
COASTAL FLOOD RISK: THE IMPORTANCE OF INTANGIBLE LOSSES AND THEIR INTEGRATION
11
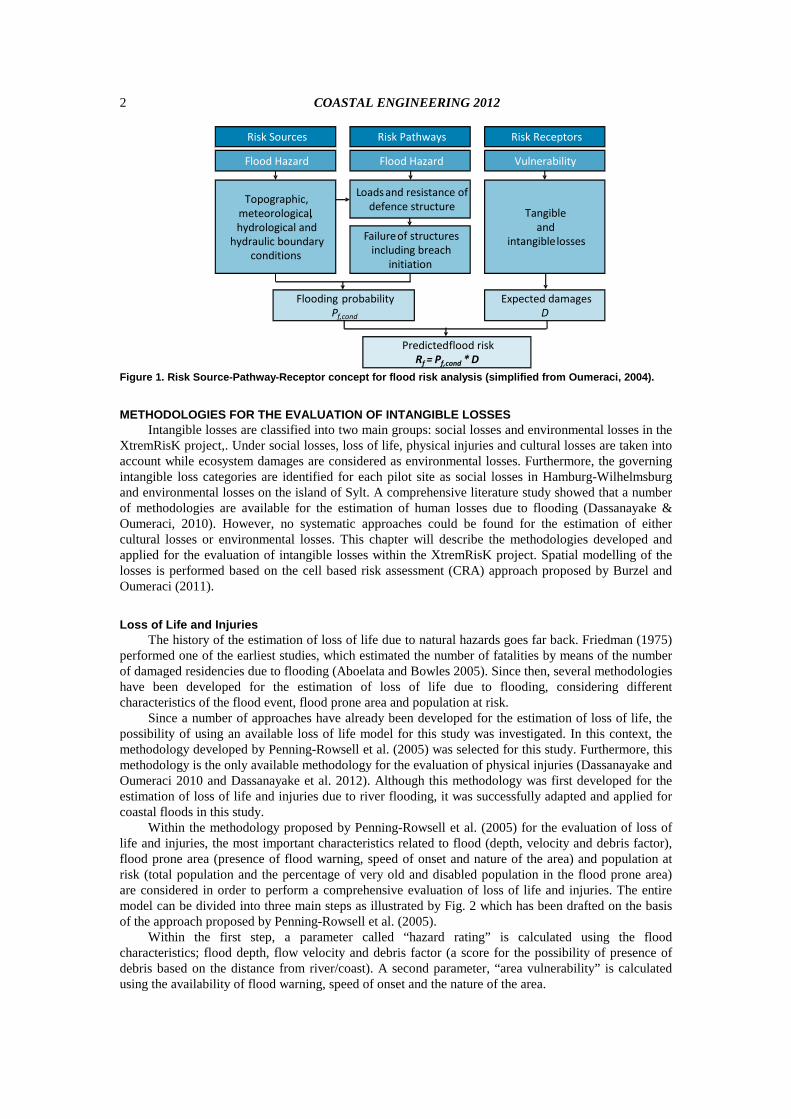
1 COASTAL FLOOD RISK: THE IMPORTANCE OF INTANGIBLE LOSSES AND THEIR INTEGRATION D.R. Dassanayake 1 The joint research project “XtremRisK” was initiated with the main objective of enhancing the knowledge with respect to the uncertainties of extreme storm surge predictions as well as quantifying exemplarily the flood risk under current conditions and future climate scenarios exemplarily for two pilot sites in Germany: Sylt Island representative for an open coast and Hamburg for an estuarine urban area. Flood risk is generally determined by the product of the flooding probability and the possible losses associated with the flood event. Flood losses are categorized as tangible and intangible depending on whether or not the losses can be assessed in monetary values. Up to date, intangible loses are not or only partially incorporated in flood risk analysis due to the lack of appropriate evaluation and integration methodologies. This study focuses on developing methodologies for the evaluation of intangible losses due to flooding and for their integration with tangible losses in flood risk analysis , A. Burzel 1 and H. Oumeraci 1 Keywords: coastal flood risk; Intangible losses; integration INTRODUCTION Coastal flooding has become one of the most devastating natural disasters in the recent past and it is expected to significantly increase due to the possible impact of climate change on sea level rise and extreme storm surge events (IPCC 2007). Furthermore, human settlements are more concentrated in the coastal zones due to the economic benefits arising from ocean navigation, coastal fisheries, tourism and recreation. Around 40% of the world’s population lives within 100 km of the coast which may lead to an increase of the damage due to coastal flooding (Stål et al. 2008). Therefore, the development of methodologies for the estimation of coastal flood risk has become an urgent need for the identification and implementation of proper coastal protection measures. The joint research project “XtremRisK” (Extreme storm surges at open coasts and estuarine areas: risk assessment and mitigation under climate change aspects) was initiated in October 2008 by the last author, with the main objective of enhancing the knowledge with respect to the uncertainties of extreme storm surge predictions as well as quantifying the overall flood risks (Oumeraci et al. 2009 and 2012). Within this project, risk analysis is exemplarily carried out for two pilot sites in Germany: Hamburg and Sylt. Hamburg is a typical example for an urban estuarine area while the island of Sylt at the North Sea represents a typical example for an open coast (Burzel et al. 2010). Flood risk is generally defined as the combination of the probability of a flood event and of the potential adverse consequences for human health, the environment, cultural heritage and economic activities (De Bruijn & Klijn 2009). Therefore, flood risk (R f ), in this project, is calculated based on the conditional probability of a flood event (P f,cond , which is calculated using the probability of storm surge event, P e and the failure probability of flood defence structure, P f ) and expected damages, D associated with the flood event, using the equation R f = P f,cond · D. For the integrated risk analysis, the “Source- Pathway-Receptor” concept (Oumeraci 2004) is adopted (see Fig. 1). The integrated risk analysis consists of the consideration of the largest physically possible storm surges (risk sources), the coastal defence failure probabilities and related flooding probabilities (risk pathways), the modelling and evaluation of the subsequent flood losses (risk receptors), including their integration into the overall flood risk. Flood losses can be categorized as tangible and intangible depending on whether or not the losses can be assessed in monetary values (Smith & Ward 1998, Merz et al. 2004). Tangible losses, as the name implies, are evaluated in monetary terms and are those generally included in flood risk analysis. However, intangible losses are not or only partially incorporated in flood risk analysis due to the lack of appropriate evaluation and integration methodologies. This paper first describes the evaluation of intangible losses within XtremRisK project briefly. The methodology developed for the integration of tangible and intangible losses in flood risk analysis will also be described. The results are presented for flooding scenario “HH_XR2010A”, one among several scenarios considered in the project for the current storm surge conditions. 1 Leichtweiß-Institute, Technische Universität Braunschweig, Beethovenstr. 51a, 38106 Braunschweig, Germany
-
Upload
independent -
Category
Documents
-
view
2 -
download
0
Transcript of COASTAL FLOOD RISK: THE IMPORTANCE OF INTANGIBLE LOSSES AND THEIR INTEGRATION

1
COASTAL FLOOD RISK: THE IMPORTANCE OF INTANGIBLE LOSSES AND THEIR INTEGRATION
D.R. Dassanayake1
The joint research project “XtremRisK” was initiated with the main objective of enhancing the knowledge with respect to the uncertainties of extreme storm surge predictions as well as quantifying exemplarily the flood risk under current conditions and future climate scenarios exemplarily for two pilot sites in Germany: Sylt Island representative for an open coast and Hamburg for an estuarine urban area. Flood risk is generally determined by the product of the flooding probability and the possible losses associated with the flood event. Flood losses are categorized as tangible and intangible depending on whether or not the losses can be assessed in monetary values. Up to date, intangible loses are not or only partially incorporated in flood risk analysis due to the lack of appropriate evaluation and integration methodologies. This study focuses on developing methodologies for the evaluation of intangible losses due to flooding and for their integration with tangible losses in flood risk analysis
, A. Burzel1 and H. Oumeraci1
Keywords: coastal flood risk; Intangible losses; integration
INTRODUCTION Coastal flooding has become one of the most devastating natural disasters in the recent past and it
is expected to significantly increase due to the possible impact of climate change on sea level rise and extreme storm surge events (IPCC 2007). Furthermore, human settlements are more concentrated in the coastal zones due to the economic benefits arising from ocean navigation, coastal fisheries, tourism and recreation. Around 40% of the world’s population lives within 100 km of the coast which may lead to an increase of the damage due to coastal flooding (Stål et al. 2008). Therefore, the development of methodologies for the estimation of coastal flood risk has become an urgent need for the identification and implementation of proper coastal protection measures.
The joint research project “XtremRisK” (Extreme storm surges at open coasts and estuarine areas: risk assessment and mitigation under climate change aspects) was initiated in October 2008 by the last author, with the main objective of enhancing the knowledge with respect to the uncertainties of extreme storm surge predictions as well as quantifying the overall flood risks (Oumeraci et al. 2009 and 2012). Within this project, risk analysis is exemplarily carried out for two pilot sites in Germany: Hamburg and Sylt. Hamburg is a typical example for an urban estuarine area while the island of Sylt at the North Sea represents a typical example for an open coast (Burzel et al. 2010).
Flood risk is generally defined as the combination of the probability of a flood event and of the potential adverse consequences for human health, the environment, cultural heritage and economic activities (De Bruijn & Klijn 2009). Therefore, flood risk (Rf), in this project, is calculated based on the conditional probability of a flood event (Pf,cond, which is calculated using the probability of storm surge event, Pe and the failure probability of flood defence structure, Pf) and expected damages, D associated with the flood event, using the equation Rf = Pf,cond · D. For the integrated risk analysis, the “Source-Pathway-Receptor” concept (Oumeraci 2004) is adopted (see Fig. 1). The integrated risk analysis consists of the consideration of the largest physically possible storm surges (risk sources), the coastal defence failure probabilities and related flooding probabilities (risk pathways), the modelling and evaluation of the subsequent flood losses (risk receptors), including their integration into the overall flood risk.
Flood losses can be categorized as tangible and intangible depending on whether or not the losses can be assessed in monetary values (Smith & Ward 1998, Merz et al. 2004). Tangible losses, as the name implies, are evaluated in monetary terms and are those generally included in flood risk analysis. However, intangible losses are not or only partially incorporated in flood risk analysis due to the lack of appropriate evaluation and integration methodologies. This paper first describes the evaluation of intangible losses within XtremRisK project briefly. The methodology developed for the integration of tangible and intangible losses in flood risk analysis will also be described. The results are presented for flooding scenario “HH_XR2010A”, one among several scenarios considered in the project for the current storm surge conditions.
1 Leichtweiß-Institute, Technische Universität Braunschweig, Beethovenstr. 51a, 38106 Braunschweig, Germany
COASTAL ENGINEERING 2012 2
Figure 1. Risk Source-Pathway-Receptor concept for flood risk analysis (simplified from Oumeraci, 2004).
METHODOLOGIES FOR THE EVALUATION OF INTANGIBLE LOSSES Intangible losses are classified into two main groups: social losses and environmental losses in the
XtremRisK project,. Under social losses, loss of life, physical injuries and cultural losses are taken into account while ecosystem damages are considered as environmental losses. Furthermore, the governing intangible loss categories are identified for each pilot site as social losses in Hamburg-Wilhelmsburg and environmental losses on the island of Sylt. A comprehensive literature study showed that a number of methodologies are available for the estimation of human losses due to flooding (Dassanayake & Oumeraci, 2010). However, no systematic approaches could be found for the estimation of either cultural losses or environmental losses. This chapter will describe the methodologies developed and applied for the evaluation of intangible losses within the XtremRisK project. Spatial modelling of the losses is performed based on the cell based risk assessment (CRA) approach proposed by Burzel and Oumeraci (2011).
Loss of Life and Injuries The history of the estimation of loss of life due to natural hazards goes far back. Friedman (1975)
performed one of the earliest studies, which estimated the number of fatalities by means of the number of damaged residencies due to flooding (Aboelata and Bowles 2005). Since then, several methodologies have been developed for the estimation of loss of life due to flooding, considering different characteristics of the flood event, flood prone area and population at risk.
Since a number of approaches have already been developed for the estimation of loss of life, the possibility of using an available loss of life model for this study was investigated. In this context, the methodology developed by Penning-Rowsell et al. (2005) was selected for this study. Furthermore, this methodology is the only available methodology for the evaluation of physical injuries (Dassanayake and Oumeraci 2010 and Dassanayake et al. 2012). Although this methodology was first developed for the estimation of loss of life and injuries due to river flooding, it was successfully adapted and applied for coastal floods in this study.
Within the methodology proposed by Penning-Rowsell et al. (2005) for the evaluation of loss of life and injuries, the most important characteristics related to flood (depth, velocity and debris factor), flood prone area (presence of flood warning, speed of onset and nature of the area) and population at risk (total population and the percentage of very old and disabled population in the flood prone area) are considered in order to perform a comprehensive evaluation of loss of life and injuries. The entire model can be divided into three main steps as illustrated by Fig. 2 which has been drafted on the basis of the approach proposed by Penning-Rowsell et al. (2005).
Within the first step, a parameter called “hazard rating” is calculated using the flood characteristics; flood depth, flow velocity and debris factor (a score for the possibility of presence of debris based on the distance from river/coast). A second parameter, “area vulnerability” is calculated using the availability of flood warning, speed of onset and the nature of the area.
Flood Hazard Flood Hazard Vulnerability
Topographic, meteorological , hydrological and
hydraulic boundary conditions
L oads and resistance of defence structure
F ailure of structures including breach
initiation
Flooding probability P f,cond
Tangible and
intangible losses
Expected damages D
Predicted
flood risk R f = P f,cond * D
Risk Sources Risk Pathways Risk Receptors

COASTAL ENGINEERING 2012
3
These two parameters are combined together in the second step for the calculation of a percentage of people at risk. Hence, the number of people exposed to risk can be calculated, if the total population of the area is known. In the meantime, a percentage of people vulnerability is estimated using the percentages of very old and disabled population. Then the number of possible injuries including loss of life is estimated using people at risk and the people vulnerability in the third step. Further, a fatality rate is calculated based on the hazard rating, which is then incorporated to calculate the number of possible loss of life.
Step
2: E
stim
atio
n of
pe
ople
vul
nera
bilit
y an
d ex
posu
re
Flood depth
Flood velocity
Debris factor
Flood warning
Speed of onset
Nature of area
Hazard Rating (HR)
Area vulnerability (AV)
% people at risk
Total population
% presence of very old
people
% presence of disabled
people
No. of people exposed to
risk
People vulnerability
%
No. of injuries including loss
of life
Fatality rate 2*HR
No. of injuries
No. of loss of life
Step
1: C
alcu
lati
on o
f ha
zard
rati
ng a
nd a
rea
vuln
erab
ility
Step
3: Q
uant
ific
atio
n of
lo
sses
Figure 2. Methodology for the evaluation of loss of life (based on the approach proposed by Penning-Rowsell et al., 2005).
The above methodology is exemplarily applied in the pilot site of Hamburg-Wilhelmsburg to estimate the possible loss of life and injuries due to flooding scenario, “HH_XR2010A”, which results in a maximum flood depth of 3.60 m and a maximum flood velocity of 2.63 m/s. The spatial analysis is performed in a 50*50m grid resolution map. According to the flooding scenario considered in this exemplary study, the total number of injuries is estimated as 916 with a maximum of 11 injuries per 50m*50m grid cell. Further, the model predicts that there might be two fatalities within the 916 injuries (Burzel et al. 2012a). The results indicate that the considered flooding scenario mainly affects the north, north-western and western part of Hamburg-Wilhelmsburg including the casualties and more injuries as compared to the other parts of the area. People living in single and two storey houses in the centre of Wilhelmsburg are only slightly affected. However, for the considered flooding scenario, only dike overtopping occurs and therefore the speed of onset and flow velocity are relatively low. In the very unlikely case of dike breaching, more severe losses would be estimated (Burzel et al. 2012b).
Cultural Losses The classification of cultural assets in the previous studies has been based on several factors. For
instance, ECLAC (2003) has identified three main categories: public historic heritage buildings, private historic heritage buildings and non-heritage public cultural infrastructure while the classification proposed in Malla (2006) is based on two types of cultural properties: movable and immovable. Considering these and further previous classifications (Dassanayake and Oumeraci 2011a), cultural assets will be considered in this study for two main categories: heritage assets and non-heritage assets. Within these two categories, both movable and immovable properties are taken into account.

COASTAL ENGINEERING 2012 4
Within this study, a qualitative assessment methodology is developed for the evaluation of cultural losses for the pilot site Hamburg-Wilhelmsburg. In this context, the physical damages to cultural assets due to flooding as well as the cultural values of each asset are taken into account (Dassanayake and Oumeraci 2011a). Unlike other buildings, it is not sufficient to consider only the physical damages of cultural assets as final cultural losses, since the cultural assets themselves are highly heterogeneous in terms of their cultural values. The proposed overall methodology for the assessment of cultural losses is illustrated in Fig 3, including two steps: (i) identification of cultural assets within the flood prone area, (ii) qualitative assessment of cultural losses.
Pilot site analysis
Inundation model
(flood data)
STEP 1: Identification of cultural assets
STEP 2: Qualitative assessment of losses
Information on cultural value of
assets
Level of cultural value
of assets
Level of Physical damage
to asset
Identification of cultural assets
Level of cultural losses
(Analysis 1)
Level of cultural losses
(Analysis 2)
Figure 3. Cultural Loss Assessment Methodology proposed by Dassanayake and Oumeraci (2011a)
In the first step, the cultural assets within the flood prone area are identified and their spatial distribution is determined. The available information on the existing conditions (types of cultural assets, age and visitation rate) is also collected.
In the second step, the physical damages of cultural assets and the cultural values of assets are determined in order to estimate the total cultural loss. Since no specific methods are available for the estimation of the level of physical damages of cultural assets, the analysis is carried out based on the available methods for the estimation of damages to residential buildings. For the estimation of physical damages, two main flood characteristics are adopted, i.e. flood depth h and flow velocity v. Based on flood depth h and velocity v as well as on the specific discharge q obtained from the product of depth and velocity (q = h · v), five damage levels are defined.
The cultural values of the assets are assessed based on their historical and their societal significance. However, the determination of cultural values represents a very complex and difficult task, since an extensive data set is needed for each and every individual asset such as the type of the cultural asset, age, tourist information, etc. Finally, the physical damages of assets and the cultural values of assets are combined in a Cultural Loss Assessment Matrix (CLAM), in order to obtain the final loss level of each asset.
Environmental Losses For the evaluation of environmental losses due to flooding, a methodology based on the ecosystem
services approach is developed. The classification of the ecosystem services developed by Millennium Ecosystem Assessment (2005) is adopted in this study. In this classification, ecosystem services are classified into four categories: provisioning, regulating, cultural and supporting as depicted in Fig 4. Provisioning, regulating and cultural services are fairly distinct while supporting services are implicitly included of all other ecosystem services and therefore interconnected with other services. Hence, it is

COASTAL ENGINEERING 2012
5
assumed that the supporting services are already reflected in other services and to avoid double-counting they are excluded from the analysis in this study.
Fig 5 shows the proposed methodology for the evaluation of environmental losses, which consists of two main steps.
First, the ecosystems present in the study area are identified by analyzing land use data. For this purpose, CORINE (Coordination of Information on the Environment) Land Cover (CLC) data from 2009 are used.
Ecosystem Services
Provisioning
ServicesProducts obtained from ecosystems
• Food• Water• Fuel• Genetic resources• Biochemicals and pharmaceuticals• Ornamental resources
Regulating
ServicesBenefits obtained from regulation of
ecosystem processes
• Air quality maintenance• Climate regulation• Water regulation• Erosion control• Pollination• Storm protection
Cultural ServicesNonmaterial benefits
obtained from ecosystems
• Spiritual and religious • Educational values• Aesthetic values• Recreation and ecotourism
Supporting
ServicesServices necessary for production of all
other ecosystem services
• Soil formation• Primary production• Nutrient cycle
Figure 4. Classification of ecosystem services according to the Millennium Ecosystem Assessment (modified from MEA 2005)
Second, the services provided by each ecosystem are also defined considering their functions and the available knowledge on ecosystem services within the first step. Using inundation models and flood data, percentage damage in each ecosystem due to the considered flooding scenarios and hence the percentage damage to each ecosystem service can be estimated exemplarily for the pilot site Sylt.
Land use data (e.g. CORINE Land Cover data)
Identification of EcosystemsE.g. Beaches, dunes, salt
marshes, forests
Definition of Ecosystem Services
Provisioning, regulating, cultural
Available knowledge on
ecosystem services
STEP 1: Identification of ecosystems and their services
Inundation model (flood data)
Estimation of influence on and degradation of
ecosystems (in %)
Estimation of changes in Ecosystem Services
(%)
STEP 2: Estimation of changes (losses) of ecosystem services
Figure 5. Two-step methodology for the assessment of Environmental losses proposed by Dassanayake & Oumeraci (2010)

COASTAL ENGINEERING 2012 6
INTEGRATION OF TANGIBLE AND INTANGIBLE LOSSES IN FLOOD RISK Since the different losses are evaluated in different units (i.e. tangible losses in Euros, loss of life
in numbers, cultural losses as a score, and environmental losses in a percentage), it is necessary to develop a systematic approach to combine all the losses in a single risk analysis. The methodology for the integration of intangible losses in flood risk analysis is developed within the framework of GIS based multi-criteria analysis (MCA). The main purposes of this methodology are (i) to bring all the tangible and intangible losses into a single scale of 0-1, (ii) to aggregate them according to their relative significance and (iii) to determine the severity of total flood loss within the study area. Among the several approaches of MCA, multi-attribute utility theory (MAUT) is selected and applied for this study. MAUT can be illustrated by Ui = ∑ wjuij where, Ui is the overall utility (or value) of alternative i, uij is the utility (or value) of the alternative i regarding the criterion j and wj is the weight for the criterion j, with ∑ wj = 1 (Malczewski 1999, Meyer 2007). The integration methodology applicable for pilot site Hamburg-Wilhelmsburg is described below, which consists of only tangible economic losses and intangible social losses (for the pilot site Hamburg-Wilhelmsburg, environmental losses are not considered due to the to the lack of data and the importance of social losses which govern the intangible losses).
For the standardization process of MCA, the value function approach is adopted, which enables the calculation of criterion values more systematically incorporating decision maker’s estimations (Malczewski 2010). Single attribute value functions were developed for each category of losses (Dassanayake and Oumeraci 2011b and 2012), which can be applied for all flooding scenarios considered in the XtremRisK project.
Calculation of Criterion Values Fig 6 illustrates the value functions considered for economic losses, loss of life, physical injuries
and cultural losses. A monotonically increasing exponential value function was defined based on the method
developed by Garvey (2009) for economic losses, VEL(x). For the derivation of the exponential function, it is necessary to define a minimum value (xmin) and a maximum value (xmax) for attribute x. As flood prone areas can also be flooded without causing any economic loss, the minimum value of x is taken as zero (xmin = 0). Generally, in the standardization process of MCA, the maximum value of the considered dataset is allocated the maximum value, 1 (here, it can be for instance the grid cell with the maximum economic loss). However, in this study, it is proposed to have a general reference value, which is independent of the current dataset of economic losses, but based on an economic indicator (such as gross national income per capita), and on the population in the flood prone area.

COASTAL ENGINEERING 2012
7
0.00
0.50
1.00
0 10 20 30 40 50 60 70 80 90 100
V EL(
x)
Economic loss as a % of (GNI per capita * max. population per cell)
VEL(x) = 1.1976 (1- e-x/55.52)
Assumed V(30) = 0.5,therefore, ρ = 55.52
x x0
1
1 2 30
V LL(
x)
No. of loss of life
0
1
xmax0
V PI (
x)
Physical Injuriesx
0 1 2 3 4 5Level of Cultural Loss (score)
01/15
3/15
6/15
10/15
1
∆2∆
3∆
4∆
5∆V CL(
x)
(a) (b)
(c) (d)
( )
( )
>
≤=
max
maxmax
1
1)(
xx
xxxxxVPI
nxwherexx
xVLL ,...2,1,0)1(1)0(0
)( =
≥=
=
Figure 6. Value functions for (a) economic losses, (b) loss of life, (c) physical injuries and (d) cultural losses.
For the standardization of loss of life, a Boolean-type function, VLL(x) is defined based on the assumption that no fatalities are accepted by society. Here, VLL(x) is 0 when attribute x is 0 (i.e. no loss of life) or 1 when attribute x is equal to 1 or more (i.e. loss of life ≥ 1). Physical injuries are analysed using a linear value function, VPI(x). The basic assumption here is that all the injured people are valued equally, as the severity of injuries is not considered in this study. The maximum attribute value xmax is taken as the average population per cell.
A piecewise linear value function is selected for the evaluation of cultural losses VCL(x), since the level of cultural losses are assessed by means of a score approach. The maximum level of damage, which is the complete destruction of a cultural asset with a high cultural value, is considered to have the highest value, VCL(x) of 1.
Calculation of criterion weights The criterion weights were calculated using the pairwise comparison method (Saaty 1990). In this
approach, each loss category is compared to all the other loss categories regarding their relative importance. Each loss category is allocated an importance scale of 1 - 9. Based on the allocated relative importance values, weights for each criterion are calculated (wLL, wPI, wCL and wEL). Finally, based on the standardised, weighted, and aggregated criterion values in each grid cell, a score is allocated to each cell in order to determine the areas with high flood losses.
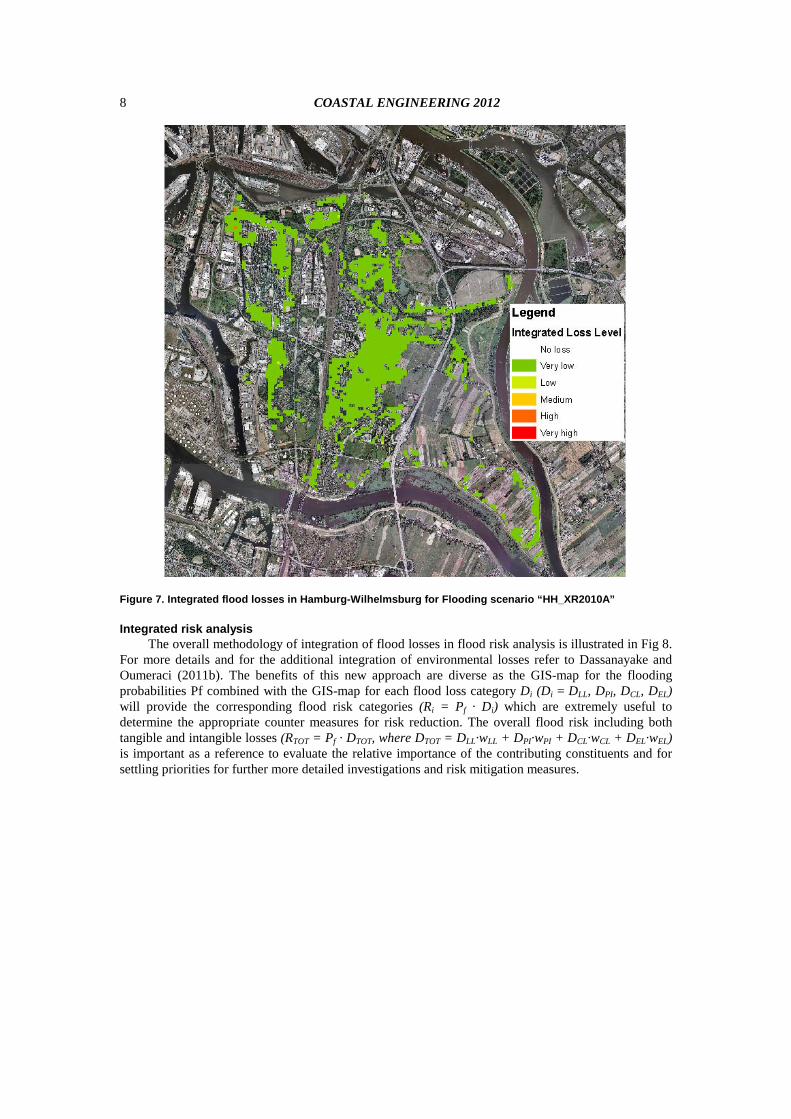
Integration of tangible and intangible flood losses Flood losses are integrated in a single map by incorporating the criterion values and weights as
calculated above (see Fig 7). According to the flooding scenario considered in this exemplary study, which has minor damages, most of the flood prone areas resulted in very low level of integrated losses. However, in the northern part of Wilhelmsburg, there are few cells, which show low and medium level of integrated losses.
COASTAL ENGINEERING 2012 8
Figure 7. Integrated flood losses in Hamburg-Wilhelmsburg for Flooding scenario “HH_XR2010A”
Integrated risk analysis The overall methodology of integration of flood losses in flood risk analysis is illustrated in Fig 8.
For more details and for the additional integration of environmental losses refer to Dassanayake and Oumeraci (2011b). The benefits of this new approach are diverse as the GIS-map for the flooding probabilities Pf combined with the GIS-map for each flood loss category Di (Di = DLL, DPI, DCL, DEL) will provide the corresponding flood risk categories (Ri = Pf · Di) which are extremely useful to determine the appropriate counter measures for risk reduction. The overall flood risk including both tangible and intangible losses (RTOT = Pf · DTOT, where DTOT = DLL·wLL + DPI·wPI + DCL·wCL + DEL·wEL) is important as a reference to evaluate the relative importance of the contributing constituents and for settling priorities for further more detailed investigations and risk mitigation measures.

COASTAL ENGINEERING 2012
9
Flooding Probability (Pf) · Flood Losses (Di) = Risk (Ri)
Flooding Probability (Pf ) ·+
Loss of life, DLL
Physical Injuries, DPI
Cultural losses, DCL
+
+
RLOL= Pf · DLL
RPI = Pf · DPI
RCL = Pf · DCL
Total loss, DTOT RTOT = Pf · DTOT
Economic losses, DEL REL = Pf · DEL
(DTOT = DLL·wLL+DPI·wPI+DCL·wCL+DEL·wEL)
wLL : Criterion weight for loss of life wPI : Criterion weight for physical injuries wCL : Criterion weight for cultural losses wEL : Criterion weight for economic lossesRi : Risk for loss category, i (Di) caused by flood with probability Pf
Figure 8. Methodology for the integration of flood losses in flood risk analysis and risk mapping for the pilot site Hamburg-Wilhelmsburg (Dassanayake and Oumeraci 2011b and 2012).
CONCLUDING REMARKS AND OUTLOOK The study focuses on the development of methodologies for the evaluation of intangible losses due
to flooding. The study attempts to extend and improve the flood risk analysis by incorporating all possible categories of tangible and intangible flood losses, which is yet limited to only direct economic losses and in few cases also includes loss of life.
The tentative results which have been achieved in the XtremRisk project indicate that the evaluation of intangible losses is as essential (or even more) as tangible losses in flood risk analysis (see also Oumeraci et al, 2012). However, the lack of appropriate methodologies for their evaluation and integration has hindered intangible losses being incorporated in risk analysis. Methodologies for the evaluation of intangible losses have now been developed and applied to two pilot sites: social losses for the pilot site in an urban estuary zone “Hamburg” partly presented in this study and environmental losses for the pilot site at the open coast “Sylt Island”.
Furthermore, a methodology for the integration of tangible and intangible losses is developed. The overall risk will be determined by incorporating the calculated flooding probability and the flood losses. Depending on the calculated flood risk and the acceptable risks for each of the pilot sites, appropriate measures for the flood risk mitigation/reduction will be determined (Oumeraci et al, 2012).
This paper only focuses on the evaluation of intangible losses in non-monetary terms. Further research is in progress in order to develop methodologies for the monetary valuation of intangible losses, which will enable the integration of flood losses within a cost-benefit analysis (CBA). Furthermore, the monetary valuation of all flood losses will provide the possibility of analysis of flood risk in monetary terms, so that a comparison with the outcomes of the risk analysis based on non-monetary evaluation of the losses will be possible (Oumeraci et al, 2012).
ACKNOWLEDGEMENT Financial support provided for the first author by German Academic Exchange Service (DAAD)
for pursuing the doctoral studies is gratefully acknowledged. Furthermore, the Federal Ministry for Education and Research (BMBF) is acknowledged for funding the project XtremRisK which is led by the last author (grant number 03F0483A). The support of the partners of XtremRisK, including the corporative and advising partners is also gratefully acknowledged.
REFERENCES Aboelata, M.A. and Bowles, D.S. 2005. LIFESim: A Model for Estimating Dam Failure Life Loss,
Report to Institute for Water Resources, US Army Corps of Engineers and Australian National

COASTAL ENGINEERING 2012 10
Committee on Large Dams. Institute for Dam Safety Risk Management, Utah State University, USA. 274 pp.
Burzel. A. and Oumeraci, H. 2011. Development of a Framework for the Spatial Modelling of Extreme Risks and the Consideration of Risk Acceptance, Progress Report 1: Cellbased Risk Assessment (CRA) approach. Leichtweiß-Institute for Hydraulic Engineering and Water Resources, Technische Universität Braunschweig.
Burzel, A., Dassanayake, D.R., Naulin, M., Kortenhaus, A., Oumeraci, H., Wahl, T., Mudersbach, C., Jensen, J., Gönnert, G., Sossidi, K., Ujeyl, G., and Pasche, E. 2010. Integrated flood risk analysis for extreme storm surges (XtremRisK), Proceedings of the 32nd International Conference on Coastal Engineering (ICCE 2010), ASCE, Shanghai, China.
Burzel, A., Dassanayake, D.R. and Oumeraci, H. 2012a. Development of a spatial loss-of-life-model for Hamburg-Wilhelmsburg, XtremRisK Progress Report. Leichtweiß-Institute for Hydraulic Engineering and Water Resources, Technische Universität Braunschweig, 68 pp.
Burzel, A., Dassanayake D.R. and Oumeraci, H. 2012b. Spatial Modelling of tangible and intangible Losses in Integrated Risk Analysis – Results of the XtremRisK, Proceedings of 2nd European Conf. on FLOODrisk Management, Rotterdam, The Netherlands.
Dassanayake, D.R. and Oumeraci, H. 2010. Framework and Methods for the Evaluation of Intangible Losses and their Integration in Coastal Flood Risk Analysis, State of the Art Report. Leichtweiß-Institute for Hydraulic Engineering and Water Resources, Technische Universität Braunschweig, 80pp.
Dassanayake, D.R. and Oumeraci, H. 2011a. Evaluation of cultural losses due to coastal floods, Progress Report. Leichtweiß-Institute for Hydraulic Engineering and Water Resources, Technische Universität Braunschweig, 40pp.
Dassanayake, D.R. and Oumeraci, H. 2011b. Integration of Tangible and Intangible Flood Losses: A GIS Based Multicriteria Analysis (MCA) Approach, Progress Report. Leichtweiß-Institute for Hydraulic Engineering and Water Resources, Technische Universität Braunschweig, 40pp.
Dassanayake, D.R., Burzel, A. and Oumeraci, H. 2012. Extreme Storm Surges and Coastal Flooding: Intangible Flood Losses in Integrated Risk Analysis, The International Journal of Ocean and Climate Systems, Multi Science Publishing, Essex, UK (in Print)
De Bruijn, K.M. and Klijn, F. 2009. Risky places in the Netherlands: a first approximation for floods, Journal of Flood Risk Management, 2, 58–67.
ECLAC - Economic Commission for Latin America and the Caribbean 2003. Handbook for Estimating the Socio-economic and Environmental Effects of Disasters. United Nations, ECLAC and International Bank for Reconstruction and Development (The World Bank).
Friedman, D. G. 1975. Computer simulation in natural hazard assessment, Institute of Behavioral Science, University of Colorado, Boulder, Colorado, 194 pp. (cited by Aboelata and Bowles, 2005).
Garvey, P. 2009. Analytical methods for risk management: A systems engineering perspective, Boca Raton: Taylor & Francis.
IPCC 2007. Climate change 2007: WG II: Impacts, Adaptation and Vulnerability, Chater 6. Coastal systems and low lying areas. Intergovernmental Panel on Climate Change (IPCC), Cambridge.
Malczewski, J. 1999. GIS and Multicriteria Decision Analysis. New York, John Wiley and Sons. Malczewski, J. 2010. Multiple Criteria Decision Analysis and Geographic Information Systems. In M.
Ehrgott, J.R. Figueira and S. Greco (eds), Trends in Multiple Criteria Decision Analysis, 369-398. New York: Springer.
Malla, B. 2006. Classification of Cultural Property and Their Conservation, Orissa Review, 61-64. MEA, 2005. Ecosystems and human well-being, A framework for assessment. Millenium Ecosystem
Assessment Series, Washington D.C: Island Press. Merz, B.; Kreibich, H.; Thieken, A. and Schmidtke, R. 2004. Estimation uncertainty of direct monetary
flood damage to buildings. Natural Hazards and Earth System Sciences, 4, 153–163. Meyer, V. 2007. GIS-based Multicriteria Analysis as Decision Support in Flood Risk Management,
FLOODsite Project Report, HR Wallingford, UK. Oumeraci, H. 2004. Sustainable coastal flood defences: scientific and modelling challenges towards an
integrated risk-based design concept, Keynote lecture. Proceedings of. First IMA International Conference on Flood Risk assessment, University of Bath, UK, 9-24.
Oumeraci, H., Jensen, J., Gönnert, G., Pasche, E., Kortenhaus, A., Naulin, M., Wahl, T., Thumm, S., Ujeyl, G., Gershovich, I. and Burzel, A. 2009. Flood risk analysis for a megacity: The German XtremRisK project, Proceedings of Conference on Road Map towards a Flood Resilient Urban Environment, Paris France.
Oumeraci, H.; Kortenhaus, A.; Burzel, A.; Naulin, M.; Dassanayake, D.R.; Jensen, J.; Wahl, T.; Mudersbach, C.; Gönnert, G.; Thumm, S.; Daemrich, K.-F.; Pasche, E.; Ujeyl, G. 2012. Integrated Flood Risk Analysis for Extreme Storm Surges at Open Coasts and in Estuaries: Background,

COASTAL ENGINEERING 2012
11
Methodology, Key Results and Lessons Learned . Proc. 2nd European Conference on FLOODrisk Management, Rotterdam, The Netherlands.
Penning-Rowsell, E., Floyd, P. Ramsbottom, D. and Surendran, S. 2005. Estimating Injury and Loss of Life in Floods: A Deterministic Framework, Natural Hazards, 36, 43–64.
Saaty, T.L. 1990. How to make a decision: The analytic hierarchy process, European Journal of Operational Research, 48, 9-26.
Smith, K. and Ward, R. 1998. Floods: Physical processes and human impacts. Chichester: John Wiley and Sons.
Stål, J., Paulsen, S., Pihl, L., Rönnbäck, P., Söderqvist, T. and Wennhage, H. 2008. Coastal habitat support to fish and fisheries in Sweden: Integrating ecosystem functions into fisheries management, Ocean and Coastal Management, 51, 594–600.


![.Noah's Flood WTJ2004[1]](https://static.fdokumen.com/doc/165x107/631c39e73e8acd997705cf6b/noahs-flood-wtj20041.jpg)


