Coagulation responses to acute and chronic stress
87
Aus dem Max-Planck-Institut für Psychiatrie Direktor: Prof. Dr. Dr. Martin E. Keck Coagulation responses to acute and chronic stress – a comparison between remitted depressed patients and healthy controls Dissertation zum Erwerb des Doktorgrades der Medizin an der Medizinischen Fakultät der Ludwig-Maximilians-Universität München vorgelegt von Franziska Merz aus Starnberg
-
Upload
khangminh22 -
Category
Documents
-
view
5 -
download
0
Transcript of Coagulation responses to acute and chronic stress

Aus dem Max-Planck-Institut für Psychiatrie
Direktor: Prof. Dr. Dr. Martin E. Keck
Coagulation responses to acute and chronic stress – a comparison
between remitted depressed patients and healthy controls
Dissertation
zum Erwerb des Doktorgrades der Medizin
an der Medizinischen Fakultät der
Ludwig-Maximilians-Universität München
vorgelegt von
Franziska Merz
aus Starnberg

2
Mit Genehmigung der Medizinischen Fakultät
der Universität München
1. Berichterstatter: Prof. Dr. Dr. Dr. h.c. Florian Holsboer
Mitberichterstatter: Prof. Dr. Michael Spannagl
Priv. Doz. Dr. Cornelius Schüle
Mitbetreuung durch den
promovierten Mitarbeiter: Dr. phil. Marcus Ising
Dekan: Prof. Dr. med. dent. Reinhard Hickel
Tag der mündlichen Prüfung: 22.12.2016

3
für meine Familie

4
Contents Summary .................................................................................................................................... 6
Abbreviations ............................................................................................................................. 8
Figures and Tables ..................................................................................................................... 9
1. Introduction ....................................................................................................................... 10
2. Theoretical background and current research ................................................................... 11
2.1. The physiology of the stress reaction: the SNS and the HPA-axis ............................ 11
2.2. Virchow’s triad and plaque formation ........................................................................ 13
2.3. Hemostasis, coagulation and fibrinolysis ................................................................... 16
2.4. Depression and the coagulation system ...................................................................... 19
2.5. Acute and chronic stress and the coagulation system ................................................ 19
2.6. Coagulation markers for acute and chronic stress ...................................................... 22
3. Research questions and hypotheses ................................................................................... 25
3.1. Hypotheses regarding basal coagulation .................................................................... 25
3.1.1. The effects of remitted depression on basal coagulation .................................... 25
3.1.2. The effects of chronic stress on basal coagulation .............................................. 26
3.1.3. The effects of the interaction between remitted depression and chronic stress on
basal coagulation ................................................................................................. 27
3.2. Hypotheses regarding stress-induced coagulation ..................................................... 27
3.2.1. The effects of remitted depression on stress-induced coagulation ...................... 27
3.2.2. The effects of chronic stress on stress-induced coagulation ............................... 28
3.2.3. The effects of the interaction between remitted depression and chronic stress on
stress-induced coagulation .................................................................................. 28
4. Methods ............................................................................................................................. 29
4.1. Subject Sample ........................................................................................................... 29
4.2. Experimental procedure ............................................................................................. 32
4.3. Assessment of the stress response .............................................................................. 34
4.4. Sampling procedure and laboratory analyses ............................................................. 35
4.5. Questionnaires ............................................................................................................ 36
4.6. Statistical analyses ...................................................................................................... 38
5. Results ............................................................................................................................... 41
5.1. Demographics ............................................................................................................. 41
5.2. Resting coagulation parameters .................................................................................. 43

5
5.2.1. Fibrinogen ........................................................................................................... 43
5.2.2. D-Dimer .............................................................................................................. 43
5.2.3. VWF .................................................................................................................... 44
5.2.4. PAI-1 ................................................................................................................... 45
5.3. Stress induction: effects of the TSST paradigm ......................................................... 45
5.3.1. Heart rate response .............................................................................................. 45
5.3.2. Cortisol response ................................................................................................. 46
5.3.3. Perceived stress ................................................................................................... 47
5.4. Stress-induced coagulation changes ........................................................................... 48
5.4.1. Fibrinogen ........................................................................................................... 49
5.4.2. D-Dimer .............................................................................................................. 51
5.4.3. VWF .................................................................................................................... 52
5.5. Associations between depression symptoms and chronic stress load, and hemostatic
markers ....................................................................................................................... 53
6. Discussion ......................................................................................................................... 56
6.1. Coagulation markers at rest ........................................................................................ 56
6.1.1. The effects of remitted depression on basal coagulation .................................... 56
6.1.2. The effects of chronic stress on basal coagulation .............................................. 57
6.1.3. Interaction effects between remitted depression and chronic stress on basal
coagulation .......................................................................................................... 58
6.2. Stress-induced changes .............................................................................................. 58
6.2.1. The effects of remitted depression on stress-induced coagulation ...................... 59
6.2.2. The effects of chronic stress on stress-induced coagulation ............................... 60
6.2.3. Interaction effects between remitted depression and chronic stress on stress-
induced coagulation ............................................................................................ 61
6.3. Associations between chronic stress and hemostasis ................................................. 61
6.4. Strengths and limitations ............................................................................................ 62
6.5. Conclusion and outlook .............................................................................................. 64
Literature .................................................................................................................................. 68
Appendix I. ............................................................................................................................... 78
Appendix II. ............................................................................................................................. 83
Eidesstattliche Versicherung .................................................................................................... 86

6
Summary
An increased risk of cardiovascular morbidity and mortality has been demonstrated in studies
on depressed individuals.
One of the mechanisms discussed to explain this relationship is an imbalance in the hemostat-
ic system.
From an evolutionary perspective it appears plausible that stress-procoagulability is a benefi-
cial adaptation to protect an organism from excessive bleeding in fight-flight situations. How-
ever, an imbalance of this system is harmful as a shift toward a hypercoagulable state contrib-
utes to atherosclerosis formation and acceleration of existing atherosclerotic plaques.
In depression, such hypercoagulable states have been frequently described – both at rest and
in response to acute stress. Depression as a stress-related disease is often concurrent with
chronic stress, as well as with hypothalamic-pituitary-adrenal (HPA)-axis alterations. A cen-
tral question of this work is whether chronic stress and depression are independent factors
influencing basal and stress-induced coagulation, or if they potentially have an interacting
effect.
In the present study the procoagulant factors fibrinogen, D-Dimer, Von-Willebrand-Factor
(VWF) and the antifibrinolytic factor plasminogen-activator-inhibitor (PAI-1) were measured
in 63 subjects from an epidemiological sample, who were recruited for presence and absence
of a history of major depression into a remitted major depression group (MD) and a control
group. Further, the participants were divided into groups of high and low chronic stress (CS).
All four coagulation factors were measured at baseline and all but PAI-1 were measured also
following a psychosocial stress test. To evaluate chronic stress the Trier inventory of chronic
stress (TICS) was employed while acute stress was elicited using a well-established psycho-
social stress test, the Trier Social Stress Test (TSST). This 13-minute test combines prepara-
tion, a mock job interview and a mental arithmetic task in front of an evaluating audience.
The following results were observed: fibrinogen was higher in the remitted depression group
at baseline and depression history had a significant effect also on stress-induced changes in
fibrinogen. A large body of research has identified fibrinogen as a potential marker for an
increased cardiovascular risk in depression, and even a marker for depression. The latter was
supported by our findings. Furthermore, a trend toward higher D-Dimer levels at rest in
chronically stressed subjects was observed. CS had an effect on stress-induced D-Dimer in-
creases, which was independent from a history of major depression.

7
Unlike previous research this work does not observe differences in VWF and PAI-1 plasma
concentrations between the MD and CS groups, neither at rest nor following the stress test.
Novel in this study was that the recruited subjects were in remission from major depressive
disorder (as diagnosed using DSM-IV) for at least 6 months. This work adds to the existing
knowledge regarding fibrinogen as a potential marker for depression in that it identified fi-
brinogen as also being increased in cases of remitted depression.
Further research is needed to investigate the role of fibrinogen in remitted depression.
In particular, interventional studies examining the effect of known treatments of depression
on fibrinogen levels are needed. It would be advisable that physicians treating depression are
aware of their patients’ cardiovascular risk factors and that they give depression, and also
remitted depression, the same amount of attention as a traditional cardiovascular risk factor.
Monitoring fibrinogen in depressed patients should be considered a real option in the future.

8
Abbreviations
ACTH Adrenocorticotropic hormone BDI-II Beck Depression Inventory, version II BMI Body Mass Index BSKE Multidimensional adjectives questionnaire regarding current state
(BSKE: Befindlichkeitsskalierung nach Kategorie von Eigenschaftswörtern) CRH Corticotropin releasing hormone CRP C-reactive Protein CS Chronic stress DNA Desoxyribonucleic acid DSM-IV Diagnostic and Statistical Manual of Mental Disorders (4th edition) EDTA Ethylendiaminetraacetat ELISA Enzyme linked immunosorbent assay HDL High-density lipoprotein HPA Hypothalamic-pituitary axis IL Interleukin LDL Low-density lipoprotein M-CIDI Munich- Composite International Diagnostic Interviews MCH Mean corpuscular hemoglobin. Hemoglobin amount per erythrocyte count MCV Mean corpuscular volume. A measure of the average volume of a red blood cell MD Remitted major depression RNA Ribonucleic acid SAM Sympathetic Adrenal Medulla SCSS Screening scale for the Trier inventory of chronic stress SNS Sympathetic Nervous System SSRI Selective serotonin reuptake inhibitor t-PA Tissue plasminogen activator TICS Trier inventory of chronic stress TNFα Tumor necrosis factor alpha TSST Trier Social Stress Test VWF Von-Willebrand-Factor

9
Figures and Tables
Tables
Figures
Table 1 Examples of questions asked in the ‘Trier inventory for the assessment of chronic stress’ (TICS) questionnaire
Table 2 Overview of the study protocol Table 3 Demographic characteristics of the study participants Table 4 Overview of previous findings regarding the effects of depression, acute
and chronic stress on hemostatic markers Table 5 Pearson’s correlation coefficients for correlations between hemostatic
measurements and TICS scores
Figure 1 Virchow’s triad and cardiovascular risk Figure 2 The hemostatic pathways Figure 3 Fibrinolysis Figure 4 Mean baseline concentrations of fibrinogen Figure 5 Mean baseline concentrations of D-Dimer Figure 6 Mean baseline concentrations of VWF Figure 7 Mean baseline concentrations of PAI-1 Figure 8 Mean heart rate measures of the four groups Figure 9 Cortisol response curves separate for each group Figure 10 Changes in perceived anxiety during the stress protocol Figure 11 (A-C)
Changes in the three coagulation parameters in response to the TSST inde-pendent of group
Figure 12 Baseline to post-stress measures of fibrinogen in the four groups Figure 13 Baseline to post-stress measures of fibrinogen including another post-stress
measure Figure 14 Baseline to post-stress measures of D-Dimer in the four groups Figure 15 Baseline to post-stress measures of D-Dimer including another post-stress
measure Figure 16 Baseline to post-stress measures of VWF in the four groups Figure 17 Baseline to post-stress measures of VWF including another post-stress
measure
10
1. Introduction
Depression is a debilitating disease with a high socioeconomic impact. Its lifetime prevalence
ranges between 10 and 15% (Lépine & Briley, 2011) and the World Health Organization pro-
jects that by 2020, depression will be the second leading cause for disability (Murray &
Lopez, 1996). An overall relative risk of 1.64 for the development of coronary heart disease in
depressed subjects has been described (Rugulies, 2002) and the risk for cardiac mortality is
increased in patients with major depressive disorder (Carney & Freedland, 2008; Cuijpers &
Smit, 2002; Nemeroff & Goldschmidt-Clermont, 2012; Von Känel et al., 2013).
One factor that might account for the elevated risk for cardiac events in depression is an im-
balance between coagulation and fibrinolysis (Bacon et al., 2006; Hemingway & Marmot,
1999; Surtees et al., 2008; Von Känel, Dimsdale, et al., 2004).
While coagulation is an interaction of various factors that causes „thickening of the
blood“,expressed colloquially, fibrinolysis reverses this process by “dissolving coagulated
blood“. Coagulation and fibrinolysis work together in order to ensure optimal functioning of
blood flow and to repair vessel wall lesions. In many healthy subjects, coagulation, as well as
fibrinolysis are activated simultaneously as a response to acute mental stress, with the balance
shifted toward a progoaculant milieu (Hjemdahl & Von Känel, 2012). From an evolutionary
standpoint a procoagulant response is biologically sensible in that it may protect the organism
from possible blood loss during a fight-or-fight situation.
In patients with impaired endothelial function, i.e. arteriosclerosis, coagulation constantly
outweighs fibrinolysis thereby resulting in a hypercoagulable state that increases the risk for
cardiovascular events such as myocardial infarction or ischemic stroke. Several studies sug-
gest that in depression, there also exists a shift towards a hypercoagulable state (Lahlou-
Laforet et al., 2006; Tsai, Hong, Liou, Yu, & Chen, 2008; Von Känel, Bellingrath, &
Kudielka, 2009a; Wium-Andersen, Orsted, & Nordestgaard, 2013) which could explain the
increased cardiovascular mortality in these depressed patients (Tsai et al., 2008).
Despite the fact that well known risk factors such as hypertension, dyslipidemia, and diabetes
history are not generally seen in depression, the cardiovascular risk is still increased. A com-
mon element seen in both classical risk factors and depression is an elevation in fibrinogen.
The relationships between impaired hemostasis, stress and depression are not yet fully under-
stood. This work attempts to make a contribution to understanding them better.

11
2. Theoretical background and current research
This chapter gives a summary of the theoretical background of the study. First, the major
stress response systems, the sympathetic nervous system (SNS) and the hypothalamus-
pituitary-adrenocortical (HPA) axis will be introduced, followed by a description of Vir-
chow’s triad: it serves as the foundation for understanding how changes in blood composition,
alterations in blood flow, and vascular endothelial injury, can elevate the risk for thrombosis.
Since a major aspect of this triad is hypercoagulability, the coagulation system will be de-
scribed. Finally, the current state of research regarding the role of depression, acute and
chronic stress on the coagulation system will be summarized.
2.1. The physiology of the stress reaction: the SNS and the HPA-axis
One of the pioneers in the area of stress research, Hans Selye described “stress as the failure
to respond appropriately to emotional or physical threats to the organism, whether actual or
imagined” (Selye, 1956 , as cited in Hamer & Malan, 2010). A breaking down of efficient
adaptation mechanisms to chronic stress over long periods of time is harmful and can lead to
disease. The two major stress response systems are the sympathetic adrenal medulla (SAM)
axis as part of the autonomic nervous system, and the hypothalamic pituitary adrenal (HPA)
axis (Houtveen, 2001). An understanding of these stress systems is relevant for this work be-
cause overactivities of both systems have been described in depression (Von Känel & Bacon,
2013) and because a dysregulation of the HPA-axis may also influence the vascular system
negatively. In cases of chronic stress and depression, HPA-axis alterations may be responsible
for disturbed hemostatic and endothelial function (Von Känel & Bacon, 2013), which may
explain increased cardiovascular morbidity in these patient groups.
The Sympathetic-Adrenal-Medulla (SAM) axis
The hypothalamus as the subordinate structure of the autonomic nervous system regulates
both the sympathetic and parasympathetic nervous systems. It initiates the release of nora-
drenaline from post-ganglionic sympathetic neurons and the release of adrenaline and nora-
drenaline from adrenal medulla (SAM).
The main function of this system is to maintain an equilibrium that ensures external demands
on the organism can be met. This equilibrium, which Cannon termed ‘homeostasis’ (Cannon,
1915) is important, for example, when the body faces increased energy demands during exer-
cise or in a ‘fight-flight’ situation. The responsiveness of the SAM system is immediate and

12
allows the organism to react without delay, for example by raising blood pressure and heart
rate and initiating vasoconstriction.
The Hypothalamic-Pituitary-Adrenal (HPA) axis
In response to stress, corticotropin-releasing hormone (CRH) is released from neurosecretory
nerve terminals in the hypothalamus, then transported to the anterior pituitary. Here CRH,
together with vasopressin, acts to stimulate secretion of ACTH into the bloodstream. Once at
the adrenals, ACTH initiates the synthesis of corticosteroids such as cortisol. Cortisol’s func-
tions include raising of blood sugar, modulation of the immune system and anti-inflammatory
actions. Further, cortisol is a catabolic and lipogenic hormone.
The HPA-axis is regulated by a negative feedback mechanism by which cortisol receptors in
the brain and at the pituitary inhibit further synthesis and release of both CRH and ACTH,
respectively. The humoral HPA-axis response is markedly slower than the nervous SAM re-
sponse. Furthermore, cortisol acts via translocation of the activated glucocorticoid receptor on
the transcriptional or genomic level and therefore its effects are further delayed.
In depression, a desensitization of the glucocorticoid receptor for cortisol leads to an insuffi-
cient negative feedback and to increased CRH, cortisol and arginine-vasopressin levels
(Binder, 2009). Depressed patients show impairments in HPA-axis regulation, as studies in-
volving the combined Dexamethasone/CRH-Suppression-Test have shown: depressed indi-
viduals respond to a CRH injection under the suppressive effects of dexamethasone with ex-
aggerated ACTH and cortisol levels, whereas the CRH effects under dexamethasone suppres-
sion are considerably blunted in healthy subjects (Ising et al., 2007).
Cortisol and the CRH can further influence synthesis and release of serotonin, norepinephrine
and dopamine and modulate their receptors. Hypersecretion of these hormones can lead to the
clinical manifestations of depression and anxiety, mainly through actions on limbic and neo-
cortical structures (Holsboer & Ising, 2010). A dysregulation of the HPA-axis may also
influence the vascular system: in chronic stress and depression, HPA-axis alterations may be
responsible for disturbed hemostatic and endothelial function (Von Känel & Bacon, 2013). In
a placebo-controlled trial, Brotman et al., (2006) showed that a 5-day treatment course of
dexamethasone in healthy men increased circulating levels of fibrinogen, and the procoagu-
lant factors VII, VIII and XI.

13
Although SAM and HPA systems seem to serve different purposes, aspects of interdependen-
cy of the two systems exist: cortisol as part of the HPA-system may be involved in modifica-
tion of sensitivity of adreno-receptors (Houtveen, 2001; Kvetnansky et al., 1995), which be-
long to the SAM system, and further, CRH gene expression can be altered by catecholamines
(Kaminski & Watts, 2013).
2.2. Virchow’s triad and plaque formation
The psychophysiological mechanisms linking depression and stress to coronary artery dis-
ease, and ultimately cardiovascular events such as stroke or myocardial infarction, have not
been fully elucidated (Von Känel, Bellingrath, et al., 2009a). Recent research suggests that a
hypercoagulable state may contribute to the progression of atherosclerosis and atherosclerotic
plaque rupturing, and ultimately leading to myocardial infarction (Von Känel & Bacon,
2013). Such a hypercoagulable state, i.e. increased clotting, decreased fibrinolytic activity and
impairments of the endothelium, has also been described in depression and may be one im-
portant element to link depression with increased cardiovascular risk. Particularly autonomic
dysfunction and alteration in the hypothalamic pituitary adrenal axis might mediate perturbed
hemostatic and endothelial function under chronic stress and negative affect, e.g., depression
or anxiety (Von Känel & Bacon, 2013).
Hypercoagulability, hemodynamic changes and endothelial dysfunction, also known as ‘Vir-
chow's triad’ (Figure 1), describe properties of the vascular system that constitute risk factors
for thrombosis and, ultimately, cardiovascular events such as myocardial infarction or stroke
caused by thromboembolisms (Chung & Lip, 2003). It is important to note that Virchow’s
triad is complemented by inflammatory processes to ultimately increase the risk for cardio-
vascular events, as Figure 1 shows.
Hypercoagulability
Hypercoagulability describes a shift toward a ‘thickening of the blood’ through activation of
platelets and the synthesis and activation of procoagulant factors. The procoagulant factors,
thrombin and fibrin are formed in a complex cascade-like manner that involves multiple fac-
tors, as Figure 2 Shows. Triggers for hypercoagulability may be an activation of the sympa-
thetic nervous system (Von Känel & Dimsdale, 2000)

14
Hemodynamic changes
Whenever blood flow is slowed down, the chance of turbulences and therefore the risk for
thrombus formation is increased. Causes for slowing of blood flow can be shifts in the com-
position of blood, for example through exsiccosis, increases in platelet count (thrombocyto-
sis), or obstruction of the vessel lumen through atherosclerotic plaques.
Endothelial damage
The healthy endothelium possesses anticoagulant, antiplatelet and fibrinolytic mechanisms
and releases vasodilative nitric oxide to maintain vascular tone and structure and proper blood
flow (Davignon & Ganz, 2004).
These mechanisms can be disturbed in a variety of ways: through inflammatory processes,
increased permeability of the endothelium, a procoagulant milieu and diminished production
of nitric oxide, which acts anti-atherogenic by inhibiting cellular adhesion, migration and pro-
liferation (Ross, 1999). In major depression lower nitric oxide activity has been reported to-
gether with increased levels of reactive oxygen species (Chrapko et al., 2004); both of which
point to a compromised endothelium (Von Känel & Bacon, 2013).
The acute phase fibrinogen which is studied in the present work has been identified as being
involved in the pathogenesis of atherosclerosis in that it increases endothelial permeability,
platelet reactivity, monocyte migration, LDL accumulation and formation of foam cells
(Borissoff, Spronk, & Cate, 2011). The large population-based, prospective, observational
CARDIA study (Green et al., 2010) revealed a significant association between fibrinogen
levels and enhanced rate of coronary-artery calcification and carotid intima-media thickness
over a 13-year study interval. Young subjects with elevated fibrinogen levels were more like-
ly to exhibit these two precursory signs for atherosclerosis in middle age.

15
Figure 1. Virchow’s triad and cardiovascular risk. The relationships between depression, stress and the hemostatic system. Blue boxes indicate that these elements belong to ‘Virchow’s triad’. Based on: Austin, Wissmann, & Von Känel (2013).
The hemostatic system and atherosclerotic plaque formation
When the endothelium lining the inner wall of a blood vessel is damaged, for example
through small lesions caused by hypertension, the protein VWF becomes exposed. Platelets
present in the blood that bypass this damaged site bind to VWF via their glycoprotein Ib-
alpha receptors. Once adherent to the site of injury, platelets secrete mediators such as cyto-
kines, chemokines, growth factors and the intrinsic components of the coagulation system.
These interact with leukocytes and dendritic cells and commence the complicated process of
atherosclerotic plaque formation. (Borissoff et al., 2011). It is believed that a procoagulant
environment will gradually promote pre-existing atherosclerosis through deposits of fibrin in
the vessel wall and through inflammatory processes (Borissoff et al., 2011; Falk &
Fernández-Ortiz, 1995). Ruptured plaques are carried away with the bloodstream and may
occlude coronary arteries and cerebral vessels, causing myocardial infarction and stroke, re-
spectively.
Risk for cardiovascular event
increases
Endothelial dysfunction
Chronic stressors (job strain, PTSD…), depression
Inflammation
Progression of existing atherosclerosis
Hypercoagulable state
Hemodynamic changes
Risk for thrombogenesis
16
2.3. Hemostasis, coagulation and fibrinolysis
Hemostasis describes the end result of the interaction of the platelet system with coagulant
and anti-coagulant influences. It aims to support a dynamic equilibrium that allows proper
blood flow and, ensures the vessel wall is sealed to prevent blood loss in case of injury (Furie
& Furie, 2008). Since hemostasis is a very complex system, its components relevant to the
present work shall be described here in a simplified manner. There are four steps involved in
hemostasis: first, primary hemostasis as the initiation of the platelet plug, second, the coagula-
tion cascade with its extrinsic and intrinsic paths; third, the cessation of further thrombus for-
mation by antithrombotic mechanisms; and fourth, fibrinolysis, which removes the clot
(Leung, 2014). The coagulation cascade, which consists of the intrinsic and extrinsic systems,
leads to formation of fibrin polymers which consolidate the platelet plug that had been formed
during primary hemostasis (Halperin & Reber, 2007).
The intrinsic pathway of coagulation
When blood comes into contact with damaged tissue, platelets become activated. An example
where damaged tissue is exposed are minute lesions that happen many times daily even in
healthy persons. These activated platelets expose negatively charged surfaces that activate the
plasma protein Factor XII. Factor XII, like all components of the intrinsic system, is always
present in the blood. As figure 2 depicts, activation of Factor XII sets into motion a cascade of
activation of other plasma proteins that result in the formation of activated factor X, the end
product of both the extrinsic and intrinsic systems.
The extrinsic pathway of coagulation
The extrinsic path is a fast-response system that is set into action once tissue factor (Factor
VII) in the endothelial cells becomes exposed through injury. Activated Factor VII then also
activates Factor X, at which point the two pathways merge.
Both pathways can also be activated without overt injury to the endothelium, which is particu-
larly the case in stress-induced coagulation, as is examined in this work.
17
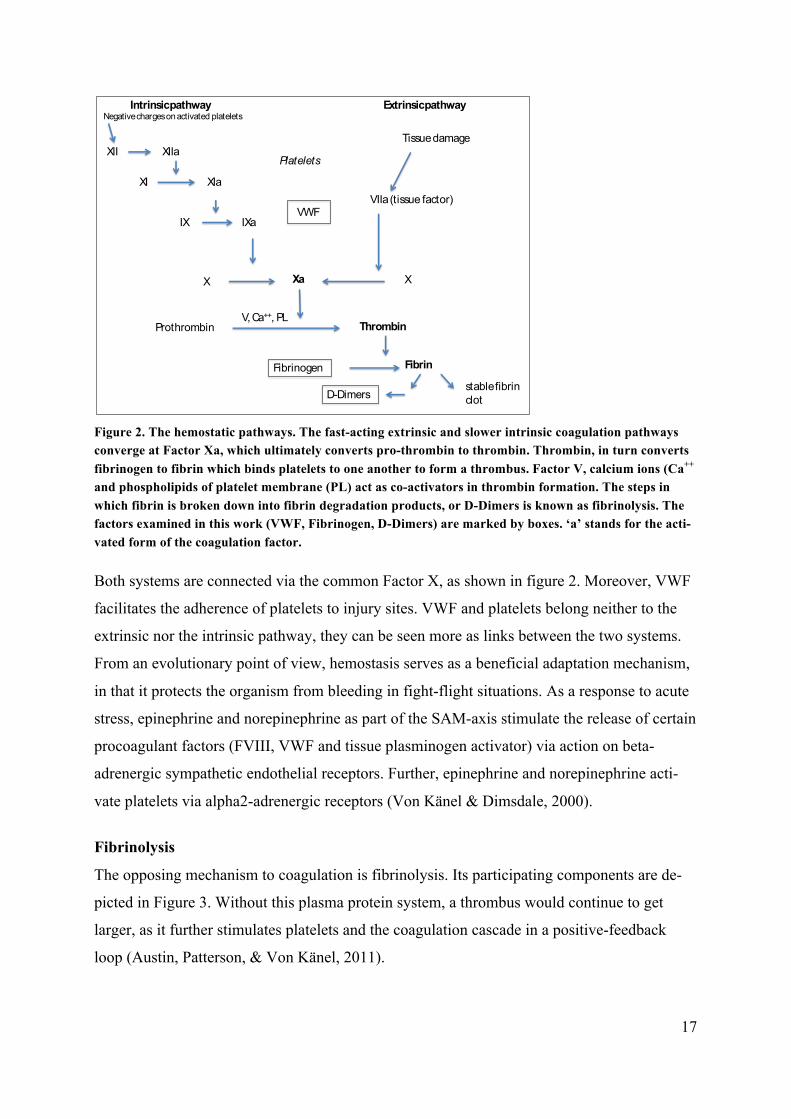
Figure 2. The hemostatic pathways. The fast-acting extrinsic and slower intrinsic coagulation pathways converge at Factor Xa, which ultimately converts pro-thrombin to thrombin. Thrombin, in turn converts fibrinogen to fibrin which binds platelets to one another to form a thrombus. Factor V, calcium ions (Ca++ and phospholipids of platelet membrane (PL) act as co-activators in thrombin formation. The steps in which fibrin is broken down into fibrin degradation products, or D-Dimers is known as fibrinolysis. The factors examined in this work (VWF, Fibrinogen, D-Dimers) are marked by boxes. ‘a’ stands for the acti-vated form of the coagulation factor.
Both systems are connected via the common Factor X, as shown in figure 2. Moreover, VWF
facilitates the adherence of platelets to injury sites. VWF and platelets belong neither to the
extrinsic nor the intrinsic pathway, they can be seen more as links between the two systems.
From an evolutionary point of view, hemostasis serves as a beneficial adaptation mechanism,
in that it protects the organism from bleeding in fight-flight situations. As a response to acute
stress, epinephrine and norepinephrine as part of the SAM-axis stimulate the release of certain
procoagulant factors (FVIII, VWF and tissue plasminogen activator) via action on beta-
adrenergic sympathetic endothelial receptors. Further, epinephrine and norepinephrine acti-
vate platelets via alpha2-adrenergic receptors (Von Känel & Dimsdale, 2000).
Fibrinolysis
The opposing mechanism to coagulation is fibrinolysis. Its participating components are de-
picted in Figure 3. Without this plasma protein system, a thrombus would continue to get
larger, as it further stimulates platelets and the coagulation cascade in a positive-feedback
loop (Austin, Patterson, & Von Känel, 2011).
Prothrombin Thrombin
Fibrinogen Fibrin
Intrinsic pathway Extrinsic pathway
XII
XI
XIIa
XIa
IX IXa
VIIa(tissue factor)
Tissue damage
XXa
stable fibrinclot
X
Negative charges on activated platelets
Platelets
D-Dimers
VWF
V, Ca++, PL
18
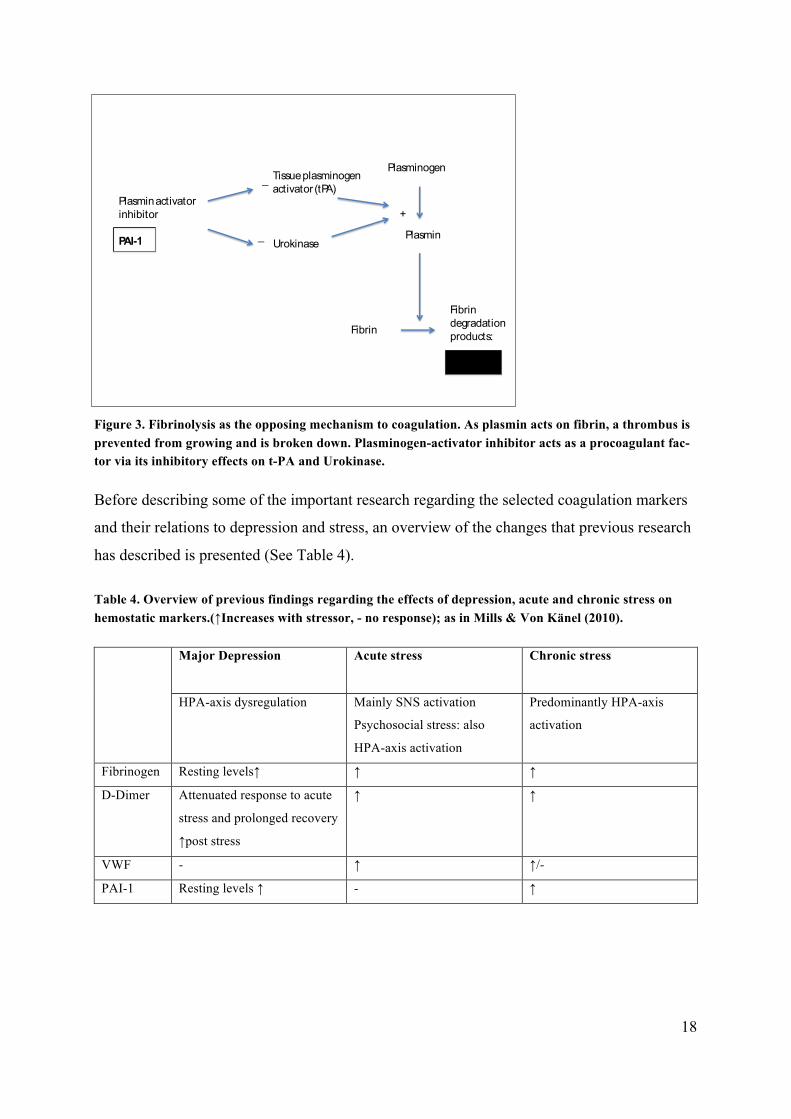
Figure 3. Fibrinolysis as the opposing mechanism to coagulation. As plasmin acts on fibrin, a thrombus is prevented from growing and is broken down. Plasminogen-activator inhibitor acts as a procoagulant fac-tor via its inhibitory effects on t-PA and Urokinase.
Before describing some of the important research regarding the selected coagulation markers
and their relations to depression and stress, an overview of the changes that previous research
has described is presented (See Table 4).
Table 4. Overview of previous findings regarding the effects of depression, acute and chronic stress on hemostatic markers.(↑Increases with stressor, - no response); as in Mills & Von Känel (2010).
Major Depression
Acute stress Chronic stress
HPA-axis dysregulation Mainly SNS activation
Psychosocial stress: also
HPA-axis activation
Predominantly HPA-axis
activation
Fibrinogen Resting levels↑ ↑ ↑
D-Dimer Attenuated response to acute
stress and prolonged recovery
↑post stress
↑ ↑
VWF - ↑ ↑/-
PAI-1 Resting levels ↑ - ↑
Plasminogen
Plasmin
Fibrin
Fibrin degradationproducts:
D-Dimer
Tissue plasminogen activator (tPA)
Urokinase
Plasmin activator inhibitor
PAI-1
+
_
_

19
2.4. Depression and the coagulation system
Depression is associated with increased levels of fibrinogen (Martins-de-Souza et al., 2014;
Wium-Andersen, Orsted, et al., 2013; Wium-Andersen, Ørsted, & Nordestgaard, 2013) and
increases in depressive symptoms have been described to correlate with elevated fibrinogen
levels in an examination of healthy school teachers over a 2-year period (Von Känel,
Bellingrath, & Kudielka, 2009b). Further, studies on platelets and psychiatric disease revealed
altered platelet functioning in depression. Increased aggregability to the stimulators thrombin
and collagen (Lederbogen et al., 2001), as well as heightened reactivity to orthostatic stress
(Musselman et al., 1996) were demonstrated in major depression patients compared to con-
trols. Interestingly, platelets store large amounts of serotonin (Williams, 2012), and in depres-
sion, storage and metabolism of this neurotransmitter, as well as noradrenergic and sero-
tonergic receptor density have been shown to be altered (Musselman et al., 1996).
Research by von Känel et al. (2009) showed associations of severity of depression symptoms
and vital exhaustion with attenuated D-Dimer responses to acute stress, but a delayed D-
Dimer recovery (Von Känel et al. 2009a). A study on elderly persons found that depressive
symptoms were associated with D-Dimer increases after exposure to an acute psychosocial
stressor (Von Känel, Dimsdale, et al., 2004). Eskandari et al. (2005) conducted a study on
premenopausal women with major depressive disorder (MDD) and report increased resting
levels of the antifibrinolytic PAI-1.
2.5. Acute and chronic stress and the coagulation system
Acute and chronic stress do not affect the hemostatic system in the same way (Mills & Von
Känel, 2010). These differences are explained in the following paragraphs.
Acute stress
Acute stress activates the sympathetic nervous system, which affects the coagulation system
in the following way: catecholamines are able to activate vascular endothelial beta-2 recep-
tors, resulting in increases of FVIII, VWF and t-PA. Catecholamines can further activate
platelets (Halperin & Reber, 2007). Acute stress also causes hemoconcentration, a process in
which increasing blood pressure causes efflux of plasma to the interstitial space. In hemocon-
centration, larger non-diffusible molecules including coagulation markers remain inside the
vascular system thereby increasing in concentration (Austin et al., 2011, 2013).

20
The HPA-axis is activated by acute stress that includes a psychosocial component, as seen in
plasma ACTH and cortisol (Bellingrath & Kudielka, 2008; Dickerson & Kemeny, 2004;
Höhne et al., 2014) However, chronic stress seems to elicit larger reactions in the HPA-axis.
The research literature describes a variety of ways to elicit acute stress in study participants in
a laboratory setting, such as mental arithmetic tasks, speech tasks, the mirror star tracing task,
and the Stroop color-word conflict test (Austin et al., 2013).
Examinations of healthy subjects revealed increases of procoagulant markers in response to
acute stress. Such markers were FVII, FVIII, FXII, fibrinogen, VWF antigen and platelets
(Austin et al., 2011; Hjemdahl & Von Känel, 2012; Thrall, Lane, Carroll, & Lip, 2007; Von
Känel et al., 2013; Von Känel, Mills, Fainman, & Dimsdale, 2001; Wirtz et al., 2008). How-
ever, the pro-fibrinolytic and anticoagulant factor tissue plasminogen activator (t-PA) was
increased through acute stress as well in these studies, which indicates that both coagulation
and fibrinolysis are activated at the same time (Austin et al., 2013; Hjemdahl & Von Känel,
2012). However, it is suggested that procoagulant mechanisms outweigh fibrinolytic mecha-
nisms, which would result in net hypercoagulability. After exposure to acute stress, levels of
coagulation factors returned to normal after 20-45 minutes, as two studies (Von Känel,
Preckel, et al., 2004; Wirtz et al., 2008) have described.
Chronic stress
The literature describes different categories of chronic psychological stress, such as work
stress, the stress of caregiving and post-traumatic stress disorder (PTSD), all of which have
been associated with changes in coagulation (Austin et al., 2011).
Cross-sectional studies have revealed associations f capacity (Hansen, Larsen, Rugulies,
Garde, & Knudsen, 2009; Von Känel et al., 2001) Persons caring for their spouse with Alz-
heimer’s disease presented with higher resting D-Dimer levels than non-caregivers matched
for age and sex (Von Känel, Dimsdale, et al., 2006). Research on PTSD patients showed an
increased morbidity and a higher and more premature mortality due to cardiovascular disease
and thromboembolism (Robicsek, Makhoul, Klein, Brenner, & Sarig, 2011). Higher levels of
procoagulant hemostasis factors were described in PTSD patients compared to controls, for
example VWF antigen and Factor VII (Robicsek et al., 2011). In addition, platelets from
PTSD patients showed an increased reactivity to epinephrine/ADP stimulation (Vidović et al.,
2011) suggesting increased stress sensitivity.

21
Furthermore, socioeconomic class has been found to also influence the hemostatic system:
fibrinogen, FVII:C and VWF:AG were found to be increased in persons with low socioeco-
nomic status, which was measured by constructs such as occupation and education (Von
Känel et al., 2001). Low socioeconomic status has been treated as a form of chronic stress,
however, one cannot make the claim that low social status always equates to chronic stress.
Nonetheless, there exists some research that found connections between socioeconomic status
and hemostatic changes. Von Känel et al., 2001, for example, summarize in their review on
psychological stress and coagulation, that socioeconomic status is inversely related to plasma
fibrinogen levels. A large public health survey by Berlin’s Robert Koch Institute on German
adults, found that a high stress burden was more prevalent in persons with low socioeconomic
status (Hapke et al., 2013). In this work, chronic stress was assessed by a questionnaire that
focuses on work and social stress primarily. Although associations between socioeconomic
status and the hemostatic system exist, this work does not examine social status of the sub-
jects.
Regarding changes in coagulation, chronic stress seems to differ from acute stress in that it is
more involved in HPA-axis activation and in decreased parasympathetic activity (Hjemdahl &
Von Känel, 2012; Von Känel & Bacon, 2013). How cortisol affects the coagulation system
has not been studied as extensively as catecholamine effects. In women with coronary artery
disease, morning serum cortisol was modestly associated with prothrombotic activity (fibrin-
ogen and VWF) suggesting that by causing a hypercoagulable state, cortisol might be in part
responsible for the formation atherosclerosis (Von Känel, Mausbach, Kudielka, & Orth-
Gomér, 2008).
One coronary angiography study revealed that patients with hypercortisolism had excess cor-
onary calcifications and atherosclerotic coronary plaques (Neary et al. 2013). Erem et al.
(2009) found that in patients suffering from Cushing’s syndrome increased platelet count,
fibrinogen and PAI-1, and decreased tissue factor pathway inhibitor were measured, which, in
summary, confirm a hypercoagulable and hypofibrinolytic state. This evidence strengthens
the argument for an association between cortisol and augmented risk for atherosclerosis. Our
study sample did not include any persons with clinical hypercortisolism. Nonetheless, the
relationship between a disturbance in HPA-axis regulation, which is manifest in hypercorti-
solism, and atherosclerosis is worth mentioning here, because patients with depression also
show alterations in HPA-axis regulation.

22
2.6. Coagulation markers for acute and chronic stress
In light of recent research in the area of acute stress and coagulation, the following parameters
were selected for examination in the present work: fibrinogen, D-Dimer, VWF and PAI-1.
The subsequent section explains the functions of these parameters and summarizes their role
in recent research.
Fibrinogen
Fibrinogen is a glycoprotein that is always present in plasma and plays a key role in thrombo-
cyte aggregation and fibrin synthesis. Receptors on activated thrombocytes bind fibrinogen so
that it can cross-link thrombocytes. The serine-protease thrombin cleaves fibrinogen, thus
converting it to fibrin. Fibrin forms strands of insoluble protein that bind to thrombocytes and
are cross-linked with the help of Factor XIII. Fibrin then contracts and hardens and together
with aggregated thrombocytes forms a clot that can seal the site of injury.
A large-scale study of the general population by Wium-Andersen et al. (2013) found that ele-
vated plasma fibrinogen levels were associated with depression and psychological distress
after adjusting for the confounders age, gender, smoking, BMI, physical activity and chronic
stress. Beside its role in blood clotting, fibrinogen is also an important acute-phase-protein,
i.e. a plasma protein that rises in concentration in response to inflammation. One of the func-
tions of an acute phase protein is to help the immune system fend off microbes. Although the
mechanisms are not yet fully understood, fibrinogen is also related to increased cardiovascu-
lar risk: a meta-analysis showed that the hazard ratio per 1 g/L increase in normal fibrinogen
levels was 1.8 for coronary heart disease and stroke (Danesh, Lewington, & Thompson,
2005). As previously mentioned, fibrinogen levels have been found to be increased in depres-
sion, and it is responsive to both acute and chronic stress. An increase in fibrinogen triggered
by psychophysiological stress was shown to be associated with stiffness of the carotid arteries
(Ellins et al., 2008), which further underlines the role of stress as a mediator for cardiovascu-
lar risk.
D-Dimer
D-Dimer, which is a product of fibrin-degradation in fibrinolysis, is an overall indicator of
activation of coagulation and fibrinolysis or fibrin turnover (Von Känel & Bacon, 2013). Dur-
ing coagulation the enzyme thrombin connects soluble fibrin molecules to form a fibrin-

23
meshwork. This meshwork is further stabilized through Factor XIII, which creates links be-
tween fibrin fibrils at their D-fragment sites, creating a meshwork structure that serves as the
foundation of a thrombus. During thrombus degradation, plasmin cleaves this mesh at various
sites, resulting in polymers of different sizes. Sites in which two fibrin proteofils were linked
(the D-fragment sites) remain intact and can be detected by an immunoabsorbant assay using
monoclonal antibodies to a specific epitope on the D-Dimer fragment.
In clinical practice D-Dimer serves as a marker for ruling out the diagnoses pulmonary embo-
lism and thromboembolism. Levels below 500ng/ml make it unlikely that a thrombus is in the
process of degradation.
D-Dimer plays a pro-atherosclerotic role in macrophage function by enhancing the inflamma-
tory response during foam cell formation (Zhou, Yang, Zhou, & Rui, 2007).
In a series of studies Von Känel et al. were able to show increases of D-Dimer in response to
acute psychosocial stress (Von Känel, Preckel, et al., 2004; Von Känel, Bellingrath, et al.,
2009a; Wirtz, Redwine, Ehlert, & Von Känel, 2009). It has been further shown that it is in-
creased in inflammation (Borissoff et al., 2011; Zhou et al., 2007).
Von-Willebrand-Factor (VWF)
VWF is a very large protein released from stimulated or damaged endothelial cells and from
thrombocytes. It triggers platelet adhesion to places of vascular injury in areas of high shear
stress and stimulates the aggregation of platelets.
In acute-stress tasks, including the Trier Social Stress Test (TSST), an increase of VWF has
been observed (Mills & Von Känel, 2010). Von Känel and Dimsdale (2000) report a dose-
dependent stimulation of VWF antigen during a 15- to 40-min infusion of epinephrine, sug-
gesting VWF production can be stimulated by sympathetic nervous system activation. Posi-
tive associations between severity of PTSD symptoms and VWF levels have been reported
(Von Känel, Hepp, et al., 2006, 2008).
Plasminogen activator inhibitor (PAI1 or SERPINE1)
Plasminogen activator inhibitor (PAI-1) is a protein that acts on tissue plasminogen activator
(t-PA) and Urokinase and prevents these enzymes from promoting plasmin production. Its
action thereby prevents fibrinolysis and amplifies or prolongs coagulation. Figure 3 depicts
the connection between PAI-1 and the coagulation cascade. Normally, the liver, adipocytes,
smooth muscle cells and platelets synthesize PAI-1. In pathological conditions however, such
as atherosclerosis, endothelial cells and other inflammatory-stimulated cells secrete increased

24
amounts of PAI-1 (Binder, 2002). Recent studies suggest a crucial role for PAI-1 in mediating
stress-induced hypercoagulability and thrombosis (Jiang, Gingles, Olivier, Miles, & Parmer,
2011) A study by Eskandari et al. (2005) on premenopausal women with major depressive
disorder showed increased resting levels of PAI-1. Further, an independent association be-
tween high PAI-1 and long term psychiatric symptoms in middle-aged men has been de-
scribed by Huotari et al. (2010). Lahlou-Laforet et al. (2006) report an elevated PAI-1 activity
in depressed patients after adjusting for the presence of chronic heart disease, smoking, tri-
glyceride concentration, hypertension, and body mass index. Subjects with vital exhaustion
showed increased baseline PAI-1 levels (Von Känel, Frey, & Fischer, 2004). Furthermore,
two of six known polymorphisms for the PAI-1 gene have been found more frequently in pa-
tients with major depressive disorder (Tsai et al., 2008). Tsai and his team conclude that in-
creased PAI-1 levels may be one factor in explaining the link between metabolic syndrome
and depression. With respect to stress, PAI-1 activity increases have been observed in chronic
stress, but it does not seem to be affected by acute stress (Mills & Von Känel, 2010).

25
3. Research questions and hypotheses
The focus of this work lies on the examination of the influence of a depression history and
chronic stress on basal and stress-related coagulation.
Depression symptoms and chronic stressors, such as job strain, may influence vascular health
by creating a low-grade hypercoagulable state (Austin et al., 2013). Net hypercoagulability
within the vasculature may contribute to increasing the risk for thrombogenesis and elicit pro-
gression of atherosclerotic plaques. The result is an increased risk for cardiovascular events,
such as stroke or myocardial infarction. The following two sets of research questions will be
addressed to help to better understand these associations.
The first set of research questions deals with resting coagulation parameters, while the second
set focuses on stress-induced changes of coagulation parameters. Within each set, the effects
of depression history and of chronic stress burden are examined independently, as well as
their interacting effect.
3.1. Hypotheses regarding basal coagulation
3.1.1. The effects of remitted depression on basal coagulation
Of the coagulation markers studied, fibrinogen stands out to have the strongest association
with depression. Major depression has been associated with elevated resting levels of fibrino-
gen in a variety of studies (Martins-de-Souza et al., 2014; Wium-Andersen, Orsted, et al.,
2013) and increases in depressive symptoms and in fibrinogen levels were significantly corre-
lated in an examination of healthy school teachers over a 2-year period (Von Känel,
Bellingrath, et al., 2009b).
Another marker that has been extensively studied in relation to depression is PAI-1. A study
by Eskandari et al. (2005) on premenopausal women with major depressive disorder (MDD)
showed increased resting levels of PAI-1. Further, an independent association between high
PAI-1 and long-term psychiatric symptoms in middle-aged men has been described by Huota-
ri et al. (2010). Lahlou-Laforet et al. (2006) report an elevated PAI-1 activity in depressed
patients after adjusting for the presence of chronic heart disease, smoking, triglyceride con-
centration, hypertension and body mass index. In the current study we examine remitted de-
pression in relation to coagulation markers, which remains relatively unexplored. Baune et al.
(2012) report that elevated PAI-1 levels were associated with remitted depression in a sample
of elderly persons. Kling et al. (2007) examined CRP and amyloid A, which, like fibrinogen

26
belong to the family of acute-phase-proteins. Both these markers were significantly elevated
in a sample of remitted depressed women compared to BMI-matched healthy controls. One
can deduce that a pro-inflammatory state that has also been described elsewhere persists even
after symptomatic recovery from depression (Kling et al., 2007). This suggests that fibrinogen
may also be elevated in remitted depression. Accordingly, the following hypothesis is de-
duced:
H1.1: Baseline fibrinogen and PAI-1 levels are higher in remitted depressed subjects com-
pared to controls.
3.1.2. The effects of chronic stress on basal coagulation
There are different concepts of what constitutes chronic stress. The two frequently discussed
models regarding the workplace are the effort/reward imbalance model (Siegrist, 1996) and
the demand/control/support model (Karasek & Theorell, 1990), also termed ‘job strain’. In the
former, high demands at work are combined with low security and few career opportunities,
while in the latter, the affected person experiences high psychological demands but at the
same time has a low decision latitude or job control (Kivimäki et al., 2002).
This combination of high demand and low control has been associated with increased cardio-
vascular mortality risk (Kivimäki et al., 2002) in a longitudinal study among employees who
were free from cardiovascular disease at baseline The cardiovascular mortality was 2.2-fold.
Further, job strain predicted future BMI and cholesterol concentrations. In persons with high
job strain, caregivers, or persons suffering from PTSD, increases in the following hemostasis
factors have been described: fibrinogen, D-Dimer, FVII, FVIII and VWF. Lower socioeco-
nomic status has been associated with higher resting plasma viscosity, VWF and Factor VIII
(Steptoe, Kunz-Ebrecht, Rumley, & Lowe, 2003). A few studies have found that low socioec-
onomic status is associated with changes in fibrinogen, D-Dimer, FVII, FVIII and VWF. PAI-
1 increases at rest have also been associated with chronic stress in a range of studies
(Eskandari et al., 2005; Huotari et al., 2010; Lahlou-Laforet et al., 2006; Mausbach et al.,
2007; Tsai, 2006). Furthermore, one study found that fibrinogen was elevated in unemployed
persons (Kaptoge et al., 2007a). Based on these findings, the following hypothesis is derived:
H1.2.: Subjects under chronic stress have elevated baseline levels of the procoagulant fac-
tors fibrinogen, DD, VWF and PAI-1 compared to controls.

27
3.1.3. The effects of the interaction between remitted depression and chronic stress on basal coagulation
As seen in studies on Dexamethasone/CRH tests, major depression has been shown to have
altered stress responsiveness, which is why it is often called a stress-related disease.
So far, interaction effects between remitted depression and chronic stress on resting coagula-
tion levels have not been examined. The hypothesis is therefore a non-directional one.
H1.3.: Baseline procoagulant markers in remitted major depression are altered, depending
on the presence of chronic stress.
The second part of this work looks at hemostatic responses to an acute stressor, the Trier So-
cial Stress Test (TSST). Again, the effects of remitted depression and chronic stress, as well
as their combined effect are analyzed.
3.2. Hypotheses regarding stress-induced coagulation
3.2.1. The effects of remitted depression on stress-induced coagulation
Regarding healthy subjects, previous research has described an increase in procoagulant fac-
tors with acute stress with the following markers showing significant increases: FVII, FVIII,
FXII, fibrinogen, VWF antigen and platelets (Austin et al., 2011; Hjemdahl & Von Känel,
2012; Thrall et al., 2007; Von Känel et al., 2013, 2001; Wirtz et al., 2008). For stress coagu-
lability in depressed individuals the literature is rather scarce. Neither of the studies examined
includes major depression patients or remitted depressed patients (as diagnosed using the
DSM-IV (Diagnostic and Statistical Manual of Mental Disorders). In a study similar to ours,
which also used the TSST with healthy, middle-aged school teachers, increased levels of vital
exhaustion and depression were associated with attenuated D-Dimer response to acute stress
but with prolonged D-Dimer recovery (Von Känel, Bellingrath, et al., 2009a), indicating pro-
longed hypercoagulability after stress cessation.
Another study found that depressive symptoms were associated with exaggerated D-Dimer
increases after the TSST in elderly subjects (Von Känel, Dimsdale, et al., 2004). Taken to-
gether, the literature suggests that D-Dimer changes over time are affected by depressive
mood. The following hypothesis is derived:

28
H2.1.: Remitted major depression has an effect on acute psychosocial stress (TSST)-
induced changes in D-Dimer levels.
3.2.2. The effects of chronic stress on stress-induced coagulation
Only few studies have examined how chronic stress influences reactions of the coagulation
systems to an acute-stressor. Also, the way in which chronic stress was defined and assessed
was not uniform. The results of a study on dementia caregivers showed that the number of
negative life events experienced before a speech task was directly correlated with changes in a
pro-coagulability score that included the thrombin/antithrombin III complex, D-Dimer, VWF,
t-PA and PAI-1 (Von Känel, Dimsdale, Patterson, & Grant, 2003). Another study investigated
social support with regards to stress-reactivity. Low levels of social support may also give rise
to chronic stress. Wirtz et al. (2009), reported that high levels of social support, as assessed by
a questionnaire, were associated with lower fibrinogen and D-Dimer before and after acute
stress (TSST). Lower social support was associated with higher fibrinogen and D-Dimer lev-
els, both at baseline and following the stressor. These results were independent of BMI, age,
and mean arterial blood pressure (Wirtz et al., 2009). Based on this research, it is hypothe-
sized that
H2.2.: High chronic stress modulates procoagulant responses to acute psychosocial stress.
3.2.3. The effects of the interaction between remitted depression and chronic stress on stress-induced coagulation
Whether chronic stress (CS) and remitted major depression (MD) have a combined effect on
stress-induced coagulation has so far not been examined in the literature.
Since major depression is a stress-related disease, an interaction effect is likely. However, a
non-directional hypothesis needs to be postulated:
H2.3.: Whether MD+ and MD- differ in their procoagulant responses to acute stress de-
pends on the presence or absence of chronic stress.

29
4. Methods
The experiment conducted for this study consisted of a preliminary interview of each partici-
pant that lasted approximately two hours, and an experimental assessment that took place dur-
ing an afternoon between 1pm and 5pm at the Max Planck Institute for Psychiatry, Munich.
During the afternoon two psychosocial stress tests were carried out with each subject, of
which only the first one is of relevance for this dissertation. Participants gave their written
consent to take part in the study, which was approved by the local Ethics Committee of Mu-
nich’s Ludwig Maximilians University. Participants were also informed that they had the
right to withdraw their consent at any time. A compensation of EUR 175 was paid for partici-
pation.
4.1. Subject Sample
A total of 63 subjects between the ages of 31 and 42 years took part in the study. Mean age
was 35.22 years overall; 36.08 (SD: 3.57) years in the control group and 34.7 (SD: 3.48) years
in the remitted depression group. The remitted depression group included 40 subjects, the
control group 24 subjects. Four subjects in the depression group were taking antidepressant
medication. There were 26 males, and 37 females, 13 of which were taking hormonal contra-
ception. Characteristics of the study sample are listed in Table 3 in the Results section.
All subjects were recruited from the Early Developmental Stages of Psychopathology (EDSP)
study, a prospective-longitudinal investigation that commenced in 1994. It was designed to
investigate prevalence, incidence, risk factors, course of disease and comorbidity of mental
disorders and includes a random sample of the city of Munich’s population register. In 1994,
3021 participants between the ages of 14 and 24 were interviewed using the Munich- Compo-
site International Diagnostic Interviews (M-CIDI)(Wittchen & Pfister, 1997), which detects
psychological disorders using DSM-IV. Between 1995 and 2005 participants were inter-
viewed using the M-CIDI at four different time points. (2005: N = 2210, response rate 73%.
403 participants from the EDSP database were eligible for inclusion as potential participants.
They were contacted and informed about the procedure. In case of approval to take part in the
study, candidates underwent a screening interview via telephone to assess whether they were
eligible for the study.
In recruitment of subjects for the study, the aim was not to have a representative cross-section
of the study cohort (EDSP) but to recruit an equal amount of subjects with and without a de-

30
pression history. Subjects were therefore selected according to this information. During the
experimental phase of the study, however, more subjects turned out to have suffered from
depression, causing an imbalance between patient and control groups.
At the time of the stress test, the hormonal system, the coagulation system and the immune
system were not to be modified by influences other than the experimental stressor. Therefore
the following exclusion criteria were defined for all subjects:
- Hormonal disorders such as Morbus Cushing or Morbus Addison, untreated thyroid
illnesses
- A history of cardiovascular events such as myocardial infarction or stroke within the
past 6 months
- Organ transplant within the past 6 months
- Treatment with cancer chemotherapy within the past 12 months
- Chronic respiratory tract diseases
- Autoimmune diseases
- Diseases of the hematopoietic system or treatment with anticoagulant drugs
- Glucocorticoid treatment or treatment with other pharmaceuticals that influence HPA-
axis functions
- Pregnancy or breast-feeding
- Professional athletes
Further, persons were excluded who were diagnosed, at present or in the past, with the follow-
ing psychiatric disorders (DSM-IV):
- Schizophrenia and other psychotic disorders
- Social phobia
- Substance-abuse
- Needle-related anxiety
- Bipolar affective disorder
- Dysthymia
Subjects in the remitted depressed group had been diagnosed with Major Depressive
Disorder, according to DSM-IV, but were in remission for a minimum of six months at the
time of the experiment. In the control group, all affective disorders, including generalized
anxiety disorder, whether at present or in the past, were further exclusion criteria.

31
In case of acute infections/inflammation or an overseas flight within the past two weeks, the
appointment for the experiment was postponed or the situation re-evaluated. The same was
true for persons under high physical strain or suffering from symptoms of depression. Shift
workers’ assessments were scheduled to take place on a day after a holiday or during a time
of day shifts. Hormonal contraception and antidepressant medication were not among the ex-
clusion criteria. 35% of participating women were taking hormonal contraception. For female
subjects who were not taking hormonal contraception, the day of the examination was chosen
to coincide with the luteal phase of the monthly cycle (days 14-28), because sex differences in
HPA-axis reactivity are known to be least during this time (Kirschbaum et al., 1999). Four
subjects included in the analyses were taking antidepressant medication. All four were taking
SSRIs: citalopram, escitalopram and paroxetine. To control for a potential influence of the
antidepressant medication, the presence of such medication was included as a covariate in all
analyses. Initially, 66 subjects were recruited. Two subjects were excluded from analyses due
to depressive symptoms within the past six months prior to the examination day. One subject
was excluded due to missing data for chronic stress. Therefore N = 63. Three subjects pre-
sented outliers for some of the coagulation parameters that were above or below two standard
deviations from the mean. The respective values, but not the three subjects, were excluded for
analysis.
Groups
In order to test for effects of remitted depression and chronic stress on coagulation factors,
subjects were assigned to a MD+/- and CS+/- group, which resulted in a 2x2 design:
MD+ MD-
CS+ CS- CS+ CS-
Remitted Major Depression (MD+) vs. healthy controls (MD-)
Subjects were assigned to two groups with respect to their disease history. Subjects without
history of any psychiatric disorders were defined as healthy control group (MD-, N = 24),
while subjects with a lifetime history of major depression were assigned to the depression
group (MD+, N = 39).

32
Participants in the MD+ group had to have a cumulative lifetime diagnosis of major depres-
sion (according to DSM-IV criteria as determined using the M-CIDI) and had been in remis-
sion for a period of at least six months at the time of examination. Group membership was
determined using longitudinal data gained from regular M-CIDI-interviews.
High chronic stress (CS+) vs. low chronic stress (CS -)
Chronic stress in study participants was evaluated with the Trier Chronic Stress Inventory,
TICS, (Schulz & Schlotz, 1999). Based on the total score of this questionnaire, the sample
was split into two groups. Using the median split a group with high chronic stress and a group
with low or no chronic stress was formed (CS+, N= 34; CS-, N=29).
4.2. Experimental procedure
Diagnostic assessment
Participants of the EDSP study received a letter of invitation and were contacted by telephone
to discuss their further involvement in the study.
After giving their consent to participate and if inclusion criteria were fulfilled (as checked
through an additional phone call), the eligible subjects were invited for a diagnostic assess-
ment. Here, the computerized Munich version of the Composite International Diagnostic In-
terview (M-CIDI) was used to assess symptoms and diagnoses of DSM-IV disorders and their
onset, duration and severity (Wittchen & Pfister, 1997) . The same interview had been used at
all assessments during the EDSP study. A variety of other questionnaires were completed at
this assessment, some of which are described further on.
Trained interviewers conducted the interval version of the M-CIDI covering the time period
between the previous assessment and the current evaluation.
Beck’s Depression Inventory II (BDI-II) was used to exclude the presence of acute symptoms
of depression within the last 14 days. Participants received an invitation for the experimental
part of the study if their BDI-II score was at or below 14.
Setting
The experiments took place in the sleep laboratory at the Max Planck Institute, which proved
to be a good choice since it shielded the participants from outside disturbances. A principal
investigator and a lab technician were present. A detailed protocol regarding instructions for
the study participants, a schedule for blood collections and questionnaires was established so

33
that the conditions were as similar as possible for each study subject. The study protocol is
presented in Table 2.
The subjects were invited to arrive at the institute with enough time to minimize stress and get
used to the new surroundings. There was also enough time for the stress caused by placing a
venous catheter to subside before beginning the actual experiments.
Trier Social Stress Test (TSST)
As it was our priority to carry out the experiments in a most accurate and standardized manner,
a detailed protocol was prepared as part of the study design so that conditions were the same
for all participants (see Table 2). It listed in great detail the steps that the investigator and
technical assistants were to go through during the afternoon. Instructions for the test subjects
regarding the TSST were read out loud to minimize inconsistencies and ambiguities due to the
investigator’s interaction with the test subjects.
For the induction of acute stress we used the Trier Social Stress Test (TSST), a standardized
experimental protocol developed by Kirschbaum et al. (1993). In the course of the test after-
noon, the TSST was used twice, but for coagulation parameters only the first TSST was rele-
vant. Several blood tests were performed for measurement of coagulation parameters.
In a first instruction 40 minutes prior to the TSST, subjects were informed that they were to
take part in a psychosocial stress test that consists of two tasks to be performed in front of a
jury. They were told that they first had to hold a speech that was to be videotaped and record-
ed. The material would then be used in an analysis of language and behaviour. The subjects
were told to present themselves in the most convincing manner possible, so as to receive a
good evaluation.
In a second instruction 25 minutes before the TSST, subjects were informed that their specific
task during the stress test was to give a presentation for a job application or for a promotion.
The subjects were able to choose the field this job was in, however, it was pointed out to them
to choose a realistic job that could fit into their current lives. Within this 5-minute talk, the
subjects would have to convince the audience of their suitability for this job/promotion. They
would have to make sure to be within the video-camera’s range. The jury could interrupt and
ask further questions if needed. During this second instruction, the participants were informed
that after their talk they would have perform a second task, and that they would receive in-
structions then. Between the first and second instruction for the TSST, participants had to do a
computerized neuropsychological test (Stroop color-word conflict test) measuring attention
and concentration. Participants were informed that their results on this test would be taken

34
into consideration for a final evaluation. In this work, however, performance on the Stroop
test was not analyzed and served as another stressful element.
After a 10-minute preparation time, subjects were led to a different room in which the jury
was waiting for them. They were not allowed to take their written notes along.
The room was equipped with a video camera connected to a screen in which the subjects
could see themselves. A microphone was handed to them at the beginning of their speech.
The jury consisted of two persons wearing laboratory coats. They were not to give any feed-
back or reassurance and had to keep neutral facial expressions.
Upon arrival of the participant, the video camera was switched on. After handing the micro-
phone to the participant, the jury leader asked the participant to start the speech and started a
stopwatch.
Five minutes into the speech the jury interrupted the participant and gave instructions on the
second task, a mental arithmetic task. In steps of 13, the participant was asked to subtract
from 1678 in their fastest and most accurate manner. Should participants make a mistake, they
had to start over at 1678. After this second task the participants were lead to the previous
room where they were allowed to read a magazine or newspaper.
4.3. Assessment of the stress response
Heart rate as a response of the sympathetic nervous system or SAM-axis was measured using
a pulse measurement belt (Polar© RS400) that participants placed around their chest. It
transmitted heart rate to a pulse watch that was worn around the wrist.
To test for responses in the HPA-axis, cortisol levels were measured.
Blood for cortisol measures was collected at six times during the test afternoon: at baseline,
directly before the TSST, directly after, and +15, +30 and +45 minutes after the TSST. 5ml
EDTA aliquots were used, centrifuged at 4000x/min, their supernatant (approximately 1ml)
separated and frozen at -20°C until further analyses were carried out using a radioimmunoas-
say kit (CT Cortisol RIA, DRG Diagnostics, Marburg, Germany) This kit has a detection limit
at 1.7 ng ⁄mL.
Multidimensional adjectives questionnaire (BSKE) regarding current state
At seven different time points subjects completed the short form of the multidimensional
adjectives questionnaire (BSKE). This test examines subjects’ current mental state using a
likert-scale from 1 (= not at all) to 6 (= agree fully) and examines, among other categories,
anxiety and inner restlessness (Janke, Debus, Erdmann, & Hüppe, 1995). The 12-item form

35
was used at several time points during the test afternoon: directly before the TSST instruc-
tions, directly before the TSST, after the TSST (retrospectively regarding the TSST) and three
times during the recovery period after the TSST. The participants’ subjective reactions to the
stressor, i.e. anxiety and inner restlessness, were considered for statistical analyses.
4.4. Sampling procedure and laboratory analyses
At the beginning of the experiment, the principal investigator or medical student placed a ve-
nous catheter in the subjects’ forearm. This catheter was connected to a flexible tube system,
which connected through the wall to the lab technician’s bench. After each collection, the
tube was flushed with 10ml 0.9% sodium chloride to prevent clotting. Between blood collec-
tions, the subject received a 0.9%-sodium-chloride drip (50ml/h, Secura Infusomat, B-Braun,
Melsungen) in order for the catheter to remain permeable. As participants were lead to the
other room for the TSST, the tube was removed and a stylet was placed to clog the catheter.
Routine blood samples were taken twice during the afternoon and included count of leuko-
cytes, erythrocytes and thrombocytes, hematocrit and hemoglobin, MCV and MCH liver en-
zymes and creatinine. One 2.5ml EDTA tube and one 7.5ml serum tubes were drawn (Mono-
vetten Sarstedt, Nürnberg). The EDTA tube was centrifuged at 4000x/min for 7
minutes and its supernatant separated and stored at +4°C until further analyses at the institute
for clinical chemistry. A urine sample was taken to exclude drug use (benzodiazepines, opi-
oids, cannabis).
Measurements of coagulation parameters took place at rest, 15 min post-stress and 45 min
post-stress. PAI-1 was measured at rest only. For the final 22 subjects of the examination rou-
tine we decided to add another time point for blood collection for additional analyses: directly
post-stress. Table 2 shows the exact time points in which blood samples for coagulation anal-
yses were obtained.
2x 3ml venous blood was collected into 0.3ml citrate buffer tubes (Monovetten Sarstedt,
Nuremberg). Aliquots were centrifuged at 4000x/min and the plasma containing the clotting
factors was separated, then kept at +4°C temperature, and frozen at -20°C until they were
shipped to a laboratory in Switzerland for further analysis. For the transport-78°C dry ice was
used. Fibrinogen, vWF and PAI-1 levels were measured using a multiplexed particle-based
flow cytometric cytokine assay (Vignali, 2000). Assay kits were used from Millipore (Zug,
Switzerland) and R&D Systems (Oxon, UK). The analysis was conducted with a conventional

36
flow cytometer (Guava EasyCyte Plus, Millipore, Zug, Switzerland). For D-Dimer measures,
an ELISA from Technoclone (Vienna, Austria) was used. Further 2x 7.5ml blood was drawn
into DNA-aliquots (Monovette Sarstedt K3E) for other analyses. In addition, RNA aliquots
for 2.5ml whole blood were drawn, pivoted and kept at room temperature until they were fro-
zen at -20°C on the next day. RNA was analyzed for the study of polymorphisms in the
FKBP5 gene and its association with major depression.
4.5. Questionnaires
Before the study day, either at home or the morning before, the subjects were asked to fill out
the Munich version of the Composite International Diagnostic Interview questionnaire (M-
CIDI), a questionnaire regarding symptoms, syndromes and diagnoses of DSM-IV disorders
(Wittchen & Pfister, 1997). The same interview was used in the longitudinal EDSP study at
all assessments. Trained interviewers conducted the interval version of the M-CIDI covering
the time period between the previous assessment and the current evaluation.
Beck Depression Inventory (BDI-II)
During the diagnostic appointment, the BDI-II (Beck & Steer 1996; German version by
Hautzinger et al. 2006) was used to assess the presence and severity of acute depression
symptoms within the last 14 days. There are 21 items including questions on sadness, feelings
of guilt, loss of energy and appetite that the participant answers on a scale from 1-4 points,
which are added to yield the total score. 0-13 points are considered as minimal, 14-19 point as
mild, 20-28 as moderate and 29-63 points as severe depression. Participants received an invi-
tation for the experimental part of the study if their total score was below 14. The BDI-II
questionnaire was also filled out a second time on the test day before the stress protocol.
Trier inventory for the assessment of chronic stress (TICS)
This 57-item questionnaire developed by Schulz and Schlotz (1999) evaluates the following
dimensions of chronic stress: work overload, pressure to succeed, excessive demand at the
workplace, work discontent, social tension, lack of social recognition, social stress. A 12-item
screening scale (SCSS) serves as a comprehensive measure of chronic stress. Internal con-
sistency (Cronbach's Alpha) of this scale has been reported at α = .87, indicating good to very
good reliability (Petrowski, Paul, Albani, & Brähler, 2012).
The frequency by which stress events were experienced or stressful feelings were perceived in
these areas over the past three months, from 0 (never) to 4 (very often), permits the investiga-

37
tor to estimate the subjects’ level of stress chronicity. Examples for questions found in the
TICS questionnaire are listed in Table 1. In the present study the questionnaire was completed
during the diagnostic interview.
Table 1. Examples of questions asked in the Trier inventory for the assessment of chronic stress for each category, as found in Petrowski, Paul, Albani, & Brähler (2012).
Category Example question Work Overload “I have too many tasks to perform. ”
Social Overload “I must frequently care for the well-being of others. ”
Pressure to Perform “I have tasks to fulfill that pressure me to prove myself. ”
Work Discontent “Times when none of my tasks seem meaningful to me.”
Excessive Demands at Work “Although I try, I do not fulfill my duties as I should”
Lack of Social Recognition “Although I do my best, my work is not appreciated”
Social Tensions “I have unnecessary conflicts with others.”
Social Isolation “Times when I have too little contact with other people. ”
Chronic Worrying “Times when I worry a lot and cannot stop.”
Table 2. The study protocol used for the examination. Overview of time points and tasks of investigator and technical assistant.
Time Main investigator
Technical assis-tant
Participant (P)
Questionnaires Blood collection
13:15 Urine sample Pulse-meter on
Welcome P at lobby
13:30 BDI-II Routine blood work 1
- Instruction - Placement of
venous cathe-ter
- P can read newspaper or book
13:55 Practice run Emotional Stroop
14:00 Baseline 1. BSKE 1. Blood collection RNA, Plasma, Cyto-kines, Coagulation parameters, Cortisol
Heart rate ___
14:05 - Instruction I for TSST
- Emotional Stroop
14:15 2. BSKE Heart rate ___

38
14:18 - Instruction II for TSST
- 10 min prepa-ration for TSST
14:30 0 min pre stress 3. BSKE 2. Blood collection RNA, Plasma, Cortisol
Heart rate ___ Time on pulse watch ___ (Pre-TSST)
14:35 Disconnect partic-ipant from blood collection
TSST: take P to other room, TSST from 14.35 to 14.50
14:50 0 min post stress 4. BSKE-retrospectively
3. Blood collection Coagulation parame-ters (n=22), Cortisol
Heart rate ___ Time on pulse watch ___ (Post-TSST)
Switch on movie 15:05 15 min post stress 5. BSKE 4. Blood collection
Coagulation parame-ters, Cortisol
Heart rate ___
15:20 30 min post stress 6. BSKE 5. Blood collection RNA, Plasma, Cortisol
Heart rate ___
15:35 END of experiment
45 min post stress 7. BSKE 6. Blood collection Routine blood work 2 Coagulation parame-ters, Cortisol
Heart rate ___ Switch off movie
4.6. Statistical analyses
Data were analyzed using PASW Statistics for Windows (Version 18.0., SPSS Inc., released
2009, Chicago, IL, USA).
For statistical analyses of variables the level of significance was set at 5% (two-tailed). Group
differences with a p-value of less than .10 are reported as suggestive trends.
Demographics
Differences between groups in quantitative and categorical demographic variables were eval-
uated with analyses of variance or Chi²-Tests, respectively. The presence of group interaction
effects between the categorical variables was analyzed using a log-linear model.
Stress induction: effects of the TSST stress paradigm
To determine whether the stress task was effective, we compared the pre- and (maximum of
the) post-stress measure of heart rate, cortisol and subjective arousal and anxiety (BSKE sub-
scores ‘inner restlessness’, ‘anxiety’) in a repeated 3 way measures ANCOVA including two
independent factors, MD and CS, and the respective baseline value as covariate. To localize
the source of potential repeated measures effects, simple contrasts to the first assessment are

39
reported. To assess whether the TSST caused any overall effect on the three coagulation pa-
rameters, paired samples t-test were used for baseline and post-stress measures of all subjects.
Baseline effects on coagulation parameters
To examine the effect of depression and chronic stress on the levels of the coagulation factors
PAI-1, Fibrinogen, DD and VWF at baseline, a two-factorial ANCOVA with the independent
factors MD and CS was used. Age, gender, hormonal contraception, smoking status, antide-
pressant medication, hematocrit, hemoglobin, thrombocytes, leukocytes, CRP and smoking
status were included as covariates. Smoking status was defined as consumption of >=5 ciga-
rettes per day.
Stress effects over different time points
To examine the effect of depression and chronic stress on the levels of the coagulation factors
at the different time points (resting state, 15 minutes post-stress, 45 minutes post-stress) a
repeated measures ANCOVA with two independent factors, MD and CS was used. Age, gen-
der, hormonal contraception, antidepressant medication, smoking status, hematocrit,
hemoglobin, thrombocytes, leukocytes and CRP were included as covariates. The Green-
house-Geiser correction of degrees of freedom was applied to account for violations of the
sphericity assumptions. For identifying the source of a potential repeated measures effect,
simple contrasts to baseline were calculated.
Separate repeated measures ANCOVAs with the factor MD and CS, respectively, were used
to examine separately the effects of depression and chronic stress on coagulation markers
directly post-stress (N=22).
Due to the small sample size for the measurement of coagulation markers directly following
the stressor, the 2x2 design would have created groups with too few members. Therefore MD
and CS were evaluated separately and not their interaction in the N=22 subsample.

40
Associations of current depressive symptoms and chronic stress scores with coagulation
factor levels
Partial correlation analyses were carried out to search for associations of the scores on the
Beck depression inventory (BDI-II) and on the screening scale and subscales of the chronic
stress questionnaire (TICS) with coagulation factor levels, correcting for the respective other
group variable (CS for BDI-II associations, and MD for TICS associations).
Sensitivity Analysis
A sensitivity analysis was conducted using G*Power v. 3.1 (Faul et al., 2009) with alpha and
beta errors set to .05 and .20, respectively. Given the sample size of N=63 and the 2 x 2
factorial design with repeated measures (resting state, 15 min post stress, 45 min post stress,
assuming a moderate correlation of r = .5 between repeated measures), we calculated a detect-
able effect size of f = .19. Thus, the detectable effect size of our analysis ranges between the
boarders of a small (f = .10) and medium effect (f = .25) according to the effect size conven-
tions reported by Cohen (1988).

41
5. Results
Source data for all Figures presented in this section can be found in Appendix I.
5.1. Demographics
The demographic characteristics of the study participants are listed in Table 3. Remitted de-
pressed and control subjects did not differ with respect to age, gender, BMI, years of educa-
tion (primary and secondary education), relationship status, antidepressant treatment, age at
onset of first depression episode, hormonal contraception (% of females) and BMI score on
the test day.
Subjects with high CS compared to low CS, as determined using the 12-item screening scale
of the TICS questionnaire (Trier inventory of chronic stress) did not differ significantly with
respect to age, gender, BMI and years of education. On average, subjects had between 1 and
38 points on the TICS questionnaire with a mean of 12 (+8.6) points, with 48 being the max-
imum number of points.
Persons with MD and CS together did not differ from the control group with respect to the
abovementioned characteristics.
Regarding relationship status, it is noteworthy that single persons were more often chronically
stressed than married persons (p=.006).
On the BDI-II, subjects had between 0 and 14 points with an average of 2.0 (+3.0) points. No
difference was found between subjects in the depression group and controls.
However, chronically stressed subjects had significant higher BDI-II scores than controls,
with mean scores at 3.2 (+3.7) versus .6 (+.8); p=.001.
Chronically stressed individuals scored higher on the Beck Depression Inventory (BDI-II) on
the test day (p=.001) than did individuals with low chronic stress. Subjects in the MD+ group
had higher chronic stress scores than MD- subjects (p=.007).
Since smoking is known to increase the risk for deep vein thrombosis, it was taken as a co-
variate in all analyses. Smoking status was defined as >=5 cigarettes per day. Out of the 63
subjects, 12 fell into this category, with a consumption of a minimum of 5 to a maximum of
20 cigarettes per day. In none of the analyses of covariance smoking status affected the re-
sults.

42
Table 3. Demographic characteristics of the study participants. CS+: chronic stress, MD+: major depres-sion. CS-, MD- negative for chronic stress and major depression. ANOVA and Chi²-Tests were calculated for group comparison in quantitative and qualitative variables, respectively. SSRI-antidepressant treat-ment: selective-serotonine-reuptake-inhibitor, (N=4): escitalopram, citalopram, paroxetine.
MD+
N=39
MD-
N=24
P values (ANOVA /
Chi²)
Variable (n) % CS+ (20)
51.3
CS- (19)
48.7
CS+(14)
58.3
CS- (10)
41.7
MD CS MD x
CS
Age in years
(SD)
34.5 (3.5) 35.0 (3.5) 36.1 (4.0) 36.1 (3.1) .159 .779 .802
Female (%) 14 (60.9) 9 (39.1) 9 (64.3) 5 (35.7) .948 .120 .802
Years of Edu-cation (SD)
12.1 (1.9) 11.9 (1.5) 12.2 (1.8) 12.8 (1.5) .272 .719 .408
BMI (SD) 24.5 (3.2) 23.5 (2.4) 24.0 (2.8) 24.7 (5.0) .664 .876 .330
Relationship status n (%) Single
Married
Divorced
12 (60)
4 (26.7)
4 (100)
8 (40)
11 (73.3)
-
8 (72.7)
5 (41.7)
1 (100)
3 (27.3)
7 (58.3)
-
.511
.006
.415
Depression history
Antidepressant treatment (SSRI) n (%) Age at onset, years (SD)
1 (5.0)
19.1 (4.1)
1 (5.3)
19.3 (4.9)
2 (14.3)
0 (0)
.594
.383
.975
Hormonal contraception
n (% female)
3 (21.4) 4 (44.4) 4 (44.4) 2 (40.0) .443 .443 .436
Amount Smokers (%)
3 (15) 4 (21) 4 (29) 1 (10) .936 .736 .552
BDI-II score on test day (SD)
3.3 (5.5) .7 (.8) 3.1 (4.1) .5 (.7) .794 .001 .974
TICS screen (SD)
20.2 (8.7) 6.9 (2.4) 14.5 (6.1) 3.9 (2.0) .007 <.001 .394

43
5.2. Resting coagulation parameters
5.2.1. Fibrinogen
The remitted depression group and control group differed significantly in baseline levels of
fibrinogen as shown in Figure 4 (left). Members of the remitted depression group had higher
fibrinogen levels at baseline: 111.19 mg/dl in the control group versus 126.74 mg/dl, in the
remitted depression group, which equals a difference of 12% (F1,50=7.738, p=.008). There was
no effect of CS (F1,50=.139, p=.711) or of the interaction of CS and MD (F1,50=.184, p=.670)
on baseline levels of fibrinogen.
Figure 4. Mean baseline concentrations of fibrinogen. A) Comparison between subjects with remitted depression and without a history of depression. B) Comparison between subjects with and without chronic stress. **: p<.01, n.s.: non-significant.
5.2.2. D-Dimer
The remitted depression and control group showed no significant differences in baseline lev-
els of D-Dimer (F1,48=.209, p=.649). Subjects with chronic stress showed baseline D-Dimer
concentrations that were on average 45% higher than in those without chronic stress.
Although this difference was not significant (F1,48=2.96, p=.092), this can be seen as a sugges-
tive trend toward higher resting D-Dimer levels in chronically stressed subjects (see Figure 5).
No interaction effect of MD and CS was observed (F1,48=2.570, p=.115).
0
20
40
60
80
100
120
140
Fibrinogen (mg/dl)
MD-
MD+0
20
40
60
80
100
120
140
Fibrinogen (mg/dl)
CS-
CS+
* * n.s.

44
Figure 5. Mean baseline concentrations of D-Dimer. Left: comparison between subjects with remitted depression and without a history of depression. Right: comparison between subjects with and without chronic stress. Depicted are means and standard error bars. (*): p<.10, n.s.: non-significant.
5.2.3. VWF
No significant differences in resting levels of VWF were found between the MD and control
group (F1,49=.203, p=.654), as well as between subjects with chronic stress and without chron-
ic stress (F1,49=.450, p=.505). See Figure 6. An interaction effect of MD and CS cannot be
reported (F1,49=.626, p=.432).
Figure 6. Mean baseline concentrations of VWF. Left: comparison between subjects with remitted depres-sion and without a history of depression. Right: comparison between subjects with and without chronic stress. Depicted are means and standard error bars. n.s.: non-significant.
0
10
20
30
40
50
60
70
80
90
D-Dimer (ng/ml)
MD-
MD+0
10
20
30
40
50
60
70
80
90
D-Dimer (ng/ml)
CS-
CS+
n.s.
(* )
0
2
4
6
8
10
12
14
VWF (mg/L)
CS-
CS+0
2
4
6
8
10
12
14
VWF (mg/L)
MD-
MD+
n.s. n.s.

45
5.2.4. PAI-1
PAI-1 resting levels were neither significantly different between remitted depressed subjects
and controls (F1,50 =.246, p=.622) nor between chronically stressed subjects and controls
(F1,50=.837, p=.365), as Figure 7 shows. There were no interaction effects of MD and CS in
the abovementioned analyses of hemostasis factors (F1,50=.308, p=.581).
Figure 7. Mean baseline concentrations of PAI-1. A) Comparison between subjects with remitted depres-sion and without a history of depression. B) Comparison between subjects with and without chronic stress. Depicted are means and standard errors. n.s.: non-significant.
5.3. Stress induction: effects of the TSST paradigm
The TSST psychosocial stress protocol elicited an effective stress reaction in all four study
groups, as seen in heart rate, as a measure of SAM-axis activity, and in cortisol increases, as a
sign of HPA-axis induction.
5.3.1. Heart rate response
Heart rate increased from an average at baseline of 80.26 beats per minute to an average of
98.13 beats per minute at the beginning of the TSST and 100.06/min at the end of the TSST.
The general linear model revealed a non-significant change over all heart-rate measures with
correction for baseline differences (F4,200 =1.679, p=.159). However, a significant stress effect
could be seen for the pre-to post-TSST heart rate (F1,52=7.218, p=.01) and for the heart rate
pre-TSST to +30 min (F1,52=4.123, p =.047). No significant effect of depression history
(F1,52=3.179, p=.080), chronic stress (F1,52=.581, p=.449) or their interaction (F<.001, p=.988)
was found. Heart rate curves for all four groups are depicted in Figure 8.
0
0,5
1
1,5
2
2,5
PAI1(ng/ml)
MD-
MD+0
0,5
1
1,5
2
2,5
PAI1(ng/ml)
CS-
CS+
n.s. n.s.

46
Figure 8. Mean heart rate measures of the four groups MD+CS, MD, CS and MD-CS- before and after the TSST. The figure shows means and standard errors corrected for baseline differences.
5.3.2. Cortisol response
On average, the TSST had a significant effect on cortisol levels (F2.2, 123.1=15.5, p<.001), as
shown in Figure 9. This effect was not due to group membership, that is, membership to one
of the following: MD+CS+, MD+CS-, MD-CS+ and MD-CS-.
An increase of cortisol levels from 127.1 ng/ml at rest to 150.8 ng/ml right after the stress test
was measured, equalling an increase of 15.7%.
0
20
40
60
80
100
120
rest instruction pre-TSST post-TSST +15min +30min +45min
bpm
MD+CS+ N=18
MD+CS- N=18
MD-CS+ N=12
MD-CS- N=9
TSST
Heart rate response

47
Figure 9. Cortisol response curves separate for each of the four groups. MD+: major depression. CS+: chronic stress. The figure shows means and standard errors corrected for baseline differences.
5.3.3. Perceived stress
The TSST evoked a noticeable change in the subjects’ feelings of perceived stress. The sub-
score ‘inner restlessness’ as measured by the BSKE questionnaire increased significantly
from baseline to the stressor (F3.6, 198.8=55.208, p<.001); see Figure 10. Group effects (MD,
CS, CS x MD) were not observed.
Subjects also perceived their anxiety levels, as measured using the BSKE ‘anxiety’ subscore,
to rise with the stressor task (F2.4, 133.6=25.666, p<.001) as shown in Figure 10. Again, group
effects were not detected.
80
100
120
140
160
180
200
baseline pre-TSST post-TSST +15min +30min +45min
ng/m
lMD+CS+ N=19
MD+CS- N=17
MD-CS+ N=14
MD-CS- N=10
TSST
Cortisol response

48
Figure 10. Changes in perceived anxiety during the stress protocol, as measured using the BSKE ques-tionnaire. A: inner restlessness subscore. B: anxiety subscore. The figure depicts estimated means and standard errors corrected for baseline differences.
5.4. Stress-induced coagulation changes
Figure 11 gives an overview of the descriptive changes observed over the time points for the
three markers (fibrinogen, D-Dimer and VWF), independent of group, with N=63. None of
the changes between pre-and post-stress reached si gnificance, however, for D-Dimer and
VWF trends were observed (p=.054 and p=.057, respectively).
Figure 11. Changes in the three coagulation parameters in response to the TSST (N=63), independent of group. The figure de-picts means and stand-ard errors for all sub-jects.
A: Fibrinogen changes over time B: D-Dimer changes over time C: VWF changes over time
0
1
2
3
4
5
0
1
2
3
4
5
MD+CS+ N=20
MD+CS- N=18
MD-CS+ N=13
MD-CS- N=10
Inner restlessness Anxiety
TSST TSST
0
10
20
30
40
50
60
70
80
90
100
baseline +15min +45min
ng/m
l
D-Dimer response
TSST
104
106
108
110
112
114
116
118
120
122
124
126
baseline +15min +45min
mg/
dl
Fibrinogen response
0
2
4
6
8
10
12
14
16
baseline +15min +45min
mg/
L
VWF response
TSST
TSST
A
B C

49
5.4.1. Fibrinogen
On a purely descriptive level, overall fibrinogen levels decreased from 120.8 mg/dl (+26.2) at
baseline to 116.2 mg/dl (+31.8) post-stress, and at +45 minutes decreased to 115.8 mg/dl
(+30.1); see Fig. 11A.
Multivariate analyses revealed that the psychosocial stress induced by the TSST caused a sig-
nificant change in fibrinogen levels (F1.9,94.2=4.076 p=.021) over time, more precisely from
baseline to 15 min post-TSST to 45 min post-TSST. Depression history accounts for this
overall significant effect of TSST on fibrinogen levels (F1,49=7.850, p=.007).
Chronic stress does not significantly account for the effect of TSST on fibrinogen levels
(F1,49=.052, p=.820). The interaction of chronic stress and depression did not have an effect
on fibrinogen either (F1,49 =.000, p=.993).
When considering baseline fibrinogen levels and the fibrinogen levels measured immediately
after the TSST, the effect of TSST on the fibrinogen reaction was non-significant
(F1,10<=.453, p>=.516) although the previously observed depression effect remains
(F1,10=6.042, p=.034); see Figure 13. The effect of chronic stress, however, was not
significant (F1,10 =.506, p=.493). As mentioned earlier, interaction effects were not calculated
due to small group sizes in the comparison of baseline to directly post-TSST.
Figure 12. Baseline to post-stress measures of fibrinogen in the four groups. Presented are means with standard errors. +positive, -negative for MD: major depression, CS: chronic stress.
80
90
100
110
120
130
140
baseline +15min +45min
mg/dl
MD+CS+ N=20
MD+CS- N=18
MD-CS+ N=14
MD-CS- N=10TSST
Fibrinogen

50
Figure 13. Baseline to post-stress measures of fibrinogen, including another post-stress time point (imme-diately post-TSST). Left: by MD: depression history. Right: by CS: chronic stress. Depicted are means and standard errors.
80
90
100
110
120
130
140
baseline post-TSST +30min +45min
mg/dl MD+ N=7
MD- N=15
80
90
100
110
120
130
140
baseline post-TSST +30min +45min
mg/dl CS+ N=15
CS- N=7
TSST TSST
Fibrinogen

51
5.4.2. D-Dimer
A trend toward a change in D-Dimer levels was observed during the TSST. Average D-Dimer
levels of all subjects increased from 56.6 ng/ml (+85.6) at baseline to 79ng/ml (+93.7) ng/ml
at 15 min (p=.054). 45 minutes following the TSST they had decreased again to 53ng/ml
(+82.7). The difference between baseline and 45 minutes post-TSST was not significant
(p=.633), see Fig. 11B.
In terms of repeated measures, the psychosocial stress test did not affect D-Dimer levels since
the overall effect of the stressor was not significant (F1.6,76.6=.099, p=.868). Depression did not
have an effect on D-Dimer levels (F1,47=.008 p=.930). Chronic stress however, had a signifi-
cant effect (F1,47 =4.107 p=.048), and a trend can be observed regarding the interaction of
chronic stress and a history of depression (F1,47=3.880 p=.055) on D-Dimer levels. As Figure
14 shows, D-Dimer levels rose in all subjects after the TSST, but the increase was most pro-
nounced when chronic stress was present, i.e. in the MD-CS+ group (increase by 38%) and
the MD+CS+ group (increase by 25%). For repeated measures in the baseline to directly post-
stress with the smaller sample of N=22, the TSST again did not seem to affect stress-
coagulability (F1,10 <=1.617, p>=.232). There was also no effect of depression history
(F1,10=2.560, p =.141) on D-Dimer levels. The CS effect seen for the larger sample could not
be reproduced in the smaller sample over the two tested time points (F1,10 =2.627, p=.136).
Figure 14. Baseline to post-stress measures of D-Dimer in the four groups. Depicted are means with standard errors. MD: major depression, CS: chronic stress.
0
20
40
60
80
100
120
140
160
180
200
baseline +15min +45min
ng/ml
MD+CS+ N=19
MD+CS- N=18
MD-CS+ N=14
MD-CS- N=9
TSST
D-Dimer

52
Figure 15. Baseline to post-stress measures of D-Dimer. including another post-stress time point (immedi-ately post-TSST). Left: by MD: depression history. Right: by CS: chronic stress. Depicted are means and standard errors.
5.4.3. VWF
In all subjects, plasma levels of VWF increased on average from 11.80 mg/L (± 5.32) at rest
to 13.16 mg/L (± 4.81) 15 minutes post-stress. While this difference did not reach signifi-
cance (p=.057), it suggests a trend. After 45 minutes, average levels increased again to 13.25
mg/L (± 4.23). The difference between baseline and the recovery measurement 45 minutes
after the stressor reached significance (11.80 mg/L to 13.25 mg/L p=.026); see Fig. 11C.
Repeated measures revealed, however, that the psychosocial stressor did not affect VWF
levels significantly (F1.5,70.9=1.643, p=.205) and that neither the presence of depression history
(F1,48=.724, p=.399) nor chronic stress (F1,48=.302, p=.585) were significant.
Interaction effects were also not significant (F1,48=.048, p=.828).
The same was observed for the baseline to immediate post-TSST measures (N=22). Neither
the effect of TSST (F1,9<=1.722 p>=.222), nor the effect of depression (F1,9=.603, p=.457) nor
the effect of chronic stress (F1,9=.281, p =.609) were significant.
0
50
100
150
200
250
baseline post-TSST +15min +45min
ng/ml
MD+ N=7
MD- N=15
0
50
100
150
200
250
baseline post-TSST +15min +45min
ng/ml
CS+ N=15
CS- N=7
TSST TSST
D-Dimer

53
Figure 16. Baseline to post-stress measures of VWF. Presented are means plus standard errors, separate for the four groups. +positive, -negative for MD: major depression, CS: chronic stress.
Figure 17. Baseline to post-stress measures of VWF, including another time point (immediately post-TSST). Left: by MD: depression history. Right: by CS: chronic stress. Depicted are means and standard errors.
5.5. Associations between depression symptoms and chronic stress load, and hemostatic markers
Partial correlation analyses were carried out to additionally examine the effects of depression
symptoms and different aspects of chronic stress on hemostatic parameters. The same covari-
ates as in the ANCOVA analyses were used plus CS or MD to further control for the respec-
tive other group effects (CS for depression symptoms, MD for chronic stress load).
0
2
4
6
8
10
12
14
16
18
20
baseline +15min +45min
mg/L
MD+CS+ N=20
MD+CS- N=17
MD-CS+ N=14
MD-CS- N=10TSST
VWF
0
2
4
6
8
10
12
14
baseline post-TSST +15min +45min
mg/L
MD+ N=6
MD- N=15
0
2
4
6
8
10
12
14
baseline post-TSST +15min +45min
mg/L
CS+ N=15
CS- N=6
VWF
TSST TSST

54
Coagulation parameters and depression symptoms
Partial correlation analyses between fibrinogen, D-Dimer, VWF, PAI-1 levels and the scores
on Beck’s Depression Inventory II at the test day did not reveal any significant associations.
The results of this correlation analysis are listed in the appendix.
Coagulation parameters and chronic stress
Associations between the TICS screening score and the nine subscores are listed in Table 5.
Fibrinogen levels directly post-stress correlated negatively with overall stress (r=-.682,
p=.030) and positively with the TICS subscore chronic worrying (r=.811, p=.004).
Fibrinogen levels at 15 minutes post-stress showed a weak negative correlation with the sub-
score ‘Excessive demand at the workplace’ (r= -.297, p= .038) and ‘Social tensions’ (r=-.279,
p=.050).
D-Dimers measured directly post-stress correlated positively with TICS’ section ‘pressure to
succeed’ (r=.637, p=.047).
As for PAI-1 levels and overall chronic stress, a negative association was discovered, albeit
only a weak one (r=-.246) and as a trend, i.e. non-significant (p=.082). The subscore ‘social
tensions’ showed a weak negative correlation with PAI-1 (r=-.313, p=.025).

55
Table 5. Pearson’s correlation coefficients for correlations between hemostatic measurements and TICS scores. The TICS consists of nine subscores and one screening score for overall measurement of chronic stress load. ‘post-stress’ stands for measurements that were taken immediately following the TSST and ‘+15 min’ for those taken 15 minutes after the TSST.
TICS
screening
score
TICS
Work
overload
TICS
social
overload
TICS
pressure
to per-
form
TICS
work
discon-
tent
TICS
Excessive
demand
at work-
place
TICS
Lack of
social
recogni-
tion
TICS
social
tensions
TICS
social
isolation
TICS
chronic
worrying
Fibrinogen
baseline
-.152
(p=.286)
-.048
(p=.739)
-.058
(p=.688)
-.117
(p=.418)
-.164
(p=.249)
-.136
(p=.249)
-.264
(p=.061)
-.168
(p=.239)
-.188
(p=.186)
-.167
(p=.241)
Fibrinogen
(N=22)
post-stress
-.682
(p=.030)
-.618
(p =.057)
.034
(p =.927)
.270
(p =.450)
-.601
(p=.066)
-.409
(p=.275)
-.256
(p=.475)
-.261
(p =.467)
-.278
(p=.436)
-.811
(p=.004)
Fibrinogen
(N=63)
+15 min
-.257
(p= .072)
-.121
(p=.399)
.033
(p=.821)
-.093
(p=.525)
-.270
(p=.058)
-.297
(p=.038)
-.268
(p=.060)
-.279
(p=.050)
-.149
(p=.301)
-.231
(p=.106)
D-Dimer
baseline
.073
(p=.616)
.065
(p=.659)
.190
(p=.191)
.176
(p=.230)
-.017
(p=.906)
.059
(p=.693)
.204
(p=.159)
.175
(p=.229)
-.009
(p=.950)
.056
(p=.702)
D-Dimer
(N=22)
post-stress
.443
(p=.199)
.337
(p =.341)
.399
(p= .253)
.637
(p=.047)
.193
(p=.593)
.612
(p=.080)
.352
(p =.318)
.341
(p=.335)
.058
(p=.873)
.433
p=.211)
D-Dimer
(N=63)
+15 min
.103
(p =.488)
.168
(p=.253)
-.004
(p=.980)
.192
(p=.195)
-.001
p=.993)
.119
(p=.425)
.192
(p=.192)
.140
(p=.344)
.093
(p=.528)
.074
(p=.619)
VWF
baseline
-.011
(p=.939)
.076
(p=.599)
.074
(p=.610)
.219
(p=.130)
-.118
p=.416)
-.011
(p=.941)
.110
(p=.449)
-.038
(p=.795)
.104
(p=.470)
-.051
(p=.726)
VWF
(N=22)
post-stress
-.128
(p=.742)
-.276
(p=.472)
.097
(p=.804)
-.122
(p =.754)
-.101
(p=.796)
.322
(p =. 437)
.224
(p =.563)
-.339
(p =.372)
-.063
(p=.872)
-.131
(p=.736)
VWF
(N=63)
+15 min
-.197
(p=.176)
r=-.269
(p=.061)
-.020
(p=.892)
.037
(p =.800)
-.041
(p=.777)
-.137
(p =.354)
.037
(p=.803)
-.120
(p =.413)
-.076
(p=.602)
-.178
(p=.220)
PAI-1
(N=63)
-.246
(p=.082)
-.214
(p =.132)
-.113
(p= .428)
-.087
(p=.550)
-.117
(p=.313)
-.214
(p =.135)
-.153
(p =.283).
-.157
(p =.270)
-.313
(p=.025)
-.254
(p=.072)

56
6. Discussion
This works’ focus lies on whether or not a history of major depression or current chronic
stress affect the hemostatic system at rest and after an acute stressor. Furthermore, the ques-
tion whether depression history and chronic stress influence coagulation independent of each
other or have interacting effects was examined.
In summary, the key findings were that subjects with a history of depression had higher rest-
ing fibrinogen levels and, additionally, that acute stress-induced changes in fibrinogen were
affected by a history of depression. Furthermore, it was shown that chronic stress load signifi-
cantly affected D-Dimer changes brought about by the TSST. The combination of CS with
MD showed a trend toward significance in influencing stress-induced D-Dimer changes.
The following sections will elaborate on the hypotheses that are listed in part 3 of this work,
together with the related findings, closing with a discussion of the limitations of this study, as
well as an outlook to further required research.
6.1. Coagulation markers at rest
6.1.1. The effects of remitted depression on basal coagulation
The remitted depression group presented with higher baseline fibrinogen levels than the con-
trol group, which confirms our hypothesis H1.1. for fibrinogen. This hypothesis stated that
baseline fibrinogen and PAI-1 levels are higher in persons with a history of depression, com-
pared to controls. For PAI-1 levels, however, there were no differences between the groups.
The present data supports hypothesis H1.1. for fibrinogen, but not for PAI-1.
Previous research on fibrinogen also found a positive association between resting fibrinogen
levels and depression (Hjemdahl & Von Känel, 2012; Wium-Andersen, Orsted et al., 2013)
and interestingly, according to the results of the present study, this association seems to per-
sist after remission of depression. The subjects in the remitted depression group experienced
their last episode on average 10.5 years prior to this assessment, but still, fibrinogen remained
elevated even when depressive symptoms were absent or at subclinical levels. These findings
add to the hypothesis that fibrinogen might serve as a marker for depression, as other

57
researchers suggest (Martins-de-Souza et al., 2014; Okwuosa et al., 2013; Wium-Andersen,
Orsted et al., 2013). Increased fibrinogen levels in remitted depression may confer an in-
creased risk for cardiovascular disease, without the presence of the traditional cardiovascular
risk factors. Notably, it has been reported that there exists a strong independent correlation
between changes in traditional cardiovascular risk factors and changes in mean fibrinogen.
(Okwuosa et al., 2013). It remains open whether these relationships hold true also for persons
with depression or depression history.
Regarding PAI-1, there were no differences between remitted depressed subjects and controls.
PAI-1 has a diurnal variation, with highest levels in the morning (Angleton, Chandler, &
Schmer, 1989) and since the TSST was carried out in the afternoon, this might be one reason
for our negative result. Another reason for our negative result may be that PAI-1 appears to be
only associated with remitted depression in aged patients, as one recent study indicates. The
subjects in that study were between the ages of 70 and 90 years (Baune et al., 2012). Howev-
er, in our work, subjects were on average in their mid-thirties. The exact role of PAI-1 in re-
mitted depression needs to be further investigated.
6.1.2. The effects of chronic stress on basal coagulation
At rest, persons with high chronic stress showed a trend toward higher D-Dimer plasma con-
centrations.
Hypothesis H1.2., which states that persons under high chronic stress show elevated co-
agulation parameters at rest, cannot be supported for any of the considered markers,
namely fibrinogen, D-Dimer, VWF and PAI-1, albeit a trend is seen for D-Dimer.
Increased D-Dimer concentrations suggest that chronically stressed persons may have in-
creased fibrin turnover. Elevated D-Dimer levels have been reported in a variety of diseases,
such as venous thrombosis (Cushman et al., 2003), ischemic heart disease (Lowe et al., 2004)
and even in cancer patients (Ay et al., 2012). Recently, a large study found that even in a
healthy population free of cardiovascular risk factors, elevated D-Dimer levels were inde-
pendently associated with increased mortality (multivariable hazard ratios ranged between
1.06 and 1.97). These findings linking increased D-Dimer plasma concentrations to increased
mortality together with the results from our study suggest that further research on the connec-
tions between chronic stress and D-Dimer is needed.

58
Our results could not reproduce the findings regarding fibrinogen, the endothelial-dysfunction
marker VWF and the anti-fibrinolytic marker PAI-1 that other studies have reported. This
may have various reasons: the other studies did not assess chronic stress in the same way as
was done in this study, i.e. using the TICS questionnaire. They studied the stress of caregiving
for demented patients, job stress and traumatic life events, separately, and did not assess over-
all chronic stress, as the TICS does.
6.1.3. Interaction effects between remitted depression and chronic stress on basal coagulation
In hypothesis 1.3., it was stated that in previously depressed subjects, procoagulant parame-
ters at baseline are altered, depending on the presence of chronic stress.
In this study no interaction effects between chronic stress and a history of major depres-
sion on baseline procoagulant markers could be found, and thus, hypothesis 1.3. cannot
be supported.
It appears that in its effect on basal coagulation, a positive depression history is independent
from chronic stress. Because depression is often accompanied and worsened by chronic stress,
and in turn, chronic stressful life situations can increase the risk of developing depression, it
was plausible to speculate that interacting effects of CS and MD existed. However, in remit-
ted depression, as examined in this work, this interaction does not seem to exist regarding
baseline levels.
6.2. Stress-induced changes
The stress test elicited a reliable stress reaction as indicated by rising cortisol levels and the
subjects’ feelings of perceived stress. On average, heart rate changed significantly from pre-
to post-stress as an indicator of an activation of the SAM-system. When looking at the repeat-
ed measures analysis of covariance, heart rate changes over all time points were not signifi-
cant. This result is not surprising, since TSST is known to more reliably trigger HPA-axis
responses than responses of the sympathetic nervous system (Dickerson & Kemeny, 2004).
Cortisol increases as part of a positive HPA-axis response were indeed significant. There are
many elements in the TSST which seem uncontrollable to the subjects and cortisol is known
to respond more with uncontrollable situations than with controllable ones (Hamer & Malan,
59
2010). Although not significant, the observation that the chronic stress group without a histo-
ry of depression (MD-CS+) had the highest overall cortisol levels is noteworthy. Whereas
chronic stress without a depression history shows a higher cortisol curve, the curve for the
combination of chronic stress plus depression history runs lower. Beside its effects on auto-
nomic functions, the TSST also influenced subjects’ anxiety levels considerably. As expected,
subjects reported that they felt more anxious during the stress test than before and that their
anxiety decreased again during the recovery period.
The TSST also elicited changes in the hemostatic system: in all subjects unrelated to group, a
trend toward an increase in D-Dimer levels was observed during the TSST, with average
levels increasing by almost one third from pre- to post-TSST. A possible reason for why this
increase was not significant may be that the post-stress measurement took place 15 minutes
after, and not directly post-stress. It is possible that D-Dimer levels had already decreased
again after this time.
6.2.1. The effects of remitted depression on stress-induced coagulation
To date, no other studies have examined remitted depression in relation to stress-induced
changes of coagulation parameters. In the present study, fibrinogen levels decreased slightly
in all but one of the four groups as a reaction to the TSST. In the MD-CS+ group, levels in-
creased slightly. Depression history accounted for this change.
In a smaller sample of subjects for which the three parameters of interest were measured di-
rectly after the TSST (N=22), this depression effect remained. However, a stress-induced in-
crease of fibrinogen, as reported by other studies, could not be seen here. Instead, a slight de-
crease was observed. A possibility for fibrinogen levels not increasing with the stressor could
be an increased consumption of fibrinogen due to in-situ fibrin formation on the surface of
blood vessels (Von Känel, Kudielka et al., 2009). However, despite the fact that fibrinogen
did not increase, depression history had a significant effect on stress-induced fibrinogen levels
over time: in subjects with a depression history, fibrinogen levels decreased after the stress
test.
No effects of remitted depression on any of the other procoagulant markers could be ob-
served.

60
Hence, hypothesis 2.1., which states that a history of depression has an effect on stress-
induced D-Dimer changes, is not supported.
Previous findings focussing on D-Dimer stress-responsiveness and depression provided a
mixed picture as both an attenuated response immediately post-stress (Von Känel,
Bellingrath, et al., 2009b) and increases (Wirtz et al., 2008) have been reported. These studies
included subjects with depression symptoms at the time of the experiment (TSST). We were
not able to reproduce any of the previous results. In this work depression history did not have
an effect on D-Dimer changes, possibly because this study examined persons without current
depression symptoms. Nevertheless, the effect of depression history on fibrinogen levels was
a significant one, as is described above.
6.2.2. The effects of chronic stress on stress-induced coagulation
Individuals with high chronic stress had significantly higher D-Dimer changes following the
stress test than those without chronic stress.
Hypothesis H2.2., which states that high chronic stress modulates procoagulant respons-
es to acute psychosocial stress, is therefore supported. D-Dimer was the only parameter
that was affected by chronic stress, while fibrinogen and VWF were unaffected.
Notably, the effect of chronic stress on D-Dimer was only true for our larger sample for
which three measurements were taken. In the smaller sub-sample, for which four measure-
ments were taken, the effect of chronic stress on D-Dimer changes was no longer significant.
This might be explained by the relatively small size of the sub-sample.
A D-Dimer increase indicates augmented production of thrombin and fibrin like during the
formation of a thrombus. Also, as a thrombus is broken down, fibrin dissolves into D-Dimers
and D-Dimer concentration increases. D-Dimer can be viewed as a marker for both fibrin
formation and degradation. D-Dimer levels rose in all subjects after the TSST, independent of
group, indicating that a hypercoagulable state had been reached briefly. The increase was
most pronounced when chronic stress was present, i.e. in the MD-CS+ group and the
MD+CS+ group.
Fibrin D-Dimer is considered an independent marker of the risk of cardiovascular disease and
is also related to atherosclerosis severity (Zhou et al., 2007). In light of this known

61
relationship, the present results suggest that persons suffering from chronic stress may be
more prone to develop atherosclerosis or that pre-existing atherosclerotic lesions may develop
faster.
6.2.3. Interaction effects between remitted depression and chronic stress on stress-induced coagulation
With respect to our hypothesis regarding the interaction effects between remitted MD and CS
on stress-induced coagulation, we found that there was a trend only for D-Dimer levels to be
affected by the CS/MD interaction. None of the other markers that were examined were af-
fected by the CS/MD interaction. Those subjects with both chronic stress and a history of de-
pression tended to have greater D-Dimer changes over the different time points, but the inter-
action did not reach significance.
Hypothesis H2.3., which states that interacting effects of CS and MD history on stress-
induced coagulation exist, is not supported for fibrinogen, D-Dimer and VWF.
Nonetheless, a trend for D-Dimer changes to be affected by a CS x MD interaction was found.
This result suggests that chronic stress may be a mediator of the association between depres-
sion and D-Dimer change. In turn, depression history could be a mediator of the association
between chronic stress and D-Dimer change following an acute stressor.
6.3. Associations between chronic stress and hemostasis
We carried out observational partial correlation analyses to examine if chronic stress load and
current depressive symptoms were associated with any of the hemostatic factors at rest and
post-stress. The score on the BDI-II, which was used to detect depression symptoms, was not
associated with any of the coagulation parameters, possibly because all subjects were in re-
mission and had sub-clinical scores. Some elements of the TICS questionnaire showed signif-
icant correlations with the measured coagulation factors.
Perhaps the most interesting association that was observed here is that fibrinogen and the
screening score for chronic stress show an inverse relationship: the chronic stress screening
score correlated negatively with fibrinogen measured immediately post-stress, as well as 15
minutes post-stress. A high chronic stress burden could be associated with lower fibrinogen
levels. However, an interpretation of these results is difficult, because for the significant as-
sociation the sample size was rather small (N=22) to draw conclusions, while for the

62
15 minutes post-stress measurement (N=63), the correlation was weak and did not reach sig-
nificance. However, it is possible that a high chronic stress load somehow suppresses fibrino-
gen levels after an acute stressor, perhaps by increasing its turnover to fibrin.
Previous research on the anti-fibrinolytic marker PAI-1 has found it to be positively associat-
ed with chronic stress but we were not able to reproduce these results.
As mentioned earlier, we intended these correlation analyses to have explorative character.
Larger sample sizes would be required to reveal further effects.
6.4. Strengths and limitations
As already mentioned in the preceding chapters, interpretation of our findings must take into
account certain choices made and limitations present. These are summarized in the following,
addressing sample selection, study protocol, technical protocol execution and potential influ-
ences of stress hemoconcentration.
Having recruited subjects from the EDSP study, which includes a well-characterized epide-
miological sample, one can assume an overall high quality of the subsample used in this
study.
The influence of smoking and oral contraceptives were not defined as exclusion criteria since
it would have created great difficulties in the recruitment of subjects. However, both have
known influences on the hemostatic system. Fibrinogen and PAI-1 activity have been shown
to be higher in previous and current smokers compared to persons who never smoked
(Lahlou-Laforet et al., 2006) and women taking oral contraceptives are more prone to deep
venous thrombosis. Contraception and smoking status were therefore used as covariates in the
analyses. In the present sample there were no statistical differences in the number of smokers
and women taking oral contraceptives between the groups. The inclusion of the four subjects
who were taking antidepressant medication merits critical attention as well since an influence
on the coagulation system is possible. We therefore accounted for its influence by using anti-
depressant medication as a covariate in all analyses.
All persons involved in the experimental part of the study adhered to a strict protocol that
listed all steps. Instructions regarding the TSST were read out loud to minimize inconsisten-
cies and ambiguities due to the investigator’s interaction with the test subjects. This ensured

63
that the TSST was carried out in a highly standardized manner. Other strong points of this
work were the location of the experiment in a soundproof room and a system that allowed for
blood collection through the wall without disturbing the participant.
Regarding the time points for measurement of the four coagulation markers, one limitation
was that in the initial study protocol, the first post-TSST blood sample would be taken 15
minutes after the TSST. Based on expert consultations during the study, we added another
time point to the study protocol immediately post TSST. The amended study protocol with the
additional measurement of coagulation factors was then implemented for the remaining 22
subjects of the sample (of a total of 63). For these 22 subjects, however, group distribution
was uneven, with only 7 subjects in the remitted depression group. Statistical analyses were
carried out for both, the complete and the N=22 sample, as described in chapter 4. For the
N=22 sample, both the small sample size, as well as the uneven distribution among the
MD/CS groups decreases the statistical power of the outcomes and any interpretations regard-
ing these results should be viewed with a degree of caution. Still, the results from the com-
plete and the N=22 samples are directionally equal for the following analyses: the depression
effect on fibrinogen changes, the negative effect of TSST on D-Dimer levels, the negative
effect of depression on D-Dimer levels, and all analyses regarding VWF. The two samples
differed in the following results: the CS effect on D-Dimer and the TSST effect on fibrinogen
were significant for the larger sample, but not for the smaller one.
Technical problems and delays could not be prevented in some cases. Baseline measures were
taken after a 30-minute time period during which the subjects were able to acclimatize to the
new setting. In some cases this time period may have been shortened, e.g. due to difficulties
with placing the venous catheter or because subjects experienced circulatory problems. Thus,
there were minor deviations in the subjects’ starting conditions. Further, some of the post-
stress blood collections may have been slightly delayed. Clogging of the catheter were likely
reasons for this, and in some cases the placement of a new catheter became necessary.
Hemoconcentration is another possible process that may have an influence on stress-induced
coagulation since it may influence the concentration of hemostatic components. As coagula-
tion factors are relatively large molecules they cannot move passively through the vessel wall
to the extravascular space (Austin et al., 2011; Hjemdahl & Von Känel, 2012). As plasma
shifts from the intra- to the extravascular space during acute stress, the concentration of
64
non-diffusible molecules rises (Allen & Patterson, 1995). This process is likely caused by an
increase in blood pressure through SNS activation. It is important to think about this concept
when studying coagulation changes since rising coagulation factor concentrations may be
genuine effects of stress but they may also be due to plasma loss (Hjemdahl & Von Känel,
2012). A review of the relevant literature (Austin & Patterson, 2013) concludes that stress-
induced changes in coagulation are due to both hemoconcentration and actual activation of
coagulation and that the intrinsic pathway (as seen in FXIII) is likely genuinely activated by
acute stress. It is not yet clear to what extent hemoconcentration needs to be accounted for
and adjusted for arithmetically when studying stress-induced coagulation parameters. There
are different methods for hemoconcentration-correction: an arithmetic correction, a baseline
plasma reconstitution method and a reconstitution method using saline (Austin & Patterson,
2013). The most accurate method is currently being debated, and correction techniques have
consequently not been included in this study.
6.5. Conclusion and outlook
Depression and chronic stress often form a vicious cycle, with chronic stress increasing de-
pressive symptoms and depressive symptoms causing further stress. It is therefore relevant to
determine whether chronic stress and depression are independent in their effect on the hemo-
static system or whether they interact to create a hypercoagulable environment.
The present study thus intended to find out if patients who had suffered from major depres-
sion in the past but were in remission at the time of the experiment also showed alterations in
hemostatic function, at rest and following acute stress. Furthermore, the influence of chronic
stress and the combination of remitted depression and chronic stress was examined in the
same way. First, the findings regarding fibrinogen are discussed, and then the findings regard-
ing D-Dimer.
This work found that remitted depressed subjects in their mid-thirties had higher fibrinogen
levels at rest than controls, with no change in D-Dimers. With regard to interaction effects
between remitted depression and chronic stress on resting coagulation markers, our results are
negative, implying that depression history and chronic stress are independent factors to influ-
ence the hemostatic system.

65
When remitted depressed participants were subjected to an acute psychosocial stressor, we
found that their stress-responsiveness was different from healthy controls, i.e. that different
effects on the concentration of coagulation factor fibrinogen and its development over time
were observed. Our findings therefore support the association between major depression and
elevations of fibrinogen levels – while other studies focused on acute depression, this study
found this association to also hold true in remitted depression.
High blood pressure, dyslipidemia, smoking status and diabetes are known cardiovascular risk
factors. Heightened fibrinogen has been identified as one of them and has been shown to also
be elevated in depression. Notably, in depression, the risk for cardiovascular disease is in-
creased, independent of the other cardiovascular risk factors. Fibrinogen therefore appears to
be a common denominator in both classical risk factors and depression. The present results
demonstrate that depression history is associated with altered hemostasis function when the
two potentially confounding biological variables, BMI and smoking, both of which are related
to metabolic syndrome, were taken into account. Positive correlations between fibrinogen
levels and the known cardiovascular risk factors high BMI, high triglycerides and LDL cho-
lesterol, low HDL, diabetes history and hypertension history have been reported (Kaptoge et
al., 2007b). In a meta-analysis on healthy middle-aged adults, Danesh et al. (2001) also report
associations between plasma fibrinogen levels and the risks for coronary heart disease and
stroke. Again, fibrinogen generally increased with BMI, LDL-cholesterol, log triglycerides
and diastolic blood pressure and fell with increasing physical activity and HDL-cholesterol
(Danesh et al., 2001).
Since fibrinogen is a major acute-phase-protein, an increase could also indicate a state of in-
flammation. Whether increased resting fibrinogen levels reflect an increased state of inflam-
mation or whether fibrinogen is elevated through pathophysiological processes caused by
depression is unclear. Work on inflammatory markers revealed elevated levels of the cyto-
kines TNF-alpha and IL-6 in depressed patients (Dowlati et al., 2010) and another study con-
cluded that the inflammation marker C-reactive protein (CRP) and the cytokines IL-1 and IL-
6 were associated with depression (Howren, Lamkin, & Suls, 2009). Furthermore, a strong
positive correlation between CRP levels and fibrinogen has been described (Kaptoge et al.,
2007b).

66
Our finding regarding increased baseline fibrinogen in remitted depression lends further sup-
port to fibrinogen as being a potential depression marker. A recent study by Martins-de-
Souza et al. (2014) investigated whether fibrinogen may serve as a marker for antidepressant
treatment response. Non-responders to antidepressant medication had higher fibrinogen levels
compared to responders. Successful treatment of depression may therefore possibly lower the
cardiovascular risk by lowering fibrinogen. Behavioral changes, such as smoking cessation
and weight loss have been shown to also decrease fibrinogen levels in young, healthy adults
(Okwuosa et al., 2013). As a consequence, it would be advisable that physicians treating de-
pression have knowledge about their patients’ cardiovascular risk factors and that they give
depression, and also remitted depression, the same amount of attention as a traditional cardio-
vascular risk factor. One should also consider monitoring fibrinogen in depressed patients as a
real option in the future.
Our second major finding was that a trend was seen for subjects under chronic stress to have
increased D-Dimer levels at rest, however for fibrinogen there was no such elevation seen.
Once all subjects underwent the acute stress test, their average D-Dimer concentrations in-
creased significantly, with the factor chronic stress having a significant effect on these
changes.
Previous research using the TICS questionnaire, which was also used in this study, reports
that depressive symptoms, burnout syndrome and sleep disturbances are more common in
people who have high levels of chronic stress than in those without high levels of stress.
(Hapke et al., 2013). Whether scores on the TICS are also positively related to increased car-
diovascular events remains open and would be worth examining. Adults experiencing social
isolation and workplace stress situations that can be considered chronic stress factors, have
been shown to have an increased risk for coronary heart disease (Steptoe & Kivimäki, 2012).
These facts make the assumption plausible that high TICS scores are associated with in-
creased cardiovascular disease. A possible reason for chronic stress being linked to coronary
heart disease may be a hypercoagulable state, which is underlined by higher D-Dimer levels,
as was found here. Prospective studies are needed to assess whether persons with high chronic
stress, as measured by the TICS, have increased cardiovascular risk, particularly since they
also showed alterations of D-Dimer levels.

67
The risk of cardiovascular disease and insults in chronically stressed individuals may be con-
siderably reduced through interventional measures such as relaxation techniques and
stress management, however, more studies in this area are needed. Social support seems to be
another key factor to protect against chronic stress and its negative effects on health. Social
support and chronic stress show an inverse relationship (Hapke et al., 2013), which needs to
be considered as a key element in public health measures. The existing studies on pharmaco-
logical interventions to restore normal hemostatic function appear to be somewhat limited in
scope, as a review by Austin et al. (2013) showed. More research on pharmacological, as well
as behavioral measures would be useful to further assess whether these can influence stress-
related hypercoagulability, and thus possibly sever the psychosomatic connections between
stress and cardiovascular risk.

68
Literature
Allen, M. T., & Patterson, S. M. (1995). Hemoconcentration and stress: a review of
physiological mechanisms and relevance for cardiovascular disease risk. Biological
Psychology, 41(1), 1–27.
Angleton, P., Chandler, W. L., & Schmer, G. (1989). Diurnal variation of tissue-type
plasminogen activator and its rapid inhibitor (PAI-1). Circulation, 79(1), 101–106.
Austin, A. W., & Patterson, S. M. (2013). Comparison of Stress-Hemoconcentration
Correction Techniques for Stress-Induced Coagulation, 2013.
Austin, A. W., Patterson, S. M., & von Känel, R. (2011). Hemoconcentration and Hemostasis
During Acute Stress: Interacting and Independent Effects. Annals Behavioral Medicine,
42, 153–173.
Austin, A. W., Wissmann, T., & Von Känel, R. (2013). Stress and hemostasis: An update.
Seminars in Thrombosis and Hemostasis, 39(8), 902–912.
Ay, C., Dunkler, D., Pirker, R., Thaler, J., Quehenberger, P., Wagner, O., … Pabinger, I.
(2012). High D-dimer levels are associated with poor prognosis in cancer patients.
Haematologica, 97(8), 1158–64.
Bacon, S. L., Ring, C., Hee, F. L. S., Lip, G. Y. H., Blann, A. D., Lavoie, K. L., & Carroll, D.
(2006). Hemodynamic, hemostatic, and endothelial reactions to psychological and
physical stress in coronary artery disease patients. Biological Psychology, 71(2), 162–70.
Baune, B. T., Smith, E., Reppermund, S., Air, T., Samaras, K., Lux, O., … Trollor, J. N.
(2012). Inflammatory biomarkers predict depressive, but not anxiety symptoms during
aging: the prospective Sydney Memory and Aging Study. Psychoneuroendocrinology,
37(9), 1521–30.
Beck, A., & Steer, R. A. (1996). Beck Depression Inventory-II. San Antonio: Pearson.
Bellingrath, S., & Kudielka, B. M. (2008). Effort-reward-imbalance and overcommitment are
associated with hypothalamus-pituitary-adrenal (HPA) axis responses to acute
psychosocial stress in healthy working schoolteachers. Psychoneuroendocrinology,
33(10), 1335–43.
Binder, B. R. (2002). Plasminogen activator inhibitor 1: physiological and pathophysiological
roles. News in Physiological Sciences : An International Journal of Physiology Produced
Jointly by the International Union of Physiological Sciences and the American
Physiological Society, 17, 56 – 61.

69
Binder, E. B. (2009). The role of FKBP5, a co-chaperone of the glucocorticoid receptor in the
pathogenesis and therapy of affective and anxiety disorders. Psychoneuroendocrinology,
34 Suppl 1, S186–95.
Borissoff, J., Spronk, H., & Cate, H. (2011). The Hemostatic System as a Modulator of
Atherosclerosis. New England Journal of Medicine, 364, 1746–60.
Brotman, D. J., Girod, J. P., Posch, A., Jani, J. T., Patel, J. V, Gupta, M., … Kickler, T. S.
(2006). Effects of short-term glucocorticoids on hemostatic factors in healthy volunteers.
Thrombosis Research, 118(2), 247–52.
Carney, R. M., & Freedland, K. E. (2008). Depression in patients with coronary heart disease.
The American Journal of Medicine, 121(11 Suppl 2), S20–7.
Chrapko, W. E., Jurasz, P., Radomski, M. W., Lara, N., Archer, S. L., & Le Mellédo, J.-M.
(2004). Decreased platelet nitric oxide synthase activity and plasma nitric oxide
metabolites in major depressive disorder. Biological Psychiatry, 56(2), 129–34.
Chung, I., & Lip, G. Y. H. (2003). Virchow’s triad revisited: blood constituents.
Pathophysiology of Haemostasis and Thrombosis, 33(5-6), 449–54.
Cohen J. Statistical power analysis for the behavioral sciences. Hillsdale: Erlbaum, 1988.
Cuijpers, P., & Smit, F. (2002). Excess mortality in depression: a meta-analysis of community
studies. Journal of Affective Disorders, 72(3), 227–36.
Cushman, M., Folsom, A. R., Wang, L., Aleksic, N., Rosamond, W. D., Tracy, R. P., &
Heckbert, S. R. (2003). Fibrin fragment D-dimer and the risk of future venous
thrombosis. Blood, 101(4), 1243–8.
Danesh, J., Lewington, S., & Thompson, S. G. (2005). Plasma Fibrinogen Level and the Risk
of Major Cardiovascular Diseases and Nonvascular Mortality. JAMA : The Journal of
the American Medical Association, 294, 1799–809.
Danesh, J., Whincup, P., Walker, M., Lennon, L., Thomson, A., Appleby, P., … Lowe, G. D.
(2001). Fibrin D-dimer and coronary heart disease: prospective study and meta-analysis.
Circulation, 103(19), 2323–7.
Davignon, J., & Ganz, P. (2004). Role of endothelial dysfunction in atherosclerosis.
Circulation, 109(23 Suppl 1), III27–32.
Dickerson, S. S., & Kemeny, M. E. (2004). Acute stressors and cortisol responses: a
theoretical integration and synthesis of laboratory research. Psychological Bulletin,
130(3), 355–91.

70
Dowlati, Y., Herrmann, N., Swardfager, W., Liu, H., Sham, L., Reim, E. K., & Lanctôt, K. L.
(2010). A meta-analysis of cytokines in major depression. Biological Psychiatry, 67(5),
446–57.
Ellins, E., Halcox, J., Donald, A., Field, B., Brydon, L., Deanfield, J., & Steptoe, A. (2008).
Arterial stiffness and inflammatory response to psychophysiological stress. Brain,
Behavior, and Immunity, 22(6), 941–8.
Eskandari, F., Mistry, S., Martinez, P. E., Torvik, S., Kotila, C., Sebring, N., … Cizza, G.
(2005). Younger, premenopausal women with major depressive disorder have more
abdominal fat and increased serum levels of prothrombotic factors: implications for
greater cardiovascular risk. Metabolism: Clinical and Experimental, 54(7), 918–24.
Falk, E., & Fernández-Ortiz, A. (1995). Role of thrombosis in atherosclerosis and its
complications. The American Journal of Cardiology, 75(6), 3B–11B.
Faul, F., Erdfelder, E., Buchner, A., Lang, AG. (2009). Statistical power analyses using
G*Power 3.1: tests for correlation and regression analyses. Behavior Research Methods,
41(4), 1149–1160.
Furie, B., & Furie, B. C. (2008). Mechanisms of thrombus formation. The New England
Journal of Medicine, 359(9), 938–49.
Green, D., Chan, C., Kang, J., Liu, K., Schreiner, P., Jenny, N. S., & Tracy, R. P. (2010).
Longitudinal assessment of fibrinogen in relation to subclinical cardiovascular disease:
the CARDIA study. Journal of Thrombosis and Haemostasis : JTH, 8(3), 489–95.
Halperin, D., & Reber, G. (2007). Influence of antidepressants on hemostasis. Dialogues in
Clinical Neuroscience, 9(1), 47–59.
Hamer, M., & Malan, L. (2010). Psychophysiological risk markers of cardiovascular disease.
Neuroscience and Biobehavioral Reviews, 35(1), 76–83.
Hansen, A. M., Larsen, A. D., Rugulies, R., Garde, A. H., & Knudsen, L. E. (2009). A review
of the effect of the psychosocial working environment on physiological changes in blood
and urine. Basic & Clinical Pharmacology & Toxicology, 105(2), 73–83.
Hapke, U., Maske, U. E., Scheidt-Nave, C., Bode, L., Schlack, R., & Busch, M. A. (2013).
[Chronic stress among adults in Germany: results of the German Health Interview and
Examination Survey for Adults (DEGS1)]. Bundesgesundheitsblatt,
Gesundheitsforschung, Gesundheitsschutz, 56(5-6), 749–54.
Hautzinger, M., Keller, F., & Kühner, C. (2006). BDI II Beck Depressions-Inventar Revision.
Frankfurt/Main: Pearson.

71
Hemingway, H., & Marmot, M. (1999). Evidence based cardiology: psychosocial factors in
the aetiology and prognosis of coronary heart disease. Systematic review of prospective
cohort studies. BMJ (Clinical Research Ed.), 318(7196), 1460–7.
Hjemdahl, P., & von Känel, R. (2012). Haemostatic Effects of Stress. In P. Hjemdahl, A.
Rosengren, & A. Steptoe (Eds.), Stress and Cardiovascular Disease (pp. 89–110).
London, England: Springer.
Höhne, N., Poidinger, M., Merz, F., Pfister, H., Brückl, T., Zimmermann, P., … Ising, M.
(2014). Increased HPA axis response to psychosocial stress in remitted depression: the
influence of coping style. Biological Psychology, 103(0), 267–275.
Holsboer, F., & Ising, M. (2010). Stress hormone regulation: biological role and translation
into therapy. Annual Review of Psychology, 61, 81–109, C1–11.
Houtveen, J. H. (2001). Psychological and physiological responses to stress.
Howren, M. B., Lamkin, D. M., & Suls, J. (2009). Associations of depression with C-reactive
protein, IL-1, and IL-6: a meta-analysis. Psychosomatic Medicine, 71(2), 171–86.
Huotari, A., Lehto, S. M., Niskanen, L., Herzig, K.-H., Hintikka, J., Koivumaa-Honkanen, H.,
… Viinamäki, H. (2010). Increased Serum PAI-1 Levels in Subjects with Metabolic
Syndrome and Long-Term Adverse Mental Symptoms: A Population-Based Study.
Cardiovascular Psychiatry and Neurology, 2010, 501349.
Ising, M., Horstmann, S., Kloiber, S., Lucae, S., Binder, E. B., Kern, N., … Holsboer, F.
(2007). Combined dexamethasone/corticotropin releasing hormone test predicts
treatment response in major depression - a potential biomarker? Biological Psychiatry,
62(1), 47–54.
Janke, W., Debus, G., Erdmann, G., & Hüppe, M. (1995). Befindlichkeitsskalierung anhand
von Kategorien und Eigenschaften.
Jiang, Q., Gingles, N. A., Olivier, M. A., Miles, L. A., & Parmer, R. J. (2011). The anti-
fibrinolytic SERPIN, plasminogen activator inhibitor 1 (PAI-1), is targeted to and
released from catecholamine storage vesicles. Blood, 117(26), 7155–63.
Kaminski, K. L., & Watts, A. G. (2013). Intact Catecholamine Inputs to the Forebrain Are
Required for Appropriate Regulation of CRH and Vasopressin Gene Expression by
Corticosterone in the Rat Paraventricular Nucleus, 24(12), 1517–1526.
Känel, R. Von, & Dimsdale, J. E. (2000). Effects of sympathetic activation by adrenergic
infusions on hemostasis in vivo. European Journal of Haematology, 65(6), 357–69.

72
Kaptoge, S., White, I. R., Thompson, S. G., Wood, A. M., Lewington, S., Lowe, G. D. O., &
Danesh, J. (2007a). Associations of plasma fibrinogen levels with established
cardiovascular disease risk factors, inflammatory markers, and other characteristics:
individual participant meta-analysis of 154,211 adults in 31 prospective studies: the
fibrinogen studies collab. American Journal of Epidemiology, 166(8), 867–79.
Kaptoge, S., White, I. R., Thompson, S. G., Wood, A. M., Lewington, S., Lowe, G. D. O., &
Danesh, J. (2007b). Associations of plasma fibrinogen levels with established
cardiovascular disease risk factors, inflammatory markers, and other characteristics:
individual participant meta-analysis of 154,211 adults in 31 prospective studies: the
fibrinogen studies collab. American Journal of Epidemiology, 166(8), 867–79.
Karasek, R., & Theorell, T. (1990). Healthy Work: Stress, Productivity, and the
Reconstruction of Working Life. New York: Basic Books.
Kirschbaum, C., Kudielka, B. M., Gaab, J., Schommer, N. C., & Hellhammer, D. H. (1999).
Impact of gender, menstrual cycle phase, and oral contraceptives on the activity of the
hypothalamus-pituitary-adrenal axis. Psychosomatic Medicine, 61(2), 154–62.
Kivimäki, M., Leino-Arjas, P., Luukkonen, R., Riihimäki, H., Vahtera, J., & Kirjonen, J.
(2002). Work stress and risk of cardiovascular mortality: prospective cohort study of
industrial employees. BMJ (Clinical Research Ed.), 325(7369), 857.
Kling, M. A., Alesci, S., Csako, G., Costello, R., Luckenbaugh, D. A., Bonne, O., …
Neumeister, A. (2007). Sustained low-grade pro-inflammatory state in unmedicated,
remitted women with major depressive disorder as evidenced by elevated serum levels of
the acute phase proteins C-reactive protein and serum amyloid A. Biological Psychiatry,
62(4), 309–13.
Kvetnansky, R., Pacak, K., Fukuhara, K., VIiscupic, E., HIiremagalur, B., Nankova, B., …
Kopin, I. J. (1995). Sympathoadrenal System in Stress. Annals of the New York
Academy of Sciences, 771(1 Stress), 131–158.
Lahlou-Laforet, K., Alhenc-Gelas, M., Pornin, M., Bydlowski, S., Seigneur, E., Benetos, A.,
… Consoli, S. M. (2006). Relation of depressive mood to plasminogen activator
inhibitor, tissue plasminogen activator, and fibrinogen levels in patients with versus
without coronary heart disease. The American Journal of Cardiology, 97(9), 1287–91.
Lederbogen, F., Gilles, M., Maras, A., Hamann, B., Colla, M., Heuser, I., & Deuschle, M.
(2001). Increased platelet aggregability in major depression? Psychiatry Research,
102(3), 255–61.

73
Lépine, J.-P., & Briley, M. (2011). The increasing burden of depression. Neuropsychiatric
Disease and Treatment, 7(Suppl 1), 3–7.
Leung, L. L. (2014). Overview of Hemostasis. Retrieved from uptodate.com
Lowe, G. D. O., Sweetnam, P. M., Yarnell, J. W. G., Rumley, A., Rumley, C., Bainton, D., &
Ben-Shlomo, Y. (2004). C-reactive protein, fibrin D-dimer, and risk of ischemic heart
disease: the Caerphilly and Speedwell studies. Arteriosclerosis, Thrombosis, and
Vascular Biology, 24(10), 1957–62.
Martins-de-Souza, D., Maccarrone, G., Ising, M., Kloiber, S., Lucae, S., Holsboer, F., &
Turck, C. W. (2014). Plasma fibrinogen: now also an antidepressant response marker?
Translational Psychiatry, 4(1), e352.
Mausbach, B. T., Aschbacher, K., Patterson, T. L., von Känel, R., Dimsdale, J. E., Mills, P. J.,
… Grant, I. (2007). Effects of placement and bereavement on psychological well-being
and cardiovascular risk in Alzheimer’s caregivers: a longitudinal analysis. Journal of
Psychosomatic Research, 62(4), 439–45.
Mills, P. J., & von Känel, R. (2010). Circulating Biomarkers of Inflammation, Adhesion, and
Hemostasis in Behavioral Medicine. In A. Steptoe, K. Freedland, J. R. Jennings, M. M.
Llabre, S. B. Manuck, & E. J. Susman (Eds.), Handbook of Behavioral Medicine:
Methods and Applications (pp. 685–704). Springer Science & Business Media.
Murray, C., & Lopez, A. (Eds.). (1996). The Global Burden of Disease: A Comprehensive
Assessment of Mortality and Disability from Diseases, Injuries, and Risk Factors in 1990
and Projected to 2020. Cambridge, MA: Harvard University Press.
Musselman, D. L., Tomer, A., Manatunga, A. K., Knight, B. T., Porter, M. R., Kasey, S., …
Nemeroff, C. B. (1996). Exaggerated platelet reactivity in major depression. The
American Journal of Psychiatry, 153(10), 1313–7.
Nemeroff, C. B., & Goldschmidt-Clermont, P. J. (2012). Heartache and heartbreak--the link
between depression and cardiovascular disease. Nature Reviews. Cardiology, 9(9), 526–
39.
Okwuosa, T. M., Klein, O., Chan, C., Jenny, N. S., Schreiner, P., Green, D., & Liu, K. (2013).
13-year long-term associations between changes in traditional cardiovascular risk factors
and changes in fibrinogen levels: the Coronary Artery Risk Development in Young
Adults (CARDIA) study. Atherosclerosis, 226(1), 214–9.

74
Petrowski, K., Paul, S., Albani, C., & Brähler, E. (2012). Factor structure and psychometric
properties of the trier inventory for chronic stress (TICS) in a representative German
sample. BMC Medical Research Methodology, 12(1), 42.
Robicsek, O., Makhoul, B., Klein, E., Brenner, B., & Sarig, G. (2011). Hypercoagulation in
chronic post-traumatic stress disorder. The Israel Medical Association Journal : IMAJ,
13(9), 548–52.
Rugulies, R. (2002). Depression as a predictor for coronary heart disease. a review and meta-
analysis. American Journal of Preventive Medicine, 23(1), 51–61.
Schulz, P., & Schlotz, W. (1999). Trierer Inventar zur Erfassung von chronischem Streß
(TICS): Skalenkonstruktion, teststatistische Überprüfung und Validierung der Skala
Arbeitsüberlastung - Diagnostica - Volume 45, Number 1 / 1999 -. Diagnostica, 45(1),
8–19.
Selye, H. (1956). Stress and psychiatry. The American Journal of Psychiatry, 113(5), 423–7.
Siegrist, J. (1996). Adverse health effects of high-effort/low-reward conditions. Journal of
Occupational Health Psychology, 1(1), 27–41.
Steptoe, A., & Kivimäki, M. (2012). Stress and cardiovascular disease. Nature Reviews.
Cardiology, 9(6), 360–70.
Steptoe, A., Kunz-Ebrecht, S., Rumley, A., & Lowe, G. D. O. (2003). Prolonged elevations in
haemostatic and rheological responses following psychological stress in low
socioeconomic status men and women. Thrombosis and Haemostasis, 89(1), 83–90.
Surtees, P. G., Wainwright, N. W. J., Luben, R. N., Wareham, N. J., Bingham, S. A., &
Khaw, K.-T. (2008). Depression and ischemic heart disease mortality: evidence from the
EPIC-Norfolk United Kingdom prospective cohort study. The American Journal of
Psychiatry, 165(4), 515–23.
Thrall, G., Lane, D., Carroll, D., & Lip, G. Y. H. (2007). A systematic review of the effects of
acute psychological stress and physical activity on haemorheology, coagulation,
fibrinolysis and platelet reactivity: Implications for the pathogenesis of acute coronary
syndromes. Thrombosis Research, 120(6), 819–47.
Tsai, S.-J. (2006). The possible role of tissue-type plasminogen activator and the plasminogen
system in the pathogenesis of major depression. Medical Hypotheses, 66(2), 319–22.
Tsai, S.-J., Hong, C.-J., Liou, Y.-J., Yu, Y. W.-Y., & Chen, T.-J. (2008). Plasminogen
activator inhibitor-1 gene is associated with major depression and antidepressant
treatment response. Pharmacogenetics and Genomics, 18(10), 869–75.

75
Vidović, A., Grubišić-Ilić, M., Kozarić-Kovačić, D., Gotovac, K., Rakoš, I., Markotić, A., …
Sabioncello, A. (2011). Exaggerated platelet reactivity to physiological agonists in war
veterans with posttraumatic stress disorder. Psychoneuroendocrinology, 36(2), 161–72.
Vignali, D. A. (2000). Multiplexed particle-based flow cytometric assays. Journal of
Immunological Methods, 243(1-2), 243–55.
Von Känel, R., & Bacon, S. L. (2013). Hemostasis and Endothelial Function. In S. Waldstein,
W. Kop, & L. Katzel (Eds.), Cardiovascular Behavioral Medicine. New York: Springer.
Von Känel, R., Bellingrath, S., & Kudielka, B. M. (2009a). Association between longitudinal
changes in depressive symptoms and plasma fibrinogen levels in school teachers.
Psychophysiology, 46(3), 473–80.
Von Känel, R., Bellingrath, S., & Kudielka, B. M. (2009b). Association of vital exhaustion
and depressive symptoms with changes in fibrin D-dimer to acute psychosocial stress.
Journal of Psychosomatic Research, 67(1), 93–101.
Von Känel, R., Dimsdale, J. E., Adler, K. a, Patterson, T. L., Mills, P. J., & Grant, I. (2004).
Effects of depressive symptoms and anxiety on hemostatic responses to acute mental
stress and recovery in the elderly. Psychiatry Research, 126(3), 253–64.
Von Känel, R., Dimsdale, J. E., Mills, P. J., Ancoli-Israel, S., Patterson, T. L., Mausbach, B.
T., & Grant, I. (2006). Effect of Alzheimer caregiving stress and age on frailty markers
interleukin-6, C-reactive protein, and D-dimer. The Journals of Gerontology. Series A,
Biological Sciences and Medical Sciences, 61(9), 963–9.
Von Känel, R., Dimsdale, J. E., Patterson, T. L., & Grant, I. (2003). Acute procoagulant stress
response as a dynamic measure of allostatic load in Alzheimer caregivers. Annals of
Behavioral Medicine : A Publication of the Society of Behavioral Medicine, 26(1), 42–8.
Von Känel, R., Frey, K., & Fischer, J. (2004). Independent relation of vital exhaustion and
inflammation to fibrinolysis in apparently healthy subjects. Scandinavian Cardiovascular
Journal : SCJ, 38(1), 28–32.
Von Känel, R., Hamer, M., Malan, N. T., Scheepers, K., Meiring, M., & Malan, L. (2013).
Procoagulant reactivity to laboratory acute mental stress in Africans and Caucasians, and
its relation to depressive symptoms: the SABPA study. Thrombosis and Haemostasis,
110(5), 977–86.
Von Känel, R., Hepp, U., Buddeberg, C., Keel, M., Mica, L., Aschbacher, K., & Schnyder, U.
(2006). Altered blood coagulation in patients with posttraumatic stress disorder.
Psychosomatic Medicine, 68(4), 598–604.

76
Von Känel, R., Hepp, U., Traber, R., Kraemer, B., Mica, L., Keel, M., … Schnyder, U.
(2008). Measures of endothelial dysfunction in plasma of patients with posttraumatic
stress disorder. Psychiatry Research, 158(3), 363–73.
Von Känel, R., Kudielka, B. M., Haeberli, A., Stutz, M., Fischer, J. E., & Patterson, S. M.
(2009). Prothrombotic changes with acute psychological stress: combined effect of
hemoconcentration and genuine coagulation activation. Thrombosis Research, 123(4),
622–30.
Von Känel, R., Mausbach, B. T., Kudielka, B. M., & Orth-Gomér, K. (2008). Relation of
morning serum cortisol to prothrombotic activity in women with stable coronary artery
disease. Journal of Thrombosis and Thrombolysis, 25(2), 165–72.
Von Känel, R., Mills, P. J., Fainman, C., & Dimsdale, J. E. (2001). Effects of psychological
stress and psychiatric disorders on blood coagulation and fibrinolysis: a biobehavioral
pathway to coronary artery disease? Psychosomatic Medicine, 63(4), 531–44.
Von Känel, R., Preckel, D., Zgraggen, L., Mischler, K., Kudielka, B. M., Haeberli, A., &
Fischer, J. E. (2004). The effect of natural habituation on coagulation responses to acute
mental stress and recovery in men. Thrombosis and Haemostasis, 92(6), 1327–35.
Williams, M. S. (2012). Platelets and depression in cardiovascular disease: A brief review of
the current literature. World Journal of Psychiatry, 2(6), 114–23.
Wirtz, P. H., Redwine, L. S., Baertschi, C., Spillmann, M., Ehlert, U., & von Känel, R.
(2008). Coagulation activity before and after acute psychosocial stress increases with
age. Psychosomatic Medicine, 70(4), 476–81.
Wirtz, P. H., Redwine, L. S., Ehlert, U., & von Känel, R. (2009). Independent association
between lower level of social support and higher coagulation activity before and after
acute psychosocial stress. Psychosomatic Medicine, 71(1), 30–7.
Wittchen, H.-U., & Pfister, H. (1997). DIA-X-Interviews: Manual für (DIA-X-Lifetime);
Verfahren und Interview; Interviewheft Längsschnittuntersuchung (DIA-X-12,
Ergänzungsheft (DIA-X-Lifetime); Interviewheft Querschnittuntersuchung Des,
Monate); Ergänzungsheft (DIA-X-12 Monate);. Frankfurt: Swets & Zeitlinger.
Wium-Andersen, M. K., Orsted, D. D., & Nordestgaard, B. G. (2013). Association between
elevated plasma fibrinogen and psychological distress, and depression in 73,367
individuals from the general population. Molecular Psychiatry, 18(8), 854–5.

77
Wium-Andersen, M. K., Ørsted, D. D., & Nordestgaard, B. G. (2013). Elevated plasma
fibrinogen, psychological distress, antidepressant use, and hospitalization with
depression: two large population-based studies. Psychoneuroendocrinology, 38(5), 638–
47.
Zhou, D., Yang, P.-Y., Zhou, B., & Rui, Y.-C. (2007). Fibrin D-dimer fragments enhance
inflammatory responses in macrophages: role in advancing atherosclerosis. Clinical and
Experimental Pharmacology & Physiology, 34(3), 185–90.

78
Appendix I.
The following tables show the raw data presented in the Results section (Section 5).
Source data for Figures 4, 5, 6 and 7. Mean baseline concentrations of fibrinogen, D-Dimer, VWF and PAI-1. Comparison between subjects with remitted depression and without a history of depression. Comparison between subjects with and without chronic stress and interaction effects.
Fibrinogen (mg/dl)
MD- (N=24) MD+ (N=39) CS- (N=29) CS+ (N=34) MD*CS
(interaction) 111.192 (±5.988)
126.742 (±3.567)
F1,50=7.738 p=.008
118.069 (±5.076)
123.235 (±4.403)
F1,50=.139 p=.711
F1,48=.184 p=.670
D-Dimer (ng/ml)
MD- (N=23) MD+ (N=38) CS- (N=28) CS+ (N=33) 57.609
(±22.223) 56.077
(±11.518) F1,48=.209
p=.649 38.464
(±13.060) 70.303
(±16.820) F1,48=2.96
p=.092 F1,48=2.570
p=.115
VWF (mg/L)
MD- (N=24) MD+ (N=38) CS- (N=28) CS+ (N=34) 11.628
(±1.475) 11.915 (±.610)
F1,49=.203 p=.654
11.711 (±.954)
11.805 (±.971)
F1,49=.450 p=.505
F1,48=.626 p=.432
PAI1 (ng/ml)
MD- (N=24) MD+ (N=39) CS- (N=29) CS+ (N=34) 1.648
(±.187) 2.072
(±.234) F1,50 =.246
p=.622 1.919
(±.266) 1.903
(±.209) F1,50=.837
p=.365 F1,48=.308
p=.581
Source data for Figure 8. Mean heart rate measures (bpm) of the four groups before and after the TSST. The figure shows means and standard errors corrected for baseline differences.
Rest Instruction pre-TSST post-TSST +15min +30min +45min MD+CS+ (N=18)
80.680 (±2.222)
82.280 (±2.181)
96.390 (±2.180)
98.170 (±2.324)
75.890 (±1.473)
75.390 (±1.732)
77.170 (±2.071)
MD+CS- (N=18)
81.370 (±3.686)
81.720 (±3.457)
94.390 (±3.918)
98.940 (±4.290)
78.440 (±2.381)
74.830 (±2.914)
74.720 (±2.670)
MD-CS+ (N=12)
77.000 (±3.213)
84.250 (±4.143)
100.170 (±4.026)
102.670 (±4.760)
74.250 (±3.170)
74.580 (±2.684)
72.000 (±3.245)
MD-CS- (N=9)
83.560 (±4.167)
81.440 (±4.240)
101.560 (±1.923)
104.330 (±4.187)
82.890 (±4.053)
79.220 (±3.045)
75.670 (±2.872)

79
Source data for Figure 9. Cortisol response (ng/ml) separate for each of the four groups. Means and standard errors corrected for baseline differences.
Baseline pre-TSST post-TSST +15min +30min +45min MD+CS+ (N=19)
127.296 (±28.464)
118.510 (±9.323)
134.360 (±9.789)
122.790 (±10.480)
104.720 (±8.828)
91.940 (±7.706)
MD+CS- (N=17)
118.378 (±27.158)
124.710 (±15.231)
153.550 (±13.444)
141.310 (±11.809)
122.070 (±11.038)
109.140 (±10.182)
MD-CS+ (N=14)
150.069 (±18.119)
144.850 (±15.953)
168.250 (±12.588)
159.970 (±16.073)
144.150 (±14.739)
130.070 (±12.505)
MD-CS- (N=10)
133.608 (±13.734)
122.890 (±8.684)
152.910 (±7.577)
147.980 (±9.949)
129.970 (±10.028)
115.830 (±9.284)
Source data for Figure 10. Changes in perceived anxiety during the stress protocol. Presented are estimated BSKE score means and standard errors corrected for baseline differences.
A: subscore ‘inner restlessness’ , B: subscore ‘anxiety’.
A: (effect of TSST: F3.6, 198.8=55.208, p<.001);
Baseline Instruction pre-TSST TSST +15min +30min +45min MD+CS+ (N=20)
2.100 (±.204)
2.800 (±.296)
3.050 (±.276)
4.000 (±.299)
1.250 (±.289)
.750 (±.190)
.800 (±.200)
MD+CS (N=18)
1.530 (±.298)
2.110 (±.290)
2.440 (±.217)
3.890 (±.179)
.940 (±.221)
.670 (±.243)
.560 (±.145)
MD-CS+ (N=13)
1.930 (±.384)
2.380 (±.367)
3.380 (±.331)
4.460 (±.215)
1.150 (±.317)
.850 (±.222)
.690 (±.263)
MD-CS- (N=10)
2.100 (±.379)
2.700 (±.367)
3.600 (±.452)
4.400 (±.400)
1.500 (±.401)
.800 (±.291)
.800 (±.291)
B: (effect of TSST: F2.4, 133.6=25.666, p<.001)
Baseline Instruction pre-TSST TSST +15min +30min +45min MD+CS+ (N=20)
.650 (±.167)
1.500 (±.295)
1.850 (±.318)
2.300 (±.430)
.450 (±.185)
.300 (±.128)
.300 (±.128)
MD+CS- (N=18)
.420 (±.163)
.720 (±.278)
0.940 (±.297)
1.390 (±.257)
.390 (±.183)
.170 (±.121)
.220 (±.101)
MD-CS+ (N=13)
.570 (±.260)
1.000 (±.408)
2.000 (±.453)
2.000 (±.438)
.690 (±.308)
.230 (±.122)
.230 (±.122)
MD-CS- (N=10)
.300 (±.153)
.500 (±.307)
1.100 (±.482)
1.500 (±.500)
.200 (±.200)
.100 (±.100)
.000 (±.000)

80
Source data for Figure 11. Changes in the three coagulation parameters in response to the TSST (N=63), independent of group. The table depicts means and standard errors with F and p-values (repeated measures ANCOVA with two independent factors, MD and CS).
baseline +15min +45min effect of TSST
effect of MD
effect of CS
Effect of MD*CS
Fibrinogen (mg/dl)
120.781 (±3.270)
116.206 (±4.011)
115.841 (±3.855)
F1.9,94.2=4.076 p=.021
F1,49=7.850 p=.007
F1,49=.052 p=.820
F1,49=.000 p=.993
D-Dimer (ng/ml)
56.645 (±10.866)
78.951 (±12.000)
53.049 (±10.582)
F1.6,76.6=.099 p=.868
F1,47=.008 p=.930
F1,47=4.107 p=.048
F1,47=3.880 p=.055
VWF (mg/L)
11.805 (±.670)
13.162 (±.611)
13.246 (±.538)
F1.5,70.9=1.643 p=.205
F1,48=.724 p=.399
F1,48=.302 p=.585
F1,48=.048 p=.828
Changes in the three coagulation parameters in response to the TSST (N=22), independent of group. Repeated measures ANCOVA with two independent factors, MD and CS.
effect of TSST effect of MD effect of CS
Fibrinogen F1,10<=.453 p>=.516
F1,10=6.042 p=.034
F1,10 =.506 p=.493
D-Dimer F1,10 <=1.617 p>=.232
F1,10=2.560 p =.141
F1,10 =2.627 p=.136
VWF F1,9<=1.722 p>=.222
F1,9=.603 p=.457
F1,9=.281 p =.609

81
Source data for Figure 12. Baseline to post-stress measures of fibrinogen (mg/dl) in the four groups. Presented are means with standard errors.
baseline +15min +45min MD+CS+ (N=20)
131.55 (±5.177)
125.15 (±6.515)
122.55 (±6.451)
MD+CS- (N=18)
121.61 (±5.304)
116.17 (±5.623)
115 (±5.813)
MD-CS+ (N=14)
111.36 (±6.715)
112.79 (±8.507)
116.14 (±8.769)
MD-CS- (N=10)
111.2 (±11.347)
104.7 (±15.107)
102.6 (±12.974)
Source data for Figure 13. Baseline to post-stress measures of fibrinogen (mg/dl), including another post-stress time point (immediately post-TSST). Presented are means and standard errors.
baseline post-TSST +30min +45min MD+ (N=7)
129.857 (±6.978)
116.571 (±9.954)
116.571 (±8.375)
121.286 (±14.484)
MD- (N=15)
109.600 (±7.105)
111.200 (±10.087)
113.667 (±10.145)
110.133 (±9.805)
CS+ (N=15)
114.000 (±5.928)
113.800 (±8.478)
113.467 (±7.600)
114.133 (±9.151)
CS- (N=7)
120.429 (±12.934)
111.000 (±15.837)
117.000 (±17.191)
112.714 (±16.903)
Source data for Figure 14. Baseline to post-stress measures of D-Dimer (ng/ml) in the four groups. Presented are means and standard errors.
baseline +15min +45min MD+CS+ (N=19)
59.160 (±14.811)
78.950 (±19.471)
45.790 (±12.338)
MD+CS- (N=18)
49.500 (±19.566)
56.500 (±18.425)
37.440 (±14.746)
MD-CS+ (N=14)
85.430 (±34.624)
138.140 (±33.369)
90.860 (±37.102)
MD-CS- (N=9)
14.330 (±7.474)
34.110 (±14.045)
38.780 (±13.534)

82
Source data for Figure 15. Baseline to post-stress measures of D-Dimer (ng/ml). including another post-stress time point (immediately post-TSST). Presented are means and standard errors.
baseline post-TSST +15min +45min MD+ (N=7)
82.230 (±34.981)
105.430 (±36.840)
177.857 (±35.273)
96.714 (±38.757)
MD- (N=15)
56.400 (±32.184)
154.400 (±65.490)
111.133 (±32.540)
80.933 (±33.330)
CS+ (N=15)
70.400 (±34.446)
151.930 (±66.786)
150.733 (±33.563)
79.667 (±34.874)
CS- (N=7)
52.230 (±22.557)
110.710 (±24.057)
93.000 (±32.146)
99.429 (±30.977)
Source data for Figure 16. Baseline to post-stress measures of VWF (mg/L). Presented are means and standard errors, separate for the four groups.
baseline +15min +45min MD+CS+ (N=20)
11.400 (±.843)
12.740 (±1.152)
13.090 (±.999)
MD+CS- (N=17)
12.370 (±.987)
14.750 (±.832)
14.640 (±1.123)
MD-CS+ (N=14)
12.390 (±2.070)
11.680 (±1.466)
11.850 (±1.042)
MD-CS- (N=10)
10.560 (±2.114)
13.360 (±1.672)
13.200 (±1.436)
Source data for Figure 17. Baseline to post-stress measures of VWF (mg/L), including another time point (immediately post-TSST). Presented are means and standard errors.
baseline post-TSST +15min +45min MD+ (N=6)
10.680 (±1.428)
9.330 (±1.564)
9.680 (±1.817)
9.910 (±.882)
MD- (N=15)
11.000 (±1.815)
10.700 (±.926)
11.200 (±1.425)
11.550 (±.788)
CS+ (N=15)
11.150 (±1.819)
9.917 (±1.032)
10.270 (±1.350)
10.980 (±.827)
CS- (N=6)
10.300 (±1.353)
11.410 (±.980)
12.020 (±2.154)
11.340 (±.838)

83
Appendix II.
The following table shows further results of the partial correlation analysis between the coag-
ulation parameters and the BDI-II score that were not presented in the text.
FIB: fibrinogen DD: D-Dimer VWF: Von-Willebrand-Factor PAI1: plasminogen activator inhibitor type 1 bdi_tsst: score on the BDI-II on the test day time points were G1: baseline, G2: +15 min, G3: +45 min, G4: immediately post-TSST.

84
The following tables shows results of the partial correlation analysis carried out between
scores on the TICS questionnaire and the selected coagulation markers. Measurements at +45
minutes post-stress were not shown in Table 5 of the results section, but are presented here.
FIB: fibrinogen levels D-Dimer levels VWF: Von-Willebrand-Factor levels PAI1: plasminogen activator inhibitor type 1 bdi_tsst: score on the BDI-II on the test day time points were G1: baseline, G2: + 15 min, G3: +45 min, G4: immediately post-TSST.

85

86
Eidesstattliche Versicherung
Merz, Annette Franziska Susanne Name, Vorname
Ich erkläre hiermit an Eides statt, dass ich die vorliegende Dissertation mit dem Thema
“Coagulation responses to acute and chronic stress – a comparison
between remitted depressed patients and healthy controls”
selbständig verfasst, mich außer der angegebenen keiner weiteren Hilfsmittel bedient und
alle Erkenntnisse, die aus dem Schrifttum ganz oder annähernd übernommen sind, als solche
kenntlich gemacht und nach ihrer Herkunft unter Bezeichnung der Fundstelle
einzeln nachgewiesen habe.
Ich erkläre des Weiteren, dass die hier vorgelegte Dissertation nicht in gleicher oder in
ähnlicher Form bei einer anderen Stelle zur Erlangung eines akademischen Grades eingereicht
wurde.
München, Ort, Datum Unterschrift Doktorandin

87
Danksagung
Bedanken möchte ich mich sehr herzlich für die sehr gute Betreuung am Max-Planck-Institut,
und für die Möglichkeit, meine Dissertation an solch einem renommierten Haus absolvieren
können.
Insbesondere gilt mein Dank Herrn Dr. Marcus Ising und Frau Dr. Nina Höhne, die mir stets
sehr hilfsbereit und kompetent zur Seite standen.
Frau Melanie Huber danke ich sehr für ihre hervorragende und sehr gewissenhafte Arbeit
beim praktischen Teil der Arbeit.