Optimizing FeCl3 in coagulation-flocculation treatment of dye ...
9
*Corresponding author Email address: [email protected] Songklanakarin J. Sci. Technol. 43 (4), 1094-1102, Jul. - Aug. 2021 Short Communication Optimizing FeCl 3 in coagulation-flocculation treatment of dye wastes Mohanad Jawad Abbas, Radin Mohamed*, Mohammed Al-Sahari, Adel Al-Gheethi, and Azra Munirah Mat Daud Micro-pollutant Research Centre, Department of Water and Environmental Engineering, Faculty of Civil Engineering and Built Environment, Universiti Tun Hussein Onn Malaysia, Batu Pahat, Johor, 86400 Malaysia Received: 2 March 2020; Revised: 4 August 2020; Accepted: 17 August 2020 Abstract The aim of the study was to investigate the efficiency of iron chloride in term of color, chemical oxygen demand (COD), TSS and turbidity removal of dye waste. Response surface methodology (RSM) using central composite design (CCD) was employed to analyze and investigate the effects of the independent factors on color, COD, turbidity, and TSS removal as well as the effect on phytotoxicity concentration. The efficiency of the optimal sample removal for dye color, COD, turbidity, and TSS were 91.89%, 85.40%, 98.36%, and 98.66%, respectively was achieved at a fixed pH value (X1) of 4, iron chloride dosage (X2) of 2.72 g/L, mixing time (X3) of 3 min and mixing speed (X4) of 30 rpm. While the phytotoxicity concentration was 53.05% at the optimal run which considered as not harmful and could be used for irrigation. The finding indicated that the use of iron chloride in coagulation-flocculation has high potential for treatment of dye waste. Keywords: color removal, wastewater treatment, pigment waste, textile waste 1. Introduction Globally, several countries are witnessing various environmental pollution, dye wastes such as azo dyes which include textile dyeing and paper printing applications constitute 50% of the industrial color waste in the world (Verma & Madamwar, 2005), which consider as one of the most toxic pollutants of natural water sources. Printing ink center wastes usually contain a high concentration of dissolved colors, organic compounds (Bhayani, 2014; Luo et al., 2014), chemical oxygen demand (COD), turbidity, toxic chemicals and a high temperature (Zayneb et al., 2015), which emphasizes the need to address these type of waste before the disposal stage. At several small printing centres or industries, dyeing wastes are disposed into the drainage with a primitive purification of treatment which led to the deterioration of water quality and obstruct the water treatment processes (Luo et al., 2014). According to Moghaddam, Moghaddam & Arami, (2010), the liquid color wastes of the printing ink center can destroy the aquatic life if not treated before being discharged into natural water sources. Printing wastes prevent the sunlight of penetrating the water surface which could damage the life of the water plants due to the preventing of photosynthesis process (Verma, Dash, & Bhunia, 2012). The presence of inorganic substances (pigments titanium dioxide and carbon black) makes the wastewater inappropriate to reuse due to the soluble excess concentration (Papić, Koprivanac, Božić, & Meteš, 2004). Nowadays, wastewater treatment and reuse with using low cost and effective methods became very important in the printing ink industry due to the lack of global clean water and the increasingly stringent regulation concerning its disposal (Bhuiyan, Rahman, Shaid, Bashar & Khan, 2016). The composition of dye wastes displaying very low biodegradability because of the huge molecular weight of the compound structure (Gupta et al., 2016). Some of the previous studies have been indicated that more than 10-15% of the dyes used during the production processes are released into the environment directly without any treatment (Bhayani, 2014; Khehra, Saini, Sharma, Chadha & Chimni, 2006) which caused burden to the biological treatment process due to high content of inorganic salt (Ranganathan, Karunagaran, & Sharma, 2007).
-
Upload
khangminh22 -
Category
Documents
-
view
0 -
download
0
Transcript of Optimizing FeCl3 in coagulation-flocculation treatment of dye ...
*Corresponding author
Email address: [email protected]
Songklanakarin J. Sci. Technol.
43 (4), 1094-1102, Jul. - Aug. 2021
Short Communication
Optimizing FeCl3 in coagulation-flocculation treatment of dye wastes
Mohanad Jawad Abbas, Radin Mohamed*, Mohammed Al-Sahari,
Adel Al-Gheethi, and Azra Munirah Mat Daud
Micro-pollutant Research Centre, Department of Water and Environmental Engineering,
Faculty of Civil Engineering and Built Environment, Universiti Tun Hussein Onn Malaysia, Batu Pahat, Johor, 86400 Malaysia
Received: 2 March 2020; Revised: 4 August 2020; Accepted: 17 August 2020
Abstract
The aim of the study was to investigate the efficiency of iron chloride in term of color, chemical oxygen demand
(COD), TSS and turbidity removal of dye waste. Response surface methodology (RSM) using central composite design (CCD)
was employed to analyze and investigate the effects of the independent factors on color, COD, turbidity, and TSS removal as
well as the effect on phytotoxicity concentration. The efficiency of the optimal sample removal for dye color, COD, turbidity,
and TSS were 91.89%, 85.40%, 98.36%, and 98.66%, respectively was achieved at a fixed pH value (X1) of 4, iron chloride
dosage (X2) of 2.72 g/L, mixing time (X3) of 3 min and mixing speed (X4) of 30 rpm. While the phytotoxicity concentration was
53.05% at the optimal run which considered as not harmful and could be used for irrigation. The finding indicated that the use of
iron chloride in coagulation-flocculation has high potential for treatment of dye waste.
Keywords: color removal, wastewater treatment, pigment waste, textile waste
1. Introduction
Globally, several countries are witnessing various
environmental pollution, dye wastes such as azo dyes which
include textile dyeing and paper printing applications
constitute 50% of the industrial color waste in the world
(Verma & Madamwar, 2005), which consider as one of the
most toxic pollutants of natural water sources. Printing ink
center wastes usually contain a high concentration of
dissolved colors, organic compounds (Bhayani, 2014; Luo et
al., 2014), chemical oxygen demand (COD), turbidity, toxic
chemicals and a high temperature (Zayneb et al., 2015), which
emphasizes the need to address these type of waste before the
disposal stage. At several small printing centres or industries,
dyeing wastes are disposed into the drainage with a primitive
purification of treatment which led to the deterioration of
water quality and obstruct the water treatment processes (Luo
et al., 2014). According to Moghaddam, Moghaddam &
Arami, (2010), the liquid color wastes of the printing ink
center can destroy the aquatic life if not treated before being
discharged into natural water sources. Printing wastes prevent
the sunlight of penetrating the water surface which could
damage the life of the water plants due to the preventing of
photosynthesis process (Verma, Dash, & Bhunia, 2012). The
presence of inorganic substances (pigments titanium dioxide
and carbon black) makes the wastewater inappropriate to
reuse due to the soluble excess concentration (Papić,
Koprivanac, Božić, & Meteš, 2004).
Nowadays, wastewater treatment and reuse with
using low cost and effective methods became very important
in the printing ink industry due to the lack of global clean
water and the increasingly stringent regulation concerning its
disposal (Bhuiyan, Rahman, Shaid, Bashar & Khan, 2016).
The composition of dye wastes displaying very low
biodegradability because of the huge molecular weight of the
compound structure (Gupta et al., 2016). Some of the previous
studies have been indicated that more than 10-15% of the dyes
used during the production processes are released into the
environment directly without any treatment (Bhayani, 2014;
Khehra, Saini, Sharma, Chadha & Chimni, 2006) which
caused burden to the biological treatment process due to high
content of inorganic salt (Ranganathan, Karunagaran, &
Sharma, 2007).

M. J. Abbas et al. / Songklanakarin J. Sci. Technol. 43 (4), 1094-1102, 2021 1095
Various techniques have been employed for treating
the dyes waste including physical, chemical and biological
techniques, where all of them have been achieved and
acceptable efficiency of removal reach more than 90% in
some conducted studies (Hassaan, El Nemr & Madkour, 2017;
Madhav, Ahamad, Singh, & Mishra, 2018; Noman, Al-
Gheethi, Talip, Mohamed, & Kassim ,2019, 2020; Šekuljica et
al. , 2015) . Although, the high efficiency of dyes removal of
the physical and chemical methods including the conventional
membranes, absorption, ozonation, oxidative process, and
others, they involve some handicaps as the high cost, suffering
from sludge generation, and require a high level of
maintenance ( Crini & Lichtfouse, 2019) . In addition, many
studies have emphasized the seriousness of the usage of
chemicals in dyes removal which is often instability, generates
undesirable by-products due to the utilization of the strong
oxidizing agents (H2O2, O3 and Fenton's reagent), besides that
there are some dyes are resistant the chemicals agents and
require higher dosage ( Holkar, Pandit, & Pinjari, 2014; Paz,
Carballo, Pérez & Domínguez., 2016; Sivarajasekar & Baskar,
2015). Moreover, Al-Sahari, Al-Gheethi & Mohamed (2020)
indicated that the excessive utilization of chemicals could
cause secondary pollution.
On the other hand, the biological degradation
methods of dyes including the employing of biometals,
metabolic pathways or adsorption by microorganisms,
biomass and plants-based methods are generally inexpensive,
ecosystem friendly, can be applied widely and have less
dangerous aspects compared to the physical and chemical
methods (Solís et al., 2012). Iron chloride (FeCl3) has known
as one of the most effective coagulants due to its high ability
to remove dyes and COD under alkaline and acidic conditions
(pH 12 or 4) and its high efficiency with a low dosage.
Furthermore, the literature has confirmed the superiority of
FeCl3 over several of the coagulants currently used in dyes
removal processes such as aluminum sulphate (alum) and
ferrous sulphate (FeSO4) in terms of the stability time, the
performance under different pH and temperature, and the
required for overdoses which often cause secondary pollution
(Aziz, Alias, Assari & Adlan, 2007; Kumar & Bishnoi, 2017).
2. Materials and Methods
2.1 Sampling of dye wastes of printing ink
The dye wastes were collected from the printing ink
center of Universiti Tun Hussein Onn Malaysia (UTHM),
Parit Raja, Batu Pahat, Johor, Malaysia. The collected samples
were transferred into an ice container to the laboratory and
stored at the cooling rooms at 4 °C. The samples were
collected from the outside storage tank before subjected to any
type of treatment. 30 L of dye water was collected among two
weeks to test 30 experimental runs which were designed by
Design Expert software 11.1.2.0. Samples were collected
daily and kept in the cooling room during treatment process to
keep the water quality and maintain it from any change that
may occur due to storage process. Safety rules were taken in
consideration during samples collection and all samples were
collected between 2:00 and 3:00 p.m.
2.2 Experimental setup
The experimental-setup in the present study
consisted of preparation of iron chloride (FeCl3), printing ink
wastewater samples. The efficiency of iron chloride (FeCl3) in
removing color, COD, turbidity and TSS using the jar tests
(coagulation-flocculation process) was investigated. The
central composite design (CCD) in duplicates was used to
study the coagulation-flocculation optimization based on pH,
iron chloride (FeCl3) dosage, mixing rate and mixing speed.
2.3 Preparation of iron chloride
The Iron (III) chloride (FeCl3) (99.9% purity) used
in the current research was produced by ''Science Company''.
The product identified as ferric chloride, anhydrous, comes in
black powder form. The use of FeCl3 was very carefully due
to its fast interaction with air. Therefore, the coagulant FeCl3
was took out from the bottle fast and the container was closed
directly to maintain the container content. The iron chloride
container was stored at 24±1 oC
2.4 Optimization of color, COD, turbidity and TSS
removal
The best operating treatment of color COD,
turbidity and TSS removal was optimized using response
surface methodology (RSM). The experimental runs were
designed using Design Expert 11.1.2.0, central composite
design (CCD) (Stat-Ease, Inc., Minneapolis, U.S.A.) software.
The independent factors included the value of pH (X1),
Coagulants dosage (X2), mixing time (X3), and mixing speed,
(X4). The maximum (+1), intermediate (0), and minimum (-1)
values of each independent variable are illustrated in Table 1.
Response surface methodology (RSM) using central
composite design (CCD) was used for optimization of
coagulation and flocculation process to see the reflection of
coagulant dosage at a different range of pH, mixing rate and
mixing time. The range of pH was selected as the average (4-
10) which is considered similar to the ranged specified by
Table 1. Coded and un-coded levels of the independent variables used in the current study.
Factor Symbol Level
.
Low (-1) Middle (0) High (+1)
Value of pH X1 4 7 10 (13*)
Iron chloride dosage (g/L) X2 1 (0*) 2 3 (4*) Mixing time (minutes) X3 1 (0*) 6 10 (14*)
Mixing speed (rpm) X4 30 (0*) 90 150
* A single run was suggested by Design-Expert software among of the 30 experimental runs

1096 M. J. Abbas et al. / Songklanakarin J. Sci. Technol. 43 (4), 1094-1102, 2021
Ramli & Aziz, (2015). The coagulant dosage was specified
according to research have been performed by Ashtekar,
Bhandari, Shirsath, Jolhe & Ghodke (2014). Maxing rate and
time were set up as mentioned by Farajnezhad, H. &
Gharbani, P. (2012). Factors ranges were specified using
various studies to obtain the different results which can more
clarify the effects of the factors on the removal efficacies.
Table 1 illustrates the factors ranges used during the
optimization of coagulation and flocculation process.
In contrast, the dependent variables included
removal rate based on the removal of Color )y1), COD )y2),
Turbidity )y3) and TSS )y1). Thirty experimental runs were
performed to evaluate the interaction between independent
factors and for the optimization of the variables and responses.
The significance of the models obtained data and values was
specified using the analysis of variance )ANOVA(, where
they considered as a significant value when the p-value <0.05.
2.5 Color measurement
Dye wastes are characterized by being high in color,
mainly due to the dyes that are present in the pigment printing
processes. Samples of dye wastes were filtered using filter
paper before measuring the color or dyeing concentration
using DR6000. Collected samples subjected to color test
before and after treatment processes using spectrometer
DR6000 under platinum- Cobalt (Pt. Co) method (number of
program 455) with a set wavelength of 120–730 nm.
2.6 Chemical oxygen demand measurements
High range COD by the reactor digestion method
was employed to determine COD value using the prepared
digestion solution by HACH for cod 20-1500 mg/L range.
Samples were prepared by dropping 2 ml of the samples into
the digestion solution vials using a clean pipet then the vials
were inverted several times gently to mix and put in the
preheated DRB200 reactor, which was set at 150 °C for 120
min. After that, the vials were taken out from DRB200
instrument and left for 10 to 15 min to cooling. Finally, COD
values were measured using the listed program COD HR at
spectrometer DR6000 by cleaning the surface of the vial first
and using the pre-preparation sample of distillation water as a
blank sample and pressed zero option in the instrument after
that COD values of the dyeing waste samples were measured
by putting the sample vials in the spectrometer DR6000
separately and pressed measure option.
2.7 Turbidity measurement
The turbidity value of the samples was measured
before and after treatment processes where Extech turbidity
meter (TB400) employed to measure the turbidity directly.
Samples preparation were not required in the turbidity test, the
supplied sample bottle of the TB400 was simply filled by
sample until the 10 mL line at the TB400 bottle and then the
bottle surface was cleaned and dried well to avoid any reading
mistakes and then the bottle was placed at the TB400 to
measure the turbidity value following Turbidity Meter Model
TB400 user guide.
2.8 Total suspended solid measurement
Total Suspended solid value of samples was
measured directly using Spectrometer DR6000 with employed
program 630. The samples were stirring and immediately
poured 10 mL of the blended sample into a sample cell, while
a second sample cell was filled with 10 mL of deionized water
which considered as blank sample. All the sample cells
cleaned and the blank Inserted into the cell holder with
Pushing ZERO option in the DR6000 which display shows 0
mg/L TSS then the dye samples was inserted one by one in the
cell holder to measure the TSS.
3. Results and Discussion
3.1 Color, COD, turbidity and TSS results of dye
samples before treatment
Color and water quality tests have been performed
for the collected samples before treatment process to identify
and assess the efficiency of iron chloride in color removal and
its effects on water quality. The COD, and TSS values on the
raw sample were high compared with the Malaysian sewage
and industrial effluent discharge standard shown in Table 2
which estimated by 507 vs. 100 mg/L and 227 vs. 100 mg/L,
respectively. While the color value was assessed under APHA
2017, method 2120B due to the incompatibility of color unit
with Malaysia standard and as well as described in a previous
research performed by Anijiofor, Daud, Idrus & Man (2018).
The color concentration of the raw water was very high
comparing to the APHA 2017 standard where the value
obtained was 650 Pt Co versus the standard value of 300 Pt
Co. In the other hand pH value was in the range (Table 2),
which was 8.05 ± 0.07 vs. 6.5- 8.5. There were no standard
recorded for turbidity of the used standards.
Table 2. Mean+STDEV of color, COD, turbidity, TSS
concentration before treatment process compared with
Malaysian sewage and industrial effluent discharge
standard )number of samples, n=3(.
Parameter Unit Mean + stdev Standard waste
Color Pt.Co 650±15 300a
COD mg/L 507±7 100b Turbidity NTU 72±2 NA
TSS mg/L 227±10 100b
(a) APHA 2017, standard method 2120B, (b) Malaysian sewage and industrial effluent discharge standard
3.2 Color removal efficiency using iron chloride
Thirty experiments were performed during this
research as shown the result of each run in Table 3. The
screening of color and COD removal by iron chloride was
conducted based on the designed performed by using RSM.
Four independent variables were tested; central composite
design (CCD) was employed with thirty runs (designed by
Design expert version 11.1.2.0). According to the study

M. J. Abbas et al. / Songklanakarin J. Sci. Technol. 43 (4), 1094-1102, 2021 1097
performed by Kumar and Bishnoi, (2017), the iron chloride
dosage (X2) was ranged between 1 and 3 g/L in this study.
Table 2 displays the observed and predictable results of color
and COD removal which designed by Design Expert software
after the analysis of data.
According to the Figure 1 and Table 3, the removal
of color was increased by increase the iron chloride dosage.
However, the average dosage of iron chloride (2 g/L) was
showed a high efficiency of color removal which reached to
95.85% (removed 623.03 Pt. CO) and with increasing the
Figure 1. Design-Expert Plot, 3D surface graph showing the effect of iron independent factors on color removal
Table 3. Summary results of all experimental runs of the study (central composite design arrangement and responses)
Run X1 X2 X3 X4
y1 y2 y3 y4
Observed Observed Observed Observed
1 7 3 6 90 75.85 69.82 79.26 88.75
2 4 2 1 150 87.77 83.85 69.97 76.23
3 13 3 6 90 54.61 70.81 73.03 93.39
4 7 0 6 90 16.34 20.54 21.64 30.22
5 10 3 1 150 61.69 67.46 99.94 97.80
6 7 2 6 90 94.46 94.89 76.79 80.75
7 7 2 6 0 76.15 65.09 77.03 81.19
8 10 3 1 30 57.23 63.31 62.08 73.74
9 7 4 6 90 47.08 59.82 50.43 71.63
10 7 2 6 90 94.31 95.09 76.74 84.19
11 10 1 1 30 62.15 52.72 58.78 69.87
12 7 2 14 90 95.38 93.43 75.53 84.71
13 10 3 10 30 56.31 60.95 64.42 78.72
14 4 1 1 150 82.62 75.23 98.89 92.95
15 4 1 10 30 81.54 69.45 64.43 72.07
16 4 3 10 150 84.15 64.50 73.56 87.22
17 4 3 1 30 71.77 65.05 99.32 94.71
18 7 2 6 90 93.69 95.69 76.83 80.75
19 10 3 10 150 60.38 62.72 70.85 87.67
20 7 2 0 90 74.62 71.48 85.22 90.97
21 7 2 6 90 94.92 94.75 76.82 83.22
22 7 2 6 150 95.85* 97.42* 72.79 85.15
23 10 1 10 30 68.54 58.85 64.33 75.46
24 4 3 10 30 72.62 86.59 100.00* 99.11
25 4 1 10 150 87.54 78.54 65.35 77.53
26 4 2 6 90 90.15 90.15 99.98 99.56*
27 4 1 1 30 79.92 70.47 61.44 71.63
28 10 1 1 150 65.38 53.16 62.85 75.77
29 7 2 6 90 92.00 81.07 60.75 72.95
30 10 1 10 150 70.69 60.98 74.71 81.62
X1(pH value), X2 (Iron chloride dosage, %), X3 (Mixing time, min), X4 (Mixing speed, rpm), y1 (Color removal, %), y2 (COD
removal, %), y3 (Turbidity, %), y4 (Total suspended solid, %). * The maximum removal run
1098 M. J. Abbas et al. / Songklanakarin J. Sci. Technol. 43 (4), 1094-1102, 2021
dosage to 3 g/L the removal percentage of color was
decreased due to the excessive dosage of FeCl3 that re-
stabilized the dye particles (Wong, Teng, & Norulaini, 2007).
Color removal was achieve to 84.15% (546.98 Pt. CO) in the
best run of iron chloride is 3 g/L, while the efficiency keep decreasing until reach to 47.08% (306.02 Pt. CO) in the out of
range run of iron chloride is 4 g/L. Comparing with the
previous study that performed by Kumar & Bishnoi (2017),
the low dosage (1 g/L) of iron chloride has been recoded a
high removal estimated by 80% while the high dosage of 3
g/L was removed around 70% of color. Moreover, Ramli &
Aziz (2015) has been reported similar results where the study
used iron ferric chloride and the color removal reach to
97.77% with the average dosage of 3.6 g/L, while in the 4 g/L
of dosage, the removal ratio of color was estimated by 95%. A
synthetic wastewater with a dye concentration of 100 mg/L
has been treated using FeCl3 coagulant with a dosage ratio of
400 mg/L. The dye removal efficiency was estimated by 88%
(88 mg/L) (Assadi, Nateghi, Bonyadinejad, & Amin, 2013).
On the other hand, Figure 1a is the summary of the
obtained results which indicated to the strong effect of iron
chloride dosage (X2) on the color removal and there was no
interaction between pH value (X1) and iron chloride dosage
(X2) affected on removing color. Figure 1b showed that pH
value (X1) has a direct effect on the color removal, where the
removal efficiency was increased with reducing the pH value
(pH< 7). Other factors were having no effects on the color
removal efficiency or they may have had a slight effect which
did not considered during the analysis of variance (ANOVA).
The model of ANOVA of color removal response was
significant with a P-value of 0.0001 (Table 4). According to
Table 4, pH value (X1) has a linear effect on the color removal
with a P-value of 0.0011, and iron chloride dosage (X2) has a
quadratic effect on the color removal with a P-value estimated
by 0.0001, while there were no effects of mixing time (X3)
and mixing speed (X4) factors which recorded insignificant
values (P-values >0.05). In addition, no interactions effects
between the factors were recorded in color removal (Table 4).
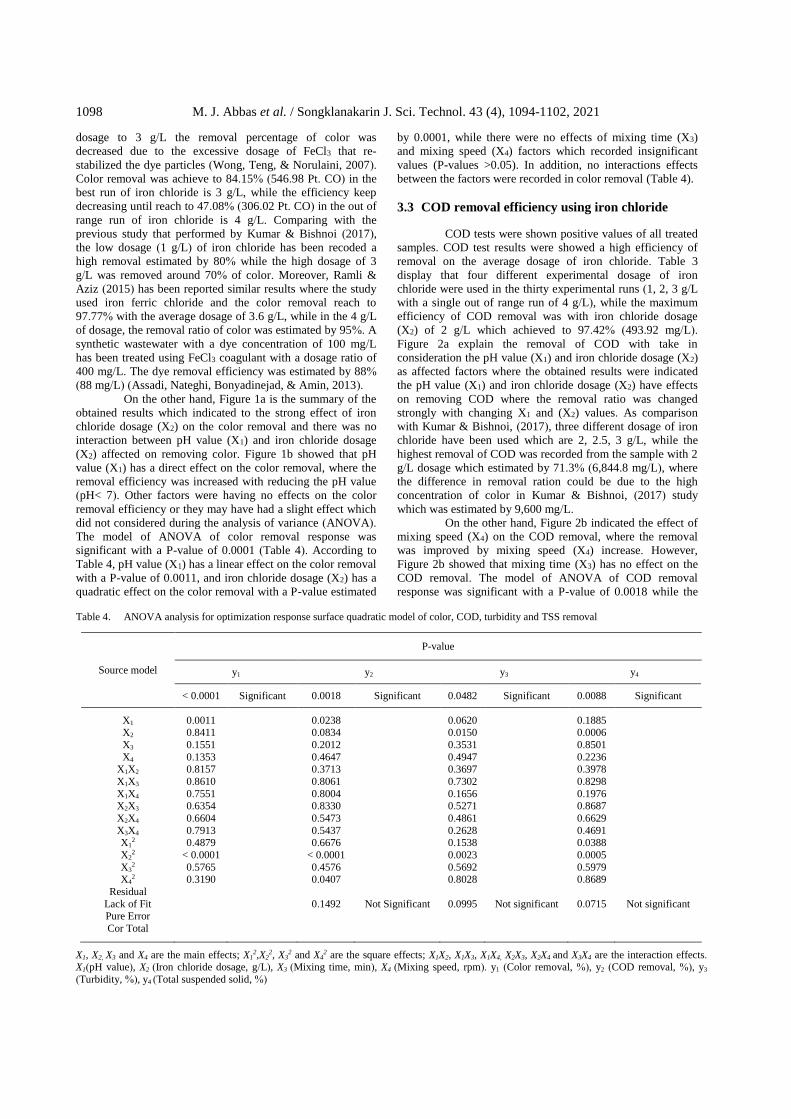
3.3 COD removal efficiency using iron chloride
COD tests were shown positive values of all treated
samples. COD test results were showed a high efficiency of
removal on the average dosage of iron chloride. Table 3
display that four different experimental dosage of iron
chloride were used in the thirty experimental runs (1, 2, 3 g/L
with a single out of range run of 4 g/L), while the maximum
efficiency of COD removal was with iron chloride dosage
(X2) of 2 g/L which achieved to 97.42% (493.92 mg/L).
Figure 2a explain the removal of COD with take in
consideration the pH value (X1) and iron chloride dosage (X2)
as affected factors where the obtained results were indicated
the pH value (X1) and iron chloride dosage (X2) have effects
on removing COD where the removal ratio was changed
strongly with changing X1 and (X2) values. As comparison
with Kumar & Bishnoi, (2017), three different dosage of iron
chloride have been used which are 2, 2.5, 3 g/L, while the
highest removal of COD was recorded from the sample with 2
g/L dosage which estimated by 71.3% (6,844.8 mg/L), where
the difference in removal ration could be due to the high
concentration of color in Kumar & Bishnoi, (2017) study
which was estimated by 9,600 mg/L.
On the other hand, Figure 2b indicated the effect of
mixing speed (X4) on the COD removal, where the removal
was improved by mixing speed (X4) increase. However,
Figure 2b showed that mixing time (X3) has no effect on the COD removal. The model of ANOVA of COD removal
response was significant with a P-value of 0.0018 while the
Table 4. ANOVA analysis for optimization response surface quadratic model of color, COD, turbidity and TSS removal
Source model
P-value
y1 y2 y3 y4
< 0.0001 Significant 0.0018 Significant 0.0482 Significant 0.0088 Significant
X1 0.0011 0.0238 0.0620 0.1885 X2 0.8411 0.0834 0.0150 0.0006
X3 0.1551 0.2012 0.3531 0.8501
X4 0.1353 0.4647 0.4947 0.2236 X1X2 0.8157 0.3713 0.3697 0.3978
X1X3 0.8610 0.8061 0.7302 0.8298
X1X4 0.7551 0.8004 0.1656 0.1976 X2X3 0.6354 0.8330 0.5271 0.8687
X2X4 0.6604 0.5473 0.4861 0.6629
X3X4 0.7913 0.5437 0.2628 0.4691 X1
2 0.4879 0.6676 0.1538 0.0388
X22 < 0.0001 < 0.0001 0.0023 0.0005
X32 0.5765 0.4576 0.5692 0.5979
X42 0.3190 0.0407 0.8028 0.8689
Residual
Lack of Fit 0.1492 Not Significant 0.0995 Not significant 0.0715 Not significant Pure Error
Cor Total
X1, X2, X3 and X4 are the main effects; X12,X2
2, X32 and X4
2 are the square effects; X1X2, X1X3, X1X4, X2X3, X2X4 and X3X4 are the interaction effects. X1(pH value), X2 (Iron chloride dosage, g/L), X3 (Mixing time, min), X4 (Mixing speed, rpm). y1 (Color removal, %), y2 (COD removal, %), y3
(Turbidity, %), y4 (Total suspended solid, %)

M. J. Abbas et al. / Songklanakarin J. Sci. Technol. 43 (4), 1094-1102, 2021 1099
Figure 2. Design-Expert Plot, 3D surface graph showing the effect of iron independent factors on COD removal
lack of fit was not significant with a P-value of 0.1492 which
indicate that the model fit is well (Table 4). According to Table
4, pH value (X1) has a linear effect on the COD removal with a
P-value of 0.0238, while iron chloride dosage (X2) and mixing
speed (X4) factors have a quadratic effect on the COD removal
with a P-value of 0.0001 and 0.0407, respectively.
The decreased of removal ration by increase the iron
chloride dosage (X2) over 2 g/L could be refer to several
factors such as the increase of the strength of repulsive forces
between dosage particles, or the restabilization of the dye
particles by excess iron chloride species (Stephenson and Duff
1996).
3.4 Turbidity removal efficiency using iron chloride
The efficiency of turbidity removal was estimated
from 50.43 to 100 % at the dosage between 2-3 g/L. The
removal ratio obtained at iron chloride dosage (X2) of 4 g/L
was 50.43% (30.31 NTU) due to the restabilization of the color
particles and excessive dosage of iron chloride which
contributed to the turbidity of water. While the turbidity
achieve the maximum removal value estimated by 100 % (72)
under pH value of 4 with the dosage (X2) of 3 g/L (Table 3,
Figure 3). According to Ramli & Aziz (2015), the removal
percentage of turbidity using iron chloride was closed to the
results observed in is study, where the maximum value of
removal was observed estimated by 97.78% with a dosage of
3.5 g/L. Mohamed et al. (2020) reported a high removal of
turbidity from dairy soiled water reached 99% (6,484.5 NTU)
with a dosage concentration of FeCl3 of 705 mg/L which
indicated to the high effects of FeCl3 on turbidity removal even
through the small concentration. While there were no effect of
the other factors, X1, X3, and X4 on the turbidity removal.
Table 4 showed that iron chloride X2 has a linear and quadratic
effects on the removal of turbidity with p value of 0.0150 and
0.0023 respectively, while other factors X1, X3, and X4 were
recorded insignificant effects on the removal ratio (P-value
>0.05). The model of ANOVA of turbidity removal response
was significant with a P-value of 0.0482 while the lack of fit
was not significant with a P-value of 0.0995 (Table 4).
3.5 TSS removal efficiency using iron chloride
According to Table 3, the removal ratio of TSS were
estimated as the lowest by 69.87% (158.61 mg/L) with a
dosage of 1 g/L and pH value of 10, and the highest removal
ratio of TSS reached 99.56% with a dosage of 2 g/L under pH
value of 4. Figure 4, indicates to the efficient effect of iron
chloride to remove TSS by using the average dosage (2 g/L).
The TSS removal ratio was decreased by increasing the iron
chloride dosage over 2 g/L which can be due to the disturbance
of the sediment particles caused by the excessive dosage. Irfan
et al. (2017) has been approximately matched the obtained
results of the current study, where the maximum removal of
TSS was reported using the iron chloride dosage of 2.5 g/L was
95% (10,882.25 mg/L). The removal of TSS had effected by
the linear and quadratic effects of iron chloride dosage (X2)
where it affects positively with a P-value of 0.0006 and 0.0005
Figure 3. Design-Expert plot, 3D surface graph showing the effect of iron chloride dosage and pH value on turbidity removal
Figure 4. Design-Expert plot, 3D surface graph showing the effect of
iron chloride dosage and mixing time on TSS
1100 M. J. Abbas et al. / Songklanakarin J. Sci. Technol. 43 (4), 1094-1102, 2021
respectively and/or due to the quadratic effects of pH value
(X1) which affect positively on the TSS removal with a P-value
of 0.0388 )p <0.05( )Table 4(. Mixing time (X3) and mixing
speed )X4( factors had no effects on the TSS removal as shown
in Table 4 )P <0.05(. The model of ANOVA of TSS removal
response was significant with a P-value of 0.0088 while the
lack of fit was not significant with a P-value of 0.0715 )Table
4(.
3.6 Validation of the optimal parameters
The optimal run was provided by the Design-Expert
software 11.1.2.0 employing the option of “Point Prediction”,
where in this option the software suggests an additional run to
be tested for the confidence test. The suggested values given by
the software for the confidence run for the factors X1 (pH
value), X2 (Iron chloride dosage, g/L), X3 (Mixing time, min),
X4 (Mixing speed, rpm) were by 4, 2.27, 3, and 30 respectively
(Table 5).
Table 5 were showed that removal ratio of color
(y1), COD (y2), turbidity (y3) and TSS (y4) were compatible
to the predicted removal ratio given by Design Expert software
which means the analytical of the software was successful with
the predicted values of the software with standard error of ±5.
According to Table 5 the predicted removal of color (y1), COD
(y2), turbidity (y3) and TSS (y4) were 93.36, 82.52, 96.83, and
99.56%, respectively, versus the tested removal values of
91.89, 85.40, 98.36, and 98.66%. Under this condition, the
independent factors exhibited strong interactions by a high
percentage of confidence level with a standard error of ±5 for
all responses.
4. Conclusions
Color test result of the collected raw water was
indicated to the high contaminated of the raw water where
comparing to the APHA 2017 standard, the color concentration
was higher than the limitation of the standard which estimated
as 650 Pt Co versus the standard value of 300 Pt Co as well as
COD and TSS tests which indicated to the over range value
comparing with the Malaysian Environmental Quality (Sewage
and Industrial Effluents) Regulations (EQA, 1979) standard
507 vs 100 mg/L and 227 vs 100 mg/L. It is revealed that the
independent factors exhibited high efficiency in the removal of
color (y1), COD (Y2), turbidity (Y3), and TSS (Y4) of printing
ink wastewater sample which estimated by 93.36, 82.52, 96.83,
and 99.56% respectively at the optimal run which were
obtained by combination of a fixed pH value (X1) of 4, iron
chloride dosage (X2) of 2.72 g/L, mixing time (X3) f 3 min and
mixing speed (X4) of 30 rpm. According to the obtained results
in the current study, the pH (X1) and iron chloride dosage (X2)
factors were effected strongly on removal efficiency of the all
responses (P-value <0.05). Mixing time (X3) was unaffected
factor in the current study where according to the ANOVA
analysis there is no effects of the mixing time on the removal
efficiency (P-value >0.05). While the mixing speed factor (X4)
had indirect effects (quadratic effect) on the removal of COD
only. The obtained results of the current study may indicate
that the coagulation process does not significantly affect the
removal efficiency of the all responses.
Acknowledgements
The research was supported by Ministry of Higher
Education Malaysia (MOHE) for providing the Fundamental
Research Grant Scheme (FRGS) with reference code: (Ref:
FRGS/1/2019/WAB05/UTHM/02/5) as financial support for
this research project.
References
Amal, G. A., Tawfik, M. M., & Hassanein, M. S. (2011). Foliar
feeding of potassium and urea for maximizing
wheat productivity in sandy soil. Australian
Journal of Basic and Applied Sciences, 5, 1197-1203.
Al-Sahari, M., Al-Gheethi, A. A. S., & Mohamed, R. M. S. R.
(2020). Natural coagulates for wastewater treatment;
A review for application and mechanism. In A. Al-
Gheethi, R. R. Mohamed, E. Noman, & A. M.
Kassim (Eds.), prospects of fresh market wastes
management in developing countries. Water science
and technology library (Volume 92). Cham.
Switzerland: Springer. doi:10.1007/978-3-030-4264
1-5_2
American Public Health Association, American Water Works
Association, and Water Environment Federation.
(2017). Standard methods for the examination of
water and wastewater. Washington, DC: American
Public Health Association.
Anijiofor, S. C., Daud, N. N. N., Idrus, S., & Man, H. C.
(2018). Recycling of fishpond wastewater by
adsorption of pollutants using aged refuse as an
alternative low-cost adsorbent. Sustainable
Environment Research, 28(6), 315-321.
Ashtekar, V. S., Bhandari, V. M., Shirsath, S. R., Jolhe, P. S.,
& Ghodke, S. (2014). Dye wastewater treatment:
Removal of reactive dyes using inorganic and
organic coagulants. I Control Pollution, 30(1).
Table 5. The best operating for removal color, COD, turbidity and TSS using iron chloride
Responses X1 X2 X3 X4 Experimental result
Tested Predicted Error %
y1 4 2.72 3 30 91.89 93.36 1.57
y2 4 2.72 3 30 85.40 82.52 3.49
y3 4 2.72 3 30 98.36 96.83 1.56
y4 4 2.72 3 30 98.66 99.56 0.91
y1 (Color removal %), y2 (COD removal, %), y3 (Turbidity removal, %), y4 (TSS removal), X1(pH value), X2 Iron chloride dosage, g/L), X3
(Mixing time, min), X4 (Mixing speed, rpm

M. J. Abbas et al. / Songklanakarin J. Sci. Technol. 43 (4), 1094-1102, 2021 1101
Assadi, A., Nateghi, R., Bonyadinejad, G. R., & Amin, M. M.
(2013). Application of coagulation process reactive
blue 19 dye removal from textile industry
wastewater. International Journal of Environmental
Health Engineering, 2(1), 5.
Aziz, H. A., Alias, S., Assari, F., & Adlan, M. N. (2007). The
use of alum, ferric chloride and ferrous sulphate as
coagulants in removing suspended solids, colour
and COD from semi-aerobic landfill leachate at
controlled pH. Waste Management and Research,
25(6), 556-565.
Bhayani, R. B. (2014). Color Removal of dyes wastewater by
coagulation and microfiltration processes (Doctoral
dissertation, Cleveland State University, Cleveland,
OH).
Bhuiyan, M. R., Rahman, M. M., Shaid, A., Bashar, M. M., &
Khan, M. A. (2016). Scope of reusing and recycling
the textile wastewater after treatment with gamma
radiation. Journal of Cleaner Production, 112,
3063-3071.
Crini, G., & Lichtfouse, E. (2019). Advantages and
disadvantages of techniques used for wastewater
treatment. Environmental Chemistry Letters, 17(1),
145-155.
Environmental Quality Act. (1974). Environmental quality act
under the environmental quality (sewage and
industrial effluents) regulations (EQA), 1979,
regulations 8 (1), 8 (2) and 8 (3). Retrieved from
https://www.span.gov.my/document/upload/p9tEiK
2zpNaAu3QkfEx7qER6Dpu1g0JB.pdf
Farajnezhad, H., & Gharbani, P. (2012). Coagulation
treatment of wastewater in petroleum industry using
poly aluminum chloride and ferric
chloride. International Journal of Research and
Reviews in Applied Sciences, 13(1), 306-310.
Gupta, V. K., Moradi, O., Tyagi, I., Agarwal, S., Sadegh, H.,
Shahryari-Ghoshekandi, R & Garshasbi, A. (2016).
Study on the removal of heavy metal ions from
industry waste by carbon nanotubes: effect of the
surface modification: a review. Critical Reviews in
Environmental Science and Technology, 46(2), 93-
118.
Hassaan, M. A., El Nemr, A., & Madkour, F. F. (2017).
Testing the advanced oxidation processes on the
degradation of Direct Blue 86 dye in
wastewater. The Egyptian Journal of Aquatic
Research, 43(1), 11-19.
Holkar, C. R., Pandit, A. B., & Pinjari, D. V. (2014). Kinetics
of biological decolorisation of anthraquinone based
Reactive Blue 19 using an isolated strain of
Enterobacter sp. F NCIM 5545. Bioresource
Technology, 173, 342-351.
Irfan, M., Butt, T., Imtiaz, N., Abbas, N., Khan, R. A., &
Shafique, A. (2017). The removal of COD, TSS and
colour of black liquor by coagulation–flocculation
process at optimized pH, settling and dosing
rate. Arabian Journal of Chemistry, 10, S2307-
S2318.
Khehra, M. S., Saini, H. S., Sharma, D. K., Chadha, B. S., &
Chimni, S. S. (2006). Biodegradation of azo dye CI
Acid Red 88 by an anoxic–aerobic sequential
bioreactor. Dyes and Pigments, 70 (1), 1-7.
Kumar, S. S., & Bishnoi, N. R. (2017). Coagulation of landfill
leachate by FeCl3: Process optimization using Box–
Behnken design (RSM). Applied Water Science,
7(4), 1943-1953.
Luo, Y., Guo, W., Ngo, H. H., Nghiem, L. D., Hai, F. I.,
Zhang, J., & Wang, X. C. (2014). A review on the
occurrence of micropollutants in the aquatic
environment and their fate and removal during
wastewater treatment. Science of Total
Environment, 473, 619-641.
Madhav, S., Ahamad, A., Singh, P., & Mishra, P. K. (2018). A
review of textile industry: Wet processing,
environmental impacts, and effluent treatment
methods. Environmental Quality Management,
27(3), 31-41.
Moghaddam, S. S., Moghaddam, M. A., & Arami, M. (2010).
Coagulation/flocculation process for dye removal
using sludge from water treatment plant:
optimization through response surface
methodology. Journal of Hazardous Materials, 175
(1-3), 651-657.
Mohamed, A. Y. A., Siggins, A., Healy, M. G., Ó
hUallacháin, D., Fenton, O., & Tuohy, P. (2020).
Appraisal and ranking of poly-aluminium chloride,
ferric chloride and alum for the treatment of dairy
soiled water. Journal of Environmental Manage
ment, 267,110567.
Noman, E., Al-Gheethi, A. A., Talip, B., Mohamed, R., &
Kassim, A. H. (2019). Mycoremediation of Remazol
Brilliant Blue R in greywater by a novel local strain
of Aspergillus iizukae 605EAN: optimisation and
mechanism study. International Journal of
Environmental Analytical Chemistry, 1-19.
Noman, E., Al-Gheethi, A., Talip, B. A., Mohamed, R. &
Kassim, A.H., (2020). Decolourization of dye
wastewater by a malaysian isolate of Aspergillus
iizukae 605EAN Strain: A biokinetic, mechanism
and microstructure study. International Journal of
Environmental Analytical Chemistry, 1-24.
Papić, S., Koprivanac, N., Božić, A. L., & Meteš, A. (2004).
Removal of some reactive dyes from synthetic
wastewater by combined Al (III) coagulation/carbon
adsorption process. Dyes and Pigments, 62(3), 291-
298.
Paz, A., Carballo, J., Pérez, M. J., & Domínguez, J. M.
(2017). Biological treatment of model dyes and
textile wastewaters. Chemosphere, 181, 168-177.
Ramli, S. F., & Abdul Aziz, H. (2015). Use of ferric chloride
and chitosan as coagulant to remove turbidity and
color from landfill leachate. Applied Mechanics and
Materials, 773, 1163-1167).
Ranganathan, K., Karunagaran, K., & Sharma, D. C. (2007).
Recycling of wastewaters of textile dyeing
industries using advanced treatment technology and
cost analysis-case studies. Resources, Conservation
and Recycling, 50(3), 306-318.
Šekuljica, N. Ž., Prlainović, N. Ž., Stefanović, A. B., Žuža, M.
G., Čičkarić, D. Z., Mijin, D. Ž., & Knežević-
Jugović, Z. D. (2015). Decolorization of
anthraquinonic dyes from textile effluent using
horseradish peroxidase: Optimization and kinetic
study. The Scientific World Journal, 2015.

1102 M. J. Abbas et al. / Songklanakarin J. Sci. Technol. 43 (4), 1094-1102, 2021
Sivarajasekar, N., & Baskar, R. (2015). Agriculture waste
biomass valorisation for cationic dyes sequestration:
A concise review. Journal of Chemical and Pharma
ceutical Research, 7(9), 737-48.
Solís, M., Solís, A., Pérez, H. I., Manjarrez, N., & Flores, M.
(2012). Microbial decolouration of azo dyes: A
review. Process Biochemistry, 47(12), 1723-1748.
Stephenson, R. J., & Duff, S. J. (1996). Coagulation and
precipitation of a mechanical pulping effluent—I.
Removal of carbon, colour and turbidity. Water
Research, 30(4), 781-792.
Verma, A. K., Dash, R. R., & Bhunia, P. (2012). A review on
chemical coagulation/flocculation technologies for
removal of colour from textile wastewaters. Journal
of Environmental Management, 93 (1), 154-168.
Verma, P., & Madamwar, D. (2005). Decolorization of azo
dyes using Basidiomycete strain PV 002. World
Journal of Microbiology and Biotechnology, 21(4),
481-485.
Wong, P. W., Teng, T. T., & Norulaini, N. A. R. N. (2007).
Efficiency of the coagulation-flocculation method
for the treatment of dye mixtures containing
disperse and reactive dye. Water Quality Research
Journal, 42(1), 54-62.
Zayneb, C., Lamia, K., Olfa, E., Naïma, J., Grubb, C. D.,
Bassem, K. & Amine, E. (2015). Morphological,
physiological and biochemical impact of ink
industry effluent on germination of maize (Zea
mays), Barley (Hordeum vulgare) and Sorghum
(Sorghum bicolor). Bulletin of Environmental
Contamination and Toxicology, 95(5), 687-693.