Coagulation d'un latex de caoutchouc naturel
177
HAL Id: tel-03104598 https://tel.archives-ouvertes.fr/tel-03104598v2 Submitted on 12 Jun 2021 HAL is a multi-disciplinary open access archive for the deposit and dissemination of sci- entific research documents, whether they are pub- lished or not. The documents may come from teaching and research institutions in France or abroad, or from public or private research centers. L’archive ouverte pluridisciplinaire HAL, est destinée au dépôt et à la diffusion de documents scientifiques de niveau recherche, publiés ou non, émanant des établissements d’enseignement et de recherche français ou étrangers, des laboratoires publics ou privés. Coagulation d’un latex de caoutchouc naturel - noir de carbone / silice : suivi de l’évolution nanostructurale d’une suspension colloïdale à un composite d’élastomère Gianluca Cattinari To cite this version: Gianluca Cattinari. Coagulation d’un latex de caoutchouc naturel - noir de carbone / silice : suivi de l’évolution nanostructurale d’une suspension colloïdale à un composite d’élastomère. Material chemistry. Université Paris-Saclay, 2020. English. NNT: 2020UPASF009. tel-03104598v2
-
Upload
khangminh22 -
Category
Documents
-
view
3 -
download
0
Transcript of Coagulation d'un latex de caoutchouc naturel

HAL Id: tel-03104598https://tel.archives-ouvertes.fr/tel-03104598v2
Submitted on 12 Jun 2021
HAL is a multi-disciplinary open accessarchive for the deposit and dissemination of sci-entific research documents, whether they are pub-lished or not. The documents may come fromteaching and research institutions in France orabroad, or from public or private research centers.
L’archive ouverte pluridisciplinaire HAL, estdestinée au dépôt et à la diffusion de documentsscientifiques de niveau recherche, publiés ou non,émanant des établissements d’enseignement et derecherche français ou étrangers, des laboratoirespublics ou privés.
Coagulation d’un latex de caoutchouc naturel - noir decarbone / silice : suivi de l’évolution nanostructurale
d’une suspension colloïdale à un composite d’élastomèreGianluca Cattinari
To cite this version:Gianluca Cattinari. Coagulation d’un latex de caoutchouc naturel - noir de carbone / silice : suivide l’évolution nanostructurale d’une suspension colloïdale à un composite d’élastomère. Materialchemistry. Université Paris-Saclay, 2020. English. �NNT : 2020UPASF009�. �tel-03104598v2�

Natural rubber latex-carbon black/silica
coagulation: following the
nanostructure evolution from a
colloidal suspension to an elastomeric
composite
Thèse de doctorat de l'université Paris-Saclay
École doctorale n° 571, Sciences chimiques : Molécules, Matériaux, Instrumentation et
Biosystèmes (2MIB)
Spécialité de doctorat : Chimie
Unité de recherche : Université Paris-Saclay, CNRS, Institut des Sciences Moléculaires
d'Orsay, 91405, Orsay, France.
Référent : Faculté des sciences d’Orsay
Thèse présentée et soutenue à Orsay, le 25/09/2020, par
Gianluca CATTINARI
Composition du Jury
Bertrand POUMELLEC
Directeur de recherche (HDR), CNRS,
Université Paris-Saclay
Président
Karim BENZERARA
Directeur de recherche (HDR), CNRS,
Sorbonne Université
Rapporteur & Examinateur
Julian OBERDISSE
Directeur de recherche (HDR), CNRS,
Laboratoire Charles Coulomb
Rapporteur & Examinateur
Michel CLOITRE
Directeur de recherche (HDR), CNRS, ESPCI
Examinateur
Catherine GAUTHIER
Professeur, INSA de Lyon, Michelin R&D
Examinatrice
Marie-Pierre FONTAINE-AUPART
Directeur de recherche, CNRS, U. Paris-Saclay
Directrice de thèse
Karine STENKEESTE
Maitre de conférences, U. Paris-Saclay
Co-Encadrante
Marc COUTY
Michelin R&D
Matthieu GALLOPIN
Michelin R&D
Co-Encadrant
Co-Encadrant
Th
èse
de d
oct
ora
t N
NT : 2
020U
PA
SF
009


Acknowledgments
First of all, it is a real pleasure to thank all the people directly involved in this project.
I will start by expressing my deepest gratitude to Dr. Fontaine-Aupart, my PhD supervisor, for always
being there and for always trying to understand. Discussion has been constant from the beginning till
the end and I have really appreciated it.
I would also like to thank the Michelin coordinators of the project: Dr. Mattheiu Gallopin for his
positive attitude during discussions and for his creativity which pushed me to perform more and more
experiments, and Dr. Marc Couty for his general supervision and guidance.
I would like to thank Dr. Karine Steenkeste for returning in moments of need and for having checked
very carefully every scientific documents I sent her.
My deepest gratitude goes also to Alexis Canette for his skills in electron microscopy and his sixth-
sense when it comes down to create new protocols. Thank you for the time spent in front of the
microscope!
Healthful thanks goes to Dr. Ludivine Houel Renault, for the support in the CPBM chemistry room
and for listening to me during numerous coffee breaks.
I would also like to express my gratitude to all the collaborators which enrich my work with their
significance contribution. The group of Sandrine Leveque-Fort and his students, comprising Dr.
Clement Cabriel, Pierre Jouchet, and Adrien Mau for helping me through all my endless super-
resolution fluorescence experiments. A thank goes also to the Abbelight team for their quick optical
and informatics development that facilitated some of my experiments. Many thanks go to Dr. Ariane
Deniset for her expertise in AFM-IR, for her help during data treatment and for her cooperation.
Another big thanks goes to Catherine le Bris for her engineering skills and her willingness to help.
A huge thank goes to my lab-mates and friends Seray Ural and Joanna Christodoulou for their dose of
fun and good vibes during endless days spent in the laboratory.
These acknowledgements would not be complete without thanking the closest people with whom I
shared the struggles and joys during this experience: Dr. Luca Polacchi, Dr. Ricardo Garcia de Castro
and Dr. Ivan Pacheco Bubi.

List of abbreviations
AFM Atomic Force Microscopy
AFM-IR Atomic Force Microscopy coupled InfraRed spectroscopy
BSE BackScattered Electrons
CB Carbon Black
CLSM Confocal Laser Scanning Microscopy
DBSCAN Density Based Spatial Clustering of Application with Noise
DONALD Direct Optical Nanoscopy with Axial Localized Detection
DPNR DeProteinized Natural Rubber
d-STORM Direct Stochastic Optical Reconstruction Microscopy
EM Electron Microscopy
E-SBR Emulsion Styrene Butadiene Rubber
FESEM Field Emission Scanning Electron Microscopy
FTIR Fourier Transformed InfraRed spectroscopy
Hilo Highly Inclines Laminated Optical sheets
IC Internal Conversion
IR InfraRed
ISC InterSystem Crossing
LRPs Large Rubber Particles
NMR Nuclear Magnetic Resonance
NR Natural Rubber
PAINT Points Accumulation for Imaging in Nanoscale Topography
PALM Photo-Activated Localization luorescence Microscopy
PM Photonic Microscopy
PSF Point Spread Function
REF Rubber Elongation Factor
SE Secondary Electrons
SEM Scanning Electron Microscopy
Si Silica
SIM Structured Illumination Microscopy
SMLM Single Molecule Localization Microscopy
SPM Scanning Probe Microscopy
SRPs Small Rubber Particles
SRPP Small Rubber Particle protein
S-SBR Solution Styrene Butadiene Rubber
SR Synthetic Rubber

STED Stimulated Emission Depletion
TEDPNR TransEsterified Deproteinized Natural Rubber
TEM Transmission Electron Microscopy
TIRF Total Internal Reflection Fluorescence

Table of contents
General Introduction to the manuscript………………………………………………………1
Chapter 1: Introduction to natural rubber and its association with fillers………………………3
Chapter 2: Imaging methods for structural characterization of polymer composites:
focus on FESEM, d-STOR and AFMIR………………………………………………………..41
Chapter 3: Natural rubber – carbon black coagulation: following the nanostructure evolution
from a colloidal suspension to an elastomeric composite…………………………………….83
Chapter 4: Natural rubber-silica coagulation: structural characterization and evolution towards
an elastomeric composite……………………………………………………………………...109
Conclusions and Perspectives……………………………………………………………….165

1
General introduction to the manuscript
Natural rubber (NR) latex extracted from Hevea brasiliensis is known to be used for the preparation
of a variety of materials, showing some advantages in comparison to its synthetic counterpart. In ad-
dition to the rubber, reinforcing fillers are considered essential for every formulation, to increase me-
chanical properties of a polymer matrix. Several strategies have been proposed to mix NR and fillers.
Among the different methods, the liquid mixing process is central for MICHELIN innovation strategy.
This method first consists of mixing an aqueous suspension of fillers (silica or carbon black) with
elastomers in the form of latex to obtained a coagulum, which is subsequently dried. If the technolog-
ical process parameters are under control at the engineering level, the fundamental knowledge of the
hetero-aggregation mechanism as well as the structural characterization and evolution of the coagulum
along drying are unknown. The context of the study as well as its novel character are better discussed
and detailed throughout chapter 1, where a state of the art on composite material made of NR and
fillers is first introduced.
The fillers used for the study are both silica (Si) and carbon black (CB). Each of them were separately
mixed with NR latex to obtain a binary colloidal suspension and its resulting coagulum. For both, we
investigated on (i) the formation and the structural evolution dynamic of the obtained NR-CB or NR-
Si coagulum, as well as (ii) the role of external physical stress (shear and/or sonication). Additionally,
in case of NR-Si system, the spatial distribution of proteins and lipids of NR at different stages of the
process, and their localization in respect to Si fillers was also explored. For this purpose, a multimodal
microscopy approach was developed combining Field Emission Scanning Electron Microscopy
(FESEM), direct stochastic optical reconstruction microscopy (d-STORM) as super resolution fluores-
cent microscopy technique and Atomic Force Microscopy coupled to Infra-Red spectroscopy (AFM-
IR). These techniques and their original application to our study are reviewed in chapter 2.
The obtained results and related discussions are presented in the form of scientific publications inserted
in the manuscript. Chapter 3 is devoted to the study concerning NR latex-CB mixing, while chapter
4 refers to the investigation on NR latex-Si system. In both cases our work is a substantial contribution
in the understanding of an elastomeric composite formation obtained via hetero-aggregation of a binary
NR-filler colloidal suspension. We believe that our investigation might open up new ways to exploit
and improve the liquid mixing process as discussed in Conclusions and Perspectives of this
manuscript.

2

3
CHAPTER 1: Introduction to natural rubber and its
association with fillers

4
Chapter 1: Introduction to natural rubber and its
association with fillers
Natural rubber (NR) is a bio-based product largely used in the production of a variety of materials.
In most applications, NR is coupled with fillers, to improve the mechanical response of the
obtained composite or nanocomposite. This chapter aims first at giving a very brief introduction
to the field of elastomer-based nanocomposite. Subsequently, we specifically focused on NR,
which is the main raw material used in this study. Its mixing with particulate fillers such as carbon
black (CB) and silica (Si) is also described. Lastly, the knowledge gap and main objective of our
study are also reported.
1. A world of nanocomposites: focus on elastomer based composites
Historically, the development and advancement of societies have been intimately related to materials
and their innovations. In fact, many technologies that make people’s life more comfortable are closely
related to materials.
The twenty-first century has witnessed a tremendous upsurge in the field of nanomaterials and
nanotechnology. By the use of nanotechnology, we can obtain structures with new characteristics
attributable to their nanometer dimensions. One of the most growing fields in this domain concerns
the nanocomposite research and production1. By definition, a nanocomposite is a matrix to which
nano-objects have been added to improve particular properties of the material. The matrix is a
continuous phase and it includes metals, inorganic non-metallic matrices and polymer matrices. The
term nano-object refers to a discontinuous phase made up of particles, sheets (e.g. exfoliated clay
stacks) or fibers having at least one dimension in the nanometer range. These nano-scale objects are
also known by the term of fillers. The properties of nanocomposites have caused researchers and
companies to consider using these materials in several fields, ranging from consumer’s electronics to
automotive industry, packaging and so on2–4.
In addition to being of technological importance, the subject of nanocomposite is a fascinating area of
interdisciplinary research. As a matter of facts nanocomposites possess unique physical, chemical,
optical, mechanical, magnetic and electrical properties. Thus, research in the field of nanocomposite
material spreads over a wide range of scientific subjects. While industry is seeking materials to meet
difficult challenges with unique properties, there is no “rule of mixture” to identify how to mix multiple
nanomaterials in the matrix to achieve all the required properties.
Among the different types of nanocomposite, a particular class refers to elastomer based
nanocomposite. This type of materials are a complex multicomponent systems whose properties
depend on the type of elastomer (or mixtures of elastomers) as well as on the type of fillers5. The word
“elastomer” derives from two words, elastic (describing the ability of a material to extend and return
to its original shape when a load is removed) and mer (from polymer, in which poly means many and
mer means part). Therefore, an elastomer is a polymer with the property of “elasticity,” generally
having notably low Young’s modulus6. Elastomers are one of the most applicable materials in science

5
Chapter 1: Introduction to natural rubber and its
association with fillers
and technology, due to their the high level of flexibility, mechanical strength etc.7. The most common
example of elastomers refers to rubber-like materials, with their ability to return to their original
configuration when a certain stress is removed. In fact, the term “elastomer” is often used
interchangeably with the word “rubber”. Thus, the association of rubber polymers with a discontinuous
phase of fillers gives rise to an elastomeric-based composite material. Over the past two decades, with
the development and introduction of fillers in polymer systems, elastomer-based composites are
entering a new era of nanostructured polymeric systems. To classify an elastomer-based composite as
nanostructured, at least one of its phase should be in nanosized regions. Obviously, in the case of
elastomer-based composites this phase is the filler. Carbon based nano-fillers like carbon nanotubes,
graphene and graphitic derivatives, inorganic fillers like nanosilica, nanometal particles and nanoclays,
bio-nanofillers such as cellulose, starch and chitin etc. are a few of the fillers having nano dimension
imparting reinforcement for the elastomer based systems7. Please note that those are just a few of the
fillers used in combination with elastomers, we will further focus on the ones specifically used in this
study (subsection 3.2).
In terms of use, the principal commercial elastomers are listed in Table 1, together with their related
application field. Tyre manufacturing is the most significant application of elastomeric based
nanocomposite materials. Other applications include the railway industry and numerous mechanical,
civil, electronics sectors. Furthermore, the production of rubber goods has also great importance:
various belts, pipes, hoses and so forth. The development of conductive rubbers obtained by formation
of interconnected charge carried paths in the dielectric rubber matrix by loading it with conductive
filler significantly widens the applicability of elastomers nanocomposites extending it to sensor based
materials, transducers, electromagnetic shielding and so on8.
Table 1.1. Principal commercial elastomers, related properties and applications7.
Polymer type Glass transition
temperature (°C)
Melting
temperature(°C)
Applications
Natural Rubber (NR) -70 / Tires, gloves, adhesives
(cis)-Polyisoprene -70 35 Tires, springs, shoes,
adhesives
Styrene-butadiene -60 / Tire treads, adhesives,
belts
(cis)-Polybutadiene -100 5 Tire treads, shoes,
conveyor belts
6
Chapter 1: Introduction to natural rubber and its
association with fillers
Acrylonitrile-
butadiene (nitrile
rubber)
-50 to -25 / Fuel hoses, gaskets,
rollers
Isobutylene-isoprene
(butyl rubber)
-70 -5 Window strips
Ethylene-propylene
monomer (EPM),
ethyliene- propylene
diene (EPDM)
-55 / Electrical insulation
Polychloprene
(neoprene)
-50 25 Hoses, belts, springs,
wetsuit and aquatic
sports equipment
Polysulfide (Thiokol) -50 / Seal, gaskets, rocket
propellants
Polydimethyl siloxane
(silicone)
-125 -50 Seal, gaskets, surgical
implants
Polyethylene -70 / O-rings, seal, gaskets
Styrene-butadiene-
styrene (SBS)
-60 / Automotive parts, shoes,
adhesives
Fluoroelastomer -10 / O-rings, seal, gaskets
Polyacrylate -15 to -40 / Hoses, belts, seals,
coated fabric
Natural Rubber (NR) is a particular type of elastomer, and it distinguishes itself by the other polymer
types which refer to Synthetic form of Rubber (SR). NR is an elastomer of natural origin derived from
a milky colloidal suspension obtained from the sap of particular botanical families of some plants
(Euphorbiaceae, Apocynaceae, Asclepiadaceae, Asteraceae, Moraceae, Papaveraceae and
Sapotaceae9). Such colloidal suspension is called NR latex. On the other hand, the production of SRs
is prompted by cheap and relatively constant supplies of petrochemical feedstock. Based on
technological properties, both NR and SR, which have their own merits, will be used continuously by
the rubber industries. Inevitably, oil and gas resources are depleting, thus biofeedstocks for synthesis
of SRs or substitution of SRs by NR, or chemically modified NR with equivalent properties may be
the future direction of the research and development highlighting the importance of studies on NR.
This particular elastomer constitutes the polymer matrix for our study. Therefore, the following
sections are devoted to an introduction to the origin and characteristics of NR.

7
Chapter 1: Introduction to natural rubber and its
association with fillers
2. Natural rubber
2.1. An overview of natural rubber
NR is one of the most important raw material of biological origin. Hevea brasiliensis commonly called
“rubber tree” is the most economically important latex source for the NR industry. The plant was
originally discovered in Amazonia, but nowadays the NR plantations are mainly concentrated all over
Southeast Asia. As a matter of facts, the global production of NR amounted to 13,7 million tons in
2018, and the quantity produced in Asia is over 88%, with Thailand and Indonesia being the two first
world producers (Figure 1.1).
Figure1.1. World NR production in 2018, source SIPH (Société Internationale de Plantations
d'Hévéas).
After five or six years from plantation the rubber tree is normally ready to produce the NR latex. The
process of extraction of NR is called tapping, and it consists of wounding the bark of the Hevea tree.
When the bark is cut, a milky liquid exudes from the wound: this product is commonly named NR
latex or field NR latex. It is known that this product accumulates in the laticifiers cells, but its role in
the plant is not well understood. It is likely to play a role in the defense mechanisms since it also
accumulates high levels of transcripts from plant defense – or stress related genes and hydrolytic
enzymes10.
In terms of composition, the out-coming field NR latex is a complex colloidal dispersion, with density
varying between 0.97 and 0.98 g * cm-3, and it contains particles ranging from several nm to several
microns dispersed in a cytoplasmic serum (C-serum). It is constituted by NR globules (also called NR
particles) ranging from 100 nm to 1000 nm, lutoids with size from 2 to 5 µm, and Frey –Wyssling

8
Chapter 1: Introduction to natural rubber and its
association with fillers
particles of 5-6 µm (Figure 1.2)11. Rubber globules are spherical or pear-shaped core-shell particles
containing cis-1,4 polyisoprene surrounded by a bio-membrane, while lutoids are complex lysosomal
vacuoles. In terms of composition, NR latex mostly comprises cis-1,4 polyisoprene (~30-35 wt%)
contained in the core of rubber globules, and non-polymeric substances such as proteins, lipids, sugars,
minerals (~ 5 wt%), and water (~ 60%). It is difficult to summarize an exact composition of a freshly
extracted latex since it depends on the season of the year for the extraction and age of the tree, but a
typical composition is displayed in Table 1.2
Table 1.2. Composition of freshly tapped NR Latex11. These are only approximate values and are
dependent on the clone, season and physiological status of the tree.
Compound wt%
Rubber (polyisoprene) 36,0
Proteins and nitrogen related molecules 1,7
Lipids 1,6
Ashes 0,5
Inositol and carbohydrates 1,6
Water 58,6
Once extracted, NR latex can be kept in the liquid state or transformed in solid NR. The solid state is
obtained either by controlled coagulation or by natural coagulation (the latex coagulates naturally in
the cup). The first one is made by addition of a weak acid such acetic acid or formic acid. On the other
hand, the natural coagulation results from the action of microbial communities present in the latex.
Micro-organisms in fresh latex of H. brasiliensis have been mainly studied from 1930 to 1975, and
their activities during latex coagulation were indeed rapidly linked with evolutions of the physical
properties of the latex. To avoid the natural aggregation and to allow collection and storage of NR latex
in its liquid state, addition of ammonia (NH3) is necessary in order to rise the pH of the suspension
(pH~10). The addition of ammonia inhibits bacterial growth and influences the composition of the
latex by hydrolyzing a part of the proteins and lipids. Such hydrolysation process increases the stability
of the product12. `

9
Chapter 1: Introduction to natural rubber and its
association with fillers
Figure 1.2. Particles contained in NR latex. (A) Picture of a cup of freshly extracted NR latex. (B)
Schematic view of the latex at the mesoscale showing lutoids, rubber particles and Frey-Wyssling
particles dispersed in the aqueous serum. (C) Schematic views of the major constituents of latex at
the microscale: a lutoid and a rubber particle11.
It is uneconomical to transport the preserved field NR latex over long distances. The normal procedure
is to concentrate it to about 60% in cis-1,4 polyisoprene. The mainly used concentration processes are
centrifugation, creaming, evaporation, and electrodecantation methods. Among these, the
centrifugation is the most popular one. When field NR latex is subjected to centrifugation, it separates
into four main fractions based on their densities: an upper layer which is a milky colloidal suspension
constituted of only NR globules, a thin yellowish layer containing Frey-Wyssling particles, an aqueous
phase called serum or C-serum and a bottom fraction composed of sediments of lutoid particles. Thus,
keeping only the uppermost fraction, the NR globules are isolated from other components and the latex
is concentrated: it is then commonly called high ammoniated NR latex or concentrated NR latex. A
comparison of the composition of field NR latex with high ammoniated NR latex is displayed in Table
1.3.

10
Chapter 1: Introduction to natural rubber and its
association with fillers
Table 1.3. Comparison of field NR latex and high ammoniated (concentrated) latex obtained from
centrifugation13. These are only approximate values and are dependent on the clone, season and
physiological status of the tree.
Component Field NR latex (%w/w) High ammoniated NR latex
(%w/w)
Rubber (polyisoprene) ~33-35% 60%
Water 60% 38%
Proteins, amino acids 1,5% 1%
Lipids 1,5% 1%
Other components (metals,
carbohydrates, etc.)
1-2% /
To simplify the system involved in our study, we chose to eliminate non-NR globule components from
field NR latex. Thus, we mainly used high ammoniated NR latex for our experiments.
2.2. Natural rubber globules
In this subchapter we will discuss some general aspects concerning the overall microstructure and size
of NR globules.
Interestingly, NR globules exhibit a bimodal size distribution, differentiating between Small Rubber
Particles (SRPs) and Large Rubber Particle (LRPs)14,15. SRPs have diameter ranging from 100 nm to
500 nm, while LRPs have diameters comprised between 500 nm and 1000 nm. The detailed size
distribution of the NR latex used for our experiments will be presented in chapter 4.
Rubber particles are of a core-shell type. The core consists in polyisoprene chains while the shell is a
complex biomembrane made of lipids and proteins. 1839 different types of proteins were identified in
rubber particles, with a range in relative molecular mass of 3.9–194.2 kDa and in isoelectric point
values ranging between 4.0–11.216. Two of these proteins are present in major quantity: the Rubber
Elongation Factor (REF, 14kDa) and the Small Rubber Particle Protein (SRPP, 20kDa)17. Berthelot et
al. 18 reported that the nature and organization of the membrane depends on the size of the rubber
particle. SRPP is usually present in SRPs membrane, while REF is found mostly on LRPs. Two
different models of REF and SPRP were proposed. The difference in their hydrophobic nature is
believed to play a role in their interaction with lipids in the biomembrane: REF has thus shown stronger
binding insertion in comparison to SRPP (Figure 1.3a). On the other hand, lipids adsorbed on the
surface of the globules have been classified into: neutral lipids, glycolipids and phospholipids. The
neutral lipids comprised triglycerides. The glycolipids consisted mainly of free and esterified steryl
glucosides, mono-galactosyl and digalactosyl diglycerides. Additionally, the main class of
phospholipids present on the surface of the NR globules are phosphatidylcholines and

11
Chapter 1: Introduction to natural rubber and its
association with fillers
phosphatidylethanolamine lecithines. As in the case of proteins, the content of lipids in LRPs and SRPs
also differs. The result of Chan et al19 indicate that there are more lipids in LRPs than in SRPs.
Figure 1.3. (a) Models illustrating the Small Rubber Particle Protein (SRPP) (light blue) and the
Rubber Elongation Factor (REF) (dark blue) distribution in small rubber particles (left) and large
rubber particles (right). (b) Latest proposed model of organizations of proteins and lipids in bio-
membrane consisting of a protein-rich layer with a typical thickness of δ1 = 3.5 nm and a second layer
containing hydrophilic heads of the lipids in contact with solution having very small thickness δ1 = 0.6
nm.
Although the nanoscale morphology of the shell still remains controversial, several possible scenarios
have emerged on the proteins and lipids arrangement. First a double layer arrangement in which an
inner layer of lipids resides beneath a protein layer was proposed20. This derives from the fact that the
principal phospholipids of the NR latex are of the lecithin type and they are strongly adsorbed on to
the surfaces of the rubber particles. They are thought to be intermediaries by which the proteins are
anchored on to the rubber particles. The adhesion between the proteins and the adsorbed lecithin has
been accounted for the fact that the pH of fresh latex is neutral before addition of ammonia. The lipid
layer carries a slight overall positive charge, whereas the proteins, being on the alkaline side of their
iso-electric point are negatively charged, so that ionic interaction between the two layers is possible.
Secondly a mixed monolayer composition was also proposed in the literature by Nawamawat et al21,
arguing that such a layer is composed of 84% proteins and 16% lipids by using phase contrast images
of AFM and confocal fluorescence microscopy.

12
Chapter 1: Introduction to natural rubber and its
association with fillers
In contrast, these biomembrane organizations were recently questioned by the work of Rochette et al22.
coupling electrokinetics measurements and cryo-TEM experiments. This work proposed a new model
suggesting the presence of a protein rich layer anchored to the polyisoprene core, of ~3.5 nm, and a
very thin second layer containing the hydrophilic heads of lipids protruding towards the solvent, ~ 0.6
nm (Figure 1.3b).
The stability/flocculation behavior of NR globules is governed by the various attractive and repulsive
forces involved in colloidal systems of all types. Those important forces which are operative between
the rubber globules are:
- Electrostatic repulsive forces: it is common for colloids dispersed in water to have electric
charges on their surfaces. The origin of the surface charge can be either ionization of chemical
groups at the surface of the particles or the adsorption of charged species from the dispersion
medium at the particle surface. In the case of NR globules, the lypo-protein layer confers a
negative electric charge to the particle surfaces thereby making the latex electrostatically sta-
bilized. Electrostatic stabilization of two NR globules can be represented schematically as
given below (Figure1.4);
-
Figure 1.4. Electrostatic repulsion between NR globules in water or in ammoniated solution.
- Steric repulsive forces: this kind of stabilization is due to the presence of macromolecules or
chains which are adsorbed or bonded on the particle surface and cause the repulsion. Therefore,
if two globules get closer to each other, their hydrophilic layer will get overlapped, increasing
the concentration of these molecules in a particular region as well as increasing the osmotic
pressure. To maintain the equilibrium, the solvent will enter in the overlapping region separat-
ing the two particles.
- Solvation forces: when two colloidal particles come within nanometer distances in a liquid
solvent, the solvent can mediate a force between them. This solvation force or hydration force,
if the solvent is water is due to differences between the solvent ordering and/or density in the
gap between the particles and in the bulk liquid region around them. The solvation layer arises
from the presence of nonionic hydrophillic materials adsorbed on the particle surfaces and it is

13
Chapter 1: Introduction to natural rubber and its
association with fillers
formed by the solvent molecules surrounding either the hydrophilic heads of lipids or the hy-
drophilic part of a protein.
- Van der Waals attractive forces: the origin of these forces is the attraction between a temporary
dipole and the corresponding induced dipoles (London theory). At molecular level, these in-
teractions are quite weak with the attraction energy decreasing with the six power of the dis-
tance between the involved molecules.
Please note that, any reduction in the negative surface charge or increase in contact between the
globules could force aggregation. In particular, the addition of divalent ions and mechanical agitation
are possible ways to achieve aggregation between NR globules.
2.3. Natural rubber network and its mechanical properties
The structural arrangement and spatial organization of polyisoprene chains together with proteins and
lipids of NR changes according to the physical state (solid or liquid). Once NR is solid, the colloidal
structure of the globules is believed to be lost to give rise to the so called “natural rubber network” or
“naturally occurring network”23,24. The organization of such a network together with the overall NR
mesostructured (term used to describe dry NR macromolecular structure and gel) have first been
reported by Tanaka and Tarachwin et.al. in two successive reviews published in 200125 and 200926.
Those publications summarize about 30 years of research presenting all the links established between
the structure of the material and the known properties of NR. One of the main discoveries of Tanaka
and co-workers reported that polyisoprene chains present in solid NR consist of two trans-isoprene
units connected to a long chain of cis-isoprene units. Such polymeric chains are then substituted in α
and ω positions linking with mono or di-phosphate groups associated with phospholipids by H-bonding
at the α-terminal, whereas the ω-terminal is presumed to be modified with dimethylallyl groups linked
to proteins by H-bonding (Figure 1.5a). In this structure the biomolecules could self-assemble creating
domains of either lipids and/or proteins, forming a physical network where linear polyisoprene chains
are connected with non-rubber components through functional terminals (Figure 1.5b).
Direct confirmation of the network structure encountered tremendous difficulties, so the researchers
have tried to solve this problem by decomposing the naturally occurring network, i.e. removing
proteins from NR to prepare DeProteinized Natural Rubber (DPNR), and removing phospholipids from
DPNR to prepare TransEsterified DeProteinized Natural Rubber (TEDPNR)27.Several analytical
methods have been used to study such networking structure: the main ones refer to spectroscopy
measurements (H,C,P-Nuclear Magnetic Resonance (NMR), Fourier Transformed InfraRed
spectroscopy (FTIR), gel permeation chromatography, dielectric spectroscopy), scattering techniques

14
Chapter 1: Introduction to natural rubber and its
association with fillers
(Small-angle neutron scattering and small-angle x-ray scattering), and rheological studies. Due to the
nanoscale size of non-rubber components, the use of highly resololved imaging techniques is necessary
to explore the morphology of those compounds in such network. Only recently Wu et.al.28 were able
to describe the spatial organization of proteins and lipids in NR using a microscopy technique. More
specifically, during their work they employed direct STochastic Optical Reconstruction Microscopy
(d-STORM) in combination with measurements of solid state NMR and rheology. They confirmed the
presence of proteins and lipids aggregates physically interacting with the terminal groups of rubber
chains, which leads to the formation of a network.
Figure 1.5. (a) Structure of polyisoprene chain in NR as proposed by Tanaka et al.26. (b) Branching
points formation giving rise to the natural rubber network24.
The presence of proteins and lipids in the described network, which is believed to be responsible for
the excellent properties of NR, unsurpassed by any synthetic counterpart29. In fact, materials issued
from NR extracted from Hevea brasiliensis exhibits excellent properties, such as high tensile and tear
strength, good crack growth resistance and minimal heat buildup. The reason behind such outstanding
properties is believed to be attributed to the strain-induced crystallization phenomenon that occurs in
NR. This ability to crystallize under strain is often explained by the high regularity of the
macromolecular structure, i.e its high percentage of chains being in cis-configuration, and by the
presence of proteins and lipids in NR. Thus, the superior mechanical properties of NR over its synthetic
counterpart can be partly attributed to the presence of proteins and lipids. The origin of exact role of
proteins and lipids in terms of properties enchantment in unvulcanized NR has been studied by
Amnuaypornsri, Toki, Tanaka and Ichikawa30,31. To investigate this role, they compared the stress-
15
Chapter 1: Introduction to natural rubber and its
association with fillers
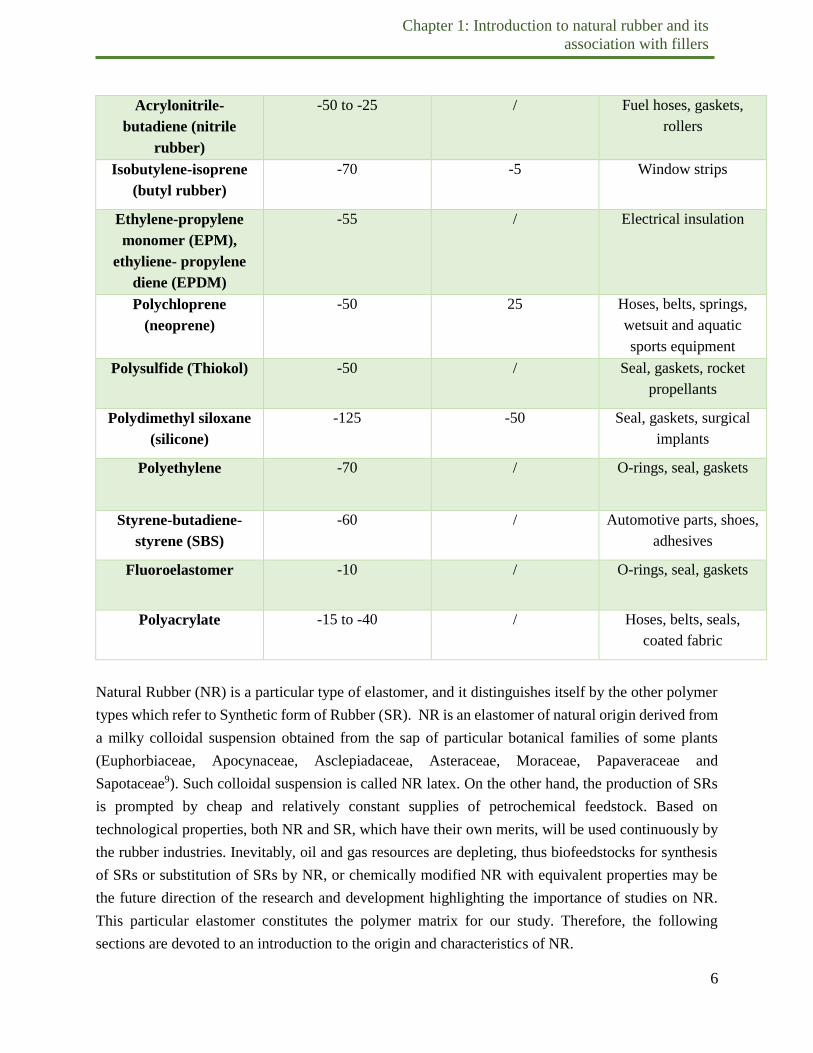
strain curves of films prepared from different types of rubber latex: high ammoniated NR latex, DPNR
latex, acetone extracted DPNR, TEDPNR, and synthetic cis-polyisoprene rubber (Figure 1.6). They
showed that the mechanical properties of highly ammoniated NR are almost equivalent after removal
of proteins. On the other hand, a significant loss was reported after transesterification, comparable to
the one of synthetic rubber.
Figure 1.6. Strain-strain curves of (A) high ammoniated NR latex, (B) DPNR obtained from
deprotenization of highly ammoniated NR latex, (C) acetone extracted DPNR, (D) transesterified
DPNR giving rise to TEDPNR and (E) synthetic cis-polyisoprene30.
Re-addition after removal of proteins and lipids was also explored. Lipase-treated DPNR (L-DPNR)
was used as starting material. Proteins and phosphatidyl coline were separately added to L-DPNR, and
stress-strain curve were measured. Results are shown in Figure 1.7 where it is interesting to note that
the curves after re-addition of proteins or phosphatidyl choline to L-DPNR did not significantly
improved the tensile properties. This finding suggested that the high tensile properties of NR are not
directly caused by the presence of proteins and lipids alone in the matrix, but it is related to the
networking structure which originates from the bonding of proteins and lipids with terminal units of
the polyisoprene chain. It is clear that simple addition of such biomolecule is not sufficient to
reconstruct the naturally occurring network.

16
Chapter 1: Introduction to natural rubber and its
association with fillers
Figure 1.7. Stress-strain curves of L-DPNR loaded with extracted proteins and/or phosphatidyl
choline30.
17
Chapter 1: Introduction to natural rubber and its
association with fillers
3. Fillers for rubber reinforcement
Despite its natural intrinsic properties, NR is rarely used in its raw form, because “too weak” to fulfil
practical requirements due to lack of hardness, strength properties and wear resistance. For this reason,
fillers are used in order to improve the properties of rubber compounds reinforcing the material. As an
example, a tire manufactured without the use of fillers will not be strong enough to withstand the stress
encountered. However, it is difficult to give a precise definition of what is reinforcement, because this
word is specifically related to a particular material and its applications. In general, reinforcement may
be defined as the addition of species giving better mechanical properties to the composite over that of
the pure polymer matrix, but what is expected as mechanical properties is very different considering
the different matrices and applications.
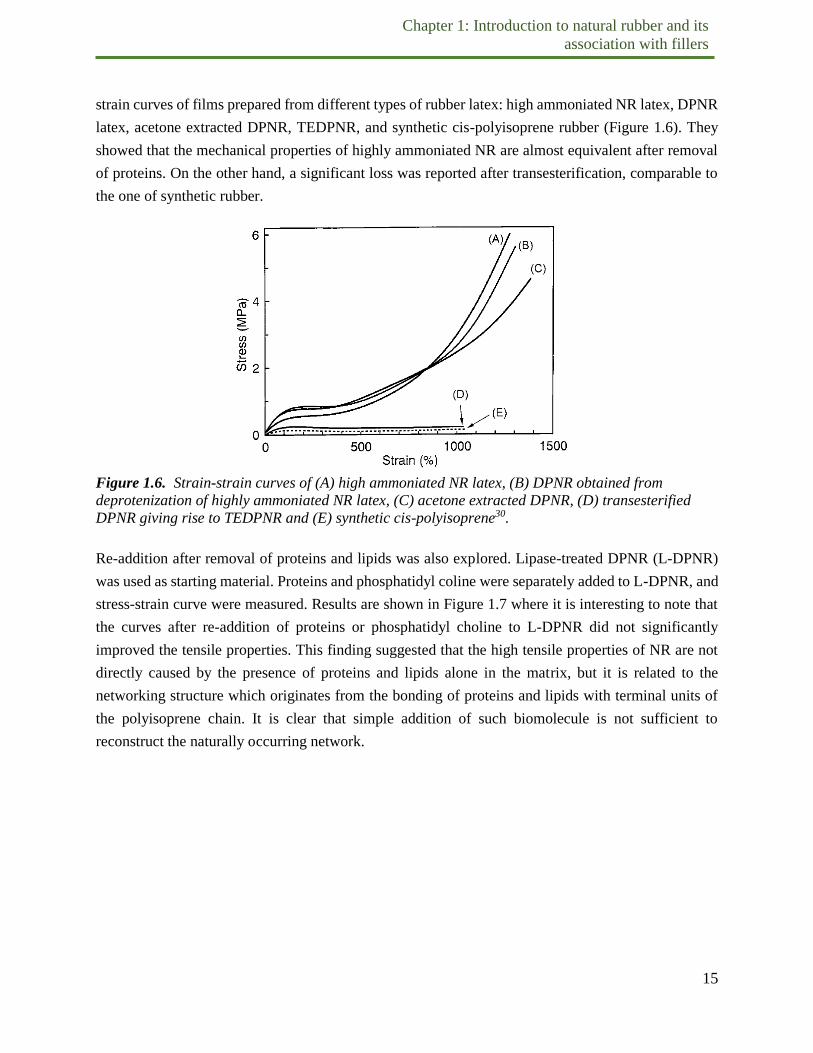
Generally, when a stress-strain test is performed on rubber samples the three most important properties
tested are the Young’s modulus, the tensile strength and the elongation at break. The tensile strength
corresponds to the force needed to break the rubber specimen. The elongation at break is the maximum
elongation the sample can undergo before breaking. The measurement of Young’s modulus in rubber
materials is very difficult, because the stress needed to deform a rubber sample is small and usually
special load cells are needed for a very precise measurement. Therefore, in most cases the ‘modulus’
is measured as the stress at a particular strain and it represents the stiffness of the material. Other
mechanical properties used to characterize the rubber materials are hardness, compression set and
abrasion resistance. A general effect of reinforcing filler on different compound properties (viscosity,
hardness, tensile strength, compression, abrasion, elongation at break) is shown in Figure 1.8.
Figure 1.8. Influence of the amount of reinforcing fillers on several compound mechanical
properties32.

18
Chapter 1: Introduction to natural rubber and its
association with fillers
Rubber goods derive many of their mechanical properties from the added mixture of these reinforcing
fillers at quantities of 30% up to as much as 300% part per hundred rubber. The reinforcing
mechanisms in rubber nanocomposite are very complicated and they are still not fully understood due
to the complexity of the heterogeneous multicomponent systems and cross-linking structure of the
rubber33. Nowadays, the reinforcing mechanism of rubber composite attracts lots of interest especially
with new filler applications giving rise to different rubber-filler combinations. What is actually needed
to reinforce rubber materials? Why is rubber reinforced by fillers and what are the microscopic
contributions that lead to a macroscopic reinforcement? Those are still today open questions. So the
topic of reinforcement still remains very open but the comprehension of this mechanism goes beyond
the main objectives of this thesis. However, years of work devoted to rubber reinforcement have
yielded insights that allow the advancement of rubber products, highlighting some intrinsic
characteristics which can be linked to a good reinforcement effect.
In general, the contribution of filler to rubber reinforcement is induced by a large difference in Young’s
modulus between rubber and filler. Rubber can be considered as a “soft” polymer while fillers are
“hard” particles. In essence, fillers are harder than rubber and cannot be easily deformable34.
The strong elements connected to the achievement of rubber reinforcement are directly linked to:
hydrodynamic effect, polymer network, polymer-filler interaction, filler-fillers interaction, filler
dispersion state in the rubber matrix, physico-chemical properties of the filler. The aim of the following
subsection is to briefly introduce each one of the elements above mentioned.
3.1. Important parameters influencing rubber reinforcement
The reinforcing mechanism of filled-rubber systems was better understood after the pioneering study
of Payne in the 60’s. The scientist studied the relation between the three dimensional particulate filler
aggregates and its dependence to two important parameters in dynamic mechanical properties: the
storage modulus G’ (corresponding to the elastic energy stored during experiments) and the loss
modulus G’’ (corresponding to the energy lost by viscous friction forces) on strain such as shear.
Payne’s works showed that, above some critical strain amplitude, the storage modulus G’ decreases
rapidly with increasing amplitude saturating at rather large deformations, while the loss modulus G’’
shows a maximum in the region where the storage modulus decreases: this effect is called “Payne
effect”; it depends on the filler content of the material and vanishes for unfilled elastomers. Payne
concluded that in particulate filled rubber (e.g. rubber filled with carbon black and silica particles) the
increase of storage modulus depends on four contributions, among which three of them are strain
independent (polymer network, hydrodynamic effect and filler-rubber interaction), while the filler-
filler contribution is strain dependent33,35,36. Thereafter, the Payne concept has been widely used to
describe the filler-filler interaction as well as filler-rubber interaction.

19
Chapter 1: Introduction to natural rubber and its
association with fillers
Concerning strain-independent contributions, the hydrodynamic effect arises from the inclusion of
rigid particles and an increase in the cross-linking density created by polymer-filler bonding37. It refers
to the fact that the addition of the filler to an elastomer results in a composite material whose
macroscopic mechanical properties are, by construction, some weighted average of the properties of
the elastomer and the rigid filler38.
With regards to the polymer network contribution, a networking structure already appears in small
amount before vulcanization due to physical cross-linking of entangled chains. This contribution is
particularly present before vulcanization in NR due to the presence of the naturally occurring network.
After vulcanization, chemical cross-links dominantly contribute to the modulus in which the value is
proportional to the cross-link density of the network.
Another important contribution to the increase of modulus is the filler-rubber contribution. On this
topic, several models have been published concerning filler-rubber interactions in carbon black filled
compound. The models are based on bound rubber, term used to define the non-extractable elastomeric
part of rubber when the composite is immersed in a good solvent for the polymer for long time. Le
Blanc et.al.39 used proton nuclear magnetic resonance (H-NMR) to study the molecular flexibility of
polymers when they are modified by filler particles. Their work demonstrated that bound rubber is
composed of two bound layers with different level of molecular mobility (Figure 1.9). In fact, very
close to filler particles, there is a thin layer of “tightly bound” rubber, which is likely to behave in a
flow field exactly as the aggregate. Then there is a region of “loosely bound” rubber, i.e., chains
attached to the particles, through the “tightly bound” rubber region, but able to undergo very large
deformation during flow. This region eventually forms connective filaments between rubber-filler
aggregates. The third portion is the unbound rubber, so-called because it can readily be extracted from
uncured compound by a good solvent of the elastomer40. In the layer of tightly bound rubber molecular
motion is very constraint, the polymer chains are “anchored” onto the stiff filler particles forcing the
chain into conformations that are different from the ones present in the bulk. The presence of such
different conformation is thought to be responsible for macroscopic reinforcement. Besides “tightly
bound” and “loosely bond” rubber, there is also rubber trapped inside the filler aggregates which fall
under the name of “occluded rubber”. This trapped occluded rubber among the voids of the aggregates
is shielded from deformation41,42. Note that the model described above was specifically studied for
carbon black filled synthetic rubber, but it can be a good base to understand the reinforcement
mechanism in other type of nanocomposites. By way of conclusion, increasing rubber-fillers
interaction and the strength of their bonds is a fundamental condition to achieve optimal rubber
reinforcement.

20
Chapter 1: Introduction to natural rubber and its
association with fillers
Figure 1.9. Schematic description of the bound rubber model introduced by Le Blanc et.al.39 for
carbon black filled synthetic rubber.
Another important parameter to consider concerns the structure of the filler in the polymer matrix and
the related dispersion state of the filler43,44. Different properties are obtained if the filler form a
continuous percolating network or isolated hard regions. An objective of producing polymeric
composites is to distribute and disperse the filler as homogeneously as possible so that the resulting
mechanical properties of the polymer/filler composite will be uniform. Failure to meet this criterion
causes locations for high stress concentration which act like “flaws” in the material. Thus, the uniform
dispersion of the filler in the polymer matrix is essential for rubber compounding to achieve optimal
properties. However, the formation of filler network, above a critical concentration, result in abrupt
increase mechanical properties. This is known has percolation phenomena, which is strongly related
to the loading level and dispersion state. In general, a more efficient mechanical reinforcement is
obtained when a rigid percolating filler network is formed within the soft polymer matrix in which an
increase of Young’s modulus is clearly observed. At small deformation, filler network play a major
role on reinforcement45. Thus, the morphology of the filler is of primary importance for the rheological
properties of the composite46–48.
The physico-chemical properties of the filler also play a major contribution. One of the parameters
capable to affect rubber-filler interaction is the average filler particle size. Particles larger than 103 nm
do not have reinforcing capabilities, and generally increase viscosity by a mere hydrodynamic effect39.
The size of fillers is directly link to the surface area which plays a role in the interaction between the
elastomer and filler surface. Reinforcing fillers with very small particle size in the range of 10-100 nm
have a high surface area that provides more active contact sites with the rubber matrix. Due to the small
size and increased surface area, nanofillers have emerged as promising fillers for improving the
properties of polymer with lower filler loading.

21
Chapter 1: Introduction to natural rubber and its
association with fillers
Apart from specific surface area as discussed above, the structure and the surface activity of fillers are
considered as crucial factors in controlling the reinforcement effect on rubbers. Surface activity can
either be expressed in a chemical sense or physical sense. The former relates to the different functional
groups present at the surface of the fillers such as lactone, quinone, carboxyl, hydroxyl, etc. In physical
sense, the variations in surface energy of the filler, surface roughness, porosity, etc. are used to
determine the ability and capacity for physisorption. Therefore, the interaction between filler and
rubber depends significantly on the functionalities present on the filler’s surface. Therefore, the
physical state of filler (solid or liquid), as well as the one of the polymer matrix, can affect the rubber-
filler interaction and the dispersion state. I would like to recall that the structure of NR in the latex state
is not the same as in the solid or dried state. As shown earlier, in the liquid or latex phase, the rubber
fraction is mainly contained in the form of core-shell NR particles, where the core is made of
polyisoprene chains and the shell is mainly composed of phospholipids and proteins. On the other
hand, in dried state, a NR network is formed. In such network, the polymer chains are more exposed
in comparison to the liquid state where they are caged by a hydrophilic layer made of biomolecules.
Based on this structural consideration, the chemical behaviors of NR changes between the liquid and
the solid state. The overall structure can be considered hydrophilic in the liquid state and hydrophobic
in the dried state. This change in behavior is most likely to influence the interaction between NR and
the involved filler as it will be discussed in the next subchapter introducing the most common fillers
usually coupled with NR.
3.2. Common fillers used in Natural Rubber Composites
The most commonly used fillers in the NR industry are CB and Si. However, other types of filler are
also of relevant importance. The following section present the structure, the composition of CB and Si
fillers used in this study as well as some generalities of their interaction with NR.
Carbon Black (CB)
CB is the generic name for a family of small-size, mostly amorphous, or para-crystalline carbon
particles grown together to form aggregates of different sizes and shapes49. CB is produced by the
incomplete combustion of hydrocarbons such as those found in petroleum oil or natural gas50. During
the reaction, carbon nodules are formed. The smallest units of CB are primary particles ( ~50nm)51
normally having a spherical shape. However, the lifespan of these particles is very short because they
rather cluster together to form aggregates of approximately 200-500 nm. The aggregation between
primary black particles involves the formation of covalent bonds between them. These bonds are very
difficult to break down by physical methods. The size and shape of the aggregates can vary from
individual spheroidal particles to clusters of a few or a multitude of primary particles with a more or
less irregular three-dimensional, chain-like, fibrous, or grape-like morphology49. Furthermore,

22
Chapter 1: Introduction to natural rubber and its
association with fillers
aggregates can form bond between themselves to form agglomerates. The bonds formed between
aggregates are of electrostatic nature and they are weaker than those within aggregate, thus they can
be broken by physical methods (sonication, agitation).
CB can be considered as a highly disordered form of graphitic carbon. Elementary analysis of CB
yields not only carbon but also small quantitates of oxygen, hydrogen, nitrogen and sulfur (Table 1.4).
Most of these elements are concentrated on the surface of CB. Hydrogen and oxygen form surface-
bound functional groups such as carbonyl, carboxyl, pyrone, phenol, quinone, lactol, ether, and
anhydride. A schematic representation of the surface’s composition of CB is displayed in Figure 1.10.
Table 1.4. Typical elemental carbon black composition49.
Element Content (% of wt)
Carbon 96-99.5
Hydrogen 0.2-1.3
Oxygen 0.2-0.5
Nitrogen 0- 0.7
Sulfur 0.1-1.0
Around 93% of CB usage is dedicated to rubber applications, and can be classified into two main
categories: tires and mechanical rubber goods (e.g. automotive belts and hoses). The reinforcing
properties of CB provide enhanced performance and durability to the rubber compounds in which they
are used. CB used in rubber applications are typically categorized as N100±N900 series blacks, where
increasing N number correlates with decreasing nitrogen surface area. The remaining 7% of carbon
usage falls into a broad group of applications, of which the most predominant are plastics, inks, and
coatings.
Figure 1.10. Surface chemistry of carbon black52.
23
Chapter 1: Introduction to natural rubber and its
association with fillers
When NR and CB are present in their solid state, the interaction between CB and NR is said to be
regulated mainly by Van der Waals attraction forces53. The origin of these attraction forces is related
to the active sites originated from the cleavage of carbon-carbon bonds during the manufacturing
process of CB.
One of the advantages of using CB in rubber materials is its ease in processing with either NR or SR.
Once in the solid state, both rubber and CB are generally hydrophobic. This is perhaps, a reason of
compatibility between CB and rubber. Additionally, the incorporation of CB into rubber creates an
interface between a rigid solid phase and a soft solid phase. The interfaces area depends, on the volume
fraction of the CB in the compound and on its specific surface area. For this reason, one of the most
important properties of CB is its surface activity. All CBs possess a distribution of energy sites, which
allow the chemisorption or physical adsorption of rubber at their surface.
On the other hand, the interaction between CB fillers in aqueous suspension and NR latex is not well
understood. Martinéz-Pedrero et al54 investigated a novel approach to form an elastomeric composite
material starting from NR latex and CB in the liquid state. Their process was based on a bulk
destabilization of a binary colloidal mixture composed of NR latex and CB filler, giving rise to a
heterocoagulum. The two type of particles were either naturally destabilized or dispersed in water with
the help of a surfactant. The researcher reported that heteroaggregation was achieved in both cases and
that sol-gel transition was mainly governed by the amount of surfactant. This indicates an interaction
between NR latex and CB in the liquid state. Indeed, the adsorption of surfactant molecules onto the
CB surface tunes the interaction between the two types of particles and thus the homogeneity of the
dispersion before its destabilization. Despite their important contribution, the fundamental
understanding on the interaction between NR latex and CB filler in the liquid state is still at its infancy.
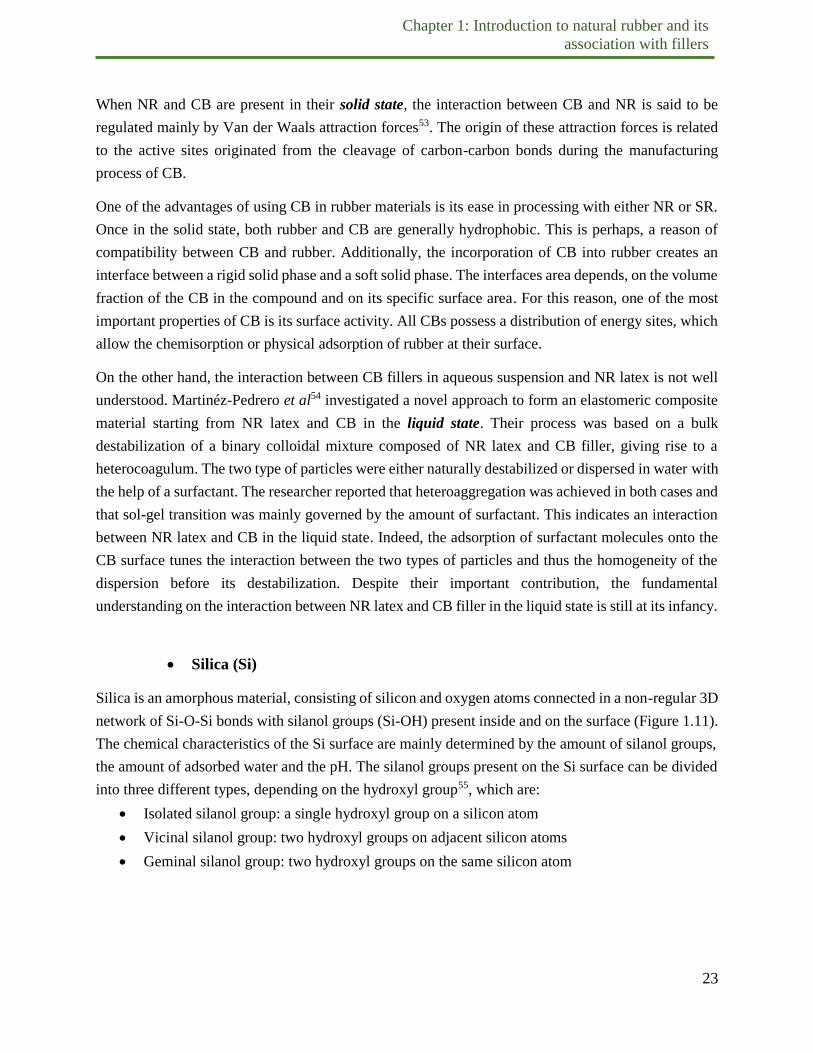
Silica (Si)
Silica is an amorphous material, consisting of silicon and oxygen atoms connected in a non-regular 3D
network of Si-O-Si bonds with silanol groups (Si-OH) present inside and on the surface (Figure 1.11).
The chemical characteristics of the Si surface are mainly determined by the amount of silanol groups,
the amount of adsorbed water and the pH. The silanol groups present on the Si surface can be divided
into three different types, depending on the hydroxyl group55, which are:
Isolated silanol group: a single hydroxyl group on a silicon atom
Vicinal silanol group: two hydroxyl groups on adjacent silicon atoms
Geminal silanol group: two hydroxyl groups on the same silicon atom

24
Chapter 1: Introduction to natural rubber and its
association with fillers
Figure 1.11. Structure of an amorphous colloidal silica particle, highlighting the presence of
different silanol groups on the surface56.
In addition to the silanol groups, a siloxane bridge is formed when one oxygen atom is shared by two
silicon atoms. The silanol groups are directly responsible for the high polarity and hydrophilic
character of Si. The characteristic structure of Si can be divided into agglomerates, aggregates and
primary particles57. The agglomerates of Si are typically ranged in the dimension of 1-40 μm. These
agglomerates are formed by hydrogen bonding and Van der Waals forces between Si aggregates. The
typical dimensions of Si aggregates are 100-1000 nm. Within the aggregates, the nano-size primary
particles are linked together via siloxane bonds.
There are two types of commercially available Si, either precipitated or fumed. The precipitated Si is
prepared by the reaction of sodium silicate and sulphuric acid under alkaline conditions and the fumed
Si is prepared by oxidation of silicon tetrachloride vapor at high temperatures. In the rubber industry
the precipitated Si is the preferred type of use because of the lower price and better mixing with the
rubber material. The more expensive fumed Si has very low bulk density (very fluffy white powder)
and it is mainly used in silicon rubber.
The introduction of Si fillers into solid rubber or NR presents the obstacle of incompatibility between
the two components. Indeed, there is a large difference between the solubility and polarity of rubber
polymers and Si, indicating difficult mixing of these two materials which usually results in large Si
aggregates non-homogeneously dispersed throughout the rubber matrix. The challenge for rubber-
silica nanocomposite is represented in achieving a good Si dispersion, and therefore homogeneous
mechanical properties.
To compensate and overcome the incompatibility of Si with hydrophobic polymers the application of
an organofunctional silane is often necessary to overcome the polarity differences in order to achieve
a higher desirable Si dispersion level in the rubber compound58. A bifunctional organosilane coupling
agent, through the organo-functional and silicon-functional moiety, is able to chemically bond a
polymer matrix to inorganic substrates such as Si. The bifunctional organosilane coupling agent serves
two functions: one end is for coupling with the hydrophilic Si surface and the other end to couple with

25
Chapter 1: Introduction to natural rubber and its
association with fillers
the hydrophobic polymer or rubber. Hence, the coupling agent acts as a connecting bridge between Si
and the rubber and improves the reinforcement of Si in rubber. In terms of surface chemistry, after the
adsorption of the silane coupling agent onto the Si surface, hydroxyl groups on the Si surface start
reacting with alkoxyl groups of the silane coupling agent. This reaction is named “silanization” and it
must undergo rapidly in-situ during the mixing process. Mainly, bi-functional-organosilanes based on
the structure shown in Figure 1.12a are used. Among them, the bi-functional-organosilanes which have
been most widely used in the tire industry so far are bis(triethoxysilylpropyl)tetrasulfide and
bis(triethoxysilylpropyl)disulfide. The structures of them are shown in Figure 1.12b and c. Successful
application of this molecules generally yield higher bound rubber content and a more successful
reinforcement59.
Figure 1.12. Basic structure of bi-functional organosilanes (a). The structure of
Bis(triethoxysilylpropyl)tetrasulfide (b), triethoxysilylpropyl) disulfide (c).
On the other hand, when Si is mixed with NR in the liquid state, literature on the fundamental processes
involved in the interaction between NR latex and Si filler in liquid is very limited. The only
fundamental study focusing on interactions and heteroaggregation between NR globules and Si filler
in aqueous conditions refers to the work of Chan et al.60It highlights some important physico-chemical
parameters required to achieve NR−Si interaction under very diluted aqueous conditions.
Before describing the main results obtained by the work of Chan et.al., it is important to keep in mind
that NR globules are generally hydrophilic because of the presence of their lipo-proteic membrane. In
fact, in colloidal form, charged proteins and phospholipids are in control of the colloidal stability.
Concerning the Si particles, their hydrophilic character is raised by the presence of silanol groups on
their surface. Therefore, the interaction between Si particles and NR globules is hindered by the
presence of negative charges on both particle’s surface. Thus, the interaction of these particles is
electrolyte responsive.
Chan et.al.60 demonstrated by fluorescence correlation spectroscopy (FCS) that the interaction between
NR globules and Si fillers occurs only in the presence of an ionic medium. Figure 1.13 shows the
normalized autocorrelation curves of the mixed solution of NR and Si filler, using different sizes of Si
and different ionic medium.

26
Chapter 1: Introduction to natural rubber and its
association with fillers
Figure 1.13. Normalized autocorrelation curves of the mixed solutions of NR and silica particles. In
water the curves are similar to the ones obtained for free silica particles suggesting no interaction
between NR and silica. In NaNO3 and MgSO4 at ionic strength of 100 Mm the curves are similar
whatever the size of silica particles and a shift to longer diffusion times connotes interaction between
NR and the filler60.
The normalised autocorrelation curves and corresponding diffusion time in water are similar and very
comparable to the diffusion times calculated for free Si particles in water (data not shown) suggesting
a lack of interaction between NR globules and Si filler. However, in the presence of Na+ and Mg2+
(ionic strength=100 mM) the two binary particles interact yielding a curve shifted to longer times. This
result can be explained by the effect of salt addition on the Electrostatic Double Layer (EDL) thickness.
As the salt concentration increases, more counter-ions are available to neutralize the colloidal surface
charge resulting into a thinner double layer and decrease of energy barrier. In terms of the
heteroaggregation kinetics, they also showed that the two binary particles interact immediately in Mg2+
solution. However, in Na+ solution, when measured immediately they observed a curve similar to the
one of free Si, and it took longer to observe the shift characteristic of the NR-plain silica particles
interaction.
3.3. Other fillers for NR
Besides CB and Si, which are the most widely used filler in natural rubber materials, other fillers are
also employed based on the industrial sector and the manufacturing process.
Clay has been an important NR filler for many years, but due to its large size and low surface activity,
the reinforcing ability of clay is poor13. Layered silicates (LS) are the main active minerals in soils and
clays. The layers are stacked by a weak dipole-dipole force and exhibit a net negative charge on the

27
Chapter 1: Introduction to natural rubber and its
association with fillers
surface. The interlayers between the galleries are normally occupied by cations such as Na+. As force
that hold the stacks are relatively weak, the intercalation of small molecules between the layers can be
done relatively easily. However, the exfoliated nanolayers of LS may not be easily dispersed in most
polymers due to their preferred face-to-face stacking61.
Calcium carbonate is also widely used as non-reinforcing and reinforcing filler to impart desire color
and reduce product cost in NR-based composites. There are two important type of CaCO3: ground
limestone and precipitated CaCO3. The former is prepared by grinding mineral limestone, while the
precipitated form is obtained by chemical precipitation of a salt solution62.
Recently, due to ecological concerns, bio-based fillers have been increasingly used as fillers in polymer
composites. Such materials promise some advantages compared to traditional inorganic fillers,
including their renewable nature, low density, nonabrasive properties, and reasonable strength and
stiffness. This makes them competitive as reinforcing agents in certain composite applications63.
Commonly used bio-based fillers are cellulose whiskers, chitosan and starch nanocrystals.
Graphene is also gaining more and more interest as filler for natural rubber composites. In the last 10
years, graphene/thermal plastic polymer composites were extensively investigated. However,
surprisingly, almost no studies involved the preparation and characterization of rubber/graphene
composites until 2011, probably due to the dispersion and exfoliation problem of graphene in the cross-
linked rubber matrix. Since 2013, the modification of rubber by using graphene nanofillers has become
one of the hot topics in the area of graphene, aiming to the automobile or bicycle tire application.
Graphene combines the conductivity of carbonaceous materials with the structural characteristics of
clay sheets (widely used in the field of elastomeric materials), thus providing new strategies in the
development of high-performance multifunctional rubber nanocomposites64.
4. Mixing filler into rubber compounds – strategies for filler
dispersion
Mixing is central to rubber technology. The mixing step between rubber and filler is a very important
task because it will define how fillers are distributed and dispersed as well as their degree of
interactions with the host polymer matrix. If the base compound is inadequately mixed, problems
cascade down through the subsequent processes of shaping and curing into the end product. It is
therefore of value to understand not only the practical procedures of mixing, but also the physical
processes involved at smaller scale.
Usually, there are five main types of ingredient in a normal rubber mix: the rubber itself, fillers,
plasticizers, minor chemical ingredients and curatives. In most mixing operations, curatives are added
at a second, lower temperature stage, either on a mill (sometimes directly after the drop mill), in a

28
Chapter 1: Introduction to natural rubber and its
association with fillers
repass through the high shear mixer, or in a relatively low shear mixer65.
Several strategies have been proposed for the mixing of rubber with filler and other ingredients (solid
mix, melt compounding etc.)53. The most conventional way consists in inserting fine particulate filler
powder into a solid mixing machine (two roll mill, internal mixer) together with solid rubber sheets.
The most common machine used to manufacture large quantities of composite is the Banbury internal
mixer. The Banbury mixer is a tangential type internal mixing machine, in which two slightly spiraled
rotors revolve side by side towards each other within a chamber shaped like two short cylinders lying
together with adjacent sides open. The chamber has a top opening called hopper, which can be closed
by pneumatic means for inserting the material and a bottom gate, which can be hydraulically opened,
to drop out the contents after mixing. Research on detailed designs of mixer rotors for mixing and
plastics in an internal mixer has continued to the present time. Later patents have generally involved
new rotor designs where the number, shape and angles of the vanes on the rotor are designed in
particular manners but the detailed description is beyond the scope of this manuscript.
Although its wide employment, conventional solid mixing method is not the most efficient way to
disperse the filler in the polymer matrix. Accordingly, there is a need to improve the methods that mix
filler with rubber. Different procedures have been developed to achieve better filler dispersion: sol-gel
techniques, in situ generation of filler23, liquid phase mixing. Among those, liquid phase mixing looks
very promising. This type of mixing involves the elastomer in the form of latex, and an aqueous
dispersion of filler, commonly called “slurry”. Once the slurry is mixed with the elastomer latex, more
options are available: the mixture can simply be dried to form a continuous polymer film with
embedded filler34, or it can be coagulated.
During the last few decades, a great effort has been made to produce CB-elastomers compounds by
combining polymer-latex with a CB and then coagulating the mixture chemically66. However, other
solutions have been proposed to obtain this coagulation reducing the mixing time and increase
productivity. In the early 2000s, a senior Chinese scientist called Wang Meng-Jiao was working for
Cabot Corporation (Boston, US). With his team, he developed and patented a novel technology which
continuously disperses CB in clean NR latex giving rise to the first NR-filler-batch made with a
continuous liquid mixing process. The composite material manufactured with this novel method
achieves excellence performance and a superior mechanical properties in comparison with their solid-
mixed counterparts67, so that Cabot marketed the product under the name of Cabot Elastomer
Composites (CEC). In the production process of CEC, a CB-slurry is first prepared by finely disperse
the filler in water without any surfactant (Figure 1.14). Subsequently, the slurry is injected into the
mixer at very high speed and continuously mixed with the NR latex stream. Under highly energetic
and turbulent conditions, the mixing and coagulation of polymer with filler is completed mechanically
at room temperature in less than 0.1 second, without the aid of chemicals. The obtained coagulated
material is a mixture of NR and fillers which follows a process of dewatering and drying.

29
Chapter 1: Introduction to natural rubber and its
association with fillers
Figure 1.14. Schematic representation of the CEC process67.
Wang claimed that one of the reason behind the superior mechanical properties of CEC stands in its
superior filler dispersion in comparison to the obtained conventional dry mixed compound. This was
demonstrated by investigating the dispersion using transmission electron microscopy and further
analysis of the properties (Figure 1.15). For N234-filled CEC, the composite shows good dispersion
and distribution throughout the NR matrix, whereas in case of dry-mixed compound, although an
extensive mixing has been applied, the dispersion and distribution are poorer than in CEC. Due to
highly dispersed filler, the obtained mechanical properties also improved. For example, it is reported
that in CEC compounds, the hysteresis, stress-strain properties and abrasion resistance of the
vulcanized materials are significantly improved over their dry-mixed counterparts. Therefore, crucial
benefits can be related to the appropriate use of such technology for the production of filled-rubber
composites. For this reason, Michelin bought a license from Cabot to use the liquid-phase mixing
technology.
As previously mentioned, the CEC product has been developed for specific use of CB filler. However,
the extension of this technology for other type of fillers, such as amorphous Si is also very interesting
and promising. At the moment, the use of liquid phase mixing in case of Si does not exclude an
independent silanization process. In fact, the industrial workflow consists in the addition of a silane
coupling agent after coagulation and drying by a thermomechanical step.
Overall, liquid phase mixing is a novel technology which did not replaced the production of composites
by internal mixers as yet, but over a long term, this is surely a possible way forward.

30
Chapter 1: Introduction to natural rubber and its
association with fillers
Figure 1.15. TEM images of (a) dewatered CEC and (b) dry mixed NR-CB composite67.Images have
the same size and were taken with a magnification power of 1000x.

31
Chapter 1: Introduction to natural rubber and its
association with fillers
5. Knowledge gap and novelty of the study
Several years after the invention of the liquid phase mixing technology, the technological process
parameters are under control at the engineering level, but studies are required to enrich the fundamental
knowledge of the heteroaggregation mechanism. In particular, the structural characterization of the
obtained coagulum and its evolution toward a composite along drying remains unknown. The structural
and physico-chemical characterization of a material along the several steps of an industrial process is
essential in order for continued progress to be made. Therefore, understanding what is happening at
the nano-microscopic scale during the liquid mixing process is a pioneer work of fundamental interest.
In other words, filling the gap between the nano-world and the macroscopic scale is very challenging,
but better understanding of the structure along the process and of the undergoing interaction occurring
during coagulation could help future development of materials made by this novel mixing method.
This is the reason behind our work, which started from a collaboration between MICHELIN and the
Institut des Sciences Moléculaires d’Orsay (ISMO).
At the moment, available literature on this subject is very limited and mostly focuses on the mechanical
properties of the obtained composite rather than structural characterization studies. It is in this context
that, we report on the structural characterization and evolution of a coagulum obtained by mixing NR
latex with either CB or Si filler. For the first time, we followed the nanoscale structural evolution
dynamics of the coagulum, until the formation of a dried composite. The role of external physical
stresses, such as shear and sonication applied in the binary colloidal suspension of NR latex and filler
was also tested, reporting a structural effect on the formed coagulum. Additionally, only in case of NR-
Si coagulation, the spatial distribution of proteins and lipids of NR, and their organization in respect to
the filler was also unraveled. To do so, we employed a set of highly resolved microscopy techniques
composed of Field Emission Scanning Electron Microscopy (FESEM), optical super-resolution
microscopy (d-STORM), and Atomic Force Microscopy coupled InfraRed spectroscopy (AFMIR).
This set of techniques gave specific and complementary insights to reach answers and conclusions that
can be found in chapter 3 and chapter 4, while the detailed description of each experimental technique
can be found in chapter 2.

32
Chapter 1: Introduction to natural rubber and its
association with fillers
REFERENCES
1. Goyal, R. K. Nanomaterials and nanocomposites: synthesis, properties, characterization tech-
niques, and applications. (Taylor & Francis, CRC Press, 2018).
2. B. Pereira, A. & A.O. Fernandes, F. Introductory Chapter: The Importance of Composites in the
World. in Renewable and Sustainable Composites (eds. B. Pereira, A. & A. O. Fernandes, F.)
(IntechOpen, 2019). doi:10.5772/intechopen.89427.
3. Honarvar, Z., Hadian, Z. & Mashayekh, M. Nanocomposites in food packaging applications and
their risk assessment for health. Electron. Physician 8, 2531–2538 (2016).
4. Jones, W. E., Chiguma, J., Johnson, E., Pachamuthu, A. & Santos, D. Electrically and Thermally
Conducting Nanocomposites for Electronic Applications. Materials 3, 1478–1496 (2010).
5. Dishovsky, N. & Mihaylov, M. Elastomer-based composite materials: mechanical, dynamic and
microwave properties and engineering applications. (Apple Academic Press, 2017).
6. McKeen, L. Elastomers. in The Effect of Sterilization Methods on Plastics and Elastomers 305–
351 (Elsevier, 2018). doi:10.1016/B978-0-12-814511-1.00010-X.
7. Advances in elastomers. 2: Composites and nanocomposites. (Springer, 2013).
8. Peace, M. H. K. & Mitchell, G. R. Conductive elastomeric composites. J. Phys. Conf. Ser. 183,
012011 (2009).
9. Cornish, K., Siler, D. J., Grosjean, O.-K. & Goodman, N. Fundamental Similarities in Rubber
Particle Architecture and Function in Three Evolutionarily Divergent Plant Species. 11.
10. Samanani, N. & Facchini, P. J. Compartmentalization of Plant Secondary Metabolism. in Recent
Advances in Phytochemistry vol. 40 53–83 (Elsevier, 2006).
11. Bottier, C. Biochemical composition of Hevea brasiliensis latex: A focus on the protein, lipid,
carbohydrate and mineral contents. in Advances in Botanical Research vol. 93 201–237 (Else-
vier, 2020).

33
Chapter 1: Introduction to natural rubber and its
association with fillers
12. Santipanusopon, S. & Riyajan, S.-A. Effect of field natural rubber latex with different ammonia
contents and storage period on physical properties of latex concentrate, stability of skim latex
and dipped film. Phys. Procedia 2, 127–134 (2009).
13. Front Matter. in Polymer Chemistry Series (eds. Thomas, S., Han Chan, C., Pothen, L., Joy, J. &
Maria, H.) vol. 2 P001–P004 (Royal Society of Chemistry, 2013).
14. Sando, T. et al. Histochemical study of detailed laticifer structure and rubber biosynthesis-related
protein localization in Hevea brasiliensis using spectral confocal laser scanning microscopy.
Planta 230, 215–225 (2009).
15. Bristow, G. M. & Westall, B. The molecular weight distribution of natural rubber. Polymer 8,
609–617 (1967).
16. Habib, M. A. H. et al. Proteomics analysis of latex from Hevea brasiliensis (clone RRIM 600).
Biochem. Cell Biol. 95, 232–242 (2017).
17. Berthelot, K. et al. Rubber Elongation Factor (REF), a Major Allergen Component in Hevea
brasiliensis Latex Has Amyloid Properties. PLoS ONE 7, e48065 (2012).
18. Berthelot, K. et al. Rubber particle proteins, HbREF and HbSRPP, show different interactions
with model membranes. Biochim. Biophys. Acta BBA - Biomembr. 1838, 287–299 (2014).
19. Chan, A. J. et al. LIPID CONTENT IN SMALL AND LARGE NATURAL RUBBER PARTI-
CLES. Rubber Chem. Technol. 88, 248–257 (2015).
20. Cornish, K., Wood, D. F. & Windle, J. J. Rubber particles from four di€ erent species, examined
by transmission electron microscopy and electron-paramagnetic-resonance spin labeling, are
found to consist of a homogeneous rubber core enclosed by a contiguous, monolayer biomem-
brane. 12.
21. Nawamawat, K. et al. Surface nanostructure of Hevea brasiliensis natural rubber latex particles.
Colloids Surf. Physicochem. Eng. Asp. 390, 157–166 (2011).

34
Chapter 1: Introduction to natural rubber and its
association with fillers
22. Rochette, C. N. et al. Shell Structure of Natural Rubber Particles: Evidence of Chemical Stratifi-
cation by Electrokinetics and Cryo-TEM. Langmuir 29, 14655–14665 (2013).
23. Chemistry, Manufacture and Applications of Natural Rubber. (Elsevier, 2014).
doi:10.1016/C2013-0-16344-1.
24. Liu, J. et al. New evidence disclosed for networking in natural rubber by dielectric relaxation
spectroscopy. Soft Matter 11, 2290–2299 (2015).
25. Tanaka, Y. Structural Characterization of Natural Polyisoprenes: Solve the Mystery of Natural
Rubber Based on Structural Study. Rubber Chem. Technol. 74, 355–375 (2001).
26. Tanaka, Y. & Tarachiwin, L. Recent Advances in Structural Characterization of Natural Rubber.
Rubber Chem. Technol. 82, 283–314 (2009).
27. Huang, C. et al. Research on architecture and composition of natural network in natural rubber.
Polymer 154, 90–100 (2018).
28. Wu, J. et al. Super-Resolution Fluorescence Imaging of Spatial Organization of Proteins and Li-
pids in Natural Rubber. Biomacromolecules 18, 1705–1712 (2017).
29. Xu, L. et al. A rheological study on non-rubber component networks in natural rubber. RSC Adv.
5, 91742–91750 (2015).
30. Amnuaypornsri, S. et al. Strain-Induced Crystallization of Natural Rubber: Effect of Proteins and
Phospholipids. Rubber Chem. Technol. 81, 753–766 (2008).
31. Amnuaypornsri, S., Sakdapipanich, J. & Tanaka, Y. Green strength of natural rubber: The origin
of the stress-strain behavior of natural rubber. J. Appl. Polym. Sci. 111, 2127–2133 (2009).
32. Edwards, D. C. Polymer-filler interactions in rubber reinforcement. J. Mater. Sci. 25, 4175–4185
(1990).
33. Sahakaro, K. Mechanism of reinforcement using nanofillers in rubber nanocomposites. in Pro-
gress in Rubber Nanocomposites 81–113 (Elsevier, 2017). doi:10.1016/B978-0-08-100409-
8.00003-6.

35
Chapter 1: Introduction to natural rubber and its
association with fillers
34. Oberdisse, J. Aggregation of colloidal nanoparticles in polymer matrices. Soft Matter 2, 29–36
(2006).
35. Payne, A. R. A note on the conductivity and modulus of carbon black-loaded rubbers. J. Appl.
Polym. Sci. 9, 1073–1082 (1965).
36. Warasitthinon, N., Genix, A.-C., Sztucki, M., Oberdisse, J. & Robertson, C. G. THE PAYNE
EFFECT: PRIMARILY POLYMER-RELATED OR FILLER-RELATED PHENOMENON?
Rubber Chem. Technol. 92, 599–611 (2019).
37. Bokobza, L. The Reinforcement of Elastomeric Networks by Fillers. Macromol. Mater. Eng.
289, 607–621 (2004).
38. Goudarzi, T., Spring, D. W., Paulino, G. H. & Lopez-Pamies, O. Filled elastomers: A theory of
filler reinforcement based on hydrodynamic and interphasial effects. J. Mech. Phys. Solids 80,
37–67 (2015).
39. Leblanc, J. L. Rubber±®ller interactions and rheological properties in ®lled compounds. Prog
Polym Sci 61 (2002).
40. Mitchell, M. R. et al. Rubber-Filler Interactions and Its Effect in Rheological and Mechanical
Properties of Filled Compounds. J. Test. Eval. 38, 101942 (2010).
41. Kraus, G. A Carbon Black Structure-Concentration Equivalence Principle. Application to Stress-
Strain Relationships of Filled Rubbers. Rubber Chem. Technol. 44, 199–213 (1971).
42. Medalia, A. I. Morphology of aggregates. J. Colloid Interface Sci. 32, 115–131 (1970).
43. Witten, T. A., Rubinstein, M. & Colby, R. H. Reinforcement of rubber by fractal aggregates. J.
Phys. II 3, 367–383 (1993).
44. Oberdisse, J., Straube, E. & Pyckhout-Hintzen, W. Structure Determination Of Polymer Nano-
composites By Small-Angle Scattering. in Recent Advances in Polymer Nanocomposites 397–
438 (Brill Academic Publishers, 2009). doi:10.1163/ej.9789004167261.i-528.112.

36
Chapter 1: Introduction to natural rubber and its
association with fillers
45. Chabert, E. et al. Filler–filler interactions and viscoelastic behavior of polymer nanocomposites.
Mater. Sci. Eng. A 381, 320–330 (2004).
46. Heinrich, G. & Klüppel, M. Recent Advances in the Theory of Filler Networking in Elastomers.
in Filled Elastomers Drug Delivery Systems vol. 160 1–44 (Springer Berlin Heidelberg, 2002).
47. Oberdisse, J., El Harrak, A., Carrot, G., Jestin, J. & Boué, F. Structure and rheological properties
of soft–hard nanocomposites: influence of aggregation and interfacial modification. Polymer 46,
6695–6705 (2005).
48. Tatou, M. et al. Reinforcement and Polymer Mobility in Silica–Latex Nanocomposites with Con-
trolled Aggregation. Macromolecules 44, 9029–9039 (2011).
49. Spahr, M. E. & Rothon, R. Carbon Black as a Polymer Filler. in Fillers for Polymer Applications
(ed. Rothon, R.) 261–291 (Springer International Publishing, 2017). doi:10.1007/978-3-319-
28117-9_36.
50. Jebur, S. K. Carbon black production, analyzing and characterization. 86.
51. Encyclopedia of materials: science and technology. (Elsevier, 2001).
52. Gazal, U., Khan, I., Usmani, M. A., Bhat, A. H. & Mohamad, M. K. H. Rubber-Based Nanocom-
posites and Significance of Ionic Liquids in Packaging Applications. in Bionanocomposites for
Packaging Applications (eds. Jawaid, M. & Swain, S. K.) 227–242 (Springer International Pub-
lishing, 2018). doi:10.1007/978-3-319-67319-6_12.
53. Thomas, S., Chan, C. H., Pothen, L. A., Joy, J. P. & Maria, H. J. Natural Rubber Materials: Vol-
ume 2: Composites and Nanocomposites. (Royal Society of Chemistry, 2013).
54. Martínez-Pedrero, F. et al. Making an elastomeric composite material via the heteroaggregation
of a binary colloidal dispersion. Soft Matter 8, 8752 (2012).
55. Sato, M. Reinforcing mechanisms of silica / sulfide-silane vs. mercapto-silane filled tire tread
compounds. (2018).

37
Chapter 1: Introduction to natural rubber and its
association with fillers
56. Miloskovska, E. E. Structure-property relationships of rubber/silica nanocomposites via sol-gel
reaction. (2013) doi:10.6100/ir739216.
57. Boehm, H.-P. The Chemistry of Silica. Solubility, Polymerization, Colloid and Surface Proper-
ties, and Biochemistry. VonR. K. Iler. John Wiley and Sons, Chichester 1979. XXIV, 886 S.,
geb. £ 39.50. Angew. Chem. 92, 328–328 (1980).
58. Kaewsakul, W., Sahakaro, K., Dierkes, W. K. & Noordermeer, J. W. M. OPTIMIZATION OF
RUBBER FORMULATION FOR SILICA-REINFORCED NATURAL RUBBER COM-
POUNDS. Rubber Chem. Technol. 86, 313–329 (2013).
59. Sae-oui, P., Sirisinha, C., Thepsuwan, U. & Hatthapanit, K. Roles of silane coupling agents on
properties of silica-filled polychloroprene. Eur. Polym. J. 42, 479–486 (2006).
60. Chan, A. J. et al. Natural Rubber–Filler Interactions: What Are the Parameters? Langmuir 31,
12437–12446 (2015).
61. Joly, S., Garnaud, G., Ollitrault, R., Bokobza, L. & Mark, J. E. Organically Modified Layered
Silicates as Reinforcing Fillers for Natural Rubber. Chem. Mater. 14, 4202–4208 (2002).
62. Suki, F. M. M. & Rashid, A. A. Effect of dispersion preparation technique of calcium carbonate
(CaCO3) fillers on mechanical properties of natural rubber (NR) latex films. in 040015 (2017).
doi:10.1063/1.4993357.
63. Mousa, A., Heinrich, G. & Wagenknecht, U. Bio-Based Fillers. in Encyclopedia of Polymeric
Nanomaterials (eds. Kobayashi, S. & Müllen, K.) 1–4 (Springer Berlin Heidelberg, 2014).
doi:10.1007/978-3-642-36199-9_285-1.
64. Wang, J., Zhang, K., Bu, Q., Lavorgna, M. & Xia, H. Graphene-Rubber Nanocomposites: Prepa-
ration, Structure, and Properties. in Carbon-related Materials in Recognition of Nobel Lectures
by Prof. Akira Suzuki in ICCE (eds. Kaneko, S. et al.) 175–209 (Springer International Publish-
ing, 2017). doi:10.1007/978-3-319-61651-3_9.

38
Chapter 1: Introduction to natural rubber and its
association with fillers
65. Bhowmick, A. K., Hall, M. M. & Benarey, H. A. Rubber Products Manufacturing Technology.
915.
66. Krishnan, S., Alex, R. & Kurian, T. HAF/SILICA/NANOCLAY “TERNARY” MAS-
TERBATCH AND HAF/SILICA BINARY MASTERBATCH FROM FRESH NATURAL
RUBBER LATEX. Rubber Chem. Technol. 87, 250–263 (2014).
67. Wang, T. et al. CEC and its application in off-the-road tires. Rubber world, 6 (2003).

39

40

41
CHAPTER 2: Imaging methods for structural
characterization of polymer composites: focus on
FESEM, d-STORM and AFMIR

42
1-Characterization techniques for composite materials: a brief overview
2-Electron Microscopy (EM)
3-EM approach in this study
4-Optical microscopy- a focus on d-STORM
5- d-STORM set-up in this study
6- Atomic Force Microscopy combined with Infrared spectroscopy: AFM-
IR method

43
Recent advances in imaging technology have had a huge impact on materials characterization,
including composites. The aim of this chapter is first to give a brief and not exhaustive overview of
composite characterization techniques, and subsequently present the multimodal microscopy approach
employed during this study.
1. Characterization techniques for composite materials: a brief over-
view
From the characterization perspective, there are many techniques that can be used to characterize
composite materials. An exhaustive review of all of them is beyond the scope of this subsection, which
only aims to a brief introduction to the most used techniques. These methods can be categorized into:
space scattering techniques, microscopy techniques, spectroscopy techniques and methods related to
mechanical properties as shown in Figure 2.1.1
Figure 2.1. Categorization of methods used to analyze composite materials1.
Scattering techniques such as small angle neutron or X-ray scattering are very powerful methods
capable of probing the whole bulk of the sample. Neutron scattering is sensitive to fluctuations in the
density of nuclei in the sample, while X-ray scattering is sensitive to inhomogeneities in the electron
density. Such methods can be used to characterize the structure of both the polymer matrix and the
fillers, either at rest or in a deformed state. In particular, neutron scattering techniques have been used
to gain information on both polymer chain configurations and fillers distribution. Remarkable work in
this domain has been done by Oberdisse et al2.
In terms of microscopy, techniques such as optical microscopy (OM), electron microscopy (EM) and
scanning probe microscopy (SPM) play a vital role in the characterization of polymer nanocomposite
morphology on different length scale3 (Figure 2.2). Historically, both scanning probe microscopy
(comprising scanning tunneling microscopy (STM) and Scanning Force Microscopy (SFM)) and
electron microscopy (including Scanning Electron Microscopy (SEM) and Transmission Electron

44
Microscopy (TEM)) have been privileged due to their intrinsic nanoscale resolution. However, the
recent development of novel fluorescence microscopy methods, such as direct Stochastic Optical
Reconstruction Microscopy (d-STORM) and Photo-Activated Localization Microscopy (PALM) that
allow details below the diffraction limit of light opens new perspective to the use of photonic
microscopy in the field of composite and polymer science4. All these microscopy techniques have the
advantage that data are acquired in direct and real space, whereas scattering methods are measured in
reciprocal space.
Figure 2.2. Scheme showing the resolution power of different microscopic techniques3.
Elsewhere, Nuclear Magnetic Resonance (NMR), dielectric spectroscopy, electron paramagnetic
resonance, Fourier Transform InfraRed spectroscopy (FTIR) are widely used techniques to study
interfacial areas and polymer dynamics. Latest developments in NMR have enabled interpretation of
the effect of fillers on the chain dynamics of polymers under external stress and high temperature5.
Moreover, rheology and physical testing methods are used to determine the mechanical properties of
the composite. Typical test used to measure the mechanical properties include tensile, flexural,
compression and shear tests6.
In this work, we used a set of multimodal highly resolved imaging methods comprising mainly: Field
Emission Scanning Electron Microscopy (FESEM), d-STORM and Atomic Force Microscopy coupled
with InfraRed spectroscopy (AFM-IR). In addition to these techniques other imaging approaches such
as Transmission Electron Microscopy (TEM) and Cryo-Scanning Electron Microscopy (cryo-SEM)
were also attempted. The working principles of each of these methods as well as their original approach
undertaken in our study are reviewed in the next subsections.

45
2. Electron Microscopy (EM)
Electron microscopy (EM), as it is understood today, is not just a single technique but a diversity
of different ones that offer unique possibilities to gain insights into structure, topology,
morphology, and composition of a material. The wealth of very different information collected by
various methods is caused by the multitude of signals that arise when electrons interact with a
specimen. Gaining a basic understanding of these interactions is an essential prerequisite to
interpret the wide variety of information related to an EM study.
Electrons are a type of ionizing radiation that is capable of removing other electrons from the
attractive field of the nucleus while transferring some of their incident energy to the individual
atoms in the specimen7,8. When an electron hits onto a material, a wide range of secondary signals
is usually generated, as summarized in Figure 2.3.
Figure 2.3. Scheme of electron-matter interactions arising from the impact of an electron beam
onto a specimen7.
Usually, the reactions noted on the top side of the diagram are utilized when examining thick or
bulk specimens, while the reactions on the bottom side are those examined in thin or foil
specimens. Thick or bulky sample are usually better suited for Scanning Electron Microscopy
(SEM) imaging while thin or foil specimen are mostly analyzed by TEM. In this study, SEM
constitutes the main characterization technique, but also TEM and Cryo-SEM were approached.
All these techniques offer nanoscale resolution mostly due to the wavelength of electrons which
is much smaller than that of photons.

46
Transmission Electron Microscopy (TEM)
TEM produces a high-resolution, black and white image from the interaction that takes place between
prepared samples and energetic electrons in a vacuum chamber. Thus, dehydration of the sample is a
requirement when using conventional TEM with observation at room temperature. To minimize the
effect of drying on samples, several chemical protective agents are often added. Upon contact with the
sample, electrons are diffracted and transmitted/scattered9. The use of diffracted electrons is usually
reserved to solve crystallographic problems and their analysis was not involved in our study. On the
other hand, transmitted electron are used to form a highly resolved image. During their passage through
the sample, these electrons can be deflected with different angles based on their interaction with the
sample. This interaction is what provides the image contrast as some electrons pass through the sample
and others are bounced away. The transmitted electrons are then focused onto a CCD camera to
produce an image. Today, TEM constitutes arguably one of the most efficient and versatile tools for
the characterization of materials over spatial ranges from the atomic scale, through the ever-growing
nanoscale7. The main drawback of TEM lies in the need of extremely thin specimen sections (around
100 nm when using operating voltage of 100 kV) to achieve electron transparency as well as the use
of staining with heavy atoms to achieve sufficient contrast.
Scanning Electron Microscopy (SEM)
The basic SEM is probably the most versatile instrument in materials science. In SEM, an electron
beam is scanned in the X-Y plane of the specimen and the top side interactions shown in Figure 2.3
are generated. These interactions can be divided into two major categories: elastic interactions and
inelastic interactions. The first kind is characterized by a negligible energy loss during the collision
and a wide-angle direction change of the scattered electron. In SEM, elastic scattering includes
BackScattered Electrons (BSE), often used to gain compositional information. On the other hand,
inelastic interactions refer to an energy loss of the primary electron beam upon interaction with the
sample. The amount of energy loss depends on whether the specimen electrons are excited singly or
collectively and on the binding energy of the electron to the atom. As a result, the excitation of the
specimen electrons during the ionization of specimen atoms leads to the generation of Secondary
Electrons (SE), which are conventionally defined as possessing energies of less than 50 eV and can be
used to image or analyze the sample. In addition to SE, a number of other signals are generated by of
inelastic interactions, including the emission of X-rays and Auger electrons. Like TEM, the use of
SEM requires vacuum conditions, and the addition of chemical fixating or contrasting agents is most
often a requirement. For this study we employed an original SEM approach, combining a specific
chemical fixation method as well as multi-detection mode of electrons: BSE and SE imaging.
These particular signals are discussed in more details in the following sections.

47
Backscattered electrons (BSE)
BSE are high-energy electrons that are produced by the elastic scattering of the primary beam electrons
with the atom nuclei (Figure 2.4.) BSE lose a significant amount of energy from the incident beam.
Roughly 10–50% of the beam electrons are backscattered toward their source, and on an average these
electrons retain 60–80% of their initial energy10.
Figure 2.4. Schematic illustration of the formation of backscattered electrons (BSE), source: Azo
materials.
Backscattering is quantified by the backscattered coefficient η, defined as:
where, 𝑛𝐵 is the number of incident beam electrons on the specimen, and 𝑛𝐵𝑆𝐸 is the number of
BSE. The same coefficient can be express using currents, where 𝑖𝐵 is the incident beam current
and 𝑖𝐵𝑆𝐸 is the BSE current. Such coefficient is influenced by several parameters, notably by: the
atomic number of the sample, the incident beam angle or tilt angle. Monte Carlo simulations have
been a great tool helping to predict the behavior of BSE coefficient in function of the
aforementioned parameters. Figure 2.5a shows the backscattering coefficient in function of the
atomic number, using different monoatomic samples. The plot shows a general, monotonic increase
in the backscatterig coefficient as a function of the atomic number. Typically, heavier elements,
because of their bigger nuclei, can deflect incident electrons more strongly than lighter elements. This
dependence give rise to an atomic number contrast used in our study after fixation of the sample with
vapor of osmium, a heavy element. Due to the osmium affinity for NR, BSE contrast is generated
between rubber-like phase and the filler. A second important parameter influencing the BSE coefficient
is the incident beam angle or tilt angle. Their relationship has also been investigated by Monte Carlo
simulation as it is shown in Figure 2.5b. At very high tilt angles, the BSE coefficient highly increases.
𝜂 =
𝑛𝐵𝑆𝐸
𝑛𝐵=𝑖𝐵𝑆𝐸
𝑖𝐵
(1)

48
a b
This is due to the fact that at high angles, electrons tend to travel in proximity to the samples surface,
limiting the penetration. Thus, they can exit the sample to form BSE electrons. Whereas, at low angles
the electrons have more tendency to penetrate the target.
Figure 2.5. Backscattered electron coefficient as function of (a) atomic number and (b) tilt angle11.
Another important consideration when working with BSE refers to the sampling depth. From which
max depth arises the information carried by BSE?
First of all, the penetration depth is influenced by the beam energy. As the beam energy increases, the
electron beam can penetrate greater depths, generating more BSE, because the electrons enter the
specimen with more energy and lose it at a lower rate. The interaction volume in iron is shown as a
function of beam energy for the range 10–30 keV in Figure 2.6.
Figure 2.6. Monte Carlo electron trajectory simulations of the interaction volume in iron as a function
of beam energy: (a) 10 keV, (b) 20 keV, (c) 30 keV11.

49
Considering 5 keV, a tension very similar to the ones used in our study, a recent investigation reported
the Z-axis backscattered depth distribution function for BSE emissions (Figure 2.7)12.
Figure 2.7. Depth distribution function generated from a steel sample, using a tension of 5 keV12.
Secondary Electrons (SE)
SE are loosely bound outer shell electrons from the specimen atoms which receive sufficient kinetic
energy from the incident beam electrons during inelastic scattering of the incident beam to be ejected
from the atom and set into motion (Figure 2.8).
Figure 2.8. Schematic illustration of the formation of secondary electrons (SE), source: Azo
materials.
These electrons have typically low energy, with an average of around 3-5 eV. For this reason, they
can only escape from a region within a few nanometers from the material surface10. As in the case of
BSE, a secondary electron coefficient is given by:
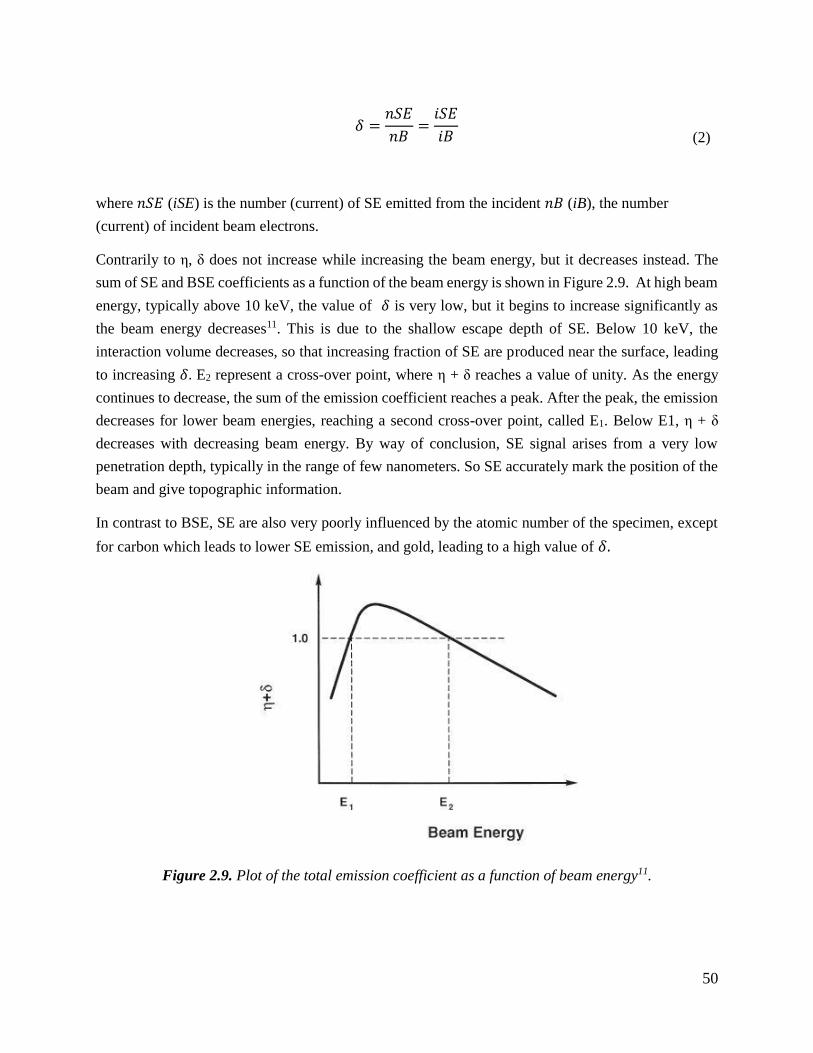
50
where 𝑛𝑆𝐸 (iSE) is the number (current) of SE emitted from the incident 𝑛𝐵 (iB), the number
(current) of incident beam electrons.
Contrarily to η, δ does not increase while increasing the beam energy, but it decreases instead. The
sum of SE and BSE coefficients as a function of the beam energy is shown in Figure 2.9. At high beam
energy, typically above 10 keV, the value of 𝛿 is very low, but it begins to increase significantly as
the beam energy decreases11. This is due to the shallow escape depth of SE. Below 10 keV, the
interaction volume decreases, so that increasing fraction of SE are produced near the surface, leading
to increasing 𝛿. E2 represent a cross-over point, where η + δ reaches a value of unity. As the energy
continues to decrease, the sum of the emission coefficient reaches a peak. After the peak, the emission
decreases for lower beam energies, reaching a second cross-over point, called E1. Below E1, η + δ
decreases with decreasing beam energy. By way of conclusion, SE signal arises from a very low
penetration depth, typically in the range of few nanometers. So SE accurately mark the position of the
beam and give topographic information.
In contrast to BSE, SE are also very poorly influenced by the atomic number of the specimen, except
for carbon which leads to lower SE emission, and gold, leading to a high value of 𝛿.
Figure 2.9. Plot of the total emission coefficient as a function of beam energy11.
𝛿 =
𝑛𝑆𝐸
𝑛𝐵=𝑖𝑆𝐸
𝑖𝐵
(2)
51
Cryo-EM
The fast development of EM has enabled unprecedented achievements in the field of life science and
materials science. In particular, the 2017 Nobel Prize of chemistry was awarded to three scientists who
contributed significantly to develop cryo-electron microscopy (cryo-EM)13. Essentially, cryo-EM is a
type of EM that allows for the specimen of interest to be viewed at cryogenic temperatures. Such
method is very effective in imaging of samples containing moisture. In general, biological molecules
form an intact structure in fully hydrated or in partly hydrated form (e.g. when embedded in a lipid
membrane) and generally perform their function with large areas of their surface exposed to aqueous
environment. The primary advantage of cryo-EM techniques is that it allows to observe such structure
in their near-native environment, without the use of chemical fixating or contrasting agents. In the
cryo-EM procedure, specimens are created by rapid freezing of biomolecules in solution and loaded
into the column of an electron microscope operating at high-vacuum and at low temperature to keep
the ice in amorphous state. This procedure has three distinct advantages over chemical fixation: (i) it
is achieved within milliseconds and it ensures simultaneous immobilization of all macromolecular
components; (ii) it can facilitate the study of dynamic processes while sublimation of the sample occurs
inside the microscope chamber; (iii) it lowers samples induce radiation damage without the use of
coating agents. Cryo-EM can be used for structure determination of isolated biomolecular
complexes across a wide molecular mass range from proteins with several tens kilo-Daltons to virus
particles with many mega-Daltons and to whole cells14,15. Additionally, once the sample is frozen it is
usually fractured before analysis on the microscope. Such fracture, especially in Cryo-SEM, exposes
surfaces that might otherwise remain obscure or not accessible.
3. EM approach in this study
The aim of this subchapter is to report the EM approaches used during our work. Not only the specific
technique that led to the main conclusions or hypothesis, but rather a complete set of imaging methods
used to attempt nanoscale understanding of our system. Therefore, a brief outcome of the micrographs
obtained with each imaging technique as well as pros and cons for imaging our system are discussed
along the sections.
EM- sample preparation
Samples were prepared by mixing an aqueous suspension of fillers (Si or CB) with NR latex. In terms
of concentration of components, two main approaches were investigated:
(a) CONCENTRATED PROTOCOL: High ammoniated NR latex with 60wt% in rubber was
mixed with a slurry of fillers (silica/CB) (silica: Kisker Biotech, 100nm) (CB: N234) at 5wt%. In case
of silica, the slurry was prepared in ionic suspension composed of magnesium sulfate (MgSO4)
(Sigma-Aldrich) with ionic strength of 0,1 M. In both cases, the mixing gives rise to instant
coagulation, and further formation of a composite after evaporation of the solvent (Figure 2.10).

52
Figure 2.10. Schematic illustration of coagulum and composite formation using the concentrated
protocol.
(b) DILUTED PROTOCOL: High ammoniated NR latex was diluted to 0.075 wt% (to visualize
individual rubber particles) and then combined with an aqueous suspension of fillers, to obtained a
binary colloidal suspension. Immediately after mixing, 100 µL of this suspension were deposited on
the microscope support (grid/coverslip/cupule). resulting in a casted drop with a spherical cap shape.
In these conditions, flocculation occurs on the deposited drop inducing a phase-separation, giving rise
to a coagulum, macroscopically visible after 1h from deposition (t=1h). At t=24h, after complete
solvent evaporation, a composite is then obtained (Figure 2.11).
Figure 2.11. Schematic illustration of coagulum and composite formation after the deposition of the
binary colloidal suspension on the glass coverslip.
Cryo-SEM: an attempted approach to structurally characterize the system
To approach the industrial protocol, we first attempted to structurally characterize the coagulum
produced with the concentrated protocol. Cryo-SEM was chosen as technique to investigate the
nanostructure of the formed material. The specimen preparation involved insertion of a small portion
of the formed coagulum in cupule carriers, and subsequent high-pressure freezing. Such type of
freezing method is currently the only method available to vitrify “thick” sample (up to 200µm)16. The

53
high-pressure freezing machine (EM HMP100, Leica) consisted of a largely automated system with an
integrated workstation. The optimum pressure of 2100 bar needs to be applied to the sample which
solidifies within 8-10 ms, followed by immediate rapid cooling to at least -140 °C to prevent the
introduction of artifacts caused by high pressure. Freezing at this pressure theoretically prevents ice
crystal formation (Figure 2.12). The centerpiece is a versatile cartridge, consisting of highly durable
polymer pieces. The assembled cartridge holds the specimen carrier sandwich (or other container) and
guides it automatically through the freezing process, finally releasing cartridge, carriers, and sample in
liquid nitrogen. This guarantees that the whole freezing sequence from pickup of the specimen to liquid
nitrogen is consistent and reproducible.
Figure 2.12. Diagram showing the stable states of water depending on pressure and temperature. At
2100 bar water can be rapidly cooled to -140 °C changing to a very viscous liquid. I, II and III show
ranges in which water is present as hexagonally oriented ice, or ice crystals. Source: EM HMP100
Leica manual.
Typical cryo-SEM micrographs of the fracture sample showing the structure of the coagulum obtained
mixing a slurry of Si with NR latex using the concentrated protocol are shown in Figure 2.13. The
images coagulum shows a fiber-like organized matrix in which few NR particles are deposed up-on.
In Figure 2.10c, the colloidal form of few LRPs and Si fillers can be noticed. However, the very few
amount of NR particles led to a difficult interpretation of the image. With the aim to visualize more
individual NR particles, cryo-SEM was also employed to structurally characterized the binary colloidal
suspension obtained with the diluted protocol. This time, high-pressure freezing was applied on the
binary colloidal suspension, but unfortunately results did not lead to the visualization of NR globules
and fillers. The high amount of frozen solvent hindered the visualization of the particles. Overall,
although the advantages previously reported using cryo-EM techniques, the constraint encountered
while employing such methods led us towards the employment of both FESEM and TEM with a prior
chemical fixation method.

54
Figure 2.13. Cryo-SEM micrographs of coagulum prepared with concentrated protocol. (a) Large
view. (b) Typical view of an inner fractured plane of the sample. (c) Magnified view of the boxed region
in b.
Chemical fixation: preparation for TEM and SEM
As previously mentioned, the employment of SEM and TEM requires dehydration of the sample during
preparation and observation condition. For this reason, the use of fixating and contrasting agents is
most often required when using these techniques. One of the originalities of our EM approach lies on
the chemical sample’s fixation using vapor of osmium tetroxide. This agent acts not only as fixative,
but also as an electron dense stain, and this is one of its major advantages over most known fixatives.
Osmium tetroxide is a powerful oxidizing agent and is extremely volatile; it melts at 41°C to give a
pale yellow liquid which boils at 131°C 17. It is generally believed that fixation of cell membranes by
osmium tetroxide involves unsaturated lipids18. The presence of a double bonds in the lipid molecule
appears to be a prerequisite to any reaction between lipids and osmium. One molecule of osmium reacts
with one double bond, leading to the formation of a cyclic osmic acid monoester. This monoester is
not very stable and it is easily hydrolyzed reacting with diols, giving rise to a stable diester, as shown
in Figure 2.14.

55
Figure 2.14. Reactions occurring during fixation of lipids with osmium tetroxide.
Very little is known about the interaction between osmium tetroxide and proteins. However, there is
evidence that osmium tetroxide has a fixative cross-linking function on tissue protein and that protein-
lipid crosslinking may occur in systems where these components are intimately mixed18.
Figure 2.15. Complete chemical fixation with osmium tetroxide shown on sample deposited on glass
coverslip.
To avoid immersion and direct contact of the specimen with the osmium tetroxide solution, vapor
fixation has been employed. To do so, a 1% solution of osmium tetroxide was prepared
extemporaneously. Subsequently, drops of osmium tetroxide were deposited around the sample’s
support placed in a hermetic box protected from light. After 30 minutes, the specimen showed a black
color indicating the presence of reduced osmium, and fixation was considered complete (Figure 2.15).
This type of fixation can be applied at any stage, independently to the degree of solvent evaporation,
allowing to preserve the structure of either NR particles, fillers, or the resulted coagulum and
composite. A typical SEM micrograph showing the structure of NR globules obtained after fixation
with osmium tetroxide is shown in Figure 2.16a. In comparison, when no fixation is applied, the
colloidal structure is shown as collapsed (Figure 2.16b).

56
Figure 2.16. SEM micrograph showing the structure of NR globules obtained (a) post osmium
tetroxide fixation and (b) without the use of any fixating agents.
Additionally, in the case of SEM, because of the high affinity of osmium tetroxide for NR, this type of
fixation allowed us to exploit BSE imaging based on chemical contrast. This is one of the advantages
in the use of SEM imaging over TEM as presented in the next subsection.
TEM vs SEM
After chemical fixation, both TEM and SEM imaging were employed to study our system. The aim of
the subsection is to present both approaches, showing typical images, and to discuss advantages and
disadvantages of the corresponding techniques for imaging our system.
Our TEM approach consisted in the deposition of the NR-filler binary colloidal suspension on
formvar/carbon grids and consequent fixating with osmium tetroxide at different evaporation stages.
Typical TEM micrographs showing the structure of the fixed NR-Si binary colloidal and the obtained
composite material after complete solvent evaporation are shown in Figure 2.17a and Figure 2.17b,
respectively. Please note that, the structural transition between the two stages is one of the main point
of our work and it will be discussed in chapter 3 and chapter 4. Herein, the discussion is limited on the
advantages and drawbacks of the techniques. During imaging of the binary colloidal suspension with
TEM, LRPs can easily be distinguished. while SRPs and Si fillers show similar opacities. On the other
hand, the composite material showed the major presence of tiny filaments, probably relating to
polyisoprene chains. Although the high resolution allowed imaging of the polymer chains, it is not
easy to distinguish Si fillers. Additionally, because of the accumulation of the information along the z-
axis, it is not possible to understand the topography of the sample.

57
Figure 2.17. TEM micrographs of NR-Si obtained after fixation of (a) binary colloidal suspension and
(b) the resulting composite after complete solvent evaporation.
One of the main differences between SEM and TEM relies on the choice of the support for the
deposition of the sample. When using TEM, it is very often necessarily to deposit the sample on grids,
whereas the employment of SEM allows a more flexible choice for supports. Glass coverslip can be
used when working with SEM, while they cannot be used for TEM. Another difference concern coating
often applied when using SEM, to avoid overcharging effects while imaging. In this work, 10 nm
carbon layer were deposited on the sample by double thread evaporation in high vacuum (10-5 mbar)
with an ACE600 device (Leica, Germany). Typical SEM micrographs, exploiting both SE and BSE
signals, obtained by post fixation and coating of the NR-Si binary colloidal suspension deposited on
glass coverslips and corresponding composite are shown in Figure 2.18. Please note that, the reported
example involves Si fillers, but similar conclusion can be made when working with CB. In both cases,
SE allows to understand the topography of the sample by analysis of the SE signal, while the BSE
signal exploits chemical contrast. By combining the information given from both signals, we can now
more easily distinguish osmium-labelled NR globules from Si fillers, as well as LRPs from SRPs
(Figure 2.18a and Figure 2.18b). Moreover, the use of SEM gives access to information on the
distribution of fillers in the resulting composite (Figure 2.18c and Figure 2.18d). Additionally, the less
cumulative z information allowed to better understand the structural transition from the binary colloidal
suspension to the resulting composite, one of the major aims our study.

58
Figure 2.18. SEM micrographs of NR-Si obtained after fixation and coating of binary colloidal
suspension and its resulting composite. (a) SE and (b) BSE image of the binary colloidal suspension.
(c) SE and (d) BSE image of the resulting composite obtained after complete solvent evaporation. Si
fillers appear dark in BSE images.
By way of conclusion, advantages and drawbacks of TEM and SEM employment in our study are
summarized in Table 2.1. TEM offers high magnification and the best resolution. However, the z
cumulative information prevents to access the topography. On the other hand, SEM has several
advantages over TEM. These main advantages refer to (i) the possibility to access the topography, (ii)
the combination with BSE imaging, (iii) access to distribution of fillers in the composite and (iv) a
flexibility in the use of several supports.
For these reasons, the original SEM approach described was chosen as main EM technique employed
in the study.

59
Table 2.1. Advantages and drawbacks of TEM and SEM as imaging techniques of our system.
TEM SEM
Advantages
-Best resolution
-Visualization of polyisoprene chains
Advantages
-Topography
- Possibility of BSE imaging
- Distribution of fillers in composite
- Flexible adaptation to supports (grids, glass)
Drawbacks
-Not easy to distinguish between Si fillers and
SRPs
- z cumulative information
- Necessarily to work with thin samples
-Not flexibility in the use of several supports
(not possible with glass coverslip)
Drawbacks
-Necessity of coating
- Very surface related information
- Slow imaging (slow scan + line average)
FESEM workstation
Since the first commercial product development by Cambridge Instruments in 1965, the SEM has been
improving in terms of resolution, image contrast and operability, etc., to show remarkable progress in
today’s instruments. A high brightness electron source is essential for attaining high resolution SEM.
In 1968, Prof. A.V. Crewe of the University of Chicago developed the field emission (FE) electron
source. Using FE source, electrons are extracted by the intense electric field which provides 1000 times
higher brightness than a conventional thermionic electron source with tungsten filament19. The FE
electron gun source was then commercialized giving rise to the FESEM era.
In this work, FESEM was performed using a Gemini500 (Zeiss, Germany) driven by SmartSEM
(version 6.3), operating in high vacuum (10-6 mbar in the observation chamber). In the set-up, electrons
are extracted by the electric field and they are accelerated at a voltage ranging from 0.02 V and 30 kV
to be focused on the sample by the use of a condenser and objective lenses (nano-twin objective lens
system). The image area is irradiated by the electrons in a sequential pattern, controlled using scanning
coils (Figure 2.19a). SE signal was collected with the corresponding in-lens detector located beyond
the objective lens. BSE signal were collected with the Energy Selective BSE in lens detector using
filtering grid > 400 V to filter out SE signal. The detection efficiency of this type of detector results
from its geometric position in the beam path and from the combination with the
electrostatic/electromagnetic lens (Figure 2.19b).

60
Figure 2.19. Simplified schematic illustration of the FESEM setup. (a) Main elements of the set-up.
(b) Magnified view of the detection system20.

61
4. Optical microscopy- a focus on d-STORM
Recent advances in fluorescence microscopy, together with a large panel of fluorescent probe have
undoubtedly transform life sciences investigations. However, adoption of these techniques by materials
science has been at a slower pace. Nanoscale imaging of materials has been mostly performed with
EM or SPM. With the advent of super-resolution microscopy (or nanoscopy), which typically offers a
spatial resolution of tens of nanometers, the resolution gap between fluorescence imaging and
EM/SPM is closing4. This improvement opens new opportunities, to unravel new insights in structures
of materials. In this work, commonly employed fluorescence protocol and techniques applied in
biological studies (confocal and d-STORM microscopy) were transposed to the field of polymer
composites. This subsection reports the fundamentals fluorescence microscopy, followed with a
description of the employed fluorescence imaging methods.
Fundamentals of fluorescence spectroscopy and microscopy
When light interacts with matter, several processes may occur at molecular level depending on the
physical and chemical properties of the sample (Figure 2.20a). The processes involved in an absorption
and emission of light are usually well described using the Perrin-Jablonski diagram (Figure 2.20b):
first molecules undergo transition from ground (S0) to an excited state (S1, S2…..Sn) by absorbing
photons of appropriate wavelengths corresponding to the energy gap between the ground and the
excited states. Once the molecule is in its excited state, there are several possible de-excitation
pathways are available. In particular, the return to the ground state can occur non radiatively (wavy
arrows in Figure 2.20b) or radiatively from either the first singlet excited state (fluorescence) or the
singlet triplet state (phosphorescence). Thus, when a molecule returns from S1 to its ground state S0
while emitting photons, it fluoresces. The photon emission for these states occurs from the lowest
vibrational sate, thus the energy of the emitted photon will always be less than the one of the incident
photon. This results in a fluorescence emission spectrum shifted to higher wavelengths than that of the
absorption spectrum. The shift between the maximum of the first absorption band and the maximum
of fluorescence is called Stokes shift21. This is a very important parameter in the selection of fluorescent
probes for fluorescence microscopy. As described below, experimentally it is necessary to separate the
fluorescence emission form the absorption and thus the use of fluorophores with large Stokes shift is
preferred.

62
Figure 2.20. (a) Possible interaction between light and matter. (b) Perrin-Jablonski diagram and the
characteristic times of the different processes. Straight arrows denote radiative process and wavy
arrows denote non-radiative processes21.
Confocal laser scanning fluorescence microscopy
The golden age of fluorescence microscopy came with the development of laser scanning microscopy
in the 1980s, and further use of Confocal Laser Scanning Microscopy (CLSM). Confocal means that
the image is obtained from one focal plane only, while any noise resulting from any other planes is
removed. On the other hand, laser scanning means the images are acquired point by point under
localized laser excitation rather than wide field illumination, as in conventional fluorescence
microscopy. To eliminate the noise resulting from the planes other than the focal one, two optically
conjugated pinholes are integrated on the excitation and detection pathways (Figure 2.21)22. In this
way, confocal microscopy is able to minimize “pollution” of the fluorescence signal by adjusting the
size of the pinhole: the smaller the pinhole, the narrower the depth of the in-focus field.
Even though resolution is somewhat enhanced with confocal microscopy over conventional wide field
techniques, the fluorescence emitted by a point is not imaged to a point in the detection, but it is spread
by diffraction. This pattern refers to as Point Spread Function (PSF). The result of this phenomena is
an image of the point source that is much larger than the actual size of the object. The size of the PSF
determines the lateral and axial resolution. It depends on the numerical aperture of the objective, on
the light excitation wavelength and on the fluorescence wavelength of the fluorescent particle.
Typically, in the visible domain, the lateral resolution is of few hundreds of nanometers (200-400 nm)
and the axial resolution of some micrometers (3-5 µm).

63
Figure 2.21. Schematic illustration of the main elements of confocal laser scanning microscopy
(CLSM).
Although very few studies have employed CLSM to investigate the structure of NR23, our group has
successfully employed CLSM to identify some important parameters for NR- Si fillers aggregation
during the liquid route24: importance of ionic medium, size of the filler particles, filler/rubber volume
percent ratio. To do so, fluorescent Si particles were used, while NR can be seen by transmission
images. However, the method fails to distinguish the spatial distribution of proteins from the one of
the lipids and their localization in respect to Si fillers as illustrated in the Figure 2.22, where proteins
and lipids appeared as co-localized in an aggregate.
Figure 2.22. Fluorescence intensity image (acquired on a Confocal microscope) on adhered NR –
100nm plain Silica heteroaggregate, with fluorescent labelling of proteins (red) and lipids (green) of
NR. The image shows a co-localized signal for proteins and lipids (yellow part).
64
Super-resolution fluorescence microscopy Super-resolution fluorescence microscopy is the term commonly given to fluorescence techniques with
resolution that are not limited by the diffraction of light. The super-resolution microscope,
development of which won the 2014 Nobel Prize in Chemistry, has been widely employed for
biomedical applications but nowadays an increasing number of laboratories are starting it to study
materials4. However, adoption of super-resolution fluorescence microscopy by materials science has
been at a slow pace. Nanoscale imaging of materials is typically performed by electron microscopy or
scanning probe techniques. While these techniques offer an unrivalled resolution, they have limitations
concerning the labeling and distinction of biological and chemical elements. To date, super-resolution
methods can be separated into two categories. The first one concerns deterministic methods based on
patterned excitation (or depletion), including STimulated Emission Depletion (STED) microscopy,
Ground State Depletion (GSD) microscopy25 and (saturated) structured illumination microscopy
((S)SIM)26. The second one concerns stochastic methods based on single molecule localization, such
as (fluorescence) Photo Activated Localization Microscopy ((f)PALM), (direct) STochastic Optical
Reconstruction Microscopy ((d)STORM) and Points Accumulation for Imaging in Nanoscale
Topography (PAINT). The group of these techniques fall under the common name of Single Molecule
Localization Microscopy (SMLM).
In this study we employed d-STORM imaging method.
d-STORM imaging
In this subsection we will introduce the principle of d-STORM and briefly discuss theprotocol designed
for the experiments.
d-STORM imaging relies on three key point: (i) the use of photo-switchable fluorescence probes,
called fluorophores, (ii) stochastic activation and temporal separation of the fluorescence signal to
separate single molecules in space and time, and (iii) single molecule localization27. To achieve
stochastic photo-switching, the probes are modulated between an “ON” and “OFF” state (Figure 2.23).
When most of the fluorophores are forced to reside in a long-lasting dark off-state, only a small subset
in the on state emits fluorescence at a given time28. In each single image, the PSF of single molecules
is approximated with a Gaussian function, and it provides information on the localization of the probe.
By sequentially imaging typically several thousand subsets of spatially distinguishable fluorophores,
all of the emitters are detected over time, and an artificial image can be reconstructed. As a result, d-
STORM and similar methods provide a list of single-molecule coordinates, which is in contrast to
conventional microscopy techniques which provide intensity information directly.

65
Figure 2.23. Schematic illustration of d-STORM principle. (a) Photoswitchable fluorophores are
transferred from a fluorescent bright state into a non-fluorescent dark state. (b) Perrin-Jablonski
diagram associated with photo-switching occurring during (d)STORM. The left white part is the
normal Jablonski diagram with the associated ground state S0, excited state S1 and triplet state T1.
Corresponding rates are the excitation rate kexc, emission rate (kfl), non-radiative decay rate knr and
inter-system-crossing rate kisc. The F•−denotes the radical anion dark-state.
As briefly mentioned in subsection 3.1, when a fluorophore accesses its excited state, besides relaxing
directly to the ground state through either photon emission or non-radiative internal conversion, it can
release its excess energy by undergoing several other intramolecular and intermolecular processes.
Through the intramolecular transition process known as intersystem crossing, fluorophores can reach
an intermediate energy state called the triplet state (T1). Such state has a much longer lifetime than the
fluorescence state, typically several microseconds. Once in this state, and in the presence of a reducing
agent which match the redox potential of the fluorophore, an electron transfer reaction can occur. The
result of such a reaction can be a non-fluorescent radical state (F●−) in which it can remain for several
seconds or minutes29. This radical state represents the non-fluorescent OFF state of the probe. Upon
reaction with molecular oxygen or irradiation with UV light, the molecule returns to the ground state,
and fluorescence is recovered.
The rate for the transition from the fluorescent ON-state into the non-fluorescent OFF-state is
controlled by the concentration of the reducing agent as well as the intensity of the excitation source.
The reducing agent is contained in the imaging buffer. Commonly used reducing agents are:
mercaptoethylamine30, dithiothreitol31, and glutathione31. In addition to the reducing agents, other

66
chemicals are also added. In particular, the imaging buffers rely on an enzymatic oxygen scavenging
system32. In fact, molecular oxygen plays an important role in many of the fluorophore’s electronic
state transition. Since the ground state of molecular oxygen is also a triplet it easily reacts with a triplet-
state fluorophore in an electron transfer reaction. This can return the fluorophore to its ground state,
but it also produces singlet oxygen and reactive oxygen species. To avoid so, oxygen must be removed
from the imaging solution by adding enzymatic systems such as combination of glucose oxidase,
glucose, and catalase.
Another important point to consider when performing d-STORM refers to the choice of the
fluorophore. The chosen fluorophore should be as bright as possible to ensure that sufficient signal is
detected and distinguished from the background noise. Additionally, the non-fluorescent dark times of
fluorophores must be long enough to guarantee the separation of single-molecules signals. The dye
Alexa Fluor 647 is a typical fluorophore of choice for SMLM studies, due to its robust photoswitching
and good photons yield. The latter parameter has a direct influence on the accuracy of SMLM
measurements. Several formulas have been introduced to estimate the resolution of SMLM
measurements33,34. For high signal to noise ratio, the resolution limit of SMLM can be simplified to
Where d is the conventional resolution limit and N is the number of photons detected in a single
fluorescence spot28.
In our study, we were interested with fluorescent probes capable to independently target proteins and
lipids of NR and silica fillers. The latter were purchased fluorescently stained from Kisker-biotech.
Although the company did not reveal the specific type of fluorophore used they disclosed that its
position is located in the inner part of the silica particle rather than on its surface. For the labelling of
proteins, click chemistry was exploited. Specifically, we used a cyanine 5 (Cy5) fluorophore carrying
a NHS ester group capable to react with primary amines groups of proteins under aqueous condition
forming a stable amide bond. On the other hand, affinity based-labelling was used to target lipids. In
particular, indocarbocyanine fluorophores (Dil or DID) were used as probes to stain lipids of NR. The
fluorescence of these molecules is strongly increased when they merge into membranes or bound to
lipophilic biomolecules. In terms of structure, Dil and DID are amphiphilic probes comprising a
charged group and a lipophilic aliphatic tail that insert into hydrophobic membranes. The good
performance of these probes for d-STORM experiments on cell membranes has been previously tested
showing good blinking capabilities35, without affecting any physiological feature and cell mobility.
Additionally, both proteins and lipids probes were previously reported for their specific labelling in
NR during the work of Wu et al36. The molecular formula together with spectroscopic properties of the
fluorophores involved in this study are summarized in Table 2.2.
𝑑𝑆𝑀𝐿𝑀 =
𝑑
√𝑁
(3)

67
Table 2.2. Structure and spectroscopic properties of the fluorophores used in this study.
5. d-STORM set-up in this study
The key technical requirements for a d-STORM optical set-up are (i) a powerful laser to photo-bleach
most fluorophores and activate only a small portion of sparsely distributed single fluorophores, (ii) a
high numerical aperture (NA) objective to efficiently collect the limited number of photons emitted by
single molecule, and (iii) a powerful camera with high quantum efficiency and low noise to record the
image from individual fluorescent emitters at a high signal to noise ratio37.
A schematic of the optical set-up used in this study is presented in Figure 2.24. It is equipped with a
Nikon Eclipse Ti inverted microscope with a Nikon perfect focus system. The excitation was
performed thanks to two different laser lines: 532 nm (Verdi G5, 5W, Coherent) and 637 nm (Obis
637LX, 140mW, Coherent) (the excitation light is represented by a green light in Figure 2.24). Both
laser beams are focused onto a rotating diffuser to homogenize the spatial distribution of the beams
illumination. They are further projected onto the sample through a high numerical aperture and
magnification objective (APO TIRF x100 1.49NA, Nikon).

68
Figure 2.24. Schematic diagram of the experimental set-up for d-STORM imaging. A 532 nm and 637
nm were used as excitation source, but for simplicity only a green light representing the 532 nm laser
source is represented. Through series of lenses and passing through a rotational diffuser the excitation
beam is focused on the objective (APO TIRF x100 1.49NA, Nikon). Three types of excitation modes
are available comprising wide field (EPI), Total Internal Reflection Fluorescence (TIRF) and Highly
inclined laminated optical sheet (Hilo). The collected fluorescence path is represented by a red light,
and it passes through a dichroic mirror before being projected on a sensible complementary metal
oxide semiconductor camera (iXon 3, Andor).
A movable mirror enables to switch among wide-field illumination, total internal reflection
fluorescence (TIRF)38 and highly inclines laminated optical sheet (Hilo) illumination39 (Figure 2.25).
TIRF is very effective in reducing the background noise, but only fluorophores in a very thin layer
close to the coverslip are excited. The penetration depth achieved using TIRF illuminations is limited
to 300-400 nm from the glass surface. Thus, in case of NR globules adhered on the surface only a
section of LRPs can be illuminated (Figure 2.25a and a1). An alternative to TIRF excitation is to
illuminate the sample using Hilo illumination. In this mode, the excitation laser light leaves the
objective at a very narrow angle, which results in an inclined beam passing through the sample. In this
way, deeper penetration depth can be achieved (few micrometers) (Figure 2.25b). This illumination in
the form of an optical light sheet is then almost perpendicular to the detection path of the microscope.
In this study, both modes have been tested as it will be discussed in more details in chapter 4. Briefly,
due to the thickness of the sample, most of the experiments have been performed using Hilo

69
illumination, which allows the excitation of the whole sample volume of the sample.
Figure 2.25. Schematic illustration of (a) TIRF and (b) Hilo excitation applied to our system. The
penetration depth when using TIRF is limited to 300-400 nm so that only a section of LRPs adhered
on the coverslip can be excited. Using Hilo excitation, the penetration depth is of several micrometers.
Regardless of the type of excitation mode, the fluorescence emitted from the sample (represented by a
red light in Figure 2.24) is collected by the objective and further passes through a dichroic mirror
containing multiband filter to eliminate residual laser light. Finally, the fluorescence light is then
focused on a complementary metal oxide semiconductor camera with 50 ms exposure time (iXon 3,
Andor).
For certain experiment, in particular to control how NR globules adhere on the coverslip, direct optical
nanoscopy with axially localized detection (DONALD) was employed. To do so, the detection part of
the set-up was modified combining the d-STORM information with Supercritical-Angle Fluorescence
analysis40. The complete description of the DONALD system is detailed elsewhere41 and it goes
beyond the scope of this manuscript. However, the advantage of this technique relies on the possibility
to achieve 3D nanometer resolution gaining information on the axial position of fluorophores within
~400 nm from the coverslip interface. A typical 3D view of NR globules adhered on the coverslip
is shown in Figure 2.26a revealing that NR particles adhere on the coverslip forming a cap shaped 3D
semi-sphere which can be recognized on the magnified view of a single LRP (Figure 2.26b).

70
Chapter 2: Imaging methods for structural characterization of
polymer composites: focus on FESEM, d-STORM and
AFMIR
Figure 2.26. Typical 3D image of NR globules adhered on the coverslip using DONALD detection.
Large view of several NR globules (a). Magnified 3D view on a single LRP showing the axial position
of the detected fluorophores revealing that NR globules adhered on the coverslip forming a cap shaped
semi-sphere.

71
Chapter 2: Imaging methods for structural characterization of
polymer composites: focus on FESEM, d-STORM and
AFMIR
6. Atomic Force Microscopy combined with Infrared spectroscopy:
AFM-IR method
We have used for the first time a highly performant and resolute technique combining atomic force
microscopy (AFM) and infrared spectroscopy (IR), named AFM-IR. The technique allows to image
and identify the chemical composition of a sample with tens of nanometers spatial resolution. Prior to
directly describe the technique, we will first recall basic elements of AFM and IR spectroscopy.
Atomic Force Microscopy (AFM)
AFM belong to the family of SPM techniques. Since its invention by binning and coworkers in 1986,
it has become an essential tool for material research. It allows visualization and investigation of the
surface properties of samples with nanometer resolution without the use of chemical agents. In AFM,
a sharp tip attached to the end of a cantilever is approached to the surface42. As a consequence, a force
appears between the tip and the surface causing the cantilever to bend. To measure these movements,
a laser is reflected on the backside of the cantilever. The change in the laser reflection is then detected
using a plane photodetector (usually a photodiode). By linking the voltage to a function of the spatial
position of the laser on the photodiode (top-bottom and left-right), it is possible to have direct access
to the movement of the cantilever (Figure 2.27). In this way it possible to obtain a topographic map of
the sample surface. In such set-up, the lateral x-y resolution mainly depends on the radius of the apex
of the AFM tip43, while the vertical one strongly depends on the noise of the photodiode44.
There are several available modes of imaging allowing AFM to characterize all varaities of materials
hard or soft, synthetic or natural. The sample is usually image in air, but it can be in liquid environment
and in some cases under vacuum42. The most common imaging modes can be classified into: contact
mode, and tapping mode. In contact mode the tip scans the sample surface by remaining in close contact
to it. The sample surface profile is generated by operating in constant force mode, adjusting the pixel-
by-pixel height of the tip. The contact force causes the cantilever to bend and therefore accommodate
changes in topography. Although contact mode is widely used, its application for soft material or
biological systems poses difficulties because of friction and the force applied between the tip and the
sample. For this reason, tapping mode was invented. In such mode, the cantilever tip oscillates at or
near its natural resonance frequency while allowing the tip to impact the sample surface for a minimal
amount of time. The cantilever’s oscillation amplitude changes with sample surface topography, and
the topography image is obtained by monitoring these changes45. However, the topographic contrast
relies on complex interaction mechanisms between the AFM tip and the sample. Stiffness, roughness,
surface charge and chemistry can change the oscillation of the tip46.

72
Chapter 2: Imaging methods for structural characterization of
polymer composites: focus on FESEM, d-STORM and
AFMIR
Figure 2.25. Schematic illustration of the AFM set-up47.
The AFM method is a very versatile technique, that besides topography characterization of a surface
also offers the possibility to measure the surface forces, mechanical properties and adhesion forces of
a sample. Such utilization of AFM is outside the scope of this thesis but was still used by our group to
discriminate the mechanical properties of small (SRP) and large (LRP) rubber particles in aqueous
environment48.
IR spectroscopy
IR spectroscopy deals with the measurement of the interaction of IR radiation with matter. In particular,
absorption of an IR photon occurs when the frequency of the absorbed radiation matches a
characteristic vibrational frequency of the molecule involved in the interaction49. Thus, in the IR
domain, it is the vibrational levels of the chemical bonds that are called upon. The absorption of IR
radiation by a molecule can be likened to two atoms attached to each other by a massless spring. Taking
the simple case of diatomic molecules, such molecules have three degrees of translational freedom and
two degrees of rotational freedom. The atoms in the molecules can also move relative to one other, that
is, bond lengths can vary or one atom can move out of its present plane. This is a description of
stretching and bending movements that are collectively referred to as vibrations50 (Figure 2.26). More
energy is needed to stretch a bond, than that to bend it. For this reason, stretching occurs at higher
frequencies than bending. Additionally, some bond can stretch in-phase or symmetrically, while others
can stretch out of phase or asymmetrically. Similarly, bending radiation can also be in plane or out of
plane.

73
Chapter 2: Imaging methods for structural characterization of
polymer composites: focus on FESEM, d-STORM and
AFMIR
Figure 2.26. Example of stretching and bending modes.
The interesting aspect about IR spectroscopy is that functional groups of molecules adsorb radiation in
specific ranges of frequencies, giving rise to a “signature” of that group. This feature allows the
identification of unknown compound. In terms of ranges of frequencies, the IR region is mainly divided
into: the near-IR, the mid-IR, and the far-IR49. Near-IR region goes from 14000 cm-1 to 4000 cm-1, the
mid-IR goes from 4000 cm-1 to 400 cm-1, and the far-IR from 400 cm-1 to 10 cm-1. The mid-IR region
is particularly interesting for the analysis of the vibration of chemical bonds in organic compounds as
most of the fundamental transitions of organic functional groups are found between 4000 to 600 cm-1.
Whereas, the region below 1200 cm-1 is known as “fingerprint” region, because it is composed of a
series of sharp peaks which correspond to a particular compound rather than functional groups. It is in
this last region, at 1100 cm-1, that the Si fillers used in this study present a very sharp and characteristic
peak, corresponding to the Si-O-Si asymmetric stretching. This signature has been used to localized Si
fillers in the NR matrix, using a combination of both AFM and IR spectroscopy; a novel approach of
AFM-IR.
AFM-IR
AFM-IR is a hybrid technique that combines the spatial resolution of AFM with the chemical analysis
capability of IR spectroscopy51. This coupling benefits from the advantages of the two individual
techniques, overcoming their respective limitations, and achieving chemical mapping at nanometer
scale. In terms of working principle, the sample is here placed on an IR transparent support (e.g. ZnSe,
CaF2), and irradiated with a tunable infrared laser focused in the proximity of a probe tip from an
atomic force microscope. If the tunable IR laser is set to a wavelength that corresponds to an absorbing
wavelength of the sample, the absorbed light induces a photo-thermal response in the sample, resulting
in thermal expansion in the absorbing region. The AFM tip can then be used to detect such thermal
expansion12. The detected signal is then proportional to the absorption coefficient53, and two type of
acquisition are possible. The position of the AFM tip can be fixed, while the laser wavenumber
changes, in order to create IR adsorption spectra with nanoscale resolution. Alternatively, the tip can
scan the sample surface, while the IR laser wavenumber is fixed. In this case, a chemical map of the
scanned sample is obtained together with the sample topography. In this configuration, a classic AFM

74
Chapter 2: Imaging methods for structural characterization of
polymer composites: focus on FESEM, d-STORM and
AFMIR
topographic image can now discriminates components based on their IR absorption. Thus, information
on chemical composition can be acquired with the same resolution as for AFM images. The
conventional set-up for AFM-IR is shown in Figure 2.27. The set-up has been developed by Dazzi et
al.54 in 2005, and further patented in 2007 in partnership with Anasys Instruments. The assembly
consists of a standard AFM system which can operate in contact mode in the open air. The sample is
placed on a IR transparent prism of ZnSe and illuminated by the IR beam from below the sample in a
total reflection configuration. The angle of illumination at the prism-object interface is chosen so that
an evanescent wave is produced at this interface. This allows a relatively homogeneous illumination
of a thin object, whatever its optical index, while limiting as much as possible the illumination of the
tip and the lever which could greatly disturb the measurement.
Figure 2.27. Schematic representation of the conventional AFM-IR set-up47.
Recently, a new configuration set-up has been developed (Figure 2.28). The major innovation consists
in the illumination of the sample and the elimination of the prism. Therefore, in this configuration, the
sample can be deposited on a wide range of substrates, as long as they are IR transparent. Moreover,
this recent set-up allows the acquisition of chemical maps choosing between the AFM tapping or
contact mode. While contact mode is suitable for a large number of samples, objects that are soft (like
NR) or not very adherent to the surface are better imaged using tapping mode. From the AFM-IR point
of view, the major challenge in using this mode is to be able to synchronize the AFM-IR measurement
with the intermittent contact with the surface. This coupling has recently been developed55, and it was
chosen as imaging mode during our study.

75
Chapter 2: Imaging methods for structural characterization of
polymer composites: focus on FESEM, d-STORM and
AFMIR
Figure 2.28. Recent configuration of AFMIR set-up55.
AFM-IR is finding numerous applications in the field of polymers, polymer blend and composites.
Tang et al.56 used for the first time this method to study the composition of high-impact polypropylene.
Additionally, Brown and Bhushan57 investigated nanocomposite films of polycarbonate containing
nanoparticles for superoleophobic surfaces.
To our knowledge, our study represents the first application of the techniques to study a composite
material composed of a NR matrix. Additionally, during the aforementioned studies, contact imaging
mode was coupled with IR spectroscopy. Whereas, the novelty of our work is also related to the use of
the tapping AFM-IR mode to study the distribution of Si fillers in the obtained composite.

76
Chapter 2: Imaging methods for structural characterization of
polymer composites: focus on FESEM, d-STORM and
AFMIR
REFERENCES
1. Bandyopadhyay, J. & Sinha Ray, S. Structural Characterization of Polymer Nanocomposites. in
Processing of Polymer-based Nanocomposites (ed. Sinha Ray, S.) vol. 277 87–126 (Springer In-
ternational Publishing, 2018).
2. Oberdisse, J., Straube, E. & Pyckhout-Hintzen, W. Structure Determination Of Polymer Nano-
composites By Small-Angle Scattering. in Recent Advances in Polymer Nanocomposites 397–
438 (Brill Academic Publishers, 2009). doi:10.1163/ej.9789004167261.i-528.112.
3. Adhikari, R. & Michler, G. H. Polymer Nanocomposites Characterization by Microscopy. Poly-
mer Reviews 49, 141–180 (2009).
4. Wöll, D. & Flors, C. Super-resolution Fluorescence Imaging for Materials Science. Small Meth-
ods 1, 1700191 (2017).
5. Böhme, U. & Scheler, U. Interfaces in polymer nanocomposites – An NMR study. in 090009
(2016). doi:10.1063/1.4942305.
6. Lila, M. K., Komal, U. K. & Singh, I. Characterization Techniques of Reinforced Polymer Com-
posites. in Reinforced Polymer Composites (eds. K. Bajpai, P. & Singh, I.) 119–145 (Wiley-
VCH Verlag GmbH & Co. KGaA, 2019). doi:10.1002/9783527820979.ch7.
7. Williams, D. B. & Carter, C. B. Transmission electron microscopy: a textbook for materials sci-
ence. (Springer, 2008).
8. Watt, I. M. The principles and practice of electron microscopy. (Cambridge University Press,
1997).
9. Transmission Electron Microscopy Characterization of Nanomaterials. (Springer Berlin Heidel-
berg, 2014). doi:10.1007/978-3-642-38934-4.
10. Zhou, W., Apkarian, R. P., Wang, Z. L. & Joy, D. Fundamentals of Scanning Electron Micros-
copy. 40.

77
Chapter 2: Imaging methods for structural characterization of
polymer composites: focus on FESEM, d-STORM and
AFMIR
11. Goldstein, J. I. et al. Scanning Electron Microscopy and X-ray Microanalysis. (Springer US,
2003). doi:10.1007/978-1-4615-0215-9.
12. Piňos, J., Mikmeková, Š. & Frank, L. About the information depth of backscattered electron im-
aging: ABOUT THE INFORMATION DEPTH. Journal of Microscopy 266, 335–342 (2017).
13. Wang, Y. Cryo-electron microscopy finds place in materials science. Sci. China Mater. 61, 129–
130 (2018).
14. Mcdonald, K. L. A review of high-pressure freezing preparation techniques for correlative light
and electron microscopy of the same cells and tissues: HPF TECHNIQUES FOR CORRELA-
TIVE LM AND EM OF SAME CELLS AND TISSUES. Journal of Microscopy 235, 273–281
(2009).
15. Murata, K. & Wolf, M. Cryo-electron microscopy for structural analysis of dynamic biological
macromolecules. Biochimica et Biophysica Acta (BBA) - General Subjects 1862, 324–334
(2018).
16. Kaech, A. & Ziegler, U. High-Pressure Freezing: Current State and Future Prospects. in Electron
Microscopy (ed. Kuo, J.) vol. 1117 151–171 (Humana Press, 2014).
17. Jenkins, R. A. Osmium tetroxide vapor fixation of dividing and regenerating Blepharisma. 162.
18. Nielson, A. J. & Griffith, W. P. Tissue fixation by osmium tetroxide. A possible role for proteins.
Journal of Histochemistry & Cytochemistry 27, 997–999 (1979).
19. Biological field emission scanning electron microscopy. (Wiley, 2019).
20. Steigerwald, D. M. EsB Detection Low Voltage – BSE Imaging. 2.
21. Valeur, B. Molecular Fluorescence Principles and Applications. Molecular Fluorescence 399
(2001).
22. Confocal Laser Microscopy - Principles and Applications in Medicine, Biology, and the Food
Sciences. (InTech, 2013). doi:10.5772/50821.

78
Chapter 2: Imaging methods for structural characterization of
polymer composites: focus on FESEM, d-STORM and
AFMIR
23. Liao, S. A Review on Characterization of Molecular Structure of Natural Rubber. MOJ Polymer
Science 1, (2017).
24. Chan, A. J. et al. Natural Rubber–Filler Interactions: What Are the Parameters? Langmuir 31,
12437–12446 (2015).
25. Hell, S. W. & Kroug, M. Ground-state-depletion fluorscence microscopy: A concept for breaking
the diffraction resolution limit. Applied Physics B Lasers and Optics 60, 495–497 (1995).
26. Gustafsson, M. G. L. & Webb, W. W. Nonlinear Structured-Illumination Microscopy: Wide-
Field Fluorescence Imaging with Theoretically Unlimited Resolution. Proceedings of the Na-
tional Academy of Sciences of the United States of America 102, 13081–13086 (2005).
27. Endesfelder, U. & Heilemann, M. Direct Stochastic Optical Reconstruction Microscopy
(dSTORM). in Advanced Fluorescence Microscopy (ed. Verveer, P. J.) vol. 1251 263–276
(Springer New York, 2015).
28. Turkowyd, B., Virant, D. & Endesfelder, U. From single molecules to life: microscopy at the na-
noscale. Analytical and Bioanalytical Chemistry 408, 6885–6911 (2016).
29. van de Linde, S. et al. Direct stochastic optical reconstruction microscopy with standard fluores-
cent probes. Nature Protocols 6, 991–1009 (2011).
30. Widengren, J., Chmyrov, A., Eggeling, C., Löfdahl, P.-Å. & Seidel, C. A. M. Strategies to Im-
prove Photostabilities in Ultrasensitive Fluorescence Spectroscopy. The Journal of Physical
Chemistry A 111, 429–440 (2007).
31. Heilemann, M., van de Linde, S., Mukherjee, A. & Sauer, M. Super-Resolution Imaging with
Small Organic Fluorophores. Angewandte Chemie International Edition 48, 6903–6908 (2009).
32. Olivier, N., Keller, D., Rajan, V. S., Gönczy, P. & Manley, S. Simple buffers for 3D STORM
microscopy. Biomedical Optics Express 4, 885 (2013).

79
Chapter 2: Imaging methods for structural characterization of
polymer composites: focus on FESEM, d-STORM and
AFMIR
33. Mortensen, K. I., Churchman, L. S., Spudich, J. A. & Flyvbjerg, H. Optimized localization anal-
ysis for single-molecule tracking and super-resolution microscopy. Nature Methods 7, 377–381
(2010).
34. Smith, C. S., Joseph, N., Rieger, B. & Lidke, K. A. Fast, single-molecule localization that
achieves theoretically minimum uncertainty. Nature Methods 7, 373–375 (2010).
35. Shim, S.-H. et al. Super-resolution fluorescence imaging of organelles in live cells with pho-
toswitchable membrane probes. Proceedings of the National Academy of Sciences 109, 13978–
13983 (2012).
36. Wu, J. et al. Super-Resolution Fluorescence Imaging of Spatial Organization of Proteins and Li-
pids in Natural Rubber. Biomacromolecules 18, 1705–1712 (2017).
37. Ma, H., Fu, R., Xu, J. & Liu, Y. A simple and cost-effective setup for super-resolution localiza-
tion microscopy. Sci Rep 7, 1542 (2017).
38. Total Internal Reflection Fluorescence (TIRF) Microscopy. Nikon’s MicroscopyU
https://www.microscopyu.com/techniques/fluorescence/total-internal-reflection-fluorescence-
tirf-microscopy.
39. Tokunaga, M., Imamoto, N. & Sakata-Sogawa, K. Highly inclined thin illumination enables clear
single-molecule imaging in cells. Nature Methods 5, 159–161 (2008).
40. Ruckstuhl, T., Enderlein, J., Jung, S. & Seeger, S. Forbidden Light Detection from Single Mole-
cules. Anal. Chem. 72, 2117–2123 (2000).
41. Bourg, N. et al. Direct optical nanoscopy with axially localized detection. Nature Photon 9, 587–
593 (2015).
42. Haugstad, G. Atomic force microscopy: understanding basic modes and advanced applications.
(John Wiley & Sons, 2012).
43. Binnig, G., Quate, C. F. & Gerber, Ch. Atomic Force Microscope. Phys. Rev. Lett. 56, 930–933
(1986).

80
Chapter 2: Imaging methods for structural characterization of
polymer composites: focus on FESEM, d-STORM and
AFMIR
44. Mr Sameer & S Gajghate. Introduction to Atomic Force Microscopy (AFM). (2017)
doi:10.13140/RG.2.2.11394.38089.
45. Jalili, N. & Laxminarayana, K. A review of atomic force microscopy imaging systems: applica-
tion to molecular metrology and biological sciences. Mechatronics 14, 907–945 (2004).
46. Dufrêne, Y. F. et al. Imaging modes of atomic force microscopy for application in molecular and
cell biology. Nature Nanotechnology 12, 295–307 (2017).
47. Dazzi, M. et al. Thèse présentée et soutenue à Orsay, le 15 Décembre 2017 : 258.
48. Chan, A. J., Sarkar, P., Gaboriaud, F., Fontaine-Aupart, M.-P. & Marlière, C. Control of inter-
face interactions between natural rubber and solid surfaces through charge effects: an AFM study
in force spectroscopic mode. RSC Adv. 7, 43574–43589 (2017).
49. Theophanides, T. Introduction to Infrared Spectroscopy. in Infrared Spectroscopy - Materials
Science, Engineering and Technology (ed. Theophanides, T.) (InTech, 2012).
doi:10.5772/49106.
50. Stuart, B. H. Infrared Spectroscopy: Fundamentals and Applications. 208.
51. Dazzi, A. & Prater, C. B. AFM-IR: Technology and Applications in Nanoscale Infrared Spec-
troscopy and Chemical Imaging. Chemical Reviews 117, 5146–5173 (2017).
52. Dazzi, A., Prazeres, R., Glotin, F. & Ortega, J. M. Subwavelength infrared spectromicroscopy
using an AFM as a local absorption sensor. Infrared Physics & Technology 49, 113–121 (2006).
53. Dazzi, A., Glotin, F. & Carminati, R. Theory of infrared nanospectroscopy by photothermal in-
duced resonance. Journal of Applied Physics 107, 124519 (2010).
54. Dazzi, A., Prazeres, R., Glotin, F. & Ortega, J. M. Local infrared microspectroscopy with sub-
wavelength spatial resolution with an atomic force microscope tip used as a photothermal sensor.
Optics Letters 30, 2388 (2005).
55. Pancani, E. et al. High-Resolution Label-Free Detection of Biocompatible Polymeric Nanoparti-
cles in Cells. Particle & Particle Systems Characterization 35, 1700457 (2018).

81
Chapter 2: Imaging methods for structural characterization of
polymer composites: focus on FESEM, d-STORM and
AFMIR
56. Tang, F., Bao, P. & Su, Z. Analysis of Nanodomain Composition in High-Impact Polypropylene
by Atomic Force Microscopy-Infrared. Analytical Chemistry 88, 4926–4930 (2016).
57. Brown, P. S. & Bhushan, B. Durable, superoleophobic polymer–nanoparticle composite surfaces
with re-entrant geometry via solvent-induced phase transformation. Scientific Reports 6, (2016).

82

83
CHAPTER 3: Natural rubber – carbon black: following
the nanostructure evolution from a colloidal suspension to
an elastomeric composite

84
Chapter 3: Natural rubber – carbon black
Introduction
The production of a rubber latex–carbon black (CB) masterbatch by liquid phase mixing is a procedure
of interest in rubber technology. One of the first approaches consisted in mixing natural rubber (NR)
latex and a CB slurry and then coagulating the mixture chemically, by addition of acid. The use of
dispersing agents, such as surfactants, to the CB slurry was also recognized as a possibility to increase
filler’s dispersion in the obtained masterbatch. However, the long mixing and coagulation times of
such processes reduces productivity. Recently, Cabot Corporation commercially launched its
continuous coagulation/liquid phase mixing technology. Here, a CB slurry prepared without the use of
any surfactant is injected into a mixer at very high speed and mixed continuously with NR latex stream.
Under high shearing condition, the mixing and coagulation is completed very rapidly, without the aid
of chemicals. The formed coagulum is subsequently extracted and dried. In 2013, Michelin bought a
license from Cabot to use this liquid-phase mixing process for its tire application. If the technological
process parameters are under control at engineering level the fundamental knowledge of the underlying
hetero-aggregation mechanism and of the processes triggering coagulation are still at its infancy. The
understanding of these processes is essential to improve the preparation of a NR-CB masterbatch.
It is in this context that the first part of the thesis is focused. Our investigation is focused on the
nanoscale structural characterization and evolution of a coagulum obtained from a binary colloidal
suspension of NR latex and a CB slurry. We investigated the dependence of NR-NR and CB-CB homo-
aggregation vs NR-CB hetero-aggregation, the structural evolution dynamics of the formed coagulum,
and the impacts of external stresses, such as shear and sonication. For this investigation, we selected
an original Field Emission Scanning Electron Microscopy (FESEM) approach as main technique. The
results are presented and discussed in the form of an article entitled “Natural Rubber- Carbon Black
coagulation: following the nanostructure evolution from a colloidal suspension to an elastomeric
composite”, submitted to the journal of Applied Polymer Science.

85
Chapter 3: Natural rubber – carbon black
Article 1: Natural rubber – carbon black: following
the nanostructure evolution from a colloidal suspen-
sion to an elastomeric composite
Gianluca Cattinari*1, Karine Steenkeste1, Catherine le Bris1, Alexis Canette2, Matthieu Gallopin3,
Marc Couty3, Marie-Pierre Fontaine-Aupart1
1 Université Paris-Saclay, CNRS, Institut des Sciences Moléculaires d’Orsay, 91405, Orsay, France
2 Sorbonne Université, CNRS, Institut de Biologie Paris-Seine, 75005, Paris, France
3 Manufacture Française de Pneumatiques Michelin, Clermont Ferrand Cedex, France
Submitted to journal of Applied Polymer Science

86
Chapter 3: Natural rubber – carbon black
Natural rubber-carbon black coagulation: following
the nanostructure evolution from a colloidal suspen-
sion to an elastomeric composite
Gianluca Cattinari*1, Karine Steenkeste1, Catherine le Bris1, Alexis Canette2, Matthieu Gallopin3,
Marc Couty3, Marie-Pierre Fontaine-Aupart1
1 Université Paris-Saclay, CNRS, Institut des Sciences Moléculaires d’Orsay, 91405, Orsay, France
2 Sorbonne Université, CNRS, Institut de Biologie Paris-Seine, 75005, Paris, France
3 Manufacture Française des Pneumatiques Michelin, Clermont Ferrand, France
ABSTRACT Making elastomeric composite materials via heteroaggregation of a binary colloidal suspension of Natural
Rubber (NR) latex and Carbon Black (CB) filler is an interesting production method to obtain an efficient
dispersion in the polymer matrix. This study successfully employs an original approach of field emission
scanning electron microscopy (FESEM), combining a specific chemical fixation method with the backscattered
electron (BSE) and secondary electron (SE) imaging modes to investigate for the first time the nanostructure
evolution of a coagulum originated from the aggregation of NR globules with CB filler in suspension.
Additionally, the role of external physical stresses,
like mechanical shear and sonication was also
investigated in terms of structural effect induced
on the formed coagulum at the nanoscopic scale.
Our results highlight destabilization of NR
globules, either induced by direct interaction with
small CB aggregates or governed by solvent
evaporation. Reduction in the size of CB
agglomerates, obtained using sonication, highly
improved filler distribution and confirmed that the
size of CB aggregates is an important parameter
responsible for the destabilization of NR globules.
1. INTRODUCTION
Field natural rubber (NR) latex extracted from Hevea brasiliensis is a colloidal dispersion of first im-
portance for many applications1, especially in the tire industry. In its raw state, it is composed of ~35%
rubber, 5% nonrubber components (proteins, lipids, sugars) and ~60% water2. The rubber fraction is
contained in the form of colloidal NR particles, corresponding to a bimodal distribution of small rubber
particles (SRPs) and large rubber particles (LRPs), with diameters ranging from 100-500 nm and 500-
1000 nm, respectively. Both types are characterized by a polyisoprene core surrounded by a thin
biomembrane primarily made of lipids and proteins3,4 (thickness ~3.5 nm). Despite its unique proper-
ties, NR is seldom used in its raw state. For example, particulate fillers such as carbon black (CB) have
been widely used to improve the mechanical properties (modulus, durability, etc.) of NR5–7. However,
mixing NR and fillers is a critical step that determines the performance characteristics of rubber com-
pounds. It has long been thought that if a CB dispersion could take place in a liquid phase process,

87
Chapter 3: Natural rubber – carbon black
many of the shortcomings in the dry mixing method could be eliminated8. Over the past decades, efforts
have been made to produce master batches by mixing NR latex with a slurry of CB under mechanical
stress9–11, giving rise to a coagulated material that is further subjected to dehydration and drying. This
type of mixing is called the “liquid route” or “colloidal dispersion pathway”. Industrially, the techno-
logical process parameters are controlled at the engineering level, but studies are required to understand
the fundamental mechanism regulating the heteroaggregation between the NR particles and CB fillers
as well as the structural evolution of the formed coagulum. Such investigations are essential to improve
the preparation of elastomeric composite materials and cannot be undertaken without the availability
of highly resolved imaging methods. In this context, we employed an original field emission scanning
electron microscopy (FESEM) approach to study the nanoscale structural evolution of an NR-CB co-
agulum along with solvent evaporation. The originality of the approach relies on (i) the fixation of the
specific chemical sample, thus preserving the colloidal structure of the NR particles as well as enhanc-
ing contrast, (ii) and the backscattered electron (BSE) and secondary electron (SE) FESEM imaging
modes. We successfully visualized the structural evolution dynamics of the coagulum from the early
stage of particle contact to the formation of a composite material. In particular, the role of mechanical
shear stress and sonication was investigated at the nanoscopic level in terms of the structural effects
induced on the formed coagulum.
2. EXPERIMENTAL
A slurry of CB (N234; density=1.8 g cm-3; surface area=120 m2/g, Cabot Corporation, Boston, US) at
5 wt% was obtained by mixing the black powder with distilled water while using an Ultra-Turrax for
5 min to prevent the formation of large CB agglomerates. Highly ammoniated NR latex (Michelin,
Clermont Ferrand, France) was used for most of the experiments, which was obtained by centrifugation
of field NR latex containing 0.7 wt% ammonia to eliminate free components and nonrubber particles
as well as to preserve the structure of NR globules12. Some experiments were also realized with depro-
teinized natural rubber (DPNR) latex obtained from a proteinase enzyme treatment of the highly am-
moniated latex. Regardless of the type, latex was diluted to 0.075 wt% rubber content and combined
with the CB slurry with a CB/rubber mass percent ratio fixed at ~40% in the binary colloidal suspension
to approach to the industrial process. Immediately after mixing, 100 µL of this suspension was depos-
ited on a rounded glass cover slip (coverslip thickness: 170 µm, MENZEL-GLASER), resulting in a
casted drop with a spherical cap shape, as illustrated in Figure 1. Under these conditions, flocculation
occurred on the deposited drop, inducing phase separation, which was macroscopically visible at t=1
h. At t=4 h, when most of the solvent was evaporated, the floating objects adhered on the glass surface.
A schematic representation showing the formation of such a phase-separated material is illustrated in
Figure 1. Herein, the term “coagulum” refers to the phase-separated material floating on the top of the

88
Chapter 3: Natural rubber – carbon black
deposited drop, while the term “composite” refers to the material obtained after the complete evapora-
tion of the solvent 24 h after the deposition of the sample on the coverslip (t=24 h). In case of samples
composed of only NR latex, and absence of CB filler, the deposition follows the same protocol.
Figure 1. Schematic illustration showing the coagulum and composite formation after the deposition
of the NR-CB binary colloidal suspension on the glass coverslip.
2.1 Application of controlled mechanical shear in the liquid suspension
For these experiments, the preparation of the sample followed the detailed description given above;
this glass coverslip constituted both the sample support and one of the shearing plates. A second mi-
croscopy coverslip was placed above the deposited drop and corresponded to the second shearing plate.
The perfect planarity and parallelism of these two microscopy coverslips were suitable for the appli-
cation of controlled shear. This was obtained using a commercial device called RheOptiCAD13,14 (CAD
instrument). It provided the ability (i) to move the top plate down at a constant and low speed to prevent
excessive compression of the sample until a gap width of 500 µm was reached between the plates and
(ii) to connect each plate to a motor controlled by software that allowed straight translation. In these
experiments, only the upper plate was displaced. The applied shear consisted of 10 oscillation cycles
for a total of 10 min. Each oscillation cycle corresponded to a total displacement in the upper plate of
1 mm (500 µm on either side from the central position) at a frequency of 10 Hz for 60 s, thereby
keeping a constant gap between the plates. The shear stress was applied immediately after the deposi-
tion of the NR-CB binary suspension (t=0) (Figure 2a) or once the floating coagulum was formed (t=1
h) (Figure 2b). Additionally, the shearing device was designed to fit on an inverted microscope, allow-
ing shearing and simultaneously transmission imaging of the sample. Herein, it was installed onto an
inverted microscope (Axiovert, ZEISS) equipped with a 60x high numerical aperture (1.1) water im-
mersion objective (Olympus) and a charge-coupled device (CCD) camera (UCBO, Olympus).
Figure 2. Schematic illustration showing the application of mechanical shear on the binary NR-CB
suspension (a) and the formed coagulum (b).

89
Chapter 3: Natural rubber – carbon black
2.2 NR-CB mix under sonication
NR-CB mixing under sonication was performed using an ultrasonic homogeniser probe (Sonopuls ho-
mogeniser HD 2070, Sound frequency: 20kHz, BANDELIN, electronic GmbH, Berlin, Germany). The
NR latex particles suspension was placed in a glass vial and sonicated for 1 min at 35 W power with a
13 mm sonication probe (SH 70 G). The CB slurry was then inserted from the top using a pipette, and
the 15 mL binary NR-CB suspension was kept under sonication for 2 min. After the total sonication
time (3 min), 100 µL were extracted and deposited on a glass coverslip as illustrated in Figure 1.
2.3 FESEM
One of the originalities of our approach relies on the chemical sample’s fixation which can be applied
both in the presence or absence of solvent. Fixation was performed by depositing 50 µL drops of os-
mium tetroxide (EMS, USA) solution (1% in water, prepared extemporaneously) around the sample’s
coverslip in a hermetic box protected from light. After 30 minutes the fixation was considered com-
plete. This type of vapour fixation allowed us to (i) avoid immersion of the deposited specimen, (ii) to
preserve the colloidal structure of NR (iii) to exploit both SE and BSE imaging based on topographic
and chemical contrast, respectively. Indeed, the high affinity of osmium tetroxide for NR particles
results in an important differentiation between NR and CB in BSE images: CB fillers appear dark while
NR globules are bright (Figure 3). This chemical fixation was applied on samples at times: t=1h, t=4h,
t=5h and t=24h. The fixed sample’s coverslips were mounted on 25.4 mm aluminium pin stubs (Micro
to Nano, the Netherlands) with double-sided sticky and conductive tabs (EMS, USA). Samples were
then coated with a 10 nm carbon layer by double thread evaporation in high vacuum (10-5 mbar) with
an ACE600 device (Leica, Germany). FESEM was performed using a Gemini 500 (Zeiss, Germany)
driven by SmartSEM (version 6.3), operating in high vacuum (10-6 mbar in the observation chamber),
at 3 kV, with high current mode, a 20 µm aperture (beam current on the specimen experimentally
measured in those conditions: 43.2 pA), and around 2 mm working distance. SE signal was collected
with the corresponding in-lens detector. BSE signal was collected with the Energy Selective BSE in
lens detector using filtering grid > 400 V to filter out SE signal. Images were acquired with a 1024 x
768 pixel definition, with a dwell time of 6,4 µs and a line averaging of 25. Please note that both SE
and BSE signals are surface selective, but while SE images are generated at the extreme surface (depth
of few nanometres), BSE images are capable of providing information arising from a depth of few tens
of nanometres15. For each sample, at least two different zones were recorded using a range of magni-
fication power spanning from x5000 to x80000.

90
Chapter 3: Natural rubber – carbon black
2.4 Determination of the NR particle Feret diameter
The quantification of rubber globule elongation was derived from the BSE images recorded at 5000x
at two different zones for each sample. A nonlocal means filter was first applied to subtract the noise
from the image. Subsequently, the MorphoLibJ Plugin (ImageJ) was employed on the binary image
with the application of watershed segmentation to detect only NR particles. Their size was reported in
terms of the maximum Feret diameter16, which meant the longest direction of the globule (Figure 4c).
This parameter is used in microscopy measurements for the size analysis of nonspherical particles. The
obtained Feret diameter was the result calculated by the average of approximately 1000 NR particles
regardless of their size. Thus, the elongation of NR particles was calculated from the difference be-
tween the average Feret diameter at t=4 h and its corresponding measurement at t=1h.

91
Chapter 3: Natural rubber – carbon black
3. RESULTS AND DISCUSSION
3.1 NR-CB coagulum: its structural evolution during drying
The nanoscale structure of the coagulum was imaged using FESEM with both BSE and SE detection,
at different aging times, so that its structural evolution dynamic during drying was reported.
Figure 3 illustrates the typical structure of the NR-CB coagulum early after its formation (t=1 h) when
the solvent is still present. One major observation is that the NR particles and CB fillers are not homo-
geneously distributed; this can be specifically highlighted by the BSE images (Figure 3b and f).
Figure 3. Typical FESEM micrographs of the NR-CB coagulum fixed at t=1 h. The mass ratio in liquid
suspension is 40% CB/rubber. (a) SE and (b) BSE images where CB appears completely dark while
NR particles are bright (magnification: 5000x), which highlights the two different microregions of the
corresponding coagulum. The glass surface presents some background noise probably due to a thin
layer of osmium deposited on the support. (c) Magnified SE and (d) BSE views of the NR-NR homoag-
gregation corresponding to the red-squared zones in (a and b). (e) Magnified SE and (f) BSE views of
the yellow-boxed regions shown in (a and b), composed of the CB filler and NR particles (magnifica-
tion: 40000x). (g) Magnified SE and (h) BSE views corresponding to the blue-boxed region in (e and
f, magnification: 80000x). Red arrows indicate regions in which the CB aggregates seem to sink into
the NR globule.

92
Chapter 3: Natural rubber – carbon black
The comparison of the SE and BSE microstructures in Figure 3a and b reveals regions composed of
homoaggregated NR particles that maintain their original colloidal structure, which is clearly visible
in the magnified images of Figure 3c and d. Outside these regions, NR particles are essentially dis-
persed together with large agglomerates of CB filler. This general dominance of homoaggregation can
be related to the mixing strategy. CB agglomerates are present in the aqueous slurry, and their size
depends on various parameters, such as the shear stress during mixing. Standard mixing using a simple
bench-top stirring device leads to object sizes ranging from 1 to 5 µm, with a minor population of
objects ranging from 100 to 300 nm. This is confirmed by a control sample of CB slurry prepared and
imaged with the same protocol as that used when in the presence of NR globules (Figure S1), thus
revealing the formation of CB agglomerates. Despite the dominance of CB agglomerates, we can point
out localized regions having particular morphological characteristics. First, some persisting small CB
aggregates (~100-300 nm) are in close contact with NR globules and can be covered by the rubber
material (Figure 3e and f). Additionally, some of them seem to sink into the surface of the globule, as
indicated by the red arrows in Figure 3g and h. These local morphological features suggest a specific
interaction between the small CB aggregates and NR globules. Similar observations are reported for a
coagulum made of DPNR latex and CB filler (Figure S2), indicating that lipids may play an important
role in the nanomechanism responsible for the abovementioned morphological characteristics; this
phenomenon will be further discussed later. The mass percent ratio between the CB filler and NR was
also drastically decreased to 5 wt% and 1 wt% (by maintaining a constant NR concentration) to assess
whether the interaction of NR globules with small CB aggregates was dependent on the CB concen-
tration (Figure S3).
At t=4 h, the distribution of CB and NR particles is similar to that observed for the coagulum at t=1 h
(Figure 4a and b compared with Figure 3a and b), with domains composed of only NR-NR homoag-
gregation and other domains consisting of large agglomerates of CB filler with scattered NR particles.
The most striking difference in the structure of the coagulum between t=4 h and t=1 h is in the elonga-
tion of all the NR globules. Such elongation was quantified by the increase of 200-250 nm in the
average Feret diameter (Figure 4c and d). A similar elongation of the NR particles is also found for the
sample composed of only NR latex (Figure 4d). At t=5 h, as more of the solvent has evaporated, we
observe a clear destabilization in the whole population of NR globules in the NR-CB sample: NR
globules lose their spherical shape (Figure 4e and f). Again, similar results are found for a sample
composed of only NR latex (Figure 4g). After 24 h and the complete evaporation of solvent in both
samples, NR globules completely lose their shape (Figure 4h and i and Figure 4j), resulting in a poly-
mer film. In summary, the structural evolution of the NR-CB coagulum can generally be attributed to
a typical film formation process of NR due to solvent evaporation. This process is composed of the
elongation and coalescence between rubber globules along with the diffusion of the polymer chain,
thereby giving rise to a polymer film17. More interestingly, some NR globules in contact with small

93
Chapter 3: Natural rubber – carbon black
CB aggregates lose their original colloidal shape at earlier stages than those deformed due to solvent
evaporation (Figure 3g).
Figure 4. Typical FESEM micrographs of the NR-CB coagulum and NR latex over time. SE images
and corresponding BSE micrographs of the NR-CB coagulum at t=4 h (a and b), t=5 h (e and f), and
t=24 h (h and i). SE images recorded on a sample composed of only NR latex: t=5 h (g) and t=24 h (j).
All images were taken with a magnification power corresponding to 10000x. (c) Illustration of the
Feret diameter determination of NR particles in image (a). (d) Histogram showing the elongation of
NR particles in terms of the average Feret diameter between t=1 h and t=4 h.

94
Chapter 3: Natural rubber – carbon black
We hypothesize that this deformation at an early stage may be related to an interaction with the small
CB filler that is capable of inducing the destabilization of the globule surface. To assess this hypothesis,
we tried to boost the contact between the surface of NR globules and CB filler by the application of
physical stress, thus aiming to reduce CB agglomeration.
3.2 Effect of shear stress in the liquid suspension
Controlled mechanical shear stress was employed to reduce CB agglomeration. The mechanical forces
were initially applied using the RheOptiCAD module right after the deposition of the NR-CB suspen-
sion on the coverslip (t=0) (Figure 2a). Light transmission images recorded during the applied oscilla-
tion cycles highlight the formation and combination of irregular flocs, growing in size and quickly
leading to a macroscopically visible phase-separated coagulum at the end of 10 oscillation cycles (~10
min) (Figure S4). On the other hand, approximately 1 h is needed to macroscopically observe phase
separation without the application of shear. Such behaviour is typical of a shear-induced aggregation
mechanism, where the applied shear forces can increase NR-CB contact and drive the particles to
overcome the interaction energy barrier18. Prior to the observation of the NR-CB coagulum structure,
a control sample was imaged attesting that the confinement between the parallel plates does not induce
any deformation of the NR globules, as shown in Figure S5. Figure 5a illustrates the structure of the
coagulum formed under shear. We can observe that the distribution of CB filler is not improved when
shear is applied; the large CB agglomerates are not broken down by the applied force. Furthermore, in
zones where NR-NR homoaggregation is dominant, no shear effect on the original form of the NR
globules is highlighted (see the red boxed region in Figure 5b). Interestingly, regions of the sample
where NR globules are in contact with small CB aggregates exhibit different structures. In these zones,
the original spherical form of NR globules appears flattened upon the application of shear stress. Pol-
ymer leakage and diffusion is increased toward the surrounding CB aggregates (Figure 5c and d). Ad-
ditional experiments were performed by applying shear on the floating NR-CB coagulum formed at
t=1 h (Figure 2b). In this case, the shearing effect shows remarkable distortion of the NR globules in
contact with the CB filler (Figure 5e and f). In summary, we can state that in our experimental condi-
tions, the applied shear did not improve the dissociation of CB agglomerates. However, it accelerated
the formation of a phase-separated NR-CB coagulum together with NR particle distortion in regions
where they are in close proximity to CB aggregates, thus leading to polyisoprene diffusion through the
sample. In an attempt to improve CB distribution and favor its interaction with NR globules, the two
components were then mixed under sonication.

95
Chapter 3: Natural rubber – carbon black
Figure. 5. FESEM micrographs of NR-CB coagulum formed under the application of mechanical
shear-stress at t=0 or formed during 1h and then subjected to shear-stress. (a) Large view SE and (b)
BSE images of the NR-CB hetero-coagulum formed after the application of 10 shearing cycles at t=0
(magnification: 5000x), showing large areas of CB agglomerates. The red boxed area highlights
domains of NR-NR aggregation (c) Magnified SE and (d) BSE views of NR globules deformation in
the NR-CB coagulum formed under shear applied at t=0, highlighting polymer diffusion into the
surrounding CB filler (magnification: 20000x). (e) SE and (f) BSE images recorded on the NR-CB
coagulum subjected to shear applied at t=1h (magnification: 20000x), thus showing similar result as
those in (c) and (d).

96
Chapter 3: Natural rubber – carbon black
3.3 NR-CB mix under sonication: effect on the structure of the formed coagulum
Sonication is known to break down CB agglomerates into smaller objects, down to a size that depends
on the energy and on the sonication time. Our experimental conditions were defined so that sonication
applied on only NR globules does not affect their structure (Figure 6g and h). When sonication is
applied during mixing of NR globules with CB slurry, the formed coagulum has remarkable properties
compared with those obtained from the previously used conditions: neither CB micrometer-sized ag-
glomerates nor NR-NR homoaggregated regions are observed. Small CB aggregates (20-200 nm) and
NR globules are homogeneously distributed. This leads to a coagulum mainly formed through het-
eroaggregation (Figure 6a and b). Additionally, SE and BSE images recorded with high magnification
(Figure 6c and d) highlight the partial coalescence between the NR globules, which are this time sur-
rounded by several small CB aggregates (20-200 nm). These aggregates establish notable contact with
the globule surface (Figure 6e), and some of them are found to partially sink into the globule, as indi-
cated by the red arrows in Figure 6f. Thus, what is locally observed without sonication (Figure 3g and
h) is here extended to the whole coagulum. These morphological features confirm a specific interaction
between the small CB aggregates and NR globules. This interaction induces the destabilization of the
colloidal form of NR particles and results in the ability of the polyisoprene chains confined in the inner
part of the globule to diffuse toward the outside, thus leading to partial coalescence.
Altogether, these results indicate (i) that the size of CB aggregates is a key parameter in the binary
colloidal dispersion pathway controlling the structure of the formed NR-CB coagulum and (ii) that the
hydrophilic character of proteins and lipid head groups at the surface of NR globules (in contrast to the
hydrophobic nature of CB) does not prevent the two particles from interacting. These important indi-
cations allow us to formulate hypotheses on the microscopic mechanisms involved in the interaction
between the NR particles and CB filler. In a previous study on the interfacial structure of NR globules,
it has been reported that the hydrophilic heads of lipids protrude toward the solvent phase, forming a
very thin second layer (~0.6 nm) above the mixed protein and lipid layer that has a thickness of ~3.5
nm 3. Thus, we can reasonably presume that small CB aggregates can reach the hydrophobic alkyl
chain of lipids located on the biomembrane. This can subsequently result in lipid reorganization and
adsorption on the hydrophobic domains of CB. The biomembrane being partially shared with the CB
aggregates will leave small and transiently uncovered patches on the globule surface, leading to the
observed coalescence between them. The aforementioned hypothesis is also supported by a recent
study on the efficiency of carbon nanotubes to penetrate phospholipid bilayers19. The researchers used
single-chain mean field theory to report a possible migration of the phospholipid tails on the surface
of hydrophobic nanotubes19. Moreover, the work of Amornwachirabodee et al.20 on the penetration of
oxidized carbon black (OCBs) (prepared from commercially available CB) into cell-sized liposomes
also reported the adsorption of phospholipids on OCBs. Additionally, a study on the effect of CB in-
cubated with giant unilamellar phospholipid vesicles (GUV) reported a decreasing number of GUV
over time21, thus supporting our hypothesis.

97
Chapter 3: Natural rubber – carbon black
Figure 6. FESEM micrographs of the NR-CB heterocoagulum obtained with sonication during mixing:
mass ratio in the liquid suspension = 40% CB/rubber and the structure was fixed at t=1 h. (a) Large
view SE and (b) BSE images of the same region showing the homogeneous distribution of NRs and
CB filler (magnification: 5000x). (c) Magnified SE and (d) BSE views corresponding to the yellow-
squared region in (a and b) (magnification: 10000x), highlighting the partial coalescence between the
NR globules that are surrounded by several small CB aggregates. (e) Magnified SE of the red boxed
region in (c) (magnification: 80000x). (f) Magnified SE and BSE views of the blue-boxed region shown
in (c and b) (magnification: 40000x), showing that the CB filler partially sinks toward the inner part of

98
Chapter 3: Natural rubber – carbon black
the NR globules. (g) Magnified SE and (h) BSE views corresponding to the control sample composed
only of sonicated NR globules.
4. CONCLUSION
This study reports new insights into the processes occurring during the coagulation between NR latex
and a CB slurry. The structural evolution dynamics at the nm scale were investigated, and the im-
pacts of external physical stresses (shear and sonication) were tested.
We highlighted the dependence of NR-CB heteroaggregation vs NR-NR or CB-CB homoaggregation
based on the way the filler and NR particles came into first contact. Mixing the two components in
colloidal suspensions under sonication maintained CB filler in the form of small aggregates (20-200
nm), resulting in the good homogenization of filler around the NR globules. When small CB aggregates
were in contact with NR particles, a structural modification of the NR colloidal form was observed.
We hypothesize a local membrane destabilization induced by the adsorption of lipids on the hydropho-
bic domains of CB, thus leading to the coalescence between the NR globules. To our knowledge, this
is the first time that the nanoscopic mechanism that rules NR-CB heteroaggregation has been de-
scribed, with the visualization of the high reactivity between the CB filler and NR globules.

99
Chapter 3: Natural rubber – carbon black
REFERENCES
1. Salomez, M. et al. Micro-organisms in latex and natural rubber coagula of Hevea brasiliensis
and their impact on rubber composition, structure and properties. Journal of Applied Microbiol-
ogy 117, 921–929 (2014).
2. Gaboriaud, F., de Gaudemaris, B., Rousseau, T., Derclaye, S. & Dufrêne, Y. F. Unravelling the
nanometre-scale stimuli-responsive properties of natural rubber latex particles using atomic force
microscopy. Soft Matter 8, 2724 (2012).
3. Rochette, C. N. et al. Shell Structure of Natural Rubber Particles: Evidence of Chemical Stratifi-
cation by Electrokinetics and Cryo-TEM. Langmuir 29, 14655–14665 (2013).
4. Nawamawat, K. et al. Surface nanostructure of Hevea brasiliensis natural rubber latex particles.
Colloids and Surfaces A: Physicochemical and Engineering Aspects 390, 157–166 (2011).
5. Thomas, S., Chan, C. H., Pothen, L. A., Joy, J. P. & Maria, H. J. Natural Rubber Materials: Vol-
ume 2: Composites and Nanocomposites. (Royal Society of Chemistry, 2013).
6. Goudarzi, T., Spring, D. W., Paulino, G. H. & Lopez-Pamies, O. Filled elastomers: A theory of
filler reinforcement based on hydrodynamic and interphasial effects. Journal of the Mechanics
and Physics of Solids 80, 37–67 (2015).
7. Encyclopedia of materials: science and technology. (Elsevier, 2001).
8. Rubber Division, ACS Liquid Phase Mixing: The Future of Natural Rubber Compounding for
Productivity and Performance. http://rubber.docegon.com/papers/2637-Liquid-Phase-Mixing-
The-Future-of-Natural-Rubber-Compounding-for-Productivity-and-Performance-.
9. Martínez-Pedrero, F. et al. Making an elastomeric composite material via the heteroaggregation
of a binary colloidal dispersion. Soft Matter 8, 8752 (2012).
10. Wang, T. et al. CEC and its application in off-the-road tires. 6 (2003).

100
Chapter 3: Natural rubber – carbon black
11. Lin, Y., Zhang, A., Wang, L., Pei, C. & Gu, Q. Carbon Black Filled Powdered Natural Rubber.
Journal of Macromolecular Science, Part B 51, 1267–1281 (2012).
12. Santipanusopon, S. & Riyajan, S.-A. Effect of field natural rubber latex with different ammonia
contents and storage period on physical properties of latex concentrate, stability of skim latex
and dipped film. Physics Procedia 2, 127–134 (2009).
13. Boitte, J.-B. et al. A novel rheo-optical device for studying complex fluids in a double shear
plate geometry. Review of Scientific Instruments 84, 013709 (2013).
14. Boitte, J.-B., Hayert, M. & Michon, C. Observation of wheat flour doughs under mechanical
treatment using confocal microscopy and classification of their microstructures. Journal of Ce-
real Science 58, 365–371 (2013).
15. Hennig, P. & Denk, W. Point-spread functions for backscattered imaging in the scanning elec-
tron microscope. Journal of Applied Physics 102, 123101 (2007).
16. Mazzoli, A. & Favoni, O. Particle size, size distribution and morphological evaluation of air-
borne dust particles of diverse woods by Scanning Electron Microscopy and image processing
program. Powder Technology 225, 65–71 (2012).
17. Butt, H.-J., Kuropka, R. & Christensen, B. Latex film formation studied with the atomic force
microscope: Influence of aging and annealing. Colloid & Polymer Science 272, 1218–1223
(1994).
18. Meng, X., Wu, H. & Morbidelli, M. Kinetics and Cluster Morphology Evolution of Shear-Driven
Aggregation of Well-Stabilized Colloids. Langmuir 31, 1113–1119 (2015).
19. Pogodin, S. & Baulin, V. A. Can a Carbon Nanotube Pierce through a Phospholipid Bilayer?
ACS Nano 4, 5293–5300 (2010).
20. Amornwachirabodee, K. et al. Oxidized Carbon Black: Preparation, Characterization and Appli-
cation in Antibody Delivery across Cell Membrane. Sci Rep 8, (2018).

101
Chapter 3: Natural rubber – carbon black
21. Pajnič, M. et al. Effect of carbon black nanomaterial on biological membranes revealed by shape
of human erythrocytes, platelets and phospholipid vesicles. Journal of Nanobiotechnology 13,
(2015).

102
Chapter 3: Natural rubber – carbon black
Supporting information
Natural Rubber - Carbon Black coagulation:
following the nanostructure evolution from a
colloidal suspension to an elastomeric composite
Gianluca Cattinari *, §, Karine Steenkeste §, Catherine le Bris §, Alexis Canette ‡, Matthieu Gallo-
pin†, Marc Couty†, Marie-Pierre Fontaine-Aupart §
§ Université Paris-Saclay, CNRS, Institut des Sciences Moléculaires d’Orsay, 91405, Orsay, France
‡ Sorbonne Université, CNRS, Institut de Biologie Paris-Seine, 75005, Paris, France
† Manufacture Française des Pneumatiques Michelin, Clermont Ferrand, France
* Corresponding author
E-mail: [email protected]

103
Chapter 3: Natural rubber – carbon black
Supporting Information 1 (S1): FESEM images of the CB slurry showing the agglomeration of CB
in the liquid medium. (a) SE image. (b) BSE image.

104
Chapter 3: Natural rubber – carbon black
Supporting Information 2 (S2): (a) SE and (b) BSE image showing CB aggregate in interaction with
a DPNR globule. DPNR latex was produced via treatment of highly ammoniated NR latex with a bio-
enzyme (proteinase), which hydrolyzes the proteins into a water soluble forms. It was subsequently
mixed with CB in the same way as for NR latex.

105
Chapter 3: Natural rubber – carbon black
Supporting Information 3 (S3): (a) SE and (b) BSE images showing CB aggregate in interaction
with a NR globule - mass ratio in liquid suspension = 5% CB/rubber
a b

106
Chapter 3: Natural rubber – carbon black
Supporting Information 4(S4): Transmission images recorded along with oscillation cycles for the
NR-CB binary colloidal suspension. Mechanical forces were applied using the RheOptiCAD module
right after the deposition of the sample on the coverslip (t=0). The parameters of each oscillation
correspond to 10 Hz frequency; total displacement of 1 µm displacement; 500µm of gap; and 60s of
application. Scale bar corresponding to 10µm.

107
Chapter 3: Natural rubber – carbon black
Supporting Information 5(S5): FESEM micrograph of NR-CB coagulum formed at t=1 h inside the
shearing module without the application of mechanical shear. It shows the maintenance of NR globular
structure, attesting that the parallel plate geometry used for the application of shear does not influence
the NR-CB coagulum structure as well as the NR globular form. (a) SE and (b) BSE images.

108

109
Chapter 4: Natural rubber-silica coagulation: structural
characterization and evolution towards an elastomeric
composite

110
Chapter 4: Natural rubber – silica
Introduction
Another important filler used in rubber technology refers to silica (Si). The main drawback often
associate to the use of Si as filler concerns its hydrophilic nature, which often limits its dispersion state
in a non-polar rubber matrix. In natural rubber (NR) technology, methods for efficient dispersion of Si
are still continuously being improved. The previously described liquid phase mixing seems an
interesting method to possibly obtain NR-Si composite with good dispersion of the filler. This
approach could take advantage of the globular structure of NR latex to allow interaction in liquid and
thus possibly achieve a good dispersion in resulting composite. However, contrarily to CB, bringing
NR latex in contact with a slurry of Si does not allow spontaneous coagulation. Hence, various
solutions have been proposed to achieve this coagulation. For example, incorporating silica into the
rubber latex by treating the Si with a coupling agent and mixing the resulting treated Si with
conventional coagulants such as polyamine. Another possible solution to achieve coagulation relies on
the combined action of divalent ions and/or the coupling with the shearing of the binary colloidal
suspension. The latter protocol is very promising, but the structural characterization of the formed
coagulum and its evolution dynamics towards the formation of a composite, as well as the distribution
of Si fillers has never been described. The first part of this chapter focuses on these issues employing
a similar FESEM approach as the one described for a NR-CB system, together with measurements of
AFM-IR. This multimodal microscopy approach allowed us to structurally characterized the formed
coagulum and follow its evolution with specific attention to the nanodistribution of Si fillers.
Subsequently we pursued the structural characterization by investigating on the spatial arrangements
of proteins and lipids of NR, during coagulation and drying. In particular, we studied their arrangement
in respect to the Si fillers distribution, locating both biomembrane components and Si from the early
stage of mixing until the formation of a composite after solvent evaporation at room temperature. This
allowed us to unravel microscopic mechanism occurring during the liquid phase mixing, involving Si,
proteins and lipids of NR. To do so, we performed experiments using mainly dual color dSTORM
imaging. Additionally, the latter technique was combined with FESEM measurements for a more
complete structural characterization.
Results are presented in the form of two articles in preparation, the first one entitled “Structural
evolution dynamics of a Silica-Natural Rubber hetero-coagulum, towards an elastomeric composite
“, and the second one “Nanoscopic spatial arrangement of silica fillers with proteins and lipids of
natural rubber: from a colloidal suspension to an elastomeric composite “.

111
Chapter 4: Natural rubber – silica
Article 2: Structural evolution dynamic of a Silica-
Natural Rubber heterocoagulum, towards an
elastomeric composite
Gianluca Cattinari*1, Karine Steenkeste1, Catherine le Bris1, Alexis Canette2, Ariane Deniset3,
Matthieu Gallopin4, Marc Couty4, Marie-Pierre Fontaine-Aupart1
1 Université Paris-Saclay, CNRS, Institut des Sciences Moléculaires d’Orsay, 91405, Orsay, France
2 Institute de biologie Paris Seine (IBPS), Sorbonne Université, CNRS service de microscopie électronique, 75005
Paris
3 Université Paris-Saclay, CNRS, Institut Chimie Physique (LCP), Université Paris-Saclay, 91405, Orsay, France
4 Manufacture Française de Pneumatiques Michelin
Article in preparation

112
Chapter 4: Natural rubber – silica
Structural evolution dynamics of a Silica-Natural
Rubber heterocoagulum, towards an elastomeric
composite Gianluca Cattinari*1, Karine Steenkeste1, Catherine le Bris1, Alexis Canette2, Ariane Deniset3,
Marc Couty4, Matthieu Gallopin4, Marie-Pierre Fontaine-Aupart1
1 Université Paris-Saclay, CNRS, Institut des Sciences Moléculaires d’Orsay, 91405, Orsay, France
2 Institute de biologie Paris Seine (IBPS), Sorbonne Université, CNRS service de microscopie électronique, 75005
Paris
3 Université Paris-Saclay, CNRS, Institut Chimie Physique (LCP), 91405, Orsay, France
4 Manufacture Française des Pneumatiques Michelin, Clermont Ferrand, France
ABSTRACT: Natural rubber (NR) latex extracted from Hevea brasiliensis is an essential raw material used in
the manufacturing of elastomeric composites. In the tire industry, NR is mixed with fillers, in particular with
silica (Si) particles to obtain tires with more versatile properties and above all more ecological. The “liquid
route” consisting in the mixing of NR latex with a colloidal suspension of Si to give rise to a coagulum that is
further dried seems a promising method to obtain a composite. In this context, this study aims to provide a
fundamental knowledge of the formation and of the structural evolution dynamics of a NR-Si heterocoagulum
coagulum efficiently formed by addition of Mg2+ ions. For this purpose, we employed an original field emission
scanning electron microscopy (FESEM) approach combining a specific chemical fixation method with the
backscattered electron (BSE) and secondary electron (SE) imaging modes. Moreover, FESEM was supported
by atomic force microscopy coupled to infrared spectroscopy (AFM-IR) to reveal the nanoscopic distribution of
Si fillers in the depth of the obtained composite. The results highlight the presence of the Si fillers surrounding
the colloidal NR particles in the heterocoagulum, preventing their early stage deformation. This occurs along
with solvent evaporation, leading to the
formation of a composite composed of
a polymer film with embedded Si parti-
cles. The latter remain homogeneously
dispersed throughout the film thickness,
organized in interconnected individual
particles or small aggregates. Regularly,
ellipsoidal-ring like structures of Si fill-
ers can be observed, as if Si particles re-
mained frozen in their initial interaction
with the NR globules. Our shear stress
application does not modify the Si filler
distribution within the heterocoagulum
but strongly increases its dynamics of
formation and evolution.
1. INTRODUCTION
Rubber polymers, with both synthetic or Natural Rubber (NR), need to be reinforced with fillers to
achieve necessary strength for most applications1–3. The use of silica (Si) as filler has become of
growing importance for certain applications, especially in the tire industry4,5. It has been found that
their introduction into rubber blends has allowed to improve the rolling-resistance of tires with related

113
Chapter 4: Natural rubber – silica
benefits such as fuel saving and less negative effect on the environment 6. Different procedures have
been developed to incorporate Si fillers in NR (milling, sol-gel techniques, etc)7. Among those, the
“liquid route” is interesting approach that relies on the colloidal mixture of NR latex with and aqueous
suspension of Si, and further drying. Different options are also available: the mixture can be directly
dried to form a continuous polymer film with embedded fillers8 or it can be first coagulated by chemical
or mechanical actions9 before drying. These coagulation methods allow to quickly obtaining a
composite that could be advantageous at the industrial level. Preliminary studies highlighted the role
of divalent cations to promote NR-Si interaction in liquid suspension10,11. However, the structural
characterization of the resulting coagulum and the distribution of Si fillers has never been described.
To reach this goal, imaging techniques giving access to nanoscopic resolution are required. In this
work, we employed field emission scanning electron microscopy (FESEM) in an original approach
that lies both on the specific chemical sample’s fixation as well as on the electron multi-detecting
modes: backscattering electron imaging (BSE) and secondary electron (SE). Additionally, FESEM was
supported by atomic force microscopy coupled to infrared spectroscopy (AFM-IR) to reveal the
nanoscopic distribution of Si fillers in the depth of the rubber matrix. By using this multimodal
microscopy approach, it was possible to image for the first time the nanostructure of the NR-Si
heterocoagulum but also to follow its structural evolution dynamics along drying with a specific
attention on the nanodistribution of the Si filler. Additionally, shear-stress applied on NR-Si suspension
was investigated in terms of shear-driven aggregation and impact on the structural evolution dynamic.
2. MATERIAL AND METHODS
2.1. Sample Preparation and characterization
High ammonia NR latex concentrate (∼60 wt %, HA latex) (Michelin, Clermont Ferrand, France) was
used for most of the experiments. It was obtained by centrifugation of field NR latex containing 0.7
wt% ammonia to eliminate free components and nonrubber particles as well as to preserve the colloidal
structure of NR globules (a polyisoprene core surrounded by a thin bioshell of proteins and
phospholipids). Some experiments were also realized with deproteinezed natural rubber (DPNR) latex
obtained via treatment of HA latex with a proteinase enzyme. Regardless of the type, the obtained latex
is a colloidal dispersion of only NR globules in aqueous phase. Both rubber lattices were diluted to
0,075 wt% rubber content using distilled water and mixed with 100 nm diameter plain Si particles
(Kisker Biotech, Steinfurt, Germany) to obtained a binary colloidal suspension. Using dynamic light
scattering method (DLS), the size distribution of both NR and Si particles before mixing was
controlled. NR latex corresponds to a bimodal distribution of particles with ~90% of globules
belonging to small rubber particles (SRPs) (size < 500 nm) and ~ 10% belonging to large rubber
particles (LRPs) (size > 500 nm), in agreement with previous results12 (Figure S1). As expected for the
hydrophilic Si particles in suspension, a major peak centered at ~ 100 nm was observed confirming

114
Chapter 4: Natural rubber – silica
that the fillers are monodispersed (Figure S1). The mass percent ratio between Si and rubber was kept
constant in all the samples and fixed at 40% in colloidal mixture. It was further controlled that this
protocol led to a coagulum having ~20% mass ratio of Si/rubber (data not shown). Unless otherwise
mentioned, the experiments were conducted in an aqueous medium composed of magnesium sulfate
0.025M (Sigma-Aldrich) corresponding to 100 mM ionic strength and adjusted at pH of ~6,5. a pre-
requisite to induce a phase-separation and formation of a NR latex or NR-Si coagulum (Figure S2) as
previously reported11. The zeta potential of NR and Si particles in solution was determined, both in
the presence and in the absence of Mg2+ions (ionic strength = 0.1 M) using a Zetasizer Nano ZS
(Malvern Paranalytical) apparatus. The global negative charge of NR globules (due to the presence of
proteins and lipids on their surface) was found to decrease following the addition of the ions, while the
global negative charge of Si particles (due to the silanol groups) remained unchanged (Table S3). For
imaging experiments, 100 µL of the binary colloidal suspension was deposited on a rounded glass
coverslip (coverslip thickness of 170 µm (MENZEL-GLASER), resulting in a casted drop with a
spherical cap shape as illustrated in Figure 1 (drop diameter ~ 1 cm). A phase-separation was
macroscopically visible at t=1 h, with the formation of a floating object corresponding to the
“heterocoagulum” (Figure 1). After t=4 h, when most of solvent evaporated, the heterocoagulum
adhered on the glass surface. After complete evaporation of the solvent (t=24 h) the material referred
to a composite. Similar sample preparation was used for suspension composed of only NR latex. Some
experiments were also performed to delay solvent evaporation. In this case, the sample was placed in
a humidity controlled chamber.
Figure 1. Schematic illustration of the dynamics of heterocoagulum and composite formation after
deposition on the glass coverslip of a NR-Si binary colloidal suspension.
2.2. Application of controlled shear-stress
The sample preparation and description of the shearing module used in these experiments were
described in details elsewhere13. Briefly, the NR-Si binary colloidal suspension was placed be-
tween two microscopy coverslips (with a controlled gap width of 500µm) well suited for the ap-
plication of controlled shear. We have controlled that such intercalation of the colloidal suspension
between the two glass slides does not induce any deformation on the NR globular structure (Figure

115
Chapter 4: Natural rubber – silica
S4). Shear application was obtained using a commercial device called RheOptiCAD14,15 (CAD
instrument). It consisted in 10 cycles of oscillations during a total of 10 min. Each oscillation
corresponds to the displacement of the upper plate of 1 mm (500 µm on either side from a central
position) at a frequency of 10Hz during 60s. It was verified on a sample of colloidal NR particles
that the shearing conditions did not alter the NR globular form (Figure S5). This shearing device
was designed to fit on an inverted microscope (Axiovert, ZEISS) equipped with an Olympus 60x
water immersion objective having 1.1 N.A. and a CCD camera (UCBO, Olympus) allowing to
acquire transmission imaging of the sample during shear.
2.3. FESEM
FESEM using both topological contrast by secondary electrons (SE) imaging and chemical contrast by
backscattered electron (BSE) imaging was performed on samples chemically fixed using vapor of os-
mium. This type of fixation allowed to preserve the NR colloidal structure and to exploit BSE imaging
distinguishing between NR and Si filler due to a different contrast: Si filler appears dark in comparison
to NR globules that are bright (Figure 3b). The chemical fixation protocol was optimized in order to
be applied regardless of the amount of solvent still present in the sample. It consists in the deposition
of 50µL drops of osmium tetroxide (EMS, USA) solution (1% in water, prepared extemporaneously)
around the cover slip of the sample, in a hermetic box protected from light avoiding immersion of the
deposited specimen. After 30 minutes, the fixation was considered as complete and the samples were
gently rinsed with ultrapure water to remove the excess of dry salt on the specimen and mounted on
25.4 mm aluminium pin stubs (Micro to Nano, the Netherlands) with double sided sticky and conduc-
tive tabs (EMS, USA). Samples were then coated with a 10 nm carbon layer by double thread evapo-
ration in high vacuum (10-5 mbar) with an ACE600 device (Leica, Germany). Observations were per-
formed in high vacuum (10-6 mbar in the observation chamber) with a FESEM Gemini500 (Zeiss,
Germany) driven by SmartSEM (version 6.3) operating at 2 kV, with high current mode, a 20 µm
aperture and approximatively 2 mm working distance. The SE signal was collected with the corre-
sponding SE in lens detector. The BSE signal was collected with the energy selective in column detec-
tor using filtering grid (> 400 V) to filter out the SE signal. Images were acquired with a 1024 x 768
resolution, with a dwell time of 6,4 µs and a line averaging of 25. Both SE and BSE signals are surface
selective; the SE images are produced at the extreme surface (depth of few nanometers) while the BSE
images are capable of providing information arising from a depth of few tens of nanometers16. For each
sample, at least two different zones were recorded using a range of magnification power spanning from
10000x to 40000x.

116
Chapter 4: Natural rubber – silica
2.4. Image treatment for quantitative analysis
The minimum average distance between centroids of nearest NR globules was estimated from the
FESEM images of the NR-Si coagulum formed at t=1 h. For this calculation, the Nearest Neighbor
Distance calculation (NND) plugin of ImageJ was used.
SRPs and LRPs were counted in the BSE images recorded from t=1 h to t=4 h. To do so, a non-local
means filter was first applied to subtract the noise from the BSE images. Subsequently, the MorphoLibJ
Plugin (ImageJ) was employed on the binary image with the application of watershed segmentation to
detect the max Feret diameter of NR particles. This is often used in microscopy measurements for the
size analysis of non-spherical particles, and it refers to the longest direction of the globule17. A thresh-
old was set at 500 nm to discriminate the NR particles: they were considered as SRPs below this
threshold, while above they were considered as LRPs. The counting was performed in three different
image planes for each condition at 10000x magnification.
2.5. FTIR Analysis
The infrared spectra of Si fillers and NR were acquired with a Bruker Vertex 70 FTIR spectrometer
with a diamond ATR (attenuated total reflection) attachment (PIKE MIRacle crystal plate diamond
ZnSe) using an MCT detector with a liquid nitrogen cooling system. Prior to measurements, HA latex
60 wt% or the purchased Si suspension at 5 wt% were dehydrated and subsequently deposited directly
on the ATR-crystal for spectra acquisition. Each FTIR spectrum corresponds to an accumulation of
100 scans from 4000 to 600 cm−1 and with a resolution of 4 cm−1.
2.6. Atomic Force Infrared Microscopy (AFM-IR)
AFM-based infrared spectroscopy (AFM-IR) is a hybrid technique that combines the spatial resolution
of atomic force microscopy (AFM) with the chemical analysis capability of infrared (IR) spectroscopy.
The method was described in details in references18,19 . The instrument used in this study is a NanoIR2
(Anasys Instrument, Bruker nano Surfaces, California, US) combining an AFM set-up with an IR
pulsed tunable laser covering the mid-IR region between 1900 cm-1 and 900 cm-1 (QLC beam, MIRcat-
QT, DAYLIGHT solutions; peak powers up to 1 W; average powers up to 0.5 W, wavelength repeat-
ability< 0.1 cm−1 and a tunable repetition rate of 1-2000 kHz). The sample were deposited on CaF2
coverslips (Crystal GmbH, Berlin). The system is used in tapping AFMIR mode20. Simultaneous ac-
quisition of topographic images and IR maps at a specific wavenumber are acquired in tapping mode
by means of a Au-coated silicon probe (scan rate 0,2 Hz, driving strength 16%, Power 5,77%, tapping
AFM-IR cantilever, Anasys Instruments – spring constant 1–3 nN.m−1). In tapping mode, the lever is
forced to oscillate constantly at a given amplitude and frequency. To perform AFM-IR measurements
in this mode, it is therefore essential to detect the oscillation generated by the photo-thermal expansion,

117
Chapter 4: Natural rubber – silica
whereas the cantilever is already oscillating. Here is the strategy: the oscillation frequency of the tap-
ping cantilever is mixed with the photothermal expansion frequency of the object. While the cantilever
is driven at a certain frequency for the tapping mode (here 1430 kHz), the frequency of the laser repe-
tition rate is chosen so that the difference of these two frequencies corresponds another eigenmode of
the cantilever (here around 230 kHZ, second mode). The nonlinear interaction produced is therefore
directly related to the photothermal expansion and will contain all the information related to the IR
absorption of the object. Please note that, the IR mapping is capable of providing information aris-
ing from a depth > 1 µm, while classic topography images are surface selective as FESEM. To-
pography and IR maps were treated using MountainsMap software, while local IR spectra were
filtered using a Stavitsky-Golay algorithm.
3. RESULTS and DISCUSSION
A. NR-Si coagulum formation
The coagulum formed in the presence of Mg2+ ions (0,1 M ionic strength) from the phase separa-
tion of NR-Si binary colloidal suspension was fixed at t=1 h, and subsequently analysed by
FESEM (Figure 2). The structure of such coagulum highlights NR particles regularly dispersed as
single globules, and surrounded by Si fillers which fill the void between (Figure 2a and b). The
determination of the minimal average distance between centroids of nearest NR globules (as de-
scribed in experimental section) resulted to a value of ~250 nm, confirming that at least one Si
particle is found intercalated between two NR globules both LRPs or SRPs (Figure 2c and d).
Thus, we confirmed that the presence of the divalent cations (ionic strength= 0,1 M) is necessary
to screen the electrostatic double layer (EDL) and induce the interaction between NR particles
(Table S3) and/or to act as electrostatic bridges between the surfaces of adjacent NR and Si parti-
cles, allowing the interaction between them. Interestingly, results obtained on the coagulum of only
NR latex report differences in comparison to the NR-SI heterocoagulum (Figure 2e and f). In the
former case, the Mg2+ ions also enable the NR-NR interaction in the liquid phase, but as soon as
the NR globules are in contact their deformation and coalescence is observed. We can reasonably
hypothesize that the NR particles are close enough to each other, to be able to induce a destabili-
zation of the NR bioshell surface. This results in the ability of the polyisoprene chains confined in
the inner part of the NR globules to diffuse toward the outside. By contrast, the presence of Si
fillers surrounding the NR particles hinders their contact and prevents them from their destructu-
ration.

118
Chapter 4: Natural rubber – silica
Figure 2. FESEM micrographs of NR-Si heterocoagulum and NR-NR homocoagulum obtained in
the presence of Mg2+ ions (100 mM ionic strength); structure fixed at t=1 h. (a) SE and (b) BSE
images of the NR-Si heterocoagulum (magnification: 10000x). (c) Magnified SE and (d) BSE im-
ages corresponding to the yellow squared region in (a) and (b), showing silica fillers surrounding
NR globules and preventing their contact (magnification: 40000x). (e) SE and (f) BSE images of
the NR-NR coagulum, showing large zones of coalescence between NR globules (magnification
10000x).
B. Structural evolution dynamics of the NR-Si coagulum
In order to follow the structural evolution dynamics of the NR-Si heterocoagulum throughout sol-
vent evaporation, until the formation of a composite, FESEM images were performed at different

119
Chapter 4: Natural rubber – silica
times from t=1 h to t=24 h. At t=2 h the NR globules still maintain their original colloidal structure
(Figure S6a). From t=3 h and along with the solvent evaporation, the sample becomes structurally
heterogeneous. Regions where the colloidal structure of NR globules is preserved as well as do-
mains characterized of a polymer film covering parts of the sample can be observed (Figures S6b
and Figure 3a). This last region is the result of polyisoprene chains, previously confined in the
inner part of the globules and diffusing across the NR particle interfaces filling the regions occu-
pied by Si fillers. To verify if the loss of the NR globular structure was due to their interaction with
the Si fillers and/or to the solvent evaporation, the NR-Si heterocoagulum was formed and main-
tained in a controlled humidity environment to limit the evaporation. In this condition, at t=4 h
while the solvent is still largely present, the FESEM images did not reveal any zone of filmication.
(Figure S7). Thus, the destabilization of the NR colloidal form is regulated by the solvent evapo-
ration.
To progress in the understanding of the structural evolution of the NR-Si heterocoagulum, counting
of LRPs and SRPs has been carried out on the structures recorded from t=1 h to t=4 h (Figure 3b).
Interestingly, the heterocoagulum at t=1h is found to be composed of ~85% of SRPs and 15% of
LRPs (Figure 3c), a ratio between the two types of NR particles similar to the one established by
DLS measurements (Figure S1). This reveals that both LRPs and SRPs are included in the hetero-
coagulum. However, during evaporation, the globular form of LRPs was retained for longer time
than that of SRPs, (Figure 3c). This is consistent with the NR particles size: the specific surface
area of SRPs is greater than the one of LRPs and thus assuming similar polymer inter-diffusion
rates, we expect the loss of the colloidal structure of SRPs at earlier stage than that of LRPs. This
observation is in agreement with a previous Atomic Force Microscopy (AFM) study20 on latex
films containing mostly LRPs and SRPs, respectively. Films formed from SRPs are smooth and
show no sign of individual particles, while the ones containing LRPs are rough and the topology
of individual particle is conserved. Another parameter that affected the structural evolution dy-
namics of the heterocoagulum containing Si fillers is the surface composition of NR globules.
Indeed, using a DPNR in place of NR, a faster filmification process was observed (Figure S8)
suggesting that proteins might contribute to the rigidity of the biomembrane of the NR globules,
retaining their spherical form for longer time.
At t=24 h, after complete evaporation of the solvent, a composite was obtained. FESEM images
show that the memory of the original colloidal form of NR globules was mostly lost to give rise to
a film with a very smooth surface where Si fillers were embedded (Figure 3c and d). The fillers
appear quite homogeneously dispersed but also regularly organized as ring-ellipse like structures
(such as the ones circled by an orange circle on Figure 3d), with sizes ranging between 250- 2000
nm, similar to those of the NR particles in their initial colloidal form. To further investigate the Si
fillers arrangement inside the composite, AFMIR measurements were performed.

120
Chapter 4: Natural rubber – silica
Figure 3. Structural evolution dynamics of NR-Si heterocoagulum, and Si filler distribution in the
obtained composite. (a) SE micrographs showing the structure at t=4 h of the (a) NR-Si hetero-
coagulum (magnification 10000x). (b) Histogram grouping the SRPs and LRPs counts and the
ratio (SRPs/LRPs) between t=1h and t=4h. (c) SE and (d) BSE images showing the distribution of
Si filler in the obtained composite, t=24h (magnification 20000x). The orange circles highlight a
ring-distribution of Si fillers.
Classical tapping-AFM measurements combining topography, amplitude and phase contrast infor-
mations (Figure S9) are in line with FESEM images. They show the presence of a NR film (Figure
S9a) covering embedded Si fillers that are better discern on the amplitude and phase contrast im-
ages (Figure S9b and c). The coupling of AFM with the IR spectroscopy allows to investigate the
arrangement of Si fillers with deeper axial depth (>1µm). A first IR map was recorded at 1100 cm-
1, corresponding to the asymmetric Si-O-Si stretching as illustrated on the FITR spectra (insert in
Figure 4d). The IR map confirms their distribution in ring-ellipse structures and revealed their
possible interconnection forming a network (Figure 4b). AFM-IR also allows the local acquisition
of IR spectra by positioning the AFM tip on domains of interest (grey and orange arrow in Figure

121
Chapter 4: Natural rubber – silica
4b). The local IR spectra showed minor peaks between 1300 cm-1 and 1800 cm-1 and a major peak
at 1100 cm-1 (Figure 4d). This confirms that the absorbing structure on the IR map recorded at
1100 cm-1 refers to Si fillers which are at least partially covered by the NR film as revealed by the
minor absorption bands between 1300cm-1 and 1800 cm-1. The presence of such film was also
confirmed by acquiring the IR map at 1450 cm-1, a wavelength related to the CH2 bending, typical
of polyisoprene (Figure 4d). The latter represents the negative image of the one recorded at 1100
cm-1. Interestingly, the local IR spectra recored on a large area NR film (blue arrow Figure 4c)
reveals an intense absorption at 1100 cm-1, proving the presence of Si fillersaraising from deeper
layers.
Figure 4. Si fillers distribution on obtained composite at t= 24 h. AFM (a) height image. (b) IR
map at 1100 cm-1 of the corresponding region referring to Si-O-Si asymmetric stretching. (c) IR
map at 1450 cm-1 referring to the CH2 bending. In both cases, the red and blue colours correspond
respectively to high and low level of IR absorption, respectively. The orange circles highlight a
specific arrangement of Si fillers. (d) Local IR spectra acquired in specific location indicated by
arrows in (c) and (d), and corresponding FTIR spectra of individual Si and NR.

122
Chapter 4: Natural rubber – silica
In summary, Si fillers are scattered throughout the thickness of the latex film. When they appear
embedded in ring-like structure of similar sizes as the diameter of NR particles, we can reasonably
assume that the distribution of Si fillers in the obtained composite might be link to the early stage
interaction with the globules. Therefore, along with the solvent evaporation NR globules lose their
colloidal form while Si fillers remain frozen in their initial position.
C. Effect of shear-stress on the colloidal suspension
Mechanical shear was applied right after the deposition of the NR-Si suspension on the coverslip,
to assess its impact on the coagulation and filmification process. Light transmission images rec-
orded during the applied oscillation cycles, highlight the formation and combination of aggregates,
growing in size and quickly leading to a macroscopically visible phase-separated coagulum at the
end of 10 min (end of the oscillation cycles) (Figure S10a). By comparison, approximately 1 h was
needed to macroscopically observe phase separation without the shear application. It was con-
trolled that in the absence of Mg2+ions, the formation of the coagulum under shear was not ob-
served (Figure S10b). This demonstrates that in our conditions, such mechanical constraint was
not sufficient for NR globules and Si particles to overcome the interaction energy barrier18, mainly
due to the electrostatic repulsion between particles. The more rapid formation of the NR-Si coag-
ulum under shear application is due to the increasing number of encounters between particles.
Figure 5a illustrates the nanostructure of the NR-Si heterocoagulum formed under shear applica-
tion. As observed macroscopically, the structural evolution kinetics of this heterocoagulum is sig-
nificantly speed-up: the FESEM image at 10 min is comparable to that obtained at t=4 h without
shearing (Figure 3a) with no perceptible structural difference. The influence of the applied shear
on the distribution of Si fillers in the final composite (t=24 h) was also controlled by combining
SE (Figure 5b) and AFM-IR (Figure 5c and d) measurements. A similar distribution and arrange-
ment, with no more aggregation of the fillers are observed as the one obtained without shear ap-
plication (Figure 3c and 4c). Thus, the application of the shear on the binary colloidal suspension
greatly accelerates the formation of a phase-separated NR-Si heterocoagulum together with boost-
ing coalescence between NR globules, without influencing the Si fillers distribution.

123
Chapter 4: Natural rubber – silica
Figure 5. Effect of shear on the structure of the NR-Si hetero-coagulum and on the distribution of
Si in the obtained composite. Mechanical shear was applied using the RheOptiCAD module. SE
images showing the structure of (a) the heterocoagulum at the end of the 10 oscillation cycles (10
min) (magnification 10000x). (b) SE micrograph showing the distribution of Si fillers in the com-
posite at t=24 h when shear-stress was applied (magnification 20000x). (c) AFM height and (d)
corresponding IR map at 1100 cm-1 of the composite at t=24hThe red colour refers to high adsorp-
tion, whereas the blue to low adsorption. The circled regions highlight a ring-distribution tendency
in the arrangement of Si fillers.
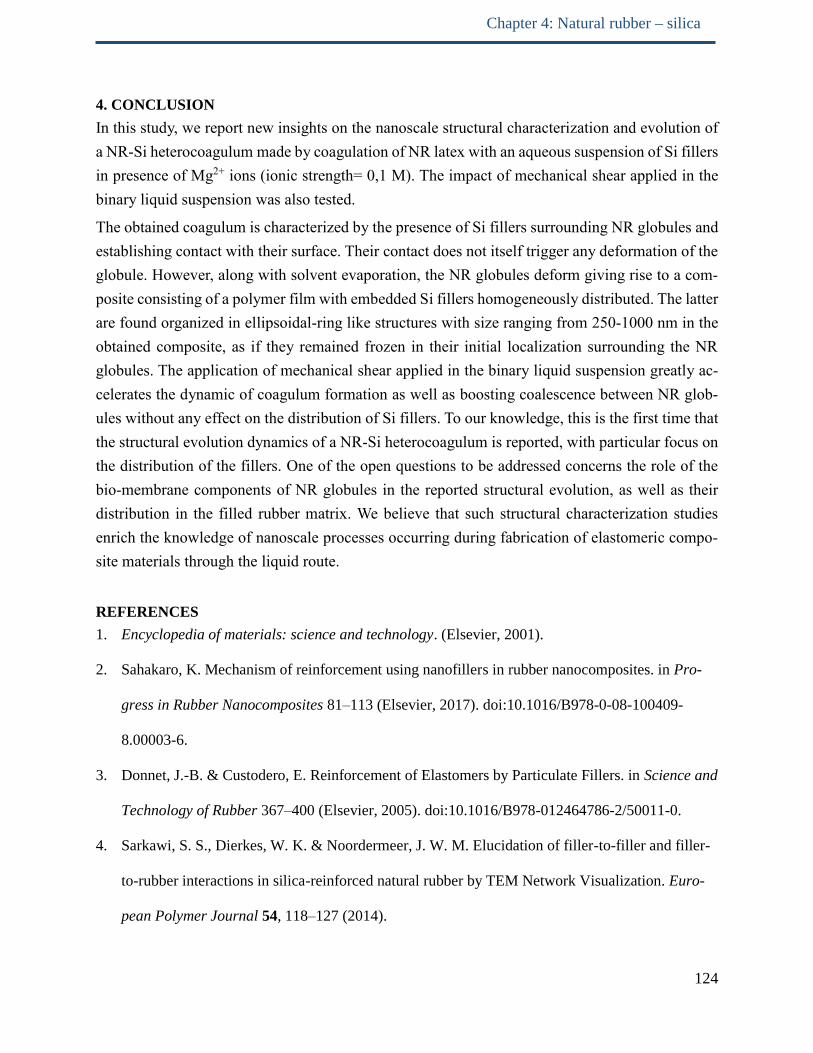
124
Chapter 4: Natural rubber – silica
4. CONCLUSION
In this study, we report new insights on the nanoscale structural characterization and evolution of
a NR-Si heterocoagulum made by coagulation of NR latex with an aqueous suspension of Si fillers
in presence of Mg2+ ions (ionic strength= 0,1 M). The impact of mechanical shear applied in the
binary liquid suspension was also tested.
The obtained coagulum is characterized by the presence of Si fillers surrounding NR globules and
establishing contact with their surface. Their contact does not itself trigger any deformation of the
globule. However, along with solvent evaporation, the NR globules deform giving rise to a com-
posite consisting of a polymer film with embedded Si fillers homogeneously distributed. The latter
are found organized in ellipsoidal-ring like structures with size ranging from 250-1000 nm in the
obtained composite, as if they remained frozen in their initial localization surrounding the NR
globules. The application of mechanical shear applied in the binary liquid suspension greatly ac-
celerates the dynamic of coagulum formation as well as boosting coalescence between NR glob-
ules without any effect on the distribution of Si fillers. To our knowledge, this is the first time that
the structural evolution dynamics of a NR-Si heterocoagulum is reported, with particular focus on
the distribution of the fillers. One of the open questions to be addressed concerns the role of the
bio-membrane components of NR globules in the reported structural evolution, as well as their
distribution in the filled rubber matrix. We believe that such structural characterization studies
enrich the knowledge of nanoscale processes occurring during fabrication of elastomeric compo-
site materials through the liquid route.
REFERENCES
1. Encyclopedia of materials: science and technology. (Elsevier, 2001).
2. Sahakaro, K. Mechanism of reinforcement using nanofillers in rubber nanocomposites. in Pro-
gress in Rubber Nanocomposites 81–113 (Elsevier, 2017). doi:10.1016/B978-0-08-100409-
8.00003-6.
3. Donnet, J.-B. & Custodero, E. Reinforcement of Elastomers by Particulate Fillers. in Science and
Technology of Rubber 367–400 (Elsevier, 2005). doi:10.1016/B978-012464786-2/50011-0.
4. Sarkawi, S. S., Dierkes, W. K. & Noordermeer, J. W. M. Elucidation of filler-to-filler and filler-
to-rubber interactions in silica-reinforced natural rubber by TEM Network Visualization. Euro-
pean Polymer Journal 54, 118–127 (2014).

125
Chapter 4: Natural rubber – silica
5. Dierkes, W. & Blume, A. Silica Reinforcement. in Encyclopedia of Polymeric Nanomaterials
(eds. Kobayashi, S. & Müllen, K.) 1–7 (Springer Berlin Heidelberg, 2014). doi:10.1007/978-3-
642-36199-9_307-1.
6. Kaewsakul, W. Silica-reinforced natural rubber for low rolling resistance, energy-saving tires:
aspects of mixing, formulation and compatibilization. (2013).
7. Thomas, S., Chan, C. H., Pothen, L. A., Joy, J. P. & Maria, H. J. Natural Rubber Materials: Vol-
ume 2: Composites and Nanocomposites. (Royal Society of Chemistry, 2013).
8. Oberdisse, J. Aggregation of colloidal nanoparticles in polymer matrices. Soft Matter 2, 29–36
(2006).
9. Wang, T. et al. CEC and its application in off-the-road tires. 6 (2003).
10. Chan, A. J. et al. Natural Rubber–Filler Interactions: What Are the Parameters? Langmuir 31,
12437–12446 (2015).
11. Berriot (Michelin), US. Patent 9,175,144B2, November, 2015.
12. Santipanusopon, S. & Riyajan, S.-A. Effect of field natural rubber latex with different ammonia
contents and storage period on physical properties of latex concentrate, stability of skim latex
and dipped film. Physics Procedia 2, 127–134 (2009).
13. Natural rubber-carbon black coagulation: following the nanostructure evolution from a colloidal
suspension to an elastomeric composite (article currently submitted to journal of Applied Poly-
mer science).
14. Boitte, J.-B. et al. A novel rheo-optical device for studying complex fluids in a double shear
plate geometry. Review of Scientific Instruments 84, 013709 (2013).
15. Boitte, J.-B., Hayert, M. & Michon, C. Observation of wheat flour doughs under mechanical
treatment using confocal microscopy and classification of their microstructures. Journal of Ce-
real Science 58, 365–371 (2013).

126
Chapter 4: Natural rubber – silica
16. Hennig, P. & Denk, W. Point-spread functions for backscattered imaging in the scanning elec-
tron microscope. Journal of Applied Physics 102, 123101 (2007).
17. Mazzoli, A. & Favoni, O. Particle size, size distribution and morphological evaluation of air-
borne dust particles of diverse woods by Scanning Electron Microscopy and image processing
program. Powder Technology 225, 65–71 (2012).
18. Dazzi, A. & Prater, C. B. AFM-IR: Technology and Applications in Nanoscale Infrared Spec-
troscopy and Chemical Imaging. Chemical Reviews 117, 5146–5173 (2017).
19. Pancani, E. et al. High-Resolution Label-Free Detection of Biocompatible Polymeric Nanoparti-
cles in Cells. Particle & Particle Systems Characterization 35, 1700457 (2018).
20. Mathurin, J. et al. How to unravel the chemical structure and component localization of individ-
ual drug-loaded polymeric nanoparticles by using tapping AFM-IR. Analyst 143, 5940–5949
(2018).
21. Rippel, M. M., Lee, L.-T., Leite, C. A. P. & Galembeck, F. Skim and cream natural rubber parti-
cles: colloidal properties, coalescence and film formation. Journal of Colloid and Interface Sci-
ence 268, 330–340 (2003).

127
Chapter 4: Natural rubber – silica
Supporting information
Structural evolution dynamics of a Silica-Natural Rubber
heterocoagulum, towards an elastomeric composite
Gianluca Cattinari *, §, Karine Steenkeste §, Catherine le Bris §, Alexis Canette ‡, Ariane Deni-
set⁂,
Matthieu Gallopin†, Marc Couty†, Marie-Pierre Fontaine-Aupart §
§ Université Paris-Saclay, CNRS, Institut des Sciences Moléculaires d’Orsay, 91405, Orsay, France
‡ Sorbonne Université, CNRS, Institut de Biologie Paris-Seine, 75005, Paris, France
⁂ Université Paris-Saclay, CNRS, Institut Chimie Physique (LCP), 91405, Orsay, France
† Manufacture Française des Pneumatiques Michelin, Clermont Ferrand, France
* Corresponding author
E-mail: [email protected]

128
Chapter 4: Natural rubber – silica
Peak 1
Peak 2
Supporting Information 1 (S1): DLS measurement of (a) NR particles (0,075 wt%) and (b) silica
particles recorded using a DLS Cordouan Vasco Flex apparatus. The particle size and distribution are
based on volume.
Peak1 Mean:130,60 nm Std Dev: 6,29% Intensity: 92,9%
Peak2 Mean: 554,27 nm Std Dev: 5,59% Intensity: 7,1%
Peak1 Mean:86 nm Std Dev: 18 Intensity: 96%
Peak2 Mean:180 nm Std Dev: 19 Intensity: 4%
a
b

129
Chapter 4: Natural rubber – silica
Supporting Information 2 (S2): Coagulation assays. NR concentration ~0.075 wt%; mass percent
ratio ~ 40% (silica/rubber); pictures were taken after 24h from the mixture (a) Photograph of NR
latex in presence of presence of Mg2+ ions (100 mM ionic strength). (b) Photograph of NR-Si binary
colloidal dispersion in presence of Mg2+ ions (100 mM ionic strength). (c) Photograph of NR-Si
dispersion in absence of ions.

130
Chapter 4: Natural rubber – silica
Supporting Information 3 (S3): Zeta potential average values of NR and Si particles in absence and
presence of MgSO4, (Ionic strength =0,1M; pH=6.5) recorded using Zetasizer Nano ZS (Malvern
Paranalytical) apparatus
Sample Zeta Average (mV) Standard deviation (%)
NR -57,9 1,1
NR + Mg2+ -28,8 0,5
Si -12,2 1,4
Si - + Mg2+ -12,2 0,6

131
Chapter 4: Natural rubber – silica
Supporting Information 4 (S4): FESEM micrograph of NR-Si hetero-coagulum formed at t=1h
inside the shearing module without the application of mechanical shear. The NR globular structure
is maintained, attesting that the insertion of the bicolloidal suspension between two parallel plates
does not induce any deformation effect. (a) SE and (b) BSE images. Magnification x10000.

132
Chapter 4: Natural rubber – silica
Supporting Information 5 (S5): SE micrograph on NR latex (without Mg2+ ions) at the end
of 10 oscillation cycles of shear. The NR globular structure is maintained attesting that the
shear conditions used does not induce any NR structural deformation on the NR globules in
absence of Mg2+ ions. Magnification 10000x.

133
Chapter 4: Natural rubber – silica
Supporting Information 6 (S6): Structural evolution dynamics of the NR-Si hetero-coagulum at
(a) t=2 h and (b) t=3 h. Magnification 10000x.
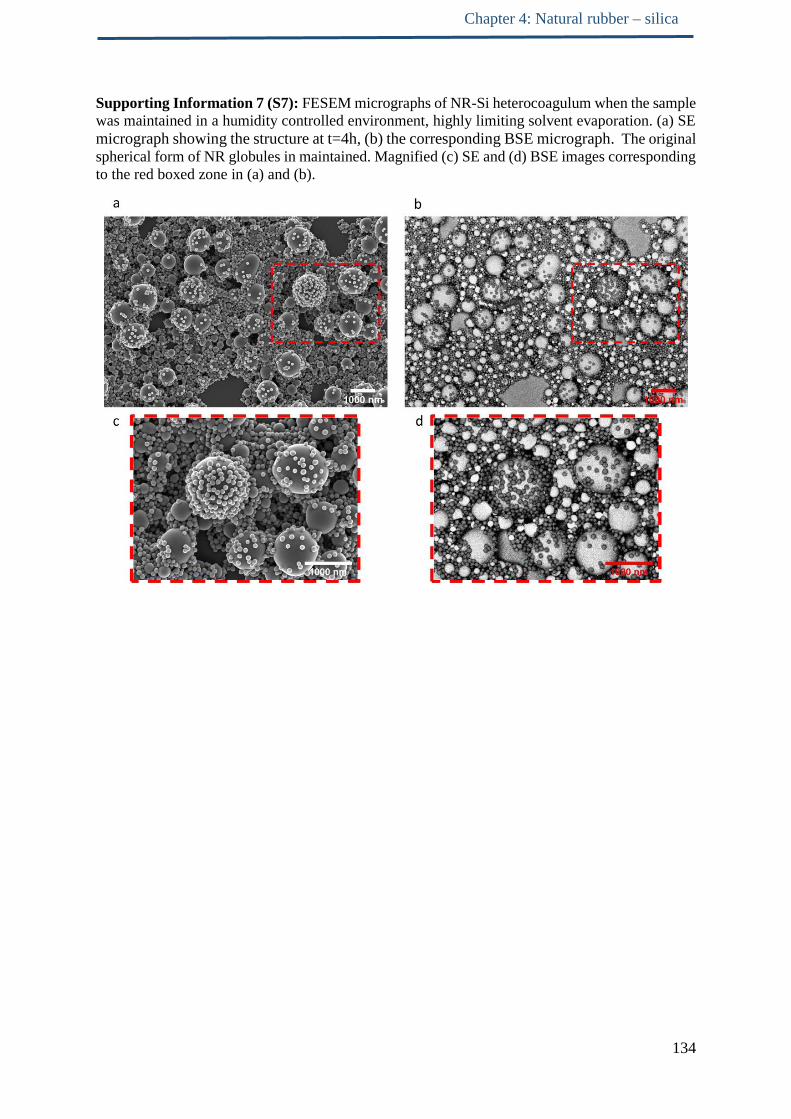
134
Chapter 4: Natural rubber – silica
Supporting Information 7 (S7): FESEM micrographs of NR-Si heterocoagulum when the sample
was maintained in a humidity controlled environment, highly limiting solvent evaporation. (a) SE
micrograph showing the structure at t=4h, (b) the corresponding BSE micrograph. The original
spherical form of NR globules in maintained. Magnified (c) SE and (d) BSE images corresponding
to the red boxed zone in (a) and (b).

135
Chapter 4: Natural rubber – silica
Supporting Information 8 (S8): SE micrographs of the DPNR-Si; structure fixed at (a) t=1 h,
(b) t=4 h and (c) t=24 h after deposition of the sample on the cover slip. Magnification 10000x,
and scale bar corresponding to 1000 nm.
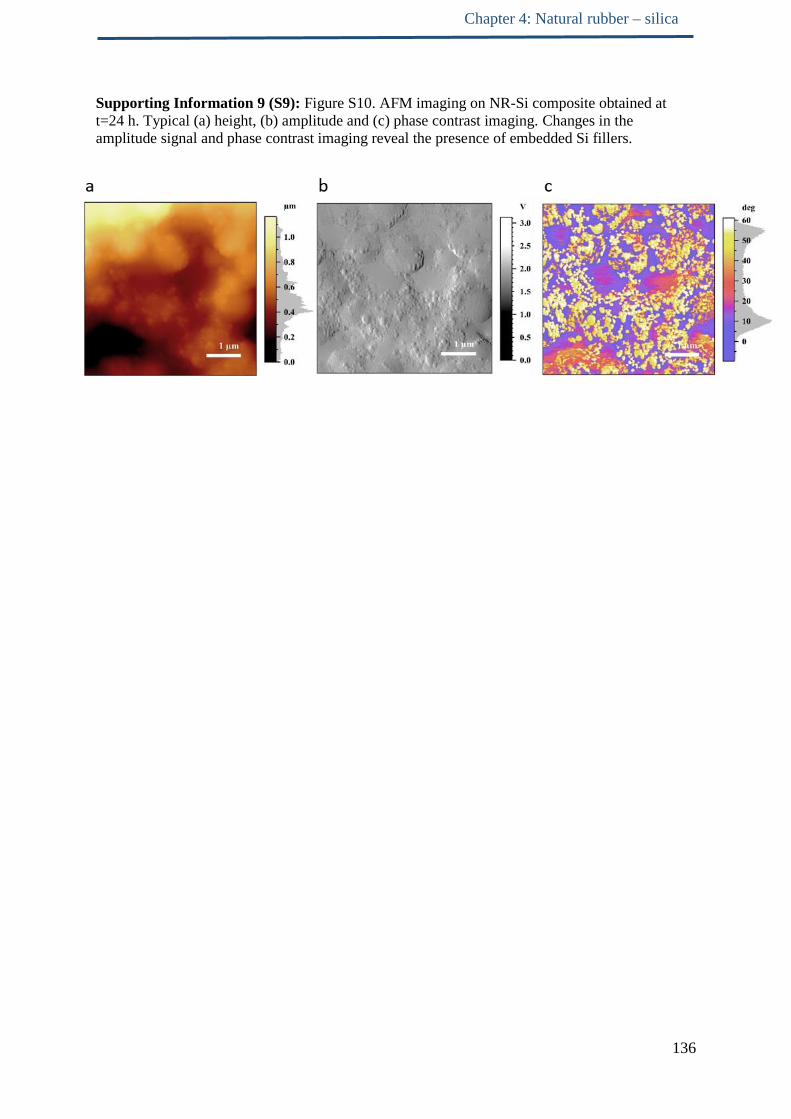
136
Chapter 4: Natural rubber – silica
Supporting Information 9 (S9): Figure S10. AFM imaging on NR-Si composite obtained at
t=24 h. Typical (a) height, (b) amplitude and (c) phase contrast imaging. Changes in the
amplitude signal and phase contrast imaging reveal the presence of embedded Si fillers.

137
Chapter 4: Natural rubber – silica
Supporting Information 10 (S10): Transmission images recorded along with oscillation cycles
for the NR-Si binary colloidal suspension in presence (a) and absence of ionic medium (b).
Mechanical forces were applied using the RheOptiCAD module. The parameters of each oscillation
correspond to 10 Hz frequency; total displacement of 1 µm displacement; 500µm of gap; and 60s
of application. Scale bar corresponding to 10µm.
138
Chapter 4: Natural rubber – silica
Article 3: Nanoscopic spatial arrangement of silica
fillers with proteins and lipids of natural rubber:
from a colloidal suspension to an elastomeric
composite
Gianluca Cattinari*1, Karine Steenkeste1, Clément Cabriel1, Sandrine Leveque-Fort1, Alexis
Canette2, Matthieu Gallopin4, Marc Couty4, Ariane Deniset3, Marie-Pierre Fontaine-Aupart1
1 Université Paris-Saclay, CNRS, Institut des Sciences Moléculaires d’Orsay, 91405, Orsay, France
2 Institute de biologie Paris Seine (IBPS), Sorbonne Université, CNRS service de microscopie électronique,
75005 Paris
3 Université Paris-Saclay, CNRS, Institut Chimie Physique (LCP), Université Paris-Saclay, 91405, Orsay,
France
4 Manufacture Française de Pneumatiques Michelin
Article in preparation

139
Chapter 4: Natural rubber – silica
Nanoscopic spatial arrangement of silica fillers with
proteins and lipids of natural rubber: from a
colloidal suspension to an elastomeric composite Gianluca Cattinari*1, Karine Steenkeste1, Clément Cabriel1, Sandrine Leveque-Fort1, Alexis
Canette2, Matthieu Gallopin4, Marc Couty4, Marie-Pierre Fontaine-Aupart1
1 Université Paris-Saclay, CNRS, Institut Sciences Moléculaires d’Orsay, 91405, Orsay, France
2 Sorbonne Université, CNRS, Institut de Biologie Paris-Seine, 75005, Paris, France
3 Université Paris-Saclay, CNRS, Institut Chimie Physique (LCP), Université Paris-Saclay, 91405, Orsay,
France
4 Manufacture Française des Pneumatiques Michelin, Clermont-Ferrand, France
ABSTRACT: Producing an elastomeric composite material through coagulation of a binary colloidal suspension
composed of Natural Rubber (NR) latex and particulate fillers is a novel production method of interest in rubber
technology. The applicability of this process using silica (Si) as fillers is particularly interesting, especially in the
tire industry. If the technological process parameters are quickly developing at engineering level, the fundamental
knowledge of nanoscale structural characterization during coagulation and drying is still at its infancy. In partic-
ular, the spatial arrangement of proteins and lipids of NR and their localization in respect to the fillers is not
known, and if solved it could enrich the knowledge on the role of those biomolecules during coagulation and
drying. To this aim, we used dual colors direct stochastic optical reconstruction microscopy (d-STORM) as super
resolution fluorescent microscopy technique to unravel the spatial distribution of lipids and proteins of NR from
the early stage of mixing of NR latex with Si fillers, until the formation of a composite obtained after evaporating
the solvent at room temperature. The combination of d-STORM and field emission scanning electron microscopy
(FESEM) was exploited to localized proteins and lipids with regards to Si fillers. We report that the presence of
Si influences the distribution of proteins and lipids of NR. When Si fillers surround NR globules at the early stage
of mixing, proteins and lipids of NR are found forming large domains (~300 nm) in the NR-Si composite, while
smaller proteins and lipids aggregates are present in absence of Si. Subsequently, the large proteins and lipids
domains formed in presence of Si are found either co-localized or in close proximity to filler structures in the
composite. We conclude suggesting a Si-induced aggregation mechanism of the biomolecules.
Making elastomeric composite materials via coagulation of a binary colloidal suspension of natural
rubber (NR) and silica (Si) fillers is a novel strategy in rubber technology1. Preliminary studies
highlighted the importance of divalent ions present in suspension in order to achieve the desired
coagulation2. Additionally, a recent study by our group focused on the structural characterization
and evolution of such hetero-coagulum along drying, reporting the presence of Si fillers
surrounding NR globules and indicating an interaction between the two components in liquid
suspension. However, the spatial arrangement of proteins and lipids of NR and their localization in
respect to the filler during coagulation and drying remains unknown, and if solved it could enable
more insights on the role of those biomolecules in the nanoscopic processes occurring during the
coagulation and drying. To explore the spatial distribution of such biomolecules and precisely
localize Si fillers, high resolution imaging techniques are necessary. Fluorescence microscopy
techniques have been extensively used to visualized proteins and lipids in cell membranes3.
However, conventional fluorescence microscopy cannot differentiate proteins from lipids in NR4.
Only the recent advances on single molecule localization microscopy (SMLM) enabled specific

140
Chapter 4: Natural rubber – silica
recognition of these bio-molecules with resolution down to several dozens of nanometers5. These
techniques have mostly seen applications in the life sciences, but they are recently gaining
interested in the field of materials6. In particular, direct stochastic optical reconstruction
microscopy (d-STORM) has been recently used for NR reporting the presence of proteins and lipids
at the chain-end of polyisoprene7. In this work, dual color d-STORM imaging is employed to
investigate on the spatial arrangement of proteins and lipids of NR from the early stage of contact
between NR globules and Si occurring during hetero-aggregation until the formation of a composite
obtained after drying. In addition, the combination of d-STORM with field emission scanning
electron microscopy (FESEM) was also exploited recovering the same exact region of the sample
and precisely localize proteins and lipids in respect to Si fillers in the composite material obtained
after evaporation of the solvent at room temperature.
2. MATERIAL AND METHODS
2.1 Sample Preparation and materials
High ammonia concentrated NR latex (∼60 wt %, HA latex) (Michelin, Clermont Ferrand, France)
was used diluted at a concentration of 0,075 wt% in distilled water and used for the experiments.
The obtained suspension is a colloidal dispersion of only NR globules. Their typical structure refers
to a polyisoprene core surrounded by a thin biomembrane primarily made of lipids and proteins8,
and their size varies between ~100-1000 nm 9. This NR latex suspension was mixed with 100 nm
Si fillers (when fluorescent, the corresponding spectra is reported in Figure S1) (Kisker Biotech,
Steinfurt, Germany) at a concentration adjusted to have a final volume percent ratio of 40%. It was
further controlled that this protocol leads to a coagulum having ~20% mass Si/NR ratio (data not
shown). The suspension medium was composed of a magnesium sulfate solution (MgSO4) (Sigma-
Aldrich) adjusted to a concentration of 0.025M (pH of ~6,5) corresponding to 100 mM ionic
strength when mixed with NR latex. Immediately after mixing, 100 µL of the binary colloidal sus-
pension were deposited on a rounded glass coverslip (coverslip thickness of 170 µm (1.5H, MEN-
ZEL-GLASER)), resulting in a casted drop with a spherical cap shape as illustrated in Figure 1
(drop diameter ~ 1 cm). A phase-separation was macroscopically visible at t=1 h, with the for-
mation of a floating object corresponding to the “heterocoagulum” but also some NR and Si parti-
cles adhering on the coverslip. After t=4 h, when most of solvent evaporated, the heterocoagulum
adhered on the glass surface. Under complete solvent evaporation (t=24 h) the material referred to
a composite.

141
Chapter 4: Natural rubber – silica
Figure 1. Schematic illustration of the kinectics of the hetero-coagulum and composite formations
after deposition on the glass coverslip of a NR-Si binary colloidal suspension.
2.2 direct Stochastic Optical Reconstruction Microscopy (dSTORM)
d-STORM relies on the reconstruction of a nanoscale image after recording the stochastic pinpoint-
ing of fluorophores that undergo an on-off switching mechanism, also known as blinking10. To
achieve such temporal signal separation, addition of a chemical imaging buffer to the sample is
necessary. The one used herein contained PBS, β-mercaptoethylamine and an oxygen scavenger
enzymatic system composed of glucose oxidase and catalase (Smart kit, Abbelight, Paris, France).
Such buffer performs better in a poor oxygen environment. Thus, the samples were further sealed
using twinsil paste.
To allow the proteins and lipids localization both on the NR globules and in the composites, the
biomolecules were fluorescently labelled with Cy5-NHS (100µM, incubation time 1h) and Dil (25
µM, incubation time 10 minutes) respectively. Labelling occurred directly in liquid suspension.
When fluorescent Si fillers were mixed with NR globules, Dil was replaced by DID as lipid probe
to prevent any spectral interference between the probes (Figure S1). Moreover, we controlled that
nor Cy5-NHS, Dil and DID have interactions with the fluorophore of Si fillers: no change in the Si
emission spectra was observed (Figure S2).
Fluorescence images were acquired using a Nikon Eclipse Ti-E microscope equipped with two
laser lines. A 532 nm (Verdi G5, 5W, Coherent) was used to excite the fluorescence of both Dil
and fluorescent Si fillers, while a 637 nm (Obis 637LX, 140mW, Coherent) line was employed to
excite Cy5-NHS as well as DID. Firstly, we used a weak laser power to illuminate the sample and
record a conventional diffraction-limited epifluorescence image. Afterwards, the laser power
intensities were increased to induce the stochastic photo-switching of the fluorophores. Two
different modes of excitation were used: a total internal reflection fluorescence (TIRF)11 and a
highly-inclined and laminated optical sheets (Hilo)12 configurations as illustrated in Figure S3. In
TIRF illumination, the generated evanescent wave is limited to 300-400 nm from the glass surface,
reducing the background noise for a better signal quality. However, when a deeper sample
penetration was required Hilo became the preferred excitation mode: the incident laser beam is
highly inclined by a large refraction and is laminated as a thin optical sheet at the specimen site
allowing image acquisition through a depth of several micrometers.

142
Chapter 4: Natural rubber – silica
In both cases, the laser light was focused through a high numerical aperture and magnification
objective (APO TIRF x100 1.49NA, Nikon). Images were acquired using a complementary metal
oxide semiconductor camera (CMOS) with 50 ms exposure time. Appropriate band pass filters
were placed in front of the camera to separate the emission signals of the different fluorophores. A
single d-STORM image is generated by the accumulation ~6000 fluorescence images. The images
were acquired and processed using NEO (Abbelight, Paris, France), a commercial software
allowing live image reconstruction as well as treatment, drift corrections and analysis in terms of
spatial descriptive statistic and clustering. Furthermore, images were processed removing the pixel
per pixel temporal median in order to get rid of background noise without altering the number of
photons in the PSFs. Each PSF was characterized using a Gaussian fit, and potential drift between
sequential acquisition was corrected using a cross correlation algorithm.
2.3 Cluster Analysis
Density based spatial clustering of application with noise (DBSCAN) was employed as algorithm
for cluster analysis. DBSCAN looks for clusters, by looking for the number of localizations within
a circle defined by its radius (ε) and its center (p). If the area of the circle contains more than a
minimum number of points (MinPts), a new cluster with p as a core object is created. We chose
ε=50 nm and MinPts=50 as input parameters in order to detect clusters that would allow high
density areas of proteins and lipids in a circle having diameter of 100 nm. This method has been
applied on two ROI regions of the acquired d-STORM images for each condition.
2.4 Field Emission Scanning Electron Microscopy (FESEM)
FESEM using both topological contrast by secondary electrons (SE) imaging and chemical contrast
by backscattered electron imaging (BSE) was performed on samples fixed using vapor of osmium
as described in details in reference13. This type of fixation allowed us to preserve the colloidal
structure of NR globules as well as to exploit both SE and BSE imaging based on chemical contrast.
Indeed, the high affinity of osmium for NR particles results in an important differentiation between
NR and Si in BSE images: Si particles appears dark while NR appears bright. The fixed coverslips
were mounted on 25.4 mm aluminium pin stubs (Micro to Nano, the Netherlands) with double
sided sticky and conductive tabs (EMS, USA). Samples were then coated with a 10 nm carbon
layer by double thread evaporation in high vacuum (10-5 mbar) with an ACE600 device (Leica,
Germany). Observations were performed in high vacuum (10-6 mbar) with a FESEM Gemini500
(Zeiss, Germany) operating at 2kV, with high current mode, a 20 µm aperture and around 2 mm of
working distance. SE were collected with the corresponding SE in lens detector. BSE were col-
lected with the energy selective in column detector using filtering grid > 400 V to filter out SE
signal. Please note that both SE and BSE signals are surface selective, but while SE images are
produce at the extreme surface (depth of few nanometers), BSE images are capable of providing
information arising from a depth of few tens of nanometers14. Images were acquired with a 1024 x
768 definition, a pixel dwell time of 6,4 µs (scan speed "7") and a line averaging of 25.

143
Chapter 4: Natural rubber – silica
FESEM was also performed after d-STORM measurements recovering the same region of
acquisition. The re-location of the same area of the sample by both methods has been achieved
through the use of patterned glass coverslips (also of thickness 170 µm (1.5H)) (Ibidi GmbH); they
are composed of 400 numbered micro-squares of 50 µm (Figure S4), as well as the use of Si as bi-
functional probe visible by both methods. Due to strong quenching of the fluorescence signal after
fixation with vapors of osmium tetroxide15, d-STORM acquisitions using Hilo illumination were
performed prior FESEM measurements.

144
Chapter 4: Natural rubber – silica
3. RESULTS AND DISCUSSION
A. Spatial distribution of proteins and lipids on NR globules: the interaction with Si fill-
ers
The distribution of proteins and lipids on NR globules using d-STORM measurements was first
approached by Wu and al7. In their conditions, the NR globules were spin coated on a slide and
were thus analysed without solvent environment. Here, we controlled the proteins and lipids distri-
bution in our ionic medium conditions (Mg2+, ionic strength=0,1 M) (Figure 3) using both TIRF
and Hilo illumination. In each case, both biomolecules appear quite homogeneously distributed all
around the NR surface. However, some segregated domains randomly interdispersed can be ob-
served in particular for proteins, in agreement with previous observations7. Additionally, when two
different NR globules come into contact, proteins and lipids are observed in the “bridging zone”
connecting the two NR particles. This same condition was also analysed by FESEM (Figure 3e),
showing polymeric material in the area connecting rubber globules.
Figure 3. d-STORM microscopy on NR globules, in presence of Mg2+ ions (ionic strength=0,1 M),
at t=1 h. The localization of proteins and lipids is indicated with red and green respectively. (a)
Dual color d-STORM micrograph using TIRF illumination on NR globules deposited on the
coverslip. (b1) Lipids and (b2) proteins distribution on a single NR globule when using TIRF
illumination. (c1) Lipids and (c2) proteins distribution on a single NR globule when using Hilo
illumination. (d) Coalescence between NR globules illustrating the presence of proteins and lipids
acting as bridges between them. (d) Corresponding SE image revealing the presence of polymeric
material between two NR globules.
Combining the information between the two techniques we can state that during coalescence the
polyisoprene chains are diffusing across the particle-particle interface, while at the same time
proteins and lipids are also moving filling up the same region. This is an indication that at least part
of the lipids and the proteins composing the bio-membrane of NR are linked with the inner polymer

145
Chapter 4: Natural rubber – silica
core and are involved in the coalescence between rubber globules.
To investigate on the interaction between Si fillers and NR globules, dual color d-STORM images
labelling Si particles and one of the biomembrane components (either proteins or lipids) were
performed (Figure 4). In both cases, we highlighted the presence of Si fillers is contact with the
surface of the NR globules (Figure 4a and Figure 4b), indicating an interaction. This result is in
line with FESEM measurements highlighting the presence of Si fillers surrounding NR globules
and preventing their direct contact16. However, no particular changes concerning the distribution
of lipids and proteins on the globules surface were highlighted when Si establishes contact. This
indicated that at early stage of mixing, when the solvent is still largely present, Si fillers do not
seem to trigger any modification on the arrangement of proteins and lipids on the biomembrane.
The latter result is in agreement with our previous work demonstrating that Si fillers do not induce
any deformation on NR globules16.
.
Figure 4. Dual color d-STORM micrographs on a NR globule in contact with Si fillers in
presence of Mg2+ ions (ionic strength=0,1 M), using Hilo excitation. (a) Dual color image
labelling lipids (green) and Si (cyan). (b) Dual color image labelling proteins (red) and Si fillers
(cyan). (c) SE and (d) BSE on a NR globule surrounded by Si fillers.
B. Reorganization of proteins and lipids distribution during coalescence
Regardless of the presence of Si, it was previously demonstrated that NR globules lose their original
colloidal form along with solvent evaporation, giving rise to a NR film generated from their
coalescence. Typically, at t=4 h, when most of the solvent is evaporated, the NR-Si coagulum is
structurally heterogeneous. A part of the sample is covered by a NR film, while some NR globules

146
Chapter 4: Natural rubber – silica
still maintained their colloidal structure. To investigate on the distribution of proteins and lipids of
NR along with the aforementioned film formation process, dual color d-STORM imaging was
performed at this stage on the NR-Si coagulum, focusing on the leftover colloidal form of NR
globules (Figure 5). Results indicate the formation of clusters of proteins and lipids, with size
ranging between 250-350 nm. Additionally, these clusters tended to be arranged in more circular
forms with size ranging within 500-1200 nm, a similar range as the one referring to the diameters
of LRPs (200-1000 nm) (Figure 5b, c and d).
Figure 5. Distribution of proteins and lipids in NR-Si coagulum at t=4 h, when the solvent is
majorly evaporated. (a) Dual color d-STORM fluorescence image of proteins (red) and lipids
(green) showing the organization of the bio-molecules into clustered domains. Magnified views
of the boxed region in (a) showing a tendency of (b) proteins and (c) lipids cluster to be organized
into circular arrangements. (d) Superposed image of (b) and (c).
The spatial distribution of proteins and lipids was then studied after complete evaporation of the
solvent, when the memory of the original colloidal form of NR globules is completely lost (t=24
h), in both presence and absence of Si fillers (Figure 6). A very different behavior was observed.
In absence of Si fillers, proteins (red) and lipids (green) were organized in very small domains with
very few aggregate structures with size of approximately 100-150 nm. The presence of very small
proteins and lipids aggregates in absences of Si is in line with previously reported SAXS
measurement where their characteristic size was evaluated to be ~25 nm17. Despite this
morphology, we find a rather homogenous distribution of the bio-components throughout the NR
film (Figure 5c). On the other hand, when Si fillers are embedded in the NR film the biomolecules
showed a marked clustering behavior, forming relatively large domains of similar size as the ones
reported at t=4 h (250-350 nm). Additionally, clusters of proteins and lipids overlapping with each
other are also present, suggesting possible co-assembly.
To verify on the accentuated clustering of the biomolecules when in presence of Si, we employed
density based spatial clustering of application with noise (DBSCAN) algorithm. Typical example
of cluster analysis on different ROIs comparing the level of proteins and lipids clustering between
the NR film obtained in absence of Si and the NR-Si composite are shown in Figure S5 and S6,
confirming a higher clustering level of the bio-molecules when in presence of Si. To control that
the presence of the sole ionic medium could not influence the clustering behavior of bio-membrane

147
Chapter 4: Natural rubber – silica
components, the spatial distribution of lipids and proteins and related DBSCAN analysis have been
studied on a NR film prepared without coagulation, by simply drying the NR latex in absence of
Mg2+ (Figure S7 and S8). The analysis resulted in a distribution of proteins and lipids very
comparable to the one referred to the NR film obtained after coagulation and solvent evaporation
in the absence of Si fillers. Altogether, these results point in the direction of a Si- induced clustering
mechanism of proteins and lipids. However, the marked clustering of the biomolecules is not
directly related to the liquid state interaction of Si with the surface of NR globules, but it seems to
start along with their destabilization carried by solvent evaporation (t=4 h). To further investigated
whether Si could be responsible for proteins and lipids clusters, we localized the fillers in respect
to the bio-molecules on the NR-Si composite combining dual color d-STORM with FESEM
experiments recorded on exactly the same sample.
Figure 6. Distribution of proteins and lipids in NR film and NR-Si composite at t=24 h, formed by
coagulation in presence of Mg2+ (ionic strength =0,1 M), and drying. Epifluorescence images of (a)
NR film and (d) NR-Si composite. Dual color d-STORM fluorescence image of proteins (red) and
lipids (green) of the corresponding (b) NR film and (e) NR-Si composite. (c), (f) Magnified view
of the boxed region (image size: ~10x10 µm) in (b), and (e), respectively, showing a difference in
the distribution of proteins and lipids between the NR film and the NR-Si composite. Proteins and
lipids show a marked clustering in the NR-Si composite.
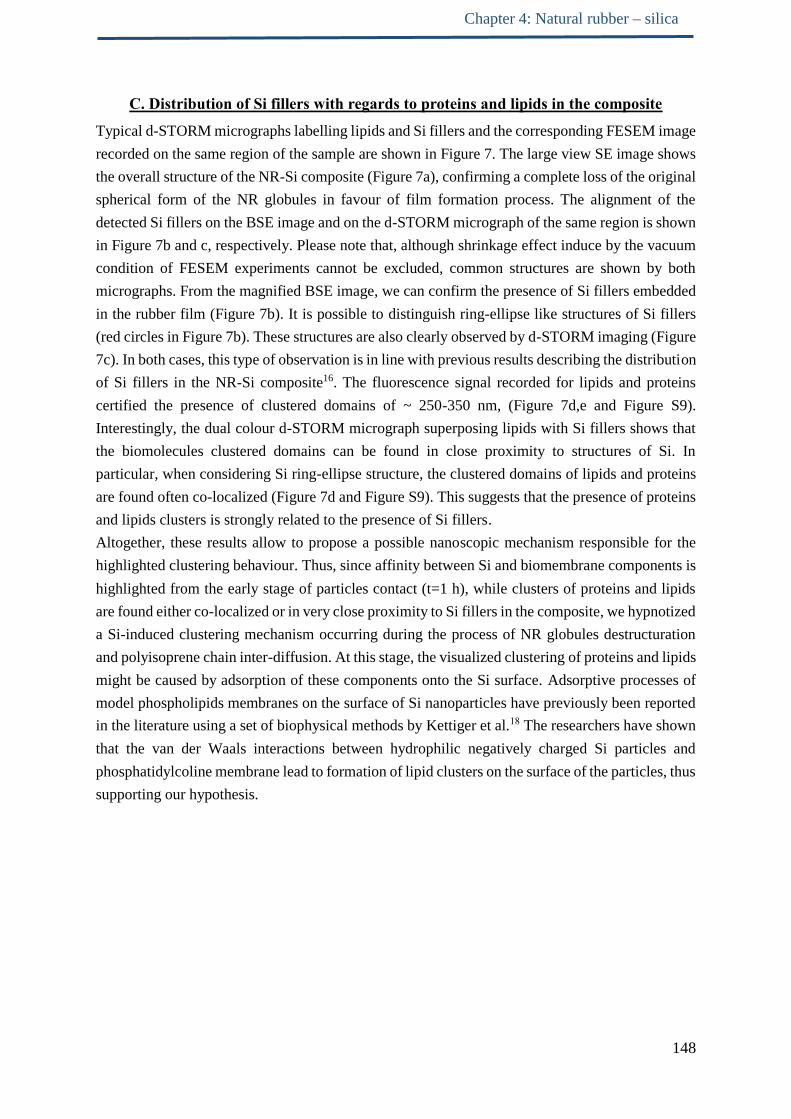
148
Chapter 4: Natural rubber – silica
C. Distribution of Si fillers with regards to proteins and lipids in the composite
Typical d-STORM micrographs labelling lipids and Si fillers and the corresponding FESEM image
recorded on the same region of the sample are shown in Figure 7. The large view SE image shows
the overall structure of the NR-Si composite (Figure 7a), confirming a complete loss of the original
spherical form of the NR globules in favour of film formation process. The alignment of the
detected Si fillers on the BSE image and on the d-STORM micrograph of the same region is shown
in Figure 7b and c, respectively. Please note that, although shrinkage effect induce by the vacuum
condition of FESEM experiments cannot be excluded, common structures are shown by both
micrographs. From the magnified BSE image, we can confirm the presence of Si fillers embedded
in the rubber film (Figure 7b). It is possible to distinguish ring-ellipse like structures of Si fillers
(red circles in Figure 7b). These structures are also clearly observed by d-STORM imaging (Figure
7c). In both cases, this type of observation is in line with previous results describing the distribution
of Si fillers in the NR-Si composite16. The fluorescence signal recorded for lipids and proteins
certified the presence of clustered domains of ~ 250-350 nm, (Figure 7d,e and Figure S9).
Interestingly, the dual colour d-STORM micrograph superposing lipids with Si fillers shows that
the biomolecules clustered domains can be found in close proximity to structures of Si. In
particular, when considering Si ring-ellipse structure, the clustered domains of lipids and proteins
are found often co-localized (Figure 7d and Figure S9). This suggests that the presence of proteins
and lipids clusters is strongly related to the presence of Si fillers.
Altogether, these results allow to propose a possible nanoscopic mechanism responsible for the
highlighted clustering behaviour. Thus, since affinity between Si and biomembrane components is
highlighted from the early stage of particles contact (t=1 h), while clusters of proteins and lipids
are found either co-localized or in very close proximity to Si fillers in the composite, we hypnotized
a Si-induced clustering mechanism occurring during the process of NR globules destructuration
and polyisoprene chain inter-diffusion. At this stage, the visualized clustering of proteins and lipids
might be caused by adsorption of these components onto the Si surface. Adsorptive processes of
model phospholipids membranes on the surface of Si nanoparticles have previously been reported
in the literature using a set of biophysical methods by Kettiger et al.18 The researchers have shown
that the van der Waals interactions between hydrophilic negatively charged Si particles and
phosphatidylcoline membrane lead to formation of lipid clusters on the surface of the particles, thus
supporting our hypothesis.

149
Chapter 4: Natural rubber – silica
Figure 7. Combined d-STORM and FESEM measurements on the NR-Si composite labelling Si
and lipids. (a) SE large view. (b) Magnified BSE image of the blue boxed region in (a). (c) d-
STORM micrographs of Si fillers (cyan) showing the presence of ring-ellipse like structure. (d)
Dual color d-STORM micrographs combining the fluorescence signals of Si fillers (cyan) and
lipids (green), obtained with sequential acquisitions and recorded in the blue boxed region of (a)
showing the presence of lipid clusters in close proximity to structures of Si fillers. (e) Magnified
view of the red boxed region in (d), showing the presence of lipid clusters in close proximity or co-
localised with ring-ellipse like structure of Si fillers.

150
Chapter 4: Natural rubber – silica
4. CONCLUSION
This study reports new insights into the spatial distribution of proteins and lipids of NR globules
together with Si fillers, during their coagulation and drying processes.
We exploited dual color d-STROM microscopy to report on the impact of Si fillers on the
biomolecules distribution, suggesting a Si-induced clustering mechanism of proteins and lipids of
NR. In fact, proteins and lipids organized themselves into large domains with sizes of ~300 nm in
the NR-Si composite material, while fewer and smaller aggregates were found in absence of Si.
Subsequently, the original combination of d-STROM microscopy with FESEM measurements
recorded on the same region of the sample highlighted that the clusters of proteins and lipids tend
to be located either co-localized or in very close proximity to Si fillers. Thus, we report that the
presence of Si is related to the formation of proteins and lipids cluster. In addition, we hypothesize
that such proteins and lipids clusters might be formed through adsorptive process occurring during
NR globule destructuration on the surface of Si fillers, which are surrounding the NR particles from
the early stage of particles contact. To our knowledge, this is the first time that the spatial
arrangement of proteins and lipids of NR is followed from the early stage of mixing with Si fillers,
until the formation of an elastomeric composite.
REFERENCES
1. Boonsomwong, K. et al. Rejuvenating the structure and rheological properties of silica nano-
composites based on natural rubber. Polymer 189, 122168 (2020).
2. Chan, A. J. et al. Natural Rubber–Filler Interactions: What Are the Parameters? Langmuir 31,
12437–12446 (2015).
3. Sezgin, E. & Schwille, P. Fluorescence Techniques to Study Lipid Dynamics. Cold Spring
Harbor Perspectives in Biology 3, a009803–a009803 (2011).
4. Sakdapipanich, J. Current Study on Structural Characterization and Unique Film Formation
of Hevea brasiliensis Natural Rubber Latex. Advanced Materials Research 844, 498–501
(2013).
5. Owen, D. M. & Gaus, K. Imaging lipid domains in cell membranes: the advent of super-reso-
lution fluorescence microscopy. Front. Plant Sci. 4, (2013).
6. Wöll, D. & Flors, C. Super-resolution Fluorescence Imaging for Materials Science. Small
Methods 1, 1700191 (2017).

151
Chapter 4: Natural rubber – silica
7. Wu, J. et al. Super-Resolution Fluorescence Imaging of Spatial Organization of Proteins and
Lipids in Natural Rubber. Biomacromolecules 18, 1705–1712 (2017).
8. Rochette, C. N. et al. Shell Structure of Natural Rubber Particles: Evidence of Chemical
Stratification by Electrokinetics and Cryo-TEM. Langmuir 29, 14655–14665 (2013).
9. Chan, A. J. et al. LIPID CONTENT IN SMALL AND LARGE NATURAL RUBBER PAR-
TICLES. Rubber Chemistry and Technology 88, 248–257 (2015).
10. Turkowyd, B., Virant, D. & Endesfelder, U. From single molecules to life: microscopy at the
nanoscale. Analytical and Bioanalytical Chemistry 408, 6885–6911 (2016).
11. Total Internal Reflection Fluorescence (TIRF) Microscopy. Nikon’s MicroscopyU
https://www.microscopyu.com/techniques/fluorescence/total-internal-reflection-fluorescence-
tirf-microscopy.
12. Tokunaga, M., Imamoto, N. & Sakata-Sogawa, K. Highly inclined thin illumination enables
clear single-molecule imaging in cells. Nature Methods 5, 159–161 (2008).
13. Bell, S. & Morris, K. An introduction to microscopy. (CRC Press, 2010).
14. Hennig, P. & Denk, W. Point-spread functions for backscattered imaging in the scanning
electron microscope. Journal of Applied Physics 102, 123101 (2007).
15. Kim, D. et al. Correlative Stochastic Optical Reconstruction Microscopy and Electron Mi-
croscopy. PLOS ONE 10, e0124581 (2015).
16. Martínez-Pedrero, F. et al. Making an elastomeric composite material via the heteroaggrega-
tion of a binary colloidal dispersion. Soft Matter 8, 8752 (2012).
17. Karino, T., Ikeda, Y., Yasuda, Y., Kohjiya, S. & Shibayama, M. Nonuniformity in Natural
Rubber As Revealed by Small-Angle Neutron Scattering, Small-Angle X-ray Scattering, and
Atomic Force Microscopy. Biomacromolecules 8, 693–699 (2007).
18. Kettiger, H., Québatte, G., Perrone, B. & Huwyler, J. Interactions between silica nanoparti-
cles and phospholipid membranes. Biochimica et Biophysica Acta (BBA) - Biomembranes
1858, 2163–2170 (2016).

152
Chapter 4: Natural rubber – silica
Supporting information
Nanoscopic spatial arrangement of silica fillers with
proteins and lipids of natural rubber: from a colloidal
suspension to an elastomeric composite
Gianluca Cattinari*1, Karine Steenkeste1, Clément Cabriel1, Sandrine Leveque-Fort1, Alexis
Canette2, Matthieu Gallopin4, Marc Couty4, Ariane Deniset3, Marie-Pierre Fontaine-Aupart1
1 Université Paris-Saclay, CNRS, Institut des Sciences Moléculaires d’Orsay, 91405, Orsay, France
2 Institute de biologie Paris Seine (IBPS), Sorbonne Université, CNRS service de microscopie électronique,
75005 Paris
3 Université Paris-Saclay, CNRS, Institut Chimie Physique (LCP), Université Paris-Saclay, 91405, Orsay,
France
4 Manufacture Française de Pneumatiques Michelin

153
Chapter 4: Natural rubber – silica
Supporting Information 1 (S1): Fluorescence absorption and emission spectra of the involved
fluorophores. Absorption (dashed line) and emission (full line). 532nm and 633nm inserted line
represent the respective excitation with the laser. Cy5-NHS is the fluorophore used to label
proteins, while either Dil or DID were used as lipid probes. Silica fillers were commercially labeled
and no indication on the type of fluorophore was given by the manufacturer (Kisker Biotech,
Germany).

154
Chapter 4: Natural rubber – silica
Supporting Information 2 (S2): Fluorescence emission spectra of silica particles in absence and
presence of Cy5 and Dil. Recorded by Cary Eclipse (Varian, Palo Alto, CA, USA).

155
Chapter 4: Natural rubber – silica
Supporting Information 3 (S3): Schematic illustration of (a) TIRF and (b) Hilo excitation
applied to our system. The penetration depth when using TIRF is limited to 300-400 nm so that
only a section of LRPs adhered on the coverslip can be excited. Using Hilo excitation, the
penetration depth is of several micrometers.

156
Chapter 4: Natural rubber – silica
Supporting Information 4 (S4): Large view SE image of the NR-Si composite deposited on an
Ibidi correlative support for combining FESEM and d-STORM experiments.
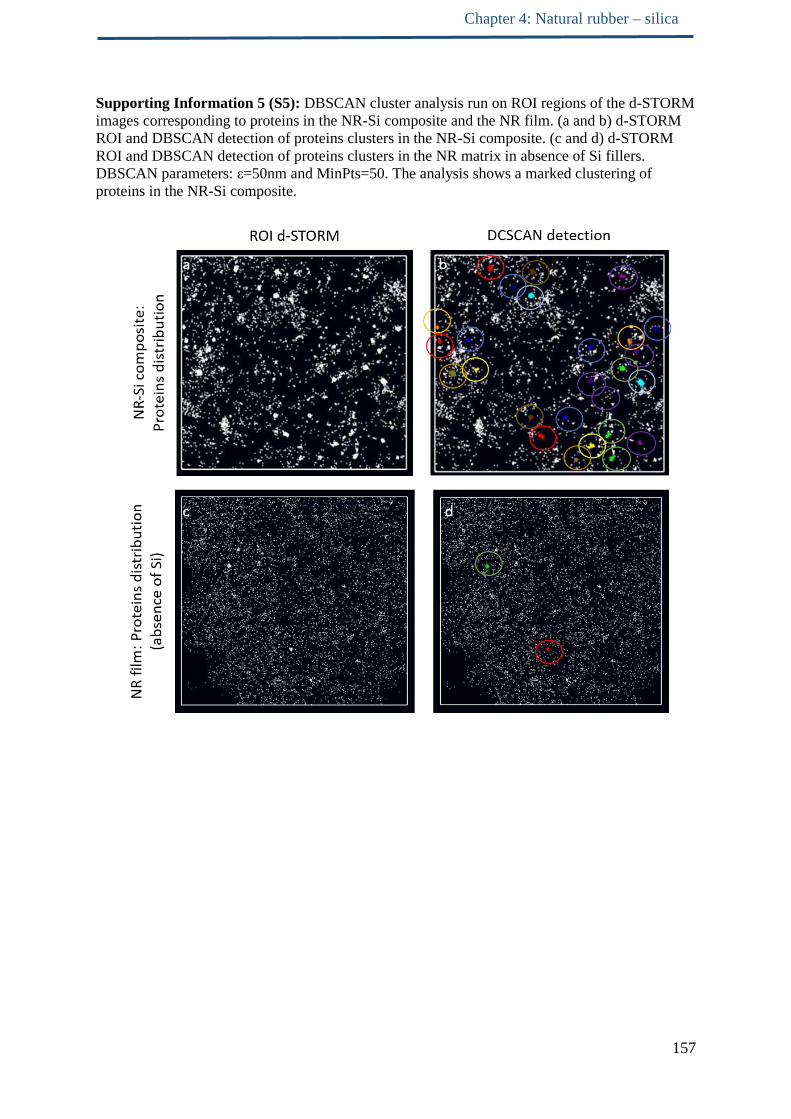
157
Chapter 4: Natural rubber – silica
Supporting Information 5 (S5): DBSCAN cluster analysis run on ROI regions of the d-STORM
images corresponding to proteins in the NR-Si composite and the NR film. (a and b) d-STORM
ROI and DBSCAN detection of proteins clusters in the NR-Si composite. (c and d) d-STORM
ROI and DBSCAN detection of proteins clusters in the NR matrix in absence of Si fillers.
DBSCAN parameters: ε=50nm and MinPts=50. The analysis shows a marked clustering of
proteins in the NR-Si composite.

158
Chapter 4: Natural rubber – silica
Supporting Information 6 (S6): DBSCAN cluster analysis run on ROI regions of the d-STORM
images corresponding to lipids in the NR-Si composite and the NR film. (a and b) d-STORM ROI
and DBSCAN detection of lipid clusters in the NR-Si composite. (c and d) d-STORM ROI and
DBSCAN detection of proteins clusters in the NR matrix in absence of Si fillers. DBSCAN
parameters: ε=50nm and MinPts=50. The analysis shows clustering of lipid in the NR-Si
composite.

159
Chapter 4: Natural rubber – silica
Supporting Information 7 (S7): Distribution of proteins and lipids in NR film formed in absence
of the ionic medium, at t=24h. (a) Epifluorescence image (EPI). (b) Dual color d-STORM
fluorescence image of proteins (red) and lipids (green) of the same zone. (c) Magnified view of the
boxed region in b (image size: ~10X10µm).
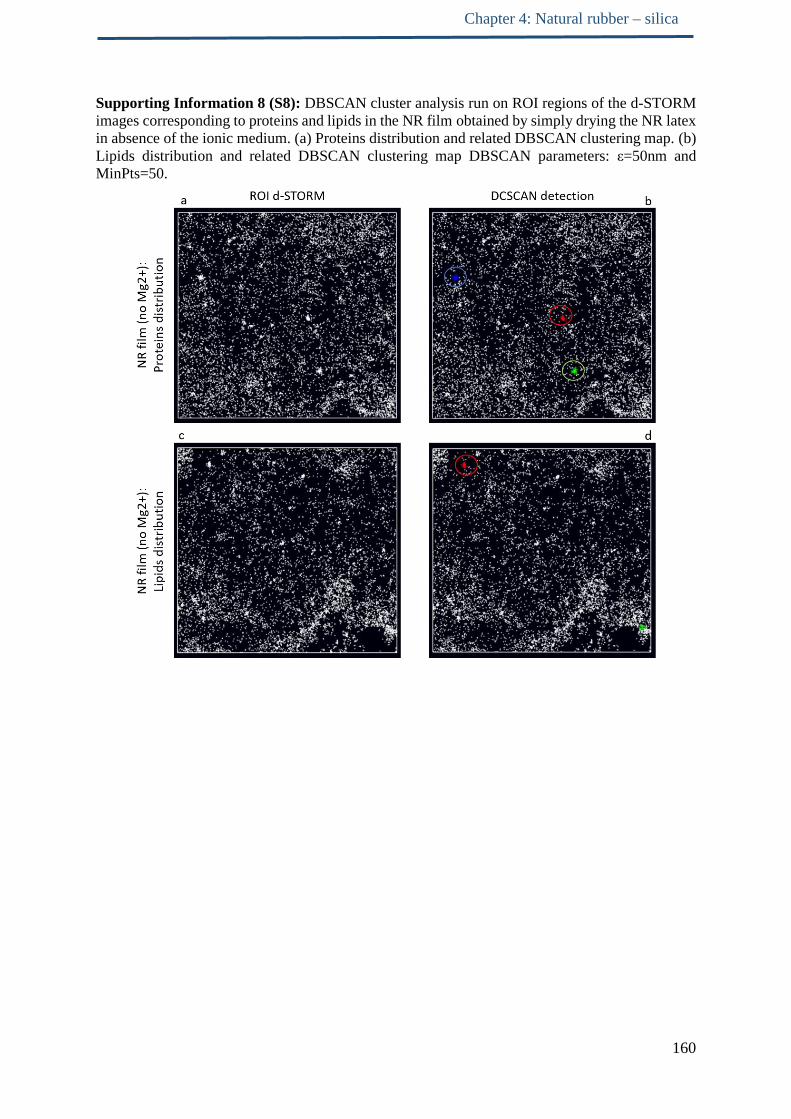
160
Chapter 4: Natural rubber – silica
Supporting Information 8 (S8): DBSCAN cluster analysis run on ROI regions of the d-STORM
images corresponding to proteins and lipids in the NR film obtained by simply drying the NR latex
in absence of the ionic medium. (a) Proteins distribution and related DBSCAN clustering map. (b)
Lipids distribution and related DBSCAN clustering map DBSCAN parameters: ε=50nm and
MinPts=50.

161
Chapter 4: Natural rubber – silica
Supporting Information 9 (S9): Combined d-STORM and FESEM measurements on the NR-Si
composite labelling Si and proteins. (a) SE large view. (b) Corresponding BSE image. (c)
Magnified BSE view of the orange boxed region in (b). (d) Corresponding d-STORM micrographs
of Si fillers (cyan) showing the presence of ring-ellipse like structure. (e) Corresponding d-STORM
micrographs combining the fluorescence signals of Si fillers (cyan) and lipids (green), showing the
presence of lipid clusters either co-localized or in close proximity to structures of Si fillers.

162
Chapter 4: Natural rubber – silica
Annex
a) Lipids cluster detection by AFMIR AFM-IR was also exploited to confirm the presence of lipids cluster on the NR-Si composite. To
do so, two IR maps were registered at 1450 cm-1 at 1725 cm-1. This last wavenumber is
characteristic of the C=O stretching of free fatty acids and its typical absorption band can be
detected by the acquisition of local spectra using AFM-IR. On the other hand, the absorption band
at 1450 cm-1 refers to the CH2 bending deformation, and it is a typical band of polyisoprene as
illustrated in the FTIR spectra of the polymer (Figure 4.1). This last one does not show any
absorption at 1725 cm-1.
Figure 4.1. FTIR spectra of polyisoprene (IR2200) recorded in attenuated total reflection mode.
The registered IR maps together with the corresponding AFM topograpgy image are shown in
Figure 4.2. the IR map at 1725 cm-1 shows absorption in equivalent zones as the ones reported in
the IR map at 1450 cm-1 demonstrating that lipids are surely in very close proximity to polyisoprene
chains (Figure 4.2b and c) (the red/yellow colour represent high absorption in the IR maps while
the blue colour refers to low absorption, as indicated by the colour bar). Subsequently, the ratio
between the IR maps (1725/1450 cm-1) was performed revealing interesting features (Figure 4.2d).
In fact, the IR map ratio shows areas of higher intensity (white circles), which strongly suggest the
presence of clustered lipid domains. The specific size of these structures ranges between 200 -300
nm, very similarly to the size range detected by d-STORM imaging. This confirmed the possibility
to detect lipid clusters using AFM-IR, possibly opening up new possibilities to exploit the
techniques to specifically investigate whether lipids are adsorbed on the surface of the fillers.

163
Chapter 4: Natural rubber – silica
Figure 4.2. Detection of lipids in NR-Si composite by AFM-IR. (a) Topography image. (b) IR map
at 1450 cm-1 referring to the CH2 deformation typical of polyisoprene. (c) IR map at 1725 cm-1
referring to the C=O of fatty acids. (d) IR map ratio between 1725 cm-1 and 1450 cm-1 highlighting
the presence of higher intensity domains probably related to the presence of lipid clusters.

164

165
Conclusions and Perspectives

166
Mixing elastomers in the form of latex with particulate fillers using liquid phase mixing technology
is an innovative strategy for the manufacturing of elastomeric composite materials. In the tire
industry, this type of mixing is very promising to possibly achieve a successful reinforcement by
improving the dispersion and distribution of the fillers. For this reason, liquid phase mixing is
central for MICHELIN innovation strategy, especially using NR latex in combination with CB or
Si fillers. If the technological process parameters are under control at the engineering level, the
fundamental knowledge of the nanoscopic mechanisms and nanoscale processes occurring during
hetero-aggregation and drying are unknown. We believe that their understanding might open up
new ways of exploiting the liquid phase mixing technology. Thus, the main objectives of this PhD
work consisted in the structural characterization of a coagulum made combining NR latex with an
aqueous suspension of either Si or CB fillers, and to follow its evolution along drying until the
formation of an elastomeric composite.
Because of the nanoscale size of NR globules and fillers, the use of highly resolved imaging
techniques was necessary for our investigation. In fact, the beginning of our work consisted in the
development of several imaging protocols for the employment of different microscopy techniques
comprising: FESEM, d-STORM and AFM-IR. Each one of these techniques allowed to reach
innovative and original results.
For a system composed of NR latex and CB fillers in aqueous suspension, we demonstrated that
the way NR globules come into first contact with CB fillers is very important in regulating the
structure of the formed coagulum. The simple mixture of the two colloidal suspensions without any
application of external physical stress leads to a coagulum where CB fillers are not homogenously
distributed nor in contact with NR globules. However, mixing the two components under sonication
maintained CB filler in the form of small aggregates (20-200 nm), leading to a good distribution of
the filler around the NR globules. Such localization of small CB aggregates in direct contact with
the surface of NR globules triggered a structural modification of the latex particles, quickly leading
to coalescence and polyisoprene chain diffusing through the sample. The visualization of this
phenomena allowed us to formulate hypothesis on the nanoscopic mechanisms causing the
destabilization of the globules. We hypothesize a local membrane destabilization induced by the
insertion of small CB filler through the lipidic part of the biomembrane of NR globules. This would
then cause the adsorption of lipids on the hydrophobic domains of CB, leading to their coalescence.
When CB black is replaced by an aqueous suspension of Si fillers of hydrophilic nature, we
confirmed the necessity of ions at sufficient ionic strength to establish interaction between NR
globules and Si particles. Due to the hydrophilic nature of the fillers, we find that Si particle
establish contact with proteins and lipids of NR globules in the liquid state. In this scenario,
sonication was not necessary to form a coagulum where heteroaggregation is dominant over
homoaggregation. In fact, when Mg2+ ions (ionic strength = 0.1 M) are present in the binary
colloidal suspension composed of NR latex and Si fillers, a heterocoagulum is quickly formed
having NR globules completely surrounded by Si particles in contact with the biomembrane
components of the NR globules. Contrarily to CB, the contact established between Si fillers and
167
NR globules does not trigger any deformation or distortion of NR particles, but the state of polymer
chain interdiffusion is regulated by the evaporation of the solvent. As a matters of fact, along with
solvent evaporation the structure of the heterocoagulum changes giving rise to a composite
consisting of a NR film with embedded Si fillers. The latter are found quite homogenously
distributed in the composite and regularly arranged into ring-ellipse like structure, probably related
to their initial interaction with NR globules. Although Si fillers do not induce deformation of the
NR globules, we demonstrated that their presence around the surface of the NR particles has an
effect on the spatial arrangement of proteins and lipids of NR. In this scenario, we highlighted a
marked clustering behavior of proteins and lipids of NR in the NR-Si composite, in comparison to
their distribution in a NR film obtained post coagulation and drying of only NR latex. Additionally,
we also reported a higher concentration of proteins and lipid cluster either co-localized or in close
proximity to Si fillers structures in the NR-Si composite. Altogether these results allowed us to
hypothesize a Si induce clustering mechanism occurring during the destabilization of NR globules
mediated by the adsorption of proteins and lipids on the surface of Si fillers. In this context, the
size of the fillers might also influence the aforementioned adsorption of proteins and lipids onto
the Si particles. Generally, smaller Si particles would have higher specific surface areas and
therefore higher adsorption capacity. It would then be interesting to investigated whether smaller
Si fillers could trigger a destabilization of NR globules, similarly to what has been reported for CB
fillers.
A possible way to quickly trigger the deformation of NR globules and achieve a state of polymer
chain interdiffusion lies in the application of mechanical shear-stress on the binary suspension
composed of NR latex with either CB or Si fillers. In particular, the application of uniaxial shear
used in this study greatly accelerated the formation of a coagulum, together with boosting
coalescence between the NR globules. However, in case of NR-Si system, our shearing condition
did not allow to bypass the interaction energy barrier without the use of salt.
Despite the extensive effort and the limited time, there are still questions left unanswered. For
example, the initiated protocol used for AFM-IR could be further exploited to possibly demonstrate
the hypotheses established for both the NR-CB and the NR-Si system. Theoretically, by the analysis
of local IR spectra recorded on the surface of either Si or CB fillers, it would be possible to gain
information on adsorbed proteins and/or lipids.
Additionally, it would be interesting to explore more the effect that mechanical shear-stress applied
in suspension has at molecular level and its role in the coagulation process. As previously
mentioned, we demonstrated that our shearing condition led to coalescence between NR globules.
At this stage, it would be interesting to control how proteins and lipids of NR are organized during
the application of shear. This would give information on the state of the biomembrane of NR
globules during shear.
Furthermore, simple shear was applied in our study at early mixing time on an already pre-mixed
NR-fillers suspension. However, such shear application does not properly correlate with the one

168
occurring at industrial level, which is generated by the injection at very high speed of the aqueous
filler suspension with NR latex. For this reason, I believe that it would be interesting to build a
laboratory device where a stream of NR latex encounters for the first time the aqueous suspension
of fillers under controlled and regulated shearing conditions and further exploit microscopy
techniques to understand the effect of shear at molecular level.
Other relevant investigations that would allow to approach the industrial protocol refer to the
possibility to repeat our study at increased concentration of NR latex and fillers. This would allow
to better explore how the results reported here for a diluted system might correlate with a more
macroscopic one.
Another continuation of our work is to extend our experimental protocols and approach using field
NR latex. This product is the preferred latex type in the industrial protocol. However, it contains
lutoids, Frey-Wyssling particles, and free proteins and lipids in addition to NR globules. For this
reason, it would be interesting to investigate how the presence of such components might affect the
coagulation process or the nanoscale mechanisms proposed here.
I personally find the multimodal microscopy approach undertaken for this project very interesting.
It gave the opportunity to work in different laboratories and with people with different scientific
backgrounds, in both the academic and the industrial environment. I hope that the experimental
imaging protocols developed during our work will be useful for the microscopy team of Michelin
R&D.
By way of conclusion, I also hope that this work opened up ideas for future research projects in the
field of NR, liquid phase mixing, and composite materials.

169
Résumé en francais Le latex de caoutchouc naturel (NR) extrait d'Hevea brasiliensis est connu pour être utilisé pour la
préparation d'une variété de matériaux. L'ajout de charges renforçantes est une méthode bien établie
pour augmenter les propriétés mécaniques de la matrice polymère et il est nécessaire pour obtenir
la résistance requise par la plupart des applications. Plusieurs stratégies ont été proposées pour
mélanger le caoutchouc avec des charges. Parmi les différentes méthodes, le procédé de mélange
liquide semble intéressant et il est central dans le cadre de technologie d'innovation Michelin. Dans
ce procédé, le latex NR est mélangé à une suspension aqueuse de charges renforçantes (silice (Si)/
noir de carbone (CB)) donnant lieu à un hétéro-coagulum, qui est ensuite soumis à un séchage. Si
ce processus se développe rapidement au niveau de l'ingénierie, la connaissance structurelle de
l'hétéro-coagulum le long du processus ainsi que les mécanismes de régulation de l'agrégation ne
sont encore bien connus. Dans ce but, nous avons utilisé une approche de microscopie multimodale
comprenant: la microscopie électronique à balayage à émission de champ (FESEM) (avec à la fois
l'imagerie électronique à rétrodiffusion et des électron secondaire), la microscopie à force atomique
couplée à la spectroscopie infrarouge (AFM -IR) et la microscopie à super résolution optique (d-
STROM) pour étudier la nanostructure de l'hétéro-coagulum et son évolution vers un composite
élastomère. En particulier, cette dernière technique est rarement utilisée pour l'étude des
matériaux, et représente donc une caractéristique innovante de l'étude. Pour un système
composé de latex NR et de charges CB en suspension aqueuse, nous avons démontré que
l'application d'une contrainte physique lors du mélange est un paramètre important qui permet
d'avoir un matériau homogène en structure avec le CB en contact avec les globules de NR.
Ensuite, nous avons aussi montré que l'interaction entre les globules de NR et les charges de
CB provoque une déformation des globules et conduit à un état de coalescence. Contrairement,
pour une suspension de latex NR et de charges Si, l'ajout d'ions est nécessaire pour créer une
interaction entre les globules de NR et les particules de Si. Cette interaction permet de bien
répartir la charge mais n'entraîne aucune déformation structurelle. Pour cela, l'application d'une
contrainte physique est encore nécessaire, cette fois ci, pour atteindre un état de coalescence
des globules de NR. Pour cette dispersion, nous avons aussi démontré que la présence de Si
autour de la surface des particules NR a un effet sur la disposition spatiale des protéines et des
lipides de NR dans le composite NR-Si. Nous avons mis en évidence un comportement de
clustering marqué des protéines et des lipides de NR. Pour compléter l’étude, nous avons
également étudié la distribution de charge de Si dans la matrice finale de NR. Ces particules se
trouvent répartis de manière homogène dans le composite et régulièrement disposés en
structure de type anneau-ellipse, liée à leur interaction en phase liquide avec les globules. En
conclusion, c'est la première fois que la caractérisation structurelle de ces systèmes est faite à
l'échelle nanométrique, permettant d'indiquer des paramètres importants pour la production de
matériaux composites par mélange liquide. Enfin, nous pensons que la compréhension micro /
nanoscopiques des mécanismes survenant au cours du processus de mélange des liquides pourrait
ouvrir de nouvelles voies pour l’amélioration et d'exploitation de cette technologie.

Université Paris-Saclay Espace Technologique / Immeuble Discovery Route de l’Orme aux Merisiers RD 128 / 91190 Saint-Aubin, France
Titre : Coagulation d'un latex de caoutchouc naturel - noir de carbone / silice : suivi de l'évolution
nanostructurale d'une suspension colloïdale à un composite d'élastomère
Mots clés : caoutchouc naturel, noir de carbone, silice, coagulation, mélange liquide
Résumé : Le latex de caoutchouc naturel (NR) extrait
d'Hevea brasiliensis est connu pour être utilisé pour
la préparation d'une variété de matériaux. L'ajout de
charges renforçantes est une méthode bien établie
pour augmenter les propriétés mécaniques de la
matrice polymère et il est nécessaire pour obtenir la
résistance requise par la plupart des applications.
Plusieurs stratégies ont été proposées pour mélanger
le caoutchouc avec des charges. Parmi les différentes
méthodes, le procédé de mélange liquide semble
intéressant et il est central dans le cadre de
technologie d'innovation Michelin. Dans ce procédé,
le latex NR est mélangé à une suspension aqueuse de
charges (silice / noir de carbone) donnant lieu à un
hétéro-coagulum, qui est ensuite soumis à un
séchage. Si ce processus se développe rapidement au
niveau de l'ingénierie, la connaissance structurelle de
l'hétéro-coagulum le long du processus ainsi que les
mécanismes de régulation de l'agrégation ne sont
encore bien connus. Dans ce but, nous avons utilisé
une approche de microscopie multimodale
comprenant: la microscopie électronique à
balayage à émission de champ (FESEM) (avec à la
fois l'imagerie électronique à rétrodiffusion et des
électron secondaire), la microscopie à super
résolution optique (d-STROM) et la microscopie à
force atomique couplée à la spectroscopie
infrarouge (AFM) -IR) pour étudier la nanostructure
de l'hétéro-coagulum et son évolution vers un
composite élastomère. Nous pensons que la
compréhension micro / nanoscopiques des
mécanismes survenant au cours du processus de
mélange des liquides pourrait ouvrir de nouvelles
voies pour l’amélioration et d'exploitation de cette
technologie.
Title : Natural rubber latex- carbon black/silica coagulation: following the nanostructure evolution from a
colloidal suspension to an elastomeric composite
Keywords : natural rubber, carbon black, silica, coagulation, liquid phase mixing
Abstract : Natural rubber (NR) latex extracted from
Hevea brasiliensis is known to be used for the
preparation of a variety of materials. Addition of
reinforcing fillers is a well-establish method to
increase mechanical properties of the polymer matrix
and it is necessary to achieve the required strength
for most applications. Several strategies have been
proposed to mix rubber with fillers. Among the
different methods, the liquid mixing process seems
interesting and it is central for Michelin innovation
technology. In this process, NR latex is mixed with an
aqueous suspension of fillers (silica/ carbon black)
giving rise to a hetero-coagulum, which is further
subjected to dehydration and drying. If this process
is quickly developing at engineering level, the
structural knowledge of the hetero-coagulum
along the process as well as the mechanisms
regulating aggregation is still at its infancy. To this
aim, we employed a multimodal microscopy
approach comprising: Field Emission Scanning
Electron Microscopy (FESEM) (with both
backscattering electron imaging and secondary
electron), oprical super resolution microscopy (d-
STROM) and atomic force microscopy coupled with
infrared spectroscopy (AFM-IR) to investigate on
the nanostructure of the hetero-coagulum and its
evolution towards an elastomeric composite. We
believe that understanding micro/nanoscopic
mechanisms occuring during the liquid mixing
process might open open up new ways of
imrpovent and exploitation of this technology.