CO Desorption Rate Dependence on CO Partial Pressure over Platinum Fuel Cell Catalysts
11
CO Desorption Rate Dependence on CO Partial Pressure over Platinum Fuel Cell Catalysts J. C. Davies 1 , R. M. Nielsen 1 , L. B. Thomsen 1 , I. Chorkendorff 1 *, Ł. LogadɃttir 2 , Z. Lodziana 2 , J. K. Nørskov 2 , W. X. Li 3 , B. Hammer 3 , S. R. Longwitz 4 , J. Schnadt 4 , E. K. Vestergaard 4 , R. T. Vang 4 and F. Besenbacher 4 1 Interdisciplinary Center for Catalysis (ICAT), Department of Physics, Department of Chemical Engineering, Technical University of Denmark, Building 312, DK-2800 Lyngby, Denmark 2 Center for Atomic-Scale Materials Physics (CAMP), Department of Physics, Technical University of Denmark, Building 307, DK-2800 Lyngby, Denmark 3 Interdisciplinary Nanoscience Center and Institute of Physics and Astronomy, University of Aarhus, Ny Munkegade, DK-8000 Aarhus C, Denmark 4 Center for Atomic-Scale Materials Physics (CAMP), Interdisciplinary Nanoscience Center, and Department of Physics and Astronomy, University of Aarhus, DK-8000 Aarhus C, Denmark Received October 16, 2003; accepted March 18, 2004 1 Introduction Proton Exchange Membrane Fuel Cells (PEMFC) are the most likely fuel cells to achieve commercialisation for auto- motive purposes due to their low operating temperatures and their inherent properties of being lightweight, producing high current densities and containing no corrosive materials [1]. At the anode of the fuel cell hydrogen dissociation and oxida- tion to protons occurs. This electrode is generally platinum- based due to the high current densities obtained [2, 3] and its inherent stability within fuel cell operating conditions. The protons formed then pass through a proton conducting mem- brane to the supported platinum cathode where they combine with oxygen to form water. If the hydrogen feed to the anode is to be produced at reasonable prices, inline reformation of a hydrocarbon species, e.g., methanol, is a viable option. Reforming methanol by partial oxidation or steam reforming produces a hydrogen feed which can contain approximately 1% CO, along with 25% CO 2 . It is very difficult to remove this CO entirely and as little as 20 ppm of CO is known to poison the hydrogen oxidation reaction at the anode by binding strongly to the platinum surface [4]. It has been shown that by alloying platinum with ruthenium the anode tolerance to CO can be increased [5]. Currently, there are two proposed mechanisms for this promotion: i) The bifunctional effect [6, 7]: It can be demonstrated that alloying Pt and Ru (with an optimal ratio of 50:50) – [ * ] Corresponding author, [email protected] Abstract Carbon monoxide adsorption on high area platinum fuel cell catalysts was investigated. Isotopic exchange experiments were performed to determine the exchange rate (k) of CO under different partial pressures of CO (p CO ) in argon. A lin- ear dependence of ln(k) with ln(p CO ) was observed. This pressure dependence of the rate of exchange is explained by considering a change in surface coverage of CO with differ- ent CO pressures and a subsequent reduction in the CO binding energy as demonstrated by Density Functional The- ory (DFT) calculations. High Pressure Scanning Tunneling Microscopy (HP STM) studies on the Pt(111) surface have also displayed a pressure dependency of the coverage con- sistent with this data. The relevance of these observations to the Polymer Electrolyte Membrane Fuel Cell (PEMFC) anode reaction is discussed. Keywords: Co-Tolerance, Ligand Effect, PEM Fuel Cell, Pla- tinum, Ruthenium FUEL CELLS 2004, 4, No. 4 # 2004 WILEY-VCH Verlag GmbH & Co. KGaA, Weinheim 1 ORIGINAL RESEARCH PAPER DOI: 10.1002/fuce.200400046
-
Upload
independent -
Category
Documents
-
view
3 -
download
0
Transcript of CO Desorption Rate Dependence on CO Partial Pressure over Platinum Fuel Cell Catalysts

CO Desorption Rate Dependenceon CO Partial Pressure over PlatinumFuel Cell CatalystsJ. C. Davies1, R. M. Nielsen1, L. B. Thomsen1, I. Chorkendorff1*, �. Logad�ttir2,Z. Lodziana2, J. K. Nørskov2, W. X. Li3, B. Hammer3, S. R. Longwitz4, J. Schnadt4,E. K. Vestergaard4, R. T. Vang4 and F. Besenbacher41 Interdisciplinary Center for Catalysis (ICAT), Department of Physics, Department of Chemical Engineering, Technical University
of Denmark, Building 312, DK-2800 Lyngby, Denmark2 Center for Atomic-Scale Materials Physics (CAMP), Department of Physics, Technical University of Denmark, Building 307,
DK-2800 Lyngby, Denmark3 Interdisciplinary Nanoscience Center and Institute of Physics and Astronomy, University of Aarhus, Ny Munkegade,
DK-8000 Aarhus C, Denmark4 Center for Atomic-Scale Materials Physics (CAMP), Interdisciplinary Nanoscience Center, and Department of Physics and Astronomy,
University of Aarhus, DK-8000 Aarhus C, Denmark
Received October 16, 2003; accepted March 18, 2004
1 IntroductionProton Exchange Membrane Fuel Cells (PEMFC) are the
most likely fuel cells to achieve commercialisation for auto-motive purposes due to their low operating temperatures andtheir inherent properties of being lightweight, producing highcurrent densities and containing no corrosive materials [1].At the anode of the fuel cell hydrogen dissociation and oxida-tion to protons occurs. This electrode is generally platinum-based due to the high current densities obtained [2, 3] and itsinherent stability within fuel cell operating conditions. Theprotons formed then pass through a proton conducting mem-brane to the supported platinum cathode where they combinewith oxygen to form water. If the hydrogen feed to the anodeis to be produced at reasonable prices, inline reformation of a
hydrocarbon species, e.g., methanol, is a viable option.Reforming methanol by partial oxidation or steam reformingproduces a hydrogen feed which can contain approximately1% CO, along with 25% CO2. It is very difficult to remove thisCO entirely and as little as 20 ppm of CO is known to poisonthe hydrogen oxidation reaction at the anode by bindingstrongly to the platinum surface [4]. It has been shown thatby alloying platinum with ruthenium the anode tolerance toCO can be increased [5]. Currently, there are two proposedmechanisms for this promotion:i) The bifunctional effect [6, 7]: It can be demonstrated that
alloying Pt and Ru (with an optimal ratio of 50:50)
–[*] Corresponding author, [email protected]
AbstractCarbon monoxide adsorption on high area platinum fuel cellcatalysts was investigated. Isotopic exchange experimentswere performed to determine the exchange rate (k) of COunder different partial pressures of CO (pCO) in argon. A lin-ear dependence of ln(k) with ln(pCO) was observed. Thispressure dependence of the rate of exchange is explained byconsidering a change in surface coverage of CO with differ-ent CO pressures and a subsequent reduction in the CObinding energy as demonstrated by Density Functional The-
ory (DFT) calculations. High Pressure Scanning TunnelingMicroscopy (HP STM) studies on the Pt(111) surface havealso displayed a pressure dependency of the coverage con-sistent with this data. The relevance of these observations tothe Polymer Electrolyte Membrane Fuel Cell (PEMFC)anode reaction is discussed.
Keywords: Co-Tolerance, Ligand Effect, PEM Fuel Cell, Pla-tinum, Ruthenium
FUEL CELLS 2004, 4, No. 4 � 2004 WILEY-VCH Verlag GmbH & Co. KGaA, Weinheim 1
ORIG
INAL
RESEARCH
PAPER
DOI: 10.1002/fuce.200400046

Davies et al.: CO Desorption Rate Dependence on CO Partial Pressure over Platinum Fuel Cell Catalysts
reduces the overpotential required for the oxidation ofpure CO to CO2 by water [8–12]. This reduction in over-potential is due to the more facile dissociation of wateron ruthenium. This mechanism has been further eluci-dated on model alloy systems prepared in vacuum andthen investigated electrochemically [13–15] and also the-oretically [16–18].
ii) The ligand effect [1, 19–21]: Here, alloying rutheniumwith platinum alters the chemical properties of the sur-face platinum atoms. It has been found both experimen-tally [14, 22] and theoretically [16–18, 23–26] that thePt-CO bond strength in a platinum/ruthenium alloy issignificantly reduced compared to that on pure plati-num.
In the situation where CO oxidation occurs in the presenceof hydrogen, it has been suggested that there may be a com-bined mechanism where both of the above processes are rele-vant [6, 27].
An important question in connection with the unravellingof the two possible mechanisms is whether CO from the reac-tant stream is in equilibrium with CO on the surface. If this isthe case, then the ligand effect must be a factor, a weaker CObond must lead to a lower CO coverage. This of course doesnot preclude a contribution from the bifunctional effect.
This can be expressed using the following kinetic descrip-tion of the processes occurring at a fuel cell anode:
H2 þ 2� $ 2HðadsÞ (i)
COþ � !ka ;kd COðadsÞ (ii)
H2Oþ � $ H2 OðadsÞ (iii)
H2OðadsÞ ! OHðadsÞ þHþ þ e� (iv)
OHðadsÞ þ COðadsÞ �!kr 2 � þCO2 þHþ þ e� (v)
HðadsÞ ! � þHþ þ e� (vi)
It can be seen that steps (ii) and (v) are the only two involv-ing CO. At steady state the coverage of CO will be governedby the following equation:
dhCOdt¼ ka pCOð1� hCOÞ � kd hCO � kr hCO ¼ 0
or
hCO ¼ka pCO
ka pCOþkdþkr¼ ka pCO
ka pCOþkd
� 1
1þ kr
ka pCOþkd
0B@
1CA (1)
Rearranging this equation, it can be shown that the steadystate coverage of CO on the surface can be expressed as twoterms, the first of which is the coverage determined by theCO adsorption equilibrium, whilst the second term is a cor-rection due to the effect of CO oxidation. From this secondterm it can be determined that for the rate of oxidation of CO
to play a significant role it would have to be large comparedto the combined rates of adsorption and desorption.
It is with this in mind that the equilibrium rates of desorp-tion will be determined during the course of this paper.
The adsorption of CO on platinum is a thoroughlyresearched area, but the majority of surface studies are lim-ited to the high vacuum regime. In nanoscale platinum parti-cles the (111) face is favoured at the surface, hence this systemwill be treated in detail here. Ertl et al. have studied theadsorption of CO at 170 K on Pt(111) by LEED and TPD [28].A diffuse (
p3 xp
3)R30� LEED pattern was observed foran overlayer of h � 0.33 and spectroscopic evidence fromEELS [29, 30] and RAIRS [31] experiments have shown that,at this coverage, only linear CO is present (~2110 cm–1). At acoverage of h � 0.5 this transforms into a c(4 � 2) overlayerwith both linear and bridge-bound species present in a 1:1ratio [31]. The presence of a c(4 � 2) structure below h = 0.5is explained by island formation of the adsorbed species.Further splitting of the c(4 � 2) structure is observed up to asaturation coverage of 0.67.
Recently, work has been performed by several groups inan attempt to bridge the pressure gap in this regime. Besenba-cher et al. have observed CO overlayers on Pt(111) in the highpressure regime by STM [32]. A maximum coverage of0.68 ML was again obtained leading to the conclusion thatraising the pressure was equivalent to lowering the tempera-ture, as long as the thermodynamic equilibrium structureremains kinetically accessible. Sum Frequency Generationstudies by Rupprechter et al. observed a 40% increase in theintensity of the linear bound CO from the c(4 � 2) structure tothe saturation coverage. The coverage dependence on thebinding energy of the CO on Pt(111) is well known underthese pressure regimes. Ertl et al. observed an initial adsorp-tion energy of 138 kJ mol–1 at room temperature, reducing to62 kJ mol–1 at the saturation coverage of 0.67 [28]. Microca-lorimetry experiments by Yeo et al. have also demonstrated ashift in the heat of adsorption from a value of 183 kJ mol–1 ata coverage of 0.05 ML down to a value of 75 kJ mol–1 at a cov-erage of 0.75 ML [33].
In previous studies, which were concerned with investi-gating the replacement of C13O preadsorbed by gaseous C12Oon polycrystalline platinum [34] no effect of changing pres-sure was observed, but these experiments were performed ina low pressure regime (1.5–4.6 � 10–7 mbar). However, adependence on temperature was observed. A value of90 kJ mol–1 for the activation energy was obtained leading toa rate of desorption of 3.50 � 10–9 mol m–2 s–1.
An isothermal kinetic study of hydrogen induced CO dis-placement has previously been performed by Parker et al. [35].They observed that chemisorbed CO could be completelyremoved from the Pt(111) surface at temperatures from 318–348 K and hydrogen pressures above 2.6 � 10–2 mbar. In thistemperature range only a fraction of the CO is removed by ther-mal desorption. They proposed that repulsive interactionsbetween the CO and atomic hydrogen lead to lower values ofthe desorption activation energy.
ORIG
INAL
RESEARCH
PAPER
2 � 2004 WILEY-VCH Verlag GmbH & Co. KGaA, Weinheim FUEL CELLS 2004, 4, No. 4
Davies et al.: CO Desorption Rate Dependence on CO Partial Pressure over Platinum Fuel Cell Catalysts
It will be demonstrated, by isotopic exchange experimentsand DFT calculations, that there is a significant relationshipbetween the pressure of CO above a platinum catalyst surfaceand the subsequent desorption rate, binding energy and cov-erage of the CO. These observations will be used to elucidatethe mechanism for fuel cell anode catalysis.
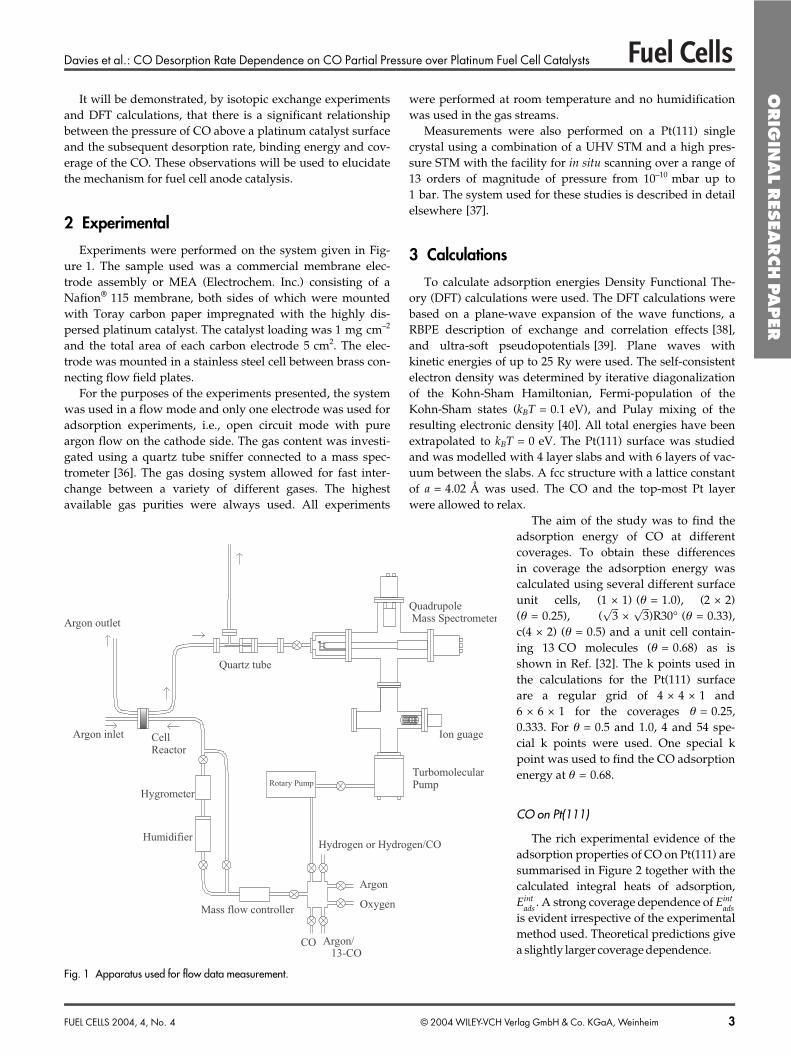
2 ExperimentalExperiments were performed on the system given in Fig-
ure 1. The sample used was a commercial membrane elec-trode assembly or MEA (Electrochem. Inc.) consisting of aNafion� 115 membrane, both sides of which were mountedwith Toray carbon paper impregnated with the highly dis-persed platinum catalyst. The catalyst loading was 1 mg cm–2
and the total area of each carbon electrode 5 cm2. The elec-trode was mounted in a stainless steel cell between brass con-necting flow field plates.
For the purposes of the experiments presented, the systemwas used in a flow mode and only one electrode was used foradsorption experiments, i.e., open circuit mode with pureargon flow on the cathode side. The gas content was investi-gated using a quartz tube sniffer connected to a mass spec-trometer [36]. The gas dosing system allowed for fast inter-change between a variety of different gases. The highestavailable gas purities were always used. All experiments
were performed at room temperature and no humidificationwas used in the gas streams.
Measurements were also performed on a Pt(111) singlecrystal using a combination of a UHV STM and a high pres-sure STM with the facility for in situ scanning over a range of13 orders of magnitude of pressure from 10–10 mbar up to1 bar. The system used for these studies is described in detailelsewhere [37].
3 CalculationsTo calculate adsorption energies Density Functional The-
ory (DFT) calculations were used. The DFT calculations werebased on a plane-wave expansion of the wave functions, aRBPE description of exchange and correlation effects [38],and ultra-soft pseudopotentials [39]. Plane waves withkinetic energies of up to 25 Ry were used. The self-consistentelectron density was determined by iterative diagonalizationof the Kohn-Sham Hamiltonian, Fermi-population of theKohn-Sham states (kBT = 0.1 eV), and Pulay mixing of theresulting electronic density [40]. All total energies have beenextrapolated to kBT = 0 eV. The Pt(111) surface was studiedand was modelled with 4 layer slabs and with 6 layers of vac-uum between the slabs. A fcc structure with a lattice constantof a = 4.02 � was used. The CO and the top-most Pt layerwere allowed to relax.
The aim of the study was to find theadsorption energy of CO at differentcoverages. To obtain these differencesin coverage the adsorption energy wascalculated using several different surfaceunit cells, (1 � 1) (h = 1.0), (2 � 2)(h = 0.25), (
ffiffiffi3p
�ffiffiffi3p
)R30� (h = 0.33),c(4 � 2) (h = 0.5) and a unit cell contain-ing 13 CO molecules (h = 0.68) as isshown in Ref. [32]. The k points used inthe calculations for the Pt(111) surfaceare a regular grid of 4 � 4 � 1 and6 � 6 � 1 for the coverages h = 0.25,0.333. For h = 0.5 and 1.0, 4 and 54 spe-cial k points were used. One special kpoint was used to find the CO adsorptionenergy at h = 0.68.
CO on Pt(111)
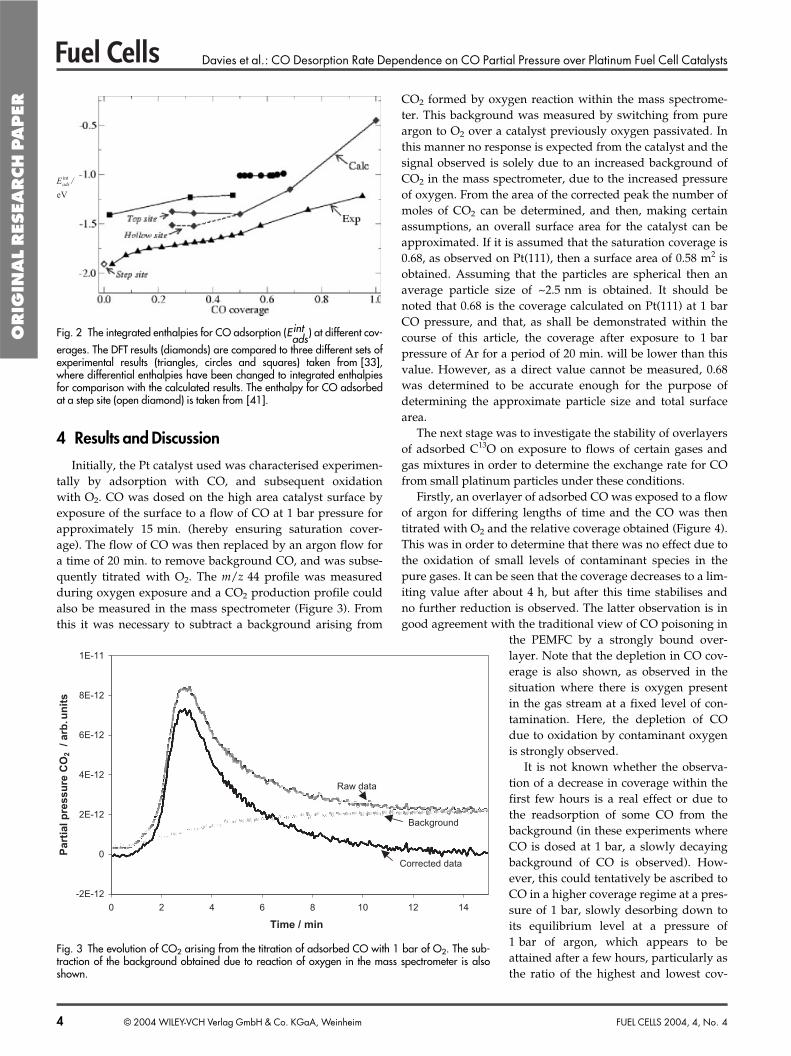
The rich experimental evidence of theadsorption properties of CO on Pt(111) aresummarised in Figure 2 together with thecalculated integral heats of adsorption,Eint
ads. A strong coverage dependence of Eint
adsis evident irrespective of the experimentalmethod used. Theoretical predictions givea slightly larger coverage dependence.
Quadrupole Mass Spectrometer
Ion guage
Turbomolecular PumpRotary Pump
Humidifier
CellReactor
Quartz tube
Argon inlet
Argon outlet
Hygrometer
Mass flow controller
Hydrogen or Hydrogen/CO
Argon
Oxygen
Argon/ 13-CO
CO
Fig. 1 Apparatus used for flow data measurement.
ORIG
INAL
RESEARCH
PAPER
FUEL CELLS 2004, 4, No. 4 � 2004 WILEY-VCH Verlag GmbH & Co. KGaA, Weinheim 3
Davies et al.: CO Desorption Rate Dependence on CO Partial Pressure over Platinum Fuel Cell Catalysts
4 Results and DiscussionInitially, the Pt catalyst used was characterised experimen-
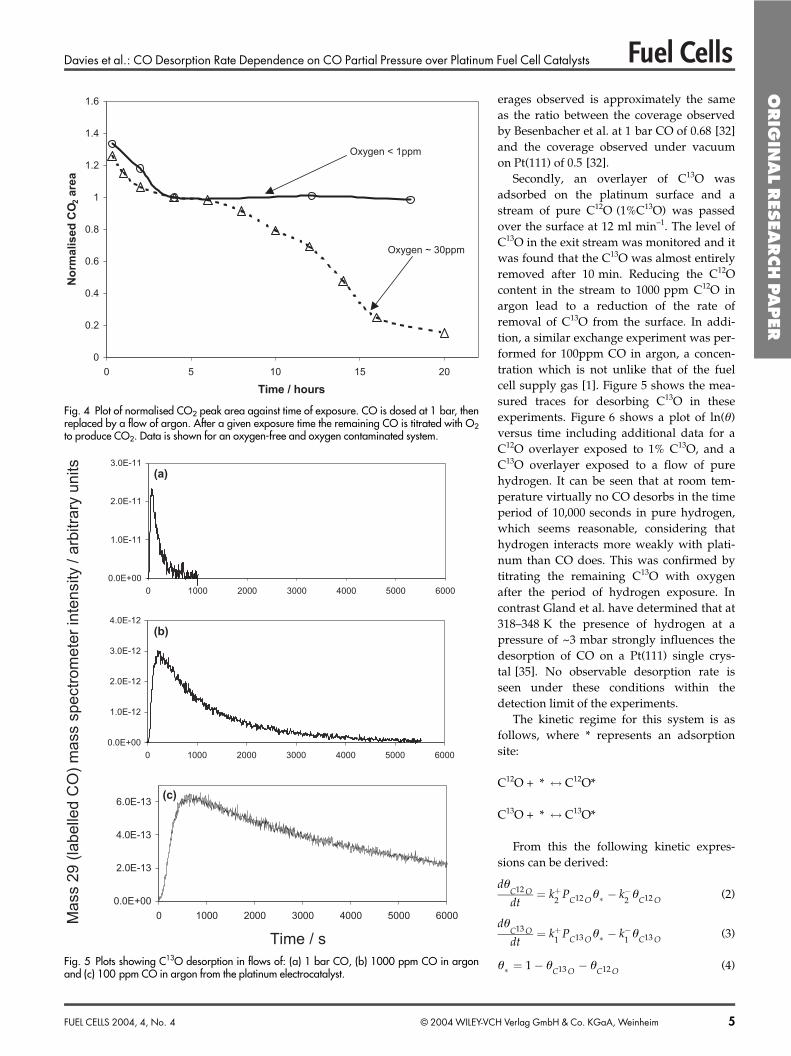
tally by adsorption with CO, and subsequent oxidationwith O2. CO was dosed on the high area catalyst surface byexposure of the surface to a flow of CO at 1 bar pressure forapproximately 15 min. (hereby ensuring saturation cover-age). The flow of CO was then replaced by an argon flow fora time of 20 min. to remove background CO, and was subse-quently titrated with O2. The m/z 44 profile was measuredduring oxygen exposure and a CO2 production profile couldalso be measured in the mass spectrometer (Figure 3). Fromthis it was necessary to subtract a background arising from
CO2 formed by oxygen reaction within the mass spectrome-ter. This background was measured by switching from pureargon to O2 over a catalyst previously oxygen passivated. Inthis manner no response is expected from the catalyst and thesignal observed is solely due to an increased background ofCO2 in the mass spectrometer, due to the increased pressureof oxygen. From the area of the corrected peak the number ofmoles of CO2 can be determined, and then, making certainassumptions, an overall surface area for the catalyst can beapproximated. If it is assumed that the saturation coverage is0.68, as observed on Pt(111), then a surface area of 0.58 m2 isobtained. Assuming that the particles are spherical then anaverage particle size of ~2.5 nm is obtained. It should benoted that 0.68 is the coverage calculated on Pt(111) at 1 barCO pressure, and that, as shall be demonstrated within thecourse of this article, the coverage after exposure to 1 barpressure of Ar for a period of 20 min. will be lower than thisvalue. However, as a direct value cannot be measured, 0.68was determined to be accurate enough for the purpose ofdetermining the approximate particle size and total surfacearea.
The next stage was to investigate the stability of overlayersof adsorbed C13O on exposure to flows of certain gases andgas mixtures in order to determine the exchange rate for COfrom small platinum particles under these conditions.
Firstly, an overlayer of adsorbed CO was exposed to a flowof argon for differing lengths of time and the CO was thentitrated with O2 and the relative coverage obtained (Figure 4).This was in order to determine that there was no effect due tothe oxidation of small levels of contaminant species in thepure gases. It can be seen that the coverage decreases to a lim-iting value after about 4 h, but after this time stabilises andno further reduction is observed. The latter observation is ingood agreement with the traditional view of CO poisoning in
the PEMFC by a strongly bound over-layer. Note that the depletion in CO cov-erage is also shown, as observed in thesituation where there is oxygen presentin the gas stream at a fixed level of con-tamination. Here, the depletion of COdue to oxidation by contaminant oxygenis strongly observed.
It is not known whether the observa-tion of a decrease in coverage within thefirst few hours is a real effect or due tothe readsorption of some CO from thebackground (in these experiments whereCO is dosed at 1 bar, a slowly decayingbackground of CO is observed). How-ever, this could tentatively be ascribed toCO in a higher coverage regime at a pres-sure of 1 bar, slowly desorbing down toits equilibrium level at a pressure of1 bar of argon, which appears to beattained after a few hours, particularly asthe ratio of the highest and lowest cov-
eV
int
adsE /
Fig. 2 The integrated enthalpies for CO adsorption (Eintads) at different cov-
erages. The DFT results (diamonds) are compared to three different sets ofexperimental results (triangles, circles and squares) taken from [33],where differential enthalpies have been changed to integrated enthalpiesfor comparison with the calculated results. The enthalpy for CO adsorbedat a step site (open diamond) is taken from [41].
-2E-12
0
2E-12
4E-12
6E-12
8E-12
1E-11
0 2 4 6 8 10 12 14
Time / min
Part
ial
pre
ssu
re C
O2
/ arb
. un
its
Raw data
Background
Corrected data
Fig. 3 The evolution of CO2 arising from the titration of adsorbed CO with 1 bar of O2. The sub-traction of the background obtained due to reaction of oxygen in the mass spectrometer is alsoshown.
ORIG
INAL
RESEARCH
PAPER
4 � 2004 WILEY-VCH Verlag GmbH & Co. KGaA, Weinheim FUEL CELLS 2004, 4, No. 4
Davies et al.: CO Desorption Rate Dependence on CO Partial Pressure over Platinum Fuel Cell Catalysts
erages observed is approximately the sameas the ratio between the coverage observedby Besenbacher et al. at 1 bar CO of 0.68 [32]and the coverage observed under vacuumon Pt(111) of 0.5 [32].
Secondly, an overlayer of C13O wasadsorbed on the platinum surface and astream of pure C12O (1%C13O) was passedover the surface at 12 ml min–1. The level ofC13O in the exit stream was monitored and itwas found that the C13O was almost entirelyremoved after 10 min. Reducing the C12Ocontent in the stream to 1000 ppm C12O inargon lead to a reduction of the rate ofremoval of C13O from the surface. In addi-tion, a similar exchange experiment was per-formed for 100ppm CO in argon, a concen-tration which is not unlike that of the fuelcell supply gas [1]. Figure 5 shows the mea-sured traces for desorbing C13O in theseexperiments. Figure 6 shows a plot of ln(h)versus time including additional data for aC12O overlayer exposed to 1% C13O, and aC13O overlayer exposed to a flow of purehydrogen. It can be seen that at room tem-perature virtually no CO desorbs in the timeperiod of 10,000 seconds in pure hydrogen,which seems reasonable, considering thathydrogen interacts more weakly with plati-num than CO does. This was confirmed bytitrating the remaining C13O with oxygenafter the period of hydrogen exposure. Incontrast Gland et al. have determined that at318–348 K the presence of hydrogen at apressure of ~3 mbar strongly influences thedesorption of CO on a Pt(111) single crys-tal [35]. No observable desorption rate isseen under these conditions within thedetection limit of the experiments.
The kinetic regime for this system is asfollows, where * represents an adsorptionsite:
C12O + * $ C12O*
C13O + * $ C13O*
From this the following kinetic expres-sions can be derived:
dhC12 Odt
¼ kþ2
PC12 O h� � k�2
hC12 O (2)
dhC13 Odt
¼ kþ1
PC13 O h� � k�1
hC13 O (3)
h� ¼ 1� hC13 O � hC12 O (4)
0
0.2
0.4
0.6
0.8
1
1.2
1.4
1.6
0 5 10 15 20
Time / hours
No
rma
lis
ed
CO
2 a
rea
Oxygen < 1ppm
Oxygen ~ 30ppm
Fig. 4 Plot of normalised CO2 peak area against time of exposure. CO is dosed at 1 bar, thenreplaced by a flow of argon. After a given exposure time the remaining CO is titrated with O2to produce CO2. Data is shown for an oxygen-free and oxygen contaminated system.
0.0E+00
2.0E-13
4.0E-13
6.0E-13
0 1000 2000 3000 4000 5000 6000
0.0E+00
1.0E-11
2.0E-11
3.0E-11
0 1000 2000 3000 4000 5000 6000
0.0E+00
1.0E-12
2.0E-12
3.0E-12
4.0E-12
0 1000 2000 3000 4000 5000 6000
Mass 2
9 (
labelle
d C
O)
mass s
pectr
om
ete
r in
tensity / a
rbitra
ry u
nits
Time / s
(a)
(b)
(c)
Fig. 5 Plots showing C13O desorption in flows of: (a) 1 bar CO, (b) 1000 ppm CO in argonand (c) 100 ppm CO in argon from the platinum electrocatalyst.
ORIG
INAL
RESEARCH
PAPER
FUEL CELLS 2004, 4, No. 4 � 2004 WILEY-VCH Verlag GmbH & Co. KGaA, Weinheim 5
Davies et al.: CO Desorption Rate Dependence on CO Partial Pressure over Platinum Fuel Cell Catalysts
For a simple model it is necessary to assume that the pres-sure of C13O above the surface is zero, although 1% of the gasadsorbing will in fact be C13O from the natural abundance ofC13. It is also assumed that, over the flow rate range used forthese experiments (12–15 ml min), there is no readsorption ofdesorbed C13O.
Hence Eq. (3) reduces to:
dhC13 Odt
¼ �k�1
hC13 O (5)
resulting in:
hC13 O ¼ hoC13 O
e�k�1 :t
(6)
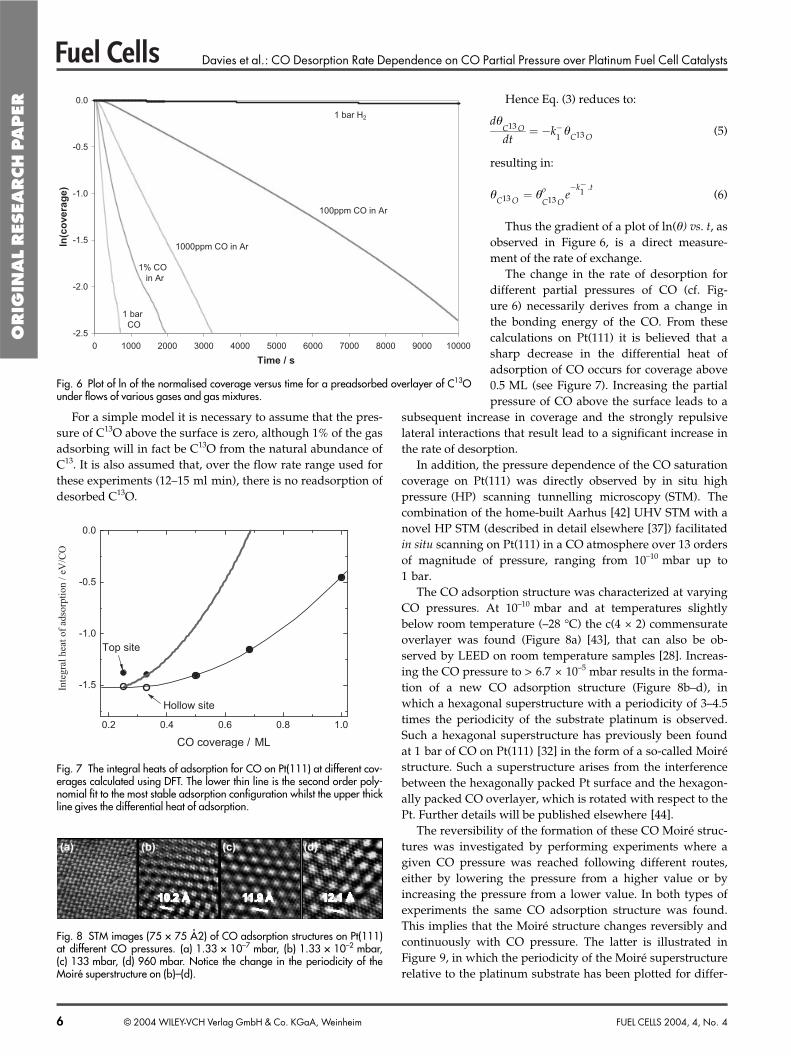
Thus the gradient of a plot of ln(h) vs. t, asobserved in Figure 6, is a direct measure-ment of the rate of exchange.
The change in the rate of desorption fordifferent partial pressures of CO (cf. Fig-ure 6) necessarily derives from a change inthe bonding energy of the CO. From thesecalculations on Pt(111) it is believed that asharp decrease in the differential heat ofadsorption of CO occurs for coverage above0.5 ML (see Figure 7). Increasing the partialpressure of CO above the surface leads to a
subsequent increase in coverage and the strongly repulsivelateral interactions that result lead to a significant increase inthe rate of desorption.
In addition, the pressure dependence of the CO saturationcoverage on Pt(111) was directly observed by in situ highpressure (HP) scanning tunnelling microscopy (STM). Thecombination of the home-built Aarhus [42] UHV STM with anovel HP STM (described in detail elsewhere [37]) facilitatedin situ scanning on Pt(111) in a CO atmosphere over 13 ordersof magnitude of pressure, ranging from 10–10 mbar up to1 bar.
The CO adsorption structure was characterized at varyingCO pressures. At 10–10 mbar and at temperatures slightlybelow room temperature (–28 �C) the c(4 � 2) commensurateoverlayer was found (Figure 8a) [43], that can also be ob-served by LEED on room temperature samples [28]. Increas-ing the CO pressure to > 6.7 � 10–5 mbar results in the forma-tion of a new CO adsorption structure (Figure 8b–d), inwhich a hexagonal superstructure with a periodicity of 3–4.5times the periodicity of the substrate platinum is observed.Such a hexagonal superstructure has previously been foundat 1 bar of CO on Pt(111) [32] in the form of a so-called Moir�structure. Such a superstructure arises from the interferencebetween the hexagonally packed Pt surface and the hexagon-ally packed CO overlayer, which is rotated with respect to thePt. Further details will be published elsewhere [44].
The reversibility of the formation of these CO Moir� struc-tures was investigated by performing experiments where agiven CO pressure was reached following different routes,either by lowering the pressure from a higher value or byincreasing the pressure from a lower value. In both types ofexperiments the same CO adsorption structure was found.This implies that the Moir� structure changes reversibly andcontinuously with CO pressure. The latter is illustrated inFigure 9, in which the periodicity of the Moir� superstructurerelative to the platinum substrate has been plotted for differ-
-2.5
-2.0
-1.5
-1.0
-0.5
0.0
0 1000 2000 3000 4000 5000 6000 7000 8000 9000 10000
Time / s
ln(c
ove
rag
e)
1 bar H2
100ppm CO in Ar
1000ppm CO in Ar
1% CO
in Ar
1 bar
CO
Fig. 6 Plot of ln of the normalised coverage versus time for a preadsorbed overlayer of C13Ounder flows of various gases and gas mixtures.
0.2 0.4 0.6 0.8 1.0
-1.5
-1.0
-0.5
0.0
CO coverage / ML
Top site
Hollow site
Inte
gra
l hea
t of
adso
rpti
on /
eV
/CO
Fig. 7 The integral heats of adsorption for CO on Pt(111) at different cov-erages calculated using DFT. The lower thin line is the second order poly-nomial fit to the most stable adsorption configuration whilst the upper thickline gives the differential heat of adsorption.
Fig. 8 STM images (75 � 75 �2) of CO adsorption structures on Pt(111)at different CO pressures. (a) 1.33 � 10–7 mbar, (b) 1.33 � 10–2 mbar,(c) 133 mbar, (d) 960 mbar. Notice the change in the periodicity of theMoir� superstructure on (b)–(d).
ORIG
INAL
RESEARCH
PAPER
6 � 2004 WILEY-VCH Verlag GmbH & Co. KGaA, Weinheim FUEL CELLS 2004, 4, No. 4

Davies et al.: CO Desorption Rate Dependence on CO Partial Pressure over Platinum Fuel Cell Catalysts
ent CO pressures. From high resolution STM images, such asthose in Figure 8, the CO distance can be directly extractedby counting the individual CO molecules, and in this way theCO coverage can be determined as a function of the CO pres-sure. This has been plotted in Figure 10, where a clear pres-sure dependence of the CO coverage is observed.
5 Model of AdsorptionCalculated adsorption properties of CO provide a good
starting point for the construction of a simple model ofadsorption kinetics, which will be further used to comparewith the experimental data presented above.
The equilibrium chemical potential of CO in the gas phasemust be equal to that of the adsorbed state (lgas = lads). Frommicroscopic theory the chemical potential of an ideal gas
lgas¼ �kB T
@ lnðQgÞ@Ng
is given by:
lgas ¼ �kB T lnð2pMkB TÞ
3=2
h3
kB Tp0
!þ lvib�rot þ kB T ln
pp0
!
¼ �TS0 þ kB T lnpp0
!(7)
where Qg is the partition function for the ideal CO gas andM = (mO + mC) is the mass of the gas molecule, h is Planck’sconstant, l
vib�rotare the contribution from the vibrational and
rotational degrees of freedom, and p and p0 are the actual andstandard pressures, respectively. The entropic term can becalculated from the microscopic model. The lengthy formulasfor rotational and vibrational modes can be found in goodtextbooks [45]. Also, S0 can be found in standard thermody-namic tables [46] and for CO S0 = 197 J kmol–1 at standardthermodynamic conditions.
The chemical potential of adsorbed CO depends on thespecific model used to describe adsorption. Two extremecases are usually considered: localized adsorption, whereadsorbed molecules are fixed at the adsorption sites (thus donot move on the surface) and mobile adsorption, where theadsorbent is free to move on the surface. It is safe to assumethat the properties of CO are somewhere between theseextremes. The chemical potential of adsorbed CO consists ofcontributions from the particular lattice statistics (lstat), vibra-tional properties (lfrus-vib) and both surface and mutual COinteraction (lint).
lads¼ l
intþ l
statþ l
frus�vib(8)
To determine the chemical potential of adsorbed CO the
coverage h ¼ NM¼ Na
Ais introduced where N molecules are
adsorbed on M available sites, or they cover an area Na of thetotal surface area available, A. The interaction part of the freeenergy can be determined directly from the DFT calculations,as the coverage dependence of Eads(h) is known (see Figure 7).Hence:
lint ¼ �kB T@ lnð qads
� �N Þ@N
¼ �kB T@ ln expð�NEint
adsðhÞ=kB TÞ
@N
¼ kB T@NEint
adsðhÞ=kB T
@N¼ Eint
adsðhÞ þ h
@EintadsðhÞ
@h
!¼ Ediff
ads
(9)
which is simply the differential heat of adsorption. This treat-ment of the interaction is purely phenomenological, as thedetails of the interaction energy are not considered, which isan obvious limitation, but there is a great advantage to thisapproach, which is that the model can be solved analytically.
In the case of localised adsorption, all gas translational androtational degrees of freedom are lost in favour of frustratedvibrational modes of the adsorbed CO molecule. This part ofthe chemical potential can be written as:
3.2
3.6
4
4.4
1.0E-08 1.0E-06 1.0E-04 1.0E-02 1.0E+00 1.0E+02
pCO / bar
dM
oir
e/d
Pt
Fig. 9 The periodicity of the Moir� superstructure as a function of the COpressure. dMoir� is the distance between adjacent Moir� patterns and dPt isthe nearest-neighbour distance of the atoms on the Pt(111) surface.
-12 -10 -8 -6 -4 -2 0
0.4
0.5
0.6
0.7
Co
ve
rag
e θ
/ M
L
log10
(p/p0)
pure adsorption
localised adsorption
gas-like adsorption
Fig. 10 The experimental data shows the CO coverage versus the COpressure as measured with the HP STM. Also shown is the calculated equi-librium coverage of CO on the Pt(111) surface at room temperature (seetext). The solid line represents the adsorption model not including anyeffects related to the statistics of CO adsorption on the surface. The dottedline is for the lattice gas model, and the dashed line represents a model ofthe mobile CO at the surface.
ORIG
INAL
RESEARCH
PAPER
FUEL CELLS 2004, 4, No. 4 � 2004 WILEY-VCH Verlag GmbH & Co. KGaA, Weinheim 7

Davies et al.: CO Desorption Rate Dependence on CO Partial Pressure over Platinum Fuel Cell Catalysts
lfrus�vib
¼ �kB T lnðqfrus�vibÞ, where the vibrational partitionfunction runs over all modes:qfrus�vib ¼
Pi
expð�ei=2kB TÞ=½1� expðhxi=kB T�.
Finally the statistics of the adsorbed phase give the config-urational entropy for the localised adsorption:
lstat¼ �kB T@ ln
MðM�NÞN
� �=@N ¼ �kB T ln
h1�h
� �.
Notice that this is a standard expression for lattice models,but it is also valid for mobile adsorption, as long as the finitesize of CO is taken into account. In the limit of point mole-cules the formula reduces to that of a 2-dimensional ideal gas.If CO is mobile at the surface, a very reasonable assumptionas there is only a very small difference between the COadsorption energies at different surface sites, then this has tobe taken into account, and an additional term enters the freeenergy, equivalent to the pressure in a 3-dimensional gas and
equal to kB T h1�h
.
The chemical potential of adsorbed CO equals:
lads¼ Eint
adsðhÞ þ h
@EintadsðhÞ
@hþ l
statþ l
frus�vib(10)
and the last term varies with the adsorbent properties.
lstat¼ kB T ln
hð1�hÞ
� �for localised adsorption and
lstat¼ kB T ln
hð1�hÞ
� �þ kB T h
ð1�hÞ
� �for mobile adsorption.
In the latter case lfrus�vib
will be the normal lvib�rot
.To find the equilibrium CO coverage the differential heat
of adsorption needs to be calculated, which can be doneeasily by approximating discrete points from DFT by a simplecontinuous function. The approximation by the second orderpolynomial is shown on Figure 7, and it is used in furtherconsiderations. The equilibrium temperature of the diluentgas (argon) and the surface ensures that effects related todirect energy transfer between impinging molecules andadsorbed CO is of minor importance.
The calculated equilibrium CO coverage on the Pt(111)surface at various pressures is shown with the experimentaldata in Figure 10. The three lines represent three differentmodels for the adsorbent. Note that there is a very small dif-ference between the two extreme adsorption statistics, and analmost linear regime in all interesting pressure ranges. Theprecise determination of CO coverage is beyond the scope ofthe present paper, but comparing to existing literature fairlygood agreement is found. From the STM data presented inthis paper and in Ref. [32] a room temperature coverage of0.68 ML at ambient pressure, and around 0.5 ML in UHV, areobserved. A simplistic mean field model as presented aboveis not able to predict the formation of superstructures, such asthe c(4 � 2) structure observed for CO on Pt(111). This is oneof the reasons why the calculated equilibrium CO coverage islower than the experimental.
Determination of the desorption rate, k, is now very sim-ple, as the desorption mechanism is governed simply byEq. (6). The standard desorption rate at equilibrium is given
by: k�1¼ mðhÞ exp �EactðhÞ
kB T
!, where m(h) is the prefactor, and
EactðhÞis the activation energy.
If CO adsorption is not activated then Eact ¼ Ediffads
.For CO on Pt(111), however, Steckel et al. [47] have shown
that at a coverage above 0.6 ML a barrier for desorptionappears. While it is very small, 0.1 eV for 0.6 ML, the magni-tude of this barrier grows to 0.5 eV at 1 ML. One might argue,that such a high coverage is not possible for such a system asCO on Pt(111), but the existence of a barrier, however small,at a coverage around 0.6 ML influences the desorption pro-cess. The activation barrier is given by Eact ¼ �Ediff
adsþ nEdiff
ads,
and 0 < n < 1 is a continuous function of the coverage.By assuming that there is a chemical equilibrium between
the adsorbed CO and the CO in the gas phase Eq. (7) and (10)can be equated, i.e.:
lg ¼ lads
) lnpp0
!� S0
kB¼
EintadsðhÞ
kB Tþ h
kB T@Eint
adsðhÞ
@hþ
lstat
kB Tþ
lfrus�vib
kB T
)Ediff
adsðhÞ
kB T¼ ln
pp0
!þ
lrest
kB T
where all the terms with small coverage dependence havebeen collected in the term lrest . Now, utilising the fact that theactivation energy can be expressed in terms of the adsorption
energy and that lnðk�1Þ ¼ ln mðhÞð Þ � EactðhÞ
kB Tthen:
lnðk�1Þ ¼ ln mðhÞð Þ � EactðhÞ
kB T
¼ ln mðhÞð Þ þ ð1� nÞ ln pp0
� �þ ð1� nÞ
lrest
kB T
¼ ð1� nÞ ln pp0
� �þ a
A relationship between the pressure and the rate constantis arrived at, where coefficients (1-n) and a come from Fig-ure 10. The slope of the linear relation depends on the cover-age dependence of the activation energy, which is usuallytaken as minus the adsorption energy.
This means that the coverage dependence of the activationenergy is weaker than the adsorption energy. The relationbetween p and k is presented in Figure 11. The absolute loca-tion along the k axis is determined by the prefactor, m, and avalue of m = 1017 gives good agreement with the experimentaldata.
It is then possible to convert the rates observed for CO de-sorption to equivalent current densities that would berequired to oxidise the same amount of CO. The case at 1 barof CO was considered where an average desorption rate of6.52 � 10–3 s–1 was obtained.
ORIG
INAL
RESEARCH
PAPER
8 � 2004 WILEY-VCH Verlag GmbH & Co. KGaA, Weinheim FUEL CELLS 2004, 4, No. 4

Davies et al.: CO Desorption Rate Dependence on CO Partial Pressure over Platinum Fuel Cell Catalysts
If a prefactor of 1017 is assumed, an activation energy canbe found from the expression:
kdes ¼ ve
�Edes ðhÞkb T
(10)
A value of 1.13 eV is obtained.By substituting back into Eq. 10, extrapolated values for
the rate of desorption of CO at 62 �C and 80 �C can beobtained. As the number of sites per square centimetre is1.50 � 1015 for close-packed Pt(111) and the number of elec-trons per oxidised CO molecule is 2, then these rates can beconverted to equivalent oxidation currents:
At 25 �C k = 6.5 � 10–3 s–1; j = 3.1 � 10–3 mA cm–2
At 62 �C k = 0.85 s–1; j = 0.41mA cm–2
At 80 �C k = 6.3 s–1; j = 3.0mA cm–2
Using a value for the prefactor of1013 s–1 the value of the desorptionenergy reduces to 0.90 eV and the follow-ing values for k and j are obtained:
At 25 �C k = 6.5 � 10–3 s–1;j = 3.1 � 10–3 mA cm–2
At 62 �C k = 0.31 s–1;j = 0.14 mA cm–2
At 80 �C k = 1.5 s–1;j = 0.73 mA cm–2
To determine the effect this would haveon the fuel cell anode mechanism, it isnecessary to compare these rates with val-ues directly measured for the CO oxidation
rates at the given temperatures as governed by the relationshipshown earlier in Eq. (1). Figure 12 shows the potential requiredto provide a current density, j, for the oxidation of pure CO at25 �C calculated from experimental data [12]. If it can be shownthat the equivalent current densities calculated above wouldrequire significant overpotentials, which are not observed aspotential losses for the fuel cells operating at these tempera-tures then the desorption rate must be significant comparedto the oxidation rate under the operating conditions of thefuel cell.
-10 -8 -6 -4 -2 0
-8
-7
-6
-5
ln(k
)
ln(p/p0)
Experiment Model
Fig. 11 Plot of the rate of C13O desorption versus the pressure of C12Oabove the surface. Squares represent experimental data whilst the solidline is from the simple model described in the text.
0
0.2
0.4
0.6
0.8
0 10 20 30 40 50 60 70
Current density j / µA cm–2
Po
ten
tial
vs.
RH
E /
V
Pt
PtRu
Fig. 12 Experimentally observed polarisation curve for CO (100%) oxida-tion at 62 �C on a platinum/ruthenium surface alloy electrode with the rel-ative surface ratio of 50:50, reproduced from Ref. [12]. The shadedregion shows the calculated range of equivalent current densities obtainedfrom the experimental CO desorption rate for 100% CO, on varying theprefactor from 1013 to 1017, and extrapolated to 62 �C.
0
0.2
0.4
0.6
0.8
0 0.2 0.4 0.6 0.8 1 1.2 1.4 1.6 1.8 2 2.2
Current density j / mA cm–2
Po
ten
tia
l / V
Fig. 13 Experimentally observed polarisation curve for CO (2% in argon) oxidation at 62 �C on aplatinum/ruthenium surface alloy electrode with the relative surface ratio of 50:50 (reproducedfrom Ref. [12]). The shaded region shows the calculated range of equivalent current densitiesobtained from the experimental CO desorption rate for 1% CO in argon, on varying the prefactorfrom 1013–1017, and extrapolated to 62 �C. The upper limit is 150 lA cm–2 and is not shown onthis plot.
ORIG
INAL
RESEARCH
PAPER
FUEL CELLS 2004, 4, No. 4 � 2004 WILEY-VCH Verlag GmbH & Co. KGaA, Weinheim 9

Davies et al.: CO Desorption Rate Dependence on CO Partial Pressure over Platinum Fuel Cell Catalysts
If the data for the rate of CO desorption on pure Pt, andthe rate of oxidation of pure CO on a platinum/ruthenium50:50 surface alloy are compared, then it can be seen that, forthe oxidation rate to match the desorption rate(j = 0.12 mA cm–2) then an overpotential of ~0.6 V would berequired. On pure platinum this value would be even higher.
If a similar treatment for the data at 1% CO in Ar is con-ducted for a prefactor of 1017 and at a temperature of 62 �C, acurrent density of j = 0.15 mA cm–2 is observed whereas for aprefactor of 1013, j = 0.053 mA cm–2. This gives a possiblerange for the current density obtained.
Again comparing to the data of Gasteiger et al. [12] in Fig-ure 13, obtained for the pure oxidation of 2% CO in argon at62 �C and comparing directly to our figure of between 53–150 lA cm–2 it can be seen that an overpotential of at least0.7 V would be required on pure platinum and an overpoten-tial of 0.45 V required on PtRu to provide the same rate ofremoval of CO by oxidation.
Therefore this would suggest that the rate of desorption isindeed significant in comparison to the rate of oxidation ob-served in the fuel cell gas stream. That is to say, that at over-potentials below those designated by the grey areas in Fig-ures 12 and 13, the rate of desorption of CO will exceed therate of electrochemical oxidation and the surface coveragewould be determined by the thermal equilibrium coverage.The only reservation can be, whether the presence of water inthe gas stream significantly reduces the CO desorption rate,and this is the subject of an ongoing study. It seems likely,however, that the dry gas phase behaviour will be a closermodel to the behaviour in the humidified fuel cell set-up thanthat observed in solution where some limitation on theexchange rate is likely.
6 ConclusionsIt has been shown from CO isotope exchange experiments
that there is a significant CO exchange rate on platinum fuelcell catalysts at room temperature. Moreover, this rate of de-sorption is strongly dependent on the pressure of CO in thefeed gas to the fuel cell.
DFT calculations have demonstrated that increasing thepressure of CO above the platinum surface leads to anincrease in the coverage of CO on the surface and a concomi-tant drop in the binding energy for CO. The coverage depen-dency on pressure has been demonstrated using a high pres-sure STM from the range of ultra-high vacuum up to 1 bar.
Furthermore, it has been demonstrated that adsorbed COis not caused to desorb by a stream of hydrogen at room tem-perature.
It is believed that in a fuel cell running under normal con-ditions at 80 �C the partial pressure of CO in the feed gas willstrongly affect the CO coverage, binding energy and subse-quent desorption rate, and that these factors are all intricatelylinked in the mechanism leading to the improved tolerance ofthe fuel cell.
Furthermore, it has been demonstrated that the rate of de-sorption is indeed significant compared to the rate of oxida-tion observed in a fuel cell.
AcknowledgementsThe Centre for Atomic-scale Materials Physics (CAMP) is
sponsored by the Danish National Research Foundation. Thepresent project was in part funded by the Danish ResearchCouncils. Computational resources were provided by DanskCenter for Supercomputing.
References[1] G. Hoogers, D. Thompsett, CATTECH 1999, 3, 106.[2] R. A. Lemons, J. Power Sources 1990, 29, 251.[3] W. Vogel, J. Lundquist, P. Ross, P. Stonehart, Electro-
chim. Acta 1975, 20, 79.[4] H. Igarashi, T. Fujino, M. Watanabe, J. Electroanal. Chem.
1995, 391, 119.[5] H. F. Oetjen, V. M. Schmidt, U. Stimming, F. Trila,
J. Electrochem. Soc. 1996, 143, 3838.[6] M. Watanabe, S. Motoo, J. Electroanal. Chem. 1975, 60,
267.[7] S. Motoo, M. Watanabe, J. Electroanal. Chem. 1979, 98,
203.[8] H. A. Gasteiger, N. Markovic, P. N. Ross, E. J. Cairns,
J. Phys. Chem. 1994, 98, 617.[9] H. A. Gasteiger, P. N. Ross, E. J. Cairns, Surf. Sci. 1993,
293, 67.[10] H. A. Gasteiger, N. Markovic, P. N. Ross, E. J. Cairns,
Electrochimica Acta 1994, 39, 1825.[11] H. A. Gasteiger, N. Markovic, P. N. Ross, J. Phys. Chem.
1995, 99, 8290.[12] H. A. Gasteiger, N. Markovic, P. N. Ross, J.Phys. Chem.
1995, 99, 16757.[13] J. C. Davies, B. E. Hayden, D. J. Pegg, Electrochimica Acta
1998, 44, 1181.[14] J. C. Davies, B. E. Hayden, D. J. Pegg, Surf. Sci. 2000,
467, 118.[15] J. C. Davies, B. E. Hayden, M. E. Rendall, D. J. Pegg,
Surf. Sci. 2002, 496, 110.[16] M. T. M. Koper, T. E. Shubina, R. A. van Santen, J. Phys.
Chem. B 2002, 106, 686.[17] T. E. Shubina, M. T. M. Koper, Electrochimica Acta 2002,
47, 3621.[18] P. Liu, A. Logadottir, J. K. Norskov, Electrochimica Acta
2003, 48, 3731.[19] H. Igarashi, T. Fujino, Y. M. Zhu, H. Uchida, M. Wata-
nabe, Phys. Chem. Chem. Phys. 2001, 3, 306.[20] M. Watanabe, Y. M. Zhu, H. Igarashi, H. Uchida, Elec-
trochemistry 2000, 68, 244.[21] P. Wolohan, P. C. H. Mitchell, D. Thompsett, S. J. Coop-
er, J. Mol. Catal. A. 1997, 119, 223.[22] R. J. Behm, Acta Physica Polonica A. 1998, 93, 259.
ORIG
INAL
RESEARCH
PAPER
10 � 2004 WILEY-VCH Verlag GmbH & Co. KGaA, Weinheim FUEL CELLS 2004, 4, No. 4

Davies et al.: CO Desorption Rate Dependence on CO Partial Pressure over Platinum Fuel Cell Catalysts
[23] Q. Ge, S. Desai, M. Neurock, K. Kourtakis, J. Phys. Chem.B. 2001, 105, 9533.
[24] M.-S. Liao, C. R. Cabrera, Y. Ishikawa, Surf. Sci. 2000,445, 267.
[25] Y. Ishikawa, M.-S. Liao, C. R. Cabrera, Surf. Sci. 2002,513, 98–110.
[26] E. Christoffersen, P. Liu, A. Ruban, H. L. Skriver,J. K. Norskov, J. Catal. 2001, 199, 123.
[27] M. Watanabe, M. Shibata, S. Motoo, J. Electroanal. Chem.1986, 206, 197.
[28] G. Ertl, M. Neumann, K. M.Streit, Surf. Sci. 1977, 64,393.
[29] W. D. Mieher, L. J. Whitman, W. Ho, J. Chem. Phys.1989, 91, 3228.
[30] H. Steininger, S. Lehwald, H. Ibach, Surf. Sci. 1982, 123,264.
[31] B. E. Hayden, A. M. Bradshaw, Surf. Sci. 1983, 125, 787.[32] E. K. Vestergaard, P. Thostrup, T. An, E. Lægsgaard,
I. Stensgaard, B. Hammer, F. Besenbacher, Phys. Rev.Lett. 2002, 88, 259601.
[33] Y. Y. Yeo, L. Vattuone, D. A. King, J. Chem. Phys. 1997,106, 392.
[34] T. Matsushima, Surf. Sci. 1979, 79, 63.
[35] D. H. Parker, A. D. Fisher, J. Colbert, B. E. Koel,J. L. Gland, Surf. Sci. 1991, 258, 75.
[36] B. Kasemo, Rev. Sci. Instrum. 1979, 50, 1602.[37] E. Lægsgaard, L. �sterlund, P. Thostrup, P. B. Rasmus-
sen, I. Stensgaard, F. Besenbacher, Rev. Sci. Instrum.2001, 72, 3537.
[38] B. Hammer, L. B. Hansen, J. K. Nørskov, Phys. Rev. B.1999, 59, 7413.
[39] D. Vanderbilt, Phys. Rev. B. 1990, 41, 7892.[40] G. Kresse, J. Furthmuller, Comput. Mat. Sci. 1996, 6, 15.[41] M. Mavrikakis, B. Hammer, J. K. Nørskov, Phys. Rev.
Lett. 1998, 81, 2819.[42] F. Besenbacher, Reports on Progress in Physics 1996, 59,
1737.[43] M. Ø. Pedersen, M.-L. Bocquet, P. Sautet, et al., Chemical
Physics Letters 1999, 299, 403.[44] E. K. Vestergaard, R. T. Vang, J. Schnadt, S. Longwitz,
F. Besenbacher, in preparation.[45] T. L. Hill, An Introduction to Statistical Thermodynamics,
Addison-Wesley, Reading, USA, 1960.[46] CRC Handbook of Chemistry and Physics, 64th ed. (Eds.
R. C. Weast), CRC, Boca Raton, FL, 1985.[47] J. A. Steckel, A. Eichler, J. Hafner, Phys. Rev. B. 2003, 68,
85416.
______________________
ORIG
INAL
RESEARCH
PAPER
FUEL CELLS 2004, 4, No. 4 � 2004 WILEY-VCH Verlag GmbH & Co. KGaA, Weinheim 11