
CMU Informedia's TRECVID 2005 Skirmishes
20
CMU Informedia’s TRECVID 2005 Skirmishes A.G. Hauptmann, R. Baron, M. Christel, R. Conescu, J. Gao, Q. Jin, W.-H. Lin, J.-Y. Pan, S. M. Stevens, R. Yan, J. Yang, Y. Zhang School of Computer Science, Carnegie Mellon University, Pittsburgh, PA USA At TRECVID 2005, CMU participated in the low-level feature extraction task, the semantic concept feature extraction task, automatic, manual and interactive search tasks and the BBC stock footage challenge. A. TASK: Low-Level Feature Extraction: Pan, Tilt and Zoom Runid: Bashful: probabilistic camera motion with conservative threshold 1 for high precision Runid: Doc: probabilistic camera motion with conservative threshold 2 for high precision Runid: Dopey: probabilistic camera motion with relaxed constraints (threshold 1) for high recall Runid: Grumpy: probabilistic camera motion with relaxed constraints (threshold 2) for high recall Runid: Happy: optical flow with weighting 1 Runid: Sleepy: optical flow with weighting 2 Runid: Sneezy: a more sensitive algorithm based on optical flow in order to improve recall We implemented a probabilistic model for detecting zoom-in/zoom-out operations. The model uses EM to estimate the probability of a particular camera operation from standard MPEG motion vectors. Traditional methods usually set an empirical threshold after deriving parameters proportional to zoom, pan, rotate and tilt. In contrast, our probabilistic model has a solid probabilistic foundation and a clear, simple probability threshold [12]. Different thresholds were applied to aggregate the frame-based camera operation probability over a whole shot. An alternate optical flow submission consisted of 2 part system: feature computation and classification. In the feature computation part, optical flows in each frame are computed, then the most consistent motion for the optical flows is extracted. This motion is projected in pan /tilt /zoom motion patterns. In other words, each frame is given a measure of how much there is a pan /tilt /zoom motion pattern in it. In the second part, each shot is given a camera motion label, based on the features for each frame in the shot. As in all our low-level feature submissions, we did not make use of the training data, so the classification were made based on straightforward weighting schemes, which incorporate the consistent movements in each frames, the scale the movements, etc. For a more detailed description of the optical flow method we used, please refer to [11]. B. TASK: High-Level Semantic Feature Extraction Runid: A Ulust 1 Best of uni-modal classifiers Runid: A Ugluttony 2 Best of Local Fusion Models Runid: A Uavarice 3 Global Fusion Models Runid: A Usloth 4 Weighted smoothing between associated concepts Runid: A Uwrath 5 Bayesian network prediction from observation to concept, BNXtoY (see Figure 1b) Runid: A Uenvy 6 Conditional random field model (see Figure 1e) Runid: A Upride 7 Common Relationship Finding The training procedures for uni-modal and multi-modal classifiers are the same as those in TRECVID 2004. Semantic concepts do not exist in isolation. For example, Naphade et al. [6] explicitly modeled the linkage between various semantic concepts via a Bayesian network that implicitly offers an ontology semantics underlying the video collection. Snoek et al. [5] propose a semantic value chain architecture for concept
Transcript of CMU Informedia's TRECVID 2005 Skirmishes
CMU Informedia’s TRECVID 2005 Skirmishes A.G. Hauptmann, R. Baron, M. Christel, R. Conescu, J. Gao, Q. Jin,
W.-H. Lin, J.-Y. Pan, S. M. Stevens, R. Yan, J. Yang, Y. Zhang
School of Computer Science, Carnegie Mellon University, Pittsburgh, PA USA
At TRECVID 2005, CMU participated in the low-level feature extraction task, the semantic concept feature extraction task, automatic, manual and interactive search tasks and the BBC stock footage challenge.
A. TASK: Low-Level Feature Extraction: Pan, Tilt and Zoom Runid: Bashful: probabilistic camera motion with conservative threshold 1 for high precision Runid: Doc: probabilistic camera motion with conservative threshold 2 for high precision Runid: Dopey: probabilistic camera motion with relaxed constraints (threshold 1) for high recall Runid: Grumpy: probabilistic camera motion with relaxed constraints (threshold 2) for high recall Runid: Happy: optical flow with weighting 1 Runid: Sleepy: optical flow with weighting 2 Runid: Sneezy: a more sensitive algorithm based on optical flow in order to improve recall We implemented a probabilistic model for detecting zoom-in/zoom-out operations. The model uses EM to estimate the probability of a particular camera operation from standard MPEG motion vectors. Traditional methods usually set an empirical threshold after deriving parameters proportional to zoom, pan, rotate and tilt. In contrast, our probabilistic model has a solid probabilistic foundation and a clear, simple probability threshold [12]. Different thresholds were applied to aggregate the frame-based camera operation probability over a whole shot.
An alternate optical flow submission consisted of 2 part system: feature computation and classification. In the feature computation part, optical flows in each frame are computed, then the most consistent motion for the optical flows is extracted. This motion is projected in pan /tilt /zoom motion patterns. In other words, each frame is given a measure of how much there is a pan /tilt /zoom motion pattern in it.
In the second part, each shot is given a camera motion label, based on the features for each frame in the shot. As in all our low-level feature submissions, we did not make use of the training data, so the classification were made based on straightforward weighting schemes, which incorporate the consistent movements in each frames, the scale the movements, etc. For a more detailed description of the optical flow method we used, please refer to [11].
B. TASK: High-Level Semantic Feature Extraction Runid: A Ulust 1 Best of uni-modal classifiers Runid: A Ugluttony 2 Best of Local Fusion Models Runid: A Uavarice 3 Global Fusion Models Runid: A Usloth 4 Weighted smoothing between associated concepts Runid: A Uwrath 5 Bayesian network prediction from observation to concept, BNXtoY (see Figure 1b) Runid: A Uenvy 6 Conditional random field model (see Figure 1e) Runid: A Upride 7 Common Relationship Finding
The training procedures for uni-modal and multi-modal classifiers are the same as those in TRECVID 2004.
Semantic concepts do not exist in isolation. For example, Naphade et al. [6] explicitly modeled the linkage between various semantic concepts via a Bayesian network that implicitly offers an ontology semantics underlying the video collection. Snoek et al. [5] propose a semantic value chain architecture for concept
detection, which includes a multi-concept learning layer called context link. At the top level, it aims at merging the results of content outputs from various concept detectors. Two configurations are explored in this work where one is based on a stacked classifier upon a context vector, and the other is based on ontology with some common sense rules. Hauptmann et al. [4] constructed a stacked logistic regression classifier to fuse the multi-concept predictions and capture the inter-concept causation. In the rest of this section, we investigate how the relationship between different semantic concepts can be leveraged.
B.1. Graphical Model Representations
(a) BNYtoX
(b) BNXtoY
(c) RBM
(d) MRF
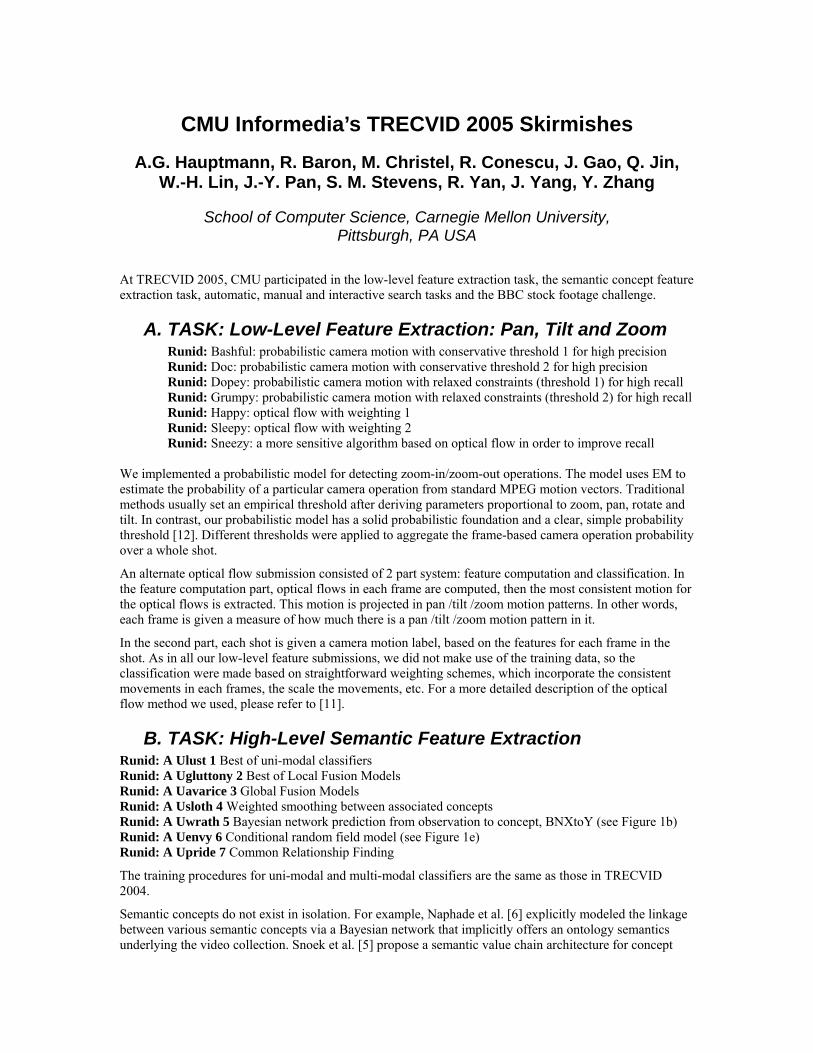
(e) CRF Figure 1 Graphical model representations of five multi-concept learning models
(Y is concept, X is observation) Before proceeding let us first introduce some notations. Formally, let Xi denote the observation of ith concept for a specific video shot, Yj in (0,1) denote the presence/absence of jth concept. Usually, we have D training data (video shots) with truth annotations {(Xd1, ..., XdM, Yd1, ..., YdN)}. The goal of multi-concept learning is to predict the true concept labels based on the detection outputs from multiple underlying uni-concept classifiers, i.e. estimate the conditional probabilities P(Y|X), under different model assumptions.
Typically, these multi-concept learning methods can be concisely represented in form of probabilistic graphical models. Figure 1 shows the graphical model representations of five types of multi-concept learning models. For instance, the Bayesian network version of the multi-net model 0 corresponds to Figure 1(a). In this model, the observation variables Xi are conditional independent to each other given the labels Y. Specially, the prior distribution of Yj is modeled as the Bernoulli distribution and the conditional probability of Xi is modeled as a Gaussian distribution,
The model parameters can be learned based on the maximum likelihood estimation (MLE). In contrast to the simple parameter estimation, it is usually intractable to infer the conditional probability of Y given X if we simply rely on the exact inference technique. We adopt a widely used approximate inference technique called Gibbs sampling, which is applicable when the joint distribution is not known explicitly, but the conditional distribution of each variable is known. In this model, we can repeatedly sample the following conditional probability to approximate the joint distribution and then compute the expectation of label Y.
In the previous model, retaining the causality between variables typically led to sophisticated network structure. In fact, it is not necessary to assume any causality between the concepts. In view of this, Naphade et al. 0 proposed a more advanced version of the multi-net model based on the factor graph model, which in fact corresponds to a Markov random field shown in Figure 1(d). Based on the graphical model, the joint probability of the observations and labels is defined as follows,
The inference of MRF can be achieved by applying some approximate techniques such as loopy belief propagation, contrastive divergence and variational methods. We adopt the contrastive divergence as the basic inference method in our experiments. The model in Figure 1(b) corresponds to another type of multi-concept detection model proposed in 0 0, where the labels Y are generated by a logistic regression function of the observation variables X. Based on an additional validation set, the parameters could be easily estimated using some quasi-Newton approaches such as L-BFGS.
However, even with so many previous efforts, there are several other possibilities that have not been exploited by researchers before. One example is shown in the Figure 1(c) called the restricted Boltzmann machine (RBM) or harmoniums where the observations X are fully connected with the concept presence Y in form of a bipartite graph. It can be shown that there is no marginal independence for either input or hidden variables in a RBM model. However, this model enjoys the advantages of conditional independence between hidden variables, which is generally violated in the directed models. This property greatly reduces inference cost. However, learning harmonium is more difficult due to the presence of a global partition function. The joint probability is defined as,
Similarly, the maximum likelihood estimation can be done by using the contrastive divergence approach. Another example is shown in Figure 1(e) named the conditional random field (CRF)[7] which means the observations Y, when conditioned on X, obeys the Markov property with respect to the corresponding undirected graph. A CRF is a random field globally conditioned on the observations X. Using the Hammersley-Clifford theorem and assuming only the pairwise clique potentials are nonzero, we can define the joint probability as,
Experimental Results on Graphical Models
We evaluate all five multi-concept detection models using the TREC'05 development data. We split the development data into three parts, where 70% as the training set to generate the concept detection outputs, 15% as the validation set to learn the multi-concept relationship, and remaining 15% as the testing set to evaluate the detection performance. An application of the multi-concept learning models is to automatically discover the co-occurrence patterns in the specific video collection. There are a considerable amount of correlation between concepts inside the video collection including both positive interactions and negative interactions. In more detail, the strongest positive/negative relations are: Positive Pairs: (outdoor, building), (urban, building), (person, face), (studio, maps), (car, road), (urban, road), (txt, sports) Negative Pairs: (sports, building), (outdoor, computer screen), (outdoor, maps), (commercial, studio), (waterfront, urban) However, we also notice that not all of the concepts can exhibit co-occurrence patterns with others due to the limited number of training data. It is beneficial to eliminate those isolated concepts in the training data. By conducting the χ2 test between every pair of the concepts, we eliminate the concepts that do not have any χ2 scores exceeding certain thresholds and thus not strongly correlated to others. Finally, we construct a five-concept collection and an eleven-concept collection including the sets of concepts as follows, 5-concept: car, face, person, txt, walk/run 11-concept: building,car,face,maps,outdoor,person,sports,studio,txt,urban,walk/run Table 1 shows the mean average precision of the five models described above when they are applied on the testing set. The baseline performance is obtained without taking any conceptual relations into account. On average, we observed that the best multi-concept modeling approaches can usually bring an additional 2-3% improvement over the baseline in terms of average precision. But so far the performance comparison between various models is far from clear yet. In the 5-concept data set, the BNXtoY and RBM models are among the best ones. But in contrast, in the 11-concept data set, the MRF and CRF model provides the best

performance. After analyzing the performance per concept, we found that the inferior performance of the BNXtoY and RBM models come from the significant degradation on one or two concepts even they improved on other concepts, which might their instabilities in handling a large amount of concepts. However, the differences between various models and baseline are not statistically significant.
5-concept dataset 11-concept dataset
Better Worse Avg AP Base AP Better Worse Avg AP Base AP
BNYtoX (runid: wrath) 2 3 0.574 0.571 5 6 0.518 0.499
BNXtoY 4 0 0.603 0.571 6 4 0.499 0.499
RBM 4 0 0.602 0.571 5 5 0.482 0.499
MRF 3 1 0.571 0.571 6 4 0.521 0.499
CRF (runid: envy) 3 1 0.588 0.571 7 3 0.521 0.499
Table 1 Performance of five multi-concept learning models and baseline
B.2 Global Fusion Models
We tried a new statistical model, Global Fusion Models, to combine evidence from multiple modalities or semantic concepts. Many widely used approaches to fusing evidence from multiple modalities are a linear combinations of individual uni-modality classifier. For each video shot x we first extract low-level features from different modalities, resulting in total k uni-modality feature vectors, x1, x2, . . . , xk. Then uni-modal classifiers are trained separately for each low-level feature, resulting in total k uni-modal classifiers, f1(x; ˆθ1), f2(x; ˆθ2), . . . , fk(x; ˆθk). The final multi-modal classifier, F(x), combines uni-modal classifiers linearly as follows,
where {wi}ki=1 are parameters of the multi-modal classifiers. Since these unimodal classifiers are trained separately, we call this type of fusion model Local Fusion Model (LFM). Common choices of learning these weights are logistic regression and Support Vector Machine (SVM). There are other choices that require no training, such as taking maximum, average, or product of uni-modal classifier scores.
We propose a new model, Global Fusion Models (GFM), to combined evidence from multiple modalities, defined as follows,
At first sight Global Fusion Models are not much different from Local Fusion Models. Both share the similar form, that is, a linear combination of uni-modal classifiers. However, the similarity is only superficial and there is a enormous difference between these two models: the parameters of the fusion model. The parameters of LFM contain only weights, and the parameters of uni-modality classifiers are fixed. We denote the fixed or pre-trained parameters with a hat. On the contrary the parameters of GFM is a union of parameters from all uni-modal classifiers. From the perspective of basis expansion, LFM has fixed basis set, which is much more restrictive than GFM that allow basis to vary. Statistical models like GFM that linearly combine flexible basis have been known as Generalized Additive Models [1]. However, we have to pay the price of having flexible bases. The parameters estimation of GFM will be much more difficult than that of LFM. We first choose a loss function, for example, exponential loss, and optimize the following objective function to estimate the parameters of GFM:
where D is a set of all video shots in the corpus, and y � {1,−1} is the label of the video shot x. However, the parameters of GFM, {θi}ki=1 are so many that directly minimize (3) with respect to all parameters will be a daunting task. Instead, we approximate the process in a forward stagewise manner. A unimodal classifier is added into the Global Fusion Models one at a time and fit with weighted examples until

stopping criterion is met. The parameter estimation process is shown in Figure 2. Currently the stopping criterion is the increase of classification errors on the held-out set.
Figure 2: Fitting GFM in forward stagewise fashion
We submitted one LFM run and one GFM run, and the evaluation results are listed in Table 2. Except for three topics most of the time LFM outperforms GFM. However, we believe GFM has not realized its full potential, and there are more issues to be explored. For example, how should we select a subset of unimodal classifier for GFM? Right now only top n performed uni-modal classifiers are chosen, which seems to be greedy. More formal approach of model selection like forward stepwise selection can be incorporated in the parameter estimation procedure.
Table 2: The results of Local Fusion Models (run id A Ugluttony 2) and Global Fusion Models (run id A
Uavarice 3) in TRECVID 2005
B.3 Multilingual and Multi-source Text Features
We also developed a new multilingual, multi-source text features to incorporate textual information from multiple languages and multiple sources (ASR transcripts and translations). Building any multi-modal classifiers on a video collection consisting of multilingual speeches naturally raises a question: How can we effectively utilize multilingual textual information? One straightforward solution is to translation multilingual transcripts into single target language, for example, English, as provided by NIST, and we can proceed the classifier training and testing procedures as if there were no multiple languages in the corpus. The good news is that translating all documents into English gives rise to more training examples, compared with training individual language-specific text classifier with fewer examples. The bad news, however, is that by translating we inevitably introduce additional translation errors into the system in addition to speech recognition errors.
In order to enjoy the benefits of abundant training examples and at the same time not to ignore more correct textual information in the native language, we propose a new multilingual text features that concatenates transcripts and translations from multiple languages together. Monolingual text features only contain English ASR transcripts or translations, but Multilingual text features contain both native Language (Chinese or Arabic) ASR transcripts and English translations. Furthermore, there usually are more than one ASR or translation to choose from, and thus we also investigate how multiple sources of ASR transcripts or translations can improve classification accuracy. Single-source text features consist of transcripts or translations from only one system, while multiple-source consists of up to four different ASR and
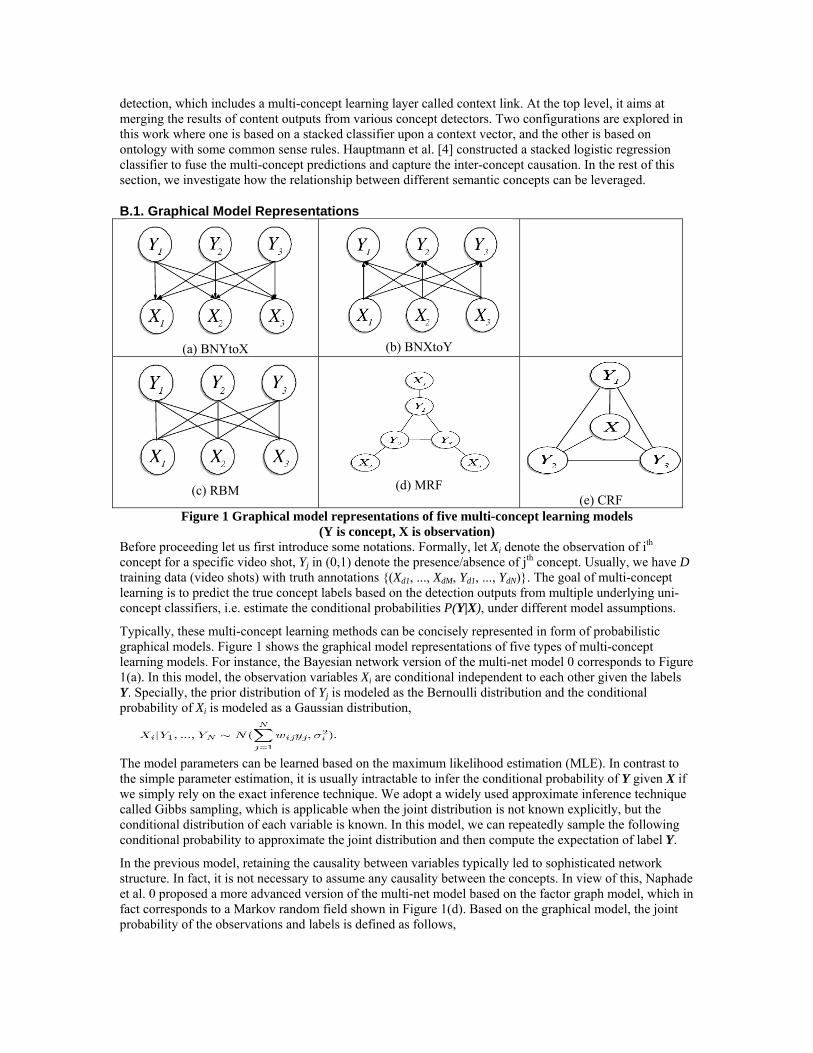
translation systems. We summarize in Table 3 available ASR and translation resources when we construct multilingual text features.
Table 3: Language resources for building multilingual text features: NIST is official TRECVID data,
MSASR is ASR based on Microsoft Speech SDK, Sphinx3 is ASR from CMU Sphinx Group, and ISL translation is provided by the CMU Interactive Systems Lab statistical translation module [13].
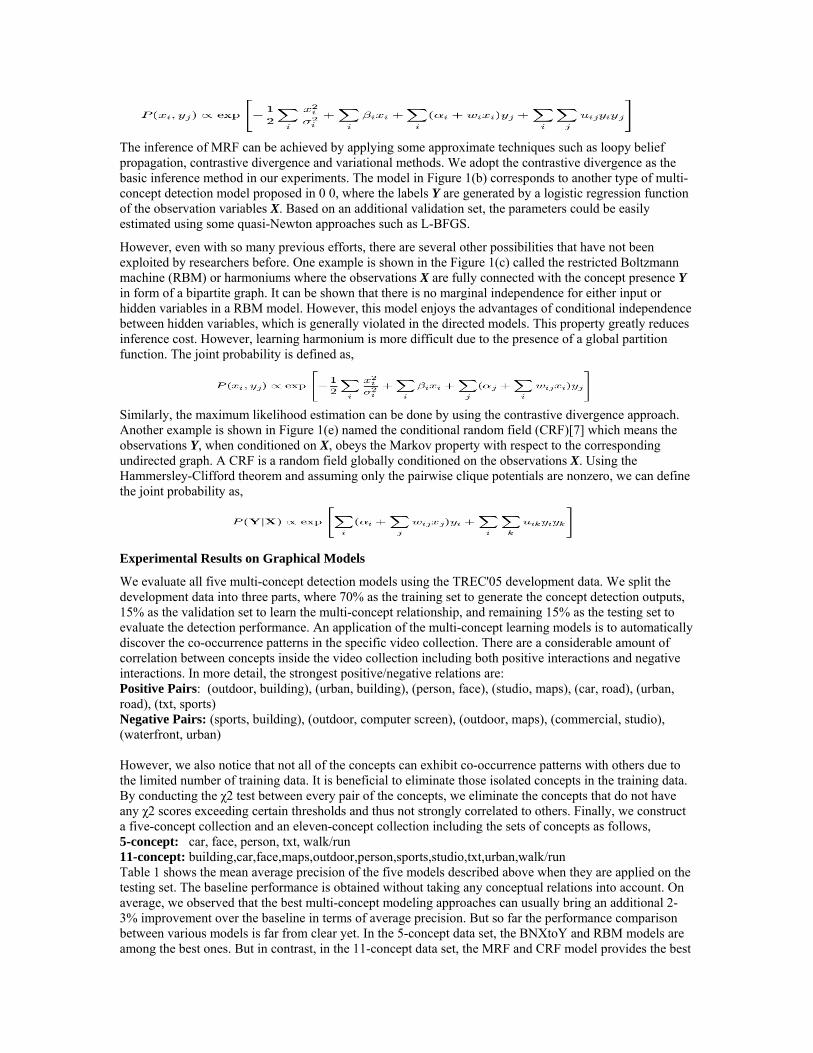
The multilingual, multi-source text features have been shown more effective than monolingual text features, especially when combining with other image features to build multi-modal classifiers. Our new multilingual, multi-source text features partially explain the success of our submission for Sports in highlevel feature extraction task, which performs the best among all submission in TRECVID 2005, as shown in Table 4. It can clearly seen that multilingual text features are remarkably more effective than English-only text features. Furthermore, multiple sources provide complementary information and further boost the performance. Therefore we conclude that the translation quality so far is not accurate enough to entitle us to complete drop native text, at least in broadcast news domain, and simultaneously exploiting native and translated text significantly improves classification performance.
Table 4: Results of detecting Sports shots with various multilingual text features combining with the same
color feature in TRECVID 2005 (* was submitted as run id A Ugluttony 2)
B.4 Common Relationship Finding
In the runid “pride”, we tried a classification method that predicts a video shot V as class C, if class C is the one common to the regions similar to those of the keyframe of shot V. In particular, regions are extracted from the shot keyframes and a graph-based method was designed to establish the relationship between regions, keyframes, and class labels. This is an alternative to other classifiers such as SVM, providing an opportunity of improved performance by classifier combination. It did not perform as hoped.
C. TASK: Automatic and Manual Search In this year, all of our automatic and manual retrieval submissions are built on a relevance-based probabilistic retrieval model, which aims at combining diverse knowledge sources from different retrieval components and semantic concept outputs. This model translated the retrieval task into a supervised learning problem with the parameters learned discriminatively. Rather than treating retrieval as a classification problem, we used an algorithm called “ranking logistic regression” by accounting for the order information between training data, so that the optimization is closely associated with the retrieval performance criteria.
Person X queries
The seven queries for finding a named person (i.e., topic 149-154) were processed using specialized algorithms in some of our automatic/manual submissions, since such queries may require different features and consequently different strategies of combining them. The major features used include: • Text retrieval score: This is the IR score between each query and original or translated transcript
associated with each video shot. The score is propagated to the neighboring shots with a certain decay curve. To overcome the errors in the translated transcript, each query is also translated into Chinese and Arabic by machine translation technique and directly matched with the original transcript of foreign news, with the similarity score incorporated into the overall IR score. In automatic search
submissions, we use the original queries, while in the manual search submissions we use the manually expanded queries.
• Face similarity: A face model is built for each person using the truth (i.e., shots containing this person) collected from the development set within 15 minute. This model computes a score for each shot to indicate how likely the faces in the shot (if any) belong to the intended person. This feature is only legitimate in the manual search since it requires manual labeling efforts.
• Face detection: Schneiderman’s face detector is used to detect the faces from the video frames with a confidence score for each detected face. We compute a binary score for each shot, where is 1 when the shot has at least one face with confidence over a predefined threshold, and 0 otherwise.
• Graphics filter: A binary score indicates whether each shot is a graphical shot (e.g., animation, sketch, shot with artificial background) or not, obtained from a graphic shot detector. Graphical shots are rarely the relevant shots of person X queries and this feature is useful to filter them out.
• Anchor filter: A binary score indicates whether each shot is an anchor shot or not, obtained from an anchor detector.
Unlike static media such as still images, video is a continuous media that consists of a temporal dimension. For example, a person who appears in one shot is very likely to appear again in adjacent shots; a person mentioned by the anchor is likely to appear in the next a few shots after the anchor shot, etc. To explore such temporal information, we adopted a simple “stacking” method which predicts the relevance of a shot (w.r.t. containing a specific person) based on the features of not only this shot but also the neighboring shots in a window. The window size is experimentally determined to be 3, which means the features from the previous shots, the current shot, and the next shot are combined.
Relevance-based Probabilistic Retrieval Model
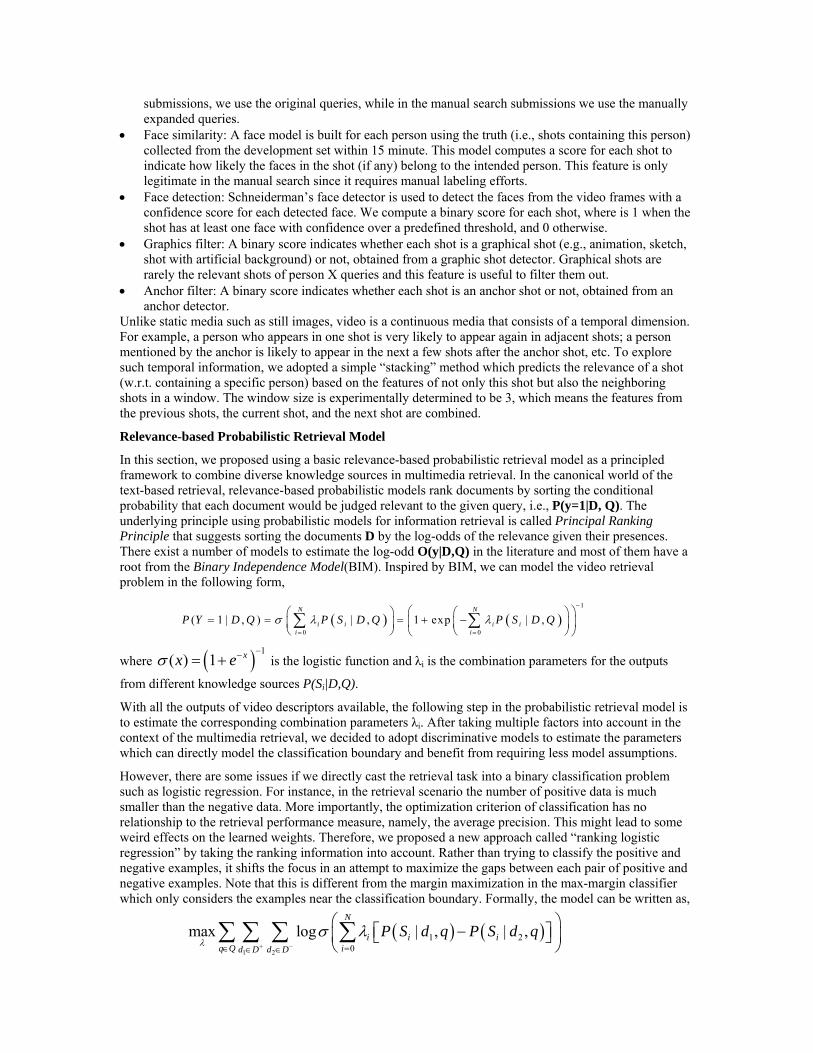
In this section, we proposed using a basic relevance-based probabilistic retrieval model as a principled framework to combine diverse knowledge sources in multimedia retrieval. In the canonical world of the text-based retrieval, relevance-based probabilistic models rank documents by sorting the conditional probability that each document would be judged relevant to the given query, i.e., P(y=1|D, Q). The underlying principle using probabilistic models for information retrieval is called Principal Ranking Principle that suggests sorting the documents D by the log-odds of the relevance given their presences. There exist a number of models to estimate the log-odd O(y|D,Q) in the literature and most of them have a root from the Binary Independence Model(BIM). Inspired by BIM, we can model the video retrieval problem in the following form,
where ( ) 1( ) 1 xx eσ
−−= + is the logistic function and λi is the combination parameters for the outputs
from different knowledge sources P(Si|D,Q).
With all the outputs of video descriptors available, the following step in the probabilistic retrieval model is to estimate the corresponding combination parameters λi. After taking multiple factors into account in the context of the multimedia retrieval, we decided to adopt discriminative models to estimate the parameters which can directly model the classification boundary and benefit from requiring less model assumptions.
However, there are some issues if we directly cast the retrieval task into a binary classification problem such as logistic regression. For instance, in the retrieval scenario the number of positive data is much smaller than the negative data. More importantly, the optimization criterion of classification has no relationship to the retrieval performance measure, namely, the average precision. This might lead to some weird effects on the learned weights. Therefore, we proposed a new approach called “ranking logistic regression” by taking the ranking information into account. Rather than trying to classify the positive and negative examples, it shifts the focus in an attempt to maximize the gaps between each pair of positive and negative examples. Note that this is different from the margin maximization in the max-margin classifier which only considers the examples near the classification boundary. Formally, the model can be written as,
( ) ( )1
0 0( 1 | , ) | , 1 exp | ,
N N
i i i ii i
P Y D Q P S D Q P S D Qσ λ λ−
= =
⎛ ⎞⎛ ⎞ ⎛ ⎞= = = + −⎜ ⎟⎜ ⎟ ⎜ ⎟⎝ ⎠ ⎝ ⎠⎝ ⎠∑ ∑
( ) ( )1 2
1 20
max log | , | ,N
i i iq Q id D d D
P S d q P S d qλ
σ λ+ −∈ =∈ ∈
⎛ ⎞−⎡ ⎤⎜ ⎟⎣ ⎦
⎝ ⎠∑ ∑ ∑ ∑
, where D+ and D- are the collections of positive/negative documents. It can be proven that the minimization of the disorder in the examples provides a lower bound of the average precision measure. However, optimizing above loss function in a brutal force manner could be computational expensive in our case. For instance, the association between 100 positive and 900 negative examples results in an explosive 90,000 training pairs. Fortunately, we have come up with an approximation with above loss function in form of
where wd is the additional weights as ratio between the number of positive/negative data, ai is a shift factor. It can be proved that this approximation is tight and the optimization complexity is the same as the logistic regression. Therefore, all of the following retrieval models will be built upon the approximated version of “ranking logistic regression”.
Query Analysis
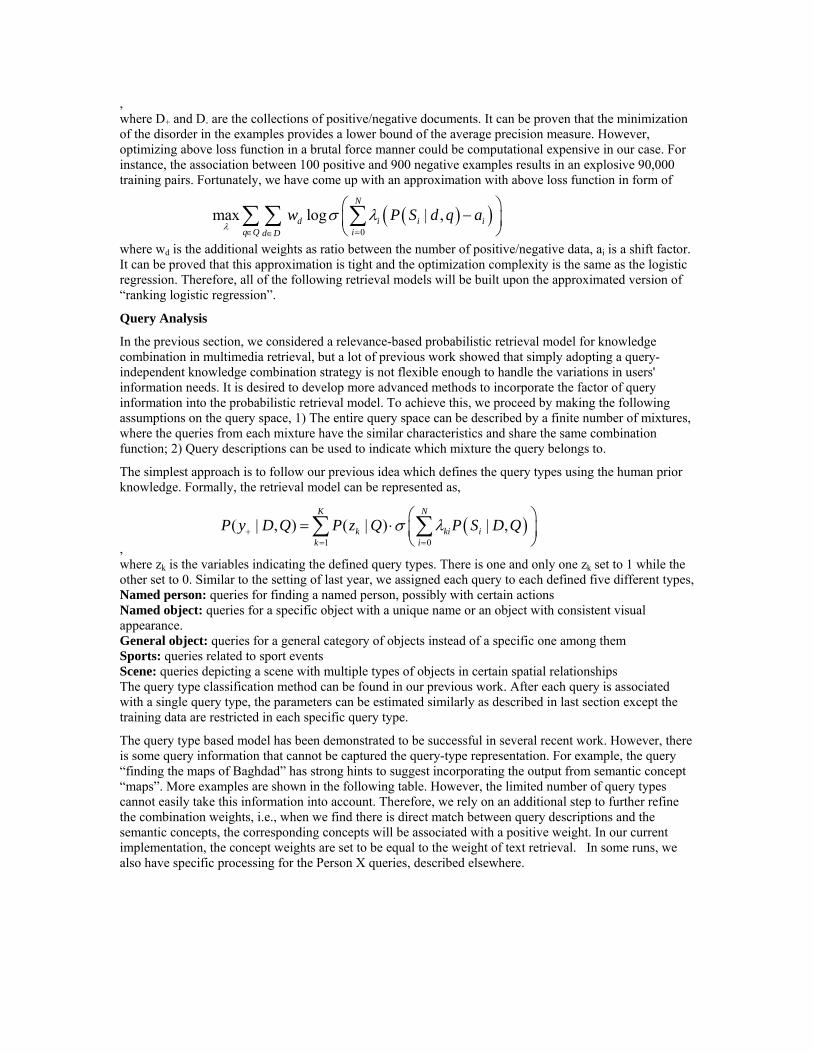
In the previous section, we considered a relevance-based probabilistic retrieval model for knowledge combination in multimedia retrieval, but a lot of previous work showed that simply adopting a query-independent knowledge combination strategy is not flexible enough to handle the variations in users' information needs. It is desired to develop more advanced methods to incorporate the factor of query information into the probabilistic retrieval model. To achieve this, we proceed by making the following assumptions on the query space, 1) The entire query space can be described by a finite number of mixtures, where the queries from each mixture have the similar characteristics and share the same combination function; 2) Query descriptions can be used to indicate which mixture the query belongs to.
The simplest approach is to follow our previous idea which defines the query types using the human prior knowledge. Formally, the retrieval model can be represented as,
, where zk is the variables indicating the defined query types. There is one and only one zk set to 1 while the other set to 0. Similar to the setting of last year, we assigned each query to each defined five different types, Named person: queries for finding a named person, possibly with certain actions Named object: queries for a specific object with a unique name or an object with consistent visual appearance. General object: queries for a general category of objects instead of a specific one among them Sports: queries related to sport events Scene: queries depicting a scene with multiple types of objects in certain spatial relationships The query type classification method can be found in our previous work. After each query is associated with a single query type, the parameters can be estimated similarly as described in last section except the training data are restricted in each specific query type.
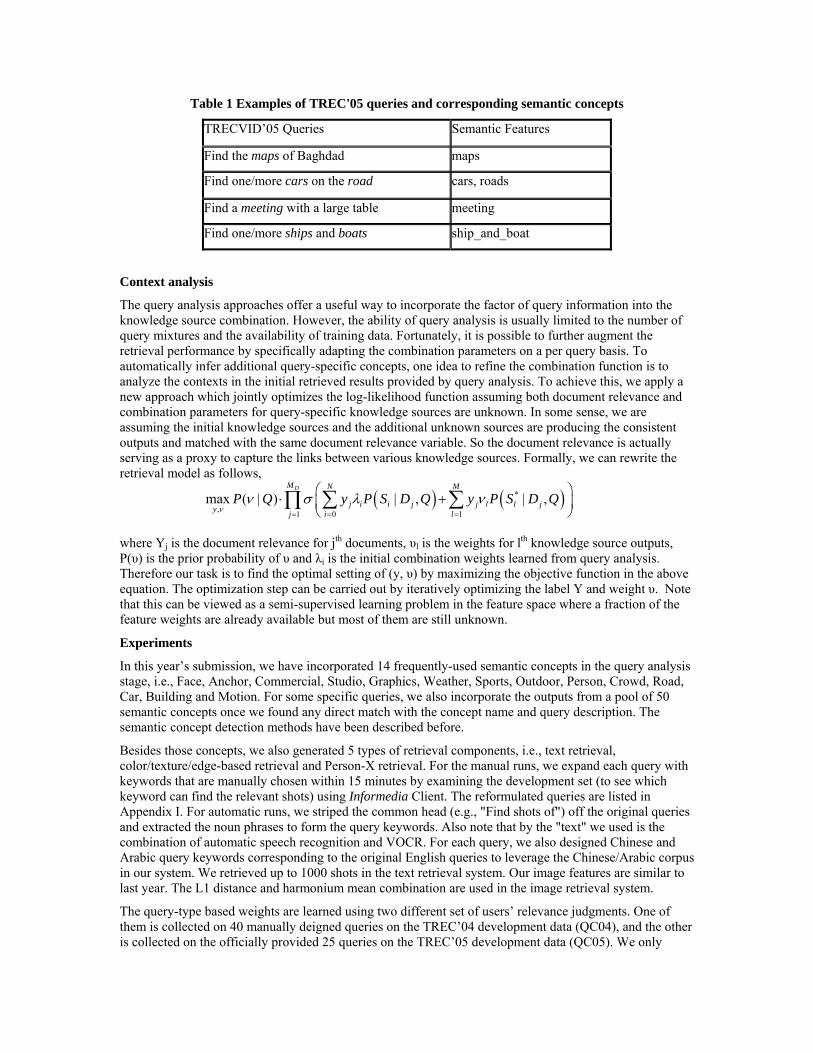
The query type based model has been demonstrated to be successful in several recent work. However, there is some query information that cannot be captured the query-type representation. For example, the query “finding the maps of Baghdad” has strong hints to suggest incorporating the output from semantic concept “maps”. More examples are shown in the following table. However, the limited number of query types cannot easily take this information into account. Therefore, we rely on an additional step to further refine the combination weights, i.e., when we find there is direct match between query descriptions and the semantic concepts, the corresponding concepts will be associated with a positive weight. In our current implementation, the concept weights are set to be equal to the weight of text retrieval. In some runs, we also have specific processing for the Person X queries, described elsewhere.
( )( )0
max log | ,N
d i i iq Q id D
w P S d q aλ
σ λ∈ =∈
⎛ ⎞−⎜ ⎟⎝ ⎠
∑ ∑ ∑
( )1 0
( | , ) ( | ) | ,K N
k ki ik i
P y D Q P z Q P S D Qσ λ+= =
⎛ ⎞= ⋅ ⎜ ⎟⎝ ⎠
∑ ∑
( ) ( )*
, 0 11
max ( | ) | , | ,DM N M
j i i j j l l jy i lj
P Q y P S D Q y P S D Qν
ν σ λ ν= ==
⎛ ⎞⋅ +⎜ ⎟
⎝ ⎠∑ ∑∏
Table 1 Examples of TREC'05 queries and corresponding semantic concepts
TRECVID’05 Queries Semantic Features
Find the maps of Baghdad maps
Find one/more cars on the road cars, roads
Find a meeting with a large table meeting
Find one/more ships and boats ship_and_boat
Context analysis
The query analysis approaches offer a useful way to incorporate the factor of query information into the knowledge source combination. However, the ability of query analysis is usually limited to the number of query mixtures and the availability of training data. Fortunately, it is possible to further augment the retrieval performance by specifically adapting the combination parameters on a per query basis. To automatically infer additional query-specific concepts, one idea to refine the combination function is to analyze the contexts in the initial retrieved results provided by query analysis. To achieve this, we apply a new approach which jointly optimizes the log-likelihood function assuming both document relevance and combination parameters for query-specific knowledge sources are unknown. In some sense, we are assuming the initial knowledge sources and the additional unknown sources are producing the consistent outputs and matched with the same document relevance variable. So the document relevance is actually serving as a proxy to capture the links between various knowledge sources. Formally, we can rewrite the retrieval model as follows,
where Yj is the document relevance for jth documents, υl is the weights for lth knowledge source outputs, P(υ) is the prior probability of υ and λi is the initial combination weights learned from query analysis. Therefore our task is to find the optimal setting of (y, υ) by maximizing the objective function in the above equation. The optimization step can be carried out by iteratively optimizing the label Y and weight υ. Note that this can be viewed as a semi-supervised learning problem in the feature space where a fraction of the feature weights are already available but most of them are still unknown.
Experiments
In this year’s submission, we have incorporated 14 frequently-used semantic concepts in the query analysis stage, i.e., Face, Anchor, Commercial, Studio, Graphics, Weather, Sports, Outdoor, Person, Crowd, Road, Car, Building and Motion. For some specific queries, we also incorporate the outputs from a pool of 50 semantic concepts once we found any direct match with the concept name and query description. The semantic concept detection methods have been described before.
Besides those concepts, we also generated 5 types of retrieval components, i.e., text retrieval, color/texture/edge-based retrieval and Person-X retrieval. For the manual runs, we expand each query with keywords that are manually chosen within 15 minutes by examining the development set (to see which keyword can find the relevant shots) using Informedia Client. The reformulated queries are listed in Appendix I. For automatic runs, we striped the common head (e.g., "Find shots of") off the original queries and extracted the noun phrases to form the query keywords. Also note that by the "text" we used is the combination of automatic speech recognition and VOCR. For each query, we also designed Chinese and Arabic query keywords corresponding to the original English queries to leverage the Chinese/Arabic corpus in our system. We retrieved up to 1000 shots in the text retrieval system. Our image features are similar to last year. The L1 distance and harmonium mean combination are used in the image retrieval system.
The query-type based weights are learned using two different set of users’ relevance judgments. One of them is collected on 40 manually deigned queries on the TREC’04 development data (QC04), and the other is collected on the officially provided 25 queries on the TREC’05 development data (QC05). We only

apply QC04 in the automatic retrieval runs and both QC04/QC05 in the manual runs. Moreover, we partitioned the TREC’05 queries into 7 person queries, 5 specific object queries, 3 general object queries, 3 sports queries and 6 others queries.
Table 2 reports the performance comparison of different automatic/manual retrieval runs. The baseline is generated by text retrieval only on the English ASR/MT output provided by NIST. For other submissions we include the ASR outputs from Microsoft and ISL speech recognition results (both the Chinese/Arabic outputs and their machine translated outputs in English). As we can observed, introducing additional Chinese/Arabic keywords can improve overall average precision around 1-2%. This improvement mainly stems from the higher recall rate. As we take a closer look, the benefit of using more keywords mainly lies in the people queries and the specific object queries, because of the reliability of text retrieval techniques in these two query types.
The manual runs with text retrieval on expanded keywords achieved noticeably better results than the automatic runs based on original keywords, as shows the effectiveness of manual keyword expansion. But in contrast, the automatic query expansion by pseudo-relevance feedback (Auto.E_PRF.QC04U) from corpus degrades the average precision a little bit. It suggests the difficulty of designing a robust automatic query expansion method.
Another major performance improvement factor comes from the combination of the text retrieval results and other knowledge sources in a query-type dependent way. For example, for the manual runs with English keywords (Manu.E), using QC04 combination produces 4.2% higher average precision and updating queries with direct matched concepts provides 2% more. The similar performance between combination weights QC05 and the weight QC04 indicates the robustness of learning the query-type combination weights, even when the underlying corpuses are different. The query-class combination method mainly benefits person and sports queries. In comparison, the specific object and “others” queries typically enjoys the introduction of further query updating.
The last performance improvement factor is the context analysis step. As we can see, the runs with the highest average precision used the context analysis as the final step. This step boosts the AP both on the “specific object” and “sports” queries by automatically introducing more semantic concepts into the combination functions which is not present in the query description, such as the outdoor classifier in “tennis” queries.
Results for Person X queries
Two manual runs and one automatic run submitted to TRECVID 2005 from CMU contain the results of the above methods for the 6 person X queries (i.e., topic 149 to topic 154). Note that topic 159 is not considered as a person X query since it requires certain actions (entering or leaving a vehicle) captured by the shot. The differences between the automatic and manual runs include the use of manually expanded queries and the face similarity features, which are not possible without human intervention. Figure 3 shows the mean average precision (MAP) of all the manual submissions to TRECVID 2005 on the 6 person-X queries, where our person X method is the best performer. The variant with temporally stacked features from neighboring shots, however, performs even worse than the one without stacking. Looking into the precision on each query, we found the stacking method is worse than the non-stacking method except only one query, which suggests that this simple way of exploiting temporal information is not very effective. But it is clear by comparison between our own methods that face similarity and manual query expansion is critical to the performance of person X queries.

0
0.05
0.1
0.15
0.2
0.25
0.3
PX
PX.Stack3
Mea
n A
vera
ge P
reci
sion
Figure 3: Performance of manual submissions on 6 person-X queries
Table 2 The overall performance of different submissions and its breakdown on five query types. MAP is mean average precision, Prec30 is the precision at 30 shots, Rec1000 is the recall at 1000 shots. In the submission descriptions,
Auto/Manu means automatic/manual runs. The second fields indicates the query keywords we used, where E is English, C is Chinese, A is Arabic. Therefore, ECA means using English, Chinese, Arabic query keyword together. PRF stands
for pseudo-relevance feedback from corpus by adding 5 keywords per query. The third field shows the setting of combination weights. QC0x indicates the training data we used for query analysis. If followed by U, we have explicitly
updated the weights with direct matched concepts. If followed by CA, we applied an additional context analysis step after query analysis.
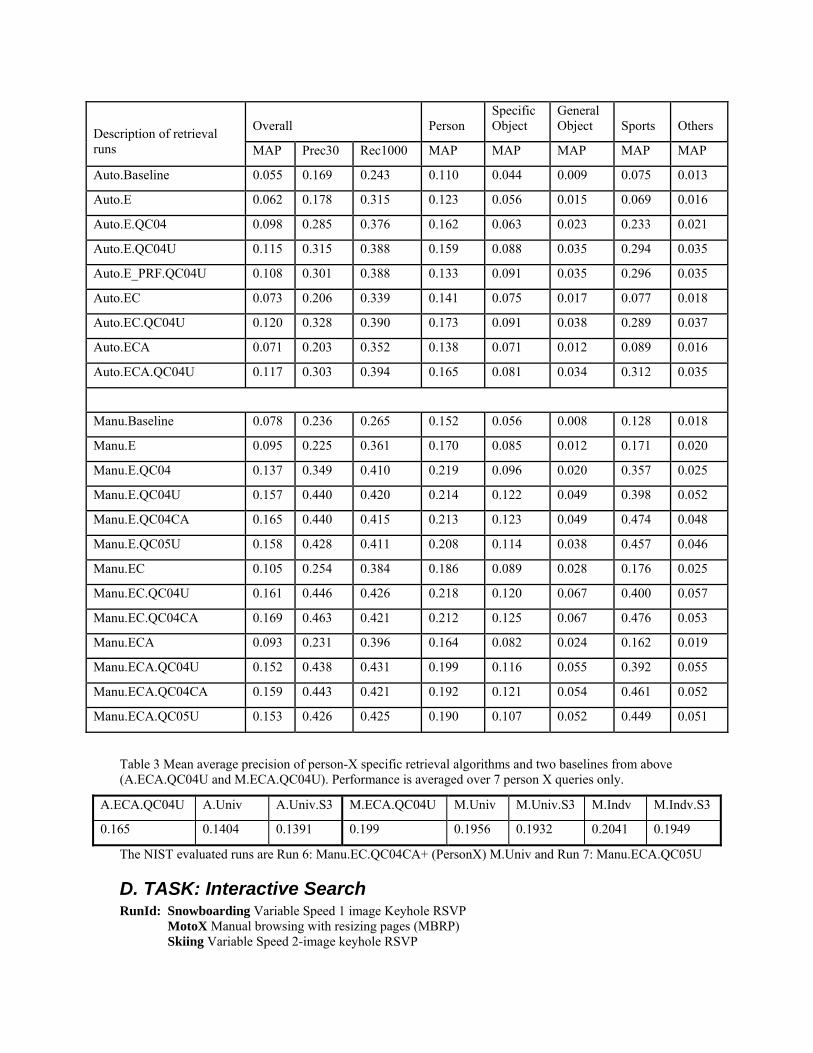
Table 3 Mean average precision of person-X specific retrieval algorithms and two baselines from above (A.ECA.QC04U and M.ECA.QC04U). Performance is averaged over 7 person X queries only.
A.ECA.QC04U A.Univ A.Univ.S3 M.ECA.QC04U M.Univ M.Univ.S3 M.Indv M.Indv.S3
0.165 0.1404 0.1391 0.199 0.1956 0.1932 0.2041 0.1949
The NIST evaluated runs are Run 6: Manu.EC.QC04CA+ (PersonX) M.Univ and Run 7: Manu.ECA.QC05U
D. TASK: Interactive Search RunId: Snowboarding Variable Speed 1 image Keyhole RSVP
MotoX Manual browsing with resizing pages (MBRP) Skiing Variable Speed 2-image keyhole RSVP
Overall Person Specific Object
General Object Sports Others Description of retrieval
runs MAP Prec30 Rec1000 MAP MAP MAP MAP MAP
Auto.Baseline 0.055 0.169 0.243 0.110 0.044 0.009 0.075 0.013
Auto.E 0.062 0.178 0.315 0.123 0.056 0.015 0.069 0.016
Auto.E.QC04 0.098 0.285 0.376 0.162 0.063 0.023 0.233 0.021
Auto.E.QC04U 0.115 0.315 0.388 0.159 0.088 0.035 0.294 0.035
Auto.E_PRF.QC04U 0.108 0.301 0.388 0.133 0.091 0.035 0.296 0.035
Auto.EC 0.073 0.206 0.339 0.141 0.075 0.017 0.077 0.018
Auto.EC.QC04U 0.120 0.328 0.390 0.173 0.091 0.038 0.289 0.037
Auto.ECA 0.071 0.203 0.352 0.138 0.071 0.012 0.089 0.016
Auto.ECA.QC04U 0.117 0.303 0.394 0.165 0.081 0.034 0.312 0.035
Manu.Baseline 0.078 0.236 0.265 0.152 0.056 0.008 0.128 0.018
Manu.E 0.095 0.225 0.361 0.170 0.085 0.012 0.171 0.020
Manu.E.QC04 0.137 0.349 0.410 0.219 0.096 0.020 0.357 0.025
Manu.E.QC04U 0.157 0.440 0.420 0.214 0.122 0.049 0.398 0.052
Manu.E.QC04CA 0.165 0.440 0.415 0.213 0.123 0.049 0.474 0.048
Manu.E.QC05U 0.158 0.428 0.411 0.208 0.114 0.038 0.457 0.046
Manu.EC 0.105 0.254 0.384 0.186 0.089 0.028 0.176 0.025
Manu.EC.QC04U 0.161 0.446 0.426 0.218 0.120 0.067 0.400 0.057
Manu.EC.QC04CA 0.169 0.463 0.421 0.212 0.125 0.067 0.476 0.053
Manu.ECA 0.093 0.231 0.396 0.164 0.082 0.024 0.162 0.019
Manu.ECA.QC04U 0.152 0.438 0.431 0.199 0.116 0.055 0.392 0.055
Manu.ECA.QC04CA 0.159 0.443 0.421 0.192 0.121 0.054 0.461 0.052
Manu.ECA.QC05U 0.153 0.426 0.425 0.190 0.107 0.052 0.449 0.051
Snowmobile Manual browsing with resizing pages (MBRP), temporal semantic clustering Mon Full Informedia Interface, expert user, mining user activity to suppress shots previously seen Tue Full Informedia Interface, novice user, mining user activity to suppress shots previously seen Wed Full Informedia Interface, novice user SupN1 Full Informedia Interface, novice user SubN2 Full Informedia Interface, novice user, mining user activity to suppress shots previously seen
Goals for the 2005 Informedia interactive search task work include: • Charting the evolution of topics and corpora through the years and gauging novice versus expert
performance by having the same expert user again perform the 2005 TRECVID search • Leveraging from past successes in exploring new approaches.
The first point is covered by having one of the Informedia researchers again remain completely isolated from the TRECVID test set and topics until he performs the interactive search task, and then submit that run, as was done for 2002, 2003, and 2004.
We also wished to do the following interactive search task experiments, again with 24 novice users: • Provide efficient, well communicated and understood access to image search, as easy and visible as the
text search interface • Provide easy access and browsing for prebuilt sets of best generic-concept shots, e.g., the “best roads” • Provide easy access and browsing for prebuilt sets of best specific-people shots, where the top 100
named people from the development set were automatically derived and used to automatically generate 100 sets of best person X, e.g., “best Kofi Annan”
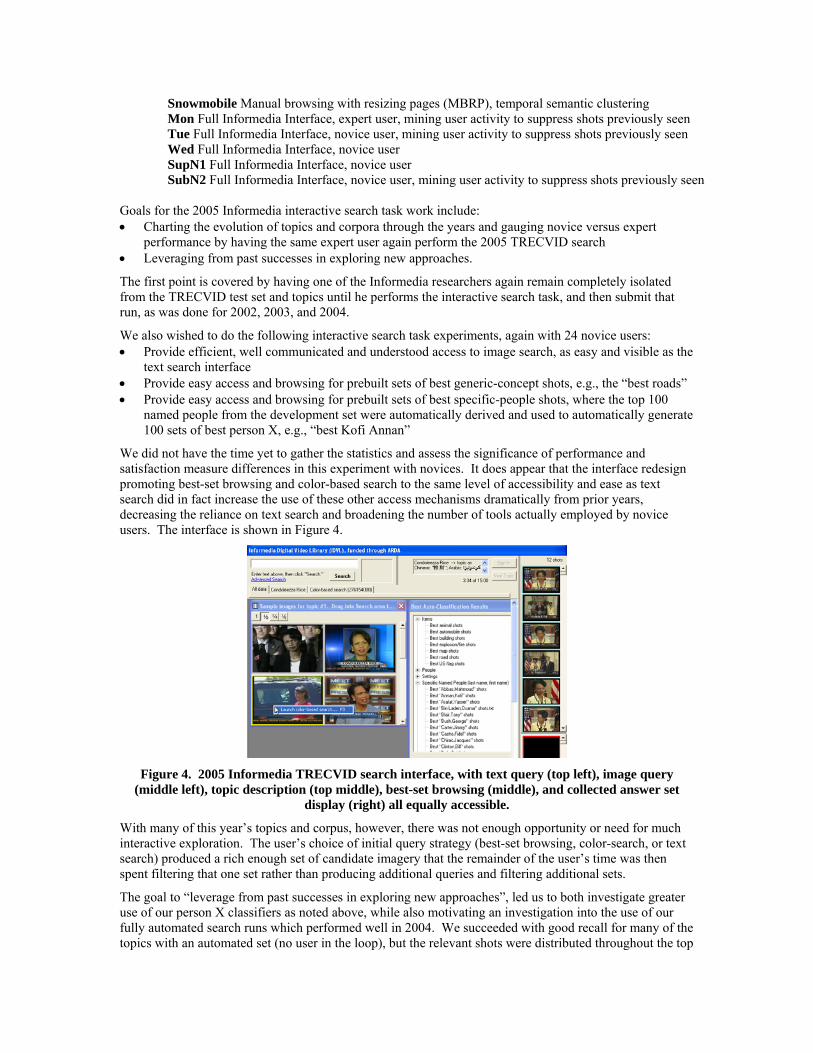
We did not have the time yet to gather the statistics and assess the significance of performance and satisfaction measure differences in this experiment with novices. It does appear that the interface redesign promoting best-set browsing and color-based search to the same level of accessibility and ease as text search did in fact increase the use of these other access mechanisms dramatically from prior years, decreasing the reliance on text search and broadening the number of tools actually employed by novice users. The interface is shown in Figure 4.
Figure 4. 2005 Informedia TRECVID search interface, with text query (top left), image query
(middle left), topic description (top middle), best-set browsing (middle), and collected answer set display (right) all equally accessible.
With many of this year’s topics and corpus, however, there was not enough opportunity or need for much interactive exploration. The user’s choice of initial query strategy (best-set browsing, color-search, or text search) produced a rich enough set of candidate imagery that the remainder of the user’s time was then spent filtering that one set rather than producing additional queries and filtering additional sets.
The goal to “leverage from past successes in exploring new approaches”, led us to both investigate greater use of our person X classifiers as noted above, while also motivating an investigation into the use of our fully automated search runs which performed well in 2004. We succeeded with good recall for many of the topics with an automated set (no user in the loop), but the relevant shots were distributed throughout the top
3000 to 5000 slots in the ordered shot list, causing the average precision for the automated search run to lag well behind the average precision scores for the best interactive runs. By relying on an intelligent human user possessing excellent visual perception skills to compensate for comparatively low precision in automatically classifying the visual contents of video, a human user could filter the automated set and produce a set that retains most or all of the relevant shots from the automated set, but with much greater precision. We made use of Rapid Serial Visual Presentation (RSVP) to experiment with the trade-offs between serial and parallel presentation of thumbnail imagery to assess shot relevance for a given topic, based in part on prior work showing promise for the RSVP technique for image retrieval [10]. We named this approach extreme video retrieval (XVR).
Machine Extremes in XVR
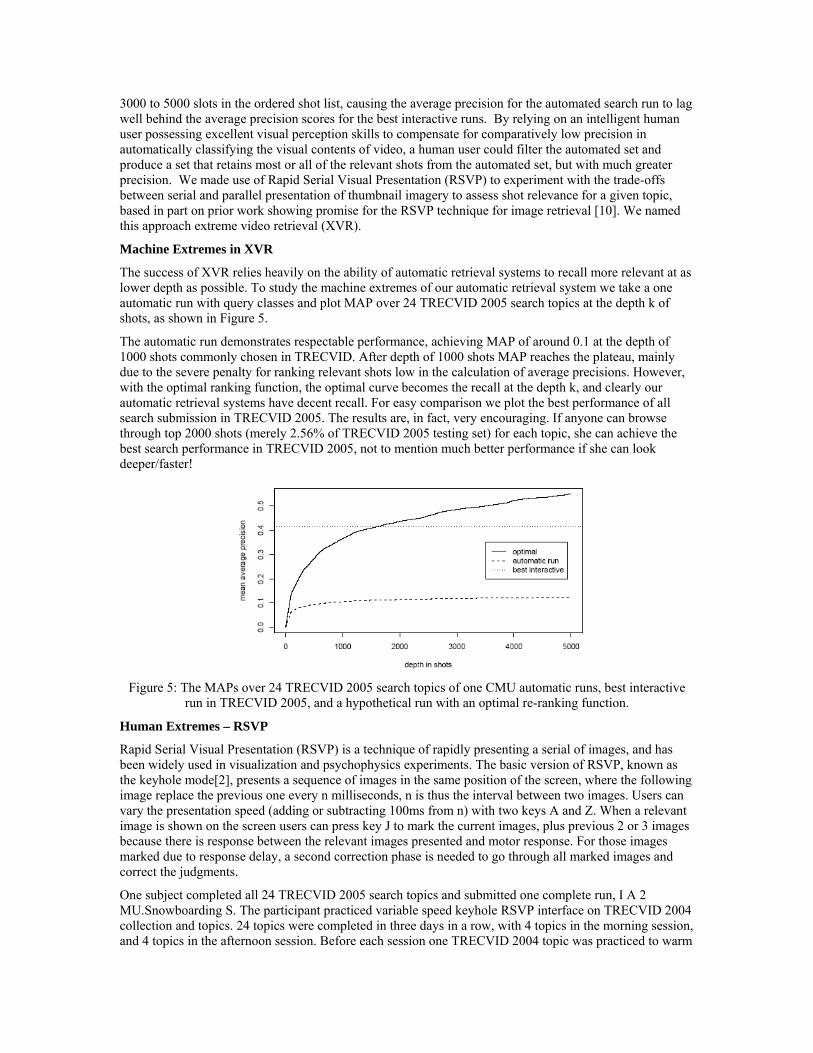
The success of XVR relies heavily on the ability of automatic retrieval systems to recall more relevant at as lower depth as possible. To study the machine extremes of our automatic retrieval system we take a one automatic run with query classes and plot MAP over 24 TRECVID 2005 search topics at the depth k of shots, as shown in Figure 5.
The automatic run demonstrates respectable performance, achieving MAP of around 0.1 at the depth of 1000 shots commonly chosen in TRECVID. After depth of 1000 shots MAP reaches the plateau, mainly due to the severe penalty for ranking relevant shots low in the calculation of average precisions. However, with the optimal ranking function, the optimal curve becomes the recall at the depth k, and clearly our automatic retrieval systems have decent recall. For easy comparison we plot the best performance of all search submission in TRECVID 2005. The results are, in fact, very encouraging. If anyone can browse through top 2000 shots (merely 2.56% of TRECVID 2005 testing set) for each topic, she can achieve the best search performance in TRECVID 2005, not to mention much better performance if she can look deeper/faster!
Figure 5: The MAPs over 24 TRECVID 2005 search topics of one CMU automatic runs, best interactive
run in TRECVID 2005, and a hypothetical run with an optimal re-ranking function.
Human Extremes – RSVP
Rapid Serial Visual Presentation (RSVP) is a technique of rapidly presenting a serial of images, and has been widely used in visualization and psychophysics experiments. The basic version of RSVP, known as the keyhole mode[2], presents a sequence of images in the same position of the screen, where the following image replace the previous one every n milliseconds, n is thus the interval between two images. Users can vary the presentation speed (adding or subtracting 100ms from n) with two keys A and Z. When a relevant image is shown on the screen users can press key J to mark the current images, plus previous 2 or 3 images because there is response between the relevant images presented and motor response. For those images marked due to response delay, a second correction phase is needed to go through all marked images and correct the judgments.
One subject completed all 24 TRECVID 2005 search topics and submitted one complete run, I A 2 MU.Snowboarding S. The participant practiced variable speed keyhole RSVP interface on TRECVID 2004 collection and topics. 24 topics were completed in three days in a row, with 4 topics in the morning session, and 4 topics in the afternoon session. Before each session one TRECVID 2004 topic was practiced to warm

up the participant. Based on the practices on TRECVID 2004 topics the participant can correct around 100 images per minute in the second phase, and thus the length of the correction phase was dynamically decided by the program based on the number of relevant shots already marked in the first phase. For example, if there are already 400 images marked in the first phase, RSVP program will stop at 11 minutes to make sure there is enough time for the participant to correct the judgments.
Keyhole RSVP is ranked 4th among all TRECVID 2005 interactive runs. While so far no existing video retrieval system has adopted RSVP as a user interface, we would argue that RSVP is a very suitable interface for XVR. First of all, RSVP is an interface specifically designed to present images rapidly, which exactly match the goal of pushing human extremes. Second, keyhole mode requires less cognitive resources to extract image content because no eye movements are required. Other sophisticated RSVP interfaces such as grid or collage demand eye movements and increase the risk of failing to keep up with the images not in the eye fixation. Third, RSVP automatically update the display area with next images in the sequence without manually paging, which save energy and attention from pressing extra keys for paging. Fourth, variable speed allows users to adjust the presentation speed. There are several reasons why we need variable speed RSVP instead of fixed speed version. If we take the first derivatives of the optimal curve in Figure 5 we will observe the rate of relevant images occurring in the sequence is not constant. There are more relevant shots in the top-rank shots than lower. Therefore, it makes sense to allow slower speed for the top-ranked shots to reduce the chance of missing relevant shots while faster speed for the lower-ranked shots. Besides, users may get tired after a period of time and need to rest by reducing presentation speed.
A second RSVP run (skiing) used a 2 image simultaneous display on each page. Each key press then marked both images on the current page, as well as the two images on the previous page as relevant, requiring four images to be verified in the validation/correction phase. Since there were more images to mark, subjects found themselves frequently not able to correct all images selected during the initial RSVP phase.
Manual Browsing in XVR
Manual Browsing with Resizing Pages (MBRP) is a strategy for interactive search, which achieved 40.7% mean average precision in TRECVID 2005 and was ranked No.2 among all the interactive submissions. Similar to RSVP, the basic idea of MBRP is to let human users to sequentially browse the computer-ranked results (shots) for each query and judge and label as many correct shots as possible within the 15 minutes. However, unlike the RSVP mode where a uniform page size (i.e., number of shots per page) is adopted throughout the whole search process, the underlying belief of MBRP is that adapting the page size according to the percentage of relevant shots (which is basically decreasing) is efficient. Specifically, at the beginning stage where the relevant shots are frequent, we prefer to use small page size since there are likely multiple relevant shots appearing in one page, which demands more attention (per shot) and key presses to label them. Later when the relevant shots become infrequent or rare, we increase the page size since there are unlikely multiple relevant shots even in a large page. The key of this method is to reduce the overhead of page turning by using the largest possible pages that avoid too many relevant shots in one page, which is not time-efficient to label given the limitation of human attention and the interaction tools (keyboard).
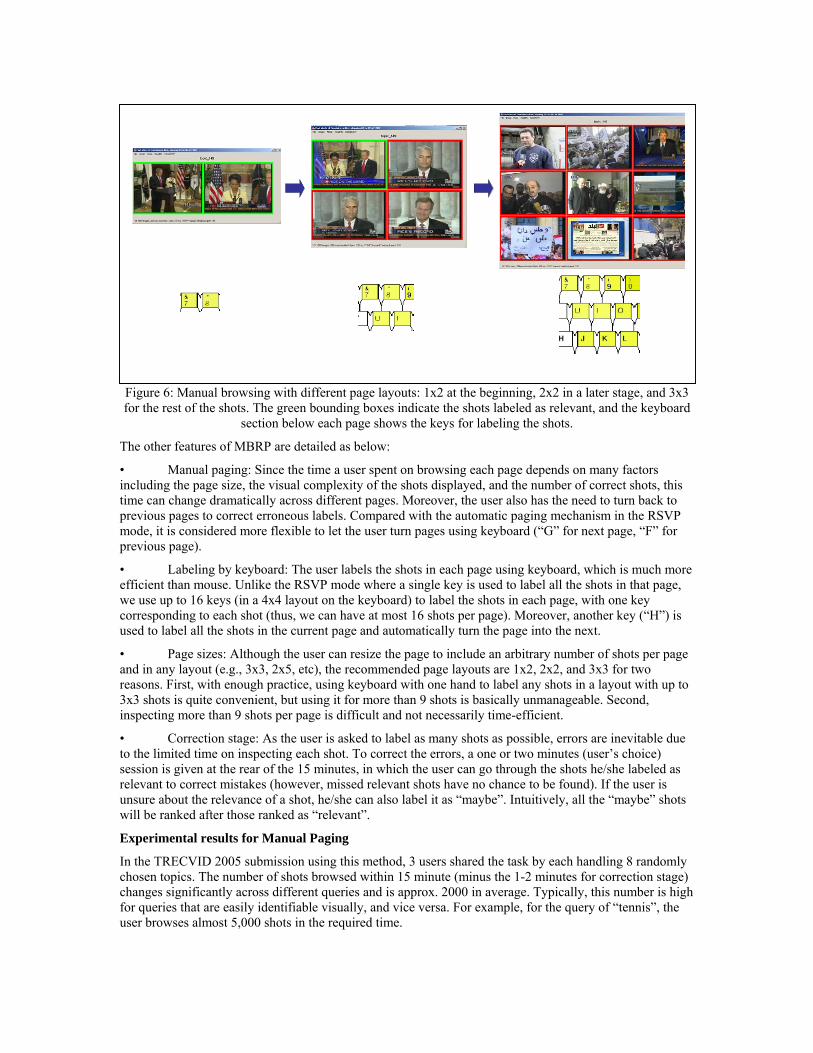
Figure 6: Manual browsing with different page layouts: 1x2 at the beginning, 2x2 in a later stage, and 3x3 for the rest of the shots. The green bounding boxes indicate the shots labeled as relevant, and the keyboard
section below each page shows the keys for labeling the shots.
The other features of MBRP are detailed as below:
• Manual paging: Since the time a user spent on browsing each page depends on many factors including the page size, the visual complexity of the shots displayed, and the number of correct shots, this time can change dramatically across different pages. Moreover, the user also has the need to turn back to previous pages to correct erroneous labels. Compared with the automatic paging mechanism in the RSVP mode, it is considered more flexible to let the user turn pages using keyboard (“G” for next page, “F” for previous page).
• Labeling by keyboard: The user labels the shots in each page using keyboard, which is much more efficient than mouse. Unlike the RSVP mode where a single key is used to label all the shots in that page, we use up to 16 keys (in a 4x4 layout on the keyboard) to label the shots in each page, with one key corresponding to each shot (thus, we can have at most 16 shots per page). Moreover, another key (“H”) is used to label all the shots in the current page and automatically turn the page into the next.
• Page sizes: Although the user can resize the page to include an arbitrary number of shots per page and in any layout (e.g., 3x3, 2x5, etc), the recommended page layouts are 1x2, 2x2, and 3x3 for two reasons. First, with enough practice, using keyboard with one hand to label any shots in a layout with up to 3x3 shots is quite convenient, but using it for more than 9 shots is basically unmanageable. Second, inspecting more than 9 shots per page is difficult and not necessarily time-efficient.
• Correction stage: As the user is asked to label as many shots as possible, errors are inevitable due to the limited time on inspecting each shot. To correct the errors, a one or two minutes (user’s choice) session is given at the rear of the 15 minutes, in which the user can go through the shots he/she labeled as relevant to correct mistakes (however, missed relevant shots have no chance to be found). If the user is unsure about the relevance of a shot, he/she can also label it as “maybe”. Intuitively, all the “maybe” shots will be ranked after those ranked as “relevant”.
Experimental results for Manual Paging
In the TRECVID 2005 submission using this method, 3 users shared the task by each handling 8 randomly chosen topics. The number of shots browsed within 15 minute (minus the 1-2 minutes for correction stage) changes significantly across different queries and is approx. 2000 in average. Typically, this number is high for queries that are easily identifiable visually, and vice versa. For example, for the query of “tennis”, the user browses almost 5,000 shots in the required time.

0
0.1
0.2
0.3
0.4
0.5
0.6
0.7
0.8
0.9
1
149 150 151 152 153 154 155 156 157 158 159 160 161 162 163 164 165 166 167 168 169 170 171 172Query topics
Ave
rage
pre
cisi
on
Best InteractiveMBRPInformedia ClientRSVP
Figure 7: Average precision of four interactive search submissions on each of the 24 query topics.
The MBRP run achieved the mean average precision (MAP) of 0.408, which is ranked the second among totally 50 the interactive submissions and is only marginally behind the best run (MAP = 0.414). It outperformed the submission using Informedia client (InfClient for short) (MAP = 0.386) and RSVP method (MAP = 0.366). Figure 7 shows the average precision of these 4 methods on the 24 query topics. Some interesting observations are made below:
There is a strong correlation between the MBRP and RSVP method, indicated by the large correlation coefficient 0.963 between the average precisions of the two methods. This means they are likely to perform well or poorly together, which is reasonable since both methods let user browse through the computer-ranked results.
In contrast, the correlation on performance between MBRP and InfClient (coeff. = 0.872) and between RSVP and InfClient (coeff = 0.862) is weaker because InfClient allows users to look for relevant shots using various search facilities including text search, image search, and various filters.
It is interesting to examine when MBRP succeeds and fails compared with InfClient, which has something to do with the difficulty of each query measured by how well computer (automatic method) is able to process the query. The correlation coefficient between MBRP and our best automatic submission is 0.741. While this is somehow expected as MBRP uses the output of the automatic search, this automatic run also has a positive correlation with coefficient 0.10 with the improvement of MBRP over InfClient. This means when the computer can handle the query well, MBRP is likely to outperform InfClient, or a quick and simple-minded user is more effective than a smarter one, and vice versa.
A second version of MBRP reranked the top 5000 images from the automatic run for each topic based on common story segments. This provided a form of semantic clustering, where sequences of images tended to be ‘related’ by the story. However, it did not yield better performance than the other MBRP run.
E. TASK: The BBC Stock Footage To study how cinematographers might use the BBC corpus and what tools would facilitate that use we brought in a professional documentary filmmaker. This filmmaker has a sizeable personal collection of raw footage and is familiar with and has used stock footage services.
Using a combination of Contextual Inquiry and Grounded Theory, the filmmaker was observed as he browsed and viewed the BBC footage. He described what he saw in the scene, how he might use the scene, and how he judged the quality of the scene. He frequently described scenes in iconological [3] terms (e.g. a scene with a tightrope walker was portraying ‘culture’) and pre-iconographic terms (e.g. a group of people listening to a speaker). However other descriptions tended to be outside the Panofsky/Shatford mode/facet matrix (e.g. a scene with the frame taken up completely by a colorful hot air balloon envelope was a “strong graphic”) or at a low syntactic feature level (e.g. describing a shot as having bold lines and colors).
From these sessions emerged a description of the filmmaker’s needs, the video features relevant to the filmmaker, and the tools to support the use of the corpus.
In recording video for documentaries, shots are often ‘targets of opportunity,’ scenes that avail themselves at the time the filmmaker is present. Typically multiple shots of the same scene will be taken. The reason may be problems with a shot (e.g. an object enters the shot, focus was off, camera bumped…), the aperture is bracketed to be sure the ideal exposure is caught, or the filmmaker may be looking for just the right shot, among other reasons. These shots are labeled in the field and designated as ‘bye’ shots, shots the filmmaker thinks are the best. In professional filmmaking a ratio of 50 or even 100 minutes of captured video to 1 minute used in the final product is not unusual. During the editing process, access to the desired video is fairly straight forward. The images are fresh in the filmmaker’s mind and the field notes provide easy access to shots.
Frequently a filmmaker may want an image that was not captured during production and will look to pre-existing video as a source. When that video comes from a library that is familiar to the filmmaker, he or she often remembers a particular scene. Depending on the organization of the library, whether physical tapes or digital media, the search may be by date, show, place, or person. However, when the library is unfamiliar the search is less targeted. Filmmakers look for supporting images that help them tell their story and may ‘co-opt’ a scene to tell a different story than the original cinematographer had in mind. Ultimately, the produced video and the pre-existing shots are woven into a single visual story.
Many times during our sessions, the filmmaker said things like, “If I was telling a story about …, I could use this shot to suggest the… concept;” “This could work as an establishing shot for stories on…;” and “That could be a transition shot…” Alternately, the filmmaker would say, “I’m looking for a shot with motion in it to convey excitement.” When pressed he would say, it could be people moving, cars, or other man-made objects. His intent was to find a transition shot between juxtaposed concepts. Using shots in these fashions suggests that precise, detailed descriptions of the shots are not always required.
Each BBC shot has a short descriptive field in the associated database object. These descriptions are of the form, “cows in a field,” “under water shot in the Florida Keys,” and “juggler” (pre-iconographic). From the perspective of our filmmaker just as useful indexed descriptions would be “outdoor,” “water,” and “people,” that are even less descriptive than pre-iconographic.
Features of interest for our filmmaker include pans, zooms, camera movement, focus of foreground and background and visual composition. While the content of the shot is important, the quality of these features can be even more so. For example, images with strong lines and bold colors were described as “graphics” and could be used for a variety of purposes with the right voiceover. So the scene with the frame taken up completely by a colorful hot air balloon envelope, followed by a shot of people working to inflate the envelope might be used as a metaphor for teamwork in an entirely different context.
Our filmmaker was concerned with camera angle. It has been shown that camera angle strongly affects the understanding and retention of pictorial events, having predictable effects on viewers’ perception of the physical and personal characteristics of persons viewed, the recall of those characteristics, and the recall of the content of the story. For example, a camera angle low to the ground looking up will impart an impression of a strong, bold, aggressive, positive personal character. In other words, camera angle in a visual narrative is comparable to adjectives in a linguistic narrative.
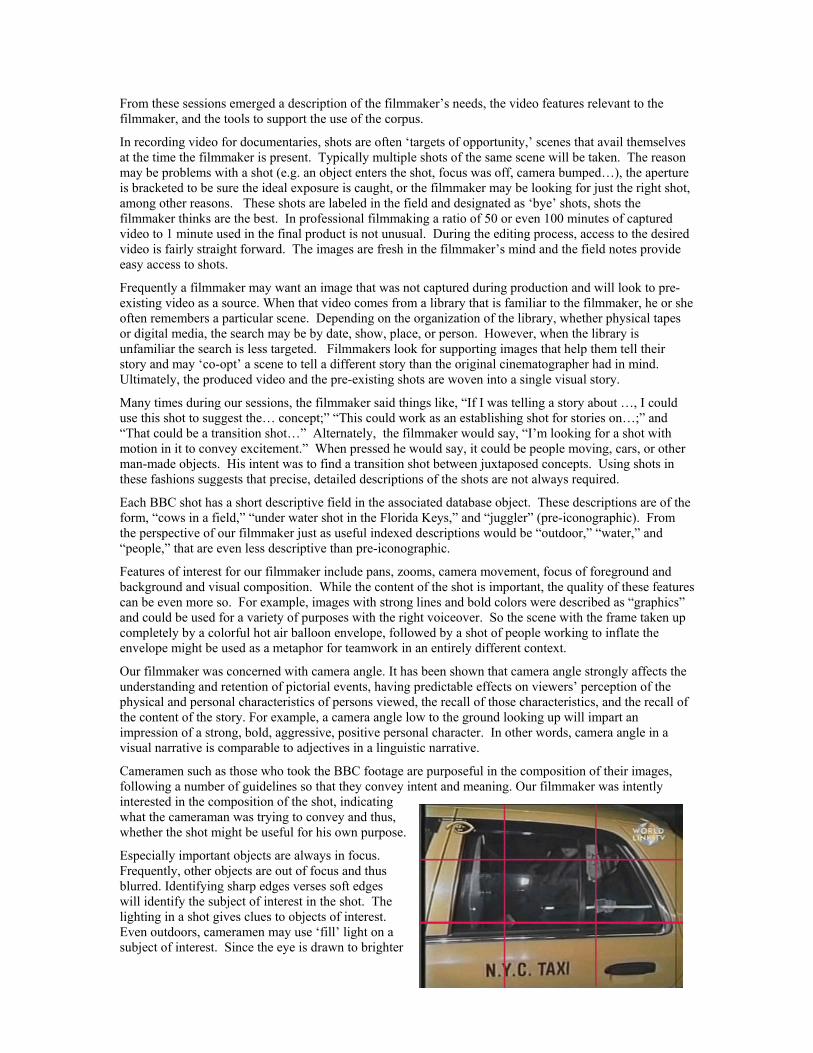
Cameramen such as those who took the BBC footage are purposeful in the composition of their images, following a number of guidelines so that they convey intent and meaning. Our filmmaker was intently interested in the composition of the shot, indicating what the cameraman was trying to convey and thus, whether the shot might be useful for his own purpose.
Especially important objects are always in focus. Frequently, other objects are out of focus and thus blurred. Identifying sharp edges verses soft edges will identify the subject of interest in the shot. The lighting in a shot gives clues to objects of interest. Even outdoors, cameramen may use ‘fill’ light on a subject of interest. Since the eye is drawn to brighter

areas of a scene, intensity, like focus, can also act as a metric of interest.
The Rule-of-Thirds can be used to identify where in the shot the cameraman felt the subject of interest is. This rule says to divide the image area into three evenly divided vertical and horizontal regions. The visual composition is strongest when the center of the object of interest falls at the intersection of these regions. Identifying objects at these locations can help determine what the cameraman was trying to emphasize.
Ultimately, we might expect a query like, “show me all the shots were a zoom ends on a strong man-made object outdoors.” Detecting features such as camera angle, camera pans, camera zooms, camera movement (dollies), objects in focus, objects out of focus, light intensity, and object location in the scene may enable professional filmmakers to query a corpus like the BBC and find useful shots.
ACKNOWLEDGMENTS This work was supported in part by the Advanced Research and Development Activity under contract numbers H98230-04-C-0406 and NBCHC040037.
REFERENCES [1] T. J. Hastie and R. J. Tibshirani. Generalized Additive Models. CRC Press, 1990. [2] R.Spence. Rapid, serial and visual: A presentation technique with potential. Information Visualization, 1(1):13–19, 2002. [3] Shatford, S.: Describing a Picture: A Thousand Words are Seldom Cost Effective. Cataloging & Classification Quarterly, 4(4) (1984,) 13-30 [4] A. Hauptmann, M.-Y. Chen, M. Christel, C. Huang, W.-H. Lin, T. Ng, N. Papernick, A. Velivelli, J. Yang, R. Yan, H. Yang, H. D. Wactlar, Confounded Expectations: Informedia at TRECVID 2004, Proceedings of (VIDEO) TREC 2004, Gaithersburg, MD, November 2004. [5] C.G.M. Snoek, M. Worring, J.M. Geusebroek, D.C. Koelma, F.J. Seinstra, The MediaMill TRECVID 2004 Semantic Viedo Search Engine, Proceedings of (VIDEO) TREC 2004, Gaithersburg, MD, November 2004. [6] M. Naphade, A Probabilistic Framework for Semantic Video Indexing, Filtering and Retrieval, IEEE Transactions on Multimedia, Volume 3, No. 1, pages 141-151, March 2001, Special Issue on Multimedia over IP. [7] J. Lafferty, A. McCallum, and F. Pereira, Conditional random fields: Probabilistic models for segmenting and labeling sequence data, International Conference on Machine Learning (ICML), 2001 [8] Christel, M., and Conescu, R. Addressing the Challenge of Visual Information Access from Digital Image and Video Libraries. Proc. ACM/IEEE Joint Conf. Digital Libraries (JCDL) (Denver, CO, June 2005), 69-78. [9] Christel, M., and Moraveji, N. Finding the Right Shots: Assessing Usability and Performance of a Digital Video Library Interface. Proc. ACM Multimedia (New York, NY, October 2004), 732-739. [10] Derthick, M. Interfaces for Palmtop Image Search. Proc. JCDL (Portland, OR, July 2002), 340-341. [11] Gao, J., Collins, R.T., Hauptmann, A., Wactlar, H., Articulated Motion modeling for Activity Analysis IEEE Computer Society Conference on Computer Vision and Pattern Recognition (CVPR'04), Workshop on Articulated and Nonrigid Motion (ANM'04), Washington, DC, vol. 1, pp. 20, July 27-July 2, 2004 [12] Jin, R. ,Qi, Y., and Hauptmann, A., A probabilistic model for camera zoom motion detection, The 16th conference of the International Association for Pattern Recognition (ICPR 2002) Québec City,Canada August 11-15 2002 [13] Stephan Vogel, Ying Zhang, Fei Huang, Alicia Tribble, Ashish Venogupal, Bing Zhao, Alex Waibel, "The CMU Statistical Translation System," in Proceedings of MT Summit IX, New Orleans, LA, U.S.A., September 2003.
Appendix I. Query Keywords Query ID Automatic Keywords Manual Keywords 149 Condoleezza Rice Condoleezza Rice Secretary 150 Iyad Allawi Allawi 151 Omar Karami Karami 152 Hu Jintao Hu Jintao 153 Tony Blair Blair "Tony Blair" 154 Mahmoud Abbas Abu Mazen Abbas "Mahmoud Abbas" Mazen 155 map Iraq Baghdad Baghdad Mosul
156 tennis tennis ATP WTA Serena Venus Williams Hewitt Roddick Agassi Safin Davenport Sharapova
157 shake hands "shake hands" "shaking hands" "shook hands"

158 helicopter helicopter 159 George Bush Bush 160 fire flame smoke fire flame 161 banners signs slogan banners march demostration 162 people building enter building "walk out" building 163 meeting roundtable meeting carbinet meeting United Nation meeting 164 ship boat ship boat ferry smuggling vessels
165 basketball basketball NBA "Yao Ming" "Phoenix Suns" celtics "Sacramento Kings" "Alan Iverson" Sixers Shaquille Lakers "Larry Brown" "Mike Bibby" Spurs
166 palm trees palm beach 167 airplane airplane hijack pilot delta "United airlines" "US Airways" 168 road cars cars road 169 tanks, military vehicles tank "military vehicles" 170 building tall building skyscraper 171 soccer goal "winning goal" "World Cup" "Football Cup" "European Cup" "Union Cup" 172 office table computer office computer