Cloud Seeding-DM-Sri Lanka2012
11
Weather Modification as a Tool for Disaster Management - An Indian Case study IV Muralikrishna 1 and Valli Manickam 2+ 1. Former Professor , JNT University, Hyderabad and Adjunct Professor, Asian Institute of Technology, Bangkok, Thailand 2. Chairperson, Environment Area, ASCI, Hyderabad, India Abstract Weather modification experiments are useful during drought situations wherever feasible. The studies carried out in India for creation of rainfall are discussed here . These experiments were carried out in 12 districts of Andhra Pradesh. The experiments involved primarily treatment of warm clouds in the monsoon season with hygroscopic cloud condensation nuclei (CCN) to enhance precipitation in the region. The cloud condensation nuclei used was calcium chloride in the particle size range of 1.0 microns to 10 microns. Radar data and ground truth were used to evaluate the impact of inducing the cloud condensation nuclei into the cloud bases using aircrafts. The Index of Coalescence Activity (ICA) has been developed for all the 10 districts as a predicator of the cloud collision coalescence activity. The data was found to be in the range on the positive side from +4.7 to as high as +23.2 indicating that warm cloud seeding mechanism has to be followed for tropical conditions. The regression equations were calculated and GIS based maps were drawn to analyze the influence zone and evaluate extent of precipitation enhancement. Statistical methods such as single ratio, double ratio method, impact coefficient, target control and downwind comparisons are used to arrive at the percentage increase in rainmass over this region. This paper details the operations and results in 12 districts for the period 2005-2007 with specific reference to Anantapur district. The results clearly indicate that the mechanism of precipitation enhancement in this region of India is through the coalescence process. Key words:- Index of coalescence activity, hygroscopic seeding, cloud condensation nuclei, impact coefficient Introduction
Transcript of Cloud Seeding-DM-Sri Lanka2012
Weather Modification as a Tool forDisaster Management - An Indian Case
study
IV Muralikrishna1 and Valli Manickam2+
1. Former Professor , JNT University, Hyderabad and Adjunct Professor, Asian Institute of Technology, Bangkok, Thailand
2. Chairperson, Environment Area, ASCI, Hyderabad, India
Abstract
Weather modification experiments are useful during drought situationswherever feasible. The studies carried out in India for creation ofrainfall are discussed here . These experiments were carried out in 12districts of Andhra Pradesh. The experiments involved primarilytreatment of warm clouds in the monsoon season with hygroscopic cloudcondensation nuclei (CCN) to enhance precipitation in the region. Thecloud condensation nuclei used was calcium chloride in the particle sizerange of 1.0 microns to 10 microns. Radar data and ground truth wereused to evaluate the impact of inducing the cloud condensation nucleiinto the cloud bases using aircrafts. The Index of Coalescence Activity(ICA) has been developed for all the 10 districts as a predicator of thecloud collision coalescence activity. The data was found to be in therange on the positive side from +4.7 to as high as +23.2 indicating thatwarm cloud seeding mechanism has to be followed for tropical conditions.The regression equations were calculated and GIS based maps were drawnto analyze the influence zone and evaluate extent of precipitationenhancement. Statistical methods such as single ratio, double ratiomethod, impact coefficient, target control and downwind comparisons areused to arrive at the percentage increase in rainmass over this region.This paper details the operations and results in 12 districts for theperiod 2005-2007 with specific reference to Anantapur district. Theresults clearly indicate that the mechanism of precipitation enhancementin this region of India is through the coalescence process.
Key words:- Index of coalescence activity, hygroscopic seeding, cloud condensation nuclei, impact coefficient
Introduction

Drought is one of the major disasters faced by humankind in many partsof the world. For overcoming the drought related problems some sort ofweather modification through Cloud seeding could provide some partialsolution under suitable conditions. Clouds are formed and developed,depending on the environment and the type of Cloud Condensation Nuclei(CCN) distribution made available to the system. The possibility ofaffecting the condensation / collision – coalescence / break up growthprocesses by seeding the cloud with either hygroscopic material or withsmall water droplets, thereby tapping the potential precipitationefficiency of the cloud system leading to rain enhancement is examinedduring cloud seeding. Precipitation efficiency is the percentage ofcondensed water within a cloud system that reaches the ground asprecipitation. Countries like China, Thailand, USA etc. have practicedcloud seeding technologies and have achieved a fairly large increase inprecipitation. It was found that the growth of large clouds can beachieved artificially by inducing cloud condensation nuclei. Specialradar has been developed to study development in clouds (Bringi et al1989). Computer software has been used with conventional radar to trackradar cells and quantify the increased merging caused by cloud seeding(Rosenfield 1987, Westislt 1990, Reinking et al. 1992). Warm stratusclouds give widespread rainfall at moderate intensity. They are presumedto operate on a coalescence mechanism because the cloud tops do not getadequately high and cold for development of ice crystals. Seeding aimsto introduce large calcium chloride particles in to the cloud base sothat they will nucleate condensation and result in large average dropletsize which will then coalesce to produce rain. The technique ofhygroscopic seeding to enhance rainfall by promoting the coalescenceprocess has not received as much attention as AgI seeding. However,studies by Bruintjies et al, 1999 has suggested that hygroscopic seedinginstills dynamic effects on convection clouds. Mather et al 1997 foundthe coalescence process initiated by cloud condensation nuclei couldalso be transmitted to other clouds in the mesoscale convective clusteralso.
Study areaThe cloud seeding experiments were carried out in 12 districts viz.Ananthapur, Chittoor, Kadapa, Kurnool, Medak, Mahaboobnagar, Prakasham,Guntur, Nalgonda, Karimnagar, Nellore and Ranga Reddy (Fig. 1a).Anantapur is located at 14.68° N 77.6° E (Fig.1b). It has an averageelevation of 335 metres (1099 feet). This District is coined to be thearea wise biggest district in Andhra Pradesh. The Boundaries ofAnantapur district are Cuddapah district.
Fig. 1a Study area, 12 districts of Andhra Pradesh
Fig.1b Anantapur District, showing various studies administrative boundries.

Methodology
Volume scan data from 5cm C band radar at 5min intervals were used totrack each operation, from which the various radar estimated parameterswere obtained. The statistical evaluation of the experiment was based onanalysis of the seeded to unseeded experimental unit lifetime propertiesusing Single ratio, double ratio and root double ratio methods. Theindex of coalescence Activity (ICA) has been developed as a predictor ofin cloud collision coalescence activity using an atmospheric upper airsounding. Index of coalescence activity was calculated using the formulaICA = 8.6 – TCCL + 1.72 (PB). The ICA is a summation of the collision andcollection efficiency, which results in the coalescence efficiency.Strautins et al (1999) documented the physics involved in the derivationof the index of coalescence activity and its relation to coalescenceactivity. The temperature at the convective condensation level (TCCL) anapproximation of the cloud base temperature and the PB is defined asthe temperature difference at 500mb (18000ft msl) between thepseudoadiabat that runs through the cloud base and the environmentaltemperature. This data is retrieved from the atmospheric upper airsounding. The number of positive vs. negative ICA ratio values showsthat there are a good number of opportunities to do hydroscopic seeding.Hygroscopic seeding is needed when ICA values are high and positive.This would make it possible to increase the level of success byintroducing hygroscopic seeding to promote coalescence in continentalclouds that have weak coalescence increasing the efficiency of rainbearing clouds and eventually rainfall. The possibility of increasingrainfall from warm convective clouds by cloud base release ofhygroscopic particles is to promote the drizzle, which grows into rainby coalescence technology. As reported by Cotton and Pielke (1995) thepredominant process for precipitation formation in warm clouds iscollision and coalescence.
Mather et al 1997 reported that the smaller cloud systems appeared torespond to treatment first, the medium size cloud systems a little
Fig.1b Anantapur District, showing various studies administrative boundries.
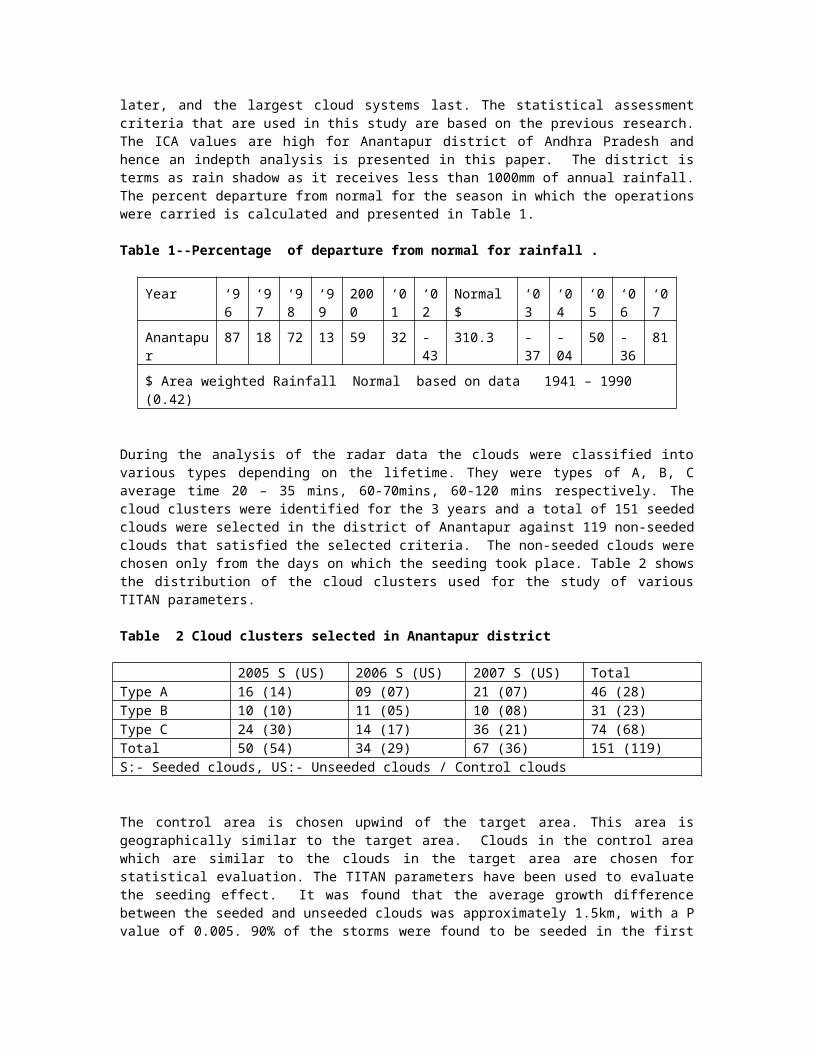
later, and the largest cloud systems last. The statistical assessmentcriteria that are used in this study are based on the previous research.The ICA values are high for Anantapur district of Andhra Pradesh andhence an indepth analysis is presented in this paper. The district isterms as rain shadow as it receives less than 1000mm of annual rainfall.The percent departure from normal for the season in which the operationswere carried is calculated and presented in Table 1.
Table 1--Percentage of departure from normal for rainfall .
Year ‘96
‘97
‘98
‘99
2000
‘01
‘02
Normal $
‘03
‘04
‘05
‘06
‘07
Anantapur
87 18 72 13 59 32 -43
310.3 -37
-04
50 -36
81
$ Area weighted Rainfall Normal based on data 1941 – 1990 (0.42)
During the analysis of the radar data the clouds were classified intovarious types depending on the lifetime. They were types of A, B, Caverage time 20 – 35 mins, 60-70mins, 60-120 mins respectively. Thecloud clusters were identified for the 3 years and a total of 151 seededclouds were selected in the district of Anantapur against 119 non-seededclouds that satisfied the selected criteria. The non-seeded clouds werechosen only from the days on which the seeding took place. Table 2 showsthe distribution of the cloud clusters used for the study of variousTITAN parameters.
Table 2 Cloud clusters selected in Anantapur district
2005 S (US) 2006 S (US) 2007 S (US) Total Type A 16 (14) 09 (07) 21 (07) 46 (28)Type B 10 (10) 11 (05) 10 (08) 31 (23)Type C 24 (30) 14 (17) 36 (21) 74 (68)Total 50 (54) 34 (29) 67 (36) 151 (119)S:- Seeded clouds, US:- Unseeded clouds / Control clouds
The control area is chosen upwind of the target area. This area isgeographically similar to the target area. Clouds in the control areawhich are similar to the clouds in the target area are chosen forstatistical evaluation. The TITAN parameters have been used to evaluatethe seeding effect. It was found that the average growth differencebetween the seeded and unseeded clouds was approximately 1.5km, with a Pvalue of 0.005. 90% of the storms were found to be seeded in the first

20mins after decision time and therefore except in the case of the TypeA clouds the rain flux differences in the first 10mins would not benormally attributed to the seeding. Silverman et al 1994 has indicatedthat large hygroscopic particle seeding leads to improved precipitationefficiency of the warm convective clouds. Bruintjes et al 1999 alsofound that seeded clouds tended to live longer than unseeded clouds inthe Mexico experiment. Table 4 gives the details of the 13 TITANderived parameters. It can been seen from Table 4 that the efficiencyin Type The percentage of rain rate for A clouds is 66, B type cloudsis the highest at 93, while for C type cloud is the lowest of 3indicating that the clustering has an definitive impact on the rainrate. Similar results have been reported Mather et al (1997) in whichstatistical evidence that hygroscopic flare seeding increased rain massin the experiment.
Silverman and Sutkarnjanaset 2000 have shown that the seeding near cloudbase with calcium chloride particles produced larger seed/ no seedratios than near cloud top seeding and that the seed / no seed ratiosincrease with increasing concentration or dosage. Table 5 shows theaverage precipitation fluxes (m3/ sec) data and its relation to maximumheight of the cloud. For a subset of control and seeded samples ananalysis of the anvil losses (top debris) was carried out to study thelifetime of the top debris. It was found that for the seeded clouds hada height of 7.2 km, while for the control cloud this value is 7.1 km,for a difference of 0.1 km = 328 feet. The average top debris of thesingle seeded clouds was higher than the top debris of the correspondingcontrol clouds, which indicates that there is considerable loss ofmoisture at the top level.

Table 4 Average data for the cloud clusters
TYPE A CLOUDS TYPE B CLOUDS TYPE C CLOUDS
Variables Seeded(S)
Unseeded (US) S Vs US
[%] Increase
Seeded (S)
Unseeded (US)
S Vs US
[%] Increase
Seeded (S)
Unseeded (US)
S VsUS
[%] Increase
Time [min] 35 20 1.75 75 69 65 1.06 6 126 64 1.97 97
Area [Km2] 53.6 15.8 3.39 239 85.17 66.21 1.29 29 159.27
120.93 1.32 32
Volume [Km3] 242.75 55.6 4.36 336 352.08
281.42 1.25 25 741.6
2484.86 1.53 53
C. Top [Km] 8.27 4.94 1.67 67 6.73 5.94 1.13 13 8.5 7.8 1.08 8C.Mass [Kilotons] 110.75 27 4.1 310 164.8
6108.73 1.51 51 319.8
6 234.4 1.36 36
P. Flux [m3/Sec] 128.62 39.8 3.23 223 232.1
7129.84 1.79 79 378.7
2303.33 1.25 25
P mass [K.tons] P Flux *Life time
270.10 47.76 5.65 465 1476.6 646.6 2.28 128 2863.
11164.78 2.46 146
VIL [Kg/m2] 6.11 3.4 1.79 79 8.36 4.48 1.86 86 8.65 10.52 0.8 20C.Thick. [Km] 6.95 4.34 1.60 60 5.64 4.54 1.24 24 7.11 6.54 1.09 9LWC [VIL/Thick] (gm/m3)
0.9 0.78 1.15 15 1.48 0.98 1.51 51 1.2 1.6 0.75 25
Efficiency[P MASS/C.MASS]
2.44 1.76 1.38 38 8.96 5.94 1.50 50 8.95 5.1 1.75 75
Rain =P Mass/ Area [Mm]
5.04 3.02 1.66 66 17.34 5.77 3.0 200 17.97 9.63 1.87 87

Rain rate =[[Z/200] **.625] {mm/hr}
24.09 14.51 1.66 66 27.86 14.45 1.93 93 26.76 27.58 0.97 3

Table 4 Average Precipitation fluxes (m3/ sec) vs height of the cloud
Max Height (km)
Seeded mean precipitation flux(m3/ sec)
Max height (km)
unseeded mean precipitation flux(m3/sec)
Seed / unseed ratio
8.0 128 5.0 40 3.26.5 232 6.0 130 1.88.5 378 7.8 303 1.24
Results from the TITAN data has shown that there is significant increasein the amount of rainfall in Anantapur district due to the seedingoperations carried out for the last three years. The next attempt was tocalculate the increase in rainfall using ground truth measurements.Because of the problems associated with the highly skew nature of themonthly and seasonal rainfall distributions for each site and largeregional differences in rainfall, it was found beneficial to take thelong-term mean and standard deviation for each station (period 1960-2000) and then to standardise monthly or seasonal rainfall by expressingit as a ratio relative to the mean. Taking the logarithm of this ratiogives a clear indication of positive and negative anomalies within thedata and reduces strongly skew distributions to a more ‘normal’ form.

Rainfall w hen seeding w as carried out expressed as % departure from long term m ean values
-20
-10
0
10
20
30
40
June July August Septem ber O ctober
M onths
% departure
ControlTarget
Fig. 2 % departure from the long term mean values for target and controlcases.
Fig. 2 shows the simpler representation of the monthly rainfalls aspercentage variations from the long-term mean. It can be seen that thedistribution of monthly rainfall for a long-term station upwind of thetarget area, reveals the influence of mainly above average monthlyrainfalls.
Results indicate a greater efficiency in the seeded clouds, and theimportant feature that always the precipitation mass of a rain cloud isgreater than its cloud mass. The efficiency of ‘the average seededcloud’ as a rain factory was estimated around 10, which means that theprecipitation mass was 10 times the cloud mass, whereas for ‘the averagecontrol cloud,’ the corresponding value was only about 7. The relativeefficiency was then increased by 30%.
Table 5 % increase in rainfall for various cloud types in Anantapurdistrict
SR method DR method RDR method

%increase
Pvalue
%increase
Pvalue
%increase
Pvalue
Type A 17 0.30 13 0.16 15 0.008Type B 19 0.45 15 0.15 15 0.009Type C 21 0.42 23 0.13 24 0.002Single ratio [SR] indicates simple ratio between seed / no-seedDouble ratio [DR] (Gabriel 1999) Root double ratio [RDR] (Gabriel 1999)
Studies carried out by Fowler et al 2001, have shown that thedifferences between seeded and non-seeded rain mass were statisticallysignificant with the p-value <0.05. It was also found that the log ofrain mass data showed both the mean and median values of the seededgroup higher than those of the non seeded group.
ConclusionsCloud seeding operations have been carried in 12 districts of AndhraPradesh since 2003. This paper attempts to showcase the results forAnantapur district. ICA values were calculated for 12 districts, and thehighest was found to be districts of Anantapur, Kurnool and Nellore.Clouds were divided into type A, B and C and their efficiencies were ofthe order of 38, 50 and 75 respectively. Results have shown that thedifference for the anvil losses for seeded to unseeded was around 0.1km.The efficiency increase in the rain was estimated to be around 15-25%.
References
Braham RR Jr. 1979, Field experimentation in weather modification,J. Amer Stat. Assoc., 74, 57-104.
Bringi, N. Sur,S., Musil, D.,and Rasmussen, R.(1989)“Microphysical Evaluation of convective clouds Inferred fromMulti-Parameter Radar Measurements and Aircraft Penetrations.”Preprints, 24th conference on Radar Meteorology, Tallahassee, FL,AMS, Boston, MA,13-17.
Bruintjes RT, DW Breed, BG Foote, MJ Dixon, BG Brown, V Salazarand HR Rodriguez, 1999 Program for the augmentation of rainfall inCoahuila (PARC) Overview and design, Proc. Seventh WMO scienceconf. on weather modification, Chiang Mai, Thailand, WMO 53-56.
Cotton, W. R., and R. A. Pielke, (1995) “Human Impacts on Weatherand Climate”. Cambridge University Press, 288 pp.

Dixon, Michael, and Gerry Wiener, (1993) TITAN: ThunderstormIdentification, Tracking, Analysis, and Nowcasting - A Radar-basedMethodology. J. Atmos. and Oceanic Technol., 10, 6, 785-797.
Fowler TL, BG Brown and RT Bruintjes 2001 Statistical evaluationof a cloud seeding experiment in Coahuila, Mexico Preprints, 15th
Conf, on Planned and inadvertent weather modification, Amer.Meteor. Soc., 49-53.
Gabriel 2000 Planning and evaluation of weather modificationprojects, proc. Seventh WMO Science Conf on Weather modification,Chiang Mai, Thailand, Supplement, WMO 39-59.
Gabriel KR 1981, On the roles of physicists and statisticians inweather modification experimentation, Bull Amer Meteor. Soc 62,62-69.
Mather GK, DE Terblanche, FE Steffens, and L Fletcher 1997,Results of the South African cloud seeding experiments usinghygroscopic flares, J of Appl Meteor, 36, 1433-1447
Mather, G. K., M. J. Dixon, J. M. DeJager, 1996: Assessing thepotential for rain augmentation - The Nelspruit randomizedconvective cloud seeding experiment. J. Appl. Meteor., 35, 1465-1482.
Reinking, R.F., R.J. Meitin, F. Kopp, H.D. Orville and J.L. Stith,(1992), “Fields of motion and transport within a shearedthunderstorm”, Atmos. Research, 28(3/ 4), 197-226.
Rosenfield D (1987) “Objective method for tracking and analysis ofconvective cells as seen by radar “Journal of Atmospheric andOceanic Technology, Vol.4, Issue 3,422-434.
Silverman and Sutkarnjanaset 2000 Results of the Thailand warmcloud hygroscopic seeding experiment, J Appl Meteor, 39, 1160-1175
Silverman BA, CL Hartzell, WL Woodley, and D Rosenfeld 1994Thailand applied atmospheric research program vol, 2Demonstration, project design, Bureau of reclamation Rep. R-94-01US Department of the interior, 183 pp.