CLOSING THE CUSTOMER GAP THROUGH EFFECTIVE ...
168
CLOSING THE CUSTOMER GAP THROUGH EFFECTIVE EMPLOYEES by Johanna Maria Fourie Submitted in accordance with the requirements for the degree MAGISTER COMMERCII In the Faculty of Economic and Management Sciences Department of Business Management University of the Free State Bloemfontein, Republic of South Africa February 2015 Study leader: Dr JH van Zyl
-
Upload
khangminh22 -
Category
Documents
-
view
2 -
download
0
Transcript of CLOSING THE CUSTOMER GAP THROUGH EFFECTIVE ...
CLOSING THE CUSTOMER GAP THROUGH EFFECTIVE EMPLOYEES
by
Johanna Maria Fourie
Submitted in accordance with the requirements for the degree
MAGISTER COMMERCII
In the
Faculty of Economic and Management Sciences
Department of Business Management
University of the Free State
Bloemfontein, Republic of South Africa
February 2015
Study leader: Dr JH van Zyl

i
DECLARATION
I declare that the thesis hereby submitted by Johanna Maria Fourie for the degree
Magister Commercii at the University of the Free State is my own independent work
and has not previously been submitted by me at another university/faculty. I
furthermore cede copyright of the thesis in favour of the University of the Free State.
__________________________ _______________
JM Fourie Date
ii
ACKNOWLEDGEMENTS
A special word of thanks to the following persons:
Dr Johan van Zyl, my study leader, for his patience, guidance and support.
Dr Pierrie Nel and Mr Alex Coetzee, for the statistical analysis of the data.
Mrs Marie-Therese Murray, for the language editing of the thesis.
To my family, thank you for your encouragement and support, but most of all for your
love.
To all my friends, thank you for your friendship and support and for always lending a
helpful hand and a willing ear.

iii
DEDICATION
I dedicate this thesis to the following:
In loving memory of my late father.
And my two loyal and loveable study buddies Jabez and Lalliepot who keep me
company.

iv
TO WHOM IT MAY CONCERN
This is to confirm that I have edited Marina Fourie’s Masters dissertation, entitled
CLOSING THE CUSTOMER GAP THROUGH EFFECTIVE EMPLOYEES
for language use and technical aspects.
Marie-Therese Murray
Mobile phone: 0828180114
2 February 2015

v
ABSTRACT
This study attempts to contribute to the current knowledge to determine the factors
that influence front-line employees in delivering a sustainable quality service.
It is nearly impossible to deliver a quality service without loyal and satisfied front-line
employees who, through a service encounter, determine the level of service quality
delivered. These employees form an integral part of the competitive advantage of a
service organisation and play a crucial, bridging role in company growth.
However, some variables influence front-line employees’ effectiveness, for example
personal and professional circumstances.
Customer expectations are critical towards the evaluation of a service; therefore,
customers have different levels of expectation. Factors such as front-line employee
commitment, loyalty and satisfaction influence customers’ perception of the quality of
service provided. In addition, customer satisfaction impacts on customer loyalty,
which, in turn, directly affects the financial results of an organisation.
In cases when expectations are not met, customers are dissatisfied, thus causing a
gap between the customer and the service organisation. This “gap”, called the
“Customer Gap” or the “Service Quality Gap” (in the Gaps Model of Service Quality),
is the difference between what the customer expects and his/her perception of the
service. However, in order to close the Customer Gap, the Provider Gap (consisting
of Gaps 1 to 4) needs to be closed first.
Front-line employees, customers and intermediaries (for example, suppliers) mostly
influence the Service Performance Gap (Gap 3), which occurs when there is a
discrepancy between specifications and service delivery. It is, therefore, evident that
front-line employees play an important role in the closure of the Service Performance
Gap; such closure depends on their attitude, competencies, skills, commitment, trust,
communication and work in a complex relationship.

vi
A literature review was conducted where-after two different questionnaires were
developed. Open-ended questions and Likert-scale questions were used. To this
end, the questionnaires were distributed at branches within AVBOB. The sample
consisted of front-line employees and managers who were in the service of AVBOB
from the beginning of June 2013 to the end of November 2013. Statistical measures
such as descriptive statistics were used.
It was found that the following professional circumstances influence front-line
employees’ effectiveness: qualification, training, rewards, organisational benefits,
work stress and workload. The following personal circumstances were identified,
namely “front-line employee transport system”, “residing area”, and the fact that
some front-line employees do not always have clean clothes to wear. In addition,
front-line employees experience conflict between their work and family
responsibilities. These circumstances can, therefore, be argued as critical for the
management of effective front-line employees and service quality.
Although other factors might also influence front-line employees’ effectiveness, the
factors identified may provide management with focal points for the management of
front-line employees. To this extent, the Gaps Model of Service Quality should be
used to guide management to find the reasons for quality issues. This useful model
also needs to be used to identify appropriate ways in which to close the Customer
Gap.
Keywords: customer gap
customer loyalty
customer satisfaction
front-line employees
gaps model of service quality
service performance gap
service quality

vii
LIST OF DEFINITIONS
Customer Gap
“the difference between customer expectations and perceptions” (Zeithaml et al.,
2009: 32).
Customer loyalty
“the behavioural intentions of the customer and the likelihood that he or she will
return to the organization” (Kotler and Keller, 2009: 163).
Customer satisfaction
“the degree of satisfaction provided by the goods or services of an organisation as
measured by the customer” (Zeithaml et al., 2009: 110).
Front-line employees
“those employees who interact with customers directly” (Grönroos, 2007: 365).
Gaps Model of Service Quality
“a framework to understand and improve service delivery” (Zeithaml et al., 2009: 31).
Service Performance Gap
“the difference between customer-driven standards and actual performance by front-
line employees” (Zeithaml et al., 2009: 38).
Service quality
“customer’s assessment or perception of how well a service is delivered or
performed” (Boshoff and du Plessis, 2013: 13).

viii
UITTREKSEL
Hierdie studie poog om ‘n bydrae te lewer tot die huidige literatuur deur te bepaal
watter faktore ‘n invloed het op kontakwerkers in die lewering van ‘n volhoubare
kwaliteit diens.
Dit is feitlik onmoontlik om ‘n kwaliteit diens te verskaf sonder lojale en tevrede
kontakwerkers. Deur hul diensverskaffingsinteraksie met die kliënt bepaal hierdie
werkers die kwaliteit van diens gelewer. Hulle vorm ‘n integrale deel van die
organisasie se mededingende voordeel en speel ook ‘n kritieke rol in die groei van
die organisasie deurdat hulle ‘n oorbruggingsrol vervul. Daarom het die effektiwiteit
van hierdie werkers ook ‘n direkte invloed op die kwaliteit van diens wat gelewer
word.
Verskeie faktore, soos byvoorbeeld persoonlike en professionele omstandighede,
beïnvloed die effektiwiteit van kontakwerkers.
Kliënte is krities met hul evaluering van ‘n diens en het verskillende vlakke van
verwagtinge van ‘n diens. Faktore soos die kontakwerker se vertroue, lojaliteit en
werksbevrediging het wel ‘n invloed op die kliënt se persepsie van die diens. Dus,
die kliënt se tevredenheid beïnvloed kliëntlojaliteit wat weer ‘n direkte invloed het op
die finansiële resultate van die organisasie.
Wanneer daar nie aan kliënte se verwagtinge voldoen word nie is hulle ontevrede en
ontstaan daar ‘n “gaping” tussen die kliënt en die diensleweraar. Hierdie “gaping”,
naamlik die Kliëntegaping, is dus die verskil tussen wat die kliënt verwag en sy/haar
persepsie van die diens wat sy/hy ontvang. Dus, om hierdie gaping te sluit, moet die
Voorsieningsgaping wat uit Gapings 1 tot 4 bestaan, eers gesluit word.
Die Dienste Werkverrigtingsgaping (Gaping 3), wat dus ontstaan wanneer daar ‘n
teenstrydigheid is tussen diensspesifikasies en die diens wat gelewer is, word die
meeste beïnvloed deur kontakwerkers, kliënte en tussengangers (byvoorbeeld
verskaffers). Dit is dus baie duidelik dat kontakwerkers ‘n belangrike rol speel in die

ix
sluiting van die Dienste Werkverrigtingsgaping (Gaping 3), omdat die sluiting van
hierdie gaping grotendeels afhang van hul houding, vaardighede, bevoegdheid,
toewyding, vertroue, kommunikasie en werk in ‘n komplekse verhouding.
‘n Literatuurstudie is gedoen waarna twee verskillende vraelyste opgestel is. Oop
vrae sowel as Likertskaal-vrae is gebruik. Die vraelyste is aan verskillende AVBOB-
takke gestuur. Die teikengroep vir die studie was kontakwerkers en bestuurders in
die diens van AVBOB vanaf begin Junie 2013 tot einde November 2013. Die
statistieke metingsinstrument wat gebruik is, sluit in beskrywende statistiek, breuke
en korrelasies.
Bevindinge dui aan dat faktore soos kwalifikasie, opleiding, erkenning,
organisasievoordele, werkstres en werklading die grootste invloed op kontakwerkers
se professionele omstandighede het. Persoonlike omstandighede sluit in
kontakwerkers se vervoersisteem en woonarea terwyl sommiges nie altyd skoon
klere het om aan te trek nie. Kontakwerkers beleef ook konflik tussen hul persoonlike
verpligtinge en werksverpligtinge. Daarom kan daar geargumenteer word dat hierdie
faktore ‘n kritieke rol in die bestuur van effektiewe kontakwerkers en kwaliteitdiens
speel.
Laastens, alhoewel daar ook ander faktore mag wees wat die effektiwiteit van
kontakwerkers kan beïnvloed, kan die faktore wat geïdentifiseer is as fokuspunt vir
die bestuur van effektiewe kontakwerkers dien. Juis daarom moet die Gapings
Model vir Diensleweringskwaliteit aangewend word om bestuur te lei om redes te
bepaal vir dienste probleme. Hierdie uiters handige model moet ook gebruik word
om toepaslike maniere te vind om die Kliëntegaping te sluit.
TABLE OF CONTENTS
CHAPTER 1 ............................................................................................................... 1
INTRODUCTION .................................................................................................... 1
1.1 INTRODUCTION AND BACKGROUND TO THE STUDY ......................... 1
1.2 PROBLEM STATEMENT ........................................................................... 7
1.3 RESEARCH OBJECTIVES OF THE STUDY ............................................ 7
1.4 METHODOLOGY ....................................................................................... 8
1.5 ETHICAL CONSIDERATION ................................................................... 11
1.6 CONTRIBUTION OF THE RESEARCH ................................................... 11
1.7 CHAPTER LAYOUT ................................................................................ 12
CHAPTER 2 ............................................................................................................. 13
THE GAPS MODEL IN SERVICE DELIVERY ...................................................... 13
2.1 INTRODUCTION AND BACKGROUND .................................................. 13
2.2 SERVICE CULTURE ............................................................................... 15
2.3 CUSTOMER SATISFACTION ................................................................. 22
2.4 THE ROLE AND IMPORTANCE OF SERVICES ..................................... 25
2.5 SERVICE QUALITY AS A COMPETITIVE ADVANTAGE ....................... 28
2.6 CUSTOMERS’ EXPECTATIONS OF SERVICES.................................... 32
2.7 CUSTOMERS’ PERCEPTIONS OF SERVICES...................................... 34
2.8 THE RELEVANCE OF CUSTOMER RETENTION AND CUSTOMER LOYALTY .......................................................................................................... 35
2.9 THE GAPS MODEL OF SERVICE QUALITY .......................................... 38
2.10 CLOSING THE PROVIDER GAPS .......................................................... 44
2.11 SUMMARY .............................................................................................. 47
CHAPTER 3 ............................................................................................................. 49
FRONT-LINE EMPLOYEES AS KEY ROLE PLAYERS IN THE SERVICE PERFORMANCE GAP (GAP 3) ............................................................................ 49
3.1 INTRODUCTION ..................................................................................... 49
3.2 GAP 3: THE SERVICE PERFORMANCE GAP ....................................... 51
3.3 THE ROLE OF FRONT-LINE EMPLOYEES ........................................... 52
3.4 FACTORS CONTRIBUTING TO FRONT-LINE EMPLOYEE SERVICE QUALITY ISSUES ............................................................................................. 55

3.5 MANAGING THE FACTORS THAT CONTRIBUTE TO FRONT-LINE EMPLOYEE SERVICE QUALITY ISSUES – CLOSE PROVIDER GAP 3 ......... 61
3.6 SUMMARY .............................................................................................. 71
CHAPTER 4 ............................................................................................................. 73
RESEARCH METHODOLOGY ............................................................................. 73
4.1 INTRODUCTION ..................................................................................... 73
4.2 PURPOSE OF THIS RESEARCH ........................................................... 73
4.3 PROBLEM STATEMENT ......................................................................... 74
4.4. RESEARCH OBJECTIVES ...................................................................... 75
4.5 RESEARCH QUESTIONS ....................................................................... 75
4.6 METHODOLOGY ..................................................................................... 76
4.7 ETHICAL CONSIDERATIONS IN BUSINESS RESEARCH .................... 88
4.8 SUMMARY .............................................................................................. 88
CHAPTER 5 ............................................................................................................. 89
RESEARCH RESULTS ........................................................................................ 89
5.1 INTRODUCTION ..................................................................................... 89
5.2. DESCRIPTION OF THE RESPONDENTS .............................................. 89
5.3 PART A – DEMOGRAPHIC PROFILE OF RESPONDENTS .................. 89
5.4 PART B – EMPIRICAL RESULTS (front-line employees and managers) .... ................................................................................................................. 94
5.4 SUMMARY ............................................................................................ 113
CHAPTER 6 ........................................................................................................... 114
DISCUSSION OF RESULTS, RECOMMENDATIONS AND CONCLUSION ...... 114
6.1 INTRODUCTION ................................................................................... 114
6.2 SUMMARY OF THEORETICAL FINDINGS .......................................... 114
6.3 DISCUSSION OF THE RESULTS AND RECOMMENDATIONS .......... 116
6.4 BLUEPRINT OF STEPS FOR SERVICE DELIVERY ............................ 128
6.5 RESEARCH OBJECTIVES OF THE STUDY ........................................ 130
6.6 LIMITATIONS OF THE STUDY AND FUTURE RESEARCH ................ 130
6.7 CONTRIBUTION .................................................................................... 131
6.8 SUMMARY AND CONCLUSION ........................................................... 131
LIST OF REFERENCES ........................................................................................ 133
APPENDICES ........................................................................................................ 144

LIST OF FIGURES
Page
Figure 1.1 Integrated Gaps Model of Service Quality 3
Figure 2.1 Effects of a service orientation 17
Figure 2.2 The Service Triangle 27
Figure 2.3 Service Quality Model 31
Figure 2.4 Factors that influence customers’ service level 33
Figure 2.5 Gap 1: The gap between customer’s expectation and the
organisation’s perception
41
Figure 2.6
Figure 2.7
Gap 2: The gap between the organisation’s perception
and the characteristics of a service quality
Gap 3: The gap between the quality of service delivered
and service provisions
42
43
Figure 2.8 Gap 4: The gap between promised quality service
delivery and external communication
44
Figure 3.1 Focus on customer-oriented service delivery 51
Figure 3.2 The service profit chain 54
Figure 3.3 Influence of work climate on front-line employee service
quality
56
Figure 3.4 Human resource strategies for delivering service quality
through people
62
Figure 5.1 Gender profile of front-line employees and managers 90
LIST OF TABLES
Page
Table 1.1 Summary on front-line employee attributes for customer
satisfaction
5
Table 2.1 Findings of various research studies indicating the
positive influence of organisational culture
20
Table 2.2 Literature review of customer satisfaction, as identified by
various authors
24
Table 3.1 Factors contributing to front-line employee service quality 55

issues
Table 4.1 Sample size of respondents 86
Table 5.1 Age profile of front-line employees and managers 90
Table 5.2 Front-line employees’ language 91
Table 5.3 Front-line employees’ and managers’ cultural groups 91
Table 5.4 Qualification: Front-line employees and managers 92
Table 5.5 Front-line employees’ transport system 93
Table 5.6 Residing area of front-line employees 93
Table 5.7 Descriptive analysis of factors (front-line employees) 94
Table 5.8 Descriptive analysis of factors (managers) 94
Table 5.9 I want management to know my family 95
Table 5.10 Does management know the family/children of each front-
line employee
96
Table 5.11 Leaders have a clear vision for the future of this
organisation
96
Table 5.12 Does your organisation have a clear vision for the future? 97
Table 5.13 What qualification is necessary for front-line employees? 97
Table 5.14 How frequent are evaluations done? 98
Table 5.15 In my organisation I receive training on how to provide the
best service to the customer
98
Table 5.16 Front-line employees receive regular training 99
Table 5.17 When I experience a problem I have the right to make a
decision and handle the problem
99
Table 5.18 When a front-line employee experiences a problem, does
he/she have the right to make a decision and handle the
problem?
100
Table 5.19 I would recommend this organisation as a good place to
work
100
Table 5.20 I am proud to work at this organisation 101
Table 5.21 I receive a performance bonus 101
Table 5.22 How are employees rewarded for good performance? 102
Table 5.23 Clear performance standards for service quality are set 102
Table 5.24 Organisational benefits are available 103

Table 5.25 Management are interested in front-line employees and
their needs
103
Table 5.26 Management are interested in the wellbeing of the family
of front-line employees
104
Table 5.27 My personal circumstances have a negative influence on
my job performance
104
Table 5.28 I have problems to get to work and back home 105
Table 5.29 I do not always have clean clothes to wear to work 105
Table 5.30 I experience conflict between my work and family
responsibilities
106
Table 5.31 I experience a lot of stress at work 106
Table 5.32 Front-line employees are treated with respect 107
Table 5.33 Front-line employee attitude and behaviour have an
impact on customer evaluation of services
107
Table 5.34 Most common complaints amongst front-line employees 108
Table 5.35 Are you flexible in your leadership role to attend to
different situations?
108
Table 5.36 Cronbach’s alpha test for reliability 109
Table 5.37 Pearson product moment correlation between service
quality and factors as identified from literature
110
Table 5.38 Pearson product moment correlation between customer
service and factors as identified from literature
111
Table 5.39 Pearson product moment correlation between front-line
employees and factors as identified from literature
112

1
CHAPTER 1
INTRODUCTION
1.1 INTRODUCTION AND BACKGROUND TO THE STUDY
The South African economy is reasonably diverse, consisting of various products
and service organisations, marketing and selling a product or service, or a product
with a service of some kind, for example the airline industry, the funeral industry,
telecommunications, and many more. These organisations play an important role in
formulating their customers’ expectations of the quality service they deliver. In order
to attract customers, they make promises concerning a product or service delivery to
them. For example, Pick n Pay promise low prices and smart savings whereas
Walmart/Massmart promise that one can save money and live better when buying
from them.
Due to such promises, customers have certain expectations when they enter a
service organisation. One of these expectations is the quality of service they are
about to receive. Mudie and Pirrie (2006: 241) state that “expectations shape
satisfaction”. Customers’ expectations of a service are formed prior to the use of the
specific service. Thereafter, customers will compare their perceived service with their
expected service. If the service meets (or exceeds) customers’ expectations, they
are satisfied or highly satisfied. It is no surprise that the law of service, according to
Mudie and Pirrie (2006: 17), is satisfaction equals perception minus expectation.
Customer expectations are critical towards the evaluation of a service and have
different levels of expectations. According to Zeithaml, Bitner and Gremier (2009: 75-
97), customer service expectations can range from low to high. According to
Zeithaml et al., “tolerable expectations” is the lowest level of expectation, followed by
“acceptable expectations”, “experience-based norms”, “normative expectations” (also
called “adequate service”) and the highest level of expectations “ideal expectations”
(also called “desired service”). Desired service is thus what the customer hopes or
wishes to receive. For example, at a fast-food restaurant, the customer expects fast

2
service, as well as convenient and tasty food. With an adequate or acceptable level
of service, on the other hand, customers are sometimes willing to accept the level of
service rendered to them. For example, a customer expects to stand in a queue at a
bank or when paying an account at a retail store. These service expectations are
formed by experiences that have developed over a period of time (Zeithaml et al.,
2009: 75-97; Hoffman, Bateson, Wood and Kenyon, 2009: 390) and that are
influenced by more than one factor.
A desired service expectation is mainly influenced by personal needs, explicit and
implicit service promises, customers’ past experiences, word-of-mouth
communication and lasting service intensifiers. An adequate service expectation, on
the other hand, is influenced by a variety of factors, which are not under the service
provider’s control, such as, for example, situational factors, perceived service
alternatives, temporary service intensifiers, and the customers’ self-perceived
service role.
However, in cases when expectations are not met, customers are dissatisfied and a
gap arises between the customer and the service organisation. This “gap”, called the
“Customer Gap” or the “Service Quality Gap” is thus the difference between the
expectations and the perceptions of the customer (Zeithaml et al., 2009: 32; Boshoff
and du Plessis, 2013: 48-51) (see Figure 1.1 Page 3) and are the most critical
service-quality gap to close. Zeithaml et al. (2009: 33) indicate that the Provider Gap,
which consists of four other gaps needs to be closed first, in order to close the
Customer Gap to (also called Gap 5) in order to fulfil customer expectations.
Therefore, in delivering a consistent quality service, it is important for any service
organisation to close this gap.
The Provider gap occur within the organisation that provides the service and include
the Listening Gap (not knowing what the customer expects); the Service Design and
Standards Gap (not having the required service designs and standards); the Service
Performance Gap (an organisation not delivering to service standards), and the
Communication Gap (not matching performance to promises). These are indicated
as Gaps 1 to 4 in Figure 1.1 Page 3.

3
The Gaps Model of Service Quality, developed by Parasuraman, Zeithaml and Berry,
demonstrates the two different gaps in services marketing, namely the Customer
Gap and the Provider Gap (Grönroos, 2007: 114). The upper part of the Gaps Model
of Service Quality shows aspects related to the customer whilst the lower part shows
aspects related to the service provider (the organisation) (Grönroos, 2007: 114;
Wolniak and Skotnicka-Zasadzien, 2011: 1240; Zeithaml et al., 2009: 32; Boshoff
and du Plessis, 2013: 48-51).
Figure 1.1: Integrated Gaps Model of Service Quality Source: Wolniak and Skotnicka-Zasadzien (2011: 1240), Grönroos (2007: 114)
Expected service
Perceived service
Customer Gap (Gap 5)
ORGANISATION (Service provider)
Gap 3 Performance Gap
Gap 2 Service Design and Standards Gap
Gap 4 Communications Gap
Gap
1 L
iste
ning
G
ap
External communications to customers (Promised quality)
Description of service quality
Management perceptions of customers’ quality
expectations
Service delivery
(Quality of performance)
Provider Gap
Word-of-mouth communication Personal needs Past experience
CUSTOMER

4
This Model demonstrates the steps when an organisation analyses and plan service
quality and also helps in identifying the factors causing gaps in service delivery. It is
important that any service organisation knows and analyses the different gaps to
ensure that they constantly change aspects in favour of service delivery in total.
The most significant variables in the service-delivery process are the degree to
which the service is offered and the extent to which front-line employees meet
customers’ needs and expectations. It is important to differentiate between the
service quality expected by the customer during a service encounter and the
customer’s perception of the service received.
A service encounter involves at least two people – namely the front-line employee
and the customer. Therefore, the person who delivers the service is the front-line
employee. These persons are important to both the customer and the organisation,
as they personify the organisation and influence the customer’s perception of
service. Some front-line employees perform different roles from sub-ordinate roles
(receptionist or delivery staff) to more professional roles such as a professional
advisor. The also act as representatives of the organisation and therefor occupy
boundary spanning roles (Boshoff and du Plessis, 2013: 202). Literature refers to
front-line employees as front-line staff or service employees (Zeithaml et al., 2009:
351). Mudie and Pirrie (2006: 131) point out that “staff that interact with customers”
are also referred to as front-line staff. Therefore, for the purpose of this study and in
the remainder of this document, these employees will be referred to as front-line
employees.
Front-line employees can be viewed as “the service, the organization in the
customer’s eyes, the brand and the marketers” of the organisation (Zeithaml et al.,
2009: 352; Hoffman et al., 2009: 295). They also act as an element of
communication and help portray the image of the organisation. These employees are
the first contact between the customer and the organisation and thus play a
prominent role in the immediate marketing process. They are the public face of the
organisation and their role is to “present” the company and to provide an accurate
and quality service. Not all front-line employees play an equally important role in the
service-delivery process.

5
Customer expectations are met when front-line employees deliver a sustainable
quality service. This reflects positively on the organisation, resulting in a higher
market share and an increase in profits. These employees have a direct influence on
the five dimensions of service quality, namely reliability, responsiveness, empathy,
assurance and tangibles (Zeithaml et al., 2009: 355). It is, therefore, important to
meet customer expectations by employing front-line employees who have the ability
to deliver.
In their study, Geetika (2010: 101) indicate that various researchers find that
effective employees are a determinant of customer satisfaction. Table 1.1 provides a
summary on front-line employees attributes for customer satisfaction.
Table 1.1: Summary on front-line employee attributes for customer satisfaction
Sector Attributes Author
Railways Front-line employee behaviour Agrawal (2008)
Railways Reliability, empathy tangibles, assurance and
responsiveness of front-line employees
Vanniarajan and Stephen
(2008)
Bus service Helpfulness of front-line employees Eboli and Mazzulla (2007)
Banking Front-line employee behaviour Jham and Khan (2008)
Tourism Front-line employee service quality Ekinci (2003)
Source: Geetika (2010: 101)
Table 1.1 provide a summary on front-line employee attributes that contribute to
customer satisfaction. Front-line employees form an integral part of the competitive
advantage of a service-delivery organisation and play a crucial role in company
growth, as they serve a bridging role. There is a demand for quality service in the
competitive climate in which service-delivery organisation operate at present.
Therefore, delivering a service that satisfies customers is always a challenge.
The effectiveness of front-line employees and the role they play in service delivery
determine whether customers will return to the organisation as long-term customers
or not. For these companies to be able to provide this type of service, management
need to understand the role of their front-line employees, as the demand for quality
services will always remain strong and increase with technology and competition.

6
Effective front-line employees are assets to any organisation. The effectiveness of
front-line employees is a topic that is seldom discussed, although they form the
backbone of any service-delivery company. Some carry mental baggage, for
example, their personal circumstances or inappropriate compensation, to work, and
this may influence their encounter with customers. Due to their responsibilities at
home and at work, lack of time available to do personal business means that
decisions about work affect decisions about life at home, and vice versa. Therefore,
front-line employees may often find it difficult to draw a line between personal, home-
and work-related aspects (Lin, Wong and Ho, 2013: 178; Wong and Lin, 2007: 726;
Chiang, Birtch and Kwan, 2010: 25-27).
Research has found that, due to stress, employees experience role conflict, with
negative consequences for both the employee and the organisation (Varca, 2009:
51). Gunlu, Aksarayli and Perçin (2010: 693) confirm that professional circumstances
may also influence employee effectiveness, and indicate that staff dissatisfaction (for
example, role ambiguity, employee or job mismatch, lack of empowerment, lack of
management commitment) are some of the forces that affect front-line employees’
effectiveness.
From literature, it is evident that front-line employees, through a service encounter,
determine the level of service quality delivered. Thus, the effectiveness of the front-
line employees who are appointed has a direct influence on the quality of service
rendered. However, variables such as personal and professional circumstances
influence their effectiveness. A lack of fulfilment in any human need may result in
employees being ineffective.
A service-delivery company cannot function effectively without front-line employees.
Therefore, management need to understand their employees’ basic human needs.
Sometimes managers do not know their employees, or know how many children they
have. As human beings, front-line employees have different needs and wants and,
unless management connect with them, they will be unable to develop into effective
employees. Service delivery mainly occurs through human contact and human
interaction. The right person needs to be hired and developed in order to deliver
according to customer expectations.

7
Bearing the above in mind, it is critical for AVBOB to employ front-line employees
who form long-term relationships with their customers and at the same time can
deliver outstanding service, show empathy and be friendly and trustworthy towards
their grieving customers.
1.2 PROBLEM STATEMENT
Product- and service-oriented organisations that sell their services or a product with
a service attached thereto need effective front-line employees to serve the customer.
A successful service-delivery organisation, quality service and effective employees
go hand in hand. Quality service delivery is dependent on the front-line employees of
such an organisation. However, employees do not always deliver a sustainable
quality service for many reasons. Many factors and circumstances in their personal
lives and work situation influence their effectiveness as employees and the quality of
service they render. Therefore, this research study aims to investigate these factors
and their impact on the effectiveness of front-line employees. Their ineffectiveness
contributes directly to the existence of the Customer Gap.
1.3 RESEARCH OBJECTIVES OF THE STUDY
Primary objective: The primary objective is to determine the factors that influence front-line employees
in their delivery of a sustainable quality service.
Secondary objectives: The secondary objectives to reach the primary objective are:
a) To examine the aspects affecting the Customer Gap;
b) To investigate the role of front-line employees in narrowing the Customer Gap;
c) To identify personal circumstances influencing the effectiveness of front-line
employees;
d) To identify professional circumstances influencing the effectiveness of front-line
employees;
e) To investigate front-line employees’ commitment towards rendering a quality
service;

8
f) To discuss management’s role in, and awareness of the role of front-line
employees in service delivery, and
g) To set up a blueprint of steps for recommendation for the management of
service delivery organisations.
1.4 METHODOLOGY
Quinlan (2011: 4) define methodology as the way in which the research study is
carried out, which implies the overall process of the literature study, the data
collection and the analysis of the data.
1.4.1 Literature study Literature (secondary data) related or similar to the research topic was reviewed.
Existing verifiable literature (publications, academic journals, electronic databases
and the Internet) was reviewed to ascertain and interpret what has been written and
published on the research topic.
1.4.2 Research design (see 4.6.2 Page 76) A quantitative research design was adopted to collect data for this research study. In
this type of research design, the respondents are asked to select and answer from
among a list provided by the researcher. Quinlan (2011: 392, 397) states that
quantitative data is precise and concise and defines a quantitative research design in
a study where variables can be measured, controlled and/or manipulated. In this
type of analysis, “the unit of measurement is the variable” which has more than one
value. For example, in gender, there are two values, namely male or female. Cooper
and Schindler (2014: 146) indicate that quantitative data is numerical data, as this
type of data results from counting things and placing them into a category.
Scale questions were used in Section A of the questionnaire. Buglear (2005: 114)
indicates that “the numerical scale used to produce the figures, forms the basis of
the analysis of quantitative data”. Buglear also states that scale questions enable the
researcher to compare the ranking of different respondents easily. Quinlan (2011:
326) points out that scale questions are used widely in research, as it is a structured
data-gathering method. Descriptive statistics were used in the compilation of the

9
demographic part (Section B) of the questionnaire. Quinlan (2011: 399) notes that
descriptive statistics, which is a form of data analysis, is used to describe the data
gathered. Summarising the statistics is an example of descriptive statistics, as
variables can be described in a number of ways such as, for example, frequencies,
ranges, means, modes, standard deviations, and medians.
• Study population and sampling
The target population for this research study consisted of front-line employees and
managerial staff who were involved in service delivery and in the employment of
AVBOB from the beginning of June 2013 to the end of November 2013 and who
were willing to participate in the research study. Non-probability sampling was used,
because it is less time consuming and inexpensive (Serakan and Bougie, 2010:
276).
A total of 123 questionnaires were completed, of which 82 were completed by front-
line employees and 41 by managers. Not every front-line employee and manager
was identified and asked to complete a questionnaire (see Page 86).
• Data-collection method
Various sources of secondary data (literature) available on the research topic were
used to compile two different structured survey questionnaires. In order to achieve
the purpose of this study, both front-line employees and management were
requested to complete a questionnaire. The aim of the questionnaires was to
determine what factors influence front-line employees in their delivery of a
sustainable quality service.
The questionnaires were only made available in English, as this is one of the official
languages, and the vast majority of the population has a command of English.
The questionnaire survey gathered quantitative data pertaining to the research topic.
Scale questions, more specifically Likert-type scale questions, were used. These
types of questions measure both the direction and the force of the attitudes.
Therefore, respondents were instructed to indicate their degree of agreement with a

10
list of statements supplied by the researcher. The majority of the questions consisted
of an option between “Strongly disagree/Disagree/Unsure/Agree/Strongly agree”
(Quinlan, 2011: 225, 327).
In order to maintain continuity, the questions were grouped by topic and placed in a
logical order. The first questions were open-ended questions to encourage response,
followed by close-ended questions; the demographic questions were placed last
(Bryman and Bell, 2007: 221).
• Statistical analysis of data
The data obtained was analysed using the Statistical Package for Social Sciences
(SPSS) software. The Department of Industrial Psychology, Faculty of Economic and
Management Sciences, assisted the researcher in the analysis and interpretation of
the data.
The results of the survey were interpreted using inferential statistics such as
Cronbach’s alpha to measure item reliability. According to Quinlan (2011: 399),
inferential statistics is used in quantitative data analysis for prediction, whereas
prediction in quantitative data analysis is based on the science of probability.
Pearsons Product Moment Correlation measures the relationship between variables.
Correlation is a measure of the relation between two or more variables. The
Pearson’s r method was used to examine relationships between interval and ratio
variables. “The “r” in Pearson correlation coefficient symbolizes the estimate of
strength of linear association based on sampling data and its direction between
interval and ratio variables” (Bryman and Bell, 2007: 362). The correlation coefficient
(prefix) indicates the magnitude and the direction of the relationship. The coefficient
can be either positive (+) or negative (-). A number represents the strength of the
relationship. Thus, the closer the coefficient is to 1, the stronger the relationship,
whereas 0 (nil) indicates a weak relationship (Bryman and Bell, 2007: 362; Cooper
and Schindler, 2014: 469). Descriptive statistics such as percentages were also
used.

11
1.5 ETHICAL CONSIDERATION
The information obtained from this study will be kept confidential and will not be
shared with other participants or any other person. The results of the study will only
be presented as a summary of all the results and participants and/or branches will
not be directly identified in any way.
Participation was completely voluntary, and participants were free to withdraw at any
time. No unethical practices took place in order to obtain information from
respondents. Data collection was preceded by obtaining a letter of permission from
the head of the Department of Business Management, University of the Free State.
There was also a verbal agreement between the Department of Business
Management and senior management of AVBOB. In order to protect the
respondents, they were informed not to write their names on the questionnaires and,
therefore, no provision was made to do so.
1.6 CONTRIBUTION OF THE RESEARCH
The key lesson to be learnt from this study will be the importance of understanding
the role that physical and professional influences play in the effectiveness of front-
line employees.
Secondly, to demonstrate the important role that front-line employees play in closing
the Customer Gap in a service organisation. The findings of this study are also of
importance to managers of service-delivery organisations, as this study will support
literature concerning the right person to be appointed to the right job. In general, it
can be concluded that management is seldom aware of the factors that influence
employee effectiveness. Therefore, the aim is to make some useful
recommendations to service employers regarding their front-line employees.
12
1.7 CHAPTER LAYOUT
The study consists of seven chapters outlined as follows:
Chapter 1: Introduction This chapter provides an introduction to the thesis.
Chapter 2: The Gaps Model in service delivery This chapter deals with the literature reviewed on the importance of a service culture
in an organisation.
Chapter 3: Front-line employees as the key role players in the Service Performance Gap
This chapter addresses the critical role of front-line employees in an organisation.
Chapter 4: Research methodology This chapter provides details on how the research was conducted.
Chapter 5: Research results This chapter provides the data analysis of the findings of the study as well as a
discussion of the findings.
Chapter 6: Discussion of the research results and summary This chapter presents the main findings, a critical assessment of the findings and a
list of recommendations drawn from the conclusions.

13
CHAPTER 2
THE GAPS MODEL IN SERVICE DELIVERY
2.1 INTRODUCTION AND BACKGROUND
Service is the lifeline of an economy and, therefore, the service sector is of
importance to any economy. In an advanced economy, the focus is also on the
production of services, including, among others, airlines, car rentals, beauticians,
doctors. For example, at a fast-food restaurant, the customer consumes both a
product and a service.
Countries that initially focused on manufacturing are now experiencing growth in
service. For example, in 2014 40% of China’s GDP was attributed to services. South
Africa in 2014, was the second biggest economy on the African continent. Statistics
published by Investec and updated on 6 November 2014 indicate that services form
the largest sector of the South African economy and “accounts for around 73% of the
country’s GDP. Within services, the most important are finance, real estate and
business services (21.2 per cent of GDP); government services (13.6 per cent of
GDP); wholesale, retail and motor trade, catering and accommodation (12.5 per cent
of GDP) as well as transport, storage and communication (9 per cent of GDP)”.1
Therefore, in the present competitive environment, one of the key factors to a
competitive advantage is delivering a quality service, which will satisfy customers.
Customer satisfaction is a prerequisite for customer retention, customer loyalty and
profitability. Customer satisfaction is an essential strategy in maintaining a
competitive advantage for any business, whereas service quality and effective front-
line employees are two variables in the process that maintain customer loyalty. The
quality of service rendered by effective front-line employees is crucial for customer
satisfaction, loyalty and the retention process, but also for the success and survival
of the organisation. Many studies in services marketing have indicated that the
1 Retrieved from http://www.tradingeconomics.com/south-africa/gdp-growth-annual [Accessed 6 November 2014].

14
human element (front-line employees) plays a key role in the delivery of quality
service (Boshoff and du Plessis, 2013: 119; Varca, 2009: 51; Grönroos, 2007: 417).
Customers are becoming more critical of the quality of service they experience. The
Internet provides customers with a great deal of knowledge before they buy a
product; thus the front-line employee needs to be au fait with a product’s pricing,
uses and technical aspects. South African consumers have not only an unlimited
need for goods and services, but are also aware of their importance as customers
and, therefore, demand high service quality.
Therefore, providing an excellent service quality, coupled with customer satisfaction,
is an important challenge for any organisation, be it in the public or private sector.
Due to the aforementioned and because of constant development, strong
competition, and shrinking management resources, service-quality organisations are
forced to evaluate the quality of their service encounters. Over the past few years,
service quality has become important to managers and researchers because of its
impact not only on organisational performance and customer satisfaction, but also on
return on investment, growing profits and customer loyalty (Chi and Gursoy, 2009:
245; Lenka, Suar and Mohapatra, 2009: 46-47).
Customer service is an internal marketing function; all those involved must be
customer minded, strive to give the customer the best service, and only make a
promise that can be kept. Marketing is all about satisfying the needs and wants of
the customer (Kotler and Keller, 2009: 74); therefore, the success of providing a
quality service rests in the hands of managers and front-line employees.
Organisational managers experience increasing pressure not only to demonstrate a
customer-focused service whereby customer expectations are met, but also to find
and identify ways of closing service-quality gaps. Due to the increased competition
among organisations, management is forced to focus on the quality of services
provided to their customers. It is, therefore, important for organisational management
to understand the importance of a service culture that will enhance and encourage
customer retention, growth and loyalty towards their business, and enhance their
market performance.

15
While financial profitability and growth is the common goal of every organisation, it is
also the most common measure of organisational performance. Steward (2010)
explains that organisational culture and norms are the first to be investigated, in
order to improve organisational performance and profitability. It is important to
understand the service sector, as service processes are becoming more vital, due to
their intangibility and customer participation.
Tsai and Lin (2014: 389, 391) are of the opinion that misunderstandings or a lack of
understanding customer needs and expectations will result in the poor performance
of a service organisation. Therefore, rendering a quality service has become an
ever-challenging task for managers.
This chapter outlines the holistic concept of service culture and aspects related to it.
Attention will also be devoted to service quality, the influence of service quality on
organisational performance, and customer loyalty. Details are also provided on
customer perceptions of service, their expectations, and customer satisfaction. The
remainder of this chapter addresses the Gaps Model, with special reference to the
Customer Gap and key factors that affect this gap.
2.2 SERVICE CULTURE
Researchers such as Grönroos (2007: 417) as well as Grönfeldt and Strother (2006:
266) reason that every true service-oriented organisation has a service culture. They
emphasise three important points, namely that a service culture exists in
organisations where there is an appreciation for quality service; that a high-quality
service must be rendered towards internal and external customers, and that a
service culture is an important element of any service organisation, as it affects its
competitive advantage.
Literature provides a multitude of definitions of service culture. According to
Grönroos (2007: 419), a service culture is when employees can be characterised as
being service-oriented. Beitelspacher, Richey and Reynolds (2011: 1) define service
culture as “a customer-centric culture aimed at exceeding customer expectations
and creating superior customer value through the development of service and

16
related performance competencies”. For the purpose of this study the definition as
proposed by Grönroos (2007: 419) is applicable.
Numerous studies have been done and produced evidence that a service culture is
of importance to organisational performance, profitability and effectiveness (see
Table 2.1 Page 20). Recently, Oocharoen (2008: 1) indicated that organisational
resources such as service culture could influence organisational excellence and
performance. The results of the study also confirm that service culture has a positive
effect on organisational performance. Results of a study by Little and Dean (2006:
473) show that service culture contributes to employee commitment towards the
organisation, employee service quality capability, and potentially improves
customers’ experience of the service rendered. Boshoff and du Plessis (2013: 198)
propose that the service culture of an organisation must be built on the foundation of
caring for both the customer and the employee.
Gallagher, Brown and Brown (2008) remark that “between 1990 and 2007, more
than 60 research studies covering 7 619 companies and small business[es] in 26
countries have found that service culture and business performance are strongly
related. This positive correlation is identified by more than 35 performance
measures, including return on investment, revenue growth, customer retention,
market share, new product sale and employee performance”. In other words, if an
organisation’s service culture focuses on employees who are competent and deliver
high-quality service, customers will have a positive experience and perception of
service quality.
Pride and Ferrel (2010: 108) argue that a service culture has not only shaped
employees’ satisfaction, but may also affect the quality of service they provide and
render towards customers. Service-focused employees have an interest in their
customers, do more for them, and strive to find solutions to customers’ problems
(Grönroos, 2007: 419). Ryan, Schmit and Johnson (1996: 853) examined data for
142 branches of an automobile finance company and found that the aggregate
employee attitude concerning satisfaction, teamwork and customer focus was indeed
related to customer satisfaction, employee turnover and the company’s financial
situation.

17
A service culture thus reflects values and assumptions prescribing what is important;
beliefs of how things work in the organisation, and norms that define appropriate and
inappropriate behaviour by employees. Finally, issues in service culture must first be
addressed if organisational changes are to be implemented in order to reduce the
gap between what customers perceive/organisations provide and what their
customers expect. Therefore, a strong service culture should include the consistent
provision of high-quality service.
Figure 2.1: Effects of a service orientation Source: Grönroos (2007: 419)
Figure 2.1 illustrates that profitability through a service strategy requires a service
culture. Customer-perceived quality is a key determinant of profitability. Service
orientation improves service quality. This, in turn, positively affects the profitability of
an organisation. Service orientation, which is a characteristic of a service culture,
improves the quality of service as perceived by customers, whereas service
orientation among front-line employees influences and enhances the process within
an organisation. This can, therefore, be considered as a chain reaction, as each
variable is dependent on the other.
A service culture is required when a service strategy is introduced and implemented.
There are four types of requirements for good service, namely strategic,
Service orientation
Service quality
Profitability

18
organisational, management, as well as knowledge and attitude (Grönroos, 2007:
421). Grönroos cautions that these requirements are intertwined and that, if all
requirements are not recognised, the internal change process cannot succeed.
Human resource management forms an important part of a service strategy and
culture. This is discussed in detail in Chapter 3.
First, developing a service strategy can only succeed if a service-focused strategy is
developed using the business mission as the foundation for this strategy. Therefore,
the service strategy must include a service vision. Grönroos (2007: 421) indicates
that a business mission must support customer activities and their processes, as this
creates value for the customer. Service concepts need to be clearly defined or else
the organisation will lack a stable foundation for goals, resources and performance
standards. These service concepts need to state what should be done, to whom,
how and with which resources, and what benefits must be offered to customers.
Human resources management forms an important part of the strategic requirements
and must have recruitment procedures, career planning, reward systems, and so on
in place. Good service rendered by the employee needs to be rewarded and
achievements need to be measured in order to enable employees to realise the
importance of good service (Grönroos, 2007: 421-422; Boshoff and du Plessis, 2013:
195).
Secondly, developing an organisation structure creates the organisation’s
prerequisite for good service. If management wish to achieve a high service quality,
all aspects of the organisation design need to be in place for the service process. To
a customer, good service means easy access to service and quick and flexible
decision-making. Service-oriented organisations require a flat organisational
structure with only a few hierarchical levels.
As the role of management changes, the decisions have to be made by the front-line
employees who are in contact with the customers. Thus, these employees are given
more responsibility and are expected to perform independently. Customers will
perceive this as better quality of services, whereas front-line employees may feel
that their jobs are more meaningful and motivating (Grönroos, 2007: 422-423).

19
Thirdly, service-oriented leadership promotes good service and includes managers’
and supervisors’ attitudes towards their role, their teams and how they act.
Management must provide constant support so that values can spread or be upheld
throughout the organisation. Therefore, management play a key role in the
development of a service culture. As leaders in the organisation, managers
contribute towards the culture of the organisation via leadership. Hence, it is
important that managers be aware of the corporate culture in their organisation.
Communication is an important part of leadership and, therefore, management must
be committed towards communication with their staff (see Figure 2.4 Page 33). On
the other hand, they must be willing, and have the ability to listen to their employees.
They need to accept the role of a coach and be able to encourage employee
performance, but also recognise and reward good performance. Management must
endeavour to get service employees involved in their planning and decision-making
processes, as they may have valuable information regarding customers’ needs and
wants, problems, opportunities and dislikes (Grönroos, 2007: 423-424).
Finally, employees gain knowledge and attitude towards good service when they
receive the necessary training. All levels of management must be motivated towards
service-oriented thinking and behaviour, as employees must know how a service
organisation operates, what their role is and what is expected of them as individuals.
All employees need to be aware of the organisation’s mission and business
strategies as well as the goal and function of each department. Therefore, training
programmes that include both knowledge-based training and attitude training are
essential (Grönroos, 2007: 425).
2.2.1 Influence of a strong service culture The majority of definitions suggest that the culture, from an organisational point of
view, directly influences the quality of service that will be delivered by its employees.
Therefore, a corporate culture that can be labelled as a service culture is essential in
every organisation (Grönroos, 2007: 415).
A service culture can only be developed over a period of time and is critical for a
customer-focused organisation. Therefore, an organisation with a strong service

20
culture seems to attract service-oriented employees, as they are favourably
influenced by the existing culture. Grönroos (2007: 415) emphasises that, when
employees identify themselves with the values of an organisation, they are less likely
to quit, while customers are more satisfied with the service they receive. Staff
turnover is lower in organisations with service-oriented values and positive attitudes
towards work. This attitude is easily transmitted to newly appointed employees.
Boshoff and du Plessis (2013: 197) mention that a strong service climate may lead
front-line employees towards appropriate task performance.
The results of a study by Yagil and Gal (2002: 223) indicate that a strong service
climate has a positive effect on front-line employees’ empowerment and sense of
control of a service station. This, in turn, has a positive influence on customer
satisfaction. Yagil and Gal also indicate that a strong service climate frees
management from some control mechanisms that are necessary when
organisational climate and service culture are weak.
Table 2.1 indicates the positive influence of an organisational culture, as supported
in various research studies.
Table 2.1: Findings of various research studies indicating the positive influence of organisational culture
Author Finding
Demirbag, Tatoglu, Tekinkus and Zaim
(2006: 831)
There is a positive relationship between
organisational culture and customer satisfaction
Dimitriades, Z.S. (2006: 783-785) Organisation culture link to job satisfaction,
commitment, service quality and turnover
Lee and Yu (2004) Organisational culture’s strength relates to
organisational performance
Tsai, Y. (2011: 2) Organisations with a positive organisational
culture are more productive
Sanders, Geurts and Van Riemsdijk (2011: 107) In a strong culture, employees show conformity
in respect of organisational values, for example
quality, innovativeness, cost effectiveness.
Employees act according to these values.

21
2.2.2 Influence of a weak service culture Hoffman et al. (2009: 294-295) indicate that every organisation has a corporate
culture, but that not every organisation has a service culture. In this regard, Grönroos
(2007: 421) adds that, if a non-service culture exists, it will keep employees from
realising the importance of all other “hidden functions”, and this will result in
employees not paying attention to other service elements. A weak corporate culture
represents only a few or even no clear, general shared values. This creates an
insecure feeling in employees of how to react in different situations. In this respect,
Yagil and Gal (2002: 216) add that a weak service culture results in service
encounters managed by bureaucratic rules; this reduces the perceived control of
both front-line employees and customers. It can, therefore, be assumed that the
culture of an organisation may affect the quality of service delivered.
Dabholkar and Abston (2008: 960) found that the inability of front-line employees to
function effectively is often governed by inadequate/poor system design, poor
recovery strategies, or a lack of knowledge. They indicate that many more reasons
and influences prevent front-line employees from being effective. For example, they
are often in the position that there are limits to their abilities to perform and to their
ability to deliver quality service to customers when they must contend with poor
working conditions and improperly maintained equipment. Other influences are,
among others, employee empowerment, supervisory support, task control,
managerial climate, job design, and individual differences (characteristics among
employees and locus of control). Zeithaml et al. (2009: 348) mention that
organisational culture is another important factor, as it influences employee
behaviour in service delivery.
2.2.3 Leadership and service culture A strong service culture starts with leadership that demonstrates service excellence.
Thus, leadership is responsible for the development and maintenance of
organisational culture and focused strategies. Grönroos (2007: 415) states that
employees tend to embrace a service culture when they notice that management is
realising these values. Therefore, employees believe that a service culture is what
they experience daily with management and other staff in key roles in the
organisation. Boshoff and du Plessis (2013: 201) state that the employees’
22
perception of their employers’ passion for service would lead to a climate that sets
service as a key strategic imperative.
Various factors are required to build and sustain a service culture. In order to
achieve and maintain a service culture, human resources and internal marketing
need to cooperate. Grönroos (2007: 367) indicates that managerial support is the
most important type of support. Managers and supervisors maintain corporate
culture and, should an organisation wish to be characterised by a service culture,
management must demonstrate their commitment and support to organisational
values of such a culture.
Grönroos (2007: 418) also argues that organisations must start with a strong service
culture and be customer focused; sustain their established service culture, and
constantly pay attention to all details. Thus, according to the author, a service culture
plays a key role in the creation of value for the customer and the organisation, as it
drives a service mindset. It is a great challenge for every manager to encourage
front-line employees to perform their best. However, management must shape front-
line employees’ understanding of what the organisation stands for. Furthermore,
management is considered to be role models (Korschun, Bhattacharya and Swain,
2014: 23).
Providing good service should be second nature to everyone within an organization
(Grönroos, 2007: 415). A service climate will encourage the delivery of customer
satisfaction and it is, therefore, important to maintain a healthy relationship with
customers (Li, Frenkel and Sanders, 2011: 1825).
2.3 CUSTOMER SATISFACTION
Customer satisfaction is crucial to all organisations wishing to increase customer
loyalty, thus creating an increased organisational performance. Therefore, in order to
sustain organisational growth and a sustainable market share, organisations need to
understand how to satisfy their customers. Customer satisfaction can only be
obtained when actual performance exceeds the customer’s expectation (Dehghan

23
and Shahin, 2011: 6), whereas dissatisfaction occurs when performance is worse
than the expected performance (Chen-Yu, Williams and Kincade, 2009: 170).
Continuous research on customer satisfaction is an indicator of its importance to,
and influence on organisational performance. Successful organisational performance
is derived from customer satisfaction, which is critical for any organisation. Customer
satisfaction can be defined as the customer’s perception of a specific service
encounter (Kim, 2011: 622). Lin and Wang (2006: 273) define customer satisfaction
as the customer’s post-purchase evaluation and response to an overall service
experience.
It is interesting to note that respondents interviewed by Akbar and Parvez (2009: 25)
view satisfaction as “a summary affective response of varying intensity; satisfaction
focus around product choice, purchase and consumption; and, at the time of
determination which varies by situation, but is generally limited in duration”. It can be
argued that customers form expectations based on external and internal cues; when
the outcomes match their expectations, they are satisfied.
In an effort to maintain economic success, organisations strive to deliver high-quality
service that will result in customer satisfaction. In this regard, Yagil and Gal (2002:
219) found a relationship between service climate and customer satisfaction.
Customer satisfaction can, therefore, be linked to an increase in market share,
profitability, return on investment, customer retention, and customer loyalty. In
addition, Dimitriades (2006: 782-783) indicate that customer satisfaction can be
linked to customer retention and organisational profits. Customer satisfaction is also
a prerequisite for customer retention (Chi and Gursoy, 2009: 246).
In the same research study, Chi and Gursoy (2009: 246-248) claim that, based on
their findings, organisation climate relates to customer satisfaction. They also found
that human resource practices influence organisational climate, which, in turn,
affects customer satisfaction. These findings are supported by a more recent study
by Evanschitzky, Sharma and Prykop (2012: 439, 499), who, according to their
theory, indicate that the main drivers of customer satisfaction are the service quality
provided by front-line employees, product quality, and value for money. It is

24
interesting to note that Evanschitzky et al. also found that the employees’ attitude,
communication style and characteristics have an impact on customer satisfaction.
It is obvious from the literature that customer satisfaction can occur at various levels
in an organisation, namely with the front-line employees, the core service or the
organisation as a whole (Sureshchandar, Rejendran and Anantharaman, 2002: 364).
Finally, the result of customer satisfaction is customer loyalty; however, customer
satisfaction is influenced by various factors, of which service quality is the most
important determinant. Therefore, besides product quality and a good price, quality
service is the cornerstone of customer satisfaction (Lamb, Hair, McDaniel, Boshoff
and Terblanche, 2008: 13; Nam, Ekinci and Whyatt, 2011: 1009-1011).
Table 2.2 provides an additional summary on customer satisfaction, as identified by
various authors.
Table 2.2: Literature review of customer satisfaction, as identified by various authors
Authors Finding
Gronholdt, Maarten and Kristensen (2000: 513) Customer loyalty is an outcome of customer
satisfaction. Results of a study by the authors
indicate that the relationship between loyalty
and customer satisfaction is strongly significant
Jones and Suh (2000: 154) The results of their study suggest that overall
customer satisfaction is a predictor of customer
loyalty
Delgado-Ballester and Munuera-Aleman
(2001: 1240 and 1254)
Customer satisfaction leads to customer loyalty
Sachdec and Verma (2004: 106) Customers’ perception, expectation and attitude
are determinants of customers’ satisfaction
Grönroos (2007: 94) Service expectations are a determinant of
customer satisfaction
Eboli and Mazzulla (2007: 25) The helpfulness of employees are determinants
of customers’ satisfaction
Agrawal (2008: 262-263) Various other determinants of customers’
satisfaction: employee behaviour as trustworthy,
prompt service, knowledgeable, friendly,
punctual and efficient
Source: Adopted from Bennett and Rundle-Thiele (2004: 516)

25
2.4 THE ROLE AND IMPORTANCE OF SERVICES
Services dominate the most advanced economies in the world, some of which have
more than 70% of their gross domestic product generated by services, as indicated
in the introduction to this chapter. Services formed an estimated 68.4% of the South
African GDP in 2013.2 Thus, services form an important part of any economy, as
“service” affects both the organisation and the customer.
Literature provides numerous meanings for “service”. Service was previously viewed
as something that does not add value to a society. However, contemporary society’s
view and importance of service is that it is something that is provided by a certain
type of organization. This point of view is misleading and thus transfers the wrong
signal concerning the importance and impact of services to the economic wealth of a
society (Grönroos, 2007: 105). Grönroos (2007: 52) defines service as “a process
consisting of a series of more or less intangible activities that normally, but not
necessarily always, take place in interactions between the customer and service
employees of the service provider”. A service is the ability of an organisation to meet
customer expectations.
Customers are vital to any organisation. Some customers spend hundreds of Rands
and others even more on the services or products of an organisation. Therefore,
service quality is very important, as it helps differentiate an organisation from its
competitors, while it also serves as a source of promotion. It also results in greater
sales, which, in turn, result in higher organisation profits. Thus, to be a market
leader, an organisation can differentiate itself from the competition by providing a
high service quality. Service quality does pay dividends over a period of time.
Nowadays, organisations realise the true value of service, namely they can develop
and maintain a sustainable competitive advantage by means of high-quality service.
Customers do not buy goods or services; they buy the benefits and services
provided to them. In this regard, AVBOB offers a one-stop service through a
2 Retrieved from https://www.gfmag.com/global-data/country-data/south-africa-gdp-country-report [Accessed 6 November 2014].

26
countrywide network of funeral parlours, rendering tangible products and intangible
services to a diverse customer base.
The key and probably most well-known characteristics of services are those
identified by Zeithaml et al. (2009: 20-22), namely intangibility, heterogeneity,
simultaneous production and consumption, and perishability. It is important to note
that, according to Zeithaml et al. intangibility is the most basic distinguishing
characteristic of a service. They argue that service is a performance rather than an
object, as it cannot be seen, tasted, touched or felt. Thus, services are not things;
they are intangible processes and/or activities. They are a deed or an effort and
cannot physically be possessed; they are difficult to advertise and difficult for the
customer to evaluate prior to purchase. No two services are identical.
Employees who deliver a service are often the “serviceˮ in the customers’ eyes.
However, because service delivery is an act between a customer and a front-line
employee, the employee has to meet certain specifications of the service. For
various reasons, the services rendered by employees may differ daily and are,
therefore, heterogeneous. Because services cannot be saved, resold, returned or
stored, they are referred to as perishable. Simultaneous production (inseparability)
refers to the fact that the productions of a service are inseparable from consumption
by the customer. Therefore, most of the time, customers need to be present in the
production of a service (for example, visit a consultant at the bank) and they cannot
take the service home. Thus, both the service provider and the customer must work
together to provide a service.
Organisations offer different types of service to customers, regardless of what it is.
However, due to the intangibility of a service, no service is the same for every
customer. A customer’s experience of a service depends on the expertise of the
front-line employee. Therefore, a customer’s experience of a service automatically
includes both the benefit of a service and the performance, whereas his/her
assessment of the service focuses on the tangible aspects thereof (Zeithaml et al.,
2009: 353). Finally, one of the biggest challenges in the service process is to deliver
and maintain a sustainable quality service to the customer.
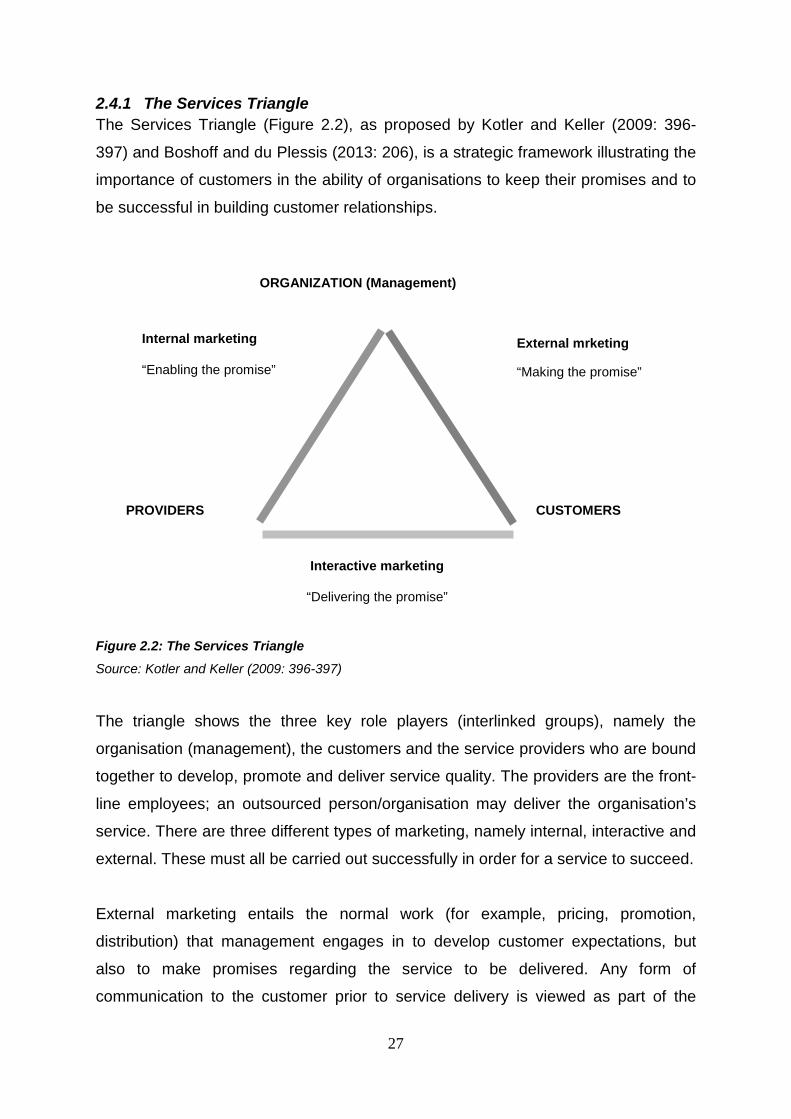
27
2.4.1 The Services Triangle The Services Triangle (Figure 2.2), as proposed by Kotler and Keller (2009: 396-
397) and Boshoff and du Plessis (2013: 206), is a strategic framework illustrating the
importance of customers in the ability of organisations to keep their promises and to
be successful in building customer relationships.
Figure 2.2: The Services Triangle Source: Kotler and Keller (2009: 396-397)
The triangle shows the three key role players (interlinked groups), namely the
organisation (management), the customers and the service providers who are bound
together to develop, promote and deliver service quality. The providers are the front-
line employees; an outsourced person/organisation may deliver the organisation’s
service. There are three different types of marketing, namely internal, interactive and
external. These must all be carried out successfully in order for a service to succeed.
External marketing entails the normal work (for example, pricing, promotion,
distribution) that management engages in to develop customer expectations, but
also to make promises regarding the service to be delivered. Any form of
communication to the customer prior to service delivery is viewed as part of the
ORGANIZATION (Management)
Internal marketing
“Enabling the promise”
External mrketing
“Making the promise”
CUSTOMERS PROVIDERS
Interactive marketing
“Delivering the promise”

28
external marketing process; therefore, any promises that were made in this process
must be kept (for example, promotion, price). To ensure that promises are kept,
management must not only recruit, train, motivate and reward front-line employees,
but also provide them with resources to deliver organisational promises (Boshoff and
du Plessis, 2013: 206).
Interactive marketing (also known as real-time marketing) entails front-line employee
skills. This is where employees or any outsourced persons/organisations
(subcontractors) break a promise, resulting in dissatisfied customers. Management
need to encourage and support front-line employees and contractors to deliver on
the service promise. However, front-line employees, who might be unable and
unwilling to deliver, will contribute to the failure of the organisation. This action will
ultimately cause the service triangle to collapse (Boshoff and du Plessis, 2013: 206).
The sides of the service triangle should be aligned. In other words, all three sides of
the triangle must be integrated to ensure that the organisation can achieve service
quality. Once this is achieved, a service culture can be maintained through the
effective management of all role players. Excellence in one component will thus be
insufficient. In order to achieve service quality, the organisation must recruit effective
employees, provide proper training, reward and motivate front-line employees, and
provide the necessary technology and equipment to keep up with promises. For
example, a promise made through external marketing must equal the service
delivered (Kotler and Keller, 2009: 396-397). Finally, this model also highlights the
notion that the service supplier and the customer are in contact. Thus the process is
visible and the customer is in a position to identify weaknesses.
2.5 SERVICE QUALITY AS A COMPETITIVE ADVANTAGE
The concept of service quality has led to a great deal of ongoing discussion and
research, especially in literature regarding services marketing. In this context,
existing literature (Pride and Ferrell, 2010: 229; Grönroos, 2007: 436-437; Kotler and
Keller, 2009: 169; Lamb et al., 2008: 414) provides evidence that service quality
plays a critical role between the organisation and its customers. Many businessmen
believe that service quality is the only competitive advantage that can be sustained

29
in the long run. From the growing number of books on the topic, it is clear that
service quality is a prerequisite for the survival of any organisation; it is critical in
both determining customer satisfaction and achieving competitive advantage; it
affects repurchase intentions of customers and, therefore, plays an important role
towards long-term profitability. According to the Gaps Model, service quality can be
viewed as the difference between customers’ expectations of a service and their
perceived service (also referred to as the Customer Gap).
The key factor in gaining and maintaining a competitive advantage is the capability to
deliver outstanding quality service to customers (Lamb et al., 2008: 414; Ladhari,
Pons, Bressolles and Zins, 2011: 951-952).
Research has shown that service quality is the outcome of internal policies. These,
in turn, result in customer satisfaction and customer loyalty. Service quality is also
directly linked to customer retention and organisational profitability (Grönroos, 2007:
124). Service quality can be used as an advertising medium for word-of-mouth
advertising and can help attract new customers (Pride and Ferrell, 2010: 368;
Grönroos, 2007: 361-362). According to research findings by Shahin and Samea
(2010: 4), service quality strategies are, in fact, a set of guidelines for all the staff in
an organisation. These strategies need to be communicated by management and
must distinguish one organisation from another.
British Airways realised that many airlines offer the basic core product, but not all of
them offer it in the same manner. Therefore, they decided to differentiate themselves
by “how” they offer their product, namely through excellent service and quality (Lamb
et al., 2008: 19). Shahin and Samea (2010: 4) indicate that, if no service quality
strategy exists, the organisation will not create a customer-oriented service.
Therefore, management should design strategies based on customer expectations
that can be profitable to the organisation. These strategies should include the
organisation’s vision, setting future objectives and targeting decisions.
Both the act of service and the purchasing of a product must leave customers
satisfied and happy so that they can recommend the organisation to friends and
family. Negative publicity is not good for any organisation, as it attracts a negative

30
perception from customers. Therefore, it can be stated that service is about
corporate image and that corporate image is as important as quality service. Results
of a study by “RightNow” Technologies in 2008 indicate that 87% of customers stop
doing business with an organisation due to poor service. Results also indicate that
loyal customers do not note the prices, because they consider quality service more
important.3
Pride and Ferrell (2010: 368) indicate that customers base their judgement of quality
of service on various factors to enable them to choose one service over another.
One of the most problematic challenges management faces is how to deal with
service quality. In this regard, the authors identify five dimensions of service quality
used by customers to judge service quality, namely reliability, responsiveness,
assurance, empathy and tangibles (see Figure 2.3 Page 31). According to Pride and
Ferrell (2010: 368) reliability (the ability to perform the promised service) is the most
important dimension in determining customers’ evaluation of service quality.
Various authors identified a number of factors that are critical, from the customer’s
point of view, in terms of service quality. For instance, Sureshshandar et al. (2004:
365) identified core service, product; human elements of service delivery
(responsiveness, assurance and empathy); tangibles of service, and social
responsibility. Mathies and Burford (2011: 643) found that an important prerequisite
of customers regarding employees’ understanding of customers’ needs is “listening”.
They also found that front-line service employees meet customer needs when they
provide quality service that has a product or tangible service outcome. In their study,
672 female respondents indicated that “knowing your customers’ needs and wants”
and “to ensure that they leave satisfied” are their prerequisite for quality service.
3 Retrieved from http://www.ehow.com/about_6505645_importance-customer-service-organization.html. [Accessed 31 July 2013].

31
Figure 2.3: Service Quality Model Source: Pride and Ferrell (2010: 370)
Research by Shahin and Samea (2010: 4) clearly shows that management should
pay more attention to service processes. They state that perceived service is directly
influenced by service delivery, and that service delivery is a result of employee
performance.
Providing quality service is a difficult task, as all customers have experienced poor
service at times. Therefore, it is important for organisations to take steps to increase
their service quality by considering the four factors that affect it, namely an analysis
of customer expectations, service quality specifications, employee performance, and
management of service expectations (Grönroos, 2007: 361-362; Pride and Ferrel
2010: 370).
Analysis of customer expectations
• Marketing research • Open communication with
employees
Service quality specifications
• Service goals • Management commitment to
service quality
Employee performance
• Employee training • Evaluation and compensation
systems
Management of service expectations
• Advertising • Good internal communication
Service quality
• Tangibles • Reliability • Responsiveness • Assurance • Empathy
32
2.6 CUSTOMERS’ EXPECTATIONS OF SERVICES
Customers have certain wishes with respect to how they want a service. Pride and
Ferrell (2010: 368) indicate that it is important to determine what customers expect
and then develop a service that meets or exceeds that expectation. Therefore, it is
crucial to differentiate between the quality expected by a customer and the real
quality of service that is provided during a service process and the customer’s
perception.
There are numerous definitions of “customer expectations”, but the most common
are those by Zeithaml et al. (2009: 32) and Zeithaml and Bitner (2003: 2), namely
that customer expectations can be defined as “the desires or wants of customers” or
“predictions made by customers about what may happen during a transaction or
exchange”. Customer expectations are based on their expectations, and the
purchase of a product must match their value-oriented processes.
It is important to note that customers have different types of expectations about
services. In the literature on services marketing, Zeithaml et al. (2009: 76-83)
identified desired service (highest expectation) and acceptable service (what the
customer will accept). Against this background, they identified factors that influence
customer expectations (see Figure 2.4 Page 33). The difference or gap between the
two levels is called “the customer’s zone of tolerance”. On the level of the desired
service, they identified “personal needs, lasting service intensifiers, derived service
expectations and personal service philosophy”, whereas on the level of acceptable
service expectations, the authors identified “temporary service intensifiers, perceived
service alternatives, customer self-perceived service role, situational factors and
predicted service”, as sources of influence.
The most important factor in a customer’s judgement of service quality is service
expectations, as these are influenced by past experiences, word-of-mouth
communication from other customers, or advertising. Every customer is unique in
his/her own way as s/he has different needs, wants and expectations. For instance,
s/he expects reliable service and low prices and wants to receive what s/he paid for.

33
Figure 2.4: Factors that influence customers’ service levels Source: Zeithaml et al. (2009: 87)
Research indicates that customer expectations have different characteristics,
namely, what customers think should form part of a service encounter; what they
expect from a service provider; what they hope for, and what they wish for.
Therefore, customer expectations can be regarded as expressions of what they
believe service providers should offer (Zeithaml and Bitner, 2003: 2). In their work on
managing customer expectations, Hu, Kandampully and Juwaheer (2009: 112) found
that customers consider not only the purpose of receiving a service, but also the
possibility that they will receive it (expectation).
The gap between what customers expect and what they experience will affect
customer satisfaction. In other words, when customers’ expectations are higher than
their experiences, they have a negative perception of satisfaction. When customers’
expectations are lower than their experiences, they have a positive perception of
satisfaction. Thus, customers’ expectations of service quality have an effect on
customer experience and customer satisfaction.
Finally, customer expectations can be managed through accurate and appropriate
communication. This can be achieved by means of marketing (for example,
advertisements), as no organisation can afford to raise customer expectations above
the level of organisational performance (see Figure 2.3 Page 31) (Pride and Ferrel,
Personal needs
Lasting service intensifiers
Temporary service intensifiers
Perceived service
Self-perceived service role
Situational factors
Desired service
Zone of tolerance
Adequate service
Explicit service promises
Implicit service promises
Word-of-mouth
Past experience
Predicted service

34
2010: 370). According to Pride and Ferrel, improved service quality and increased
customer satisfaction reduce the gap between customers’ expectations and their
perceived level of performance. This is an ongoing task for any organisation.
2.7 CUSTOMERS’ PERCEPTIONS OF SERVICES
Customer satisfaction and its importance to the success of organisations are widely
discussed in marketing literature (Sachdev and Verma, 2004: 93; Grönroos, 2007:
94). Satisfaction is related to customer needs and it is, therefore, important to find
out which services should be improved in order to increase customer satisfaction.
Customer satisfaction can occur at various levels in an organisation, for example
satisfaction with a frontline employee, with the core service, or with the organisation
as a whole (Chi and Gursoy, 2009: 246). Therefore, front-line employee performance
and customer satisfaction are key contributors to organisational success, because
customer needs and the fulfilment thereof are important for the survival of any
organisation. A satisfied customer will always return.
Boshoff and du Plessis (2013: 37-38) identified factors of service quality that are
critical from the customers’ point of view, “namely core services/service product; the
human element of service delivery; systematization of service quality, the tangibility
of service and social responsibility”. It is important to note that, according to them, it
has also become clear that these factors influence customer satisfaction. Chi and
Gursoy (2009: 246) further indicate that customers with a poor perception of service
quality also have a poor level of satisfaction. The same applies to customers with a
medium/high perception of service quality and whose results indicate that their
perception of service quality is medium/high.
Sureshchandar et al.’s (2002: 371) study shows that, although there is a correlation
between service quality and customer satisfaction, service quality is likely to be
influenced by variables such as advertising, other forms of communication, the
service rendered by front-line employees, and the experiences of other market
players. Therefore, they suggest that management should endeavour to improve not
only customers’ satisfaction, but also their perception of the organisation’s overall

35
service quality (Sureshchandar et al., 2002: 371). Therefore, the key to customer
satisfaction is to exceed their expectations.
In their study, Lin and Wang (2006: 271-282) found that perceived value had a high
impact on customer satisfaction and customer loyalty. Their final results indicate that
customer satisfaction, perceived value and trust accounted for 85% of the variance
in customer loyalty. Results also indicate that 62% of the variance in customer
satisfaction was explained by perceived value. These results support prior studies,
namely that customer satisfaction and perceived value are important predictors of
customer loyalty and that customer satisfaction is the result of customer perception
of value received.
Finally, to enhance customer satisfaction, an organisation can engage in efforts to
improve the value perceived by their customers by focusing on activities with a high
importance rating (Lam, Shankar, Erramilli and Murthy, 2004: 308). Of all service
products, quality is one of the most expected by customers. Therefore, a high and
unique way of quality will win customers and make them loyal towards an
organisation in the long run. In other words, the key to a competitive advantage is to
deliver quality service that will enhance customer satisfaction.
The role of front-line employees in service quality and customer satisfaction will be
discussed in detail in Chapter 3.
2.8 THE RELEVANCE OF CUSTOMER RETENTION AND CUSTOMER LOYALTY
In competitive environments, an increasing number of organisations apply their
strategies to attract customers, to keep these customers as long as possible, and to
encourage customers to increase their purchases by developing personal and lasting
relationships with them. Khan (2014: 109) further indicates that relationship
marketing can increase customer retention, if management build long-term
relationships with their customers.

36
These relationships must benefit both the customer and the organisation. By building
strong customer relationships and focusing on the factors that influence these
relationships, management will be able, over time, to understand their customers’
expectations. Khan (2014: 109) further indicates that the objective of a marketing
strategy is to deliver value to customers. Organisations’ level of relationship
marketing strategies is positively correlated with both organisational performance
and the level to which strategic competitive advantage is achieved in the
marketplace. This can, over time, contribute to the closure of Gap 1.
Customer loyalty is vital to organisational performance, as loyal customers will
generate more sales, a steady cash flow and improve profits and thus be the key to
organisational success and profitability. A loyal customer is a major asset to any
organisation, as s/he reduces the need to seek new customers (Dimitriades, 2006:
782-785; Albarq, 2013: 701).
Therefore, customer loyalty refers to the behavioural intentions of the customer and
the likelihood that s/he will return to the organisation (Salanova, Agut and Peirό,
2005: 1217). Research has shown that excellent employee performance is related to
customer loyalty, and that a favourable service climate also has a positive influence
on customer loyalty (Pride and Ferrel, 2010: 371). Various other factors also explain
why customers remain loyal to an organisation, namely customer satisfaction with
service, the image of the organisation, the satisfactory manner in which complaints
are handled, communication between the organisation and its customers, and trust
in the service provided (Ball, Coelho and Vilares, 2006: 392).
In view of the importance of customer loyalty to organisations, the results of a study
by Lin and Wang (2006: 279) indicate that customer loyalty is affected by perceived
value and customer satisfaction, on the one hand, whereas customer satisfaction
plays an important role in perceived value and customer loyalty, on the other. There
is thus a positive link between customer loyalty and organisational profitability. Lin
and Wang further explain that loyal customers are less likely to switch to another
organisation because of price. Loyal customers will rather make more purchases
than non-loyal customers; they are less likely to shop around and provide repeat
business. The loyal customer will help promote the organisation by word-of-mouth,

37
business referrals, and provide references. In fact, a loyal customer is an
organisation’s best advertising medium; increases sales by purchasing a wider
variety of products, and will also make more frequent purchases. A loyal customer
spreads positive word-of-mouth and makes positive recommendations. Other
dimensions of customer loyalty are resistance to switching to another organisation,
identifying with the service, and preference for a particular service (Dehghan and
Shahin, 2011: 4; Kheng, Mahamad, Ramayah and Mosahab, 2010: 57).
Salanova et al. (2005: 1224) conducted a research study in which 114 units (58 hotel
receptionists and 56 front-desk staff for restaurants) and 342 contact employees
participated. From each unit, 3 employees and 10 customers participated. Their
results indicate that there is a link between service climate and customer loyalty. In
addition, their study also shows that the greater the service climate, the highest the
customer loyalty, and the highest the customer loyalty, the greater the service
climate. Their results thus indicate that a positive service climate can be associated
with customer loyalty. Their findings are also in line with previous research indicating
a positive relationship between service climate and customer loyalty. Finally,
customer satisfaction can be viewed as a basis for customer loyalty. It is clear from
the literature that there is a relationship between customer satisfaction and customer
loyalty (Ball et al., 2006: 392).
The Gaps Model of Service Quality, definitely the best known service-quality model,
is used to improve service quality and plays a significant role in services marketing
literature. It implies that all service quality gaps need to improve and be closed in
order to increase customer satisfaction.
Closing the Customer Gap (the gap between customer expectations and their
perception of service) is important in rendering a quality service, which is also the
basis of the Gaps Model. This model provides information to management and helps
them understand how service quality emerges. Service quality and customer
satisfaction are two of the core concepts in an organisational environment, and the
key to a sustainable competitive advantage.

38
2.9 THE GAPS MODEL OF SERVICE QUALITY
Parasuraman et al. (1983, 1985, 1988, 1990, 1991, 1993) did intensive work on
service quality and developed an extended model of service quality based on the
gaps between customer expectations of service and what they perceive. This model
is called the Gaps Model of Service Quality (Kotler and Keller, 2009: 400, Grönroos,
2007: 114; Boshoff and du Plessis, 2013: 48-51; Clow and Kurtz, 2004: 86-100).
The authors of the Gaps Model of Service Quality point out that a customer’s
perception of service quality depends on the four gaps that exist in an
organisation/customer environment. They found that closing the gap between what
customers expect and what they perceive is critical in delivering a quality service.
From a managerial point of view, the identification of service quality gaps is a useful
approach, since this Model serves as a framework for organisations to improve their
quality of service and their marketing services.
Organisational management finds this Model useful in identifying differences
between standards and delivery to those standards. The difference can be used to
explain customer satisfaction and to identify areas in need of improvement. Once a
gap is identified a plan can be developed to bridge the gap. However, a gap analysis
involves internal and external analysis, where external analysis relates to
communication with customers, and internal analysis relates to service design and
service delivery. Furthermore, this Model shows how information with respect to
customer expectations and front-line employees’ interpretation and perception of
customers’ requirements has been altered (Boshoff and du Plessis, 2013: 49).
The Gaps Model of Service Quality comprises two main categories, namely the
Customer Gap and the Provider Gap. These Gaps occur within a service-providing
organisation. The Customer Gap represents the difference between a customer’s
expectation and perception of a service encounter. The Provider Gap consists of 4
Gaps, namely the Listening Gap, the Services Design and Standards Gap, the
Service Performance Gap and the Communication Gap (Seth, Deshmaukh and Vrat,
2005: 916; Grönroos, 2007: 115). These four Gaps, which occur within service
organisations, are responsible for the Customer Gap.

39
In order to close the Customer Gap, the Provider Gaps (Gaps 1 to 4) need to be
closed. The Marketing Association of Australia and New Zealand proposes that the
following equation thus applies: Customer Gap=f (Gaps 1 to 4) (Yadav and
Dabhade, 2013:82). Thus, the magnitude and the direction of each Gap in the Model
will affect the quality of service. Wolniak and Skotnicka-Zasadzien (2011: 1243)
found that the Customer Gap is an outcome of all the other Gaps.
To compete successfully, organisations need to understand customers’ perceptions
of quality as well as the manner in which service quality is influenced. Currently,
more organisations are realising that their key challenge is managing quality service.
Organisations are experiencing service gaps, due to the perception and expectations
of their customers; this, in turn, generates opportunities for organisations to improve
their services and systems. Research indicates that the service quality gaps affect
service delivery; therefore, management should endeavour to prevent these gaps as
early as possible (Shahin and Samea, 2010: 6).
2.9.1 The Customer Gap The Customer Gap, also referred to as “Gap 5” (see Figure 1.1 Page 3) (Wolniak
and Skotnicka-Zasadzien, 2011: 1241; Kong and Muthusamy, 2011: 148;
Renganathan, 2011: 159; Shahin and Samea, 2010: 2) is the central focus of the
Gaps Model and can be defined as “the distance we have with our customers, a
measure of the degree of disconnection we have with them” (Gafo, 2010). In other
words, the bigger the disconnection, the bigger the Customer Gap will be. This Gap
represents the difference between what customers expect and what they perceive.
Wolniak and Skotnicka-Zasadzien (2011: 1245) indicate that the Customer Gap can
be written as “Expected quality by a customer = perceived quality – expected
quality”. Thus, the gap between a customer’s expectations and a customer’s
perceptions leads to customer dissatisfaction. Organisations experience this Gap,
due to the difference in customers’ expectations and perceptions of service quality
(see Figure 2.6). Therefore, in order to satisfy customers, this Gap needs to be
closed so that competitive advantage can be achieved by exceeding customer
expectations. Wolniak and Skotnicka-Zasadzien also states that the result of the
Customer Gap can be predicted, namely that the higher the Customer Gap, the

40
higher the risk of generating customer dissatisfaction and losing customer loyalty will
be. This Gap consists of five dimensions of service quality, namely tangibles (all
physical facilities and equipment as well as front-line employees and other staff
appearances), reliability front-line employees ability to perform a service as promised
by the organisation), responsiveness (the willingness of the organisation to listen to
their customers), assurance (this is the skills, knowledge and courtesy of front-line
employees), and empathy (caring for the customers as well as individual service to
the customers) (see Figure 2.3 Page 31) (Pride and Ferrell, 2010: 370). The
customer’s evaluation of the service quality dimension will be influenced by the
service delivery process (Boshoff and du Plessis, 2013: 170).
According to Wolniak and Skotnicka-Zasadzien (2011: 1241-1247), Renganathan
(2011: 162), Urban (2009: 633) as well as Shahin and Samea (2010: 2), the main
factors leading to this Gap are:
• Gap 1: Management does not know what their customers expect; thus their
perception of customers’ expectations differs from customer’s actual needs and
desires.
• Gap 2: Management does not select an appropriate service design and
standards; thus, even if they are aware of customers’ needs, these may not be
turned into appropriate service specifications.
• Gap 3: Organisations do not deliver according to service standards; thus,
service quality specifications are not met.
• Gap 4: Organisations do not match performance promises; thus their market
communication activities are not consistent with their service delivery.
2.9.2 The Provider Gap This Gap consists of four internal quality gaps (organisational) that represent quality
losses and that interact with one another in many ways. In order to close the
Customer Gap, all these Gaps (Gaps 1 to 4) need to be closed (Wolniak and
Skotnicka-Zasadzien, 2011: 1243).

41
Gap 1: The Listening Gap
This Gap represents the difference between the customer’s expectation towards a
service and the organisation’s perception of the customer’s expectation towards the
quality of service offered (see Figure 2.5).
Figure 2.5: Gap 1: The gap between a customer’s expectation and the organisation’s perception Source: Wolniak and Skotnicka-Zasadzien (2011: 1241)
Differences in this Gap occur because management are not aware of their
customers’ expectations. This means that management do not know and are unable
to predict the factors that constitute a high-quality service. Therefore, this Gap
occurs mainly due to inaccurate and insufficient information obtained from market
research; the incorrect interpretation of customers’ expectations; inadequate service
recovery; poor communication in the organisation, and poor flow of information
between all parties involved (Wolniak and Skotnicka-Zasadzien, 2011: 1241).
Gap 2: The Service Design and Standards Gap
This Gap occurs because of the difference in the organisation’s understanding of
customers’ expectations towards service and the quality of service provided (see
Figure 2.6).
EXPECTED SERVICE
Customer’s expectation towards an expected service
Gap 1 PERCEIVED SERVICE
Organization’s perception of customer’s expectations towards
the quality of service offered
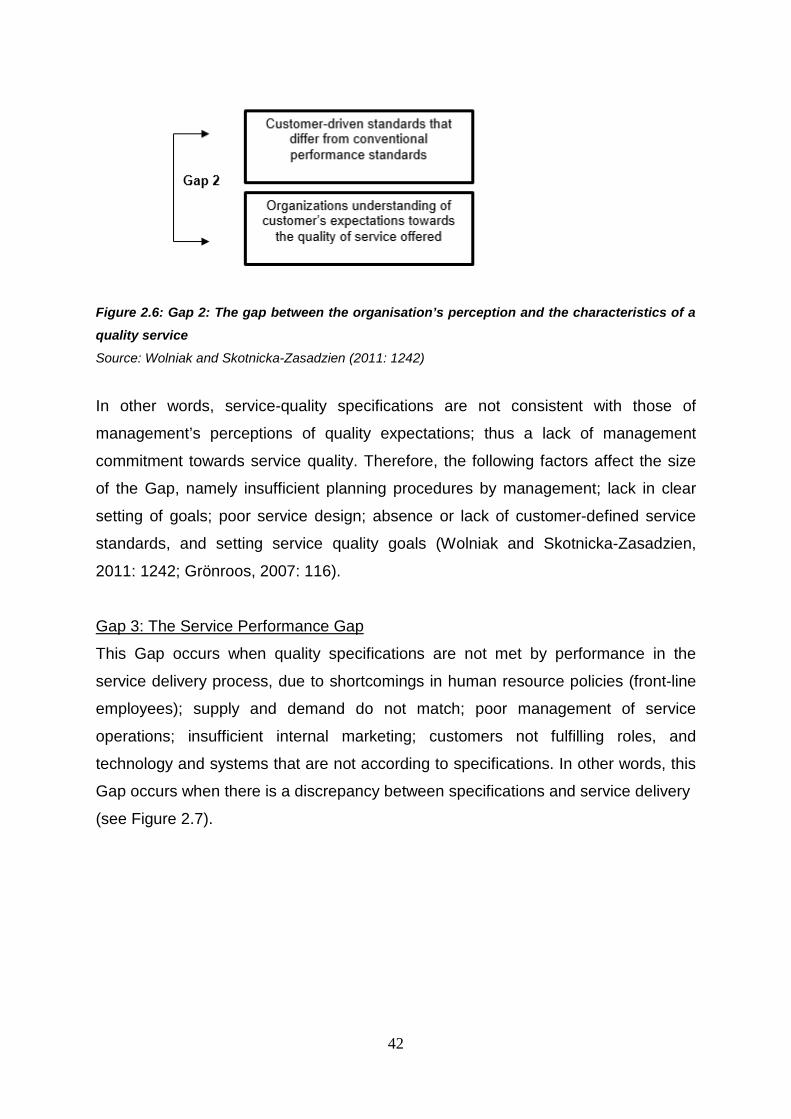
42
Figure 2.6: Gap 2: The gap between the organisation’s perception and the characteristics of a quality service Source: Wolniak and Skotnicka-Zasadzien (2011: 1242)
In other words, service-quality specifications are not consistent with those of
management’s perceptions of quality expectations; thus a lack of management
commitment towards service quality. Therefore, the following factors affect the size
of the Gap, namely insufficient planning procedures by management; lack in clear
setting of goals; poor service design; absence or lack of customer-defined service
standards, and setting service quality goals (Wolniak and Skotnicka-Zasadzien,
2011: 1242; Grönroos, 2007: 116).
Gap 3: The Service Performance Gap
This Gap occurs when quality specifications are not met by performance in the
service delivery process, due to shortcomings in human resource policies (front-line
employees); supply and demand do not match; poor management of service
operations; insufficient internal marketing; customers not fulfilling roles, and
technology and systems that are not according to specifications. In other words, this
Gap occurs when there is a discrepancy between specifications and service delivery
(see Figure 2.7).
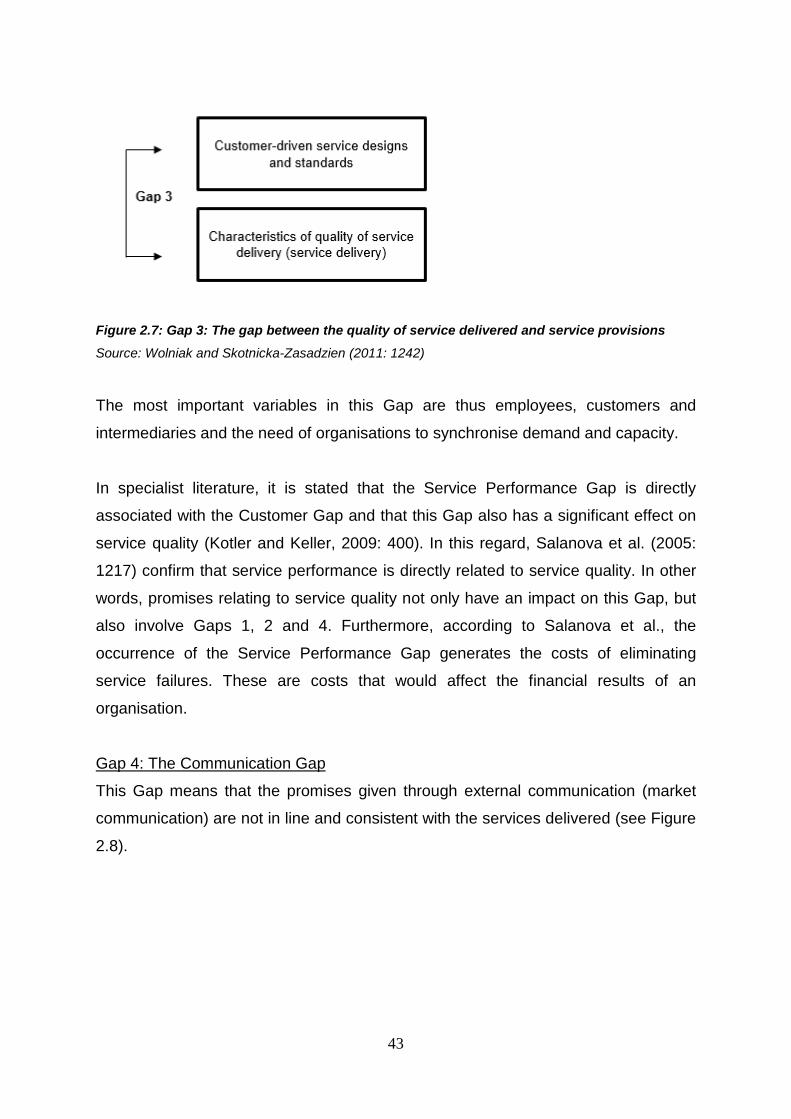
43
Figure 2.7: Gap 3: The gap between the quality of service delivered and service provisions Source: Wolniak and Skotnicka-Zasadzien (2011: 1242)
The most important variables in this Gap are thus employees, customers and
intermediaries and the need of organisations to synchronise demand and capacity.
In specialist literature, it is stated that the Service Performance Gap is directly
associated with the Customer Gap and that this Gap also has a significant effect on
service quality (Kotler and Keller, 2009: 400). In this regard, Salanova et al. (2005:
1217) confirm that service performance is directly related to service quality. In other
words, promises relating to service quality not only have an impact on this Gap, but
also involve Gaps 1, 2 and 4. Furthermore, according to Salanova et al., the
occurrence of the Service Performance Gap generates the costs of eliminating
service failures. These are costs that would affect the financial results of an
organisation.
Gap 4: The Communication Gap
This Gap means that the promises given through external communication (market
communication) are not in line and consistent with the services delivered (see Figure
2.8).

44
Figure 2.8: Gap 4: The gap between promised quality service delivery and external communication Sources: Wolniak and Skotnicka-Zasadzien (2011: 1242)
Customers assessed the information provided by family, friends and commercials;
the main reasons for this Gap are poor market communication; too many promises;
inappropriate pricing; inadequate horizontal communication, and poor management
of customers’ expectations. Employees responsible for advertising as well as
marketing employees responsible for promotions must be held responsible for the
lack in external communication.
2.10 CLOSING THE PROVIDER GAP
In an ideal environment, customers’ expectations and perceptions of service delivery
would match; however, if that is not the case, a gap occurs. The secret to closing the
Customer Gap is to close the Provider Gap (gaps 1-4) and to keep it closed.
Therefore, Grönroos (2007: 114-118); Fitzsimmons and Fitzsimmons (2008: 109);
Wolniak & Skotnicka-Zasadzien (2011: 1242); Clow and Kurtz (2004: 93-100);
Boshoff and du Plessis (2013: 48-51) as well as Kotler and Keller (2009: 402-406)
identified the following strategies to close the Provider Gap in order to close the
Customer Gap:
Gap 1 The Listening Gap:
The above authors propose various strategies to minimise or close Gap 1. Improved
marketing research can be used to understand customers’ expectations. The best-
known survey, namely the SERVQUAL survey, may be an option. In this survey,

45
customers are requested to provide ratings of the service-quality dimensions
(reliability, responsiveness, empathy, tangibles, and assurance). The authors also
suggest upward communication (in other words, management must have some form
of customer contact); better communication between management and front-line
employees; a reduction in the number of levels of management; keeping and
improving relationships with current customers rather than attracting new ones, as a
current customer costs less than attracting a new one, and service recovery. This
Gap is perhaps the easiest of all the Gaps to close.
Furthermore, the said authors also proposed different strategies for service recovery,
namely that management must do the right thing first; they must follow up
complaints; solve problems immediately; provide adequate and logic explanations to
customers; treat customers fairly; develop a long-term relationship with their
customers; learn from previous experiences, and listen to customers who leave the
organisation. However, if problems are due to bad management, a change of
management or better knowledge regarding service competition is required (Boshoff
and du Plessis (2013: 51).
Gap 2 The Service Design and Standards Gap:
Grönroos (2007: 114-118) as well as Kotler and Keller (2009: 402-406) propose
various strategies to narrow or close this Gap. They indicate that commitment to
service quality by management and service providers is more important in closing
the quality gap than any other planning procedure. Therefore, all service standards
set by the organisation must be based on customer requirements.
As indicated earlier, services are intangible and process-oriented and it is, therefore,
difficult to communicate. Both front-line employees and customers play an important
role in the process of identifying customers’ needs for a new service. The
development of new services (service innovations) is an important driver of
competitive advantage. Therefore, in order to narrow or close this Gap,
management, service providers and front-line employees must be committed to
service quality and should agree on specifications and goals to deliver quality
service. Management needs to ensure that all services are clearly designed; that
new services are developed, and that existing services are improved. With this in

46
mind, Service Blueprint is a unique tool for service development and design. This
tool provides a graphic breakdown of the service systems in an organisation. This
visual process portrays all the steps in a logic order and is a useful technique in
developing a new service (Grönfeldt and Strother, 2006: 131-138).
In addition, hard and soft service standards, which are solely based on customers’
requirements and expectations, must be set and in place and they must reflect
customers’ expectations of service quality. This can have a positive result on the
closure of Gap 2 as well as on the Customer Gap. It is important to note that
tangibles (servicescape) such as interior and exterior attributes have an enormous
impact not only on how customers interpret messages sent out by an organisation,
but also on the evaluation and experience of their service. Management may make
use of designers to create a service environment that supports the services offered
by the organisation. Therefore, by using servicescape, Provider Gap 2 can finally be
closed effectively (Mudie and Pirrie, 2006: 83).
Gap 3 The Service Performance Gap:
The evidence of previous research by Grönfeldt and Strother (2006: 131-138),
Grönroos (2007: 116-118), as well as Mudie and Pirrie (2006: 84-110) identified a
number of variables to close this Gap, namely employees, customers, intermediaries
(for example, retailers, agents, and so on) and the need of organisations to
synchronise demand and capacity.
The role of front-line employees is critical in the closure of this Gap. Therefore,
human resources must ensure that the best candidates are appointed; provide the
necessary training to enable them to deliver according to service-quality standards;
ensure that the necessary support systems (tools and techniques) are available for
front-line employees to do their job, and to have measures in place to retain the best
front-line employees. Front-line employees must also take responsibility for a job
done. This gap could be narrowed through the improvement of internal
communication, empowerment of front-line employees and to find and develop
solutions to service problems (Boshoff and du Plessis, 2013: 50).

47
Secondly, the role of customer in the organisation is equally important, and
management must understand their customers; develop strategies to enhance
customer participation; reward customers for their contribution in the organisation,
and find ways in which to control and motivate intermediaries to organisational goals.
Demand and supply must match in order to deliver quality service.
Front-line employees, as the key role players in this Gap, are discussed in detail in
Chapter 3.
Gap 4 The Communications Gap:
The closure of this Gap depends on various factors such as the proper coordination
of communication in and outside an organisation. Management and front-line
employees must be in agreement regarding their communication to customers.
Therefore, the service promises made by front-line employees and the organisation
itself must not be overpromised. Management should pay more attention to their
advertising campaigns and ensure that they are accurate and realistic. Advertising
objectives must address service variables such as intangibility, heterogeneity,
perishability and inseparability. Advertising campaigns should be an actual statement
of what the target market is about to receive – for example, price and quality. This
contributes to the creation of customer loyalty and brand awareness. Management
must not only manage customers’ expectations, but also educate customers in terms
of the service process (Grönroos, 2007: 116; Mudie and Pirrie (2006: 180-198).
2.11 SUMMARY
The literature studied confirms Grönroos’s (2007) conclusion that the gap analysis
should be used not only to guide management in an effort to find reasons for quality
problems and losses, but also to discover ways in which to close those gaps. By the
same token, it is also essential that management understand customers’
expectations and that the gaps in service quality be identified. The information
obtained can assist management in identifying cost-effective ways to close these
gaps. Thus, every organisation should analyse its own specific quality gaps,
beginning with customers’ expectations and complaints. Literature studies indicate
that customer satisfaction leads to repeat purchases. These, in turn, lead to loyal

48
customers. These, in turn, lead to enhanced brand equity and subsequent higher
profits. Therefore, in order for organisations to obtain a higher customer loyalty,
management need to continuously endeavour to increase value as perceived by
their customers by increasing service quality and enhancing customer satisfaction.
Understanding the factors that have an impact on service quality and customer
satisfaction is of great importance to every service organisation. Thus, to enhance
AVBOB’s service quality perception amongst their customers, the Customer Gap
needs to be closed. The Provider Gap (gaps 1-4) needs to be closed by
management and front-line employees.

49
CHAPTER 3
FRONT-LINE EMPLOYEES AS KEY ROLE PLAYERS IN THE SERVICE PERFORMANCE GAP (GAP 3)
3.1 INTRODUCTION
Given the competitiveness of the service sector in the world, especially in developed
countries, but also in South Africa, increasing attention is being paid to the various
strategies to improve customer service. In order to differentiate themselves from their
competitors in some way, many organisations are focusing on the quality of
customer service as their means of differentiation, whereas other organisations tend
to develop a closer relationship with their customers in order to increase customer
satisfaction and customer loyalty (Boshoff and du Plessis, 2013: 33-54).
There is substantial evidence in the literature on service marketing to confirm that
customer service is a major factor for organisations, not only to gain and increase
their market share, but also to compete in the competitive market of the 21st century.
Organisations that provide a customer-oriented quality service that meets or exceeds
customer expectations have a major competitive advantage (Grönroos, 2007: 94,
144-147; Boshoff and du Plessis, 2013: 36-51).
Although technology and physical resources offer valuable support, organisations
depend more on their front-line employees than on any other staff members. The
reason being that these employees are in a position to follow up on some critical
aspects such as quality service rendered, attend to customers’ wishes, and take
corrective action when required. The importance of front-line employees has been
confirmed in various studies such as that of Grönroos (2007: 366), Zeithaml et al.
(2009: 374), Grönfeldt and Strother (2006: 38-40), as well as Baptiste (2008: 291)
who have indicated that these employees are a crucial resource for any organisation.
The importance of front-line employees is directly linked to Provider Gap 3, namely
the Service Performance Gap.

50
It is also important to bear in mind that some services are delivered in the workplace
(for example, a radio station), whereas others are delivered at the customer’s home
(for example, plumber or postman), or at the service site (for example, a hairdresser
or airline baggage-handling staff). Thus, in most of the services rendered, the
customer needs to be physically present. This study focuses on service delivery at a
service organisation, more specifically AVBOB, which means that the customer and
front-line employee are physically present and thus forced to interact with each
other.
In the literature, front-line employees are referred to as those employees who
interact with customers directly thus customer-contact employees (Grönroos, 2007:
365), whereas Zeithaml et al. (2009: 351) refer to them as “service employees”.
In addition, the interaction between the customer and the front-line employee
provides a potential for an organisation to both improve service quality and achieve
customer loyalty. Customers are not concerned about the profit they are generating
for the organisation; they rather expect the organisation to meet their needs.
Although the “customer” may be an individual or a member of a group, it is important
to bear in mind that the organisation must be geared to the customer’s wishes and
needs (Dimitriades, 2006: 783-785).
With this in mind, Boshoff and du Plessis (2013: 196) indicate that front-line
employees contribute directly to service quality, because their attitude and behaviour
impact on the customer’s evaluation of services. They also point out that
management need to endeavour to enhance a positive service climate that will guide
front-line employee behaviour and ensure quality.
Therefore, strategies must be developed with an eye on the customer who must be
viewed as an asset that needs to be valued, developed and retained. It is, therefore,
important to bear in mind that, from a customer’s point of view, the most important
service impression occurs during a service encounter when the customer and front-
line employees interact. It is, therefore, important to note the role of front-line
employees in service delivery.

51
Figure 3.1: Focus on customer-oriented service delivery Source: Zeithaml et al. (2009: 376)
3.2 GAP 3: THE SERVICE PERFORMANCE GAP
The fundamental reason for the occurrence of this Gap is that human resource
issues are not in place (Grönroos, 2007: 116-118). This means that front-line
employees are unable or unwilling to perform a service at the desired or prescribed
level. Wolniak and Skotnicka-Zasadzien (2011: 1242) and Boshoff and du Plessis
(2013: 50-51) state that this Gap is the difference between the standard of service
quality and the actual service delivered.
There are different reasons for the existence of this Gap. Grönroos (2007: 116-118)
and Ueno (2010: 76) indicate that this Gap is mainly due to organisational
specifications that are too rigid and front-line employees who are not in agreement
with, and do not adhere to these specifications; organisation specifications that are
not in line with the corporate culture; poor management of the service operations,
and a lack of internal marketing, technology and systems.
In other words, the most important variables in this Gap are employees, customers
and intermediaries. In specialist literature, it is stated that the Service Performance
Gap is directly associated with the Customer Gap and that this Gap also has a
Manager
Frontline
Supervisor
Frontline
Frontline Frontline
Frontline
Frontline
Frontline
Frontline
Supervisor
CUSTOMERS

52
significant effect on service quality (Kotler and Keller, 2009: 400). Furthermore,
according to Kotler and Keller, the occurrence of the Service Performance Gap
generates the costs of eliminating service failures. These costs would affect the
financial results of an organisation.
This chapter focuses on the role of front-line employees. In the following section, the
role of the front-line employees, the reasons for the occurrence of this Gap as well
as strategies for closing this Gap are discussed.
3.3 THE ROLE OF FRONT-LINE EMPLOYEES
It is important to note that the people’s component plays a crucial role in the service-
delivery process. “People” refers to front-line employees, customers and all other
human role players involved in the service process. In the case of AVBOB and all
service organisations, front-line employees provide a link between external
customers and the internal operations of an organisation; their role in customer care
cannot be sufficiently emphasised (Lamb et al., 2008: 414).
These employees are vital for the success of any organisation. They are in
immediate contact with the customer and are instrumental in the inter-active
marketing process. The employment of suitable front-line employees will enhance
and contribute to the success of any organisation. In fact, they are so essential that
Zeithaml et al. (2009: 352) regard them as “the service” and “the organization in the
customer’s eyes”. What makes them so special is that they are employed to attend
to the customers’ wishes and demands and to follow up on the quality of service
rendered. They are the first contact employees in the service-delivery process and
act as part-time marketers for the organisation. Not only do they serve the customer,
but they also represent their employer. Thus, front-line employees play a crucial role
in service delivery, as they are contributing towards an organisation’s future and
success. Such organisations are recognised by the abilities of their skilled and
motivated front-line employees.

53
Customer satisfaction, through focused quality customer service, remains the key to
profitability and, in many instances, front-line employees are the reason for
customers returning to AVBOB. However, they can also be the reason why
customers do not return, as everything they do or say may influence the customer’s
perception of the organisation.
In addition, front-line employees act as representatives of an organisation and can
thus directly influence customer satisfaction. Therefore, they play the role of
marketers. They act as a human advertising board when selling a product or service.
For example, an off-duty employee may act unprofessionally or make a rude remark
– this will reflect negatively on AVBOB. In some instances, employees such as bank
assistants or professional nurses may wear a company uniform. In addition,
customers often tell stories of dreadful experiences at service-delivery companies, in
which a front-line employee often plays a prominent role therein.
Front-line employees are also the brand of their organisation. An example is
Morrison’s, a company in the United Kingdom, whose effective front-line employees
deliver quality service. They are committed to a sustainable and high-quality
customer service, while their strategy is to provide the best customer service and to
develop the best-trained and motivated staff. In 2010, the company had over 131
000 employees, serving over 11 million customers weekly. The company also won
the Employer of the Year Award in 2011, which demonstrates their focus on staff and
their ability and commitment to exceptional customer service.
To enable them to develop their front-line employees to satisfy customers in the best
possible way, Morrison’s focus on training, coaching and communication. Front-line
employees are encouraged to engage with customers; this leads to repeat trade by
some of the 11 million customers visiting their store weekly. The company believes
that the four key components of quality customer service are information, specialist
attention, after-sales service, and convenience. The company also believes that it is
more cost effective to retain its customers than to attract new ones.

54
The lesson learned from this company is that effective management involves the
understanding of employee behaviour, training, motivating and rewarding front-line
employees to exhibit those behaviours.4
On account of their role as bridging workers, front-line employees are the first to
interact with customers and are, therefore, in a privileged position because they not
only spend a great deal of time directly with customers, but also collect first-hand
market information (Coelho, Augusto and Lages, 2010: 31).
No organisation can be successful if front-line employees are not happy in their
working environment. Bearing this in mind, front-line employees are also linked to
customer satisfaction. The service profit chain confirms this relationship (see Figure
3.2) and indicates that there are links between service quality, employee satisfaction,
employee productivity, value of the service provided to the customer, customer
satisfaction, customer retention, and customer profits. Thus, according to the service
profit chain, customer satisfaction is influenced by the value of service quality, while
service quality is influenced by customer loyalty (Klopper et al., 2006: 206: Boshoff
and du Plessis, 2013: 195).
Figure 3.2: The service profit chain Source: Zeithaml et al. (2009: 354)
Front-line employees’ willingness, appearance and manners influence the degree to
which customers are satisfied with the service rendered to them.
4 Retrieved from www.thetimes100.co.uk. [Accessed 23 August 2013].

55
3.4 FACTORS CONTRIBUTING TO FRONT-LINE EMPLOYEE SERVICE QUALITY ISSUES
In the literature on service marketing, work and non-work factors have been
identified as having an influence on front-line employee performance (see Table 3.1).
Not only do these factors influence the effectiveness and competency of front-line
employees, but they also widen the Service Performance Gap.
Table 3.1: Factors contributing to front-line employee service-quality issues
Authors Factors
Marin-Garcia, Bonavia and Losilla
(2011: 3-6)
Uncertainty among front-line employees as to what is
expected of them results in their being less
cooperative, not committing themselves, and having
no trust in the organisation.
Coelho et al. (2010: 31-45) Front-line employees hold unstructured jobs
Gudergan, Beatson and Lings (2008: 28) Individual characteristics of front-line employees. For
example, their need for feedback, role motivation,
communication style, and organisational commitment.
Some of these factors can also influence the service
behaviour of front-line employees.
Hui, Chiu, Yu, Cheng and Tse (2007: 152) Service climate and ineffective leadership also
significantly influence employees’ service quality.
Front-line employees are not always trained to
understand customers. In fact, they are often
underpaid and untrained. This results in low levels of
motivation, job dissatisfaction, a high staff turnover,
and mostly dissatisfied customers.
Karatepe (2013: 614-616) Front-line employees are underpaid and experience
role stress as well as family-work conflict and family
conflict; family interference with work-related
responsibilities. Front-line employees are
undertrained, underpaid and overworked.
Mudie and Pirrie (2006: 146-150) Role ambiguity, role conflict, role overload,
employee/job mismatch, performance measured on
quantity and not quality, lack of empowerment, lack of
common purpose, lack of management commitment
and role tension are factors that contribute to staff
dissatisfaction and ineffectiveness.

56
Kumar, Kee and Manshor (2009: 211-
214)
Role ambiguity and conflict, poor employee job-fit,
inappropriate supervisory control systems, lack of
teamwork, poor technology job-fit and lack of
perceived control as factors that influence employee
effectiveness.
Zeithaml et al. (2009: 357) Emotional labour, person/role conflict,
organisation/client conflict and interclient conflict.
Not only do the above factors influence front-line employee performance, but their
behaviour is also influenced by organisational culture and the values and norms of
the organisation. Organisational culture is “the glue” that keeps an organisation
together and is the way in which an organisation exerts control over its employees
and their behaviour (Grönfeldt and Strother, 2006: 267). In addition, their perceptions
of the organisation’s service culture and subsequent support by management have
an important influence on their behaviour, work effort, job satisfaction and service
quality (Yoon, Beatty and Suh, 2001: 513; Marin-Garcia et al., 2011: 3) (see Figure
3.3). Unfortunately, a leader who does not have a strong leadership and who does
not realise the organisation’s values will not build and sustain a service culture.
Figure 3.3: Influence of work climate on front-line employee service quality Source: Yoon, Beatty and Suh (2001: 512)
Service culture
Work effort
Employee service quality
Support from management
Job satisfaction

57
A discussion of some of the factors that contribute to front-line employees’ service-
quality issues now follows.
• Emotional labour
In the literature on service marketing, much has been mentioned regarding
emotional labour. Mudie and Pirrie (2006: 133) refer to emotional labour as those
jobs that go beyond physical and mental skills needed to deliver a quality service.
This includes actions such as smiling when serving a customer, eye contact,
showing interest and engaging in a conversation with customers of whom some are
unknown to front-line employees. These actions require emotional labour from the
front-line employees who may experience a bad day and are still expected to put on
the face of the organisation when dealing with customers.
Mudie and Pirrie (2006: 133) also indicate that there are two types of displayed
emotional labour, namely “surface acting and deep acting”. In the former, front-line
employees are required to act as being happy and empathetic, whereas, in the case
of AVBOB, front-line employees are expected to feel and experience the emotions of
the customer.
Mudie and Pirrie indicate that emotional labour creates stress, as front-line
employees may experience a decrease in job satisfaction and be emotionally
exhausted. They also point out that, if front-line employees are unable to master
emotional labour, they will endeavour to evade the situation.
Kinman’s (2009: 118-130) and Wong and Lin’s (2006: 726-728) findings are
consistent with those of Mudie and Pirrie (2006: 133), namely that emotional labour
can lead to emotional exhaustion and job dissatisfaction. It could also result in
psychological distress that has an impact on employee well-being; it may also “spill
over” into other domains of the employee’s life, leading to conflict between work and
home roles, sleeping problems, exhaustion, irritability and even social withdrawal. In
addition, Mudie and Pirrie explain that emotional labour may also impair family life
and leisure activities and point out that emotional labour is present in approximately
two-thirds of workplace communication (Mudie and Pirrie, 2006: 133).

58
• Role ambiguity
Front-line employees do not often understand what management expect of them,
and become frustrated with customers (Mudie and Pirrie, 2006:147; Coelho et al.
2010: 34).
• Person/role conflict
Present economic circumstances compel an increasing number of women to enter
the workforce. However, due to work responsibilities, new demands may conflict with
specific roles within the traditional family. On the other hand, the husband may find
that his household duties increase when his wife is working (Hsu, 2011: 234). For
these reasons, front-line employees may find that they have little time left for family
responsibilities, and this may increase the likelihood of conflict between work and
family responsibilities (Hoffman, et al. 2009: 300; Lin et al., 2013: 178-179; Clow and
Kurtz, 2004: 97; Netemeyer, Maxham and Pullig, 2005: 130-133).
Empirical research by Mathies and Burford (2011: 636-637) indicates that gender
differences in service roles still prevail. They argue that, in some organisations,
either male or female front-line employees dominate front-line services. They
continue by stating that women, in general, tend to fill front-line employee positions,
whereas men are usually associated with technical competence and practical tasks.
According to the authors, women experience higher levels of role ambiguity, role
conflict, more mental stress and emotional labour than men. They also explain that
female front-line employees tend to be more emotionally exhausted and take on
greater responsibilities. Therefore, they find it more difficult to separate their work
and non-work tasks.
Zeithaml et al. (2009: 356) mention that role/person conflict may arise when
employees are requested to wear specific clothing or change their appearance to
suit job requirements. Mudie and Pirrie (2006: 147) argue that role conflict may arise
in situations where employees are in a subordinate role, which implies that the
service provider has no expertise or ability to deliver the service.

59
• Lack of empowerment
Empowerment is the process whereby front-line employees are given the power and
autonomy to act and exercise control over job-related issues and situations. When
employees have no autonomy or may not use their discretion when handling
customers, they may find their jobs very frustrating (Mudie and Pirrie, 2006: 149).
• Organisation/client conflict
Zeithaml et al. (2009: 357-358); Hoffman, et al. (2009: 301) and Boshoff and du
Plessis (2013: 203) address this issue stating that this type of conflict arises between
the organisation (management) and the customer. A demanding customer may
cause an employee to choose whether to follow organisation rules or satisfy
customer demands. Conflict is greatest when the front-line employee believes that
the organisation’s policies are wrong and that he must decide whether or not to
follow these policies.
• Interclient conflict
This occurs when a front-line employee is serving a few customers simultaneously
and spends additional time with one customer, for example a bank teller meeting the
customer’s needs. Waiting customers may become annoyed and dissatisfied
because their needs are not met. Front-line employees may find it difficult to serve
many customers simultaneously (Mudie and Pirrie, 2006: 149; Hoffman, et al., 2009:
302; Boshoff and du Plessis, 2013: 204).
• Performance measured on quantity
Performance measured on quantity and not quality is another factor, as some
organisations are more interested in employee efficiency than employee
effectiveness and in the number of customers they serve. Such circumstances may
dishearten front-line employees’ experiences, placing additional demands and
pressure on front-line employees (Mudie and Pirrie, 2006: 149; Boshoff and du
Plessis, 2013: 204-205).

60
• Role overload
When jobs are badly designed, front-line employees are expected to do more than
they can. This causes frustration and dissatisfaction with employee performance
(Mudie and Pirrie, 2006: 148).
• Lack of a common purpose and of management commitment
Front-line employees may feel isolated in their positions, as they may believe that
fellow front-line employees and management do not back them. They may also feel
that management say one thing and do another. This may cause front-line
employees to become disenfranchised (Mudie and Pirrie, 2006: 149).
• Quality of job performance/Productivity
Some organisations expect front-line employees to be both effective and efficient, as
management expect them to deliver quality service. Front-line employees experience
additional pressure as they find it stressful to be simultaneously cost effective and
productive (Mudie and Pirrie, 2006: 149).
• Employee/job mismatch
Unsuitable persons are often appointed as front-line employees because of poor
recruitment and selection processes. In addition, some organisations are not
concerned with customer satisfaction and quality service, thus resulting in high
turnover rates among front-line employees (Mudie and Pirrie, 2006: 149).
• Role tension
Any of the above dissatisfactions can cause role tension. Not only does role tension
affect the level of front-line employee commitment, but it can also reduce job
satisfaction, and increase high levels of absenteeism and staff turnover (Mudie and
Pirrie, 2006: 149; Lin et al., 2013: 178).
As indicated earlier, front-line employees play an important role in any service
organisation. However, in some instances, they may be the cause of customer
dissatisfaction. Many reasons and factors within the organisation can contribute to

61
their dissatisfaction and high staff turnover. However, management can prevent this
from happening by managing effectively and implementing strategies.
3.5 MANAGING THE FACTORS THAT CONTRIBUTE TO FRONT-LINE EMPLOYEE SERVICE QUALITY ISSUES – CLOSE PROVIDER GAP 3
In order for AVBOB to close the Service Performance Gap (Provider Gap 3), a
combination of strategies is needed to ensure that front-line employees are willing
and able to deliver a quality service and that they are motivated to perform according
to organisational requirements (Mudie and Pirrie, 2006: 131-149; Ueno, 2010: 76;
Hoffman, et al. 2009: 306-312; Boshoff and du Plessis, 2013: 210-219; Clow and
Kurtz, 2004: 97-99).
Research on the Service Performance Gap has identified critical factors such as
employees, customers and intermediaries in order to close this Gap (Mudie and
Pirrie, 2006: 92; Zeithaml et al., 2009: 38-39). Numerous studies have identified
front-line employee performance and their contribution towards the closure of
Provider Gap 3 as being important (Zeithaml et al., 2009: 38-39; Urban, 2009: 631-
645).
Similarly, Dabholkar and Abston (2008: 959-961) findings are in line with those of
Zeithaml et al. (2009: 38-39), namely that co-operation, perceived control and
employee-job match affect the Service Performance Gap. It has become clear that
employee-job match emphasises the importance of job design, employee selection
and development in service performance. In addition, employee-job match,
perceived control, shared values, and supervisory control lead to trust and
commitment. This, in turn, leads to co-operation and ultimately ensures good service
performance.
Human resources can motivate front-line employees to deliver a customer-oriented
service. Zeithaml et al. (2009: 360-375) and Ueno (2010: 76) put the following
strategies forward to deliver service quality through effective front-line employees:
hire suitable people; develop people to deliver service quality; provide needed
support systems, and retain the best employees (see Figure 3.4). The importance of
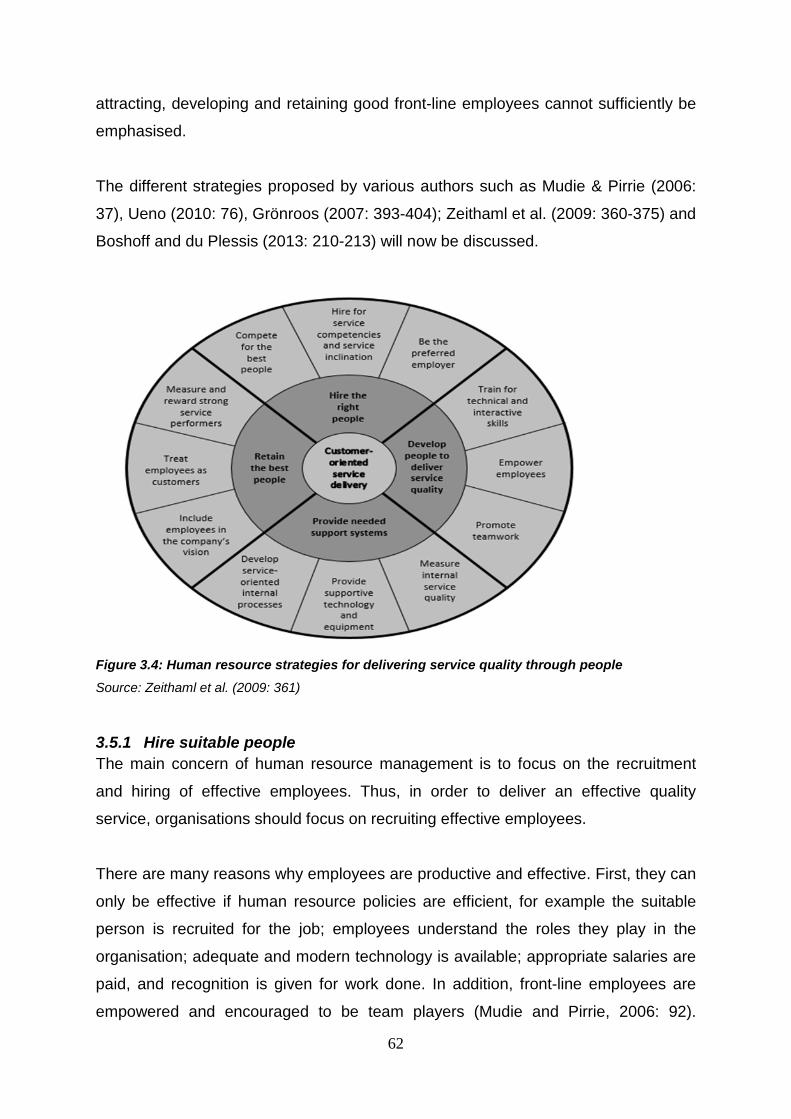
62
attracting, developing and retaining good front-line employees cannot sufficiently be
emphasised.
The different strategies proposed by various authors such as Mudie & Pirrie (2006:
37), Ueno (2010: 76), Grönroos (2007: 393-404); Zeithaml et al. (2009: 360-375) and
Boshoff and du Plessis (2013: 210-213) will now be discussed.
Figure 3.4: Human resource strategies for delivering service quality through people Source: Zeithaml et al. (2009: 361)
3.5.1 Hire suitable people The main concern of human resource management is to focus on the recruitment
and hiring of effective employees. Thus, in order to deliver an effective quality
service, organisations should focus on recruiting effective employees.
There are many reasons why employees are productive and effective. First, they can
only be effective if human resource policies are efficient, for example the suitable
person is recruited for the job; employees understand the roles they play in the
organisation; adequate and modern technology is available; appropriate salaries are
paid, and recognition is given for work done. In addition, front-line employees are
empowered and encouraged to be team players (Mudie and Pirrie, 2006: 92).

63
Responsibilities at home and at work are sources of dominant stress. The
unavailability of time for the individual him-/herself results in decisions regarding
work life. These, in turn, affect decisions about life at home and vice versa. In the
long term, this may result in tension which impacts on front-line employees’ health
(Ueno, 2010: 76-77; Boshoff and du Plessis, 2013: 210-211).
3.5.1.1 Compete for the best front-line employees
In order to recruit the best people, organisations must identify these employees and
compete with other organisations. Mudie and Pirrie (2006: 148) suggest that
organisations need to act as marketers to recruit the best employees and that the
key characteristic of employers is to provide opportunities for personal and career
growth. According to Mudie and Pirrie, when evaluating an organisation as a
potential employer of choice, employees examine the following factors: reputation,
culture, leadership, treatment of staff, opportunity for career growth, compensation,
and benefits.
3.5.1.2 Hire front-line employees for service competencies
Mudie and Pirrie (2006: 148) suggest that organisations attract new front-line
employees whose abilities and values can contribute to the organisation. They also
indicate that front-line employees must possess the skills, knowledge and potential
to perform the job. Potential employees must be screened to determine whether they
are interested in performing a service-related job (Boshoff and du Plessis, 2013:
211).
3.5.1.3 Be a preferred employer
To gain competitive positioning in order to attract and retain the best employees is to
be the preferred employer in a specific industry or location. An organisation must
endeavour to outperform its competitors by attracting the best and most talented
employees and by offering them the necessary training, career opportunities, internal
support, and attractive incentives (Zeithaml et al., 2009: 365-366). An employer of
choice can retain employees by including them in the organisation’s vision, treating
them as customers, as well as measuring and rewarding strong service performers.

64
3.5.2 Develop customer-oriented front-line employees In order to develop and maintain customer-oriented front-line employees who are
focused on delivering quality service, an organisation must develop its employees by
providing the necessary training, promoting teamwork, and empowering them
(Boshoff and du Plessis, 2013: 211).
3.5.2.1 Empowerment
A number of authors have discussed and researched the empowerment of front-line
employees in service delivery and the fact that empowerment contributes positively
to the morale of front-line employees (Mudie and Pirrie, 2006: 255; Boshoff and du
Plessis, 2013: 211-213; Grönroos, 2007: 401-404).
Empowerment is a means of improving workers’ satisfaction and increasing their
performance. Boshoff and du Plessis, (2013: 211-213) view the empowerment of
front-line employees mainly as a strategy to provide them with greater discretion and
autonomy. In fact, they found that there are different levels of empowerment, namely
full empowerment (also called flexible empowerment), limited empowerment, and no
empowerment.
Through full empowerment, front-line employees are given the latitude to decide
what would be best in order to solve a service problem. Some kind of authority is
delegated to the front-line employee through “limited empowerment”. Similarly,
Bradley and Sparks suggest that non-empowered front-line employees be trained to
refer problems to superiors who will then deal with customers.
Gudergan’s et al. (2008: 31-32) findings reveal that full empowerment of front-line
employees results in a higher satisfaction rate than the other two levels of
empowerment. However, results also indicate that there is no significant difference
between the other two forms of empowerment. Therefore, research has shown that
full empowerment of front-line employees can turn frustrated customers into satisfied
ones. It has also become clear that, when front-line employees use an
accommodating communication style, customer satisfaction varies depending on the
empowerment strategy used. By the empowerment of front-line employees,
customers may experience that they are being treated as special.

65
Grönroos (2007: 402) argues that, besides empowerment, front-line employees must
also be enabled to take responsibilities. This includes support from management,
knowledge support to analyse a situation in order to make a proper decision, and
technical support to provide front-line employees with the necessary information to
address situations.
Empowering front-line employees has the following benefits: they respond more
rapidly and more directly to customer needs and dissatisfied customers; they are
more satisfied with their jobs and feel better about themselves; customers are
treated with enthusiasm; empowered front-line employees are a valuable source of
ideas, and create good word-of-mouth referrals and increased customer retention
(Grönroos, 2007: 402-404).
3.5.2.2 Provide the necessary training
An important human resource strategy is employee training, as this may help reduce
anxiety and frustration. Training programmes for front-line employees will provide
them with the necessary technical skills, knowledge and interactive skills to deliver
service quality (Zeithaml et al., 2009: 366-367; Boshoff and du Plessis, 2013: 217).
Technical skills may be taught through formal education (for example, McDonald’s
Hamburger University) or through on-the-job training where theoretical and work
experience is combined (for example, internship programme). However, some
organisations have formal training programmes. For example, Honda has a training
programme which involves going to 21 cities to train 7 500 people (Pride and Ferrel,
2010: 528). Front-line employees also need training in interactive skills which,
according to Grönroos (2007: 373), are intertwined with technical skills.
Based on their review of literature, Gudergan et al. (2008: 31-32) indicate that front-
line employees require training in order to understand the service-delivery system in
an organisation and to manage interactions experienced with customers. Gudergan
et al. also mention that the service capabilities of front-line employees affect the level
of customer service rendered. This implies that front-line employees can, with the
necessary training and organisational support, serve customers effectively.

66
Successful organisations invest in training and ensure that the training suits their
organisational goals, mission and strategies.
3.5.2.3 Promote teamwork
The aim of teamwork is to help organisations attend to internal problems by allowing
team members to study and solve problems. The benefit of teamwork is that it lowers
work stress, provides emotional support, and increases employee motivation.
Therefore, by promoting teamwork, organisations can enhance the ability of
employees to provide and deliver excellent service. Many organisations have a
Service Blueprint, which portrays their integral service system and enables
employees to understand their roles as well as those of the customer (Mudie and
Pirrie, 2006: 143; Coelho et al., 2010: 36; Boshoff and du Plessis, 2013: 216).
Mudie and Pirrie, (2006: 143) indicate that another way of promoting teamwork is to
reward the team instead of the individual. This will encourage team effort and team
spirit.
3.5.3 Provide a support system Many organisations require their employees to take responsibility for customers
without providing an internal support system. In this respect, Grönroos (2007: 367,
397) states that front-line employees can only be effective if internal support systems
are aligned with their need to be customer focused. Therefore, without a customer-
oriented internal support system, proper conditions for the delivery of quality
customer service do not exist. It is, therefore, nearly impossible for front-line
employees to deliver quality service without a supportive system.

67
The following strategies are aimed at ensuring a customer-oriented internal support.
3.5.3.1 Measure internal service quality
Organisations can deliver better quality, customer-oriented service by ensuring the
internal service quality. To measure and reward internal service is one way in which
to develop and support internal service relationship (Grönroos, 2007: 398).
Therefore, before an organisation can start developing an internal service quality, it
should first measure customers’ perceptions of internal quality. Grönroos, (2007:
398) indicate that an internal customer service audit can be used to implement a
culture of internal service quality. Audit results assist with the identification of
customers, customer needs, how they are doing, and possible improvements.
Therefore, measuring internal service quality enables organisations to design an
effective service-delivery process.
3.5.3.2 Develop a service-oriented internal process
Internal procedures must support quality service performance in an organisation. To
best support front-line employees and to meet customer needs, the organisation’s
internal procedures and processes should be designed with customer value and
satisfaction in mind (Grönroos, 2007: 396).
3.5.3.3 Provide supportive technology and equipment
In order for front-line employees to deliver service quality, they need to have the right
tools, equipment and technology available. Without the necessary equipment and
technology, front-line employees will feel frustrated (Grönroos, 2007: 395-396).
3.5.4 Retain the best front-line employees Zeithaml et al. (2009: 371) and Boshoff and du Plessis (2013: 217-218) indicate that
the primary goal of human resources is to hire suitable employees to train, develop,
motivate and encourage them to deliver a customer-oriented service.
3.5.4.1 Include front-line employees in the organisation’s vision
Employees need to share a mutual understanding of an organisation’s vision in order
to adhere to its objectives. Therefore, they must understand how their work fits into
the bigger picture of the organisation. Whereas some employees remain with one
68
organisation because they are focused on the organisation’s vision and goals, others
may do so because of their salary, rewards and other benefits. An organisation’s
vision must be clear, motivating, and be communicated to employees frequently
(Zeithaml et al., 2009: 371).
Boshoff and du Plessis (2013: 217-218) argue that the written communication of
organisational policies and the requirement that front-line employees read such
documents may contribute to the organisation’s objectives. The authors explain that
some human resource practices (for example, training, performance reviews, and job
descriptions) may foster a positive organisation climate and can be used to
communicate the importance of customer service.
3.5.4.2 Treat front-line employees as customers
Zeithaml et al. (2009: 373) emphasise that, when employees feel valued and taken
care of, they will remain with the organisation. Zeithaml et al. are of the opinion that,
if employees are treated fairly, they will also treat customers better, thus resulting in
greater customer satisfaction.
Mudie and Pirrie (2006:131-150) and Grönroos (2007: 383-396) imply that, when
front-line employees understand the importance of service, they will be more
motivated and hard working. Little and Dean (2006: 464) investigated employees’
commitment and opinion of the quality of service they deliver. Results indicated that
front-line employees will deliver quality service to customers when they experience
positive management approaches towards them.
However, organisations can conduct internal market research to determine whether
the employees’ needs for job and work-life are met. Besides the mentioned research,
advertising and different forms of communication directed to employees may
increase their commitment and sense of value towards the organisation (Zeithalm et
al., 2009: 374).
3.5.4.3 Measure and reward strong service performers
Results of an empirical research by Peiró, Martinez-Tur and Ramos (2005: 786)
indicate that service organisations must be more service oriented and thus introduce

69
a reward system for front-line employees who focus on service quality. They further
explain that the front-line employee who knows that s/he will be rewarded for
delivering quality service will probably make an effort to understand the customers’
perceptions of services. Other examples in literature claim that rewarding is
important. For example, Slătten (2010: 4-8) claims that a reward system has a
motivating effect on front-line employees and that it may motivate them to deliver a
high-quality service. Therefore, a reward system that is perceived as fair may
motivate front-line employees to do their best when interacting with customers.
Pride and Ferrell (2010: 529) indicate that employees must receive attractive
compensation that motivates and retains the most effective individuals. Pride and
Ferrell mention that decent compensation programmes encourage the correct
treatment of customers. They emphasise that the advantages and disadvantages of
different compensation methods be considered. The Contained Store in the Unites
States of America is an example of an organisation paying employees’ salaries that
are 50% to 100% higher than those paid by their rivals (Pride and Ferrell, 2010:
530).
Beitelspacher et al. (2011: 3) indicate that, when front-line employees perceive
rewards for quality service rendered, the service quality perspective from the
customer’s point of view will be enhanced. The results of a study by Peirό et al.
(2005: 786) support the previous research, namely that front-line employees who
perceive that they are rewarded for delivering quality service will probably make
more effort to understand customers’ perceptions of service.
3.5.5 Person/Role conflict Mudie and Pirrie (2006: 147) suggest that, in order to minimise role conflict, human
resources must design jobs whose scope is pitched on the abilities of the employee
who will perform the task; prioritise the tasks that an employee is expected to fulfil,
and define these tasks in terms of what customers expect. They further mention that
human resources also need to ensure that performance is measured on customer-
focused tasks and that employees receive training in time management.

70
3.5.6 Job satisfaction Söderlund and Rosengren (2008: 552) investigated whether an employee should
smile while interacting with customers in order to impress them. In fact, some
companies such as Wal-mart, Disneyland, MacDonalds and Body Shop instruct their
employees to smile. Söderlund and Rosengren (2008: 552) found that this type of
enforcement by management to display a certain type of behaviour causes stress
and is exhausting for the employee. Thus, front-line employees are often restricted to
a set of rules and procedures that contribute to their being demotivated. Lee, Nam,
Park and Lee (2004: 251) found that job satisfaction, empowerment, service training
and service reward have a significant effect on organisational commitment. Lee et al.
(2004) indicate that empowerment is a key factor in enhancing front-line employees’
job satisfaction, as they thereby obtain the power to make on-the-spot decisions.
Chi and Gursoy (2009: 246) findings claim that front-line employees’ job satisfaction
is as important as customer satisfaction for the success of an organisation. However,
numerous factors such as job characteristics, personality traits, personal belief
system, self-esteem and values, group norms as well as demographic and
organisational factors may affect employees’ job satisfaction (Gil, Berenguer and
Cervera, 2008: 923). Gil et al. (2008: 923) further mention that front-line employees’
job satisfaction is one of the main reasons why they develop good service, thus
influencing customers’ satisfaction, customers’ perceptions of service quality and
competitiveness.
Literature on service marketing suggests that satisfied front-line employees perform
their work better and thus contribute to the increasing level of customer satisfaction
(Zeithaml et al., 2009: 354). Zeithaml et al. (2009: 354) also mention that, if front-line
employees are part of a solid service culture and receive management’s support, this
may lead to increased job satisfaction and simultaneously influence customers’
perceptions.

71
3.5.7 Managing emotional labour Kinman (2009: 118-130) points out that emotional display rules can be
communicated to employees by means of organisational vision statements, staff
handbooks, training, performance appraisals, and organisational socialisation
processes. Gudergan et al. (2008: 32) mention that emotional motivation provides
front-line employees with a sense of belonging and a desire to do well, as they have
a positive feeling towards the organisation. According to Gudergan et al., front-line
employees with a strong emotional attachment to an organisation display high levels
of customer service.
3.5.8 Internal communication Organisations need to coordinate and integrate communication across all
departments to enable employees to deliver quality service. In addition, internal
marketing communication must be managed and communicated accurately to
employees. Good management will choose an appropriate communication channel
to achieve this (Grönroos, 2007: 388).
3.6 SUMMARY
In order to provide high-quality service, AVBOB needs to make changes in the
organisation’s culture. Management need to put these in place by implementing a
service strategy. Only then can Provider Gap 3 be closed. Excellent service requires
front-line employees who feel and are empowered, motivated by management and
participate in training. Currently, the demands for quality service are high and
organisations in the services market must have a management team and front-line
employees who can provide a service that fulfils customers’ needs. Due to the
importance of the service encounters, managers must manage their front-line
employees to ensure that their attitude and behaviours contribute towards the
delivery of quality service.
Front-line employees’ positive attachment to the organisation impacts on their
approach to customer service. They need to feel valued in their positions in order to
experience a positive devotion towards the organisation. Therefore, front-line
employees play a crucial and dynamic role in the closure of Service Performance

72
Gap 3. The closure of this Gap mainly depends on their attitude, competencies,
skills, commitment, trust, communication, and work in a complex relationship.

73
CHAPTER 4
RESEARCH METHODOLOGY
4.1 INTRODUCTION
The aim of this chapter is to explain the research methodology used for this study.
The different stages of the process, namely purpose of the research, problem
statement, research objectives, methodology, ethical considerations and summary,
will be discussed individually.
Quinlan (2011: 130, 482) state that methodology focuses on the overall research
process and the kind of tools and procedures to be used in order to gather data from
the identified population. It also focuses on the individual steps in the research
process and the most “objective” procedures to be used. Quinlan further explains
that research methodology provides an indication to the reader of how the research
was conducted.
4.2 PURPOSE OF THIS RESEARCH
According to Cooper and Schindler (2014: 121-124), research has different
meanings to different people. They indicate that research not only refers to a search
for knowledge, but that it is also a process of systematic and methodical
investigation. They point out that academic research is the search for new
knowledge or information on a specific topic, whether it is a contribution to existing
knowledge by means of study, observation, or experiment and comparison.
The purpose of research can be described as follows: to discover answers to
questions; to review existing knowledge; to investigate a problem, and to provide a
solution to a problem (Sekaran and Bougie, 2010: 445).
Sekaran and Bougie (2010: 3) describes the business research process as a
systematic and objective process of collecting, recording and analysing data in order
to make business decisions whilst Cooper and Schindler (2014: 653) describe the

74
business research process as “the ordered set of activities focused on the
systematic collection of information using accepted methods of analysis as a basis
for drawing conclusions”.
Business research is of great importance as a management decision tool and plays
an important role in the development and implementation of new strategies (Sekaran
and Bougie, 2010: 2-3). This business research study was conducted not only for the
above reasons, but also with a view to building and contributing to current theories.
In the event of new facts and evidence, the results of the study may support or
persuade people to accept the contribution.
4.3 PROBLEM STATEMENT
According to Sekaran and Bougie (2010: 45) the problem statement introduces the
problem that is addressed in a specific business decision area.
Bearing the above definition in mind, the motivation for this research study stemmed
from the fact that product- and service-oriented organisations tend to provide a
sustainable quality service to both internal and external customers. To be a
successful service-delivery organisation, quality service and effective front-line
employees go hand in hand. Quality service delivery is dependent on the front-line
employees of an organisation. However, front-line employees do not always deliver a
sustainable quality service. Many factors and circumstances in their personal and
work lives influence both their effectiveness as employees and the quality of service
they render. Some of these factors are relationships in the workplace, the work
environment, as well as the employees’ personality and socio-economic
circumstances. Front-line employees are often not aware of how these affect their
service rendered. This ineffectiveness contributes directly to the existence of the
Customer Gap.

75
4.4. RESEARCH OBJECTIVES
Quinlan (2011: 481) defines research objectives as the steps taken by the
researcher to accomplish the aim of the research. On the other hand, Cooper and
Schindler (2014: 271) indicate that the research objectives “are the researcher’s
version of the business problem”. Thus, the research objectives give an indication of
what the researcher wishes to achieve in his/her research.
The primary objective of this study was to determine the factors that influence front-
line employees in their delivery of a sustainable quality service.
The secondary objectives of this study were:
a) To examine the aspects that influence the Customer Gap;
b) To investigate the role of front-line employees in narrowing the Customer Gap;
c) To identify personal circumstances that impact on the effectiveness of front-line
employees;
d) To identify professional circumstances that influence the effectiveness of front-
line employees;
e) To investigate front-line employees’ commitment towards rendering a quality
service;
f) To discuss the role and awareness of management in respect of front-line
employees’ role in service delivery.
g) To set up a blueprint of steps for recommendation for the management of
service-delivery organisations.
4.5 RESEARCH QUESTIONS
Cooper and Schindler (2014: 665) point out that the research question can be
viewed as the preferred hypothesis that best states the objectives of the research.
Quinlan (2011: 40) explains that a research question indicates the issues that need
to be resolved. Thus, a research question can be defined as the researcher’s
translation of the research problem.
76
Since this is a descriptive research, questions such as who, when, where and how
need to be answered (Cooper and Schindler, 2014: 134). The following research
questions are formulated:
• What factors influence front-line employees to deliver a sustainable quality
service?
• What aspects influence the Customer Gap?
• What is the role of front-line employees in narrowing the Customer Gap?
• What personal circumstances influence the effectiveness of front-line
employees?
• What professional circumstances influence the effectiveness of front-line
employees?
• How committed are front-line employees towards rendering a quality service?
• What is the role and awareness of management in respect of front-line
employees’ role in service delivery?
4.6 METHODOLOGY
4.6.1 Literature study Secondary data (literature) related or similar to the research topic was reviewed.
Existing verifiable literature, such as publications, academic journals, electronic
databases and the Internet, was reviewed to ascertain and interpret what has been
written and published on the research topic.
In this regard, literature was summarised in two chapters. In Chapter 2, the Gaps
Model in service delivery was discussed and, in Chapter 3, front-line employees as
key role players in the Service Performance Gap were discussed.
4.6.2 Research design (see 1.4.2 Page 8) A research design is defined as the master plan that specifies the methods and
procedures for collecting and analysing information obtained (Cooper and Schindler,
2014: 124-125). Therefore, a research design can be regarded as a framework for a
research project that focuses on the end product, namely what kind of study is being
77
planned and the kinds of results to be achieved. An appropriate and suitable
research design must be decided upon prior to conducting a research study.
• Types of research design
According to several researchers (Cooper and Schindler, 2014: 104, 369; Quinlan,
2011: 308; Bryman and Bell, 2007: 155, 578), there are two types of research
design, namely quantitative and qualitative. According to Sekaran and Bougie (2010
3) as well as Bryman and Bell (2007: 425-426), the quantitative research approach
involves the collection and analysis of numerical data and the application of
statistical tests. Quinlan (2011: 380) and Cooper and Schindler (2014: 144-148)
define quantitative data as numerical data, and quantitative data analysis is thus the
analysis of quantitative data, using statistical methods. The data is the result of
counting things and placing them into a category. Quantitative data is precise and
concise; variables can be measured, controlled and/or manipulated (Quinlan, 2011:
380; Cooper and Schindler, 2014: 144-148).
Quinlan, (2011: 380) and Cooper and Schindler (2014: 144-148) also state that, in
this type of analysis, the variable is the unit of measurement. Such a variable has
more than one value. For instance, in gender, there are two values, namely male or
female. It has become clear that quantitative research is thus an established
statistical method for the analysis of data. On account of the above reasons, this
research study used the quantitative research design to collect data.
It is important to note that, unlike in qualitative research, according to Quinlan (2011:
308), the researcher will never refer to “me”, “I” or “the researcher” in quantitative
research.
On account of the following reasons, the qualitative research design was not used.
According to the researchers Sekaran and Bougie (2010: 370-371) and Bryman and
Bell (2007: 425-426), qualitative research is concerned with words rather than
numbers and it also involves the collection of data in the form of drawings, maps or
visual data and is gathered through interviews and observations. Quinlan (2011:
105) indicate that qualitative data represent feelings, beliefs, opinions, ideas,
understandings and thoughts. Qualitative research is unstructured and the

78
researcher is not in search of facts but rather explore experiences, perceptions and
understandings. Words like “explore”, “describe” and “construct” are used (Bryman
and Bell, 2007: 425-426).
• Types of research
Quinlan (2011: 182-188) and Sekaran and Bougie (2010:103-105) indicate that there
are different types of business research, namely descriptive, exploratory, and causal.
The type of business research is determined by the information required for the
research problem.
Quinlan (2011: 399) indicate that, in descriptive research, the phenomena are
described as they exist, and that this type of research is used to obtain and identify
information on characteristics pertaining to certain issues or problems. As indicated
earlier, the characteristics of a population are described, whereas questions such as
who, when, where and how are answered (Cooper and Schindler, 2014: 134). The
authors further explains that there are different design techniques for descriptive
research, namely surveys (questionnaires), experiments and observation, and that
data is reported in the form of frequencies, percentages and averages.
Exploratory and causal research was not decided upon for the following reasons.
According to Sekaran and Bougie (2010: 103) and Bryman and Bell, (2007: 38-66)
exploratory research is conducted when some information or facts are known but
more information is required to clarify and define the nature of a certain problem
whilst causal research is conducted to attempts to reveal a causal relationship
between variables.
Bearing this in mind, descriptive research was decided upon for the following
reasons:
• Descriptive research is often undertaken to describe characteristics of a group
of employees in an organisation (Sekaran and Bougie, 2010: 106).

79
• Cooper and Schindler (2014: 21) indicate that descriptive research attempts to
determine the extent of differences in perception, needs, attitudes and
characteristics of a subgroup.
• Descriptive research offers ideas for future research (Sekaran and Bougie,
2010: 107).
• Descriptive research may help the organisation make some decisions regarding
their employees (Sekaran and Bougie, 2010: 107).
• Reliability in this type of research is high (Cooper and Schindler, 2014: 147).
• Descriptive research is used to summarise quantitative data (Cooper and
Schindler, 2014: 147).
• Statistical techniques such as frequencies, mean or standard deviation are
used to summarise the information (Sekaran and Bougie, 2010: 107).
• In many instances, descriptive information is all that is needed to solve a
business problem (Cooper and Schindler, 2014: 147).
4.6.3 Primary data-collection method According to Sekaran and Bougie (2010: 185), there are three main data-collection
methods in survey research, namely interviewing, administering questionnaires, and
observing people/phenomena. Quinlan (2011: 220) indicate that there are various
methods of data collection, namely diaries, focus groups, interviews, observations
and surveys, and that a researcher must find the most appropriate way to collect the
necessary data/information. Bryman and Bell (2007: 56-57) and Quinlan (2011: 221-
224, 326) indicate that a survey is a research technique in which information is
gathered from a sample of people, using various data-collection methods such as
questionnaires, surveys and interviews. According to these authors, questionnaires
are structured data-gathering instruments that are widely used in research. Cooper
and Schindler, 2014: 225) indicates that self-administered questionnaires are those
completed by the respondents themselves.
Thus, the primary data-collection method adopted for this research was the survey
method. Self-administered questionnaires prove to be the most suitable method for
the following reasons:

80
• Self-administered questionnaires are less expensive and less time consuming
compared to interviews and telephone surveys (Quinlan, 2011: 222; Cooper
and Schindler, 2014: 665).
• Respondents are of the opinion that they remain anonymous while they can
complete the questionnaires in their own time (Cooper and Schindler, 2014:
225, 230).
• Questionnaires were completed without the researcher’s involvement
• A very broad range of topics resulted in a broad range of data being collected.
English is one of the official languages and, because the vast majority of the
population has command of English, the questionnaires were only available in
English (see Annexures B and C).
4.6.4 Questionnaire design Researchers such as Sekaran and Bougie (2010: 197), Bryman and Bell (2007:
731), and Quinlan (2011: 192) defined a questionnaire as a pre-formulated, written
set of structured questions. It is an efficient data-collection mechanism used to
gather data in survey studies. In fact, Quinlan (2011: 336-337) indicates that key
issues such as the content of the questionnaire, the order, construction and
presentation of the questions, and the length of the questionnaire are important
when designing a questionnaire. An important advantage of questionnaires is that
they can be used for large-scale surveys.
The data-collection instrument consisted of two different questionnaires (primary
data), which were used to gather data relevant to the research objectives and
research questions. Questionnaires were based on the literature reviewed and
relating to the research topic such as accredited journals, the Internet, articles and
academic publications and were discussed with both the researcher’s study leader
and the statistician. Questions were also adopted from the work of Lee et al. (2004:
251-264). The questions were thus designed to be relevant, accurate,
understandable and short. To maintain continuity, the questions were grouped by
topic, with each section containing a set of questions relevant to that topic.
Questions were placed in logical order (Buglear, 2005: 607).

81
According to Quinlan (2011: 293), Bryman and Bell (2007: 258), as well as Sekaran
and Bougie (2010: 200), there are some basic types of questions, namely closed
questions and open-ended questions. Open-ended questions enable respondents to
give their personal opinion in their own words. This type of questions is used to
explore the respondents’ understanding, feelings, opinions and beliefs. Respondents
often provide long responses, making it difficult to code. Another disadvantage is that
answers are not prepared in advance and it is, therefore, difficult to analyse them
statistically.
With closed questions, the respondents are asked to select an answer from a
number of predetermined alternatives. The researcher provides a limited and strict
set of options to choose from. Researchers tend to favour closed questions, as they
are less time consuming and easier to code; quick to analyse and record; easier and
quicker for respondents to complete; due to a variety of answers, closed questions
may help clarify the meaning of the question to respondents; closed questions are
convenient when collecting factual data (Quinlan, 2011: 293; Bryman and Bell, 2007:
260-262).
Therefore, on account of the above advantages, it was decided to use closed
questions for both questionnaires. However, a few open-ended questions were
included in the questionnaires, with the aim of collecting management’s personal
opinion regarding the “evaluation of frontline employees in terms of work
achievement” and, secondly, establishing “how frontline employees are rewarded for
good performance”. Front-line employees were asked to indicate the number of
years that they are in the service of AVBOB.
Content of the questionnaire The two questionnaires were constructed as follows:
One for front-line employees (Annexure B) and one for management (Annexure C).

82
Questionnaire for front-line employees (Annexure B) This questionnaire was divided into Sections A and B (Buglear, 2005: 607).
Section A of the questionnaire was divided into different subsections (A to L), with a
set of questions concerning a particular topic such as Organisation climate;
Empowerment; Training/Systems/HR; Rewards; Job satisfaction; Management;
Front-line employees; Customer service; Service quality; Commitment, and General.
These questions were used to assess the role of front-line employees in the
organisation, thereby answering the primary and secondary objectives of the
research.
Subsection A of the questionnaire consisted of open-ended questions, and
respondents were asked to indicate how long ago they were appointed by the
organisation and if they held a previous position in the organisation. These questions
were placed first in order to encourage response (Bryman and Bell, 2007: 221-223).
Throughout Subsections B to L, five-point Likert-scale questions (closed
questions), based on and identified in the literature research (Chapters 2 and 3),
were used. Buglear (2005: 114) indicates that “the numerical scale used to produce
the figures forms the basis of the analysis of quantitative data”. He also mentions
that scale questions enable the researcher to compare the ranking of different
respondents with ease. Quinlan (2011: 326) indicates that scale questions are used
widely in research as a structured data-gathering method.
The respondents were thus instructed to indicate their degree of agreement with a
list of statements supplied by the researcher. The questions consisted of an option
between “Strongly disagree/Disagree/Unsure/Agree/Strongly agree” (Quinlan, 2011:
225, 327).
Likert-scale questions were used for the following advantages:
• Questions are turned into statements (Sekaran and Bougie, 2010: 152,155).
• A number of statements can be provided in a list, as they do not take up much
room (Sekaran and Bougie, 2010: 152,155).

83
• The more points in the scale, the more data can be gathered (Quinlan, 2011:
327).
• This type of questions can be pre-coded (Quinlan, 2011: 327).
• Likert-scale questions were used to capture front-line employees’ opinions and
perceptions regarding service delivery, AVBOB and management.
Section B of the questionnaire focused on demographic issues, including
respondents’ gender, age, marital status, home language, cultural group, highest
qualification, how they get to work, and their area of residence. The last two
questions were included for use in significance testing, namely to show whether
there were any significant relationships between personal circumstances that
influence front-line employees’ effectiveness and commitment towards rendering a
quality service. Descriptive statistics were used in compiling this section of the
questionnaire.
Questionnaire for management (Annexure C) This questionnaire was divided into Sections A and B (Buglear, 2005: 607).
Section A of the questionnaire was divided into two subsections, namely A
(Leadership) and B (Employees). These sections included open-ended and closed
questions.
Section B of the questionnaire focused on demographic issues, including
respondents’ gender, age, marital status, cultural group and highest qualification.
4.6.5 Validity and reliability Quinlan (2011: 42), Bryman and Bell (2007: 41), Sekaran and Bougie (2010: 158),
as well as Cooper and Schindler (2014: 257, 260) indicate that validity is an
important criterion for research, as it is concerned with the validity of the research
findings. Content validity was assured by means of a literature review pertaining to
literature applicable to the research questions. Therefore, the questionnaires that
provide the data needed are the correct data-collection method for the research, as
they were based on literature reviewed.

84
According to the above researchers, reliability measures the accuracy of the
research findings. The population used in the research and the data-gathering
method is appropriate. Thus, if the same research is repeated and the same results
are obtained, the research can be deemed to be reliable. Therefore, Cronbach’s
alpha was used to test internal reliability in this study (Bryman and Bell, 2007: 164).
The closer Cronbach’s alpha is to 1, the higher the internal reliability, whereas 0 is
an indication of no internal reliability.
4.6.6 Sample selection According to Sekaran and Bougie (2010: 445), sampling is the process of selecting
elements from the population in order to represent that population. Sampling enables
the researcher to establish some unknown characteristics of a population.
The reasons for sampling in this research study are lower cost; greater accuracy of
the results; greater speed of data collection, and availability of population (Cooper
and Schindler, 2014: 338-339).
Research population Literature provides various definitions of a population. Quinlan (2011: 29 and 143)
defines a population as all elements that the researcher focuses upon and to which
the obtained results should be generalized. De Vos, Strydom, Fouché and Delport
(2005: 193) indicate that a population refers to all individuals who share the same
attributes in which the researcher is interested.
The population for this research study consisted of front-line employees and
managerial staff who were involved in service delivery in the employment of AVBOB
during the months starting in June 2013 and ending in November 2013 and who
were willing to participate in the research study.
Types of sample design Quinlan (2011: 208), Sekaran and Bougie (2010: 267-268); Bryman and Bell (2007:
182), as well as Cooper and Schindler (2014: 341-344) identified two types of
sampling design – probability and non-probability sampling. Non-probability sampling
can be defined as “a sampling technique in which units of the sample are selected
85
on the basis of personal judgement or convenience” Sekaran and Bougie (2010:
442). Therefore, the sample cannot be generalised to the population. Non-probability
sampling was used, as it is less time consuming and inexpensive (Serakan and
Bougie, 2010: 276).
According to Quinlan (2011: 213-214), Bryman and Bell (2007: 197-202), as well as
Cooper and Schindler (2014: 358-360), there are three types of non-probability
sampling methods, namely convenience, quota, and snowball sampling.
Convenience sampling can be defined as the sampling method “used to obtain those
units/people most conveniently available” (Cooper and Schindler, 2014: 655).
Convenience sampling was used in this research. Questionnaires were distributed to
different branches of AVBOB. However, not every front-line employee and manager
were identified and asked to complete a questionnaire, because there was no
census or list of names of the population available. Thus, there was no sampling
frame from which a sample could be drawn randomly. Not every front-line employee
and manager had an equal opportunity of being included in the research (Quinlan,
2011: 213). Therefore, results can thus not be generalised to the entire population of
AVBOB and, unfortunately, external validity cannot be ensured. However, non-
probability sampling, if carefully controlled, may provide acceptable results (Cooper
and Schindler, 2014: 359).
4.6.7 Data collection A letter of permission to collect data was obtained from the head of the Department
of Business Management, University of the Free State (see Annexure A). There was
also a verbal agreement between the Department of Business Management and
senior management of AVBOB. In order to protect the respondents, they were
informed not to write their names on the questionnaires and, therefore, no provision
was made to do so.
The names and telephone numbers of different AVBOB branches were obtained.
AVBOB regions are divided into various branches, each under its own management.
Branch managers were approached or contacted by telephone and requested to
participate in the study. However, hardly any response was received. Therefore, an

86
AVBOB employee was approached and requested to deliver and collect the
questionnaires when s/he was doing his/her routine visits to branches.
Questionnaires were also faxed or sent by email to some of the branches. These
were delivered and collected during office hours, weekdays and from the months of
June 2013 to November 2013. Self-administered questionnaires were only handed to
those respondents who were willing to participate in the research study.
The aim and importance of the study was communicated and explained; care was
taken that the same respondent did not complete more than one questionnaire.
Assurance of confidentiality was also given to the respondents prior to data
collecting. This was also confirmed by a covering letter attached to the questionnaire
(Annexure D).
Table 4.1: Sample size of respondents
Region Branch Frontline employees
Managers
Bloemfontein Bloemfontein, Bloemfontein Region,
Bloemfontein Life
7 8
Botshabelo 3 1
Christiana 1 1
Ficksburg 5 1
Hartswater 2 1
Hennenman 1 -
Kimberley 5 1
Klerksdorp 1 1
Kroonstad 4 1
Ladybrand 3 1
Postmasburg 2 1
Prieska - 1
Virginia 3 1
Welkom 5 1
QwaQwa 8 1
Pretoria Groblersdal 1 1
Johannesburg Alberton 2 -
Roodepoort 1 1
East London Aliwal North 2 1

87
Colesberg 1 2
Cradock 1 1
De Aar 2 1
King William’s Town 1 1
Durban Bethlehem 5 -
Newcastle 1 1
Harrismith - 1
Warden - 1
Cape Town Beaufort West 1 1
Bellville 2 1
Bredasdorp 2 1
George 3 1
Mossel Bay 2 1
Oudtshoorn - 1
Stellenbosch 2 1
Strand 1 1
Tygervalley 1 1
Worcester 1 -
Wynberg 1 -
Every manager and every front-line employee did not complete the questionnaire as,
in some instances; they were either out of town, out of office, on leave, busy with a
customer, or on sick leave.
4.6.8 Statistical analysis of the data A total of 123 questionnaires were completed: 82 by front-line employees and 41 by
managers.
The data analysis began once the data had been collected, as raw data must be
converted into meaningful information. The raw data was edited to detect errors and
omissions. Missing values occur when respondents skip or refuse to answer a
questionnaire item. Therefore, the missing data (blank spaces) were kept as they
were, because the number of missing values is small and non-random (Cooper and
Schindler, 2014: 68).

88
The questionnaires were screened and coded, and the data entered on an Excel
spreadsheet. The data obtained was analysed using the Statistical Package for
Social Sciences (SPSS) software. The Department of Industrial Psychology, Faculty
of Economic and Management Sciences, assisted the researcher in the analysis and
interpretation of the data.
The results were interpreted using inferential statistics. Cronbach’s alpha measured
item reliability. Inferential statistics, according to Quinlan (2011: 399), are used in
quantitative data analysis for prediction. Descriptive statistics such as percentages
and charts were also used.
4.7 ETHICAL CONSIDERATIONS IN BUSINESS RESEARCH
The quality of a research study depends on the integrity of the researcher. All parties
involved in research should exhibit ethical behaviour (Quinlan, 2011: 27).
The aim of ethics in research is to ensure that participants do not suffer adverse
consequences (Cooper and Schindler, 2014: 28-34). According to Cooper and
Schindler, a researcher should follow three guidelines, namely to explain the study
benefits; to explain participant rights and protection, and to obtain informed consent.
These ethical principles were adhered to during this study, as respondents were
informed that this is a Master’s study for academic purposes (see Annexure D). They
were also assured that their contribution to the research is confidential and that they
will not be identified at any time or during the research. Thus, to protect the
respondents (anonymity), they were also informed not to write their names on the
questionnaires and no provision was thus made to do so. No one was compelled to
participate in the research study and respondents were informed that their
participation is voluntary.
4.8 SUMMARY
In this chapter, the research methodology of the study, the selection of respondents,
the method used to collect data as well as the analysis thereof was explained.
Chapter 5 is a discussion of the results obtained.

89
CHAPTER 5
RESEARCH RESULTS
5.1 INTRODUCTION
This chapter provides the main findings of the study as well as a discussion of the
findings. The chapter is divided into two sections, namely Part A and Part B. Part A
is a discussion of the demographic results for front-line employees and managers.
Part B focuses on the empirical results.
The research study includes some sensitive issues to which the respondents may
not give their truthful answer.
5.2. DESCRIPTION OF THE RESPONDENTS
The population for this research study included front-line employees and managerial
staff involved in service delivery who was in the employment of AVBOB from the
beginning of June 2013 to the end of November 2013 and who were willing to
participate in the research study.
The respondents completed a total of 125 questionnaires, of which 123 were usable
for the study and 2 were incomplete. The results are thus based on 123
questionnaires. Front-line employees completed 82 questionnaires and managers
completed 41 questionnaires.
5.3 PART A – DEMOGRAPHIC PROFILE OF RESPONDENTS
The demographic variables for both front-line employees and managers, for which
data was collected, included gender, age, marital status, cultural group and highest
qualification. Additional data with regard to “home language”, “how respondents get
to work” and “respondents’ residential area” was only collected from front-line
employees. The purpose of the demographic information is to provide insight into the
characteristics of the respondents.
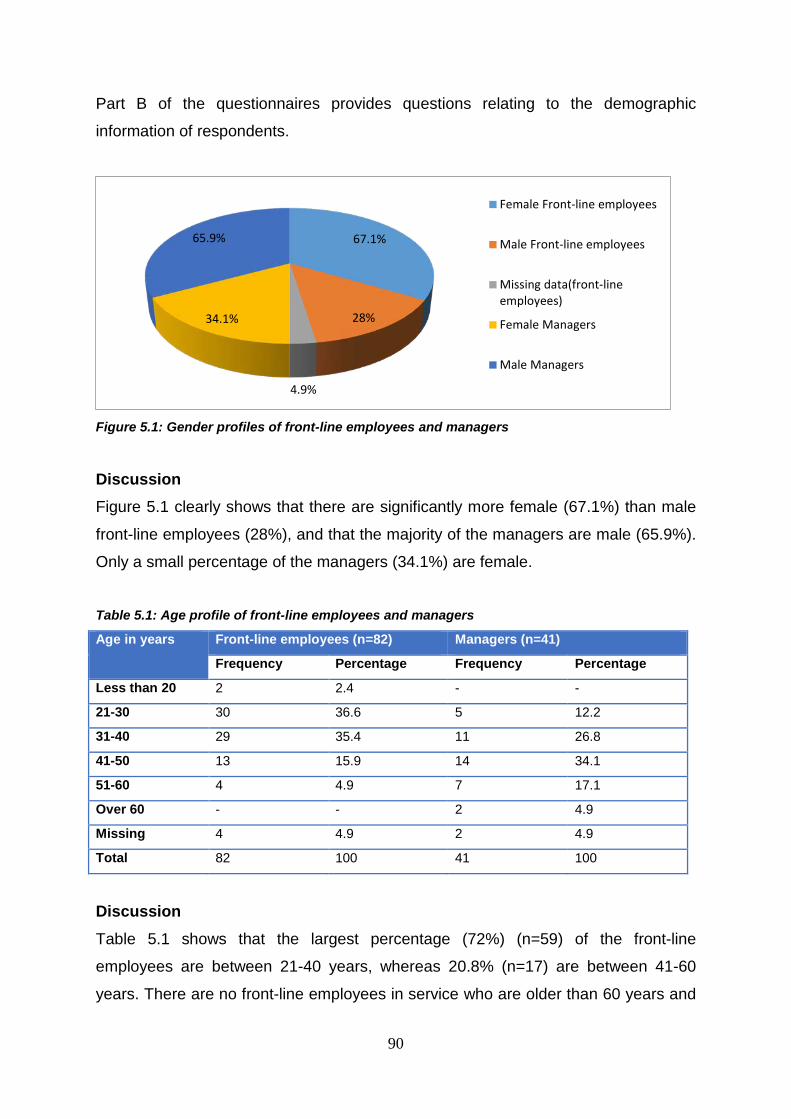
90
Part B of the questionnaires provides questions relating to the demographic
information of respondents.
Figure 5.1: Gender profiles of front-line employees and managers
Discussion Figure 5.1 clearly shows that there are significantly more female (67.1%) than male
front-line employees (28%), and that the majority of the managers are male (65.9%).
Only a small percentage of the managers (34.1%) are female.
Table 5.1: Age profile of front-line employees and managers
Age in years Front-line employees (n=82) Managers (n=41)
Frequency Percentage Frequency Percentage
Less than 20 2 2.4 - -
21-30 30 36.6 5 12.2
31-40 29 35.4 11 26.8
41-50 13 15.9 14 34.1
51-60 4 4.9 7 17.1
Over 60 - - 2 4.9
Missing 4 4.9 2 4.9
Total 82 100 41 100
Discussion Table 5.1 shows that the largest percentage (72%) (n=59) of the front-line
employees are between 21-40 years, whereas 20.8% (n=17) are between 41-60
years. There are no front-line employees in service who are older than 60 years and
67.1%
28%
4.9%
34.1%
65.9%
Female Front-line employees
Male Front-line employees
Missing data(front-lineemployees)
Female Managers
Male Managers

91
this may be due to the retirement age being 60. The vast majority of the managers
are in the age group 41-60 years (51.2%) (n=21). Only a small percentage (16%)
(n=39) are in the age group 21-40 years.
Table 5.2: Front-line employees’ language
Language Front-line employees (n=82)
Frequency Percentage
Afrikaans 35 42.7
English 6 7.3
Sotho 22 26.8
Tswana 6 7.3
Xhosa 9 11
Zulu 1 1.2
Missing 3 3.7
Total 82 100
Discussion The largest percentage of the front-line employees speaks Afrikaans (42.7%) (n=35).
The reason may be that people in the Cape Town region and those from small towns
such as Christiana, Hartswater, Prieska and Kimberley are mainly Afrikaans
speaking. The second largest majority of the respondents speak Sotho (26.8%)
(n=22). The reason may be that Black people in the Free State (Bloemfontein,
Botshabelo, Ficksburg, Henneman, Kroonstad, Ladybrand, Welkom, Virginia) and
Qwa Qwa are Sotho speaking.
Table 5.3: Front-line employees’ and managers’ cultural groups
Culture Front-line employees (n=82) Managers (n=41)
Frequency Percentage Frequency Percentage
Asian - - - -
Black 46 56.1 10 25
Coloured 11 13.4 5 12.2
White 23 28 25 61
Missing 2 2.4 1 2.4
Total 82 100 41 100

92
Discussion The majority of the front-line employees who agreed to participate in the study were
Black (56.1%) (n=46), White (28%) (n=23) and Coloured (13.4%) (n=11). The
majority of the managers who participated in the study were White (61%) (n=25),
Black (25%) (n=10) and Coloured (12.2%) (n=5).
Table 5.4: Front-line employees’ and managers’ qualification
Qualification Front-line employees (n=82) Managers (n=41)
Frequency Percentage Frequency Percentage
Below Grade 12 16 19.5 7 17.1
College/Technicon Certificate
4 4.9 1 2.4
College/Technicon Diploma
8 9.8 6 14.6
Grade 12 43 52.4 19 46.3
University Degree - - 4 9.8
Missing 11 13.4 4 9.8
Total 82 100 41 100
Discussion The majority of the front-line employees (52.4%) (n=43) and managers (46.3%)
(n=19) are in possession of Grade 12. None of the front-line employees are in
possession of a university qualification; however, over 14% of them have a post-
matriculation qualification. Four managers (9.8%) (n=4) have a university degree and
17% a post-matriculation qualification.
Tables 5.5 and 5.6 do not form part of the demographic information. These were
placed under “Demographics” (Part B of the questionnaire), in order to gain insight
into how front-line employees get to work and where they reside so as to establish
whether these factors influence their performance at work.

93
Table 5.5: Front-line employees’ transport system (n=82)
Transport system Frequency Percentage
Bicycle - -
Bus 5 6.1
On foot 21 25.6
Hike 1 1.2
Own transport 23 28
Pool vehicle - -
Taxi 29 35.4
Other - -
Missing 3 3.7
Total 82 100
Discussion The results in Table 5.5 indicate that the majority of the front-line employees (35.4%)
(n=29) travel by taxi, because the majority of them are Black and reside in the
township. Of the frontline employees, 28% (n=23) have their own transport, while
25.6% (n=21) walk to work. Furthermore, 6.1% (n=5) of them make use of buses.
Only 1 (1.2%) respondent indicated that s/he hikes to work.
Table 5.6: Front-line employees’ residential area (n=82)
Residential area Frequency Percentage
Farm 3 3.7
Plot 4 4.9
Town 35 42.7
Township 34 41.5
Other 4 4.9
Missing 2 2.4
Total 82 100
Discussion Table 5.6 clearly shows that the majority of the front-line employees (42.7%) (n=35)
reside in a town; nearly an equal number of them (41.4%) (n=34) reside in
townships; some reside on a farm (3.7%) (n=3), and others reside on a plot (4.9%)
(n=4). These front-line employees may reside in rural districts.

94
5.4 PART B – EMPIRICAL RESULTS (front-line employees and managers) Table 5.7: Descriptive analysis of factors (Front-line employees’ response) (n=82)
Factor N Minimum Maximum Mean Std deviation
Climate 82 2.10 5 4.0 0.73
Empowerment 82 2.00 5 3.9 0.72
Training/Systems/HR 82 1.88 5 3.8 0.78
Rewards 82 1.00 5 3.3 0.86
Job satisfaction 82 2.50 5 4.0 0.74
Management 82 1.83 5 3.7 0.85
Customer service 82 1.00 5 4.4 0.64
Service quality 82 3.14 5 4.4 0.53
Commitment 82 2.80 5 4.3 0.59
Sig. at 0.05
Discussion The highest mean score in Table 5.7 is 4.4 (Customer service and Service quality),
4.3 (Commitment), 4.0 (Organisational climate and Job satisfaction) and the least
mean score is 3.3 (Rewards).
The mean (or average) is a method to describe central tendency, in other words, the
arithmetic average. In order to calculate the mean, all values are added up and
divided by the number of values (Quinlan, 2011: 400; Bryman and Bell, 2007: 359).
Table 5.8: Descriptive analysis of managers’ response (n=41)
Factor N Minimum Maximum Mean Std deviation
V3.1 39 2.00 5 4.4 0.67
V3.2 41 1.00 5 3.7 1.3
V3.3 41 2.00 5 4.3 0.84
V3.4 40 2.00 5 4.6 0.63
V3.5 41 1.00 5 4.2 0.96
V3.6 41 2.00 5 4.6 0.63
V3.7 41 2.00 5 4.1 1.0
V3.8 40 2.00 5 4.0 1.0
V3.9 41 2.00 5 4.2 0.86
V3.10 41 2.00 5 3.6 1.2

95
V3.11 41 1.00 5 3.6 1.2
V3.12 40 1.00 5 4.3 0.99
V3.13 41 2.00 5 4.2 0.83
V3.14 41 1.00 5 3.8 1.1
V3.15 41 1.00 5 4.0 0.97
Sig. at 0.05
Discussion The highest mean score in Table 5.8 is 4.6 “Customers are valued” (Question 3.4)
and “Front-line employee attitude and behaviour have an impact on customer
evaluation of service” (Question 3.6), followed by a mean of 4.4 “Management
communicate organisation objectives to front-line employees”.
The least mean score is 3.6 “Do front-line employees receive regular training”
(Question 3.10) and “Front-line employees are appointed according to their service
competencies” (Question 3.11). Therefore, the results imply that management is
aware of the value of their customers and that training and the appointment of
competent front-line employees are not a high priority.
The mean (or average) is a method to describe central tendency, in other words, the
arithmetic average. In order to calculate the mean, all values are added up and
divided by the number of values (Quinlan, 2011: 400; Bryman and Bell, 2007: 359).
Table 5.9: I want management to know my family (husband, wife, children) (Front-line employees’ response) (n=82)
Frequency Percentage
Strongly disagree 10 12.2
Disagree 18 22
Unsure 7 8.5
Agree 29 35.4
Strongly agree 17 20.7
Missing 1 1.2
Total 82 100
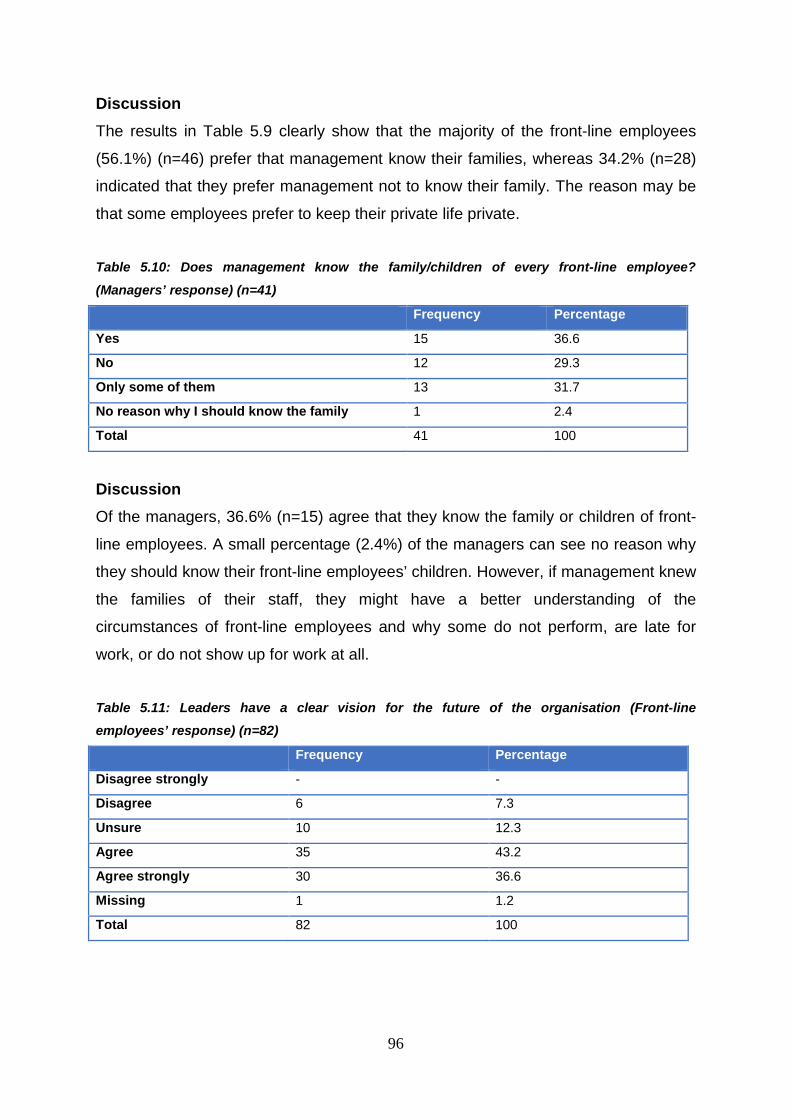
96
Discussion The results in Table 5.9 clearly show that the majority of the front-line employees
(56.1%) (n=46) prefer that management know their families, whereas 34.2% (n=28)
indicated that they prefer management not to know their family. The reason may be
that some employees prefer to keep their private life private.
Table 5.10: Does management know the family/children of every front-line employee? (Managers’ response) (n=41)
Frequency Percentage
Yes 15 36.6
No 12 29.3
Only some of them 13 31.7
No reason why I should know the family 1 2.4
Total 41 100
Discussion Of the managers, 36.6% (n=15) agree that they know the family or children of front-
line employees. A small percentage (2.4%) of the managers can see no reason why
they should know their front-line employees’ children. However, if management knew
the families of their staff, they might have a better understanding of the
circumstances of front-line employees and why some do not perform, are late for
work, or do not show up for work at all.
Table 5.11: Leaders have a clear vision for the future of the organisation (Front-line employees’ response) (n=82)
Frequency Percentage
Disagree strongly - -
Disagree 6 7.3
Unsure 10 12.3
Agree 35 43.2
Agree strongly 30 36.6
Missing 1 1.2
Total 82 100

97
Discussion It is clear from the results in Table 5.11 that the majority of the front-line employees
(79.8%) (n=65) are of the opinion that management have indeed a clear vision for
the organisation, whereas 6 respondents indicated that they disagree about
leadership’s vision for the organisation.
Table 5.12: Does your organisation have a clear vision for the future? (Managers’ response) (n=41)
Frequency Percentage
Yes 31 75.6
No 8 19.5
Unsure 2 4.9
Total 41 100
Discussion The results in Table 5.12 indicate that 75.6% (n=31) of the managers agree that
AVBOB have indeed a clear vision for the future.
Table 5.13: What qualification is required for front-line employees? (Managers’ response) (n=41)
Frequency Percentage
Grades 1-7 - -
Grades 8-12 35 85.5
Diploma 5 12.2
Degree - -
Other 1 2.4
Total 41 100
Discussion The results in Table 5.13 show that the majority of the respondents (85.5%) (n=35)
indicated that the highest qualification required for front-line employees is Grades 8-
12.

98
Table 5.14: How frequently are evaluations done? (Managers’ response) (n=41)
Frequency Percentage
Every 3 months 15 36.6
Every 6 months 5 12.2
Once a year 14 34.1
Other 4 9.8
Missing 3 7.3
Total 41 100
Discussion The results in Table 5.14 clearly indicate that the majority of the respondents
(36.6%) (n=15) agree that front-line employees should be evaluated every 3 months.
However, nearly an equal number of front-line employees (34.1%) (n=14) are
evaluated once a year.
Table 5.15: In my organisation, I receive training on how to provide the best service to the customer (Frontline employees’ response) (n=82)
Frequency Percentage
Strongly disagree 2 2.4
Disagree 13 15.9
Unsure 5 6.1
Agree 29 35.4
Strongly agree 33 40.2
Total 82 100
Discussion The results in Table 5.15 reveal that the majority of the front-line employees (75.6%)
(n=62) agree that they do receive training in order to provide the best service to
customers. However, 18.3% (n=15) of the front-line employees disagree.

99
Table 5.16: Front-line employees receive regular training (Managers’ response) (n=41)
Frequency Percentage
Disagree 13 31.7
Unsure 3 7.3
Agree 12 29.3
Strongly agree 13 31.7
Total 41 100
Discussion The majority of the respondents (61%) (n=25) indicated that front-line employees
receive regular training; one third of the respondents (31.7%) (n=16) disagree. These
results confirm those of Table 5.23, namely that there are front-line employees in the
employment of AVBOB who do not receive training.
Table 5.17: When I experience a problem, I have the right to make a decision and handle the problem (Frontline employees’ response) (n=82)
Frequency Percentage
Disagree strongly 2 2.4
Disagree 5 6.1
Unsure 13 15.9
Agree 40 48.8
Agree strongly 22 26.8
Total 82 100
Discussion The results in Table 5.17 indicate that the majority of the front-line employees
(75.6%) (n=62) are of the opinion that they may make a decision in order to solve a
problem.

100
Table 5.18: When a front-line employee experiences a problem, does s/he have the right to make a decision and handle the problem? (Managers’ response) (n=41)
Frequency Percentage
Yes 10 24.4
No 4 9.8
Depends on the type of problem
26 63.4
Management must attend to the problem
2 2.4
Total 41 100
Discussion The majority of the managers (63.4%) (n=26) indicated that it depends on the type of
problem, whereas 24.4% (n=10) of the respondents indicated that front-line
employees may make a decision.
Table 5.19: I would recommend this organisation as a good place to work in (Front-line employees’ response) (n=82)
Frequency Percentage
Strongly disagree - -
Disagree 3 3.7
Unsure 12 14.6
Agree 32 39
Strongly agree 35 42.7
Missing - -
Total 82 100
Discussion These results in Table 5.19 show that the majority of the front-line employees
(81.7%) (n=67) indicated that they would recommend AVBOB as a good place to
work in, whereas 14.6% (n=12) of the front-line employees are unsure as to whether
they would recommend AVBOB as a good place to work in.

101
Table 5.20: I am proud to work in this organisation (Front-line employees’ response) (n=82)
Frequency Percentage
Strongly disagree 1 1.2
Disagree 5 6.1
Unsure 6 7.3
Agree 27 32.9
Strongly agree 41 50
Missing 2 2.4
Total 82 100
Discussion These results in Table 5.20 indicate that the majority of the front-line employees
(82.9%) (n=68) are proud to work at AVBOB; a small percentage of them (7.3%)
(n=6) disagree, and 7.3% (n=6) of them are unsure as to whether they are proud to
be an AVBOB employee.
Table 5.21: I receive a performance bonus (Front-line employees’ response) (n=82)
Frequency Percentage
Strongly disagree 11 13.4
Disagree 17 20.7
Unsure 15 18.3
Agree 23 28
Strongly agree 13 15.9
Missing 3 3.7
Total 82 100
Discussion The results in Table 5.21 indicate that 43.9% (n=36) of the respondents did receive a
performance bonus, whereas an alarming 34.1% (n=18) of them did not receive a
performance bonus. It is interesting to note that 18.3% (n=15) of the front-line
employees are unsure as to whether they receive a performance bonus.

102
Table 5.22: How are employees rewarded for good performance? (Managers’ response) (n=41)
Frequency Percentage
Bonus 10 24.4
Awards 2 4.9
Certificate 2 4.9
Trophy 2 4.9
Commission 2 4.9
None 6 14.6
Other 6 14.6
Missing 11 26.8
Total 41 100
Discussion The results in Table 5.22 indicate that an alarmingly small percentage of the front-
line employees (24.4%) (n=10) receive a bonus. It is interesting to note that 14.7%
(n=6) of them receive a reward, certificate or trophy; 4.9% (n=2) receive commission,
and 14.6% (n=6) do not receive any form of recognition.
Table 5.23: Clear performance standards for service quality are set (Front-line employees’ response) (n=82)
Frequency Percentage
Strongly disagree 1 1.2
Disagree 4 4.9
Unsure 13 15.9
Agree 29 35.4
Strongly agree 34 41.5
Missing 1 1.2
Total 82 100
Discussion Table 5.23 shows that more than three-quarter of the respondents (76.9%) (n=63)
indicated that the organisation has set standards for service quality; a small
percentage of them (6.1%) (n=5) disagree, and 15.9% of them (n=13) are unsure as
to whether there are performance standards set for service quality. This is an
indication that some front-line employees are unaware of what is happening in the
organisation and that no or insufficient training is provided.

103
Table 5.24: Organisational benefits are available (Front-line employees’ response) (n=82)
Frequency Percentage
Strongly disagree 16 19.5
Disagree 18 22
Unsure 10 12.2
Agree 25 30.5
Strongly agree 11 13
Missing 2 2.4
Total 82 100
Discussion The results in Table 5.24 indicate that there is an almost equal split between the
respondents who agree (43.5%) (n=36) and those who disagree (41.7%) (n=34) that
benefits are available; whereas 12.2% are unaware that company benefits are
available. It is alarming to note that front-line employees did not know whether
company benefits are available. This is a clear indication that there might be a
communication problem or that front-line employees are uninformed.
Table 5.25: Management are interested in front-line employees and their needs (Front-line employees’ response) (n=82)
Frequency Percentage
Strongly disagree 2 2.4
Disagree 15 18.3
Unsure 14 17.1
Agree 33 40.2
Strongly agree 16 19.5
Missing 2 2.4
Total 82 100
Discussion The results in Table 5.25 show that the majority of the respondents (59.7%) (n=49)
indicated that management are interested in their needs; 20.7% of the respondents
disagree, and 17.1% of the respondents are unsure.

104
Table 5.26: Management are interested in the well-being of the family of front-line employees (Front-line employees’ response) (n=82)
Frequency Percentage
Strongly disagree 6 7.3
Disagree 12 14.6
Unsure 20 24.4
Agree 23 28
Strongly agree 20 24.4
Missing 1 1.2
Total 82 100
Discussion The results in Table 5.26 reveal that the majority of the respondents (52.4%) (n=43)
indicated that management are interested in their families; 21.9% (n=18) of the front-
line employees do not agree and a nearly equal number of front-line employees
(n=20) (24.4%) indicated that they are unsure.
Table 5.27: My personal circumstances have a negative influence on my job performance (Front-line employees’ response) (n=82)
Frequency Percentage
Strongly disagree 26 31.7
Disagree 28 34.1
Unsure 3 3.7
Agree 19 23.2
Strongly agree 5 6.1
Missing 1 1.2
Total 82 100
Discussion From the results in Table 5.27, it is clear that the majority of the respondents (65.8%)
(n=54) indicated that their personal circumstances have no influence on their work
performance; one third of them (29.3%) (n=24) agree that their personal
circumstances do influence their work performance, and only a small number of
them (n=3) (3.7%) are unsure.

105
Table 5.28: I have problems getting to and from work (Front-line employees’ response) (n=82)
Frequency Percentage
Strongly disagree 26 32.1
Disagree 33 40.2
Unsure 3 3.7
Agree 17 21
Strongly agree 2 2.5
Missing 1 1.2
Total 82 100
Discussion From the results in Table 5.28, it is clear that the majority of the respondents (62.3%)
(n=59) have no problem getting to work; a third of the respondents (23.5%) (n=19)
agree that they experience problems getting to work, and a small percentage of them
(3.7%) (n=3) are unsure as to whether they have experienced transport problems.
Table 5.29: I do not always have clean clothes to wear to work (Front-line employees’ response) (n=82)
Frequency Percentage
Strongly disagree 33 41.8
Disagree 32 40.5
Unsure 1 1.3
Agree 9 11.4
Strongly agree 4 5.1
Missing 3 3.7
Total 82 100
Discussion The results in Table 5.29 clearly show that the majority of the respondents (82.3%)
(n=65) indicated that they disagree and thus have clean clothes to wear to work;
16.5% (n=13) of them do not always have clean clothes to wear, and only one (n=1)
(1.3%) indicated that s/he is unsure.

106
Table 5.30: I experience conflict between my work and family responsibilities (Front-line employees’ response) (n=82)
Frequency Percentage
Strongly disagree 23 28.4
Disagree 31 38.3
Unsure 6 7.4
Agree 16 19.8
Strongly agree 5 6.2
Missing 1 1.2
Total 82 100
Discussion According to the results in Table 5.30, the majority of the respondents (66.7%)
(n=54) disagree and thus do not experience any conflict between their work and
family responsibilities; 26% (n=21) of them do experience conflict, and some of them
(7.4%) (n=6) are unsure as to whether they experience conflict between work and
family responsibilities.
Table 5.31: I experience a great deal of stress at work (Front-line employees’ response) (n=82)
Frequency Percentage
Strongly disagree 11 13.4
Disagree 23 28
Unsure 11 13.4
Agree 27 32.9
Strongly agree 10 12.2
Total 82 100
Discussion The results in Table 5.31 indicate that nearly half of the respondents (45.1%) (n=37)
experience stress at work; 41.4% (n=34) of the respondents do not experience any
stress at work, and 13.4% of them are unsure as to whether they experience any
stress at work.

107
Table 5.32: Front-line employees are treated with respect (Managers’ response) (n=41)
Frequency Percentage
Disagree 2 4.9
Unsure 4 9.8
Agree 16 39
Strongly agree 19 46.3
Total 41 100
Discussion The results in Table 5.32 indicate that 85.3% (n=35) of the front-line employees are
treated with the necessary respect. Only a small percentage (4.9%) (n=2) of them
disagree, indicating that front-line employees are not treated with respect. However,
4 managers (9.8%) indicated that they are unsure.
Table 5.33: Front-line employees’ attitude and behaviour have an impact on customer evaluation of services (Managers’ response) (n=41)
Frequency Percentage
Disagree 1 2.4
Agree 14 34.1
Strongly agree 26 63.4
Total 41 100
Discussion The results in Table 5.33 reveal that the vast majority of the respondents (97.5 %)
(n=40) indicated that the attitude and behaviour of front-line employees impact on
customers’ evaluation of services. Only 1 respondent (2.4%) disagreed.

108
Table 5.34: Most common complaints among front-line employees (Managers’ response) (n=41)
Frequency Percentage
Too much work to do 8 19.5
Not my work, but that of somebody else 7 17.1
Poor communication from management 5 12.2
Too much work and poor communication 5 12.2
Other 8 19.5
Missing 8 19.5
Total 41 100
Discussion The results in Table 5.34 indicate that the most common complaint received by
management is that of front-line employees’ workload (19.5%) (n=8), while others
(17.1%) (n=7) complain about doing somebody else’s work. Some front-line
employees (12.2%) (n=5) complain about poor communication from management,
whereas an equal number of them (12.2%) (n=5) indicated that they have too much
work and that communication is poor.
Table 5.35: Are you flexible in your leadership role to attend to different situations? (Managers’ response) (n=41)
Frequency Percentage
Yes 40 97.6
No 1 2.4
Total 41 100
Discussion The results in Table 5.35 indicate that the majority of the managers (97.6%) (n=40)
are flexible in their leadership role.

109
Reliability testing: Front-line employees Table 5.36 represents the mean scores and Cronbach’s alpha value for all Likert-
scale questions based on the factors that influence service delivery.
Table 5.36: Cronbach’s alpha test for reliability (Front-line employees) (n=82)
Variable Cronbach’s alpha a
Percentage No. of questions
Reliability
Climate 0.86 86 10 High internal reliability
Empowerment 0.78 78 5 High internal reliability
Training/Systems/HR 0.82 82 8 High internal reliability
Rewards 0.75 75 4 High internal reliability
Job satisfaction 0.89 89 4 High internal reliability
Management 0.89 89 6 High internal reliability
Customer service 0.89 89 6 High internal reliability
Service quality 0.85 85 7 High internal reliability
Commitment 0.82 82 5 High internal reliability
Discussion The reliability for the above scales was found by computing the coefficient a. Factors
were determined using a 5-point Likert scale. “Job satisfaction”, “Management” and
“Customer service” have the highest alpha value of .89 (89%). The lowest alpha
value is .75 (75%) for “Rewards” and .78 (78%) for “Empowerment”. All coefficients
are found to be greater than 0.7; therefore, the tests conducted are considered to be
valid and acceptable. The acceptable Cronbach’s alpha value is 0.7 and above
(Skeran and Bougie, 2010: 324).
Pearson Product Moment Correlation tests The correlation coefficient (prefix) indicates the magnitude and the direction of the
relationship. The coefficient can be either positive (+) or negative (-). Thus, the closer
the coefficient is to 1, the stronger the relationship; 0 (nil) indicates a weak
relationship (Bryman and Bell, 2007: 362; Cooper and Schindler, 2014: 473).

110
Table 5.37: Pearson Product Moment Correlation test showing the relationship between Service quality (factor J) and factors as identified (n=82)
Factors Service quality
Correlation coefficient
Guildford’s value of r (+ or -)
Informal interpretation
Commitment 0.71** 0.7-0.9 High correlation
Strong relationship
Organisation climate 0.62** 0.4-0.7 Moderate correlation
Substantial relationship
Job satisfaction 0.59** 0.4-0.7 Moderate correlation
Substantial relationship
Customer service 0.58** 0.4-0.7 Moderate correlation
Substantial relationship
Empowerment 0.56** 0.4-0.7 Moderate correlation
Substantial relationship
Management 0.54** 0.4 - 0.7 Moderate correlation
Substantial relationship
Training/Systems/HR 0.52** 0.4-0.7 Moderate correlation
Substantial relationship
Rewards 0.24* 0.2-0.4 Low correlation
Definite, but small relationship
** Correlation is significant at the 0.01 level (2-tailed)
* Correlation is significant at the 0.05 level (2-tailed)
Discussion The Pearson Correlation test was conducted to establish whether there is a
relationship between Service quality (factor J) and various factors as identified from
literature. Table 5.37 shows that all the values are above 0 and closer to 1. This
means that Service quality is positively correlated to the factors that have an
influence on it.
From the results, Commitment has the highest value (71%) and thus the strongest
relationship with Service quality. In addition, Organisation climate (62%) is the next
highest value and has a substantial relationship with Service quality. It is further
observed that Job satisfaction (59%), Customer service (58%), Empowerment
(56%), Management (54%), and Training/Systems/HR (52%) are moderately
correlated to Service quality and show a substantial relationship. Rewards (24%)

111
have a low correlation with Service quality. However, there is a definite, but small
relationship between Service quality and Rewards. The results also indicate that
Rewards is less correlated with Service quality.
Table 5.38: Pearson Product Moment Correlation showing the relationship between Customer service (factor I) and factors as identified (n=82)
Factors Customer service
Correlation coefficient
Guilford’s value of r (+ or -)
Informal interpretation
Empowerment 0.42** 0.4-0.7 Moderate correlation
Substantial relationship
Commitment 0.37** 0.2-0.4 Low correlation
Small relationship
Management 0.36** 0.2-0.4 Low correlation
Small relationship
Organisation climate
0.33** 0.2-0.4 Low correlation
Small relationship
Job satisfaction 0.27* 0.2-0.4 Low correlation
Small relationship
Training/Systems /HR
0.27* 0.2-0.4 Low correlation
Small relationship
Rewards 0.13 <0.2 Slight correlation
Almost no relationship
** Correlation is significant at the 0.01 level (2-tailed)
* Correlation is significant at the 0.05 level (2-tailed)
Discussion The above test was conducted to establish whether there is a relationship between
Customer service (factor I) and various factors as identified from literature. Table
5.38 shows that all the values are above 0 and closer to 1. This means that
Customer service is positively correlated to the factors that have an influence on it.
From the results, Empowerment (42%) has the highest value, has moderate
correlation and a substantial relationship to Customer service. In addition,
Commitment (37%), Management (36%), Organisation climate (33%), Job
satisfaction (27%) and Training/Systems/HR (27%) have a low correlation and a
definite, but small relationship with Customer service. It is further observed that

112
Rewards (13%) has a slight correlation with Customer service and almost no
relationship.
Table 5.39: Pearson Product Moment Correlation test showing the relationship between Front-line employees (factor H) and factors as identified (n=82)
Factors Front-line employees
Guildford’s value of r(+ or -)
Informal interpretation
Empowerment 0.76** 0.7-0.9 High correlation
Strong relationship
Organisation climate 0.71** 0.7-0.9 High correlation
Strong relationship
Job satisfaction 0.58** 0.4-0.7 Moderate correlation
Substantial relationship
Training/Systems/HR 0.56** 0.4-0.7 Moderate correlation
Substantial relationship
Commitment 0.53** 0.4-0.7 Moderate correlation
Substantial relationship
Management 0.52** 0.4-0.7 Moderate correlation
Substantial relationship
Rewards 0.29** 0.2-0.4 Low correlation
Definite, but small relationship
** Correlation is significant at the 0.01 level (2-tailed)
* Correlation is significant at the 0.05 level (2-tailed)
Discussion The above test was conducted to establish whether there is a relationship between
Front-line employees (factor H) and various factors as identified from literature.
Table 5.39 shows that all the values are above 0 and closer to 1. This means that
Front-line employees are positively correlated to the factors that have an influence
on them.
From the results, Empowerment (76%) and Organisation climate (71%) have a high
correlation and a strong relationship with Front-line employees. Furthermore, Job
satisfaction (58%), Training/Systems/HR (56%), Commitment (53%) and
Management (52%) have a moderate correlation and a substantial relationship with

113
Front-line employees. Rewards (29%) have a low correlation and a definite but small
relationship with Front-line employees.
5.4 SUMMARY
In this chapter, the research findings of the study were examined. Chapter 6
provides a detailed discussion of the results obtained, a conclusion and
recommendations for future research.

114
CHAPTER 6
DISCUSSION OF RESULTS, RECOMMENDATIONS AND CONCLUSION
6.1 INTRODUCTION
The aim of this study was to determine factors that have an influence on front-line
employees in delivering a quality service. This chapter presents an interpretation and
discussion of the empirical findings as well as recommendations.
The chapter is divided into two sections, namely Part A and Part B. Part A is a
discussion of the demographic results for front-line employees and managers. Part B
focuses on the empirical results, followed by a blueprint of steps for service delivery.
What make this chapter significant is that the results obtained lead to interesting
observations and recommendations.
6.2 SUMMARY OF THEORETICAL FINDINGS
Existing sources of secondary verifiable data such as publications, academic
journals, electronic databases and the Internet were reviewed to ascertain and
interpret what has been written and published on the research topic. The following
section briefly summarises the theoretical findings.
The most significant variables in the service-delivery process are the degree to
which the service is offered and the extent to which front-line employees meet
customers’ needs. Customers’ expectations are met when front-line employees
deliver quality service. This reflects positively on the organisation, resulting in a
higher market share and increase in profits. In order to achieve this, service-oriented
leaders can use the Gaps Model of Service Quality as a framework. Not only does
this model provide information, but it also helps them understand how service quality
emerges. The two main gaps in this model are the Customer Gap and the Provider
Gap. According to this model, customers’ perceptions of service quality depend on
the four gaps that exist within an organisation. These gaps are the Listening Gap,

115
the Services Design and Standards Gap, the Service Performance Gap, and the
Communication Gap. In order to close the Customer Gap, these four Gaps must first
be closed.
Front-line employees are the main role players in an organisation; therefore, their
loyalty towards the organisation has an impact on their approach to customer
service. Front-line employees play a crucial and dynamic role in the closure of
Provider Gap 3 (Service Performance Gap); the closure of this Gap mainly depends
on their attitude, competencies, skills, commitment, trust, communication, and work
in a complex relationship.
As front-line employees have a direct influence on the service-quality dimensions, it
is important to meet customers’ expectations by employing front-line employees who
have the ability to deliver. However, various factors may affect their effectiveness.
Some front-line employees may carry mental baggage to work, whereas others may
find it difficult to draw a line between personal, home- and work-related aspects. On
the other hand, some front-line employees may experience role conflict, while other
professional circumstances may also influence their effectiveness (e.g., employee or
job mismatch, empowerment, lack of management commitment, inappropriate
compensation, organisation culture, or poor communication) and their encounter with
customers and thus have negative consequences for both the employee and the
organisation. Front-line employees need to feel valued in their positions in order to
experience a positive devotion towards the organisation.
Various strategies are put forward to deliver service quality through effective front-
line employees, namely to hire the right front-line employees; compete for the best
front-line employees; hire front-line employees for their service competencies; be a
preferred employer; develop front-line employees who are customer-oriented;
empower front-line employees; retain the best front-line employees; develop front-
line employees to deliver service quality; promote teamwork; measure internal
service quality, and provide the necessary support systems.
Bearing this in mind, the following section provides a detailed discussion of the
findings.

116
6.3 DISCUSSION OF THE RESULTS AND RECOMMENDATIONS
The objective of this section is to present the empirical results of this study as well as
recommendations on the presented results. This chapter is divided into two sections,
namely Part A and Part B. Part A discusses the demographic results for front-line
employees and managers, and Part B focuses on the empirical results.
PART A – DEMOGRAPHIC RESULTS The demographic profile of front-line employees and managers includes gender,
age, cultural groups, and qualification profiles. These questions were asked to
enable the researcher to gain insight into the demographic characteristics of the
respondents. Additional results obtained from front-line employees include language,
transport system, and residential area. The purpose was to gain insight into how
front-line employees get to work and where they reside in order to establish whether
these factors have an influence on their performance at work. The questions related
to this section are found in Part B of the questionnaires (Appendices B and C).
Gender: Interesting results were obtained for gender: the majority of the front-line
employees are female, while the majority of managers are male.
Recommendation Although there was an overall even representation of gender between front-line
employees and managers in this study, AVBOB can consider appointing more
females in managerial positions to meet the requirements of the Employment Equity
Act. As can be noted, there are more males (65.9%) than females (34.1%) on the
managerial side.
Age: Results indicate that the majority of the front-line employees fall in the age
group 21-40 years and are thus fairly young. The conclusion can be made that
AVBOB mostly recruit younger persons as the majority of front-line employees are
Millennials (13-33 years of age) and Generation Xers (34-48 years old).
The results also show that the majority of the managers are 31-50 years old and
range between Millennials (13-33 years) and Baby Boomers (49-67 years). The

117
results indicate that a large percentage of the managers are nearing retirement and
have to be replaced within a few years’ time. However, the study is well presented in
terms of age groups.
As a result of the generation gap between managers and front-line employees,
misunderstandings and conflicts may occur as people have different mindsets, views
and communications styles. Thus, managers have to manage different generations
in their workforce while the biggest challenge is to teach generations to work towards
a common goal. In addition, due to personality differences, conflicts may occur and
could cause unpleasant and uncomfortable workplace situations.
Recommendation It is recommended that all members of staff undergo training in order to recognise
generation differences and learn how to manage these differences. Managers can
also encourage front-line employees to participate in cross-generation interaction, as
generations can learn valuable lessons from one another. It is also recommended
that staff members undergo training in conflict management, as age differences may
result in misunderstanding and thus cause conflict.
Frontline employees’ language: The largest percentage of the front-line
employees are Afrikaans speaking, followed by Sotho-speaking front-line
employees. The managers’ language was not tested.
Recommendation Although the study is well presented in terms of front-line employees’ language,
front-line employees must be encouraged to learn an additional language, as this
may improve communication between colleagues and with customers.
Culture: The majority of the front-line employees are Black, followed by White and a
small percentage of Coloured front-line employees. Results obtained from managers
indicate that the majority of the managers are White, followed by Black and a small
percentage of Coloured managers.

118
Recommendation Although the respondents’ culture can be regarded as a good representation of the
country’s rainbow nation, the appointment of more Black and Coloured front-line
employees and managers is recommended in order to adhere to the requirements of
the Employment Equity Act. Due to the many cultures with different religions, values,
language, race and gender in the employment of AVBOB, training in cultural diversity
is recommended for both managers and front-line employees. Such training can
educate staff on how to treat and respect people of different backgrounds and thus
avoid discrimination. In addition, diversity training can create a positive work
environment and promote better communication and teamwork. In order to manage
cultural differences effectively, managers must be sensitised regarding cultural
diversity aspects such as leave requirement, work functions (food and beverage
preferences), and religion.
Qualification: Although over half of the front-line employees and one third of the
managers possess a Grade-12 certificate, respondents are still well educated and
the results show a good spread of the respondents’ educational level. Although
managers are better qualified than front-line employees, their level of education is
still low. However, the results indicate the overall average qualification of front-line
employees and managers.
Recommendation Human resources need to address the education requirements for managers and
front-line employees. The selection and appointment strategies should be designed
to target managers and front-line employees with the necessary skills. In addition,
due to the different levels of education among the staff in AVBOB’s employment, the
organisation can introduce and provide more in-house training programmes in order
to have employees on the same educational level. This will not only enhance staff
competency, but also allow them to take notice of what is happening in the
organisation.
Front-line employees’ transport system and residential area: These two factors
go hand to hand as they influence one another. They were tested as they may affect
the personal and professional circumstances of front-line employees. The majority of

119
the front-line employees reside in town and in townships. Furthermore, front-line
employees make use of a diverse transport system. The results show that the
majority of them travel by taxi or walk to work. The reason why so many front-line
employees make use of public transport is most probably because the majority of
them reside in town or in the townships. In addition, due to high taxi fees, strikes,
impassable roads, reckless driving, and high accident rate, front-line employees
often prefer to walk. This is, in fact, a very unreliable system. Some front-line
employees arrive late for work, never show up, are tired from walking long distances,
and are in a bad mood due to their transport problems or responsibilities at home.
This, in turn, results in service-quality problems as their service delivery is not up to
standard. Another employee often needs to do their job; this may result in conflict
between staff members.
Recommendation Front-line employees need to be encouraged to contact the office and inform
management about their situation or transport problems. It is not always viable for a
company to make use of their own transport for their employees; however, should
the company lose money because employees turn up late for work, a careful
calculation needs to be done to compare the loss in money and transport costs.
PART B – EMPIRICAL RESULTS In order to answer the research question “What personal circumstances have an
influence on the effectiveness of front-line employees?”, “Front-line employees’
transport system” has been identified as a personal factor, because the majority of
the front-line employees make use of an unreliable transport system. A small
percentage of front-line employees indicated that they “do not always have clean
clothes to wear to work”. This may also be a contributing factor. Not all front-line
employees have the same amount of clothing. Some need to do their washing in the
evening after work and thus may not have dry clothing for the next day, especially
during winter months. Lin et al. (2013: 178); Wong and Lin, (2007: 726) as well as
Chiang et al. (2010: 25-27) indicate that personal circumstances may lead to conflict
between work and home life.

120
On the questions “My personal circumstances have a negative influence on my job
performance”; “I do not always have clean clothes to wear to work”; “I experience
conflict between my work and family responsibilities”, and “I have problems to get to
work and back home”, front-line employees indicated that this does not influence
their effectiveness. However, their answers can be understood as that they did
neither read nor interpret the questions correctly.
Recommendations Although only some front-line employees experience a transport problem, they still
make use of an unreliable transport system. Managers can encourage front-line
employees to inform them when they experience a transport problem. In addition,
front-line employees can be encouraged to form clubs and travel together. Not only
can they save on travelling costs, but it is also a more secure alternative to some of
the transport systems used. Management may consider the possibility of front-line
employees wearing a corporate uniform or have a standard look for all staff. Thus,
female and male front-line employees may dress in the same way and colour.
However, it must relate to the nature of the employees’ jobs and apply to both men
and women.
In order to answer the research question “What professional circumstances have an
influence on the effectiveness of front-line employees?”, training, rewards,
organisational benefits, work stress and work overload were identified as
professional circumstances that influence front-line employees’ effectiveness.
The above results are in line with the findings of various authors such as Zeithaml et
al. (2009: 348, 360-375), Grönroos (2007: 415), Mudie and Pirrie (2006: 146-150),
Gudergan et al., (2008: 28) as well as Karatepe (2013: 614-616), as discussed in
Chapter 3.
Hui et al. (2007: 152) indicate that front-line employees are often undertrained,
whereas Karatepe (2013: 614-616) indicate that front-line employees experience role
stress, are overworked and experience family-work conflict. Mudie and Pirrie (2006:
133, 146-150) and Kinman (2009: 118-130) indicate that emotional work causes
stress, as some front-line employees may act as being happy and empathetic, while
121
others feel and experience the customers’ emotions. This can result in front-line
employees being emotionally exhausted. Kinman (2009: 118-130) also indicates that
performance is measured on quantity and not quality. Kumar et al. (2009: 212)
identified poor technology and job suitability; Pride and Ferrell (2010: 529) indicated
that front-line employees must receive compensation, while Chi and Gursoy (2009:
247) claimed that uncertainty among front-line employees about what is expected
from them results in them being less co-operative, not committing themselves and
having no trust in the organisation. In addition, Boshoff and du Plessis (2013: 195)
found that the inability of front-line employees to function effectively is sometimes
governed by inadequate/poor system design, poor recovery strategies, or a lack of
knowledge.
Recommendations Human resource management is an important part of the strategic management of
every organisation. The following recommendations are made.
As far as training is concerned, all levels of management must be motivated to
service-oriented thinking and behaviour, as front-line employees must know how a
service organisation operates, what their role is and what is expected of them as
individuals. All front-line employees need to be aware of the organisation’s mission
and business strategies as well as the goal and function of each department.
Therefore, training programmes that include knowledge-based training (e.g., product,
system and team training) as well as attitude training are essential, as this will
enable front-line employees to deliver quality service through teamwork (Grönroos,
2007: 425).
Rewards are a powerful way to encourage front-line employee performance. Human
resources need to implement a uniform reward system to ensure that front-line
employees receive the same kind of recognition for good work. Rewards should be
presented to front-line employees on a regular basis. There are various ways of
rewarding front-line employees for good work. However, rewards in the form of
money do not always constitute a strong reward, as front-line employees also expect
to feel that they are valued. Acknowledgement is another form of reward; therefore, a
“thank-you”, a compliment, or time off work may also be viewed as a form of reward.
122
Front-line employees should be informed that excellent service is appreciated and
recognised in AVBOB’s rewards system. Clear guidelines relating to performance
standards for service delivery must be set by management and communicated to
front-line employees. These documents must be distributed among AVBOB
branches. Management need to ensure that front-line employees read, understand
and sign these documents. In addition, they need to set specific, quantifiable and
measurable goals for front-line employees and measure their performance through
customers’ opinions.
The unavailability of organisation benefits to some front-line employees places
additional stress on these employees. Human resources must ensure that benefits
are available to all front-line employees. In addition, they need to ensure that front-
line employees understand their service contract and as to whether benefits are
available or not.
As front-line employees experience work stress, balance-training programmes are
recommended to gain control and balance between professional and personal
circumstances. De-stress activities such as action cricket or a fun day can be
arranged to help alleviate front-line employees’ work stress.
Work overload creates work stress; thus training in time management can enable
front-line employees to work more “intelligently”. Human resources, via
management, can encourage front-line employees to collaborate with other
employees who do similar work. Suggestions could be made to front-line employees
as to how to prioritise work. Promote teamwork, as this provides emotional support
to front-line employees and enhances their motivation. Ensure that front-line
employees understand their job descriptions to enable them not only to focus on
what is exactly expected of them, but also to avoid pressure due to work overload.
Stress management is suggested to provide front-line employees with the necessary
skills to handle work pressure. In this regard, management must ensure that a
service blueprint is available at every AVBOB branch to enable front-line employees
to understand their role in both the process and the organisation.

123
In order to answer the primary research question:
(d) “What factors influence front-line employees to deliver a sustainable quality
service?”
and some secondary research questions:
(e) “What professional circumstances have an influence on the effectiveness of
front-line employees?”
(f) “How committed are front-line employees towards rendering a quality service?”.
Pearson product moment correlation was used to determine the strength of the
relationship of service quality; customer service, and front-line employees, using the
variables identified by Boshoff and du Plessis (2013: 195-220); Grönroos (2007: 423-
425) and Zeithaml et al. (2009: 348).
The recommendations for the above research questions were made after the last
research question was analysed.
In order to find answers to the above research questions, the factors as identified,
namely commitment, climate, job satisfaction, customer service, empowerment,
management, training/systems/HR and rewards, were correlated with service quality.
Some interesting and unexpected results were obtained. Findings indicate that
commitment has a high correlation and strong relationship with service quality. This
implies that, if front-line employees are committed, they will deliver service quality.
Organisation climate and job satisfaction show the next highest correlation with
service quality, as both have a moderate correlation (positive) and substantial
relationship with service quality. The positive correlation of commitment, organisation
climate and job satisfaction with service quality can be interpreted as that there is a
probability that these factors have an influence on service quality.
It is interesting to note that rewards indicates a low correlation (positive) and a
definite, but small relationship with service quality, while the remaining factors
indicate a moderate correlation (positive) and a substantial relationship with service
quality. The findings are interesting, as rewards were previously perceived as a
contributing factor to professional circumstances.

124
Secondly, empowerment, commitment, management, organisational climate, job
satisfaction, training/systems/HR and rewards were correlated with customer
service. Once again, interesting and unexpected results were obtained. Findings
indicate that empowerment has a moderate correlation and substantial relationship
with customer service. Commitment and management show the next highest
correlation with customer service, as both have a low correlation (positive) and small
relationship with customer service. The positive correlation of empowerment,
commitment and management with customer service can be interpreted as that there
is a probability that these factors have an influence on customer service. It is
interesting to note that “rewards” has a slight correlation and almost no relationship
with customer service. The remaining factors indicate a low correlation (positive) and
a small relationship with customer service.
Thirdly, empowerment, commitment, management, organisational climate, job
satisfaction, training/systems/HR and rewards were correlated with front-line
employees. The results indicate that empowerment and organisation climate have a
high correlation and strong relationship with front-line employees, whereas job
satisfaction has a moderate correlation and substantial relationship with frontline
employees. The positive correlation of empowerment, organisation climate and job
satisfaction with front-line employees can be interpreted as that there is a probability
that these factors have an influence on front-line employees. Rewards, once again,
has a low correlation and a definite, but small relationship with front-line employees.
All the other factors are moderately correlated and have a substantial relationship
with front-line employees.
Except for “rewards”, all other findings are in line with literature. Gudergan et al.
(2008: 28) indicate that commitment, organisational climate and job satisfaction can
have an influence on the service behaviour of front-line employees; Salanova et al.
(2005: 1218) indicate that commitment has an influence on the service behaviour of
front-line employees, and Mudie and Pirrie (2006: 144) state that committed
employees contribute to the economic benefits of an organisation.

125
Gil et al. (2008: 923) indicate that job satisfaction experienced by front-line
employees is one of the main reasons why they develop good service. In this regard,
Gil et al. also indicate that front-line employee job satisfaction may be affected by job
characteristics, front-line employee personality traits, group norms, personal belief
systems, self-esteem and values as well as demographic and organisational factors.
Mudie and Pirrie (2006: 36) indicate that climate is referred to as “employee’s
perception of the events, practice and procedures as well as their perceptions of the
behaviours that are rewarded, supported, and expected”. Organisation climate
reflects the human resource practices in an organisation and can be regarded as an
indicator of an organisation’s success. A positive organisation climate will, therefore,
have more productive front-line employees. Thus, “if management are to leave the
development of an appropriate organisational culture to emerge from front-line
employees themselves, and are not trying to “control” the organisational culture, then
management need to ensure that they recruit people with the right values”, and “if
front-line employees perceive management as failing in proper support,
encouragement and rewards, it is no surprise if customers perceive the service as
unsatisfied” (Mudie and Pirrie, 2006: 137).
Specialist literature indicates that empowerment of front-line employees contributes
positively to their morale (Grönroos, 2007: 401-404), whereas Boshoff and du
Plessis (2013: 112-113) view empowerment of front-line employees as a “strategy”
to provide them with greater discretion and autonomy. Mudie and Pirrie (2006: 149)
indicate that, when front-line employees have no autonomy or may not use their
discretion when dealing with customers, they may find their jobs very frustrating. If
front-line employees are empowered, they will have the knowledge, skills, and
authority to focus on the customers. The correct implementation of empowerment of
front-line employees forms part of an organisation’s internal marketing process and
can have an impact on front-line employees’ job satisfaction, which may, in turn,
improve customer contact (Grönroos, 2007: 130; 402).
The results relating to “rewards” is not fully in line with literature (Pride and Ferrel,
2010: 529) and Zeithaml et al. (2009: 374) and with previous findings (e.g., Slătten,
2010: 4-8; Liao and Chuang, 2004: 450; Beitelspacher et al., 2011: 3, and Peiró et

126
al., 2005: 786). According to these authors, rewards have a motivating effect on
front-line employees and encourage proper treatment of customers. Rewarding front-
line employees may encourage and motivate them to deliver a service of high
quality.
If management cannot lead by example or are not capable of encouraging front-line
employees to be service minded and customer oriented, the organisation’s ability to
deliver a quality service will decrease. Service-oriented leadership, including
managers’ and supervisors’ attitudes towards their role, their teams and how they
act, promotes good service. Without constant support by management, values
cannot spread or be maintained throughout the organisation. They play a key role in
the development of a service culture and, because they are leaders in the
organisation, they contribute to the culture of the organisation via their leadership
(Grönroos, 2007: 367, 422-423).
The results relating to “rewards” may be ascribed to the fact that front-line
employees receive a diverse reward system (e.g., bonus, trophy, certificate, and so
on) or that some are unsure as to whether they receive any rewards and, therefore,
do not really care. Some front-line employees may be happy with their jobs and more
driven by passion for what they are doing. For them, rewards are less important. In
addition, some front-line employees may gain a sense of accomplishment from their
work, while others may view their fringe benefits or social rewards as sufficiently
rewarding. When front-line employees have a clear understanding of what it takes to
be rewarded and to receive recognition, they will probably feel more supported by
AVBOB and, therefore, display more loyalty (Arnolds and Venter, 2007: 17).
Recommendations In order to enhance front-line employees’ role in delivering sustainable quality
service, human resources need to address the following recommendations. First,
internal marketing activities/strategies must be addressed. Managers are the key to
success; therefore, improving management’s commitment towards, and support of
front-line employees must be encouraged. Managers need to undergo leadership
training in order to understand and support their organisation’s values and culture.
They must personally demonstrate that they are customer focused and service

127
oriented, live up to it and behave accordingly. They must also physically support
front-line employees to perform in a customer-focused and service-oriented manner.
Furthermore, the implementation of a service profit chain may help managers define
their own role in AVBOB, but will also assist them in developing the best strategies.
Communication between managers and front-line employees must be encouraged
and operational decisions should be managed down to front-line employees in order
to keep them informed and understand what is expected of them. As far as front-line
employees are concerned, verbal and written upward communication must be
improved to enable managers to understand front-line employees’ needs. It is also
recommended that front-line employees understand the type of behaviour that can
be rewarded by AVBOB. Understanding an organisation’s rewards system can
directly and indirectly influence customer-oriented behaviour.
Finally, human resource management forms an important part of the strategic
requirements and must have recruitment procedures, career planning, and a reward
system in place. Good service rendered by the front-line employees needs to be
rewarded and achievements need to be measured to enable front-line employees to
realise the importance of good service. Rewards must be linked to AVBOB’s vision,
and a good rewards system must be easy to manage and understand. In order for
management to achieve a high service quality, all aspects of the organisation’s
design need to be in place for the service process. A discussion of AVBOB’s
strategic action plan with front-line employees will enable them to notice how they
contribute towards achieving strategic goals. In addition, a service-oriented
organisation requires a flat organisational structure with only a few hierarchical
levels.
It is recommended that AVBOB address the identified factors and draw up a service
blueprint to explore and identify front-line employees’ roles in the organisation in
delivering a sustainable service quality.

128
6.4 BLUEPRINT OF STEPS FOR MANAGERS OF SERVICE DELIVERY ORGANISATIONS
In order to achieve the last objective (g) “To set up a blueprint of steps for
recommendation for the management of service delivery organisations”, the
following blueprint is presented:
1. Always recruit the best front-line employees.
• Compete for the best front-line employees.
• Hire the best front-line employees for their service competencies.
• Strive to be the employer of choice.
Loyal and effective front-line employees are an asset to any service-delivery
organisation and, in order to benefit from them as an investment, human resource
management requires a strategic approach. Processes and practices must be
redesigned in order to support the development of these members of staff. Recruit
and carefully select the best front-line employees by evaluating and testing them for
their skills and knowledge to do the job. When an organisation’s goals and training
initiatives are linked, an employer can be labelled as the employer of choice.
2. Develop front-line employees to be service-oriented.
• Provide the necessary technical and skills training to all front-line
employees.
• Empower all front-line employees.
• Promote teamwork among front-line employees.
Training programmes should be integrated throughout the organisation and aligned
with the organisation and performance objectives. Provide comprehensive technical
and job-specific skills training to front-line employees to enable them to take
responsibility. The implementation of a service blueprint can assist front-line
employees in knowing where and how they fit into the process and organisation. Set
team goals and reward front-line employees when these goals are achieved.

129
3. Provide the necessary support systems to all front-line employees.
• Measure internal service quality.
• Provide the necessary supportive technology and equipment to all front-
line employees.
• Develop service-oriented internal processes.
Supply the necessary equipment, technology and internal support systems such as
access to intranet, e-mails, websites, and customer information databases to enable
front-line employees to provide an effective service. Measure internal service quality
between departments annually, and redesign internal processes to be customer
oriented.
4. Retain the best front-line employees.
• Include all front-line employees in the organisation’s vision.
• Treat all front-line employees as customers.
• Reward front-line employees for successful performance and excellence.
The organisation’s vision needs to be clear and motivating, and must be frequently
communicated to front-line employees to enable them not only to share in, and
understand the organisation’s vision, but also to adhere to the organisation’s
objectives. Make front-line employees feel valuable, treat them fairly and let them
feel that they are taken care of. Conduct internal market research to determine
whether front-line employees’ job and work-life are met. Introduce a decent
compensation programme and a fair rewards system for employees who focus on
service quality.
The above blueprint of steps must be regarded as a valuable tool towards the quality
service-delivery process for AVBOB.
130
6.5 RESEARCH OBJECTIVES OF THE STUDY
Finally, the primary objective, namely to determine factors that influence front-line
employees in their delivery of a sustainable quality service, was achieved based on
the research findings in Chapter 5.
The following six secondary objectives were also achieved:
a) To examine the aspects that influence the Customer Gap was achieved in
Chapter 2.
b) To investigate the role of front-line employees in narrowing the Customer Gap
was achieved in Chapter 3.
c) To identify the personal circumstances that influence the effectiveness of front-
line employees was achieved in Chapters 3 and 5.
d) To identify the professional circumstances that influence the effectiveness of
front-line employees was achieved in Chapters 3 and 5.
e) To investigate front-line employees’ commitment towards rendering a quality
service was achieved in Chapters 3 and 5.
f) To discuss the role and awareness of management in the front-line employees’
role in service delivery was achieved in Chapters 2 and 3.
g) To set up a blueprint of steps for recommendation for the management of
service-delivery organisations was achieved in Chapter 6.
6.6 LIMITATIONS OF THE STUDY AND FUTURE RESEARCH
As in any research, there are some limitations to this study. For example, the study
was restricted to AVBOB, and only front-line employees and managers at some of
the branches completed the questionnaires. Secondly, a relative small number of
front-line employees (n=82) and managers (n=41) serves as the sample. It was not
an easy task to distribute the questionnaires to the respondents, and to receive the
questionnaires back from them. In addition, it was difficult to convince the
respondents, especially managers, that the questionnaires were distributed solely for
academic purposes.

131
This research also provides room for future research. The research can be extended
to several other service organisations within the funeral industry to generalise the
findings. It would be interesting to observe whether the same factors show a positive
relationship when tested in another service organisation in the funeral industry. It
could also be extended to a more diverse group of service providers. Secondly,
another potential area for investigation is the role of managers and their strategies
towards a competitive advantage and sustainable quality service in AVBOB. Thirdly,
service encounters between front-line employees and AVBOB customers can be
investigated to determine and identify discrepancies in the service encounter
between these two parties and to identify ways to deliver a service that best suits
their customers. Fourthly, customer satisfaction is an outcome of service quality and
it can be investigated to determine AVBOB customers’ level of satisfaction with the
service they receive.
6.7 CONTRIBUTION
The contribution of this study is not only to identify personal and professional
circumstances that influence front-line employees in their delivery of a sustainable
quality service, but also to demonstrate the important role that front-line employees
play in a service organisation.
6.8 SUMMARY AND CONCLUSION
This chapter presented and discussed the theoretical and empirical findings,
recommendations based on these findings, and recommendations regarding future
research.
Human resources are considered an important part of AVBOB to maintain a
competitive advantage. The organisation’s challenge is to recruit and retain front-line
employees. In this study, the relationship of service quality, commitment, and front-
line employees with various factors was tested. The most significant findings of the
study are the positive correlation with commitment, organisational climate,
empowerment, job satisfaction and management. Furthermore, transport has been
identified as a personal circumstance that has an influence on front-line employees’

132
effectiveness, while clothing may also be a contributing factor. Training, rewards,
organisation benefits, work stress and work overload have been identified as
professional circumstances that influence the effectiveness of front-line employees.
Finally, bearing this in mind, for AVBOB to compete successfully, it is essential that
management use the Gaps Model of Service Quality to identify areas that need
improvement. For AVBOB to close the Service Performance Gap, the other three
gaps within the Provider Gap (Gaps 1, 2 and 4) must also be closed in order to close
the Customer Gap. To achieve excellent service quality through effective front-line
employees, all internal marketing strategies must form an integral part of strategic
management. In addition, top and middle management as well as supervisors must
work together to demonstrate leadership, changes in organisational culture, and their
support for the internal marketing processes. Literature suggests that managers can,
through effective recruitment, training, rewards system and the creation of a
favourable organisation climate, contribute towards the effectiveness of front-line
employees to deliver a sustainable quality service. All the recommendations in this
study are practical and can be applied and achieved by AVBOB.

133
LIST OF REFERENCES
Agrawal, R. 2008. Public transport and customer satisfaction: The case of Indian
Railways. Global Business Review, 9(2): 257-272.
Akbar, M.M. and Parvez, N. 2009. Impact of service quality, trust, and customer
satisfaction on customer loyalty. ABAC Journal, 29(1): 24-38.
Albarq, A.N. 2013. Applying a SERVQUAL Model to measure the impact of service
quality on customer loyalty among local Saudi Banks in Riyadh. American Journal of
Industrial and Business Management, 3: 700-707.
Arnolds, C.A. and Venter, D.J.L. 2007. The strategic importance of motivational
rewards for lower-level employees in the manufacturing and retail industries. SA
Journal of Industrial Psychology, 33(3): 15-23.
Ball, D., Coelho, P.S. and Vilares, M.J. 2006. Service personalization and loyalty.
Journal of Services Marketing, 20(6): 391-403.
Baptiste, N.R. 2008. Tightening the link between employee wellbeing at work and
performance: A new dimension for HRM. Management Decision, 46(2): 284-305.
Beitelspacher, L.S., Richey, R.G. and Reynolds, K.E. 2011. Exploring a new
perspective on service efficiency: service culture in retail organizations. Journal of
Service Marketing, 25(3): 215-228.
Bennett, R. and Rundle-Thiele, S. 2004. Customer satisfaction should not be the
only goal. Journal of Services Marketing, 18(7): 514-523.
Boshoff, C. and du Plessis, F. 2013. Services Marketing – A contemporary
approach. Juta: Cape Town.
134
Bryman, A. and Bell, E. 2007. Business Research Methods. 2nd ed. New York:
Oxford University Press.
Buglear, J. 2005. Quantitative methods for business: the A-Z of QM. Amsterdam,
Boston: Elsevier/Butterworth-Heineman.
Chen-Yu, H.J., Williams, G. and Kincade, D.H. 2009. Determinants of customer
satisfaction/dissatisfaction with the performance of apparel products. Family and
Consumer Science Research Journal, 28(2): 167-192.
Chi, C. G. and Gursoy, D. 2009. Employee satisfaction, customer satisfaction, and
financial performance: An empirical examination. International Journal of Hospitality
Management, 28: 245-253.
Chiang, F.F.T., Birtch, T.A. and Kwan, H.K. 2010. The moderating roles of job
control and work-life balance practices on employee stress in the hotel and catering
industry. International Journal of Hospitality Management, 29: 25-32.
Coelho, F., Augusto, M. and Lages, L.F. 2010. Contextual factors and the creativity
of frontline employees: The mediating effects of role stress and intrinsic motivation.
Journal of Retailing, 87(1): 31-45.
Clow, K.E. and Kurtz, D.L. 2004. Services Marketing: Operation, Management and
Strategy. 2nd ed. Cincinnati: Atomic Dog Publishing.
Cooper, D.R. and Schindler, P.S. 2014. Business Research Methods. 12th ed.
Boston:McGraw Hill/Irwin.
Dabholkar, P.A. and Abston, K.A. 2008. The role of customer contact employees as
external customers: A conceptual framework for marketing strategy and future
research. Journal of Business Research, 61: 959-967.

135
Dehghan, A. and Shahin, A. 2011. Customer loyalty assessment: A case study in
MADDIRAN, the distributor of LG Electronics in Iran. Business Management and
Strategy, 2(1): 1-23.
Delgado-Ballester, E. and Munuera-Aleman, J.L. 2001. Brand trust in the context of
customer loyalty. European Journal of Marketing, 35(11/12): 1238-1258.
Demirbag, M., Tatoglu, E., Tekinkus, M. and Zaim, S. 2006. An analysis of the
relationship between TQM implementation and organizational performance. Journal
of manufacturing Technology Management, 17(6): 829-847.
Developing competitive advantage through customer service n.d. (Online). Retrieved
from: www.thetimes100.co.uk. [Accessed 23 August 2013].
De Vos, A.S., Strydom, H., Fouché, C.B. and Delport, C.S.L. 2005. Research at
Grass Roots. 3rd ed. Cape Town: Paarl Print.
Dimitriades, Z.S. 2006. Customer satisfaction, loyalty and commitment in service
organisations: Some evidence from Greece. Management Research News, 29(12):
782-800.
Eboli, L. and Mazzulla, G. 2007. Service quality attributes affecting customer
satisfaction for bus transit. Journal of Public Transport, 10(3): 21-34.
Ekinci, Y. 2003. An investigation of the determinants of customer satisfaction.
Tourism Analysis, 8(2): 193-196.
Evanschitzky, H., Sharma, A. and Prykop, C. 2012. The role of the sales employee
in securing customer satisfaction. European Journal of Marketing, 46(3/4): 489-508.
Fitzsimmons, J.A. and Fitzsimmons, M.J. 2008. Service Management. Operations,
Strategy, Information Technology. International edition: New York: McGraw-Hill.

136
Gafo, I. 2010. The Customer Gap (Online). Retrieved from:
http://marketing.blogs.ie.edu/archies/2010/the-customer-gap.php. [Accessed 06
June 2012].
Gallagher, S., Brown, C. and Brown, L. 2008. A strong market culture drives
organizational performance and success. Employment Relations Today, 35(1): 25-
31.
Geetika, S.N. 2010. Determinants of customer satisfaction on service quality: A
study of railway platforms in India. Journal of Public Transport, 13(1): 97-113.
Gil, I., Berenguer, G. and Cervera, A. 2008. The role of service encounters, service
value, and job satisfaction in achieving satisfaction in business relationships.
Industrial Marketing Management, 37(8): 921-939.
Global Finance: South African GDP Data and Country Report 2004. (Online)
Retrieved from: http://www.gfmag.com/gdp-data-country-reports/176-south-africa-
gdp-country-report [Accessed 08 August 2012].
Gronholdt, L., Maarten, A. and Kristensen, K. 2000. The relationship between
customer satisfaction and loyalty: cross-industry differences. Total Quality
Management, 11(4/5/6): 509-514.
Grönroos, C. 2007. Service Management and Marketing: Customer Management in
Service Competition. 3rd ed. Chichester, United Kingdom: John Wiley and Sons Ltd.
Grönfeldt, S.V.A.F.A. and Strother, J. 2006. Service Leadership: The Quest for
Competitive Advantage. Thousand Oaks, California: Sage Publications.
Gudergan, S., Beatson, A. and Lings, I. 2008. Managing service staff as an
organizational resource: Implications for customer service provision. Services
Marketing Quarterly, 29(4): 25-41.

137
Gunlu, E., Aksarayli, M.K. and Perçin, N.S. 2010. Job satisfaction and organisational
commitment of hotel managers in Turkey. International Journal of Contemporary
Hospitality, 22(5): 693-717.
Hoffman, K.D., Bateson, J.E.G., Wood, E.H. and Kenyon, A.J. 2009. Services
Marketing: Concepts, Strategies and Cases. London: Cengage Learning, Inc.
Hsu, Y.R. 2011. Work-family conflict and job satisfaction in stressful working
environments. International Journal of Manpower, 32(2): 233-248
Hu, H-H., Kandampully, J. and Juwaheer, T.D. 2009. Relationships and impacts of
service quality, perceived value, customer satisfaction, and image: An empirical
study. The Service Industries Journal, 29(2): 111-125.
Hui, C.H., Chiu, W.C.K., Yu, P.L.H., Cheng, K. and Tse, H.H.M. 2007. The effect of
service climate and the effective leadership behaviour of supervisors on frontline
employee service quality: A multi-level analysis. Journal of Occupational and
Organizational Psychology, 80(1): 151-172.
Ignacio Gafo, 2010. The Customer Gap (Online). Retrieved from:
http://marketing.blogs.ie.edu/archies/2010/the-customer-gap.php. [Accessed 06
June 2013].
Jham, V. and Khan, K.M. 2008. Determinants of performance in retail banking:
Perspectives of customer satisfaction and relationship marketing. Singapore
Management Review, 30(2): 35-45.
Jones, M.A. and Suh, J. 2000. Transaction-specific satisfaction and overall
satisfaction: an empirical analysis. Journal of Services Marketing, 14(2): 147-159.
Karatepe, O.M. 2013. The effects of work overload and work-family conflict on job
embeddedness and job performance. International Journal of Contemporary
Hospitality Management, 25(4): 614-634.

138
Khan, M.T. 2014. Relationship Marketing – Some Aspects. International Journal of
Information, Business and Management, 6(2): 108-120.
Kheng, L.L., Mahamad,O., Ramayah, T. and Mosahab, R. 2010. The impact of
service quality on customer loyalty: A study of Banks in Penang, Malaysia. Industrial
Journal of Marketing Studies, 2(2): 57-62.
Kim, H.J. 2011. Service orientation, service quality, customer satisfaction, and
customer loyalty: Testing a structural Model. Journal of Hospitality Marketing and
Management, 20: 619-637.
Kinman, G. 2009. Emotional labour and strain in frontline service employees. Journal
of Management Psychology, 24(2): 118-135.
Klopper, H.B., Berndt, A., Chipp, K., Ismail, Z., Roberts-Lombard, M., Subramani, D.,
Wakeham, M., Petzer, D., Hern, L., Saunders, S. with Meyers-Smith, P. 2006.
Marketing: Fresh Perspectives. Cape Town: Pearson Education South Africa (Pty)
Ltd.
Kong, S.M. and Muthusamy, K. 2011. Using service gaps to classify quality
attributes. The TQM Journal, 23(2): 145-63.
Korschun, D., Bhattacharya, C.B. and Swain, S.D. 2014. Corporate social
responsibility, customer orientation, and the job performance of frontline employees.
Journal of Marketing, 78(3): 20-37.
Kotler, P. and Keller, K.L., 2009. Marketing Management. 13th ed. Upper Saddle
River, New Jersey: Pearson Education Inc.
Kumar, M., Kee, F.T. and Manshor, A.T. 2009. Determining the relative importance
of critical factors in delivering service quality of banks. Managing Service Quality,
19(2): 211-228.

139
Ladhari, R., Pons, F., Bressolles, G. and Zins, M. 2011. Culture and personal values:
How they influence perceived service quality. Journal of Business Research, 64:
951-957.
Lam, S.Y., Shankar, V., Erramilli, M.K. and Murthy, B. 2004. Customer value,
satisfaction, loyalty and switching costs: an illustration from a business-to-business
service context. Journal of Academy Marketing Science, 32(3): 293-311.
Lamb, C.W., Hair, J.F., McDaniel, C., Boshoff, C. and Terblanche, N.S. 2008.
Marketing. 3rd ed. Cape Town, South Africa: Oxford University Press.
Lee, S.K.J. and Yu, K. 2004. Corporate culture and organizational performance.
Journal of Managerial Psychology, 19(4): 340-359.
Lee, Y-I-K., Nam, J-H., Park, D-H. and Lee, K.A. 2004. What factors influence
customer-orientated pro-social behaviour of customer-contact employees? Journal of
Services Marketing, 20(4): 251-264.
Lenka, U., Suar, D. and Mohapatra, P.K.J. 2009. Service quality, customer
satisfaction, and customer loyalty in Indian Commercial Banks. The Journal of
Entrepreneurship, 18(1): 47-64.
Li, X., Frenkel, S. and Sanders, K. 2011. Strategic HRM as process: how HR system
and organization climate strength influence Chinese employee attitudes. The
International Journal of Human Resource Management, 22(9): 1825-1842.
Liao, H. and Chuang, A. 2004. A multilevel investigation of factors influencing
employees service performance and customer outcomes. Academy of Management
Journal, 47(1): 41-58.
Lin, H-H. and Wang, Y-S. 2006. An examination of the determinants of customer
loyalty in mobile commerce contexts. Information and Management, 43: 271-282.

140
Lin, J-H., Wong, J-Y. and Ho, C. 2013. Promoting front-line employees’ quality of life:
Leisure benefit systems and work-to-leisure conflicts. Tourism Management, 36:
178-187.
Little, M.M. and Dean, A.M. 2006. Links between service climate, employee
commitment and employees’ service quality capability. Managing Service Quality,
16(5): 460-476.
Marin-Garcia, J.A., Bonavia, T. and Losilla, J-M. 2011. Exploring working conditions
as determinants of job satisfaction: An empirical test among Catalonia service
workers. The Service Industries Journal, 31(12): 2051-2066.
Mathies, C. and Burford, M. 2011. Customer service understanding: gender
differences of frontline employees. Managing Service Quality, 21(6): 636-648.
Mudie, P. and Pirrie, A. 2006. Services Marketing Management. 3rd ed. Oxford:
Butterworth-Heineman.
Nam, J., Ekinci, Y. and Whyatt, G. 2011. Brand equity, brand loyalty and consumer
satisfaction. Annals of Tourism Research, 38: 1009-1030.
Netemeyer, R.G., Maxham, J.G. and Pullig, C. 2005. Conflict in the work-family
interface: Links to job stress, customer service employee performance, and
customer purchase intent. Journal of Marketing, 69(2): 130-143.
Ooncharoen, N. 2008. Building organizational excellence and business performance
of hotel business in Thailand: Effects of service culture and organizational
characteristic. International Journal of Business Research, 8(3): 1-10.
Peirό, J.M., Martinez-Tur V. and Ramos, J. 2005. Employee’s overestimation of
functional and relational service quality: A Gap Analysis. The Service Industries
Journal, 25(6): 773-788.

141
Pride, W.M. and Ferrel, O.C. 2010. Marketing. 15th ed. Canada: Nelson Education,
Ltd.
Quinlan, C. 2011. Business Research Methods. Hampshire, United Kingdom:
Cengage Learning EMEA.
Renganathan, R. 2011. Service Quality in Hospitality Services: Gap Model and
Factor Analysis. European Journal of Social Sciences, 26(2): 159-175.
Ryan, A.N., Schmit, M.J. and Johnson, R. 1996. Attitudes and effectivesness:
Examining relations at an organizational level. Personnel Psychology, 49(4): 853-
882.
Sachdev, S.B. and Verma, H.V. 2004. Relative importance of service quality
dimentions: A multi-sectoral study. Journal of Services Research, 4(1): 93-116.
Salanova, M., Agut, S. and Peirό, J.M. 2005. Linking organizational resources and
work engagement to employee performance and customer loyalty: The mediation of
service climate. Journal of Applied Psychology, 90(6): 1217-1227.
Sanders, K., Geurts, P. and van Riemsdijk, M. 2011. Considering leadership climate
strength: Affective commitment within supermarkets in Central Europe. Small Group
Research, 42(1): 103-123.
Sekaran, U. and Bougie, R. 2010. Research methods for businesses. 5th ed.
Chichester, United Kingdom: John Wiley and Sons Ltd.
Seth, N., Deshmaukh, S.G. and Vrat, P. 2005. Service quality models: a review.
International Journal of Quality and Reliability Management, 22(9): 913-949.
Shahin, A. and Samea, M. 2010. Developing the Models of Service Quality Gaps: A
critical discussion. Business Management and Strategy, 1(1): E2, 1-11.

142
Slătten, T. 2010. Do employees’ feelings really matter in service-quality
management? European Business Review, 22(3): 318-338.
Söderlund, M. & Rosengren, S. 2008. Revisiting the smiling service worker and
customer satisfaction. International Journal of Service Industry Management, 19(5):
552-574.
Steward, D. 2010. Growing the Corporate Culture (Online). Retrieved from:
https://www.wachovia.com/foundation/v/index.jsp?vgnextoid=ab411f07760aa110VC
M1000004b0d1872RCRD&vgnextfmt=default. [Accessed 26 June 2012].
Sureshchandar, G.S., Rajendran, C. and Anantharaman, R.N. 2002. The relationship
between service quality and customer satisfaction – a factor specific approach.
Journal of Services Marketing, 16(4): 363-379.
The importance of customer service to the organization. n.d. (Online). Retrieved
from: http://www.ehow.com/about_6505645_importance-customer-service-
organization.html. [Accessed 31 July 2013].
Trading Economics. 2014. South African GDP Annual Growth Rate. (Online).
Retrieved from: http://www.tradingeconomics.com/south-africa/gdp-growth-annual
[Accessed 06 November 2014].
Tsai, Y. 2011. Relationship between organizational culture, leadership behavior and
job satisfaction. BMC Health Services Research, 11(98): 2-9.
Tsai, M-C. and Lin, C-L. 2014. Bridge the Gaps: From deficiency on superior service.
Asia Pacific Journal of Tourism Research, 19(4): 389-415
Ueno, K. 2010. What are the fundamental features supporting service quality?
Journal of Services Marketing, 24(1): 74-86.

143
Urban, W. 2009. Service quality gaps and their role in service enterprise
development. Baltic Journal of Sustainability, 15(4): 631-645.
Vanniarajan, T. and Stephen, A. 2008. Railqual and passenger satisfaction: An
empirical study in southern railways. Asia Pacific Business Review, IV(1): 64-75.
Varca, P.E. 2009. Emotional empathy and front line employees: does it make sense
to care about the customer? Journal of Services Marketing, 23(1): 51-56.
Wolniak, R. and Skotnicka-Zasadzien, B. 2011. The concept study of Servqual
method’s gap. Qual Quant, 46: 1239-1247.
Wong, J-Y. and Lin, J-H. 2007. The role of job control and job support in adjusting
service employee’s work-to-leisure conflict. Tourism Management, 28: 726-735.
Yadav, R.K. and Dabhade, N. 2003. Service marketing triangle and GAP model in
hospital industry. International Letters of Social and Humanistic Sciences, 8: 77-85.
Yagil, D. and Gal, I. 2002. The role of organizational service climate in generating
control and empowerment among workers and customers. Journal of Retailing and
Consumer Services, 9(4): 215-226.
Yoon, M.H., Beatty, S.E. and Suh, J. 2001. The effect of work climate on critical
employee and customer outcomes: An employee-level analysis. International Journal
of Service Industry Management, 12(5): 500-521.
Zeithaml, V.A. and Bitner, M.J. 2003. Service Marketing: Integrating customer focus
across the firm. 2nd ed. Boston, M.A: McGraw-Hill.
Zeithaml, V.A., Bitner, M.J. and Gremier, D.D. 2009. Services Marketing. 3rd ed.
Boston, M.A: McGraw-Hill.

144
APPENDICES Appendix A – Permission to hand-out questionnaires for research purposes Appendix B – Questionnaire for Front-line employees
Appendix C – Questionnaire for Managers
Appendix D - Purpose of research and confidentiality

145
ANNEXURE A

146
ANNEXURE B
SURVEY QUESTIONNAIRE FOR FRONTLINE EMPLOYEES
Mark with “x” where applicable SECTION A A. 1. How long ago were you appointed by the organization
(a) Less than 5 years
(b) 5 – 10 years
(c) 10 years and more
2. What is your position within the organization? Post Level? 3. (a) Have you had another position in the organization before?
Yes No
(b) If “yes” what was your position? B: Climate Mark with “x” where applicable
Stro
ngly
A
gree
Agr
ee
Uns
ure
Dis
agre
e
Stro
ngly
D
isag
ree
1. Management are flexible to meet the needs of different situations 2. Leaders have a clear vision for the future of this organization
3. Proud to work at this organization 4. I believe that the success of this organization depends on meeting the customer’s needs
5.I would recommend this organization as a good place to work 6. The organization has a formal performance review process 7.In my organization clear performance standards for service quality are set
8. Individuals on all levels are recognized 9. In my organization we work as a team 10. I have job security in my workplace
C: Empowerment 1. When I experience problems I have the right to make a decision and handle the problem?
2. Frontline employees may participate in decision making processes 3. Frontline employees may make decisions in order to provide excellent service
4.Have responsibility and authority to act independently 5. I am empowered to accommodate and act on customer requests

147
D. Training/Systems/HR St
rong
ly
Agr
ee
Agr
ee
Uns
ure
Dis
agre
e
Stro
ngly
D
isag
ree
1 Training programs are in place 2. Supportive equipment are provided 3. Internal support systems are available and up to date (e.g. customer records) 4.Training fits the organizations goals and strategies 5. I receive the necessary training to enhance my ability to deliver a quality service
6.The organization uses performance measurement to identify areas that needs attention
7 Organizational benefits are available (pension etc) 8. In my organization I receive training on how to provide the best service to the customers
E. Rewards 1. Salary increases are market related 2. Incentives are provided 3. I am recognized for my contribution towards quality service 4. I receive a performance bonus F. Job satisfaction 1. Working conditions are acceptable 2 Job responsibilities are clearly defined 3. I consider my job as pleasant 4. I feel satisfied with my overall job environment G. Management 1. Management communicate regularly with frontline employees 2. Management are interested in frontline employees and their needs 3. Management are interested in the wellbeing of the family of frontline employees
4.Management set clear performance standards for service quality 5. Management distribute work fairly amongst frontline employees 6. Management is flexible and adjusts his/her leadership style according to the needs of different situations.
H. Frontline employees 1. I may make a decision and use my own judgment in order to get the job done 2. I have the opportunity to give feedback to management 3 .I form long term relationships with my customers 4. I am committed in providing a quality service to customers 5. I have the required knowledge to assist customers I. Customer service 1. I voluntary assist customers even if it means that it may go beyond my job requirements
2. I go out of my way to make a customer feel satisfied 3. I help customers beyond what is expected from me 4.I frequently go out of my way to assist a customer 5.I meet performance requirements when serving a customer 6. Customers are treated with empathy

148
J. Service Quality St
rong
ly
Agr
ee
Agr
ee
Uns
ure
Dis
agre
e
Stro
ngly
D
isag
ree
1. In my organization we work hard to meet customer needs 2. Customers are valued 3. I provide a quick and prompt service 4. I perform the service right the first time 5. In my organization we are dedicated to provide the customer with the needed support
6. In my organization frontline employees responds immediately to customer complaints
7.I am interested in solving customer problems K. Commitment 1. I will make personal sacrifices if it is to the benefit of the organization 2. I am proud to work at this organization 3. I work hard to meet customer needs 4. I am never to busy to help a customer 5. I make personal sacrifices to help the organization succeed L. General 1. My personal circumstances have a negative influence on my job performance
2. Management is unaware of my personal circumstances and problems 3. I have problems to get to work and back home 4. I want management to know my family (e.g. husband, wife, children) 5. I experience conflict between my work and family responsibilities 6.Management is interested in the wellbeing of my family 7. Although I am committed to my organization my family comes first 8.My personal circumstances have no influence on my work 9. I do not always have clean clothes to wear to work 10. I consider myself as over worked an under paid 11. I do not always feel like smiling at customers 12. I experience a lot of stress at work 13. Service is provided according to industry based standards 14.I know which aspects of service is important to customers 15.I must learn to provide a better service 16.I have the power to make on-the-spot decisions 17.I understand my role in the organization 18. Management understand when I experience a family crisis 19. My personal circumstances influence the way I treat customers 20. Dress code has an influence on customer perception

149
SECTION B: Geographic details Mark with x where applicable 1. What is your gender? Male Female
2. Age Group Less than 20 years 21-30 years 31-50 years 51-60 years More than 60 years
3. Marital status Single Married Divorced Widow Widower Living with a partner Other Specify:
4. Home Language Afrikaans English Sotho Tswana Xhoza Zulu Other Specify:
5.Cultural Group Asian Black Coloured White Other Specify:
6. Highest Qualification
7. How do you get to work? Bicycle Bus Foot Hike Own Transport Pool vehicle Taxi Other Specify
8. Residing Area Farm Plot Town Township Other Specify:

150
ANNEXURE C SURVEY QUESTIONNAIRE FOR MANAGERS
Section A 1. What is your current position within the organization? ___________________________________
2. Post Level____________________________________________________________________
3. When did you start at the organization? _____________________________________________
4. What are your responsibilities in your present position? _________________________________
____________________________________________________________________________________
__________________________________________________________________________________
A. Leadership Mark with x where applicable
1. Are you flexible in your leadership role to attend to different situations?
2 How do you deal with a difficult situation?
Agr
ee
stro
ngly
Agr
ee
Uns
ure
Dis
agre
e
Dis
agre
e
Stro
ngly
First ask the frontline employee what is the problem
Greet the customer and then attend to the problem
Apologize to the customer and then attend to the problem
3. Do you agree with the following?
Agr
ee
stro
ngly
Agr
ee
Uns
ure
Dis
agre
e
Dis
agre
e
Stro
ngly
1. Management communicate organization objectives to frontline employees
2. Action are taken by management when frontline employees provide them with an idea
3. Frontline employees are treated with respect
4. Customers are valued
5. Management is of the opinion that frontline employees are committed in providing a quality service to customers
6. Frontline employee attitude and behavior have an impact on customer evaluation of services
7. Every frontline employee receive personal skills training to deliver a better service to customers
8. Management motivate supervisors to support frontline employees
9. The organization has training programs for frontline employees
10. Frontline employees receive regular training
11. Frontline employee are appointed according to their service competencies
Yes No

151
12.Management treat frontline employees with respect
13. Work objectives and responsibilities are clearly communicated by management
14.Organizational goals and frontline employees are considered when making decisions
15. I show sincere interest in the welfare of the families of frontline employees
4. Does management know the family/children of each frontline employee?
5. Does your organization have a clear vision for the future?:
Yes No Unsure
B. Employees
1. What qualification is necessary for frontline employees?
Grade 1-7
Grade 8-12
Diploma
Degree
Other
Specify:
2. When a frontline employee experiences a problem, does he/she have the right to make a decision and
handle the problem?
3. How are frontline employees evaluated in terms of working achievement?
_____________________________________________________________________________
____________________________________________________________________________
4. How frequent are evaluations done?
Every 3 months
Every 6 months
Once a Year
Other
Specify:
5. How are employees rewarded for good performance? _________________________________
Yes
No
Only some of them
No reason why should know family
Yes
No
Depends on the type of problem
Management must attend to the problem

152
6. Most common complaints amongst frontline employees are:
Too much work
Not my work but that of somebody else
Poor communication from management
Other
Specify:
SECTION B Geographic details 1.Gender Male Female 2. Age Group Less than 20 years 20-30 years 31-40 years 41-50 years 51-60 years More than 60 years 3. Marital Status Single Married Divorce Widow Widower Living with a partner Other Specify: 4. Cultural Group Asian Black Coloured white 5. Highest Qualification

153
ANNEXURE D 24 May 2013 TO WHOM IT MAY CONCERN Dear Sir/Madam
I am conducting a research study to obtain my Masters degree in Business
Management in the Faculty of Economic and Management Sciences at the
University of the Free State. The title of my research study is "The critical role of
front-line employees in a service organization".
Your co-operation in completing the attached questionnaire is kindly requested and
appreciated. It will take you about 6 minutes to complete. There is no risk involved in
participating in the study. Your participation is voluntary and all information will be
treated as confidential.
Should you have any questions regarding the study or questionnaires, I can be
contacted at: 051-4013425 (office hours) or 083 335 1868 or [email protected].
By completing this questionnaire you are automatically giving informed consent that
the information obtained may be used as a contribution towards my research.
Yours sincerely
Marina Fourie