Organizational discourse and communication: the progeny of Proteus
© 2014. Published by The Company of Biologists Ltd | Development (2014) 141, 1589-1598 doi:10.1242/dev.105254
1589
ABSTRACTCell lineage analysis enables us to address pivotal questions relatingto: the embryonic origin of cells and sibling cell relationships in theadult body; the contribution of progenitors activated after trauma ordisease; and the comparison across species in evolutionary biology.To address such fundamental questions, several techniques for clonallabelling have been developed, each with its shortcomings. Here, wereport a novel method, CLoNe that is designed to work in allvertebrate species and tissues. CLoNe uses a cocktail of labelling,targeting and transposition vectors that enables targeting of specificsubpopulations of progenitor types with a combination of fluorophoresresulting in multifluorescence that describes multiple clones perspecimen. Furthermore, transposition into the genome ensures thelongevity of cell labelling. We demonstrate the robustness of thistechnique in mouse and chick forebrain development, and showevidence that CLoNe will be broadly applicable to study clonalrelationships in different tissues and species.
KEY WORDS: Clonal lineage, CRE recombinase, piggyBactransposase, Multi-fluorescence, Progenitor cells, Fate mapping,Electroporation, Cerebral cortex, Wulst, Dorsal ventricular ridge
INTRODUCTIONThe goal of cell lineage analysis is to provide information on thenumber, distribution, phenotype and functional integration of allcells derived from the same single embryonic stem cell or progenitorpopulation (Buckingham and Meilhac, 2011). Detailed clonalanalysis has only been achieved in relatively simple organisms, suchas C. elegans (Sulston, 1983), and fundamental questions remain tobe answered in vertebrates despite considerable progress. Thechallenge is to selectively target a particular progenitor populationwithin a defined sector of the developing embryo and follow thedevelopment and integration of the derived cells to adulthood.Methods are needed to study several clones synchronously in vivoas they integrate into functional networks. Moreover, to address theimportant questions related to comparative evolutionarydevelopmental biology, the same methods should work in distinctspecies.
Most common clonal labelling methods are based on viralparticles, such as retrovirus (Cepko et al., 1995; Heins et al., 2002;Li et al., 2012; Reid et al., 1995) or lentivirus (Sato et al., 2010),
TECHNIQUES AND RESOURCES
Department of Physiology, Anatomy and Genetics, University of Oxford, OxfordOX1 3QX, UK.
*Authors for correspondence ([email protected];[email protected])
This is an Open Access article distributed under the terms of the Creative CommonsAttribution License (http://creativecommons.org/licenses/by/3.0), which permits unrestricteduse, distribution and reproduction in any medium provided that the original work is properlyattributed.
Received 24 October 2013; Accepted 2 February 2014
carrying a reporter gene. However, these methods have drawbacksand could suffer from either underestimating or overestimating thesize of the clones. To minimise such mistakes, very few clones mustbe studied in a given specimen, impeding the study of generation,integration and relationship of multiple clones.
New genetic models with cre-mediated recombination in specificcell populations enable the expression of reporter genes in aspatiotemporal manner (Danielian et al., 1998) facilitating thedevelopment of clonal lineage analysis methods from selectedprogenitors. Nkx2.1-expressing progenitors in the brain have beenlabelled in mice using retrovirus injections (Brown et al., 2011), yetreliance on a Cre mouse line restricted the experimental design tothis species. The discovery and generation of various fluorescentproteins has greatly aided in the development of combinatorialmultifluorescent labelling, allowing delineation of distinctly labelledfluorescent cells (Livet et al., 2007; Tsien, 2009). Original Brainbowmethodology (Livet et al., 2007) was limited by default redfluorescence in non-Cre expressing cells. This initial shortcomingwas recently amended (Cai et al., 2013) but still the use of Brainbowmethods in clonal lineage analysis is extremely limited owing to thepaucity of Cre-expressing chick and zebrafish lines. Electroporableconstructs cannot label entire lineages due to their incapacity to beintegrated in the genome. However, its multifluorescent combinationconcept has been successfully applied to lineage analysis inDrosophila Brainbow (Hampel et al., 2011) and Star Track analysisof astrocyte clones (García-Marqués and López-Mascaraque, 2013).Unfortunately, Star Track relies upon a single promoter (GFAP) toselect a specific progenitor population and for subsequent expressionof the fluorophore. Hence, it is required that the promoter remainsactive throughout the entire period of investigation for fluorescentreporter expression. Although this continued expression is presentin the particular case of astrocytes, this approach makes its uselimited to other scenarios.
We have developed a new method, CLoNe (clonal labelling ofneural progenies), to study clonal lineages, that tackles thedisadvantages of other methods. We tested CLoNe on several tissueswith a particular focus on forebrain neural progenitors and foundthat it provides a remarkably accurate and reliable fate-map ofmultiple clones originating from independent stem/progenitor cellswithin the same tissue volume of the same specimen. The methodis particularly suited for in vivo and comparative studies on clonallyrelated cell populations.
RESULTSWe developed the method of CLoNe to enable clonal lineageanalysis of the progeny of specifically targeted progenitor cells.CLoNe consists of a mixture of three different kinds of plasmids(labelling vectors, targeting vector and transposase expressingcassette; Fig. 1) that, when transfected into cells, initiate a cascadeof recombination events culminating in a unique colour code in eachprogenitor and its derived cells. The twelve labelling vectors each
CLoNe is a new method to target single progenitors and studytheir progeny in mouse and chickFernando García-Moreno*, Navneet A. Vasistha, Jo Begbie and Zoltán Molnár*
Dev
elop
men
t

1590
contains one of four fluorophores together with one of threesubcellular localisation signals downstream of a LoxP flanked STOPsignal. The targeting vector encodes the enzyme Cre recombinasedriven by regulatory control elements specific to the cell populationof interest. Expression of Cre in this cell population results inremoval of the STOP signal in the labelling vectors, allowingfluorescent protein expression. Finally the transposition vectorencodes the enzyme piggyBac transposase (PB), which recognisesspecific terminal repeats flanking the fluorescent cassettes in thelabelling vectors. PB transposase expression results in the randomtransposition of a small number of fluorescence cassettes into thegenome (Woltjen et al., 2009). This genomic insertion is crucial asit creates stable labelling of transfected cells with a random, uniqueand heritable combination of fluorophore sequences. The thousandsof possible combinations can be detected by confocal microscopy toreveal clonal relationships. We tested each of the different stages ofthe process, i.e. targeting of specific progenitors, transposition intothe genome and generation of inheritable random combinatorialhues, to validate CLoNe.
Targeting of specific progenitorsLabelling vector efficacy was tested in N2A cells. In the absence ofCre recombinase, no fluorescence was detected, demonstratingSTOP signal function (supplementary material Fig. S1). However,on co-transfection with a constitutive Cre-expressing vector,fluorescence was seen (supplementary material Fig. S1).Furthermore, subcellular targetting of the tagged fluorophores toplasma membrane, cytoplasm or nucleus was also confirmed(supplementary material Fig. S1).
We tested eight candidate fluorophores and selected four based ona series of criteria (supplementary material Table S1). It wasimportant that the fluorophores were stable and bright enough to bereadily detected, with minimal overlap with other wavelengths. Wealso chose monomeric forms to prevent interactions betweendifferentially tagged fluorophores.
For our method of clonal analysis to be advantageous, it isimportant to be able to target specific populations. We reasoned thatthe use of specific regulatory sequences would lead to Crerecombinase expression in a select progenitor population. However,as the regulatory sequences could also drive expression in earlier
iterations of the progenitors than those to be tested, we imposed atemporal control by using electroporation. During forebraindevelopment, progenitors from a specific area express a unique codeof regulatory genes (Guillemot et al., 2006; Kawaguchi et al., 2008)and in many cases, can be defined by expression of a single genemarker. We chose a number of these markers as candidates to labelspecific progenitors, and here show that a combination of theirregulatory elements and in utero electroporation enables clonalanalysis in subpopulations of forebrain progenitors.
Dlx1/Dlx2 are homologous genes highly expressed in theforebrain region that mainly generates the basal ganglia: thesubpallium. The cis-regulatory elements driving Dlx1/Dlx2expression have been well described (Ghanem et al., 2007), andwe selected the URE2 regulatory sequence to clone into thetargeting vector. Electroporation of pURE2-CRE together withpPB-STOP-mCherry into mouse embryos at embryonic day (E)12.5, early in forebrain development, resulted in the presence ofred fluorescent cells at the subpallium only (Fig. 2A,B). Bycomparison, electroporation of pURE2-CRE:pPB-STOP-mCherrytogether with a ubiquitously expressing EGFP (pPB-CAG-EGFP)resulted in EGFP labelling of many progenitors at both pallial andsubpallial levels (green cells in Fig. 2A), whereas only cellsgenerated at the subpallium expressed mCherry. Thus, we couldspecifically label subpallial progenitors using pURE2-CRE.
A further aim in our design of CLoNe was that it could be usedacross species. We therefore tested whether the same combinationof vectors could be used to target a homologous progenitorpopulation in the developing chick forebrain. Electroporation of theDNA constructs used above into chick embryos in ovo had identicalresults (Fig. 2C). Again, EGFP expression showed that thoughprogenitors of both pallial and subpallial territories were transfected,yet only a small proportion of subpallial cells expressed mCherry.This demonstrates the ability of this technique to label specificprogenitors across different species.
In addition to using CLoNe to target different areas (Visel et al.,2013), we wanted to test its use to target different subpopulations ofprogenitors within the same area. In the developing forebrain,distinct progenitor subpopulations can be distinguished within thesame region by expression of specific regulatory genes. Forexample, radial glial cells (RGCs) located at the neocortical
TECHNIQUES AND RESOURCES Development (2014) doi:10.1242/dev.105254
Fig. 1. Clonal labelling through CLoNe. A mixture of three different types of vectors (labelling vectors, targeting vector and transposase expressing cassette)is co-transfected to the progenitors through electroporation. (A) Twelve plasmid labelling vectors, collectively named as pPB-STOP-XFPs, carry the expressionof one fluoroprotein arrested by a loxP-flanked STOP signal. The targeting vector encodes Cre recombinase under a promoter of our choice. Only progenitorcells expressing the selecting gene will express Cre, thus recombining the STOP and triggering the expression of the fluorophores by means of the strongconstitutive promoter CAG. (B) Transposase enzyme recognises the 5′ and 3′ terminal repetitions at the labelling vectors, excises them and randomlyintegrates a small number of labelling cassettes into the genome of the progenitor. The random combination of fluoroproteins generates distinguishable hues atdifferent subcellular compartments. These hues are permanent, stable and inheritable by the whole progenitor cell lineage.
Dev
elop
men
t

ventricular zone express transcription factor Emx2 (Cecchi, 2002)whereas intermediate progenitors (IPCs) at the subventricular zone(SVZ) are known to express Tbr2 (Englund et al., 2005).Electroporation of a single labelling vector along with pEmx2-CRE(Suda et al., 2010) enabled the selective labelling of RGCs and theirprogeny (Fig. 2B). By contrast, electroporation of this labellingvector into mice directed fluorophore expression exclusively to IPCsbut not to RGCs (Fig. 2C; N.A.V., F.G.-M., Siddharth Arora,Amanda F. P. Cheung, Sebastian J. Arnold, Elizabeth J. Robertsonand Z.M., unpublished).
Efficient piggyBac transposition into the progenitor genomeThe use of the piggyBac system to deliver transgenes into thegenome has previously been described in mouse and chicken (Dinget al., 2005; Park and Han, 2012; Woltjen et al., 2009). Indeed,stable transposition of fluorophores into the genome has beenemployed to study the progeny of GFAP, GLAST and nestin-expressing lineages in the developing murine cortex (García-Marqués and López-Mascaraque, 2013; Siddiqi et al., 2014). Todetermine the successful active transposition of labelling sequencesusing CLoNe, we addressed three criteria: first, whether fluorophoreexpression was maintained in the progenitors; second, whether thederived clones extended to different timed cohorts of the cortex; and,finally, whether late generated populations also acquired thefluorophore combination.
The maintenance of fluorophore expression in progenitors isevidence of successful genomic integration as in its absence thelabelling vectors would remain episomal and be diluted with eachcell division and subsequently lost. This lack of long-termfluorescence in progenitors can be seen in previous studies that usetraditional non-transposable electroporation (see Hatanaka et al.,2004). In our experiments, progenitors transfected at early stages ofembryonic development (E12 in mouse and E5 in chick) showedfluorescent staining several days (Fig. 3) and even weeks (Fig. 4F,G;Fig. 5) after transfection. In addition, the acquired uniquecombinatorial hue in the progenitor was preserved after mitosis, anddaughter cells inherited the same fluorescent tag at either membrane,cytoplasmic and nuclear localisation (Fig. 3). This is significantbecause episomal vectors can be asymmetrically distributed betweendaughter cells during cell division, resulting in progenies withdifferent hues. By contrast, genomic integration would result infaithful replication of the progenitor hue. We studied forebrainprogenitor pools (VZ/SVZ) after CLoNe electroporations of earlymouse and chick embryos. In both systems we found maintenanceof the unique combinatorial patterns. In mice, analysis of ventricular(Fig. 3A) and abventricular progenitors (Fig. 3B) showed groups oftwo or three cells shortly after mitosis. In chick there were morenumerous clusters of same-coloured cells in the germinal ventricularzone (Fig. 3C-E; supplementary material Fig. S2) with up to ninecells in one of the examples.
Our second test of genomic integration was whether CLoNelabelled all cortical layers. Neurogenesis in cortex follows an inside-out pattern. Consequently, neurons born earlier locate in deepercortical layers than later-born neurons. Studies using traditional non-transposable neocortical electroporation affect progenitors onlytransiently and capture a snapshot of cortical neurogenesis, i.e. onlylabel cells located in one or few layers in the cortex (Siddiqi et al.,2014). Our analysis of mouse neocortical sections following earlyCLoNe electroporations demonstrated a distribution of fluorescentcells across the entire depth of the neocortex (n=11 successfullyelectroporated pups at E12 analysed from P0 to P29, all of themshowed a whole-layered cortical distribution of the labelled cells;
1591
TECHNIQUES AND RESOURCES Development (2014) doi:10.1242/dev.105254
Fig. 2. Labelling of selected progenitors. A specific promoter that is activeonly in a selected region controls Cre expression and thus restricts theexpression of fluoroproteins to targeted progenitors. (A) Examples of mouseforebrains electroporated at E12.5 and processed at E15.5 with a constitutiveEGFP construct, pDlx1/2-CRE and pPB-STOP-mCherry. Examples areshown in the septum (sept, top row) and the lateral cortical stream (LCS,bottom row). Both pallial and subpallial progenitors were labelled with theelectroporation, as demonstrated by green fluorescence. However, onlysubpallial cells at the septum and lateral cortical stream displayed redfluorescence. (B) Chick forebrains electroporated with the same cocktail asA. Same specificity of Dlx1/2 promoter targeted the expression of the redfluorochrome in subpallial cells only, whereas pallial co-transfected cellsexpressed only EGFP. Insets in A and B demonstrate the entire coronalsection counterstained with DAPI at the level where images were taken fromthe regions depicted by white rectangles. (C) Selective Cre expressiondistinguishes radial glia and intermediate progenitors within the same sectorof the brain. At the developing neocortex, radial glial progenitors expressEmx2, its promoter selectively activates fluorophore expression in thisprogenitor population (left panel). Intermediate progenitors selectivelyexpress Tbr2, its promoter selectively activates fluorophore expression inintermediate progenitors, but not in radial glia. CP, cortical plate; IZ,intermediate zone; LV, lateral ventricle; PSb, pallial-subpallial boundary; SP,subpallium; VZ, ventricular zone; PCx, piriform cortex; Cng, cingulum, LCx,lateral cortex. Scale bars: 100 μm. D
evel
opm
ent

1592
Fig. 4A). This lack of clustering indicates stable transfection ofcommon progenitors for these cortical neurons with the fluorophorespassed on to all daughter cells without dilution and attenuation ofthe label.
And third, we addressed whether early CLoNe electroporationscontinued to label late-generated populations during corticogenesis.In the developing cortex, glial cell populations are generated afterneurogenesis, in early- to mid-postnatal development (Sauvageot andStiles, 2002). Traditional non-transposable electroporation does notlabel these late populations as the episomal vector is lost (Siddiqi etal., 2014). By contrast, CLoNe electroporation in mouse was able tolabel astrocytes (in every pEmx2-CRE or pCAG-CRE driven CLoNelabelling after P5, n=20) and oligodendrocytes (in all pEmx2-CRE orpCAG-CRE driven CLoNe labelling after P10, n=9) during postnatalforebrain development, weeks after the transfection of the labellingvectors (Fig. 4B-G). The labelling appears stable as cells remainfluorescent at least 10 weeks after transfection (data not shown).
To rule out contribution from episomal copies of labelling vectors,we compared fluorescence expression of two labelling vectors:mCherry with intact PB repeats and EYFP lacking the 3′ PB repeatand therefore incapable of genomic transposition (representinggenomic and episomal contributions, respectively). As soon as 2days after electroporation and continued at 7 and 14 days aftertransfection (supplementary material Fig. S3), cells expressingmCherry were found across different transfected areas (neocortexand striatum, n=8; supplementary material Fig. S3), whereas
expression of EYFP could not be detected. As previously described(García-Marqués and López-Mascaraque, 2013), this shows thattransposition is necessary for the expression of fluorescence.Episomal vectors neither contribute nor alter mature genomic hue,which supported the presence of a single combination in each clone.
It is always possible that the integration site is deleterious or alterscell behaviour, as it could theoretically happen in other clonal methodssuch as viral infection. We considered this possibility real, but of verylow probability. We have no information about the frequency ofaberrant behaviours. However, we did not notice any evidentalteration as cells always divided, migrated and differentiated in thepreviously described and expected fashion, and the somatodendriticmorphology, projections, laminar position of the pyramidal neuronswas in accordance with our expectation. In addition, the distributionof the analysed clones was similar to that found in previous literature.
These data demonstrate that our piggyBac-based methodproduced an effective and necessary transposition of the labellingsequences into actively transcribed regions of the genome for stableand permanent labelling of lineages.
Fluorescent hue is stable in postmitotic cells and revealsclonal relationshipHaving successfully established the targeting and transposition stepsof the labelling, we employed CLoNe in mouse and chick forebraindevelopment to reveal clonal relationships. We defined a clone as agroup of cells sharing the same combination of four different
TECHNIQUES AND RESOURCES Development (2014) doi:10.1242/dev.105254
Fig. 3. Combinatorial hue remains stable after sequential mitoses in mouse and chick brains. (A-C) E13 mouse in utero neocortical electroporations ofCLoNe vectors, with unrestricted selection (pCAG-CRE) and nuclear tagged fluorochromes, revealed at P0 (A,B) or P7 (C). (A) Cortical ventricular zone (VZ) atthe dorsal forebrain at P0, 1 week after transfection. Five pairs of cells 6 days after transfection and just after mitosis shared the same combination of nuclearcolours. Right panel shows images of isolated cells from left panel at the four different fluorescent channels. Eight pups were successfully electroporated andshowed clonal labelling. The difference in intensity colour in pair of cells number 3 might be explained by a differential partition of the fluorescent proteins,which would be normalised once both cells display the fluorescent palette encoded by the genome. (B) Examples of conserved fluorescent nuclear hue aftersubventricular mitosis in the lateral telencephalon at P7, 2 weeks after electroporation (n=8, the eight animals showed clonal labelling). Groups of two or threecells, numbered 6 to 12, showed preservation of the fluorescent combination. (C-E) E5 chick electroporations of untargeted CLoNe vectors. (C) Progenitorslabelled at the hippocampus displaying the high variability of fluorescent combinations. (D) Progenitor cells and postmitotic-derived cells at the dorsal pallium.(E) High magnifications of different progenitors from D and subsequent sections of the forebrain. Clusters of cells sharing the same shade of colour can befound at the VZ and in some cases at the mantle zone (MZ). Different arrows indicate clonally related cells derived from the same original stem cell; dashedlines separate clones. A detailed analysis of the fluorophore expression pattern and intensity hues can be found in supplementary material Fig. S2. Scale bars:100 μm in C,D; 25 μm in B; 10 μm in A,E.
Dev
elop
men
t

fluorophores in their three possible tagged-forms. We reasoned thata broad spectrum of colours would be generated as most transfectedprogenitors acquire one or more copies of each labelling vector,while PB transposition creates a unique combinatorial hue (morethan 1296 combinations in each of the compartments, as discussedbelow) by random genomic insertion of, on average, nine labellingsequences (Woltjen et al., 2009). This large number of potentialcombinations allowed us to remove spatial clustering as arequirement of clonal assessment. We analysed a single section ofan E10 chick electroporated at E5 with pCAG-CRE driven CLoNevectors using IMARIS (Bitplane) software (supplementary materialFig. S4). We spotted more than 1000 cells each expressing at leastone fluoroprotein, with the IMARIS counted for EGFP being 1072cells. The mean intensity of these EGFP-expressing cells wasdistributed equally across the four channels (supplementary materialFig. S4), suggesting an equal expression of the differentfluorophores. Next, we determined the power of CLoNe to generate
and discriminate unique colours, considering that highly frequentcombinations are not useful for clonal analysis. We thresholded theintensity into six levels and classified the mean intensity of each cellin each of the channels. Accordingly, each cell was assigned acolour code comprising four digits (the four colours, BGYR; from0 to 5; it implies a number of 64-1296 potential combinations). Werecommend looking for and analysing clones displaying highlycomplex hues only, showing expression of more than one but not allthe fluorophores in each of the compartments, rather than studysingle colour-labelled cells in either the nucleus or the membrane.In our experience, complex patterns tend to occur with the lowestfrequency. When considering two independent hues in a given cell(nucleus and membrane/cytoplasm) and complex patterns only, thetheoretical probability of two progenitors to acquire the same hueindependently decreases to 1/64×64=0.00005%. However, takinginto account technical limitations (the brightness of two of thefluorophores is not entirely independent, confocal imaginglimitations) in the practice and being conservative we can reliablydiscriminate at least 100 different hues per cellular compartment(analysis of Brainbow 1.0 mouse line L showed that from 89 to 166colour hues can be identified with three different fluorophores)(Livet et al., 2007), so our estimate increases the likelihood of twoprogenitors to randomly acquire the same hue independently to0.01%.
Our analysis detected up to 264 different colour codes (averageof 4 cells/combination) in total cellular brightness measurement.Importantly 86 colour codes were represented in a single cell, and96% of the codes (253 of 264) were represented in 15 or less cells;795 out of 1072 cells (74%) belonged to low-represented codes(supplementary material Fig. S4). This low occurrence of the hues,and the different hue in either nucleus and membrane of the cell,made analysis of the random expression of these 12 fluorophoressufficient to discriminate clonal relationships. To further facilitateclonal analysis, we reduced the number of labelled progenitors bydecreasing the targeting vector concentration (supplementarymaterial Fig. S5) and also increased the variety of fluorophores.However, none of the additional fluorophores tested (mKeima,mCerulean, mKO and mTFP1; supplementary material Table S1)fulfilled the exhaustive requirements of brightness and independenceof signal.
Early mouse and chick embryos electroporated with differentcombinations, proportions and concentrations of CLoNe vectorswere analysed at several stages of embryonic and postnataldevelopment with particular attention to clones (Figs 5 and 6). Wefirst studied short-term labelling at the derivatives of the wing limbbud (supplementary material Fig. S6). CLoNe labelling was able todistinguish clonal relationships at the fibroblast and muscle celllineages. In embryonic mouse forebrain, the Emx2 promoter labelledclones in the neocortex and olfactory cortex (Fig. 5; supplementarymaterial Figs S7 and S8). These clones were observed at P15, 3weeks after the electroporation and abounded in the astrocyticlineage. We consider the main reason for the preferential astrocyticlabelling is the differences in cellular shape and membranemorphology rather than preferential labelling pattern. Whereasmembrane fluorophores tend to aggregate in the axonal componentof neurons (Livet et al., 2007) and the morphology of the neuron isnot well defined, the flat dispersed membranes of astrocytes andoligodendrocytes generate a more prominent and typical labellingthat is easily identifiable. Clonal clusters of astrocytes were easilyidentified in all layers of the cerebral cortex (Fig. 5A) and in somecases dispersed across the entire depth of the cortical thickness(Fig. 5B, clones 5 and 6) but multifluorescence was also detected in
1593
TECHNIQUES AND RESOURCES Development (2014) doi:10.1242/dev.105254
Fig. 4. Efficient piggyBac transposition into the genome allows theinvestigation of late derivatives of clones during postnatal stages.Untargeted CLoNe labelling demonstrates actual transposition of labellingcassettes. Mice were electroporated at E12 and brains were examinedduring postnatal development (A, P7; B-G, P15). (A) Neocortex of singlearrested colour (STOP-EGFP) evidenced neurons located at layers II to VI ofthe neocortex at P7. (B-F) CLoNe labels clonally related astrocytes (B-D) andoligodendrocytes (white arrows; E,F) during late postnatal development(P15). Progenitor stem cells are still detectable in the VZ/SVZ (orsubependymal zone) at the pallial-subpallial boundary (grey arrowhead) atP15. (G) CLoNe at the hypothalamus (HT) revealed many late-bornastrocytes and multifluorescence at the progenitors (arrowheads) aligning thethird ventricle (IIIv) at P15. A, amygdala; CC, cerebral cortex; wm, whitematter; St, striatum. Scale bars: 200 μm in G; 100 μm in A,F; 50 μm in E; 20μm in B-D.
Dev
elop
men
t

1594
neurons (supplementary material Fig. S8). CLoNe labelling enablesthe quantification of several key features of these clones, such asclone size, cell types, cell morphology and location within the tissue,and allows us to postulate possible forms of cell migration or modelpossible involvement of different progenitors.
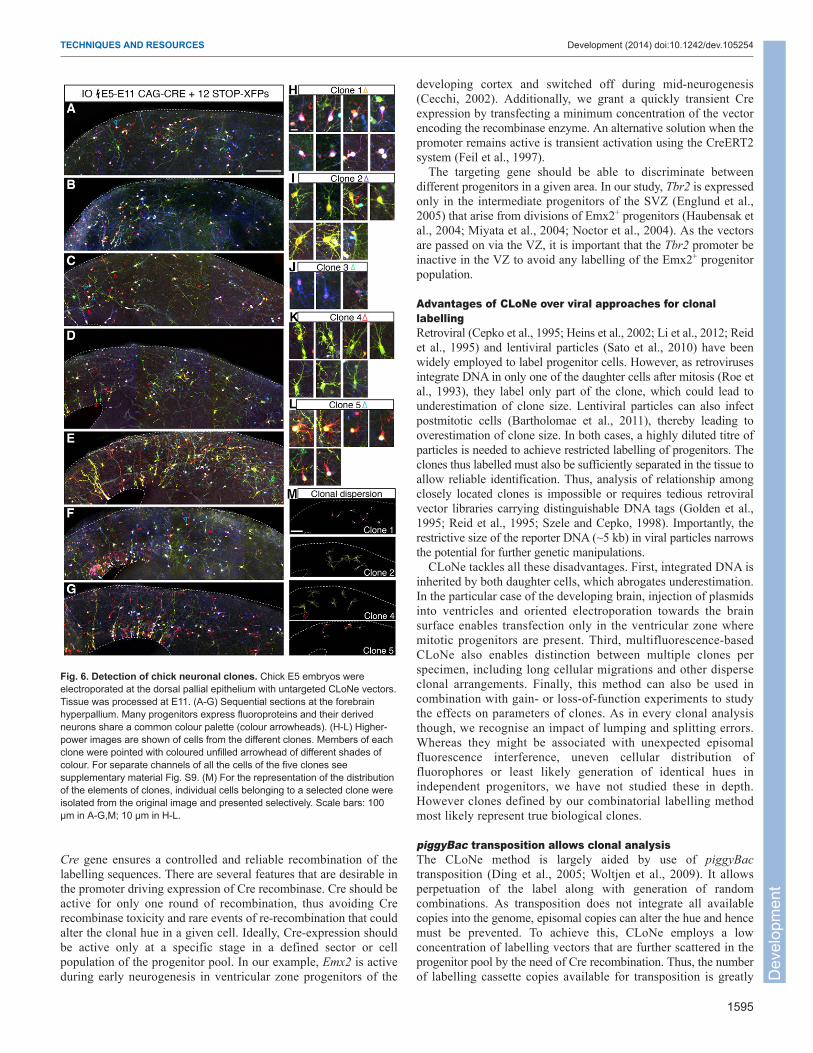
We found that the concentration of the targeting vector was crucialin determining the number of progenitor cells labelled with CLoNe.We assessed the optimal concentration for each targeting vector forclonal analysis and observed that a low concentration (~10 ng/μl) ofpCAG-CRE provides the best results (supplementary material Fig.S5). We performed our clonal analysis on chick forebraindevelopment with these parameters and found multiple clones withinthe same tissue volume, allowing the study of the clonal inter-relationships (Fig. 6). Clones in the hyperpallium of E11 chick brain,6 days after transfection, were selected according to the complexityof the combinatorial hue. The criteria for selection was that the cellsmust present the same independent nuclear and/or cytoplasmiclabelling and must show a comparable brightness in each channel(supplementary material Fig. S9), avoiding mono-labelled (one singlecolour) or pan-labelled (all colour in all compartments) cells. Afterstudying a total thickness of 500 μm (Fig. 6A-G), we described fiveclones (Fig. 6H-L; supplementary material Fig. S9), with an averageof seven cells per clone (from three cells in clone 3 to ten cells inclone 4). Importantly, membrane labelling allowed the analysis ofdetailed morphological and anatomical features of progeny.Hyperpallial clones were distributed radially across the entirethickness of the hyperpallium (Fig. 6M), with a tendency to locate insuperficial levels of the hyperpallium in clone 5. Most of the cells
displayed a bipolar morphology without any preferred orientation.Remarkably clone 2 cells presented elongated neurites that extendedtowards other members of the same clone (Fig. 6M). As an importantadvantage, CLoNe allows the study of several targeted clones in thesame region of tissue, enabling the investigation of interclonalrelationships (supplementary material Fig. S10).
DISCUSSIONCLoNe provides a versatile tool to target specific progenitors andlabel all clonal cells in a unique and permanent fashion. The methodbuilds on previous methods such as Brainbow, but it enables thelabelling of several clones within the same volume of tissue usingmultifluorescence supported by piggyBac transposition, which labelsthe entire clone for weeks and most likely for the entire lifespan ofthe animal. Moreover, CLoNe is based on the use of cell-typespecific Cre. It allows comparative analysis of progenitor cellsacross species by using evolutionarily significant genetic elementsto activate Cre expression. Furthermore, the use of plasmid vectorsopens the possibility of genetically manipulating progenitors tostudy the impact of single genes on the clonal development oftargeted populations. We propose that CLoNe is suitable for varioustissues, as evidenced in muscular and epithelial tissue, and systemsacross several vertebrate species.
Selectivity of CLoNe relies on the selectivity of CreexpressionThe most remarkable feature of CLoNe is the ability to discriminateprogenitors and label their entire lineage. Transient expression of the
TECHNIQUES AND RESOURCES Development (2014) doi:10.1242/dev.105254
Fig. 5. CLoNe detects murine glial clones. Mouse E12 embryos were electroporated at the neocortical epithelium with CLoNe vectors targeted by Emx2promoter. Tissue was processed at P15. Six of the animals electroporated at E12 that survived up to P15 were actually labelled and five showed clonallabelling. (A,B) Lateral neocortex displays small groups of astrocytes stained with the same combinatorial hue. Clones 1-4 present clusters arranged in smallcortical areas, whereas clones 5 and 6 show groups of cells separated by the cortical thickness. In clone 2, the membrane (green and yellow) and the nuclearlabelling (red) are uniform among the four clonally related cells (see supplementary material Fig. S7). Dashed lines mark (right) the pial surface and (left) thewhite matter/cortex boundary. Dashed lines in B link the deeper and more superficial members of clones 5 and 6. Clones 1-6 are magnified in the insets at theright. (C) High magnification of a clone of four astrocytes labelled with mbEGFP and the four ncXFPs. (D) Merged and four independent channel images at theolfactory cortex showing a clone of six astrocytes only labelled with EGFP but not with the other fluoroproteins. Scale bars: 250 μm in A,B; 100 μm in D; 50 μm(clone magnifications) and 25 μm in C.
Dev
elop
men
t
Cre gene ensures a controlled and reliable recombination of thelabelling sequences. There are several features that are desirable inthe promoter driving expression of Cre recombinase. Cre should beactive for only one round of recombination, thus avoiding Crerecombinase toxicity and rare events of re-recombination that couldalter the clonal hue in a given cell. Ideally, Cre-expression shouldbe active only at a specific stage in a defined sector or cellpopulation of the progenitor pool. In our example, Emx2 is activeduring early neurogenesis in ventricular zone progenitors of the
developing cortex and switched off during mid-neurogenesis(Cecchi, 2002). Additionally, we grant a quickly transient Creexpression by transfecting a minimum concentration of the vectorencoding the recombinase enzyme. An alternative solution when thepromoter remains active is transient activation using the CreERT2system (Feil et al., 1997).
The targeting gene should be able to discriminate betweendifferent progenitors in a given area. In our study, Tbr2 is expressedonly in the intermediate progenitors of the SVZ (Englund et al.,2005) that arise from divisions of Emx2+ progenitors (Haubensak etal., 2004; Miyata et al., 2004; Noctor et al., 2004). As the vectorsare passed on via the VZ, it is important that the Tbr2 promoter beinactive in the VZ to avoid any labelling of the Emx2+ progenitorpopulation.
Advantages of CLoNe over viral approaches for clonallabellingRetroviral (Cepko et al., 1995; Heins et al., 2002; Li et al., 2012; Reidet al., 1995) and lentiviral particles (Sato et al., 2010) have beenwidely employed to label progenitor cells. However, as retrovirusesintegrate DNA in only one of the daughter cells after mitosis (Roe etal., 1993), they label only part of the clone, which could lead tounderestimation of clone size. Lentiviral particles can also infectpostmitotic cells (Bartholomae et al., 2011), thereby leading tooverestimation of clone size. In both cases, a highly diluted titre ofparticles is needed to achieve restricted labelling of progenitors. Theclones thus labelled must also be sufficiently separated in the tissue toallow reliable identification. Thus, analysis of relationship amongclosely located clones is impossible or requires tedious retroviralvector libraries carrying distinguishable DNA tags (Golden et al.,1995; Reid et al., 1995; Szele and Cepko, 1998). Importantly, therestrictive size of the reporter DNA (~5 kb) in viral particles narrowsthe potential for further genetic manipulations.
CLoNe tackles all these disadvantages. First, integrated DNA isinherited by both daughter cells, which abrogates underestimation.In the particular case of the developing brain, injection of plasmidsinto ventricles and oriented electroporation towards the brainsurface enables transfection only in the ventricular zone wheremitotic progenitors are present. Third, multifluorescence-basedCLoNe also enables distinction between multiple clones perspecimen, including long cellular migrations and other disperseclonal arrangements. Finally, this method can also be used incombination with gain- or loss-of-function experiments to studythe effects on parameters of clones. As in every clonal analysisthough, we recognise an impact of lumping and splitting errors.Whereas they might be associated with unexpected episomalfluorescence interference, uneven cellular distribution offluorophores or least likely generation of identical hues inindependent progenitors, we have not studied these in depth.However clones defined by our combinatorial labelling methodmost likely represent true biological clones.
piggyBac transposition allows clonal analysisThe CLoNe method is largely aided by use of piggyBactransposition (Ding et al., 2005; Woltjen et al., 2009). It allowsperpetuation of the label along with generation of randomcombinations. As transposition does not integrate all availablecopies into the genome, episomal copies can alter the hue and hencemust be prevented. To achieve this, CLoNe employs a lowconcentration of labelling vectors that are further scattered in theprogenitor pool by the need of Cre recombination. Thus, the numberof labelling cassette copies available for transposition is greatly
1595
TECHNIQUES AND RESOURCES Development (2014) doi:10.1242/dev.105254
Fig. 6. Detection of chick neuronal clones. Chick E5 embryos wereelectroporated at the dorsal pallial epithelium with untargeted CLoNe vectors.Tissue was processed at E11. (A-G) Sequential sections at the forebrainhyperpallium. Many progenitors express fluoroproteins and their derivedneurons share a common colour palette (colour arrowheads). (H-L) Higher-power images are shown of cells from the different clones. Members of eachclone were pointed with coloured unfilled arrowhead of different shades ofcolour. For separate channels of all the cells of the five clones seesupplementary material Fig. S9. (M) For the representation of the distributionof the elements of clones, individual cells belonging to a selected clone wereisolated from the original image and presented selectively. Scale bars: 100μm in A-G,M; 10 μm in H-L.
Dev
elop
men
t
1596
reduced when compared with non-transposable electroporation. Trueto this, episomal constructs were not found in our long-termexperiments, making it ideal for long-term fate mapping (García-Marqués and López-Mascaraque, 2013).
Owing to the very low probability of similar recombinationpattern and thus similar colour spectrum, CLoNe is particularlyvaluable for the study of multiple clones within the same tissuevolume. CLoNe can further benefit from various methods to makethe tissue permeable; therefore, the reconstruction can be obtainedfrom a larger volume of continuous tissue, rather than fromreconstructed serial sections. These methods could help tackle otherchallenges related to the application of multifluorescence to thestudy of lineages, such as potential intracellular fluorescenceinconsistency or variable fluorescent brightness throughoutincreasing tissue depths. Combining CLoNe with OPT (MRCIGMM, University of Edinburgh), Scale (Hama et al., 2011), Clarity(Chung et al., 2013), SeeDB (Ke et al., 2013) or ClearT (Kuwajimaet al., 2013) could be useful in these respects. Moreover, CLoNecould be combined with birthdating, which could help with thecalculation and computation of cladograms of tagged cells.
CLoNe is well suited for various tissues and organisms toconduct comparative studies.Originally CLoNe was developed to enable the study the progeny ofselected progenitor populations in the cerebral cortex and theganglionic eminences of mouse and chick and we have proven itssuitability to other cell types such as fibroblasts and muscle syncytia.There was an emphasis to develop a method that could be used insauropsids and mammals. Therefore, CLoNe is particularly suitedfor comparative studies when clones derived from specificprogenitor populations are compared.
Development of this method also provides unique opportunitiesfor embryology by being able to label the entire progeny of aprogenitor population. To extract the information of such progeniesand their relationships will require combination with new methodsthat allow imaging of larger tissue volumes as mentioned above.
We anticipate that several developmental communities willembrace this method because CLoNe is designed to work in allvertebrate species and tissues using the same constructs. Asproposed CLoNe labelling can boost studies in broad biologicalsciences covering stem cell biology, cancer research and all areas ofdevelopmental biology.
MATERIALS AND METHODSPlasmid vector generationPlasmids were generated using standard cloning methods. Three differenttypes of vectors are needed for the stable, selective and unique labelling ofspecific single progenitors and their progenies.
We started with pCAG-CRE (Matsuda and Cepko, 2007) (Addgeneplasmid 13775; kindly provided by Dr Cepko, Harvard Medical School,Boston, USA) into which we replaced the CAG promoter with the mouseEmx2 enhancer (Suda et al., 2010) (kindly provided by Dr Aizawa, RIKENKobe, Japan) or mouse Dlx1/2 enhancer [URE2 sequence (Ghanem et al.,2007)] for subpallial progenitors. These sequences are 1-6 kb long and showa high degree of homology with the chicken genome.
Second, to generate the labelling vectors, a synthetic stop SV40 signalflanked by directly oriented LoxP sites was PCR amplified from the pBS302plasmid (Sauer, 1993) (kindly provided by Dr Sauer, Oklahoma MedicalResearch Foundation, USA; Addgene plasmid 11925) and subcloned into apPB-UbC-EGFP vector (Yusa et al., 2009) (kindly provided by WellcomeTrust Sanger Institute) between UbC promoter and EGFP sequence. Theplasmid generated was pPB-UbC-loxP-STOP-loxP-EGFP and afterreplacement of the main promoter by CAG was referred to as pPB-STOP-
EGFP. The fluorescent protein in this first arrested vector was replaced withthe different fluorphores detailed in supplementary material Table S1(Ramakrishnan et al., 2000; Zapata-Hommer and Griesbeck, 2003; Livet etal., 2007; Kogure et al., 2008) to generate other labelling vectors. Eitherhuman H2B histone (GenBank ID X00088.1) or a palmitoylation sequencewere cloned in frame at the 5′ extreme of the fluorophore to tether XFPs tothe nucleus or membrane, respectively. The resulting vectors were referredto as pPB-STOP-ncXFPs or pPB-STOP-mbXFPs. All plasmids weresequenced for confirmation.
Finally, the third vector required, mPB (Yusa et al., 2009) (kindlyprovided by Wellcome Trust Sanger Institute), expresses transposase activitythat recognises terminal reptitions in pPB-STOP-XFPs, excises them andincludes the labelling sequences into the genome. A truncated non-transposable labelling cassette (referred to as pCAG-STOP-EYFP) wasgenerated by removing the 3′ terminal repetition from pPB-CAG-STOP-EYFP.
All plasmids needed for CLoNe labelling are available through Addgene(http://www.addgene.org/).
Plasmid validation and N2A cultureAll newly generated plasmid vectors were validated in vitro prior to theiruse in vivo
Briefly, N2A cells were cultured in 25 or 75 cm2 flasks at 37°C, 5% CO2
in DMEM + Glutamax (Gibco) with 10% foetal bovine serum (Gibco) andpenicilin/streptomycin (100 U and 100 μg, respectively; Gibco). Cells werepassaged every two days by trypsinising with Trypsin-EDTA (0.25%trypsin) and centrifugation of the cells. N2A cells were transfected usingFuGENE (Promega) in media without antibiotics. Fluorescence could beseen in N2A cells 24 hours after transfection.
As a final step, the efficacy of the vectors to label specific singleprogenitors and their whole progeny was tested in vivo by in uteroelectroporation.
CLoNe vector mixturesDNA plasmids were dissolved in TE buffer (10 mM Tris-HCl, 1 mM EDTA,pH 8.0) and mixed with Fast Green (Sigma). Targeting vectors were usedfirst at high concentration (0.5 to 1 μg/μl) and sequentially decreased tolessen the number of progenitors labelled (100, 10, 5 and 1 ng/μl of pCAG-CRE). Transposase vector (mPB) was consistently used at 300 ng/μl.Labelling vectors (pPB-STOP-XFPs) concentration varied according to thequality and brightness of the fluorescent signal, from 200 to 500 ng/μl eachof the 12 vectors (around 3.5-4 μg/μl in total). Remarkably, best CLoNeperformance was achieved when pCAG-CRE was transfected at 10 ng/μl, aconcentration 30 times less than mPB. Whereas two vectors co-transfectedat the same concentration can virtually reach a global co-transfection (Ranaet al., 2004), the great difference between Cre-expressing and mPB vectorsguarantees every cell transfected with Cre also expresses transposase. In ouranalysis, progenitors getting only Cre but not mPB do not display anyfluorescence. Both factors together (large mPB:Cre vector ratio and lack ofepisomal cassettes-derived fluorescence) evidence that CLoNe reliablylabels clones through piggyBac mediated transposition.
AnimalsAll animal experiments were approved by a local ethical review committeeand conducted in accordance with personal and project licenses under theUK Animals (Scientific Procedures) Act (1986). Adult C57/BL6 micewere obtained from a local breeding colony at the University of Oxford[based on the Harlan (UK) strain]. They were maintained on a 12/12-hourlight/dark cycle (7 am, lights on) and provided with ad libitum access tofood and water. The day when vaginal plug was detected was referred toas E0.5.
Fertilised hens’ eggs, obtained from Winter Egg Farm (UK), wereincubated at 38°C in humidified atmosphere until required stages.
In utero electroporationTransfection by electroporation of embryonic neural progenitors wasperformed as described previously (García-Moreno et al., 2010). Pregnant
TECHNIQUES AND RESOURCES Development (2014) doi:10.1242/dev.105254
Dev
elop
men
t
mice were anaesthetised by inhalation with isofluorane administered inconjunction with pure oxygen. The uterine horns were exposed out of theabdominal wall and constantly warmed and hydrated with warm saline.Embryos were injected to specifically fill up the lateral ventricle. Theembryos were then electroporated. Forebrain ventricular zone cells weretransfected by means of a BTX Electroporator ECM (Harvard Apparatus).Buprenorhpine (vetergesic) was administered to the pregnant mice prior tosurgery (0.05 mg/kg) and the injected embryos were allowed to survive untilE15 or E18 or until different postnatal stages.
In ovo electroporationElectroporation of the chick embryos was performed as previously described(Itasaki et al., 1999). Briefly, eggs were incubated in vertical position at38°C. Plasmids were injected into either the lateral ventricles or the winglimb bud of E4/E5 chick embryos using a fine pulled-glass needle. Fourelectric pulses (14-17 V, 15 ms pulses with a 950 ms interval) were thenapplied to the brain between insulated silver 40 mm×0.8 mm wire electrodeswith flattened pole (Intracel). Drops of Ringer’s solution supplemented withantibiotics (penicillin/streptamycin: Sigma) were added to the egg and theembryos were incubated until E7-E14.
Tissue processingEmbryonic murine brains, chick embryonic brains and wing limbs up toE11 were fixed by immersion in 4% paraformaldehyde (PFA), whereaspostnatal mice and E12-E14 chick embryos were transcardially perfusedwith phosphate-buffered saline (PBS) followed by PFA. All the brainswere coronally sectioned at 50-70 μm in a vibrating microtome (LeicaVT1000S).
Imaging and analysisImages were captured using a Zeiss LSM 710 confocal microscope (CarlZeiss Microimaging). Similar image parameters (laser power, gain, pinholeand wavelengths) were maintained for images from each brain. To obtain aclear definition of the thinnest processes of the neurons, we needed toincrease the laser power of the confocal microscope to a level in which thebrightest nuclei could appear saturated in the final image. However, whenusing this laser power, we still detected a wide range of colour intensitiesand this makes the analysis of different cells possible. Three independentchannels were employed to detect the four fluorophores, the first for EGFP,the second for mT-Sapphire and mCherry, and the third for EYFP. Theexcitation and absorption conditions for each fluorophore were (innanometres): mT-Sapphire (Ex: 405; Ab: 470-545), EGFP (Ex: 488; Ab:490-530), EYFP (Ex: 514; Ab: 515-580), mCherry (Ex: 561; Ab: 580-695).Each channel was assigned as the emission colour, except for mT-Sapphire,which was assigned as blue. Z-stacks were taken individually for eachchannel and then collapsed to obtain maximum intensity projections. Imageswere adjusted and analysed using ImageJ (Image Analysis in Java, NIH) andAdobe Photoshop CS6 (Adobe Systems Inc.).
To establish clonal relationships, we analysed the intensity mean of eachfluorescent signal separately using IMARIS software (Bitplane; Switzerland)and classified intensities in six values (0 to 5). It generated a four-digit codeeasily comparable among cells. All the values were compared acrosspotentially clonally related cells. In ideal conditions, two independentcellular compartments should be measured separately. In our experience, thenuclear labelling can be easily identified and measured independently. Sofor a better performance of CLoNe in neurons, of which the nucleus usuallycovers most of the soma, independent nuclear and membrane/cytoplasmicmeasurements are recommended.
AcknowledgementsWe thank Dr Jorge García-Marqués (Cajal Institute, Madrid, Spain) for helpfulcomments about the project, Rosina Savisaar for technical support with chickelectroporations, Dr Shankar Srinivas for IMARIS support, and Elizabeth J.Robertson (University of Oxford, UK) and Sebastian Arnold (University of Freiburg,Germany) for the Tbr2cre mutant mice. In addition, we thank Addgene, Dr Aizawa(Riken Kobe, Japan), Dr Cepko (Harvard Medical School, Boston, USA), DrGriesbeck (Max Planck, Munich, Germany), Dr Livet (Inserm, France), DrRamakrishnan (University of Washington, Seattle, WA, USA) and Dr Sauer
(Oklahoma Medical Research Foundation, Oklahoma City, USA) for kindlyproviding us with plasmid vectors.
Competing interestsThe authors declare no competing financial interests.
Author contributionsF.G.-M. and Z.M. designed the project; F.G.-M. performed the experiments; N.A.V.performed Tbr2cre electroporations; J.B. designed the chick experiments; F.G.-M.,N.A.V. and Z.M. interpreted the results; F.G.-M. and Z.M. wrote the manuscript; allthe authors commented and edited the manuscript.
FundingF.G.-M. is funded by the Human Frontiers Science Program (HFSP) long-termpostdoctoral fellowship program; N.A.V. is funded by Goodger Fellowship and FelixScholarship; J.B. is funded by the Biotechnology and Biological SciencesResearch Council (BBSRC); and Z.M. holds research grants from BBSRC, TheWellcome Trust and Medical Research Council UK. Deposited in PMC forimmediate release.
Supplementary materialSupplementary material available online athttp://dev.biologists.org/lookup/suppl/doi:10.1242/dev.105254/-/DC1
ReferencesBartholomae, C. C., Arens, A., Balaggan, K. S., Yáñez-Muñoz, R. J., Montini, E.,
Howe, S. J., Paruzynski, A., Korn, B., Appelt, J. U., Macneil, A. et al. (2011).Lentiviral vector integration profiles differ in rodent postmitotic tissues. Mol. Ther. 19,703-710.
Brown, K. N., Chen, S., Han, Z., Lu, C. H., Tan, X., Zhang, X. J., Ding, L., Lopez-Cruz, A., Saur, D., Anderson, S. A. et al. (2011). Clonal production andorganization of inhibitory interneurons in the neocortex. Science 334, 480-486.
Buckingham, M. E. and Meilhac, S. M. (2011). Tracing cells for tracking cell lineageand clonal behavior. Dev. Cell 21, 394-409.
Cai, D., Cohen, K. B., Luo, T., Lichtman, J. W. and Sanes, J. R. (2013). Improvedtools for the Brainbow toolbox. Nat. Methods 10, 540-547.
Cecchi, C. (2002). Emx2: a gene responsible for cortical development, regionalizationand area specification. Gene 291, 1-9.
Cepko, C., Ryder, E. F., Austin, C. P., Walsh, C. and Fekete, D. M. (1995). Lineageanalysis using retrovirus vectors. Methods Enzymol. 254, 387-419.
Chung, K., Wallace, J., Kim, S.-Y., Kalyanasundaram, S., Andalman, A. S.,Davidson, T. J., Mirzabekov, J. J., Zalocusky, K. A., Mattis, J., Denisin, A. K. etal. (2013). Structural and molecular interrogation of intact biological systems. Nature497, 332-337.
Danielian, P. S., Muccino, D., Rowitch, D. H., Michael, S. K. and McMahon, A. P.(1998). Modification of gene activity in mouse embryos in utero by a tamoxifen-inducible form of Cre recombinase. Curr. Biol. 8, 1323-S2.
Ding, S., Wu, X., Li, G., Han, M., Zhuang, Y. and Xu, T. (2005). Efficient transpositionof the piggyBac (PB) transposon in mammalian cells and mice. Cell 122, 473-483.
Englund, C., Fink, A., Lau, C., Pham, D., Daza, R. A., Bulfone, A., Kowalczyk, T.and Hevner, R. F. (2005). Pax6, Tbr2, and Tbr1 are expressed sequentially by radialglia, intermediate progenitor cells, and postmitotic neurons in developing neocortex.J. Neurosci. 25, 247-251.
Feil, R., Wagner, J., Metzger, D. and Chambon, P. (1997). Regulation of Crerecombinase activity by mutated estrogen receptor ligand-binding domains.Biochem. Biophys. Res. Commun. 237, 752-757.
García-Marqués, J. and López-Mascaraque, L. (2013). Clonal identity determinesastrocyte cortical heterogeneity. Cereb. Cortex 23, 1463-1472.
García-Moreno, F., Pedraza, M., Di Giovannantonio, L. G., Di Salvio, M., López-Mascaraque, L., Simeone, A. and De Carlos, J. A. (2010). A neuronal migratorypathway crossing from diencephalon to telencephalon populates amygdala nuclei.Nat. Neurosci. 13, 680-689.
Ghanem, N., Yu, M., Long, J., Hatch, G., Rubenstein, J. L. and Ekker, M. (2007).Distinct cis-regulatory elements from the Dlx1/Dlx2 locus mark different progenitorcell populations in the ganglionic eminences and different subtypes of adult corticalinterneurons. J. Neurosci. 27, 5012-5022.
Golden, J. A., Fields-Berry, S. C. and Cepko, C. L. (1995). Construction andcharacterization of a highly complex retroviral library for lineage analysis. Proc. Natl.Acad. Sci. USA 92, 5704-5708.
Guillemot, F., Molnár, Z., Tarabykin, V. and Stoykova, A. (2006). Molecularmechanisms of cortical differentiation. Eur. J. Neurosci. 23, 857-868.
Hama, H., Kurokawa, H., Kawano, H., Ando, R., Shimogori, T., Noda, H., Fukami,K., Sakaue-Sawano, A. and Miyawaki, A. (2011). Scale: a chemical approach forfluorescence imaging and reconstruction of transparent mouse brain. Nat. Neurosci.14, 1481-1488.
Hampel, S., Chung, P., McKellar, C. E., Hall, D., Looger, L. L. and Simpson, J. H.(2011). Drosophila Brainbow: a recombinase-based fluorescence labeling techniqueto subdivide neural expression patterns. Nat. Methods 8, 253-259.
Hatanaka, Y., Hisanaga, S., Heizmann, C. W. and Murakami, F. (2004). Distinctmigratory behavior of early- and late-born neurons derived from the corticalventricular zone. J. Comp. Neurol. 479, 1-14.
1597
TECHNIQUES AND RESOURCES Development (2014) doi:10.1242/dev.105254
Dev
elop
men
t
1598
Haubensak, W., Attardo, A., Denk, W. and Huttner, W. B. (2004). Neurons arise inthe basal neuroepithelium of the early mammalian telencephalon: a major site ofneurogenesis. Proc. Natl. Acad. Sci. USA 101, 3196-3201.
Heins, N., Malatesta, P., Cecconi, F., Nakafuku, M., Tucker, K. L., Hack, M. A.,Chapouton, P., Barde, Y. A. and Götz, M. (2002). Glial cells generate neurons: therole of the transcription factor Pax6. Nat. Neurosci. 5, 308-315.
Itasaki, N., Bel-Vialar, S. and Krumlauf, R. (1999). ‘Shocking’ developments in chickembryology: electroporation and in ovo gene expression. Nat. Cell Biol. 1, E203-E207.
Kawaguchi, A., Ikawa, T., Kasukawa, T., Ueda, H. R., Kurimoto, K., Saitou, M. andMatsuzaki, F. (2008). Single-cell gene profiling defines differential progenitorsubclasses in mammalian neurogenesis. Development 135, 3113-3124.
Ke, M.-T., Fujimoto, S. and Imai, T. (2013). SeeDB: a simple and morphology-preserving optical clearing agent for neuronal circuit reconstruction. Nat. Neurosci.16, 1154-1161.
Kogure, T., Kawano, H., Abe, Y. and Miyawaki, A. (2008). Fluorescence imagingusing a fluorescent protein with a large Stokes shift. Methods 45, 223-226.
Kuwajima, T., Sitko, A. A., Bhansali, P., Jurgens, C., Guido, W. and Mason, C.(2013). ClearT: a detergent- and solvent-free clearing method for neuronal and non-neuronal tissue. Development 140, 1364-1368.
Li, Y., Lu, H., Cheng, P.-L., Ge, S., Xu, H., Shi, S.-H. and Dan, Y. (2012). Clonallyrelated visual cortical neurons show similar stimulus feature selectivity. Nature 486,118-121.
Livet, J., Weissman, T. A., Kang, H., Draft, R. W., Lu, J., Bennis, R. A., Sanes, J. R.and Lichtman, J. W. (2007). Transgenic strategies for combinatorial expression offluorescent proteins in the nervous system. Nature 450, 56-62.
Matsuda, T. and Cepko, C. L. (2007). Controlled expression of transgenes introducedby in vivo electroporation. Proc. Natl. Acad. Sci. USA 104, 1027-1032.
Miyata, T., Kawaguchi, A., Saito, K., Kawano, M., Muto, T. and Ogawa, M. (2004).Asymmetric production of surface-dividing and non-surface-dividing corticalprogenitor cells. Development 131, 3133-3145.
Noctor, S. C., Martínez-Cerdeño, V., Ivic, L. and Kriegstein, A. R. (2004). Corticalneurons arise in symmetric and asymmetric division zones and migrate throughspecific phases. Nat. Neurosci. 7, 136-144.
Park, T. S. and Han, J. Y. (2012). piggyBac transposition into primordial germ cells is anefficient tool for transgenesis in chickens. Proc. Natl. Acad. Sci. USA 109, 9337-9341.
Rana, Z. A., Ekmark, M. and Gundersen, K. (2004). Coexpression after electroporationof plasmid mixtures into muscle in vivo. Acta Physiol. Scand. 181, 233-238.
Reid, C. B., Liang, I. and Walsh, C. (1995). Systematic widespread clonalorganization in cerebral cortex. Neuron 15, 299-310.
Roe, T., Reynolds, T. C., Yu, G. and Brown, P. O. (1993). Integration of murineleukemia virus DNA depends on mitosis. EMBO J. 12, 2099-2108.
Sato, Y., Poynter, G., Huss, D., Filla, M. B., Czirok, A., Rongish, B. J., Little, C. D.,Fraser, S. E. and Lansford, R. (2010). Dynamic analysis of vascularmorphogenesis using transgenic quail embryos. PLoS ONE 5, e12674.
Sauer, B. (1993). Manipulation of transgenes by site-specific recombination: use of Crerecombinase. Methods Enzymol. 225, 890-900.
Sauvageot, C. M. and Stiles, C. D. (2002). Molecular mechanisms controlling corticalgliogenesis. Curr. Opin. Neurobiol. 12, 244-249.
Siddiqi, F., Chen, F., Aron, A. W., Fiondella, C. G., Patel, K. and LoTurco, J. J.(2014). Fate mapping by piggyBac transposase reveals that neocortical GLAST+progenitors generate more astrocytes than nestin+ progenitors in rat neocortex.Cereb. Cortex 24, 508-520.
Suda, Y., Kokura, K., Kimura, J., Kajikawa, E., Inoue, F. and Aizawa, S. (2010). Thesame enhancer regulates the earliest Emx2 expression in caudal forebrainprimordium, subsequent expression in dorsal telencephalon and later expression inthe cortical ventricular zone. Development 137, 2939-2949.
Sulston, J. E. (1983). Neuronal cell lineages in the nematode Caenorhabditis elegans.Cold Spring Harb. Symp. Quant. Biol. 48, 443-452.
Szele, F. G. and Cepko, C. L. (1998). The dispersion of clonally related cells in thedeveloping chick telencephalon. Dev. Biol. 195, 100-113.
Tsien, R. Y. (2009). Constructing and exploiting the fluorescent protein paintbox (NobelLecture). Angew. Chem. Int. Ed. Engl. 48, 5612-5626.
Visel, A., Taher, L., Girgis, H., May, D., Golonzhka, O., Hoch, R. V., McKinsey, G.L., Pattabiraman, K., Silberberg, S. N., Blow, M. J. et al. (2013). A high-resolutionenhancer atlas of the developing telencephalon. Cell 152, 895-908.
Woltjen, K., Michael, I. P., Mohseni, P., Desai, R., Mileikovsky, M., Hämäläinen, R.,Cowling, R., Wang, W., Liu, P., Gertsenstein, M. et al. (2009). piggyBactransposition reprograms fibroblasts to induced pluripotent stem cells. Nature 458,766-770.
Yusa, K., Rad, R., Takeda, J. and Bradley, A. (2009). Generation of transgene-freeinduced pluripotent mouse stem cells by the piggyBac transposon. Nat. Methods 6,363-369.
Zapata-Hommer, O. and Griesbeck, O. (2003). Efficiently folding and circularlypermuted variants of the Sapphire mutant of GFP. BMC Biotechnol. 3, 5.
TECHNIQUES AND RESOURCES Development (2014) doi:10.1242/dev.105254
Dev
elop
men
t
Copyright © 2022 FDOKUMEN