Dental Topography of Platyrrhines and Prosimians: Convergence and Contrasts
Upload
uni-bayreuthCategory
view
2download
0
Climate vs. topography – spatial patterns of plantspecies diversity and endemism on a high-elevationislandSeverin D. H. Irl1*, David E. V. Harter1, Manuel J. Steinbauer1,2, David Gallego Puyol3,Jos�e Mar�ıa Fern�andez-Palacios4, Anke Jentsch5 and Carl Beierkuhnlein1
1Department of Biogeography, Bayreuth Center of Ecology and Environmental Research (BayCEER), University ofBayreuth, 95770 Bayreuth, Germany; 2Section Ecoinformatics and Biodiversity, Biosciences, Aarhus University, 8000Aarhus, Denmark; 3Department Physical, Chemical and Natural Systems, Universidad Pablo de Olavide, 41013Sevilla, Spain; 4Island Ecology and Biogeography Research Group, Department of Ecology, Universidad de LaLaguna, La Laguna, 38206 Tenerife, Spain; and 5Department of Disturbance Ecology, Bayreuth Center of Ecologyand Environmental Research (BayCEER), University of Bayreuth, 95770 Bayreuth, Germany
Summary
1. Climate and topography are among the most fundamental drivers of plant diversity. Here, weassessed the importance of climate and topography in explaining diversity patterns of species rich-ness, endemic richness and endemicity on the landscape scale of an oceanic island and evaluated theindependent contribution of climatic and topographic variables to spatial diversity patterns.2. We constructed a presence/absence matrix of perennial endemic and native vascular plant species(including subspecies) in 890 plots on the environmentally very heterogeneous island of La Palma,Canary Islands. Species richness, endemic richness and endemicity were recorded, interpolated andrelated to climate (i.e. variables describing temperature, precipitation, variability and climatic rarity)and topography (i.e. topographic complexity, solar radiation, geologic age, slope and aspect). Weused multimodel inference, spatial autoregressive models, variance partitioning and linear regressionkriging as statistical methods.3. Species richness is best explained by both climatic and topographic variables. Topographicvariables (esp. topographic complexity and solar radiation) explain endemic richness, and climaticvariables (esp. elevation/temperature and rainfall seasonality) explain endemicity. Spatial patterns ofspecies richness, endemic richness and endemicity were in part geographically decoupled from eachother.4. Synthesis. We identified several topography-dependent processes ranging from evolutionary pro-cesses (micro-refugia, in situ speciation, pre-adaptation to rupicolous conditions, dispersal limita-tions) to human-induced influences (introduced herbivores, fire, land use) that possibly shape theendemic richness pattern of La Palma. In contrast, climate mainly drives endemicity, which is con-nected to ecological speciation and specialization to local conditions. We highlight the importanceof incorporating climatic variability into future studies of plant species diversity and endemism. Thespatial incongruence in hot spots of species richness, endemic richness and endemicity emphasizesthe need for an integrated conservation approach acknowledging different diversity measures to pro-tect the complete spectrum of diversity. High-elevation islands such as La Palma are highly suitableto study drivers of diversity and endemism, as they offer environmental gradients of continentalmagnitude on the landscape scale of a single climatic mini-continent and a large array of in situ-speciated endemics.
Key-words: Canary Islands, climatic rarity, climatic stability, island ecology, landscape ecology,landscape scale, mini-continent, multimodel inference, spatial ecology
*Correspondence author. E-mail: [email protected]
© 2015 The Authors. Journal of Ecology © 2015 British Ecological Society
Journal of Ecology 2015, 103, 1621–1633 doi: 10.1111/1365-2745.12463

Introduction
Species and species diversity are not distributed randomly inspace (Rosenzweig 1995). Rather, they follow distinct spatialpatterns (Orme et al. 2005; Stohlgren et al. 2005) or are dis-tributed along differing environmental gradients (Hortal et al.2013; Slaton 2015). In heterogeneous landscapes, often multi-ple overlapping and interacting gradients are influential, espe-cially gradients based on topography and climate (Dewar &Richard 2007; Slaton 2015). This complexity results in a keytask in ecology, biogeography and evolution: disentanglingthe major drivers of species distribution and biodiversity pat-terns from a diverse array of environmental factors.In contrast to many other regions, oceanic islands harbour
relatively low species richness but high endemism (Kier et al.2009). Oceanic islands never had contact with other land-masses (Whittaker & Fern�andez-Palacios 2007); accordingly,most of their endemic species and especially single-islandendemics (SIEs) are a result of in situ speciation (Whittaker,Triantis & Ladle 2008). The spatial distribution of endemismwithin a given oceanic island can thus give valuable informa-tion about origin and drivers of biodiversity patterns on thelandscape scale and have important implications for conserva-tion (Richardson & Whittaker 2010).Landscape-scale studies on oceanic islands have a major
advantage over comparable research on continental systems.The presence of a large share of species that have evolvedin situ allows inferring general drivers of speciation from spa-tial patterns of diversity and endemism. In continental sys-tems, endemism is less a product of in situ speciation butrather the result of range contractions of formerly widespreadspecies (Tribsch & Sch€onswetter 2003; Orme et al. 2005). Inaddition, the mixing of species pools due to past speciesmovement and immigration resulting from environmental fluc-tuations might impede the interpretation of emergent diversitypatterns in the context of speciation on the continent (Kisslinget al. 2012).On oceanic islands, two distinctly different mechanisms
related to speciation can be inferred from patterns of ende-mism. First, centres of endemism (i.e. endemic richness; Myerset al. 2000) show regions and/or environmental conditions towhich most species from the regional species pool are adapted.Endemic richness thus can be used as a measure to identifybiodiversity hot spots (Myers et al. 2000; Possingham &Wilson 2005). Secondly, and in contrast to richness patterns,the percentage of endemic species (i.e. endemicity) is a mea-sure of how strongly local species pools are derived fromin situ speciation in comparison with immigration processes.High values of endemicity thus indicate environmental condi-tions that make it necessary for colonizing species to adapt,which can lead to ecological speciation (Nosil 2012; Stein-bauer et al. 2013a; Steinbauer, Irl & Beierkuhnlein 2013b).On the regional scale, islands are characterized by relatively
stable oceanic climate conditions (Whittaker & Fern�andez-Palacios 2007). However, traditionally, ‘stability’ is mainlyacknowledged for island temperature regimes, whereas a largespatio-temporal variation in precipitation is a common
phenomenon within island archipelagos or even within a sin-gle island (Dewar & Richard 2007; Giambelluca et al. 2011).In addition, high intra-island precipitation variability increasesthe potential for adaptive evolutionary divergence within andamong species, leading to adaptations to specific conditionswithin the island in focus (Mallet et al. 2014; Harter et al. inpress). Thus, the concept of presumed stability (or variability)on islands might need a re-evaluation, as hot spots of neo-en-demism tend to form in moderately variable conditions on thecontinent, indicating the importance of variability for specia-tion (Fjelds�a et al. 1997).Climatic conditions often show pronounced spatial patterns
in the distribution of specific climatic features within a singleisland (Giambelluca et al. 2011; Garz�on-Machado, Otto & delArco Aguilar 2014). The commonness or rarity of these cli-matic conditions (i.e. their isolation in a spatial context) mightaffect the pattern of diversity and endemism by restrictingimmigration and enabling speciation under specific climaticconditions (Steinbauer et al. 2012). The concept of climaticrarity suggests that in a specific area, certain climatic condi-tions are less common than others (Ohlem€uller et al. 2008).High climatic rarity is likely connected to spatially restrictedselection pressure, which promotes adaptive differentiationprocesses (Nosil 2012). In this study, we transferred, for thefirst time, this concept to the landscape scale within a singleisland to take advantage of the continental-scale environmen-tal gradients found on the landscape scale of a high-elevationisland. This enabled us to relate these large-scale gradients topatterns of diversity and endemism of the complete speciesassemblage of this island at resolutions not feasible for conti-nental systems.Topographic complexity positively influences species rich-
ness patterns and speciation processes (Whittaker, Triantis &Ladle 2008; Hortal et al. 2009; Trigas, Panitsa & Tsiftsis2013). Increasing topographic complexity (e.g. variation inslope inclination and aspect) increases habitat diversity, nichespace available for niche partitioning and speciation and thusenables species coexistence (Hortal et al. 2009). Therefore,topographic complexity likely results in increased speciesrichness (Hortal et al. 2009). In addition, complex topographyoffers micro-refugia during periods of environmental alter-ations (e.g. during past climatic fluctuations, or even duringrare extreme weather events; Ashcroft et al. 2012). This candecrease extinction risks, consequently maintaining speciesrichness and endemic richness over time (Mee & Moore2014), which is crucial on isolated oceanic islands with lowcolonization rates. Thirdly, topographic complexity may causegene-flow barriers among diverging populations, supportingreproductive isolation and hence local differentiation(Gillespie & Roderick 2014).Our research aims were to assess how climatic and topo-
graphic variables individually contribute to explaining speciesrichness, endemic richness and endemicity at the landscapescale. Within this framework, we specifically focused on pre-cipitation variability, climatic rarity and topographic complex-ity. We used the island of La Palma (Canary Islands) as astudy system due to its strong elevational and ecological
© 2015 The Authors. Journal of Ecology © 2015 British Ecological Society, Journal of Ecology, 103, 1621–1633
1622 S. D. H. Irl et al.

gradients (Garz�on-Machado, Otto & del Arco Aguilar 2014),very complex topography (Carracedo et al. 2002; Irl &Beierkuhnlein 2011) and large array of endemic plant species(Acebes Ginov�es et al. 2010).
Materials and methods
STUDY AREA
La Palma is the north-westernmost island of the Canary Islands,located in the Atlantic Ocean off the coast of north-western Africa(Fig. 1). La Palma covers an area of 706 km2; its highest peak isRoque de los Muchachos (2426 m; Carracedo et al. 2002). La Palmahas a subtropical–Mediterranean climate with humid winters and drysummers (Garz�on-Machado, Otto & del Arco Aguilar 2014). How-ever, climatic conditions differ considerably within the island. Annualprecipitation ranges from about 170 mm to almost 1400 mm (exclud-ing fog drip), annual temperature from about 9 °C on the island sum-mit to around 22 °C at the leeward south-western coast (Irl &Beierkuhnlein 2011). Fog drip can locally lead to an increase of pre-cipitation particularly relevant in summer (Marzol, S�anchez & Yanes2011) but likely does not change the overall spatial pattern of precipi-tation because both fog drip and rainfall are largely linked to topogra-phy (Walmsley, Schemenauer & Bridgman 1996). The north-easterntrade winds create an elevation-associated climatic divide of the islandin a humid windward and a dry leeward side. Above the trade wind-induced cloud zone exists a thermal inversion layer, generally exhibit-ing dry conditions with the possibility of snow and ice in winter(Garz�on-Machado, Otto & del Arco Aguilar 2014).
La Palma is geologically divided into two parts. The northern olderpart is morphologically complex with steep valleys (so-called barran-cos), coastal cliffs and the massive Caldera de Taburiente complex,which has almost vertical cliffs in its interior reaching 1000 m ormore in elevation. The volcanic activity has ceased in the northernpart, which is dominated by erosive processes (Carracedo et al.2002). The younger, southern part is still subject to subaerial volcanicontogeny (the last eruption on the southern tip of the island was doc-umented in 1971) and has gentler slopes with volcanic cones and ashfields (Carracedo et al. 2002).
The zonal vegetation directly reflects the climatic conditions of theisland (Garz�on-Machado, Otto & del Arco Aguilar 2014). Thesezones range from halophytic communities in arid coastal areas to suc-culent scrub and thermophilic woodlands in semi-arid lower eleva-tions, through the endemic Canary Pine forest in mid-elevations to ahigh-elevation summit scrub. On the windward side, a palaeo-endemicevergreen humid laurel forest and a slightly less humid tree heathErica arborea–Morella faya forest exist at mid-elevations in the zoneof the trade wind clouds instead of the Canary Pine forest (del ArcoAguilar et al. 2010; Garz�on-Machado, Otto & del Arco Aguilar2014). Endemic species are found in all natural vegetation zones (delArco Aguilar et al. 2010). According to Acebes Ginov�es et al.(2010), La Palma hosts 658 native vascular plant species (includingspecies and subspecies; for simplification reasons, hereafter referredto as species), of which 193 are archipelago endemics (AEs, i.e. ende-mic to the Canary Islands). Of the AEs, 37 are SIEs.
SAMPLING METHOD
The presence and absence of endemic perennial vascular plant spe-cies (i.e. all SIEs and AEs) was recorded in 890 plots using a radialsampling approach with a 50 m radius (Fig. 1a; see Table S1 in
Supporting Information for a list of species; to access the data usedin this study, see Irl et al. 2015). To cover all relevant gradients,we accessed sampling sites by all means possible (i.e. roads, tracks,hiking paths, backcountry, non-technical climbing, etc.). In aselected area, a random point was set as centre point of each plot.This centre point was recorded with a GPS device (Garmin Oregon550). Our sampling approach covers all relevant environmental gra-dients on La Palma owing to the large number of plots and thegood spatial coverage, even though plots were not randomly dis-tributed (Fig. 1a). This sampling approach is very time-efficient,allowing for a large sample size, which is essential for differentiatedhigh-resolution spatial analyses in the face of a variety of gradients(e.g. elevation, precipitation, geology, seasonality and solar radiation)and topographic complexity.
We focused on perennial vascular plant species including allwoody species but excluding annuals. Perennials are valuable studyobjects for several reasons: (i) perennials are easy to identify in thefield due to their relatively large growth (many are small- to medium-sized shrubs), whereas annuals can easily be underestimated as theyproduce above-ground biomass only for short time periods during theyear. This might result in wrong absences for annuals if above-groundbiomass is not present. (ii) Due to their longevity, perennials integrateover long-term environmental conditions (e.g. climate), while annualsreact very strongly to short-term weather conditions, making theirappearance dependent on stochastic events. (iii) Most endemics onthe Canary Islands are perennials (93% according to Shmida &Werger 1992), whereas the relevance of annuals for the flora, espe-cially the endemic flora, of the Canary Islands is limited. In addition,this sampling focus strongly increased sampling efficiency, resultingin exceptionally high spatial coverage, which is fundamental for ourresearch objectives.
The numbers of remaining native perennial species (i.e. speciesthat were not SIEs or AEs) were identified in the field and recordedwithout species’ identities as our focus was on endemic diversity(i.e. endemic richness and endemicity). We calculated total perennialspecies richness per plot (hereafter referred to as species richness,abbreviated as SR) by adding the number of recorded endemic peren-nial species to the remaining native perennial species.
The percentage of single-island endemics (pSIE) and the percent-age of archipelago endemics (pAE) were calculated by dividing thenumber of single-island endemics (nSIE) and the number of archipe-lago endemics (nAE) through total species richness, respectively. Per-centage indices are independent of richness gradients and are anindicator of taxonomic or, in our case, floristic uniqueness (Gillespie,Claridge & Roderick 2008). Nomenclature and endemic status followAcebes Ginov�es et al. (2010). Sampling took place in fall 2010 andin spring 2011, 2012 and 2013.
ENVIRONMENTAL DATA
Basic environmental data were derived from raster data sets providedby the Cabildo Insular de La Palma (2 9 2 m digital elevation modeland geologic map). The resolution of the digital elevation model wasresampled to a raster resolution of 100 9 100 m. All plots wererecalculated as centroids of the 100 9 100 m raster. Plots that werelocated within the same raster cell were homogenized (i.e. specieslists were added together). Elevation, slope angle, micro-aspect(northernness and easternness) and macro-aspect (mean aspect pergrid cell within a 5 km radius) as well as mean annual solar radiation(using a standard diffuse atmosphere and based on latitude, elevationand slope aspect) were calculated for each plot.
© 2015 The Authors. Journal of Ecology © 2015 British Ecological Society, Journal of Ecology, 103, 1621–1633
Plant diversity on a high-elevation island 1623

La Palma
CanaryIslands
Elevation (m)
Climaticrarityindex
Topographiccomplexity
index
2420
High
Low
High
Low
0
Sample points 0 3 6 12km
High
Rainfallseasonality
index
Low
N
N
Kilometers200100500
(a) (b)
(c) (d)
Fig. 1. Maps of La Palma within the Canary Islands showing the spatial distribution of (a) elevation (including the location of the sampled plots),(b) the rainfall seasonality index, (c) the climatic rarity index and (d) topographic complexity. The large number of sampled plots (n = 890)enabled to cover the whole island and all relevant environmental conditions.
© 2015 The Authors. Journal of Ecology © 2015 British Ecological Society, Journal of Ecology, 103, 1621–1633
1624 S. D. H. Irl et al.

Mean annual precipitation and mean annual temperature were inter-polated using data collected from meteorological stations for the Can-ary Islands (n = 214 for mean annual temperature and n = 288 formean annual precipitation; see Fig. S1). Linear regression kriging (Rpackage gstat) was applied as interpolation method, with elevation,slope, island, micro-aspect and macro-aspect as covariables (fordetails on linear regression kriging, see Statistical analysis section).Three measures of precipitation variability were computed usingmonthly precipitation data from 47 meteorological stations from theSpanish Federal Meteorology Agency (AEMET) from the CanaryIslands (time span: 1969 to 1998; see Fig. S1) and implementing thesame linear regression kriging technique: (i) intra-annual variabilityrepresented by the 30-year mean of the annual coefficients of varia-tion based on monthly precipitation sums, respectively, (ii) interan-nual variability represented by the coefficient of variation for annualprecipitation over the 30-year time period, and (iii) rainfall seasonalityrepresented by the rainfall seasonality index by Walsh & Lawler(1981); see the spatial distribution of the rainfall seasonality index forLa Palma in Fig. 1a.
Climatic rarity was calculated following the method given byOhlem€uller et al. (2008) for two geographic entities: (i) based on theclimate of the Canary Islands and (ii) based on the climate of LaPalma. For both geographic entities, each climatic variable wasdivided into equal range classes. For mean annual temperature, weused a class size of 0.25 °C, and for mean annual precipitation, aclass size of 25 mm. According to the temperature and precipitationconditions, each 100 9 100 m raster cell was assigned to a respectivetemperature and precipitation class (e.g. a combination of precipitationranging from 300 to 325 mm and temperature from 20 to 20.25 °C).Then, all cells of each combined temperature and precipitation classon La Palma were summed up, resulting in a spatial index of climaticrarity based on area (in ha). Climatic rarity increases with decreasingindex values (Fig. 1b).
Topographic complexity was estimated by calculating the ratiobetween the 3D and 2D surface area with the following equation(Fig. 1c; Jenness 2004):
Topographic complexity index
¼P
100�100m ðArea2�2m= cosðSlope2�2mÞÞArea100�100m
;
where Area2 9 2 m is the area per grid cell from a 2 9 2 m digitalelevation model (DEM), Slope2 9 2 m the slope of each grid cell fromthe same DEM in degrees, and Area100 9 100 m the area per grid cellfrom a 100 9 100 m DEM containing all 50 9 50 (i.e. 2500) gridcells from the 2 9 2 m DEM. This index increases with increasingtopographic complexity (i.e. from 1 = absolutely flat surface to /).
The linear regression kriging method and all other statistical meth-ods were implemented in R Statistics (version 3.0.1; R Core Team2013). All other geo-information was calculated using ArcGIS� soft-ware by Esri (Redlands, CA, USA). A list summarizing all environ-mental variables used in this study is given in Table 1.
STATIST ICAL ANALYSIS
First, the linear relationship between response and explanatory vari-ables was assessed by bivariate correlations (Spearman’s q; seeTable S2). To undergo a variable reduction for each response variable(species richness, nSIE, nAE, pSIE, pAE), explanatory variables withcorrelations �0.1 ≤ r ≤ 0.1 were excluded due to weak explanatorypower (Fløjgaard et al. 2011). In a second step, collinearity wasaddressed by testing correlations for each possible pair of explanatory
variables. If |r| > 0.7, the explanatory variable performing poorer withthe response variable was excluded (S2; see Dormann et al. 2013 fora discussion of collinearity). This resulted in a unique set of climaticand topographic variables for each response variable (see Table S3).
Nonlinear relationship between the independent and dependentvariables can be accounted for in a regression framework using trans-formations. To select the appropriate transformation for each responsevariable, exploratory linear regression models were applied to eachexplanatory variable. The following transformations were separatelytested to find the best model fit: untransformed, logarithmic, squareroot, quadratic (x2) and hump-shaped (x2 + x). Transformation selec-tion was based on AICc values (i.e. second-order Akaike InformationCriterion) of the respective regression models (Grueber et al. 2011;see Table S4). The best fitting transformation of each explanatoryvariable was implemented in a multiple linear regression (MLR).Table S5 displays the resulting MLR for species richness, nSIE, nAE,pSIE and pAE. Model fits of each MLR model were visually checkedto ensure compliance with model assumptions.
The residuals of each MLR were tested for spatial autocorrelationusing Moran’s I to avoid potential parameter estimate bias and infla-tion of type I errors (Dormann et al. 2007). No spatial autocorrelationwas detected in the residuals of the MLR for species richness(I = �0.001, n.s.) and nSIE (I = �0.002, n.s.), whereas nAE(I = �0.007, P < 0.001), pSIE (I = �0.004, P < 0.001) and pAE(I = �0.003, P < 0.05) resulted in significant spatial autocorrelation.To double-check the effect of spatial autocorrelation, simultaneousautoregressive models (SARs) with a spatially dependent error termwere implemented based on the same set of explanatory variables asin the MLR. SARs account for spatial autocorrelation by using aneighbourhood matrix (Dormann et al. 2007). Results were comparedwith the respective MLR using Nagelkerke’s pseudo-R2 as correlationcoefficient (Nagelkerke 1991; see S3). Performance of MLRs andSARs was comparable, even though Nagelkerke’s pseudo-R2 wasconsistently higher. For this reason and because the three significantMoran’s I values are very close to zero, we conclude that spatialautocorrelation is therefore negligible for the following steps and issufficiently covered by the explanatory variables in the respectiveMLR.
Variance partitioning using partial linear regression (R packagevegan) was implemented to assess the overall importance of climateand topography following the guidelines of Legendre (2008). Vari-ance partitioning quantifies the independent and/or joint explanatorypower (adjusted R2 as the goodness-of-fit measure) of different groupsof explanatory variables by conducting MLRs always between a focalset of explanatory variables and the residuals of a regression betweenthe dependent variable and all other explanatory variables (explainedin Legendre 2008). Variance partitioning estimates the proportion ofvariation the response variable can be attributed exclusively to one setof explanatory variables once the effect of the other explanatory vari-ables has been taken into account. All variables used in this studywere pre-classified into being either climatic or topographic drivers(Table 1). The same set of variables as selected for the MLR and theSAR approach and their respective best fitting transformations wereused for variance partitioning (see S3). Then, based on this set ofvariables, the independent, overlapping and total contribution of eachclass (i.e. topography or climate) was calculated based on adjusted R2
values.
Multimodel inference (MMI) is an alternative approach to variancepartitioning used to estimate the relative importance of each explana-tory variable in relation to each response variable (R packagerelaimpo version 2.2-2). In contrast to traditional null-hypothesis
© 2015 The Authors. Journal of Ecology © 2015 British Ecological Society, Journal of Ecology, 103, 1621–1633
Plant diversity on a high-elevation island 1625

testing, MMI enables inference from more than one model (Johnson& Omland 2004) and has been proposed as a promising method inecology and biogeography (Millington & Perry 2011). The relativeimportance and confidence intervals were calculated using bootstrap-ping (n = 1000) with all possible model combinations. As a result,the explained variation of the MMI for each response variable (indi-cated as adjusted R2), and the relative contribution of each explana-tory variable (i.e. % contribution to the R2 of the respective MMI)and its confidence interval are given.
In a last step, the spatial interpolation of the response variableswas conducted using linear regression kriging (R package gstat). Lin-ear regression kriging uses a statistical approach (MLR) to infer therelationship of explanatory variables to the response variable and theninterpolates the residuals into space (Garz�on-Machado, Otto & delArco Aguilar 2014). All explanatory variables used in the MLRs andtheir respective transformations according to each response variablewere used as basis of direct spatial interpolation of species richness,endemic richness and endemicity values.
Statistical significance is indicated in the following as ‘*’ forP < 0.05, ‘**’ for P < 0.01 and ‘***’ for P < 0.001. All correlationcoefficients in MLRs, MMI and variance partitioning are given asnumber of variable-corrected adjusted R2.
Results
TOPOGRAPHY VS. CL IMATE
The large number of sampled points ensured a comprehensiveand spatially dense coverage of the island, including all rele-vant environmental gradients (Fig. 1a), and a very high spa-tial density of plots on this scale (1.26 plots per km2). A totalof 79 archipelago endemics were identified (44% of all peren-nial archipelago endemics of La Palma; Acebes Ginov�es et al.2010), 31 of which were SIEs (84% of all La Palma SIEs;Acebes Ginov�es et al. 2010; see species list Table S1). Spe-cies richness ranged from 1 to 57 species per plot, nSIE from0 to 8 species per plot, nAE from 0 to 24 species per plot,and pSIE as well as pAE from 0% to 100%. The overall
explanatory power of the MMI was good (species richness,pSIE and pAE) to moderate (nSIE and nAE); that is, a mod-erately large section of unexplained variance remained(Table 2).Variance partitioning revealed that topography and climate
both are more or less equally important for species richness(joint explained variation for climate: R2 = 0.41 and topogra-phy: R2 = 0.34, including a large share of overlapping contri-bution: R2 = 0.26; Fig. 2a). However, endemic richness wasdominated by the influence of topography for both nSIE (jointexplained variation: R2 = 0.18) and nAE (joint explained vari-ation: R2 = 0.27), whereas climate had very little influence onendemic richness (joint explained variation: R2 ≤ 0.06;Fig. 2b,c). Climate was very important in explaining endemic-ity for both pSIE (joint explained variation: R2 = 0.42) andpAE (joint explained variation: R2 = 0.45; Fig. 2d,e). More-over, the influence of topography was almost not separablefrom the explained variation of climate (independentexplained variation for pSIE: R2 = 0.01 and pAE: R2 = 0.02;overlapping explained variation for pSIE: R2 = 0.15 and forpAE: R2 = 0.22). For all values of joint, independent, over-lapping and total explained variation of each response vari-able resulting from variance partitioning, see Table S5.
ENVIRONMENTAL COMPONENTS OF TOPOGRAPHY AND
CLIMATE
In the MMI, species richness was mainly explained by eleva-tion, annual solar radiation, the rainfall seasonality index andthe topographic complexity index (Fig. 2f, Table 2a), indicat-ing the joint importance of climate (elevation, rainfall season-ality index) and topography (annual solar radiation,topographic complexity index). However, the relative contri-bution of each variable was relatively moderate (e.g. elevationas explanatory variable with the highest relative contributiononly reaches 27%). Further climatic (climatic rarity, interan-
Table 1. List of all environmental variables and their abbreviations used in this study grouped into climate and topography
Environmental variables
Class Variable Abbreviation Unit Min. value Max. value
Climate Climatic rarity for the Canary Islands CR_CAN ha 4 5311Climatic rarity for La Palma CR_LP ha 2 818Elevation Elev m a.s.l. 1 2392Intra-annual precipitation variability INTRA_VAR – 1.18 1.96Interannual precipitation variability INTER_VAR – 0.25 0.48Mean annual precipitation MAP mm 177 1331Mean annual temperature MAT °C 8.7 20.0Rainfall seasonality index RSI – 0.67 0.84
Topography Annual solar radiation ASR Wh m�2 63 650 189 110Easternness Easternness – 0 1Geologic age Age Ma 0.0005 4Macro-aspect Macro – �0.925 0.899Northernness Northernness – 0 1Slope angle Slope ° 1 55Topographic complexity index TCI – 1 2.97
Units and minimum and maximum values are given for each variable.
© 2015 The Authors. Journal of Ecology © 2015 British Ecological Society, Journal of Ecology, 103, 1621–1633
1626 S. D. H. Irl et al.

Tab
le2.
Total
explainedvariationandrelativ
eim
portance
ofeach
environm
entalvariable
inexplaining
(a)speciesrichness,(b)endemic
richness
(nSIE=numberof
single-islandendemics;nA
E=nu
mber
ofarchipelagoendemics)
and(c)endemicity
(pSIE=percentage
ofsingle-islandendemics;pA
E=percentage
ofarchipelagoendemics).Total
explainedvariation(given
asR2 )
results
from
multim
odel
infer-
ence
(bootstrap
n=10
00).‘%
ofR2 ’
givestherelativ
econtributio
nof
therespectiv
eenvironm
entalvariable
tothetotalexplainedvariation
(a)Sp
eciesrichness
(b)Endem
icrichness
(c)Endem
icity
SRnS
IEnA
EpS
IEpA
E
Total
explainedvariation:
R2=0.50
Total
explainedvariation:
R2=0.20
Total
explained
variation:
R2=0.31
Total
explainedvariation:
R2=0.44
Total
explainedvariation:
R2=0.48
%of
R2
Dir.
Transf.
%of
R2
Dir.
Transf.
%of
R2
Dir.
Transf.
%of
R2
Dir.
Transf.
%of
R2
Dir.
Transf.
Elev
27∩
Hum
pTC
I50
+Sq
rtTC
I47
+Sq
rtElev
50∪
Hum
pMAT
32∪
Hum
pASR
20∩
Hum
pASR
22∩
Hum
pASR
22�
Sqrt
RSI
29∪
Hum
pRSI
31∪
Hum
pRSI
18∩
Hum
pSlop
e16
+Linear
Slop
e16
+Quad
ASR
13∪
Hum
pASR
12∪
Hum
pTC
I9
+Log
INTRA_V
AR
5∪
Hum
pCR_L
P12
+Log
INTER_V
AR
6∩
Hum
pIN
TER_V
AR
10∩
Hum
pCR_C
AN
6+
Log
CR_L
P4
+Log
RSI
3∩
Hum
pEasternness
3�
Linear
Easternness
6�
Linear
Easternness
6∪
Hum
pIN
TER_V
AR
4�
Linear
INTRA_V
AR
6∩
Hum
pIN
TER_V
AR
5∪
Hum
pAge
4∪
Hum
pIN
TRA_V
AR
5∪
Hum
pSlop
e4
+Quad.
Explanatory
variablesareorderedby
relativ
econtributio
nandaregroupedas
either
topographic(italics)
orclim
atic
variable
(bold).The
best
fitting
transformationis
givenin
‘Transf.’.Testedtransformations
wereas
follo
ws:lin
ear,logarithmic,square
root,quadratic
andhump-shaped
(x2+x).‘D
ir.’indicatesthedirectionof
correlation(D
ir.‘+’=positiv
ecorrelation;
‘�’=negativ
ecorrelation;
∩=hu
mp;
∪=in-
versehu
mp).Abb
reviations
ofvariablesaregivenin
Table
1.Fo
rdetails,seetheMaterialsandmetho
dssection.
© 2015 The Authors. Journal of Ecology © 2015 British Ecological Society, Journal of Ecology, 103, 1621–1633
Plant diversity on a high-elevation island 1627

nual precipitation variability, intra-annual precipitation vari-ability) and topographic variables (easternness and slope) onlyplayed a subordinate role (Fig. 2f, Table 2a). Overallexplained variation was high (R2 = 0.5; Table 2a); however,half of the variation remained unexplained.Endemic richness was best explained by different topo-
graphic variables, that is the topographic complexity index,annual solar radiation and slope for both nSIE and nAE(Fig. 2g,h, Table 2b). The topographic complexity index aslargest contributor of relative importance reached 50% and47% for nSIE and nAE, respectively. Climatic variables onlyhad marginal influence of ≤5% (i.e. intra-annual precipitationvariability, interannual precipitation variability and the rainfallseasonality index), with the slight exception of climatic rarityfor La Palma for nAE (12%; Table 2b). Overall explainedvariation was moderate for both nSIE and nAE and did notsurpass R2 = 0.31 (Table 2b).Climatic variables had the highest explanatory power for
endemicity, whereas topographic variables were of minorimportance (Fig. 2i,j). For pSIE, elevation and the rainfallseasonality index (both climatic variables) as well as annual
solar radiation (topographic variable) were the most importantvariables, ranging from 12% (annual solar radiation) to 50%relative importance (elevation; Table 2c). The climatic vari-ables mean annual temperature (which is strongly linked toelevation; relative importance of 32%) and the rainfall season-ality index (relative importance of 31%) as well as to a cer-tain degree also annual solar radiation (relative importance of12%) had the highest relative importance for pAE (Table 2c).Other climatic (i.e. intra-annual precipitation variability andinterannual precipitation variability) and topographic variables(i.e. geologic age and easternness) only had little additionalexplanatory power (≤6%; Fig. 2i,j, Table 2c). Overallexplained variation was high for both pSIE and pAE, almostreaching R2 values of 0.5 for the latter (Table 2c).
SPATIAL DISTRIBUTION OF SPECIES RICHNESS,
ENDEMIC RICHNESS AND ENDEMICITY
A complex pattern of species richness, endemic richness andendemicity is visible for La Palma (Fig. 3). Species richnessdecreased with elevation and from northeast to southwest
Variance partitioning Relative importanceof explanatory variables
Climate
Climate
Climate
Topography
Topography
Topography
Climate
Climate
Topography
Topography
Climate Topography
SR
nSIE
pSIE
pAE pAE
pSIE
nSIE
nAE nAE
SR
CR_C
ANCR
_LP
INTR
A_VA
RIN
TEA_
VAR
MAT RS
I
Age
ASR
Easte
rnne
ssSl
ope
TCI
Elev
CR_C
ANCR
_LP
INTR
A_VA
RIN
TRA_
VAR
MAT RS
I
Age
ASR
Easte
rnne
ssSl
ope
TCI
Elev
CR_C
ANCR
_LP
INTR
A_VA
RIN
TER_
VAR
MAT RS
I
Age
ASR
Easte
rnne
ssSl
ope
TCI
Elev
60
40
20
% R
elat
ive
impo
rtanc
e
0
60
40
20
% R
elat
ive
impo
rtanc
e
060
40
20
% R
elat
ive
impo
rtanc
e
0
60
40
20
% R
elat
ive
impo
rtanc
e
060
40
20
% R
elat
ive
impo
rtanc
e
0
Spe
cies
richn
ess
End
emic
rich
ness
End
emic
ity
0 0.1 0.2
Adj. R2
0.3 0.4 0.5
0 0.1 0.2
Adj. R2
0.3 0.4 0.5
0 0.1 0.2
Adj. R2
0.3 0.4 0.5
0 0.1 0.2
Adj. R2
0.3 0.4 0.5
0 0.1 0.2
Adj. R2
0.3 0.4 0.5
(a)
(b)
(c)
(d)
(e)
(f)
(g)
(h)
(i)
(j)
Fig. 2. Variance partitioning of the influenceof climate and topography (a–d) and relativeimportance of explanatory variables (f–j) onspecies richness (SR), endemic richness(nSIE = number of single-island endemics;nAE = number of archipelago endemics) andendemicity (pSIE = percentage of single-island endemics; pAE = percentage ofarchipelago endemics). Figures a–d show theindependent and overlapping explainedvariation of climate and topography asportion of the total adjusted R2 values. Forvalues, see S5. Figures f–j display therelative importance of each explanatoryvariable calculated by the multimodelinference approach as per cent contribution tothe R2 for the respective response variable.Gaps indicate that these variables wereremoved due to collinearity or during thevariable reduction process. Both variancepartitioning and relative importance resultfrom multiple linear regressions. For detailson both methods, please see the Materialsand methods section. Abbreviations ofexplanatory variables: Age, geologic age;ASR, annual solar radiation; CR_CAN,climatic rarity for the Canary Islands;CR_LP, climatic rarity for La Palma; Elev,elevation; INTER_VAR, interannualprecipitation variability; INTRA_VAR, intra-annual precipitation variability; MAT, meanannual temperature; RSI, rainfall seasonalityindex; TCI, topographic complexity index.
© 2015 The Authors. Journal of Ecology © 2015 British Ecological Society, Journal of Ecology, 103, 1621–1633
1628 S. D. H. Irl et al.
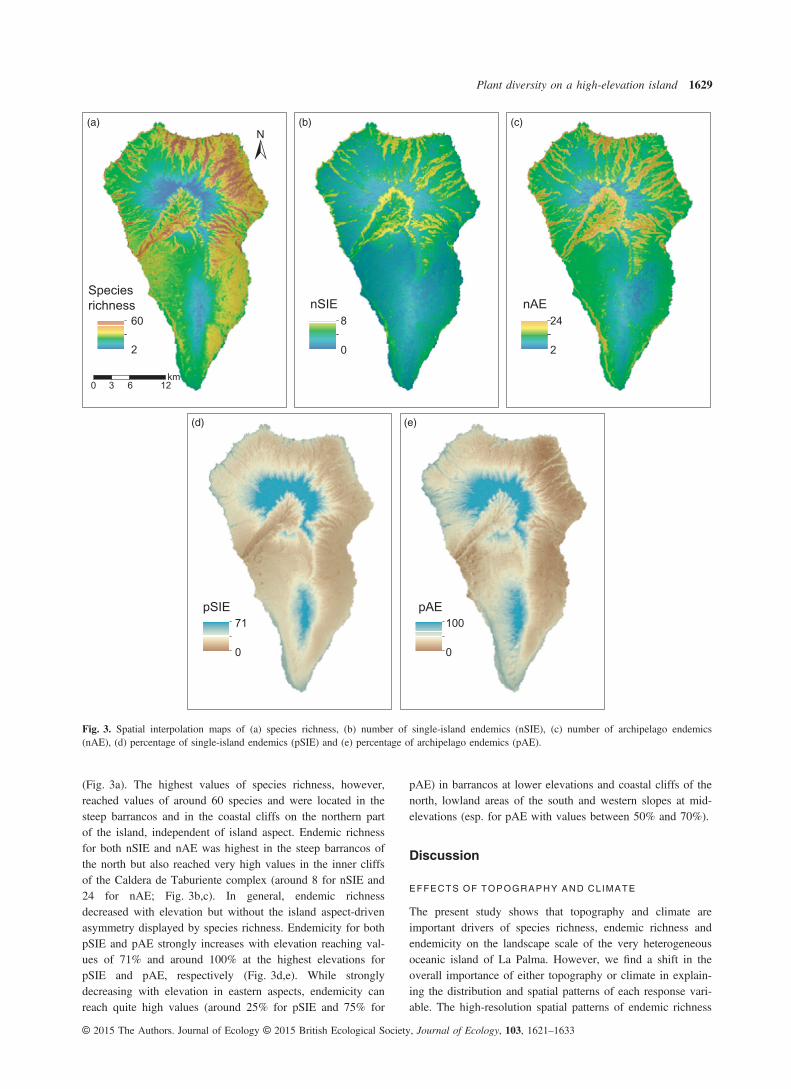
(Fig. 3a). The highest values of species richness, however,reached values of around 60 species and were located in thesteep barrancos and in the coastal cliffs on the northern partof the island, independent of island aspect. Endemic richnessfor both nSIE and nAE was highest in the steep barrancos ofthe north but also reached very high values in the inner cliffsof the Caldera de Taburiente complex (around 8 for nSIE and24 for nAE; Fig. 3b,c). In general, endemic richnessdecreased with elevation but without the island aspect-drivenasymmetry displayed by species richness. Endemicity for bothpSIE and pAE strongly increases with elevation reaching val-ues of 71% and around 100% at the highest elevations forpSIE and pAE, respectively (Fig. 3d,e). While stronglydecreasing with elevation in eastern aspects, endemicity canreach quite high values (around 25% for pSIE and 75% for
pAE) in barrancos at lower elevations and coastal cliffs of thenorth, lowland areas of the south and western slopes at mid-elevations (esp. for pAE with values between 50% and 70%).
Discussion
EFFECTS OF TOPOGRAPHY AND CLIMATE
The present study shows that topography and climate areimportant drivers of species richness, endemic richness andendemicity on the landscape scale of the very heterogeneousoceanic island of La Palma. However, we find a shift in theoverall importance of either topography or climate in explain-ing the distribution and spatial patterns of each response vari-able. The high-resolution spatial patterns of endemic richness
Speciesrichness
(a) (b) (c)
(e)(d)
nSIE nAE8
0
pSIE71
0
pAE100
0
24
2
60
N
2
0 3 6 12km
Fig. 3. Spatial interpolation maps of (a) species richness, (b) number of single-island endemics (nSIE), (c) number of archipelago endemics(nAE), (d) percentage of single-island endemics (pSIE) and (e) percentage of archipelago endemics (pAE).
© 2015 The Authors. Journal of Ecology © 2015 British Ecological Society, Journal of Ecology, 103, 1621–1633
Plant diversity on a high-elevation island 1629

and endemicity, which are mainly based on in situ-speciatedspecies, allow us to make inferences about the biogeographicdrivers important for patterns of evolution and speciation butalso have major implications for species conservation onscales rarely targeted. Given the fact that endemic richnessand endemicity indicate quite different aspects, we discussboth patterns separately.The current distribution of endemic richness on La Palma
is likely shaped by adaptations to local environmental condi-tions, and recent human-mediated influence (i.e. introducedherbivores, fire and land use), a pattern probably relevant formost regions of the world. We suggest several possible evolu-tionary processes, which are not mutually exclusive, to beresponsible for the strong positive impact of topography onendemic richness, which in our study is mainly influenced bythe topographic complexity index.First, a complex topography such as that found in this study
likely renders a high diversity of different habitats and thus alarge local niche space (Hortal et al. 2013; Steinbauer et al.2013a) as well as an increase in area (Leutner et al. 2012). Sec-ondly, high topographic complexity likely offers micro-refugiaduring periods of climatic fluctuation, thus reducing local extir-pation probabilities (M�edail & Diadema 2009) and possiblyalso increasing speciation (Mee & Moore 2014). Thirdly, thelow influence of climate on endemic richness might indicatethat the endemic species set (as a whole) is adapted to the com-plete range of climatic conditions on the island, as in situ speci-ation has happened in all climatic conditions on the island (esp.relevant for SIEs; Beard, Chapman & Gioia 2008). Fourthly,many endemic species are adapted to rupicolous conditions(del Arco Aguilar et al. 2010): conditions that are more likelyto be present if topographic complexity is high. Finally, the lossof dispersal power is a common syndrome of evolution onislands (Whittaker & Fern�andez-Palacios 2007). Dispersal limi-tations within an island (i.e. gene-flow barriers) are expected tosupport speciation processes (Kisel & Barraclough 2010; Gille-spie & Roderick 2014).Like all islands world-wide, La Palma also is, to some
degree, affected by anthropogenic influences (Caujap�e-Castellset al. 2010). Therefore, we suggest that besides the mentionedevolutionary processes, several human-induced influences arepresent that can potentially explain the identified endemic rich-ness pattern. On the one hand, steep and inaccessible areasmight offer ‘safe sites’ for endemics from introduced herbi-vores (Irl et al. 2014a,b) because endemics are preferentiallybrowsed by introduced herbivores (Garz�on-Machado et al.2010; Irl et al. 2012) due to lacking defence mechanisms(Bowen & Van Vuren 1997). On the other hand, endemicsmight experience lower fire frequencies (which have generallyincreased in recent decades; Climent et al. 2004) in topo-graphic complex regions probably due to lower vegetationcover and lower productivity. Finally, human land use cannotoccur, at least at high intensities, in areas of highly complexterrain. Thus, the presented pattern might be partially a resultof the current land use distribution. However, further studiesare needed to disentangle the independent effects of adaptiveevolution and range detraction from human influence.
In contrast to endemic richness, climate has a strongerinfluence on endemicity than topography on La Palma.Endemicity stands for floristic uniqueness and the relativeimportance of endemics in a given area (Gillespie, Claridge &Roderick 2008) but is also interpreted as a measure of specia-tion (Emerson & Kolm 2005; Steinbauer, Irl & Beierkuhnlein2013b). Climate and especially climatic changes directly influ-ence speciation, for example through specific resource avail-ability in terms of energy or water availability or byestablishing specific selection pressures (Hua & Wiens 2013).For example, high-elevation ecosystems possess quite harshconditions for plant growth; thus, selective pressure is veryhigh (Anthelme & Dangles 2012). Idle resources, open nichespace and potential isolation effects in high-elevation islandecosystems likely stimulate speciation processes (Steinbauer,Irl & Beierkuhnlein 2013b). As a result, endemicity poten-tially indicates evolutionary in situ specialization to specificenvironmental conditions (i.e. past adaptive speciation pro-cesses), a phenomena which has been proposed to be relevantfor all mountainous islands as well as isolated mainland peaksand mountain systems (Steinbauer, Irl & Beierkuhnlein2013b).
PRECIP ITAT ION VARIABIL ITY AND CLIMATIC RARITY
Precipitation variability, especially the rainfall seasonalityindex, contributed substantially in explaining species richnessand endemicity but not endemic richness on La Palma. Theareas of La Palma with high precipitation variability host gen-erally fewer species, while stable areas are mainly humidregions supporting relatively high species richness. High spe-cies richness likely results from high resource availability andlow selective pressure for specialization, suitable for common(mesophytic) species communities (Stohlgren et al. 2005;Weigelt, Jetz & Kreft 2013). However, in aridity-proneregions, one of the essential resources for plant growth is verylimited (i.e. water) and/or connected to a high temporalstochasticity, leading to less favourable growing conditions.This results in an increased importance of specialized ende-mics and thus a higher floristic uniqueness (i.e. endemicity)but lower species richness in high-variability conditions (De-war & Richard 2007). Several studies have shown that centresof endemic richness are connected to long-term climatic sta-bility (Platts et al. 2013; Weber et al. 2014; Cook, Hardy &Crisp 2015), while endemic richness on La Palma is highestin variable conditions. However, our study used measures ofclimatic variability on a short-term scale (in the range of sev-eral decades), not accounting for stability on geologic time-scales. This might indicate that long-term stability and short-term variability are not mutually exclusive; thus, time-scaleshave to be considered for climatic stability analyses.Although an intriguing concept due to its ability to inte-
grate different climatic factors into a single parameter, cli-matic rarity only has negligible effects on both speciesrichness and endemic richness. While climatic rarity has beenshown to be a good indicator of species’ range size and rarityon continental scales (Ohlem€uller et al. 2008), it seems of
© 2015 The Authors. Journal of Ecology © 2015 British Ecological Society, Journal of Ecology, 103, 1621–1633
1630 S. D. H. Irl et al.

only minor importance for richness and endemism on thelandscape scale of La Palma. Recent studies have shown thatrichness and species rarity have a complex relationship (e.g.Kreft, Sommer & Barthlott 2006; Hubbell 2013), which mightnot be as straightforward as previously assumed.
SPAT IAL PATTERN OF SPECIES RICHNESS, ENDEMIC
RICHNESS AND ENDEMICITY
The combined negative effect of both the elevation-temperaturegradient and annual solar radiation indicates that high speciesrichness is found in steep barrancos and coastal cliffs at low tomid-elevations because low temperatures and high solar radia-tion are stressful for plant growth (K€orner 2003). The main dri-vers of endemic richness on La Palma are topographiccomplexity, annual solar radiation and slope. Similar to speciesrichness, the highest values of endemic richness are found inthe steep barrancos, coastal cliffs and inner cliffs of the Calderade Taburiente (Fig. 3b,c), although without the trade wind-in-duced asymmetry shown for species richness. Earlier studieswere not able to identify such small-scale differences in ende-mic richness on the Canary Islands (e.g. Reyes-Betancort et al.2008).Highest values of endemicity are found at high elevations
but also in the barrancos and coastal cliffs at low elevationson the western dry side of the island (Fig. 3d,e). High solarradiation at high elevations might select for adequate adapta-tion, while impeding the existence of most species that areadapted to conditions of lower radiation (Anthelme &Dangles 2012). This decreases general species richness andfacilitates evolutionary adaptation processes, including ecolog-ical speciation of specialist endemics via UV-B radiation-in-duced mutagenesis (Flenley 2011). In addition, high UV-Bradiation is responsible for the evolution of characteristic life-forms in the high-elevation ecosystems. On La Palma, thisbecomes obvious in the presence of giant rosette plants suchas several representatives from the genus Echium, and mor-phological adaptations such as pubescence (e.g. Genista bene-hoavensis, Echium wildpretii subsp. trichosiphon, Plantagowebbii or Teline stenopetala subsp. sericea).Interestingly, hot spots of species richness, endemic rich-
ness and endemicity are spatially decoupled on the landscapescale. In consequence, to conserve the whole spectrum of bio-logical variation, it is obviously not enough to only focus onspecies richness as a measure of biodiversity on the continen-tal scale (Orme et al. 2005; Daru, Bank & Davies 2015) orthe island scale (Di Virgilio et al. 2014). Rather, it is impor-tant to employ conservation strategies for a wide range of dif-ferent habitats and various definitions of ‘hot spot’ toadequately cover and preserve the total breadth of speciesdiversity (Stohlgren et al. 2005; Daru, Bank & Davies 2015).
LOOKING BEYOND LA PALMA
While the isolation of oceanic islands has impeded the naturalcolonization of mammalian herbivores, there is virtually nooceanic island on the global scale without human-introduced
mammalian herbivores (Caujap�e-Castells et al. 2010). Thus,the identified importance of topography for the identificationof endemic hot spots may hint for a general importance of‘safe sites’ within islands, protecting endemic species fromintroduced herbivores.Similar to our results, highest percentages of endemic spe-
cies on continental mountains are found in topographicallycomplex areas (Verboom et al. 2015), often showing a strongincrease of endemicity with elevation (e.g. Vetaas & Grytnes2002; Nogu�e, Rull & Vegas-Vilarr�ubia 2013). Thus, ourresults support a seemingly global pattern found in topograph-ically complex regions, although we focus on the landscapescale of a single island. On continents, larger endemicity inhigh elevations may, however, not only be driven byenhanced local evolutionary processes (e.g. elevation-drivenisolation sensu Steinbauer et al. 2012), but also due to thesurvival of species widespread during times of colder climaticconditions (Tribsch & Sch€onswetter 2003). No matter whatthe underlying cause is, high-elevation areas should, as a con-sequence, be considered as high-priority sites for nature con-servation both on islands and on the continent.
Conclusion
We suggest that future studies (e.g. using environmental nichemodelling) need to acknowledge the effect of spatio-temporalclimate variability but also the equally important effect oftopography, especially on the distribution of species richnessand endemic richness (Platts et al. 2013). On the one hand,the general use of long-term means in modelling of climaticenvelops in the face of climate change has recently been criti-cized (Letten et al. 2013). On the other hand, models onlybased on climate will likely perform poorer than models thatalso include topographic components, highlighting the impor-tance of using both climate and topography. In addition, weargue that endemics might be more resilient towards ongoingclimate change than previously thought because of their pre-adaptation to variable precipitation conditions. However, thisneeds to be investigated in future studies explicitly targetingclimate change effects on islands (see Harter et al. 2015).In general, high-elevation islands such as La Palma offer
the opportunity to study continental-scale environmental gra-dients with high species turnover and clearly defined zonalecosystems on the landscape scale of a single island. Theseso-called climatic mini-continents host a large array of ende-mic species, which mainly evolved in situ under island condi-tions (especially SIEs; Whittaker, Triantis & Ladle 2008).Thus, high-elevation islands are optimally suited to providefurther insights into the fundamental drivers of diversity andendemism, even possessing the possibility to transfer thegained knowledge to non-island systems.
Acknowledgements
We would like to thank Dr. F�elix Medina (Consejer�ıa de Medio Ambientedel Cabildo Insular de La Palma), �Angel Palomares Mart�ınez and �AngelRebol�e (both National Park Caldera de Taburiente, La Palma), Karina for the
© 2015 The Authors. Journal of Ecology © 2015 British Ecological Society, Journal of Ecology, 103, 1621–1633
Plant diversity on a high-elevation island 1631

wonderful housing and Holiday Cars for all the support. Two anonymous ref-erees provided useful and constructive comments on the manuscript. We per-ceive no conflict of interests.
Data accessibility
All data used in this article are accessible in the Dryad Digital Repository. Fordetails, please see Irl et al. (2015).
References
Acebes Ginov�es, J.R., Le�on Arencibia, M.C., Rodr�ıguez Navarro, M.L., delArco Aguilar, M., Garc�ıa Gallo, A., de P�erez Paz, P.L., Rodr�ıguez Delgado,O., Mart�ın Osorio, V.E. & de Wildpret la Torre, W. (2010) Spermatophyta.Lista de especies silvestres de Canarias. Hongos, plantas y animales ter-restres. 2009. (eds M. Arechavaleta, S. Rodr�ıguez, N. Zurita & A. Garc�ıa).Gobierno de Canarias, Tenerife, pp. 122–172.
Anthelme, F. & Dangles, O. (2012) Plant–plant interactions in tropical alpineenvironments. Perspectives in Plant Ecology, Evolution and Systematics, 14,363–372.
del Arco Aguilar, M.J., Gonz�alez-Gonz�alez, R., Garz�on-Marchado, V. &Pizarro-Hern�andez, B. (2010) Actual and potential natural vegetation on theCanary Islands and its conservation status. Biodiversity and Conservation,19, 3089–3140.
Ashcroft, M.B., Gollan, J.R., Warton, D.I. & Ramp, D. (2012) A novelapproach to quantify and locate potential microrefugia using topoclimate, cli-mate stability, and isolation from the matrix. Global Change Biology, 18,1866–1879.
Beard, J.S., Chapman, A.R. & Gioia, P. (2008) Species richness and endemismin the Western Australian flora. Journal of Biogeography, 27, 1257–1268.
Bowen, L. & Van Vuren, D. (1997) Insular endemic plants lack defensesagainst herbivores. Conservation Biology, 11, 1249–1254.
Carracedo, H.C., P�erez Torrado, F.J., Ancochea, E., Meco, J., Hern�an, F.,Cubas, C.R., Casillas, R., Rodriguez, E. & Ahijado, A. (2002) Cenozoic vol-canism II: the Canary Islands. The Geology of Spain (eds W. Gibbons & T.Moreno), pp. 439–472. Geological Society, London.
Caujap�e-Castells, J., Tye, A., Crawford, D.J., Santos-Guerra, A., Sakai, A.,Beaver, K., Lobin, W., Florens, F.B.V., Moura, M., Jardim, R., G�omes, I. &Kueffer, C. (2010) Conservation of oceanic island floras: present and futureglobal challenges. Perspectives in Plant Ecology, Evolution and Systematics,12, 107–129.
Climent, J., Tapias, R., Pardos, J.A. & Gil, L. (2004) Fire adaptations in theCanary Islands pine (Pinus canariensis). Plant Ecology, 171, 185–196.
Cook, L.G., Hardy, N.B. & Crisp, M.D. (2015) Three explanations for biodi-versity hotspots: small range size, geographical overlap and time for speciesaccumulation. An Australian case study. New Phytologist, 207, 390–400.
Daru, B.H., Bank, M. & Davies, T.J. (2015) Spatial incongruence among hot-spots and complementary areas of tree diversity in southern Africa. Diversityand Distributions, 21, 769–780.
Dewar, R.E. & Richard, A.F. (2007) Evolution in the hypervariable environ-ment of Madagascar. Proceedings of the National Academy of Sciences ofthe United States of America, 104, 13723–13727.
Di Virgilio, G., Laffan, S.W., Ebach, M.C. & Chapple, D.G. (2014) Spatialvariation in the climatic predictors of species compositional turnover andendemism. Ecology and Evolution, 4, 3264–3278.
Dormann, C.F., McPherson, J.M., Ara�ujo, M.B., Bivand, R., Bolliger, J., Carl,G. et al. (2007) Methods to account for spatial autocorrelation in the analysisof species distributional data: a review. Ecography, 30, 609–628.
Dormann, C.F., Elith, J., Bacher, S., Buchmann, C., Carl, G., Carr�e, G. et al.(2013) Collinearity: a review of methods to deal with it and a simulationstudy evaluating their performance. Ecography, 36, 27–46.
Emerson, B.C. & Kolm, N. (2005) Species diversity can drive speciation. Na-ture, 434, 1015–1017.
Fjelds�a, J., Ehrlich, D., Lambin, E. & Prins, E. (1997) Are biodiversity ‘hot-spots’ correlated with current ecoclimatic stability? A pilot study using theNOAA-AVHRR remote sensing data. Biodiversity and Conservation, 6,401–422.
Flenley, J.R. (2011) Why is pollen yellow? And why are there so many speciesin the tropical rain forest? Journal of Biogeography, 38, 809–816.
Fløjgaard, C., Normand, S., Skov, F. & Svenning, J.C. (2011) Deconstructingthe mammal species richness pattern in Europe–towards an understanding ofthe relative importance of climate, biogeographic history, habitat heterogene-ity and humans. Global Ecology and Biogeography, 20, 218–230.
Garz�on-Machado, V., Otto, R. & del Arco Aguilar, M.J. (2014) Bioclimaticand vegetation mapping of a topographically complex oceanic island apply-ing different interpolation techniques. International Journal of Biometeorol-ogy, 58, 887–899.
Garz�on-Machado, V., Gonz�alez-Mancebo, J.M., Palomares-Mart�ınez, A.,Acevedo-Rodr�ıguez, A., Fern�andez-Palacios, J.M., Del-Arco-Aguilar, M. &P�erez-de-Paz, P.L. (2010) Strong negative effect of alien herbivores on ende-mic legumes of the Canary pine forest. Biological Conservation, 143, 2685–2694.
Giambelluca, T.W., Chen, Q., Frazier, A.G., Price, J.P., Chen, Y.-L., Chu,P.-S., Eischeid, J. & Delparte, D. (2011) The rainfall atlas of Hawai’i. http://rainfall.geography.hawaii.edu.
Gillespie, R.G., Claridge, E.M. & Roderick, G.K. (2008) Biodiversity dynamicsin isolated island communities: interaction between natural and human-medi-ated processes. Molecular Ecology, 17, 45–57.
Gillespie, R.G. & Roderick, G.K. (2014) Evolution: geology and climate drivediversification. Nature, 509, 297–298.
Grueber, C.E., Nakagawa, S., Laws, R.J. & Jamieson, I.G. (2011) Multimodelinference in ecology and evolution: challenges and solutions. Journal of Evo-lutionary Biology, 24, 699–711.
Harter, D.E.V., Irl, S.D.H., Seo, B., Steinbauer, M.J., Gillespie, R., Triantis,K.A:., Fern�andez-Palacios, J.M. & Beierkuhnlein, C. (2015) Impact of globalclimate change on the floras of oceanic islands – Projections, implicationsand current knowledge. Perspectives in Plant Ecology, Evolution and System-atics, 17, 160–183.
Harter, D.E.V., Thiv, M., Weig, A. Jentsch, A. & Beierkuhnlein C. (in press)Spatial and ecological population genetic structures within two island-ende-mic Aeonium species of different niche width. Ecology and Evolution, doi:10.1002/ece3.1682.
Hortal, J., Triantis, K.A., Meiri, S., Th�ebault, E. & Sfenthourakis, S. (2009) Is-land species richness increases with habitat diversity. The American Natural-ist, 174, 205–217.
Hortal, J., Carrascal, L.M., Triantis, K.A., Th�ebault, E., Meiri, S. &Sfenthourakis, S. (2013) Species richness can decrease with altitude but notwith habitat diversity. Proceedings of the National Academy of Sciences ofthe United States of America, 110, E2149–E2150.
Hua, X. & Wiens, J.J. (2013) How does climate influence speciation? TheAmerican Naturalist, 182, 1–12.
Hubbell, S.P. (2013) Tropical rain forest conservation and the twin challengesof diversity and rarity. Ecology and Evolution, 3, 3263–3274.
Irl, S.D.H. & Beierkuhnlein, C. (2011) Distribution of endemic plant species onan oceanic island – a geospatial analysis of La Palma (Canary Islands). Pro-cedia Environmental Sciences, 7, 170–175.
Irl, S.D.H., Steinbauer, M.J., Babel, W., Beierkuhnlein, C., Blume-Werry,G., Messinger, J., Palomares-Mart�ınez, �A., Strohmeier, S. & Jentsch, A.(2012) An 11-yr exclosure experiment in a high-elevation island ecosys-tem: introduced herbivore impact on shrub species richness, seedlingrecruitment and population dynamics. Journal of Vegetation Science, 23,1114–1125.
Irl, S.D.H., Steinbauer, M.J., Epperlein, L., Harter, D.E.V., Jentsch, A., P€atz,S., Wohlfahrt, C. & Beierkuhnlein, C. (2014a) The hitchhiker’s guide toisland endemism – biodiversity and endemic perennial plant species inroadside and surrounding vegetation. Biodiversity and Conservation, 23,2273–2287.
Irl, S.D.H., Steinbauer, M.J., Messinger, J., Blume-Werry, G., Palomares-Mart�ınez, �A., Beierkuhnlein, C. & Jentsch, A. (2014b) Burned and devoured– introduced herbivores, fire, and the endemic flora of the high-elevationecosystem on La Palma, Canary Islands. Arctic Antarctic and AlpineResearch, 46, 859–869.
Irl, S.D.H., Harter, D.E.V., Gallego Puyol, D., Fern�andez-Palacios, J.M.,Jentsch, A. & Beierkuhnlein, C. (2015) Data from: Climate vs. topography –spatial patterns of plant species diversity and endemism on a high-elevationisland. Dryad Digital Repository, http://dx.doi.org/10.5061/dryad.7sk2g.
Jenness, J.S. (2004) Calculating landscape surface area from digital elevationmodels. Wildlife Society Bulletin, 32, 29–839.
Johnson, J.B. & Omland, K.S. (2004) Model selection in ecology and evolu-tion. Trends in Ecology and Evolution, 19, 101–108.
Kier, G., Kreft, H., Lee, T.M., Jetz, W., Ibisch, P.L., Nowicki, C., Mutke, J. &Barthlott, W. (2009) A global assessment of endemism and species richnessacross island and mainland regions. Proceedings of the National Academy ofSciences of the United States of America, 106, 9322–9327.
Kisel, Y. & Barraclough, T.G. (2010) Speciation has a spatial scale thatdepends on levels of gene flow. The American Naturalist, 175, 316–334.
Kissling, W.D., Eiserhardt, W.L., Baker, W.J., Borchsenius, F., Couvreur, T.L.,Balslev, H. & Svenning, J.C. (2012) Cenozoic imprints on the phylogenetic
© 2015 The Authors. Journal of Ecology © 2015 British Ecological Society, Journal of Ecology, 103, 1621–1633
1632 S. D. H. Irl et al.

structure of palm species assemblages worldwide. Proceedings of theNational Academy of Sciences of the United States of America, 109,7379–7384.
K€orner, C. (2003) Alpine Plant Life: Functional Plant Ecology of High Moun-tain Ecosystems, 2nd edn. Springer, Basel.
Kreft, H., Sommer, J.H. & Barthlott, W. (2006) The significance of geographicrange size for spatial diversity patterns in Neotropical palms. Ecography, 29,21–30.
Legendre, P. (2008) Studying beta diversity: ecological variation partitioningby multiple regression and canonical analysis. Journal of Plant Ecology, 1,3–8.
Letten, A.D., Ashcroft, M.B., Keith, D.A., Gollan, J.R. & Ramp, D. (2013)The importance of temporal climate variability for spatial patterns in plantdiversity. Ecography, 36, 1341–1349.
Leutner, B.F., Steinbauer, M.J., M€uller, C.M., Fr€uh, A.J., Irl, S.D.H., Jentsch,A. & Beierkuhnlein, C. (2012) Mosses like it rough – growth form specificresponses of mosses, herbaceous and woody plants to micro-relief hetero-geneity. Diversity, 4, 59–73.
Mallet, B., Martos, F., Blambert, L., Pailler, T. & Humeau, L. (2014) Evidencefor isolation-by-habitat among populations of an epiphytic orchid species ona small oceanic island. PLoS ONE, 9, e87469.
Marzol, M.V., S�anchez, J.L. & Yanes, A. (2011) Meteorological patterns andfog water collection in Morocco and the Canary Islands. Erdkunde, 65,291–303.
M�edail, F. & Diadema, K. (2009) Glacial refugia influence plant diversity pat-terns in the Mediterranean Basin. Journal of Biogeography, 36, 1333–1345.
Mee, J.A. & Moore, J.S. (2014) The ecological and evolutionary implicationsof microrefugia. Journal of Biogeography, 41, 837–841.
Millington, J.D. & Perry, G.L. (2011) Multi-model inference in biogeography.Geography Compass, 5, 448–463.
Myers, N., Mittermeier, R.A., Mittermeier, C.G., Da Fonseca, G.A. & Kent, J.(2000) Biodiversity hotspots for conservation priorities. Nature, 403,853–858.
Nagelkerke, N.J. (1991) A note on a general definition of the coefficient ofdetermination. Biometrika, 78, 691–692.
Nogu�e, S., Rull, V. & Vegas-Vilarr�ubia, T. (2013) Elevational gradients in theneotropical table mountains: patterns of endemism and implications for con-servation. Diversity and Distributions, 19, 676–687.
Nosil, P. (2012) Ecological speciation. Oxford University Press, Oxford.Ohlem€uller, R., Anderson, B.J., Ara�ujo, M.B., Butchart, S.H.M., Kudrna, O.,Ridgely, R.S. & Thomas, C.D. (2008) The coincidence of climatic and spe-cies rarity: high risk to small-range species from climate change. Biology Let-ters, 4, 568–572.
Orme, C.D.L., Davies, R.G., Burgess, M., Eigenbrod, F., Pickup, N., Olson,V.A. et al. (2005) Global hotspots of species richness are not congruent withendemism or threat. Nature, 436, 1016–1019.
Platts, P.J., Gereau, R.E., Burgess, N.D. & Marchant, R. (2013) Spatial hetero-geneity of climate change in an Afromontane centre of endemism. Ecogra-phy, 36, 518–530.
Possingham, H.P. & Wilson, K.A. (2005) Biodiversity: turning up the heat onhotspots. Nature, 436, 919–920.
R Core Team (2013) R: A Language and Environment for Statistical Comput-ing. R Foundation for Statistical Computing, Vienna. http://www.R-pro-ject.org/.
Reyes-Betancort, J.A., Santos-Guerra, A., Guma, I.R., Humphries, C.J. & Car-ine, M.A. (2008) Diversity, rarity and the evolution and conservation of theCanary Islands endemic flora. Anales del Jard�ın Bot�anico de Madrid, 65,25–45.
Richardson, D.M. & Whittaker, R.J. (2010) Conservation biogeography – foun-dations, concepts and challenges. Diversity and Distributions, 16, 313–320.
Rosenzweig, M.L. (1995) Species diversity in space and time. CambridgeUniversity Press, Cambridge.
Shmida, A. & Werger, M. (1992) Growth form diversity on the Canary Islands.Vegetatio, 102, 183–199.
Slaton, M.R. (2015) The roles of disturbance, topography and climate in deter-mining the leading and rear edges of population range limits. Journal of Bio-geography, 42, 255–266.
Steinbauer, M.J., Irl, S.D.H. & Beierkuhnlein, C. (2013b) Elevation-driven eco-logical isolation promotes diversification on Mediterranean islands. ActaOecologica, 47, 52–56.
Steinbauer, M.J., Otto, R., Naranjo-Cigala, A., Beierkuhnlein, C. & Fern�andez-Palacios, J.M. (2012) Increase of island endemism with altitude – speciationprocesses on oceanic islands. Ecography, 35, 23–32.
Steinbauer, M.J., Dolos, K., Field, R., Reineking, B. & Beierkuhnlein, C.(2013a) Re-evaluating the general dynamic theory of oceanic island biogeog-raphy. Frontiers in Biogeography, 5, 185–194.
Stohlgren, T.J., Guenther, D.A., Evangelista, P.H. & Alley, N. (2005) Patternsof plant species richness, rarity, endemism, and uniqueness in an arid land-scape. Ecological Applications, 15, 715–725.
Tribsch, A. & Sch€onswetter, P. (2003) Patterns of endemism and comparativephylogeography confirm palaeoenvironmental evidence for Pleistocene refu-gia in the Eastern Alps. Taxon, 52, 477–497.
Trigas, P., Panitsa, M. & Tsiftsis, S. (2013) Elevational gradient of vascularplant species richness and endemism in Crete – the effect of post-isolationmountain uplift on a continental island system. PLoS ONE, 8, e59425.
Verboom, G.A., Bergh, N.G., Haiden, S.A., Hoffmann, V. & Britton, M.N.(2015) Topography as a driver of diversification in the Cape Floristic Regionof South Africa. New Phytologist, 207, 368–376.
Vetaas, O.R. & Grytnes, J.A. (2002) Distribution of vascular plant species rich-ness and endemic richness along the Himalayan elevation gradient in Nepal.Global Ecology and Biogeography, 11, 291–301.
Walmsley, J.L., Schemenauer, R.S. & Bridgman, H.A. (1996) A method forestimating the hydrologic input from fog in mountainous terrain. Journal ofApplied Meteorology, 35, 2237–2249.
Walsh, R.P.D. & Lawler, D.M. (1981) Rainfall seasonality: description, spatialpatterns and change through time. Weather, 36, 201–208.
Weber, L.C., VanDerWal, J., Schmidt, S., McDonald, W.J. & Shoo, L.P.(2014) Patterns of rain forest plant endemism in subtropical Australia relateto stable mesic refugia and species dispersal limitations. Journal of Biogeog-raphy, 41, 222–238.
Weigelt, P., Jetz, W. & Kreft, H. (2013) Bioclimatic and physical characteriza-tion of the world’s islands. Proceedings of the National Academy of Sciencesof the United States of America, 110, 15307–15312.
Whittaker, R.J. & Fern�andez-Palacios, J.M. (2007) Island biogeography – Ecol-ogy, evolution, and conservation, 2nd edn. Oxford University Press, Oxford.
Whittaker, R.J., Triantis, K.A. & Ladle, R.J. (2008) A general dynamic theoryof oceanic island biogeography. Journal of Biogeography, 35, 977–994.
Received 21 January 2015; accepted 7 August 2015Handling Editor: Jennifer Lau
Supporting Information
Additional Supporting Information may be found in the online ver-sion of this article:
Table S1. List of all species identified in this study.
Figure S1 Map of meteorological stations used for interpolatingclimate data.
Table S2. Bivariate correlation matrix of environmental variables.
Table S3. Table of best fitting transformations for MLR.
Table S4. Table of AICc values of transformations.
Table S5. Table of absolute values of variance partitioning.
© 2015 The Authors. Journal of Ecology © 2015 British Ecological Society, Journal of Ecology, 103, 1621–1633
Plant diversity on a high-elevation island 1633
Copyright © 2022 FDOKUMEN