Climate Variability and Change in Bihar, India - MDPI
22
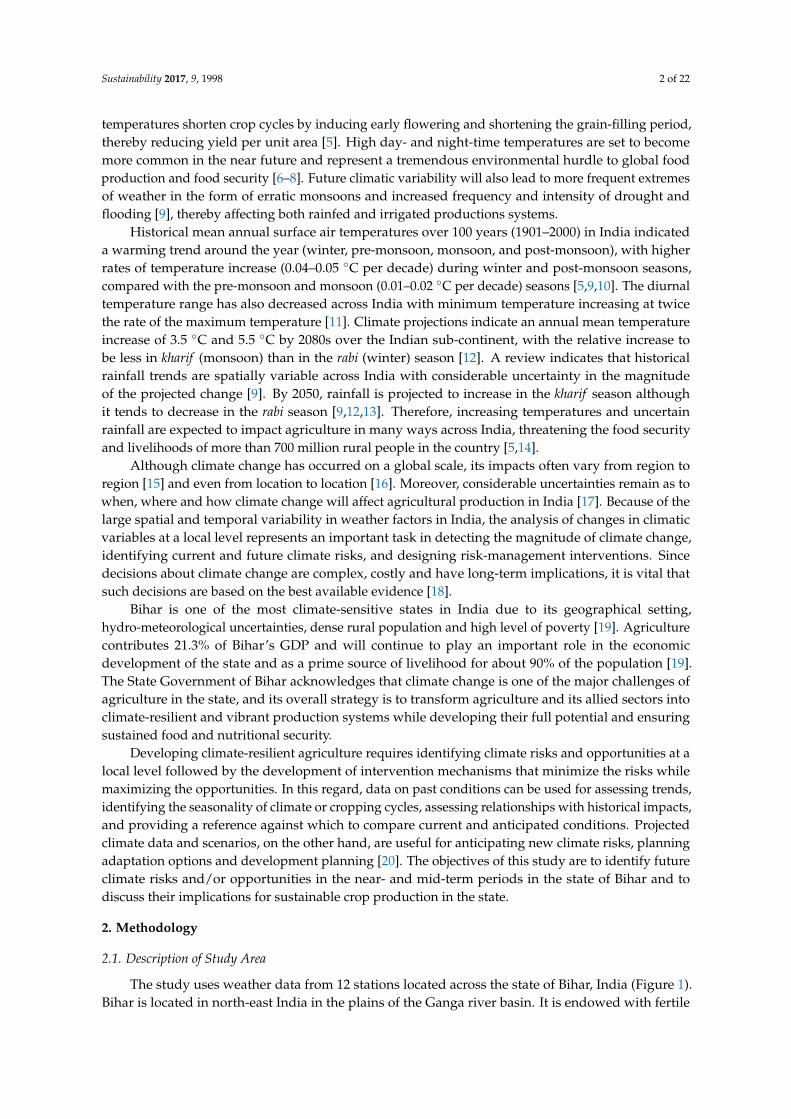
sustainability Article Climate Variability and Change in Bihar, India: Challenges and Opportunities for Sustainable Crop Production Kindie Tesfaye 1, * ID , Pramod K. Aggarwal 2 , Fasil Mequanint 3 ID , Paresh B. Shirsath 2 ID , Clare M. Stirling 4 ID , Arun Khatri-Chhetri 2 ID and Dil Bahadur Rahut 4 1 International Maize and Wheat Improvement Center (CIMMYT), P.O. Box 5689, Addis Ababa, Ethiopia 2 CGIAR Research Program on Climate Change, Agriculture and Food Security (CCAFS), Borlaug Institute for South Asia (BISA), International Maize and Wheat Improvement Centre (CIMMYT), New Delhi 110012, India; [email protected] (P.K.A.); [email protected] (P.B.S.); [email protected] (A.K.-C.) 3 Ethiopian Agricultural Research Institute (EIAR), P.O. Box 2003, Addis Ababa, Ethiopia; [email protected] 4 International Maize and Wheat Improvement Center (CIMMYT), El Batan 06600, Mexico; [email protected] (C.M.S.); [email protected] (D.B.R.) * Correspondence: [email protected]; Tel.: +251-(11)-6462324 Received: 26 August 2017; Accepted: 20 October 2017; Published: 1 November 2017 Abstract: Climate change and associated uncertainties have serious direct and indirect consequences for crop production and food security in agriculture-based developing regions. Long-term climate data analysis can identify climate risks and anticipate new ones for planning appropriate adaptation and mitigation options. The aim of this study was to identify near-term (2030) and mid-term (2050) climate risks and/or opportunities in the state of Bihar, one of India’s most populous and poorest states, using weather data for 30 years (1980–2009) as a baseline. Rainfall, maximum and minimum temperatures, and evapotranspiration will all increase in the near- and mid-term periods relative to the baseline period, with the magnitude of the change varying with time, season and location within the state. Bihar’s major climate risks for crop production will be heat stress due to increasing minimum temperatures in the rabi (winter) season and high minimum and maximum temperatures in the spring season; and intense rainfall and longer dry spells in the kharif (monsoon) season. The increase in annual and seasonal rainfall amounts, and extended crop growing period in the kharif season generally provide opportunities; but increasing temperature across the state will have considerable negative consequences on (staple) crops by affecting crop phenology, physiology and plant-water relations. The study helps develop site-specific adaptation and mitigation options that minimize the negative effects of climate change while maximizing the opportunities. Keywords: Bihar; climate analysis; climate change; India; crop production 1. Introduction Climate change threatens sustainable development in South Asia given the potential vulnerability associated with high population density, poverty, and limited resources for adaptation. Climate change is, thereby, set to cause huge economic, social, and environmental damage across the region, compromising growth potential and poverty-reduction efforts [1]. Agriculture is extremely vulnerable, as any change in climate influences crop growth and yield, hydrologic balances, supplies of inputs and other management practices [2]. Climate change effects on agriculture are manifold: changes in average temperatures, rainfall, and weather extremes; changes in pests and diseases conditions; changes in the nutritional quality of foods; and changes in sea level, among others [3,4]. Higher Sustainability 2017, 9, 1998; doi:10.3390/su9111998 www.mdpi.com/journal/sustainability
-
Upload
khangminh22 -
Category
Documents
-
view
2 -
download
0
Transcript of Climate Variability and Change in Bihar, India - MDPI
sustainability
Article
Climate Variability and Change in Bihar, India:Challenges and Opportunities for SustainableCrop Production
Kindie Tesfaye 1,* ID , Pramod K. Aggarwal 2, Fasil Mequanint 3 ID , Paresh B. Shirsath 2 ID ,Clare M. Stirling 4 ID , Arun Khatri-Chhetri 2 ID and Dil Bahadur Rahut 4
1 International Maize and Wheat Improvement Center (CIMMYT), P.O. Box 5689, Addis Ababa, Ethiopia2 CGIAR Research Program on Climate Change, Agriculture and Food Security (CCAFS), Borlaug Institute for
South Asia (BISA), International Maize and Wheat Improvement Centre (CIMMYT), New Delhi 110012,India; [email protected] (P.K.A.); [email protected] (P.B.S.); [email protected] (A.K.-C.)
3 Ethiopian Agricultural Research Institute (EIAR), P.O. Box 2003, Addis Ababa, Ethiopia;[email protected]
4 International Maize and Wheat Improvement Center (CIMMYT), El Batan 06600, Mexico;[email protected] (C.M.S.); [email protected] (D.B.R.)
* Correspondence: [email protected]; Tel.: +251-(11)-6462324
Received: 26 August 2017; Accepted: 20 October 2017; Published: 1 November 2017
Abstract: Climate change and associated uncertainties have serious direct and indirect consequencesfor crop production and food security in agriculture-based developing regions. Long-term climatedata analysis can identify climate risks and anticipate new ones for planning appropriate adaptationand mitigation options. The aim of this study was to identify near-term (2030) and mid-term (2050)climate risks and/or opportunities in the state of Bihar, one of India’s most populous and pooreststates, using weather data for 30 years (1980–2009) as a baseline. Rainfall, maximum and minimumtemperatures, and evapotranspiration will all increase in the near- and mid-term periods relativeto the baseline period, with the magnitude of the change varying with time, season and locationwithin the state. Bihar’s major climate risks for crop production will be heat stress due to increasingminimum temperatures in the rabi (winter) season and high minimum and maximum temperaturesin the spring season; and intense rainfall and longer dry spells in the kharif (monsoon) season.The increase in annual and seasonal rainfall amounts, and extended crop growing period in thekharif season generally provide opportunities; but increasing temperature across the state will haveconsiderable negative consequences on (staple) crops by affecting crop phenology, physiology andplant-water relations. The study helps develop site-specific adaptation and mitigation options thatminimize the negative effects of climate change while maximizing the opportunities.
Keywords: Bihar; climate analysis; climate change; India; crop production
1. Introduction
Climate change threatens sustainable development in South Asia given the potential vulnerabilityassociated with high population density, poverty, and limited resources for adaptation. Climatechange is, thereby, set to cause huge economic, social, and environmental damage across the region,compromising growth potential and poverty-reduction efforts [1]. Agriculture is extremely vulnerable,as any change in climate influences crop growth and yield, hydrologic balances, supplies of inputsand other management practices [2]. Climate change effects on agriculture are manifold: changesin average temperatures, rainfall, and weather extremes; changes in pests and diseases conditions;changes in the nutritional quality of foods; and changes in sea level, among others [3,4]. Higher
Sustainability 2017, 9, 1998; doi:10.3390/su9111998 www.mdpi.com/journal/sustainability
Sustainability 2017, 9, 1998 2 of 22
temperatures shorten crop cycles by inducing early flowering and shortening the grain-filling period,thereby reducing yield per unit area [5]. High day- and night-time temperatures are set to becomemore common in the near future and represent a tremendous environmental hurdle to global foodproduction and food security [6–8]. Future climatic variability will also lead to more frequent extremesof weather in the form of erratic monsoons and increased frequency and intensity of drought andflooding [9], thereby affecting both rainfed and irrigated productions systems.
Historical mean annual surface air temperatures over 100 years (1901–2000) in India indicateda warming trend around the year (winter, pre-monsoon, monsoon, and post-monsoon), with higherrates of temperature increase (0.04–0.05 ◦C per decade) during winter and post-monsoon seasons,compared with the pre-monsoon and monsoon (0.01–0.02 ◦C per decade) seasons [5,9,10]. The diurnaltemperature range has also decreased across India with minimum temperature increasing at twicethe rate of the maximum temperature [11]. Climate projections indicate an annual mean temperatureincrease of 3.5 ◦C and 5.5 ◦C by 2080s over the Indian sub-continent, with the relative increase tobe less in kharif (monsoon) than in the rabi (winter) season [12]. A review indicates that historicalrainfall trends are spatially variable across India with considerable uncertainty in the magnitudeof the projected change [9]. By 2050, rainfall is projected to increase in the kharif season althoughit tends to decrease in the rabi season [9,12,13]. Therefore, increasing temperatures and uncertainrainfall are expected to impact agriculture in many ways across India, threatening the food securityand livelihoods of more than 700 million rural people in the country [5,14].
Although climate change has occurred on a global scale, its impacts often vary from region toregion [15] and even from location to location [16]. Moreover, considerable uncertainties remain as towhen, where and how climate change will affect agricultural production in India [17]. Because of thelarge spatial and temporal variability in weather factors in India, the analysis of changes in climaticvariables at a local level represents an important task in detecting the magnitude of climate change,identifying current and future climate risks, and designing risk-management interventions. Sincedecisions about climate change are complex, costly and have long-term implications, it is vital thatsuch decisions are based on the best available evidence [18].
Bihar is one of the most climate-sensitive states in India due to its geographical setting,hydro-meteorological uncertainties, dense rural population and high level of poverty [19]. Agriculturecontributes 21.3% of Bihar’s GDP and will continue to play an important role in the economicdevelopment of the state and as a prime source of livelihood for about 90% of the population [19].The State Government of Bihar acknowledges that climate change is one of the major challenges ofagriculture in the state, and its overall strategy is to transform agriculture and its allied sectors intoclimate-resilient and vibrant production systems while developing their full potential and ensuringsustained food and nutritional security.
Developing climate-resilient agriculture requires identifying climate risks and opportunities at alocal level followed by the development of intervention mechanisms that minimize the risks whilemaximizing the opportunities. In this regard, data on past conditions can be used for assessing trends,identifying the seasonality of climate or cropping cycles, assessing relationships with historical impacts,and providing a reference against which to compare current and anticipated conditions. Projectedclimate data and scenarios, on the other hand, are useful for anticipating new climate risks, planningadaptation options and development planning [20]. The objectives of this study are to identify futureclimate risks and/or opportunities in the near- and mid-term periods in the state of Bihar and todiscuss their implications for sustainable crop production in the state.
2. Methodology
2.1. Description of Study Area
The study uses weather data from 12 stations located across the state of Bihar, India (Figure 1).Bihar is located in north-east India in the plains of the Ganga river basin. It is endowed with fertile
Sustainability 2017, 9, 1998 3 of 22
alluvial soil with abundant water resources, especially groundwater resources. Bihar has a geographicalarea of 9,360,000 hectares with three important agro-climatic zones: North-West, North-East, andSouth. The North-West zone has 13 districts and receives an annual rainfall of 1040–1450 mm. The soilis mostly loam and sandy loam. The North-East Zone has 8 districts and receives rainfall ranging from1200–1700 mm, and has loam and clay loam soils. The South Zone has 17 districts, receives an averageannual rainfall of 990–1300 mm, and has sandy loam, loam, clay, and clay loam soils [19].
Rice, wheat, and maize are the major cereal crops. Rice is the main monsoon crop and is cultivatedin all districts of Bihar. Wheat was increasingly planted by Bihari farmers after the green revolution,and it currently occupies the status of major crop of the rabi season. Maize is also cultivated, withan average annual production level of approximately 1.5 million tons and a steady positive trend inproduction. Pulses such as mung bean, peas, and lentil are mostly grown in the southern parts ofBihar [19].
Sustainability 2017, 9, 1998 3 of 22
2. Methodology
2.1. Description of Study Area
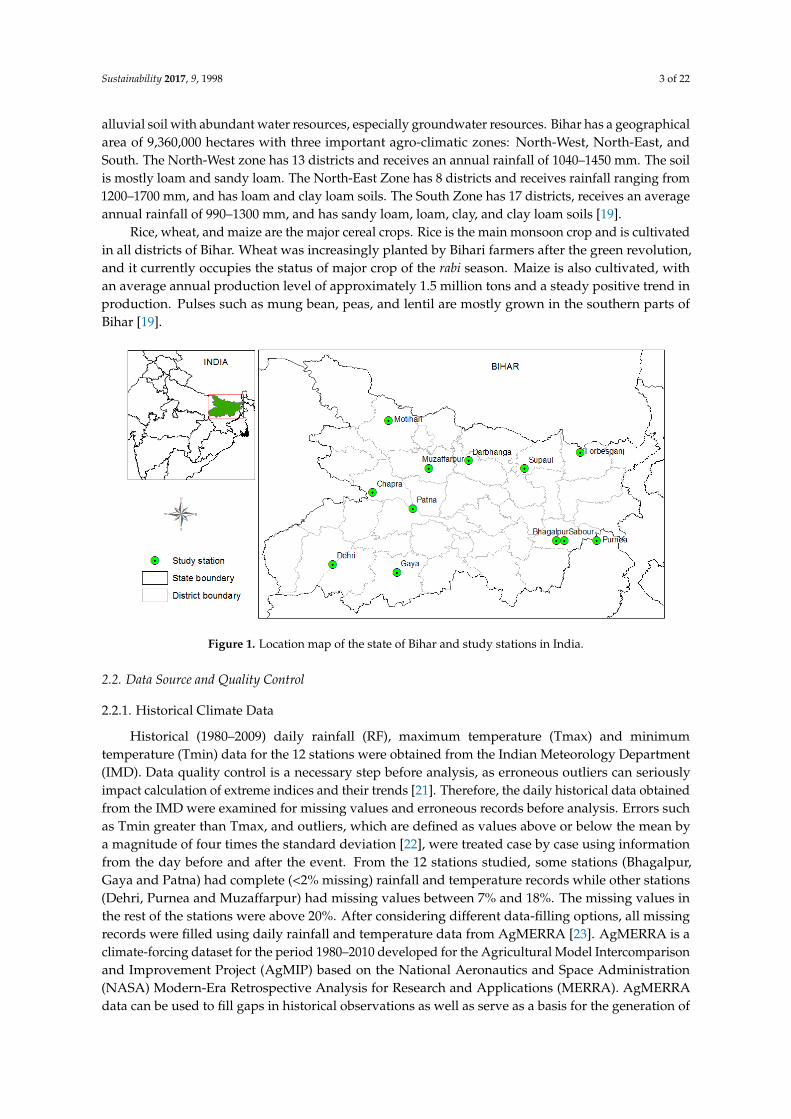
The study uses weather data from 12 stations located across the state of Bihar, India (Figure 1). Bihar is located in north-east India in the plains of the Ganga river basin. It is endowed with fertile alluvial soil with abundant water resources, especially groundwater resources. Bihar has a geographical area of 9,360,000 hectares with three important agro-climatic zones: North-West, North-East, and South. The North-West zone has 13 districts and receives an annual rainfall of 1040–1450 mm. The soil is mostly loam and sandy loam. The North-East Zone has 8 districts and receives rainfall ranging from 1200–1700 mm, and has loam and clay loam soils. The South Zone has 17 districts, receives an average annual rainfall of 990–1300 mm, and has sandy loam, loam, clay, and clay loam soils [19].
Rice, wheat, and maize are the major cereal crops. Rice is the main monsoon crop and is cultivated in all districts of Bihar. Wheat was increasingly planted by Bihari farmers after the green revolution, and it currently occupies the status of major crop of the rabi season. Maize is also cultivated, with an average annual production level of approximately 1.5 million tons and a steady positive trend in production. Pulses such as mung bean, peas, and lentil are mostly grown in the southern parts of Bihar [19].
Figure 1. Location map of the state of Bihar and study stations in India.
2.2. Data Source and Quality Control
2.2.1. Historical Climate Data
Historical (1980–2009) daily rainfall (RF), maximum temperature (Tmax) and minimum temperature (Tmin) data for the 12 stations were obtained from the Indian Meteorology Department (IMD). Data quality control is a necessary step before analysis, as erroneous outliers can seriously impact calculation of extreme indices and their trends [21]. Therefore, the daily historical data obtained from the IMD were examined for missing values and erroneous records before analysis. Errors such as Tmin greater than Tmax, and outliers, which are defined as values above or below the mean by a magnitude of four times the standard deviation [22], were treated case by case using information from the day before and after the event. From the 12 stations studied, some stations (Bhagalpur, Gaya and Patna) had complete (<2% missing) rainfall and temperature records while other stations (Dehri, Purnea and Muzaffarpur) had
Figure 1. Location map of the state of Bihar and study stations in India.
2.2. Data Source and Quality Control
2.2.1. Historical Climate Data
Historical (1980–2009) daily rainfall (RF), maximum temperature (Tmax) and minimumtemperature (Tmin) data for the 12 stations were obtained from the Indian Meteorology Department(IMD). Data quality control is a necessary step before analysis, as erroneous outliers can seriouslyimpact calculation of extreme indices and their trends [21]. Therefore, the daily historical data obtainedfrom the IMD were examined for missing values and erroneous records before analysis. Errors suchas Tmin greater than Tmax, and outliers, which are defined as values above or below the mean bya magnitude of four times the standard deviation [22], were treated case by case using informationfrom the day before and after the event. From the 12 stations studied, some stations (Bhagalpur,Gaya and Patna) had complete (<2% missing) rainfall and temperature records while other stations(Dehri, Purnea and Muzaffarpur) had missing values between 7% and 18%. The missing values inthe rest of the stations were above 20%. After considering different data-filling options, all missingrecords were filled using daily rainfall and temperature data from AgMERRA [23]. AgMERRA is aclimate-forcing dataset for the period 1980–2010 developed for the Agricultural Model Intercomparisonand Improvement Project (AgMIP) based on the National Aeronautics and Space Administration(NASA) Modern-Era Retrospective Analysis for Research and Applications (MERRA). AgMERRAdata can be used to fill gaps in historical observations as well as serve as a basis for the generation of
Sustainability 2017, 9, 1998 4 of 22
future climate scenarios [23]. The AgMERRA data was evaluated by comparing it with observed datafrom Patna station which has complete records, and it was found that there was a good agreement(R2 ≥ 0.987) between the AgMERRA dataset and observed records.
After filling missing records, possible non-homogeneities in the data were assessed by visualexamination of the plots’ annual rainfall and temperature data followed by a statistical test usingStudent’s t test at each station [24]. Both the visual examination and statistical test showed no breakpoints in the time series.
2.2.2. Future Climate Data
Future daily RF, Tmax and Tmin data for two future 30-year periods, centered at 2030 (2010–2039)and 2050 (2040–2069), were downscaled from 20 general circulation models (GCMs) which are amongthose GCMs that have been used by the Intergovernmental Panel on Climate Change (IPCC) to produceits fifth assessment report, AR5 [25]. GCMs are climate models that project into the future and are themost advanced tools currently available for simulating the response of the global climate system toincreasing greenhouse gas concentrations. The 20 GCMs were selected based on availability of data forthe two (4.5 and 8.5) representative concentration pathways (RCPs) used in this study. The RCPs arefour greenhouse gas concentration (not emissions) trajectories adopted by the IPCC for its AR5. Thefour RCPs: RCP2.6, RCP4.5, RCP6.0, and RCP8.5 are named after a possible range of radiative forcingvalues of 2.6, 4.5, 6.0, and 8.5 Wm−1 in the year 2100, respectively [25].
2.3. Data Analysis
2.3.1. Annual and Seasonal Analysis
Analysis of RF, Tmax and Tmin was carried out on annual, seasonal, and monthly timescalesfor the baseline (1980–2009), 2030 and 2050 periods. The three seasons considered in this studywere pre-monsoon (February–May), monsoon or kharif (June–September), and post-monsoon or rabi(October–January). Descriptive statistics were used to derive annual, seasonal and monthly summariesfrom the daily data, and relative changes were calculated to compare changes between the baselineand projected climates. Rainfall onset, cessation and length of growing period were determined forthe monsoon season (June–September). Similar to previous studies [26], the onset of the rains in themonsoon season was defined in this study as the first occasion after 1 June when the rainfall thataccumulated in 3 consecutive days was at least 20 mm, with no dry spells of more than 10 days in thenext 30 days. The daily rainfall data was processed to give maximum dry-spell lengths in the next30-day periods, starting from the onset of rain for each site, and dry-spell lengths exceeding 5, 7, 10, 15and 20 days over the next 30 days from planting were calculated to get an overview of the droughtcondition during the crop-growing period. The cessation of the rains was taken as the date after 15September following which no rain occurs over a period of 20 days [26]. The length of the growingseason was calculated as the difference between rainfall onset and cessation dates.
Reference evapotranspiration (ET) was calculated from daily maximum and minimumtemperatures using the ‘evapotranspiration’ package in R [27] following the method of Hargreavesand Samani [28].
2.3.2. Trend Analysis
The climatic data from all stations were subjected to an auto-correlation test for the purpose ofdeciding appropriate trend analysis methods. Since there were no auto-correlations detected, thenon-parametric Mann–Kendall (MK) test along with Sen’s slope estimator [29] was used to examinerainfall and temperature trends and their magnitudes. The MK test is a rank-based procedure suitablefor detecting a non-linear trend [30].
Sustainability 2017, 9, 1998 5 of 22
2.4. Presentation of Data
The data are presented at different spatial (site and state) and temporal (baseline, 2030 and 2050)scales. Whilst most of the data are presented at site level, some of the data are presented at state levelwhenever geographical aggregation is more meaningful than site-level comparison. The data are alsopresented in a way that shows the temporal changes between the three climate periods and the twoRCPs. However, whenever the results are similar between the two RCPs, data are presented only forRCP8.5 (business-as-usual scenario) to avoid congestion of data in tables and figures.
3. Results
3.1. Changes in Annual and Seasonal Rainfall Amounts
A projection of rainfall in 2030 and 2050 under the two RCPs indicates an increase in annual andseasonal totals across Bihar. The annual total rainfall in the baseline period ranges from 1036 mm to1625 mm across stations with an average value of 1225 mm. The average annual rainfall total acrossthe studied stations is projected to increase by 6–7% in 2030 and 12% in 2050 (Figure 2).
Sustainability 2017, 9, 1998 5 of 22
2.3.2. Trend Analysis
The climatic data from all stations were subjected to an auto-correlation test for the purpose of deciding appropriate trend analysis methods. Since there were no auto-correlations detected, the non-parametric Mann–Kendall (MK) test along with Sen’s slope estimator [29] was used to examine rainfall and temperature trends and their magnitudes. The MK test is a rank-based procedure suitable for detecting a non-linear trend [30].
2.4. Presentation of Data
The data are presented at different spatial (site and state) and temporal (baseline, 2030 and 2050) scales. Whilst most of the data are presented at site level, some of the data are presented at state level whenever geographical aggregation is more meaningful than site-level comparison. The data are also presented in a way that shows the temporal changes between the three climate periods and the two RCPs. However, whenever the results are similar between the two RCPs, data are presented only for RCP8.5 (business-as-usual scenario) to avoid congestion of data in tables and figures.
3. Results
3.1. Changes in Annual and Seasonal Rainfall Amounts
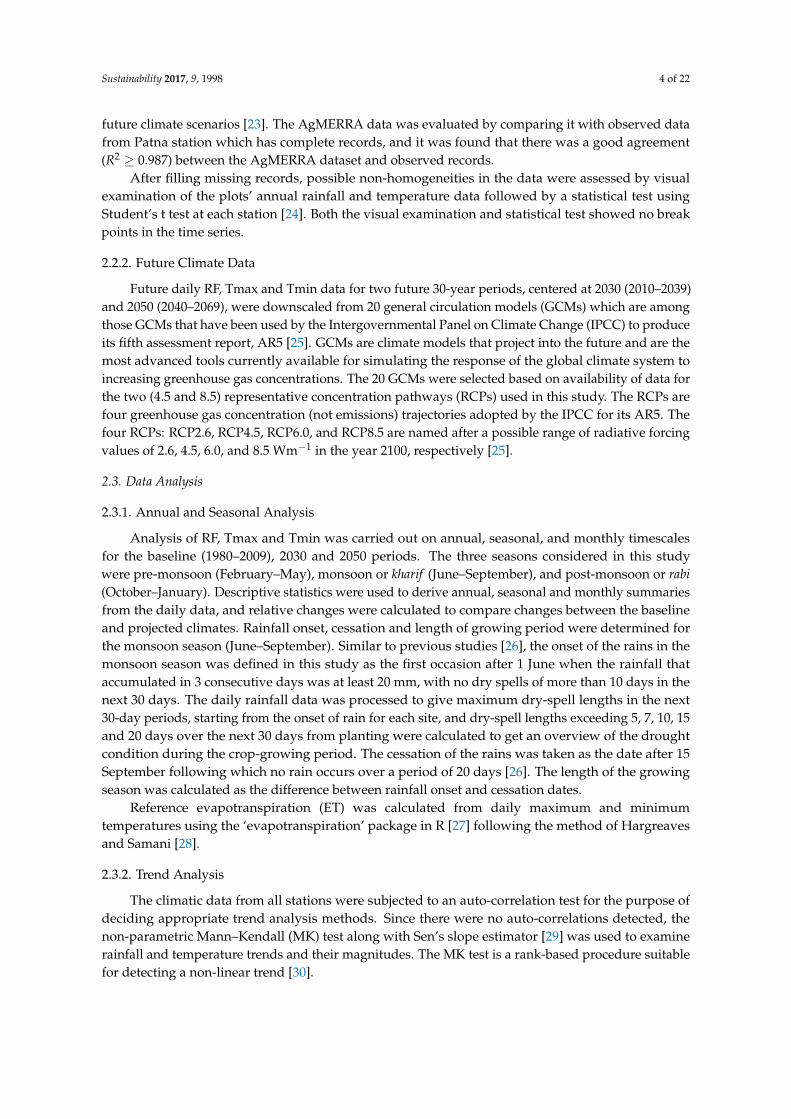
A projection of rainfall in 2030 and 2050 under the two RCPs indicates an increase in annual and seasonal totals across Bihar. The annual total rainfall in the baseline period ranges from 1036 mm to 1625 mm across stations with an average value of 1225 mm. The average annual rainfall total across the studied stations is projected to increase by 6–7% in 2030 and 12% in 2050 (Figure 2).
Figure 2. Annual and seasonal relative changes in rainfall in 2030 and 2050 under two representative concentration pathways (RCPs) across the state of Bihar. Vertical error bars indicate standard deviations.
The seasonal rainfall (4-month periods) total in the baseline period ranges from 54–215 mm, 882–1305 mm and 66–120 mm, with an average seasonal total of 117 mm, 1020 mm and 87 mm for February–May (FMAM), June–September (JJAS) and October–January (ONDJ), respectively. The average seasonal total rainfall is projected to increase by 12–20%, 4–6% and 8–10% in 2030 and 12–16%, 11–12% and 9–15%
Figure 2. Annual and seasonal relative changes in rainfall in 2030 and 2050 under two representativeconcentration pathways (RCPs) across the state of Bihar. Vertical error bars indicate standard deviations.
The seasonal rainfall (4-month periods) total in the baseline period ranges from 54–215 mm,882–1305 mm and 66–120 mm, with an average seasonal total of 117 mm, 1020 mm and 87 mm forFebruary–May (FMAM), June–September (JJAS) and October–January (ONDJ), respectively. Theaverage seasonal total rainfall is projected to increase by 12–20%, 4–6% and 8–10% in 2030 and 12–16%,11–12% and 9–15% in 2050 in the FMAM, JJAS and ONDJ seasons, respectively (Figure 2). Althoughthe absolute increases are very small compared to the JJAS season, the relative increases in seasonalrainfall are higher in the FMAM season followed by the ONDJ season. Moreover, unlike the JJASand ONDJ seasons, the increase in seasonal rainfall in the FMAM season is higher under RCP4.5than RCP8.5 in both 2030 and 2050 (Figure 2), indicating that the low-emission scenario could triggerhigh-rainfall conditions during the hottest part of the season.
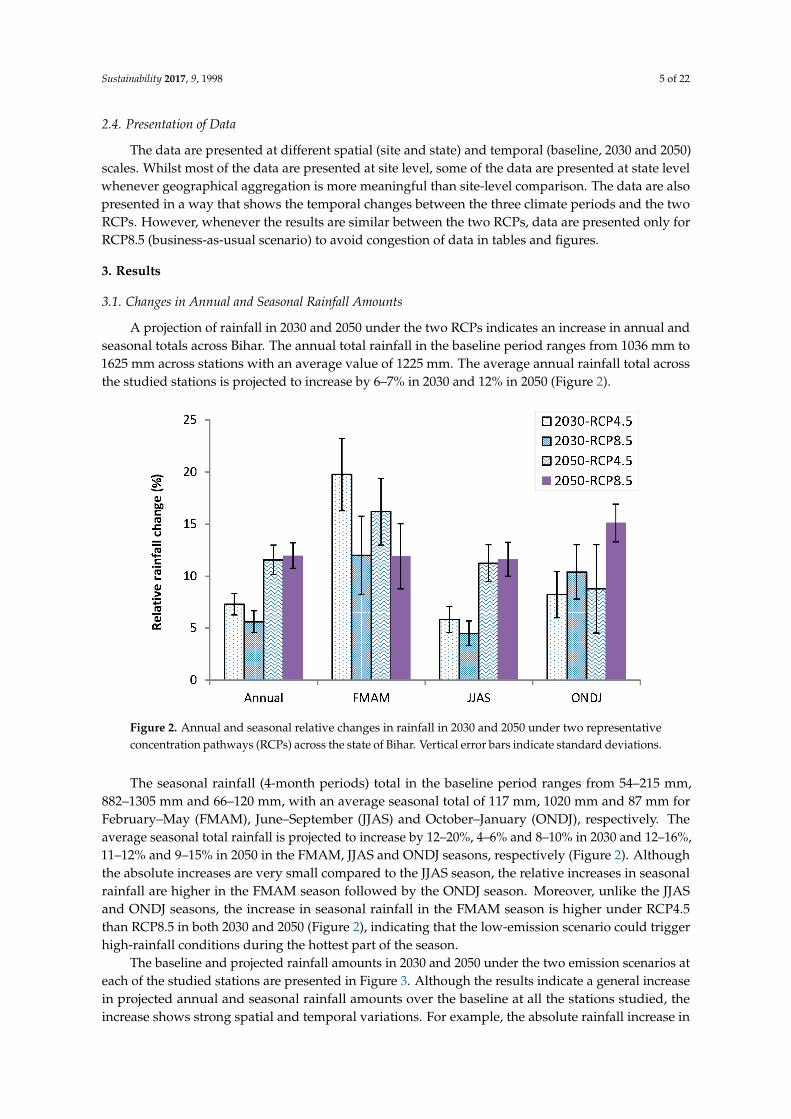
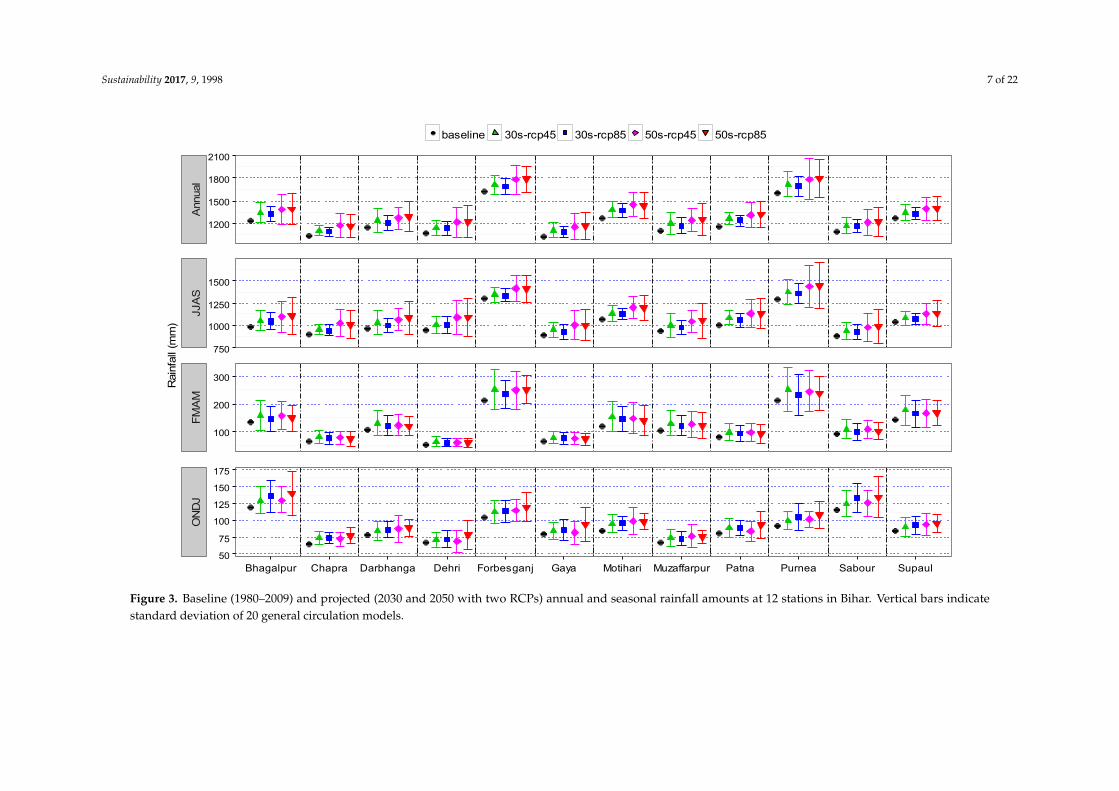
The baseline and projected rainfall amounts in 2030 and 2050 under the two emission scenarios ateach of the studied stations are presented in Figure 3. Although the results indicate a general increasein projected annual and seasonal rainfall amounts over the baseline at all the stations studied, theincrease shows strong spatial and temporal variations. For example, the absolute rainfall increase in
Sustainability 2017, 9, 1998 6 of 22
both 2030 and 2050 is lower at Chapra, Dehri, Gaya and Supaul but it is higher at Darbhanga, Motihari,Patna and Purnea. Season-wise, the JJAS will have the highest absolute increase in rainfall amountcompared to the FMAM and ONDJ seasons in both 2030 and 2050. The stations that will experiencehigher increases in FMAM rainfall in both 2030 and 2050 are Forbesganj and Purnea; while the stationswith higher increases in the ONDJ season are Bhagalpur, Forbesganj, Purnea and Sabour (Figure 3).Comparison of the rainfall changes in the two future periods studied indicate that increases in rainfallin 2050 may be higher than that of 2030 in the JJAS season, but remain similar in the FMAM and ONDJseasons at all stations. There is no significant difference between the emission scenarios considered inboth 2030 and 2050, although RCP4.5 tends to give higher rainfall conditions than RCP8.5 in 2030 atmost of the stations (Figure 3).
3.2. Changes in Daily Rainfall Intensity
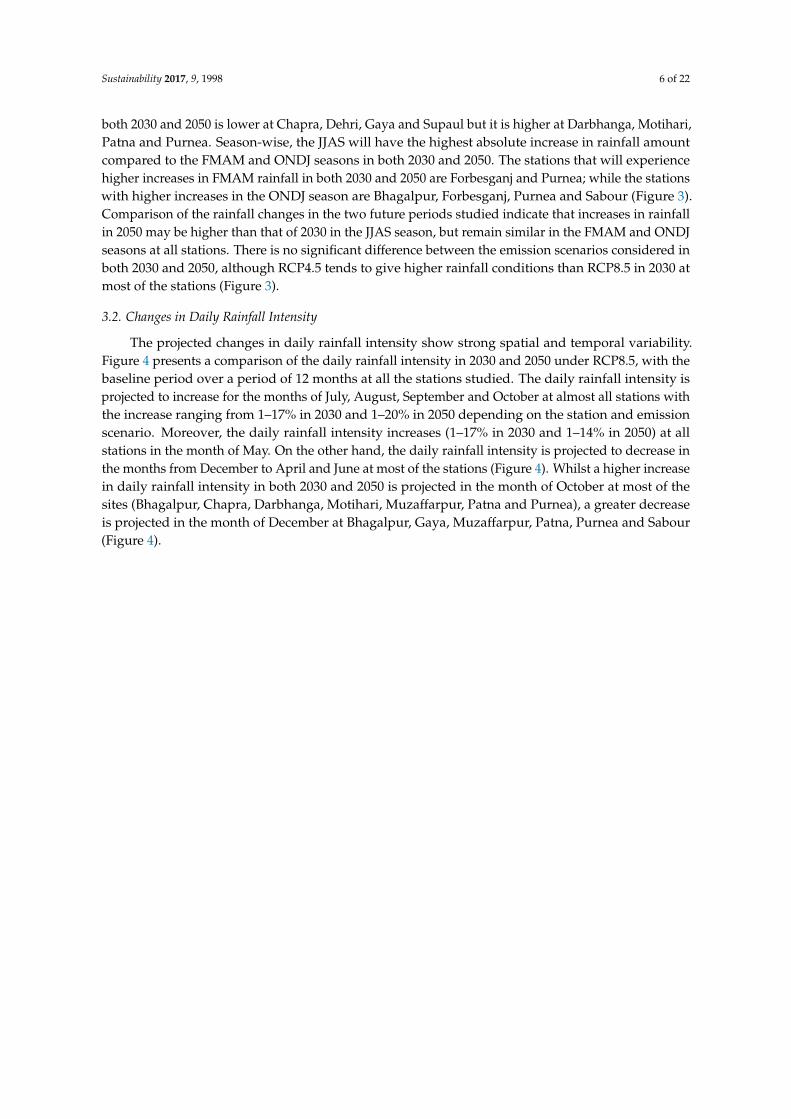
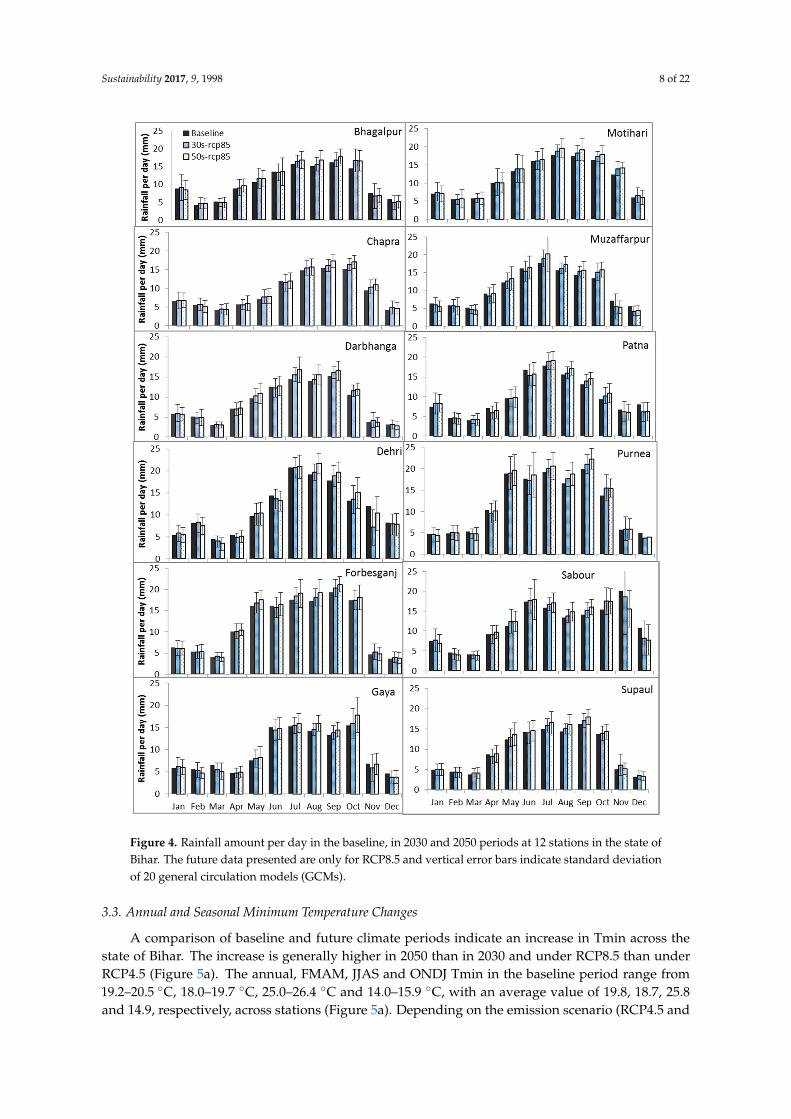
The projected changes in daily rainfall intensity show strong spatial and temporal variability.Figure 4 presents a comparison of the daily rainfall intensity in 2030 and 2050 under RCP8.5, with thebaseline period over a period of 12 months at all the stations studied. The daily rainfall intensity isprojected to increase for the months of July, August, September and October at almost all stations withthe increase ranging from 1–17% in 2030 and 1–20% in 2050 depending on the station and emissionscenario. Moreover, the daily rainfall intensity increases (1–17% in 2030 and 1–14% in 2050) at allstations in the month of May. On the other hand, the daily rainfall intensity is projected to decrease inthe months from December to April and June at most of the stations (Figure 4). Whilst a higher increasein daily rainfall intensity in both 2030 and 2050 is projected in the month of October at most of thesites (Bhagalpur, Chapra, Darbhanga, Motihari, Muzaffarpur, Patna and Purnea), a greater decreaseis projected in the month of December at Bhagalpur, Gaya, Muzaffarpur, Patna, Purnea and Sabour(Figure 4).
Sustainability 2017, 9, 1998 7 of 22Sustainability 2017, 9, 1998 7 of 22
Figure 3. Baseline (1980–2009) and projected (2030 and 2050 with two RCPs) annual and seasonal rainfall amounts at 12 stations in Bihar. Vertical bars indicate standard deviation of 20 general circulation models.
1200
1500
1800
2100
750
1000
1250
1500
100
200
300
50
75
100
125
150
175
Ann
ual
JJA
SFM
AM
ON
DJ
Bhagalpur Chapra Darbhanga Dehri Forbesganj Gaya Motihari Muzaffarpur Patna Purnea Sabour Supaul
Rai
nfal
l (m
m)
baseline 30s-rcp45 30s-rcp85 50s-rcp45 50s-rcp85
Figure 3. Baseline (1980–2009) and projected (2030 and 2050 with two RCPs) annual and seasonal rainfall amounts at 12 stations in Bihar. Vertical bars indicatestandard deviation of 20 general circulation models.
Sustainability 2017, 9, 1998 8 of 22
Sustainability 2017, 9, 1998 8 of 22
Figure 4. Rainfall amount per day in the baseline, in 2030 and 2050 periods at 12 stations in the state of Bihar. The future data presented are only for RCP8.5 and vertical error bars indicate standard deviation of 20 general circulation models (GCMs).
3.3. Annual and Seasonal Minimum Temperature Changes
A comparison of baseline and future climate periods indicate an increase in Tmin across the state of Bihar. The increase is generally higher in 2050 than in 2030 and under RCP8.5 than under RCP4.5 (Figure 5a). The annual, FMAM, JJAS and ONDJ Tmin in the baseline period range from 19.2–20.5 °C, 18.0–19.7
Figure 4. Rainfall amount per day in the baseline, in 2030 and 2050 periods at 12 stations in the state ofBihar. The future data presented are only for RCP8.5 and vertical error bars indicate standard deviationof 20 general circulation models (GCMs).
3.3. Annual and Seasonal Minimum Temperature Changes
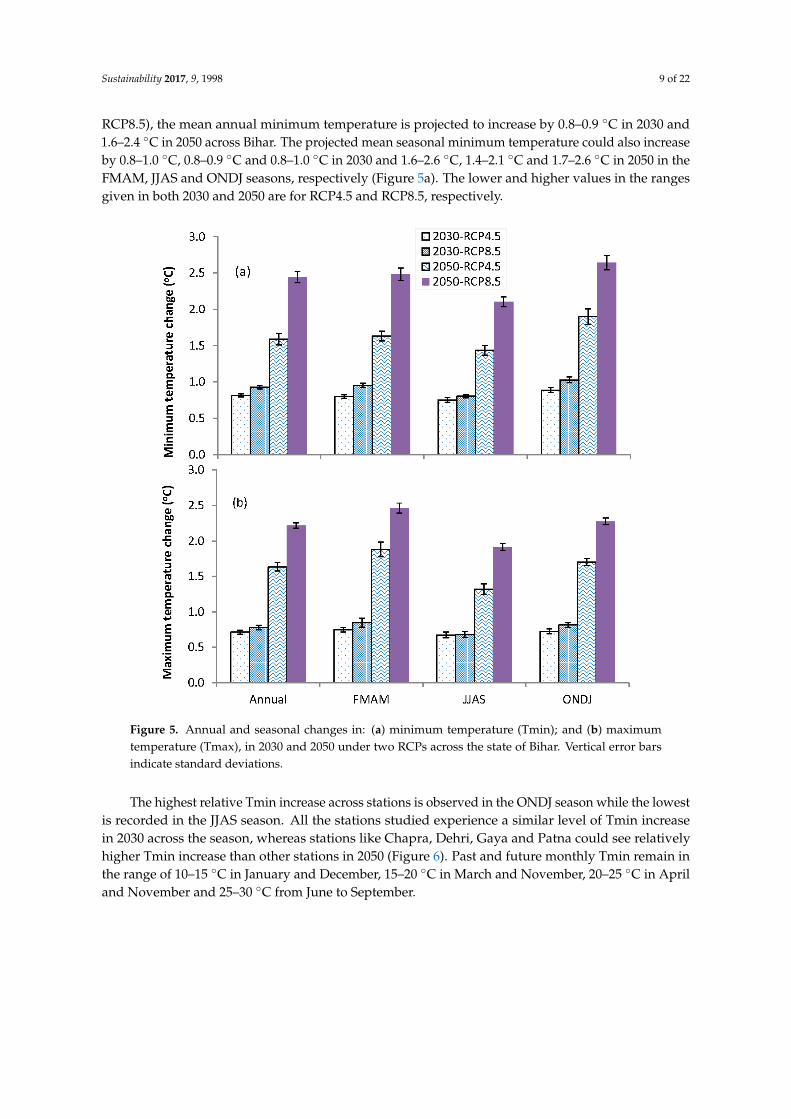
A comparison of baseline and future climate periods indicate an increase in Tmin across thestate of Bihar. The increase is generally higher in 2050 than in 2030 and under RCP8.5 than underRCP4.5 (Figure 5a). The annual, FMAM, JJAS and ONDJ Tmin in the baseline period range from19.2–20.5 ◦C, 18.0–19.7 ◦C, 25.0–26.4 ◦C and 14.0–15.9 ◦C, with an average value of 19.8, 18.7, 25.8and 14.9, respectively, across stations (Figure 5a). Depending on the emission scenario (RCP4.5 and
Sustainability 2017, 9, 1998 9 of 22
RCP8.5), the mean annual minimum temperature is projected to increase by 0.8–0.9 ◦C in 2030 and1.6–2.4 ◦C in 2050 across Bihar. The projected mean seasonal minimum temperature could also increaseby 0.8–1.0 ◦C, 0.8–0.9 ◦C and 0.8–1.0 ◦C in 2030 and 1.6–2.6 ◦C, 1.4–2.1 ◦C and 1.7–2.6 ◦C in 2050 in theFMAM, JJAS and ONDJ seasons, respectively (Figure 5a). The lower and higher values in the rangesgiven in both 2030 and 2050 are for RCP4.5 and RCP8.5, respectively.
Sustainability 2017, 9, 1998 9 of 22
°C, 25.0–26.4 °C and 14.0–15.9 °C, with an average value of 19.8, 18.7, 25.8 and 14.9, respectively, across stations (Figure 5a). Depending on the emission scenario (RCP4.5 and RCP8.5), the mean annual minimum temperature is projected to increase by 0.8–0.9 °C in 2030 and 1.6–2.4 °C in 2050 across Bihar. The projected mean seasonal minimum temperature could also increase by 0.8–1.0 °C, 0.8–0.9 °C and 0.8–1.0 °C in 2030 and 1.6–2.6 °C, 1.4–2.1 °C and 1.7–2.6 °C in 2050 in the FMAM, JJAS and ONDJ seasons, respectively (Figure 5a). The lower and higher values in the ranges given in both 2030 and 2050 are for RCP4.5 and RCP8.5, respectively.
Figure 5. Annual and seasonal changes in: (a) minimum temperature (Tmin); and (b) maximum temperature (Tmax), in 2030 and 2050 under two RCPs across the state of Bihar. Vertical error bars indicate standard deviations.
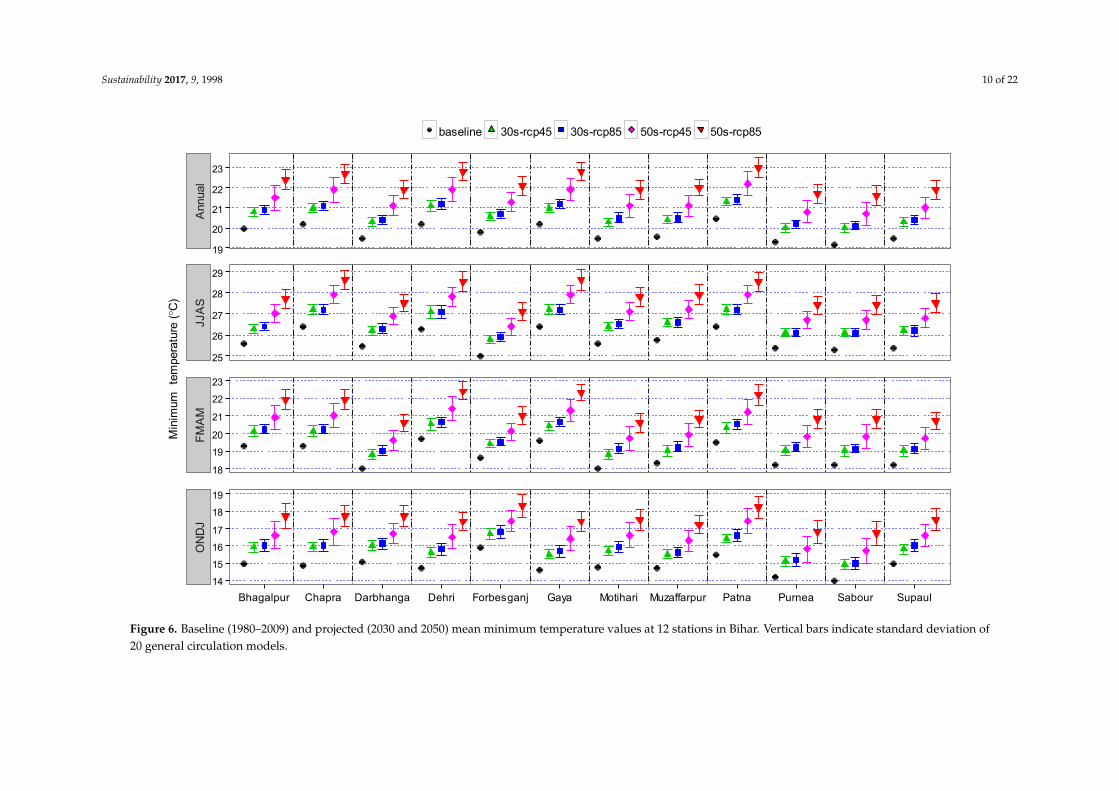
The highest relative Tmin increase across stations is observed in the ONDJ season while the lowest is recorded in the JJAS season. All the stations studied experience a similar level of Tmin increase in 2030 across the season, whereas stations like Chapra, Dehri, Gaya and Patna could see relatively higher Tmin increase than other stations in 2050 (Figure 6). Past and future monthly Tmin remain in the range of 10–15 °C in January and December, 15–20 °C in March and November, 20–25 °C in April and November and 25–30 °C from June to September.
Figure 5. Annual and seasonal changes in: (a) minimum temperature (Tmin); and (b) maximumtemperature (Tmax), in 2030 and 2050 under two RCPs across the state of Bihar. Vertical error barsindicate standard deviations.
The highest relative Tmin increase across stations is observed in the ONDJ season while the lowestis recorded in the JJAS season. All the stations studied experience a similar level of Tmin increasein 2030 across the season, whereas stations like Chapra, Dehri, Gaya and Patna could see relativelyhigher Tmin increase than other stations in 2050 (Figure 6). Past and future monthly Tmin remain inthe range of 10–15 ◦C in January and December, 15–20 ◦C in March and November, 20–25 ◦C in Apriland November and 25–30 ◦C from June to September.
Sustainability 2017, 9, 1998 10 of 22Sustainability 2017, 9, 1998 10 of 22
Figure 6. Baseline (1980–2009) and projected (2030 and 2050) mean minimum temperature values at 12 stations in Bihar. Vertical bars indicate standard deviation of 20 general circulation models.
19
20
21
22
23
25
26
27
28
29
18
19
20
21
22
23
14
15
16
17
18
19
Ann
ual
JJA
SFM
AM
ON
DJ
Bhagalpur Chapra Darbhanga Dehri Forbesganj Gaya Motihari Muzaffarpur Patna Purnea Sabour Supaul
Min
imum
tem
pera
ture
(°C
)
baseline 30s-rcp45 30s-rcp85 50s-rcp45 50s-rcp85
Figure 6. Baseline (1980–2009) and projected (2030 and 2050) mean minimum temperature values at 12 stations in Bihar. Vertical bars indicate standard deviation of20 general circulation models.
Sustainability 2017, 9, 1998 11 of 22
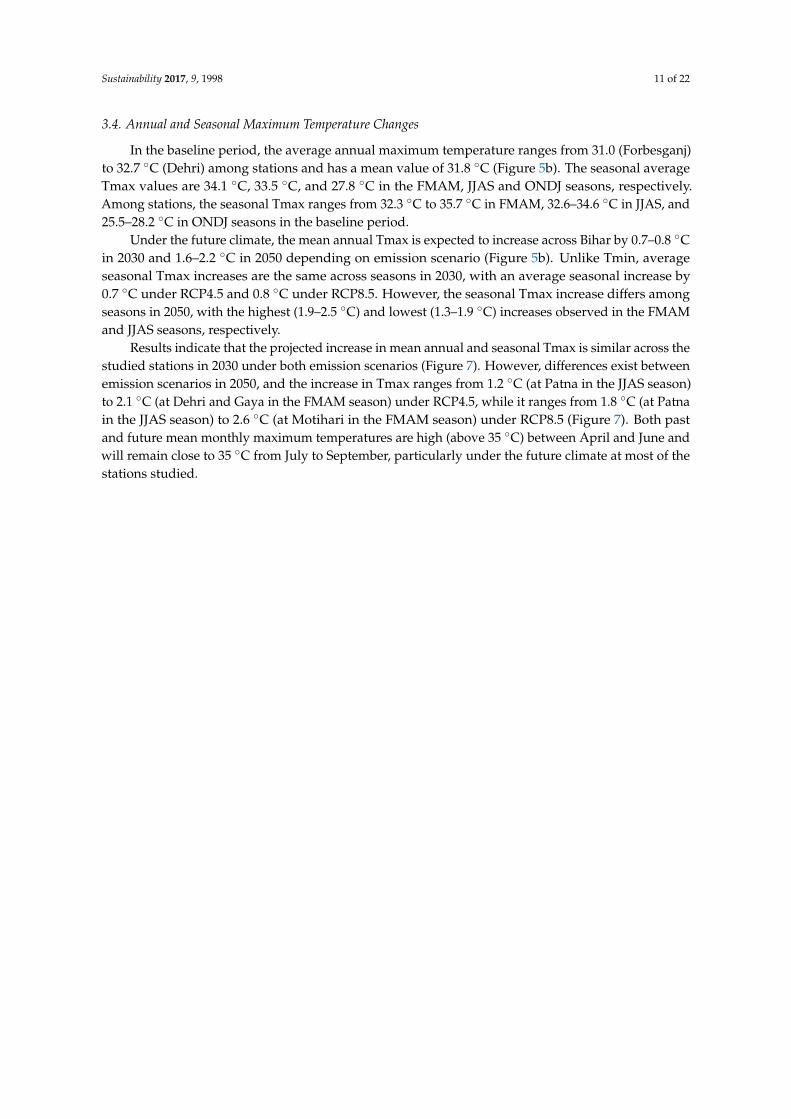
3.4. Annual and Seasonal Maximum Temperature Changes
In the baseline period, the average annual maximum temperature ranges from 31.0 (Forbesganj)to 32.7 ◦C (Dehri) among stations and has a mean value of 31.8 ◦C (Figure 5b). The seasonal averageTmax values are 34.1 ◦C, 33.5 ◦C, and 27.8 ◦C in the FMAM, JJAS and ONDJ seasons, respectively.Among stations, the seasonal Tmax ranges from 32.3 ◦C to 35.7 ◦C in FMAM, 32.6–34.6 ◦C in JJAS, and25.5–28.2 ◦C in ONDJ seasons in the baseline period.
Under the future climate, the mean annual Tmax is expected to increase across Bihar by 0.7–0.8 ◦Cin 2030 and 1.6–2.2 ◦C in 2050 depending on emission scenario (Figure 5b). Unlike Tmin, averageseasonal Tmax increases are the same across seasons in 2030, with an average seasonal increase by0.7 ◦C under RCP4.5 and 0.8 ◦C under RCP8.5. However, the seasonal Tmax increase differs amongseasons in 2050, with the highest (1.9–2.5 ◦C) and lowest (1.3–1.9 ◦C) increases observed in the FMAMand JJAS seasons, respectively.
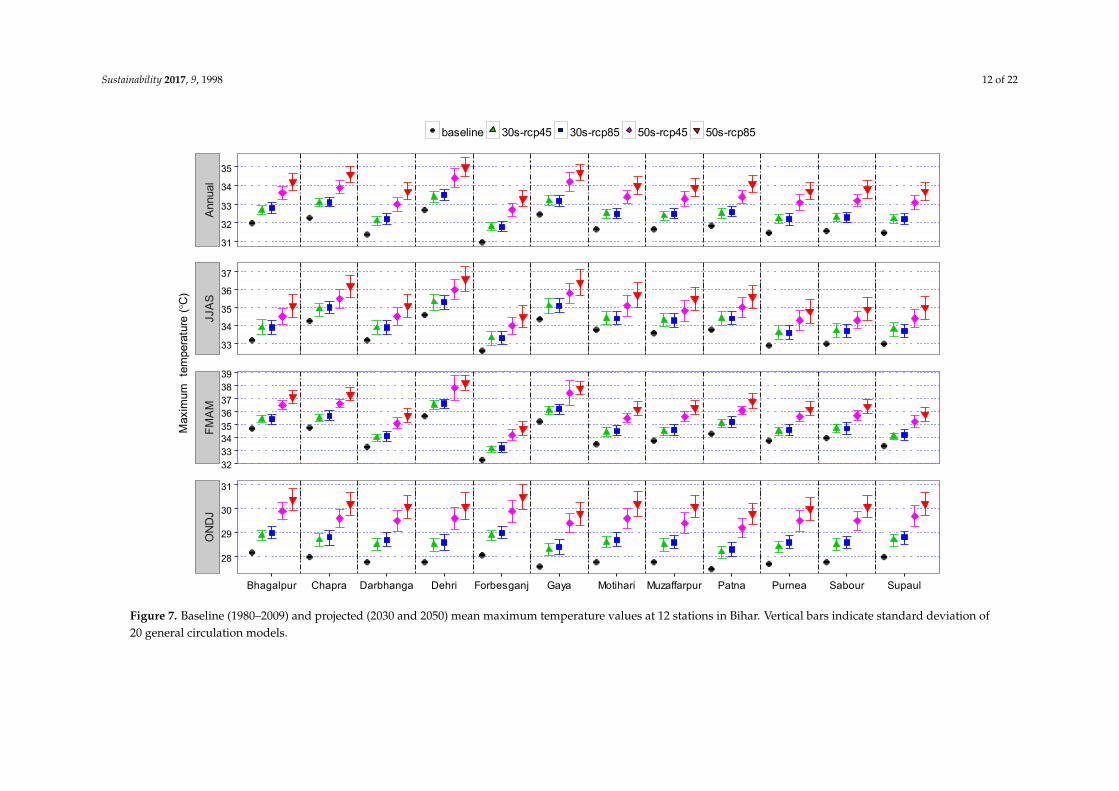
Results indicate that the projected increase in mean annual and seasonal Tmax is similar across thestudied stations in 2030 under both emission scenarios (Figure 7). However, differences exist betweenemission scenarios in 2050, and the increase in Tmax ranges from 1.2 ◦C (at Patna in the JJAS season)to 2.1 ◦C (at Dehri and Gaya in the FMAM season) under RCP4.5, while it ranges from 1.8 ◦C (at Patnain the JJAS season) to 2.6 ◦C (at Motihari in the FMAM season) under RCP8.5 (Figure 7). Both pastand future mean monthly maximum temperatures are high (above 35 ◦C) between April and June andwill remain close to 35 ◦C from July to September, particularly under the future climate at most of thestations studied.
Sustainability 2017, 9, 1998 12 of 22Sustainability 2017, 9, 1998 12 of 22
Figure 7. Baseline (1980–2009) and projected (2030 and 2050) mean maximum temperature values at 12 stations in Bihar. Vertical bars indicate standard deviation of 20 general circulation models.
31
32
33
34
35
33
34
35
36
37
3233343536373839
28
29
30
31
Ann
ual
JJA
SFM
AM
ON
DJ
Bhagalpur Chapra Darbhanga Dehri Forbesganj Gaya Motihari Muzaffarpur Patna Purnea Sabour Supaul
Max
imum
tem
pera
ture
(°C
)
baseline 30s-rcp45 30s-rcp85 50s-rcp45 50s-rcp85
Figure 7. Baseline (1980–2009) and projected (2030 and 2050) mean maximum temperature values at 12 stations in Bihar. Vertical bars indicate standard deviation of20 general circulation models.
Sustainability 2017, 9, 1998 13 of 22
3.5. Trend of Annual Mean Minimum and Maximum Temperatures
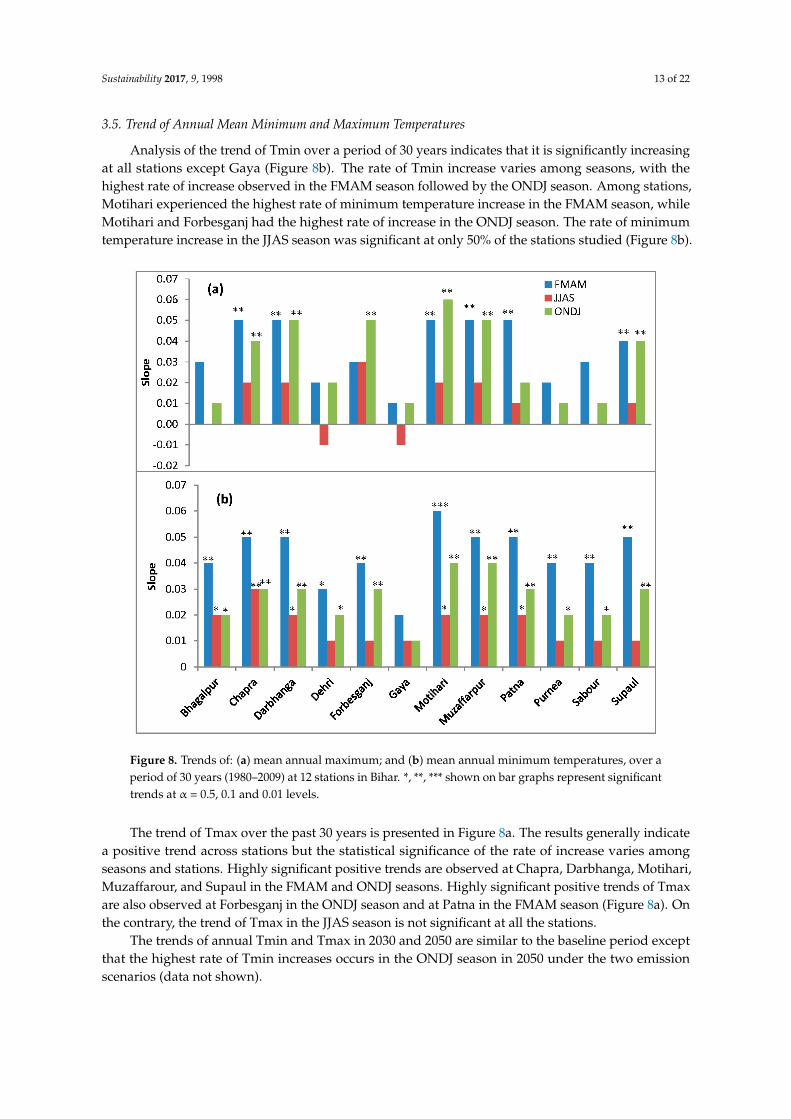
Analysis of the trend of Tmin over a period of 30 years indicates that it is significantly increasingat all stations except Gaya (Figure 8b). The rate of Tmin increase varies among seasons, with thehighest rate of increase observed in the FMAM season followed by the ONDJ season. Among stations,Motihari experienced the highest rate of minimum temperature increase in the FMAM season, whileMotihari and Forbesganj had the highest rate of increase in the ONDJ season. The rate of minimumtemperature increase in the JJAS season was significant at only 50% of the stations studied (Figure 8b).
Sustainability 2017, 9, 1998 13 of 22
3.5. Trend of Annual Mean Minimum and Maximum Temperatures
Analysis of the trend of Tmin over a period of 30 years indicates that it is significantly increasing at all stations except Gaya (Figure 8b). The rate of Tmin increase varies among seasons, with the highest rate of increase observed in the FMAM season followed by the ONDJ season. Among stations, Motihari experienced the highest rate of minimum temperature increase in the FMAM season, while Motihari and Forbesganj had the highest rate of increase in the ONDJ season. The rate of minimum temperature increase in the JJAS season was significant at only 50% of the stations studied (Figure 8b).
Figure 8. Trends of: (a) mean annual maximum; and (b) mean annual minimum temperatures, over a period of 30 years (1980–2009) at 12 stations in Bihar. *, **, *** shown on bar graphs represent significant trends at α = 0.5, 0.1 and 0.01 levels.
The trend of Tmax over the past 30 years is presented in Figure 8a. The results generally indicate a positive trend across stations but the statistical significance of the rate of increase varies among seasons and stations. Highly significant positive trends are observed at Chapra, Darbhanga, Motihari, Muzaffarour, and Supaul in the FMAM and ONDJ seasons. Highly significant positive trends of Tmax are also observed at Forbesganj in the ONDJ season and at Patna in the FMAM season (Figure 8a). On the contrary, the trend of Tmax in the JJAS season is not significant at all the stations.
The trends of annual Tmin and Tmax in 2030 and 2050 are similar to the baseline period except that the highest rate of Tmin increases occurs in the ONDJ season in 2050 under the two emission scenarios (data not shown).
Figure 8. Trends of: (a) mean annual maximum; and (b) mean annual minimum temperatures, over aperiod of 30 years (1980–2009) at 12 stations in Bihar. *, **, *** shown on bar graphs represent significanttrends at α = 0.5, 0.1 and 0.01 levels.
The trend of Tmax over the past 30 years is presented in Figure 8a. The results generally indicatea positive trend across stations but the statistical significance of the rate of increase varies amongseasons and stations. Highly significant positive trends are observed at Chapra, Darbhanga, Motihari,Muzaffarour, and Supaul in the FMAM and ONDJ seasons. Highly significant positive trends of Tmaxare also observed at Forbesganj in the ONDJ season and at Patna in the FMAM season (Figure 8a). Onthe contrary, the trend of Tmax in the JJAS season is not significant at all the stations.
The trends of annual Tmin and Tmax in 2030 and 2050 are similar to the baseline period exceptthat the highest rate of Tmin increases occurs in the ONDJ season in 2050 under the two emissionscenarios (data not shown).
Sustainability 2017, 9, 1998 14 of 22
3.6. Model Uncertainty in Rainfall and Temperature Projections
Model uncertainty in rainfall projection is shown by the standard deviations of the 20 GCMs inFigure 3. The uncertainty varies between emission scenarios, periods and stations. It is generally higherfor RCP4.5 than RCP8.5 in 2030 but remains similar between emission scenarios in 2050. Comparisonof the study periods indicate that rainfall projections in 2050 are more uncertain than those in 2030in the main rainy season (JJAS), while uncertainties remain similar between the two periods in theFMAM and ONDJ seasons. Among sites, uncertainty is higher at Forbesganj and Purnea (high rainfallareas) as compared to the rest of the stations (Figure 4). On the other hand, model uncertainty is verylow at Chapra, Dehri and Gaya in the FMAM season and at Chapra, Muzaffarpur and Supaul in theONDJ season.
Model uncertainty in the projection of maximum and minimum temperatures is lower thanthat observed for rainfall and is similar across stations (Figures 6 and 7). Like rainfall, higher modeluncertainty is observed in 2050 than in 2030. Moreover, model uncertainty is higher in the JJAS andONDJ seasons than in FMAM season in 2050.
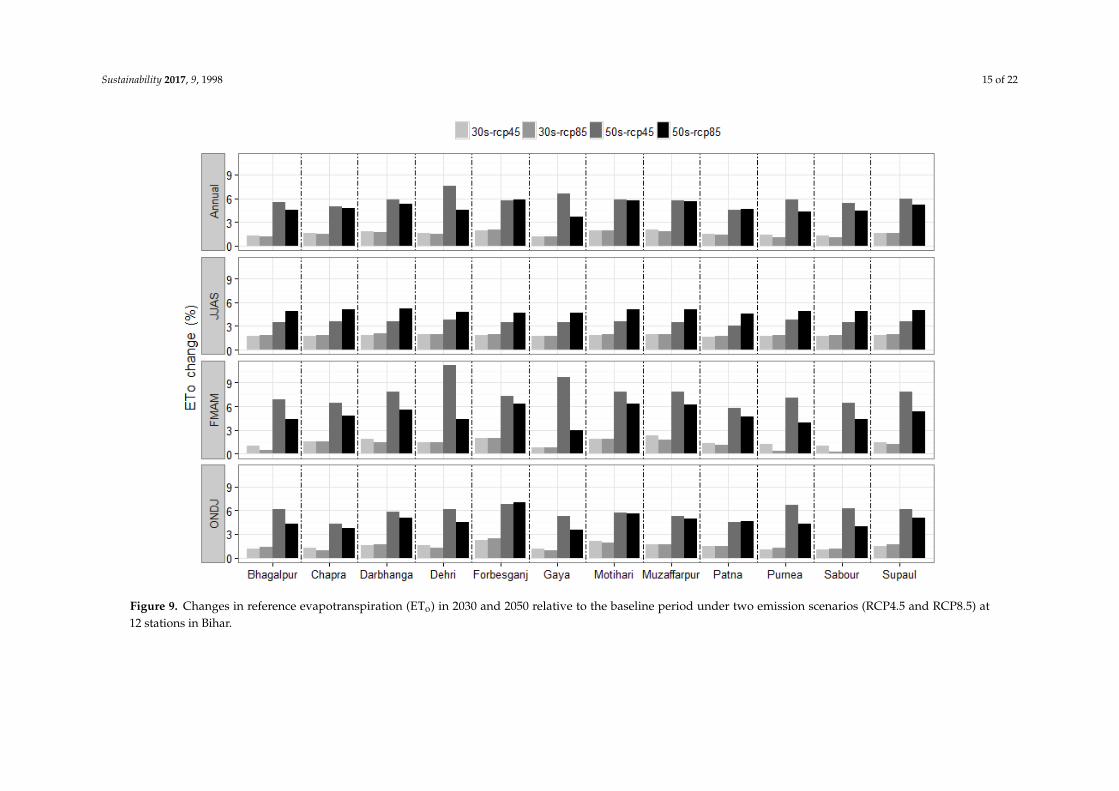
3.7. Annual and Seasonal Reference Evapotranspiration Changes
The annual and seasonal ETo changes show that ETo is likely to increase under the future climateat all stations, with the increase to be higher in 2050 than in 2030 under the two emission scenarios atall stations (Figure 9). The annual ETo is expected to increase by 1–3% in 2030 and 4–7% in 2050 acrossstations (Figure 9).
The increase in ETo is generally similar across season and station in 2030 under both emissionscenarios as compared to that in 2050. The ETo increase in 2050 varies among seasons and sites andbetween emission scenarios. The FMAM season may experience higher increases in ETo, particularlyunder RCP4.5, in 2050 than the JJAS season. The stations that may see a higher ETo increase underRCP4.5 in 2050 are Dehri and Gaya in the FMAM season and Bhagalpur, Dehri, Forbesganj, Purnea,Sabour and Supaul in the ONDJ season. On the other hand, the increase in ETo in the JJAS season issimilar across stations, with the highest increase observed under RCP8.5 in 2050 (Figure 9).
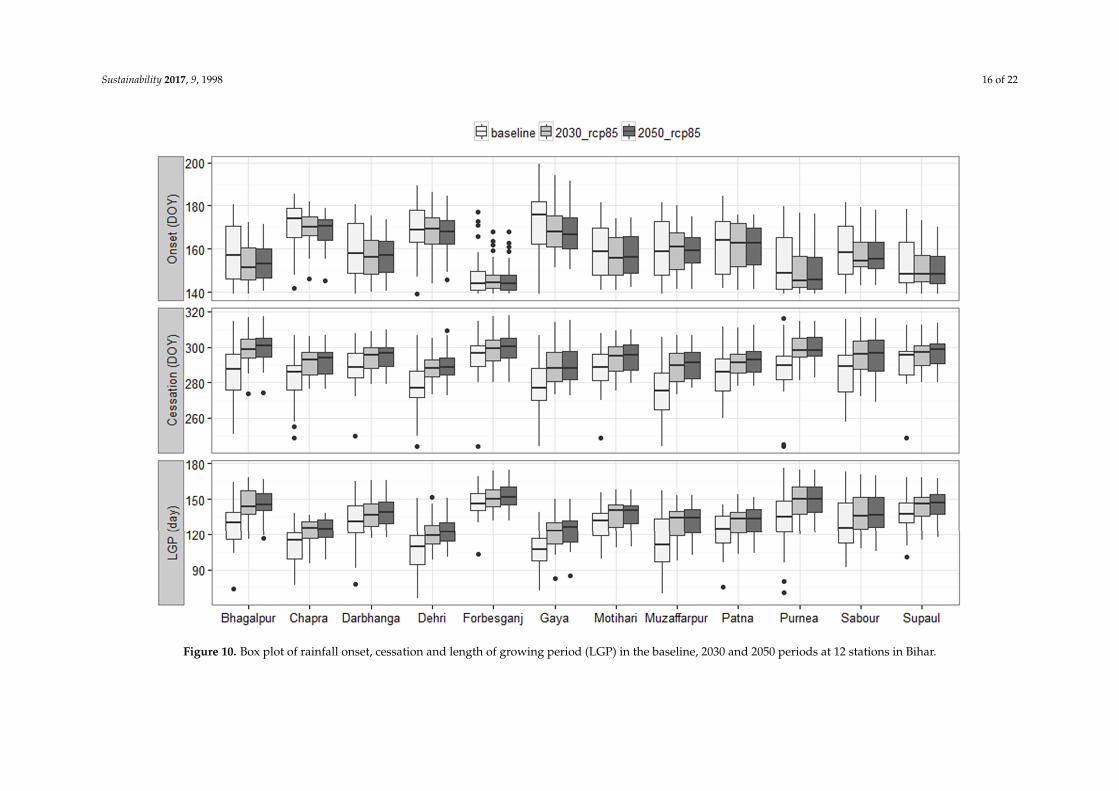
3.8. Changes in Monsoon Rainfall Onset and Cessation and Length of Growing Period
Analysis of rainfall onset in the monsoon season (JJAS) across stations indicates that planting canstart as early as the end of May (e.g., Forbesganj and Purnea) and as late as mid-June (e.g., Chapra andGaya) in the baseline period. Although there is a tendency for early onset at all stations (a maximumof five days at Gaya) under the future climate, there is no statistical difference between the baselineand future periods (2030 and 2050) in median onset date (Figure 10). The end of the monsoon seasonin the baseline period ranges from the first week of October (Muzaffarpur and Gaya) to the thirdweek of October (Forbesganj, Patna and Sapaul), that is, from day of year (DOY) 275–296. The end ofthe rainy season is projected to be extended under the future climate although there is no significantdifference between 2030 and 2050 (Figure 10). The median cessation dates could range from DOY 288(mid-October) to 300 (end of October), extending the end of the season by 4–8 days at Darbhanga,Forbesganj, Motihari, Patna, Sabour and Supaul, by 9–12 days at Chapra, Dehri and Gaya, and by13–16 days at Bhagalpur, Muzaffarpur and Purnea. Thus, the late end of the monsoon season underthe future climate prolongs the median growing period by 5–8 days at Forbesganj, Patna and Supaul,by 9–13 days at Darbhanga, Derhi, Chapra, Motihari and Sabour, and by 14–18 days at Bhagalpur,Gaya, Muzaffarpur and Purnea (Figure 10).
Sustainability 2017, 9, 1998 15 of 22
Sustainability 2017, 9, 1998 15 of 22
Figure 9. Changes in reference evapotranspiration (ETo) in 2030 and 2050 relative to the baseline period under two emission scenarios (RCP4.5 and RCP8.5) at 12 stations in Bihar.
Figure 9. Changes in reference evapotranspiration (ETo) in 2030 and 2050 relative to the baseline period under two emission scenarios (RCP4.5 and RCP8.5) at12 stations in Bihar.
Sustainability 2017, 9, 1998 16 of 22Sustainability 2017, 9, 1998 16 of 22
Figure 10. Box plot of rainfall onset, cessation and length of growing period (LGP) in the baseline, 2030 and 2050 periods at 12 stations in Bihar. Figure 10. Box plot of rainfall onset, cessation and length of growing period (LGP) in the baseline, 2030 and 2050 periods at 12 stations in Bihar.
Sustainability 2017, 9, 1998 17 of 22
4. Discussion
Climate change is already affecting agriculture and its effects are unevenly distributed across theworld [4]. Understanding how climate is changing and will change at local level, determining themagnitude of the change, and identifying climate risks and opportunities associated with it can guideagricultural decisions, strategies and interventions that lead to climate-resilient farming systems. Thisstudy focused on analyzing past and future downscaled climate data at a local level and looked intoannual, seasonal and intra-seasonal climatic changes, identifying the climate risks and opportunitieswith respect to crop production in Bihar.
This study used quality-checked historical climate data and projections from an ensemble of20 GCMs downscaled to a station level using bias-corrected spatial downscaling method [31,32].Multi-model ensemble is an efficient technique to consider all the potential uncertainties considered inthe GCM projections [33,34]. In this study, it was found that uncertainties in rainfall and temperatureprojections were within reasonable limits and the data were good enough for climate analysis inthe study area. However, model uncertainties were generally higher for rainfall than temperatureprojections and vary over time and space. Hence, the regional model outputs, particularly onrainfall variations, have to be handled with caution while being used for climate analysis and impactassessment at different sites.
4.1. Rainfall Changes and Its Implications for Crop Production
The state of Bihar receives high annual rainfall (>1000 mm) under the present climate. More than80% of the annual total rainfall is received during the monsoon season (JJAS) with only 9% and 7%of the amount received in the FMAM and ONDJ seasons, respectively. This study found an increasein annual rainfall in Bihar under the future (2030 and 2050) climate relative to the baseline period.However, the magnitude of change varies with season, site and climate periods studied. The seasonalrainfall in Bihar is expected to increase over time under the future climate, with the highest relativeincrease in the FMAM season and the highest absolute increase in the JJAS season. A modest (8–10% in2030 and 9–15% in 2050) rainfall increase is also projected in the ONDJ season. Although it is difficultto make a direct comparison of this study with previous studies because of differences in time period,GCMs, emission scenarios and downscaling methods used, our results are similar to those studiesthat projected a general increase in monsoon rainfall in India including Bihar (e.g., [12,35]) and TamilNadu [36] under the future climate. However, the reported reduction in winter rainfall across India by2050 [12] is not observed for Bihar in the current study.
There is a considerable spatial variability in the projected annual and seasonal rainfallincrease among stations, suggesting the need for considering local differences in water and othercrop-management practices under rainfed and irrigated systems in Bihar. The results from this studyalso indicated an increase in rainfall per day under the future climate, particularly in the monsoonseason, which would increase the chance of flash floods at most of the sites studied. An increasein rainfall intensity under the future climate may lead to flood conditions and lesser groundwaterrecharge. Flooding is already a major problem for many heavily populated deltaic regions like Bihar inSouth Asia [9]. Therefore, an increase in rainfall amount and intensity under the future climate wouldbecome a major climate risk for Bihar as it will exacerbate the state’s current vulnerability to floodscaused by high rainfall and topographic conditions in Nepal [19]. Under severe conditions, floodingmay lead to the relocation of both farms and farming populations to other regions [9].
Sustainability 2017, 9, 1998 18 of 22
An increase in rainfall in the future climate would also lead to an increase in atmospheric humidity,and in the duration of the wet season [37]. Therefore, combined with higher temperatures, theseconditions could favor the development of fungal diseases, incidence of insect pests and vectors [9,38].
4.2. Temperature Changes and Implications for Crop Production
The results in this study indicate an increasing trend in both minimum and maximumtemperatures across Bihar in the baseline period, with the rate of increase in minimum temperaturebeing significant and higher than the one in maximum temperature at almost all stations. Bothminimum and maximum temperatures are increasing faster and higher in the FMAM and ONDJseasons than the JJAS season. Temperature increases have also been reported for parts of India for bothpast records [39] and future projections [12,35]. The observed maximum and minimum temperaturetrends are also in line with the reported changes at a global scale [40]; and with the argument thatdaily minimum temperature exhibits more associations with the global warming phenomenon ratherthan daily maximum temperature [41].
The increases in temperature will probably offset the likely benefits of increasing atmosphericconcentrations of carbon dioxide on crop plants [9]. For example, the increase in minimum temperaturecontributes to increased growing degree day (GDD), leading to an alteration of growing periods andyield. It also affects available soil water, and thereby exacerbates water stress which ultimately affectsyield [42,43]. Moreover, the current maximum temperature in Bihar is already close to the maximumtemperature threshold of kharif (e.g., rice) and rabi (e.g., wheat) crops [44]. Thus, a further increase intemperature under the future climate, particularly in 2050, may cause day and night temperatures toexceed the maximum limit for many of the current crops and varieties grown in the state (see reviewsof [45] for temperature thresholds). In this study, the future temperature increases are found to behigher in the ONDJ and FMAM seasons, and hence crops grown during the rabi and spring seasonswill be most affected.
High-temperature levels increase crop respiration rates and evapotranspiration, hasten nutrientmineralization in soil while reducing crop duration, the number of grains formed, fertilizer-useefficiency, and crop yield [9,44,46–48]. In rice, for example, yield is reduced by 10% with each 1 ◦C risein minimum temperature and by 15% with each 1 ◦C rise in mean temperature [47]. In wheat, a rise inmaximum temperature mainly reduces the duration of anthesis and grain-filling periods which resultsin reduced grain yield [44,46,48]. This also indicates that for every 1 ◦C rise in temperature, the yieldsof wheat soybean, mustard, groundnut and potato would decline by 3–7% in India [49]. Maize is alsohighly susceptible to heat stress during the reproductive stage [7,50–52], and it is reported that eachdegree increase in a day where the temperature exceeds 30 ◦C reduces the final yield of maize by 1%under favorable growing conditions, and by 1.7% under drought-stressed conditions [53]. This showsthat heat stress will be a major climate risk for crop production across Bihar, particularly for winter-and spring-sown crops when higher temperatures coincide with the reproductive phase of the crops.
In order to minimize the impact of high temperatures, adaptation measures such as deployingheat-tolerant germplasm, planting-date adjustment, and optimum irrigation through efficientwater-management systems need to be designed and evaluated for the different farming systems ofthe state.
4.3. Monsoon Growing Season Changes and Implications for Crop Production
The results of this study indicated a longer growing period because of an extended monsoonseason across the stations studied in Bihar. Since there was no significant difference in the onset ofrainfall dates between the baseline and future periods, the longer growing period under the futureclimate was mainly a result of late cessation of the rainfall. Depending on location, this wouldallow growing of medium- to late-maturing crops which could increase the yield of major monsooncrops such as rice, maize and legumes. On the other hand, the probability of dry spells and rate ofevapotranspiration are projected to increase under the future climate, compromising the benefit from
Sustainability 2017, 9, 1998 19 of 22
high rainfall and long growing periods. Moreover, increasing temperature levels would shorten thematurity period of crops, and hence an extended growing period alone could not be translated into abetter harvest. This, therefore, emphasizes the need for designing adaptation measures that capitalizeon the opportunities which come with climate change while minimizing its negative effects [54].
5. Conclusions
Changes in rainfall conditions, temperature, evapotranspiration and growing period are detectedacross Bihar in the near- and mid-term climate. These changes have implications for rainfed andirrigated cropping systems in the state as the magnitude and pattern of the changes will affect cropevaporation, runoff, soil water storage, crop water requirement, crop growth period, photosynthesisability, crop respiration and yield. The magnitudes of rainfall and temperature changes vary by siteindicating that the effect of climate change on crops could also vary at each location. Changes in rainfallcould mostly affect kharif crops while the increase in temperature, particularly minimum temperature,could be a major climate risk for rabi- and spring-sown crops. It is, therefore, suggested that adaptationand mitigation strategies in Bihar have to be location- and season-specific.
Acknowledgments: We acknowledge the support for this work provided by the numerous donors contributingto the CGIAR Research Program on Climate Change, Agriculture and Food Security (CCAFS).
Author Contributions: K.T. and P.K.A. designed the research, with valuable input from P.B.S.; K.T. and F.M.analyzed the data; and K.T. wrote the first draft of the article, which was improved with substantial input fromP.K.A.; F.M.; P.B.S.; C.M.S.; A.K.C. and D.B.R.
Conflicts of Interest: The authors declare no conflict of interest.
References
1. Ahmed, M.; Suphachalasai, S. Assessing the Costs of Climate Change and Adaptation in South Asia; AsianDevelopment Bank: Mandaluyong, Philippines, 2014.
2. Knox, J.; Hess, T.; Daccache, A.; Wheeler, T. Climate change impacts on crop productivity in Africa andSouth Asia. Environ. Res. Lett. 2012, 7, 034032. [CrossRef]
3. Niang, I.; Ruppel, O.C.; Abdrabo, M.A.; Essel, A.; Lennard, C.; Padgham, J.; Urquhart, P. Africa. In ClimateChange 2014: Impacts, Adaptation, and Vulnerability. Part B: Regional Aspects; Contribution of Working Group IIto the Fifth Assessment Report of the Intergovernmental Panel on Climate Change; Barros, V.R., Field, C.B.,Dokken, D.J., Mastrandera, M.D., Eds.; Cambridge University Press: Cambridge, UK; New York, NY,USA, 2014.
4. Porter, J.R.; Xie, L.; Challinor, A.J.; Cochrane, K.; Howden, S.M.; Iqbal, M.M.; Lobell, D.B.; Travasso, M.I.Food Security and Food Production Systems. In Climate Change 2014: Impacts, Adaptation, and Vulnerability.Part A: Global and Sectoral Aspects; Contribution of Working Group II to the Fifth Assessment Report of theIntergovernmental Panel on Climate Change; Mastrandrea, P.R., White, L.L., Eds.; Cambridge UniversityPress: Cambridge, UK; New York, NY, USA, 2014.
5. Chattopadhyay, N. Climate change and food security in India. In Climate Change and Food Security in SouthAsia; Lal, R., Sivakumar, M.V.K., Faiz, M.A., Rahman, A.H.M.M., Islam, K.R., Eds.; Springe: Berlin, Germany,2011; pp. 129–251.
6. Lobell, D.B.; Schlenker, W.; Costa-Roberts, J. Climate trends and global crop production since 1980. Science2011, 333, 616–620. [CrossRef] [PubMed]
7. Cairns, J.E.; Sonder, K.; Zaidi, P.H.; Verhulst, N.; Mahuku, G.; Babu, R.; Nair, S.K.; Das, B.; Govaerts, B.;Vinayan, M.T.; et al. Maize production in a changing climate: Impacts, adaptation, and mitigation strategies.Adv. Agron. 2012, 114, 1–57. [CrossRef]
8. Hijioka, Y.; Lin, E.; Pereira, J.J.; Corlett, R.T.; Cui, X.; Insarov, G.; Lasco, R.; Lindgren, E. Akhilesh SurjanAsia. In Climate Change 2014: Impacts, Adaptation, and Vulnerability. Part B: Regional Aspects; Contributionof Working Group II to the Fifth Assessment Report of the Intergovernmental Panel on Climate Change;Barros, V.R., Field, C.B., Dokken, D.J., Mastrandrea, M.D., Mach, K.J., Bilir, T.E., Chatterjee, M., Ebi, K.L.,Estrada, Y.O., Genova, R.C., et al., Eds.; Cambridge University Press: Cambridge, UK; New York, NY, USA,2014; pp. 1327–1370.
Sustainability 2017, 9, 1998 20 of 22
9. Randhawa, R.K.; Singh, H.; Kang, M.S. Global warming and its possible impact on agriculture in India. Adv.Agron. 2014, 123, 65–121. [CrossRef]
10. Rupakumar, K.; Kumar, K.K.; Pant, G.B.; Srinivisan, G. Climate change: The Indian scenario. In InternationalConference on Science and Technology Capacity Building for Climate Change; Background Paper Prepared byFICCI; FICCI: New Delhi, India, 2002; pp. 5–17.
11. Roy, S.S.; Balling, R.C. Analysis of trends in maximum and minimum temperature, diurnal temperaturerange, and cloud cover over India. Geophys. Res. Lett. 2005, 32, 2–5. [CrossRef]
12. Lal, M.; Nozawa, T.; Emori, S.; Harasawa, H.; Takahashi, K.; Kimoto, M.; Nakajima, T.; Takemura, T.;Numaguti, A. Future climate change: Implications for Indian summer monsoon and its variability. Curr. Sci.2001, 81, 1196–1207.
13. Prabhakar, S.V.R.K.; Shaw, R. Climate change adaptation implications for drought risk mitigation:A perspective for India. Clim. Chang. 2008, 88, 113–130. [CrossRef]
14. Dagar, J.C.; Singh, A.K.; Singh, R.; Arunachalum, A.A. Climate change vis-a-vis Indian agriculture. Ann.Agric. Res. New Ser. 2012, 33, 189–203.
15. Trajkovic, S.; Kolakovic, S. Wind-adjusted Turc equation for estimating reference evapotranspiration athumid European locations. Hydrol. Res. 2009, 40, 45–52.
16. Hadgu, G.; Tesfaye, K.; Mamo, G. Analysis of climate change in Northern Ethiopia: Implications foragricultural production. Theor. Appl. Climatol. 2014, 117, 733–747. [CrossRef]
17. Lal, M. Implications of climate change in sustained agricultural productivity in South Asia. Reg. Environ.Chang. 2011, 11, 79–94. [CrossRef]
18. Pope, V. Why Are Climate Data and Evidence Important? Available online: http://blogs.worldbank.org/climatechange/why-are-climate-data-and-evidence-important (accessed on 14 January 2016).
19. GOB State Action Plan on Climate Change: Building Resilience through Development. Available online:http://www.moef.gov.in/sites/default/files/Bihar-StateActionPlanonClimateChange(2).pdf (accessed on7 January 2016).
20. Mason, S.; Kruczkiewicz, A.; Ceccato, P.; Crawford, A. Accessing and Using Climate Data and Information inFragile, Data-Poor States; International Institute for Sustainable Development: Winnipeg, MB, Canada, 2015.
21. You, Q.; Kang, S.; Aguilar, E.; Yan, Y. Changes in daily climate extremes in the eastern and central TibetanPlateau during 1961–2005. J. Geophys. Res. Atmos. 2008, 113, D07101. [CrossRef]
22. Klein Tank, A.M.G.; Zwiers, F.W.; Zhang, X. Guidelines on Analysis of Extremes in a Changing Climate in Supportof Informed Decisions for Adaptation; World Meteorological Organization (WMO): Geneva, Switzerland, 2009.
23. Ruane, A.C.; Goldberg, R.; Chryssanthacopoulos, J. Climate forcing datasets for agricultural modeling:Merged products for gap-filling and historical climate series estimation. Agric. For. Meteorol. 2015, 200,233–248. [CrossRef]
24. Siddik, M.A.Z.; Rahman, M. Trend analysis of maximum, minimum, and average temperatures inBangladesh: 1961–2008. Theor. Appl. Climatol. 2014, 116, 721–730. [CrossRef]
25. IPCC. Climate Change 2014: Synthesis Report; Contribution of Working Groups I, II and III to the FifthAssessment Report of the Intergovernmental Panel on Climate Change; CoreWritingTeam, Pachauri, R.K.,Meyer, L.A., Eds.; IPCC: Geneva, Switzerland, 2014; ISBN 9789291691432.
26. Sivakumar, M.V.K. Predicting rainy season potential from the onset of rains in Southern Sahelian andSudanian climatic zones of West Africa. Agric. For. Meteorol. 1988, 42, 295–305. [CrossRef]
27. R Core Team. R: A Language and Environment for Statistical Computing; R Foundation for Statistical Computing:Vienna, Austria, 2011; ISBN 3-900051-07-0.
28. Hargreaves, G.H.; Samani, Z.A. Reference crop evapotranspiration from ambient air temperature. In The1985 Winter Meeting of American Society of Agricultural Engineers; American Society of Agricultural Engineers:Chicago, IL, USA, 1985; pp. 1–12.
29. Sen, P.K. Estimates of the regression coefficient based on Kendall’s Tau. J. Am. Stat. Assoc. 1968, 63, 1379–1389.[CrossRef]
30. Kendall, M.G.; Gibbons, J.D. Rank Correlation Methods, 5th ed.; Arnold, E., Ed.; Oxford University Press:New York, NY, USA; London, UK, 1990.
31. Salvi, K.; Kannan, S.; Ghosh, S. Statistical downscaling and bias correction for projections of Indian rainfalland temperature in climate change studies. In Proceedings of the 2011 International Conference onEnvironmental and Computer Science, Singapore, 16–18 September 2011; Volume 19, pp. 7–11.
Sustainability 2017, 9, 1998 21 of 22
32. Maraun, D. Bias correction, quantile mapping, and downscaling: Revisiting the inflation issue. J. Clim. 2013,26, 2137–2143. [CrossRef]
33. Semenov, M.A.; Stratonovitch, P. Use of multi-model ensembles from global climate models for assessmentof climate change impacts. Clim. Res. 2010, 41, 1–14. [CrossRef]
34. Krishnamurti, T.N.; Kishtawal, C.M.; Zhang, Z.; LaRow, T.E.; Bachiochi, D.R.; Williford, C.E.; Gadgil, S.;Surendran, S. Multimodel ensemble forecasts for weather and seasonal climate. J. Clim. 2000, 13, 4196–4216.[CrossRef]
35. Kumar, K.R.; Sahai, A.K.; Kumar, K.K.; Patwardhan, S.K.; Mishra, P.K.; Revadekar, J.V.; Kamala, K.; Pant, G.B.High-resolution climate change scenarios for India for the 21st century. Curr. Sci. 2006, 90, 334–345.
36. Geethalakshmi, V.; Lakshmanan, A.; Rajalakshmi, D.; Jagannathan, R.; Sridhar, G.; Ramaraj, A.P.;Bhuvaneswari, K.; Gurusamy, L.; Anbhazhagan, R. Climate change impact assessment and adaptationstrategies to sustain rice production in Cauvery basin of Tamil Nadu. Curr. Sci. 2011, 101, 342–347.
37. Kaur, R. Climate change and its possible impacts on agriculture in India. Indian Farm. 2012, 62, 10–15.38. Sharma, V.K.; Thind, T.S.; Singh, P.P.; Mohan, C.; Arora, J.K.; Prem, R. Disease-weather relationships and
forecasting of bacterial leaf blight of rice. Plant Dis. Res. 2007, 22, 52–56.39. Hundal, S.S. Global climate change vis-a-vis crop productivity. In Natural and Anthropogenic Disasters:
Vulnerability, Preparedness and Mitigation; Jha, M.K., Ed.; Publishing Company and Springer: New Delhi,India, 2010; pp. 413–431.
40. Alexander, L.V.; Zhang, X.; Peterson, T.C.; Caesar, J.; Gleason, B.; Klein Tank, A.M.G.; Haylock, M.; Collins, D.;Trewin, B.; Rahimzadeh, F.; et al. Global observed changes in daily climate extremes of temperature andprecipitation. J. Geophys. Res. 2006, 111, D05109. [CrossRef]
41. Easterling, D.R.; Horton, B.; Jones, P.D.; Peterson, T.C.; Karl, T.R.; Parker, D.E.; Salinger, M.J.; Razuvayev, V.;Plummer, N.; Jamason, P.; et al. Maximum and minimum temperature trends for the globe. Science 1997, 277,364–367. [CrossRef]
42. Harrison, L.; Michaelsen, J.; Funk, C.; Husak, G. Effects of temperature changes on maize production inMozambique. Clim. Res. 2011, 46, 211–222. [CrossRef]
43. Deb, P.; Shrestha, S.; Babel, M.S. Forecasting climate change impacts and evaluation of adaptation optionsfor maize cropping in the hilly terrain of Himalayas: Sikkim, India. Theor. Appl. Climatol. 2014, 121, 649–667.[CrossRef]
44. Anand, A.; Khetarpal, S. Impact of climate change on agricultural productivity. In Plant Biology andBiotechnology, Volume I: Plant Diversity, Organization, Function and Improvement; Bahadur, B., Rajam, M.V.,Sahijram, L., Krishnamurthy, K.V., Eds.; Springer: New Delhi, India, 2015; Volume I, pp. 729–755.ISBN 9788132222866.
45. Luo, Q. Temperature thresholds and crop production: A review. Clim. Chang. 2011, 109, 583–598. [CrossRef]46. Hundal, S.S. Climatic variability and its impact on cereal productivity in Indian Punjab. Curr. Sci. 2007, 92,
506–512.47. Peng, S.; Huang, J.; Sheehy, J.E.; Laza, R.C.; Visperas, R.M.; Zhong, X.; Centeno, G.S.; Khush, G.S.;
Cassman, K.G. Rice yields decline with higher night temperature from global warming. Proc. Natl. Acad. Sci.USA 2004, 101, 9971–9975. [CrossRef] [PubMed]
48. Aggarwal, P.K.; Kalra, N. Analyzing the limitations set by climatic factors, genotype, and water and nitrogenavailability on productivity of wheat II. Climatically potential yields and management strategies. Field Crop.Res. 1994, 38, 93–103. [CrossRef]
49. Aggarwal, P.K. Global Climate Change and Indian Agriculture. Case Study form ICAR Network Project; IndianCouncil of Agricultural Research: New Delhi, India, 2009.
50. Mayer, L.I.; Rattalino Edreira, J.I.; Maddonni, G.A. Oil yield components of maize crops exposed to heatstress during early and late grain-filling stages. Crop Sci. 2014, 54, 2236–2250. [CrossRef]
51. Rattalino Edreira, J.I.; Budakli Carpici, E.; Sammarro, D.; Otegui, M.E. Heat stress effects around floweringon kernel set of temperate and tropical maize hybrids. Field Crop. Res. 2011, 123, 62–73. [CrossRef]
52. Rezaei, E.E.; Webber, H.; Gaiser, T.; Naab, J.; Ewert, F. Heat stress in cereals: Mechanisms and modelling.Eur. J. Agron. 2015, 64, 98–113. [CrossRef]

Sustainability 2017, 9, 1998 22 of 22
53. Lobell, D.B.; Bänziger, M.; Magorokosho, C.; Vivek, B. Nonlinear heat effects on African maize as evidencedby historical yield trials. Nat. Clim. Chang. 2011, 1, 42–45. [CrossRef]
54. Dar, W.D.; Gowda, C.L.L. Declining agricultural productivity and global food security. J. Crop Improv. 2013,27, 242–254. [CrossRef]
© 2017 by the authors. Licensee MDPI, Basel, Switzerland. This article is an open accessarticle distributed under the terms and conditions of the Creative Commons Attribution(CC BY) license (http://creativecommons.org/licenses/by/4.0/).