Climate change in Jordan: a comprehensive examination approach
11
American Journal of Environmental Sciences 5 (1): 58-68, 2009 ISSN 1553-345X © 2009 Science Publications Corresponding Author: Moshrik R. Hamdi, The Hashemite University, P.O. Box 150459, Zarqa, Jordan 13115 Tel: + 962 5 390 3333/Ext. 4476 Fax: + 962 5 382 6823 58 Climate Change in Jordan: A Comprehensive Examination Approach 1 Moshrik R. Hamdi, 2 Mahmoud Abu-Allaban, 3 Ammar Al-Shayeb, 3 Mohammed Jaber and 4 Naill M. Momani 1 Department of Land Management and Environment, 2 Department of Water Management and Environment, The Hashemite University, P.O. Box 150459, Zarqa 13115, Jordan 3 Department of Water Management and Environment, The Hashemite University, P.O. Box 150459, Zarqa 13115, Jordan 4 Consortium Consultants for Safety and Environment, Abu-Dhabi, UAE Abstract: Problem statement: Jordan is experiencing harsh water shortage in different parts of the country due to high fluctuations in annual precipitation; the only source of water. In addition, heat waves are becoming more frequent in the region. Precipitation decrement and summer heat waves are being blamed on global warming. This study aimed to detect trends in weather parameters in Jordan. Approach: Data from six meteorological stations distributed around Jordan were analyzed using several parametric and nonparametric statistical approaches including Mann-Kendall, Linear Regression, Cusum, Rank Sum, Student's t-test, Rank Difference, Auto Correlation and Skewness- Kurtosis Normality test. Results: The results indicated that there are no visible trends indicating an increase or decrease in the annual precipitation and maximum temperature. However, there are good to strong trends indicating that annual minimum temperature has increased in the last decade while annual temperature range has decreased. Conclusion: Decreasing temperature range proved that the Earth’s atmosphere is becoming more efficient in trapping terrestrial infrared radiation, which is accountable for the global warming. Key words: Climate change, Jordan, air temperature, relative humidity, precipitation, statistical tests INTRODUCTION Jordan is a Mediterranean country that depends mostly on rain as its main water resource. Recent years have witnessed shortage in the rainfall in different parts of the country. As a result, numerous streams have dried out, underground water level has fallen to critical levels and most water aquifers are experiencing high concentrations of Total Dissolved Solids (TDS), which makes them unsuitable for domestic or irrigation uses. In addition, extreme weather conditions such as flash floods during winter and heat waves during summer are becoming more frequent in the region. These conditions are direct consequences of global climatic changes that have recently been affecting several locations, which are dramatically impacting wide ranges of ecosystems [1] . The Fourth Assessment Report of the Intergovernmental Panel on Climate Change (IPCC), issued in 2007, has pointed out that decreases in the amount of precipitation and other extreme climate events, including hot extremes, heat waves are very likely to become more frequent in multitudes and subtropical land regions [2] . There are many natural processes that influence the climate on the earth. These processes include volcanic activity, which is known to cause cooling of the surface temperature, variations in solar activity such as sunspots and length of their cycle and orbital changes that affect the interception of sunlight by the earth. Such impacts are beyond human influence and will continue to affect the climate in the future. In addition, there are significant anthropogenic climate changes that result from human activity, particularly the unusual increase in the concentration of greenhouse gasses in the atmosphere, mainly carbon dioxide from burning fossil fuel. The Fourth IPCC came up with solid conclusions that most of the global warming that has been observed over the last 50 years is attributed to human activities [2] . Jordan climate during geological eras: The climate in Jordan experienced several climactic changes through
-
Upload
independent -
Category
Documents
-
view
4 -
download
0
Transcript of Climate change in Jordan: a comprehensive examination approach

American Journal of Environmental Sciences 5 (1): 58-68, 2009 ISSN 1553-345X © 2009 Science Publications
Corresponding Author: Moshrik R. Hamdi, The Hashemite University, P.O. Box 150459, Zarqa, Jordan 13115 Tel: + 962 5 390 3333/Ext. 4476 Fax: + 962 5 382 6823
58
Climate Change in Jordan: A Comprehensive Examination Approach
1Moshrik R. Hamdi, 2Mahmoud Abu-Allaban, 3Ammar Al-Shayeb,
3Mohammed Jaber and 4Naill M. Momani 1Department of Land Management and Environment,
2Department of Water Management and Environment, The Hashemite University, P.O. Box 150459, Zarqa 13115, Jordan
3Department of Water Management and Environment, The Hashemite University, P.O. Box 150459, Zarqa 13115, Jordan
4Consortium Consultants for Safety and Environment, Abu-Dhabi, UAE
Abstract: Problem statement: Jordan is experiencing harsh water shortage in different parts of the country due to high fluctuations in annual precipitation; the only source of water. In addition, heat waves are becoming more frequent in the region. Precipitation decrement and summer heat waves are being blamed on global warming. This study aimed to detect trends in weather parameters in Jordan. Approach: Data from six meteorological stations distributed around Jordan were analyzed using several parametric and nonparametric statistical approaches including Mann-Kendall, Linear Regression, Cusum, Rank Sum, Student's t-test, Rank Difference, Auto Correlation and Skewness-Kurtosis Normality test. Results: The results indicated that there are no visible trends indicating an increase or decrease in the annual precipitation and maximum temperature. However, there are good to strong trends indicating that annual minimum temperature has increased in the last decade while annual temperature range has decreased. Conclusion: Decreasing temperature range proved that the Earth’s atmosphere is becoming more efficient in trapping terrestrial infrared radiation, which is accountable for the global warming. Key words: Climate change, Jordan, air temperature, relative humidity, precipitation, statistical tests
INTRODUCTION
Jordan is a Mediterranean country that depends mostly on rain as its main water resource. Recent years have witnessed shortage in the rainfall in different parts of the country. As a result, numerous streams have dried out, underground water level has fallen to critical levels and most water aquifers are experiencing high concentrations of Total Dissolved Solids (TDS), which makes them unsuitable for domestic or irrigation uses. In addition, extreme weather conditions such as flash floods during winter and heat waves during summer are becoming more frequent in the region. These conditions are direct consequences of global climatic changes that have recently been affecting several locations, which are dramatically impacting wide ranges of ecosystems[1]. The Fourth Assessment Report of the Intergovernmental Panel on Climate Change (IPCC), issued in 2007, has pointed out that decreases in the amount of precipitation and other extreme climate events, including hot extremes, heat waves are very
likely to become more frequent in multitudes and subtropical land regions[2]. There are many natural processes that influence the climate on the earth. These processes include volcanic activity, which is known to cause cooling of the surface temperature, variations in solar activity such as sunspots and length of their cycle and orbital changes that affect the interception of sunlight by the earth. Such impacts are beyond human influence and will continue to affect the climate in the future. In addition, there are significant anthropogenic climate changes that result from human activity, particularly the unusual increase in the concentration of greenhouse gasses in the atmosphere, mainly carbon dioxide from burning fossil fuel. The Fourth IPCC came up with solid conclusions that most of the global warming that has been observed over the last 50 years is attributed to human activities[2]. Jordan climate during geological eras: The climate in Jordan experienced several climactic changes through

Am. J. Environ. Sci., 5 (1): 58-68, 2009
59
history. During the geological ages that precede the Pleistocene, Jordan was submerged in water. This submergence occurred during the early Cambrian, early Ordovician, Silurian, Mid-Devonian, late-Carbonian, Triassic, late Grecian and lower Crelacous[3]. During the remaining geological ages, the Tythes water recessed and Jordan experienced dry continental climate. This is evident from the Nubian Sandstone that dominates the geological foundations in different parts of Jordan[4,5]. The Pleistocene and the Holocene eras had the last climatic changes that marked important impacts. It is commonly believed that the changes that happened during Pleistocene and the Holocene have left important impacts on the landscape and the environmental ecosystems[6] in semi tropical areas. During the Pleistocene era, the northern Hemisphere witnessed several major climatic changes. Four climatic changes were accompanied by glaciations and heavy rain fall (pluvial) in med and upper latitudes. Each two glaciations in row were separated by warm and dry periods (interpluvial) [7]. Several climatic benchmarks were recorded during the Pleistocene era. Pluvials were associated with excess number of intensified low pressure systems in the region[8]. Precipitation was not restricted to wintertime, instead significant amounts of precipitations used to take place during the spring and autumn. As a result of high precipitations, the region contained several fresh-water lakes[9] and the Dead-Sea was much larger encompassing a large portion of the Rift Valley[10]. Precipitation changes have continued during new history. Table 1 summarizes the heavy-rain and the dry periods since the Christ[6]. Immense efforts have been spent to detect current climate changes in North American, Europe, Russia and Australia, but only few such studies have been conducted in Jordan and neighboring countries. Cohen and Stunhill[11] analyzed daily records of temperature, rainfall and global irradiance at three locations in the Jordan Valley. Their findings revealed significant decreasing trend in annual maximum mean temperatures, no significant trends in annual rainfall and an increasing (but inconsistent) trend in the annual mean minimum temperatures. Hasanean[12] investigated the trends in air temperature series from eight meteorological stations in the East Mediterranean including Amman. He found a negative trend at a 95% confidence level. His findings showed a 2°C increasing trend in minimum temperatures and a 1°C decreasing trend in maximum temperatures.
Table 1: Dry and wet periods since the Christ[6] Date Rain Date Rain 500 BC Heavy rain 1310-1428 Very dry 400-200 BC Dry 1428-1460 Heavy rain 200BC 180 AC Heavy rain 1460-1640 Dry 180-390 Dry 1540-1680 Heavy rain 390-415 Rainy 1680-1708 Dry 415-670 Very dry 1708-1838 Rain 670-925 Heavy rain 1838-1875 Dry 925-1100 Very dry 1875-1900 Rain 1100-1310 Heavy rain 1901- Very dry Smadi and Zghoul[13] examined changes, trends and fluctuations in the total rainfall and number of rainy days at Amman Airport Meteorological station in Jordan during the period 1922-2003. Their statistical analysis detected a sudden change and shift in the average total rainfall and annual number of rain days that occurred in 1957. Abu-Taleb et al.[14] looked at changes in annual and seasonal relative humidity variations in five stations around Jordan. Their analysis indicates an increasing trend in relative humidity at all different stations. They also noticed a major change point in the annual relative humidity in 1979. Above studies have come up with important findings, they pointed out that Jordan is indeed being affected by the global warming, although they have either focused on only one meteorological parameter at a time, or they were restricted to certain geographical locations, particularly Amman Airport station. In this study more meteorological parameters are considered and several trend tests are applied in order to have a comprehensive image about what is going on in real world in Jordan. This study aimed at studying climate parameters including precipitation, relative humidity and air temperature in order to find out if global climate changes and how global warming are impacting the climate in Jordan. We also examined some of the meteorological variables concerning climate change in Jordan other than exploring choices involved in the methodology in detecting temporal trends, changes and randomness. Types of trend hypothesis were discussed, i.e., step trend versus monotonic trend as well as the statistical category to employ: parametric versus non-parametric. Also, light was shed on data analysis so that best and legitimate results were achieved through choosing and using of a proper trend technique for that analysis from a wide variety of trend detection methods.
MATERIALS AND METHODS Data collection: In studying climate change we have needed data about many climate elements like relative humidity, rainfall averages, minimum and maximum air

Am. J. Environ. Sci., 5 (1): 58-68, 2009
60
temperature, studying historic climate of the area of Middle East and Jordan and reviewing previous studies that predicted so many changes on climate in Jordan. Available selected meteorological data were retrieved from six different observation weather stations with medium to long term annual records. Records were ranging between 30-83 years. The stations are located in different geographical and biomes in Jordan. These stations comply by the requirement of the World Metrological Organization regulations. We assume that the data sets used in this study were collected and reported in a consistent and reliable manner. These data were obtained from Jordanian Department of Meteorology. Analysis of databases was carried out using different statistical methods depending on the distribution pattern of characteristics and other specific features. Statistical analysis: Statistics can be a useful tool for analyzing and drawing meaningful conclusions about characteristics associated with the meteorological data set used in this study. We think that the strict standardization of methods selected in this study is required for proper application of statistical techniques and to proper interpretation of these data for trends and change. In this manuscript we examine several simple statistical approaches both parametric and non-parametric to detect significant, providing evidence, not proof of trend, changes, randomness and normality. Trend is a monotonic or step change in the level of the time series, i.e., a general increase or decrease in observed values of the studied meteorological random variables over time. It is preferable to think of trend tests as a quantitative basis for deciding whether apparent trends are real[15]. Keeping in mind the advantages and drawbacks of both parametric and non-parametric tests, an adequate approach to analyze data is to use the appropriate tests, regardless if they are parametric or non-parametric. Non-parametric tests (distribution free) make no prior assumption(s) for probability distribution which does not depend upon the form of the underlying distribution of the null hypothesis that meant for testing certain hypothesis. These tests tend to ignore the magnitude of the observations in favor of the relative values or ranks of the data. They are preferable tests when implicit assumptions about the data are not met which is sometimes the case in real applications. In addition, these tests tend to be simple in design, easy to understand, used to model both liner and non-linear relations and used for evenly and unevenly spaced observations.
Most non-parametric methods can work with short series (5 or more observations) and handle unequally spaced, ties and missing data. These methods are convenient to use in investigations of multiple data sets because exhaustive checking of distributional assumptions is not required. The tests are designed for use with data expressed in a nominal or ordinal scale. Furthermore, many difficulties which appear to make the data unusable with a parametric technique can in fact, be overcome using non-parametric ones. Therefore, fewer assumptions have to be made about the data. On the other hand, parametric tests assume that the time series data and the errors (deviations from the trend) follow a normal distribution with homogeneous variance. In general, these tests are more powerful for given n when the variable is normally distributed, but much less powerful when it is not, compared with the non-parametric tests[16]. Testing data to ensure that these assumptions are met can become tedious especially when many trends need to be examined. These tests are useful as they also quantify the change in mean or gradient of trend in the data. The dividing line between parametric and non-parametric tests is not a sharp one[17]. All tests used in this research are considered confirmatory data analysis tools which designed for specifically testing certain hypotheses. Appropriate parametric tests can overcome some difficulties of series instability that encountered with the used data. Although meteorological time series are occasionally not normally distributed and contain properties that are undesirable for use with parametric tests[18], Skewness-Kurtosis Normality test was conducted in this study. Unlike other normality tests, this specific test is not affected by ties. In this case, we resort to use distribution free methods rather than parametric ones. Skewness-kurtosis normality test was implemented in this study to test all used data for normality. Null hypothesis of normality test states that the used data are normally distributed. Passing the normality test only allows stating no significant departure from normality is found. It is widely recognized that non-parametric procedures can have significantly higher power and efficiency than parametric procedures in cases where there is a substantial departure from normality and the sample size is large which is commonly encountered for many climate change variables[19]. Even for small departures from normality, the performance of the non-parametric procedures is similar to or better than that for the parametric procedures.
Am. J. Environ. Sci., 5 (1): 58-68, 2009
61
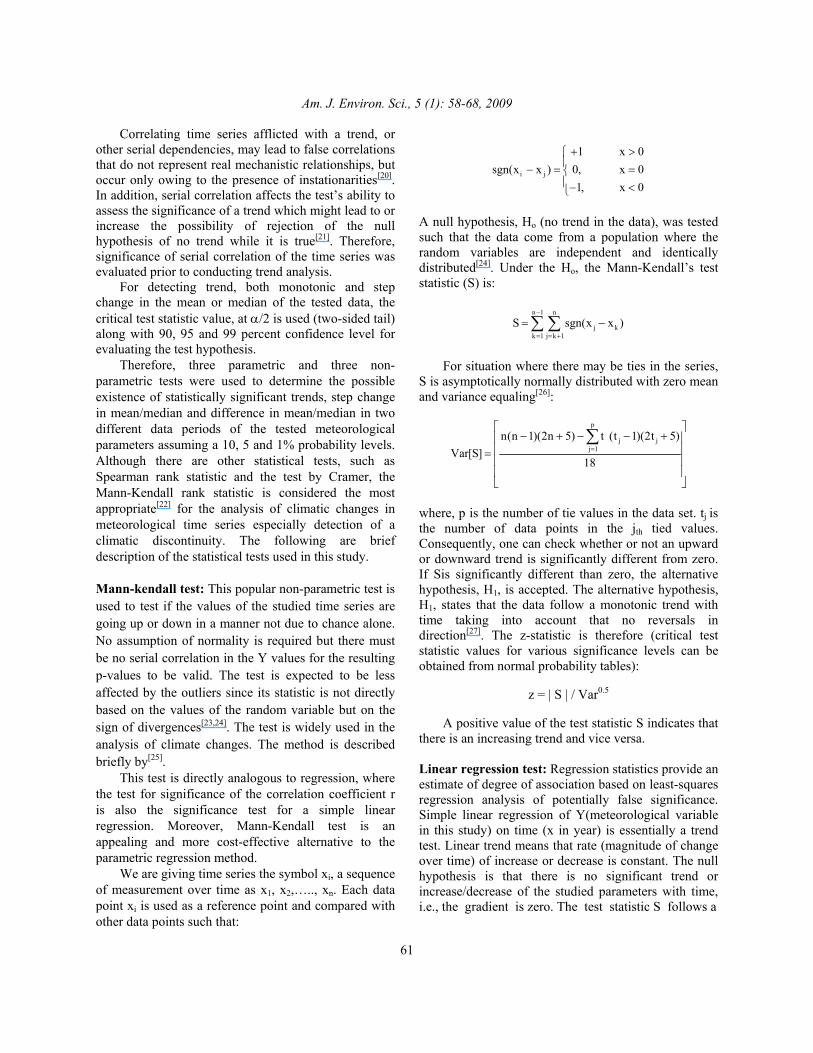
Correlating time series afflicted with a trend, or other serial dependencies, may lead to false correlations that do not represent real mechanistic relationships, but occur only owing to the presence of instationarities[20]. In addition, serial correlation affects the test’s ability to assess the significance of a trend which might lead to or increase the possibility of rejection of the null hypothesis of no trend while it is true[21]. Therefore, significance of serial correlation of the time series was evaluated prior to conducting trend analysis. For detecting trend, both monotonic and step change in the mean or median of the tested data, the critical test statistic value, at α/2 is used (two-sided tail) along with 90, 95 and 99 percent confidence level for evaluating the test hypothesis. Therefore, three parametric and three non-parametric tests were used to determine the possible existence of statistically significant trends, step change in mean/median and difference in mean/median in two different data periods of the tested meteorological parameters assuming a 10, 5 and 1% probability levels. Although there are other statistical tests, such as Spearman rank statistic and the test by Cramer, the Mann-Kendall rank statistic is considered the most appropriate[22] for the analysis of climatic changes in meteorological time series especially detection of a climatic discontinuity. The following are brief description of the statistical tests used in this study. Mann-kendall test: This popular non-parametric test is used to test if the values of the studied time series are going up or down in a manner not due to chance alone. No assumption of normality is required but there must be no serial correlation in the Y values for the resulting p-values to be valid. The test is expected to be less affected by the outliers since its statistic is not directly based on the values of the random variable but on the sign of divergences[23,24]. The test is widely used in the analysis of climate changes. The method is described briefly by[25]. This test is directly analogous to regression, where the test for significance of the correlation coefficient r is also the significance test for a simple linear regression. Moreover, Mann-Kendall test is an appealing and more cost-effective alternative to the parametric regression method. We are giving time series the symbol xi, a sequence of measurement over time as x1, x2,….., xn. Each data point xi is used as a reference point and compared with other data points such that:
i j
1 x 0sgn(x x ) 0, x 0
1, x 0
+ >− = =− <
A null hypothesis, Ho (no trend in the data), was tested such that the data come from a population where the random variables are independent and identically distributed[24]. Under the Ho, the Mann-Kendall’s test statistic (S) is:
n 1 n
j kk 1 j k 1
S sgn(x x )−
= = +
= −∑ ∑
For situation where there may be ties in the series, S is asymptotically normally distributed with zero mean and variance equaling[26]:
p
j jj 1
n(n 1)(2n 5) t (t 1)(2t 5)Var[S]
18=
− + − − +
=
∑
where, p is the number of tie values in the data set. tj is the number of data points in the jth tied values. Consequently, one can check whether or not an upward or downward trend is significantly different from zero. If Sis significantly different than zero, the alternative hypothesis, H1, is accepted. The alternative hypothesis, H1, states that the data follow a monotonic trend with time taking into account that no reversals in direction[27]. The z-statistic is therefore (critical test statistic values for various significance levels can be obtained from normal probability tables):
z = | S | / Var0.5
A positive value of the test statistic S indicates that there is an increasing trend and vice versa. Linear regression test: Regression statistics provide an estimate of degree of association based on least-squares regression analysis of potentially false significance. Simple linear regression of Y(meteorological variable in this study) on time (x in year) is essentially a trend test. Linear trend means that rate (magnitude of change over time) of increase or decrease is constant. The null hypothesis is that there is no significant trend or increase/decrease of the studied parameters with time, i.e., the gradient is zero. The test statistic S follows a

Am. J. Environ. Sci., 5 (1): 58-68, 2009
62
student-t distribution with n-2 degrees of freedom under the null hypothesis. If the gradient (trend) is positive or negative, then null hypothesis will be rejected. This parametric test assumes that the data are normally distributed and that the errors (deviations from the trend) are independent and follows the same normal distribution with zero mean. Also, the test can be used with both evenly or unevenly spaced observations. Moreover, the test is not very sensitive to small deviations but very sensitive to outliers, abnormally high or low values at the start or end of a series will influence on the estimate of gradient[28]. The regression gradient is estimated by:
n
i ii 1
n2
ii 1
(x x)(y y)b
(x x)
=
=
− −=
−
∑
∑
and a y bx= −
The test statistic S is:
bS =σ
Where n
i ii 1
2
12 (y a bx )
n(n 2)(n 1)=
− −σ =
− −
∑
CUSUM test: This is a distribution free technique tests whether the means in two parts of a time series are different (for an unknown change in time). The CUmulative SUM test is based on the cumulative sums charts to detect systematic changes over time in one or more measured variables[29]. The null hypothesis, H0, for this test is no step jump or change in the mean/median. This means that the data collected before a specific time is from a clearly different population than the data collected after that time. The test statistic of the studied time series is:
k
k i mediani 1
V sgn(x x )=
= −∑
where, k = 1, 2,….., n and
1 x 0sgn(x) 0, x 0
1, x 0
+ >= =− <
xmedian is the median value of xi time series data set. The distribution of test statistic, Vk, follows the Kolmogorov-Smirnov two-sample statistic. A negative value of Vk indicates that the latter part of the record has a higher mean than the earlier part and vice versa. Note that the separation period can be determined in this test[27]. Worsley likelihood ratio test: This is a parametric test assumes that the data are normally distributed. The likelihood ratio Technique detects whether the means in two parts of a record are different (for an unknown time of change). The deviation from the means are calculated as[30]:
k
k ii 1
S (x x)=
= −∑
where, k = 1, 2,….n Depending on their position in the time series the test weights the values of Sk such that:
0.5*k kZ k(n k) S−= −
*
** kk
x
ZZD
=
The test statistic W is:
0.5
2 0.5
(n 2) VW(1 V )−
=−
where **kV max Z=
A negative value of W indicates that the latter part of the record has a higher mean than the earlier part and vice versa[27]. The null hypothesis Ho here is no step change in the mean between two data periods. Both CUSUM and this test are used in this study when the meteorological records being analyzed are naturally broken into two distinct periods. Rank-sum test: This non-parametric technique tests whether the medians in two different periods are different. In this test the data ranked from 1 (smallest) to N (largest) using an average of ranks when ties exist in the data set. S statistic is the sum of ranks of observations in the n group (smaller group) and m, the larger group. The null hypothesis Ho of this test is no difference in the median between two data periods. The theoretical mean and standard deviation of S under the null hypothesis is:

Am. J. Environ. Sci., 5 (1): 58-68, 2009
63
0.5
n(N 1)2
nm(N 1)12
+µ =
+ σ =
The test statistic, Zrs is approximately normally distributed and is equal to[31]:
rs
(S 0.5 ) / if SZ 0 if S
| S 0.5 | / if S
− − µ σ > µ= = µ + − µ σ < µ
The rank sum for related samples represents non-parametric alternatives to the t-test. The main limit of rank sum test is that it was originally designed for detecting single point-changes. Differently, the Mann-Kendall and CUSUM tests as examples are non-parametric tests particularly suitable in sequential analysis[32]. Considerations of power and efficiency were taken when decided to choose these tests. Student’s t-test: The test is one of the simplest parametric techniques for testing a signal change of the mean value on the basis of a difference between sample means[33]. The test assumes that the data are normally distributed which tests whether the means in two different periods of the studied time series are different. The null hypothesis Ho states that no difference in the mean between two data periods:
x yt1 1Sn m
−=
+
x and y are the means of the first and second period, respectively. S is the standard deviation of the sample and m and n are the number of observations in the first and second periods respectively. Rank difference test: This test uses the ranks of the data rather than their raw values to calculate the statistic. This is done by replacing the n time series values by their relative ranks starting at 1 for the lowest up to n. The statistic U is the sum of the absolute rank differences between successive ranks as shown in the following formula[34]:
n
i i 11 2
U | R R |−=
= −∑
The null hypothesis Ho for this test is that the data come from a random process. For large n, the statistic U
is normally distributed with the following mean and variance: µ = (n+1) (n-1)/3 σ = (n-2) (n+1)(4n-7)/90 To find the z statistic, the following formula was used[31]:
0.5
| U |z − µ=
σ
Autocorrelation test: Autocorrelation or serial correlation can be defined as a measurement which at one time period reflects the level of the tested variable at a previous time period. In other words, the extra data does not provide any new information. Under realistic stochastic processes (exhibiting seasonality, skewness and serial correlation), it is robust in comparison to parametric alternatives. The null hypothesis Ho for this test is that the data come from a random process. In general, most, but not all, time-series data with time steps shorter than the annual time step are serially correlated. This parametric test is used to test if the time series data used in this study is serially correlated. An autocorrelation function at lag one is suggested by many researchers as a parametric test for finding trends which is more powerful than those provided by the Mann-Kendall statistic for detecting trends especially when used for discovering purely stochastic trends[31]. The lag one autocorrelation coefficient is calculated as:
n 1
i i 1i 1
1 n2
ii 1
x x)(x x)r
(x x)
−
+=
=
− −
=
−
∑
∑
The mean and the variance given that the data come from a random process are: E(r1) = -1/n
3 2
1 2 2
(n 3n 4)Var(r )[n (n 1)]− +
=−
Then the z statistic is:
0.51 1 1Z r E(r ) / Var(r )= −
RESULTS
Outputs of the eight statistical tests are summarized in Table 2-6. As could be inferred from Table 2, there is no sound evidence that there are increasing or decreasing trends in the relative humidity records at Baqoura, Amman Airport and Queen Aliaa' Airport. At
Am. J. Environ. Sci., 5 (1): 58-68, 2009
64
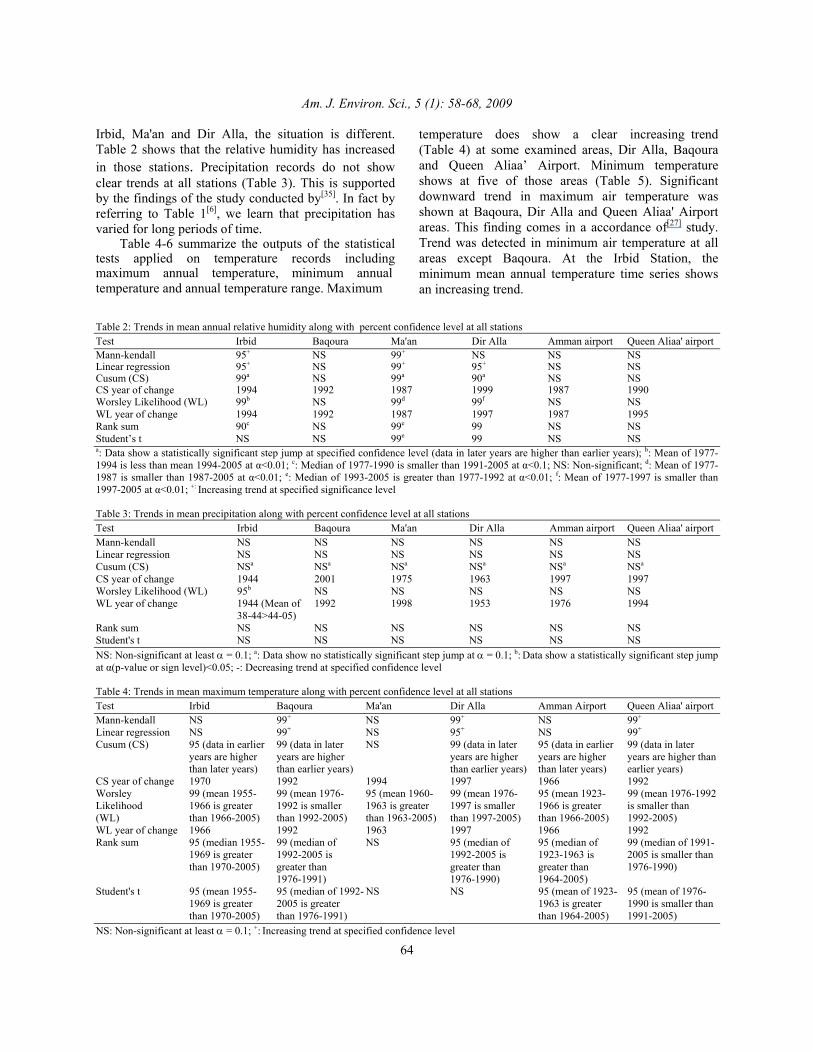
Irbid, Ma'an and Dir Alla, the situation is different. Table 2 shows that the relative humidity has increased in those stations. Precipitation records do not show clear trends at all stations (Table 3). This is supported by the findings of the study conducted by[35]. In fact by referring to Table 1[6], we learn that precipitation has varied for long periods of time. Table 4-6 summarize the outputs of the statistical tests applied on temperature records including maximum annual temperature, minimum annual temperature and annual temperature range. Maximum
temperature does show a clear increasing trend (Table 4) at some examined areas, Dir Alla, Baqoura and Queen Aliaa’ Airport. Minimum temperature shows at five of those areas (Table 5). Significant downward trend in maximum air temperature was shown at Baqoura, Dir Alla and Queen Aliaa' Airport areas. This finding comes in a accordance of[27] study. Trend was detected in minimum air temperature at all areas except Baqoura. At the Irbid Station, the minimum mean annual temperature time series shows an increasing trend.
Table 2: Trends in mean annual relative humidity along with percent confidence level at all stations Test Irbid Baqoura Ma'an Dir Alla Amman airport Queen Aliaa' airport Mann-kendall 95+ NS 99+ NS NS NS Linear regression 95+ NS 99+ 95+ NS NS Cusum (CS) 99a NS 99a 90a NS NS CS year of change 1994 1992 1987 1999 1987 1990 Worsley Likelihood (WL) 99b NS 99d 99f NS NS WL year of change 1994 1992 1987 1997 1987 1995 Rank sum 90c NS 99e 99 NS NS Student’s t NS NS 99e 99 NS NS a: Data show a statistically significant step jump at specified confidence level (data in later years are higher than earlier years); b: Mean of 1977-1994 is less than mean 1994-2005 at α<0.01; c: Median of 1977-1990 is smaller than 1991-2005 at α<0.1; NS: Non-significant; d: Mean of 1977-1987 is smaller than 1987-2005 at α<0.01; e: Median of 1993-2005 is greater than 1977-1992 at α<0.01; f: Mean of 1977-1997 is smaller than 1997-2005 at α<0.01; +: Increasing trend at specified significance level Table 3: Trends in mean precipitation along with percent confidence level at all stations Test Irbid Baqoura Ma'an Dir Alla Amman airport Queen Aliaa' airport Mann-kendall NS NS NS NS NS NS Linear regression NS NS NS NS NS NS Cusum (CS) NSa NSa NSa NSa NSa NSa CS year of change 1944 2001 1975 1963 1997 1997 Worsley Likelihood (WL) 95b NS NS NS NS NS WL year of change 1944 (Mean of 1992 1998 1953 1976 1994 38-44>44-05) Rank sum NS NS NS NS NS NS Student's t NS NS NS NS NS NS NS: Non-significant at least α = 0.1; a: Data show no statistically significant step jump at α = 0.1; b: Data show a statistically significant step jump at α(p-value or sign level)<0.05; -: Decreasing trend at specified confidence level Table 4: Trends in mean maximum temperature along with percent confidence level at all stations Test Irbid Baqoura Ma'an Dir Alla Amman Airport Queen Aliaa' airport Mann-kendall NS 99+ NS 99+ NS 99+ Linear regression NS 99+ NS 95+ NS 99+ Cusum (CS) 95 (data in earlier 99 (data in later NS 99 (data in later 95 (data in earlier 99 (data in later years are higher years are higher years are higher years are higher years are higher than than later years) than earlier years) than earlier years) than later years) earlier years) CS year of change 1970 1992 1994 1997 1966 1992 Worsley 99 (mean 1955- 99 (mean 1976- 95 (mean 1960- 99 (mean 1976- 95 (mean 1923- 99 (mean 1976-1992 Likelihood 1966 is greater 1992 is smaller 1963 is greater 1997 is smaller 1966 is greater is smaller than (WL) than 1966-2005) than 1992-2005) than 1963-2005) than 1997-2005) than 1966-2005) 1992-2005) WL year of change 1966 1992 1963 1997 1966 1992 Rank sum 95 (median 1955- 99 (median of NS 95 (median of 95 (median of 99 (median of 1991- 1969 is greater 1992-2005 is 1992-2005 is 1923-1963 is 2005 is smaller than than 1970-2005) greater than greater than greater than 1976-1990) 1976-1991) 1976-1990) 1964-2005) Student's t 95 (mean 1955- 95 (median of 1992- NS NS 95 (mean of 1923- 95 (mean of 1976- 1969 is greater 2005 is greater 1963 is greater 1990 is smaller than than 1970-2005) than 1976-1991) than 1964-2005) 1991-2005) NS: Non-significant at least α = 0.1; +: Increasing trend at specified confidence level

Am. J. Environ. Sci., 5 (1): 58-68, 2009
65
Table 5: Trends in mean minimum temperature along with percent confidence level at all stations Test Irbid Baqoura Ma'an Dir Alla Amman airport Queen Aliaa' airport Mann-Kendall 99+ NS 95+ 99+ 99+ NS Linear regression 99+ NS 90+ 99+ 99+ 90- Cusum (CS) 99 (data in later NS 99 (data in later 99 (data in later 99 (data in later NS years are higher years are higher years are higher years are higher than earlier years) than earlier years) than earlier years) than earlier years) CS year of change 1997 1997 1992 1993 1983 1992 Worsley 99 (mean of 1955- 90 (mean of 1976- 99 (mean of 1960- 99 (mean of 1976- 99 (mean of 1923- 99(mean of 1960- Likelihood 1993 is smaller 1997 is smaller 1993 is smaller 1993 is smaller 1993 is smaller 1999 is greater than (WL) than 1993-2005) than 1997-2005) than 1993-2005) than 1993-2005) than 1993-2005) 1999-2005) WL year of change 1993 1997 1993 1993 1993 1999 Rank Sum 99 (median of 1955- NS 95 (median of 1983- 99 (median of 1991 NS NS 1979 is smaller 2005 is smaller -2005 is smaller than 1980-2005) than 1960-1982) than 1976-1990) Student's t 95 NS NS NS NS NS NS: Non-significant at least α = 0.1; +: Increasing trend at specified confidence level Table 6: Trends in annual temperature range along with percent confidence level at all stations Test Irbid Baqoura Ma'an Dir Alla Amman airport Queen Aliaa' airport Mann-kendall 99- 99+ 95- NS 99- 99+ Linear regression 99- 99+ 99- NS 99- 99+ Cusum (CS) 95 (data in earlier 99 (data in later NS NS 99 (data in earlier 99 (data in later years are higher years are higher years are higher years are higher than later years) than earlier years) than later years) than earlier years) CS year of change 1978 1996 2005 1990 1979 1998 Worsley 99 (mean 1955- 99 (mean 1976- 99 (mean 1960- NS 99 (mean of 1923- 95 (mean 1976- Likelihood 1965 is grater 1984 is smaller 1964 is greater 1979 is greater 1999 is smaller than (WL) than 1965-2005) than 1984-2005) than 1964-2005) than 1979-2005) 1999-2005) WL year of change 1965 1984 1964 2003 1979 1999 Rank sum 99 (median 1955- 99 (median 1991- NS NS 99 (median 1923- 99 (median 1992- 1979 is greater 2005 is smaller 1963 is greater 2005 is greater than than 1980-2005) than 1976-1990) than 1964-2005) 1976-1990) Student's t 95 (mean 1955- NS 99 (mean 1960- 99 (mean 1976- 95 (mean 1923- 99 (mean 1976- 1979 is greater 1982 is greater 1990 is greater 1963 is greater 1991 is smaller than than 1980-2005) 1983-2005) than 1991-2005) than 1964-2005) 1992-2005) Rank Difference 99 95 NS NS 99 99 Auto Correlation 99 NS NS NS 99 99 Skewness-kurtosis Fail Pass Fail Pass Fail Pass normality NS: Non-significant at least α = 0.1; +: Increasing trend at specified confidence level; -: Decreasing trend at specified confidence level In Amman Airport station where the longest meteorological records exist, a clear positive (increasing) trend in the minimum mean annual temperature is observed using both the Mann-kendall and simple linear regression tests at 99% significance level. Moreover, Annual temperature range is showing a clear decreasing trend (Table 6).
DISCUSSION Table 2 shows that the relative humidity has increased in those stations, however, this increase is not sufficient to conclude a climate change. There are other factors that contribute to the increasing moisture content in the atmosphere including water bodies and green lands. The last decades have witnessed extensive efforts to increase areas of irrigated cultivated lands in the Jordan valley through constructing a long canal to
carry water from Yarmouk River to southern parts of the valley. New cultivated areas have flourished in several parts of the valley including Dir Alla, which used to be a barren dry land. Last decades have also witnessed constructing several dams, artificial lakes and wastewater treatment plants. Irbid governorate is hosting several water projects including Wadi Araba Dam, Alwihda Dam and a wetland for wastewater treatment at Rumtha, 15 km to the north-east of Irbid City. Furthermore, the people of Irbid have abandoned cultivating traditional crops, basically grains. Irbid meadows hosted flourished wheat and barley agriculture in the past. Grains were usually harvested around the end of spring (April and May) leaving behind thousands acres of dry soil. Currently, Irbidies are active in cultivating Olive trees on their lands including areas that were never cultivated in the past. Olive trees are evergreen trees, therefore
Am. J. Environ. Sci., 5 (1): 58-68, 2009
66
they act as natural humidifiers through their transpiration and exhaling processes. Ma'an has also witnessed an increase in agricultural activities in its surrounding due to the availability of fresh ground water. Thousands of wells have been drilled in the past few years to provide huge areas with water necessary for cultivating potato, watermelon and fruit orchards in both sides of Wadi Araba, which is located upwind from Ma'an. Other mega projects aiming to flourish agriculture are also available in the eastern and southern parts of Ma'an governorate including the ones in the northern parts of Saudi Arabia. Table 6 shows that precipitation has varied for long periods of time. Since detecting increasing or decreasing trends in precipitation requires data from hundreds of years and our data was collected in less than a 100 year span, it might be difficult to detect trends in such a short time interval. We anticipate that in the next 50 years it might be possible to have strong evidences of decreasing precipitation trends. Annual temperature range is showing a clear decreasing trend (Table 6), which means that the Earth Atmosphere has become more efficient in preserving its energy for longer durations. Dir Alla is one of the stations located in the Jordan Valley, an area characterized with relatively high air temperature: very hot in summer and warm in winter. Observed mean daily minimum and maximum temperature ranges between 9 and 39°C. The Jordan Valley, a vegetable basket of Europe and winter resort is considered a natural greenhouse which makes it one of the climatically unique spots in the region. The longest meteorological records at Amman station, shows a clear positive (increasing) trend in the minimum mean annual temperature. This might confirm the fact of greenhouse effect gases that rises minimum temperatures by warming gases. At the Irbid Station, the minimum mean annual temperature time series shows an increasing trend. This trend in temperatures will increase the demand for agricultural and urban domestic water use and encourage eutrophication in streams and lakes that affect freshwater ecosystem. Moreover, in arid and semi-arid regions such as Jordan, changes in temperature will increase the evapotranspiration, reducing optimality of plants, water stress which leads to a significant reduction of food production. This increases risk of desertification in those areas not to mention many bio-physical and social impacts. Furthermore, rising temperatures increases energy consumption for cooling. Mortality rates would also
rise during the winter months and hot summers. Individuals in developed countries will be vulnerable to heat which increases by virtue of circulatory problems related to vascular and heart disease[36] However, long-term time series, which are not available in most developing countries, are required to define a definite climatic trend.
CONCLUSION In this study we attempted to detect and quantify evidences of climatic change in Jordan. Data from six meteorological stations at Irbid City, Baqoura, Dir Alla, Ma'an, Amman Airport and Queen Aliaa' Airport were examined using several tests in order to detect any changes in air temperature, relative humidity and precipitation over last decades. our findings revealed that minimum air temperature has increased since the seventies of the last century. This increase indicates a slight change in regional climate. Rainfall records have revealed that precipitation has been fluctuating at all stations and no statistical trends of increase or decrease in the annual precipitations indicating climatic change were detected. Relative humidity records do not indicate clear trends at Baqoura, Amman Airport and Queen Aliaa' Airport. However, it increased at the remaining three stations. The relative humidity increases at Irbid, Dir Alla and Ma'an may not be considered a consequence of global warming or an indication of climate change because it was accompanied by rapid growth in cultivated areas and mega hydro-projects. Annual maximum air temperature records do not show clear trends, but annual minimum temperatures have increased while the annual range of temperature have decreased. Decreasing temperature range proves that the earth is becoming more efficient in trapping terrestrial infrared radiation, which is responsible of the global warming.
REFERENCES 1. Walther, G.R., E. Post, P. Convey, A. Menzel,
C. Parmesan, T.C.J. Beebee, J.M. Fromentin, O. Hoegh-Gulberg and F. Bairlen, 2002. Ecological responses to recent climate change. Nature, 416: 389-395. DOI: 10.1038/416389a.
2. Solomon, S., D. Qin and M. Manning, 2007. Intergovernmental Panel on Climate Change. The Physical Science Basis. Contribution of Working Group I. Cambridge University Press, New York, USA. http://www.ipcc.ch/.

Am. J. Environ. Sci., 5 (1): 58-68, 2009
67
3. Orni, E. and E. Efrat, 1971. Geography of Israel. 3rd Edn., Israel University Press, Jerusalem.
4. Abed, M.A., 1983. Geology of Jordan. Jordanian Geologists Ass, Amman-Jordan.
5. Burdon, D., 1959. Geology of Jordan. FAO and Government of Jordan, Amman.
6. Shehadeh, N., 1990. The Climate of Jordan. 1st Edn., Dar Al-Bashir, Amman-Jordan.
7. Butzer, K.W., 1963. The last pluvial phase of the euroafrican subtropics. Proceedings of the Rome Symposium on Changes of Climate, 1963, UNESCO Publications, Paris-France, pp: 211-217. http://unesdoc.unesco.org/Ulis/cgi-bin/ulis.pl?catno=69895&set=48D626E4_1_380&gp=0&lin=1.
8. Crowe, P.R., 1971. Concepts in Climatology. 3rd Edn., Longman, London. ISBN: 9780582481480.
9. Abed, M.A., 1983. Paleoclimates of the upper paleistocence in the Jordan rift. Proceeding of the 2nd International Congresss, Archaeol Jordan, pp: 81-94.
10. Schattner, I., 1962. The Lower Jordan Valley. Scripta Hierosolymitana II, Magnes Press, Jerusalem, pp: 123.
11. Cohen, S. and G. Stahill, 1996. Contemporary climate change in the Jordan valley. J. Applied Meteorol., 35: 1051-1058. DOI: 10.1175/1520-0450(1996)035<1051:CCCITJ>2.0.CO;2.
12. Hasanean, H.M., 2001. Fluctuations of surface temperature in the east mediterranean. Theor. Applied Climatol., 68: 75-87. DOI: 10.1007/s007040170055.
13. Smadi, M.M. and A. Zghoul, 2006. A sudden change in rainfall characteristics in Amman, Jordan during the mid 1950s. Am. J. Environ. Sci., 2: 84-91. http://www.scipub.org/fulltext/ajes/ajes2384-91.pdf.
14. Abu-Taleb, A.A., A.J. Alawneh and M.M. Smadi, 2007. Statistical analysis of recent changes in relative humidity in Jordan. Am. J. Environ. Sci., 3: 75-77. http://www.scipub.org/fulltext/ajes/ajes3275-77.pdf.
15. Loftis, J.C., R.C. Ward, R.D. Phillips and C.H. Taylor, 1989. An evaluation of trend detection techniques for use in water quality monitoring programs. http://catalogue.nla.gov.au/Record/4035044.
16. Hirsch, R.M., R.B. Alexander and R.A. Smith, 1991. Selection of methods for the detection and estimation of trends in water quality. Water Resourc. Res., 27: 803-813. DOI: 10.1029/91WR00259.
17. Kruskal, W.H. and J.M. Tanur, 1978. International Encyclopedia of Statistics. 2nd Edn., Free Press, New York, USA., ISBN: 9780029179604.
18. Hirsch, R.M. and J.R. Slack, 1984. A nonparametric trend test for seasonal data with serial dependence. Water Resourc. Res., 20: 727-732. DOI: 10.1029/WR020i006p00727.
19. Helsel, R.D. and R. M.Hirsch, 1988. Discussion of applicability of the t-test for detecting trends in water quality variables. Water Resourc. Bull., 24: 201-204. DOI: 10.1111/j.1752-1688.1988.tb00896.x.
20. Chatfield, C., 2004. The Analysis of Time Series: An Introduction. 6th Edn., Chapman and Hall/CRC Press, London, ISBN: 10: 1584883170, pp: 352.
21. Yue, S., P. Pilon and B. Phinney, 2003. Canadian stream flow trend detection: Impacts of serial and cross correlation. Hydrol. Sci. J., 48: 51-63. DOI: 10.1623/hysj.48.1.51.43478.
22. Goossens, C. and A. Berger, 1986. Annual and seasonal climatic variations of Northern Hemisphere and Europe over the last century. Ann. Geophys., 4: 385-400.
23. Kendall, M.G., 1975. Rank Correlation Methods. 4th Edn., Charles Griffin, London. ISBN: 0195205723.
24. Mann, H.B., 1945. Non-parametric test against trend. Econometrica, 13: 245-259. http://www.jstor.org/pss/1907187.
25. McBride, G., 2000, Anomalies and Remedies in Nonparametric Seasonal Kendall Trend Tests and Estimates. http://www.sflorida.er.usgs.gov/edl_data/text/anom.pdf.
26. Grayson, R.B., R.M. Argent, R.J. Nathan, T.A. McMahon and R. Mein, 1996. Hydrological Recipes: Estimation Techniques in Australian Hydrology, 1st Edn., Cooperative Research Centre for Catchment Hydrology, Melbourne, Australia, ISBN: 1876006137, pp: 125.
27. Montgomery, D.C., E.A. Peck and G.G Vining, 2001. Introduction to Linear Regression Analysis. 3rd Edn., John Wiley and Sons, New York, USA., ISBN: 10: 0471315656, pp: 672.
28. McGilchrist, C.A. and K.D. Woodyer, 1975. Note on a distribution free CUSU technique. Technometrics, 17: 321-325.
29. Worsley, K.J., 1979. On the likelihood ratio test for a shift in location of normal populations. J. Am. Stat. Assoc., 74: 365-367. http://www.jstor.org/stable/2286336.

Am. J. Environ. Sci., 5 (1): 58-68, 2009
68
30. Kundzewicz, Z.W. and A. Robson, 2004. Change detection in hydrological records-a review of the methodology. Hydrol. Sci. J., 49: 7-19. DOI: 10.1623/hysj.49.1.7.53993.
31. Manly, B.F.J. and D.I. MacKenzie, 2000. A cumulative sum type of method for environmental monitoring. Environmetrics, 11: 151-166. http://www3.interscience.wiley.com/journal/71004924/abstract.
32. Iman, R.L. and W.J. Conover, 1983. A Modern Approach to Statistics, 2nd Edn., John Wiley and Sons, New York, USA., ISBN: 0471096679.
33. Meacham, I., 1968. Correlation in sequential data-three sample indicators. Civil Eng. Trans. Inst. Eng. Aust., CE10: 225-228.
34. Freiwana, M. and M. Kadioˇglub, 2008. Climate variability in Jordan. Int. J. Climatol. 28: 69-89. DOI: 10.1002/joc.1512.
35. Allen Consulting Group, 2005. Climate Change Risk and Vulnerability: Promoting an efficient adaptation response in Australia, Final Report. http://www.climatechange.gov.au/impacts/publications/pubs/risk-vulnerability.pdf.