
AL-Zaytoonah University of Jordan
504
I AL-Zaytoonah University of Jordan The Faculty of Economics & Administrative Sciences The 15th Scientific Annual International Conference for Business Sustainability and Competitiveness in Business s 18 – 20 April 2016 ISBN 978-9957-8583-5-3 ISSN : 2231-827
-
Upload
khangminh22 -
Category
Documents
-
view
0 -
download
0
Transcript of AL-Zaytoonah University of Jordan

I
AL-Zaytoonah University of Jordan
The Faculty of Economics
&
Administrative Sciences
The 15th Scientific Annual
International Conference for Business
Sustainability and Competitiveness in
Business
s
18 – 20 April 2016
ISBN 978-9957-8583-5-3
ISSN : 2231-827

II
جميع الحقوق محفوظة
ال يسمح بإعادة إصدار هذا الكتاب او تخزينه في نطاق استعادة المعلومات
او نقلة او استنساخه بأي شكل من األشكال دون إذن خطي مسبق من رئاسة
.األردنية جامعة الزيتونة
كل ماورد في هذا الكتاب يعبر عن وجهات نظر الباحثين أنفسهم وال يعبر بالضرورة عن وجهات نظر رئاسة
.المؤتمر او سياسة جامعة الزيتونة األردنية
- (2016/4/1630) رقم اإلداع لدى المكتبة الوطنية- المملكة األردنية الهاشمية
ISBN 978-9957-8583-5-3

III
Participating Countries

IV
Objectives
The purpose of the conference is to explore inclusive business strategies with the aim
of strengthening the Competitiveness and sustainability.
In Business sustainable Competitiveness is much more than profitability through low
cost leadership or differentiation. It entails sustaining competitive advantage through
constant growth, creation and innovation.
At macro level, Sustaining competitive advantage involves effective managing of
resources, Knowledge assets and competencies. Further, sustainability is about
leveraging advantage and improving weaknesses to gain a greater added value for
Stakeholders and society.
Sustainability in business and the new network economy is a fundamental requirement
opportunities for excellence based on accumulated and renewable Knowledge of
individuals and organizations.
In this context, Faculty of economics and administrative sciences organized an
international conference which embraced on a major effort to deepen understanding of
how sustainability relates to competitiveness in business

V
Conference Themes
Sustainability and Competitiveness.
Strategy and sustainable advantage.
Measuring sustainable competitiveness.
Competitiveness innovations and knowledge economy.
Sustainability and Competitiveness in Business.
Sustainability and business intelligence.
The competitive advantage of nation.
Sustainable supply chain management
Sustainable business.
Competitiveness in Business.
Competitiveness in services Sector.
Sustainability and Social Networking.
Conference Committee
Chair Saad Ghaleb Yaseen (Ph.D)
Raed M. Al-Qirm (Ph.D)
Abdul-Aziz Al-Nedawy (Ph.D)
Osama Sameh Shaaban (Ph.D)
Saeb Farhan Al Ganidah (Ph.D)
Najim A. Najim (Ph.D)
Abdullah Khader Ateyah (Ph.D)
Nawaf Ahmad Al-Ghusain (Ph.D)
Dima Dajane (Ph.D)
Scientific Committee Saad G. Yaseen (Ph.D) HKJ Chair
Abbas Ali (Ph.D USA
Mohammad Nimat Elahee (Ph.D) USA
Steve Flowers (Ph.D) UK
Beverlee Anderson (Ph.D) USA
Nickolas Iberges (Ph.D) Greek
Nandish V. Patel (Ph.D) UK
Iwona Pawlas (Ph.D) Poland
Wolfgang Hinck (Ph.D) Germany
Haseeb Kebeer (Ph.D) UK
Anastasia Papazafeiropoulou (Ph.D) UK
Yogesh Dwivedi (Ph.D) UK
Zinal Arfeen Ahmad (Ph.D) Malaysia
Hans Leman (Ph.D) Newziland
Allam Ahmad (Ph.D) UK
Mousa Al-Louzi (Ph.D) HKJ
Mohet Fej (Ph.D) UAE

VI
Index Page
Numbers Paper Title Authors Institution Country
1 The Relationship between Sustainable Development and Fair Trade
Dr. Hany M. Elshamy Tanta University Egypt
7
Strategic Management and its Relationship to
Competitive Advantage A Field Study on Industrial
Food Companies in the Southern West Bank (Hebron, Jerusalem, Bethlehem)
Dr, Omar Jubraeel Jaber
Alslaibi Al-Quds University Palestine
17 Sustainability and Its Role in Organizational
Performance in The Jordanian Pharmaceutical Industry
DR. Abdulsattar H. Yousif
DR. Prof. Najm A. Najm Dr. Jasser Al Nasour
Al Zaytoonah University of
Jordan Jordan
30 The Case Of Usage of Letter of Credit in Turkey's Foreign Trade: A Sample of Participation Banks
Ahmet GÖKGÖZ
Erkam TEKÇE
Mustafa KEVSER
Yalova University Turkish
30 Sustainability Accounting Profession
Mohammed M. Yassin
Ahmad A. Abdallah
Omran A. Al-Ibbini
Al-Zaytoonah University of
Jordan Jordan
45 Affective Commitment Impact on Turnover Intentions in Jordanian Insurance Companies
Emil Abujaber Regent University Jordan
55 Justifying the Investment of Information Technology
Projects: A Case Study from Jordan
Qais Hammouri
Mai Al-Sebae Emad Abu-Shanab
Yarmouk University Jordan
65 Environment and sustainable development in Qat
Economic Dr. Mohammed Esmail Al-ab Sana’a University Yemen
78
Assessment of Profitability Competitiveness in Jordanian Banks- A Comparative Study between
Islamic and Conventional Banks
Madher Ebrahim Hamdallah
Anan Fathi Srouji
Al-Zaytoonah University of
Jordan Jordan
86
Sustainable Technology Adoption in a violence
context: The Case of Banking Services in the Republic of Yemen
Khaled Al-Qasa
Munadil K. Faaeq Universiti Utara Malaysia Malaysia
95 Factors influence Sustainability of E-Government
Services in Most Dangerous Country in the World
Dr. Munadil Khaleel Faaeq
Al-Sammarraie Alaa K.Faieq
Universiti Utara Malaysia
Baghdad University
Malaysia
Iraq
113
The impact of external public debt and Foreign Aid to
capital expenditure in Jordan (2000-2014) In light of the competitive advantage
Dr. Hana' Alhunaiti
Dr. Fozan Alhrout
The World Islamic Science &
Education University Jordan
122
The Effect of Low Morale and Motivation on Employees’ Productivity & Competitiveness in
Jordanian Industrial Companies
Dr. Osama Samih Shaban
Dr. Ziad Al-Zubi
Dr. Nafez Ali Dr. Mohammed Al-Attar
Al-Zaytoonah University of
Jordan Jordan
130
STATIC COGNITIVE SIMULATION MODEL
EVALUATING THREATS SURVIVABILITY OF COMPLEX TECHNICAL SYSTEMS
VYCHUZHANIN V.V
BOYKO V.D
Odessa national marine
university Ukraine
138
Constructing Sustainability and Competitiveness in
Jordanian Private Universities through a SWOT
Analysis Model
Majd Hassan Rayyan (PhD) University of Petra Jordan
146
Using The Unified Theory of Acceptance and Use of
Technology to Explain E-commerce Acceptance by
Jordanian Travel Agencies
Dr. Dima Dajani Al-Zaytoonah University of Jordan
Jordan
162
THE DEVELOPMENT OF USER INTERFACE
PROTOTYPE OF DECISION SUPPORT SYSTEM
FOR RISK MANAGEMENT OF COMPLEX
TECHNICAL SYSTEMS
VYCHUZHANIN V.V
RUDNICHENKO N.D
SHIBAEVA N.O
BOYKO V.D
Odessa national marine
university Ukraine
173 Towards Sustainable Enterprise Resource Planning
and Management Approach for Universities Radwan Tahboub
Palestine Polytechnic
University Palestine
185
Investigating the structural relationships between
service quality, price fairness, product quality, satisfaction and customer loyalty in automotive
aftermarket industry
Dr. Jyoti Kumar Chandel Mr. Syed Aulia
Waljat College of Applied Sciences
Oman
198
Business Incubators as a sustainability tool Definition, Services provided, Mechanism of Work, Requirements
and Effect on the Economy
Dr. Firas Rifai Al-Zaytoonah University of
Jordan Jordan
206
Competitive advantage based on human capital and its impact on organizational sustainability ((Applied
Study in Jordanian Telecommunications Sector))
Dr. Abdel Aziz Al-Naddawi Al-Zaytoonah University of
Jordan Jordan
222
The learning organization: A foundation to enhance
the sustainable competitive advantage of the service
sector in Egypt
Dr. Wael Omran Aly New Cairo Academy Egypt
243 A Framework for Implementing Knowledge
Management in E-Government
Emad Abu-Shanab
Issa Shehabat Yarmouk University Jordan

VII
253
INFORMATIZATION OF THE CONTROLLED
FROM DISTANCE DIAGNOSTICATING OF THE STATE OF THE COMPLEX TECHNICAL
SYSTEMS
VYCHUZHANIN V.V Odessa national marine university
Ukraine
260 E-business Entrepreneurship and Long-term
Sustainability
Dr. Khaled S. Al Omoush
Dr. Raed M Al-Qirem Zaid M. Al Hawatmah
Al-Zaytoonah University of
Jordan Jordan
270
The Interest Rate Ratchet in an Accelerator-Cash Flow
Model of Gross Nonresidential Fixed Investment for the USA between 1950 and 1988
Ibrahim Alloush Al-Zaytoonah University of
Jordan Jordan
284 Using NSGAII for Solving Multi-objective Master
Production Scheduling Problems with Application
Jalal A. Sultan
Omar R. Jasim
University of Mosul
University of Al-Hayat Iraq
295
The Impact of High Quality Relationship on Innovative Work Behavior Of Employees Through
Psychological Wellbeing, A Case Of Pharmaceutical
Sector
Ahmad Usman Shahid
Rizwan Qaiser Danish
Asad Afzal Humayon
Jawad Shahid
Ihtisham Munir
COMSATS institute of information technology
University of the Punjab
COMSATS institute of information technology
University of the Punjab
University of the Punjab
Pakistan
Lahore
Pakistan
Lahore
Lahore
314 Higher Education System in Pakistan and Transition to
Knowledge Economy
Muhammad Ayub Buzdar
Dr. Riaz Ul Haq Tariq
University Faisalabad National Accreditation
Council Islamabad
Pakistan
321
EFFECT OF CORE COMPETENCE ON SUSTAINABLE COMPETITIVE ADVANTAGES
OF BATIK BANYUMAS SMALL AND MEDIUM
ENTERPRISES
Rahab
Nurul Anwar Rawuh Edy Priyono
Jenderal Soedirman
University Indonesia
334
Assessing the Impact Greening Information Technology Tools and Technologies on Organizational
Sustainability
Dr. Abdel-Rahman Ismail Dr. Mahmood Badr Ridha Al
Obidi
Al Zaytoonah University of Jordan
Jordan
344
New business model for pharmaceutical companies to enhance competitiveness and create social value "
Glaxo Smith Kline (GSK) MODEL "
Dr: Kherchi Ishak Dr: Meddah Araibi Elhadj
Dr: Fellague Mohamed
University of Hassiba
Benbouali Algeria
358 Advanced Aspects on Sustainable Biometric Security Innovation
Prof. Dr. Muzhir Shaban Al-Ani
Anbar University Iraq
369
Using Structural Equation Modelling to Evaluate the
Hotel Restaurants’ Service Quality Dimensions,
Satisfaction and Customer's Loyalty
Ala`a Nimer AbuKhalifeh
Ahmad Puad Mat Som
University Sains
Universiti Sultan Zainal
Abidin
Malaysia
385 Arabia versus Persia: Is this what the Arab Spring
ended with?
Saeb Farhan Al Ganideh
Saad Ghaleb Yasseen
Al Zaytoonah University of
Jordan Jordan
399 The Role of Macroeconomic Stability in Enhancing
Jordan's Economic Competitiveness
Dr. Hamad Kasasbeh
Dr. Abdallah Shawawreh
AL-Zaytoonah University of
Jordan Jordan
407 PUBLIC DEBT INTEREST FREE BORROWING
FROM THE CENTRAL BANK Dr.Randa Sharafeddine Al Jinan University Lebanon
423 Information Policy Interactions: Net Neutrality and
Access to Information in US and India Ramesh Subramanian Quinnipiac University USA
435 Public Listing, Context and CSR: The Effects of Legal
Origin
Marc Goergen
Salim Chahine
Geoffrey Wood Chris Brewster
Cardiff University
American University in Beirut
University of Essex University of Reading
UK
Lebanon
UK UK
458 Foreign Business Activities, Foreignness of the VC
Syndicate, and IPO Performance
Salim Chahine
Samer Saade
Marc Goergen
American University of
Beirut
American University of Beirut
Cardiff University
Lebanon
Lebanon
UK
487
Protection of fair competition A study under the rules of Jordanian unfair competition Code no (51) of the
year (2000) and competition Code no (33) of the year
(2004)
Dr. Yaseen Mohammad Al-Juboori
Dr. Muneer Mohammad
Alofishat
Al-Zaytoonah University of
Jordan Jordan
491 The impact of Synergy on Teamwork Performance: Group Analysis Perspective
Prof. Tareq Shareef Younus Ahlia University Bahrain

1
The Relationship between Sustainable
Development and Fair Trade
Dr. Hany M. Elshamy
Tanta University
Egypt
Abstract:
Fair trade is an alternative trading model that combines trade with empowerment and
sustainable development. 2013 was the year of impressive growth for fair trade. Shoppers spent
$.5 billion on Fair trade products, a 15 percent increase on 2012 figures. As BTC’s report (2014)
argued that fair trade products are sold in 120 countries and serve over 1.3 million farmers and
workers in 70 countries. The main objective of this paper is to study how fair trade supports
sustainable development. A theoretical discussion that considers the concepts of sustainable
development and fair trade is presented. This paper found that fair trade plays an important role
in supporting sustainable development. Moreover, fair trade products can be used as a vehicle
to support sustainable production and it acknowledges that this cannot be done without
sustainable consumption.
Introduction
Fair trade is an ethical certification system which aims to promote equality and
sustainability in the farming sector. A product that carries the Fair trade label has met rigorous
Fair trade Standards, which focus on (1) improving labor and living conditions for farming
communities, and (2) promoting farming practices that don’t harm either people or the
environment. Fair trade is not a charity. It is an alternative trading model that combines trade
with empowerment and sustainable development (BTC, 2014).
Fair trade has grown dramatically in recent years in many developed countries and has
entered mainstream markets through supermarkets. (Hayes & Moore, 2005). Year 2013 was
year of impressive growth for fair trade. Shoppers spent $.5 billion on Fair trade products, a 15
percent increase on 2012 figures. As BTC’s report (2014) argued that fair trade products are
sold in 120 countries and serve over 1.3 million farmers and workers in 70 countries.
This paper aims to discuss the role of the fair trade in achieving the sustainable
development. For this purpose, a theoretical discussion that considers the concepts of
sustainable development and fair trade is presented. Moreover the paper shows some empirical
data about the role of the fair trade in some countries and for some products. The main objective
of this paper is to study how fair trade supports sustainable development.
The organization of this paper will be as follows: section 2 presents background about the
fair trade. Section 3 shows the aspects of sustainable development. Section 4 shows the
relationship between the fair trade and sustainable development. Conclusions and policy
recommendations will be presented in section 5.
The Economics of Fair-trade
According to the fair trade organization, the number of farmers and workers that benefit
from Fair trade are now 1.5 million people in 74 countries worldwide. The number of producers'
organizations has grown from 827 in 2009 to 1210 by the end of 2013. The distribution of the
producers in 2013 were as follows: 404 producers from Africa & the Middle East (33.4%), 624

2
producers from Latin America & the Caribbean (51.6%) and 182 producers from Asia &
Oceania (15%).
According to fair trade organization, 80% of all fair-trade producers are small producer
organizations, 64% of all fair trade farmers are in Africa and the Middle East and 113 farms are
Fair Trade certified in South Africa.
The following table shows the top ten countries for fair trade farmers and workers.
Table 1 Top Ten Countries for Fair trade Farmers and Workers
Country Number of farmers and workers
Kenya 295,400
Tanzania 164,100
India 139,400
Ethiopia 138,000
Ghana 104,400
Peru 61,300
Colombia 49,100
Uganda 47,300
Mexico 40,300
Cote d'Ivoire 34,300
Source: fair trade, 2015 http://www.fairtrade.org.uk
The Fair trade premium is an additional sum above the purchase price paid directly to
producer organizations. Farmers and workers democratically decide on how to invest the
premium according to their priorities. According to fair trade (2015), 96% Fair Trade is
generated by seven products: bananas, cocoa, coffee, cotton, flowers, sugar and tea. On
plantations, workers spent 24% of their premium on education. Small producer organizations
invested 49% of their premium income on improving their organizations. Workers on fair trade
certified banana plantations invested 28% on housing improvements. Cocoa farmers invested
46% of their premium improving productivity and quality.
Table 2 shows the volumes sales of some fair Trade products in 2012 and 2013.
Table 2 Volume of sales for Fair Trade products in 2012 and 2013
Product Unit 2012 2013 Growth
rate
Banana MT 331,980 372,708 12%
Cocoa (cocoa beans) MT 42,714 54,485 27.6%
Coffee (green bean) MT 77,429 83,709 8%
Cotton (lint) MT 9,005 7,817 -13%
Dried and processed fruits MT 1,507 1,430 -5%
Flowers 1,000 stems 536,669 623,907 16%
Fresh fruit MT 12,094 13,329 10%
Fruit Juice 1,000 liters 37,165 42,577 15%
Gold Gramm 6,434 7,562 17.5%
Herbs, herbal teas and spices MT 637 1,795 182%
Honey MT 1,319 1,898 44%
Quinoa MT 590 658 11%
Rice MT 5,623 5,482 -3%
Sports balls 1,000 items 152 108 -28%
Sugar (cane sugar) MT 158,986 193,829 22%
Tea MT 11,649 11,375 -2%
Vegetables MT 435 706 62%
Wine 1,000 liters 16,432 20,934 27%
Source: fair trade, 2015 http://www.fairtrade.org.uk

3
It can be shown from Figure 1 that herbs and herbal teas and spices had the highest growth
rate (182%). However, the sports balls had the lowest growth rate (-28%).
Source: fair trade, 2015 http://www.fairtrade.org.uk
A fair marketing movement which appeared for the first time in Europe in the 40’s and
50’s of last century through religious groups and nongovernmental organizations with
independent political attitudes (Abu-Ghazaleh, 2009). The movement started to market the
products coming from developing countries. With time, it developed to be a movement against
imperialism and unfair economic policies. Fair trade provides economically marginalized
producers with an opportunity in front of capitalist companies in terms of securing a better
marketing competitiveness.
The Fair Trade scheme involves the following three categories of actors: (Boto, 2014)
A) Fair Trade producers usually represent co-operatives or associations in developing
countries. To participate in the Fair Trade scheme, they have to join Fair Trade membership
organizations e.g., fair trade Labeling Organizations (FLO), Fair Trade Federation (FTF) and
International Fair Trade Association (IFAT). Participation commits producers to abide by Fair
Trade standards, pay annual fees and supply products at predetermined prices.
B) Traders are importers, exporters or processors who deal in Fair Trade products,
replacing so called middlemen. They are associated with Fair Trade membership organizations
and subject to the standards, predetermined prices and monitoring requirements of the
organizations which they join. Prime traders include Solidar’Monde (France), Oxfam (UK),
Oxfam Wereldwinkels (Belgium) and Claro (Switzerland), to mention a few.
C) Retailers interface with the end consumers of Fair Trade products. World Shops
represent the most common outlets for Fair Trade products. Recently, however, Fair Trade
products have begun to make their way into general retailers, such as supermarket chains16.
In Egypt With over 500 fairly-traded products from all over Egypt, Fair Trade Egypt (FTE)
supports 34 artisan groups, which translates into more than 2,300 individual artisans all over
Egypt from Fayoum, Aswan, Qena, Assiut, Marsa Matrouh, Siwa, Sohag, North Sinai, Behera,
Marsa Allam and Cairo.
There are wide selection of authentic handmade Egyptian products including; glazed
pottery, hand-woven textiles, crafted wood, alabaster goods, traditional Egyptian dolls, various
types of embroidered home and personal accessories, brass jewelry, beaded accessories, palm-
leaf baskets, Bedouin-style accessories, home accent decor light fixtures, leather purses,
Akhmim bed sheets and tablecloths, and much more.(FTE website)
Sustainable Development
Sustainable development is a term widely used by politicians all over the world, even
though the notion is still rather new and lacks a uniform interpretation. Important as it is, the
Figure 1: Growth Rates of selected Fairtrade Products between 2012-2013
Banana
Cocoa (cocoa beans)
Coffee (green bean)
Cotton (lint)
Dried and processedfruits
Flowers

4
concept of sustainable development is still being developed and the definition of the term is
constantly being revised, extended.
According to the classical definition given by the United Nations World Commission on
Environment and Development in 1987, development is sustainable if it “meets the needs of
the present without compromising the ability of future generations to meet their own needs.”
It is usually understood that this “intergenerational” equity would be impossible to
achieve in the absence of present-day social equity, if the economic activities of some groups
of people continue to jeopardize the well-being of people belonging to other groups or living
in other parts of the world (Tatyana, 2004).
Sustainable development could probably be otherwise called equitable and balanced,
meaning that, in order for development to continue indefinitely, it should balance the interests
of different groups of people, within the same generation and among generations, and do so
simultaneously in three major interrelated areas–economic, social, and environmental (Olivier,
2010).
Sustainable development is about equity, defined as equality of opportunities for well-
being, as well as about comprehensiveness of objectives (Tatyana, 2004).
Obviously, balancing so many diverse objectives of development is an enormous challenge
for any country. For instance, how would you compare the positive value of greater national
security with the negative value of slower economic growth (loss of jobs and income) and some,
possibly irreversible, environmental damage? There is no strictly scientific method of
performing such valuations and comparisons. However, governments have to make these kinds
of decisions on a regular basis. If such decisions are to reflect the interests of the majority, they
must be taken in the most democratic and participatory way possible. But even in this case,
there is a high risk that long-term interests of our children and grandchildren end up
unaccounted for, because future generations cannot vote for themselves. Thus, to ensure that
future generations inherit the necessary conditions to provide for their own welfare, our present
day values must be educated enough to reflect their interests as well (Tatyana, 2004).
How does Fair Trade Support Sustainable Development?
Fair trade believes that it plays an important role in the sustainability agenda as a promoter
of sustainable practices in the production of Fair trade products. It also believes that by
providing suitable support and adequate information, all actors can play a role in supporting
sustainable practices whether this is done through the production of sustainable commodities
(disadvantaged producers) or the consumption of sustainable products (sensitized consumers).
Fair trade, thus, acknowledges that it must play an important role as a supporter of sustainable
production (through secure and sustainable livelihoods) and sustainable consumption (through
information and awareness) (Olivier, 2010).
Fair trade brings a human face to global trade aiming to secure fairer terms of trade so that
producers and workers in developing countries can invest in a better future for themselves and
their communities. It is a holistic approach to sustainability with a focus on improving long-
term economic, environmental, and social conditions.
Fair trade works to support producers to economically and sustainably strengthen their
livelihoods, as follows(Olivier, 2010):
Encouraging that producers get a better price for their products. Most Fair trade products have
a Fair trade Minimum Price – a price floor which aims to cover producers’ costs of
sustainable production;
Providing on top of stable prices, a Fair trade Premium – that producers can invest in
economic projects such as farm improvements to increase yield and quality;
Improving the terms of trade for producers, promoting long term relationships, prepayments
and market access.
Fair trade’s environmental standards have emphasized on making products without harming
the environment or having a negative impact on the sustainability of the production site’s
habitat.

5
In order to implement this, Fair trade will continue working at different levels (Tatyana,
2004):
Supporting producers to meet Fair trade’s social and environmental standards;
Providing the tools needed for producers to elaborate their own development plans;
Providing producers the technical tools needed to face environmental and climate change
challenges;
Providing financial services to producers to face and adapt to environmental and climate
change challenges.
The Fair trade premium is also a key sustainability driver that enables producers to invest in
long term social development projects that benefit the producers, their families and their
communities.
A crucial feature of this premium is that its use is decided by the producers themselves, and
is not imposed upon them. The Fair trade premium is a tool that allows producers to (Tatyana,
2004; (Boto, 2014):
Empower themselves as they can make decisions that have a direct impact on the
sustainability of their activities;
Decide where to allocate these resources according to their needs;
Address sustainability issues that are pressing to them ranging from education to healthcare.
Sustainable production can only be achieved once producers have been able to face their
economic, environmental, and social challenges. Economic stability is a precondition for any
individual to respect sustainable social and environmental practices.
Fair trade works to enable producers to strengthen their livelihoods and contribute to a
more sustainable world. Sustainable production is to a great extent shaped by sustainable
consumption. Consumers have, in fact, sent a message to retailers indicating that they want to
consume more sustainably.
Fair trade has taken the responsibility to inform consumers on the benefits generated by
purchasing Fair trade products – this is yet another means to demonstrate that by consuming
Fair trade products, consumers support economic, environmental and social sustainability. In
this regard, Fair trade will continue to inform consumers on their Fair trade consumption
options and to carry out awareness campaigns through its labeling initiatives.
Conclusions
The number of fair trade producers' organizations has grown from 827 in 2009 to 1210 by
the end of 2013. The distribution of the producers in 2013 were as follows: 404 producers from
Africa & the Middle East (33.4%), 624 producers from Latin America & the Caribbean (51.6%)
and 182 producers from Asia & Oceania (15%).
Fair trade works to support producers so that they enjoy secure and sustainable livelihoods.
In doing so, Fair trade connects disadvantaged producers in the South and sensitized consumers
in the North.
Fair trade plays an important role in supporting sustainable development. Fair trade
products can be used as a vehicle to support sustainable production and it acknowledges that
this cannot be done without sustainable consumption.
This highlights Fair trade’s role to connect producers and consumers through a label that
represents both fairer trade conditions and a more sustainable development scheme.
Fair trade can help government in achieving its 2030 plan of eliminating poverty and
reducing inequality - as espoused in its National Development Plan - in the flowing ways:-
Ensuring that workers receive sustained higher wages that exceed the statutory minimum and
reflect rising food prices.
Provided a reference point to which employment terms and conditions have been set and
occupational health and safety systems aligned.
Making an indirect positive impact on workers from neighboring non Fair trade certified hired
labor farms, where management have been pressured into providing similar improvements
including working conditions and wages for their workers, to match those of Fair trade
certified farms
6
References
Abu-Ghazaleh, S. (2009) "Role of Fair Trade in Rural Sustainable Development in the West
Bank" , Master's dissertation, Al Quds Open University , Palestine
Boto, I. (2008) "Does Fair Trade contribute to sustainable development? Resources on Fair
Trade", Brussels Rural Development Briefings a series of meetings on ACP-EU Development
issue. http:// brusselsbriefings.net
Fair Trade Foundation (2011) " Annual Review 2011 Fair trade Africa"
http://www.fairtrade.org.uk
Fair Trade Foundation (2014a) "Achieving sustainable development with fair trade"
http://www.fairtrade.org.uk
Fair Trade Foundation (2014b) "Monitoring the Scope and Benefits of Fair
trade"http://www.fairtrade.org.uk
Fair Trade Foundation (2014c) " Fair trade’s Contribution to a More Sustainable World"
http://www.fairtrade.org.uk
Fair Trade Foundation (2015) "Unlocking the power together Annual Impact Report 2013–
2014" http://www.fairtrade.org.uk
Hayes, M. and G. Moore (2005) " The Economics of Fair Trade: a guide in plain English "
www.fairtraderesearch.net
Olivier, B.(2010) "Fair Trade Sustainable Trade?" BTC, Belgian development agency.
Tatyana P. (2004) "Beyond Economic Growth An Introduction to Sustainable Development"
WBI learning resources series, The World Bank Washington, D.C.
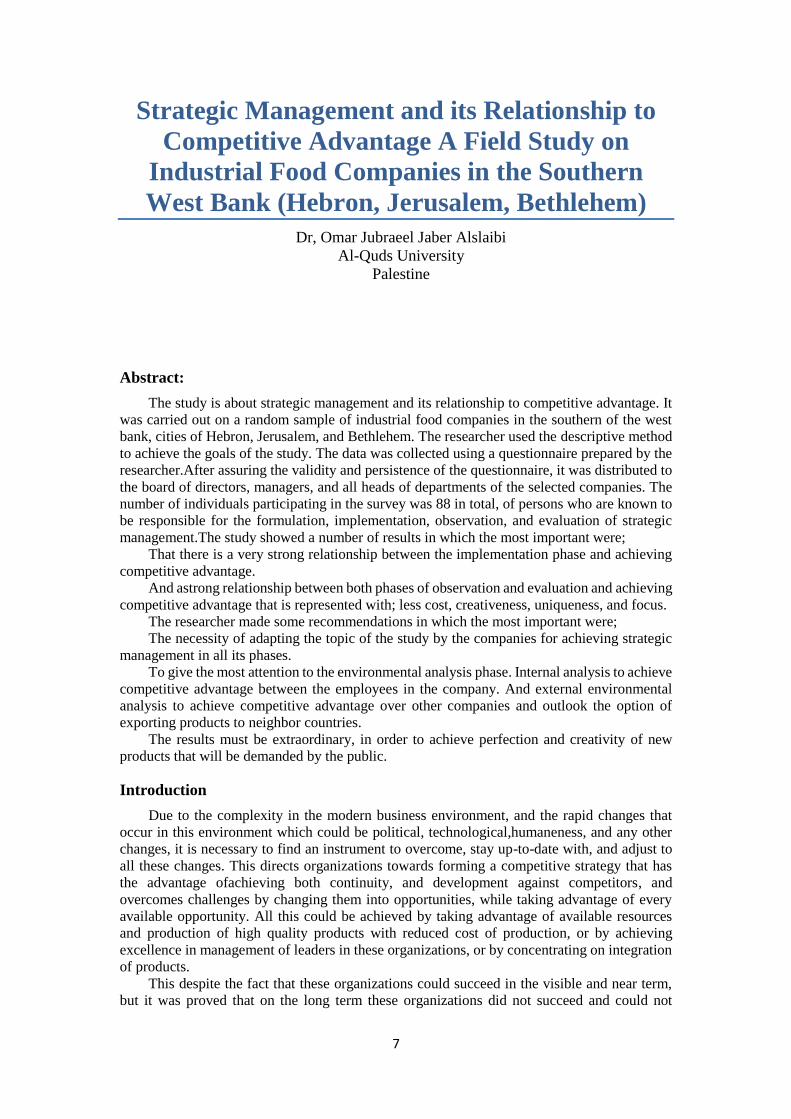
7
Strategic Management and its Relationship to
Competitive Advantage A Field Study on
Industrial Food Companies in the Southern
West Bank (Hebron, Jerusalem, Bethlehem)
Dr, Omar Jubraeel Jaber Alslaibi
Al-Quds University
Palestine
Abstract:
The study is about strategic management and its relationship to competitive advantage. It
was carried out on a random sample of industrial food companies in the southern of the west
bank, cities of Hebron, Jerusalem, and Bethlehem. The researcher used the descriptive method
to achieve the goals of the study. The data was collected using a questionnaire prepared by the
researcher.After assuring the validity and persistence of the questionnaire, it was distributed to
the board of directors, managers, and all heads of departments of the selected companies. The
number of individuals participating in the survey was 88 in total, of persons who are known to
be responsible for the formulation, implementation, observation, and evaluation of strategic
management.The study showed a number of results in which the most important were;
That there is a very strong relationship between the implementation phase and achieving
competitive advantage.
And astrong relationship between both phases of observation and evaluation and achieving
competitive advantage that is represented with; less cost, creativeness, uniqueness, and focus.
The researcher made some recommendations in which the most important were;
The necessity of adapting the topic of the study by the companies for achieving strategic
management in all its phases.
To give the most attention to the environmental analysis phase. Internal analysis to achieve
competitive advantage between the employees in the company. And external environmental
analysis to achieve competitive advantage over other companies and outlook the option of
exporting products to neighbor countries.
The results must be extraordinary, in order to achieve perfection and creativity of new
products that will be demanded by the public.
Introduction
Due to the complexity in the modern business environment, and the rapid changes that
occur in this environment which could be political, technological,humaneness, and any other
changes, it is necessary to find an instrument to overcome, stay up-to-date with, and adjust to
all these changes. This directs organizations towards forming a competitive strategy that has
the advantage ofachieving both continuity, and development against competitors, and
overcomes challenges by changing them into opportunities, while taking advantage of every
available opportunity. All this could be achieved by taking advantage of available resources
and production of high quality products with reduced cost of production, or by achieving
excellence in management of leaders in these organizations, or by concentrating on integration
of products.
This despite the fact that these organizations could succeed in the visible and near term,
but it was proved that on the long term these organizations did not succeed and could not

8
continue to survive except through a competitive strategy that is formed accurately by highly
experienced individuals that have an abundant amount of information and data.
These organizations were chosen due to the importance and necessity of their products to
the local market from on hand, and because of the competition these organizations face from
the Israeli market on the other hand, and because the Israeli competitive has an abundant
avalanche of economical capabilities. It is very difficult for Palestinian organizations to
compete with this advantage, from this point it is very critical for these organizations to inspire
competitive advantage by adopting the concept of it, possession of trained and efficient human
resources, and reducing cost, this and having reduced price high quality products is the main
interest of the Palestinian consumer.
Study Problem
Due to the rapid changes associated with the political situation in the Palestinian market
of; the inability to import and export for reasons related to the economic agreements signed
with the Israeli side, closures, strikes, recurring events, and strong competition from Israeli
products, all these result to the need of these organizations to concentrate on modern
management methods to overcome the complexities of the environment and to attain safety,
continuity, and achieve competitive advantage. As is stated in the (Al-Khatib, 2005, 415) that
strategic management is one of the key components to the success of organizations. And
organizations that use strategic management according to experiences of organization are
successful and continuing organizations over the long term(Berry, 455, 1998). Based on this
introduction, the researcher was able to formulate the problem of the study using the following
key question: what is the relationship between utilization of strategic management including all
of its stages and achieving competitive advantage in the food industry companies in the
provinces of the southern West Bank (Hebron, Bethlehem, Jerusalem).
The study variables
The independent variable of the study is strategic management including its three stages
of formulation, implementation, and monitoring and evaluation so as to include the formulation
stage; formulation of the vision, formulation of the message, the internal and external
environmental analysis, and the formulation of strategic objectives. The implementation phase
includes the preparations of the policies, procedures, operational and executive programs, and
temporal programs. And the third phase includes pre, continuous, and after monitoring,
evaluation of the result, and finally making the necessary improvements in a timely manner.
The dependent variable for the study: achieving competitive advantage, price advantage (low
cost and creativity), (creating new ideas and products), differentiating through (marketing
strategies, the form and content of the goods), and concentration and integration.
Hypotheses of the study
The first major hypothesis: there is no significant statistical relationship at the significance
level (0.05 ≥ ∞) between the application of the concept of strategic management (formulation,
implementation, monitoring and evaluation), and the achievement of competitive advantage
(price competition, creativity, differentiation), which emanated the three sub-hypotheses that
are:
First sub-hypothesis: There is no significant statistical relationship at the significance level
(0.05 ≥ ∞) between the formulation of the strategy (formulation of the vision, message,
environmental analysis, the formulation of the strategic objectives), and achieving competitive
advantage (price competition, creativity, focus, differentiation)
Second sub-hypothesis: there is no significant statistical relationship at the significance
level (0.05 ≥ ∞) between the strategic implementation phase (policies, programs, executive
programs, schedules) and achieving competitive advantage (price competition, creativity,
differentiation)

9
Third sub-hypothesis: there is no significant statistical relationship at the significance level
(0.05 ≥ ∞) between the control phase and strategic Monitoring and Evaluation (pre monitoring
parallel and continuous monitoring, dimensional monitoring and evaluation) and achieving
competitive advantage (price competition, creativity, differentiation).
The second major hypothesis: there is no significant statistical relationship at the
significance level (0.05 ≥ ∞) between the elements of the stages of strategic management and
achieving competitive advantage.
Objectives of the study
This study aims to highlight and define the concept of strategic management with all its stages,
and the concept of competitive advantage through competitive price, creativity and focus.
Identify the reality of the application of the concept of strategic management in the food
industry companies in the southern West Bank (Hebron, Bethlehem, Jerusalem
identify the relationship between the application of the concept of strategic management and
the concept of achieving competitive advantage
To result in some recommendations that may help the companies selected for the study
The limits of the study Human limits - the individuals employed in the departments of the food industry companies
which total in 88 individuals.
Spatial limits - food industry companies in the cities of Hebron, Bethlehem and Jerusalem
Temporal limits - This study was completed in the time period from 08.15.2015 - 12.25.2015.
Objective limits the study addressed the issue of strategic management and the issue of
competitive advantage
Study Terms
Strategic Management: defined by (Hunger 1997) as a group of administrative decisions
and practices that determine the long-term performance of a facility, this includes developing
the strategy, implementing, monitoring, and evaluating it when necessary. While (Yasin, 1998)
defined it as a system of integrated operations related to internal and external environmental
analysis. Then formulating an appropriate strategy based on the results of the environmental
analysis, implement, and evaluate the strategy to ensure the long-term strategic goals either by
expanding its achievements or by achieving excellence and sustainability of it. It was also
defined by (Ghalibi, 2011) as a systematic approach to business achieved by dealing with
strengths and opportunities on one hand and weaknesses and challenges on the other hand,
which represents integrated and ongoing administrative processes that are targeted towards the
formulation, implementation, monitoring and evaluation of the strategies. Also defined by
(Prasad, 2005) as the science and art that lies in the formulation of decisions related to all
departments and functions in the organization and enables it to achieve the objectives and apply
the vision and mission of the organization.
As stated in (Al-Durra and Jaradat, 2014) that strategic management is the science and art
consisting of three steps: The first step is positioned in the formulation of the philosophy of the
organization (creation of the vision, and message, formulation of the goals, and objectives, and
the development of the core values of the organization) (formulation stage), in addition to
environmental analysis and resulting to the strengths and weaknesses and the opportunities and
challenges. The second phase which lies in the implementation of the strategy. And the third
phase is to assess and evaluate strategies when necessary.
The importance of strategic management lies in achieving the following benefits:
Integration of the behavior of employees in the form of comprehensive joint efforts.
Solidifying a trend towards long term orientation and a medium and short-term orientation
in the organization.
To Direct the organization to identify the opportunities and prioritize exploiting them.
To reduce the effects of conditions and adverse changes

10
Abundance of resources and consuming less time to straighten wrong decisions and reduce
cost.
Adapt a risk management program for the organization thus help in continuity
Expose the organization to threats and thus strengthening the possibility to avoid them or
turn them into opportunities.
Havea positive impact on the well-being and improvement of the organization and its
continuity.
Provide integrated input to work within an integrated team.
Improve the quality of decisions and lack of overlap creating a relaxed atmosphere to work
and improve the quality of the product.
Reduce the gaps and overlap in administrative and production activities which is reflected
on the quality of the product. (Al-Durra and Jaradat, 2014)
Competitive Advantage: which was defined by (Li, 2003) The search for something
unique and different from what competitors offer. While (Render, 2001) saw that it is a
reference to the system that has more unique features than competitors. It was also defined by
(Qutub, 2002) as the unique and long-term site being developed by the organization through
the performance of its activities uniquely and effectively, taking advantage of the strengths and
opportunities and avoiding the weaknesses and challenges that it may face.It was defined from
the point of view of (Getomer, 2000) as ever known from the consumer's perspective that it is
offering a product or service that is considered very important to the consumer and offering
him this in much better than competitors would.It was defined by (Murr, 2009) as the thing that
works to satisfy consumer desires other than what is offered by competitors.
The researcher believes that competitive advantage for organizations is what pleases and
satisfies the consumer. Whether it is reduced price; price advantage over competitors, or a
higher quality product; better quality than competitors, or it could be by better communication
with the consumer and following up with them after selling them the product or giving them
the service. These could be achieved by:
Reduced price, products can sell at a lower price than competitors if the organization has
been able to reduce the cost of production or if it has efficient human resources capable of
increasing production and raising its quality and thus reducing the cost.
Differentiation which is defined by (John son, 2002) that it is the ability to distinguish the
organization from its competitors in the same business sector, whether by the quality of
products or the nature of the resources owned by the Organization that lead it to the ability to
achieve continuity and quality of goods or services to overpower competitors, and be difficult
to imitate. As stated in (Alsakarneh, 2005) that differentiation is unique, one of a kind, and
wonderful, and recognition of an organization means the always competing to new creative
products or services.
Creativity defined by (Amobile @ etal, 1980) as that the process that links relationships
between things that have never been linked to each other in any way or by any relation. Also
stated in (Fadhli, 2003) that creativity is the creation, renovation, addition, and departure from
the common to the uncommon, and creativity was defined by (Zu'bi and Jerida, 2007) as coming
up with a new idea or set of ideas that improve and develop what is common. In the
(International Conference for the development of creativity, 2009) creativity was defined as the
human behavior that leads to change in the same material used previously.
Focus which means the organization is concentrating on a special trend that will help
distinguish it from competitors by offering multiple alternatives of the same product, it has not
been shown by previous studies that it has resulted in any recognition.
Approach of the study
As the descriptive approach is based in studying phenomena and placing them accurately
as they are in reality, the researcher used this method that certainly fits for achieving the goals
of this study. This method offers the ability to collect data from primary or secondary resources,
then analyzing this data to reach meaningful information that could be generalized to increase
the information stock of the study.

11
Study sample: The study sample grouped board members, managers, and heads of
administrative departments at the food industrial companies in the southern West Bank
(Hebron, Bethlehem, and Jerusalem) which totaled in (88) persons. Eighty eight questionnaires
were distributed to all individuals of the sample. The 89.7% of the questionnaires were handed
back, only nine were lost, the following table shows the characteristics and features of the study
sample.
Table number (1) shows the Statistical Descriptions of the personal characteristics of the
study population (n=79)
Characteristic Group Recurrence Percentage %
Gender Male 55 69.6
Female 24 30.4
Total 79 100%
Age Ages less than 30 7 8.8%
Ages 30-40 28 35.6%
Ages 40-50 14 17.7%
Ages 50 and more 30 37.9%
Total 79 100%
Academic Degree Bachelor 55 69.6%
Masters 21 26.6%
Doctorate 3 3.8%
Total 79 100%
Years of Experience Less than 5 23 29.1
5-10 18 22.8
10-20 17 21.5
More than 20 21 26.6
Area Hebron 36 45.5%
Bethlehem 20 25.3%
Jerusalem 23 29.2%
Total 79 100%
Study tools: the questionnaire prepared by the researcher to collect information that would
help achieve the study goals, the researcher used closed questions according to Gradient Likert
Quintet. The questionnaire was divided into two parts:The first part is personal information
about the individuals in the sample (gender, age, academic qualifications, practical experience,
and company place). The second part contained (85) parts distributed on the axes of the study
as follows:
Formulation stage which includes formulation of the message, internal and external
environmental analysis, offering strategic options, and formulation of strategic goals, which
consists of 30 parts
Implementation stage, includes policies, procedures, programs, and tactics and consists of
20 parts
Monitoring and evaluation stage consisting of 15 parts
Competitive advantage stage includes competitive price, uniqueness, creativity, and focus
this consists of 20 parts
Validity and consistency of the questionnaire: The researcher depended on virtual honesty,
and honesty of arbitrators to measure the validity of the administration, as the researcher took
the opinions of both the members of the administration and the strategic administration then
formulated the questionnaire last version. And for assuring consistency of the questionnaire the

12
researcher depended on a test and retest method and the percentage of consistency was 87% in
both the test and retest, and it is a reasonable percentage in most areas.
Previous Studies
(Nseirat and Khateeb, 2006) study, the topic of this study was 'the reality of strategic
planning in the Jordanian pharmaceutical industry sector and its relation to administrative
performance in these companies' the purpose of the study, The researchers used the descriptive
analytical method for achieving the objectives of their study. They prepared a questionnaire
that was distributed after assuring its validity and consistency. The study sample was all
employees in the administrations of the six selected companies from the Jordanian companies
guide for year 2001, which totaled in 54 individuals.The results of this study were: There is no
relation between adapting strategic planning and administrative performance in the selected
companies, and that the concept of strategic planning was not clear to these companies. On the
contrary the managers in these companies had positive instructions towards strategic planning,
and they believe that it plays a role in strengthening competition for a company. The study
recommended spreading the culture of strategic planning, and adopting it in the company.
The research of (ElSleibi, 2006) which was titled as 'the reality of strategic management
of human resources and its relationship to performance- studying Palestinian universities'. The
study aimed to detecting the reality of strategic management of human resources from
formulation to implementation, to monitoring and evaluation. And the relation of adopting this
strategy to the administrative performance. The researcher used the descriptive method to
achieve the objectives of the study. He used a questionnairehe had prepared for collecting the
necessary information for the study that was distributed after assuring its validity and
consistency. The study sample consisted of the employees in human resources departments of
the Palestinian universities in the West Bank that totaled in 74 individuals.The study resulted
in finding a strong positive correlation between adopting strategic management of human
resources and the performance of the university. And that most focus was on formulating the
plan other than implementation, monitoring and evaluation.There was a variance in
implementation of the strategy from one university to the other, and in the performance. The
recommendations of the researcher were: the importance of adopting a clear strategy for human
resources in the departments of universities, and the importance of focusing on the
implementation and monitoring of these strategies as is focused formulation.
Study of (Elzaaneen, 2010) this aimed to studying competitive advantage in the products
of medical companies in the gaze strip and its effect on increasing their market share from the
customers point of view, the researcher used the descriptive analytical method, and the
information was collected by a questionnaire he had prepared and distributed after assuring its
validity and consistency. The important result was that the variety and availability of products
in addition to services after selling is considered as middle competitive advantage and this
resulted in an increase in the market share if these companies.
Study for (abdeltelbani, and others, 2012) titled strategic planning and its relation to
competitive advantage- a field study on medical distributing companies in Gaza. the researchers
used the descriptive analytical method to achieve the goals of the study by distributing a
questionnaire They prepared, the sample of the study consisted of the members of the board of
directors, and managers of the medical distributing companies in Gaza Strip that totaled in 74
individuals, these were responsible for strategic planning. Major results of the study; there is a
statistically significant when (0.05 ≥ ∞), between strategic environmental analysis and
achieving competitive advantage, especially for recognition. The researchers recommended
that it is critical to adopt strategic planning.
Test Hypothesis of the Study
Table (2)
It shows the results of the correlation coefficient between the elements of strategic management
and elements of competitive advantage W = 79

13
No. Area Pearson’s
Correlation
Coefficient
Value of∞
1 Formulation
Stage
Price Competition 0.883 0.002
Recognition 0.685 0.002
Creativity 0.790 0.019
Focus 0.595 0.001
Competitive advantage 0.882 0.001
2 Implementation
Stage
Price Competition 0.495 0.000
Recognition 0.526 0.000
Creativity 0.388 0.000
Focus 0.365 0.001
Competitive Advantage 0.566 0.001
3 Monitoring and
Evaluation
Price competition 0.597 0.000
Recognition 0.682 0.000
Creativity 0.752 0.000
Focus 0.683 0.000
Competitive advantage 0.794 0.001
The first sub hypothesis: which states “There is no significant statistical relationship at the
significance level (0.05 ≥ ∞) between the formulation of the strategy, and achieving competitive
advantage (price competition, creativity, focus, differentiation). By reviewing number 1 in table
(2) it shows that Pearson’s correlation coefficient forPrice competition is (0.683) and at ∞ =
0.002 which is less than (0.05 ≥ ∞) and Pearson correlation coefficient between the formulation
stage and differentiation is 0.685 at (0.002 ≥ ∞) which is less than (0.05 ≥ ∞) as well as the
correlation coefficient between the formulation stage and creativity is 0.790 when (0.019 ≥ ∞)
which is less than (0.05 ≥ ∞), and thePearson’s correlation coefficient between the formulation
stage and focus is 0.595 when (0.00 ≥ ∞) which is less than (0.05 ≥ ∞), and the Pearson
correlation coefficient between the formulation stage and competitive advantage is 0.882 at
(0.00 ≥ ∞), which is less than (0.05 ≥ ∞). This tells that there is a strong positive correlation
between the formulation stage and achieving competitive advantage for the leaders in the food
industrial companies. This correlation is the strongest between the formulation stage and
creativity being an important element of competitive advantage; this is by consistent
development and new products. After it is recognition, then price competition, then focus.
The second sub-hypothesis which states: “there is no significant statistical relationship at
the significance level (0.05 ≥ ∞) between the strategic implementation phase and achieving
competitive advantage.” And by reference to the number (2) in Table (2) between the Pearson
correlation coefficient between the implementation and recognition phase e 0.566 when (0.01
≥ ∞) which is less than (0.05 ≥ ∞) means there is a relationship but it is not very strong as the
correlation coefficient is close to 0.5 and this link was strongest with the differentiation factor
of 0.526 link when (0.00 ≥ ∞), followed by strong price competition by a factor of 0.495 link
when (0.00 ≥ ∞), followed by creativity 0.088, followed by focus 0.365 and ∞ value in these
cases was less than 0.05 which refers to accepting the alternative hypothesis which refers to a
relationship.
The third sub-hypothesis which states that: “there is no significant statistical relationship
at the significance level (0.05 ≥ ∞) between the control phase and strategic Monitoring and
Evaluation and achieving competitive advantage.” In view of the item (3) in Table (2) it appears
that the Pearson correlation coefficient between monitoring and evaluation, and achieving
competitive advantage is 0.794 at ∞ = 0.001 which is less than (0.05 ≥ ∞) This suggests the
14
existence of a relationship and the fact that the correlation coefficient = 0.794 It is greater than
0.5, this relationship is described as a very strong one. From the standpoint of officials of the
companies they will adapt the alternative hypothesis, which suggests a strong relationship
between monitoring and evaluation, and achieving competitive advantage in all elements of the
stage, and from viewing the item (3) in the table whichshows that the relationship is strongest
between the control phase and creativity as the correlation coefficient of 0.752 and 0.683,
followed by focus and differentiation 0.682 and 0.597, followed by price competition and all
of them are at (0.00 ≥ ∞).
The first major hypothesis; from studying the table (2) there is a very strong relationship
between the formulation stage with a correlation coefficient of 0.882, followed by monitoring
and evaluation and assessment stage with a correlation factor of 0.794, followed by the
implementation phase with a correlation coefficient of 0.566. Conditions show that if the
formulation is built depending on an accurate environmental analysis, and objectives are
understandable and attained by all employees, all this with the right evaluation and assessment
at the right time within all stages, then it is assured to achieve competitive advantage, through
creativity, focus, recognition, and price competition.
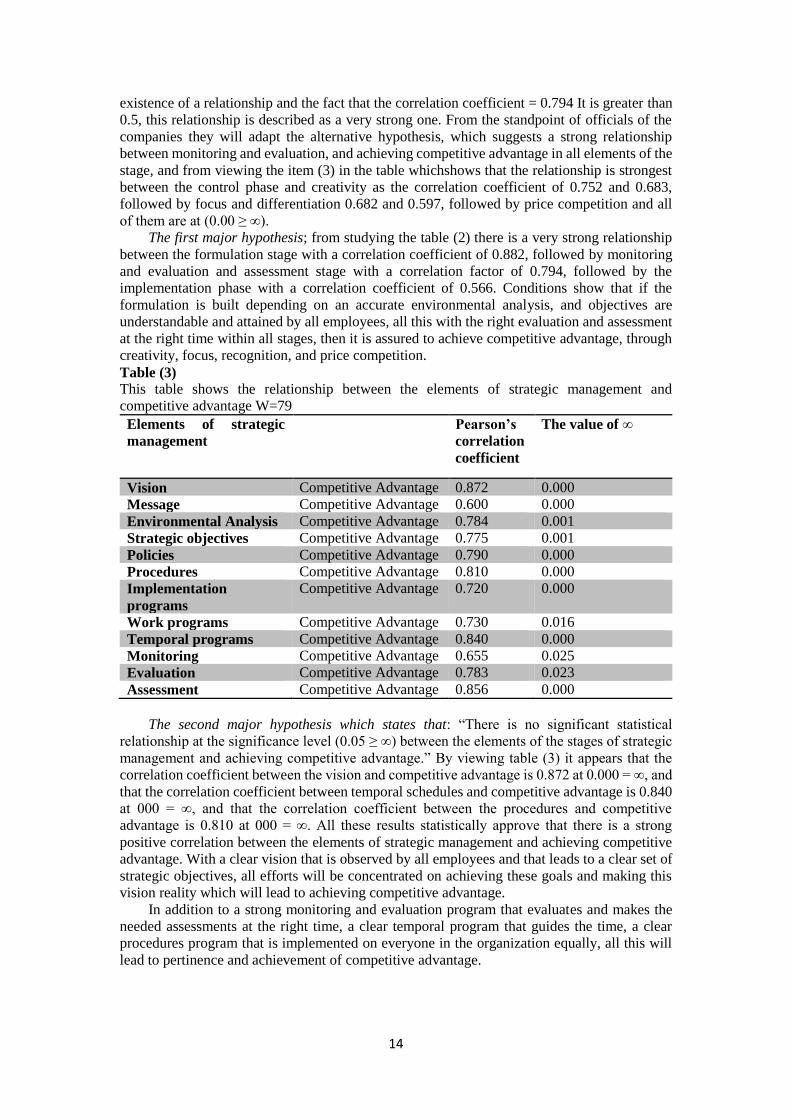
Table (3)
This table shows the relationship between the elements of strategic management and
competitive advantage W=79
Elements of strategic
management
Pearson’s
correlation
coefficient
The value of ∞
Vision Competitive Advantage 0.872 0.000
Message Competitive Advantage 0.600 0.000
Environmental Analysis Competitive Advantage 0.784 0.001
Strategic objectives Competitive Advantage 0.775 0.001
Policies Competitive Advantage 0.790 0.000
Procedures Competitive Advantage 0.810 0.000
Implementation
programs
Competitive Advantage 0.720 0.000
Work programs Competitive Advantage 0.730 0.016
Temporal programs Competitive Advantage 0.840 0.000
Monitoring Competitive Advantage 0.655 0.025
Evaluation Competitive Advantage 0.783 0.023
Assessment Competitive Advantage 0.856 0.000
The second major hypothesis which states that: “There is no significant statistical
relationship at the significance level (0.05 ≥ ∞) between the elements of the stages of strategic
management and achieving competitive advantage.” By viewing table (3) it appears that the
correlation coefficient between the vision and competitive advantage is 0.872 at 0.000 = ∞, and
that the correlation coefficient between temporal schedules and competitive advantage is 0.840
at 000 = ∞, and that the correlation coefficient between the procedures and competitive
advantage is 0.810 at 000 = ∞. All these results statistically approve that there is a strong
positive correlation between the elements of strategic management and achieving competitive
advantage. With a clear vision that is observed by all employees and that leads to a clear set of
strategic objectives, all efforts will be concentrated on achieving these goals and making this
vision reality which will lead to achieving competitive advantage.
In addition to a strong monitoring and evaluation program that evaluates and makes the
needed assessments at the right time, a clear temporal program that guides the time, a clear
procedures program that is implemented on everyone in the organization equally, all this will
lead to pertinence and achievement of competitive advantage.

15
Results of the Study
After analysis of the data, and testing the hypothesis, the study resulted in the following:
There is a strong positive correlation between the strategy formulation stage and achieving
competitive advantage, and this correlation is at its highest between the formulation stage and
achieving creativity as an element of competitive advantage with a correlation coefficient of
0.882 which is in the fourth quarter
There is a positive correlation between the implementation stage and achieving
competitive advantage with a correlation coefficient of 0.566 that shows it is not such a strong
correlation as with the formulation stage.
There is a strong positive correlation between the monitoring and evaluation stage and
achieving competitive advantage with a correlation coefficient of 0.794 which is in the fourth
quarter
There is a strong positive correlation between the clarity of the vision in the formulation
stage and achieving competitive advantage
There is a strong positive correlation between the clarity of the procedures and the ease
and justice of applying them in the implementation stage and achieving competitive advantage
There is a strong positive correlation between the clarity of the program and commenting
to it especially in the field of creativity and competitive price and low cost.
There is a strong positive correlation between the clarity of the procedures and applying
them in the implementation stage and achieving competitive advantage especially by price
competition and recognition.
Recommendations
The researcher recommended the following:
Due to the importance of the organizations vision in the achievement of competitive
advantage the researcher recommends that all companies willing to achieve this advantage must
take the opinions of all their members and employees to formulate a clear simple vision that
they all understand and can comply to and give their best to achieve
Departments of companies that aspire to achieve competitive advantage must adopt all
stages of strategic management.
To give critical attention to the formulation stage especially formulation of the vision, the
environmental analysis, and the formulation of smart goals.
To give critical attention to the monitoring and evaluation stage, because of its importance
in the achieve mm of competitive advantage especially evaluating in the right time.
The importance of having a clear set of procedures, which are applied throughout the
implementation stage.
The importance of adopting clear timely programs throughout the implementation stage.
The importance of having creativity considering it the most important element of
competitive advantage.
Consumption of all efforts to reduce cost in order to achieve competitive price.
References
Al-Khateeb,Saleh&Nseirat, Fared, (2015), Strategic Planning and Administrative
Performance, an analytical study on Jordanian pharmaceutical industry sector, journal
of administrative studies, vol. 32, No. 2.
Berry, M. (1997), Strategic Planning in Small High Tech. Companies, Long Range
Planning. Vol., 31, No. 3 pp., 455-466
Hunger, J.D. of Wheelen, T.L. (1997) “strategic management”, 6th edition, An Imprint
of Addison Wesley Longman, Inc.

16
Yaseen, SaadGhaleb, (1998), Strategic Management, Barzorey publishing house,
Amman.
Al-Ghalbi, Taher&Edreis, Waeal, (2011), Strategic Management, Concepts and
Operations. Wael for publishing and distribution, Amman, Jordan.
Prasad, Ajit,(2005), A Dictionary of Strategic Management, New Delhi: Excel Books.
Durra, Abdelbare&Jarradat, Naser, (2014), Strategic Management in the Twenty First
Century, Wael for publishing and distribution, Jordan, Amman.
Li, H, (2003), an Examination of Competitive Advantage in the Wenshou (China)
Footwear Industry, the University of Winsdor / Doctor of Philosophy Thesis of
Business Administration.
Heizer, J, and Render, B, (2001), “Operation Management” 6th Edition, Prentice Hall,
Inc.
Al-Qutob, Muhieldean, (2002), The Strategic Choice and its Effect in Achieving
Competitive Advantage, Practical study on a sample from a Jordanian Insurance
company, Unpublished PHD project, college of administration and economy,
Mustanseria University.
Getomer, J, (2002), “Celebrate The Nest 10 Years by Taking Action, Central New York
Business Journal, April, pp. 40-54.
Johnson, G, &Scholes, K, (2002) “Exploring Corporate Strategy”6th Edition, Pearson
Education Limited, USA.
Al-Sakarna, Bilal, (2005), Leadership Strategies and their Role in Achieving
Competitive Advantage and Improving Performance for communication companies in
Jordan, (2005-2004), unpublished PHD project at the college of administration and
economics, University of Amman for Advanced Studies.
Yair, A, (2000), “Search for the Unique: Can Firm Specific Advantages be Evaluated),
Journal if Management studies, Vol. 45, No. 6, pp. 24-45.
Al-Fadli, Fadeil Sabah, Factors Affecting on the role of Managers as responsible for
Creation: analytical field study in Kuwait, University of King Soaod, college of
management (2003).
Al Zughbi , Ali Falah&Jareri , majedAbdelazez , The role of the importamce of
accounting in achieving economic competitive advantage in the Jordanian economic
institutions, http://philadelphia,edu.Jo/Arabic/adfin/research1/9.doc
National Conference for Improvement of Performance- A better Performance in
Government sector, Future Role of Administrative Development Institutions on
Performance Development in Riyadh, 2009
Previous Reference, (2005).
El-Sleibi, Omar (2006), Analysis of the Reality of Strategic Management of Human
Resources in Palestinian Universities, unpublished PHD project, Sudan University of
Science and Technology, College of Advanced Education.
Elzaaneen, Aseim Fayez, (2010), Competitive Advantage in Medical Products of
National Drug Companies and its effect on increasing the market share from the point
of view of the consumer in the Gaza Strip, Unpublished Masters project, College of
Advanced Education, Islamic University.

17
Sustainability and Its Role in Organizational
Performance in The Jordanian Pharmaceutical
Industry
Dr. Jasser Al Nasour DR. Prof. Najm A. Najm DR. Abdulsattar H.
Yousif
Al Zaytoonah University
of Jordan
Al Zaytoonah University
of Jordan
Al Zaytoonah University
of Jordan
Jordan Jordan Jordan
Abstract:
The purpose of this study is to explore the indicators of sustainability in Jordanian
pharmaceutical industry and investigate the impact of the triple dimensions of sustainability
(economic, social, and environmental) on organizational performance (market share,
profitability, and extension of the organization). The study sample consisted of 164 respondents
were taken from the three major pharmaceutical organizations: Al-Hikma Pharmaceutical Co.;
Dar Al Dawa, and Ram Pharma. The collected data was analyzed using appropriate statistical
tools to test the hypotheses of the study. The results indicate that there is an impact of all three
dimensions of sustainability on organizational performance. Based on results discussion it can
be concluded that there is a need for Jordanian pharmaceutical organizations to develop
sustainability indicators into its decisions and practices.
Key terms: Sustainability dimensions, continuum of business-ecology
Introduction
The law of business survival from Adam Smith era up to Friedman’s , which is maximizing
profit , has never changed and will continue to be so in the future , because profit is the blood
of business organization .Smith in his famous book (The Wealth of Nations 1776) has
emphasized that , wealth creation is the responsibility of the state and individuals , and the
main objective of a company is to continue , as a wealth originator through the production and
marketing of tangible goods, to protect capital and maximize profit . ( Avisgai,1994). While
Friedman , in his book “ Capitalism and Freedom “ has focused on the Economic motives as
the core of the privates enterprise. Furthermore, Friedman has stated that the fundamental
function of business organization is profit maximization for the benefit of shareholder, while
the ethical and social (and of course environmental) responsibilities are related to uneconomic
motives which are out of the nature of the private enterprise goals .(Friedman,1962 , and 1970
). In contrast to this prospective, there is the Iron low of responsibility which donates that when
business fail to foster the main interests and benefits of the society, therefore it would be
necessary for the society authority to impose these interests and benefit by law.
The debate which going on nowadays everywhere concerning the law of environmental
survival which pointed out that without ensuring environmental protection , business,
organization have to search for new world or planet . Therefore it would be relevant to ask “will
location become the critical factor in business success or failure”, or the main market laws will
continue to be the main determining factor of business although it is threatening environmental
system and the whole society . Jones & Conrad have stated that “ in the old pollution - based
economy , we live in a situation of eco-apartheid , where the environment is the weaker party ,
and it exposed to major violations threatening the survival of the planet , such as : Excessive
consumption of energy and resources , Climate change , Ocean acidity , arctic melting ,

18
deterioration of biodiversity , bio-depletion , toxic wastes , radioactive pollution , weird weather
… etc. (Jones and Conrad 2008 ) .These Great problems with all its associated social and ethical
problems are the outcomes of business and their concentration on the economic dimensions
which can not Continue for long by giving the market and profit maximization the priority
against the society and environment. To handle these critical problems the concept of business
social responsibility was first introduced and then followed by the concepts of business ethics,
business citizenship and lastly, the corporate philanthropy concept. To tackle the environmental
problems the concept of environmental responsibility and corporate greening and sustainability
were introduced. The theoretical framework of this paper aims at presenting the concepts
related to sustainability and its role in treating environmental problems to introduce a clear
perspective concerning the essential development in this field. The applied aspect of this study
comprises a field study about sustainability dimensions and the extent to which these
dimensions are adopted by Jordanian pharmaceutical companies and to determine the effect of
this adoption on the general performance of these companies.
Sustainability concept
Sustainability is a complex and broad concept that includes many dimensions, which makes it
very difficult for researchers to agree on one united definition. Table 1 contains a list of
sustainability definitions by author.
Table 1: Definitions of sustainability Author Definition
Brundtland, 1987 - Development that meets the needs of the present without compromising the
ability of future generations to meet their own needs”
Kuhn and Deetz,
2008
It seeks to pursue current development while preserving the environment and
natural resources for long-term growth
Fergus and
Downey, 2005,
Bai and Sarkis,
2014,
- More recently, it has been extended to incorporate economic,
environmental, and social sustainability which includes equitable
development.
Lozano, 2012 - The corporate activities that proactively seek to contribute to sustainability
equilibrium, including the economic, environmental, and social dimensions
of today, as well as their inter-relations within and throughout the time
dimension while addressing the company's system and its stakeholders.
Dyllick and
Hockerts, 2002
- An effective business strategy that attempts to meet the needs of
organizational stakeholders without compromising the resources and interests
of the local community
Hubbard, 2009,
Chow and Chen,
2012
- Corporate sustainability has multiple dimensions with the most popular
being environmental, economic, and social
Zhong , and Wu,
2015
- A set of triangular concept which involve comprehensive and integrated
approach to economic , social , and environmental process .
Hueting, 2015 - It is the situation in which vital environmental functions are safeguard
for future generation .
Angelakoglous,
and Gaidajis, 2015
Environmental sustainability refers to wider time scales and covers
broader environmental issues in various scales .
Cobb , et al, 2007 - It is the path of continuous improvement , wherein the products and
services required by society are delivered with progressively less negative
impact upon the earth .
Table 1 indicates that, there are three kinds of needs for sustainability, firstly, human needs
that related to health, safety, and Enjoying nature. Secondly, business needs which are basically
the natural resources-based economic growth. Thirdly, diversified needs concerning
protecting and maintaining the diversity of all kinds of plants, animals and terrain.
19
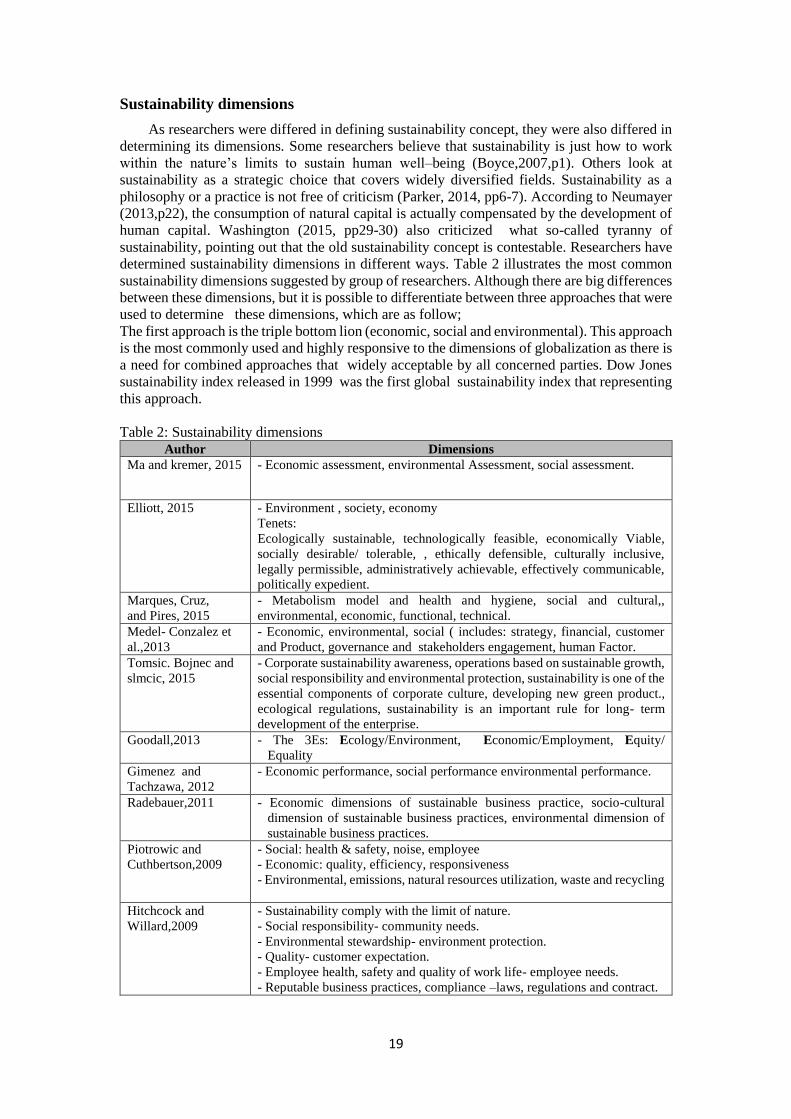
Sustainability dimensions
As researchers were differed in defining sustainability concept, they were also differed in
determining its dimensions. Some researchers believe that sustainability is just how to work
within the nature’s limits to sustain human well–being (Boyce,2007,p1). Others look at
sustainability as a strategic choice that covers widely diversified fields. Sustainability as a
philosophy or a practice is not free of criticism (Parker, 2014, pp6-7). According to Neumayer
(2013,p22), the consumption of natural capital is actually compensated by the development of
human capital. Washington (2015, pp29-30) also criticized what so-called tyranny of
sustainability, pointing out that the old sustainability concept is contestable. Researchers have
determined sustainability dimensions in different ways. Table 2 illustrates the most common
sustainability dimensions suggested by group of researchers. Although there are big differences
between these dimensions, but it is possible to differentiate between three approaches that were
used to determine these dimensions, which are as follow;
The first approach is the triple bottom lion (economic, social and environmental). This approach
is the most commonly used and highly responsive to the dimensions of globalization as there is
a need for combined approaches that widely acceptable by all concerned parties. Dow Jones
sustainability index released in 1999 was the first global sustainability index that representing
this approach.
Table 2: Sustainability dimensions Author Dimensions
Ma and kremer, 2015 - Economic assessment, environmental Assessment, social assessment.
Elliott, 2015 - Environment , society, economy
Tenets:
Ecologically sustainable, technologically feasible, economically Viable,
socially desirable/ tolerable, , ethically defensible, culturally inclusive,
legally permissible, administratively achievable, effectively communicable,
politically expedient.
Marques, Cruz,
and Pires, 2015
- Metabolism model and health and hygiene, social and cultural,,
environmental, economic, functional, technical.
Medel- Conzalez et
al.,2013
- Economic, environmental, social ( includes: strategy, financial, customer
and Product, governance and stakeholders engagement, human Factor.
Tomsic. Bojnec and
slmcic, 2015
- Corporate sustainability awareness, operations based on sustainable growth,
social responsibility and environmental protection, sustainability is one of the
essential components of corporate culture, developing new green product.,
ecological regulations, sustainability is an important rule for long- term
development of the enterprise.
Goodall,2013 - The 3Es: Ecology/Environment, Economic/Employment, Equity/
Equality
Gimenez and
Tachzawa, 2012
- Economic performance, social performance environmental performance.
Radebauer,2011 - Economic dimensions of sustainable business practice, socio-cultural
dimension of sustainable business practices, environmental dimension of
sustainable business practices.
Piotrowic and
Cuthbertson,2009
- Social: health & safety, noise, employee
- Economic: quality, efficiency, responsiveness
- Environmental, emissions, natural resources utilization, waste and recycling
Hitchcock and
Willard,2009
- Sustainability comply with the limit of nature.
- Social responsibility- community needs.
- Environmental stewardship- environment protection.
- Quality- customer expectation.
- Employee health, safety and quality of work life- employee needs.
- Reputable business practices, compliance –laws, regulations and contract.
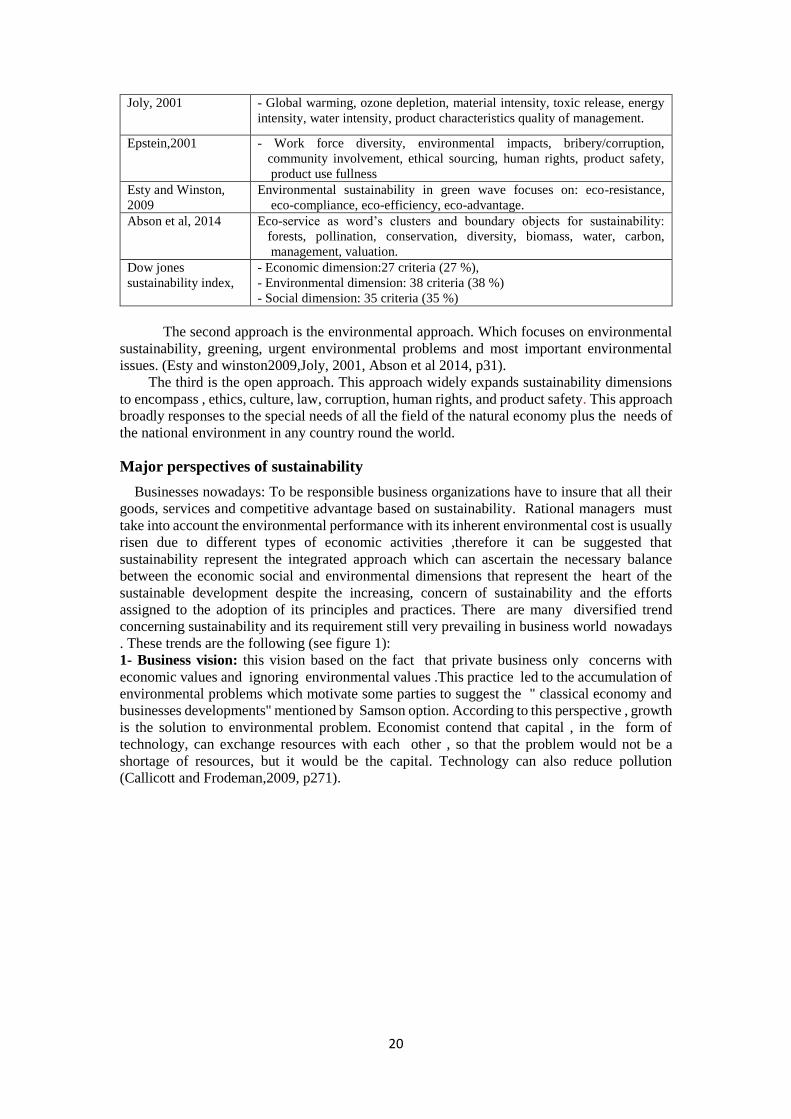
20
Joly, 2001 - Global warming, ozone depletion, material intensity, toxic release, energy
intensity, water intensity, product characteristics quality of management.
Epstein,2001 - Work force diversity, environmental impacts, bribery/corruption,
community involvement, ethical sourcing, human rights, product safety,
product use fullness
Esty and Winston,
2009
Environmental sustainability in green wave focuses on: eco-resistance,
eco-compliance, eco-efficiency, eco-advantage.
Abson et al, 2014 Eco-service as word’s clusters and boundary objects for sustainability:
forests, pollination, conservation, diversity, biomass, water, carbon,
management, valuation.
Dow jones
sustainability index,
- Economic dimension:27 criteria (27 %),
- Environmental dimension: 38 criteria (38 %)
- Social dimension: 35 criteria (35 %)
The second approach is the environmental approach. Which focuses on environmental
sustainability, greening, urgent environmental problems and most important environmental
issues. (Esty and winston2009,Joly, 2001, Abson et al 2014, p31).
The third is the open approach. This approach widely expands sustainability dimensions
to encompass , ethics, culture, law, corruption, human rights, and product safety. This approach
broadly responses to the special needs of all the field of the natural economy plus the needs of
the national environment in any country round the world.
Major perspectives of sustainability
Businesses nowadays: To be responsible business organizations have to insure that all their
goods, services and competitive advantage based on sustainability. Rational managers must
take into account the environmental performance with its inherent environmental cost is usually
risen due to different types of economic activities ,therefore it can be suggested that
sustainability represent the integrated approach which can ascertain the necessary balance
between the economic social and environmental dimensions that represent the heart of the
sustainable development despite the increasing, concern of sustainability and the efforts
assigned to the adoption of its principles and practices. There are many diversified trend
concerning sustainability and its requirement still very prevailing in business world nowadays
. These trends are the following (see figure 1):
1- Business vision: this vision based on the fact that private business only concerns with
economic values and ignoring environmental values .This practice led to the accumulation of
environmental problems which motivate some parties to suggest the " classical economy and
businesses developments" mentioned by Samson option. According to this perspective , growth
is the solution to environmental problem. Economist contend that capital , in the form of
technology, can exchange resources with each other , so that the problem would not be a
shortage of resources, but it would be the capital. Technology can also reduce pollution
(Callicott and Frodeman,2009, p271).

21
Figure 1: six perspectives of sustainability mainstream
Economists during 20th century were proudly announcing that the world protect the 40
per capita (Arrow et al,2004,p147). However conventional economics is increasingly criticized
for its failure to reflect environmental demands and the limits of the plant capacity , which are
increasingly exposed to degradation and depletion. As a result, environmental risks have
become costly to the national economy and social system. Catton declares that emphasis on
increasing economic growth and increases in per capita consumption of resources has turned
us from Homo sapiens into Homo colossus. Technological innovation has temporarily
expanded the available carrying capacity, but the finite planet inevitably imposes limits on our
ability to fool ourselves with technological prowess (Catton,1980).
.It can be concluded that what protect the environment, is goods according to the economic
concept . Therefore as far as this goods continue to be so business will invest to renew it . It
is business perspective , which has created the environmental problem with its common
dimensions. Hence, sustainability option would not be a real option unless it pays, to the
society and environment. This actually means that sustainability option will be a good option
as long it stay within the frame of cost / revenue analysis.
2- Regulation–based perspective: This viewpoint relays upon the rule of law as the main
organizer of individual, companies, and whole society, to maintain the interests of all parties.
As environment deterioration will badly affect all parties therefor, regulations are the most
effective mean to protect environment. According to the world commission environment and
development , "Human laws must be reformulated to keep human activities in harmony with
the unchanging universal laws of nature." Rule of law for nature, extending respect the law of
the non-human world , and imposing the environmental law , can contribute significantly to
the reduction of environmental violation and stop externalities by enforcing companies to
carry out their pollution . Although authority of law is important to reduce environmental
violation, but it is not enough under the aggravation of environmental problems. Sustainability
requires, more than a law , because it is a social responsibility of all parties which must
contribute to achieve it , at home , at work on the street and at all commons . Sustainability to
be effective and fruitful must be a common human responsibility for any one ,at any time and
any where.
3- ISO 14000 perspective: ISO 9001-1987 and 2008 is a broad framework to build a generic
system of quality management, in the same context, ISO 14001-2004 represented a voluntary
standard for the construction of the broader environmental management system (Siew,2015,
p185). It represents the minimum level required from international companies to enter the
global market after being in compliance with the international standards of environmental
quality. The environmental quality system according to ISO 14000 is an organized attempt to
consider environmental issue as one of the standard to evaluate a company major ability and
make the environmental performance of a company as one of the main elements of the
company's total performance . This means that when a company run its system and produces

22
its output should be hold responsible for any waste of resource or pollution and must take all
necessary step to reduce that to protect the environment and achieve its quality.
4- Brundtland commission perspective (Balance between generations): This perspective
actually suggests that total sustainability will be achieved through sustainable development,
which was defined by Brundtland as: it is a vision of balance between the present and future
generations , a process that "meets the needs ,and aspirations of present society without
compromising the ability to meet those of future generations. This definition indicates that
resources must be shared by recent generations and future generations, without considering the
possible waste and irresponsible use of natural resources by companies with possible depletion
during the era of future generation. In fact , maintain the existence of resources to next
generation is not a true sustainability , what is needed is to ensure that all environmental
resources will have the possibility to survive and continue.
5- Perspective of greening: The green wave was released many decades ago to become later
"Green Economy" which was an initiative released by UNDP in 2008 . The main purpose of
this initiative is to greening the economy and ensuring a green growth that foster all the
requirements of economic growth and environment greening.
Greening practices can be adopted by all types of companies in all types of industries and
economic sectors . Therefore , some people are calling for "explosion of all for greening”
(Jones and Conrad,2008,p35) , such as , green productivity (Tuttle and Heap,2008), green
innovation (Chen et al.,2012) ,green manufacturing (David,2013) ,green investment
(Urdrich,2010), down to green trust and satisfaction ( Chen and Chang,2013,p63). Despite
the fact that the green wave was released in the 60s of the last century (Bhamra and
Lofthouse,2007,p1 ) , but the environmental problems are still worsening , which means that
the green wave option is not enough as a tool to tackle all environmental problems caused
by decades of ignorance of environment issue , particularly if we know that business
organizations would never adopt a green option unless reaching economic of scale (Jones
and Conrad,2008,p53). According to marginal analysis, green alternatives will really take off
only when companies reach economies of scale (Jones and Conrad,2008,p53). Finally, Green
economy can be called the " economy of two per cent" according to was suggested by
"UNDP" for investing two per cent of the global GDP to green ten central sectors of the
world economy (UNDP,2011,p24).
6- Ecological perspective: Eco-vision is a results of the worsening environmental problems in
the second half of the 20th century as a response to the ability of neoclassical economic theory
to solve those problems or provide adequate explanation for them .(Chmelev,2012). This vision
is conducted to build an economies of de-growth (Rallis et al.,2012,p1), anti-growth alternative
(Colye,2011) and ecological economy that assigns high priority to the environment and its
systems. This is totally different from classical economy principles which allocate priority to
profit making and marketing mechanisms which has led to the recent environmental disasters
that threatening human survival on earth .By comparison between classical economy which
based on market models standards and ecological economic which based on environmental
standards, it would be adequate to refer to ".Bounding" contribution through his study
“Spaceship Earth”. In this study, he released what called “the cowboy economy” and
“Spaceship Earth”. According to the cowboy economy, people don’t pay attention to the nature
and environmental problems. They exploit the natural resources and when these resources run
out, they use to immigrate and move to other places for new resource. In the “Spaceship Earth”
as strong metaphor for limited energy and resources, infinity is ended and mankind is in box.
Accordingly, an appropriate strategy on efficient use of energy and resources, and recycling of
materials and products should be adopted. (Boulding,1966,Costanza,2015).
Classical economics has dealt with natural resources as unlimited resources, but not
according to the perspective of the earth as spaceship, where limited resources are decreasing
and environmental damage are increasing day by day. If the traditional economy relays upon
economic efficiency ,the ecological economy depends on environmental efficiency and its
necessities without being concerned with economic efficiency, which has led to all serious
environmental problems, we are suffering from nowadays . Despite the fact that, the ecological
system does not cover the whole strong , natural dimensions, according to Triple Bottom Line

23
approach.(Bhamara and Lofthouse ,2007). Depending on these there dimensions, sustainability
can achieve the efficient balance between economic value- added ( economic responsibility,
societal goods, social responsibility ) and pollution avoidance ( environmental responsibility
) (Sikder, 2003).
Methodology
This study focuses on the adoption of sustainability concept by Jordanian pharmaceutical
industry and its impact on the organizational performance . The study seeks to determine the
impact of sustainability implantation on organizational performance of the companies under
study (the sample of the study). The main variable of the study are:
i. Independent variables encompass the three main dimensions of sustainability (i.e. economic,
social and environmental).
ii. Dependent variables comprise the main organizational performance measures. all business
organization are performance-oriented where success can be reached through the ability of
achieving performance within the internal environment of the organization ,associated with a
rapid and effective response to the market needs in the external environment. Organizational
performance is highly associated with the great evolution of the managerial concepts and
methods. Organizational performance is in fact, the overall performance of the Organization,
which is directly connected with the Organization strategy and its ability to survive and develop
in the future.(Kaplan and Norton,1993), (hammer and champy,2006).
According ( Kaplan and Norton) organizational performance is usually expressed and
measured by multiple indicators. They also stated that there are four perspectives for
organizational performance or what so called business performance, which are: financial
indicator. internal operation. learning and growing, and customer.
Furthermore, the Calibration by its four types, internal ,competitive ,functional and generic
benchmarking provide relevant indicator of the internal organizational performance with
relevant comparison between organizational departments and external indicators with
company best competitors and industry leaders . Actually, there are many organizational
performance indicators, but the researchers have adopted three of them which are market share,
profitability, and company expansion.
Hypotheses of the study: The hypotheses of this study are :
Ho1: There is no statistically significant impact of sustainability dimension (economic, social
and environmental) on market share of organization in the Jordanian pharmaceutical industry.
Ho2: There is no statistically significant impact of sustainability dimension (economic, social
and environmental) on profitability of the organization in the Jordanian pharmaceutical
industry. .
Ho3: There is no statistically significant impact of sustainability dimension (economic, social
and environmental) on the organization extension in the Jordanian pharmaceutical industry.
Data collection: Beside a broad literature review a deliberately designed questionnaire was
used to collect the required as it is one of the most relevant tools for data collection in field
studies. It consists of four sections covered, the basic demographic data, and sustainability
indicators adopted by the company, sustainability dimensions and organizational performance
measure which provided the necessary data for statistical analysis and hypotheses testing .
The questionnaire:
The questionnaire was the main tool for data collection of this study . After it was designed
and deliberately formulated based on the available literature , it was evaluated by academic
referees and then modified according to their comments and notes . It consists of four
section; the first , covered the demographic and basic data, the second addresses ten selected
sustainability indicators commonly use by business organizations. The third included
statements regarding the dimensions of sustainability (independent variables). The fourth
comprised organizational performance measures (dependent variables ).

24
Sample characteristics: A random sample 180 was taken from three major Jordanian
pharmaceutical organizations representing the Jordanian pharmaceutical industry . ( Hikma
Pharmaceutical Co.; Dar Al Dawa, and Ram Pharma) . The questionnaires were distributed at
the headquarters of the three organizations. The recovered and complete questionnaires of (164)
were the base of the statistical analysis of this study. The first section of the questionnaire was
assigned to cover the general characteristics of the sample, as it is illustrated by Table 3.
Table 3: General characteristics of the sample
Characteristics Categories Frequency
Number %
Gender
Male 106 106.0
Female 59 36.0
total 164 100
Age
- 25 22 13.4
26-34 67 40.9
35-44 42 25.6
45-54 27 16.5
55 -- 6 3.7
Total 164 100
Marital status
Single 109 66.5
Married 55 33.5
Total 164 100
Education
Secondary 12 7.3
Diploma 20 12.2
Bachelor 95 57.9
Master 28 17.1
Ph.D. 9 5.5
Total 164 100
Job
Manager/supervisor 55 34
Professional
(production/quality)
34
21
Professional
(medicine/pharmacy)
35
21
Clerk
27 16
N.A. 13 8
Total 164 100
Number of training
programs
None 16 10
1-3 63 38
4-6 41 25
7-9 19 12
> 9 25 15
Total 164 100
The second part of the questionnaire implies ten essential indictors that determine the
strength of Jordanian pharmaceutical companies commitment to the adoption of
sustainability as strategic choice relegalizing all the consequences of this obligation
concerning broad tasks and responsibilities. This is clearly portrays in table 4.
Table 4 : Indicators of companies commitment to the adoption of sustainability as strategic
option
Sustainability indicators Yes Sometime No
No. % No. % No. %
- The company adopts sustainability as a
strategy or as a long term policy . 110 67.1 40 29.9 5 3.0
- The company correlates sustainability with
its reputation. 107 66.2 52 31.7 5 3.0

25
- The company sustain considerable
financial charges for sustainability adoption
.
102 62.2 51 31.1 11 6.7
- Social and environmental sustainable
performance is one of the company total
performance indicators .
98 59.8 53 35.4 8 4.3
- The company adopts projects and programs
related to sustainability in its annual budget
.
80 48.8 67 40.9 16 9.8
- The company implements a clear policy
directed to the green customer . 69 42.1 66 40.2 28 17.1
- The company has its own experts in the
field of sustainability. 73 44.5 66 40.2 25 15.2
- The company has its own code of values
and principles that are sustainability and
society & environment protection oriented .
76 46.3 74 45.1 14 8.5
- The company adopts environmental
standardization indicators to undertake
regular comparisons with its major
competitors .
82 50.0 68 41.5 14 8.5
- The company has its organizational culture
that is sustainability oriented . 65 39.4 86 52.4 13 7.9
Tests
Before conducting hypotheses testing, some tests such as , face and content validity,
reliability and Relationships between independent variables were conducted. which are :
Face validity: As it was stated before the questionnaire was developed relying upon
sustainability literature and reviewed by academic referees to ensure its validity as a mean for
collecting the required data .Then contents validity of the questionnaire statement was tested
using factors analysis for the three dimensions of sustainability and organizational
performance measures .The results of this test indicates that factor loading for both , dependent
and independent variables are good and valid for statistical analysis . Table 5 below portrays
these results .
Table 5 . Factor loadings of study variables or (5) Variables Factor1 Extraction
- Economic dimension 0.861 o.666
- Environmental dimension 0.788 0.590
- Social dimension 0.862 0.743
- Performance criteria 0.790 0.626
To ensure the reliability of the questionnaire internal consistency of the questionnaire
items, Cronbach’s alpha was calculated for the three sustainability dimensions. Cronbach’s
alpha for
economic dimension was 0.668, for environmental dimension was 0.771, for social
dimension was 0.680, and for performance criteria was 0. 680. These results indicated that
there is an internal consistency between the questionnaire items and sustainability statements.
Relationships between variables of the study were examined to verify correlations between
independent and dependent variables. Inter-item correlation matrix was used ,where the
obtained results indicates that , the correlations between variables are were above of 30%
(table 6) , which means that the study variables are appropriated for statistical analysis.
Table 6: Inter-item correlation matrix
Sustainability dimensions Three performance criteria
Economic Social Environ. Market
Share Profitability Extension
Economic 1.000
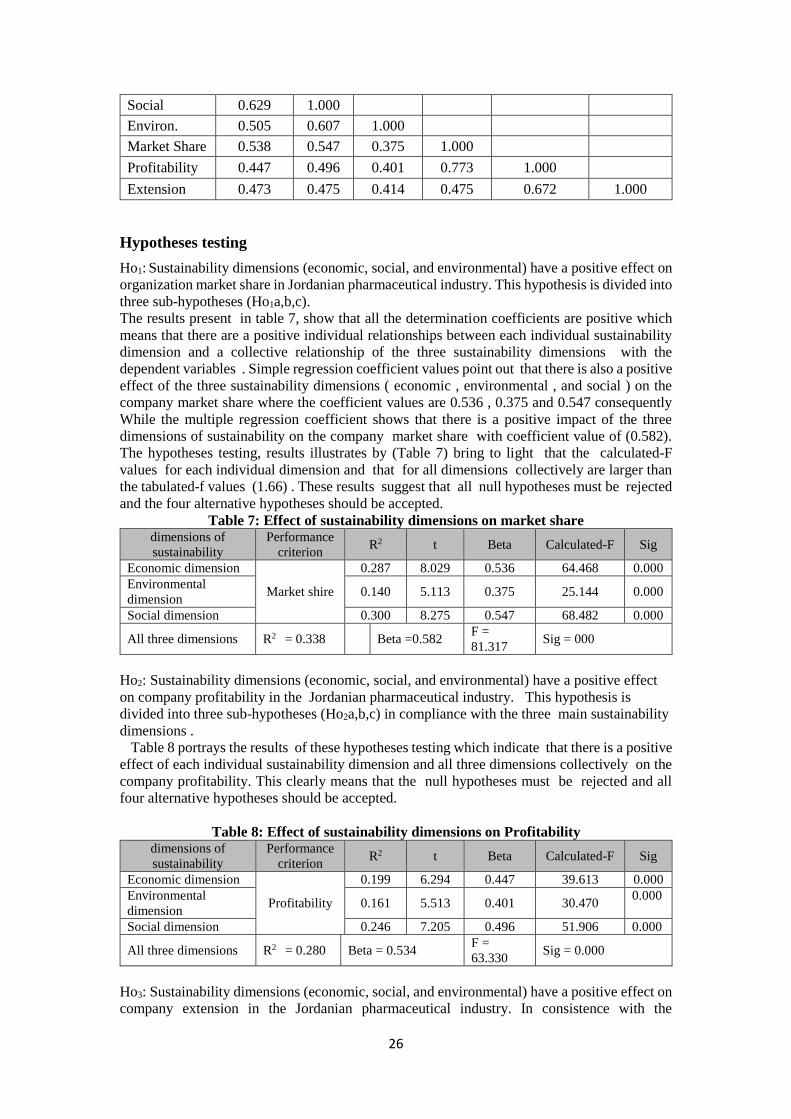
26
Social 0.629 1.000
Environ. 0.505 0.607 1.000
Market Share 0.538 0.547 0.375 1.000
Profitability 0.447 0.496 0.401 0.773 1.000
Extension 0.473 0.475 0.414 0.475 0.672 1.000
Hypotheses testing
Ho1: Sustainability dimensions (economic, social, and environmental) have a positive effect on
organization market share in Jordanian pharmaceutical industry. This hypothesis is divided into
three sub-hypotheses (Ho1a,b,c).
The results present in table 7, show that all the determination coefficients are positive which
means that there are a positive individual relationships between each individual sustainability
dimension and a collective relationship of the three sustainability dimensions with the
dependent variables . Simple regression coefficient values point out that there is also a positive
effect of the three sustainability dimensions ( economic , environmental , and social ) on the
company market share where the coefficient values are 0.536 , 0.375 and 0.547 consequently
While the multiple regression coefficient shows that there is a positive impact of the three
dimensions of sustainability on the company market share with coefficient value of (0.582).
The hypotheses testing, results illustrates by (Table 7) bring to light that the calculated-F
values for each individual dimension and that for all dimensions collectively are larger than
the tabulated-f values (1.66) . These results suggest that all null hypotheses must be rejected
and the four alternative hypotheses should be accepted.
Table 7: Effect of sustainability dimensions on market share dimensions of
sustainability
Performance
criterion R2 t Beta Calculated-F Sig
Economic dimension
Market shire
0.287 8.029 0.536 64.468 0.000
Environmental
dimension 0.140 5.113 0.375 25.144 0.000
Social dimension 0.300 8.275 0.547 68.482 0.000
All three dimensions R2 = 0.338 Beta =0.582
F =
81.317 Sig = 000
Ho2: Sustainability dimensions (economic, social, and environmental) have a positive effect
on company profitability in the Jordanian pharmaceutical industry. This hypothesis is
divided into three sub-hypotheses (Ho2a,b,c) in compliance with the three main sustainability
dimensions .
Table 8 portrays the results of these hypotheses testing which indicate that there is a positive
effect of each individual sustainability dimension and all three dimensions collectively on the
company profitability. This clearly means that the null hypotheses must be rejected and all
four alternative hypotheses should be accepted.
Table 8: Effect of sustainability dimensions on Profitability dimensions of
sustainability
Performance
criterion R2 t Beta Calculated-F Sig
Economic dimension
Profitability
0.199 6.294 0.447 39.613 0.000
Environmental
dimension 0.161 5.513 0.401 30.470
0.000
Social dimension 0.246 7.205 0.496 51.906 0.000
All three dimensions R2 = 0.280 Beta = 0.534
F =
63.330 Sig = 0.000
Ho3: Sustainability dimensions (economic, social, and environmental) have a positive effect on
company extension in the Jordanian pharmaceutical industry. In consistence with the

27
dimensions of sustainability, this hypothesis is divided into three sub-hypotheses (Ho3a,b,c).
The obtained results of these hypotheses testing are displayed in Table 9, these results assure
that there is a positive effect of each individual dimension of sustainability and all three
dimension collectively on company extension. These results affirm that all null hypotheses
must be rejected and the four alternative hypotheses should be accepted.
Table 9: Effect of sustainability dimensions on Extension dimensions of
sustainability
Performance
criterion R2 t Beta Calculated-F Sig
Economic dimension
Extension
0.224 6.744 0.433 45.433 0.000
Environmental
dimension 0.171 5.718 0.414 32.693
0.000
Social dimension 0.226 6.791 0.475 46.118 0.000
All three dimensions R2 = 0.294 Beta = 0.542 F = 65.823 Sig = 0.000
Discussion
For more than two centuries, business was the most important option and unlimited
growth was the most motivating business objective. This seems to have ended now as
sustainability has become the most important choice for survival throw a well balanced
growth without breaking Eco-Limits . Sustainability is the choice of all companies for efficient
use of the available resources where " small is beautiful " and " green product " is the least
need for environmental cleaning that it usually causes or by contrast incurring the additional
burden of green taxes . Green information technology saves tons of papers through the use
of e-mail Correspondences and e-documentation . (Poniatowski,2010). Sustainability
represent one type of resources renewal such as ; 8Rs’ (recycle, reuse, reduce, redistribute,
relocate, restructure, re-contextualize, re-evaluate) (Arrow,2004,p3).
It can be observed from the six perspectives, that the business perspective is based on
economic responsibility and growth priority regardless of other considerations including the
destruction of the environment (Seidel, et al.,2012,p3). The second perspective is dependent on
the law and its effective adaption of environmental objectives on one hand, and on the extent
of the organization's commitment to these goals in a conscious and enlightened manner on the
other hand. Previous experience has confirmed that legislation, is not enough to make the
organizations committed to these objectives due to many reasons .
The previous three perspective (balance between generations, ISO 14000, and greening wave)
exceed the legal responsibility to the corporate environmental responsibility (CER). According
to these perspectives, environmental performance is based on indicators that are not necessarily
compatible with the financial performance indicators (Porter and van der Linde,1995,). On the
other hand, environmental performance can be a significant driver of superior quality, reduction
of environmental effects, and an important source of competitive advantage (Pil and
Rethenberg, 2003,Yang et al., 2010, Horisch et al.,2015, Hallsted et al.,2015,p).
It is necessary to emphasize that environmental performance imposes additional burdens on
the organization, but it can provide many of the advantages of environmentally responsible
organization (see table 10). Sixth perspective still has to do a lot of strenuous efforts in order to
consider the environment as its first priority , and business demands to be second.
Table 10: Positive environmental performance associates with: Positive results Negative results
- reducing the waste of material
- decreasing the pollution
- improving quality
- reducing inventories
- realizing green supply chain
- improving better relationships with green
customer
- obtaining awards of environmental quality
- increasing cost of material
- increasing production cost
- redesigning process and product
- increasing cost of employee training
- experiencing problems with suppliers
- rising the price of the product
- reducing ability to compete

28
- creating a new activities to compete
- entering new markets
- improving organization reputation
- reducing organization’s payment of green
taxes
- improving quality of life in society
- new life cycle e (raw material, production,
distribution, end-of life)
The results of this field study showed that the Jordanian pharmaceutical organizations which
adopt sustainability programs and practices have a positive impact on its organizational
performance. These results are consistent with the results of many other studies in the field,
such as those conducted by , (Tomsic, Bojnec, and Simcic,2015, Goyal and Rahman,2013)
where both reveals that the three sustainability dimensions have a positive effect on business
organizations performance.
References
Abson, D.J. et al.,(2014): Ecosystem services as a boundary object for sustainability,
Ecological Economics, 103, pp 29–37.
Angelakoglou, K. , and Gaidaijs, G. , (2015) A review of methods contributing to the
assessment of environmental sustainability of industrial system ., Journal of Cleaner
Production , 108 (2015) 725-747.
Arrow, K. J. et al.(2004): Are We Consuming Too Much?, Journal of Economic
Perspectives, Vol 18, No. 3, pp 147–172.
Avishai, B.(1994): What is Business’s Social Compact ? HBR.Vol ( 72 ) No.(1 ),Jan-Feb, pp38-
48.
Bai, C.A. and Sarkis, J. (2014), “Determining and applying sustainable supplier key
performance indicators”, Supply Chain Management: An International Journal, Vol. 19 No. 3,
pp 275-291.
Boyce, J. K. (2007): Is Inequality Bad for the Environment?, University of Massachusetts
Amherst, Working Paper 135, available at: http://scholarworks.umass.edu.
Boulding, K.E. (1966): The Economics of the Coming Spaceship Earth, in: Jarrett, H. (ed.)
1966. Environmental Quality in a Growing Economy,pp. 3-14. Johns Hopkins University Press,
Baltimore, Avialable at: http://arachnid.biosci.utexas.edu ( Retrieved dec 20, 2015).
Brundtland, G.H.(1987). Our common future. Oxford University Press, Oxford.
Callicott, J. B. and Frodeman, R.(2009): Encyclopedia of Environmental Ethics and
philosophy,
Gale, Cengage Learning, Detroit.
Catton, Jr., W.R.(1980): Overshoot: The Ecological Basis of Revolutionary Change, The
University of Illinois, Illinois.
Chow, W.S. and Chen, Y. (2012), “Corporate sustainable development: testing a new scale
based on the mainland Chinese context”, Journal of Business Ethics, Vol. 105 No. 4, pp 519-
533.
Cobb, C. , Schuster, D., Beloff, B., and Tanzil , D., (2007) Benchmarking Sustainability ,
Journal of Chemical Engineering Progress, 103 (2007) , pp 38-42.
Coyle, D.(2011): The Economy of Enough, Princeton University Press, Princeton
Dow Jones(2008): Dow Jones Sustainability World Indexes Guide, Available at:
http://www.sustentabilidad.uai.edu.ar (retrieved Dec. 12, 2015)
Dyllick, T. and Hockerts, K. (2002), “Beyond the business case for corporate sustainability”,
Business Strategy and the Environment, Vol. 11 No. 2, pp 130-141.
Esty, D.C. and Winston, A.S.(2009): The Green to Gold, John Wiley & sons, New Jersey.
Fergus, A. and Rowney, J. (2005), “Sustainable development: lost meaning and opportunity?”,
Journal of Business Ethics, Vol. 60 No. 1, pp 17-27.
Friedman, M. (1962 ), Capitalism and Freedom, University of Chicago Press, Chicago.p133.
29
Friedman, M. (1970): The Social Responsibility of Business is to Increase it’s Profits, New
York Times Magazine, Sep3.1970,pp126-7.
Gokcekus, H., Türker, U., and LaMoreaux, J.W.(Eds)(2011): Survival and Sustainability:
Environmental concerns in the 21st Century, Springer, New York.
Hörisch, J., o Ortas, E., Schaltegger, S., and Álvarez, I.(2015): Environmental Effects of
Sustainability Management tools: An Empirical Analysis of Large Companies,
Ecological Economics 120, pp. 241–249.
Hubbard, G. (2009), “Measuring organizational performance: beyond the triple bottom line”,
Business Strategy and the Environment, Vol. 18 No. 3, pp 177-191.
Hueting , R., (2010) Why environmental Sustainability can most probably not be attained
with growing production ., Journal of Cleaner Production , 18 (2010) 525 – 530.
Jones, Van and Conrad, Ariane(2008): The Green Collar Economy, HarperCollins Publishers,
Australia.
Kuhn, T. and Deetz, S. (2008), “Critical theory and corporate social responsibility: can/should
we get beyond cynical reasoning”, The Oxford Handbook of Corporate Social Responsibility,
Oxford University Press, Oxford, pp 173-196.
Lozano, R. (2014) , Creativity and organizational learning as means to foster sustainability
.,Journal of Sustainable Development , Vol. 22, Issue 3, May, , pp 205 – 216.
Neumayer, E.(2013): Weak versus Strong Sustainability, Edward Elgar, Cheltenham.
Parker, J.(2014): Critiquing Sustainability, Changing Philosophy, Routledge, New York.
Pil, F.K. and Rothenberg, S.(2003): Environmental Performance as a Driver of Superior
Quality,
Production and Operations Management, Vol. 12, No. 3, Fall, pp.404-415.
Poniatowski , M.(2010): Foundations of Green IT, Prentice Hall, New Jersey..
Seidel, S., Recker, J., and Brocke, J.v.(2012): Green Business Process Management, in:
Brocke, J.v., Seidel, S., and Recker , J.(Eds): Green Business Process Management, Springer,
Heidelberg, pp.3-13.
Siew, R. Y.J.(2015): A review of Corporate Sustainability Reporting Tools (SRTs), Journal
of
Environmental Management, 164, 180e195
Washington, H,(2015): Demystifying Sustainability, Routledge, London.
Yang, C.-.L., Lin, S.-.P., Chan, Y.-.H., and Sheu, C.,(2010): Mediated effect of environmental
management on manufacturing competitiveness: an empirical study. International Journal
Production Economics, 123, pp. 210-220..
Zhong, Yun , and Wu, Peng ,(2015) Economic Sustainability, Environmental Sustainability
, and Constructability Indicators Related to Concrete and steel project, Journal of Cleaner
Production ,108, pp.748-756.
30
The Case Of Usage of Letter of Credit in
Turkey's Foreign Trade: A Sample of
Participation Banks
Mustafa KEVSER Erkam TEKÇE Ahmet GÖKGÖZ
Yalova University Yalova University Yalova University
Turkish Turkish Turkish
Abstract:
In this study, the case of usage of letter of credit in Turkey's foreign trade is analyzed. In
this context, initially, some information was given about the process of letter of credit method
and the preferability of it in Turkey's imports and exports. Then, in accordance with the purpose
of study, letter of credit method in Turkey is analyzed in terms of maturity, confirmation,
country and magnitude through the letter of credit data regarding 2014 imports of a participation
bank operating in Turkey.
Key words: Foreign Trade, Letter of Credit, Turkey.
1. Introduction
Depending on the fast growing population of the world, a wide variety of goods and
services is needed. Countries cannot meet all needs of goods and services with their own
internal resources or cheaper or high quality goods and services can be provided from abroad.
Countries not only want to buy goods and services they need but also want to sell goods and
services they produce in order to ensure their development. Because of these reasons, in our
day, world countries cooperate and pursue ways of developing trade with each other. In this
regard, foreign trade plays an important role in existing and developing economic cooperation
among countries.
Foreign trade which expresses the trade of goods and services of international economic
relation is the realization of trade of goods and services through imports and exports among
countries. Trade of goods and services subject to foreign trade across countries and continents
bring along many difficulties. Especially, there are many risks in transporting goods and
services to buyer and receiving its payment. Therefore, two most important topics are the type
of delivery and the type of payment. The first one is how to deliver the goods and services
subject to foreign trade and start and end time of obligation of recipient and seller, the second
one is how to receive the payment of goods and services subject to foreign trade. There are
important risks importers and exporters face in delivering goods and services and receiving its
payment. The exporter cannot receive the payment of goods he sends or the importer cannot
receive the goods he pays. While the exporter wants to receive the payment first, similarly the
importer wants to receive goods and services first. The most common payment method protects
buyer and seller from above risks is letter of credit.
The aim of this study is to analyze the case of usage of letter of credit in Turkey's foreign
trade. In accordance with the purpose of study, primarily some information about the letter of
credit method will be given, then the case of usage of letter of credit of a participation bank
operating in Turkey on the basis of letter of credit data of this bank regarding 2014 imports will
be anaylzed. In this content, first of all it would be fitting to give some imformation about the
letter of credit method.

31
2. The Letter of Credit
The letter of credit is a written promise consisting of the instruction given by
buyer(importer) to his bank and the instruction given by correspondent bank in foreign country
of same bank to beneficiary(exporter) that indicates payment in return for submitting particular
documents at a particular time (Gökgöz and Şeker, 2014:90). The letter of credit including the
functions of payment and credit, as a banking transaction, ensures transactions among the
contracting parties securely (Ekici, 1995: 21). Letter of credit is derived from “accredites”
which means credibility, guaranty, acceptance and so on. In the event that buyer and seller do
not know each other well, one or more bank commitments can build up trust among parties
(Bölükbaşı, 2008: 21-22). There are generally four parties in the the letter of credit method.
These are; emir (import firm), issuing bank (bank of import firm), beneficiary (export firm) and
corresponding bank (bank of export firm).
The process of the method of the letter of credit can be summarized as below (Şirinpınar, 2012:
33):
The contract between buyer and seller is signed after early negotiations.
Emir of letter of credit opens letter of credit by applying issuing bank.
Issuing bank prepares letter of credit and sends it to corresponding bank.
Corresponding bank examines letter of credit and report it to export firm.
Export firm examines letter of credit and despatches goods subject to trade.
Beneficiary submits the documents of export delivery to his bank
If the letter of credit is confirmed, corresponding bank makes the payment to issuing bank
within 7 workdays and sends essential documents.
Issuing bank submits related documents to emir and receives the payment
If the letter of credit is not confirmed, the payment is remitted by issuing bank
The payment is transferred to export firm.
Letters of credit can be classified under four titles in terms of some criteria (Kodalak and others,
2015: 72-73):
1) Letters of Credit in Terms of Liability to Pay
a) Confirmed letter of credit
b) Unconfirmed letter of credit
2) Letters of Credit in Terms of Payment Conditions
a) Letter Of Credit On Sight
b) Deferred Letter Of Credit
c) Letter of Credit with Acceptance Credit
3) Letters of Credit in Terms of Purpose of Usage
a) Fixed Letter Of Credit
b) Transferable Letter Of Credit
c) Red Clause Letter Of Credit
d) Green Clause Letter Of Credit
e) Back-To-Back Letter Of Credit
f) Revolving Letter Of Credit
4) Commonly Used Letters of Credit in Foreign Trade
a) Straight Deferred Letter Of Credit
b) Straight Confirmed Deferred Letter Of Credit
c) Straight Cash Letter Of Credit
d) Straight Confirmed Cash Letter Of Credit
Table 1: The amount of Turkey’s Foreign Trade in Terms of Methods of Payments
(2014)

32
Imports
( 1.000
USD)
Percenta
ge
(%)
Exports
(1.000
USD)
Percenta
ge
(%)
Cash against goods 71 528
310 29,54
102 834
175 65,25
Cash in advance 119 326
764 49,27
14 929
437 9,47
Cash against documents
14 920
304 6,16
24 228
910 15,37
Deferred letter of credit 10 542
951 4,35 2 449 256 1,55
Letter of credit 18 442
201 7,62
11 239
517 7,13
Letter of credit with acceptance credit 118 420 0,05 44 238 0,03
Cash against documents with acceptance
credit 493 065 0,2 139 269 0,09
Cash against goods with acceptance
credit 516 465 0,21 112 354 0,07
Other 6 288 637 2,6 1 633 002 1,04
Total 242 177
117 100
157 610
158 100
Source: TUIK data, www.tuik.gov.tr
As seen from Table 1, most common methods of payments in Turkey’s imports are
respectively cash, cash against goods, letter of credit and cash against documents. And most
common methods of payments in Turkey’s exports are respectively cash against goods, cash
against documents, cash and letter of credit.
3. The Evaluation of the Letter of Credit Applications in Turkey’s Foreign Trade
In this study, the letters of credit data of a participation bank is analyzed with the purpose
of determining the place of the type of letter of credit in use. 2060 letter of credit transactions
made in 2014 by that bank is analyzed in terms of country, maturity, confirmation and amount
of imports.
Table 2: The Relationship Between Country and Maturity
Type of Maturity Total
Country Sight payment Deferred
Argentina Quantity 0 2 2
Percentage %100 %100 %100
Australia Quantity 1 2 3
Percentage %33 %67 %100
Austria Quantity 1 1 2
Percentage %50 %50 %100
Bahrain Quantity 1 0 1
Percentage %100 %0 %100
Bangladesh Quantity 60 13 73
Percentage %82 %28 %100
Belgium Quantity 8 3 11
Percentage %73 %27 %100
Brasil Quantity 4 0 4
Percentage %100 %0 %100
Bulgaria Quantity 1 0 1
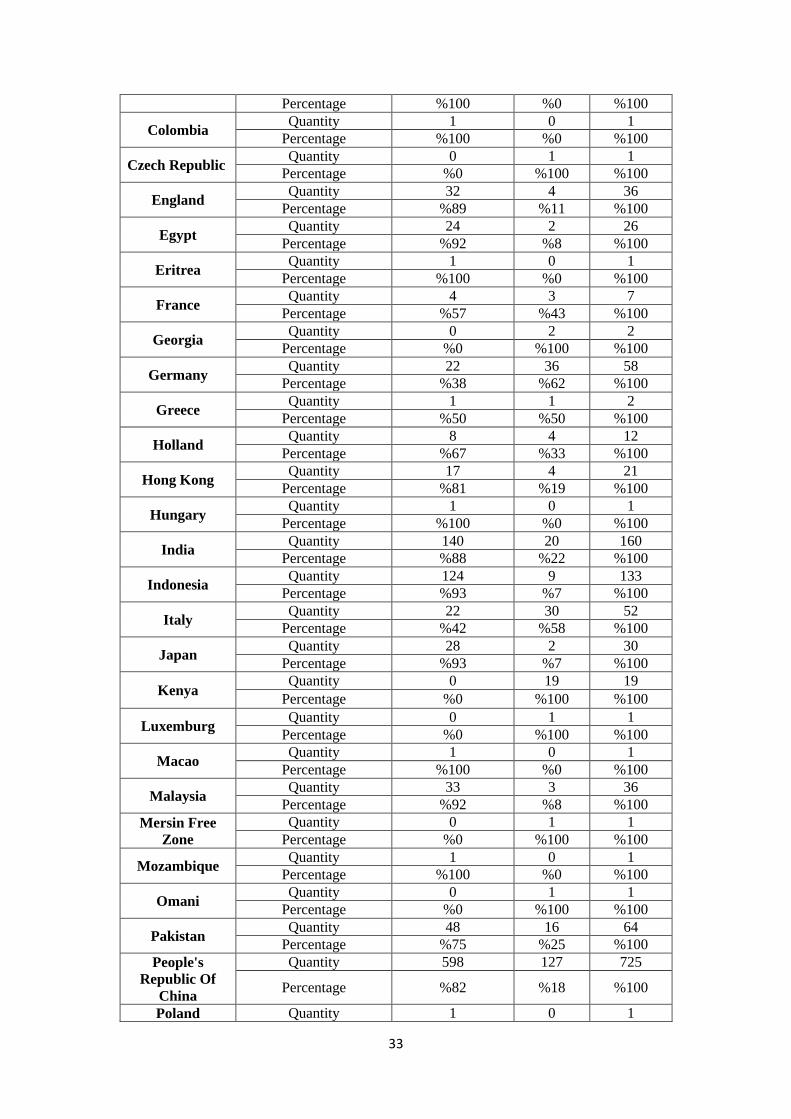
33
Percentage %100 %0 %100
Colombia Quantity 1 0 1
Percentage %100 %0 %100
Czech Republic Quantity 0 1 1
Percentage %0 %100 %100
England Quantity 32 4 36
Percentage %89 %11 %100
Egypt Quantity 24 2 26
Percentage %92 %8 %100
Eritrea Quantity 1 0 1
Percentage %100 %0 %100
France Quantity 4 3 7
Percentage %57 %43 %100
Georgia Quantity 0 2 2
Percentage %0 %100 %100
Germany Quantity 22 36 58
Percentage %38 %62 %100
Greece Quantity 1 1 2
Percentage %50 %50 %100
Holland Quantity 8 4 12
Percentage %67 %33 %100
Hong Kong Quantity 17 4 21
Percentage %81 %19 %100
Hungary Quantity 1 0 1
Percentage %100 %0 %100
India Quantity 140 20 160
Percentage %88 %22 %100
Indonesia Quantity 124 9 133
Percentage %93 %7 %100
Italy Quantity 22 30 52
Percentage %42 %58 %100
Japan Quantity 28 2 30
Percentage %93 %7 %100
Kenya Quantity 0 19 19
Percentage %0 %100 %100
Luxemburg Quantity 0 1 1
Percentage %0 %100 %100
Macao Quantity 1 0 1
Percentage %100 %0 %100
Malaysia Quantity 33 3 36
Percentage %92 %8 %100
Mersin Free
Zone
Quantity 0 1 1
Percentage %0 %100 %100
Mozambique Quantity 1 0 1
Percentage %100 %0 %100
Omani Quantity 0 1 1
Percentage %0 %100 %100
Pakistan Quantity 48 16 64
Percentage %75 %25 %100
People's
Republic Of
China
Quantity 598 127 725
Percentage %82 %18 %100
Poland Quantity 1 0 1

34
Percentage %100 %0 %100
Portugal Quantity 4 0 4
Percentage %100 %0 %100
Qatar Quantity 0 2 2
Percentage %0 %100 %100
Russia Quantity 2 3 5
Percentage %40 %60 %100
South Korea Quantity 108 64 172
Percentage %63 %37 %100
Spain Quantity 5 5 10
Percentage %50 %50 %100
Sweden Quantity 2 2 4
Percentage %50 %50 %100
Switzerland Quantity 15 7 22
Percentage %68 %32 %100
Serbia Quantity 1 0 1
Percentage %100 %0 %100
Singapore Quantity 12 7 19
Percentage %63 %37 %100
Sri Lanka Quantity 1 20 21
Percentage %04 %96 %100
Sudan Quantity 1 0 1
Percentage %100 %0 %100
Saudi Arabia Quantity 17 1 18
Percentage %94 %6 %100
Taiwan Quantity 68 43 111
Percentage %61 %39 %100
Tajikistan Quantity 1 0 1
Percentage %100 %0 %100
Thailand Quantity 30 3 33
Percentage %91 %9 %100
Turkey Quantity 0 5 5
Percentage %0 %100 %100
UAE (United
Arab Emirates)
Quantity 7 4 11
Percentage %64 %36 %100
Ukraine Quantity 0 1 1
Percentage %0 %100 %100
USA (United
State of
America)
Quantity 9 6 15
Percentage %60 %40 %100
Uzbekistan Quantity 4 0 4
Percentage %100 %0 %100
Vietnam Quantity 98 9 107
Percentage %92 %8 %100
Total Quantity 1571 489 2060
Percentage %76 %24 %100
As seen from Table 2, 76% of letter of credit transactions is sight payment and 24% of letter of
credit transactions is deferred. The bank opened the highest number of transactions for People's
Republic Of China and 82% of transactions is letter of credit on sight.
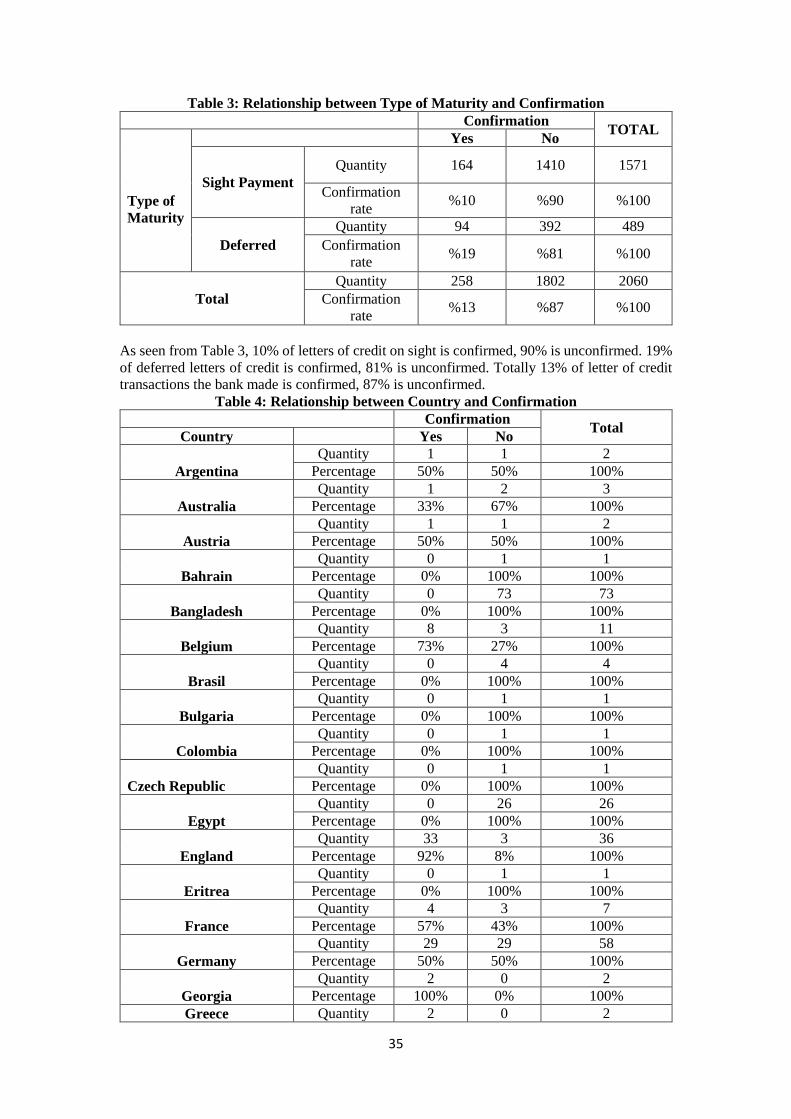
35
Table 3: Relationship between Type of Maturity and Confirmation
As seen from Table 3, 10% of letters of credit on sight is confirmed, 90% is unconfirmed. 19%
of deferred letters of credit is confirmed, 81% is unconfirmed. Totally 13% of letter of credit
transactions the bank made is confirmed, 87% is unconfirmed.
Table 4: Relationship between Country and Confirmation
Confirmation Total
Country Yes No
Argentina
Quantity 1 1 2
Percentage 50% 50% 100%
Australia
Quantity 1 2 3
Percentage 33% 67% 100%
Austria
Quantity 1 1 2
Percentage 50% 50% 100%
Bahrain
Quantity 0 1 1
Percentage 0% 100% 100%
Bangladesh
Quantity 0 73 73
Percentage 0% 100% 100%
Belgium
Quantity 8 3 11
Percentage 73% 27% 100%
Brasil
Quantity 0 4 4
Percentage 0% 100% 100%
Bulgaria
Quantity 0 1 1
Percentage 0% 100% 100%
Colombia
Quantity 0 1 1
Percentage 0% 100% 100%
Czech Republic
Quantity 0 1 1
Percentage 0% 100% 100%
Egypt
Quantity 0 26 26
Percentage 0% 100% 100%
England
Quantity 33 3 36
Percentage 92% 8% 100%
Eritrea
Quantity 0 1 1
Percentage 0% 100% 100%
France
Quantity 4 3 7
Percentage 57% 43% 100%
Germany
Quantity 29 29 58
Percentage 50% 50% 100%
Georgia
Quantity 2 0 2
Percentage 100% 0% 100%
Greece Quantity 2 0 2
Confirmation TOTAL
Type of
Maturity
Yes No
Sight Payment
Quantity 164 1410 1571
Confirmation
rate %10 %90 %100
Deferred
Quantity 94 392 489
Confirmation
rate %19 %81 %100
Total
Quantity 258 1802 2060
Confirmation
rate %13 %87 %100
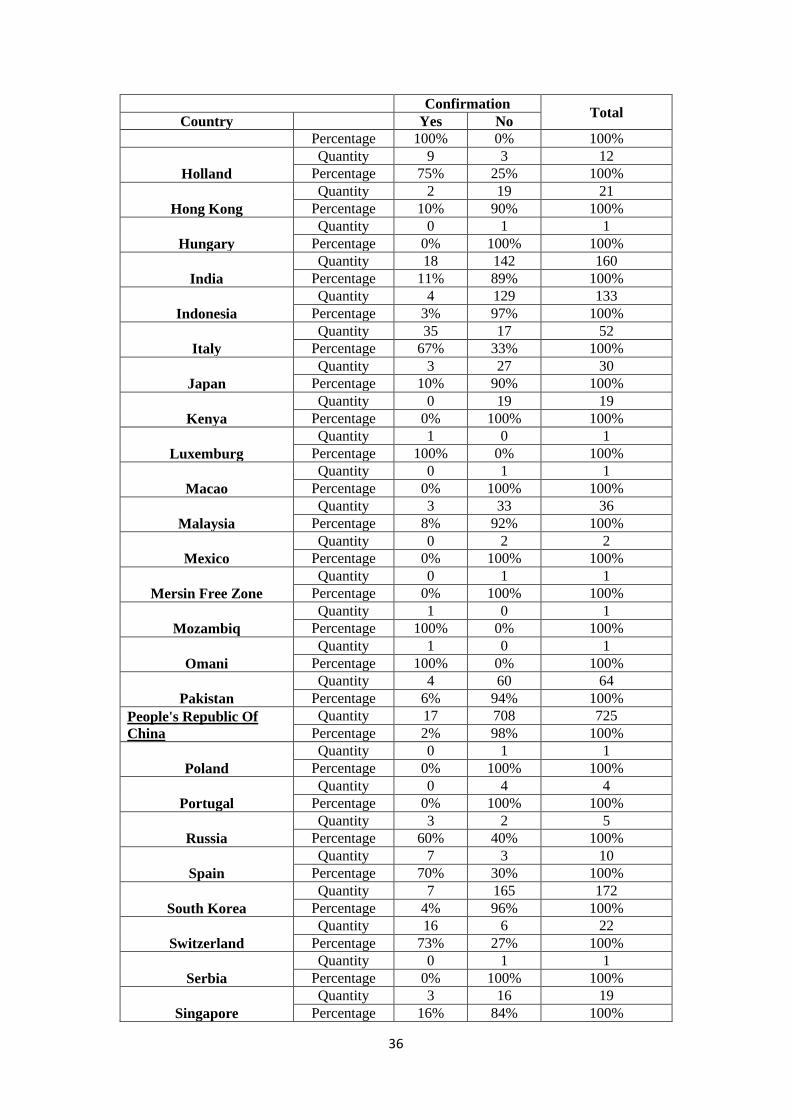
36
Confirmation Total
Country Yes No
Percentage 100% 0% 100%
Holland
Quantity 9 3 12
Percentage 75% 25% 100%
Hong Kong
Quantity 2 19 21
Percentage 10% 90% 100%
Hungary
Quantity 0 1 1
Percentage 0% 100% 100%
India
Quantity 18 142 160
Percentage 11% 89% 100%
Indonesia
Quantity 4 129 133
Percentage 3% 97% 100%
Italy
Quantity 35 17 52
Percentage 67% 33% 100%
Japan
Quantity 3 27 30
Percentage 10% 90% 100%
Kenya
Quantity 0 19 19
Percentage 0% 100% 100%
Luxemburg
Quantity 1 0 1
Percentage 100% 0% 100%
Macao
Quantity 0 1 1
Percentage 0% 100% 100%
Malaysia
Quantity 3 33 36
Percentage 8% 92% 100%
Mexico
Quantity 0 2 2
Percentage 0% 100% 100%
Mersin Free Zone
Quantity 0 1 1
Percentage 0% 100% 100%
Mozambiq
Quantity 1 0 1
Percentage 100% 0% 100%
Omani
Quantity 1 0 1
Percentage 100% 0% 100%
Pakistan
Quantity 4 60 64
Percentage 6% 94% 100%
People's Republic Of
China
Quantity 17 708 725
Percentage 2% 98% 100%
Poland
Quantity 0 1 1
Percentage 0% 100% 100%
Portugal
Quantity 0 4 4
Percentage 0% 100% 100%
Russia
Quantity 3 2 5
Percentage 60% 40% 100%
Spain
Quantity 7 3 10
Percentage 70% 30% 100%
South Korea
Quantity 7 165 172
Percentage 4% 96% 100%
Switzerland
Quantity 16 6 22
Percentage 73% 27% 100%
Serbia
Quantity 0 1 1
Percentage 0% 100% 100%
Singapore
Quantity 3 16 19
Percentage 16% 84% 100%

37
Confirmation Total
Country Yes No
Sri Lanka
Quantity 0 21 21
Percentage 0% 100% 100%
Sudan
Quantity 0 1 1
Percentage 0% 100% 100%
Saudi Arabia
Quantity 17 1 18
Percentage 94% 6% 100%
Tajikistan
Quantity 0 1 1
Percentage 0% 100% 100%
Thailand
Quantity 0 33 33
Percentage 0% 100% 100%
Taiwan
Quantity 1 110 111
Percentage 1% 99% 100%
Turkey
Quantity 3 2 5
Percentage 60% 40% 100%
Ukraine
Quantity 1 0 1
Percentage 100% 0% 100%
UAE (United Arab
Emirates)
Quantity 2 9 11
Percentage 18% 82% 100%
USA (United State of
America)
Quantity 11 4 15
Percentage 73% 27% 100%
Uzbekistan
Quantity 0 4 4
Percentage 0% 100% 100%
Vietnam
Quantity 2 105 107
Percentage 2% 98% 100%
Total Quantity 261 1799 2060
Percentage %13 %87 %100
According to Table 4, only 13% of letter of credit transactions is confirmed. 2% of letter
of credit transactions of People's Republic Of China which has highest number of transactions
is confirmed, 98% is unconfirmed.
Table 5: Relationship Between the Amount of Imports and Type of Maturity
Categorical Imports1
Total 1 2 3 4 5
Sight Payment Quantity 401 447 441 168 114 1571
Percentage %87 %77 %72 %74 %64 %76
Deferred Quantity 62 135 168 59 65 489
Percentage %13 %23 %28 %26 %36 %24
Total Quantity 463 582 609 227 179 2060
Percentage %100 %100 %100 %100 %100 %100
When the magnitude of letter of credit transactions is considered, transactions between
100.000-250.000 USD comes first and transactions between 50.000-100.000 USD comes in
second. 72% of letter of credit transactions is letter of credit on sight, 28% is deferred. 77% of
letter of credit transactions between 50.000-100.000 USD is letter of credit on sight, 23% is
deferred.
-1 1 less than 50.000 USD
2- between 50.000-100.000 USD
3- between 100.000- 250.000 USD
4- between 250.000-500.000 USD
5- more than 500.000 USD

38
Table 6: Relationship Between the Amount of Import and Confirmation
Confirmation
Categorical Imports 2 Total
1 2 3 4 5
Yes Quantity 30 59 67 38 65 258
Percentage %06 %10 %11 %17 %36 %13
No Quantity 433 523 540 189 114 1799
Percentage %94 %90 %89 %83 %64 %87
Total Quantity 463 582 609 227 179 2060
Percentage %100 %100 %100 %100 %100 %100
When the relationship between the amount of import and confirmation is considered, according
to Table 6, 11% of letter of credit transactions between 100.000-250.000 USD is confirmed,
89% is unconfirmed. 10% of letter of credit transactions between 50.000-100.000 USD is
confirmed, 90% is unconfirmed.
4. Conclusion and Evaluation
The most commonly used methods of payment are respectively cash, cash against goods,
letter of credit and cash against documents in Turkey’s imports. As for Turkey’s exports, the
most commonly used methods of payment are respectively cash against goods, cash against
documents, cash and letter of credit. The letter of credit method does not take place near the
top. The percentage of the letter of credit method in Turkey’s imports and exports is only nearly
7%. The fact that cash and cash against goods payment methods respectively comes first in
Turkey’s imports and exports makes Turkey disadvantageous and face important risks in
foreign trade.
As a result of the analysis of a participation bank’s letter of credit transactions in 2014, it
is determined that 76% of letter of credit transactions is letter of credit in sight and 87% of letter
of credit transactions is unconfirmed. When the magnitude of letter of credit transactions is
considered, it is seen that the most transactions are between 100.000-250.000 USD.
References
BÖLÜKBAŞI, Senem, (2008), Akreditifli İşlemlerde Karşılaşılan Sorunlar ve Çözüm Önerileri
Üzerine Bir İnceleme, Basılmamış Yüksek Lisans Tezi, Marmara Üniversitesi Sosyal Bilimler
Enstitüsü.
EKİCİ, Akın (1995), Akreditifin Hukuki Niteliği ve Tarafların Yükümlülükleri, Beta Yayınları,
İstanbul.
GÖKGÖZ, Ahmet ve Ayberk ŞEKER (2014), Dış Ticaret İşlemleri ve Muhasebesi, Dora
Yayınları, Bursa.
KODALAK, Oğuzhan, TOPAL, Bayram ve Ahmet Selçuk DİZKIRICI (2015), “Dış Ticarette
Akreditifli Ödemeler: UCP 600’e Göre Bankalarda Güncel Örnek Uygulamalar”, Journal of
Accounting, Finance and Auditing Studies, Vol.1, Issue 3: 68-90.
ŞİRİNPINAR, Arlin, (2012), Dış Ticarette Akreditif İşlemlerinde Operasyonel Risklerin
Önlenmesi, Basılmamış Yüksek Lisans Tezi, İstanbul Kültür Üniversitesi, Sosyal Bilimler
Enstitüsü.
-1 2 less than 50.000 USD
2- between 50.000-100.000 USD
3- between 100.000- 250.000 USD
4- between 250.000-500.000 USD
5- more than 500.000 USD

39
TUİK, Foreign Trade Statistics by Enterprise Characteristics,
http://www.turkstat.gov.tr/PreTablo.do?alt_id=1088, 17.01.2016.
Sustainability Accounting Profession
Omran A. Al-Ibbini Ahmad A. Abdallah Mohammed M. Yassin
Al-Zaytoonah University
of Jordan
Al-Zaytoonah University
of Jordan
Al-Zaytoonah University
of Jordan
Jordan Jordan Jordan
Abstract:
This theoretical paper considers how accounting can contribute to sustainability reporting
for organizations, and what implications changes in sustainability reporting in these
organizations could have for the accounting profession, in terms of opportunities, challenges
and skills. Through reviewing the literature, it was found that there are a number of challenges
that face sustainability reporting, including difficulties of estimation and projections,
understanding links between actions and impact, establishing robust indicators, verifiability and
assurance, and the challenge of applying accounting standards to sustainability issues. Also,
accounting profession should seek to adapt its training support and programs to accommodate
the future needs of sustainability reporting. Greater attention needs to be paid towards
measuring sustainability; the accounting profession could play an important role in developing
robust measures.
1. Introduction
In the last two decades, sustainable development became an important phenomenon not
only at national platforms but also at the corporate level. “Sustainable development is
development that meets the needs of the present without compromising the ability of future
generations to meet their own needs” (Brundtland, 1987). This definition emphasizes that
sustainability reporting should recognize the interdependence of economic, social and
environmental factors. When this definition is applied in practice, it is so broad and vague that
business and less enlightened governments can claim to care about the environment, but
actually give priority to social and economic considerations (ACCA, 2010). Ball (2002) argues
that the greater focus on sustainability accounting in the private sector is to some extent linked
to the unsustainable nature of much private sector practices, whereas public sector could be
seen as closer to sustainability concerns.

40
(Source: www.csrwatchjordan.com)
Sustainability embraces three major areas: economic progress, social progress and
environmental progress. Previously, the attention had focused on economic or financial
progress while social and environmental progress was assigned less recognition. This trend
seems to be changing now as more focus is being placed on social and environmental issues.
With environmental and social issues becoming increasingly important in the public opinion,
there is no doubt about the significance of sustainability reporting. According to Laplume et al.
(2008), several stakeholders such as employees, customers, suppliers, creditors, etc. with a
drive for diverse economic, environmental, and social interests determine the success of an
organization. Sustainability reporting is an unavoidable route through which organizations try
to meet the information needs of the host of stakeholders. With the rising concerns for social
and environmental matters, one cannot but accept the overwhelming need for sustainability
reporting.
According to common definitions, every dimension of the sustainability dimensions focuses on
different subsets.
Environmental factors Social Economic
Energy
Water
Greenhouse gases
Emissions
Hazardous and non-hazardous
waste
Recycling
Packaging
Community investment
Working conditions
Human rights and fair trade
Public policy
Diversity
Safety
Anticorruption
Accountability /
Transparency
Corporate governance
Stakeholder value
Economic performance
Financial performance[12]
(Source: www.wikipedia.com)
Sustainability accounting connects the companies' strategies from a sustainable framework
by disclosing information on the three dimensional levels (environment, economic and social).
In practice, however, it is difficult to put together policies that promote simultaneously
environmental, economic and social goals.
The sustainability accounting phenomenon sprang up from developments in accounting.
An area of brainstorming over the years has been how accounting and accountability could
improve sustainable development. This line of brainstorming has tried to promote the strategy
of sustainability by developing systems that could modify conventional financial accounting
systems to cover sustainability issues.
To develop sustainability accounting systems, one thing fundamentally required is the
reappraisal of the relative significance of social, environmental and economic benefits and risks
and their interactions in corporate accounting systems (Schaltegger and Burritt, 2010).
Sustainability accounting has enjoyed popularity of recent. Several organizations are
beginning to adopt new techniques in their annual reports by making disclosures on their core
activities and the impact that these have on the environment. This development coincides with
the increasing demand from stakeholders on how companies manage their resources to achieve
their goals so as to accomplish sustainable development. Sustainability accounting
acknowledges the importance of financial information and tries to replicate this on social and
environmental concerns.
Sustainability reporting involves a number of professions. This paper considers how
accounting can contribute to sustainability reporting for organizations, and what implications
changes in sustainability reporting in these organizations could have for the accounting
profession, in terms of opportunities, challenges and skills.
2. GLOBAL REPORTING INITIATIVE (GRI)
A number of attempts have been made to define sustainability or sustainable development
in a way that could be used consistently around the world. The Brundtland definition still leaves
a large degree of differences in measuring sustainability. Specific indicators and measures
41
designed for international use, but they tend to focus on specific aspects of sustainable
development and are voluntarily implemented by private or public sector. Global Reporting
Initiative (GRI) is a framework designed mainly for private companies, but developing
supplementary guidance for sustainability reporting for public agencies, charities and other
organizational entities.
The GRI framework is a collection of reporting guidance documents — all of which were
developed through global, multi-stakeholder consultative processes — designed to assist
companies in preparing sustainability reports and ESG disclosures. These guidance documents
are periodically revised to ensure that they continue to meet the needs of 21st-century business
and society (GRI Website).
The Global Reporting Initiative was founded at the end of the 1990s. Only a few dozen
companies filed reports with the GRI in its first few years, but with the environmental
sustainability movement at its core, it quickly gathered momentum. By the mid-2000s,
hundreds of companies were voluntarily adopting the GRI framework and producing
sustainability reports. In January 2011, the GRI began collecting GRI-referenced and non-GRI-
referenced reports. Today, thousands of companies, from all over the globe, are publishing
sustainability reports. The first version of the GRI standards appeared in 2000. The working
groups that draft and revise the framework and supplements are composed of corporate
representatives, NGOs, labor groups and society at large. Two years later, the second version
of the Sustainability Reporting Guidelines was released at the World Summit for Sustainable
Development in 2002. This version known as G2 was a significant improvement from the first
version. It was utilized by several companies including Cisco, Ford, and Microsoft. G3 was
released in 2006. Its content was streamlined to bring about improved communication with
stakeholders. The G3 guidelines are more useful for investors and analysts, and bring corporate
governance into focus. In May 2013, G4 was published. The guideline focuses on those topics
that are material to an organization and its key stakeholders. This ‘materiality’ focus will make
reports more relevant, more credible and more user-friendly. This new focus on materiality
means that sustainability reports should now focus on matters that can be considered as key in
achieving the organization’s goals in alignment to its impact on society (Oba and Ibikunle,
2015).
By continually revising its standards through a broadly consultative global process to meet
evolving circumstances, the GRI has established itself as a leader in reporting (GRI Website).
In the 2013 Boston College Center for Corporate Citizenship and EY survey on
sustainability reporting, more than two-thirds of respondents indicate that their organizations
employ the GRI framework in the preparation of their reports. The key benefit of using the GRI
framework, in addition to standardization of reports, is guidance on material issues. The GRI
emphasizes that a company consider those environmental and social aspects that are most
significant to its key stakeholders and have the most significant impacts on its business — or
result from it (EY and Boston College Center, 2014).
3. SUSTAINABILITY IN JORDAN
Jordan, along with several other Arab nations, is increasingly weaving the tenets of
sustainable practices into day-to-day business. That means taking greater account of the
economic, social, and environmental impact of our decisions (Queen Rania, 2015). For
example, the Jordan River Foundation (JRF) was the first NGO in the region to issue a
sustainability report. JRF strives to make all its projects community and climate conscious,
partnering with villages like Rasoun to transform them into models of sustainable
development. The tourism sector, exemplified by the award-winning Royal Society for the
Conservation of Nature (RSCN), is on a track to transform itself into a sustainable industry,
building eco-friendly accommodation, advising communities how to protect their resources,
and establishing wildlife and nature sanctuaries (Jordan River Foundation, 2011). It is worth
mentioning that the JRF has presented its sustainability management report 2010 using the
requirements of application level B of G3.

42
Also, Arab Sustainability Leadership Group (ASLG) formed in Jordan in 2008, ASLG is
committed to the highest standards of sustainability practices and – encouragingly – growing
in strength. As leading practitioners in sustainability, members are setting the pace of business
and proving that the Arab world can respond to global challenges. When it comes to
sustainability, ASLG is the regional standard bearer. To encourage broader adoption of 21st
Century business practices, ASLG launched in 2009 the first Arab Responsible
Competitiveness Index (ARCI). ARCI is an invaluable indicator for the Middle East on the
status of industries and services, guiding governments and CEOs alike on how they can
successfully combine conscience and competitiveness (Queen Rania, 2015).
Corporate Social Responsibility (CSR) Watch Jordan (2014) issued a comparative study
on the practice of corporate responsibility (CR) among 7 sectors in Jordan including banks,
telecom, transport, manufacturing, logistics, energy, and mining. These sectors formed the total
GDP of Jordan. The study concluded that Jordanian banks fall along a broad spectrum of CR
practice, starting from no CR practice at all, to strategic CR practice, with the majority of the
banks falling in the Charitable Practice category. Also, it was found that the majority of
telecom, transport, manufacturing, logistics, and mining companies don’t report any CSR
practice. Energy Local and regional companies operating within Jordan fall along a broad
spectrum of CR practice. Ranging from no apparent CR practice to semi strategic practice, most
companies fall into the semi strategic practice category.
While other countries move into the field of sustainability, Jordan will continue to
innovate, solidifying its position as a leading regional economy, society, and role model.
4. ACCOUNTING AND SUSTAINABILITY
By disclosing sustainability information, organizations aim to increase transparency, enhance
brand value, reputation and legitimacy, improve competitive stance and trigger employee
motivation (Herzig and Schaltegger, 2006).
In the last four decades, the business world has been under pressure to be responsible to
its stakeholders and the entire environment/society in which it operates (Sihotang & Effendi,
2010). As such, the need for a reporting framework that captures an integration of economic,
environmental and social factors into information disclosure with a target for sustaining
resources for the future is emphasized (Eppel, 2008). Although there is no single globally
accepted definition of sustainability reporting, Elkington (1997) asserts that “the term
sustainability reporting in its narrowest term is a framework for measuring and reporting
corporate performance against economic, social and environmental parameters. As such, it
covers the triple Ps – people, plant and profits.
The development of sustainability indicators and monitoring frameworks has largely been
led by statisticians and economists. However, accountants have their own skill-set which could
considerably benefit robust sustainability standards and monitoring. Standardizing the
measurement of indicators within and between organizational units is the most obvious area
where accountants could lead development.
Accountants could also add value in the areas of risk management, value for money
methodologies, and balancing governance and ethical standards in politically governed
environments. Also, if government institutions decide to pursue monetization strategies as part
of sustainability reporting frameworks, then accountants will have ample opportunity to apply
their financial and budgeting skills (EY and Boston College Center, 2014).
Challenges for Accountants
Regardless of the enthusiasm in sustainability reporting, organizations and those reporting
for the first time are finding it challenging grappling with the set of protocols. Unlike financial
reporting, which is targeted primarily at one key stakeholder, the investor, sustainability
reporting targets a wider range of stakeholders and borders around addressing complex issues
such as emissions, wastes, etc. (Oba and Ibikunle, 2015). In a bid to address these inherent
complexities in sustainable reporting, standardization efforts are afloat to have comparable and
verifiable sustainability reports globally. Despite the efforts channeled to this end, significant

43
differences still remain between organizations from different institutional environments with
regard to the content and quality of sustainability reports (Fortanier et al., 2011).
Although there are clearly areas where accountants can make a strong and unique
contribution to sustainable development and government sustainability reporting, it is also a
field which raises challenging issues for the profession. These issues relate to the key elements
of the sustainability approach – the interconnected nature of environmental, economic and
social factors, and the intergenerational time-frame and, hence, length of calculations. The
associated challenges include: difficulties of estimation and projections, understanding links
between actions and impact, establishing robust indicators, and verifiability and assurance. The
challenge of applying the traditionally rigorous standards of accounting to sustainable
development issues may make some wish to shy away from this process. However, these
challenges could also be looked on as opportunities to develop the strengths of the profession
into new areas (EY and Boston College Center, 2014).
Thoradeniya et al. (2012) noted that notwithstanding the importance of sustainable
development, its reporting remains voluntary in most countries. This is largely because of the
fact that organizations in countries that have no functional laws institutionalizing sustainability
reporting also engage in their own forms of reporting and as a result there exists a farrago of
reporting styles and information contents.
Challenges for Researchers
It is also important to understand the factors that influence disclosure in order to improve
sustainability accounting. However, insufficient research attention has been paid to factors that
impact on the quality of sustainability reporting which is necessary for better accountability
(Thoradeniya et al., 2012). It is imperative that the possible determinants of corporate
sustainability accounting be established so as to be able trigger better and sustained reporting.
Despite the growing quantum of literature on the subject as well as the increasing awareness of
sustainability issues in society, the current knowledge of sustainability accounting has many
gaps and inconsistencies. Research on sustainability reporting has been unsystematic and
lacking a flow. The concept even seems to suggest several things to different researchers and
organizations. Research direction must be targeted at getting sustainability accounting
systematized and structured. For this to be realized there must be a reference, that is, a
framework that enjoys a relative degree of acceptability of which the only one that seems to
exist for now is the GRI (www.wikipedia.com).
CONCLUSION
This paper aimed at exploring the sustainability accounting profession challenges that face
accountants in the area of sustainable development as it became an important phenomenon.
Accountants will need to broaden their knowledge and to establish a common dialogue with
social and ecological professionals.
There are undoubtedly a number of challenges to sustainability reporting, including
difficulties of estimation and projections, understanding links between actions and impact,
establishing robust indicators, verifiability and assurance and the challenge of applying the
traditionally rigorous standards of accounting to sustainable development issues.
Also, the accounting profession should seek to adapt its training support and programs to
accommodate the future needs of sustainability reporting.
Greater attention needs to be paid to understanding how sustainability elements could be
measured. The accounting profession could play an important role in developing robust
measures which are appropriate to the task.

44
REFERENCES
Association of Chartered Certified Accountants – ACCA (2010), Sustainability
Reporting Matters: What Are National Governments Doing About It?,
<http://www.accaglobal.com/content/dam/acca/global>
Ball, A. (2002), Sustainability Accounting in UK Local Government: An Agenda for
Research, ACCA research report no. 78 (London: CAET).
Brundtland, G. (ed.) (1987), Our Common Future: The World Commission on
Environment and Development, <http://www.un-documents.net/wced-ocf.htm>.
CSR Watch Jordan (2014), Comparative Sectoral Study on Corporate Responsibility,
<http://www.csrwatchjordan.com/sustainability-in-jordan.html>
Elkington, J. (1997). Cannibals with Forks: Triple Bottom Line of 21st Century
Business, St. Albans: Capstone Publishing Ltd.
Eppel, D. (1999). Sustainable Development and Environment: A Renewed Effort in the
OECD. Environment, Development, and Sustainability, Vol. 1, pp: 41 – 53.
EY and Boston College Center for Corporate Citizenship (2014), Value of
sustainability Reporting, Ernst and Young LLP.
Fortanier, F., Kolk, A. & Pinkse, J. (2011). Harmonization in CSR reporting: MNEs
and global CSR standards. Management International Review 51, 665–696.
Global Reporting Initiative – GRI, “G4 Developments”
<https://www.globalreporting.org/reporting/latestguidelines/g4developments/Pages>
Herzig, C. & Schaltegger, S. (2006). Corporate Sustainability Reporting: An Overview,
in: Schaltegger, S., Bennett, M., Burritt, R.L. (Eds.), Sustainability Accounting and
Reporting. Springer, Dordrecht, pp. 301–324.
Jordan River Foundation (2011), Sustainability Report 2010, <
http://www.jordanriver.jo/sites/default/files/SUSTAINABILITY-REPORT-
2010.pdf>
Laplume, A.O., Sonpar, K. & Litz, R.A. (2008). Stakeholder Theory: Reviewing a
Theory That Moves Us. Journal of Management 34, 1152–1189.
Oba, V., Ibikunle J. (2015), Issues in Sustainability Accounting: A Global Reporting
Initiative Perspective, www.ssrn.com.
Queen Rania Al Abdullah (2015), Sustainable Development,
<http://www.queenrania.jo/community-empowerment/sustainable-development>
Schaltegger, S. & Burritt, R. L. (2010). Sustainability accounting for companies:
Catchphrase or decision support for business leaders? Journal of World Business, 45,
pp. 375–384.
Sihotang, P. & Effendi, S. (2010). Sustainability Reporting for CSR Disclosures: A
case study in Oil and Gas Industry, ICBE.
Thoradeniya, P; Lee, J; Tan, R. & Ferreira, A. (2012). The Factors Influencing
Sustainability Reporting in a Developing Nation: An Empirical Test of Theory of
Planned Behaviour. Working Paper, Department of Accounting and Finance, Faculty
of Business and Economics, Monash University Australia.
www.wikipedia.com, < https://en.wikipedia.org/wiki/Sustainability_accounting >
45
Affective Commitment Impact on Turnover
Intentions in Jordanian Insurance Companies
Emil Abujaber
Regent University
Jordan
Abstract:
The study reviewed the literature on group commitment and proposed a question and a
quantitative research design that explores commitment and its effect on turnover intentions in
Jordanian’s insurance companies, representing a collectivist culture. More specifically, it
measured multiple foci’s of commitment: commitment to organization, manager, and team. The
literature covers three main social exchange and group theories and explores commitment in-
group and work setting. Correlation between affective commitment to team, manager, and
organization and its relationship to turnover intentions was tested as well as a bivariate
regression analysis to test and predict which type of commitment is a better predictor of
turnover intentions. The study found that all commitment foci were negatively related to
turnover intentions, and found that affective commitment to team is a significant predictor of
turnover intentions than normative and continuance commitment.
Keywords: Groups, Teams, Commitments, Culture, Turnover intentions
Introduction
Studying and researching the field of group dynamics is rich in content and importance to
the field of organizational behavior, leadership, and management for the last 80 years. (Levine,
2010) Indeed, group behavior theory is essential to understand how people think, behave, and
interact in human activities (Levine, 2010) hence, require a researcher’s attention for its
importance to daily interactions and social exploration.
William and Jennifer (2010) found that groups cannot have full control over their members
but still need to rely on them to function (William & Jennifer, 2010); therefore, No group or
team can function efficiently without its member’s commitment to the group and organization.
The commitment phenomenon grabbed the attention of organizations and researchers for its
core functionality in group cohesiveness and performance, and many practitioners attempted to
explore the best methods for commitment development and its benefits to the organization
regarding of motivation, achievement, and satisfaction among others variables, as evident in
the literature. (Levi, 2014; Levine, 2010; Levine, 2006)
Certainly, commitment to organizations and groups is a vital attitude, and it holds many
criteria such performance, turnover, and satisfaction among other crucial variables and
elements of organization effectiveness. The reasons why employers and other group members
are committed are not easy to explain as many variables can add to the complexity of human
and group behavior. Furthermore, Moreland and Levine (2010) found that scholars had
difficulties when attempting to distinguish between distinctive types of commitment.
For instance, Gibson et al, (2012) assert that some research found effectiveness and
commitment are related, and effectiveness is lower when commitment is absent. (Gibson et. al,
2012)
Additionally, Gibson et al, (2012) also found that turnover and its related costs are lower,
no excessive supervision is required, and identification with organizational goals and
considering them as one’s own is some of the benefits of individual’s commitment to

46
organizations (Gibson et. al, 2012). Hence, commitment is a top organizational priority and
contemporary organizations are aware of it (Hausknecht, Rodda, & Howard, 2009).
Nevertheless, organizational commitment concept has been researched extensively (Levi,
2014; William & Jennifer, 2010; Neininger et al., 2010) and it answered many questions,
however, this paper is more interested in researching commitment in a group or teamwork
setting and level of analysis that can fill in the gaps of some unexplored areas of team
commitment, its development, maintenance, and effect in addition to organizational
commitment. Specifically, this paper will attempt to apply the affective, normative, and
continuance commitment concepts found in the literature to a new cultural setting and
organizations in the country of Jordan.
Team commitment is still a developing area of research and exploration. (Neininger et al.,
2010) therefore, this is an important concept as researchers found that employees are more
committed to their teams than their organizations, which they spend most of their daily activities
together, and hence teams have more influence on individual behavior that organizations do.
(Neininger et al., 2010; Riketta & Van Dick, 2005).
Many challenges are facing Jordan’s economy today, with an unemployment rate of
fourteen percent according to the department of labor statistics (2015), and external threats and
upheaval in the region that is taking its toll on the national economy. Businesses in Jordan face
many challenges (Khawaldeh, Muala, & Ziadat, 2014) in addition to turnover that averaged
2.8% in 2011 (Directorate of Labor Statistics, 2011).
Literature research is sparse on turnover and commitment concepts in Jordan; however,
few scholars attempted to explore and focus on several industries in Jordan such as
telecommunication sector (Alhadid, Guta, Muhaisen, & Alzougool 2014) industrial sector (Abu
Jadayil, Mohsen, & Al-Bashir, 2015) healthcare (Al-Hussami, Darawad, Saleh, & Hayajneh,
2013) and insurance (Judeh, 2012) that explores turnover phenomenon.
This paper will focus on the insurance industry as it is considered one of the most important
sectors in Jordan economy that is facing considerable turnover challenges (Judah, 2010) and
employs almost 3000 employees (JOIF, 2015).
Gibson et. al (2012) viewed commitment to organizations as attitudinal in nature, and
includes three elements: (1) sense of identification (2) involvement in duties (3) loyalty to the
organization. Lawler (2010) defined commitment as the desire of an individual to keep
preserving a relationship with another in spite of other possibly better alternatives. Hence, an
individual does not look for another option or break from the current relationship regardless of
what is available. Further, Johnson and Yang (2010) asserts that in a working environment, an
individual bonds psychologically with the social entity at their jobs (Johnson & Yang, 2010).
The following section reviews the literature on commitment and three social theories that
explore member to group commitment and attempted to prescribe and predict the antecedents
of commitment in a social and work setting. From literature, five hypotheses are presented
followed by the methods and data collection scheme and the result and conclusion of the study.
Literature Review
Relational cohesion theory
From a social perspective, relational cohesion theory describes the conditions that will
develop commitment in relationships (Lawler, 2010) and argues that when people are engaged
socially in a cohesive relationship, the outcomes involves commitment as well as the desire to
give with no “strings attached (unilaterally) and partaking in new joint activities or ventures
that require or imply trust in the other’s goodwill.” (Lawler, 2010, p. 689)
This activity is a result of a bond that forms through strong emotions in a social exchange
setting, turning the focus on the value of affiliation with group instead of just some material
objects. (Lawler, 2010) This requires a structural dimension according to the theory.
“Structural cohesion is based on the degree of interdependence, that is, how dependent the
people are on each other.” (Lawler, 2010) However, people must feel the need for each other

47
so that cohesion and commitment develops; once that happens people tend to stay in their
relationships, show trust, exchange gifts, cooperate and grow. (Lawler, 2010)
Furthermore, Lawler (2010) identified four conditions where emotions within groups can
cause commitment. First, people come together in social structures and start exchanging
according to their dependency and the value each gets from the exchange, therefore, at this
point people are inclined to maximize their benefit from the relationship. The relationships get
stronger depending on the frequency of their interaction. (Lawler, 2010)
Second, people start to feel success or failure through the repeated interactions and based
on the success or failure they start to think logically that their felt emotions are the outcome of
their group membership (Lawler, 2010). Third, once people keep receiving the positive feelings
from their groups, they bond more together and adjust their behavior to other members and
even accept sacrifices and other costs to keep the cohesiveness well and viable. (Lawler, 2010)
Finally, only after this sequence of exchange to emotion to cohesion, commitment is
produced. The theory contends that no commitment will develop unless people feel this
emotional connection and keeps getting it within the group. These conditions make a group
cohesive in a repeated pattern of exchange (Lawler, 2010).
Relational cohesion theory, therefore, can predict and explain the possibility of
commitment occurring in groups if all the conditions are met in sequence that includes social
exchange and interdependence, followed by shared responsibility, positive feelings, and
cohesion.
Group Socialization
Group socialization views framework of groups as dynamic rather than static units.
According to group socialization model, groups change overtime and can affect members
profoundly. (Levine, 2010) Furthermore, Levine (2010) makes a distinction between group
development and group socialization and focuses on the latter that involves a social exchange
between individuals and groups and their reciprocal effect on thoughts, behavior, and feelings.
The basic premise of the model examines groups that are small in size, and members
interact on regular basis. Further, members share common values, have emotional ties, and want
to achieve a goal. (Levine, 2010)
Group socialization views commitment as a second level process after groups evaluates
the prospective members. At this phase, groups desire new members that can add value to them
and inspects member’s current and previous achievement and possible future contributions.
Similarly, individuals also evaluate the group and explore the possibility of groups satisfying
their needs. (Levine, 2010)
The evaluation outcome determines the level of commitment and how each member feels
towards the new group. Therefore, the higher the group’s evaluation of the prospective member
the higher the commitment. Similarly, the higher the member’s evaluation of the group the
higher the commitment.
This will lead to the desire to satisfy the need of maintaining the positive relationship and
feelings the group gets from the individual and individual from group, by working together on
achieving both the group and the individual goals and needs.
Since groups are dynamic and change overtime, individual’s as well as group’s
commitment level does not stay at the same level. That usually happen because the evaluation
process is ongoing throughout the life cycle of the group – member relationship, therefor,
whenever the evaluation yields positive results commitment increase and the opposite is true.
The process of this evaluation goes through a decision criteria that determine the commitment
level. Once the commitment level raises, each party tries to move into a new level called the
transition phase. However, this will only occur once both parties agree on the level of
commitment.
Moreland and Levine (1982) proposed model proposes five phases: investigation,
socialization, maintenance, resocialization, and remembrance and four role transitions: entry,
acceptance, divergence, and exit. Commitment is determined after the socialization phase and
turns the individual into a full member at the enter level.
48
The model proposes a rich perspective on the dynamic and changing nature of commitment,
which contrast to the relational cohesion theory that views commitment in a liner more static
fashion that comes in a straight sequence. Nevertheless, both theories portray commitment as a
strong psychological and emotional matter that can produce positive or negative outcomes.
Social Identity Theory
Self and Chatman (2010) identified two member attitudes toward groups that are closely
connected psychological constructs: identification and commitment. The investigation of the
conditions that makes people commit to a group is explored through identification with group’s
values, traditions, and goals and can explain some of the ways groups develop such levels of
commitment.
The core premise of most of commitment definition includes a psychological attachment
to a group. (O’Reilly & Chatman, 1986) The scholars identified compliance, identification, and
internalization as three types of group commitment. (Self & Chatman, 2010; O’Reilly &
Chatman, 1986) Those types are similar to what Meyer and Allen introduce in their three
dimensions model “affective, normative, continuance” (Meyer & Allen, 1991). Both
Identification and affective commitment are positively and willingly motivated and individuals
desire to stay and contribute to the group.
One explanation why people would identify with groups and gets attached to it comes from
social identity theory. The theory suggests that people “define their self-concept in terms of
their memberships in various social groups.” (Self & Chatman, 2010) Furthermore, an
individual can correspond with more than one group, which translates into self-identity. Thus,
when a person identifies with group’s values and objective, it influences the perception,
behavior, and attitude of an individual.
Affective, normative, and continuance commitment
Johnson and Yang (2010) focused on multiple levels of commitment and theorized that
there are three different forms of commitment that includes affective commitment, normative
commitment, and continuance commitment (Johnson & Yang, 2010).
Affective commitment involves an emotional attachment and readiness to perform tasks
for others while adopting same goals and values. (Allen & Meyer, 1991; Johnson & Yang,
2010) This aligns well with the emotional aspect of relational cohesion theory and reasserts the
importance of emotional connection within a group. One thing that distinguish this form of
commitment is that it is self-determined, meaning that the behavior is not determined by any
external motivators such as financial incentives, it is performed and determined by the
individual’s will. (Johnson & Yang, 2010)
Normative commitment involves a compelling feeling to return the favor and show loyalty
to an entity based on some external pressure of morality, norms, society, or reward. (Allen &
Meyer, 1991; Johnson & Yang, 2010)
There are several distinctions between affective and normative commitment. For one,
normative commitment is based on the feeling of obligation and pressure to reciprocate and pay
back the debt. Affective commitment promotes a more positive feeling and willingness to
perform because of passion to the individuals in the groups or the organization. Although both
involve emotions, yet one is guilt driven and the other is passion driven. Studies also show that
both forms can be available at the same time, and there are correlations between the two.
(Johnson & Yang, 2010)
Continuance commitment is the rational calculation of costs and benefits and the
evaluation of one’s position and other alternatives. . (Allen & Meyer, 1991; Johnson & Yang,
2010) Any employee that highly values the current employment will remain in the position as
they see the positive and desirable outcomes provided through their jobs; moreover, the
decision can also be made as a result of any lack of other opportunities. (Johnson & Yang,
2010) This form of commitment is based on compliance and is not self-determined as affective
and normative commitment; however, this doesn't mean that it cannot be desirable. (Johnson &
Yang, 2010)
49
Bagarim (2010) concluded that across all definitions of commitment there is one major
commonality that is, “commitment is an obliging force or energy that directs behaviour to a
specific target or focus of that commitment energy, which then shapes a psychological bond
between the source of commitment and the specific target of that commitment.” (Bagarim,
2010, p. 98) Furthermore, it seems that the best predictor of member to organization, member
to team, and member to leader commitment is affective commitment (Bagarim, 2010) and the
research must focused and directed at those factors to get the best results. (Bagarim, 2010)
Therefore, this paper will investigate affective commitment to team, leader, and organization
as a predictor of turnover intentions, which is explored in the following section.
Turnover Intentions
Turnover intentions are defined as the “the conscious and deliberate decision to leave
the organization.” (Tett & Meyer, 1993) Mobley, Horner, and Hollingsworth (1978) studied
withdrawal behavior and the process of employee decision to withdraw and found that
intentions to quit were the last point considered before searching for another job. Moreover, in
a meta-analysis Griffith, Hom, and Gaertner (2000) found that intention to quit and affective
commitment has a negative relationship.
Hence, the following hypotheses is proposed and explored:
H1: Affective commitment to organization has a negative relationship with turnover intentions.
H2: Affective commitment to team has a negative relationship with turnover intentions.
H3: Affective commitment to the immediate manager has a negative relationship with turnover
intentions.
H4: Affective commitment to team is a stronger predictor of member turnover intentions than
normative commitment.
H5: Affective commitment to team is a stronger predictor of member turnover intentions than
continuance commitment.
Cultural Considerations
The review so far revealed several important dimensions and layers to commitment. The
relational cohesion perspective proposed a sequential linear process where commitment occurs
after positive emotions and cohesion. The group socialization framework proposed a different
more dynamic process where commitment may increase or decrease according to mutual
evaluation of individuals and groups. Moreover, affective commitment and identification were
strong emotional bonds that attach people to a certain group’s values and goals.
In a collectivist cultural setting, the Middle East cultural cluster show pride and loyalty to
their family and organization. (Norton, 2013) Moreover, the dimension includes cohesiveness
and devotion to those groups, in addition to highly valuing face-saving and status. Hence, there
are inconsistencies when it comes to family organization loyalty and commitment and work
commitment. In fact, the study found that the culture “deemphasizes charismatic/value-based
and team-oriented leadership.” (Norton, 2013)
Furthermore, Oishi & Su (2010) posits that individuals in a collectivist culture attempt to
maintain relational bonds with others in-group members, which involves adjustment to group
needs, harmony, and developing emotional experiences. Also, Oishi & Su (2010) found that
“In terms of work-related behaviors within collectivist contexts, working with in-group
members tends to result in better performance than working alone.” (Oishi & Su, 2010, p.115)
This study is concerned with the process of commitment development and loyalty to
groups that are not family or kin related in Jordan, which is categorized as a collectivist culture
and share the attributes of the Middle East cultural cluster.
Method
Research Design

50
This study used a posttest-only correlational research design and obtained a group of
participants from three insurance companies in Jordan, Delta Insurance, United Insurance, and
EuroArab Insurance respectively. To measure affective commitment variable and turnover
intentions variable, a survey was adapted from Meyer and Allen’s scale (1993) of affective,
normative, and continuance commitment, and Yücel (2012) turnover intentions scale. The
surveys were distributed to the three companies in Amman with the help and permission of HR
department heads in each company.
The study focused on insurance companies to control the variability of other industry’s
influence and for the purpose of this research. Insurance sector is chosen because of its
economic power and significance and the salient turnover phenomenon according to the
statistics from various official sources. Moreover, the surveys were randomly distributed to all
departments to reduce any possible bias.
Participants
200 surveys were printed and distributed to reflect the sum number of employees in all
three insurance companies. Employees of junior and mid-level were targeted, and a total of 117
responded representing a rate of 58%, which is a good response rate according to research-
advisor.com that suggested a response rate of 137 for a population of 200. Amongst
respondents, 60% were male, 40% female, 61% holding a bachelors degree, 44% were between
age 20 and 29, 34% between 30 and 39 and 5% above 40 years old; 65% worked in their
companies between 1 and 5 years, 15% between 6 and 10, and 15% between 11 and 25 years.
Measures and Data Analysis
Affective, normative, and continuance commitment was measured using Meyer and
Allen’s scale (1993) that contains a seven-point Likert scale where 1= strongly disagree, and
7= strongly agree, and the reliability is presented with a Cronbach’s alpha aggregate of .87.
Each the three affective commitment variables (commitment to manager, team, and
organization) will be measured with adaptation to the Meyer and Allen scale as used in a similar
research in South Africa (Bagraim, 2010) and as shown in the Appendix.
Turnover intentions were measured using a three-item scaled adapted from Yücel (2012)
scale with a five-point Likert scale ranging from 1 = strongly disagree to 5 = strongly agree and
with a reliability Cronbach’s alpha aggregate score of .87. The data analysis procedure used
SPSS statistical analysis software after collecting the data.
Data Collection
For data collection, self-administered surveys were distributed by acquiring the help of
key people inside the insurance companies in Jordan. A random sample of managers and
subordinates were given surveys after gaining permission, with a letter attached to explain the
nature of the included questions. The language of the surveys was translated to Arabic and was
double checked and tested previously with three respondents to assure understanding,
consistency, and accuracy.
Results
Correlation coefficients were computed between affective commitment to organization
and turnover intentions, affective commitment to team and turnover intentions, and affective
commitment to manager and turnover intentions to test H1, H2, and H3.
Regarding affective commitment to organization and turnover intentions, a p value of less
than .05 was required for significance. The results of the correlational analysis show that the
correlations were statistically significant with a p value (.000 < .05) for all three tests, and the
Pearson correlation coefficient for affective commitment to organization was r(115) = -.504, p
< .05 .
The result suggests that affective commitment to organization has a strong negative relationship
with turnover intentions as hypothesized. For affective commitment to team, Pearson

51
correlation coefficient r (115) = -.379, p < .05; and for affective commitment to manager,
Pearson correlation coefficient r (115) = -.424, p < .05.
As expected, the correlation analysis showed that all three affective commitment foci are
significantly and negatively related to turnover intentions; although affective commitment to
organization has the strongest relationship followed my commitment to manager and lastly
team. Furthermore, the three foci affective commitment showed a significant positive
correlation with one another as shown in Table 1 below.
Table 1.
Pearson correlation for affective commitment variables
ACORG ACT
ACT .581*
ACMAN .456* .568*
Note: ACORG = Affective Commitment to Organization, ACT = Affective Commitment to
Team, ACMAN = Affective Commitment to Manager, * = statistically significant at p > .05
level.
To test H4 and H5 and explore whether affective commitment to team is a stronger predictor
of turnover intentions than normative commitment and continuance commitment, a bivariate
linear regression analysis was conducted.
The linear regression established that affective commitment to team could statistically
significantly predict negative turnover intentions (beta = -.379, p < .05) with a model fit F(1,
110) = 18.434, p < .05. The results for normative commitment was statistically insignificant
(beta = -.155, p > .05) with a model fit result of F(1, 114) = 33.646, p = .097, as well as
continuance commitment (beta = .169, p > .05) F(1, 114) = 40.252, p = .69. The linear
regression test confirmed that affective commitment to team can significantly better predict
turnover intentions than normative and continuance commitment.
Discussion
This study contributes to the literature by replicating and testing commitments theories in
a new setting and culture. The research confirmed all five of the propositions regarding the
outcome of the multiple types of commitment. The nature of affective commitment and its
positive psychological bond that develops with all levels (team, manager, and organization) and
its relationship to turnover intentions is significant and could suggest great solutions and
benefits to leaders and organizations that is suffering from high turnover.
Furthermore, some recommendations can be made to managers to interfere before the
actual decision to leave the organization is made which can benefit the organization financially
and morally. Moreover, a strategy to increase employee’s engagement and positive affective
commitment can be integrated into employee’s orientation and probation period, which can also
add much value and decrease the turnover rates in Jordanian insurance companies.
Affective commitments to organization and manager had a stronger negative relationship
with turnover intentions than affective commitment to team, which was one of the surprising
findings in this study. The implication of this result can suggest a new focus on those levels and
provide an incentive to future studies that may explore the reason behind such findings.
Nevertheless, the regression analysis confirmed that affective commitment to team is a
significant and stronger predictor of turnover intentions than normative and continuance
commitment. This finding suggests that an increase of the positive psychological bond in work
teams can increase the retention of employees and can predict the possibility of commitment
better than neutral or negative psychological and emotional connections.
Strengths and weakness
The study provides a contribution to the literature and managers on commitment and
turnover phenomena in a new collectivist country and an important sector. This will help future
studies to understand fully differences between organizational, team, and manager commitment
52
across cultures. Furthermore, the research design can limit the problems of maturity and
attribution, and can assist in getting much quicker results.
However, there is still some limitation to the study, as more data are needed from other
collectivist cultures, as well as other industries before generalizations can be made. Also, levels
of commitment may vary across cultures.
Another important question is how other variables may influence commitment, as other
studies attempted to look at this problem and the possibility of other variables affecting the
dependent variable exists. Other factors such as the difference of commitment in individualist
setting or the influence of economic and other external factors can be considered and
operationalized in future researches.
Nevertheless, the study contributes to the business community and organizations in Jordan
as the issue of turnover is decreasing the effectiveness, development, and regional and global
competitiveness. A scheme to develop affective commitment can be developed and tailored to
fit managers and employees through a reliable source and more empirical studies.
References
Abu Jadayil, W., Mohsen, M., & Al-Bashir, A. (2013). Statistical Model Representing
Workers Turnover Problem in Third Developing Countries: Jordanian Industrial
Sector. Nternational Journal of Human Resource Studies, 3(4), 102-110.
Alhadid, O., Guta, A., Muhaisen, A., & Alzougool, B. (2014). THE IMPACT OF SELF
DISCLOSURE ON TURN OVER INTENTION: THE PERCEPTIONS OF
EMPLOYEES IN TELECOMMUNICATION COMPANIES IN JORDAN. Journal of
Arts, Science & Commerce, 5(2), 10-19.
Al-Hussami, M., Darawad, M., Saleh, A., & Hayajneh, F. (2013). Predicting nurses'
turnover intentions by demographic characteristics, perception of health, quality of
work attitudes. International Journal of Nursing Practice Int J Nurs Pract, 79-88.
Bagraim, J. (2010). Multiple Affective Commitments and Salient Outcomes: The
Improbable Case of Information Technology Knowledge Workers. The Electronic
Journal Information Systems Evaluation, 13(2), 97-106.
Gibson, J., Ivancevich, J., Donnelly, Jr., J., & Konopaske, R. (2012). Organizations:
Behavior, structure, processes (14th ed.). Dubuque, IA: McGraw-Hill.
Hausknecht, J. P., Rodda, J., & Howard, M. J. (2009). Targeted employee retention:
Performance-based and job-related differences in reported reasons for staying. Human
Resource Management, 48, 269–288.
JOHNSON, R. E., CHANG, C. (., & YANG, L. (2010). COMMITMENT AND
MOTIVATION AT WORK: THE RELEVANCE OF EMPLOYEE IDENTITY AND
REGULATORY FOCUS. Academy Of Management Review, 35(2), 226-245.
doi:10.5465/AMR.2010.48463332
JOIF. (2015). Retrieved November 15, 2015, from
http://en.joif.org/Home/InsuranceSector.aspx
Judeh, M. (2012). Selected Personality Traits and Intent to Leave: A Field Study in
Insurance Corporations. IBR International Business Research.
Khawaldeh, K., Muala, A., & Ziadat, M. (2014). Antecedents and Mediator of
Turnover Intention amongst Employees in Private Communications Sector in Jordan:
A Structural Equation Modeling (SEM) Approach. Journal of Management and
Sustainability JMS.
Lawler, E. J., Thye, S. R., & Yoon, J. (2000). Emotion and Group Cohesion in
Productive Exchange. American Journal Of Sociology, 106(3), 616-657.
Levine, J. (2010). Encyclopedia of group processes & intergroup relations. New Delhi.:
SAGE Publications.
Meyer, J. P., & Allen, N. J. (1991). A three-component conceptualization of
organizational commitment. Human Resource Management Review, 1, 61–89.
53
Neininger, A., Lehmann-Willenbrock, N., Kauffeld, S., & Henschel, A. (2009). Effects
of team and organizational commitment – A longitudinal study. Journal of Vocational
Behavior, 567-579.
Northouse, P. (2013). Leadership: Theory and practice (6th ed.). Thousand Oaks:
SAGE.
O’Reilly, C., & Chatman, J. (1986). Organizational commitment and psychological
attachment: The effects of compliance, identification, and internalization on prosocial
behavior. Journal of Applied Psychology, 71, 492–499.
Riketta, M., & Van Dick, R. (2005). Foci of attachment in organizations: A meta-
analytic comparison of the strength and correlates of workgroup versus organizational
identification and commitment. Journal of Vocational Behavior, 67, 490–510.
William T., S., & Jennifer A., C. (2010). Identification and commitment. In J. Levine
(Ed.), Encyclopedia of group processes and intergroup relations. Thousand Oaks,
Calif.: SAGE Publications.
Appendix
Affective Commitment Scale items
I really feel as if this organization's problems are my own
I think that I could easily become as attached to another organization as I am to this one (R)
I do not feel like 'part of the family' at my organization (R)
I do not feel 'emotionally attached' to this organization (R)
This organization has a great deal of personal meaning for me
I do not feel a strong sense of belonging to my organization (R)
I really feel as if my team’s problems are my own.
I think that I could easily become as attached to another team as I am to this one (R)
I do not feel like 'part of the family' at my team (R)
I do not feel 'emotionally attached' to this team (R)
This team has a great deal of personal meaning for me
I do not feel a strong sense of belonging to my team (R)
I really feel as if my manager’s problems are my own
I think that I could easily become as attached to another manager as I am to this one (R)
I do not feel 'emotionally attached' to my manager (R)
My manager has a great deal of personal meaning for me
I do not feel a strong sense of belonging to my manager (R)
Normative commitment
I do not feel any obligation to remain with my current employer. (R)
Even if it were to my advantage, I do not feel it would be right to leave my organization now.
I would feel guilty if I left my organization now.
This organization deserves my loyalty.
I would not leave my organization right now because I have a sense of obligation to the
people in it.
I owe a great deal to this organization.
Continuance Commitment
It would be very hard for me to leave my organization right now, even if I wanted to

54
Too much in my life would be disrupted if I decided I want to leave my organization now
Right now staying with my organization is a matter of necessity as much as desire
I feel I have too few options to consider leaving this organization
One of the few serious consequences of leaving this organization would be the scarcity
available alternative.
One of the major reasons I continue to work for this organization is that leaving would require
considerable personal sacrifice – another organization may not match the overall benefit that I
have here.
Turnover Intentions Measure
I intend to leave the organization.
I intent to make a genuine effort to find another job over the next few months.
I often think about quitting.
Bio Emil Abujaber joined the consulting and training industry with different venues in Amman
- Jordan such as Ernst & Young (EY), the Business Development Center (BDC), and
Management Executive Training Institute of Canada (MeTraining) immediately after moving
back to Amman.
Conducted, designed, and delivered professional training and consulting projects in
Amman-Jordan, Al-Jubayl-Saudi Arabia, Baghdad-Iraq, Istanbul-Turkey, Kuwait City, Kuwait
and Dubai-UAE with global companies such as SABIC, Ahli Bank, Royal Jordanian among
others.
Topics included leadership skills, advance presentation skills, problem solving, decision-
making, strategic planning, professional customer service and selling skills, and emotional
intelligence among others.
Emil Abujaber holds a Masters in Management and a Master in Government form Regent
University, and is a PhD. candidate in Organizational Leadership; he is currently teaching part-
time at German Jordan University.
55
Justifying the Investment of Information
Technology Projects: A Case Study from Jordan
Emad Abu-Shanab Mai Al-Sebae Qais Hammouri
Yarmouk University Yarmouk University Yarmouk University
Jordan Jordan Jordan
Abstract:
Investing in information technology is a requirement for enterprises to sustain their
competitive advantage in a market that is described as changing and global. IT is a very
important resource for enterprises to improve their organizational performance, but requires
some justification for its costs and burdens. This study utilized a model proposed by
Gunasekaran, Love, Rahimi and Miele (2001) and applied it on a case in Jordan by analyzing
and exploring the implications of investing in IT projects. The case used is the Japan Tobacco
International, where a survey was used to collect response from JTI personnel and the
documents available on their portal. The detailed results of this study are reported with
conclusions at the end.
Keywords: Information technology; Investment justification; tangible and intangible benefits,
operational, tactical, strategic, impacts, Jordan.
Introduction
The investment in information technology results in a wide transformation toward
automating the business processes in different fields in organizations. Organizations in the 21st
century adopt diverse applications and technologies to transform manual processes to
automated processes to reduce their costs and increase their revenues (Macnish, 2012).
Information technology is the course of action that collects, stores, processes, and
transmits data. The “term information technology” (IT) appeared in 1958 by Leavitt and
Whisler, they proclaimed that “the new technology does not yet have a single established name.
We shall call it information technology (IT)” (Mehrotra, 2012. p: 418). Different shapes of
information technology like hardware, software, and networks, provide solutions for business
problems. Organizations are utilizing new types of infrastructure like cloud computing and
distributed systems, and advanced applications like computer aided design (CAD), computer
aided manufacturing (CAM) and enterprise resource planning (ERP) (Onn & Sorooshian,
2013).
The evolving nature of new technology as well as the fast and constant development in
information and communication technology (ICT) stimulates further developments and
diffusion (Rojko, Lesjak & Vehovar, 2011). IT has had a significant influence on the way
organizations function. Such developments have a crucial influence on organizations’
strategies, tactics, and operational decisions (Gunasekaran, Ngai & Gaughey, 2006).
This paper will explore the influence of IT investments on organizational performance
utilizing a case study method. The case explored in this study is Japan Tobacco International
(JTI). The structure of this paper is the following: The following section will review the
literature in an aim to understand the implications of IT investments and the factors that may
lead to the success or failure of such projects. The following section will cover the dimensions
concluded from the literature that would relate to case under consideration. Finally, the paper
will end up with conclusion and future work.

56
Literature Review
The employed criteria for IT investment justification can be grouped into the following
categories: Strategic impact, tactical considerations, operational performance, tangible and
intangible financial and non-financial indicators. Different approaches are adopted for the
purpose of evaluating IT projects and their influence on organizational performance. The
reported approaches in the literature are the following: economic, strategic, operational, and
analytic approaches (Gunasekaran, Ngai & Gaughey, 2006).
Justification of IT investment
Quantifying the benefits of IT investment is difficult because of the high uncertainty of
the factors considered in the process. The following factors contribute to the level uncertainty:
global competition among companies in improving their performance and gaining competitive
advantages, increasing economic pressures, radical changes in business environment, and
business process reengineering (Gunasekaran, Love, Rahimi & Miele, 2001). The information
technology nature does clearly create challenges for the scientific measurement of IT
investments returns. Challenges are less present in traditional long term investments that result
in competitive advantage (Drnevich & Croson, 2013). Furthermore, IT investments are costly
and make the organizations more skeptical regarding the profits and returns. IT specialists
(directors and managers in charge of such investments), should analyze and explore the main
factors that lead to expected returns on investment and not only the ones related to the financial
results. They should also take into account the strategic advantage of the organization and
creative technologies connected to IT investment with business process reengineering and
organizational redesign. On the other hand, decision makers should set the main reasons that
prompted the organization to invest in IT (Stewart, Coulson & Wilson, 2007).
There is an agreement that IT actually contributes to business value, but how it contributes
to business value is uncertain. Also, understanding the nature of IT investment benefits is
significant in evaluating how IT contributes to the value of the business (Prasad, 2008). The
lack of awareness of ICT nature coupled with the cash flow importance contributes to making
the processes of evaluating its benefits burdensome and requires considerable resources (Love
& Irani, 2004).
Drnevich & Croson (2013) proclaimed that IT investments can comprise a tangible
resource like IT assets or intangible capabilities needed. They added that such IT investments
can influence organization’s strategy by influencing both its effectiveness and efficiency. In
addition to that, IT investment provides critical information that would either increase the
investments value on other capabilities or resources, or force management toward more
effective and efficient decision making.
It seems clear in the examples reported by Gunasekaran, Ngai and Gaughey (2006) that if
the evaluation is related to IT/IS services, it might need to specify more weight to "intangibles".
On the other hand, we might need to specify higher weight to "tangibles" if it is in
manufacturing. Such understanding means that different situations require different weights to
be assigned to tangible, intangible, financial and non-financial criteria. As an example and when
evaluating IT/IS marketing projects, more weight might be assigned to financial performance
and intangibles such as customer satisfaction. On the other hand, the IT/IS manufacturing
projects might require more weight given to non-financial performance measures such as
capacity utilization, and intangibles such as flexibility. An appreciation and understanding of
the intangible benefit in IT is important for IT investment continuity (Prasad, 2008). Flexible
IT infrastructure existence will enable the development and identification of key programs and
applications in the organization. Such step will then improve production processes (Perez-
Arostegui, Benitez-Amado & Tamayo-Torres, 2012).
IT project importance (success and failure)
Many variables have been investigated as influencers on IT success such as outsourcing,
strategic planning, and IT strategic alignment. Outsourcing focuses on some of the most

57
important issues such as IT as a competitive advantage, IT as a core competency, and company
size (Peslak, 2008). Certain application also fits with specific strategic and tactical situations
(Abu-Shanab, 2004).
The evaluation of every investment (before and after being made) is very significant in
determining the successful decision that the organization took (Ahmad & Arshad, 2014). The
major barrier to justifying IT investments is having no strategic vision (Love & Irani, 2004)
where critical issues were faced with respect to the gained strategic benefit. Also, projects
budget overrun is reported as one of the many problems caused by management lack of
understanding of IT costs. Such estimation uncertainty is becoming more and more important.
Sweis (2015) classified the factors that may lead to IS project failure into two types:
managerial and technical. Poor communication, poor leadership, poor methodology and meager
competencies, are the main managerial factors. Managerial factors related to the management
of information system (MIS) are the most crucial factors that lead to its failure. Factors reported
in the literature are the following: the organization complexity and management support. The
author concludes that the high degree of customization involvement in the application, the
underestimation of project schedule, and the changes in design specifications, are the three main
factors that contribute to the failure of IS projects in Jordanian companies. A similar study of
105 IT firms in Jordan concluded that the most important factors influencing the success of IT
projects are: poor planning, unclear goals and objectives, and changing project objectives
during the execution (Abu-Shanab & Al-Saggar, 2013)
IT project success is assessed by using simple measures such as delivering a working
system on budget, on time and to the specifications required. Such criteria are perceived as
rational, objective and fact-based. However such assessment, in predicting and determining the
budget needed and the time required for the system development defined by its specifications,
ignores the unavoidable uncertainty (Cecez-Kecmanovic, Kautz & Abrahall, 2014).
Horan & Fowler (2007) examined successful system development and compared the
associated factors with system success to the most associated factors with system failure. The
authors concluded that the most influential factors in system success are the following: top
management commitment, effective project management, project personnel knowledge/skills
and user acceptance. Such factors are directly related to the factors associated with IS failure
(lack of top-management commitment to the project, lack of effective project management, lack
of required knowledge/skills of project personnel, and users resistance).
Research reported many factors that are related to the success and failure of IT/IS projects.
A study related to e-government projects concluded that three major categories are proposed
for e-government systems success and they are: infrastructure, human, and governmental
factors (Abu-Shanab & Bataineh, 2014). Other researchers asserted that success or failure
depends on the system type, data, size, users, certainty…etc. It is difficult to define failure or
success in general terms because it is dependent on the criteria used and the stakeholders view
(Nguyen, Saranto, Tapanainen & Ishmatova, 2014). It is one person’s failure that may be
another one’s success (Heeks, 2006).
Research Method
This study followed a case study approach, where a case was selected to apply a framework
that guides the analysis done. The framework adopted a five dimensions typology and they are:
strategic impact, tactical impact, operational impact, intangible benefits, and cost related issues
(Gunasekaran, Love, Rahimi & Miele, 2001). The framework is a good tool for investment
justification of IT projects.
The selected case was utilized to investigate the implications of adopting IT and its
importance to the firms by using the framework. The following sections will analyze the case
in details. The case is the Japan Tobacco International (JTI). This case study utilized reports
published on the JTI’s website and the content of the website itself, and partially for the
Jordanian market. The questions addressed in this study are adopted from the framework
proposed by Gunasekaran et al. (2001). Qualitative analyses on responses were applied to better
understand the environment of investment in IT projects and conclude to the research objectives

58
and goals. The main objective of this work is to better understand the investment justification
in IT projects followed by a Jordanian firm. The following sections will depict the qualitative
data collected and conclusions of this research.
Japan Tobacco International
Japan Tobacco International (JTI) founded as a partnership between Japan Tobacco and
RJ Reynolds, where they form a group of private companies operating in 120 countries in the
world and Jordan is one of them (JTI, 2012a). The goal of JTI is to be the most successful and
respected tobacco company in the world. JTI has a corporate strategy to increase profit through
establishing outstanding brands, enhancing productivity and focusing on continuous
improvement.
JTI realizes the downside of smoking; it does not offer its products to encourage people to
smoke. JTI is interested in developing low-risk products, and it has identified its position toward
smoking through six principles: openness about the risks of smoking, transparency about
products, commitment to the development of reduced-risk products, prevention of youth
smoking, accommodation between smokers and non-smokers, and respect for local norms and
cultures (JTI, 2012d).
Strategic impact
The best way to ensure the effectiveness of IT investment can be achieved by looking at
the technology as an essential element in achieving the company’s strategy. Strategy should be
clear in direction, boundaries, parameters, nature of environments, and connected with the
objectives of the organization (Gunasekaran et al., 2001). IT/IS strategic significance in
organizational performance acts a key role in determining if a particular IT/IS is needed in the
organization and how it should be implemented. The strategic choices have long term impact
on IT/IS planning and implementation as well as IT/IS contribution to organizational
performance (Gunasekaran et al., 2006).
JTI considers technology as an important resource for achieving its strategy that is seeking
to build outstanding brands, continue to enhance productivity, develop human resources as a
cornerstone of growth, and sharpen the focus on responsibility and credibility of its products
(JTI, 2012a). On the other hand, the strategy of JTI is to gain a leading position in the global e-
cigarette market. In 2014, JTI was successful in acquiring e-cigarette under its E-lites umbrella
which was defined as “consumer products that provide an inhalable vapor by direct electrical
heating of a liquid contained within the device or a replaceable cartridge” (JTI, 2012b).
One of the most strategic challenges facing JTI is the illegal trade of tobacco, which is
considered a global issue. Such issue influences the company’s ability to control the activities
such as production, import, export, purchase, and sales of its products and services. Other issues
(related to legislations and the illegal trade) are the following: the high rate in taxes, difficulties
facing law enforcement, difficulty to control borders, the growth of complexity in organized
crime, absence of government support to eradicate this growing issue, and the adequacy of law
enforcement officers’ knowledge. This issue has a negative impact on both businesses and the
society, where governments are challenged in overcoming the illegal trade of tobacco products.
JTI succeeded in utilizing information technology as an effective solution to eliminate the
illegal trade through developing a set of extensive Anti-Illicit Trade (AIT) programs in house
which represented the basis of its internal control to fight this issue (JTI, 2012c).
The main reasons that prompted the enterprise to invest in information technology are:
sustaining its survival, growing in a global competitive environment, increasing its market
share, and sustaining its competitive advantage. Strategic information system planning is one
of the major reasons for gaining a competitive advantage (Earl, 1990; Silvius & Stoop, 2013).
According to a study by Hammouri, Shraideh, and Abu-Shanab (2015) for evaluating the
success of strategic information system planning in Jordan, the authors concluded that the JTI’s
success in the implementation of strategic information system planning in its strategic activities
relies on a set of factors like: the clarity of strategy, the stakeholders influence and nature of

59
social behavior, and the competitive environment. Their study utilized two case studies and
they are Japan Tobacco International (JTI) and Irbid Electricity Company (IDECO).
Tactical impact
This dimension focuses on identifying the critical success factors that will lead the
company to attain its strategic objectives and goals. Tactical considerations are the following:
tangible vs. intangible, performance indicators, generating data, evaluation methods, security,
and involvement of senior managers (Gunasekaran et al., 2001).
One of the critical success factors of JTI is the diversity of its workforce culture. The
company has more than 26,000 employees from 100 different nationalities. So to achieve its
business objectives with high level of integrity, JTI developed a code of conduct for its
employees and other stakeholders over the world. The code of conduct is presented as an
integral statement regarding the organizational values, believes, roles, and responsibilities
toward conducting business in compliance with corporate governance and laws (JTI, 2012d).
By enforcing such code of conduct, JTI ensures that all of its employees have the right to work
in a fair environment and they have equal opportunities. They also have the needed level of
commitment to establish and maintain such environment and succeed in protecting its
intellectual capital and personal information (JTI, 2014a).
Thomas McCoy (CEO of JTI) said that “Our goal is to be the most successful and
respected tobacco company in the world. The Code of Conduct is essential to achieving this.”
Bruno Duguay (the Chief Compliance Officer of JTI (CCO)) made the following statements:
“We have made the Code as user friendly as possible by providing practical guidance and
information to help you maintain the high standards JTI expects from us.”
A code of conduct mechanism is a confidential reporting concerns mechanism (RCM) that
implements a robust process (like the “whistle blowing” act ) to determine any behavior or
violation of JTI’s compliance regulations and laws related to illicit trade internally and
externally. RCM mechanism can be accessed via the company’s intranet to find out the details
related to illicit trade. JTI focuses on increasing awareness for its employees regarding the illicit
trade issue through providing a training program for them to help minimize threats of this issue.
This indicates that JTI succeeded in utilizing information technology to decrease the rate of
turnover for employees (JTI, 2012e).
JTI is keen on improving and developing new products to meet customers’ expectations
as well as to achieve their strategic objectives. In December 2011, JTI signed agreement with
Ploom Company to develop pocket-sized smoking devices which they called “Pax”. These
devices are portable vaporizers including silicon mouthpieces that can be connected with
superior lip-sensing technology. Pax devices are composed of intelligent and cooling system
that automatically adjust the temperature of users to optimize heat and vapor production without
heating the material or producing smoke (JTI, 2012j; Pax, 2015).
By integrating IT with intellectual property; JTI teams utilized email tools to receive new
ideas or suggestions related to new product development from persons not belonging to JTI
group. Such technique is protecting the company as well as its intellectual property for talented
people (JTI, 2012h).
Operational impact
When exploring the operational considerations, the enterprise should identify the
operational critical success factors to perform the daily operations. Such dimensions mean that
the firm needs to measure the role of IT infrastructure in achieving business goals for each
department. The process includes measuring the system and data integration, users’
perceptions, servers, existing operations system, data migration, existing IT systems, and
software (Gunasekaran et al., 2001).
JTI tries to fight illicit trade and deter criminals from converting genuine products from
the judicial supply chain. JTI has 22 factories, 5 tobacco processing facilities, 8 global flagship
brands and hundreds of different products sold in millions of selling points by tens of thousands
of distributors and suppliers over the world (JTI, 2012f). This makes illegal trade a big threat

60
and global issue to the company. In 2013, Euromonitor reported that the size of illicit tobacco
trade is approximately 392 billion cigarettes per year (JTI, 2012c). Based on that, the company
has worked hard to invest in IT to protect its supply chain from illicit trade. JTI implemented
the “track and trace” system, which aims at delivering its products to the intended markets. The
process includes putting unique signs on the products at the master case and carton level, which
enables the company to monitor the route of its products within the legitimate supply chain.
In addition to that, JTI implemented a set of integrated programs as solutions to fight illicit
trade. One of these programs is “know your customer” (KYC) program which focuses on those
global customers. The system is integrated with the track and trace system to form a solid base
to trace the products and where they were sold. In addition to more control on operation and
the fight against illicit trade, these programs are fostering customer relationship management.
Other programs adopted by JTI is the “market and volume monitoring program”, which
investigates the market position and determine the quantity of its products that will be sold in
intended markets.
JTI also has focused on programs related to its suppliers to minimize illicit trade which is
known as “know your supplier program” (KYS), which helps in conducting business with all
suppliers in the manufacturing, transportation, and storage activities. JTI also has implemented
the “product authentication system” which provides authentication for its products; it is defined
as a digital tax verification system that allows customers to check if the package is realistic or
not by an SMS or telephone call. JTI employed tagging on its products (especially chemical
products) by using a reader to vitrify them. JTI also implemented some security programs to
monitor its products from theft during transportation and track the finished products at factories
and warehouses (JTI, 2012e).
Intangible benefits
JTI sees technology as an important tool to achieve its strategy and to conduct business
effectively and efficiently (Hammori et al., 2015). IT played a vital role in making the company
a leading international tobacco product manufacturer. JTI utilized diverse IT tools and technical
solutions to enable employees to establish its business goals in a legitimate framework through
four core centers that will lead the company to gain its competitive advantage.
The first is the Center of Excellence (CoE), which is responsible for understanding its
business goals and incorporate them into other processes and systems. The second is the Global
Development Center (GDC), which is responsible for defining the strategic direction,
developing and training personnel on different global business applications, and ensuring the
secure access to information in compliance with laws and regulations. The third is the Global
Technical Center (GTC) that assists in providing the IT infrastructure solutions to all
employees, factories and markets, such as the networks, communication and collaboration
tools, and workplace computing techniques. Finally, the Information Security and Risk
Management (ISRM) which provides the protection for the information resources of JTI based
on three words: confidentiality, integrity, and availability.
In 2002, JTI implemented its enterprise resource planning system (ERP) as one of the most
significant IT projects in its history. It provides a significant contribution for the company by
acquiring and integrating different business activities from all over the world into its wide
system. Examples for such application are: Gallaher, acquired in 2007 to establish JTI position
in UK; and Leaf Tobacco Supplier Group acquired in 2009 to create a New Leaf Tobacco
Sourcing Company with US Leaf Tobacco Supplier. On the other hand, it enhanced the human
resources operations such as recruitment, selection, training and development, motivation,
maintenance, and assigning and retaining a team that shares aspiring goals of the company (JTI,
2012g). Research in Jordan indicated that ERP systems are vital applications that are associated
with operational improvements, and information quality (Abu-Shanab & Saleh, 2014).
JTI utilized its website to improve the quality of its products and services to the public by
providing specific tools that enable customers and suppliers to submit and share their
suggestions and ideas. Such venue improved JTI’s position in relation to product feedback,
media relations, business ethics, career and investor contacts, and corporate social

61
responsibility. Some of these tools have positive impact on JTI’s stakeholders in understanding
their users and legal requirements (JTI, 2012h). On the other hand, JTI utilized social media
tools such as Facebook and Linkedin for getting people within a company to communicate,
collaborate, and share their ideas and experiences that can lead to problem solving and create
new ways of doing business.
JTI also developed an internal communication tool (called Engage) that enables employees
to create a specific profile, where they can share their opinions, documents, and ideas on
specific projects based on their role and expertise. Blanca Garcia, the project manager of
Engage platform, declares that: “If traditional communication was a flat sheet of paper, a
collaboration platform would be more like origami. There is overlap, different levels, it is multi-
dimensional. With more traditional communication, such as email, two people can share ideas.
With a platform like Engage, there are no limits on how many people participate in that
conversation” (JTI, 2012i).
JTI developed enterprise portals to make sure its business processes are completed
according to standards. Such portals consisted of content management, business intelligent, data
warehouse, and data management. Such tools assist the company in meeting its business needs
with more security. For example, JTI developed a certification program for its suppliers who
are willing to work with JTI. Suppliers are requested to provide the required information about
their products and services through a dedicated portal during the bidding process. If the products
and services offered by suppliers meet the certification program specifications and standards,
the company may conduct the transaction. The online portals help the company in providing
high quality products with lower cost, improve the relationship with suppliers, and minimize
illicit trade (JTI, 2012c).
Cost related
Measuring the benefits of IT is one of the challenges facing most companies. Barth et al.
(2001) examined the factors that enable companies to predict the benefits of intangible assets
and found that research and development are the most important factor followed by advertising
expenses. On the other hand, they found that company size, growth, trading volume, equity
issuance, and perceived mispricing have a positive impact on predicting intangible benefits.
Return on investment (ROI) is not an adequate tool for measuring intangible benefits of
IT (Gunasekaran et al., 2001). In JTI, intangible assets area unit calculated by employing a cost
model and are declared at cost less accumulated amortization and accumulated impairment
losses. Intangible assets area unit treated severally, and measured at value at the initial
recognition and also the prices of intangible assets acquired through business mixtures with
price at the acquisition date.
Intangible assets with finite productive life cycle area unit amortized employing a straight-
line method over their calculable helpful life and area unit tested for impairment whenever there
is any indication of impairment. The calculable helpful life and amortization methodology of
intangible assets with finite helpful life are reviewed at the tip of every twelvemonth, and any
changes in estimate would be accounted for future estimation. The calculable helpful lifetime
of major intangible assets with finite helpful life as follows: Trademarks for twenty years and
Software for five years.
Since 2014, JTI has developed a formula that is understood known as the “Adjusted
Operating Profit”. The formula is considered a key performance indicator to improve business
investment management and its revenue and facilitate the method of benchmarking
performance with alternative trade players. Adjusted Operating Profit (AOP) includes the
following calculations (JTI, 2014b):
AOP = Operating profit + amortization cost of acquired intangibles + adjustment items
The previous formula estimates the “Adjustment Items” (income and costs) in the
following manner
AI = impairment losses on goodwill ± restructuring income and costs ± others

62
Conclusion and Future Work
It is vital for businesses to better understand the factors that influence IT projects success
and failure. Still businesses are not always keen on success or failure as they try to benefit from
their investment in IT ventures in the best manner. Such direction requires a solid ground for
measuring the benefits of implementing IT projects and investing in ICT.
This work aimed at exploring the importance of investing in IT projects. This research
adopted a case study method focusing on Japan Tobacco International (JTI). Also, this study
utilized a framework guided by the work of Gunasekaran, Love, Rahimi & Miele model (2001).
The decision of investing in IT must be aligned to the organizational strategy and senior
management should be committed to supporting the project by providing the necessary
resources. On the other hand, the tactical and operational areas are considered as the most
effective key performance indicators (KPI) in measuring the intangible benefits and to evaluate
the success of investment of IT projects as well as to ensure that the project is implemented in
consistency with firm’s strategy and objectives.
This study reflects our understanding of a survey responses and documents available from
JTI’s portals. Such work lacks the necessary generalizability of research and requires more
cases to better understand the challenges faced by companies in justifying their investment in
IT. Future work is required to support our understanding using other case studies. Also, it is
useful to use other models or frameworks in exploring such dilemma, and better support the
role of IT in sustaining organizational competitive advantage.
References
Abu-Shanab, E. (2004). Data Warehousing Strategies: A Strategic Alignment
Perspective. A conceptual paper presented in the Proceedings of the Decision Sciences
Institute Conference-Boston, USA. 2004, p. 1-6.
Abu-Shanab, E. & Al-Saggar, A. (2013). Reasons Behind IT Project Failure: The Case
of Jordan. A book chapter in “Business Strategies and Approaches for Effective
Engineering Management” edited by Saqib Saeed, M. Ayoub Khan, Rizwan Ahmad.,
IGI Global, USA, (2013).
Abu-Shanab, E. & Bataineh, L. (2014). Challenges Facing E-government Projects:
How to Avoid Failure? International Journal of Emerging Sciences, Vol. 4(4), pp. 207-
217.
Abu-Shanab, E. & Saleh, Z. (2014). Contributions of ERP Systems in Jordan,
International Journal of Business Information Systems, Vol. 15(2), 2014, pp. 244-260.
Ahmad, F., & Arshad, N. H. (2014). Value Delivery of Information Technology
Investment: A Conceptual Framework. International Journal of Computer Theory and
Engineering, Vol. 6(2), PP, 150.
Barth, M.E. Kasznik, R. & McNichols, M.F. (2001). Analyst Coverage and Intangible
Assets. Journal of Accounting Research, PP, 1-34.
Cecez-Kecmanovic, D., Kautz, K., & Abrahall, R. (2014). Reframing success and
failure of information systems: a performative perspective. Mis Quarterly, Vol. 38(2),
pp, 561-588.
Drnevich, P. L. & Croson, D. C. (2013). Information technology and business-level
strategy: toward an integrated theoretical perspective. Mis Quarterly, Vol. 37(2), PP,
483-509.
Earl, M.J. (1990). Approaches to Information System planning: Experiences in
Strategic Information System Planning, the International Conference on Information
Systems, PP, 191-225.
Gunasekaran, A. Love, P. Rahimi, F. & Miele, R. (2001). A Model for Investment
Justification in Information Technology Projects. International Journal of Information
Management, Vol. 21(5), PP, 349-364.

63
Gunasekaran, A. Ngai, E. W. & McGaughey, R. E. (2006). Information technology and
systems justification: A review for research and applications. European Journal of
Operational Research, Vol. 173(3), PP, 957-983.
Hammouri, Q. Shraideh, L. & Abu-Shanab, E. (2015). Evaluating the Success of
Information Strategic System Planning “Two Cases from Jordan”. International
Conference on Information Technology ICIT, PP, 390-396.
Heeks, R. (2006). Health information systems: Failure, success and improvisation.
International journal of medical informatics, Vol. 75(2), pp, 125-137.
Horan, P., & Fowler, J. J. (2007). Are Information Systems' Success and Failure Factors
Related?-An Exploratory Study. Journal of Organizational and End User Computing,
Vol. 19(2), pp, 1-22.
Love, P. E., & Irani, Z. (2004). An exploratory study of information technology
evaluation and benefits management practices of SMEs in the construction industry.
Information & Management, 42(1), 227-242.
Macnish, K. (2012). Unblinking eyes: the ethics of automating surveillance, Ethics Inf
Technol, Vol. 14(1), PP, 151-167.
Mehrotra, C. (2012). Ethics: “Its Importance, Role and Code in Information
Technology”, International Journal of Advance Research in Computer Science and
Software Engineering, Vol. 2(1), PP, 417-421.
Nguyen, T. T. H., Saranto, K., Tapanainen, T., & Ishmatova, D. (2014, January). A
Review of Health Information Technology Implementation Success Factors:
Importance of Regulation and Finance. In System Sciences (HICSS), 2014 47th Hawaii
International Conference on (pp. 2).
Onn, C.W. and Sorooshian, S. (2013). Mini Literature Analysis on Information
Technology Definition, Information and Knowledge Management, Vol. 3(2), PP, 139-
140.
Pax (2015), PaxVapor, accessed by the internet on Septemper (2015),
https://www.paxvapor.com/
Perez-Arostegui, M. N., Benitez-Amado, J., & Tamayo-Torres, J. (2012). Information
technology-enabled quality performance: an exploratory study. Industrial Management
& Data Systems, Vol. 112(3), PP, 502-518.
Peslak, A. R. (2008). Organizational information systems: rate of return and
influencing variables as viewed by top financial executives. Industrial Management &
Data Systems, Vol. 108(1), pp. 43-59.
Prasad, A. (2008). Information technology and business value in developing
economies: A study of intangible benefits of information technology investments in
Fiji. The Electronic Journal of Information Systems in Developing Countries, Vol.
34(2), PP, 1- 11.
Rojko, K. Lesjak, D. & Vehovar, V. (2011). Information communication technology
spending in (2008-) economic crisis. Industrial Management & Data Systems, Vol.
111(3), PP, 391-409.
Silvius, A.J.G. Stoop, J. (2013). The Relationship between Strategic Information
System Planning Situational Factors, Process Configuration and Success, Journal of
Information Technology & Information Management, 22(1), PP, 1-15.
Stewart, W. Coulson, S. & Wilson. R. (2007). Information Technology: When it is
Worth the Investment. Journal of the Communications of IIMA, Vol. 7(3), PP, 119-
122.
Sweis, R. (2015). An Investigation of Failure in Information Systems Projects: The
Case of Jordan. Journal of Management Research, Vol. 7(1), PP, 173-185.
JTI Website References
JTI (2012a), JTI-at-a-Glance, accessed by the internet on September (2015),
http://www.jti.com/our-company/jti-at-a-glance/.
64
JTI (2012b), JTI Brands, accessed by the internet on June (2015),
http://www.jti.com/brands/.
JTI (2012c), Anti-Illicit-Trade JTI, accessed by the internet on July (2015),
http://www.jti.com/how-we-do-business/anti-illicit-trade/overview/
JTI (2012d), Code-Conduct, accessed by the internet on July (2015),
http://www.jti.com/how-we-do-business/code-conduct/
JTI (2012e), Fighting Contraband, accessed by the internet on July (2015),
http://www.jti.com/files/6913/3777/3625/JTI_AIT_FightingContraband_May_2011.p
df
JTI (2012f), JTI Logistic, accessed by the internet on July (2015),
http://www.jti.com/in-focus/world-jti-logistics/
JTI (2012g), Career Areas, accessed by the internet on July (2015),
http://www.jti.com/careers/career-areas/it/
JTI (2012h), Contact, accessed by the internet on July (2015), http://www.jti.com/site-
tools/contact-us/
JTI (2012i), Engage, accessed by the internet on July (2015), http://www.jti.com/in-
focus/engaging-employees-online1/
JTI (2012j), Media, accessed by the internet on September (2015),
http://www.jti.com/media/news-releases/jti-macdonald-corp-reaches-an-agreement-
regarding-illicit-trade-of-cigarettes-in-canada-2/
JTI (2014a), Code of Conduct, accessed by the internet on July (2015),
http://www.jti.com/files/5514/1025/7084/Code_of_Conduct_2014_NOLINKS.PDF
JTI (2014b), Investors, accessed by the internet on August (2015),
http://www.jt.com/investors/results/forecast/pdf/Supplemental20140424_E.pdf
JTI (2015), Finance, accessed by the internet on August (2015),
http://www.jt.com/investors/meetings_and_events/general_meeting/pdf/annotation20
150225_E.pdf

65
Environment and sustainable development in
Qat Economic
Dr. Mohammed Esmail Al-ab
Sana’a University
Yemen
Abstract:
No one can deny that consumption and production of Qat nowadays seems to be a way of
life of most of Yemeni people, having financial, social, cultural and environmental far-flung
effects. The high rising agricultural operation, production and marketing of Qat are parallel to
rise in the number of people asking for and chewing it. In the last two or three decades, Qat
consumption was widely spreading in Yemen. Currently, Qat consumption includes all groups
of society (intellectuals, businessmen, employees and workers).
As the number of people asking for Qat increasing, cultivation areas of Qat spread
significantly and occupying most agricultural areas. The unprecedented expansion in Qat area
and production were mainly the result of the unorganized and haphazardly executed digging of
irrigation wells, a matter that significantly contributed to the depletion of underground water
resources in many areas in Yemen.
Moreover, the expansion in Qat production has its negative effect on the export sector. But
Qat sector contributes to government revenue by a Qat consumption tax and as a religious Zakat
duty , becoming the fastest-growing and most profitable occupation involving millions of
farmers, traders and other service-providers , so Qat plays a prominent role in sustainable
development Yemen's economy and has become the backbone of the region’s economy,
because, Qat production and distribution now support the livelihoods of millions of Yemenis.
However, with growing national pressure to ban its distribution, we stresses the need for
effective policies to better manage the production, consumption and trade of Qat, and to create
an enabling policy to encourage saving of the cash from the production and marketing of Qat
and encourage investment for alternative livelihood options.
Key words:- Economic, Environmental, Qat, sustainable development.
Introduction
Qat (Catha edulis Forsk.) is an evergreen shrub of the Celastraceae family. In eighteenth
century, Peter Forsskalin described a plant from Yemen and named it Catha edulis. Since that
most authors have used this name (Kennedy et al. 1983). Chewing of Qat leaves and ingesting
the juices that contain the psychoactive substance, Cathinone produces sympathomimetic and
central nervous system stimulation analogous to the effects of amphetamine (Schechter et al.
1984). These effects include elevated blood pressure, mydriasis, hyperthermia, anorexia,
insomnia, and alertness (Baasher 1980; Mekasha 1984). The subjective pleasurable effects
such as the ability to concentrate, euphoria, confidence, friendliness, contentment and flow of
ideas have also been reported (Kalix 1988).
One would estimate that at least over 85% of the Yemeni people chew Qat leaves. Over
60% of these are in the habit of chewing once a week and the remaining find it necessary to
chew Qat daily. Consequently the expansion of Qat cultivation has been quite significant, over
the last two decades. The areas of cultivation are estimated to have at least tripled if not
quadrupled to some 80,000-126,000 hectares (Oskar 1992).

66
In Yemen Qat cultivation is found mainly in the Yemen volcanic (basalt and tuffs).
Good drainage is the only factor that all soils satisfactorily cultivated with Qat have in common.
The soils which suitable for Qat cultivation are slightly alkaline. (Sharma et al. 1976) Qat
benefits from available water resources, such as rainfall, floods, springs, and groundwater.
Farmers sometimes bring in water even from far away by using trucks carrying water tanks.
The high revenue generated by Qat farming also encourages farmers to drill deep wells despite
high drilling costs. Moreover, in this paper the concomitant negative aspects of qat cultivation
and use. and the influence of qat on the socioeconomic life of Yemenis, , qat and sustainable
economic development in Yemen.
AIMS OF STUDY
In relation to the above mentioned problem of consumption of Qat in Yemen society, the study
determines the following objectives:
a-To identify the direct or indirect effects of growing and spreading of Qat on natural
environment.
b-To investigate the natural environmental factors which help in growing and spreading of Qat
in Republic of Yemen
c-To highlight some of positive contribution of sustainable development in Qat Economic to
Yemen society such as agriculture development, government budget, and on rural life . The
increase in rural savings and investment result in improving the level of living in rural areas.
Add to that, the positive effect on irrigation development and irrigated areas. It also helps in
decrease rural-urban immigration. It affects farmer’s incomes, employment and gross domestic
product .
The Effect of Qat on Water Resources
Yemen is amongst the driest countries in the world. Per capita water availability is little
more than one fifth of the regional average. Only represent 2% of the world wide average.
Yemen's per capita availability of 150 m3 is well below the 1000 m3 usually assumed to be
necessary for food self sufficiency. (World Bank 1999).
According to the High Water Council (HWC 1992a) the total population was estimated to
be around 23.4 million by the year 2010. Eighty per cent of them live in the central and southern
highlands which receive most of the erratic and limited rainfall. Increasing water demand in
recent years and the limited availability of surface water resources have increased the pressure
on the available, mostly non-renewable groundwater resources. The number of wells dug for
Qat irrigation increase by the increase of Qat production. Number of wells amounted to 4,765
well in Sana'a basin.
While other crops such as fruits and vegetables were irrigated from the same wells, it was
possible to estimate amounts of water utilized in Qat production through the application of
cowpats. Water utilized in Qat production was estimated at 659 million m3 in 1996. This amount
kept increasing with the increase in Qat production until it reached 756 million m3 in the year
2000 (Atroush 2001) (Table-1).
Therefore, Bazza (2001) summarized four critical issues for Qat effect on water resources as
follows:
a. Lack of sustainability of the water resources, as the current use from most aquifers is
much higher than natural recharge. This trend will ultimately lead to the depletion of
groundwater with all of the consequences.
b. Demand on water resources continues to grow with the population increase and the
higher needs to meet food requirements.
Table 1 Estimation of ground water extracted for Qat production in the year 2000
Source of
irrigation
Area
(meter2)
%of area
to total
Area under
Qat within
each water
Water
duty
(m3/ha)
Extracted ground
water for Qat
production
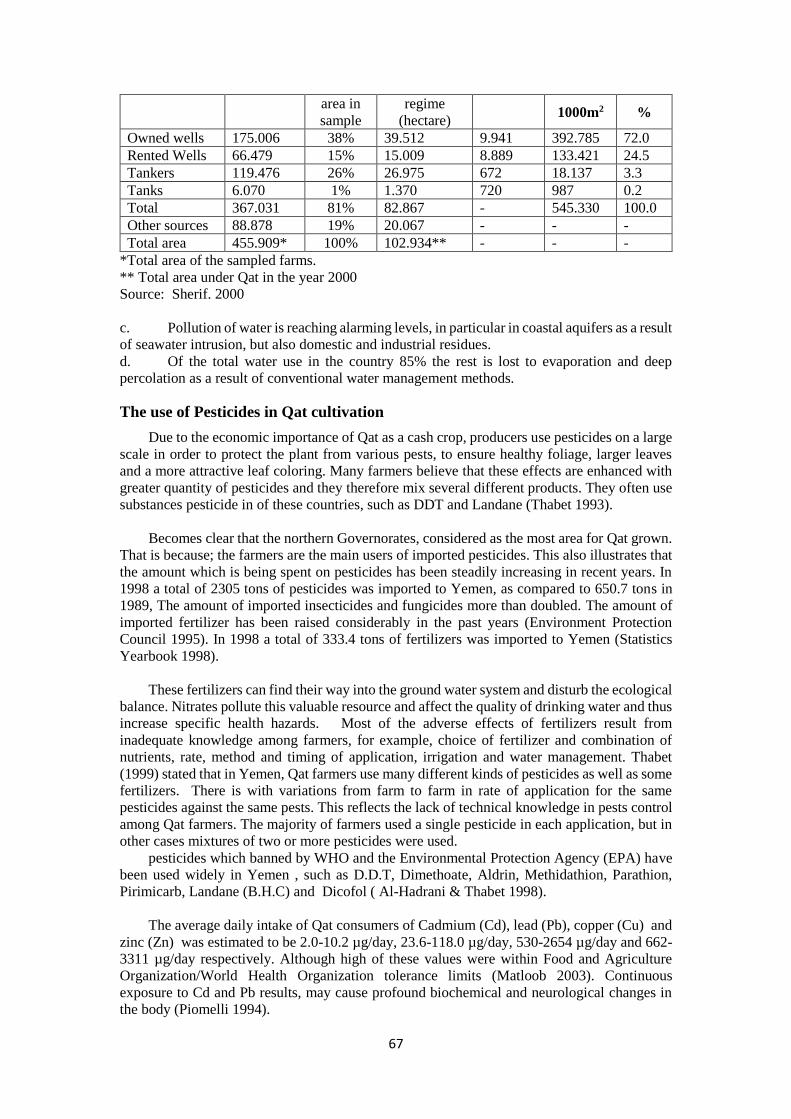
67
area in
sample
regime
(hectare) 1000m2 %
Owned wells 175.006 38% 39.512 9.941 392.785 72.0
Rented Wells 66.479 15% 15.009 8.889 133.421 24.5
Tankers 119.476 26% 26.975 672 18.137 3.3
Tanks 6.070 1% 1.370 720 987 0.2
Total 367.031 81% 82.867 - 545.330 100.0
Other sources 88.878 19% 20.067 - - -
Total area 455.909* 100% 102.934** - - -
*Total area of the sampled farms.
** Total area under Qat in the year 2000
Source: Sherif. 2000
c. Pollution of water is reaching alarming levels, in particular in coastal aquifers as a result
of seawater intrusion, but also domestic and industrial residues.
d. Of the total water use in the country 85% the rest is lost to evaporation and deep
percolation as a result of conventional water management methods.
The use of Pesticides in Qat cultivation
Due to the economic importance of Qat as a cash crop, producers use pesticides on a large
scale in order to protect the plant from various pests, to ensure healthy foliage, larger leaves
and a more attractive leaf coloring. Many farmers believe that these effects are enhanced with
greater quantity of pesticides and they therefore mix several different products. They often use
substances pesticide in of these countries, such as DDT and Landane (Thabet 1993).
Becomes clear that the northern Governorates, considered as the most area for Qat grown.
That is because; the farmers are the main users of imported pesticides. This also illustrates that
the amount which is being spent on pesticides has been steadily increasing in recent years. In
1998 a total of 2305 tons of pesticides was imported to Yemen, as compared to 650.7 tons in
1989, The amount of imported insecticides and fungicides more than doubled. The amount of
imported fertilizer has been raised considerably in the past years (Environment Protection
Council 1995). In 1998 a total of 333.4 tons of fertilizers was imported to Yemen (Statistics
Yearbook 1998).
These fertilizers can find their way into the ground water system and disturb the ecological
balance. Nitrates pollute this valuable resource and affect the quality of drinking water and thus
increase specific health hazards. Most of the adverse effects of fertilizers result from
inadequate knowledge among farmers, for example, choice of fertilizer and combination of
nutrients, rate, method and timing of application, irrigation and water management. Thabet
(1999) stated that in Yemen, Qat farmers use many different kinds of pesticides as well as some
fertilizers. There is with variations from farm to farm in rate of application for the same
pesticides against the same pests. This reflects the lack of technical knowledge in pests control
among Qat farmers. The majority of farmers used a single pesticide in each application, but in
other cases mixtures of two or more pesticides were used.
pesticides which banned by WHO and the Environmental Protection Agency (EPA) have
been used widely in Yemen , such as D.D.T, Dimethoate, Aldrin, Methidathion, Parathion,
Pirimicarb, Landane (B.H.C) and Dicofol ( Al-Hadrani & Thabet 1998).
The average daily intake of Qat consumers of Cadmium (Cd), lead (Pb), copper (Cu) and
zinc (Zn) was estimated to be 2.0-10.2 µg/day, 23.6-118.0 µg/day, 530-2654 µg/day and 662-
3311 µg/day respectively. Although high of these values were within Food and Agriculture
Organization/World Health Organization tolerance limits (Matloob 2003). Continuous
exposure to Cd and Pb results, may cause profound biochemical and neurological changes in
the body (Piomelli 1994).
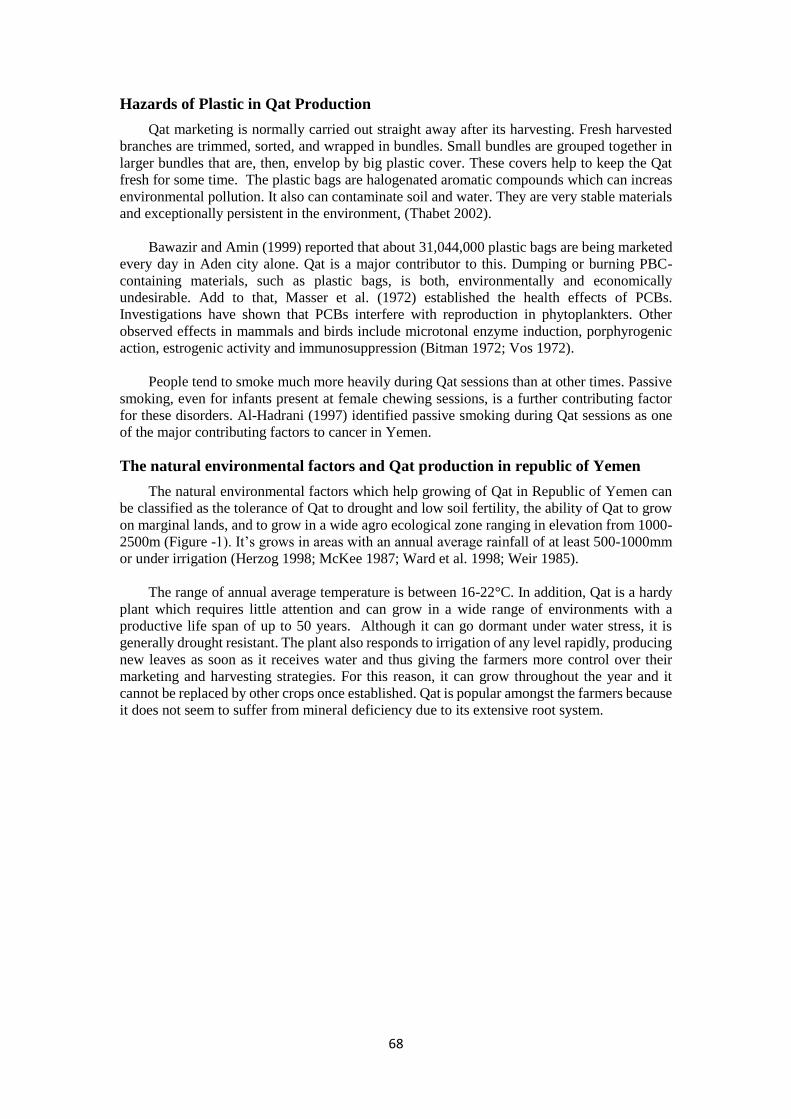
68
Hazards of Plastic in Qat Production
Qat marketing is normally carried out straight away after its harvesting. Fresh harvested
branches are trimmed, sorted, and wrapped in bundles. Small bundles are grouped together in
larger bundles that are, then, envelop by big plastic cover. These covers help to keep the Qat
fresh for some time. The plastic bags are halogenated aromatic compounds which can increas
environmental pollution. It also can contaminate soil and water. They are very stable materials
and exceptionally persistent in the environment, (Thabet 2002).
Bawazir and Amin (1999) reported that about 31,044,000 plastic bags are being marketed
every day in Aden city alone. Qat is a major contributor to this. Dumping or burning PBC-
containing materials, such as plastic bags, is both, environmentally and economically
undesirable. Add to that, Masser et al. (1972) established the health effects of PCBs.
Investigations have shown that PCBs interfere with reproduction in phytoplankters. Other
observed effects in mammals and birds include microtonal enzyme induction, porphyrogenic
action, estrogenic activity and immunosuppression (Bitman 1972; Vos 1972).
People tend to smoke much more heavily during Qat sessions than at other times. Passive
smoking, even for infants present at female chewing sessions, is a further contributing factor
for these disorders. Al-Hadrani (1997) identified passive smoking during Qat sessions as one
of the major contributing factors to cancer in Yemen.
The natural environmental factors and Qat production in republic of Yemen
The natural environmental factors which help growing of Qat in Republic of Yemen can
be classified as the tolerance of Qat to drought and low soil fertility, the ability of Qat to grow
on marginal lands, and to grow in a wide agro ecological zone ranging in elevation from 1000-
2500m (Figure -1). It’s grows in areas with an annual average rainfall of at least 500-1000mm
or under irrigation (Herzog 1998; McKee 1987; Ward et al. 1998; Weir 1985).
The range of annual average temperature is between 16-22°C. In addition, Qat is a hardy
plant which requires little attention and can grow in a wide range of environments with a
productive life span of up to 50 years. Although it can go dormant under water stress, it is
generally drought resistant. The plant also responds to irrigation of any level rapidly, producing
new leaves as soon as it receives water and thus giving the farmers more control over their
marketing and harvesting strategies. For this reason, it can grow throughout the year and it
cannot be replaced by other crops once established. Qat is popular amongst the farmers because
it does not seem to suffer from mineral deficiency due to its extensive root system.

69
Figure 1 The regions of Qat production in Yemen Republic
Qat cultivation was found in four major geological zones (Steffen 1978). It's thrives is better
and produces foliage in greatest abundance on acidic well-drained soil in well-watered
mountainous districts.
The Qat in The Yemeni Economy
Table- 2 explaines the sub-sectors contributing to the agricultural of gross domestic
product; include crops, forestry, livestock, fish, and government services. Excluding the
contribution of government services sub-sector, which increased at a very high annual rate
(24.3%) the contribution of all the sub-sectors increased at an average annual rate ranging
between 2.3% (livestock) and 9.9% (fish). Average annual rates of increase for other sub-
sectors were 8.2% for plant production (excluding Qat), 5.6% for forestry, and 2.8% for Qat.
Crops, excluding Qat, ranked first, contributing on the average YR 17.8 billion followed by Qat
which contributed YR 12.2 billion. The contribution of other production sub-sectors ranged
between almost YR 1 billion for fish and YR 3.7 billion for livestock.
Qat sector contributes to government revenue in two ways: by a Qat consumption tax
(levied on Qat transport and marketing) and a religious Zakat duty (levied on Qat production).
While Zakat is collected at the farm level by Zakat assessors, the consumption tax is collected
at checkpoints located at the bottlenecks of the roads, as well as in the Qat markets of each city.
The portion of government revenue derived from the Qat sector is however nearly negligible.
Table 2 Development of Agricultural of gross of domestic product and its constituents
in constant 1990 prices YR million
Items
►
Crops
with out
Qat
Qat Forestry Livestock Fish Services Total
1990 13.834 10.741 1.286 3.688 797 271 30.617
1991 12.066 11.142 1.407 2.648 807 276 28.346
1992 15.946 11.508 1.714 3.523 669 396 33.756
1993 16.876 11.796 1.685 3.709 742 448 35.256

70
1994 16.274 12.090 1.654 2.901 688 446 34.053
1995 17.560 12.389 1.625 3.586 722 528 36.410
1996 17.660 12.491 1.536 3.911 930 560 37.088
1997 19.613 12.811 1.687 4.315 1.267 649 40.342
1998 24.115 13.142 1.856 4.552 1.385 830 45.880
1999 17.071 13.471 1.937 4.436 1.509 861 46.285
Average 17.802 12.158 1.639 3.727 952 527 36.803
Increase
%*
8.22
2.82
5.62
2.25
9.93
24.19 5.69
*Percentages of average annual increase to the value in 1990
Saurce: Central Statistical Organization 2000a
Taxes actually levied fall short of that Table 3 It is well known that due to tax evasion,
especially in the case of Qat. The state loses annually millions of Rials. It seems likely that 70
- 90 percent of Qat consumption tax that should be levied is not being collected. In the year
1998 this would represent a loss of 4,239 to 16,351 million Rials.
Table 3 Qat in Tax Revenue in the Years 1990, 1994 and 1998
Tax and Zakat 1990 1994 1998
1000 RY 1000 RY 1000 RY
Total Tax Revenue 13.733.075 25.358.569 79.949.512
Qat consumption Tax 298.417 664.864 1.816.732
Qat Zakat 193.091 181.359 325.965
Source: Taxation Department, Ministry of Finance. Sana’a. Yemen
The Effect of Qat on Gross Domestic Product
Qat contributes to gross domestic product. Table-4 estimated the average contribution to
these sectors during the period 1990 - 1999 is YR 12.2 billion, YR 1 billion, and YR913 million,
respectively in constant 1990 prices. These contributions represented 33.5%, 8.6%, and 5.7%
of the contribution of agriculture, trade, and transport to gross domestic product, respectively.
The total contribution of Qat to gross domestic product amounted to YR 14.1 million or 8.7%
of gross domestic product, or 10.2% of gross domestic product without oil contribution. Thus,
Qat contribution to gross domestic product ranked 5th after agriculture (23%), mining and
quarrying (14%), transport, storage and communication (10%), and manufacturing (9%). In
other words, Qat contribution to gross domestic product amounted to 38%, 62%, 88%, and 98%
of the contribution of agriculture, mining and quarrying, transport, storage and communication,
and manufacturing sectors, respectively. The direct contribution of Qat averaged about 54% of
oil contribution to gross domestic product during the period 1990 - 1999. However, its total
contribution was estimated as 63% of the oil contribution during the same period.
Table 4 Contribution of Qat to agriculture, other sectors and gross domestic product in
constant YR million
Item Unit 1990 1999 Average
Gross domestic product YRm 126.489 206.108 162.045
Agriculture YRm 30.617 46.285 36.803
Trade YRm 10.232 15.595 12.205
Transport YRm 18.713 15.944 16.039
Oil YRm 15.949 32.719 22.482
Qat production YRm 10.741 13.471 12.158
Qat share in trade YRm 916 1.165 1.043
Qat share in transport YRm 802 1.019 913
Total Qat contribution YRm 12.459 15.655 14.114
%of Qat to agriculture % 35.08 29.1 33.04

71
%of Qat to trade % 8.95 7.47 8.55
%of Qat to transport % 4.29 6.39 5.69
%of direct Qat contribution to oil % 63.37 41.17 54.08
% of total Qat contribution to oil % 73.51 47.85 68.16
% of Qat in gross domestic product % 11.37 9.03 10.24
Source: Central Statistical Organization 2000
The Contribution of Qat to Employment
The total contribution of Qat to employment in agriculture, trade, and transport sectors is
507 thousand persons in 1999, which represented 14% of all persons employed by the economy
aged 15 years or above. It ranked second only to agriculture, and was followed by the wholesale
and retail trade sector, which employed 437 thousand people or 12.1%. The public
administration, defense, and security sector, which employed 358 thousand persons or 10%.
Each of the other sectors employed represented less than 10% of the total employment.
Comparing the total employment in Qat production, trade and transport with employment in
agriculture including and excluding those working in Qat production reveals that, it amounts to
26%, or 35%, respectively.
The Contribution of Qat to Employment in Rural Areas
Table-5 shows that, Qat is the best provider of job opportunities in agriculture. Qat
production utilized the services of 99.3 thousand hired laborers in the year 1999. This number
is more than 5 times the hired laborers employed for vegetable crops, 2.7 times the number
hired for cash crops (excluding Qat), 2.2 times the number hired for cereals, and 1.2 times as
the number hired for fruits .
Family members working in Qat production amounted to 374 thousand person, which are
33.5 times as much as those working in vegetables production, 7.3 times as much as those
working in cereals production, 5.7 times as much as those working in cash crops excluding Qat,
and 4.1 times as much as those working in fruits production. The total number of persons
working in Qat is 473 thousands in 1999, which represent 25% of the total number of people
working in agriculture. Fruits came next to Qat, employing 175 thousands (9.1%) followed by
cash crops without Qat, which are 114 thousands (5.9%), with cereals 97 thousands employers
(5%), and with vegetable crops about 15 thousands employers (1.6%).
Contribution of Qat to Employment in non-Agricultural Sectors
The percentages of Qat contribution to the value added in the trade and transport sectors
in 1999 were 7.47% and 6.39% respectively, while the numbers of people working in these two
sectors were 349,144 and 122,465 respectively. Hence, the number of people working in the
Qat trade was estimated at 26,081 and 7,826 respectively. The working force in Qat related
activities in the two sectors amounted to 33,907 persons in the same year. However, these
figures should be treated as only rough estimates. (Central Statistical Organization 2000a).
Table 5 Estimation of hired and family labor working in the production of Qat and some
groups of other crops for the year 2000
Crop
Farm labor at the country level
%of
hired
to
total
labor
%of total
labor to
total
agricultural
employment
**
Hired Family Total
Man/
year*
Rati
o o
f
Qa
t to
oth
er c
rop
s
Man/
year*
Rati
o o
f
Qa
t to
oth
er c
rop
s
Man/
year*
Rati
o o
f
Qa
t to
oth
er c
rop
s
Qat 99.299 - 373.948 - 437.247 - 20.98 24.55

72
Cereals 45.409 2.19 51.485 7.26 96.894 4.88 46.86 5.03
Vegetables 19.656 5.05 11.179 33.45 30.835 15.35 63.75 1.6
Fruits 83.992 1.18 90.747 4.12 174.740 2.71 48.07 9.06
Cash
crops-Qat 37.378 2.66 76.941 4.86 114.319 4.14 32.7 5.93
* Numbers of man/year were calculated on the assumption that the person work 300 days
per year.
* The latest estimation of the total number of people working in agriculture is 1,927,868
people in 1999.
Source: Sherif et al. 2000
Table-6 estimates the total contribution of Qat to employment in Yemen in the year 1999.
It shows that the total contribution of Qat sub-sector to employment amounted to 507 thousand
persons or 14% of the employed persons aged 15 years or above in the whole economy. Hence,
it ranked second only to agriculture in this respect. It was followed by the wholesale and retail
trade sector includes hotels and restaurants, which employed 437 thousand people (12.1%) and
the public administration, defence, and security sector, which employed 358 thousand persons
(10%). All other sectors employed less than 10% of the total employed persons. Comparing
total employment in Qat production, trade and transport with employment in agriculture
including and excluding Qat revealed that it amounted to 26%, or 35%, respectively.
Table 6 Total contribution of Qat to employment in 1999
Sectors contribution Employed person
Person Percentage
Total Qat contribution 507.154 14.00
Agriculture without Qat 1.451.983 40.09
Total agriculture 1.959.137 54.09
Mining and quarrying 17.699 0.49
Manufacture 135.503 3.74
Electricity, gas and water 11.713 0.32
Construction 238.264 6.58
Whole sale and retail trade 437.001 12.07
Transport, storage and communication 122.465 3.38
Financial institutions and real estate 29.968 0.83
Public administration, defense & security 357.907 9.88
Education 209.195 5.78
Health and social work 42.350 1.17
Others 60.477 1.67
Total 3.621.679* 100.00*
*The first two lines are not included in the total.
Source: Central Statistical Organization 2000a
The Contribution of Qat on Farmers Incomes
Table-7 shows that, Qat is by far, the most profitable crop for farmers. Gross Revenue per
hectare of Qat averaged YR 2.5 million, while it averaged YR 101,000 for cereals, YR 547,000
for fruits, YR 540,000 for vegetables and YR 419,000 for cash crops excluding Qat. That is
gross income per hectare of Qat was almost 25 times as much as the same for cereals, 6 times
as much for cash crops excluding Qat, and 4.6 times as much for both vegetables and fruits.
Figures for gross margin were more exciting. Gross margin per hectare of Qat averaged YR 1.9
million, while it averaged YR 423 thousands for fruits, YR 343 thousands for cash crops
without Qat, YR 215 thousands for vegetables, and YR 36 thousands for cereals. The gross
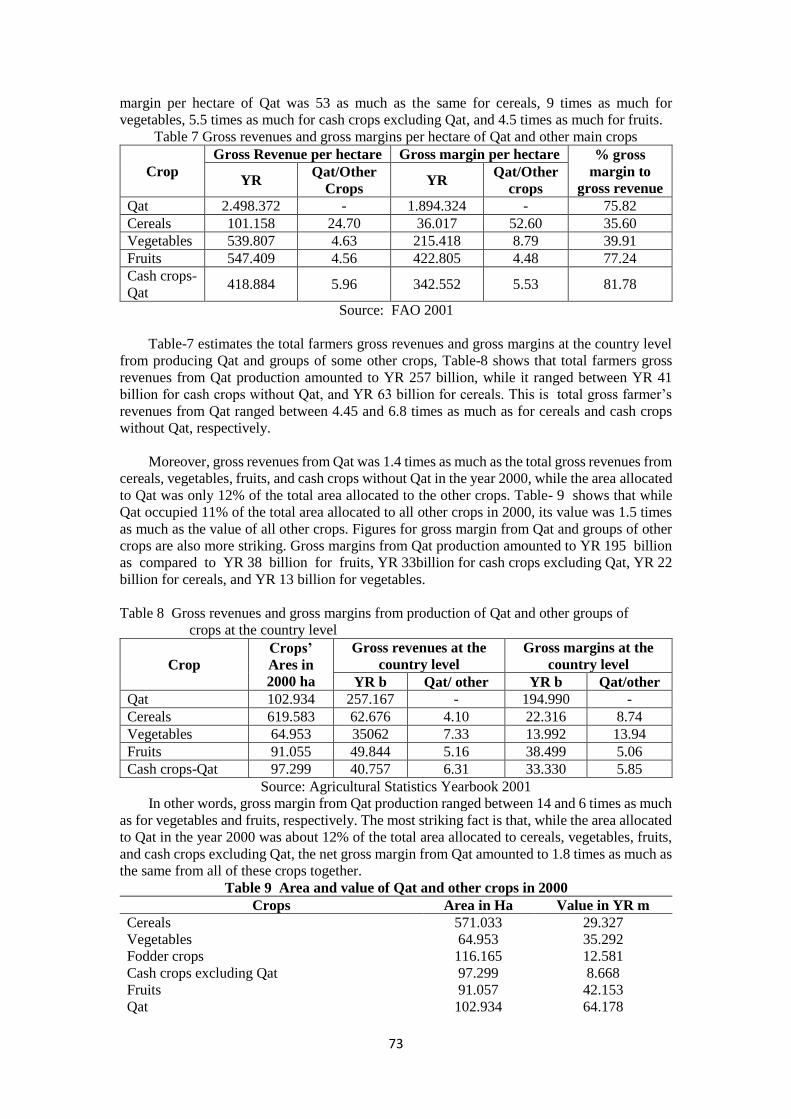
73
margin per hectare of Qat was 53 as much as the same for cereals, 9 times as much for
vegetables, 5.5 times as much for cash crops excluding Qat, and 4.5 times as much for fruits.
Table 7 Gross revenues and gross margins per hectare of Qat and other main crops
Crop
Gross Revenue per hectare Gross margin per hectare % gross
margin to
gross revenue YR
Qat/Other
Crops YR
Qat/Other
crops
Qat 2.498.372 - 1.894.324 - 75.82
Cereals 101.158 24.70 36.017 52.60 35.60
Vegetables 539.807 4.63 215.418 8.79 39.91
Fruits 547.409 4.56 422.805 4.48 77.24
Cash crops-
Qat 418.884 5.96 342.552 5.53 81.78
Source: FAO 2001
Table-7 estimates the total farmers gross revenues and gross margins at the country level
from producing Qat and groups of some other crops, Table-8 shows that total farmers gross
revenues from Qat production amounted to YR 257 billion, while it ranged between YR 41
billion for cash crops without Qat, and YR 63 billion for cereals. This is total gross farmer’s
revenues from Qat ranged between 4.45 and 6.8 times as much as for cereals and cash crops
without Qat, respectively.
Moreover, gross revenues from Qat was 1.4 times as much as the total gross revenues from
cereals, vegetables, fruits, and cash crops without Qat in the year 2000, while the area allocated
to Qat was only 12% of the total area allocated to the other crops. Table- 9 shows that while
Qat occupied 11% of the total area allocated to all other crops in 2000, its value was 1.5 times
as much as the value of all other crops. Figures for gross margin from Qat and groups of other
crops are also more striking. Gross margins from Qat production amounted to YR 195 billion
as compared to YR 38 billion for fruits, YR 33billion for cash crops excluding Qat, YR 22
billion for cereals, and YR 13 billion for vegetables.
Table 8 Gross revenues and gross margins from production of Qat and other groups of
crops at the country level
Crop
Crops’
Ares in
2000 ha
Gross revenues at the
country level
Gross margins at the
country level
YR b Qat/ other YR b Qat/other
Qat 102.934 257.167 - 194.990 -
Cereals 619.583 62.676 4.10 22.316 8.74
Vegetables 64.953 35062 7.33 13.992 13.94
Fruits 91.055 49.844 5.16 38.499 5.06
Cash crops-Qat 97.299 40.757 6.31 33.330 5.85
Source: Agricultural Statistics Yearbook 2001
In other words, gross margin from Qat production ranged between 14 and 6 times as much
as for vegetables and fruits, respectively. The most striking fact is that, while the area allocated
to Qat in the year 2000 was about 12% of the total area allocated to cereals, vegetables, fruits,
and cash crops excluding Qat, the net gross margin from Qat amounted to 1.8 times as much as
the same from all of these crops together.
Table 9 Area and value of Qat and other crops in 2000
Crops Area in Ha Value in YR m
Cereals 571.033 29.327
Vegetables 64.953 35.292
Fodder crops 116.165 12.581
Cash crops excluding Qat 97.299 8.668
Fruits 91.057 42.153
Qat 102.934 64.178
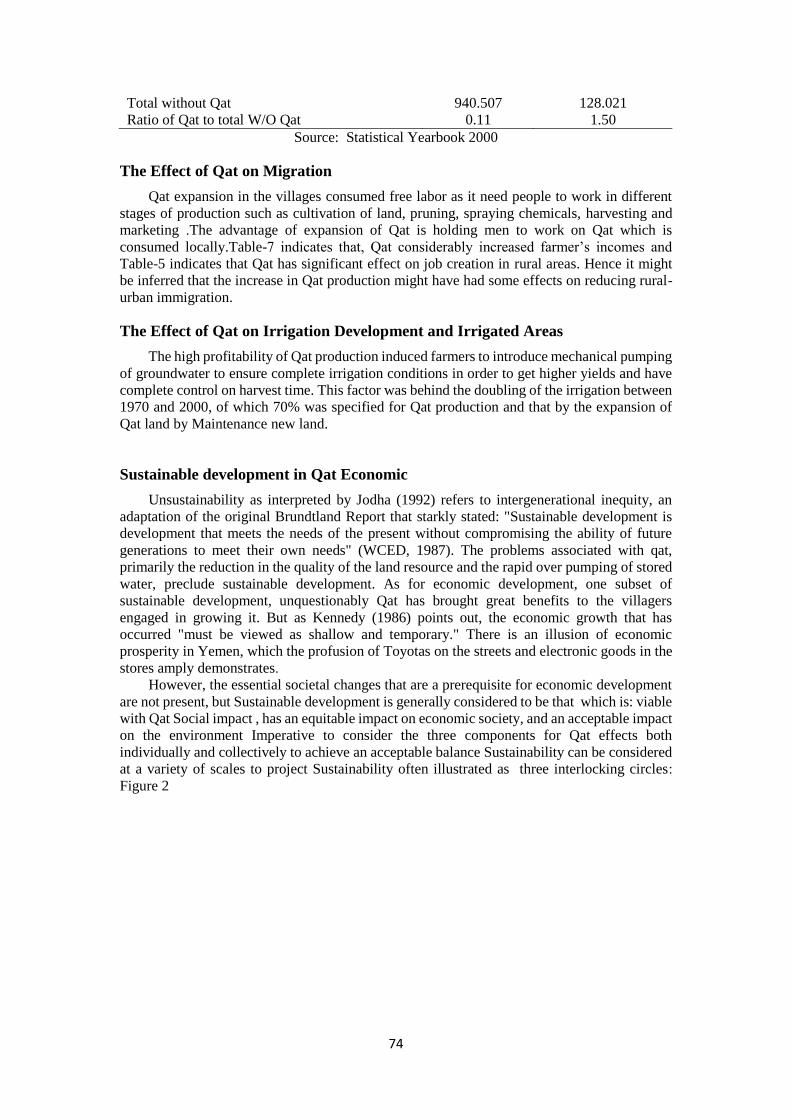
74
Total without Qat 940.507 128.021
Ratio of Qat to total W/O Qat 0.11 1.50
Source: Statistical Yearbook 2000
The Effect of Qat on Migration
Qat expansion in the villages consumed free labor as it need people to work in different
stages of production such as cultivation of land, pruning, spraying chemicals, harvesting and
marketing .The advantage of expansion of Qat is holding men to work on Qat which is
consumed locally.Table-7 indicates that, Qat considerably increased farmer’s incomes and
Table-5 indicates that Qat has significant effect on job creation in rural areas. Hence it might
be inferred that the increase in Qat production might have had some effects on reducing rural-
urban immigration.
The Effect of Qat on Irrigation Development and Irrigated Areas
The high profitability of Qat production induced farmers to introduce mechanical pumping
of groundwater to ensure complete irrigation conditions in order to get higher yields and have
complete control on harvest time. This factor was behind the doubling of the irrigation between
1970 and 2000, of which 70% was specified for Qat production and that by the expansion of
Qat land by Maintenance new land.
Sustainable development in Qat Economic
Unsustainability as interpreted by Jodha (1992) refers to intergenerational inequity, an
adaptation of the original Brundtland Report that starkly stated: "Sustainable development is
development that meets the needs of the present without compromising the ability of future
generations to meet their own needs" (WCED, 1987). The problems associated with qat,
primarily the reduction in the quality of the land resource and the rapid over pumping of stored
water, preclude sustainable development. As for economic development, one subset of
sustainable development, unquestionably Qat has brought great benefits to the villagers
engaged in growing it. But as Kennedy (1986) points out, the economic growth that has
occurred "must be viewed as shallow and temporary." There is an illusion of economic
prosperity in Yemen, which the profusion of Toyotas on the streets and electronic goods in the
stores amply demonstrates.
However, the essential societal changes that are a prerequisite for economic development
are not present, but Sustainable development is generally considered to be that which is: viable
with Qat Social impact , has an equitable impact on economic society, and an acceptable impact
on the environment Imperative to consider the three components for Qat effects both
individually and collectively to achieve an acceptable balance Sustainability can be considered
at a variety of scales to project Sustainability often illustrated as three interlocking circles:
Figure 2

75
Figure 2 sustainable Development of Qat in Yemen
Conclusion
Despite Qat consumption gives negative impact on the country environment as well as
social impacts, However Qat plays a prominent role in Yemen's economy and has a strong
impact on related sectors. These include transportation, marketing, and commercial margins
(wholesale and retail). Qat related economic activities therefore positively affect national
revenue. Qat directly contributes to the growth of the Yemeni economy, well beyond the
agricultural sector. Also the old and new Qat farmers significantly increased their incomes, to
enabled them to improve their level of living. The predicted, population growth enhance qat
production ,required in Yemen is an analog program , by timeframe is a reasonable estimate for
an entire population to adjust its behavior and for Qat . Yemenis could be induced to reduce
their Qat consumption through the use of authoritative, incentive-driven, and hortatory policy
tools, both at formal and informal levels, In conjunction with a sustained education .
REFERENCES
Agricultural Statistics Yearbook. 2001. General department of agricultural statistics
and documentation. Ministry of Agriculture and Irrigation. Yemen: Modern Yemen
for publishing.
Al-Hadrani, A.M. & Thabet, A.A. M. 1998. Al-mubidit almstkhdmah ala alqat wa
alaktuah balamrad alsrtaniyah. The used Pesticides on Qat tree and relationship by
cancerous diseases, Maglat Dersa’at Yemenia 60-61.
Al-Hadrani, A.M. 1997. At-Tadkhin “Smoking”. 2nd Ed. Republic of Yemen, Sana’a:
Yemeni Cancer Society
Atroush, Khedr. B. 2001. The effect of Qat on water resources. Republic of Yemen.
Project TCP/YEM/0067 (A), FAO 8 (20): October 2001.

76
Baasher, T.A. 1980. The use of khat: a stimulant with regional distribution. In:
Edwards G, & Arif A (Eds.): A Drug problem in sociocultural context - a basic for
polices and program planning, World Health Organization. Geneva: Public Health
Papers. pp. 86-93.
Bawazir, A. & Amin, B. 1999. Plastic Abuse in Yemen. Working paper, 1st National
Conference on Hazards of Pesticides and Other Chemicals on Human Health and
Environment. Yemen Cancer Society, Sana’a. 14 – 16 March.
Bazza, M. 2001. Improved on-farm participatory water management to reduce minig
of groundwater in Yemen, Farming Systems study (FAO) World Bank, pp. 3 – 4.
Bitman , J., Cecil, H.C. & Harris, S.J. 1972. Biological Effect of Polychlorinated
Biphenyls in Rats and Quail. Environ. Health. Perspect 1: 145 -149.
Environment Protection Council. 1995. Al-wada al-piee li Gumhoria al-Yemenia.
Status of the Environment in the Republic of Yemen-1995, Ministers Council,
Republic of Yemen.
Herzog, M. 1998. Shrubland management in tribal Islamic Yemen. Social Forestry as
Development of a Local and Sustainable (Sylvi-)Culture. An Essay in Practical
Philosophy. http://www.brainworker.ch/reports/yemen/index.htm#TOC [5 May 2005].
HWC. 1992a. National Water Legislation and Institution Issues. The Technical
Secretariat of the High Water Council, Sana'a, Republic of Yemen. Final report,
Volume II, UNDP/DESD project YEM/88/001.
Jodha, N.S., 1992. Understanding and responding to global climate change in fragile
resource zones. In: J. Schmandt and J. Clarkson, eds., The regions and global warming:
impacts and response strategies. New York: Oxford University Press, 203 - 218.
Kalix, P. 1988. Khat: a plant with amphetamine effects. J. Subst. Abuse Treat 5: 163-
169.
Kennedy, J., Teague., Rokaw, W. & Conney, E. 1983. A medical evaluation of the use
of qut in North Yemen. Society Science and Medicine 17: 783-793.
Kennedy, J.G., 1986. The Flower of Paradise: The Institutionalized Use of the Drug
Qat in North Yemen. Dordrecht: D. Reidel Publishing Company, 268 pp.
Masser, J.L., Fisher, N.S., Teng, T.C. & Wurster, C.F. 1972. Polychlorinated
Biphenyls: Toxicity to certain Phytoplankters. Science 175: 191-192.
Matloob, M.H. 2003. Determination of cadmium, lead, copper and zinc in Yemeni khat
by anodic stripping voltammetry. Eastern Mediterranean Health Journal 9 (1/2): 28–
36.
McKee, C. 1987. Medical and social aspects of Qat in Yemen: a review. J of the Royal.
Society of Medicne 80 (12): 762 – 765.
Mekasha, A. 1984. The clinical effect of khat (Catha edulis Forsk). In Ermias Dagne,
(Ed.). Proceedings of international symposium on chemical and ethnopharmacological
aspects of khat, pp. 77-81. Ethiopia: Addis Ababa.
Oskar, H. 1992. Qat, the myth and the truth, Agricultural sector review mission to
Yemen F.A.O.
Piomelli, S. 1994 . Childhood lead poisoning in the 90s. Pediatrics 93: 508–10.
Schechter, M.D., Rosecroms, J.A. & Glennon, R.A. 1984. Comparison of behavioral
effects of cathinon, amphetamine and apomorhine. Pharmacology Biochemistry and
behavior 20: 181-184.
Sharma, R.K. & Awad, A.M., Dewan, H.C. 1976. Soil and water Investigation Report
No. 6, Central Agricultural Research Organisation Project, Taiz, UNDP/FAO/Yemen
73/010 Ministry of Agriculture, Yemen Arab Republic.
Sherif, M. 2000. Project document about Qat, Ministry of Planning & Development,
Ministry of Agriculture & Irrigation, by financing: Food & Agriculture Organization
of the United Nations, Sana’a Republic of Yemen
Statistics Yearbook. 1998. Central statistical organization, Republic of Yemen, Sana’a:
Ministry of planning & development.

77
Steffen, H. 1978. Yemen Arab Republic, final Report on the Airphoto Interpretation
Project of the Swiss Technical Cooperation Service, Berne, Published by Dept. of
Geography, University Surich, Switzerland. April.
Thabet, A.A. 1993. Interaction between the extract of natural plant and toxicology of
some insecticides. Ph.D Thesis. Fac. Of Agriculture. Universty of Alexandria. Egypt.
Unpublished.
Thabet, A.A. 1999. Natural pesticide as new altematives to replace the convenienal
hazardous pesticides in Republic of Yemen. London: Alexandria Science Exchange.
Thabet, A.A. 2002. Qat and environment, National conference on Qat, Sana’a, Yemen.
6-7 April.
Vos, J.G. 1972. Toxicology of PCBs for Mammals and for Birds. Environ. Health.
Perspect 1: 105-117.
Ward, C., Al-Thawr, A., Qasem, F. & Noman, A. 1998. Al-Qat, Qat. Yemen
Agricultural Strategy. Working Paper No. 8 , Ministry of Agriculture and Irrigation,
Yemen.
WCED, 1987. Our Common Future. World Commission on Environment and
Development. New York: Oxford University Press, 400 pp.
Weir, S. 1985 .Qat in Yemen, consumption and social change, London: British
Museum Publication.
World bank. 1999. Statistical information management and analysis system. London:
Sage.

78
Assessment of Profitability Competitiveness in
Jordanian Banks- A Comparative Study
between Islamic and Conventional Banks
Anan Fathi Srouji Madher Ebrahim
Hamdallah
Al-zaytoonah University Al-zaytoonah University
Jordan Jordan
Abstract:
The study investigated the performance efficiency of conventional banks and Islamic
banks in the Jordan for the period 2011 and 2014. A comparative study of the Islamic and
conventional banks is undertaken based on selected financial ratios as performance indicators.
The collated secondary data derived from the banks’ financial statements are transformed to
percentages and ratios so that comparison can be made between the different banks and periods.
Comparing conventional and Islamic banks results showed significant differences in business
orientation and performance in the areas of ROA and Profit margin. The conventional banks
are more profitable in addition to being better able to effectively generate income by its assets.
However, Islamic banks appeared to be more controlling over its’ income in relation to the
shareholders’ equity than the conventional in 2014. While in relation to the profit margin the
Islamic banks rate was higher than the conventional banks, due to higher expenses pursued by
the conventional banks.
Keywords: Profitability, Return on Assets (ROA), Return on Equity (ROE), Profit
Margin (PM).
1.0 Introduction
Global and boarder less markets, forced banks to adopt innovative strategies to ensure
continuous business improvement. In order to do so banks should satisfy the needs of customers
and meet their high changing expectations. Due to the importance of their financial system and
influence on national economies, banks are highly regulated in most countries. Most nations
have institutionalized a system known as reserve banking called central banks, under which
commercial banks hold liquid assets equal to only a portion of their current liabilities and
deposits them in central banks. Few visionary individuals, scholars, bankers, Islamic
economists, and Shari’ah scholars started Islamic banking system as a universal banking in
1970.
Although Riba-free business transactions were in practice before this, a well-defined
working model for Islamic banking did not exist (Tahir, 2007). Interest-free banking attracted
a lot of attention, this awareness took place because of the emergence of young Muslim
economists (Naqvi, 2011), where Islamic finance proved to be the fastest-growing segment of
the global financial system (Lawal, 2010).
1.1 Research Objectives
The study was designed to evaluate and comparatively analyze the financial performance
of Jordanian Islamic and conventional banks subject to profitability, for the periods 2011 and
2014. The study addressed to contribute in abridging the knowledge gap identified in literature,
regarding Islamic and conventional banks financial performance, especially profitability, in

79
relation to time, so the comparison came to see Islamic and conventional banks performance
after four years of performance in the Jordanian-banking sector.
1.2 Significant of the Study
The competitive performance evaluation of Islamic and conventional banks for the two
periods illustrates the knowledge gap prevailing in literature regarding financial performance
evaluation of Jordanian banks. The research hopes to identify further research issues and
questions pertaining to measurement and mitigation of Islamic bank performance, as it helps
investors identify chances and investment opportunities and in the selecting process among the
banks (Castelli et al., 2006). This study came to evaluate the performance of all the Islamic and
conventional banks in Jordan, and then due a performance comparison between the two groups.
2.0 Literature Review
The efficiency of the banking system has been one of the most important issues in financial
environment. Since their products and services are of an intangible nature, it is hard to measure
their efficiency and competitiveness. Many researchers have attempted to measure the
productivity and efficiency of the banking industry using outputs, costs, efficiency, and
performance. Bank’s performance provides a signal to depositors and investors whether to
invest or to withdraw funds from the bank and whether to buy or sell the bank’s securities.
In addition, regulators also need to know the bank’s performance for regulation purposes.
Moreover, a failure of a single bank creates an economic confusion, and is regarded as an
economy disaster. Bank performance can be studied by either financial or non-financial
perspectives, and for any business to continue it must perform in a successful matter, especially
profitability (Ranti, 2011).
In Jordan ROA ratio ten years ago was approximately 26.9% for the conventional banks
and 14.7% for the Islamic banks (Al-Momany and Srouji, 2007). However, considering the last
4 years trend in ROA, both types of banks are experiencing difficulties in profitability, as in
Matar (2014).
Whereas the average ROE of conventional banks a decade before was 26.96%, compared
with a 14.7% for the Islamic banks (Al-Momany and Srouji, 2007). However, Olson and Zoubi
(2008); and Siraj and Pillai (2012) comparison of the GCC, revealed that conventional banks
were found to be less profitable in relation to ROE, due to higher provisions toward credit losses
and impairment losses, and Islamic banks were more equity financed with a significant
relationship.
While Almazari (2014) added that the increase of assets, operating expense, and cost to
income caused a decrease in Islamic banks profitability in Saudi Arabia, while an increase in
operating income caused an increase in profitability, in relation to both ROA and Profit Margin.
This was also found in Matar (2014) study, based on a comparison research in Jordan.
3.0 Methodology
Based on the previous literature and on common used ratios applied, helped in evaluating
and measuring the financial performance by analyzing the profitability of the banks in Jordan.
In this study, the descriptive statistics will be presented through frequencies and percentages
by summarizing the grouped data using a combination of tabulated description and graphical
description. Coefficient of variance was also calculated by using the standard deviation, as if
the coefficient of variance decreased it would be an indication of high dispersion of data points
around the mean, which leads to consistency, and more homogeneity within the group, which
leads to less risk and better performance in banks (Turen, 1995) and Asif Kan et al. (2015). The
equation is calculated as following:
𝐶. 𝑉. =𝑠
𝜇 ∗ 100

80
Since the main aim of this research was to find the difference between both conventional
and Islamic banks, t-test was used in order to determine any significant difference between the
two groups mean (Malik and Mullen, 1975), by using the following formula:
𝑡 = 𝜇1 − 𝜇2-
√𝑠12+𝑠2
2
𝑛−1
3.1 Explanation of the Ratio Model
By examining the financial statements through ratio analysis, which is considered as an
analytical tool applied by investors and lenders to safeguard their decisions, and also helps in
reflecting the financial performance of an organization (Ho and Wu, 2006).
Financial position, which could be known and clarified by the help of financial ratios, is a
health measurement. In this research, profitability will be used as an evaluating measurement
of financial performance. In this research and based on literature review, financial performance
groups were used to compare the Islamic banks in Jordan with the conventional banks, as
indicated in the research model in figure (1).
3.2 Profitability Ratios
Since profitability is an important issue, as it helps banks understand the current conditions
of the institutes critical factors, which they should consider in making decisions and creating
new policies for either recovery or improvement. The ability to earn profit may be measured in
terms of return on assets, return on equity, and profit margin Hasan et al. (2012) as in this study.
Figure (1)
3.3 Hypothesis
In order to evaluate and analyze the financial performance of the Jordanian Islamic and
conventional banks, and to draw a comprehensive comparison, the following main hypothesis
was tested:
There is a significant difference of the financial performance of Jordanian Islamic and
conventional banks in terms of profitability.
The hypothesis was sub-divided into the following hypotheses:

81
There is a significant difference of the financial performance of Jordanian Islamic and
conventional banks in terms of ROA.
There is a significant difference of the financial performance of Jordanian Islamic and
conventional banks in terms of ROE.
There is a significant difference of the financial performance of Jordanian Islamic and
conventional banks in terms of PM.
3.4 Data Sampling and Statistics
The data had been retrieved from the annual financial reports of all the Jordanian Islamic banks,
for the periods 2011 and 2014. As the year, 2011 was the first full working year of two new
Islamic banks in the market.
4.0 Data Analysis and Discussion
4.1 Profitability
Based on previous literature profitability of the selected Islamic banks in this study was
measured in terms of ROA, ROE, PM, and discussed respectively.
4.1.1 Return on Assets
Table (1) and figure (1), reflects the descriptive results and profitability indicator for the
period 2011 and 2014. The conventional banks mean for both the period 2011 and 2014, was
higher than the Islamic banks. The coefficient of variance for the year conventional banks was
lower than the Islamic banks, which means that they were less risky in terms of ROA. With a
significant difference between the two mean, this means that there is a difference in terms of
ROA between the two groups of banks.
In comparison with the total bank averages during the periods 2011 and 2014, for the
conventional banks was higher than the Islamic banks. In addition also to the mean of both the
conventional and Islamic banks, was also in favor to the conventional banks.
Table (1) ROA for the year 2011 and 2014
ROA Conventional Banks Islamic Banks
2011 0.0121 0.0059
2014 0.0159 0.0106
Mean 0.0138 0.0098
Standard deviation 0.0017 0.0027
Coefficient of variance 0.1266 0.2786
Significance 0.050
Significant at a α ≤ 0.05 level.

82
Figure (1) ROA of Islamic Banks and Total Banks in Jordan
4.1.2 Return on Equity
The previous scenario for ROE changed in comparison with the ROA. As stated in table
(2) and figure (2), the mean of the period 2011 was higher for the conventional banks, then the
amount went in favor toward the Islamic banks for the year 2014. Explanation was due to the
nominator and denominator level. As the Return on equity for the Islamic banks in relation to
the shareholders’ equity was higher than the conventional banks, which maybe a competitive
advantage. In general results did not show a significant difference between the means.
However, while taking a closer look on the risk indicator, it seems that the Islamic banks were
riskier in performance than the conventional banks.
Table (2) ROE for the year 2011 and 2014
ROE Conventional Banks Islamic Banks
2011 0.081 0.066
2014 0.107 0.1101
Mean 0.092 0.100
Standard deviation 0.011 0.023
Coefficient of variance 0.128 0.237
Significance 0.603
Significant at a α ≤ 0.05 level.
Figure (2) ROE of Islamic Banks and Total Banks in Jordan
Conventional Banks
Islamic Banks
0
0.002
0.004
0.006
0.008
0.01
0.012
0.014
0.016
2011 2014
Conventional Banks
Islamic Banks
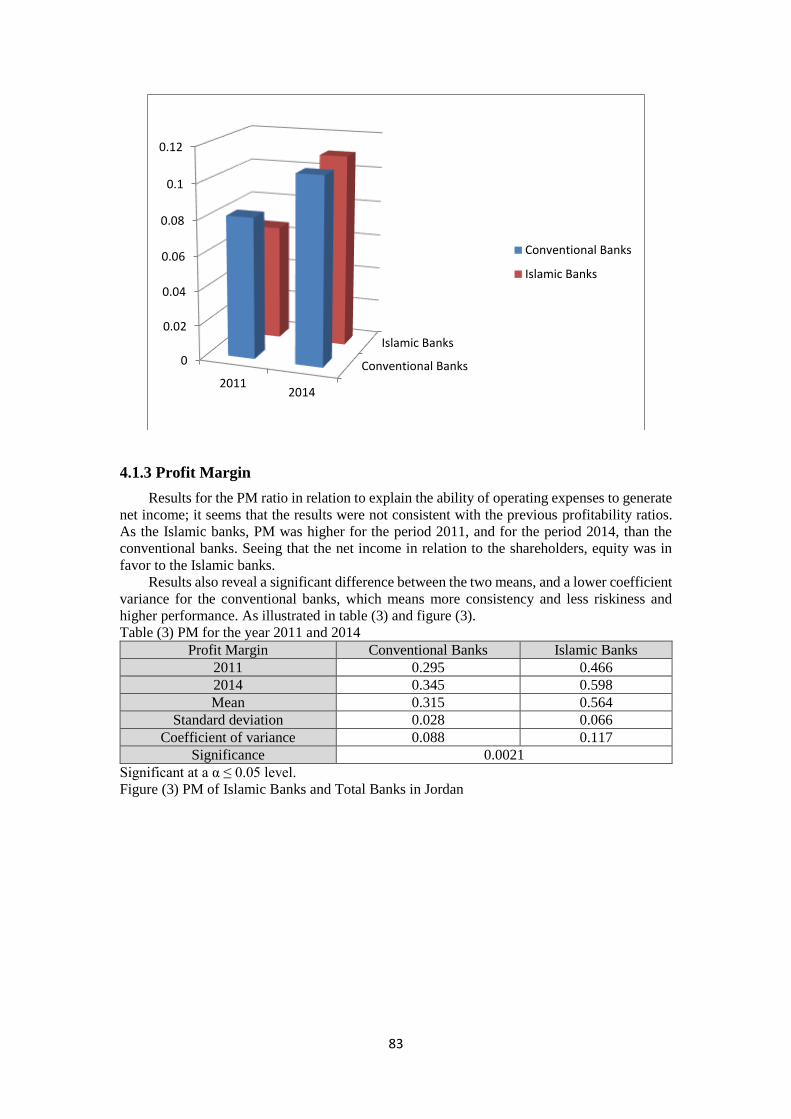
83
4.1.3 Profit Margin
Results for the PM ratio in relation to explain the ability of operating expenses to generate
net income; it seems that the results were not consistent with the previous profitability ratios.
As the Islamic banks, PM was higher for the period 2011, and for the period 2014, than the
conventional banks. Seeing that the net income in relation to the shareholders, equity was in
favor to the Islamic banks.
Results also reveal a significant difference between the two means, and a lower coefficient
variance for the conventional banks, which means more consistency and less riskiness and
higher performance. As illustrated in table (3) and figure (3).
Table (3) PM for the year 2011 and 2014
Profit Margin Conventional Banks Islamic Banks
2011 0.295 0.466
2014 0.345 0.598
Mean 0.315 0.564
Standard deviation 0.028 0.066
Coefficient of variance 0.088 0.117
Significance 0.0021
Significant at a α ≤ 0.05 level.
Figure (3) PM of Islamic Banks and Total Banks in Jordan
Conventional Banks
Islamic Banks
0
0.02
0.04
0.06
0.08
0.1
0.12
20112014
Conventional Banks
Islamic Banks

84
5.0 Summary
The study identified and compared the financial performance of all full-fledged Islamic
banks operating in Jordan, in relation to profitability, then each bank was compared with the
mean of the total working banks in Jordan. Data was retrieved from the financial annual reports
for 2011 and 2014, familiar profitability ratios analysis were applied with descriptive and
inferential statistics for analyzing the results. Empirical results revealed that Jordanian Islamic
banks in the year 2014 were more profitable than the conventional banks in relation to ROE
than the year 2011, while it was higher for the Islamic banks in relation to the profit margin for
both periods. Nevertheless, at the same time the conventional banks assets ability to generate
income was higher for the conventional than the Islamic banks, for both the years 2011 and
2014. For the deviation and coefficient of variance as consistency values also proved that, for
all the profitability ratios, results revealed that the conventional banks were less risky than the
Islamic banks.
6.0 Limitations and Recommendations for Future Research
As the target of this paper was to determine of bank performance based on profitability
indicators, a limitation of the study was based on the limited number of performance ratios.
Moreover, a limitation of comparing the groups in two-year periods, rather than a range, may
affect the results.
For that, it is recommended for future studies to investigate other financial performance
indicators as liquidity and risk, with various ratios. Another recommendation also is to change
the type of banks compared, as Islamic only; or even foreign and local banks.
References:
Almazari, A. A. (2014). Impact of Internal Factors on Bank Profitability: Comparative
Study between Saudi Arabia and Jordan. Journal of Applied Finance & Banking, 4(4),
125-140.
Al-Momany, M. T. & Srouji, A. S. (2007). A Comparative Study between Islamic &
Commercial Banks, Using Financial Ratio Analysis.Al-Manarah Journal for research
and Studies, (Economy and Administrative Sciences), 13(2), 1428.
Conventional Banks
Islamic Banks
0
0.02
0.04
0.06
0.08
0.1
0.12
20112014
Conventional Banks
Islamic Banks
85
Asif Khan, M., Ali, M., & Atif Khan, M. (2015). Gauging Profitability and Liquidity
of Islamic Banks: Evidence from Malaysia and Pakistan. International Journal of
Accounting and Financial Reporting, 5(1), 75-90.
http://dx.doi.org/10.5296/ijafr.v5i1.6865
Castelli, A., Dwyer, J. P., & Hasan, I. (2006). Bank Relationships and Small Firms’
Financial Performance. Federal Reserve Bank of Atlanta Working Paper Series, May.
Hasan, S. A., Subhani, M. I. & Osman, A. (2012). Consumer Criteria for the Selection
of an Islamic Bank: Evidence from Pakistan. International Research Journal of
Finance and Economics, 94.
Ho, T. C. & Wu, S. Y. (2006). Benchmarking Performance Indicators, Bencharking:
An International Journal, 13(1/2), 147-159.
Lawal, Y. (2010). Islamic Economics the Cornerstone of Islamic Banking. Journal of
Economics and Engineering, 4, 95-99.
Tahir, S. (2007). “Islamic Banking Theory and Practice: a Survey and Bibliography
of the 1995-2005 Literature.” Journal of Economic Cooperation, Vol. 28(1), 1-72.
Malik, H. J., & Mullen, K., (1975). Applied Statistics for Business and Economics.
Addition-Wesley, N.Y.
Matar, A. (2014). Analyzing the profitability of Islamic banks versus conventional
banks: Evidence from Jordan. Innovation Management in Business Conference
Proceeding, Al-Zaytoonah University. Amman, Jordan, 21-23. April.
Naqvi S. (2011). Critical Success and Failure Factors of Entrepreneurial Organizations:
Study of SMEs in Bahawalpur. Journal of Public Administration and Governance ,
1(2), 17-22.
Olson, D., & Zoubi, T. A. (2008). Using Accounting Ratios to Distinguish Between
Islamic and Conventional Banks in the GCC Region. The International Journal of
Accounting, 43, 45-65.
Siraj, K., & Pillai, P. (2012). Comparative Study on Performance of Islamic Banks and
Conventional Banks in GCC region. Journal of Applied Finance & Banking, 2(3), 123-
161.
Ranti, U. (2011). Corporate Governance and Financial Performance of Banks: A Study
of Listed Banks in Nigeria. Unpublished doctoral dissertation, Covenant University,
Ota, Ogun State.
Turen S. (1995). Performance and risk analysis of Islamic banks: The case of Bahrain
Islamic Bank. Jounal of King Abdul-Aziz University: Islamic Economics, 7 (1), p. 33.

86
Sustainable Technology Adoption in a violence
context: The Case of Banking Services in the
Republic of Yemen
Munadil K. Faaeq Khaled Al-Qasa
Universiti Utara Malaysia Universiti Utara Malaysia
Malaysia Malaysia
Abstract:
In the context of developed countries and in a few Middle Eastern ones, customers are
already availing themselves of the sustainable banking services in hoards. Contrastingly, in
Yemen, a nation characterized as riddled with violence, studies concerning the banking services
practicability are few and far between. To compound the situation further, majority of the
people in Yemen steer clear of using banking services for their financial needs and this occupies
one of the top issues concerning the country’s economy. Accordingly, this study is an attempt
to reduce the literature gap concerning the factors that affect the Yemeni consumer’s use of
banking services Sustainability. It is important to note that Yemeni consumers are distinct from
those in developed countries in terms of their psychological, cultural and behavioral utilization
of the banking system. Data was collected primarily through questionnaires, which were
distributed among university students, after which it was analyzed through SPSS 17. This is
followed by the hypotheses testing via factor analysis, correlation analysis and regression
analysis. According to the results, the service quality-banking legal framework relationship
significantly and positively impacted behavioral intention toward sustainable in banking
services, except cultural belief. Specifically, cultural had a negative and significant impact in
sustainable of banking system usage in Yemen.
Keywords: Sustainable, behavioural intention, service quality, legal framework, banking
system in Yemen
1. Introduction
A country’s economy is driven by the role of sustainable station of banks. In the current
times, the country’s economic development largely hinges on its sustainable of banking
system’s performance. Banks in general, facilitates the mobilization of savings from the surplus
sectors to the clients through loans in order to ultimately facilitate investments. This process is
brought about in a way that the savings are used for investments. In other words, if people
refrain from using banking services at sustainable way, a great proportion of the economic
capital would just remain untouched (Rosly, 2005). In Yemen’s context, even though the
government is exerting effort to boost the banking sector because of its significance in driving
economic changes, there exists notable deposit shortage. This is because people in Yemen still
refuse to trust the banks with their savings and instead opt for keeping their savings in their
homes. According to the Mayor of Yemen, there exist only 600, 000 bank accounts constituting
2.7% of the country’s population.
Additionally, the annual circulated checks only reach around 500-600 thousand. These
facts were reported by the Malaysian company, SIRIM Berhad in 2010 (Swidi, 2011).
Moreover, according to Al-Mushrqui (2009), majority of the financial transactions occur
outside of commercial banks, indicting the need for an extensive study focusing on the sector
and examining the influencing factors.

87
This motivated the present study to determine the significant factors that influence the
behavioral intention of Yemeni consumers to avail of the banking services Sustainability with
university students as the study sample. This sample was chosen owing to the fact that this
sample’s age range (20-31 years) is deemed to be the largest demographic segment of the
consumers in society (Rugimbana, 2007). This range constitutes a significant population of the
country, numbering approximately 22.2 million people in the year 2007 with an annual growth
rate of 3% (Library of Congress, 2008).
Thus, the present study contributes to literature by providing an insight into the factors
affecting the behavioral intention of Yemeni people towards interaction with banks and keep
the services sustainable. In particular, the present study is an attempt to highlight the awareness
of the variables that could possibly affect this important segment of the Yemeni population to
make sustainable use of banking services. In this regard, according to Khan (2010), a significant
relationship exists between violence and the successful adoption of banking services but as yet,
no clear proof has been provided as to violence’s impact on the adoption of e-services. In the
current times, Yemen’s unbalanced political, economic and social situation calls for the effect
of such violence on its banking services.
2. Literature Review
2.1 Sustainability
Generally, sustainability known as saving something that has been usable for a certain
period of time without having any extra aid to continue its processes (Reynolds & Stinson,
1993). Additionally, Misund and Hoiberg ( 2003) explained sustainable in ICT as
“technology that is capable of being maintained over a long span of time independent of
shifts in both hardware and software”.
2.2 Conflicts types
The global situation is riddled with various types of conflicts, with majority of developing
countries experiencing civil war and violence – for instance, Afghanistan, Burma, India, Iraq,
Myanmar, Nigeria, Pakistan, Philippines, Russia, Somalia, Sri Lanka (HIIK, 2008), Syria
(Pasternak, 2013), and Yemen (Lewis, 2013). It is expected that several more will suffer from
such violence. Specifically, HIIK (2008) estimated that from the 345 war torn conflicts, the
intrastate constitutes the largest proportion while interstate only constitute a small number.
Based on the estimate, around 111 conflicts are taking place in Asia and Oceania, while in
Africa, there are around 79 conflicts, in Europe there are 65, in the Middle East and North
Africa there are 47, and in the Americas, there are estimated 43 conflicts.
Evidently, little effort is required to provide a description of the impacts of civil disorder
on the environment of the country – these include psychological distortion, economical setback,
which in some cases results in the country’s downfall (Pederson, 2002; Landrigan et al., 2004).
Literature concerning information technology has failed to examine the possible inference of
conflicts from the different countries of the world on the successful implementation and use of
technological applications and services (Khan, 2010). However, some studies examined the
impact of organizational conflicts on the technology adoption (Smith and McKeen, 1992). The
impact of organizational conflict invariably affects the technology adoption and could be
compared to the role of civil conflict on e-government adoption.
According to the HIIK (2008), the reasons behind the occurrence of conflict in the
countries include territory, secession, decolonization, autonomy, system/ideology, national
power, predominance of regions, control of resources and international power. Therefore, it
becomes important to evaluate the environmental factors impacting behavioral intention to use
banking services. In other words, it is crucial to examine how violence in Yemen and its
unstable environmental state impact its people’s behavioral intention to use banking services in
the country.

88
2.3 Behavioral Intention
Most studies considered behavioral intention in their studies as a dependent variable (e.g.
Bounding et al., 1993; Zeigthalm, et al., 1996) as it robust in its prediction of human behavior
that is crucial in realizing actual behavior (Zolait, Matilla, and Sulaiman, 2008).
In particular, consumer intention can be any of two ways namely favorable or unfavorable
(Zeithalm, 1996; Ladhari, 2009). The former results in the formation of a bond with the service
provider and the intention to purchase products/services from the provider and hence increase
market share. On the other hand, the latter leads to the potential of brand-switching,
disinclination to purchase, the negative word of mouth (Zeithalm, 1996). Financial success is
largely dependent on the degree to which consumers show favorable behavioral intention
toward buying the services or products (Maiyaki and Mokhtar, 2009). This study examines
three variables as antecedent factors of behavioral intention to avail of banking services in the
context of Yemen. They are service quality, banking legal framework and cultural belief.
2.4 Perceived Service Quality
In banking services, service quality is presently occupying a position of an important
service industry aspect, particularly with the increasing competition (Pont and McQuilken,
2005). It enables banks to achieve a competitive edge over rivals (Pont and McQuilken, 2005).
In this regard, banks services should go over the consumers’ expectations (Amarjit, Falschner
and Shachar, 2006). Additionally, service quality is considered as a success and survival factor
in the banking industry and it has been examined as a major element in the consumer’s intention
to make use of financial services (Patricio, Fisk and Cunha, 2003).
According to majority of studies, poor services are an antecedent to bank-switching of
consumers (Lees, Garland and Wright, 2005). Other studies like Schmidth, Bergsiek, and
Kolesnikova (2008) reported that 40% of customers in the U.S. switched banks because of poor
services. Similarly, Allred and Addams (2000) stated that 50% of their sample study employed
bank switching because of issues in services.
In fact, the relationship between the product/services quality and their use has been
investigated in many studies in literature. Such studies reported quality to play a key factor in
consumer intention (Andronikidis, 2009; Gottllieb, Brown and Drennan, 2011; Lee and Beeler,
2009; Ravichandran, Bhargavi and Kumar, 2010; and Shaharudin, et al., 2011). Moreover, the
positive perceptions of consumers towards service quality have been coupled with intention to
use the services/products offered while a negative perception leads to lack of intention to
purchase such products/services (Kouthouris and Alexandris, 2005).
2.5 Banking Legal Framework
Banking service is deemed to among the top-most susceptible industries to different types
of crises and this explains why the banking sector is deemed to be one of the most highly
regulated sectors, where in which customers and funds of the financial institutions are protected.
This safeguard regulation enhances the confidence of customers and their intention towards
banking services, and attracts potential customers. It is also works towards securing the
depositors’ rights against losses in case of banks foreclosure (Broaddus, 1994). Therefore, the
banking industry is generally described as unstable and its regulation is explained by the
significant roles in the financial system and the concern of consumers (Niemeyer, 2006).
In this regard, although consumer protection has attracted increasing interest all over the
globe, there is a fundamental distinction between consumer protection between developed and
developing nations. In developed nations, consumers have various alternatives and the
authorities are confident of the ability of the market to deliver benefits because of the solid
market mechanism instead of the government regulation (Asher, 1998). Contrastingly, in
developing nations, the environment is characterized as immature and the economy is still in
its early stages of development. In this context, consumers depend more on government
regulations for their asset’s protection (Al-Ghamdi, Sohail and Al-Khaldi, 2007). In Yemeni
banking sector, various challenges has been experienced throughout the years. These challenges
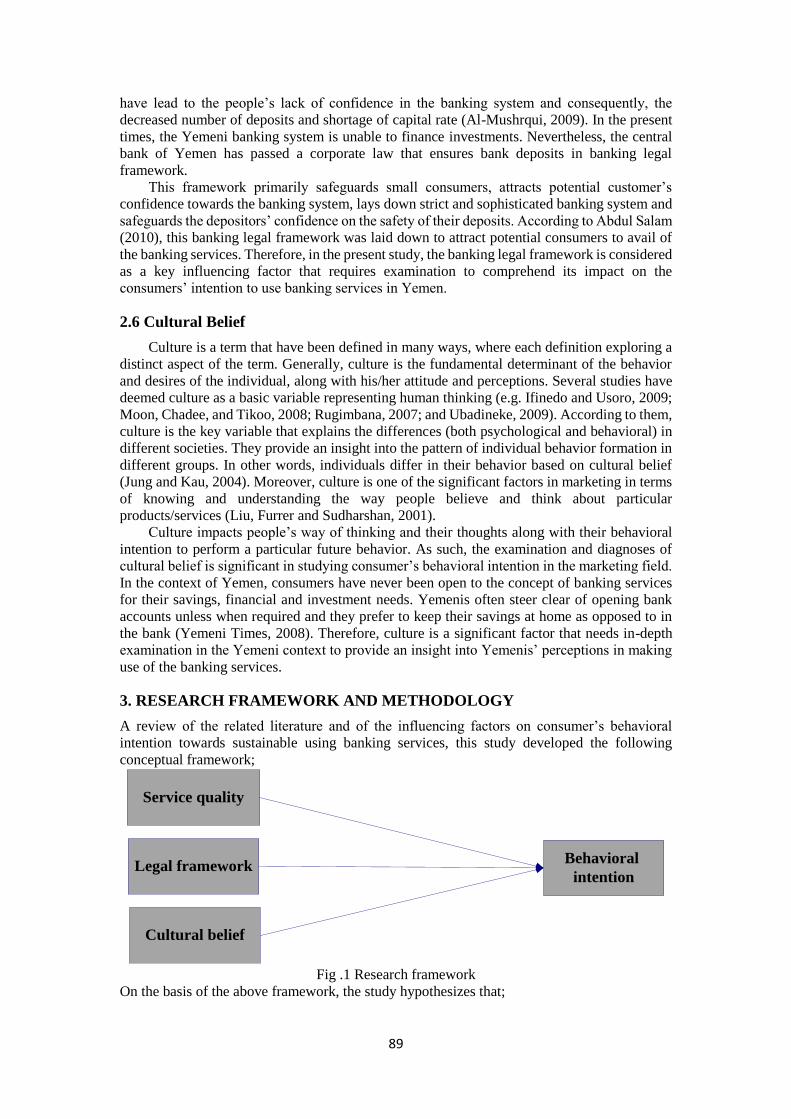
89
have lead to the people’s lack of confidence in the banking system and consequently, the
decreased number of deposits and shortage of capital rate (Al-Mushrqui, 2009). In the present
times, the Yemeni banking system is unable to finance investments. Nevertheless, the central
bank of Yemen has passed a corporate law that ensures bank deposits in banking legal
framework.
This framework primarily safeguards small consumers, attracts potential customer’s
confidence towards the banking system, lays down strict and sophisticated banking system and
safeguards the depositors’ confidence on the safety of their deposits. According to Abdul Salam
(2010), this banking legal framework was laid down to attract potential consumers to avail of
the banking services. Therefore, in the present study, the banking legal framework is considered
as a key influencing factor that requires examination to comprehend its impact on the
consumers’ intention to use banking services in Yemen.
2.6 Cultural Belief
Culture is a term that have been defined in many ways, where each definition exploring a
distinct aspect of the term. Generally, culture is the fundamental determinant of the behavior
and desires of the individual, along with his/her attitude and perceptions. Several studies have
deemed culture as a basic variable representing human thinking (e.g. Ifinedo and Usoro, 2009;
Moon, Chadee, and Tikoo, 2008; Rugimbana, 2007; and Ubadineke, 2009). According to them,
culture is the key variable that explains the differences (both psychological and behavioral) in
different societies. They provide an insight into the pattern of individual behavior formation in
different groups. In other words, individuals differ in their behavior based on cultural belief
(Jung and Kau, 2004). Moreover, culture is one of the significant factors in marketing in terms
of knowing and understanding the way people believe and think about particular
products/services (Liu, Furrer and Sudharshan, 2001).
Culture impacts people’s way of thinking and their thoughts along with their behavioral
intention to perform a particular future behavior. As such, the examination and diagnoses of
cultural belief is significant in studying consumer’s behavioral intention in the marketing field.
In the context of Yemen, consumers have never been open to the concept of banking services
for their savings, financial and investment needs. Yemenis often steer clear of opening bank
accounts unless when required and they prefer to keep their savings at home as opposed to in
the bank (Yemeni Times, 2008). Therefore, culture is a significant factor that needs in-depth
examination in the Yemeni context to provide an insight into Yemenis’ perceptions in making
use of the banking services.
3. RESEARCH FRAMEWORK AND METHODOLOGY
A review of the related literature and of the influencing factors on consumer’s behavioral
intention towards sustainable using banking services, this study developed the following
conceptual framework;
Service quality
Cultural belief
Legal frameworkBehavioral
intention
Fig .1 Research framework
On the basis of the above framework, the study hypothesizes that;

90
H1: There is a positive relationship between perceived service quality and student’s behavioral
intention to use bank services.
H2: There is a positive relationship between banking legal framework and student’s behavioral
intention to use bank services.
H3: There is a significant relationship between cultural belief and student’s behavioral intention
to use bank services.
4. STUDY SAMPLE
The sample comprising of university students, was selected with the help of random
sampling technique and data was collected via questionnaire. From the 850 questionnaires
distributed, 598 were returned, constituting a response rate of 70.4%. According to the results
of the assessment, the respondents had several income ranges with majority of them (39.1%)
earning a monthly income between YR80, 001 and YR100, 000. This is followed by 23.2%
who earned a monthly income between YR60, 001 and 80, 000, 14.9% earned over YR100,
001, and 12.9% of the respondents earned between YR40, 004 and YR60, 000. At the end of
the list is occupied by 5% of the respondents who earned between YR20, 001 and YR40, 000
and 4.8% who earned less than YR20, 000 per month.
As for their age range, 42.1% of the respondents are between 20 and 30 years old. This is
followed by 39.6% of respondents between 31 and 40 years old, 11.5% who are 41 years old
and above, and 6.7% who are under 20 years old. Out of the total respondents, 470 were male
and the remaining 128 were female. At the time of conducting the study, 94.8% of the
respondents were not bank customers while 5.2% were bank customers. The details of the above
demographics are listed in Table 1.
Table 1 Demographic Profiles of the Respondents
Profile Frequency Percentage
Monthly income in Yemeni Riyal (YR)
Less than 20000 29 4.8
20001- 40000 30 5.0
40001-60000 77 12.9
60001-80000 139 23.2
80001-100000 234 39.1
100000- over 89 14.9
Age:
Under 20 years 40 6.7
20 to 30 years 252 42.1
31 to 40 years 237 39.6
41 and above 69 11.5
Gender:
Male 470 78.6
Female 128 21.4
Bank usage
Bank customer 31 5.2
Non-bank customer 567 94.8
All the items were positively stated and were measured with the help of a five-point Likert scale
that ranges from 1 depicting strongly disagree and 5 depicting strongly agree. The Cronbach
alpha result for all the variables was over 0.7 and the items displayed factors loadings higher
than 0.5, indicating measurement validity.

91
5. DATA ANALYSIS
Table 2 presents the correlation results of the study. Based on the table, the values of the
variables are; perceived service quality (r=0.121 with p<0.01), banking legal framework
(r=0.165, with p<0.05) and cultural belief (r=-.190, with p<0.05). The findings show that all
the variables are correlated with behavioral intention in a significant manner.
Table 2 Correlations among summated study variables
Variables DV IV1 IV2
DV- Behavioral intention (BI) 1
IV1- Service quality (SQ) .121** 1
IV2- Banking Legal Framework (BLFW) .165* -.020 1
IV4- Cultural Belief (CB) -.190** -.026 -.607
** Correlation is significant at the 0.01 level (2-tailed).
* Correlation is significant at the 0.05 level (2-tailed).
The components direct impact on intention to sustainable of use banking services was run
through multiple regression analysis. The dimensions listed in Table 3 show that the four
dimensions explained 27.6% of the behavioral intention variance. The standard coefficient beta
of service quality is significant and positive at (β=.091* with p<0.05), indicating support for
hypothesis 1. Similarly, the standard coefficient beta for banking legal framework is (β=.0090*
with p<0.05), which is consistent with hypothesis 2 and for cultural belief, significant beta was
confirmed with a negative sign (β=-.501** with p<0.05) indicating support for hypothesis 3.
Table 3 Summary of Multiple Regression Results
Independent Variables Standardized Coefficient Beta (ß)
Service quality H1 .091*
Legal framework H2 .0090*
Cultural belief H3 -.501**
R² .276
Adjusted R² .272
Sig. F Change 0.000**
F value 75.438
Note: *p < 0.05, ** p < 0.01
Dependent Variable: Behavioral intention (BI)
6. STUDY DISCUSSION
The present study primarily examined behavioral intention toward sustainable use of
banking services, which is considered as the fundamental factor in the actual behavior of
consumers. Studies dedicated to behavioral intention form the source of predicting purchase
intention (Fishbein and Ajzen, 1980). From the results of the present study, it could be deduced
that service quality predicts Yemeni consumers’ intention to interact with the banking system.
Yemeni consumers are very discerning with the banks efficient delivery of services as evident
from the results.

92
Moreover, Yemeni consumers perceive that Yemeni banks are capable of efficient and
timely delivery of sustainable services. When the students perceive that the banks services and
products satisfy their quality expectations, this may result in their behavioral intention to avail
of these services and products. Despite the existence of the positive significant perception, the
consumers may form their decision to interact with the banking system in Yemen on other
variables that could impact their behavioral intention (Al-Hajri, 2008). These may include trust,
protection among others (Esmaili, 2011). This indicates the requirement for more research into
these variables in Yemeni context to shed a light on the consumer’s behavioral intention to avail
of the sustainability of banking services.
Additionally, actual factors prevent consumers from interacting with banks should be kept
into consideration. For instance, the country’s legal framework reflects government
intervention in protecting consumers and it facilitates a confident environment among
consumers for the achievement of economic stability. Several studies have also addressed the
legal framework-behavioral intention relationship (e.g. Chang, 2009; Ferdous and Towfique,
2007; Tsai et al., 2007; and Wirtz et al., 2007).
The importance of legal framework and its effect on behavioral intention shows that the
former can be utilized to promote students’ sustainable use of banking services. On the basis of
the comparison between its influence and the influence of the rest of the variables within the
model (see Table 3), it is clear that it has the lowest influence in behavioral intention prediction.
Nevertheless, this is still a significant result and worthy of future examination.
This weak predictive power of the legal framework in Yemen and its effect on the
behavioral intention of students is related to the experience that Yemeni people went through
in 2006, during which the Yemeni Central Bank declared on of the country’s largest bank’s
liquidity, i.e. the Watani bank. Majority of the depositors to this bank were adversely affected,
after which consumer confidence in financial institutions started to decline. In this case,
consumers perceived the lack of government protection (Elaph Electronic Newspaper, 2008).
According to the final finding of the study, cultural believe significantly related to
behavioral intention toward sustainable of use banking serviceswith (β=.-501** and p<0.01).
The minus sign shows an inverse direction indicating that with increased cultural belief,
behavioral intention to sustainable use banking services decreases. This is supported by Teng
and Laroche’s (2007) result, which stated that culture has a significant and negative impact on
purchase intention of consumers. Some results of cultural factor’s effect on purchase intention
were significantly positive whereas others are significantly negative according to societal
culture. In this regard, Liu and McClure (2001) contended that consumers from various cultures
display various behaviors and intention towards particular services/products.
This may explain why Yemenis are not open to dealing with the banking system and why
they prefer to keep their money in their residences as opposed to availing the banking services
(Al-Adhi, 2009). Moreover, the Yemeni people’s perception of keeping their money with them
and trading in cash develops their confidence psychologically. Cash transactions are conducted
in majority of trade activities, including durable goods (al-Mushrqui, 2009).
It is therefore crucial for Yemeni banks to expend greater efforts to shift people’s attitudes
towards using banking services. However, as things stand, majority of the banks in Yemen,
despite the prevalent Islamic way of life, still deal with interest (reba). This is because Islamic
banks were established in Yemen only in 2008 and currently, there are only four of these banks
in the country (Al-Hamady, 2010).
In comparing the short life of Islamic banks with its counterpart traditional one, it is clear
that Islamic banks have obtained significant market share in the past few years and this shows
that Yemenis are ready to deal with Islamic banks.
7. Contribution of the Study
In the research framework, the results obtained from investigating and analyzing the set of
variables, provide invaluable information to bank managers and practitioners. It is important
for management and practitioners to satisfy students’ expectations regarding to the sustainable
banking services. The results showed that cultural belief is the top most important aspect in the
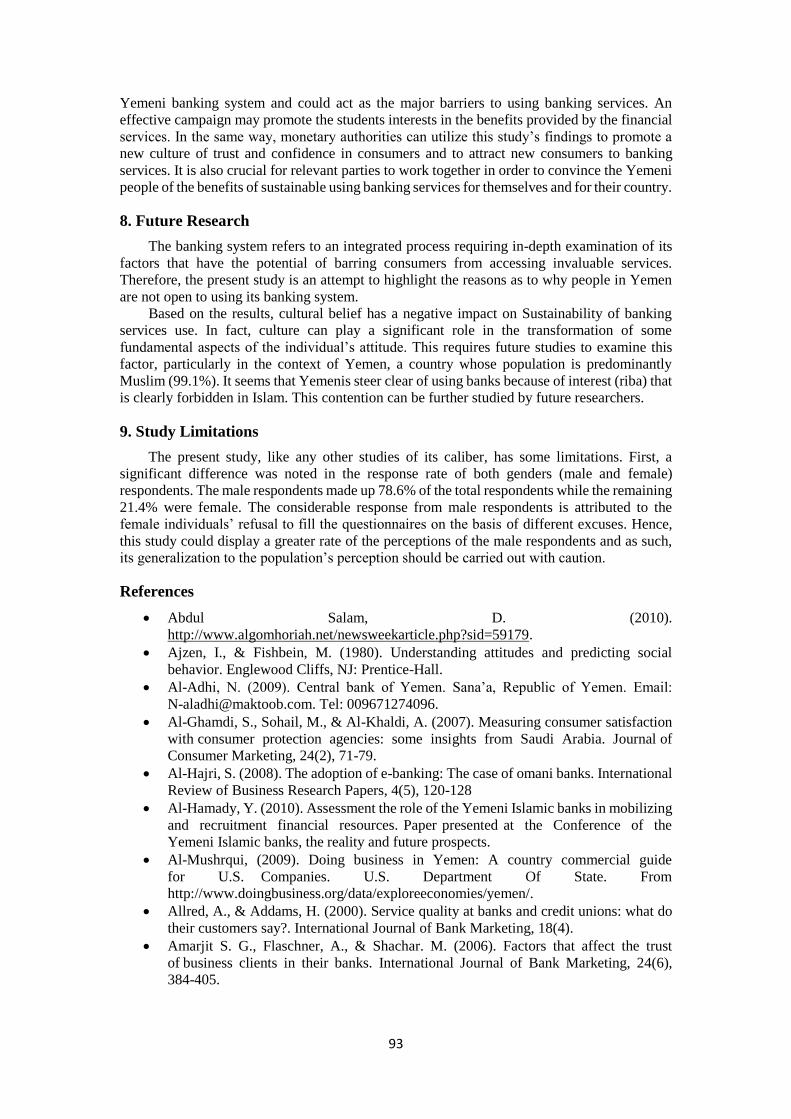
93
Yemeni banking system and could act as the major barriers to using banking services. An
effective campaign may promote the students interests in the benefits provided by the financial
services. In the same way, monetary authorities can utilize this study’s findings to promote a
new culture of trust and confidence in consumers and to attract new consumers to banking
services. It is also crucial for relevant parties to work together in order to convince the Yemeni
people of the benefits of sustainable using banking services for themselves and for their country.
8. Future Research
The banking system refers to an integrated process requiring in-depth examination of its
factors that have the potential of barring consumers from accessing invaluable services.
Therefore, the present study is an attempt to highlight the reasons as to why people in Yemen
are not open to using its banking system.
Based on the results, cultural belief has a negative impact on Sustainability of banking
services use. In fact, culture can play a significant role in the transformation of some
fundamental aspects of the individual’s attitude. This requires future studies to examine this
factor, particularly in the context of Yemen, a country whose population is predominantly
Muslim (99.1%). It seems that Yemenis steer clear of using banks because of interest (riba) that
is clearly forbidden in Islam. This contention can be further studied by future researchers.
9. Study Limitations
The present study, like any other studies of its caliber, has some limitations. First, a
significant difference was noted in the response rate of both genders (male and female)
respondents. The male respondents made up 78.6% of the total respondents while the remaining
21.4% were female. The considerable response from male respondents is attributed to the
female individuals’ refusal to fill the questionnaires on the basis of different excuses. Hence,
this study could display a greater rate of the perceptions of the male respondents and as such,
its generalization to the population’s perception should be carried out with caution.
References
Abdul Salam, D. (2010).
http://www.algomhoriah.net/newsweekarticle.php?sid=59179.
Ajzen, I., & Fishbein, M. (1980). Understanding attitudes and predicting social
behavior. Englewood Cliffs, NJ: Prentice-Hall.
Al-Adhi, N. (2009). Central bank of Yemen. Sana’a, Republic of Yemen. Email:
[email protected]. Tel: 009671274096.
Al-Ghamdi, S., Sohail, M., & Al-Khaldi, A. (2007). Measuring consumer satisfaction
with consumer protection agencies: some insights from Saudi Arabia. Journal of
Consumer Marketing, 24(2), 71-79.
Al-Hajri, S. (2008). The adoption of e-banking: The case of omani banks. International
Review of Business Research Papers, 4(5), 120-128
Al-Hamady, Y. (2010). Assessment the role of the Yemeni Islamic banks in mobilizing
and recruitment financial resources. Paper presented at the Conference of the
Yemeni Islamic banks, the reality and future prospects.
Al-Mushrqui, (2009). Doing business in Yemen: A country commercial guide
for U.S. Companies. U.S. Department Of State. From
http://www.doingbusiness.org/data/exploreeconomies/yemen/.
Allred, A., & Addams, H. (2000). Service quality at banks and credit unions: what do
their customers say?. International Journal of Bank Marketing, 18(4).
Amarjit S. G., Flaschner, A., & Shachar. M. (2006). Factors that affect the trust
of business clients in their banks. International Journal of Bank Marketing, 24(6),
384-405.

94
Andronikidis, A. (2009) Linking dimensions of perceived service quality to actual
purchase behaviour, EuroMed Journal of Business, 4(1), 4 – 20.
Asher, A. (1998). Going global: a new paradigm for consumer protection. The Journal
of Consumer Affairs, 32(2), 183-203.
Bae, S. W., & Choi, H. Y. (2001). The impact of magazine credibility and the degree
of information processing on advertising effectiveness. Journal of Advertising, 5461-
5466.
Broaddus, A. (1994). Choices in banking policy. Federal Reserve Bank of
Richmond Economic Quarterly, (80), 1-9.
Chan, R.Y. (2004). Consumer responses to environmental advertising in China.
Marketing Intelligence & Planning, 22(4), 427-437.
Chang, C. (2009). Consumers’ adoption of online financial services: the case of
Taiwan. Doctoral dissertation. Alliant International University.
Elaph Electronic Newspaper. (2008). End the services of 300 employees in the National
Bank of Yemen. Retrieved July 2, 2008, from
http://www.elaph.com/Web/Webform/SearchArticle.aspx?ArticleId=132567§ion
archive=Economics
Ennew, C., Watkins, T., & Wright M. (1995). Marketing financial services.
Oxford, Heinemann.
Esmaili, E., Desa, M., Moradi, H., & Hemmati, A. (2011). The role of trust
and other behavioral intention determinants on intention toward using internet
banking. International Journal of Innovation, Management and Technology, 2(1), 95-
100.
Ferdous, A. & Towfique, B. (2007) Consumer sentiment towards marketing in
Bangladesh: The relationship between attitudes to marketing, satisfaction and
regulation. Marketing Intelligence & Planning,26(5), 481-495.
Misund, G., & Hoiberg, J. (2003). Sustainable information technology for global
sustainability.Digital Earth. Information Resources for Global Sustainability
Symposium. Retrieved from http://www.ia.hiof.no/ ∼ gunnarmi/omd/dig_earth_03/
Reynolds, J., & Stinson, W. (1993). Sustainability analysis. Paper presented at the
Primary Healthcare Management Advancement Programme.
.

95
Factors influence Sustainability of E-
Government Services in Most Dangerous
Country in the World
Alaa K.Faieq Dr. Munadil Khaleel Faaeq Al-
Sammarraie
Baghdad University Universiti Utara Malaysia
Iraq Malaysia
Abstract:
Electronic government (EG) is a computer applications used in the governing activities
and operations of a government; whereby both the government and the public interact transact
electronically. Iraq being tagged as a conflicting area has received lesser related studies on
practicability of EG. Variables like infrastructure, social factors, security, habit, users behavior
and the more are to be determined majorly effecting the sustainability of EG as a technological
and psychological packages. With the theoretical perspectives of the Unified Theory of
Acceptance and Use of Technology2 (UTAUT2). This study is aimed at investigating the
related variables that could mitigate the sustainability of EG in most dangerous country in the
world. This study propose to quantitatively examine the usage behavior (sustainability) of EG
in Iraq, with that, data were gathered from Iraq being a dangerous and violence zone in the
Middle East and the world. Additionally, the findings limitations of our study are discussed.
Keywords: Information system, Electronic Government, Application, Unified Theory of
Acceptance and Use of Technology.
Introduction
Electronic government (EG) is an electronic application with the main orientation of
serving beneficiaries faster and wider than the traditional governmental settings can offer. Khan
(2010) posited that there is a significant affection between crisis and the success adoption of
EG services in the Arab homeland, but still there is no explicit proof on whether civil war,
crisis, and violence can affect the adoption EG services. The present rowdy and unbalance
nature of Iraq therefore necessitate the effort to examine what effect of the dangerous and
conflict environment could contribute to the adoption of EG in Iraq as a most dangerous country
in the world (Top 10 Most Dangerous Countries in the World). Scores of studies have employed
UTAUT and UTAUT2 to achieve similar objective, but none has implemented UTAUT2 to the
adoption of EG in public agencies and particularly in a deranged and conflicted country like
Iraq.
In that purpose, this study adopt the theoretical perception of UTAUT2 to examine the
adoptability of UTAUT2 in Iraq and in that course, will elaborately explain the type of conflicts
and the vulnerability of EG services to the types of conflicts in Iraq.
Dangerous and Conflicts environments
Nowadays, many countries facing unstable environment in general. Iraq is one of these
countries. Currently Iraq accounted as a most dangerous country in the world (Top 10 Most

96
Dangerous Countries in the World). Iraq suffered from dangerous and conflict environment
from few years. Additionally, Pedersen (2002) explain that the world is increasingly witnessing
different types of conflicts, several numbers of developing countries are burning from the
flames of civil war and riots (HIIK 2008). Reportedly, several more are still going to witness
the burning. HIIK (2008) estimated that among the 345 conflicts and crisis ongoing globally,
the intrastate amounted for the largest and interstate attract a very minor number, as showed in
Table 1.
Table 1: Conflicts forms in all over the world and location.
Conflicts forms in all over the world Conflicts located in
111 Asia and Oceania
79 Africa
65 Europe
47 Middle East and Maghreb
43 Americas
Obviously it takes little effort to describe the consequence of civil disorder on country’s
environment, mass psychological distortion, economical setback, and sometimes lead to total
downfall of the country (state of emergency) (Pedersen 2002; Landrigan, Lioy et al. 2004).
Invariably, the influence of organizational conflict on the adoption of technology is
transmissible and could be potentially similar to kind of role civil conflict plays on electronic
government adoption. Currently, Iraq facing a real risky environment has with thousands of
fatalities (see Table 2).
Table 2 Total Estimated Iraqi Civilian Fatalities, by Year.
Year Fatalities
2003 7,30
2004 16,800
2005 20,200
2006 34,500
2007 23,600
2008 6,400
2009 3,000
2010 2,500
2011 1,578
Electronic Government in Iraq
In general, Iraq facing huge problems in many fields such as education, sciences, healthy,
and electronic services (James A. Wall., 1995; Pascal C. Sanginga, Kamugisha et al., 2007;
K.Faaq, Ismail et al., 2009). Iraq is currently within an aftermath of war, even with the
conspicuous consequence of the war from the length and breadth of the country, Iraq
government is aiming at developing the country’s infrastructure under which electronic
government is enlisted (James A. Wall 1995; UN & ESCWA 2007). Through this, the
government dream of citizenry transactions with the governmental services to be done
electronically, while the serves can be accessed throughout the country widely and timely. The
EG will transform the traditional access and transaction of governmental services through portal
where everyone can logon anywhere and anytime. Logically, besides the technical
(infrastructure) and financial needs to determine the success of such project, there are still some
social impediments that can still hinder the practicability of EG in Iraq, some of them are
investigating the adoptability EG by the people of Iraq. Alongside, there is a limited research
on the effects of risky and civil conflicts on adoption of technology and in particular E-G
services (Khan, Moon et al. 2010). In corroborating with the claims of Almutiri (2007) some
factors dictate the success and the failure of technology implementation, and these factors used
to be identified explicitly (Chris 1957), hence this study is oblige to examine the factors that
97
inform the success and the failure of EG services in the most dangerous country in the world
(see Table 2).
Original Unified Theory of Acceptance and Use of Technology
Venkatesh et al. (2003) conducted a study to compare the similarities and differences
among prior theories and models of user acceptance to formulate Unified Theory of Acceptance
and Use Technology (UTAUT). This study of comparison included the technology acceptance
model (TAM) (Davis et al., 1989), theory of planned behaviour (TPB) (Ajzen, l99l), theory of
reasoned action (TRA) (Ajzen & Fishbein, 1975), the combination of TAM and TPB (C-
TAM-TPB) (Taylor & Todd, 1995), model of PC utilization (MPCU) (Thompson et al., l99l),
innovation diffusion theory (IDT) (Rogers, 2003), social cognitive theory (SCT) (Compeau &
Higgins, 1995), and motivational model (MM) (Davis et al., l992). Unified Theory
Acceptance and Use Technology (UTAUT) have four constructs to predict users’ behavioural
intention and behaviour of use, namely: (a) performance expectancy, (b) effort expectancy, (c)
social influence, and (d) facilitating conditions (Venkatesh et al., 2003). The relationships
between these constructs, behaviour intention and behaviour of use are moderated by four key
factors i.e. age, gender, voluntariness, and experience (Venkatesh et al., 2003). The following
Figure 3.10 shows the UTAUT diagram.
Unified Theory of Acceptance and Use of Technology Two in Context:
The aim of this study is to explore the theoretical perspective of UTUAT2 in the context of a
dangerous zone. The adoption of EG would be examined in while employing the theoretical
elements of UTAUT2 to set the paradigm of the examination (Venkatesh et al., 2012). Further
noted that examining theories in new contexts can result new opportunities for the creation of
new knowledge (Alvesson & Karreman 2007). Moreover, (UTAUT2) has seven constructs to
predict users’ behavioural intention and use behaviour, namely: (a) performance expectancy,
(b) effort expectancy, (c) social influence, (d) facilitating conditions (e) hedonic motivation, (f)
price value, and (g) habit (Venkatesh et al., 2012). The relationships between these constructs,
behaviour intention and behaviour of use are moderated by three key factors i.e. age, gender,
and experience (Venkatesh et al., 2003). The following Figure (1) shows the UTAUT2 diagram.
Among other technology adoption and acceptance model, UTAUT2 is the most complex model
that combines the elements of other models to present a more appropriate adoptable model for
the purpose of this study. UTAUT2 has been adopted in bounties of researches that tend to be
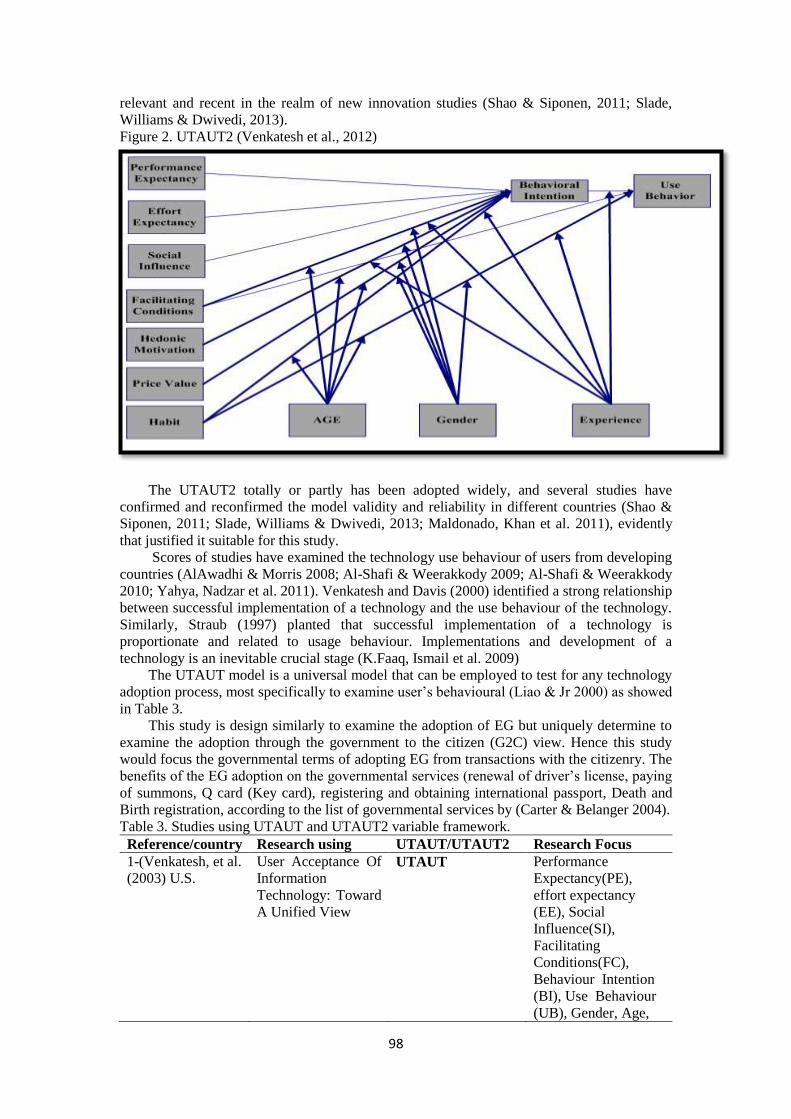
98
relevant and recent in the realm of new innovation studies (Shao & Siponen, 2011; Slade,
Williams & Dwivedi, 2013).
Figure 2. UTAUT2 (Venkatesh et al., 2012)
The UTAUT2 totally or partly has been adopted widely, and several studies have
confirmed and reconfirmed the model validity and reliability in different countries (Shao &
Siponen, 2011; Slade, Williams & Dwivedi, 2013; Maldonado, Khan et al. 2011), evidently
that justified it suitable for this study.
Scores of studies have examined the technology use behaviour of users from developing
countries (AlAwadhi & Morris 2008; Al-Shafi & Weerakkody 2009; Al-Shafi & Weerakkody
2010; Yahya, Nadzar et al. 2011). Venkatesh and Davis (2000) identified a strong relationship
between successful implementation of a technology and the use behaviour of the technology.
Similarly, Straub (1997) planted that successful implementation of a technology is
proportionate and related to usage behaviour. Implementations and development of a
technology is an inevitable crucial stage (K.Faaq, Ismail et al. 2009)
The UTAUT model is a universal model that can be employed to test for any technology
adoption process, most specifically to examine user’s behavioural (Liao & Jr 2000) as showed
in Table 3.
This study is design similarly to examine the adoption of EG but uniquely determine to
examine the adoption through the government to the citizen (G2C) view. Hence this study
would focus the governmental terms of adopting EG from transactions with the citizenry. The
benefits of the EG adoption on the governmental services (renewal of driver’s license, paying
of summons, Q card (Key card), registering and obtaining international passport, Death and
Birth registration, according to the list of governmental services by (Carter & Belanger 2004).
Table 3. Studies using UTAUT and UTAUT2 variable framework.
Reference/country Research using UTAUT/UTAUT2 Research Focus
1-(Venkatesh, et al.
(2003) U.S.
User Acceptance Of
Information
Technology: Toward
A Unified View
UTAUT Performance
Expectancy(PE),
effort expectancy
(EE), Social
Influence(SI),
Facilitating
Conditions(FC),
Behaviour Intention
(BI), Use Behaviour
(UB), Gender, Age,

99
Experience,
Voluntarines of use.
2-Yu-Lung et al.
(2007)
(Taiwan)
Using UTAUT to
explore the
behaviour of 3G
mobile
communication users
UTAUT PE, EE, SI, FC, Use
behaviour, Gender,
Age, experience,
voluntariness of use,
level of education
Intention to Use.
3-Chiu and Wang,
(2008)
( Taiwan)
Understanding Web-
based learning
continuance
intention: The role of
subjective task value
UTAUT PE, EE, SI ,FC,
computer self-
efficacy, Attainment
value, utility
value,intrinsic,
anxiety, (CI)
4- Liu, G., et al.
(2008)
(China)
User acceptance of
Internet banking in
an uncertain and
risky environment
UTAUT Self-efficacy (SF)
perceived risk (PR)
Locus of control(C)
perceived
uncertainty (UC)
system quality (SQ)
information quality
(IQ (
service quality(VQ),
PE
5-Al-Shafi and
Weerakkody,
(2009) (Qatar)
Understanding
Citizens'
Behavioural
Intention In The
Adoption Of E-
Government
Services In The State
Of Qatar
UTAUT PE, EE, SI,
Behavioural Intention
to Use eG, Gender,
Age, Internet
6-Wang and Shih,
(2009) ( Taiwan)
Why do people use
information kiosks?
A validation of the
Unified Theory of
Acceptance and Use
of Technology
UTAUT PE, EE, SI, FC, UB,
Gender, Age, BI.
7-Al-Shafi and
Weerakkody
(2010) (Qatar)
Factors Affecting E-
Government
Adoption In The
State Of Qatar
UTAUT PE, EE, SI, FC, Trust
of the Internet, Trust
of Intermediary (BI)
and Use Behaviour
8-Yahya et
al.(2011)
(Malaysia)
Determinants of
UTAUT in
Measuring User
Acceptance of E-
Syariah Portal in
Syariah Courts in
Malaysia
UTAUT PE, EE, SI, BI, Actual
Usage(AU)
9-Al-Sobhi et al.
(2011) (Saudi
Arabia)
The Roles Of
Intermediaries In E-
Government
Adoption: The Case
Of Saudi Arabia
UTAUT PE, EE, SI, FC, Trust
of the
Internet, Trust of
Intermediary, (BI)
and Use Behaviour
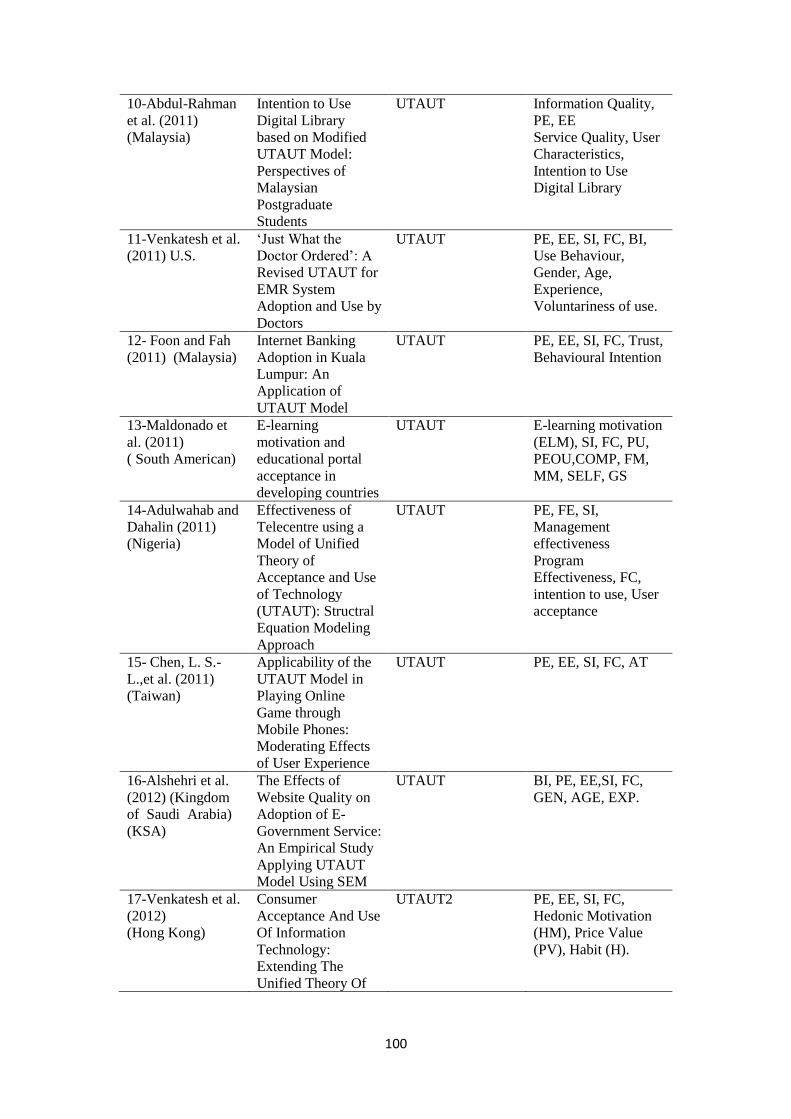
100
10-Abdul-Rahman
et al. (2011)
(Malaysia)
Intention to Use
Digital Library
based on Modified
UTAUT Model:
Perspectives of
Malaysian
Postgraduate
Students
UTAUT Information Quality,
PE, EE
Service Quality, User
Characteristics,
Intention to Use
Digital Library
11-Venkatesh et al.
(2011) U.S.
‘Just What the
Doctor Ordered’: A
Revised UTAUT for
EMR System
Adoption and Use by
Doctors
UTAUT PE, EE, SI, FC, BI,
Use Behaviour,
Gender, Age,
Experience,
Voluntariness of use.
12- Foon and Fah
(2011) (Malaysia)
Internet Banking
Adoption in Kuala
Lumpur: An
Application of
UTAUT Model
UTAUT PE, EE, SI, FC, Trust,
Behavioural Intention
13-Maldonado et
al. (2011)
( South American)
E-learning
motivation and
educational portal
acceptance in
developing countries
UTAUT E-learning motivation
(ELM), SI, FC, PU,
PEOU,COMP, FM,
MM, SELF, GS
14-Adulwahab and
Dahalin (2011)
(Nigeria)
Effectiveness of
Telecentre using a
Model of Unified
Theory of
Acceptance and Use
of Technology
(UTAUT): Structral
Equation Modeling
Approach
UTAUT PE, FE, SI,
Management
effectiveness
Program
Effectiveness, FC,
intention to use, User
acceptance
15- Chen, L. S.-
L.,et al. (2011)
(Taiwan)
Applicability of the
UTAUT Model in
Playing Online
Game through
Mobile Phones:
Moderating Effects
of User Experience
UTAUT PE, EE, SI, FC, AT
16-Alshehri et al.
(2012) (Kingdom
of Saudi Arabia)
(KSA)
The Effects of
Website Quality on
Adoption of E-
Government Service:
An Empirical Study
Applying UTAUT
Model Using SEM
UTAUT BI, PE, EE,SI, FC,
GEN, AGE, EXP.
17-Venkatesh et al.
(2012)
(Hong Kong)
Consumer
Acceptance And Use
Of Information
Technology:
Extending The
Unified Theory Of
UTAUT2 PE, EE, SI, FC,
Hedonic Motivation
(HM), Price Value
(PV), Habit (H).
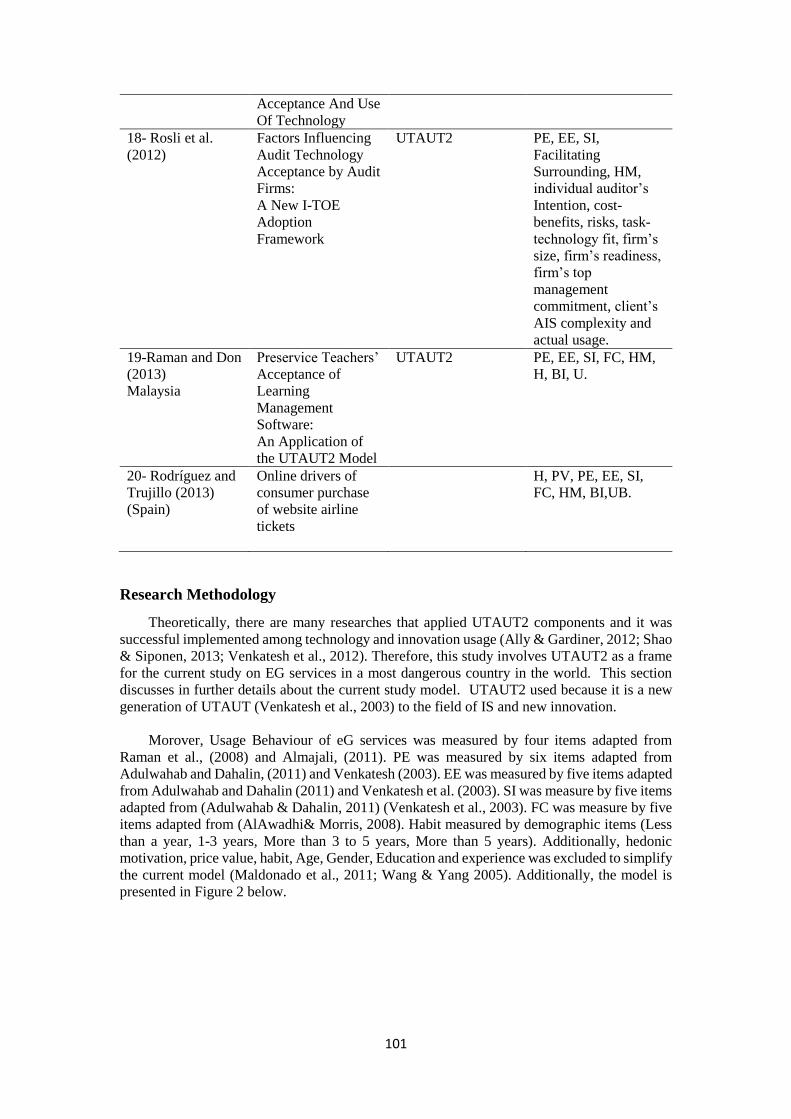
101
Acceptance And Use
Of Technology
18- Rosli et al.
(2012)
Factors Influencing
Audit Technology
Acceptance by Audit
Firms:
A New I-TOE
Adoption
Framework
UTAUT2 PE, EE, SI,
Facilitating
Surrounding, HM,
individual auditor’s
Intention, cost-
benefits, risks, task-
technology fit, firm’s
size, firm’s readiness,
firm’s top
management
commitment, client’s
AIS complexity and
actual usage.
19-Raman and Don
(2013)
Malaysia
Preservice Teachers’
Acceptance of
Learning
Management
Software:
An Application of
the UTAUT2 Model
UTAUT2 PE, EE, SI, FC, HM,
H, BI, U.
20- Rodríguez and
Trujillo (2013)
(Spain)
Online drivers of
consumer purchase
of website airline
tickets
H, PV, PE, EE, SI,
FC, HM, BI,UB.
Research Methodology
Theoretically, there are many researches that applied UTAUT2 components and it was
successful implemented among technology and innovation usage (Ally & Gardiner, 2012; Shao
& Siponen, 2013; Venkatesh et al., 2012). Therefore, this study involves UTAUT2 as a frame
for the current study on EG services in a most dangerous country in the world. This section
discusses in further details about the current study model. UTAUT2 used because it is a new
generation of UTAUT (Venkatesh et al., 2003) to the field of IS and new innovation.
Morover, Usage Behaviour of eG services was measured by four items adapted from
Raman et al., (2008) and Almajali, (2011). PE was measured by six items adapted from
Adulwahab and Dahalin, (2011) and Venkatesh (2003). EE was measured by five items adapted
from Adulwahab and Dahalin (2011) and Venkatesh et al. (2003). SI was measure by five items
adapted from (Adulwahab & Dahalin, 2011) (Venkatesh et al., 2003). FC was measure by five
items adapted from (AlAwadhi& Morris, 2008). Habit measured by demographic items (Less
than a year, 1-3 years, More than 3 to 5 years, More than 5 years). Additionally, hedonic
motivation, price value, habit, Age, Gender, Education and experience was excluded to simplify
the current model (Maldonado et al., 2011; Wang & Yang 2005). Additionally, the model is
presented in Figure 2 below.

102
Figure 2: Research Framework of sustainability of EG.
Research Hypotheses Development
The current research model was examined in this study was shown in Fig. 2. According to the
UTAUT2, performance expectancy, effort expectancy, social influence, facilitating conditions
and Habit are hypothesized to be the determinants of usage behavioural in the context of EG
services in risky environment. The current research hypotheses are shown below. Moreover, all
of the variables and hypotheses in the current model are proposed based on the UTAUT2.
H1. Performance expectancy has a positive effect on sustainable (usage behaviour) of EG
services.
H2. Effort expectancy has a positive effect on sustainable (usage behaviour) of EG services.
H3. Social influence has a positive effect on sustainable (usage behaviour) of EG services.
H4. Facilitating conditions have a positive influence on sustainable (usage behaviour) of EG
services.
H5. Habit has a positive influence on sustainable (usage behaviour) of EG services.
Population and Sampling that proposed to Implementation UTAUT2:
The study will focus on the (G2C) services mainly, covering the range of all government
services, such as social, economical, and the rest in the specific context of dangerous zone. Iraq
citizenry from different levels of demographical features would therefore be surveyed for the
purpose of this study. Additionally, this study included 75 valid questionnaires from responds
from three regions in Iraq (south, middle and north) equally.
7.1 Sampling Profile
The final data sample included the staff (lecturers and administers) in public universities.
The sampling profile showed that the sample is a representative of the studied population.
Following discussion the distribution of the respondents according to the demographic variable
(such as: AGE, GEN, EDU, INC and EXP). Moreover, differences and uneven of results among
differences between male and female in daily life, several levels of age, families and individual
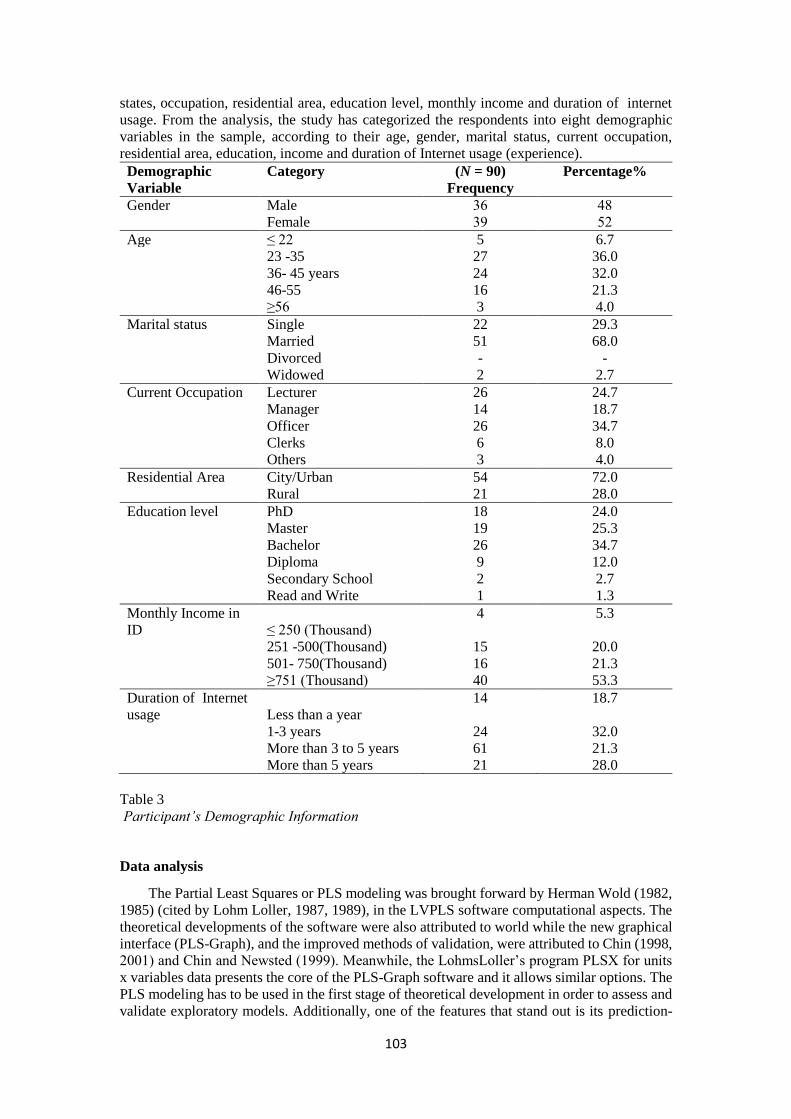
103
states, occupation, residential area, education level, monthly income and duration of internet
usage. From the analysis, the study has categorized the respondents into eight demographic
variables in the sample, according to their age, gender, marital status, current occupation,
residential area, education, income and duration of Internet usage (experience).
Demographic
Variable
Category (N = 90)
Frequency
Percentage%
Gender Male 36 48
Female 39 52
Age ≤ 22 5 6.7
23 -35 27 36.0
36- 45 years 24 32.0
46-55 16 21.3
≥56 3 4.0
Marital status Single 22 29.3
Married 51 68.0
Divorced - -
Widowed 2 2.7
Current Occupation Lecturer 26 24.7
Manager 14 18.7
Officer 26 34.7
Clerks 6 8.0
Others 3 4.0
Residential Area City/Urban 54 72.0
Rural 21 28.0
Education level PhD 18 24.0
Master 19 25.3
Bachelor 26 34.7
Diploma 9 12.0
Secondary School 2 2.7
Read and Write 1 1.3
Monthly Income in
ID ≤ 250 (Thousand)
4 5.3
251 -500(Thousand) 15 20.0
501- 750(Thousand) 16 21.3
≥751 (Thousand) 40 53.3
Duration of Internet
usage Less than a year
14 18.7
1-3 years 24 32.0
More than 3 to 5 years 61 21.3
More than 5 years 21 28.0
Table 3
Participant’s Demographic Information
Data analysis
The Partial Least Squares or PLS modeling was brought forward by Herman Wold (1982,
1985) (cited by Lohm Loller, 1987, 1989), in the LVPLS software computational aspects. The
theoretical developments of the software were also attributed to world while the new graphical
interface (PLS-Graph), and the improved methods of validation, were attributed to Chin (1998,
2001) and Chin and Newsted (1999). Meanwhile, the LohmsLoller’s program PLSX for units
x variables data presents the core of the PLS-Graph software and it allows similar options. The
PLS modeling has to be used in the first stage of theoretical development in order to assess and
validate exploratory models. Additionally, one of the features that stand out is its prediction-

104
oriented research in which the methodology is invaluable for researchers to concentrate on the
endogenous constructs explanation. Moreover, all items are measured using a seven-point scale.
The PLS path modeling approach is generally utilized to estimate causal relationships in
the field of path models that entail latent constructs indirect measurement by various indicators.
Prior studies conducted by Wold (1982), Lohmoller (1989), Chin (1989), Tenenhaus, Vinzi,
Chatelin and Lauro (2005) were dedicated to explaining the methodological basis and
approaches for outcome evaluation and they offered some methodological examples.
Testing the Measurement Model, Outer Model, Using PLS Approach
Prior to hypotheses testing, the measurement model, the outer model was assessed with
the help of the Partial Least Squares Structural Equation Modeling (PLS-SEM) methods. As
such, the present study employed the two-stage approach recommended by Anderson and
Gerbing (1988). The study model is presented in Figure 3 with its structural dimensions.
Figure 3
Path analysis result after deleting the items bellow 0.7
7.2 The Content Validity
The measure’s content validity is the degree to which the items produced to measure a
construct is capable of measuring the concept they are designed to measure (Hair et al., 2010).
Specifically stating, the items that were designed to measure a construct should present a higher
loading on their construct compared to other constructs. The researcher made sure of this by
conducting a comprehensive literature review to produce items whose validity is already tested
and established by other studies. On the basis of factor analysis, constructs items and the results
are presented in Table 4 and Table 5. In these Tables, the content validity of items and their
measures are listed in two ways. First, the items present high loading on their respective
constructs in comparison to other constructs and second, the items loadings significantly loaded
on their constructs and this confirms the content validity of the measures as displayed in Table
4 (Chow & Chan, 2008).
EE FC PE SI UB
EECe1 0.800 0.423 0.413 0.216 0.529

105
EECe2 0.738 0.364 0.357 0.157 0.523
EECe3 0.801 0.381 0.332 0.127 0.558
EECe4 0.831 0.517 0.524 0.395 0.687
EECe5 0.785 0.613 0.412 0.257 0.638
FCCf1 0.525 0.858 0.327 0.291 0.514
FCCf2 0.354 0.798 0.121 0.260 0.375
FCCf3 0.385 0.705 0.045 0.197 0.286
FCCf4 0.588 0.866 0.401 0.263 0.604
FCCf5 0.488 0.843 0.162 0.298 0.429
PECd1 0.411 0.278 0.897 0.544 0.579
PECd2 0.476 0.195 0.849 0.550 0.555
PECd3 0.437 0.248 0.712 0.390 0.495
PECd5 0.411 0.259 0.853 0.418 0.560
SICa2 0.250 0.418 0.404 0.800 0.292
SICa4 0.235 0.104 0.520 0.808 0.298
UBCh1 0.606 0.532 0.574 0.231 0.849
UBCh2 0.667 0.415 0.672 0.410 0.913
UBCh3 0.707 0.501 0.558 0.335 0.861
UBCh4 0.493 0.449 0.351 0.228 0.687
Table 4
Significance of the factor loading
Construct Items
Factor
Loadings
Standard
Error T Value
Effort Expectancy EECe1 0.800 0.048 16.625
EECe2 0.738 0.080 9.203
EECe3 0.801 0.063 12.625
EECe4 0.831 0.026 32.321
EECe5 0.785 0.049 15.998
Facilitating Conditions FCCf1 0.858 0.030 28.207
FCCf2 0.798 0.075 10.668
FCCf3 0.705 0.106 6.658
FCCf4 0.866 0.024 35.732
FCCf5 0.843 0.041 20.528
Performance Expectancy PECd1 0.897 0.023 39.428
PECd2 0.849 0.066 12.942
PECd3 0.712 0.098 7.295
PECd5 0.853 0.036 23.977
Social Influence SICa2 0.800 0.139 5.754
SICa4 0.808 0.133 6.063
UBCh1 0.849 0.033 25.409
UBCh2 0.913 0.017 54.738
UBCh3 0.861 0.032 26.668
UBCh4 0.687 0.109 6.323

106
Table 5
The Convergent Validity Analysis
Construct Items
Factor
Loadings
Cronbach's
Alpha
composite
Reliability AVE
Effort Expectancy EECe1 0.800 0.852 0.893 0.627
EECe2 0.738
EECe3 0.801
EECe4 0.831
EECe5 0.785
Facilitating Conditions FCCf1 0.858 0.876 0.908 0.666
FCCf2 0.798
FCCf3 0.705
FCCf4 0.866
FCCf5 0.843
Performance Expectancy PECd1 0.897 0.847 0.898 0.690
PECd2 0.849
PECd3 0.712
PECd5 0.853
Social Influence SICa2 0.800 0.453 0.785 0.647
SICa4 0.808
Usage Behavior UBCh1 0.849 0.849 0.899 0.692
UBCh2 0.913
UBCh3 0.861
UBCh4 0.687
Table 6
The Discriminant Validity Analysis
Construct 1 EE 2 FC 3 PE 4 SI 5 UB
1Effort Expectancy 0.792
2Facilitating Conditions 0.590 0.816
4Performance Expectancy 0.521 0.295 0.831
5Social Influence 0.301 0.323 0.575 0.804
6Usage behavior 0.749 0.567 0.660 0.367 0.832
Table 7
The Results of the Inner Structural Model
Hyp.
No.
Hypothesis
Statement
Path
Coefficient
Standard Error
(STERR) T Value Decision
H1 PE→UB 0.414*** 0.108 3.817 Supported
H2 EE → UB 0.427*** 0.084 5.070 Supported
H3 SI →UB -0.070 0.074 0.948 Not Supported
H4 FC→UB 0.215*** 0.086 2.517 Supported
H5 HT→UB 0.103*** 0.060 1.713 Supported
*:p<0.1; **:p<0.05; ***:p<0.01

107
Findings
The findings of the study would practically and encouragingly contribute to the
government decisions in Iraq especially over the course of sustainable EG services.
Additionally, would also provide empirical lay down for the decision makers of Iraq, IT
practitioners, and posterity on the sustainable of EG in Iraq specifically and technological
adoption and acceptance in Iraq in general. Lastly, there are more than 28 million Iraqis have
been waiting for enhancement in EG services.
Additionally, this research demonstrated UTAUT2 in the dangerous environment and
sustainable context. The more of finding in details will discuss in the following paragraphs;
8.1 Performance Expectancy (PE) has a positive influence on sustainable (Usage
Behaviour) of eG services.
The Performance Expectancy is defined as the degree to which an individual believes that
using the system will help to attain gains in job/ life performance (Venkatesh et al., 2003, 2012).
Many previous empirical studies have investigated PE in different fields and it was used in
many softwares in analysis such as (SPSS, AMOS, PLS) in various countries (Al-Shafi &
Weerakkody 2010; Al-Sobhi et al., 2011; Venkatesh, et al., 2003; Venkatesh et al., 2012; Yu-
Lung et al., 2007; Yahya et al., 2011) who belong to developing and developed nations.
Accordingly, the researcher is particularly interested in investigating how PE contributes
to effecting UB of eG services among end users in Iraq. Indeed, the present study attempts to
examine the relationship between PE and UB in a risky area.
In examining the hypothesis related to the relationship between PE and UB the result of
the SEM analysis implies that the effect of PE on the UB has a significant impact on the UB at
the 0.01 level of significance (β= 0.414, t= 3.817, p<0.01). Therefore, hypothesis H1 was
supported. The finding suggests that individual performances in terms of life performances and
accomplishments of transaction/task can be improved when the individual use the eG services
the unstable and risky environment.
This result is in line with previous empirical studies. Many previous empirical studies have
shown that there is a positive relationship between PE and other variables (Al-Shafi &
Weerakkody 2010; Al-Sobhi et al., 2011; lawan, 2011).
8.2 Effort Expectancy (EE) has a positive influence on sustainable (Usage
Behaviour)of eG services.
Effort Expectancy (EE) is defined as the degree of ease associated with the use of the
system (Venkatesh et al., 2003, 2011, 2012). Based on previous works, it appears that EE is
important among different innovations in the Middle East and non-Middle East countries
(Abdul-Rahman et al., 2011; AlAwadhi & Al-Sobhi et al., 2011; Foon & Fah 2011; Venkatesh
et al., 2011; Yahya et al., 2011).
However, there is a lack of empirical studies that examined EE in violence and dangerous
situations. Therefore, further research is required to investigate the relationship between EE
and UB in Iraq as a conflicted and risky region.
The finding proved that EE influences UB of eG services in Iraq, because of the degree of
eG services is perceived as relatively easy to understand and use.
In examining the hypothesis of the relationship between EE and UB, the result of SEM
analysis implies that the present study practically tested the relation between EE and UB.
However, this study indicates EE has a significant and positive influence on UB (β= 0.427,
t=5.070, p>0.1), or H2 is supported. Therefore, hypothesis H2 was supported.
With these findings, previous studies have provided empirical evidence of the significant
positive relation between EE and UB (Yu-Lung et al., 2007).

108
8.3 Social Influence has an effect on a sustainable (Usage Behaviour) of eG services
Social Influence (SI) could be one of the main reasons of low usage of E-Services (Al-
Majali, 2011) in general and specifically in Iraq. Moreover, the few past studies in Iraq have
neglected the examination of the effects of social influence especially from family and peers,
and empirical test have not been previously carried out in Iraq.
In examining the hypothesis related to SI the result of the SEM analysis implies that the
present study practically tested this variable. More specifically, it was found that the SI has no
effect on UB (β= -0.070, t=0.948, p>0.1). Also, β is negative (-0.070) among this relation,
which indicates there is not a significant positive relationship of H3 centralisation of SI. SI was
hypothesised to be a significant positive effect on UB and the path was positive, as posted, it
was not statistically significant within the selected .01 significant level. Thus this hypothesis
did not support H3. Further, in this study, (β) size was -0.070.
Previous empirical studies recommended that SI should play a critical role regarding to a
new innovation. In the current study, the relationship was negative and not statistically
significant, thus it was not supported H3.
This study suggests that the eG services users do not have any influence from their pair
group or anybody influencing their usage of eG services. The finding further validates the non-
significance of maintaining social influence in assessing technology. More so, in technologies
that are prone to the public as revealed by (Chiu & Wang, 2008; Al-Sobhi et al., 2011).
Additionally, the current study is in line with social influence result in other studies, because it
is not making any significant contribution to the prediction in the Saudi Arabia eG context (Al-
Sobhi et al., 2011; Alshehri et al., 2012).
8.4 Facilitating Conditions has a positive influence on sustainable (Usage
Behaviour) of eG services.
Facilitating conditions is the degree to which an individual believes that an organisational
and technical infrastructure exists to support the system (Venkatesh et al., 2003, 2012). Several
prior empirical studies shed light on Facilitating Conditions (FC) as an important key for their
studies, in different countries (Venkatesh et al., 2003, 2011, 2012). Furthermore, there is a lack
of Facilitating Conditions (FC) in terms of Infrastructure (Al-Dabbagh, 2011; Portal Iraq,
2011), and of teeming challenges and barriers faced in Iraq. To overcome that challenges, the
government of Iraq spent 20 million USD in an agreement between Iraq and Italy in 2004 to
achieve eG project (Tai, 2008).
The SEM is also capable of performing analysis of the investigation of the relationship
among FC and CUI. For research question number two, the results show that FC has a
significant and positive influence on UB (β= 0.215, t=2.517, p>0.1) this appears to recommend
that FC has a positive and statistically significant effect on UB. Thus hypothesis H4 is
supported. (Please refer to Figure 5.3 of Path Model Results). FC was observed to have
significant influence on user adoption of eG services in Iraq.
With these finding, previous studies have provided empirical evidence of the significant
positive relationship between FC and UB (Wang & Shih, 2009; Venkatesh et al., 2011;
Adulwahab & Dahalin, 2011).
8.5 Habit and sustainable (Usage Behaviour) of eG.
Habit in this study means the time (duration) that a citizen in Iraq used the internet services.
The results of this study show that habit has an insignificant effect on UB among Iraqis (β=
0.039, t=1.148, p>0.1).
Evidences that the Habit affect the usage of eG services, because it is possible that some
Iraqi users have
Use the technology and or EG services as habit for example some EG services user have
a daily or weekly habit to check his or her care fine by using e-fine through EG services or
obtain their salary from the key card monthly (is the name given to one of eG services,

109
equivalent to what is commonly known debit card). This is the evidence that prove that H7 is
also supported. Many studies have involved the habit such as (Venkatesh et al., 2013; ).
9. Conclusion
The findings of the study confirm that same theories and same variables have different
results in different countries among different culture, sample size, nations, economic,
environment and political circumstances. In specific there is a contribution by investigating a
theory in new environment such as wars area, disaster region, risky environment, and so on.
Additionally, there is a lack in testing UTAUT2 and usage issues in dangerous and unstable
environment.
The finding also clarified that there is a clear gap to measure the usage issue (adoption an
acceptance). Regarding to usage issue and by examine the literature there is a lack in applying
UTAUT2 in conflict and dangerous environment.
In parallel, the findings of the study would practically and encouragingly contribute to
the government decisions in Middle-East nations especially over the course of adopting
an E-G technology .
Suggestion of future research
It is a high priority and important significance to measure the sustainable by use behavior
of technology among the users in such as this environment specially the Middle-East in
different parts facing different challenges and misfortunes such as wars in Yemen spicily civil
war in north of Yemen, conflicts in Egypt and Libya, violence in republic of Iraq. Moreover,
to include UTAUT2 as an underpinning theory to a determinant the effects of unstable
circumstances on the environment affect citizen (users) among E-S technologies. Therefore,
there is a need to involve various theories to measure the sustainability of eG services and
unstable circumstance effects on users in Middle-East area. Moreover, this study carries out E-
G spicily Government to Citizen services in risky environment, the next research could be
concern on Government to Government, Government to Employee and Government to
Business. At the same time, there is a lack of testing the variables that affect usage behavior
and satisfaction of users as well. Additionally, there is a need to measure the adoption and
acceptance in different context. Furthermore, there is a necessity to measure the electronic
banking, electronic commerce, electronic learning, electronic system, electronic health record,
electronic ticket, key card, Q card, smart card, visa card, master card, computer/ iPad adoption,
mobile government (M-G), Telecenter services adoption and acceptance, under different forms
of environments in developing and developed countries among different cultures and sample
size.
Limitations of the Present Study
This study is proposing to including UTAUT2 as an underpinning theory to a determinant
the effects of civil conflicts on environment and sustainability of EG services. Therefore, there
is a need to involve another theory to measure the conflict's effects on users. Moreover, this
study carryout one services out four, in another word this study concern on government to
citizen services and there is a clear gap to measure the effect of conflicts on different types of
EG services such as; government to government, government to employee and government to
business. In same time, there is a lack of testing the variables that affect sustainability of E-G
services and satisfaction of users as well Furthermore, there is a necessity to measure the
sustainable services of electronic bank, electronic commerce, electronic learning, electronic
system, electronic healthy record, electronic ticket, key card, Q card, smart card, visa card,
master card, computer/ iPad adoption, mobile government (M-G), sustainable Telecenter
services, under different forms of conflicts in developing and developed nations.

110
References
Abdul-Rahman, A. L., A. Jamaludin, et al. (2011). Intention to Use Digital Library based
on Modified UTAUT Model: Perspectives of Malaysian Postgraduate Students. World
Academy of Science, Engineering and Technology 75.
Adulwahab, L. and Z. M. Dahalin (2011). Effectiveness of Telecentre using a Model of
Unified Theory of Acceptance and Use of Technology (UTAUT): Structral Equation
Modeling Approach. Emeging Trends in Computing and Information Sciencess 2(9).
Fishbein, M., & Ajzen, I. (1975). Belief, Attitude, Intention, and Behavior: An Introduction
to Theory and Research.Reading, MA: Addison-Wesley.
Alrawashdeh, T. A. (2011). The Extended Utaut Acceptance Model Of Computer Based
Distance Training System Among Public Sector's In Jordan. Doctor of Philosoph, UUM,
Kedah.
Al-Majali, M. M. (2011). The Antecedents Of Internet Banking Service Adoption In
Jordan: Using Decomposed Theory Of Planned Behaviour Universiti Ut Ara Malaysia
Doctor Of Philosophy
AlAwadhi, S. & Morris, A. (2008). The use of the UTAUT model in the adoption of e-
government services in Kuwait. Proceedings of the 41st Annual Hawaii International
Conference on System Sciences, January 7-10, 2008, Waikoloa, Hawaii, pp: 219
Al-Shafi, S. and V. Weerakkody (2009). Understanding Citizens' Behavioural Intention
In The Adoption Of E-Government Services In The State Of Qatar. 1618-1629.
Al-Zoubi, M., T. L. Sam, et al. (2011). E-Government Adoption Among Businesses in
Jordan. Academic Research International 1(1): 141-156.
Alsohybe, N. T. (2007). The implementation of e-government in the republic of yemen:
an empirical evaluation of the technical and organizational readiness, Capella University.
Alvesson, M. and D. Karreman (2007). Constructing mystery: Empirical matters in theory
development. Academy of Management Review 32(4): 1265-1281.
Borgatti, S. P. (1999) Elements of Research.
Carlsson, C., J. Carlsson, et al. (2006). Adoption of Mobil Device/services –searching for
Answers with the UTAUT.Hawaii International Conference on System Sciences. Hawaii
International Conference on System Science, Hawaii, IEEE.
Compeau, D. R., & Higgins, C. A. (1995). Computer Self-Efficacy: Development of a
Measure and Initial Test. MIS Quarterly, 19(2), 189-211.
Chiu, C.M. & Wang, E.T.G. (2008). Understanding Web-based learning continuance
intention: The role of subjective task value. Information & Management, (45): 194-
201.doi:101016/j.im2008.02.003
Davis, F. D., R. P. Bagozzi, et al. (1989). User Acceptance of Computer Technology : A
comparison of two theoretical models. Management Science 35(8): 982-1003.
Davis, F. D., R. P. Bagozzi, et al. (1992). Extrinsic and Intrinsic Motivation to Use
Computers in the Workplace1. Journal of Applied Social Psychology 22(14): 1111-1132.
Ebrahim, Z. and Z. Irani (2005). E-government adoption:architecture and barriers.
Business Process Management 11 (5): 589-611.
Fishbein, M., & Ajzen, I. (1975). Belief, Attitude, Intention, and Behavior: An
Introduction to Theory and Research.: Wesley.
Foon, Y. S. and B. C. Y. Fah (2011). Internet Banking Adoption in Kuala Lumpur: An
Application of UTAUT Model. International Journal of Business and Management 6(4):
161-167.
Khan, G. F., J. Moon, et al. (2010). Civil Conflict,Digital Divide,and E-government
Service Adoption: A Conflict Theory Approach. World Academy oof Scienece,
Engineering and Technology 66 2010.
Khan, G. F. (2010). Essays on Electronic Government in Developing Countries: A Socio-
Technical Perspective Ph. D, KAIST.
Khan, G. F., Moon, J., Rhee, C., & Rho, J. J. (2010). E-government Skills Identification

111
and Development: Toward a Staged-Based User-Centric Approach for Developing
Countries. Asia Pacific Journal of Information Systems, 20(1).
Khan, G. F., Moon, J., Zo, H., & Rho, J. J. (2012). E-government Service Use Intention:
Digital Divide and Technology Adoption in a War-torn Country Information
Development.
K.Faaq, M., Ismail, N. A., Osman, W. R. S., K.Faieq, A., & Aleqab, M. (2009).
Application of TAM in the readiness for E-Government services. Paper presented at the
Creating Global Economies through Innovation and
Ok, S., & Shon, J. The Determinant of Internet Banking Usage Behavior in Korea:
A Comparison of Two Theoretical Models. Retrieved December 20, 2008, from
http://www.collecter.org/archives/2006_December/08.pdf
HIIK, (2008). Conflict barometer. Heidelberg Institute For International Conflict
Research, Department of Political Science, University of Heidelberg.
Igbaria, M. (1992). An examination of microcomputer usage in Taiwan. Information
& Management, 22(1), 19-28. doi: 10.1016/0378-7206(92)90003-x
Lai, V. S., & Li, H. (2005). Technology acceptance model for internet banking: an
invariance analysis. Information & Management, 42(2), 373-386. doi:
10.1016/j.im.2004.01.007
Genuardi, P., (2004). User adoption of information technology: Implications for
application development research. Masters Thesis, Faculty of the Graduate School of
Arts and Sciences of Georgetown University, Washington, D.C.
Lee, J.-K., Braynov, S., & Rao, R. (2003). Effects of Public Emergency on Citizens'
Usage Intention Toward E-Government: A Study in the Context of War in Iraq. Paper
presented at the International Conference on Information Systems (ICIS).
Norman, P. and Smith, L. "The Theory of Planned Behavior and Exercise: An
Investigation into the Role of Prior Behavior, Behavioral Intentions and Attitude
Variability," European Journal Social Psychology (25:4), 1995, pp. 403–415.
Jain, V. & Kesar, S. (2011). E-government implementation challenges at local level: A
comparative study of government and citizens’ perspectives. Electron. Government, Int.
J. 8: 208-225. Retrieved from http://www.inderscience.com/inf
o/inarticle.php?artid=39837
Partridge, H. (2007). Redefining the digital divide: Attitudes do matter! Proceedings of
the American Society for Information Science and Technology 44(1): 1-13.
Paris, Landrigan, P.J. Lioy, P.J. Thurston, G. Berkowitz, G. & L.C. Chen, (2004).
Health and environmental consequences of the world trade center disaster. Environ.
Health Perspect., 112: 731-739.
Pedersen, D. (2002). "Political violence, ethnic conflict, and contemporary wars:broad
implications for health and social well-being. Social Science & Medicine 55: 175-190.
Ruuska, I., & Teigland, R. (2009). Ensuring project success through collective
competence and creative conflict in public–private partnerships – A case study of Bygga
Villa, a Swedish triple helix e-government initiative. International Journal of Project
Management, 27(4), 323-334. doi: 10.1016/j.ijproman.2008.02.007
Rogers, E. M. (2003). Diffusion of Innovations, 5th Edition: Free Press.
Rogers, E M (1995) Diffusion of innovations: 4th edition New York: Free Press, 518pp
Shao, X., Siponen, M. (2011). "Consumer Acceptance and Use of Information
Technology: Adding consumption theory to UTAUT2," Proceedings > Proceedings of
SIGSVC Workshop . Sprouts: Working Papers on Information Systems,
11(157).http://sprouts.aisnet.org/11-157
Sheppard, B.H., Hartwick, J., & Warshaw, P.R. (1988). The theory of reasoned action: A
meta-analysis of past research with recommendations for modifications and future
research. Journal of Consumer Research, 15, 325-343.

112
Taylor, S. and P. Todd (1995). "Assessing IT Usage: The Role of Prior Experience." MIS
Quarterly 19(4).
Thompson, R. L., C. A. Higgins, et al. (1991). Personal Computing: Toward a Knowledge
Management: Theory & Practice, Malaysia.
Venkatesh, V., & Davis, F. D. (2000). A theoretical extension of the technology
acceptance model: Four longitudinal Field Studies. Management Science, 46(2), 186-204.
Venkatesh, V., M. G. Morris, et al. (2003). User acceptance of information technology:
Toward a unified view1. MIS Quarterly 27(3): 425-478.
Venkatesh, V., Sykes, T. & Zhang, X. (2011 January). Just what the doctor ordered: A
revised UTAUT for EMR system adoption and use by doctors. Proceedings of the
44th Hawaii International Conference on System Sciences, Kauai, HI., USA., pp: 1-10.
Walela, P. (2009). Relevance Of Usability To Development Of Cellular
Technology, Strathmore University. Master of Science in Information Systems
Wang, H., & Rubin, B. L. (2004). Embedding e-finance in e-government: a new e-
government framework. Electronic Government, an International Journal, 1(4), 362 - 373.
doi: 10.1504/EG.2004.005912.
Wang, H & Yang, H. (2005) The Role of Personality Traits in UTAUT Model under
Online Stocking. Contemporary Management Research.1(1), 69-82.
Wang, Y.S. & Shih, Y.W. (2009). Why do people use information kiosks? A validation
of the Unified Theory of Acceptance and Use of Technology. Government Information
Quarterly 26(1): 158-165.
Wu, Y.-L., Y.-H. Tao, et al. (2007). Using UTAUT to explore the behavior of 3G mobile
communication users. Industrial Engineering and Engineering Management, 2007 IEEE
International Conference on.
Yahya, M., Nadzar, F. Masrek, N. & Abd Rahman, B (2011). Determinants of
UTAUT in measuring useracceptance of E-syariah portal in syariah courts in
Malaysia. Proceedings of the 2nd International Research Symposium in Service
Management, July 26-30, 2011, Yogyakarta, Indonesia, pp: 242-250. Retrieved
from http://irssm.upnyk.ac.id/userfiles/file/papers/031.pdf.
Yayla, A., & Hu, Q. (2007). User Acceptance Of E-Commerce Technology: A Meta-
Analytic Comparison Of Competing Models Retrieved from
http://is2.lse.ac.uk/asp/aspecis/20070192.pdf
Maldonado, U.P.T., Khan, G.F. Moon, J. & Rho, J.J. (2011). E-learning motivation
and educational portal acceptance in developing countries. Online Information
Review. 35(1): .66-85.doi 10.1108/14684521111113597.
Moore, G. C., & Benbast, I. (1991). Development of an instrument to measure the
perceptions of adopting an information technology innovation. Information Systems
Research, 2(2), 192-222.
Top 10 Most Dangerous Countries in the World. (2013). Top 10 Most Dangerous
Countries in the World 2013 Retrieved August 4, 2013, from
http://toptenstore.blogspot.com/2013/01/top-10-most-dangerous-countries-in.html
Shao, X., Siponen, M. (2011). "Consumer Acceptance and Use of Information
Technology: Adding consumption theory to UTAUT2," Proceedings > Proceedings of
SIGSVC Workshop . Sprouts: Working Papers on Information Systems, 11(157).
http://sprouts.aisnet.org/11-157
Slade, E., Williams, M. & Dwivedi, Y. (2013) ‘Extending UTAUT2 to explore consumer
adoption of mobile payments’, Proceedings of the UK Academy for Information Systems
Conference, March 19-20th, Oxford.

113
The impact of external public debt and Foreign
Aid to capital expenditure in Jordan (2000-
2014) In light of the competitive advantage
Dr. Fozan Alhrout Dr. Hana' Alhunaiti
Ministry of Planning and International
Cooperation
The World Islamic Science & Education
University
Jordan Jordan
Abstract:
The purpose of the study is to build an estimation model for the impact of the external debt
and Foreign Aid on the capital expenditures in the Hashemite Kingdom of Jordan for the period
of (2000-2014). A multiple regression model is used and the major findings are: (1) there is a
negative and statistically significant impact of external debt on capital expenditures; (2) there
is a positive and statistically significant impact of foreign aid on capital expenditures.
1. Introduction
The capital expenditure has a main role in economic and social development process, without
it there the country cannot be build product projects and service projects, and other capital
formations (investments). Because of the lack or scarcity of domestic savings, most
developing countries, which intend to speed up the development process are demanding
foreign loans, to encourage its foreign investment in the national economy, as this has a direct
and indirect positive impacts on many of the economic indicators, such as balance of
payments, general budget, gross domestic product, total demand, employment, prices, and
income and wealth distribution.
Jordan government's, during the past twenty years focused on reducing of external public
debt, while the increase in government capital expenditure - which was seen as sufficient -
were not among the list of priorities of fiscal policy in Jordan. The Jordanian government
considers that increase private sector partnership in the field of capital expenditure is the best
way to move forward towards increasing capital expenditure in the country (International
Monetary Fund, 2005, pp. 37).
Research problem,
external pubic debt conceder’s big issue for developing countries which is obstructing
development financial policies plans, even threatening future financial stability of countries
economics. over time the Jordanian state depends on financing both government capital
expenditure , current government e spending and private capital expenditure: through finance
external debt because of deficit in the domestic savings and weaknesses of the public revenues
and deficit in the general budget, which is pushing the Government to search for new sources
of funding were foreign loans of the most important sources of financing Capital expenditure
in the Jordanian economy as a whole from government and private (investment). Public external
debt value has reached in (2000) year to (5.044) billion JD has increased by (2014) year to
(8.033) billion JD. Thus, the purpose of this paper is to determine the impact of external public
debt to capital spending in Jordan for the period (2000 -2014).
due to enormity of the necessary funds to finance the development process, there are a huge

114
investment is difficult to execute from private sector , therefore they cannot be invest, as a
result of weakness revenues, investment activity , low income levels , low savings domestic
rates and the lack of justice in developing countries including Jordan, many of These countries
depend on external sources to finance investment projects, through external borrowing and
foreign aid and foreign direct investment (ESCWA 0.2003, pp. 40-45). 2000-
2014
Components of research problem,
explaining this study problem by asking the following key questions:
1. What is the impact of external public debt to capital expenditure in Jordan In light of the
competitive advantage?
2. What is the impact of foreign aid on capital expenditure in Jordan In light of the
competitive advantage?
Research hypotheses,
this study is based on the following main assumptions:
Ho1: No impact with statistically significant at the level of significance (α = 0.05) of the
external public debt on capital expenditure in Jordan In light of the competitive advantage
. Ho2: No impact with statistically significant at the level of significance (α = 0.05) of the
foreign aid on Jordan in capital expenditure In light of the competitive advantage.
Importance of research,
the importance of searching through highlighting the impact of external public debt on
Jordan capital expenditure, according to researchers aware of Arab libraries are generally
lacking and Jordanian particularly for such research and the researchers hope that the public
and private sectors in Jordan benefit from the study results which we hope investigate. Hence
the importance of studying impact of external debt on capital expenditure in Jordan, and the
ability of external debt to mobilize domestic savings, and directing capital expenditure to
achieve real economic growth, and exploiting funding from external debt effectively to
improve investment and development the national economy.
External public debt:
Is the amount of debt-based (required) from a particular country and in other words is the
amount based from actual liabilities and is not contingent on the residents of an economy, at
any given time, for non-residents, which requires payments from the debtor to pay the original
amount and / or interest at some point or points of time in the future. (IMF, 2003, p. 7).
Capital expenditure:
The definition of gross capital formation in the national accounts with the concept of
capital expenditure in capital goods system corresponds to a concept used by economists. And
gross capital formation does not include only the capital goods-producing (machinery,
buildings, roads and assets artistic and otherwise, and the improvements that are made to non-
produced assets) also the gross capital formation measures what is added to the capital stock of
buildings, equipment and inventory which is in addition to the ability to produce more goods
and income in the future. (United Nations national accounts, manual, 2005, p. 24).
Foreign aid: Include financial and technical assistance to be provided in aid of the state
of foreign stats and institutions, to be allocated to finance development projects (the Central
Bank of Jordan Annual Report 2008, p. 2)

115
2. Literature Reviews
Many researchers discussed this issue, external debt as a phenomenon represents an
economic problem (Njern, 2003, P.32 & Griffin, 1970, Pp.99-112) it requires repayment
deducted share of income or gross national product, it increases public spending, and reduce
savings, in addition to the accumulation of external debt is a heavy load on the national
economy if the public debt continues cumulative increase in rates greater than the rate of
increase in the gross national product. (Alraheema, 2006, pp. 1941-1945)
The external public debt is a global phenomenon, the countries turn to because of the lack
of internal economic resources to achieve desired rates of economic growth, increase the
incomes of individuals, for the implement of development plans to reach a real growth in
income and gross national product, and to meet the deficit in the balance of payments and public
budgets from the shortage of local resources in achieving economic, social, political objectives,
and to meet the change of population growth and demographic changes, as is the case of Jordan.
Where the growing impact of this type of financing to increase the size of public
revenues.(Awni 0.2005, pp. 165-159).
The causes of external financing.
As a result of the decline in foreign aid introduced to Jordan. Jordan dramatically goes to
external borrowing, at the beginning of the eighties (Momani, 1987, pp. 8-7).
We can be referred to a series of important reasons that prompted Jordan goes to external
funding sources as an important source of access to financial resources:
Capital expenditure (investment):
. The investment process is more complicated than just a trade-off between interest rate
and the marginal efficiency of capital, its affected by the prospects and forecasts conducted by
the investor, and dimensions of political and planning and financial state. government's
investment in Jordan's has been associated with the government's investment plans for
economic and social development of the state, which aimed to increase the national income as
a clear indicator of the progress of the country's economy, raise the living individual level, the
provision of basic needs, the development of the structure of the national economy and achieve
social utility that cannot be achieved by any other sector exception through the government
sector. The marginal investment tendency and the sustainability of the development at high
rates rise, requires capital-intensive and advanced technology, which is lacking in Jordan, like
other developing countries, which is forcing Jordan to external borrowing for the purchase of
machinery and equipment. (Kasasbeh, 1993, pp. 34-18).
Jordan general budget described with continuing structural long-term deficit due to the
large expansion in public expenditures of the state, both current and capital expenditure.
Second: capital expenditure Government investment still importance in the development
process and promote the economy National (Mshorab, 1997, pp. 120-103). This confirms that
some of the projects countries need to modern technology, private investor sometimes hesitated
to engage in some of the high cost despite of the high investment return, so the state participate
and enter to transfer technology and reduce its primary costs of the projects, in addition to the
state's ability to mobilizations of appropriate technology for economic and social conditions
compared to the ability of private sector. The profit is private investor goals to enter into the
projects, while the main motivations for most of the government investment is the social and
economic development, to achieve a balance between the different sectors of the economy and
income redistribution and the government investment objectives to least developed regions to
achieve a balanced growth between regions or governance. ( Ajamiyeh, 1984, pp. 348-347) .
Public investment could adversely affect investment when financed from internal loans
of direct and indirect taxes and of inflationary financing, where the savings of individuals
transfer through government, which reduces the funds available for private investment.
However, the public investment has positive effects on private investment, as it works to
motivate by providing infrastructure, lines of transport and communication and skilled workers
116
trained, etc. this is lead to reduces the cost of production and increase private sector
productivity, as well as by increasing effective demand resulting from increased government
spending (ESCWA 0.2005, pp. 2-1).
There's nothing wrong with the government sees as modern thought leading to public
borrowing or increasing it, as long as it does not produce bad economic effects. And Bastyl
seen the necessary of differentiate between public loans held for economic production purposes
and loans, If it will invest in projects that generate physically revenues at least equal to the loan
amount and interest it will be a feasibility to borrow. (Draz and Samira Ayoub, 2002, p. 299 y
304, Nasser 0.2005, p. 50, p 222).
Capital expenditure determinants,
Investment policy based on encouraging the mobilization of domestic savings through
work on sustainable development, which is reflected the individual's income-level, maintaining
the stability of the currency exchange rate and interest rate. motivated domestic savings ,
attracted foreign investment, and stimulated local investments needed to achieve sustained
economic growth and domestic investment, it is essential to the local investment environment
to create and increase confidence in the investment climate and investment promotion, through
the provision of incentives and exemptions, facilitate the registration and licensing procedures
for investment projects, create the appropriate legal environment to protect investment, also
must develop and strengthen the financial market (ESCWA, 2003, p 43-47). the researchers
choices the most important determinants of spending capital as follows:
external public debt,
States went to the external source of financing if local revenues insufficiently to meet
local spending state needs to provide the desired level of growth, and services that state take
upon itself, the external public debt contributes to increase capital formation and thus increase
GDP. On the other hand, there are a repayments and interest, and debt services according to the
terms of agreements in terms of dates, currency and so on. (Momani, Riad, p. 365).
the external public debt impact on investment may be positive or negative, sometimes
depending on the nature and results of the economic policy followed in the debtor country,
some studies concluded that a negative relationship on the Jordanian economy as a bug load
of external borrowing swallow a large part of Jordan exports and national income, the external
borrowing did not significantly contribute to increased domestic production and domestic
savings, and the trade balance deficit reduces and has a negative impact on economic growth
for the period a year ago (1985 ) (Momani, Riad, p. 371).
Foreign aid, the value of foreign aid raised from 240 million Jordanian dinars since (2000)
to (1237) million dinars a year (2014). Foreign aid conceder of the most important sources of
free fund, they are financial transfers to Jordan treasury from institutions and foreign
governments as grants, and exploited by countries receiving aid in the financing of capital and
current expenditures, as well as soft loans, which are within the framework of foreign aid which
is reflected on investment. (Central Bank of Jordan report, 2014).
Workers' remittances abroad, recently growing interest in financial flows associated
with the transfers' overseas workers as a source of funding externally from Jordanian , in the
year (2000) Jordanian Workers' remittances abroad transferred (1.177) billion dinars compared
to (2388) billion dinars in the year (2014), which means that overseas workers' remittances It
jumped (1.03). The Jordanian remittances are one of the most important sources of financing
in Jordan.
Economic growth,The economic growth means GDP growth, so the economic growth
measured by GDP growth rate, while the development is economic growth accompanied by a
series of structural changes that affect all economic and social aspects of the population.
economic growth affected by the level of financial available resources through the labor force
growth , development of skills, increase the production capacity of the agricultural, industrial

117
and service economy, because of growth is influenced by technical progress. (Taher, 1998, pp.
50-45).
Economic openness, Openness affects the economy through liberalization of trade goods
and services import, export and transfer of production elements. Impact of imports on economic
growth by saving capital goods and intermediate materials to developed the national
investments. In opposite the imports are a loading on the state's foreign currency reserves.
(Meshaal, et al., 2007, p. 7-1). Economic openness is measured on the basis of total exports and
imports.
Interest rates, the changes in interest prices have many reflects on investment decisions,
borrowing and saving. The interest rate is one of the monetary policy, which contribute to
maintaining the balance between savings and investment, as the change in the interest rate
affects the distribution of funds available for investment tools, so the interest rate determined
investment. (Khryosh et al. 1999, p. 4-2).
Capital expenditure depends in Keynesian theory on the investment cost of the interest rate
and linked relationship counterproductive, in addition the capital expenditure depend on
investors' expectations for investment return, high interest prices pushed borrowing countries
to look for other sources of lending and interest rate minimum cost. (Ali and Nizar Al-
IssaSaadEddin, 2004, p. 303-325).
the capital expenditures or capital investments are investments which is expected return
distributed to a number of years more than one year, for example, investments in various types
fixed assets which are considered as productive assets (equipment, stock, tools and means of
transportation). Long-term investments that do not give a profit quickly in the short term and
not the logic of assessed on the basis profitability in the short term. (Hanafi 0.2001, p. 263-
257).
ESCWA (2005) The aim of the study to identify macro-economic factors that may contribute
to GDP growth which might be promote economic growth in the ESCWA region, was used
model to straighten confrontations errors and self-retreat confrontations and models Granger
causality to highlight the gross domestic product (GDP) in member countries growth
determinants, and do practically determine the relationships between GDP and public debt and
private and private investment growth rate. The study found that public investment a positive
impact on private investment, the study recommended that Jordan should seek to further
stimulate public investment in infrastructure, financial and human capital, and will achieve
growth of public investment in health and education in GDP. Moreover, the public investment
in infrastructure, it seems a major role in stimulating private sector initiatives
ESCWA (2007)The study examined the role of foreign aid in the Arab region's
development over the past three decades, with a focus on Jordan, Palestine, Egypt and Yemen,
the study was presented to policy-makers in governments and international institutions whom
concerned with a comprehensive analysis of macroeconomic development, the most important
trends in the flow of foreign aid to the Arab region and the characteristics of these Aid, and its
impact on economic growth and social indicators, the study identified a number of key areas
that should be addressed in the economic policy in order to increase the effectiveness of flowing
aid to the Arab region to reducing poverty and enhancing development, also to know the impact
of aid on economic growth and social indicators, the study found through analysis on Jordan,
Egypt, Yemen and conclusions of the other studies, that foreign aid is more volatile than other
macroeconomic variables, such as GDP .
Khalidi study (2008) The study focused on the analysis of the impact of foreign aid on
economic development in Jordan, its suggest that poor countries mainly depend on foreign aid
as a resource to meet their financial deficit. There are many external resources such as foreign
direct investment, foreign loans, loans and technical assistance, and other forms. Jordan
remained one of the countries that do not have foreign investment, Jordan has to be depend on

118
foreign aid and debt instead of other external funding sources, the study found that the flow of
foreign capital has a direct and clear impact on economic development in Jordan
Alfred Greiner, (2014) The study the macroeconomic effects of public investment in low-
income countries, the investment-growth linkages, public external and domestic debt
accumulation, the fiscal policy reactions necessary to ensure debt-sustainability. Well-executed
high-yielding public investment programs can substantially raise output and consumption and
be self-financing in the long run. However, even if the long run looks good, transition problems
can be formidable when concessional financing does not cover the full cost of the investment
program. Covering the resulting gap with tax increases or spending cuts requires sharp
macroeconomic adjustments, crowding out private investment and consumption and delaying
the growth benefits of public investment. Supplement with external commercial borrowing, can
smooth these difficult adjustments, reconciling the scaling up with feasibility constraints on
increases in tax rates. But the strategy may be also risky. With poor execution, sluggish fiscal
policy reactions, or persistent negative exogenous shocks, this strategy can easily lead to
unsustainable public debt dynamics. Front-loaded investment programs and weak structural
conditions (such as low returns to public capital and poor execution of investments) make the
fiscal adjustment more challenging and the risks greater.
Jaejoon Woo and Manmohan S. Kumar, (2014) This paper explores the impact of high
public debt on long-run economic growth. Analyze, based on a panel of advanced and emerging
economies over almost four decades. The empirical results suggest an inverse relationship
between initial debt and subsequent growth, controlling for other determinants of growth: on
average, a 10 percentage point increase in the initial debt-to-GDP ratio is associated with a
slowdown in annual real per capita GDP growth of around 0.2 percentage points per year, with
the impact being somewhat smaller in advanced economies. There is some evidence of
nonlinearity with higher levels of initial debt having a proportionately larger negative effect on
subsequent growth. Analysis of the components of growth suggests that the adverse effect
largely reflects a slowdown in labor productivity growth mainly due to reduced investment and
slower growth of capital stock.
3. Methodology
This study aims to test the effect of the independent variables: external public debt, foreign
aid, on the dependent variable of capital expenditure in Jordan, to achieve the goal of the study
we testing the impact of these three independent variables on capital expenditure in accordance
with specific procedures and using the data collected, categorized and analyzed, so that they
are subject to testing and draw conclusions
approach of the study: The study relied on the related subject of the study of financial
statements, in order to identify the impact on public external debt and foreign aid as a dependent
variables on the dependent variable; capital expenditure in Jordan for the period for the period
(2000-2014).
The data of the study consisted of data available for the main variables study, which have been
available from the Jordanian general budget Department, Ministry of Finance, the Central Bank
of Jordan, the Department of Statistics of Jordan, International statistics and reports of the
World Bank to get the study data during the study period.
The study method Researchers relied on descriptive analysis and benchmark in data
analysis and interpretation in order to test hypotheses of the research. The analysis used the
time-series to explain model variables, which was estimated using analysis software (Eviews
5) to test the impact of the external public debt and foreign aid on capital expenditure.
the study variables: below is an overview of the variables used in the research used in the
standard model:
Independent variables A. External public debt: the expression of the outstanding public
external debt. The researchers have got data from the central Bank publications, Jordanian
Ministry of Finance and the Directorate of Public Debt.
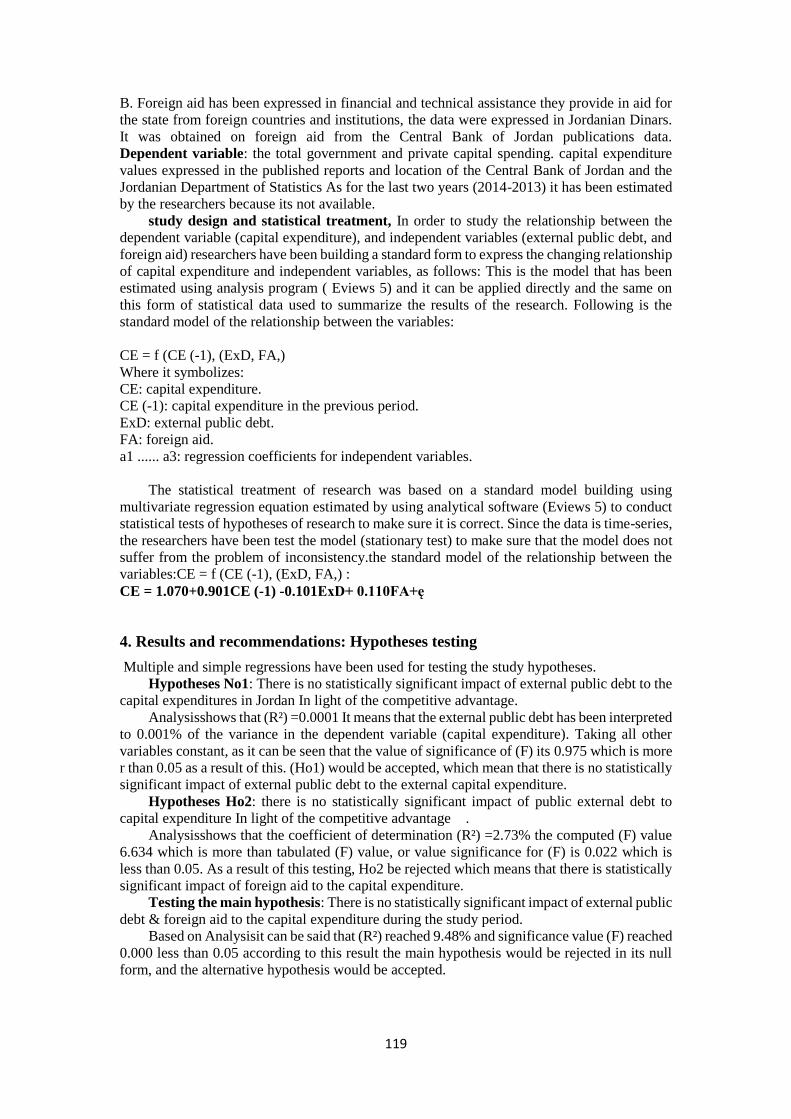
119
B. Foreign aid has been expressed in financial and technical assistance they provide in aid for
the state from foreign countries and institutions, the data were expressed in Jordanian Dinars.
It was obtained on foreign aid from the Central Bank of Jordan publications data.
Dependent variable: the total government and private capital spending. capital expenditure
values expressed in the published reports and location of the Central Bank of Jordan and the
Jordanian Department of Statistics As for the last two years (2014-2013) it has been estimated
by the researchers because its not available.
study design and statistical treatment, In order to study the relationship between the
dependent variable (capital expenditure), and independent variables (external public debt, and
foreign aid) researchers have been building a standard form to express the changing relationship
of capital expenditure and independent variables, as follows: This is the model that has been
estimated using analysis program ( Eviews 5) and it can be applied directly and the same on
this form of statistical data used to summarize the results of the research. Following is the
standard model of the relationship between the variables:
CE = f (CE (-1), (ExD, FA,)
Where it symbolizes:
CE: capital expenditure.
CE (-1): capital expenditure in the previous period.
ExD: external public debt.
FA: foreign aid.
a1 ...... a3: regression coefficients for independent variables.
The statistical treatment of research was based on a standard model building using
multivariate regression equation estimated by using analytical software (Eviews 5) to conduct
statistical tests of hypotheses of research to make sure it is correct. Since the data is time-series,
the researchers have been test the model (stationary test) to make sure that the model does not
suffer from the problem of inconsistency.the standard model of the relationship between the
variables:CE = f (CE (-1), (ExD, FA,) :
CE = 1.070+0.901CE (-1) -0.101ExD+ 0.110FA+ę
4. Results and recommendations: Hypotheses testing
Multiple and simple regressions have been used for testing the study hypotheses.
Hypotheses No1: There is no statistically significant impact of external public debt to the
capital expenditures in Jordan In light of the competitive advantage.
Analysisshows that (R²) =0.0001 It means that the external public debt has been interpreted
to 0.001% of the variance in the dependent variable (capital expenditure). Taking all other
variables constant, as it can be seen that the value of significance of (F) its 0.975 which is more
r than 0.05 as a result of this. (Ho1) would be accepted, which mean that there is no statistically
significant impact of external public debt to the external capital expenditure.
Hypotheses Ho2: there is no statistically significant impact of public external debt to
capital expenditure In light of the competitive advantage .
Analysisshows that the coefficient of determination (R²) =2.73% the computed (F) value
6.634 which is more than tabulated (F) value, or value significance for (F) is 0.022 which is
less than 0.05. As a result of this testing, Ho2 be rejected which means that there is statistically
significant impact of foreign aid to the capital expenditure.
Testing the main hypothesis: There is no statistically significant impact of external public
debt & foreign aid to the capital expenditure during the study period.
Based on Analysisit can be said that (R²) reached 9.48% and significance value (F) reached
0.000 less than 0.05 according to this result the main hypothesis would be rejected in its null
form, and the alternative hypothesis would be accepted.
120
Recommendations, Based on the research results, the researchers concluded the following:
1. The importance of establish an independent department dealing with public debt, both
internal and external managed debt sustainability, debt decision, determine currency, time, and
size , type of public debt and its source.
2. Enhancing partnership between the public sector and private sector to promote private
investment and should attention to crowded competition between public and privet investments,
and reduce the role of the public sector in direct production for the private sector which is
reducing the external debt.
3. Perpetrate many studies and researches on external debt and capital expenditure.
References
Ajamiyeh, Mohamed Abdelaziz, et al. (1984), Memoirs of development and planning,
first edition, Dar Arab renaissance for printing and publishing, Beirut, Lebanon. Pp.
347-348.
Ali, Abdel Moneim Mr. Nizar Al-IssaSaadEddin, (2004), currencies, banks and
financial markets, Dar Al-Hamed Publishing and Distribution, Amman, Jordan.
Awni, Khaled (2005) mathematical model to frame the foreign debt: theoretical
framework. Albsaer magazine, Petra Private University, No. 2, Amman, Jordan. Pp.
159-165.
Central Bank of Jordan, (1999-2014), Research and Studies Department, published
annual reports on the bank's website, Amman, Jordan.
Draz, Hamid Abdul Majeed, and Samira Ibrahim Ayoub (2002) Principles of Public
Finance, University House Publishing, Alexandria p. 299, p 304.
Economic and Social Commission for Western Asia (2003), economic trends in the
ESCWA region and the effects of shocks associated with it, No. 1, United Nations.
7. Economic and Social Commission for Western Asia (2005), the global expectations
and predictions for the ESCWA region: the role of public investment and spending in
the economic growth, No. 2, United Nations.
8. Economic and Social Commission for Western Asia (2005), global expectations and
predictions for the ESCWA region: debt, investment and economic growth in the region
self-exciter, No. 3, United Nations.
9. Economic and Social Commission for Western Asia (2007), economic trends and
their implications: Foreign aid and development in the Arab region, No. 4, United
Nations.
10. Griffin, K. (1970), “Foreign capital, domestic savings and economic development”
.Bulletin of the Oxford University Institute of Economics and Statistics 32, 99-112.
11. Greiner, Alfred, (2014) Sustainable Public Debt and Economic Growth under
Wage Rigidit , Bielefeld University, Metroeconomica, international review of
economics.
Hanafi, Abdul Ghaffar (2001) basics of funding and financial management, University
House, Alexandria, pp. 263-257.
International Monetary Fund (2003), external debt statistics, Guide for Compilers and
users of 0.2003 .
International Monetary Fund, (2005) “Public Investment and Fiscal Policy- Summaries
of the Pilot Country studies”. Fiscal Affairs department, April, pp. 37-38
Kasasbeh, Hamad (1993), the government's economic policies in the field of
encouraging investment in Jordan, Research and Studies Department, Central Bank of
Jordan, Amman, Jordan.
Khalidi, MofaqDandan (2008) the impact of foreign aid on economic development in
Jordan (1990-2005), Journal of Human Sciences, No 4.
17. Khrayosh, Hosni and Ershaid, Ali and Jodah, Ahmad, (1999), investment and
finance between theory and implement, Zahran Publishing House, Jordan.
121
Mashal, Zakiah, et al. (2007), impact of FDI on economic growth: A Case Study of
Jordan, Journal of Economic and Administrative Sciences, Vol. 23, No. 1.
Ministry of Finance of Jordan, (1999-2014), the government and public financial
bulletins, Directorate Studies, Ministry Website, Amman, Jordan.
20. Mshorb, Ibrahim (1997), undeveloped and development in the Third World issues,
first edition, Dar Manhal Lebanese, Beirut, Lebanon.
21. Momani, Riyad (1987), the impact of foreign capital, loans and foreign aid to
economic development: the Jordanian experience for the period (1985-1968) Yarmouk
Research Journal, Vol. 2, a series of humanities and social sciences, No (2), Yarmouk
University, Jordan.
22. Njeru, James. (2003), “The Impact of Foreign Aid on Public Expenditure: The Case
of Kenya”. AERC Research, African Economic Research Consortium, Nairobi, Kenya
November 2003, Paper 135.
23. Qaqish, Awni (2005) The impact of government investment spending on
macroeconomic indicators before and after the economic reform programs (1976-
2001), Master unpublished study, University of Jordan, Amman, Jordan.
24. SaadAlrhaimy, (2006), impact of external loans to develop t tourism sector in
Jordan for the period (1990-2003), Albesaar magazine, Volume 10, First Issue, March,
2006, the Private University Petra, Amman, Jordan. Pp. 141-145.
25. Taher, JamilAsfour, Saleh (1996), the unified directory of concepts and
terminology of planning in the countries of the Cooperation Council for the Arab States
of the Gulf, Arab Planning Institute.
26. United Nations Statistics Division, National Accounts Manual (2005), National
Accounts Introduction process, number 85, the United Nations New York.
27. Woo, Jejoon& Kumar, Monmohan S. (2014), Pubic Debt and Growth, International
Monetary Fund, Washington, October 2014.
122
The Effect of Low Morale and Motivation on
Employees’ Productivity & Competitiveness in
Jordanian Industrial Companies
Dr. Mohammed
Al-Attar Dr. Nafez Ali Dr. Ziad Al-Zubi
Dr. Osama Samih
Shaban
Al-Zaytoonah University of Jordan
Jordan
Abstract:
The current study aims to examine the effect of low morale and motivation on employee's
productivity and competitiveness. Low productivity and loosing competitiveness is an outcome
of low morale and low motivation and sometimes may lead to further undesired symptoms such
as absenteeism and sabotage. Non-recognition of the employees' contributions their motivation
and morale will not improve, nor will their productivity as well.
A questionnaire has been designed for this purpose, and it was distributed to selected
accounting and management employees working in different Jordanian business environments.
The number of questionnaires analyzed were (138) questionnaires. Resolution data were
analyzed using the statistical program Smart PLS, (Partial Least Square). The Study concluded
that Low Morale and Low Motivation affects Productivity and Competitiveness and makes on
limiting its consequences, and the study also recommended that management should work on
increasing productivity by increasing employees’ satisfaction through re-engineering systems
and processes, providing incentives, education and training.
Keywords: Low morale, Low Motivation, Productivity, Competitiveness, Jordanian
Industrial Companies.
1. Introduction
In General, high morale leads to high productivity, but there is not always a positive
correlation between the two. Close supervision, time studies, and scientific management can be
used in order to reach a high level of productivity, but sometimes we can reach to high
productivity by low morale, but it is doubtful whether this combination can last. [1]. Renis
Likert explained different combinations of morale and productivity: high morale and low
productivity; high morale and high productivity; low morale and high productivity; and low
morale and low productivity [2]. We can say that managers have to work for improving the
morale of their employees, as high morale makes the work a better working environment, and
it helps the organization to attain its goals easily.
Organizations want its employees to be more productive, so will motivation will be enough
to get things done? And what motivates our behavior. Employees are considered the most
important resources, and the winning card in the hands of management. Low productivity may
be traceable to poor employee motivation. The success and effectiveness of any firm depends
to some extent on how well employees are motivated. Theories of human resource management,
as well theories of motivation suggest that motivated employees tend to be more creative and
productive, and wise management is the management which could use theories of motivation
in order to increase productivity and competitiveness [3].
Competition can be defined as a contest between individuals or groups where they strive
to attain and reach particular goals [4]. The concept of competitiveness has been linked to early
socialization processes between parents and children. Parents often teach individualism to their
123
children and this is often characterized by making distinctions between themselves and others
[5]. Motivation and competitiveness go hand in hand together. Individuals who are extremely
motivated are also extremely competitive as they know the way and the means to accomplish
their goals. On the other hand, other individuals use competition in a negative way. These
individuals use competition selfishly to achieve their goals without considering the
consequences to themselves and others [6].
Society places a great emphasis and pressure on competition. There is a controlling focus
on being competitive and successful [7]. This kind of focus can cause low intrinsic motivation
as the individuals may feel lost between the ways and the gains. This concept is known as the
hidden cost of reward. That is, it is having the opposite effect on the individual. So instead of
motivating them to win, it is causing them lower intrinsic motivation [8].
The current research problem focuses on how low morale and motivation of employees,
who feel they are not being recognized as valuable contributors to the system, and get no
rewards for the good work that they do, may lead to low productivity, loosing competitiveness,
and sometimes may lead to further undesired symptoms such as absenteeism and sabotage.
In order to stand on study importance, the current research is going to cover all aspects of
low morale and motivation and its effects on productivity and competitiveness. These two
important aspects are attributed to employee’s negative psychology. From the researchers point
of view these two factors are very important and it worth discussion.
The objectives of the current study aims to examine the effect of low morale and
motivation on employee's productivity and competitiveness. This research will try to attain the
following objectives:
To stand on the causes of low morale and motivation
To point out the effect of low morale and motivation on employee's productivity and
competitiveness.
2. Literature Review
Moral is an elusive quality which involves feelings, emotions, attitude and perception
towards the organization and its members. Positive moral is usually characterized by
discipline, confidence and willingness to perform.
Low moral can be attributed to many factors such as job security, lack of fair compensation
policy, uncertain business conditions, and excessive outsourcing practices. Low moral effects
company income, productivity, financial competitiveness, and effect organizational objectives
[9]. Low morale is an outcome of managerial behavior where managers addresses their
employees from atop-down command, and don’t communicate directly on work place issues
[10]. This kind of communication results in a gap between employees and managers, which in
turn leads to employee distrust, disrespect, and reduction of morale and workforce motivation
[11]. Low moral also causes employees to lose interest especially when managers don’t
appreciate employee’s efforts and tasks performed [12]. A costly indicator of low morale is
high employee’s turnover. This happens when employees leave their jobs as they feel unhappy
and have no incentives to stay. The negative effect of employee’s turnover is disconcerting
because of its great effect both financially and on productivity levels. Financially means, the
company has to hire new employees either by higher salaries or by additional recruiting
expenses. At the production level, the employees who leave, they will take with them the
knowledge, skills and ability that helped contribute to the goals, profit and performance of the
organization [13].
Absenteeism is another costly indicator of low morale. Unjustified absenteeism increases
cost and decreases productivity [14]. According to an article in The Leading Edge, “dissatisfied
employees or discontent with their bosses can have a high price tag”. [15]. Management should
work on controlling the effects of low morale throughout understanding of their employees’
potential and their core work processes, understanding their abilities, enriching employees’ job
and recognizing their achievements [16].

124
The second perspective of this study is motivation. Motivation has been the core of many
studies. The early studies carried out in the eighties and nineties of this century have discussed
this concept widely. Mitacheel (1982), and Steers & Peter (1983), Baron (1991) stated that
motivation is the internal process that activate, guide and maintain behavior [17]. At the
beginning of the twentieth century other researchers such as Buchanan & Hueznski (2004),
stated that motivation is “the cognitive decision making process through which goal directed
behavior is initiated, energized, directed and maintained” [18]. Butler & Rose (2011), defined
motivation as the course of movement, the inspiration behind activity, and the feeling within
individual that makes him want to achieve personal need or expectation [19]. Recently Osabiya
(2015) defined motivations as the driving force within individuals by which they attempt to
achieve specific goal in order to fulfill some needs or expectations [20].
Achieving sustained high levels of performance is usually the aim of every organization.
Employees are considered the main tools of such aimed performance, and motivation is
considered the mean to achieve such performance. In other words, high attention should be
given to methods of motivating individuals in order to achieve the desired goals.
The current research study is linking motivation with productivity. The recent research
studies indicated a positive correlation between motivation and the level of productivity in
many organizations. Companies that use motivation to enhance a higher level of productivity
are considered a world class and compete globally, and which in turn create sustained
competitiveness [21]. Also research indicated that a person who is motivated works hard,
sustains a pace of hard work, and has self-directed behavior to achieve the desired goals. On
the other hand, low motivation with low productivity is often considered to be the problem. To
fully understand motivation, studies stated that, there are two types of motivation extrinsic and
intrinsic. Extrinsic motivation is concerned tangible, real rewards that are received by the
employee while intrinsic motivation is a built inside the person and which is natural in nature
[22]. According to individual’s psychology, there is an inherent set of needs in each individual
which can be satisfied through rewards of their job work performance [23].
The other element concerning this study is productivity. Productivity is defined as the
effective and efficient utilization of all resources, material, labor, capital, information and time
[24]. Low productivity is indicated through many signs which include poor quality of domestic
outputs, lack of competitiveness of products in international markets, shortages of skills, low
production technology, poor industrial relations, and poor human resource management.
Research finding indicate that there is a link between motivation and productivity in the
industrial sector. When an employee’s needs are met, it means that he derives his satisfaction
from the job and eventually it creates a motivated employee [25]. All motivation theories tend
to support the idea that a motivated worker willingly uses his ability in a constructive way to
accomplish the tasks assigned to him. A motivated employee’s work attitude is wholesome and
tends toward high performance and productivity [26].
In General, high motivation and high morale leads to high productivity as it was mentioned
in the introduction of this research paper. There is not always a positive correlation between
them. Close supervision, time studies, and scientific management can be used in order to reach
a high level of productivity, Renis Likert as it was stated earlier he mentioned different
combinations of morale and productivity: high morale and low productivity; high morale and
high productivity; low morale and high productivity; and low morale and low productivity.
Managers have to work for improving the morale of their employees, as high morale makes the
work a better working environment, and it helps the organization to attain its goals easily [27].
The final element of the study variables is competitiveness. As early stated, motivation
and competitiveness go hand in hand together, competition is found in all aspects of life, even
between brothers and sisters. Competition has great impact on the motivation of an individual.
Some individuals use competition in a positive way, they use it in order to gain personal growth
and to help them reaching their potential goals. Other individuals use competition in a negative
way. These individuals use competition selfishly to achieve their goals without considering the
consequences to themselves and others [28]. Individuals who are extremely motivated are also
extremely competitive as they know the way and the means to accomplish their goals.

125
3. Method
The primary data needed for the study objectives were collected through a survey
conducted among Different Jordanian industrial companies. The total listed industrial
companies in Jordanian are 64 companies, and a total of 580 employees working in different
managerial levels. The research study sample size is 295 employees which were determined
using the sample size formula at 95% confidence level, and 4 confidence interval, and a total
of 580 employees which constitute the study population.
A questionnaire has been designed for this purpose, and it was distributed randomly to the
working employees taking part in actions and activities on carrying out business in their
companies in November 2015, and to different managerial levels. The number of valid
questionnaires analyzed were (276) questionnaires out of (295) distributed which constitute
93.5% of total questionnaires distributed. The questionnaire was designed out of 24 questions,
which (9) questions were specified to low morale, (8) questions were specified to low
motivation and finally (7) questions were specified to Productivity and Competitiveness.
Resolution data were analyzed using the statistical program Smart PLS.
Quantitative data were collected using a self-administered questionnaire, in which the
employees were asked to state the likelihood (on a 5-point scale: [5] strongly agree; [4] agree;
[3] neutral; [2] disagree; [1] strongly disagree).
Other Data is collected from secondary sources. Secondary data is collected from articles
published by the well-known periodicals, books, and dissertations.
3.1: Statistical Analysis
The Statistical Package for Social Sciences Smart PLS was applied in analyzing the data
received; Statistical Analysis tools include the followings:
Descriptive Statistics, mainly frequencies and percentages, were used to analyze sample
characteristics according to job, educational level, professional certificates, and experience.
Correlation, Inter-correlation, Regression, and Path Coefficient were used to analyze and
describe study variables from a statistical point.
Reliability Test using Cronbach’s Alpha was used to test the reliability of the scale.
3.2 Research Design (Exhibit-1)
Research design is formed out of three main elements which constitute the research design.
The Model in Exibit-1 shows the effect of low morale, and low motivation on the
Productivity and Competitiveness.
3.3 Study Hypothesis
H1: There is an effect of low morale on low motivation.
H2: There is an effect of low morale on Productivity and Competitiveness.
H3: There is an effect of low motivation on Productivity and Competitiveness.
3.4 Data Analysis and Findings
3.4.1: Reliability test:
Low Motivation
(MV)
Productivity & Competitivenes
s
Low Morale
(ML)
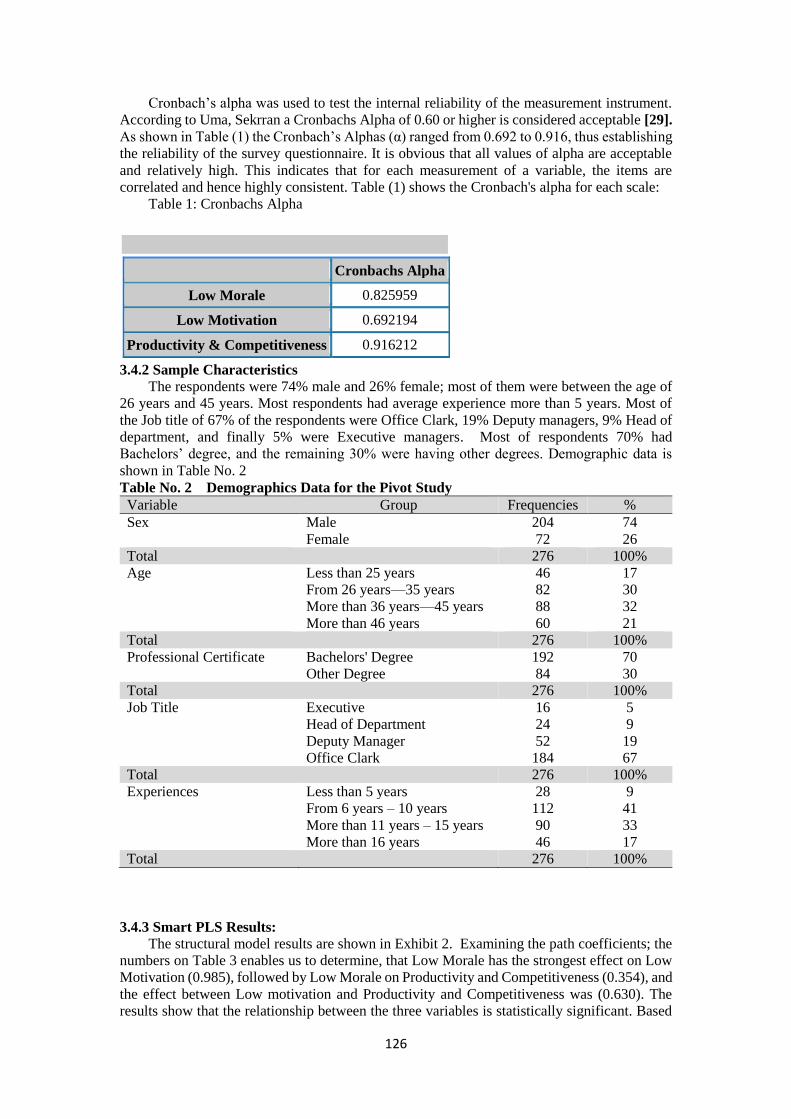
126
Cronbach’s alpha was used to test the internal reliability of the measurement instrument.
According to Uma, Sekrran a Cronbachs Alpha of 0.60 or higher is considered acceptable [29].
As shown in Table (1) the Cronbach’s Alphas (α) ranged from 0.692 to 0.916, thus establishing
the reliability of the survey questionnaire. It is obvious that all values of alpha are acceptable
and relatively high. This indicates that for each measurement of a variable, the items are
correlated and hence highly consistent. Table (1) shows the Cronbach's alpha for each scale:
Table 1: Cronbachs Alpha
Cronbachs Alpha
Low Morale 0.825959
Low Motivation 0.692194
Productivity & Competitiveness 0.916212
3.4.2 Sample Characteristics
The respondents were 74% male and 26% female; most of them were between the age of
26 years and 45 years. Most respondents had average experience more than 5 years. Most of
the Job title of 67% of the respondents were Office Clark, 19% Deputy managers, 9% Head of
department, and finally 5% were Executive managers. Most of respondents 70% had
Bachelors’ degree, and the remaining 30% were having other degrees. Demographic data is
shown in Table No. 2
Table No. 2 Demographics Data for the Pivot Study
Variable Group Frequencies %
Sex Male 204 74
Female 72 26
Total 276 100%
Age Less than 25 years 46 17
From 26 years—35 years 82 30
More than 36 years—45 years 88 32
More than 46 years 60 21
Total 276 100%
Professional Certificate Bachelors' Degree 192 70
Other Degree 84 30
Total 276 100%
Job Title Executive 16 5
Head of Department 24 9
Deputy Manager 52 19
Office Clark 184 67
Total 276 100%
Experiences Less than 5 years 28 9
From 6 years – 10 years 112 41
More than 11 years – 15 years 90 33
More than 16 years 46 17
Total 276 100%
3.4.3 Smart PLS Results:
The structural model results are shown in Exhibit 2. Examining the path coefficients; the
numbers on Table 3 enables us to determine, that Low Morale has the strongest effect on Low
Motivation (0.985), followed by Low Morale on Productivity and Competitiveness (0.354), and
the effect between Low motivation and Productivity and Competitiveness was (0.630). The
results show that the relationship between the three variables is statistically significant. Based
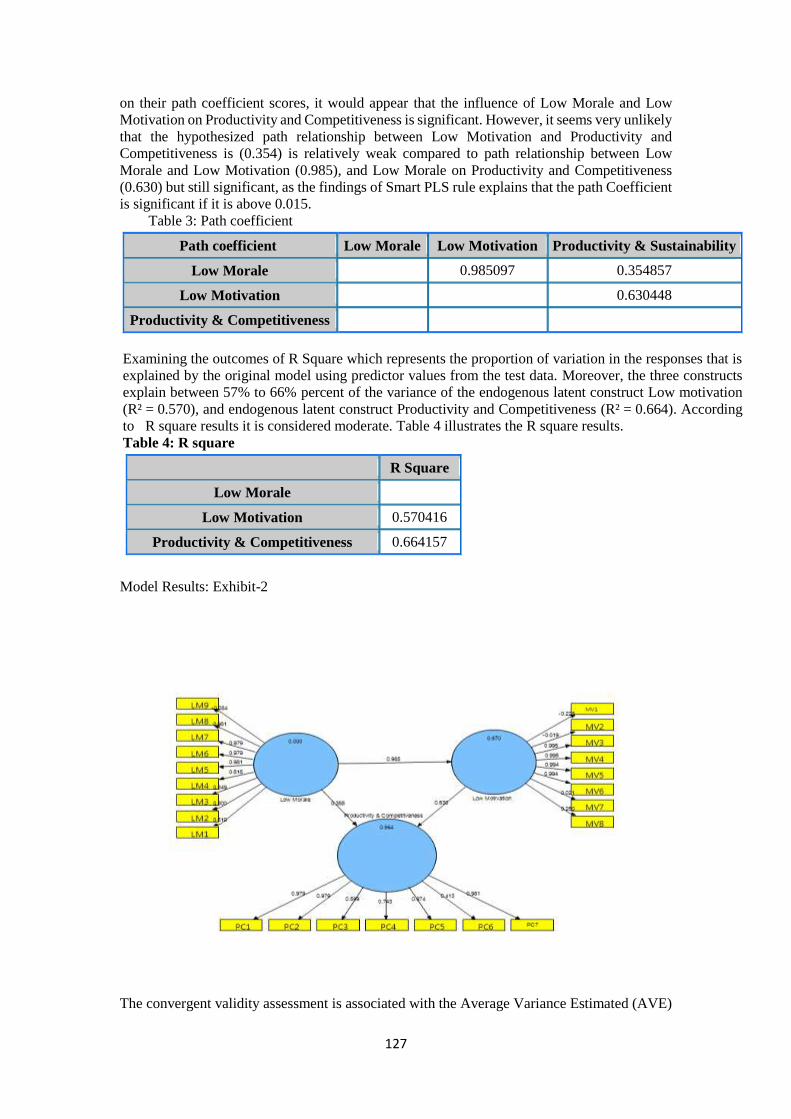
127
on their path coefficient scores, it would appear that the influence of Low Morale and Low
Motivation on Productivity and Competitiveness is significant. However, it seems very unlikely
that the hypothesized path relationship between Low Motivation and Productivity and
Competitiveness is (0.354) is relatively weak compared to path relationship between Low
Morale and Low Motivation (0.985), and Low Morale on Productivity and Competitiveness
(0.630) but still significant, as the findings of Smart PLS rule explains that the path Coefficient
is significant if it is above 0.015.
Table 3: Path coefficient
Path coefficient Low Morale Low Motivation Productivity & Sustainability
Low Morale 0.985097 0.354857
Low Motivation 0.630448
Productivity & Competitiveness
Examining the outcomes of R Square which represents the proportion of variation in the responses that is
explained by the original model using predictor values from the test data. Moreover, the three constructs
explain between 57% to 66% percent of the variance of the endogenous latent construct Low motivation
(R² = 0.570), and endogenous latent construct Productivity and Competitiveness (R² = 0.664). According
to R square results it is considered moderate. Table 4 illustrates the R square results.
Table 4: R square
R Square
Low Morale
Low Motivation 0.570416
Productivity & Competitiveness 0.664157
Model Results: Exhibit-2
The convergent validity assessment is associated with the Average Variance Estimated (AVE)

128
value. The evaluation of validity criterion in table 4 illustrates that the AVE values of Low
Morale (0.531), Low Motivation (0.508), and Productivity and Competitiveness (0.701) are all
above the cutoff point of 0.50. Therefore, all reflective constructs demonstrate high levels of
convergent validity [30].
Table 4: AVE
AVE
Low Morale 0.531549
Low Motivation 0.508221
Productivity and Competitiveness 0.701575
4. Conclusions & Recommendations
4.1 Conclusions
The results show that the relationship between the three variables is statistically
significant. Based on their path coefficient scores, it would appear that the influence of Low
Morale and Low Motivation on Productivity and Competitiveness is significant, so the research
hypothesis stating that Low Morale and Low Motivation affects Productivity and
Competitiveness and makes on limiting its consequences.
The Real cause behind low employee morale can include uncertain business conditions, limited
upward rewards, job security issues, lack of fair compensation policy, and excessive
outsourcing policy.
4.2 Recommendations
Management should ensure a positive work environment which encourages confidence,
discipline, and willingness to perform the job in the best possible manner.
Management should also work on strong and sustained compensation policies that bridge the
gap between the payrolls of the employees.
Management should work on increasing productivity by increasing employees’ satisfaction
through re-engineering systems and processes, providing education and training.
Encouraging practices that focus on learning of personal development competitive attitudes.
5. References
Rao, V.S.P., (2007), Human Resource Management. 2nd Ed. D.P. House, New Delhi. P203.
Renis Likert .
Stephen I. Duggah, (2014), Using Motivating Theories to Enhance Productivity in Cement
Manufacturing Companies in Nigeria: An Overview. The International Journal of Social
Sciences. Vol.20, No.1.
Ryckman, R. M. Thornton, B. & Gold, J. A. (2009), Assessing Competition Aviodance as
a Basic Personality Dimension. The Journal of Psychology Vol.143 No.2, pp 175-192.
Collier, S.A. , Ryckman, R. M. Thornton, R. & Gold, J. A. (2010), Competitive Personality
Attitudes and Forgiveness of Others. The Journal of Psychology. Vol.144, 535-543.
Collier, S.A. , Ryckman, R. M. Thornton, R. & Gold, J. A. (2010).

129
Ryckman, R. M. Thornton, B. & Gold, J. A. (2009).
Abuhamdeh, S. & Csikszentmihalyi, M. (2009). Intrinsic and extrinsic motivation orient
ion in the competitive context: an examination of person-situation interactions. Journal of
personality. Vol. 77. No. 5
Henry Sauermann and Wesley M. Cohen, )2008(What Makes Them Tick? Employee
Motives and Firm Innovation NBER .Paper No. 14443.
Henry Sauermann and Wesley M. Cohen )2008(.
Chungsup Lee, Jarrod Scheunemann, Robin Hall, Laura L. Payne (2012), Staff Morale &
Burnout: Prevention and Possible Solutions. The Office of Recreation & Park Resources,
University of Illinois: Department of Recreation, Sport & Tourism.
Zeynep Ton, Robert S. Huckman. (2008), Managing the Impact of Employee Turnover on
Performance: The Role of Process Conformance, Organization Science Vol.19 No.1 , pp.
56–68.
Lee, H.W& Liu, C.H. (2009), “The Relationship among Achievement Motivation,
Psychological contract and Work Attitudes. Social Behavior and Personality. Vol. 37 P321-
328
Julie Abbot, (2003) "Does employee satisfaction matter? A study to determine whether low
employee morale affects customer satisfaction and profits in the business-to-business
sector", Journal of Communication Management, Vol. 7, No. 4, pp.333 - 339
Julie Abbot, (2003)
H. C. Ngambi (2011), The relationship between leadership and employee morale in higher
education, African Journal of Business Management Vol. 5, No.3 , pp. 762-776.
Steers, R.M & Porter, L.W (1983). “Motivation and Work Behavior. Ens. 3rd Ed. New
York: McGraw-Hill.
Bucharan, D. & Huczynski, A (2004). Organization Behavior: An Introductory text 5th ed.,
Harlow: FT/Prentice Hall
Bulter, M. & Rose, E, (2011) Introduction toOrganizational Behavior, 1st Ed. London IPD.
Osabiya, B. J. ,(2015) The Effect of Employees’ Motivation on Organizational
Performance, Journal of Public Administration and Policy Research, Vol.7, No.4, pp62-75.
Stephen I. Duggah, (2014)
Bulter, M. & Rose, E, (2011)
Ozturk, E. O. (2012). Contemporary motivation theories in educational psychology and
language learning: An overview. The International Journal of Social Sciences, Vol.3, No.1
pp 33-46.
ILO: International Labor Organization
Nwasike J. (1991). “Increasing Productivity in the Nigerian Public Sector”. Proceeding of
a National Conf. on Productivity Abuja.
Stephen I. Duggah, (2014)
Likert, R. (1932). A technique for the measurement of attitudes. Archives of Psychology,
22(140), 1–55.
Collier, S.A., Ryckman, R. M. Thornton, R. & Gold, J. A. (2010).
Uma, Sekrran. Research Method for Business: A Skill Building Approach. 7th Edition,
John Wiley and Sons, New York; 2003.
Fornell, C., Larcker, D.F., (1981). Evaluating structural equation models with unobservable
variables and measurement error. Journal of Marketing Research 18 (1), 39-50.

130
STATIC COGNITIVE SIMULATION MODEL
EVALUATING THREATS SURVIVABILITY
OF COMPLEX TECHNICAL SYSTEMS
BOYKO V.D VYCHUZHANIN V.V
Odessa national marine university Odessa national marine university
Ukraine Ukraine
Abstract:
The paper presents a dynamic cognitive simulation model of complex technical systems
that allows monitoring the impact of adverse external influences and factors affecting units of
the system on its common state. Unlike previous models, which evaluated only static patterns
of the behaviors of complex technical systems, this model makes possible tracking changes of
the system over time. The model is constituted of a directed graph, and simulating the processes
of degradation and recovery of complex technical systems units in a discrete time mode. The
model can serve stand alone mode, as the core component, or part of the framework of decision
support system. It is also possible to use models for risk management for a complex technical
system in accordance with ISO 31000:2009.
Keywords: complex technical systems, cognitive simulation model
1. Static cognitive simulation model evaluating threats survivability of complex
technical systems
Today, decision support system widely used - both in form of a "situation room", and in
form of systems that collect and visualize information about the status complex technical
systems (CTS) and predict the further development of the situation. (Mallach, 2000)
In the case of CTS combination of object management and the context external
environment is a complex set of processes and factors that significantly influence each other.
Existing methods for the evaluation of threats and risks are largely static assessment of threats
to the functional, structural and cyber survivability of CTS. So accurate assessment of the
dynamic behavior of CTS under the impact of adverse external influences and factors affecting
survivability is facing difficulties as a "combinatorial explosion" which significantly
complicated tracking all possible scenario of CTS behavior. For example, cognitive simulation
model (CSM) ship power plant (Fig.1) in the minimum structural form has more than 130 units,
and static analysis generation about 1206 scenarios. (Boyko & Vychuzhanin, 2013) Applying
the dynamic component to model can significantly complicate it.

131
Fig. 1 – Example of minimal base CSM of ship power plant.
In this paper, a dynamic extension of the existing static model are proposed. This extension
is done by integrating into model nodes additional dynamic characteristics. These
characteristics can change the functional parameters of nodes that represents the real functional
performance in a model unit CTS.
Basic CSM CTC is a weighted directed graph, where nodes model CTS units, and directed
edges – inter-unit communications. Each node in model bind parameters determining the
performance of the real unit CTC, and with each edge – parameters defining the characteristics
of inter-unit communications.
At listed papers are discussed methods and techniques of analysis of the connection
between individual units and the complex overall all-state system survivability.
These approaches have connected a number of different aspects of threats to the
survivability of individual unit (Boyko, 2012). All three aspects – structural, functional and
cybernetic, which are characterized by structural, functional and cyber threats, respectively.
Structural threat determines the dependence of the effect of one unit on the overall survivability
of the CTS according to the "geographical" position the unit in the overall CTS hierarchy.
Functional performance criteria are used to determine the effect functional state of a single unit
for the total functional survivability (secondary functional performance) of CTS. Finally, cyber
threats, defines the role and position of the unit in the overall control of the complex and the
impact on the general state of the machine control CTC. Cyber threat can be considered as a
property of the system to maintain the observability and controllability in its context, where

132
observability - the system's ability to provide complete and accurate information about the
status of its units and inter-units communications and control - the ability to properly and
respond to control commands in a finite time.
According to the proposed approach for evaluating the structural, functional and cyber
threats survivability for each node CSM CTS is done by modeling pulses, which permits to
avoid complicated analytical calculations and accordingly simplifies software component of
the model. Therefore structural, functional and cyber survivability are evaluated by the
distribution modeling impulses along the orgraph of CSM CTC. Model complemented artificial
units - for the distributing of the diagnostic pulse addition nodes of "super-source" and "super-
receiver" are required. Upon receiving values of threats and risks for each of the system units
they are ranked in ascending order of threat, thus allowing to identify and account of potential
all-system risks.
From software realization point of view CSM CTS is combination of associative arrays
(dictionaries of terminology Python language). These dictionaries store the state, name and
parameters nodes CSM CTS, communication configuration between the nodes and the status
of these inter-unit communications. Furthermore, for each discrete point of time software model
stores vectors for each of simulating pulses. They are used for recursive modeling of
distributing pulses along the model. One of vectors represents a nodes status at time t, and the
other at time t + Δt, where Δt - discrete time step. Distribution of pulses is calculated by a
special algorithm which is implemented in python language. (Schult & Swart, 2008)
Along evaluating of the functionality of threats and risks, the model is complemented by
artificial nodes "super-source" and "super-receiver". "Super-source" is node, which is
connected with all "real" source-nodes of model (nodes which have no predecessor in graph).
"Super-receiver" is node, which is connected with all "real" receiver-nodes of model (nodes
which have no successor in graph). Cognitive simulation modeling for evaluating observability
and controllability of the model, models graph also is complemented by artificial units -
"sensors", and "controllers". Both may or may not have hardware analog in CTS, in the latter
case they simply presents external observer abstraction. Sensors presents nodes which receive
information of the status of units or inter-units bonds of CTS. Node controllers transmit control
signals to model units. Also, edges and nodes of model may carry a different parameters
depending on what type of resource connections ("substance - energy - information") they
model.
The initial value of CSM CTS units are stored in an external file, which can be set as a
dialect of JSON or YAML standard (see. Fig.2) - this is done to ensure simple serialization of
data from one side, and on the purpose make system data maximal language independent, "self-
describing" and easy to understand (Crockford, 2006). Also this approach beneficial from safety
and consistency of model software realization. In the extremal case, the model file can be edit
manually even in a text editor. In addition, plain text format allowed wide use of version control
system using the traditional centralized or distributed system of version control (svn, mercurial,
git), and successfully solve issues of distributed backup and software distribution scheme of
model data between different centers of decision-making support.
The output data of the model are table values with threats that can be displayed either as a
simple csv format (which allows them to further processing by simple command-line utils), or
in human formats json/yaml, or, if necessary, a fully automated processing and serialization
format – for example in xml.
{
"rej": "bin",
"row_razd": ";",
"decimal_razd":",",
"v":
{
"V01":{"V06":1},
"V02":{"V06":1},
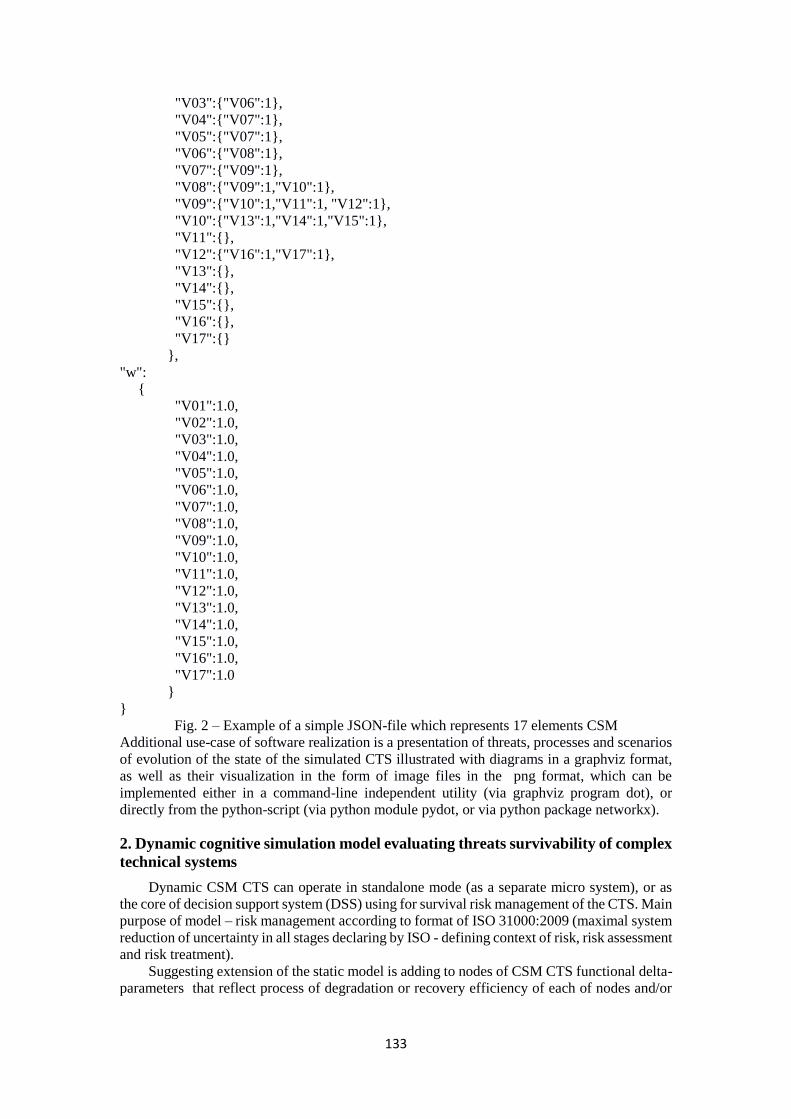
133
"V03":{"V06":1},
"V04":{"V07":1},
"V05":{"V07":1},
"V06":{"V08":1},
"V07":{"V09":1},
"V08":{"V09":1,"V10":1},
"V09":{"V10":1,"V11":1, "V12":1},
"V10":{"V13":1,"V14":1,"V15":1},
"V11":{},
"V12":{"V16":1,"V17":1},
"V13":{},
"V14":{},
"V15":{},
"V16":{},
"V17":{}
},
"w":
{
"V01":1.0,
"V02":1.0,
"V03":1.0,
"V04":1.0,
"V05":1.0,
"V06":1.0,
"V07":1.0,
"V08":1.0,
"V09":1.0,
"V10":1.0,
"V11":1.0,
"V12":1.0,
"V13":1.0,
"V14":1.0,
"V15":1.0,
"V16":1.0,
"V17":1.0
}
}
Fig. 2 – Example of a simple JSON-file which represents 17 elements CSM
Additional use-case of software realization is a presentation of threats, processes and scenarios
of evolution of the state of the simulated CTS illustrated with diagrams in a graphviz format,
as well as their visualization in the form of image files in the png format, which can be
implemented either in a command-line independent utility (via graphviz program dot), or
directly from the python-script (via python module pydot, or via python package networkx).
2. Dynamic cognitive simulation model evaluating threats survivability of complex
technical systems
Dynamic CSM CTS can operate in standalone mode (as a separate micro system), or as
the core of decision support system (DSS) using for survival risk management of the CTS. Main
purpose of model – risk management according to format of ISO 31000:2009 (maximal system
reduction of uncertainty in all stages declaring by ISO - defining context of risk, risk assessment
and risk treatment).
Suggesting extension of the static model is adding to nodes of CSM CTS functional delta-
parameters that reflect process of degradation or recovery efficiency of each of nodes and/or

134
edges of CSM CTS, which permits transition from static assessment of the survivability of the
system to evaluation based on dynamic view of changing characteristics of CSM CTS.
Let, be a weighted, directed acyclic graph:
, (1)
and
, (2)
where V – a plurality of nodes;
E – a plurality of directed edges;
ui – node number i;
uj – node number j;
eij – directed edge, which connect nodes vi and vj;
k – number of nodes in the graph.
Change units CTS states are defined by four groups of factors: the natural elements
failures, restoring unit functionality, shutdown when triggered means of emergency protection
and reconfiguration actions of external impact. Connections between elements are all defined
and stationary in time, so that at any time the state of the element can be set as an element of
health and of other elements. Signs of system performance unchanged over time and allow
uniquely identify the state of the system at the aggregate state of its elements.
Add to model following vector:
, (2)
where D(u) – function of dynamic delta-parameters model nodes;
δ – array of dynamic delta-parameters;
δi – dynamic delta-parameter of node ui;
ui – node number i;
k – number of nodes in the graph.
Dynamic delta-parameters model function (vector) D (u) using for prediction state of CSM
CTS nodes per discrete time steps by superposition. Then re-determination "top-list" of
threats and risks survivability recalculated.
A positive value of D(u) for a particular system node (δi for node ui) would mean that the
functional unit operation is increased and thus simulating unit recovery. A negative value D(u)
would mean that the functional unit operation is reduced and thus simulating unit degradation
because of natural causes (wear) or as a result of destructive factors and adverse effects.
Condition of nodes dynamic characteristics at each instant of discrete time defined by the
following relation:
, (3)
where t – instant of discrete time;
wi – numerical expression of nodes condition (0 – node out of order);
δi(t) – value of dynamic characteristics for node with number j at moment of discrete
time t;
k – number of nodes in the graph.
So, from relation (3) we can get recursive relation expressing difference between condition of
node at any moment of discrete time:
(2.4)
Thus, for the vector of discrete time-values T = 0,1,2,..., t is possible to obtain a series of images,
graphs, determine the development of the state CSM CTS in time.

135
Dynamic delta-parameters can either remain stable or vary at each step of discrete time – in the
simplest case it can be left unchanged. In a more complex use-case it changes at each step
depending on the expert assessment or technical information retrieval systems with CTS.
3. The algorithmic implementation of the delta-parameters vector
Vector D(u) at the program level is implemented as a single JSON/YAML standalone
independence file (Fig. 3). Thus, its filling and editing can be performed either manually or
automated manner. Additional advantage of using such file format is that it is already facilitate
the integration of the dynamic component of an existing CSM CTS. On level of software
realization, dynamic change of nodes CSM CTS has been implemented in two different ways.
The first way – a simple summation of the dynamic characteristics from delta-parameters
vector with the values of nodes CSM CTS. Such solution has the advantage that greatly simplify
software implementation and scaling of model. Also overall clarity of the model turns simpler.
On the other hand, the expansion and complication of the model (for example, the addition
complexity of connections or implementation into model complex variable cross-dependencies
and dynamic characteristics) may be much more complicated and demands additional time and
resources. This complication can be partially realized by supplementing CSM new connection
and nodes which will be put in an additional communication and solve the problem analytically,
rather than systemically.
The second way - is transition from a purely oriented graph computer model to the object-
oriented. This method involves a common graph approach extended with object-oriented
representation of nodes, where each node is a separate entity, and common analysis made with
use of multi-agent simulation methods and object-oriented programming paradigm. This will
allow involvement of different characteristics for different nodes and cross-link units to
complement conventional bonds IF... THEN (for example, "to ensure efficiency, unit must..."),
which in the future perspective allow build deeper simulation model of behavior CTS.
{
"rej": "D(u)",
"delta":
{
"D01":0.5331,
"D02":0.5695,
"D03":0.6422,
"D04":0.4578,
"D05":0.7847,
"D06":0.6428,
"D07":0.0975,
"D08":0.6719,
"D09":0.2234,
"D10":0.6864,
"D11":0.3974,
"D12":0.5995,
"D13":0.9379,
"D14":0.4000,
"D15":0.6365,
"D16":0.9571,
"D17":0.7811
}
}
Fig. 3 – Example of JSON-file D(u) for the small vector of seventeen elements.
On the level of software building has been used discrete-event simulation framework SimPy
(Muller, Vignaux, & Chui, 2014), based on standard Python, which allow modeling simulation
of the interaction of distributed objects using the object-oriented model (Matloff, 2008). Each

136
node has been formed by a call to an individual constructor objects. Initialization of the model
has several stages. First JSON-file has been read, then iteratively object constructor (as python
generator with special method yield) has been called to build required set of objects with the
specified characteristics of the model.
The advantage of this way is the ability to better simulate the behavior of CTS, and therefore
more accurate analysis of the model. The downside – complexity of all-system representation
and some loss of transparency for an untrained operator.
3. Risk management issues
According to ISO 31000: 2009 risk assessment process should include the following steps:
risk identification, risk analysis and risk evaluation (ISO, 2009), (Knight & others, 2010).
Information system for evaluating risks and threats, based on CSM CTS may be used on all
stages of risk assessment as a standalone micro decision support system (DSS) that evaluates
risks and provides all necessary information for decision support. Such a way using of CSM
CTS possible at all the stages of ISO format risk management and equally may be used for
preventive measures to identify and reduce risks of CTS. Information for CSM CTS can be
provided by the systems of technical diagnostics and/or expert assessments of CTS operator.
Using of CSM CTS can improve the effectiveness of risk management at all stages, allow
monitoring the impact on CTS caused by both external and internal adverse influences. Model
also allow modeling and identification such complex scenarios as "domino effect", cascade and
cumulative (accumulation) degrading of units. Dynamic extension of model allows monitoring
and identification risks on a wide range of time and "on the go" analysis.
At the stage of risk identification the main task is creating complete list of risks. It is
important to identify not only the "real" risks but also "secondary" "silent" risks, related to the
decision not to action or to use opportunity. The risks included in the list irrespective to
controlled or not their source, even if the source or the reason may not be obvious. One of the
benefits of information systems based on CSM CTS is the ability to monitor the impact and
response to the risks of CTS with non-obvious sources and causes.
On risk analysis stage one of the first tasks are examination of causes and sources of risk,
and taking into account existing management tools, their efficiency and effectiveness. ISO
standard emphasizes that the effects of the risk can be expressed in the form of tangible or
intangible impacts. In some cases more than one numerical value or describing parameter to
specify the degree of feasibility, impact and risk for various times, locations, groups or
situations. At the stage of risk analysis CSM CTS may be used not only to determine the effects
of moves to management risk and consideration possible scenarios for risk management, but
also introduces an additional "categorical framework", which determines the overall risk as the
sum of the structural, functional and cyber risks of CTS.
Risk evaluation stage based on preparing for decision-making, based on the initial results
of the risk analysis for evaluation of exposure to risk and establishing priority to reduce risk.
CSM CTS is used as an "interactive map" of possible alternative states of CTS units, ranked by
criteria of the categorical framework of risk – their structural, functional and cyber impacts.
This saves time and simplifies the process of making decisions on risk control.
Thus CSM CTS can be effectively used for risk management process at the all
aforementioned stages. Deployment such a system will enhance the efficiency of the staff,
reduce the time of decision-making and increase the percentage of correct decisions on damage
control. In addition, the use of the system will increase the visibility and transparency of the
processes.
In the future, the proposed model can be extended by an analysis of the dynamics of the
component, where each dynamic parameter may be determined independently, and can be
calculated on the basis of statistics collected by means of technical diagnostics and the hardware
and software interfaces. On the basis of these statistics can be carried out ahead prediction of
each of the elements, which can be carried out both locally and centrally – with the collection
of statistics from all the available CTS.
137
4. Conclusion
CSM CTS presented in a paper was designed for using as a DSS reference core and can
be used at any stage of risk management: defining context of risk, risk assessment and risk
treatment. Main purpose of the model is identification and prediction threats by modeling
dynamic changes in the units of CTS, as well as providing the operator (or decision maker),
visualization of current systems state and the possible scenarios of the situation.
The proposed model significantly extends and complements the existing approach for
determining aspects of the impacts, as components of the model that are not static, but dynamic.
This allows evaluate effect of individual units state to whole system and monitoring scenarios
of general processes of the CTS. It additionally makes possible modeling time-extended
processes of degradation and/or recovery of individual parts of CTS.
Modeling of dynamic processes are performed using a process-based discrete-event
simulation framework SimPy, based on standard Python. As interface files computer model use
an open standard format JSON or YAML, which allow CSM CTS to operate its nodes as an
independent entity objects programming model, and simplifies standalone operation of CSM
CTS or its integration into DSS.
References
Boyko, V. D. (2012). Metodika otsenki zhivuchesti sudovykh tekhnicheskikh sistem.
[Survivability evaluation approach for vessel technical systems]. In Sbornik nauchnykh
trudov SWorld (pp. 37–39). Odessa.
Boyko, V. D., & Vychuzhanin, V. V. (2013). Kognitivnoe modelirovanie ocenki
zhivuchesti sudovoj jenergeticheskoj ustanovki [Cognitive modeling evaluation of the
survivability of the ship’s power plant]. In Mezhdunarodnaja nauchno-tehnicheskaja
konferencija “Informacionnye sistemy i tehnologii” (IST-2013) (pp. 195–197). Nizhny
Novgorod.
Crockford, D. (2006). The application/json media type for javascript object notation
(json). Retrieved from http://tools.ietf.org/html/rfc4627.txt
ISO, I. (2009). 31000: 2009 Risk management–Principles and guidelines. International
Organization for Standardization, Geneva, Switzerland.
Knight, K. W., & others. (2010). AS/NZS ISO 31000: 2009-the New Standard for
Managing Risk.
Mallach, E. G. (2000). Decision Support and Data Warehouse Systems (1st ed.).
McGraw-Hill Higher Education.
Matloff, N. (2008). Introduction to discrete-event simulation and the simpy language.
Davis, CA. Dept of Computer Science. University of California at Davis. Retrieved on
August, 2, 2009.
Muller, K., Vignaux, T., & Chui, C. (2014). SimPy: discrete-event simulation in
Python. SimPy Development Team.
Schult, D. A., & Swart, P. (2008). Exploring network structure, dynamics, and function
using NetworkX. In Proceedings of the 7th Python in Science Conferences (SciPy
2008) (Vol. 2008, pp. 11–16).

138
Constructing Sustainability and
Competitiveness in Jordanian Private
Universities through a SWOT Analysis Model
Majd Hassan Rayyan (PhD)
University of Petra
Jordan
Abstract:
Privatization of higher education is gaining momentum in some Arab countries, such as
Jordan, the United Arab Emirates, Qatar and Egypt. In Jordan, for instance, private universities
have gained recognition and accreditation in providing quality education and were able to
attract Jordanian as well as Arab students, who are unable to be enrolled in public universities.
However, as sustainability and competitiveness are two concerns facing higher education
institutions, private universities in Jordan need to achieve a sustainable competitiveness to face
competition from other public and foreign universities in the region. The relationship of these
two dynamics to higher education, however, is not clearly stated which has obstructed an
effective strategic planning for constructing sustainability and competitiveness for Jordanian
private universities This paper aims to provide an analysis of the relation of sustainability and
competitiveness to higher education and offers a SWOT framework that analyzes private
universities internal strengths and weaknesses and external threats and opportunities which they
need to work on to sustain a competitive development.
Keywords: Sustainability, Competitiveness, Jordan, Private Universities, SWOT Analysis
Introduction
In their attempt to join a knowledge-driven economy, nations trust that higher education
is a major source of economic competitiveness but without qualified resources, higher
education institutions will be unable to function. Therefore, countries struggle to develop their
human resources skills through an emphasis on quality of teaching and learning. Thomson,
Strickland and Gamble (2008) argue, however, that to establish their resource abilities,
countries as well as corporations must recognize their resources’ strengths and competitive
advantage and develop those that drive sustainable competitiveness. Hence, universities, like
other organizations, need to pay attention to existing internal and external environmental factors
and asses their strengths and weaknesses to enhance the opportunities and decrease the threats
facing their operations.
Arab countries consider sustainability and competitiveness major issues facing universities
and higher education institutions. However, the relationship of sustainability and
competitiveness to higher education is not clearly defined which resulted in obstructing the
effective strategic planning for constructing sustainability and competitiveness for Arab
universities. Badran (2014) believes, for instance, that higher education in the Arab countries
was unable for long to meet market demand for certain skills. A key point in this regard is the
privatization of higher education which is gaining momentum in some Arab countries, such as
Jordan, Egypt, Lebanon and other Gulf countries such as the United Arab Emirates and Qatar
who also have opened their doors to foreign universities in order to internationalize their higher
education provision and standards. These foreign universities are competing with the national
universities in their quest to gain a sustainable competitiveness in higher education.

139
A situation of concern in this direction is the Jordanian private universities who acquired
recognition in providing an established higher education institutions, gained Arab and foreign
accreditations and succeeded in attracting and enabling Jordanian as well as Arab students to
be enrolled in its programs. However, private universities in Jordan have their weaknesses and
threats which limited their ability to accomplish sustainability and competitiveness due to
several factors among of which is the competition from other public and foreign universities in
the region.
Study Objectives
The aim of this study is two folds:
Provide an analysis of the relation of sustainability and competitiveness to higher education
and
Offer a SWOT framework of Jordanian private universities strengths, weaknesses,
opportunities and threats that they should consider in their endeavor to achieve sustainability
and competitiveness in higher education.
Relevance of Sustainability and Competitiveness to Higher Education
Scholars maintain that competitiveness is a major issue at the national as well as corporate
levels (Rusinko, 2007; Kuh, 2009). At the national level, meanwhile a country’s
competitiveness describes a nation’s ability to effectively manage its human resources and
competencies; sustainable competitiveness of a country describes the process of identifying the
key factors that support national competitive advantage to achieve better quality of life for the
population over time (Vargas-Hernández, J. G. & Luis Vladimir, 2013). The concept of
“International competitiveness” was provided by Porter in his book “The Competitive
Advantage of Nations”, who also combined the concept of sustainable development with
competitiveness (Esty & Porter, 1998). Scholars maintain in this regard that the most enabling
factors of a country’s sustainable competitiveness are macroeconomic stability, openness to the
global environment and sound social infrastructure for investment in human development in
education and healthcare. Moreover, to have efficient businesses, countries should provide
transparent legal environment for investors and entrepreneurs that support their futuristic
competitive advantages.
Corporate competitiveness, on the other hand, describes an organization’s continuous
productivity through cost effectiveness or product variation and constant improvement to
remain innovative ahead of the competitors (Vargas-Hernández, J. G. and Luis Vladimir, 2013).
Based on these facts, Henard (2010) maintains that as any knowledge driven economy
requires educated and capable work force to compete and excel in the ever changing and
complex business environment, the role that higher education institutions play in the nation’s
building, economic competitiveness and human resource development is totally acknowledged.
Moreover, signifying higher education importance, higher education and training have been
located at the fifth pillar within the World Economic Forum Global Competitiveness Index.
This pillar measures the quality of higher education and extent of staff training by business
leaders to ensure continuous increase of skills and capabilities (WEF, 2015). Cusick (2009) also
considered the role that academic institutions play and asserted their needs to search for
strategies that enable them develop and incorporate sound sustainability and competitiveness
in their operations. Moreover, it is evident that entrepreneurs’ growing interest and demand to
invest in higher education, over the past decades, have increased competition among and
between private and public higher education institutions which granted students better and
varied choices of institutions and academic disciplines.
Development of Private Higher Education in Jordan
Higher education in Jordan started in 1962 with the establishment of Jordan public university,
which started with 69 students and few faculty members. Currently, there are 30 universities in

140
Jordan (10 public and 20 private), about 299,324 students, and 8823 faculty members
(MoHESR, 2016).
The rise of private, for profit, universities in Jordan came after the Jordanian Council of Higher
Education authorized the establishment of the first private university (Amman University) in
the early 1990s in response to a growing demand of higher education. Currently, there are
twenty private universities; two of them are registered as regional universities (The World
Islamic Science & Education University and Arab Open University). Table 1 illustrates private
universities in Joran according to their date of establishment.
Since their establishment, private universities have seen a rapid increase in enrollment which
grew by about 18 percent annually from 36,642 to 55,744 during the period from 2000 to 2006.
According to the Ministry of Higher Education and Scientific Research statistics (2016) the
current enrolled students in private universities in the academic year 203/2014 at 75,110
thousand students (72329 undergraduate and 2781 graduate students), out of them 16,840
thousand undergraduate and 576 graduate students come from Arab and foreign countries.
Moreover, the total of faculty members at private universities in 2013/2014 reached 8823
among them 621 Arabs and 125 foreigners (MoHESR, 2016). In the academic year 2013/2014
a total number of 16024 students have graduated from private universities compared to 41022
graduates from public universities (MoHESR, 2016).
Table 1: Private Universities according to their date of Establishment
Name Date of
Establishment Website
1 Al-Ahliyya Amman University 1990 www.amman.edu
2 Jordan Academy of Music 1990 www.jam.edu.jo
3 Princess Sumaya University (PSU) 1991 www.psut.edu.jo
4 Applied Science University 1991 www.asu.edu.jo
5 Philadelphia University 1991 www.philadelphia.edu.jo
6 Al-Isra University 1991 www.isra.edu.jo
7 Petra University 1991 www.uop.edu.jo
8 Al-Zaytoonah Private University 1992 www.alzaytoonah.edu.jo
9 Jerash Private University 1992 www.jerashun.edu.jo
10 Faculty of Educational Sciences &
Arts-UNRWA 1993 www.fesa.edu.jo
11 Zarqa University 1994 www.zpu.edu.jo
12 Irbid National University 1995 www.inu.edu.jo
13 Amman Arab University 1997 www.aau.edu.jo
14 Arab Open University (Regional) 2002 www.aou.edu.jo
15 Jordan Applied University College of
Hospitality and Tourism Education 2004 www.jau.edu.jo
16 Middle East University 2005 www.meu.edu.jo
17 Jadara University 2005 www.jadara.edu.jo
18 Ajloun National University 2008 www.anu.edu.jo
19 The World Islamic Science &
Education University (Regional) 2008 www.wise.edu.jo
20 American University of Madaba 2013 www.aum.edu.jo
Source: Ministry of Higher Education and Scientific Research, 2016 http://www.mohe. gov.jo
/ en/Pages/PrivateUniversities.aspx#sthash.hBAAPksG.dpuf
Fundamentals of A SWOT Model
A SWOT model illustrates the Strengths, Weaknesses, Opportunities and Threats of work
organizations. Specifically, SWOT analytical framework can be achieved by collecting needed
information from the environment that assists the organization in evaluating the challenges and
strong points that offer it opportunities in order to set a strategic action plan for achieving the

141
objectives (Singh, 2010). Strengths and weaknesses describe the internal factors that are
responsive and controllable by the management who has the main obligation to handle them.
Opportunities and threats constitute the external uncontrollable environmental factors that
have positive and/or negative impact on an organization’s operations (Helsloot and Jong, 2006).
The Internal Factors: Strengths and Weaknesses
Strengths: include the power factors that help an organization maintain a continuous and
effective operation (such as employing skillful and experienced employees, product branding,
reliable resources provision and supply, substantial assets, advanced technology, innovation,
strong culture…etc.).
Weaknesses: include the challenging factors that obstruct the easy flow of operations and
generate difficulties for the organization (such as dissatisfied or unqualified employees,
outdated technology, lack of capable and visionary leadership, ineffective marketing strategy,
inadequate location, bureaucracy, weak culture…etc.)
The External Factors: Opportunities and Threats
Opportunities: include unmanageable but good factors for the organization that reside in
the external environment which require the organization to hold on them and use them
competently for better performance (such as positive shifts in the economic, social,
governmental, technological matters, or legislative matters..etc.)
Threats: reside in the external uncontrolled and hostile factors that have negative impact
on the operations of the business. Similar to the opportunities, the organizations must screen
and classify the possible threats before their occurrences (such as intensifying competition from
new entrants, political insecurity and conflicts, social unrest, bad reputation, governmental
pressures, terrorism…etc.). Figure 1 illustrates the external and internal factors in the SWOT
model.
A SWOT Framework for Private Universities in Jordan
The value chain analysis was provided by Porter (1990) to link an organization internal
ability with its external opportunities. Providing a SWOT analysis for higher education
institutions is used, as an assessment or quality control tool, to alert the university
administration, faculty and staff of the points of strength and weaknesses in their educational
systems as well as the environmental factors that might enhance or obstruct their operations.

142
Therefore, setting a SWOT model can impact the university’s decisions on all matters including
teaching, planning, financial and technological activities.
This section presents a SWOT framework for Jordanian private universities, illustrated in
Table 2. The framework outlines the internal strengths and external opportunities that have
positive impact which universities need to sustain and pursue. The framework also outlines the
challenging factors embedded in the internal weaknesses and external threats which universities
need to regulate and control in their search for sustainability and competitiveness.
Table 2: A SWOT Framework of the Internal and External Factors facing Private Universities
in Jordan
Positive Factors
(Strengths & Opportunities)
Negative Factors
(Weaknesses and Threats)
In
tern
al
Fa
cto
rs Strengths Weaknesses
Providing alternate HE institutions
choices for students and the society
Reputation of value education
Geographic location covering many
areas of the country
Offering broad disciplines and subjects
Extensive faculty research
Lack of an integrated strategy for HE
Modest impact on local community
Inconsistency between graduates’
output and academic research and the
needs of society
Students’ unrest and violence
Reputation and status
E
xte
rnal
Fact
ors
Opportunities Threats
Economists’ support
Attracting and retaining qualified
faculty members
Increased demand on higher education
especially from refugees of the
neighboring countries.
Fostering brand names in HE
Government policies and regulations
Accreditation and Quality assurance
review
Economic and political situations
Societal appeal and demand for Higher
Education
Local and regional Competition
Lack of cooperation with other
Jordanian and Arab universities
Absence of linkage between secondary
and university education
Discussion of the SWOT Framework
The Positive Factors: Strengths and Opportunities
People in Jordan consider Private universities as constructive academic institutions that
provide an appropriate alternative option for a large number of students who are keen to pursue
their education but do not have the chance to be enrolled in public universities. Private
universities have developed a reputation for the educational services they offer to
students. Moreover, they employ capable and experienced faculty members who ensure that
students receive value education and who are recognized for their extensive research in varied
subjects and disciplines.
Another major strength about private universities is their geographical spreading.
Although many are established within the Greater Amman municipality but they are also found
in other major governorates of Jordan, such as Balqa, Irbid, Ajloun, Zarqa, Madaba, and Jerash.
The fact that they are located in these places means that students can have access to these
institutions. However, they need to expand their presence to the south of Jordan, and
specifically to the governorates of Aqaba, Tafileh and Maan. Private universities have the
opportunity of gaining the economists’ support who sustain that higher education in Jordan is

143
an important sector that constitute a major provision for the Jordanian economy, its balance of
payments and saving funds as Arab and international students studying in Jordanian universities
spend an average of USD 13,000 per year on university fees and about USD 500-1,000 per
month for living expenses (Chemonics International Inc., March 2006; Istaiteyeh, 2012). A
USAID Phase II, Jordan vision 2020 report recommended, therefore, that Arab and
International students be granted an admission quota in Jordanian universities as well as the
removal of restrictions on private universities’ admission of students that is limited to 8,000 for
each university and 800 students for each discipline. Moreover, as students’ families’ visits
constitute a major support to tourism, higher education should be assigned a seat on the
Jordanian tourism board (Chemonics International Inc., 2006).
The growing number of students, Jordanian as well as refugees from other neighboring
countries, demands a continued increase of higher education institutions (Kanaan et al., 2009).
This demand is an opportunity for private universities to expand and get more licenses for
establishment in other areas of the country.
The Negative Factors: Weaknesses and Threats
Private universities in Jordan have recorded accomplishments, however, being for profit
entities, therefore, they are struggling, like any other business, with different challenges that
they need to overcome. Challenges facing private universities stem from their major
weaknesses which include the educational systems, quality of programs, and demographic
challenges. Critics point out, in this regard, that private universities are losing their strength and
advantage due to difficulties arising from an ineffective and average performance, lack of a
well-defined strategy and inconsistency between their output of graduates and the needs of
society (Majdoubeh, 2015, Badran, 2014, Sabri, 2011). Badran (2014) believes, for instance,
that most of the universities in Jordan still adopt traditional based education far from raising
students’ ability for critical and analytical problem solving to many societal issues and
concerns. Moreover, Badran (2014) argues that universities have introduced enormous number
of graduates in terms of quantity more than quality in creativity, problem-solving, and
entrepreneurial skills. Moreover, scientific research in private universities is not up to
expectations although each private university is required, accordance to the Jordanian higher
education law, to allocate at least five percent of its budget for scholarship and research which
should be entirely fulfilled otherwise unused quantities be given back to the research fund of
the Ministry of Higher Education and Research (MoHER).
Among the major threats that confront private universities are conformity with
accreditation requirements. Unlike public universities, private universities in Jordan are subject
to the accreditation and quality assurance system instituted in 2007 by the Higher Education
Accreditation Commission (HEAC) that is responsible to evaluate, inspect and accredit higher
education institutions to guarantee their compliance with stated higher education regulations.
Accreditation is granted to private universities on several measures such as teaching, learning-
assessment, student achievement, student support and guidance, learning resources, and quality
management. However, because there is no comprehensive assessment tool, each Jordanian
university is responsible to set its own standards.
Competition from other Jordanian universities for students and faculty also put threat in
front of private universities in Jordan. Regional competition from other universities in some
Arab countries in the MENA and Gulf region that are undergoing a process of privatization and
internationalization of higher education (Mazawi, 2004).
Conclusion
This study aimed to explore the factors that can impact the ability of Jordanian private
universities to build and create sustainability and competitiveness. The analysis revealed that
in order to be supportive to competitiveness, private universities should have a strong academic
culture that is alerted to the mentioned points of strengths and weaknesses and fit them in all
its policies and activities. It is important for private universities to be primary initiators of

144
social responsibility, idol in moral conduct, considerate of environmental issues, and caring of
faculty and students’ safety and satisfaction. Moreover, to remain competitive private
universities must be flexible and open to constant change. Therefore, the faster private
universities can adapt to technological changes or new educational methods, the more rapidly
they will present modern quality education. Moreover, private universities need to be more
competitive in delivering quality education to students and trained graduates to meet the needs
of the market. Moreover, they need to focus on formulating innovative approaches of learning
that require new methods of education to develop human resources skills, meet uncertainties in
global business environment, and continue transforming to meet competition and gain
sustainable competitiveness.
In addition, to support their sustainable competitiveness it is necessary for private
universities to reinforce their provided services to society by means of cooperating with
government and other educational groups; revising their curricula and teaching and learning
methods; and providing research that serve the requirements of the society.
References
Badran, A. (2014). “New Trends in Higher Education in Jordan”, 4 th Arab-Turkish
Congress of Social Sciences on Education, Economic and Development, Arab
Thought Forum Amman-Jordan, 26-27 October 2014.
Chemonics International Incorporation (March 2006). “Jordan Vision 2020-Phase II-
JORDAN AMIR II Achievement of Market-Friendly Initiatives and Results”, An
Initiative of Leading Jordanian Business Associations produced for review by the
United States Agency for International Development (USAID). Online from
http://inform.gov.jo/en-us/By-Date/Report-Details/ArticleId/15/Jordan-Vision-2020-
Phase-II
Cusick, J. (2009), “Study abroad in support of education for sustainability: a case
study”,
Environment, Development, and Sustainability, Vol. 11 (4), pp. 801-13.
Esty, D. C. & Porter, M. E. (1998). “Industrial Ecology and competitiveness:
Strategic Implications for the Firm”, Journal of Industrial Ecology, winter, 1998, Vol.
2(1): 35-43.
Henard, F. (2010). “Learning our lesson: Review of Quality in Higher Education”, A
study of OECD-Institutional Management in Higher Education (IMHE), retrieved
from http://www.oecd. org/edu/imhe/44058352.pdf
Istaiteyeh, R. (2012).”Jordan’s Higher Education Exports and Circular Migration”, In
Knerr , B. (ed.) Transfers from International Migration: A Strategy of Economic and
Social Stabilization at National and Household level, Kassel University press: 203-
224.
http://www.eis.hu.edu.jo/deanshipfiles/conf10969959.pdf
Kanaan, T., Al-Salamat, M., and Hanania, M. (2009). "Financing Higher Education in
Jordan," Jordan Center for Policy Research and Dialogue (JCPP), Amman-Jordan,
Online, http://www.jcpprd.org/Files/ResearchDatabase/Financing%20Higher%20
Eduction%20in%20Jordan.pdf
Kuh, G. (2009), Higher Education Impact Activities: what they are, why they matter,
AAC&U.
Majdoubeh, A. (2015).” Opportunity turned into threat”, Jordan Times Newspaper,
August 20, 2015 on line from http://www.jordantimes.com/opinion/ahmad-y-
majdoubeh/ opportunity-turned-threat
Masri, S. & Wilkens, K. (2011). “Higher Education Reform in the Arab World”, the
Brookings Project on U.S. Relations with the Islamic World 2011 U.S.-Islamic World
Forum Papers, the Saban Centre for Middle East Policy at Brookings, Available
Online from

145
http://www.brookings.edu/~/media/research/files/papers/2011/8/education%20reform
%20wilkins/08_education_reform_wilkins.pdf
Mazawi, A. M. (2004). "Geopolitics and University Governance in the Arab States,"
International Higher Education, 34 (Winter 2004)
Ministry of Higher Education and Scientific Research (MoHESR) (2016). Notes on
Higher Education in Jordan, Data for the Academic year 2013-2014, Amman: Jordan.
Online from http://www.mohe.gov.jo/ar/pages/Statistics.aspx
Porter, M. E. (1990). The Competitive Advantage of Nations, London; Macmillan.
Rusinko, C.A. (2007), “Green manufacturing: an evaluation of environmentally
sustainable
manufacturing practices and their impact on competitive outcomes”, IEEE
Transactions
on Engineering Management, Vol. 54 (3), pp. 445-54.
Sabri, H. (2011). "The Impeding Drivers of Risk at Private Higher Education
Institution in Jordan: An Analytical approach", Journal of Education and Vocational
Research (JEVR), Vol. 2 (4), October, 2011, pp: 120-131,
Sabri, H. and El-Refae, G. (2006). "Accreditation in Higher Business Education in the
Private Sector: The Case of Jordan," Journal of Marketing for Higher Education, 16
(1/2006), New York: Best Business Books: Haworth Press.
Singh, N. (2010). SWOT Analysis–A Useful Tool for Community Vision, A concept
paper of central Himalayan village. Researcher, 2(9): 16-18.
Thompson, A. J. Strickland III, A. J., and Gamble, J. (eds.) (2008). Crafting; Executing Strategy: Text and Readings, (17th ed.), McGraw-Hill/Irwin.
Vargas-Hernández , J. G. and Luis Vladimir, V. A. (2013). “Sustainability as a
Strategy of Responsible and competitive Development”, International Journal of
Good Conscience, Vol. 8 (1), pp. 4-81.
World Economic Forum (WEF) (2015). The Global competitiveness Report 2014-
2015. Retrieved from http://reports.weforum.org/global-competitiveness-report-2014-
2015/methodology/
146
Using The Unified Theory of Acceptance and
Use of Technology to Explain E-commerce
Acceptance by Jordanian Travel Agencies
Dr. Dima Dajani
Al-Zaytoonah University
of Jordan
Jordan
Abstract:
This study examines the possibility of adapting a technology acceptance model designed
in the context of the developed world to a developing nation. Jordan will be used as a case
study for this purpose because it experiences similar challenges and opportunities that other
Arab countries encounter in their technology acceptance. Qualitative and quantitative
techniques were used to collect data for this research. The results indicated that performance
expectancy, effort expectancy, social influence, competitive pressure and facilitating conditions
had a positive impact on behavior intention to use e-commerce. In contrast, perceived risk,
government support and compatibility had insignificant relationship with behavior intention.
Furthermore, the result pointed out that age and gender did not affect the relationship between
performance expectancy, perceived risk and behavior intention. The study outcome holds
implications and recommendations for future research.
Keywords: E-commerce, Technology Acceptance Models, Jordanian Travel Agencies,
Information Technologies, Developing Countries
1. Introduction
The use of information technologies is vital for the sustainable development of the
economies of developing countries. Bowonder et al. (1993) recognized the importance of IT
and its implications for developing countries. They argued that the developing countries need
to understand the persistent nature of changes created by new IT applications and the
consequences of not keeping pace with the changes occurring in the developed world. Lightner
et al. (2002) underlined this importance and indicated that with the globalization and the
increased use of e-commerce, it is imperative to ensure that these systems can be effectively
used across cultural boundaries.
This implies that the global digital gap between the developed and developing countries
should decrease. The world is a global market today; both firms and consumers in developed
countries would like to exchange information, products and services with their counter parts in
the developing countries. Therefore, Elbeltagi et al. (2005) underlined the importance of
understanding the drivers behind technology adoption in developing countries to help
companies remain competitive in the global market.
While e-commerce has become a significant driver of change in business practice, there
have been few studies relating to its acceptance in developing countries, specifically in the
Middle East area, and more particularly in Jordan. The limited research on technology
acceptance in the developing countries indicates conflicting results with regards to the
appropriateness and predictive power of these models in the developing countries (Abu Shanab
et al., 2010; Bandyopadhyay and Fraccastoro, 2007; Lin and Bhattacherjee, 2008). Researchers
147
explain that the culture of a specific country and the type of technology investigated are the
reasons behind this inconsistency (Steers et al., 2008; Abu Shanab et al., 2010). Therefore, one
of the objectives of this study is to validate and test the appropriateness of the Unified Theory
of Acceptance and Use of Technology model in a different culture, more specifically Jordan.
The literature indicates that this model has not been extensively tested after it has been
developed by Venkatesh et al. (2003). Only two studies used this model in the Arab World,
namely the work of Al-Gahtani et al. (2007) and Abu Shanab et al. (2010).
Furthermore, despite the fact that the travel industry has a history of being among the first
businesses to use particular forms of information technology, for example, computer
reservation systems (CRS), followed by the global distribution systems (GDS), there are few
studies of technology acceptance in the tourism sector, in both the developing and developed
nations. To this date, there are very limited studies that examine technology acceptance in the
tourism industry (Mette Hjalager, 2010; Buhalis and Law, 2008). In fact there is no single
study that examines technology acceptance in the tourism industry in the Arab World.
Therefore, one of the objectives of this study is to examine the factors that affect e-commerce
acceptance in Jordanian travel agencies. This study examines the possibility of adapting a
technology acceptance model designed in the context of the developed world to a developing
nation. Jordan will be used as a case study for this purpose because it experiences similar
challenges and opportunities that other Arab countries encounter in their technology
acceptance.
2. Review of Literature
The technology acceptance models depend on various theories to explain the use of
information technologies, such as the diffusion of innovation theory introduced by Rogers
(2003), the theory of reasoned action by Fishbein and Ajzen (1975), the theory of planned
behaviour introduced by Ajzen (1985, 1991), and the social cognitive theory was presented in
the work of Bundura (1977, 1978, 1986). Researchers used these theories as a background to
explain the adoption and use of information technologies. Consequently, most of the proposed
technology acceptance models used the behaviour intention construct as a mediating variable
between the independent variables and the dependent variable, or used it as a dependent variable
by itself. This implies that these models share the same underlying concept in explaining
information technology use.
The most frequently cited model was the technology acceptance model, originally
developed by Davis in 1986 (Davis et al., 1989). Their model suggested that the two main
beliefs (e.g. perceived usefulness and perceived ease) affected individuals’ attitudes. The
attitude construct would determine the behaviour intention and consequently the use of
information technology. Later, the construct of attitude was omitted from the model because it
did not fully mediate the independent variables (Venkatesh and Davis, 1996). This means that
the construct of perceived usefulness and perceived ease of use had a direct effect on behaviour
intention without the moderating effect of attitude.
Another important model that explained the use of information technologies was the
combined theory of planned behaviour and the technology acceptance model. This model used
the independent constructs of TAM ( perceived usefulness, perceived ease of use) and the
independent constructs of the theory of planned behaviour (subjective norms, perceived
behavioural control) to explain the behaviour intention and use of information technology. The
technology acceptance model was extended to TAM2 to explain the use of information
technologies. Venkatesh and Davis (2000) explained how independent variables (perceived
usefulness, perceived ease of use, subjective norms, image, job relevance, output quality and
result demonstrability) affected intention to use and usage behaviour of information
technologies. To be specific, their model illustrated the major determinants of perceived
usefulness and how the perceived usefulness construct affect intention to use information
technologies. Furthermore, they showed in their model the moderating effect of experience and
voluntariness between subjective norms and intention to use.

148
The unified theory of acceptance and use of technology operationalized various
independent constructs from the aforementioned behaviour technology models. Venkatesh et
al. (2003) used the independent constructs of (performance expectancy, effort expectancy,
social influence and facilitating conditions) to explain the behaviour intention and use of
information systems. In addition, they used the moderating variables of gender, age, experience,
and voluntariness to explain technology use.
The UTAUT was validated and examined in different fields and settings. Using the
UTAUT for accepting various information technologies was tested in both developed and
developing economies, such as the work of Parameswaran et al. (2015), Conrad et al. (2015),
Martins et al. (2014), Zhou et al. (2010) and Chan et al. (2010). However, the literature
indicated the scarce application of the UTAUT in the context of the Arab World; with the
exception of the study by Al-Gahtani et al. (2007) in Saudi Arabia, Abu Shanab et al. (2010) in
the banking sector in Jordan, Al-Qeisi (2009), Alawadhi and Morris (2009) in the adoption of
e-government in Kuwait and Riffaie et al., (2012) in explaining online banking in Oman. In
addition, the literature indicated the scarce application of the UTAUT in the hospitality and
tourism field, particularly in e-commerce.
Al-Gahtani et al. (2007) measured the effect of the UTAUT in explaining the behaviour
intention and the use of computers in Saudi's organizations. They used the four constructs used
in the original UTAUT introduced by Venkatesh et al. (2003). However, they substituted the
social influence construct by subjective norms and they used four and three items to measure
each construct without clear explanation for choosing these specific items. They concluded
that performance expectancy and subjective norms affected the system use. In contrast,
facilitating conditions and effort expectancy had no significant effect.
In addition, Abu Shanab et al. (2010) investigated the factors that affect consumers'
acceptance of Internet banking in Jordan. They replicated and extended the UTAUT to examine
its applicability in Jordan. They investigated the effect of performance expectancy, effort
expectancy, social influence and personality dimensions (Personal innovativeness, perceived
trust, and perceived risk) on the behaviour intention. However, they excluded the construct of
actual use and substituted it by behaviour intention, and some of their constructs were measured
by only two items that is not adequate to measure a construct.
In the context of the developing countries, Gupta et al. (2008) examined the adoption of
ICT in government institutions in India. They investigated the effect of performance
expectancy, effort expectancy, and social influence on the behaviour intention to use the
technology. Furthermore, they investigated the effect of facilitating conditions on user
behaviour and did not explain how they measured the user behaviour. In their investigation,
they used the structural equation modelling to validate five of the major constructs and then
used multiple regression analyses for each construct separately using only four measuring
items. They found out that performance expectancy, effort expectancy, social influence and
facilitating conditions had a positive impact on ICT use, and that gender did not moderate these
relationships with behaviour intention.
Bandyopadhyay and Franccastoro (2007) examined the effect of culture through the social
influence variable of the UTAUT on users’ acceptance of Prepayment Metering System (new
innovation in India). In their investigation, they used only three constructs (performance
expectancy, effort expectancy and social influence) to test the acceptance of the new technology
on a consumer sample. The researchers excluded actual use and facilitating conditions
constructs without any justification. The results indicated high discriminant validity between
some of the constructs, such as performance expectancy and effort expectancy. Their results
indicated that social influence, performance expectancy and effort expectancy were significant
determinants of behaviour intention to use the new system.
In addition, Neufeld et al. (2007) integrated the charismatic leadership theory with the
UTAUT to examine the role of leaders influencing user adoption of information technology in
seven organizations. They used only three items to measure each construct. They concluded
that the leadership characteristic was positively associated with increased performance
expectancy, effort expectancy, social influence and facilitating conditions perceptions of the
system users.
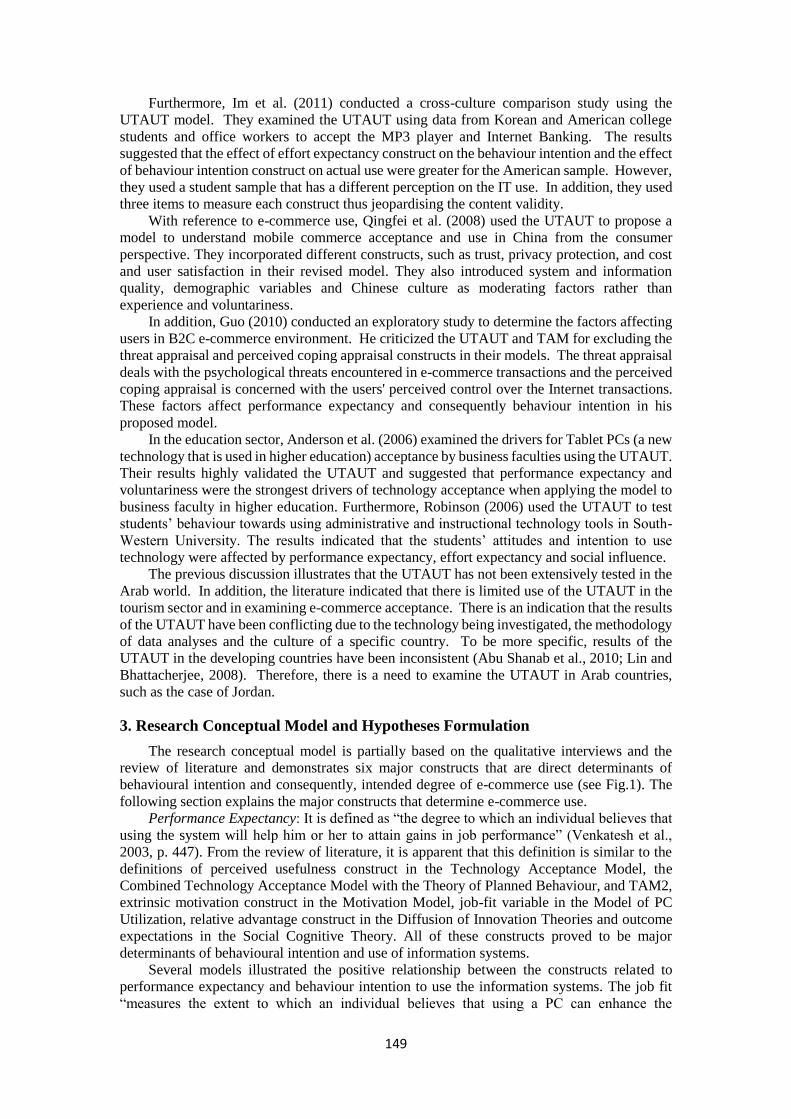
149
Furthermore, Im et al. (2011) conducted a cross-culture comparison study using the
UTAUT model. They examined the UTAUT using data from Korean and American college
students and office workers to accept the MP3 player and Internet Banking. The results
suggested that the effect of effort expectancy construct on the behaviour intention and the effect
of behaviour intention construct on actual use were greater for the American sample. However,
they used a student sample that has a different perception on the IT use. In addition, they used
three items to measure each construct thus jeopardising the content validity.
With reference to e-commerce use, Qingfei et al. (2008) used the UTAUT to propose a
model to understand mobile commerce acceptance and use in China from the consumer
perspective. They incorporated different constructs, such as trust, privacy protection, and cost
and user satisfaction in their revised model. They also introduced system and information
quality, demographic variables and Chinese culture as moderating factors rather than
experience and voluntariness.
In addition, Guo (2010) conducted an exploratory study to determine the factors affecting
users in B2C e-commerce environment. He criticized the UTAUT and TAM for excluding the
threat appraisal and perceived coping appraisal constructs in their models. The threat appraisal
deals with the psychological threats encountered in e-commerce transactions and the perceived
coping appraisal is concerned with the users' perceived control over the Internet transactions.
These factors affect performance expectancy and consequently behaviour intention in his
proposed model.
In the education sector, Anderson et al. (2006) examined the drivers for Tablet PCs (a new
technology that is used in higher education) acceptance by business faculties using the UTAUT.
Their results highly validated the UTAUT and suggested that performance expectancy and
voluntariness were the strongest drivers of technology acceptance when applying the model to
business faculty in higher education. Furthermore, Robinson (2006) used the UTAUT to test
students’ behaviour towards using administrative and instructional technology tools in South-
Western University. The results indicated that the students’ attitudes and intention to use
technology were affected by performance expectancy, effort expectancy and social influence.
The previous discussion illustrates that the UTAUT has not been extensively tested in the
Arab world. In addition, the literature indicated that there is limited use of the UTAUT in the
tourism sector and in examining e-commerce acceptance. There is an indication that the results
of the UTAUT have been conflicting due to the technology being investigated, the methodology
of data analyses and the culture of a specific country. To be more specific, results of the
UTAUT in the developing countries have been inconsistent (Abu Shanab et al., 2010; Lin and
Bhattacherjee, 2008). Therefore, there is a need to examine the UTAUT in Arab countries,
such as the case of Jordan.
3. Research Conceptual Model and Hypotheses Formulation
The research conceptual model is partially based on the qualitative interviews and the
review of literature and demonstrates six major constructs that are direct determinants of
behavioural intention and consequently, intended degree of e-commerce use (see Fig.1). The
following section explains the major constructs that determine e-commerce use.
Performance Expectancy: It is defined as “the degree to which an individual believes that
using the system will help him or her to attain gains in job performance” (Venkatesh et al.,
2003, p. 447). From the review of literature, it is apparent that this definition is similar to the
definitions of perceived usefulness construct in the Technology Acceptance Model, the
Combined Technology Acceptance Model with the Theory of Planned Behaviour, and TAM2,
extrinsic motivation construct in the Motivation Model, job-fit variable in the Model of PC
Utilization, relative advantage construct in the Diffusion of Innovation Theories and outcome
expectations in the Social Cognitive Theory. All of these constructs proved to be major
determinants of behavioural intention and use of information systems.
Several models illustrated the positive relationship between the constructs related to
performance expectancy and behaviour intention to use the information systems. The job fit
“measures the extent to which an individual believes that using a PC can enhance the

150
performance of his job or her job” (Thompson et al., 1991, p. 129). The perceived usefulness
construct enhances the job performance according to Davis (1989). The relative advantage
construct in the diffusion of innovation theory indicates that the positive characteristics of the
innovation affect its adoption. Finally, the outcome expectations from using the system affect
the intentions to use it (Compeau and Higgins, 1995). Therefore, the higher the advantages that
are gained from the system use, the faster the decision to adopt will be. Hence, the following
hypotheses are proposed:
H1: Performance expectancy will have a significant positive relationship with behaviour
intention to use e-commerce.
Effort Expectancy: It is defined as “the degree of ease associated with the use of the
system” (Venkatesh et al., 2003, p. 450). This definition is related to the definition of perceived
ease of use in Technology Acceptance Model (Davis, 1989), and Motivational Model (Van Der
Heijden, 2004); complexity construct in the Model of PC Utilization (Thompson et al., 1991)
and the Diffusion of Innovation Theory (Rogers, 1995); and ease of use construct in the
Decomposed Theory of Planned Behaviour (Taylor and Todd 1995a), and the Combined
Technology Acceptance Model with Theory of Planned Behaviour (Taylor and Todd, 1995b).
All of these constructs had a positive relationship on the intention to use the system. Therefore
the following hypotheses are proposed:
H2: Effort expectancy will have a significant positive relationship with behaviour
intention to use e-commerce.
Social influence: is defined as “the degree to which an individual perceives that important
others believe he or she should use the new system” (Venkatesh et al., 2003, p. 451). Three
constructs are related to this definition: the first construct is subjective norm in the theories of
Reasoned Action (Fishbein and Ajzen, 1975), Theory of Planned Behaviour (Taylor and Todd,
1995a) and Combined Technology Acceptance Model with the Theory of Planned Behaviour,
TAM2 (Taylor and Todd, 1995b). The second construct is social factors in the model of PC
Utilization (Thompson et al., 1991), and the third construct is image in the Diffusion of
Innovation Theory (Rogers, 1995). These entire constructs had a positive effect on the intention
to use the system. Hence, the following hypotheses are developed:
H3: Social influence will have a significant positive relationship with behaviour intention
to use e-commerce.
Perceived risk: is an important factor that affects the individual’s confidence in their
decisions. Risky conditions can be those where the chances of the outcomes are not clear or
known (Im et al., 2007). Risk is argued to be a multidimensional construct (Tsaur et al., 1997).
For example, Cunningham (1967) and Bettman (1973) developed a plan for identifying the
dimensions of risk. Cunningham suggested that certainty and the consequences of an act as two
dimensions of the risk factor, while, Bettman suggested that there are two types of risk: the
inherent risk and the handled risk. Moutinho (1987) classified the tourists’ risks into five
dimensions: functional risk, physical risk, financial risk, social risk and psychological risk.
Roehl and Fesenmaier (1992) classified tourists’ risk into seven items: equipment risk, financial
risk, physical risk, psychological risk, satisfaction risk, social risk and time risk. Hence, the
following hypotheses are proposed:
H4: Perceived risk will have a significant negative relationship with behaviour intention
to use e-commerce.
External Factors: Several external factors affect the intention of individuals to use e-
commerce in their organizations, such as government support, competition and external
pressure.
Government agencies play a vital role in setting policies that facilitate or hinder the use of
e-commerce in developing nations. Government support is defined as the extent to which
government facilitates conditions in order to adopt new technologies (Calantone et al., 2006;
Looi, 2005). This ranges from lowering the cost of using the Internet and setting up e-commerce
facilities to developing e-commerce laws for different sectors and informing people on the
advantages of using e-commerce in business activities (Calantone et al., 2006; Looi, 2005).
Furthermore, competitive and external pressures are important factors that affect the
adoption of innovation at organizations (Looi, 2005; Hsu et al., 2006). It is rivalry that

151
encourages firms to be more innovative and to increase the rate of innovation adoption
(Premkumar and Roberts, 1999). Research on communication technologies indicated that the
existence of these technologies is a necessity to compete in the market place (Premkumar et al.,
1994). Hence, the following hypotheses were developed:
H5: Government support will have a significant positive relationship with behaviour
intention to use e-commerce.
H6: Competitive pressure will have a significant positive relationship with behaviour
intention to use e-commerce.
Organizational Factors: The organizational factors relate to two major constructs that
affect the use of e-commerce at the travel agencies, namely facilitating conditions and
compatibility. Resource-facilitating conditions refer to the availability of the financial and
technology resources at an organization that have a positive effect on the intention to use the
technology system (Taylor and Todd, 1995a). In addition to the facilitating condition construct,
compatibility of the technology with the values, needs and culture is an important factor that
affects the adoption of new technologies at organizations. Rogers (1995, p. 15) defined
compatibility as “the degree to which an innovation is perceived as being consistent with the
existing values….” He clarified that when the innovation is well-matched with the values and
the culture of a certain society, it will be adopted easily. Similarly, Tornatsky and Klien (1982)
concluded that the compatibility of the innovation with the users’ norms have a positive
influence on the adoption. Hence the following hypothesis is developed:
H7: Facilitating conditions will have a significant positive relationship with behaviour
intention to use e-commerce.
H8: Compatibility with values, beliefs and preferred work practices will have a significant
positive relationship with behaviour intention to use e-commerce.
Behaviour Intention: It is defined as a “measure of strength of one’s intention to perform
a specific behaviour” (Fishbein and Ajzen, 1975, p. 288) and is a useful predictor of how
individuals will behave in the future. Behaviour intention is considered as an important
mediator in the relationships between the independent variables and the use of the information
systems. From the review of literature, all of the technology intention models illustrated the
positive relationship between behaviour intention and intended use.
H9: Behaviour intention has a significant positive relationship with the intended degree
of e-commerce use.
152
Figure (1.0) Research Conceptual Model
3. Methodology
3.1 Research Sample
A list of the total number of travel agencies (330 travel agencies) in the area of Amman
was prepared. All of the travel agencies were organized alphabetically in a list with the names
of the owners or operating mangers and contact addresses, then each of the travel agencies was
assigned a number and entered through statistical software (Excel) that randomly selected 320
travel agencies (using simple random sample technique). After multiple telephone calls, all of
the travel agents were ready to participate with an exception of three travel agents. Two of the
travel agents were going out of business, and one did not provide the reason for not
participating. This decreased the total sample to 317. Given that only three travel agents did not
participate from the desired sample, we can conclude low levels of non-response error
(Malhotra, 2004).
3.2 Measurements
A broad set of indicators (items) were generated to measure the model constructs. The
measurements of the constructs were derived from the extensive review of literature and the in
depth interviews with travel agencies' owners. These items were submitted to a group of experts
in multi-cultural and multi-lingual contexts to comment on their clarity and suitability. This
Perceived Risk -Financial risk - Psychological risk
Social Influence -Subjective norm -Social factors -Image
Effort Expectancy -Perceived ease of use -Complexity -Ease of use
Performance Expectancy -Perceived usefulness - Extrinsic motivation -Job fit -Relative advantage -Outcome expectation
External Factors -Government support -Competitive pressure
Organizational Factors -Facilitating conditions - Compatibility
Behaviour Intention to Use E-commerce
Intended Degree of E-commerce Use
H1+
H2+
H3+
H4 -
H5 +
H7 +
H6 +
H8 +
H9+

153
procedure minimized construct bias and item bias that could occur due to the application of
measurement developed in a Western culture to an Eastern culture without careful amendments
(Mitchell, 1996; Van De Vijver and Hambleton, 1996). The items that survived this procedure
were those incorporated in the questionnaire and represented the measures for the constructs
used in this study.
Data was collected from 313 travel agencies in the area of Amman through a questionnaire
survey. The survey instrument was despatched following a pilot test. Initial data analysis
provided descriptive statistics relating to demographic variables, key informants and actual use
of the Internet. The reliability and validity of each construct was established using item-to-total
correlations, Fornell and Larcker's (1981) test of validity and exploratory factor analyses. The
results of factor analysis were used as inputs in successive multiple regression analyses. E-
commerce use was measured by time and frequency of the Internet use.
To calculate the discriminant validity, the researcher calculated the standardized item
loadings and error terms for every item and construct in the conceptual model.
Then, the researcher calculated the individual AVE for every construct and compared this with
the squared correlation matrix as illustrated in table 1. The variance extracted (VE) is the
average squared factor loading. The VE should be .5 or above to indicate convergent validity
which is the case of all the constructs. In addition, the VE estimates for two factors are greater
than the square of the correlation between the two factors and thus provide evidence of
discriminant validity (Hair et al., 2006). Furthermore, the AVE values ranged from .50 to .64.
These figures are all within the acceptable levels (≥.50), and illustrates a sufficient AVE score
(Hair et al., 2006). Furthermore, all squared correlations were lower than the AVE for each
construct. This provides evidence of discriminant validity among the constructs in this study
(Hair et al. 2006; Fornell and Larcker, 1981). Finally, construct reliability (CR) values ranged
from .72 to .83 that provides evidence of adequate convergence or internal consistency (Hair et
al., 2006).
Table 1: Squared Correlation Matrix (2)
** Correlation is significant at the 0.01 level
* Correlation is significant at the 0.05 level
3.3 Data Analysis and Results

154
After checking the regression assumptions, multiple regression analyses were carried out using
the Enter Method to evaluate and to test the hypotheses. The results indicated a significant
model (F8, 304= 62.639, P< .0005. R2= .622, Adjusted R2 = .612). The significant variables
emerged from the results are shown below:
Table 2: Results of Significant Variables
Predictor Variables Standardized Coefficients Beta Sig
Performance Expectancy .287 .000
Effort Expectancy .170 .004
Social Influence .159 .001
Competitive Pressure .322 .000
Facilitating conditions .116 .010
In contrast, the perceived risk, government support and compatibility constructs are not
significant predictors in the model; hence H4, H5 and H7 are not supported. The following
illustrates the results of these predictor variables:
Table3: Results of Insignificant Variables
Predictor variables Standardized Coefficients Beta Sig
Perceived Risk .019 .702
Government Support -.066 .144
Compatibility .046 .277
In order to test the relationship between the behaviour intention to use e-commerce and
Intended actual use of e-commerce, a bivariate regression analysis was carried out. As the name
indicates, this analysis is used when we need to analyze the relationship between an independent
variable (behaviour intention to use e-commerce) and a dependent variable (intended actual
use). The results of the analysis indicate a significant relationship between the two variables
(F1, 311=93.849, P< .0005. R2= .232, Adjusted R2= .229). The beta value in the standardized
regression coefficient is .481. This means that behaviour intention contributes around .481 in
explaining the dependent variable (actual use of e-commerce). Thus the results support H9
hypothesis that indicates a positive relationship between behaviour intention and actual use of
e-commerce.
Table 4: Results of Significant Relationship between Behaviour Intention and Intended
Actual Use
Predictor variables Standardized Coefficients
Beta
Sig
Behaviour Intention
.481
.000
Intended actual use is measured by the frequency of using the Internet to sell tourism products
and services online and the time spent on using the Internet. Table 7.6 illustrates that 78.9% of
the travel agents will use the Internet from 6-10 times a day to sell tourism services.
Furthermore, almost 50% of the sample will use it around 5 hours a day. None of the
respondents indicated a rejection to use e-commerce at their travel agencies. These high
percentages of use provide an indication of the e-commerce acceptance by the travel agents.
Table 5: Frequency of Using the Internet
Items
Frequency Percent
Frequency of Use
Not al all 0 0.0%
1-2 times a month 2 0.6%
1-2 times a week 2 0.6%
1-2 times a day 11 3.5%

155
3-5 times a day 12 3.8%
6-10 times a day 247 78.9%
More than 10 times a day 39 12.5%
Time
Never use 0 0.0%
Shorter than 15 min 1 0.3 %
15-30 min 7 2.2 %
30 min 2 hrs 15 4.8%
From 2-3 hours a day 24 7.7%
From 4-5 hours a day 147 47.0%
Longer than 5 hours 119 38.0%
In summary, the results of the multiple regression analyses indicated a significant model
and supported most of the theorized hypotheses. The results indicated that hypotheses 1, 2, 3,
6, 7 and 9 are supported. That is, performance expectancy, effort expectancy, social influence,
competitive pressure, facilitating conditions and behaviour intention. In contrast, hypotheses 4,
5 and 8 were rejected (perceived risk, government support and compatibility). Furthermore,
the results pointed out that age and gender did not affect the relationship between performance
expectancy, perceived risk and behaviour intention. However, gender affects the relationship
between social influence and behaviour intention and the relationship between effort
expectancy and behaviour intention, but not age moderator. Table 6 provides a summary of the
findings.
Table 6: Hypotheses Conclusion
Hypothesis
Number
Independent
Variables
Dependent
Variables
Moderators Results
H1 Performance
Expectancy
Behaviour
Intention
None Accept
H2 Effort
Expectancy
Behaviour
Intention
None Accept
H3 Social Influence Behaviour
Intention
None Accept
H4 Perceived Risk Behaviour
Intention
None Reject
H5 Government
support
Behaviour
Intention
None Reject
H6 Competitive
Pressure
Behaviour
Intention
None Accept
H7 Facilitating
conditions
Behaviour
Intention
None Accept
H8 Compatibility Behaviour
Intention
None Reject
H9 Behaviour
Intention
Intended Actual
Use
None Accept
4. Discussion
Considering all of the results, it was concluded that the UTAUT, which was originally
proposed and tested in developed countries, can also explain e-commerce adoption in Arab
countries, such as Jordan. The modified UTAUT explained 62% of intention to use variance,
and 23% of actual use variance. These findings are consistent with the limited scholarly work
using the UTAUT in the developing countries, such as that of Gupta et al. (2008), Al-Gahtani
et al. (2007) and Bandyopadhyay and Fraccastoro (2007).

156
The research model provides better explanatory power than previous work conducted in
developing countries using different technology acceptance models, such as the TAM, to
predict e-commerce adoption. For example, Seyal et al. (2004) investigated the factors that
influence e-commerce adoption in Pakistan using different constructs, such as organizational
culture, management support, government support and perceived benefits of the innovation.
Their model explained 47% of the variance in the adoption of e-commerce. This implies that
the unified model used in this research provides a higher explanatory power for e-commerce
adoption rather than using a simple technology acceptance model to explain e-commerce
adoption in the developing countries.
Furthermore, the UTAUT considers the cultural differences between Jordan and Western
culture (wherein the UTAUT and most of the technology adoption models originated). The
results suggest that adapting to the Jordanian hierarchical managerial style reduced the need of
the mangers of the travel agencies to incorporate individual attitudes related to the adoption of
e-commerce. This implies that the decision making in Jordanian firms evolves through top
management rather than employees. As such, when an organization’s top management decides
to use a new innovation, his or her decision is unquestionable, and an employee’s attitude
toward the technology does not mediate the relationship between the independent factors and
the actual use.
Therefore, the senior managers and owners of travel agencies have the authority to make
innovation-decisions, whereby decisions to adopt or reject innovations are made by a few
individuals in an organization, who posses high authority, high social status and excellent
technical skills (Rogers, 2003). This result is consistent with the work of Hofstede (2005), who
suggested that subordinates expect to be told what to perform in a hierarchical culture, such as
in Jordan.
The research model highlights the importance of government support for e-commerce
adoption. In particular, the construct of government support was not a significant factor to
influence the e-commerce adoption in the Jordanian travel agencies. This means that the
Jordanian government does not provide adequate assistance for the travel agents to facilitate
the use of e-commerce. This finding is important because it is distinct from the Western
cultures, in which government support was not investigated as a possible influential factor on
the adoption of new innovation. This might be due to the low level of government support and
interference in the Western markets. In contrast, the Jordanian government is responsible for
taking decisions related to the technologies that are or are not allowed in the country, and is
also responsible for setting up e-commerce laws in the country (INTAJ, 2000). As such, in the
view of many Jordanian travel agents, the government plays a fundamental role in assisting in
the adoption of e-commerce, but their performance to-date has been inadequate.
The previous discussion provides evidence that the modified UTAUT is appropriate for
the context of developing countries, such as Jordan. In addition, the model could be appropriate
for other Middle Eastern countries that are similar to Jordan, such as Lebanon and Syria.
5. Theoretical and Practical Implication
As a contribution to theory, this study is one of the first to examine the modified UTAUT
in the hospitality industry in the Arab world. Despite the extensive use of information
technologies in the hospitality and tourism sector, only limited studies have recently applied
the TAM and its extended versions to evaluate technology acceptance in this sector (e.g. Huh
et al., 2009; Kim et al., 2009; Lam et al., 2007; Lee et al., 2006). Thus the application of
technology acceptance models in the hospitality and tourism settings is still in its early stages,
specifically in the Arab countries. Most of these studies focus on the critical factors influencing
user acceptance in different settings in the hospitality industry, but not specifically in the travel
agencies (Kim et al., 2009; Lam et al., 2007; Kaplanidou and Vogt, 2006; Wober and Gretzel,
2000). Moreover, none of these studies investigated the role of age and gender as potential
moderators on the acceptance of technology. This study is the first to utilize the UTAUT model
to analyze the critical determinants of e-commerce acceptance among Jordanian travel

157
agencies. Therefore, researchers need to evaluate the UTAUT in travel agencies in both the
developed and Middle East/ Arab countries.
The research model adjusts for cultural differences between Jordan and other developed
countries where technology acceptance models have been originally formulated. For example,
the research model differs by the exclusion of some of the constructs, such as attitude toward
adoption that is included in several technology models (e.g. TRA, TPB, C-TPB-TAM) and the
inclusion of government support and technological benefits. The exclusion of attitude is
consistent with the initial suggestion from Davis et al. (1989) where they have indicated that in
certain contexts, attitude has a less important role in technology acceptance. Thus, the exclusion
of attitude is appropriate in this study because the decision to adopt technology in the Jordanian
travel agencies is made at the top management level. Furthermore, most of the decision makers
in the developing and Arab countries might have a positive attitude towards adopting an
innovation, but they do not adopt it. This is what Rogers (2003) referred to as the "KAP-gap".
In addition, attitudes are believed to be long–term beliefs, and as such, some technology
acceptance researchers (e.g. Thompson et al., 1991; Venkatesh et al., 2003) have excluded this
construct from their work.
From a methodological perspective, the research considered the specific characteristics of
the Jordanian business society that is traced to the Arab Islamic culture. The study indicates the
importance of conducting depth-interviews in cross-cultural research to identify the exact
meaning of some constructs integrated in the conceptual model, to capture the domain of key
constructs investigated in the model (e.g. compatibility), and to include imperative constructs
that could affect e-commerce use in the Jordanian travel agencies (e.g. government support and
competitive pressure).
The results of the study provide Arab senior managers and travel agencies owners with
useful insights of the factors that could affect the acceptance of e-commerce at their agencies.
The study indicates that innovation characteristics, such as performance expectancy, effort
expectancy and compatibility can increase the acceptance of e-commerce. Therefore,
programmers and designers of tourism websites should pay attention to the usefulness, the ease
of use and the compatibility of the system. It is recommended to create websites that are easy
to browse, interactive and compatible with the needs of the users so as to help them to
understand and find what they are searching for. Furthermore, the language and the instruction
of browsing should be easy to understand (Kim et al., 2009; Huh et al., 2009). Software
engineers should develop software and programmes that have bi-lingual interface (Arabic and
English) to be used and understood by all of the employees in the Arab organizations.
Explicitly, user-friendliness of the e-commerce websites is essential to increase employees’
acceptance.
Additionally, an important determinant of e-commerce use is compatibility. This implies
that travel agents should have websites that are easy to update and flexibly to change. The travel
agents should find it easy to update the information on their websites and change or add some
tourism packages that are demanded by their clients. This requires Arab website designers to
develop websites that are compatible with the needs of the staff in the organization. The
websites should contain important and sufficient information that is understood by all of the
staff. In addition, the layout, graphics, links and animation should be simple and attractive for
both the employees and consumers.
Furthermore, the result of this study shows that awareness of e-commerce benefits and
advantages has significant effect on the adoption of e-commerce in the Arab organisations.
Therefore, the Jordanian government should launch campaigns illustrating the benefits of using
e-commerce for Jordanian organisations. The government should formulate a national plan that
increases the awareness and use of e-commerce to the Jordanian organisations and its
consumers. The government should invest more in the ICT infrastructure and improve the
Internet quality. In addition, the Jordanian government should encourage the development of
more network service providers. This will increase the competition among service providers
and allow the prices of The Internet to decrease
6. Conclusion and Future Research

158
The study reveals that the UTAUT, which was proposed in developed countries, can be
used to explain e-commerce use by Jordanian Travel agencies. The modified UTAUT is crucial
for assessing the acceptance of e-commerce and other information technologies that are
important for the development of developing economies. It explained 62% of behavior
intention variance and 23% of intended actual use variance. Furthermore, some constructs
showed significant relationship with behavior intention, such as performance expectancy, effort
expectancy, social influence, competitive pressure and facilitating conditions. While the
constructs of perceived risk, government support and compatibility had insignificant
relationship with behavior intention.
Despite the study’s contributions and practical implications, it has also several limitations
and unexplored future research directions. Evaluating the modified UTAUT with a broader
sample (in other Arab countries, such as Syria, Egypt and Lebanon) could considerably increase
the generalizability of the results. In addition, Future research efforts in Arab countries should
examine the conceptual model in other tourism sectors or in other industries to assess the extent
to which these findings can be generalized since the application of the Unified theory of
Acceptance and Use of Technology model is very minimal. Future research can be built on this
study by testing the effect of different moderators such as, age, gender and experience on the
relationship between the independent constructs and dependent constructs. Lastly, future
research can investigate other variables that explain the intention and use of e-commerce in
tourism sector.
References:
Abu Shanab, E. et al., (2010). "Internet Banking and Customers' Acceptance in
Jordan: The Unified Model's perspective." Communications of the Association for
Information Systems 26(23): 493-524.
Ajzen, I., (1985). From Intentions to Actions: A theory of Planned Behaviour. Action
Control: From Cognition to Behaviour. J. Kuhl and J. Beckmann. New York, Springer
Verlag: 11-39.
Ajzen, I., (1991). "The Theory of Planned Behaviour." Organisational Behaviour and
Human Decision Processes 50: 179-211.
AlAwadhi, S. and Morris, A., (2009). " Factor Influencing the Adoption of E-
government Services." Journal of Software 4(6)
Al-Gahtani, S. Hubona, G. and Wang, J., (2007). "Information Technology (IT) in
Saudi Arabia: Culture and Acceptance and Use of IT." Information & Management
44: 681-691.
AlQeisi, K., (2009). Analyzing the Use of UTAUT Model in Explaining Online
Behaviour: Internet Banking Adoption, Ph.D thesis, Brunel University, UK.
Anderson, J. Schwager, P. and Kerns, R., (2006). "The Drivers for acceptance of Tablet
PCs by Faculty in a College of Business." Journal of Information Systems Education
17(4): 429-440.
Bandura, A., (1977). "Self-efficacy: Toward a Unifying Theory of Behavioural
Change." Psychological Review 84(2): 191-215.
Bandura, A., (1978). "Reflections on Self-efficacy." Advances in Behavioural
Research and Therapy 1: 237-269.
Bandura, A., (1986). Social Foundations of Thought and Action. Englewood Cliffs, NJ:
Prentice Hall.
Bandyopadhyay, K. and Fraccastoro, K., (2007). "The Effect of culture on User
Acceptance of Information Technology." Communication of the Association for
Information Systems 19: 522-543.
Bettman, J.R., (1973). "Perceived Risk and its Components: A model and Empirical
Test." Journal of Marketing Research 10(2): 184-190.
Bowonder, B. Miyoake, T. and Sign, T., (1993). "Emerging Trends in Information

159
Technology. Implications for Developing Countries." International Journal Of
Information Management 13(3): 183-204.
Buhalis, D. and Law, R., (2008). "Progress in Information Technology and Tourism
Management: 20 Years on and 10 Years after the Internet-The State of eTourism
Research." Tourism Management 29: 609-623.
Calantone, R. Griffith, D. and Yalcinkaya, G., (2006). "An Empirical Examination of
a Technology Adoption Model for the Context of China." Journal of International
Marketing 14(4): 1-27.
Chan, et. al., (2010). "Modeling Citizen Satisfaction with Mandatory Adoption of an
E-government Technology." J.Assoc.Inf.Syst. 11(10):519-549.
Colby, C. and Parasuraman, A., (2003). "Technology." Marketing Management 12(4):
28-33.
Compeau, D. and Higgins, C., (1995a). "Application of Social Cognitive Theory to
Training for Computer Skills." Information Systems Research 6(2): 118-143.
Conrad, et al., (2015). "Bridging the Divide: Using UTAUT to Predict
Multigenerational Tablet Adoption Practices." Computers in Human Behaviour.
50:186-196.
Cunningham, S.M., (1967). The Major Dimensions of Perceived Risk. Risk Taking and
Information Handling in Consumer Behaviour. D. F. Cox. Boston, The Harvard
University Graduate School of Business Administration
Davis, F.D. Bagozzi, R.P. and Warshaw, P., (1989). "User Acceptance of Computer
Technology: A Comparison of Two Theoretical Models." Management Science 35(8):
982-1003.
Davis, F.D., (1986). A Technology Acceptance Model for Empirically Testing New
End-User Information Systems: Theory and Results Sloan School of Management,
Massachusetts Institute of Technology.
Davis, F.D., (1989). "Perceived Usefulness, Perceived Ease of Use, and User
Acceptance of Information Technology." MIS Quarterly 13(3): 319-339.
Elbeltagi, I. McBride, N. and Hardaker, G., (2005). "Evaluating the Factors Affecting
DSS Usage by Senior Managers in Local Authorities in Egypt." Journal of Global
Information Management 13(2): 42-65.
Fishbein, M. and Ajzen, I., (1975). Belief, Attitude, Intentions and Behaviour: An
Introduction to Theory and Research. Reading, MA: Addison-Wesley.
Fornell, C. and Larcker, D. V., (1981). "Structural Equation Models with
Unobservable Variables and Measurement Error: Algebra and Statistics." Journal of
Marketing Research 18(1): 39-50.
Guo, C., (2010). "The Psychological Influences of Threat on B2C E-commerce
Adoption: An Extended Study and Explanatory Framework." Journal of Promotion
Management 16: 303-315.
Gupta, B., Dasgupta, S. and Gupta, A., (2008). "Adoption of ICT in a Government
Organization in a Developing Country: An Empirical Study." Journal of Strategic
Information Systems 17: 140-154.
Hair, J. et al., (2006). Multivariate Data Analysis. Upper Saddle River, NJ: Pearson
Education Inc.
Hofstede, G. and Hofstede, J., (2005). Cultures and Organizations Software of the
Mind. New York: McGraw-Hill
Hsu, P. Kenneth, K. and Dunkle, D., (2006). "Determinants of E-Business Use in U.S.
Firms." International Journal of Electronic Commerce 10(4): 9-45.
Huh, H. Taegoo, K. and Law, R., (2009). "A Comparison of Competing Theoretical
Models for Understanding Acceptance Behaviour of Information Systems in Upscale
Hotels." International Journal of Hospitality Management 28(1).
Im, I. Hong, S. and Sookang, M., (2011). "An International Comparison of Technology
Adoption: Testing the UTAUT Model." Information and Management 48(1): 1-8.

160
Im, I. Kim, Y. and Joo Han, H., (2007). "The Effects of Perceived Risk and Technology
Type on Users' Acceptance of Technology." Information & Management.
INTAJ (March 2000). The Reach Initiative: Launching Jordan's Software and IT
Services Industry. A Strategy and Action Plan for H.M. King Abdullah II Amman,
Jordan.
Kaplanidou, K. and Vogt, C., (2006). "A Structural Analysis of Destination Travel
Intentions as a Function of Web Site Features." Journal of Travel Research 45(2): 204-
216
Kim, S.B. Kim, T. and Shin, S.W., (2009). "Modelling Roles of Subjective Norms and
eTrust in Customers' Acceptance of Airline B2C ecommerce Websites." Tourism
Management 30: 266-277.
Lam, T. Cho, V., and Qu, H., (2007). "A Study of Hotel Employee Behaviour
Intentions towards Adoption of Information Technology." International Journal of
Hospitality Management 26(1): 49-65.
Lee, H.Y. Kim, W.G. and Lee, Y.K., (2006). "Testing the Determinants of
Computerized Reservation System Users' Intention to Use via Structural Equation
Model." Journal of Hospitality and Tourism Research 30(2): 246-266.
Lightner, N. Yenisey, M. and Ozok, A., (2002). "Shopping Behaviour and Preferences
in E-Commerce of Turkish and American University Students: Implications from
Cross- Cultural Design." Behaviour & Information technology 21(6): 373-385.
Lin, C. P. and Bhattacherjee, A., (2008). "Elucidating Individual Intention to Use
Interactive Information Technologies: The Role of Network Externalities."
International Journal of Electronic Commerce 13(1): 85-108.
Looi, H.C., (2005). "E-Commerce Adoption in Brunei Darussalam: A Quantitative
Analysis of factors Influencing IT Adoption." Communications Of The Association for
Information systems 15: 61-81.
Malhotra, N., (2004). Marketing Research an Applied Orientation. Upper Saddle
River, NJ: Pearson Prentice Hall.
Martins, C. Oliveira, T. Popovic, A., (2014). "Understanding the Internet Banking
Adoption: A Unified Theory of Acceptance and Use of Technology and Perceived Risk
Application." International Journal of Information Management 34(1):1-13.
Mette Hjalager, A., (2010). "A Review of Innovation Research in Tourism." Tourism
Management 31: 1-12.
Mitchell, V., (1996). "Assessing the Reliability and Validity of Questionnaires: An
Empirical Example." Journal of Applied Management Studies 5(2): 199-207.
Moutinho, L., (1987). "Consumer Behaviour in Tourism." European Journal of
Marketing 21(10): 5-44.
Neufeld, D. Dong, L. and Higgins, C., (2007). "Charismatic Leadership and User
Acceptance of Information Technology." European journal of Information Systems 16:
494-510.
Parameswaran, S. Kishore, R. and Li, P., (2015). "Within-Study Measurement
Invariance of the UTAUT Instrument: An Assessment With User Technology
Engagement Variables." Information and Management 52:317-336.
Premkumar, G. and Roberts, M., (1999). "Adoption of New Information Technologies
in Rural Small Businesses." Omega Intl. J.Mgmt 27: 467-487.
Premkumar, G. Ramamurthy, K. and Nilakanta, S., (1994). "Implementation of
Electronic Data Interchange: An Innovation Diffusion Perspective." Journal of
Management Information System 11(2): 157-186.
Qingfei, M. Shaobo, J. and Gang, Q., (2008). "Mobile Commerce User Acceptance
Study in China: A Revised UTAUT Model." Tsinghua Science and Technology 13(3):
257-264.
Riffai, M. Grant, A. and Edgar, D. (2012). "Big TAM in Oman: Exploring the Promise
of on-line Banking, its Adoption by Customers and the Challenges of Banking in
161
Oman." International Journal of Information Management 32: 239-250.
Robinson, L., (2006). "Moving Beyond Adoption: Exploring the Determinants of
Student Intention to Use Technology." Marketing Education Review 16(2): 79-88.
Roehl, W.S. and Fesenmaier, D.R., (1992). "Risk Perceptions and Pleasure Travel: An
Exploratory Analysis." Journal of Travel Research 30(4): 17-26.
Rogers, E.M., (1995). Diffusion of Innovation. New York: Free Press.
Rogers, E.M., (2003). Diffusion of Innovation. New York: Free Press.
Rogers, E.M., (2003). Diffusion of Innovation. New York: Free Press.
Seyal, A. et al., (2004). "Determinants of Electronic Commerce in Pakistan:
Preliminary Evidence from Small and Medium Enterprises." Electronic Markets 14(4):
372-387.
Steers, R.M. Meyer, A.D. and Sanchez-Runde, C.J., (2008). "National Culture and The
Adoption Of New Technologies." Journal of World Business 43: 255-260.
Taylor, S. and Todd, P.A., (1995a). "Understanding Information Technology Usage: A
Test Of Competing Models." Information System Research 6(2): 144-176.
Taylor, S. and Todd, P.A., (1995b). "Assessing IT Usage: The Role of Prior
Experience." MIS Quarterly 19(4): 561-571.
Thompson, R.L. Higgins, C. and Howell, J.M., (1991). "Personal Computing: Towards
a Conceptual Model of Utilization." MIS Quarterly 14: 125-143.
Tornatzky, L.G. and Klein, K., (1982). "Innovation Characteristics and Innovation
Adoption-Implementation: A Meta Analysis of Findings." Ieee Transactions on
Engineering Management 29(1): 28-45.
Tsaur, S.H. Tzeng, G. and Wang, K., (1997). "Evaluating Tourist Risks from Fuzzy
Perspectives" Annals of Tourism Research 24(4): 796-812.
Van De Vijver, F. and Hambleton, R.K., (1996). "Translating Tests: Some Practical
Guidelines." European Psychologist 1(2): 89-99.
Van Der Heijden, H., (2004). "User Acceptance of Hedonic Information Systems." MIS
Quarterly 28(4): 695-704.
Venkatesh, et al., (2003). "User Acceptance Of Information Technology: Toward A
Unified View." MIS Quarterly 27(3): 425-478.
Venkatesh, et al., (2003). "User Acceptance Of Information Technology: Toward A
Unified View." MIS Quarterly 27(3): 425-478.
Venkatesh, V. and Davis, F.D., (1996). "A Model of the Antecedents of Perceived Ease
of Use: Development and Test." Decision Sciences 27(3): 451-481.
Venkatesh, V. and Davis, F.D., (2000). "A Theoretical Extension of The Technology
Acceptance Model: Four Longitudinal Field Studies." Management Science 46(2):
186-204.
Wober, K. and Gretzel, U., (2000). "Tourism Managers' Adoption of Marketing
Decision Support Systems." Journal of Travel Research 39(2): 172-181.
Zhou, T. Lu, Y. Wang, B., (2010). "Integrating TTF and UTAUT to Explain Mobile
Banking User Adoption." Computers in Human Behaviour 26: 760-767

162
THE DEVELOPMENT OF USER
INTERFACE PROTOTYPE OF DECISION
SUPPORT SYSTEM FOR RISK
MANAGEMENT OF COMPLEX
TECHNICAL SYSTEMS
BOYKO V.D SHIBAEVA N.O RUDNICHENKO N.D VYCHUZHANIN
V.V
Odessa national marine university
Ukraine
Abstract:
The article describes the specifics and stages of the development of user’s interface of
prototype the decision support system (DSS) for risk management of complex technical
systems. The use specificity analysis of the existing DSS for tasks of risk assessment and
management of technical systems was carried out. The existing software architecture and
implementation of the modern DSS was reviewed considered. The building of the mind-map
for the design of the user interface prototype DSS to form concepts domain was conducted. The
block diagram of the software architecture subsystems of the proposed DSS was developed.
The operation algorithm developed by DSS was formed. The interface prototype of the main
form DSS for risk management of complex technical systems was developed and implemented
in software using java language and NetBeans IDE. The developed abstract UML-class model
of DSS was introduced. The class structure of the DSS software project in NetBeans was showd.
The results of testing and profiling of the developed user interface prototype DDS for risk
management of complex technical systems were described.
Keywords: decision support systems, prototyping, risks, risk management, complex technical
systems, the user’s interface, Java, UML, mind-map
1. The analysis of the specificity of existing DSS for risk assessment and
management
In the modern world in technical fields it is often necessary to automate not just the
calculation processes for performing routine technical tasks, but also to delegate analytical
operations to information systems. The results of this analysis can be used when making control
decisions aimed to minimizing levels of risks in technical systems. However, there is a necessity
for processing and analyzing of multidimensional amounts of data of different nature.
Especially this problem is important for the business areas, ie the use of advanced DSS for the
tasks of risk assessment and management to reduce the coCTS of repairs and reduce the
probability of emergency situations leading to significant financial coCTS.
The number of criteria and indicators that can be incorporated in the process of analysis of
possible alternatives when evaluating risks of different technical systems can reach several
hundreds and thousands, that leads to great computational and time-expenses. Currently, the
decision support system (DSS) are used for the problems like these.
163
The conducted analysis of the number of sources (Gerasimov B.M., Divizinjuk M.M., &
Subach I.Y., 2004; Klochko V.I., Shumkov E.A., & Vlasenko A.V., 2013; Popov A.L., 2008
Tereljanskij P.V., 2009;) allowed to find out that at the moment there is no clear and universal
definition for this term, which would not restrict the range of tasks of the DSS. The most correct
definition for risk assessment of technical systems, according to (Gerasimov B.M., Divizinjuk
M.M., & Subach I.Y., 2004) performs the following wording: the " decision support systems
are human-machine objects that allow decision makers use data, knowledge, objective and
subjective models for analyzing and solving semistructured and unstructured problems."
The possibility of using a DSS for risk assessment and management is quite broad,
however, the key purpose is to provide the user-friendly interface for performing analysis of
priority scenarios of possible development risks to the management personnel, analyCTS and
experts (Grinchenko M.A., 2011; Zagorul’ko Y.A., Zagorul’ko G.B., & Kravchenko A.Y.,
2010).
The basic functions of modern DSS for risk assessment of technical systems are providing
automated input, the structured storage and analysis of data for various scenarios of risks
development.
However, at the moment, the analysis of literary sources (Gerasimov B.M., Divizinjuk
M.M., & Subach I.Y., 2004; Timochko A.I., 2013) have shown that the mechanisms of complex
accumulation of new knowledge were not fully researched in the existing concepts of DSS. No
flexibility to bring knowledge of different nature to the form, able to ensure their swift
development and use by DSS operators.
According to (Popov A.L., 2008) for mahing management decision it is for the appropriate
situation necessary to consider the interactions between all factors influenced on the system.
Direct and indirect linkages between elements and inter-element connections. There are
hundreds and thousands in technical systems. Because of in there are additional demands on
architecture, software implementation and processing power of the DSS for task estimations
and risk management in technical systems
A priority task is to provide an ergonomic user’s interface for interaction responsible
persons who make decision makers with such systems for minimizing the probability of errors
due to "human factor (Haettenschwiler P., 1999; Marakas, 1999). This is due to the fact that
there is a need to ensure with the system not only the possibility of conducting operational
search and formalization of information about the risk scenarios, but also to build conceptual
models of building of further consequences in the minds of the service operator. I.e. DSS can
form and visualize qualitative assessments and resumptive characteristics. In particular, the
system is necessary to nut capabilities: to distribute tasks between the control operator and the
system; to identify and classify some priorities of individual tasks, solved by the DSS; to assess
the information content of signs and concepts used by the system, to the formation of step-by-
step algorithms of the operators work with the DSS in a variety of modes both in normal and in
critical conditions; to formalize the main operators possibilities on the processing of
information, which the system outputs into the means of visualization.
2. Existing architectural and software solutions of the DSS
Modern architectural solutions of the DSS vary greatly, depending on the application. The
most universal structure of the DSS, according to (Klochko V.I., Shumkov E.A., & Vlasenko
A.V., 2013), consiCTS of the following blocks: data input, data search, data validator,
knowledge bases, data storage, operational databases, data analysis, methods of making
operating decisions, the methods correction of making decision. The knowledge base can
consist of: the system knowledge base, General knowledge bases, application knowledge base.
However, due to the constant growth and improvement of intellectual analysis of data and
theory of decision making methods, it is necessary to use new architectural solutions. In
particular, the urgent task is the realization of the following opportunities: support the client-
server architecture based on a decentralized distributed network, the use of web technologies
for the purpose of security of access to corporate data, the introduction of cryptographic
techniques to protect against unauthorised access, aggregation of statistics logs on the current

164
and predicted scenarios of development of emergent situations, support for efficient search in
the multi-dimensional structures of data, the treatment of not regulated and not formalized
queries, reliability, scalability, fault-tolerance. The implementation of these functional
possibilities is time-consuming, but it is rewarding in operation due to the high degree of
flexibility in configuration and administration.
A number of authors (Tereljanskij P.V., 2009) note that, among the existing modern DSS
the most functional solutions are the offer from Oracle, SAS, Cognos and Hyperion. However,
the functional sets of these products more focus on the financial planning implementation, the
formation of different kinds of reporting, cost management, value analysis and business event
management than on the conduct; on of the analysis and evaluation of risk scenarios, i.e. it has
an applied economic nature.
There are more simple solutions like "Choice DSS" or "Advisor", they are less demanding
to the resources. Their functions include: gathering appropriate information from various data
sources; transformation of the processed information to the standardized data format;
automated querying to the datastores with the post-processing; flexible search of information
relevant to the query, providing information in a structured way; the easy use in the
administration of the system by the user without additional knowledge; flexibility of the job
metadata. However, to have the functionality of these software packages is not also enough for
embedding as a full DSS for complex technical systems.
There are narrow mathematical standardized software products used for statistical analysis
performance such as S-Plus, Statgraphics, Statistica, "Mesosaur", SPSS, Systat, TimeLab,
Data-Desk, Scenario and others. However, because of the lack of flexibility of settings, no one
of these software systems are not able to take fully into account the specificity and the structural
design of a concrete technical system, interaction between system components.
3. The purpose of the article
The purpose of this article is to describe specific of stages of development of the user’s
interface prototype of the DSS for risk management of complex technical systems to improve
the use of the system by operators and persons who makes decision by reducing the negative
impact on the process of risk management of technical systems of the human factor.
The main stages of development of the user’s interface prototype of the DSS for risk
management CTS are: to design a "mind map" (mindmap) for the concepts domain formation
of the developed system, to build the structural diagram of the subsystems of the software
architecture of the DSS, to develop the algorithm of the system functioning, to create of the
main form interface prototype, to develop the UML class diagram of prototype implementation,
to Assembly and profile the developed prototype interface, to debug and curry out the
automated module testing of the ready software application.
4. A mind-map development for the identification of the domain concepts
Due to the previously conducted analysis of the existing DSS and methods of their
development it can be said that there is a necessity to form domain concepts for solving
problems of risk management of CTS. Nowadays, for the formation and systematization
domain concepts, "mind maps" (mind map) (Gul’tjaev A.K. & Mashin V.A., 2000; Tidvell D.,
2011; Varfel T. Z., 2013), are widely used. A fragment of mind-map o the DSS for risk
management is presented in fig.1. To implement this "mind map" as the software package for
making of conceptual visual models XMind 6 was chosen, due to its high performance, broad
functionality, cross-platform and low demand to resources of a PC.
The basic blocks that make up the structure of the developed DSS are: analytical (AB),
imitational (IB), the database on the elements of CTS (BDE), the database on MS CTS
(BDMS), a block of interactive user’s interface (BII), the block implementing internal logic
(BVL).
165
The AB structure consiCTS of identification modules, analysis and forecasting. The
analysis conducted within the framework of this module is carried out according to two criteria:
the risk level priority and the criticality of potential emergencies.
The IB structure consiCTS of modules of cognitive maps construction, failure scenarios
trees, event trees. The building of cognitive maps is based on the use of graph theory and
determined for 2 types: structural cognitive maps, reflecting the static topological structure of
the items and MS systems, and functional which are designed to accommodate the specific
dynamic of interaction between the elements and MS in different conditions. Each cognitive
map is a directed graph whose nodes are elements and edges MS.
The structure of the BDE is presented in these data tables:
name (including the full name of the item and the description of its functional purpose);
a shorthand notation (the subsystem to which the element belongs, the name and unique
identifier in the form of a 5-digit symbol record are indicates for each item);
the risk level of (the date the italized "Year.Month.Day.Hour.Minute" format the current risk
value for a given element, the maximum and minimum risk values that were fixed by the system
during the entire period of operation);
additional parameters the duration of the operation in the italized format, the average cost of a
new item on the market, expressed in U.S. dollars, the type of the EVI resource used or
generated during the functioning and the operation mode of the element that is presented in
discrete form: O-regular, l-irregular;
the regular probability (failure – in accordance with the regulations, it is predicted, taking into
account the current technical condition of the element and statistically averaged, based on
available statistical data for the entire period of the element).
The EVI resource is understood: energy, substance or information, depending on the structural
design of the element and its functionality.
The BDMS structure mainly follows the structure of the BDE, except for some additional
fields. In particular, the additional parameters table contains the type of the transporter for each
MS EVI resources, as well as the element source fields and the element receiver were created
for making easy diagnosis and the state CTS monitoring.
The BII structure consist of the following modules:
The operating module that contains the components of the decision accounting control, the
control decisions choice, the automated visualization, the view item statistics for MS an CTS;
The monitoring module that contains the components of the online visualization risks of the
values, parameter values and States of the elements and MS CTS, the values of probability of
elements and MS CTS failure;
The diagnostic module that contains the components of technical parameter visualization and
simulation models;
The risk assessment, module that is contain the components visualization values of the
structural and functional risks and damages, the probability of failure on the selected items and
MS CTS.
The structure of the BVL consiCTS of the following modules:
The module of formalization the accident scenarios and the components operation conditions
of CTS;
The module of formation of reporting documentation in the form of an events log, a taken
actions register, a list of accidents with reference of the date;

166
The module of automation of risks, and probabilities damages calculations.
Figure 1 – Fragment of a developed mind map of the DSS for risk management
It becomes possible to detail the specifics of the system components development based on
the created concept domain and the formed mind map. In particular, it is necessery to develop
the software architecture of the DSS.
5. The construction structural diagram building of the software architecture of the
DSS subsystem
The developed software architecture of the DSS is presented in Fig. 2. It contains the
subsystem of (as a part of the future software product of they are separate packages):
identification (for dynamic determination of potential accident scenarios and faults in the
system), analysis ( the formalization of the criteria for possible damages and risks assessment,
with the subsequent identification of correlations in the priority accident scenarios), evaluation
(the conducting numerical evaluation of the coefficients of structural and functional damages
and risks for each priority of the risk development scenario, forecasting ( the elements and the
MS condition assessment in dependence on the taken control decision), confid (the insurance
of the verification and validation of the taken control measures and actions to minimize risks),
logging ( to make the detailed reporting information about changes in the functioning of the
elements and the MS CTS, action taken in emergency and extreme conditions of the system
operation) and monitoring (tracking and visualization of changes in the CTS operation in the
online mode).

167
Figure 2 – Block diagram of the subsystems of the software architecture of DSS
The structural scheme of the software architecture of the DSS subsystems can be a
conceptual basis for the functioning algorithm implementation of the DSS which reflects the
operating cycle of the developed system.
6. Development of algorithm of functioning of the DSS
The idea of the developed algorithm of the software operation of the DSS (Fig.3), is in the
constant operation of all modules of the subsystem in parallel-distributed multi-hown mode.
This reduces the amount of time for using the production capabilities of the computational
devices and allows quickly to record all changes in the elements and the MS, operation that
occur in the system.
Figure 3 – the algorithm of functioning of the DSS

168
The start of the DSS application is performed from the operator’s panel, in a direct or
remote mode. After the running application computational processes for downloading and
updating of the existing analytical and simulation modules that are responsible for the building
of the actual cognitive maps of the CTS are carried out. Initialization of control components,
distribution of memory resources and computing devices is performed. The current data on the
state of the CTS and all its elements and the MS is displayed on the screen, into the log file and
in to the appropriate DB tables. The identification of the potential risk level in the system is
checked. In the case of potentially high level risk detection the forecasting module is challenged
to form the priority emergency development scenarios. The formalization of the priority risk
scenarios, the development of a recommended action list and a comparative evaluation of their
effectiveness is carried out. On the basis of these actions the formation of operating decisions
alternatives, with the possibility of selection and confirmation by the operator is mode. The
decisions made on the risks management are recorded in the logs and the program displays
again the current data on the user’s screen. In the case of the possible risk in the elements and
the MS operation disfunction the system continues its operation in the normal mode, visualizing
the data which come into the DSS. Data is updated by monitoring and diagnostics modules,
with a given regularity (by default it is once half an hour). The synchronization of the software
diagnostic module operation with the database, queries on filling of its fields with the updates
data, and the creation of database backups is carried out. To save computational resources to
monitoring and graphical virtualization of the status of the DSS in th case of stable mode of the
CTS operation, it is possible to turn the system in to the background.
When choosing this mode the background service (daemon) that moves to the system tray
and closes the main interface window of the DSS is run and initialized. In the case of
identification of the possible risk level the system informs the operator. Depending on the
program notification settings the following can happen: a message box or a appears an email to
the specified email address or SMS to mobile phones with the fixation of performed actions in
a log is sent. Due to the elaborated algorithm of the DSS it is possible to turn to the
implementation of the visual part of the user’s interface prototype.
7. The development of the main form prototype interface of the DSS for the risks
management CTS
The analysis of several literature sources (Mashnin T.S., 2009; Nouton P. & Shildt G.,
2003; Weisfeld, 2005) allowed us to that find out that for the development of the visual part of
the user’s interface prototype of the DSS it is advisable to use an integrated environment of
NetBeans 8.0.2 development, Java programming language, Swing GUI framework, the
automatic Maven build. These software tools were chosen because of the easy configuration of
their joint work, the development of applications based on the popular MVC model (Model-
View-Controller), absence of pay-per-use (all tools are free and distributed under a General
Public license). The composition of the main form visual components of developed user’s
interface prototype of the DSS is presented in table 1. The appearance of the main form interface
prototype of the DSS for the risk management CTS is presented in Fig. 4.
Table 1 – Composition of used visual components of the developed prototype DSS
Type
Name
Description of functional purpose
JPanel
OperatingUnit The display area of the control module component
HistoryLogUnit The display area of the events logging module
components
CtsStructureUnit The display area of the components of the
structure CTS output module components
RiskEvalutionUnit The display area of the risk assessments output
module components
JTabbedPane MenuTab The tabs form

169
JLabel
ListLabel The display component of the action list label
ElementTableLabel The display component of the elements table label
IEConnectLabel The display component of the table MS label
CBCtsDiagLabel The display component of the risk diagram label
HistoryLogLabel The display component of the log information
output label
NormImpactLabel The display component of the normalizing impact
activation label
StartStrMomLabel The display component of the striking modeling
impulse activation label
JButtom
ApplyButtom The component of the selected solution
application
CanselButtom The component of the selected solution
cancellation
JTable
ElementOutTable The component of the output of the CTS elements
parameter values
IEOutTable The component of the output of the MS CTS
parameter values
JText Area LogTextArea Log information output component
JCheck Box
ViewCtsDiagChBox The component of the CTS risks diagram output
activation
ViewCtsGraphChBox The component of the CTS cognitive maps output
activation
StartNormImpChBox The component of the normalizing impact
activation
StartModMoMShBox The component of the striking modeling impact
activation
JComboBox DesitionList The display component of control solutions
JFrame
GraphOutFrame The CTS cognitive map visualization component
DiagOutFrame The risk distribution diagram visualization
component
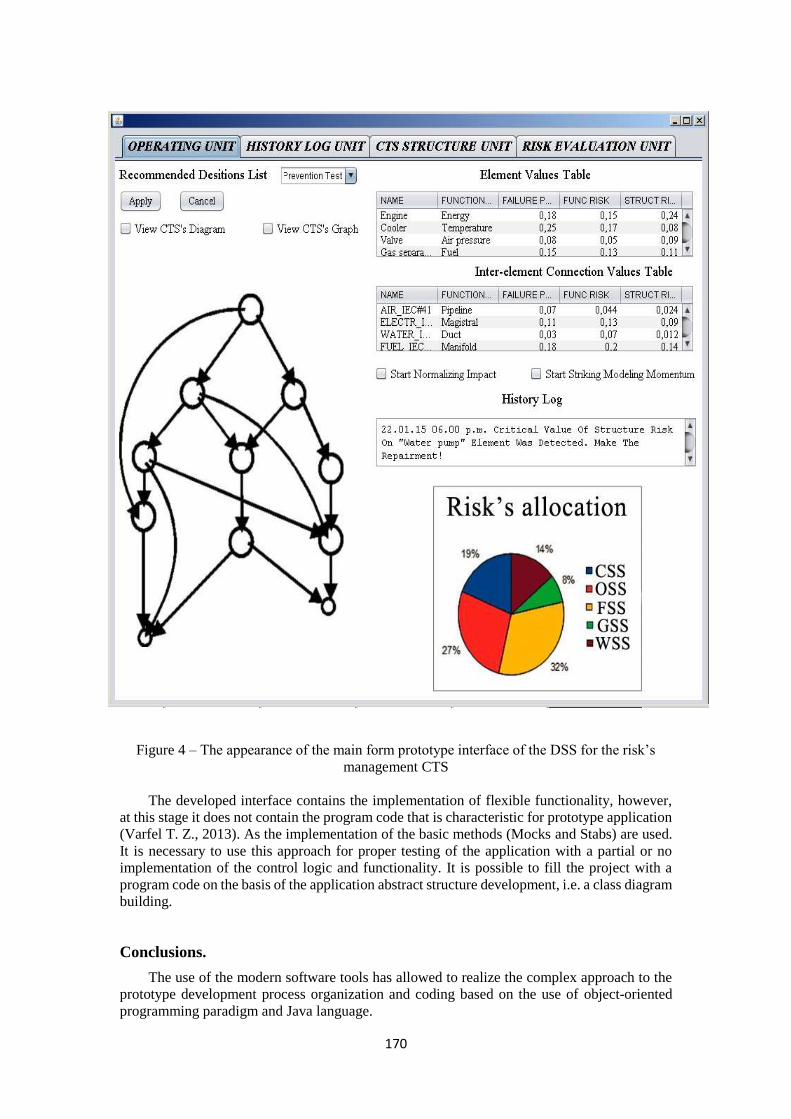
170
Figure 4 – The appearance of the main form prototype interface of the DSS for the risk’s
management CTS
The developed interface contains the implementation of flexible functionality, however,
at this stage it does not contain the program code that is characteristic for prototype application
(Varfel T. Z., 2013). As the implementation of the basic methods (Mocks and Stabs) are used.
It is necessary to use this approach for proper testing of the application with a partial or no
implementation of the control logic and functionality. It is possible to fill the project with a
program code on the basis of the application abstract structure development, i.e. a class diagram
building.
Conclusions.
The use of the modern software tools has allowed to realize the complex approach to the
prototype development process organization and coding based on the use of object-oriented
programming paradigm and Java language.
171
The applied methodologies, technical tools and graphics libraries for quick prototyping
reduced time and programming code amount to develop the user’s interface prototype of the
DSS for risk management of the CTS.
The testing and profiling of the developed user’s interface prototype of the DSS for risk
management of CTS has demonstrated its efficiency, the variety of the potential put in the
application, due to the use of the modern technologies of software implementation, as well as
the possibilityof taking into account for the specific of the various elements risk impact and
the MS systems on the control action value.
The developed prototype allows to automate the process of monitoring risks, reduce
material and time coCTS for the development and adoption of management decisions.
The developed user’s interface prototype of the DSS for risk management CTS cross-
platform and advanced software application with a low degree of classes connectivity and can
be used with the further implementation of the back-end part of the DSS based on modern
design patterns due to the flexibility of implementation.
References
Barsegjan A.A., Kuprijanov M.S., & Stepanenko V.V.,. (2004). Metody i modeli
analiza dannyh: OLAP i Data – mining [Methods and models of data analysis: OLAP
and Data - mining] (p. 336). Peterburg: BHV.
Gerasimov B.M., Divizinjuk M.M., & Subach I.Y.,. (2004). Sistemy podderzhki
prinjatija reshenij: proektirovanie, primenenie, ocenka jeffektivnosti [Decision support
systems: design, application, performance evaluation]. Sevastopol': NANU, NIC VSU,
318.
Grinchenko M.A.,. (2011). Realizacija informacionnoj tehnologii prognozirovanija
processov razvitija makrojekonomicheskoj sistemy. Rezul'taty issledovanija [The
implementation of information technology development process of macroeconomic
forecasting system. results of the study]. Sistemy Obrabotki Informacii, 2(92), 259-262.
Gul'tjaev A.K., & Mashin V.A.,. (2000). Proektirovanie i dizajn pol'zovatel'skogo
interfejsa [Design of user interface] (p. 352). SPb: Koronaprint.
Haettenschwiler P.,. (1999). Neues anwenderfreundliches Konzept der Entscheidungs-
unterstutzung. Gutes Entscheiden in Wirtschaft, Politik und Gesellschaft (pp. 189-208).
Zurich: Hochschulverlag AG.
Klochko V.I., Shumkov E.A., & Vlasenko A.V.,. (2013). Arhitektury sistem
podderzhki prinjatija reshenij [Architecture Decision Support Systems]. Nauchnyj
Zhurnal Kubgau, 02(86), 1-10.
Kuznecov M.A., & Ponomarev S.S.,. (2009). Sovremennaja klassifikacija sistem
podderzhki prinjatija reshenij [Modern classification decision support systems].
Prikaspijskij Zhurnal: Upravlenie I Vysokie Tehnologii, 3(3), 52-58.
Marakas, G. (1999). Decision support systems in the twenty-first century. Upper Saddle
River, N.J.: Prentice Hall.
Mashnin T.S.,. (2009). Sovremennye Java-tehnologii na praktike [Modern Java
technology in practice] (p. 560). SPb: VHV Peterburg.
Morgunov E.P.,. (2007). Sistema podderzhki prinjatija reshenij pri issledovanii
jeffektivnosti slozhnyh sistem: principy razrabotki, trebovanija i arhitektura [Decision
support system in the study of complex systems: design principles, requirements and
architecture]. Vestnik Sibirskogo Gosudarstvennogo Ajerokosmicheskogo Universiteta
Imeni Akademika M.F.Reshetneva, 3(3), 59-63.
Nouton P., & Shildt G.,. (2003). Java 2 (p. 1072). SPb: VHV Peterburg.
Pavlenko M.A., Berdnіk P.G., Kalmikov M.M., & Kapranov V.O.,. (2008). Pіdhodi do
rozrobki іnformacіjnih modelej v sistemah pіdtrimki prijnjattja rіshen' [Approaches to
the development of information models in decision support systems]. Sistemi Obrobki
Іnformacіi (Harkіv: HU PS), 1(68), 60-64.
172
Popov A.L.,. (2008). Sistemy podderzhki prinjatija reshenij: Uchebno-metod. Posobie
[Decision Support Systems] (p. 80). Ekaterinburg: Ural. gos. un-t,.
Rudnichenko N.D., Vychuzhanin V.V. (2013). Struktura sistemy podderzhki i
prinjatija reshenij pri proektirovanii intellektual'nyh sistem ocenki zhivuchesti
tehnicheskih sistem [] .Materialy vseukrainskoj nauchno-tehnicheskoj konferencii s
mezhdunarodnym uchastiem «Suchasnі tehologії proektuvannja, pobudovi,
ekspluatacії і remontu suden, mors'kih tehnіchnih zasobіv і іnzhenernih sporud» (IST-
2013) (pp. 115–117). Ukraine: IUST.
Tereljanskij P.V.,. (2009). Sistemy podderzhki prinjatija reshenij. Opyt
proektirovanija: monografija [Decision support systems. Experience in design: a
monograph] (p. 127). Volgograd: VolgGTU.
Tidvell D.,. (2011). Razrabotka pol'zovatel'skih interfejsov [The development of user
interfaces] (p. 480). SPb: Piter.
Timochko A.I.,. (2013). Proektirovanie informacionnogo obespechenija dejatel'nosti
operatora v perspektivnyh sistemah upravlenija [Design of Information Management
in the perspective of the operator control systems]. Nauka І Tehnіka Povіtrjanih Sil
Zbrojnih Sil Ukraїni, 3(12), 114-149.
Varfel T. Z.,. (2013). Prototipirovanie. Prakticheskoe rukovodstvo [Prototyping.
Practical Guide] (p. 240). Moscow: Mann, Ivanov i Ferber.
Weisfeld, M. (2005). Ob"ektno-orientirovannyj podhod: Java,.Net, S++. Vtoroe
izdanie [The Object-Oriented Thought Process] (2nd ed., p. 304). Moscow: KUDIC-
OBRAZ.
Zagorul'ko Y.A., Zagorul'ko G.B., & Kravchenko A.Y.,. (2010). Razrabotka sistemy
podderzhki prinjatija reshenij dlja neftegazodobyvajushhego predprijatija [The
development of decision support systems for the oil and gas companies]. In 12-j
nacional'naja konferencia po iskusstvennomu intellektu s mezhdunarodnym uchastiem
– KII-2010 (pp. 137-145). Moscow: Fizmatlit.

173
Towards Sustainable Enterprise Resource
Planning and Management Approach for
Universities
Radwan Tahboub
Palestine Polytechnic
University
Palestine
Abstract:
Enterprise Resource Planning and management systems (ERP) are very important
integrated and crucial solutions to the success of small to medium enterprise (SMEs)
businesses. Such solutions are very risky and not straightforward solution and may lead to
business failure if not implemented correctly, hence many critical factors play important roles
in a successful implementing of an ERP system. Recently, smart and innovative universities
started to look at ERP systems so as to solve their problems in controlling, managing and
sustaining the ever expanding business functions related to university daily and strategic
activities. This includes the integration and automation of all university activities, services,
resource planning and decision making activities such as student life cycle, staff recruitment
and assessment, financial issues and human resources management. Information technology
plays a very important role in the sustainable implementations of such university ERP (UERP)
solutions. In this paper, a presentation of best practice approach on how to plan for successful
UERP systems. Palestine Polytechnic University (PPU) will be considered as a case study
Introduction
The information technology era has created new patterns in all aspects of our lives in
general and in entrepreneurial and smart universities in specific. This includes the adoption of
intelligent strategic planning that is based on the correct usage of processed information from
all units and departments of such universities. This amount of information is becoming more
and more huge and complex due to the emersion of different academic, social and economic
factors, needs and resources in each smart university activities to achieve their entrepreneurial
strategic goals and objectives. This means that such universities should highly invest in
different new tools and systems in order to achieve the best quality in sustainable and efficient
use of all available resources including time and cost. Consequently, this increases the overall
performance and competiveness of these universities and makes it more sustainable and robust
in our high demand and changing world [1, 2].
The concept of enterprise resource planning and management ERP began clearly in the
1990's, it is an integrated system that integrates the business functions, where information flows
between different functional modules with a centralized database [3]. ERP systems focus on
how information will be collected, stored, used, accessed, gathered, and summarized [4]. ERP
started as Inventory Control (IC), then it has been developed into Material Requirements
Planning (MRP) in 1970s which focused into planning and controlling the production cycle,
then in 1980s it advanced into Manufacturing Resource Planning (MRP II), its goal is to
increase the efficiency of manufacturing using integrated technologies. ERP integration
includes business functions, software, and hardware [4].
ERP implementation is a complicated process and needs deep involvement from all
departments of the organization [5]. The benefits of a successful ERP system are very large.

174
These benefits can impact all operational, managerial, strategic, IT infrastructure, and
organizational aspects of an organization [6].
Universities as large organizations can take lots of advantages in using ERP systems. The
continuous increase of student numbers, global directions, high operation quality, competitive
environment, and the increment of performance are attracting factors for universities to adopt
the ERP systems [3]. However, the complexity of the ERP system planning and implementation
increases the rate of failure, so the critical success factors are the most important aspects that
must be taken into consideration during any ERP system implementation life cycle [6].
Critical Success Factors in ERP Systems
In order to have a successful implementation of an ERP systems, many factors should be
considered in order to be sure that the final implementations leads to the required objectives by
such an implementation. Such factors are called Critical Success Factors (CSFs) [6]. CSF can
be defined as series of activates with special and continuous consideration for ERP planning
and implementation [5].
According to [11] there are 37 CSFs are summarized after validation, ranking and
classification processes. Also these factors are categorized into four categories: critical, active,
reactive, and inert; according to the roles which are played in the implementation of the system
as shown in table 1. Critical factors: are factors that strongly impact other factors and impacted
by other. Active factors: these factors which are less affected by other factors. Reactive factors:
factors which are the opposite of active ones. Inert factors: are factors that less involved in the
system dynamics and they are be opposite of critical ones.
Dozens of studies about the CSFs and their impact in success and failure of ERP
implementations led to conclude their significance to find the CSFs which ensure the success
in higher education sector [3]. CSFs can be categorized into 4 groups [7]. Also [8] summarized
the 11 main CSFs after studying a 1000 companies and set sub factors inside each main factor.
Others studies mentioned 9 CSFs [9]. Finally, [10] present the CSFs and ERP's performance
according the regions and countries.
University Information Technology Systems
It is known that information is the result of row data processing. Huge amount of
information need special tools to analyze it in order to make use of the valuable results needed
to make suitable and fruitful decisions. Such advanced tools include intelligent systems, data
mining tools and expert systems. A university that makes good use of such tools will lead to
knowledge based, experienced, smart and wise university that responds to different critical
situations in the right manner and right time.
Table 1: CSFs groups according to [11]
Critical Factors Active Factors
Top management support
Management of expectations
Business process reengineering
Project (ERP) team composition and
competence
Education and training of users
Interdepartmental cooperation and
communication
Involvement of users in systems development
and integration
Culture of resistance within an organization
Vendor and consultant support to users
Systems changes and upgrade to new versions
Change management
Organization politics and characteristics
Interest groups
Management style and decision making
National and organization cultures
Rules and practices
Reactive Factors Inert Factors
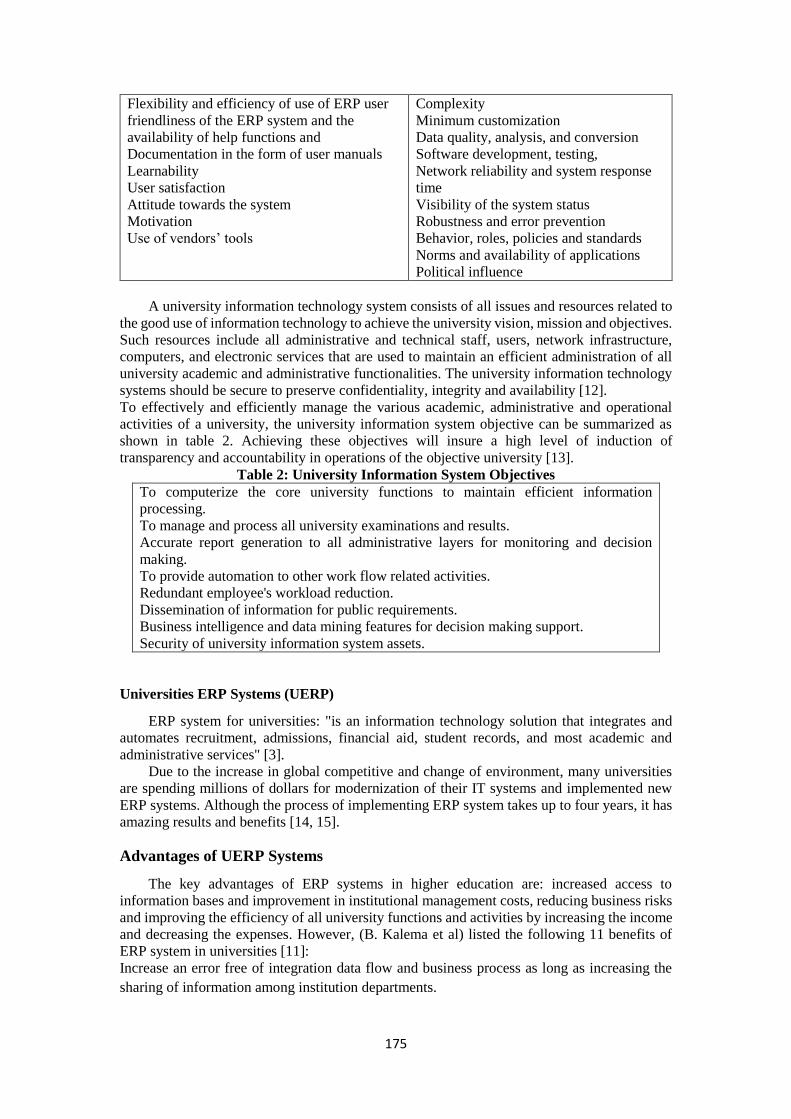
175
Flexibility and efficiency of use of ERP user
friendliness of the ERP system and the
availability of help functions and
Documentation in the form of user manuals
Learnability
User satisfaction
Attitude towards the system
Motivation
Use of vendors’ tools
Complexity
Minimum customization
Data quality, analysis, and conversion
Software development, testing,
Network reliability and system response
time
Visibility of the system status
Robustness and error prevention
Behavior, roles, policies and standards
Norms and availability of applications
Political influence
A university information technology system consists of all issues and resources related to
the good use of information technology to achieve the university vision, mission and objectives.
Such resources include all administrative and technical staff, users, network infrastructure,
computers, and electronic services that are used to maintain an efficient administration of all
university academic and administrative functionalities. The university information technology
systems should be secure to preserve confidentiality, integrity and availability [12].
To effectively and efficiently manage the various academic, administrative and operational
activities of a university, the university information system objective can be summarized as
shown in table 2. Achieving these objectives will insure a high level of induction of
transparency and accountability in operations of the objective university [13].
Table 2: University Information System Objectives
To computerize the core university functions to maintain efficient information
processing.
To manage and process all university examinations and results.
Accurate report generation to all administrative layers for monitoring and decision
making.
To provide automation to other work flow related activities.
Redundant employee's workload reduction.
Dissemination of information for public requirements.
Business intelligence and data mining features for decision making support.
Security of university information system assets.
Universities ERP Systems (UERP)
ERP system for universities: "is an information technology solution that integrates and
automates recruitment, admissions, financial aid, student records, and most academic and
administrative services" [3].
Due to the increase in global competitive and change of environment, many universities
are spending millions of dollars for modernization of their IT systems and implemented new
ERP systems. Although the process of implementing ERP system takes up to four years, it has
amazing results and benefits [14, 15].
Advantages of UERP Systems
The key advantages of ERP systems in higher education are: increased access to
information bases and improvement in institutional management costs, reducing business risks
and improving the efficiency of all university functions and activities by increasing the income
and decreasing the expenses. However, (B. Kalema et al) listed the following 11 benefits of
ERP system in universities [11]:
Increase an error free of integration data flow and business process as long as increasing the
sharing of information among institution departments.

176
ERP system helping the teaching and learning ways.
Internal workflow will increase efficiently, such as: student registration.
Developing and adopting effective actions of a new business process.
Enhancing an information sharing.
The ease of access to the information recourses.
Communication will be managed and effective alerts of programs.
Centralization of data storage.
Provide an easy web interface system.
The planning operation will be increased.
Reducing the overhead expenses, increase efficiency by optimizing the hardware institution.
The Integration of all functions in higher education institutes' environment represent
financial, academic, human resource, and administration as a one piece that shares the business
functions, and the ability to transfer the data between the users and individual process in real
time; unlike the previous system which was a fragmented application systems. Keeping up with
modern ICT (mobile, wireless, web based applications) is also important in universities
communities [5].
Components of UERP Systems
Table 3 shows the basic components of a UERP system. Each component consists of many
subcomponents that work in harmonic with each other and with the other sub components in
the system. Of course other components/subcomponents can be added or deleted to the UERP
system as each university needs and requires. Usually, these components are administered and
used through an efficient fully integrated web-enabled multi-tier application with management
functions that are necessary to successfully handle all the aspects of the target university.
Table 3: Components and sub Components of a Typical UERP
UERP Basic Components UERR Subcomponents
Student aspects management
systems:
Students admissions and academics
Examination management and result processing alumni
management
Student fees and financial management
Students self-service portal
Attendance monitoring
Placement service portal
Financial and human
resource management
system:
Financial accounting and budget management
HR and payroll management
Employees self-service portal
Stores, purchase, bill tracking and assets management
Administrative issues
management and reporting
system:
Knowledge management
Fleet management
Medical service and insurance management
E-procurement and tendering management
Legal issues and complaints management
Other university activities
management system
Library management
File and document management
Research project and master thesis management
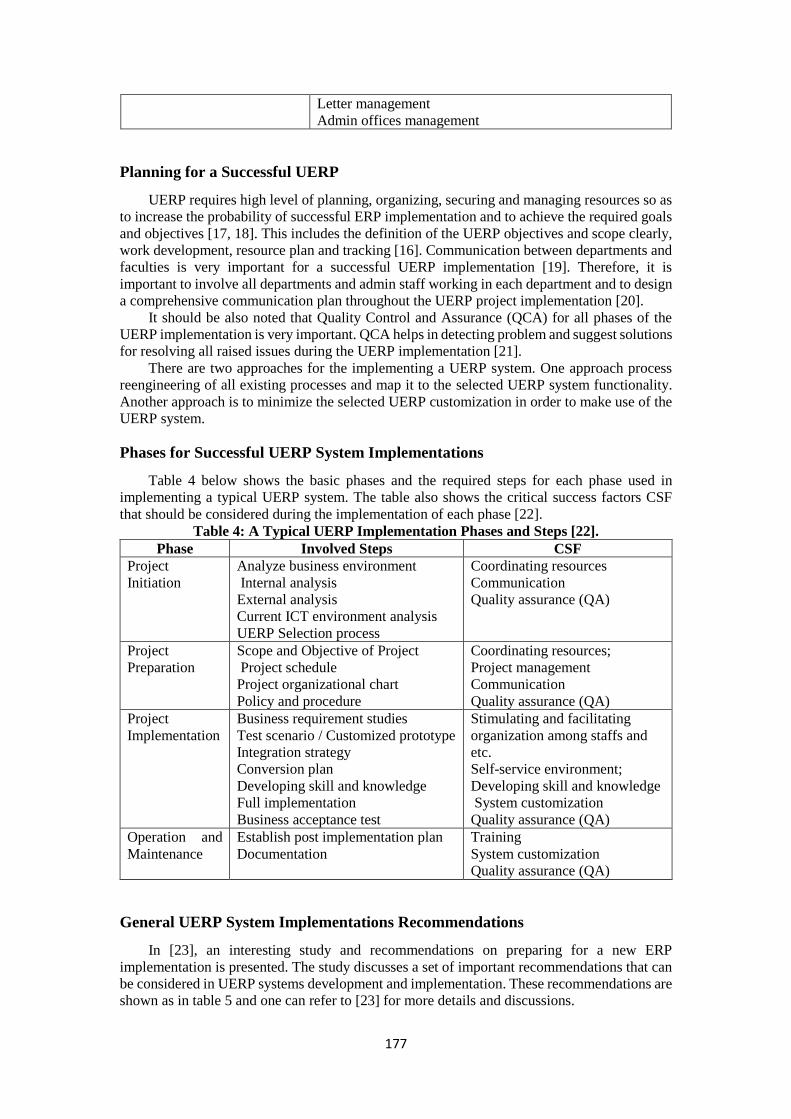
177
Letter management
Admin offices management
Planning for a Successful UERP
UERP requires high level of planning, organizing, securing and managing resources so as
to increase the probability of successful ERP implementation and to achieve the required goals
and objectives [17, 18]. This includes the definition of the UERP objectives and scope clearly,
work development, resource plan and tracking [16]. Communication between departments and
faculties is very important for a successful UERP implementation [19]. Therefore, it is
important to involve all departments and admin staff working in each department and to design
a comprehensive communication plan throughout the UERP project implementation [20].
It should be also noted that Quality Control and Assurance (QCA) for all phases of the
UERP implementation is very important. QCA helps in detecting problem and suggest solutions
for resolving all raised issues during the UERP implementation [21].
There are two approaches for the implementing a UERP system. One approach process
reengineering of all existing processes and map it to the selected UERP system functionality.
Another approach is to minimize the selected UERP customization in order to make use of the
UERP system.
Phases for Successful UERP System Implementations
Table 4 below shows the basic phases and the required steps for each phase used in
implementing a typical UERP system. The table also shows the critical success factors CSF
that should be considered during the implementation of each phase [22].
Table 4: A Typical UERP Implementation Phases and Steps [22].
Phase Involved Steps CSF
Project
Initiation
Analyze business environment
Internal analysis
External analysis
Current ICT environment analysis
UERP Selection process
Coordinating resources
Communication
Quality assurance (QA)
Project
Preparation
Scope and Objective of Project
Project schedule
Project organizational chart
Policy and procedure
Coordinating resources;
Project management
Communication
Quality assurance (QA)
Project
Implementation
Business requirement studies
Test scenario / Customized prototype
Integration strategy
Conversion plan
Developing skill and knowledge
Full implementation
Business acceptance test
Stimulating and facilitating
organization among staffs and
etc.
Self-service environment;
Developing skill and knowledge
System customization
Quality assurance (QA)
Operation and
Maintenance
Establish post implementation plan
Documentation
Training
System customization
Quality assurance (QA)
General UERP System Implementations Recommendations
In [23], an interesting study and recommendations on preparing for a new ERP
implementation is presented. The study discusses a set of important recommendations that can
be considered in UERP systems development and implementation. These recommendations are
shown as in table 5 and one can refer to [23] for more details and discussions.

178
PPU Case Study
In this section a presentation on how the first and second phases of planning a sustainable
UERP system at PPU were processed. The required steps in each phase were done through
comprehensive meetings and discussions with professionals and staff from different
administrative and technical departments and units. The analysis was done by all the PPU
stakeholders: PPU management, IT center of excellence, PPU computer center, faculty
members, academic department, student registration department, finance department, human
resource department etc.
Table 5: New ERP Implementation Recommendations [23]
Rec # Recommendation Action Points
R1
Target and objectives for Operations
should be defined and outcome of the
employees actions should be visible
for ensuring efficient usage of ERP
Define clear monthly and quarterly
targets.
Follow up in weekly meetings 3. Define
clear business plan and vision.
R2
Recognize employees’ requirements
for ERP system itself to increase
usefulness and learnability of ERP for
achieving improved user satisfaction.
Identify ERP function related to
employee roles.
R3
Name department’s key user or users.
Recognize users’ requirements from
learning style perspective and create a
training plan accordingly. Focus
training on two subjects, using ERP
and changed processes.
Name department's key user or users.
Create implementation team within the
case company.
Apply "Learning Style Questionnaire".
Consider "Learning organization" test.
Create training plan to accomplish two
subjects; use of ERP and changed
processes
R4
Focus and ensure positive and open
organizational culture to-wards the
ERP implementation project.
Define target status of change.
Establish strong team.
Analyze current status of resistance.
Communicate target.
Personalize target.
Follow-up.
Institutionalize working practices.
Define business performance
measurements for follow-up and for
defining success
R5
By the support of top management,
the employee involvement and the
meaning of the ERP in the company
can be increased.
Obtain top managements support.
Ensure sufficient time and money
budgets.
Introduce strategic vision
R6
Create a communication plan that
sells the project to employees and
covers the scope, objectives and tasks
of the project.
Communicate the benefits of the ERP.
Communicate how new system will
work.
Communicate how employees outcome
will improve
R7
Identify and trace the key business
processes with the help of experts for
ensuring that those will be
implemented in new ERP.
Identify processes related to current
ERP.
Identify processes where current ERP is
not used.
Recognize processes that can't be
implemented to new ERP.
Re-design point 3 processes to fit new
ERP

179
PPU Business Environment Analysis
PPU started to study the possibility of implementing a UERP so as to achieve an efficient
information technology system as presented in section 1.2, the set objectives was as presented
in table 1 above. Also PPU want to sustain the presented advantages of UERP systems
presented in section 2.1. Hence, PPU UERP will fulfill the vision of "developing an
entrepreneurial information technology system that leads to wisdom and knowledge based
administrative decisions".
PPU also claimed the UERP system mission of "To reach a comprehensive information
system that can be efficiently used in PPU resources planning and management in order to
achieve PPU vision and mission to fulfill wise administrative activities in all aspects of
university life cycle"
Accordingly the first step was to analyze the PPU environment (business analysis), this step
included three activities:
Institution’s internal analysis,
Institution’s external analysis and
Institution’s ICT current environment's analysis.
The results of these activities are summarized as shown in table 6 and in figure 1.
Table 6: Summary of PPU Internal, External and ICT Analysis.
Environmental
Factors Strengths Weaknesses
Institutional
Performance
So many ICT
professionals with high
level of experiences
Normal overall ICT systems performance
satisfaction
ICT staff
properties
High level of ICT
specialists with different
skills and experiences
Low number of professionals in SE
development.
Lack of high experienced SE analysts.
Lack of leadership in the SE development
lifecycle.
Administrative
properties
High and medium
administration levels
willingness to support
an integrated ICT
solution.
Lack of real plans to fulfill the required
willingness in developing the integrated ICT
system.
Lack of clear ICT manager reference to
manage and lead the development process.
High academic and work load of existing
ICT staff
Weak follow-up of previous
recommendations to develop an integrated
ICT system
Properties of
current offered
services
Basic services to
accomplish day to day
tasks like registration
and HR services
Nonintegrated subsystems since it were built
on local basis.
Does not clearly support new PPU mission
and vision.
Does not support intelligence or knowledge
based decision support activities
Minimal documentation and reference
manuals.
ICT
organizational
structure
Basic structure of
existing units like
Lack of high level clear ICT organizational
structure that supports the development of

180
computer center and
center of excellence
the claimed university ICT integrated
system.
Financial
aspects
Basic budget to support
the existing ICT
activities
Lack of high budget allocation for the
required ICT integrated systems
ICT Reputation
PPU is an ICT based
organization with high
reputation.
High level of performance expectations from
PPU ICT services and functions.
ICT decision
making
strategies
Very good intra unit
decision making
strategies
Lack of integrated mechanisms to handle a
high level of ICT integrated systems
ICT quality
control and
assurance
None Lack of quality control and assurance to
control the existing ICT subsystems
Miscellaneous
issues and
aspects
Intention to handle the
change management
issues by the PPU
administration.
Possibility of
conducting internal
training and building
awareness activities.
Possibility of securing
external fund to support
the required ICT
integrated system.
High work load of all PPU users.
Change management issues by some units,
users and students.
Slow follow up of the latest ICT leading
edge technologies.
No clear decision regarding UERP BUY or
MAKE strategies.
Delay in implementing the PPU security
recommendations suggested by the PPU
security CERT.
Figure 1: PPU Non-Integrated Subsystems
PPU UERP System Project Preparation Phase
It is clear from the previous business environmental analysis that a lot of work should be
done in order to start the UERP project implementation. All non-integrated subsystems should
be redesigned and integrated to be similar to that in figure 2.
The following points summarize the basic recommendations that can be followed in order to
move forward towards a sustainable UERP implementation at PPU.

181
Continue using and marinating the existing non-integrated subsystems and finish the
development of already started subsystems including the webpage development.
Implement the computer center action plan regarding the required center infrastructure.
Assign or create a new administrative position with VP privileges to lead the required PPU
UERP project.
Re-engineering and reorganizing the ICT organizational units according to the following
suggested sample diagram, figure 2.
Assign the new ICT VP to supervise and implement the following activities towards the new
UERP system:
Recruit / train new / existing highly qualified staff to be assigned to the new ICT organizational
structure as suggested in figure 2.
Develop a comprehensive and integrated master plan to all required activities and subsystems
to fulfill the required UERP components as mentioned in section 2.2. This includes the gap
analysis and relationship between the required subsystems and existing ones.
Develop a detailed and comprehensive plan to implement the new UERP system and decide on
whether to buy or make the strategies or a combination of them.
Create the recommended computer data center structure and equipment.
Allocate the required budgets so as to start the implementation of the previous steps and
recommendations.
Implement the PPU security recommendations suggested by the PPU security CERT.
Figure 2: Sample Integrated Subsystems towards UERP

182
UERP System Buy or Make Decision
One of the most important questions that one can ask while moving toward the UERP
systems is whether to buy or make the UERP. This question is very difficult question and in
order to answer such a question many factors can be considered. This includes, but not limited
to cost, quality and time of analyzing, designing, implementing and mainlining / testing of the
UERP. Accordingly, PPU team did a very comprehensive study to be able to come up with a
clear decision. In all cases, PPU should do a very detailed requirements and gap analysis which
will lead to determine all required processes that should be included in the new UERP.
Figure 3: Suggested new University ICT Organizational Structure.
The study showed that in-house software development may be considered due to the
experienced teams at PPU and at the same time the existing processes requires a lot of
customization that may take a lot of time to be done when buying an existing UERP. However,
by doing so, PPU has to wait for few years to be able to finish the required systems. According
a hybrid approach may be selected so as to minimize the time/cost/customization factors in the
intended UERP.
Table 7 shows a simple comparison of one of the scenarios that has been considered
compare the buy or make and the hybrid approaches. It may be clear that the hybrid approach
can be considered as trade-off for a university with good technical experiences and staff.
However, a more comprehensive and detailed study should be conducted in order to make sure
which approach to select for a given university. PPU will do this once the new organizational
structure is approved and in action.
VP for ICT
Capacity Building and Training Unit Computer Center
Information Security Unit
Network Infrastructure Unit
Data Center Unit
Maintenance Unit
Software Systems Development Center
SE Analysis and Documentation Unit
Software Develempnet Unit
WEB and Interface Development Unit
Quality Control and Assurance Unit
VP Admin Office

183
Table 7: Comparison of Different Development Approaches
Conclusion
In this paper a presentation of how enterprise resource planning and management systems
can be mapped and used in universities and educational organizations. ERP systems are usually
used in business organizations to manage and plan for their resources, however if these systems
are used in universities, a great values and benefit can be gained from such systems. UERP will
increase the level of integration of the university functions and processes to a level that helps
all university stake holders to go to the knowledge and wisdom and intelligence in their day to
day and strategic decision making activities.
A case study on a sample university has been presented and results showed that UERP
systems need a lot of work and commitments from all users and administrative layers. However,
even if using UERP system in universities is a dream for all university stakeholders, so many
factors should be considered and handled in order to reach a successful implementation of such
systems.
Acknowledgement
The author would like to thank all the PPU Software Systems Integration Committee
members for their support and help while discussing and approving the ideas that were raised
during the PPU UERP System proposal phase. Special thanks go to PPU administration for
their time and efforts in discussing the raised ideas with the committee members.
References
Zornada, L., & Velkavrh, T., "Implementing ERP Systems in Hogher Education
Institution", 27th Int. Conf. Information Technology, 20-23 June, 2005.
Fisher, M. D. "Staff perception on enterprise resource planning implementation - case
study of three Australian Universities, PhD Thesis, Queensland, Central Queensland
University, 2006.
Aldayel, M. Aldayel, A. Al-Mudimigh, "The critical success factors of REP
implementation in higher education in Saudi Arabia - case study", 2011.
M.Lutovac, "The successful methodology for enterprise resource planning (ERP)
implementation", 2012.
R. Ahmad, Z. Mukhtar, "Campus ERP implementation framework for private institution
of higher learning environment in Malaysia". 2011.
I.Sowan, R.Tahboub, "ERP systems critical success factors: ICT perspevtive",The SAI,
IJACSA 2015.
E.Ziemba, I.Obłąk, "Critical Success Factors for ERP Systems Implementation in Public
Administration ", Interdisciplinary Journal of Information, Knowledge, and Management,
2013.
F.Nah, J.Lau, "ERP implementation: Chief Information Officers' Perception of Critical
Success Factors", International Journal of Human-Computer Interaction, 2003.
E.Umble, R.Haft, M.Umble, "Enterprise resource planning: Implementation producers and
critical success factors", ELSEVIER journal, 2003.
E.Ngai, C.Law, F.Wat, "Examining the critical success factors in the adoption of enterprise
resource palnning". ELSEVIER journal, 2008.
Purchase from external company (Analyze+
Purchase+ Maintenance for 36 M)
(18 Deployment)
+ (36 M
Maintenance)
622576 285000 373546 162000 50000 1,493,121 90%
Development by PPU Existing and New Staff 54 852000 285000 0 162000 50000 1,349,000 70%
Developing using Exisiting Staff (based on 54
months for developing part of the system)
54 (96 M if all
Modules will be
developed)
162000 351000 0 162000 30000 705,000 20%
TCO for
PPU ERP
System (4
years)
Other
Logistic
s Costs
Other
Technical
Staff Costs
(by PPU )
Effeciency
Of Final
Products
Development MethodExpected Period
(M)
Direct Dev
Cost
PPU inkind
Costs (Exisiting
Staff)
Maintenance
Costs (for 36 M)

184
Kalema, O. Olugbara, R. Kekwaletswe: "Identifying critical success factors: the case of
ERP systems in Higher education", 2014.
A.Bajahzar, A.Alqahtani, A.Baslem, "A survey study of the Enterprise Resource
Planning", international conference on advanced computer science applications and
technology, 2013.
Cavtat, Croatia. pp. 307-313. A.Abugabah, L.Sanzogni, "Enterprise resource planning
(ERP) system in higher education: A literature review and implication", 2010.
A.Abugabah, L.Sansogni, O.Alfarraj, " Evaluation the impact of ERP systems in higher
education", 2015
A.Abugabah, L.Sansogni, O.Alfarraj, "The phenomenon of enterprise systems in higher
education: insights from users", 2013.
Rabaa‟I, A., Bandara, W., & Gable, G. ERP Systems in the Higher Education Sector: A
Descriptive Case study. 20th Australian Conference on Information Systems, 2-4 December,
2009. Melbourne, Australia. pp. 456-470. 2009.
Nah, F. F.-H., & Delgado, S. Critical Success Factors For Enterrpise Resource Planning
Implementation and Upgrade. Journal of Computer Information Systems , Vol.47, No. 1, pp.
99-113. 2003.
Umble, E. J., Haft, R., & Umble, M. M. Enterprise Resource Planning: Implementation
Procedures and Critical Success Factors. European Journal of Operational Research, Vol. 146,
No. 2, pp.241-257. 2006.
Al-Mudimigh, A., Zairi, M., & Al-Mashari, M. ERP software implementation: an
integrative framework. European Journal of Information System , Vol.10, No.4, pp.216-226.
2001.
Mahrer, H. SAP R/3 implementation at the ETH Zurich: A higher education management
success story. Proceeding of the 5th American Conference on Information System, 13-15
August, Milwaukee, WI. p. 272. 1999.
Kumar, M., Vijaya, P., Suresh, D. A., & Prashanth. Analyzing the Quality Issues in ERP
implementation: A case Study. Conference on Emerging Trends in Engineering and
Technology, ICETET-09, 19-21 November, Nagpur, India. pp. 759-764. 2010.
R. Ahmad, Z. Othman, M. Mukhtar," Campus ERP Implementation Framework for Private
Institution of Higher Learning Environment in Malaysia", Wseas Transactions on Advances In
Engineering Education, Issue 1, Volume 8, ISSN: 1790-1979, January 2011.
Antti Karkio, "Preparing for ERP Implementation, Case Study", Helsinki Metropolia
University of Applied Sciences, Master’s Degree, Industrial Management, Master’s Thesis,
May 2014.
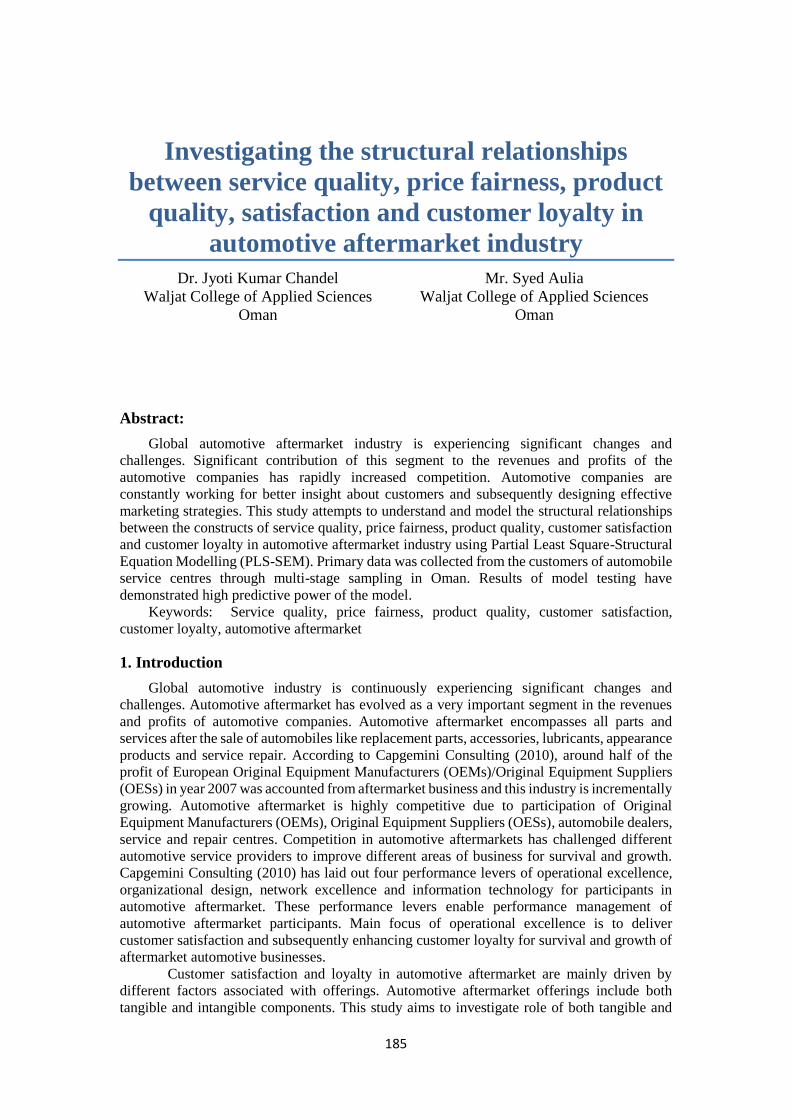
185
Investigating the structural relationships
between service quality, price fairness, product
quality, satisfaction and customer loyalty in
automotive aftermarket industry
Mr. Syed Aulia Dr. Jyoti Kumar Chandel
Waljat College of Applied Sciences Waljat College of Applied Sciences
Oman Oman
Abstract:
Global automotive aftermarket industry is experiencing significant changes and
challenges. Significant contribution of this segment to the revenues and profits of the
automotive companies has rapidly increased competition. Automotive companies are
constantly working for better insight about customers and subsequently designing effective
marketing strategies. This study attempts to understand and model the structural relationships
between the constructs of service quality, price fairness, product quality, customer satisfaction
and customer loyalty in automotive aftermarket industry using Partial Least Square-Structural
Equation Modelling (PLS-SEM). Primary data was collected from the customers of automobile
service centres through multi-stage sampling in Oman. Results of model testing have
demonstrated high predictive power of the model.
Keywords: Service quality, price fairness, product quality, customer satisfaction,
customer loyalty, automotive aftermarket
1. Introduction
Global automotive industry is continuously experiencing significant changes and
challenges. Automotive aftermarket has evolved as a very important segment in the revenues
and profits of automotive companies. Automotive aftermarket encompasses all parts and
services after the sale of automobiles like replacement parts, accessories, lubricants, appearance
products and service repair. According to Capgemini Consulting (2010), around half of the
profit of European Original Equipment Manufacturers (OEMs)/Original Equipment Suppliers
(OESs) in year 2007 was accounted from aftermarket business and this industry is incrementally
growing. Automotive aftermarket is highly competitive due to participation of Original
Equipment Manufacturers (OEMs), Original Equipment Suppliers (OESs), automobile dealers,
service and repair centres. Competition in automotive aftermarkets has challenged different
automotive service providers to improve different areas of business for survival and growth.
Capgemini Consulting (2010) has laid out four performance levers of operational excellence,
organizational design, network excellence and information technology for participants in
automotive aftermarket. These performance levers enable performance management of
automotive aftermarket participants. Main focus of operational excellence is to deliver
customer satisfaction and subsequently enhancing customer loyalty for survival and growth of
aftermarket automotive businesses.
Customer satisfaction and loyalty in automotive aftermarket are mainly driven by
different factors associated with offerings. Automotive aftermarket offerings include both
tangible and intangible components. This study aims to investigate role of both tangible and

186
intangible components of automotive aftermarket offerings to influence customer satisfaction
and loyalty. Customers’ perception of service quality, product quality and price fairness are the
antecedents constructs linked with offerings while customer satisfaction and loyalty constructs
are the outcomes. Relationships between service quality, price fairness, product quality,
satisfaction and customer loyalty have been investigated with Partial Least Square – Structural
Equation Modelling (PLS-SEM). Tested conceptual model will facilitate in the prediction of
customer satisfaction and their loyalty in automotive aftermarket industry.
Literature Review
2.1 Service Quality
Parasuraman, Zeithaml & Berry (1988) has given five dimensions of Reliability,
Assurance, Responsiveness, Empathy and Tangibility to measure the service quality.
Parasuraman & Zeithaml (2006) has stated service quality as “the degree and direction of
discrepancy between customers’ service perceptions and expectations”. Most of the researches
in service quality have used the SERVQUAL model developed by Parasuraman, Zeithaml &
Berry (1985& 1988) which provides a comparison of customer expectations and their
perceptions about the services. Cronin & Taylor (1992) has proposed SERVPERF in place of
SERVQUAL because of efficiency of performance based scale.
2.2 Price fairness
A product is mostly measured in terms of its price value when customer satisfaction is to
be considered. They are many more factors that influence the price and its fairness from a
customer point of view (Athanassopoulos 2000).
Anderson, Fornell and Lehmann (1994) also highlighted on the importance of price. They
specified that major factor is concerned with customer satisfaction is the product price. When
customers first make their decision on buying a product, the first few points which come to
their mind include the price of the product as well. Zeithaml and Bitner (1996) has focused on
understanding of price variable and it has to be go in line with service quality as customers are
more concerned about the price of a product.
Zeithaml and Bitner (1996) specify that the measure of customer satisfaction is related to
various parameters like service quality, product quality, price, situation and personal factors.
Zeithaml (1988) through customer’s cognitive conception stated that price was specified
to have a minimum influence on a product or its service. Thus price was clearly specified to be
sacrificed to acquire certain kind of product or service. Many such researches gave the same
review about price and its relation with the service quality. She also explained that objective
monetary price and target price are not equal in customers mind. The correct definition of price
from customers point of view was the price that customer perceived in his mind, that is the
perceived price. Hence, perceived price is much more meaningful than monetary price for any
customer.
Oliver (1999), stated that the customers usually adjudicate service quality and price by the
perception of “equity”. Based on this criterion, they then decide whether they are satisfied or
dis- satisfied.
Zeithaml (1988) also clearly mentioned the relation between perceived price and perceived
sacrifice from a customer point of view. Lower the perceived price lower is the perceived
sacrifice. Contrary to this it is also said that the price is a key factor for a customer and lower
perceived price will not always assure a highly satisfied customer.
2.3 Product quality
Service industries comprise of both tangible and intangible aspects in offerings. Shostack
(1977) classified between tangible products and intangible products. Rathmell (1966) came up
with a concept of good-service scale, where he categorized pure goods on one extreme and pure
187
service at other extreme. But most of the industries fell in between these two extremes. Most
of the researchers lay a hand on this topic of tangible and intangible products in the service
industry. Athanassopoulos (2000) has described product quality as an organization's ability to
produce low-cost products at a high volume and use of quantitative tools to measure product
quality.
Cronin, Brady and Hult (2000) assessed 32 studies in the same field and came up with a
conclusion that tangible quality of service product should be included in the satisfaction model
in the prospective study. They also concluded that the product quality is related to customer
decision making to a greater extent.
Lehtinen and Lehtinen (1991) gave a measure of service quality, and explained that the
physical quality of service is an integration of physical environment, physical support,
equipment and physical features. Here “physical environment and equipment” term is similar
to the tangible measure proposed by Parasuraman, Zeithml and Berrry (1988). Lehtinen and
Lehtinen (1991) considered physical product but took it only as part of the overall physical
quality of service.
Brucks, Zeithanl and Naylor’s (2000) study of perceived quality helps in building
customers for durable products; perceived product quality plays a pivotal role in consumer
decision making process. The satisfaction model which has been proposed by Parasuraman,
Zeithml and Berrry (1994), it is believed that product quality will have similar impact as that
of consumer satisfaction as that service quality. This study helps in measuring the product
quality as an independent factor which is likely to influence the customer satisfaction.
2.4 Customer Satisfaction
Customer satisfaction has a significant place in the marketing field since Cardoz (1965)
introduced it. It explains the frame of mind of a customer for a particular product or service. It
helps manufacturer to survive in the market and achieve profitability and long term relationship
with its customers. For a service provider it is very important to take this into consideration the
expectations of customer (Sureshchandar et al., 2002). A satisfied customer not only tends to
become loyal but also is a good means for potential customers. Satisfied customers will have
publicity through word of mouth about their goods, services and their experiences. For example
in Middle Eastern countries because of cultures, social life has been shaped in a way that social
communication is strong as the strong bonding between the members in their tribe which will
enhance the chances of getting more number of customers (Jamal & Naser, 2002).
2.5 Customer Loyalty
Customers show signs of customer loyalty when a product or service is consistently used
by the same group of people over a stretched time period. In services, loyalty has been
considered as an “observed behaviors” (Bloemer et al.,1999). They are various reasons that
influence loyalty; a few of them are psychological, economic, functional/technical and
contractual. Caruana (2002) has opined that the customer loyalty is not a mere expression
thought rather than a loyalty towards brand. The relationship between product quality and
service quality is of our most importance when it comes to Customer satisfaction. Loyalty
describes fidelity and enthusiastic devotion.
2.6 Relationship between service quality and customer satisfaction
Sureshchandar et al. (2002) has reported a significant relationship between different
service quality dimensions and customer satisfaction. It has been reported that there is a strong
linkage between quality dimensions with respect to the service quality and customer
satisfaction. Hence, we hypothesize:
H1. Service quality has a direct positive effect on customer satisfaction.
2.7 Relationship between service quality and customer loyalty

188
Service quality is directly proportional to the customer loyalty and it has direct and indirect
impact on such as customer perceived value, customer trust and the customer satisfaction
(Tang, 2014). Therefore, we hypothesize:
H2. Service quality has a direct positive effect on customer loyalty.
2.8 Relationship between price fairness and customer satisfaction
Price has always a factor when it comes to customer for making a decision and it has also its
own effect in establishing the customer loyalty in terms of affective loyalty and behavioral
loyalty (Bassey, 2014). Therefore, we hypothesize:
H3. Price fairness has a direct positive effect on customer satisfaction.
2.9 Relationship between price fairness and customer loyalty
Price fairness has significant impact on gaining the confidence of customers and
converting it to their satisfaction which can be determined by confidence reward, which in turn
will have a proportionate effect on obligation which results in customers’ loyalty (Regina
Virilaite, 2009). Therefore, we hypothesize:
H4. Price fairness has a direct positive effect on customer loyalty.
2.10 Relationship between product quality and customer satisfaction
Product quality has a major role on the customer satisfaction, which in turn will
substantially influence on the performance of the companies, and also intends to maintain long-
term performance, to ensure that the companies take care of product quality on a continuous
basis so as to make sure that customers are satisfied in the future as well (Petr Suchanek, 2014).
Therefore, we hypothesize:
H5. Product quality has a direct positive effect on customer satisfaction.
2.11 Relationship between product quality and customer loyalty
Service product quality has a direct on the customer loyalty, the service providers of retail
banking services has emphasized on the relationship between the dimensions of service quality
which leads to customer satisfaction and customer loyalty (Daniel Onwonga, 2013). Therefore,
we hypothesize:
H6. Product quality has a direct positive effect on customer loyalty.
2.12 Relationship between customer satisfaction and customer loyalty:
Customer satisfaction has been reported to influence customer loyalty (Leong, Hew, Lee,
& Ooi, 2015; Minarti & Segoro, 2014). Hence, we hypothesize:
H7. Customer satisfaction has a direct positive effect on customer loyalty.
3. Conceptual Model
Following conceptual model is proposed by review of literature review and it is aimed to
be tested for structural relationships between different constructs:
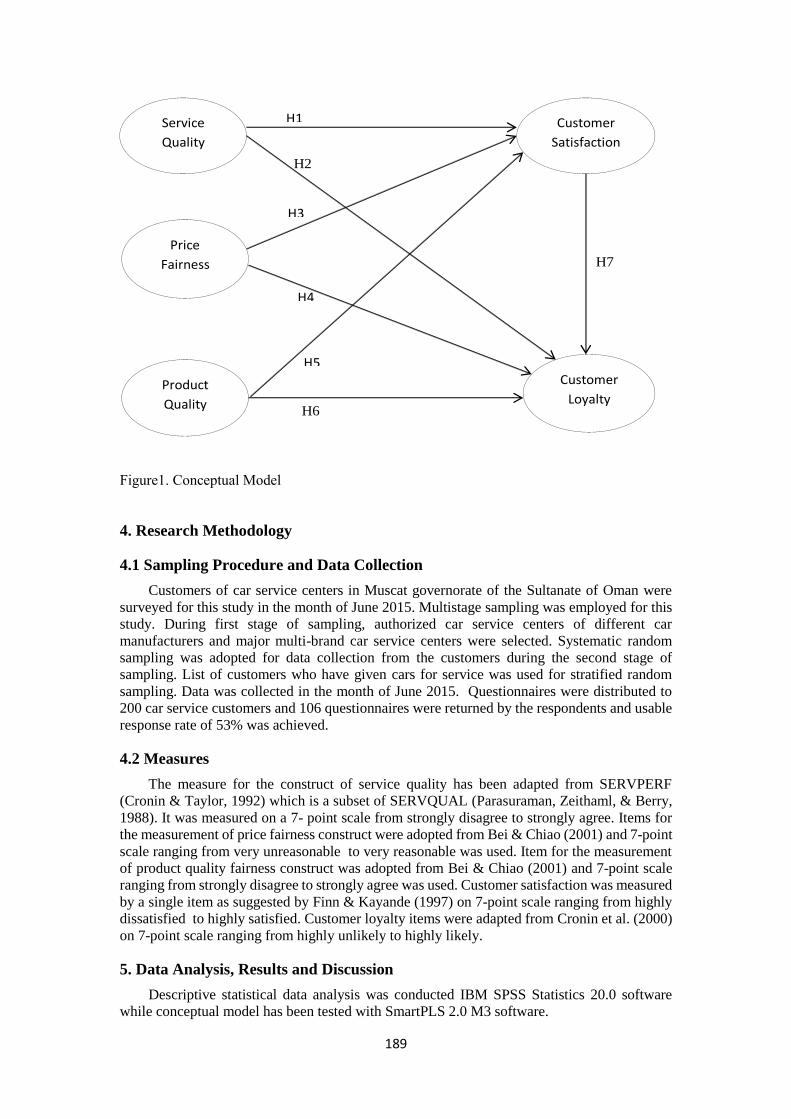
189
Figure1. Conceptual Model
4. Research Methodology
4.1 Sampling Procedure and Data Collection
Customers of car service centers in Muscat governorate of the Sultanate of Oman were
surveyed for this study in the month of June 2015. Multistage sampling was employed for this
study. During first stage of sampling, authorized car service centers of different car
manufacturers and major multi-brand car service centers were selected. Systematic random
sampling was adopted for data collection from the customers during the second stage of
sampling. List of customers who have given cars for service was used for stratified random
sampling. Data was collected in the month of June 2015. Questionnaires were distributed to
200 car service customers and 106 questionnaires were returned by the respondents and usable
response rate of 53% was achieved.
4.2 Measures
The measure for the construct of service quality has been adapted from SERVPERF
(Cronin & Taylor, 1992) which is a subset of SERVQUAL (Parasuraman, Zeithaml, & Berry,
1988). It was measured on a 7- point scale from strongly disagree to strongly agree. Items for
the measurement of price fairness construct were adopted from Bei & Chiao (2001) and 7-point
scale ranging from very unreasonable to very reasonable was used. Item for the measurement
of product quality fairness construct was adopted from Bei & Chiao (2001) and 7-point scale
ranging from strongly disagree to strongly agree was used. Customer satisfaction was measured
by a single item as suggested by Finn & Kayande (1997) on 7-point scale ranging from highly
dissatisfied to highly satisfied. Customer loyalty items were adapted from Cronin et al. (2000)
on 7-point scale ranging from highly unlikely to highly likely.
5. Data Analysis, Results and Discussion
Descriptive statistical data analysis was conducted IBM SPSS Statistics 20.0 software
while conceptual model has been tested with SmartPLS 2.0 M3 software.
Service
Quality
Price
Fairness
Product
Quality
Customer
Satisfaction
Customer
Loyalty
H1
H3
H4
H5
H2
H6
H7

190
5.1 Demographics: Table 1 exhibits the results linked with respondents and their
demographics.
Table1. Respondents' Profile
Frequency Percentage
Gender Male 98 92.5
Female 8 7.5
Age 18-25 42 39.6
26-35 42 39.6
36-45 12 11.3
46-55 10 9.4
Monthly Household Income
Below OMR 500 60 56.6
OMR 500-1000 36 34.0
OMR 1001-1500 3 2.8
OMR 1501-2000 4 3.8
Above OMR 2000 3 2.8
Education
Matric 5 4.7
Senior Secondary 71 67.0
Graduate 27 25.5
Post Graduate 3 2.8
Country of Origin Oman 79 74.5
India 4 3.8
Pakistan 3 2.8
Bangladesh 5 4.7
Philippine 4 3.8
Egypt 5 4.7
Iraq 4 3.8
Others 2 1.9
Brand of Car Toyota 17 16.0
Mazda 8 7.5
Nissan 17 16.0
Hyundai 10 9.4
Kia 10 9.4
Ford 8 7.5
Honda 7 6.6
Chevrolet 8 7.5
Mercedes-Benz 7 6.6
Mitsubishi 8 7.5
Others 6 5.7
5.2 Analysis of Model
Partial Least Squares–Structural Equation Modelling (PLS-SEM) technique has been
employed to test the conceptual model. It is based on component based approach. PLS-SEM
technique is considered appropriate for prediction and theory development. This approach does
not rely on normal distribution of data. PLS-SEM has the capability to even handle relatively
small sample sizes. Therefore, PLS-SEM was considered as an appropriate option to test the
conceptual model. Figure 2 exhibits the results of PLS model with different indicators of model.

191
Figure2. Results of model testing
5.3 Evaluation of Measurement Model
Conceptual model testing has delivered indicator loadings ≥ 0.70 (Hair, Ringle, & Sarstedt,
2011) which proves indicators’ reliability in this model. Following table exhibits the all items’
loadings, composite reliability, average variance extracted and Cronbachs Alpha values of
different constructs:
Table2. Psychometric properties of the measurement model
Construct Item Loading Composite
Reliability
(CR)
Average
Variance
Extracted
(AVE)
Cronbachs
Alpha
Tangibles Vehicle service centre has
modern- looking
equipment
0.96 0.98 0.93 0.97
The physical facilities in
Vehicle service centre are
visually appealing
0.96
Personnel in the Vehicle
service centre are neat in
appearance
0.96
Materials associated with
the service are visually
appealing
0.97
Reliability When Vehicle service
centre promises to do
something by a certain time
it does so
0.97 0.98 0.93 0.98

192
When you have a problem,
Vehicle service centre
shows a sincere interest
in solving it.
0.96
Vehicle service centre gets
things right the first time.
0.96
Vehicle service centre
provides its services at the
time it promises to do
so.
0.96
Vehicle service centre
insists on error-free
records.
0.96
Responsiveness The personnel in Vehicle
service centre tell you
exactly when services will
be performed. (Delivery
time how well explained &
received by customer)
0.96 0.98 0.93 0.97
Personnel in Vehicle
service centre give you
prompt service. (Delivery
on time /before time)
0.96
Personnel in Vehicle
service centre are always
willing to help you.
(Explaining the facilities
available)
0.95
Personnel in Vehicle
service centre are never too
busy to respond to your
requests.
0.96
Assurance The behavior of personnel
in Vehicle service centre
instils confidence in you.
(Seeking commitment for
next service)
0.96 0.98 0.92 0.97
You feel safe in your
dealings with Vehicle
service centre. (explaining
the quality as
differentiation)
0.96
Personnel in Vehicle
service centre are
consistently courteous with
you. (Meet and greet)
0.95
Personnel in Vehicle
service centre have the
knowledge to answer your
questions. (How well
explained what all jobs
were done ,clarity in
communication)
0.96
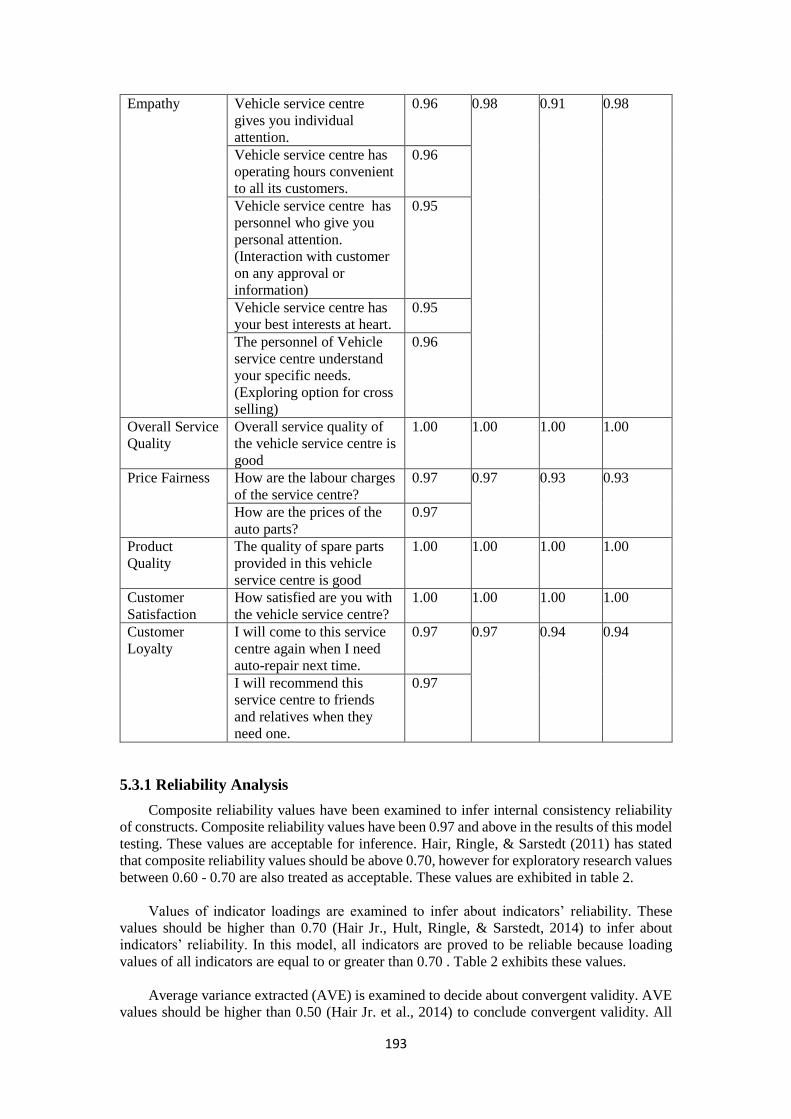
193
Empathy Vehicle service centre
gives you individual
attention.
0.96 0.98 0.91 0.98
Vehicle service centre has
operating hours convenient
to all its customers.
0.96
Vehicle service centre has
personnel who give you
personal attention.
(Interaction with customer
on any approval or
information)
0.95
Vehicle service centre has
your best interests at heart.
0.95
The personnel of Vehicle
service centre understand
your specific needs.
(Exploring option for cross
selling)
0.96
Overall Service
Quality
Overall service quality of
the vehicle service centre is
good
1.00 1.00 1.00 1.00
Price Fairness How are the labour charges
of the service centre?
0.97 0.97 0.93 0.93
How are the prices of the
auto parts?
0.97
Product
Quality
The quality of spare parts
provided in this vehicle
service centre is good
1.00 1.00 1.00 1.00
Customer
Satisfaction
How satisfied are you with
the vehicle service centre?
1.00 1.00 1.00 1.00
Customer
Loyalty
I will come to this service
centre again when I need
auto-repair next time.
0.97 0.97 0.94 0.94
I will recommend this
service centre to friends
and relatives when they
need one.
0.97
5.3.1 Reliability Analysis
Composite reliability values have been examined to infer internal consistency reliability
of constructs. Composite reliability values have been 0.97 and above in the results of this model
testing. These values are acceptable for inference. Hair, Ringle, & Sarstedt (2011) has stated
that composite reliability values should be above 0.70, however for exploratory research values
between 0.60 - 0.70 are also treated as acceptable. These values are exhibited in table 2.
Values of indicator loadings are examined to infer about indicators’ reliability. These
values should be higher than 0.70 (Hair Jr., Hult, Ringle, & Sarstedt, 2014) to infer about
indicators’ reliability. In this model, all indicators are proved to be reliable because loading
values of all indicators are equal to or greater than 0.70 . Table 2 exhibits these values.
Average variance extracted (AVE) is examined to decide about convergent validity. AVE
values should be higher than 0.50 (Hair Jr. et al., 2014) to conclude convergent validity. All

194
AVE scores in this tested model are greater than 0.50, hence convergent validity is proved.
AVE scores are exhibited in table 2.
Discriminant Validity: To examine discriminant validity, Fornell-Larcker Criterion has been
employed. It requires that the square root of AVE should be more than inter construct correlation
values (Hair et al., 2011). This criterion has been satisfied by the results and it is confirmed
that discriminant validity exists for all constructs. Values for assessment of discriminant validity
are exhibited in table 3.
Table3. Inter-construct correlations
1 2 3 4 5 6 7 8 9 10
1. Tangibles 0.95
2. Reliability 0.92 0.95
3.
Responsiveness
0.91 0.92 0.95
4. Assurance 0.91 0.91 0.90 0.95
5. Empathy 0.94 0.94 0.94 0.93 0.95
6. Overall
Service Quality
0.88 0.87 0.86 0.88 0.93 1.00
7. Price
Fairness
0.90 0.89 0.91 0.90 0.94 0.91 0.96
8. Product
Quality
0.88 0.87 0.88 0.87 0.91 0.86 0.90 1.00
9. Customer
Satisfaction
0.87 0.87 0.88 0.88 0.91 0.85 0.91 0.85 1.00
10. Customer
Loyalty
0.91 0.90 0.90 0.89 0.93 0.90 0.93 0.88 0.91 0.96
Note: Square root values of average variance extracted (AVE) is given on the diagonal of the
matrix. Inter-construct correlation values are given off the diagonal.
5.4 Evaluation of Structural Model:
Hypotheses formulated for this study have been tested with the structural model. Structural
model has been examined with path loadings and R2 value. Path loadings explain the strength
of relationships between exogenous and endogenous variables, however R2 values explain the
prediction power of the model. R2 values of endogenous constructs are exhibited in Table-4.
Path coefficients are exhibited in table-5.
Table 4. R2 Values
Customer Satisfaction Customer Loyalty
R2 0.86 0.91
R2 values of this model indicate high predictive power. This model explains 86% variance in
customer satisfaction and 91% customer loyalty.
Significance of path coefficients has been assessed with the help of t-values by application
of bootstrapping technique. Bootstrapping was applied on 5000 bootstrap samples and 106
cases. Effect of service quality on customer satisfaction and customer loyalty has been found
to be significant at significance level of 1%. While effect of price fairness on customer
satisfaction has been found to be significant at significance level of 1% and effect of price
fairness on customer loyalty has been significant at significance level of 5%. Effect of product
quality on customer satisfaction and customer loyalty has been found to be insignificant. Effect
of customer satisfaction on customer loyalty has been found to be significant at 5% significance
level. Thus hypotheses H5 and H6 are not supported because of insignificant relationships while

195
H1, H2, H3, H4, and H7 indicate significant relationships and these hypotheses are supported. T-
Statistics values obtained after bootstrapping are exhibited in table 5.
Table 5. Path Coefficients (Mean, STDEV, T-Values)
Original
Sample
(O)
Sample
Mean
(M)
Standard
Deviation
(STDEV)
Standard
Error
(STERR)
T Statistics
(|O/STERR|)
Service Quality→
Customer
Satisfaction
0.46 0.47 0.11 0.11 4.00***
Service Quality →
Customer Loyalty
0.40 0.41 0.13 0.13 3.16***
Price fairness →
Customer
Satisfaction
0.50 0.49 0.12 0.12 4.15***
Price fairness →
Customer Loyalty
0.27 0.26 0.11 0.11 2.39**
Product Quality →
Customer
Satisfaction
-0.02 -0.02 0.10 0.10 0.16
Product Quality →
Customer Loyalty
0.08 0.08 0.09 0.09 0.92
Customer
Satisfaction →
Customer Loyalty
0.24 0.24 0.10 0.10 2.32**
*** Significant at 0.01 level, ** significant at 0.05 level, * significant at 0.1 level and values
without any * are not significant.
Critical t-values for significance level of 10% , 5% and 1% for two-tailed test are 1.65, 1.96
and 2.58
6. Conclusion
This study confirms significant positive influence of service quality on customer
satisfaction and customer loyalty in automotive aftermarket industry. However, influence of
product quality on customer satisfaction and loyalty has been found to be insignificant in
automotive aftermarket industry. Relationships between price fairness and customer
satisfaction and loyalty have been found to be significant as hypothesized.
This model possesses good prediction power for endogenous constructs of customer
satisfaction and loyalty. This model explains 86% variance in customer satisfaction and 91%
variance in customer loyalty.
References:
Attanassopoulus, Antreas D. (2000), “Customer Satisfaction Cues to support market
segmentation and explain switching behavior, “ Journal of Business Research, 47(3),
191-207.
Anderson, Eugene W., Claes Fornell and Donalid R.Lehmann (1994), “ Customer
satisfaction, Market share, and profitablility: Findings from Sweden, “ Journal of
Marketing, 58 ( July), 53-66.
Bassey, F. O. (2014). The Effect of Perceived Price Fairness on Customer Satisfation
and Loyalty. Institute of Graduate Studies and Research, Eastern Mediterranean
University Gazimağusa, North Cyprus .81-82.
196
Bei, L., & Chiao, Y. (2001). An integrated model for the effects of perceived product,
perceived service quality and perceived price fairness on consumer satisfaction and
loyalty. Journal of Consumer Satisfaction Dissatisfaction and Complaining
Behaviour, 14, 125–140.
Bloemer, J. (1999). Linking perceived service quality and service loyalty: a multi-
dimensional perspective. European Journal of Marketing, 33(11, 12), 1082-1106.
Brucks, M., Zeithaml, V. A., & Naylor, G. (2000). Price and brand name as indicators
of quality dimensions for consumer durables. Journal of the Academy of Marketing
Science, 28(3), 359-374.
Cardozo, R. (1965). An experimental study of customer effort, expectation, and
satisfaction. Journal of Marketing Research, 2(8), 243-247.
Caruana, A. (2002). Service Loyalty: The Effects of Service Quality and the
Mediating role of Customer Satisfaction. European Journal of Marketing, 36(7), 811-
828.
Cronin, J. J., & Taylor, S. A. (1992). Measuring Service Quality : A Reexamination
and Extension. Journal of Marketing, 56(3), 55–68. doi:10.2307/1252296
Cronin, J. J., Brady, M. K., & Hult, G. T. M. (2000). Assessing the effects of quality,
value, and customer satisfaction on consumer behavioral intentions in service
environments. Journal of Retailing, 76(2), 193–218. doi:10.1016/S0022-
4359(00)00028-2
Daniel Onwonga, J. N. (2013). Perceived Service Quality And Customer Loyalty In
Retail Banking In Kenya . British Journal of Marketing Studies Vol.1.No.3 , 32-61.
Finn, A., & Kayande, U. (1997). Reliability assessment and optimization of marketing measurement. Journal of Marketing Research, 34, 262–275.
Hair Jr., J. F., Hult, G. T. M., Ringle, C. M., & Sarstedt, M. (2014). A Primer on
Partial Least Squares Structural Equation Modeling (PLS-SEM). Sage Publications,
Inc.
Jamal, A., & Naser, K. (2002). Customer satisfaction and retail banking: an
Assessment of Some of the Key Antecedents of Customer Satisfaction in Retail
Banking. International Journal o Bank Marketing, 20(4), 146-160.
Lehitnen, Uolevi and Jarma R, Lehitnen (1991), “Two Approaches to service quality
dimesions, “ The service Industrial Journal, 11(3), 287 -303.
Leong, L.-Y., Hew, T.-S., Lee, V.-H., & Ooi, K.-B. (2015). An SEM–artificial-
neural-network analysis of the relationships between SERVPERF, customer
satisfaction and loyalty among low-cost and full-service airline. Expert Systems with
Applications, 42(19), 6620–6634. doi:10.1016/j.eswa.2015.04.043
Minarti, S. N., & Segoro, W. (2014). The Influence of Customer Satisfaction,
Switching Cost and Trusts in a Brand on Customer Loyalty – The Survey on Student
as im3 Users in Depok, Indonesia. Procedia - Social and Behavioral Sciences, 143,
1015–1019. doi:10.1016/j.sbspro.2014.07.546
Oliver, R.L. (1999). Whence Consumer Loyalty? Journal of Marketing, 63, 33-44.
Parasuraman, A., Berry, L.L &Zeithaml, V (1985). A conceptual model of service
quality and the implications for future research. Journal of Marketing Management,
49, 41-51.
Parasuraman, A., Zeithaml, V. A., & Berry, L. L. (1988). SERVQUAL: A Multiple-

197
Item Scale for Measuring Consumer Perceptions of Service Quality. Journal of
Retailing, 64(1), 12–40.
Parasuraman, A., Zeithaml, V.A. & Berry, L.L. (1994). Alternative scales for
measuring service quality: acomparative assessment based on psychometric and
diagnostic criteria. Journal of Retailing, 70(3), 201-230.
Parasuraman, A., & Zeithaml, V. (2006). Understanding and Improving Service
Quality: A Literature Review and Research Agenda. In B. Weitz & R. Wensley
(Eds.), Handbook of Marketing. London: Sage Publications.
Petr Suchanek, J. R. (2014). Customer Satisfaction, Product Quality and Perforamnce
of Companies. Review of Economic Perspectives- Narodohospodarsky obzar vol-14 ,
329-344.
Rathmell, John M. (1966) What is meant by Services?” Journal of Marketing, 30 (October), 32-36.
Regina Virvilaite, V. S. (2009). The Relationship between Price and Loyalty in
Service Industry. ISSN 1392 – 2785 Inzinerine Ekonomika-Engineering Economics ,
99-100.
Shostack, G Lynn (1977). “Breaking Free From Product Marketing “ Journal of Marketing,41 (April), 73-80.
Sureshchander, G.S., Rajendran, C. & Anantharaman, R.N. (2002). The Relationship
Between Service Quality and Customer Satisfaction – a Factor Specific Approach.
Journal of Services Marketing, 16, (4), 361-378.
Tang, Y. D. (2014). A Literature Review on the Relationship Between Service
Quality and Customer Loyality. Sciedu , 27-33.
The Aftermarket in the Automotive Industry. (2010). Retrieved from
http://www.de.capgemini.com/resource-file-
access/resource/pdf/tl_The_Aftermarket_in_the_Automotive_Industry.pdf
Zeithaml, Valarie A and Mary J Bitner (1996), Service Marketing, 1st edtion New York: McGraw-Hill.
Zeithaml Valarie A (1988). “ Consumer perception of price, Quality and value: A
Means End Model and Synthesis of Evidence. “ Journal of Marketing.
198
Business Incubators as a sustainability tool
Definition, Services provided, Mechanism of
Work, Requirements and Effect on the
Economy
Dr. Firas Rifai
Al-Zaytoonah University
of Jordan
Jordan
Abstract:
In all Arab countries the portion of small businesses is very high and is almost above 90%
of the whole economy. Thus, these small businesses have a huge effect on the growth and
development of the national economy and its sustainability of business. Therefore these very
important small businesses must deserve the whole attention and support of the decision makers
on all levels and in both public and private sector. Small Businesses are facing many burden
and challenges especially in the early stages (Seed stage), which could cause fail of the whole
businesses. Business Incubators are an effective tool in supporting small businesses in the risky
early stage. These Business incubators give new (entrepreneurial) start ups all support could
they need such as knowhow, material, equipments, consultancy, management, space (offices)
and financial support. Business Incubators reduce the fail probability and increase the success
probability of new small entrepreneurial establishment (startups, spin-off). Business incubators
differ from research and technology parks in their engagement to new entrepreneurial startups
and early-stage companies. Most research and technology parks do not offer business assistance
services, which considered as the core service of business incubation. Business incubators
concentrate on small businesses, which based on entrepreneurial idea. Therefore universities
seem to be the best location for effective and successful Business Incubators. Universities on
both public and private sector have to create Business Incubator to transfer new entrepreneurial
ideas into the market, strengthen new entrepreneurs from the university, support the whole
region and contribute to the economic development process and economy growth.
Introduction
The sector of small and medium enterprises ensures beside the sector of large enterprises
the completion of the economic structure, which has a major role in achieving economic growth
in general and economic development in particular (Thurik, Wennekess,1999: in Al-Wade
2010). In most Arab countries, including Jordan, the number of small enterprises makes up the
largest proportion of the total number of business organizations and was in the year 2014 higher
than 90% of all organizations (Rifai 2010 / Al-Wade 2010). Therefore, small companies have
the greatest influence in the economy and deserve to get an extra support and backing from the
decision makers specially the entrepreneurial companies because these small enterprises and
small entrepreneurs lacking in many cases to the success requirements (European
Comissim,2001) such as managerial skills, administrative knowledge, financial knowledge and
technical skills and others (Allen and Rahman,1958, Peters et al 2004: in Al-Wade 2010 and
Allen and Mccioskey, 1990). In addition small enterprises and specially the entrepreneurial
199
enterprises are facing many challenges and burdens by getting financial fund and support, what
they hardly need to establish and manage the project successfully.
The very important role of Business Incubators becomes noticeable by people who are not
satisfied in their jobs or are unemployed and have the necessity to establish their own business
to change their unsatisfied life (Necessity Entrepreneurial Activity), without having the
necessarily managerial and technical skills. Therefore they failed in most cases. In contrast,
there are many new startups based on a new idea or opportunity (Opportunity Entrepreneurial
Activity) where the chances of success are higher. But in both cases Business Incubators play
a key role in increasing the success rate of these small and new startups (Rifai, 2010). Studies
and researches show that ca. 33% of new established business failed after the third year and
40% failed after the seventh year (OECD 2002, in Al-Wadi , P. 3). This mentioned percentage
decreased to 15%-20% for incubated new startups (Bruton 1998, Abetti 2004: in Al-Wade
2010, P. 4).
History of Business Incubator
Research to date has identified Business Incubator units as an effective mechanism for
supporting the growth and development of small entrepreneurial firms (McAdam and Marlow,
2008, P. 219). As a logical consequence "business incubators" has been developed with the
mission to give important (entrepreneurial) small businesses and new small startups all support
they could need to have success. At the beginning, incubator units were located in close
proximity to universities with the aim of pursuing three key objectives; technology transfer,
promotion of entrepreneurship and the commercialisation of leading edge research (Mian,
1996; Shane, 2002; Albert and Gaynor, 2003). Furthermore, they provided a number of support
services such as concept testing, technical information, intellectual property advice, access to
seed capital and management guidance (Zucker et al., 2002; Carayannis et al., 2006).
Since its first definition in the 1950s in the USA, the concept of the business incubator has
evolved continually, reflecting economic conditions, regional needs and specific technology.
Initially, an incubator was a means to revitalize a region, providing support to entrepreneurs to
develop new businesses (Mian, 1996). Since the 1970s, technological incubators have become
an important tool to promote the development of technology clusters. This movement
accelerated in the 1980s due to the linking of the concept of the incubator with public research
institutions (PRIs). After that and more recently, technological incubators have been
characterized by a sectoral focus for the development and dissemination of information
technologies and biotechnology (Vedovello, 1997). Thus, incubators are structures present in
many parts of the world that facilitate the regional development of innovation, cooperation
between researchers and industry through the provision of information and the establishment
of international networks for co-operation and the exchange of information between companies
(Thursby and Kemp, 2002). In its generic sense, the term “incubator” is often used to describe
a wide range of organizations that, in one way or another, help entrepreneurs develop their ideas
from inception through to commercialization and the launching of a new enterprise. A broad
definition of the term embraces science and technology parks, as well as organizations which
have no single physical location and concentrate instead on managing a network of enterprise
support services (Lindelof and Loftsen, 2004).
Business Incubators were established in many countries such as Jordan in both public and
private sector including universities. These incubators support new small startups in early
stages (seed, development and market introduction) and help them getting through these critical
phases and increase the success possibility (Rifai 2010). Worldwide there are more than 3500
business incubators with a concentration (60% of the total) in North America and Europe (Al-
Wade 2010, P. 4). This number is increasing permanently.
Literature Review
It is generally recognised that incubators offer a protected environment where new small
firms can pool resources, share knowledge and create a network of alliances with other
entrepreneurs (Smilor and Gill, 1986; Barrow, 2001). Initially, incubators emerged in proximity
200
to universities with the aim of promoting technology transfer and the commercialisation of
innovative and novel research (Shane, 2002; Albert and Gaynor, 2003). University based
incubators normally pursue three key objectives; technology transfer, promotion of
entrepreneurship and commercialisation of leading edge research (Zucker et al. 2002; Lockett
and Wright, 2005; Nouira et al., 2005). Other secondary objectives include development of
entrepreneurial spirit, civic responsibility, image and new sources of finance (Albert and
Gaynor, 2003). The University incubator aims to provide a number of initial services such as
concept testing, technical advice, intellectual property advice, seed capital and management
guidance. Such advice and support is offered through experts on site and moreover, such
incubators attract the attention of business angels3, venture capitalists, whilst facilitating
industrial networks, strategic advice and mentoring (Albert and Gaynor, 2003).
Proximity to the university coupled with the knowledge, facilities and labour force can be
valuable in several ways (Dettwiler et al., 2006; Loefsten and Lindeloef, 2001; Loefsten and
Lindeloef, 2003). Co-operation with university staff may provide access to the latest knowledge
in the area of interest thus resulting in the development of more innovative products (Lockett
and Wright, 2005; Nouira et al., 2005; Felsenstein, 1994). The university link may also result
in reduced development costs (Markman et al., 2005) in addition to providing the customer
with a guarantee that products or services are based on the latest knowledge available (Zucker
et al., 2002). Another related university resource is the availability of specialist skills based
labour where it may be an advantage to be located close to the university in order to make the
firm known to students in specific disciplines (Quintas et al., 1992; Barrow, 2001).
Incubator facilities include business advice, service and incubator management. Business
advice includes that acquired either from the persons employed by the incubator or by
consultants recommended by the incubator administration (Lee and Osteryoung, 2004;
Rothschild and Darr, 2005). Moreover, the service resource provided by the incubator refers to
secretarial services, conference facilities, canteen and car parking which are usually much less
costly than individual premises and services (Markman et al., 2005). Effective incubator
management can ensure that the firms have access to resources of business advice including
specialist programs and seminars (Safraz, 1997).
All in all Business Incubators are considered as a development program helps to diversify
the economic activities, increases wealth, create new jobs, create & distribute of new
technology and reduce risks of new investment in new start-ups. Business Incubators are
accepted and well known mechanism to support (entrepreneurial) small projects (Start-ups) by
offering a wide range of services and facilities in order to overcome all critical, important,
complex and dangerous early phases successfully. Business Incubators offer the most
requirements of business success such as administrative, personal and analytical supports,
business office inclusive all equipments, helping owners of small business by getting financial
fund. (Rifai, 2010).
Roles and Objectives of Business incubators
Business incubators are covering and working in many industrial sectors such as service,
tourism, media, and other sectors of business. Business incubators play their role by providing
appropriate services according to the nature and special needs of each specific project.
The major role and significance of business incubator are as followed:
Rehabilitation of a new generation of business owners by supporting them
establishing serious and profitable new start-ups, which have a large contribution to the
development of production and creating new jobs and promote economic growth and
development.
Supporting new start-ups in almost all industrial sectors in the early and critical phases.
Creating the right climate and offering all requirements for a successful new start-ups.
3 For more information about Busines Angels please see Rifai 2012

201
Developing of human resources and make them able to meet the administrative, financial,
accounting, technical and marketing difficulties, which usually pose the biggest challenges in
the establishment phase.
Providing scientific and managerial consulting and support owners by creating feasibility
studies and business plan and other relevant analytical requirement for new start-ups.
Providing financial services through direct connection with finance sector or business
Angels or even through the incubators themselves as investors.
Supporting emerging start-ups with market analysis and marketing.
Providing support and assistance to new small enterprises to achieve high growth rates and
quality in business.
Having benefits out of scientific research and new ideas by implementing successfully in
the market.
Increase the investment in viable innovative ideas to empower the national economy.
The nature of the work of business incubators is widely spread in different fraught and
thorny activities and in the most cases goes with risk, therefore it requires a lot of activities and
special tools, which considered the essential of the work of these incubators. Below are some
important requirements for a good business incubator:
Business incubator's Requirements
Adviser or manager of the incubator: He/she contributes to the creation of the appropriate
environment and stimulates persons concerned. He/she must be have an appropriate managerial
and analytical knowledge, which qualify him/her for this position.
Getting support from the community and format a social network: The community support
for incubators and the formation of relations with companies, universities and the government
is very important for the success of the business incubators. But the basis of this support and
these relationships is the achievements of the incubators economically and socially for the
community.
The project selection criteria: Business incubators must define the selection criteria for
projects clearly such as projects must be innovative and supported by a detailed plan for the
project.
Financing: funding of pilot projects considered the most important obstacles that is not
easy to solve because of absence of important information and is not possible to compare the
new project with others. Therefore incubators have to have their own budget or have good
enjoying relations with investors (Business Angels) and finance sector to facilitate the financing
of small pilot projects.
Permanent assessment and evaluation: Incubators must constantly evaluate their work to
improve their performance and outputs according to the changing and dynamic business
environment to increase the percentage of business success they support.
Not to exaggerate the capacity: Persons in charge should not exaggerated in the adoption
of projects that require capabilities and skills outweigh the capacity of the incubator
scientifically, practically and financially.
Business incubators and their impact on the success of emerging small pilot
projects
In the magazine "Administration and Economy", No. 83 for the year 2010 results of a
questionnaire has been published, which targeted to determine the impact of business incubators
in the success of small businesses and thus of the sustainability of the whole economiy. This
questionnaire was done by Dr. Anwar Ahmed Nahar Al-Azzam and by Prof. Dr. Sabbah
Mohammed Musa. Below are information about the above mentioned survey:

202
1. The study population: (a) business incubators in Jordan, (b) pilot projects, which graduated
from the incubators, (c) incubated projects at that time, and (d) pilot projects did not enter the
incubators.
2. The study sample: 69 pilot projects, which were incubated and graduated from the incubator
3. The sampling unit and analysis: contains 69 Managers. The researchers retrieved 58
questionnaires.
The results of this study are as follow
1. There is a statistically significant effect of the support factors such as service, administrative,
and technical on the success of the pilot projects in terms of the ability to grow and the ability
to generate income and create new jobs.
2. There is a statistically significant effect of vision factors such as strategic vision, strategic
leadership and incubation strategy (acceptance and evaluation) on the success of small pilot
projects in terms of the ability to grow and the ability to generate income and create new jobs.
Business incubators in Jordan
There are many business incubators in Jordan in public and private sector including public and
private higher education sector (Universities). Below is a list of almost all Business Incubators
in Jordan:
1. Injaz (public sector) aimed graduate students to teach them the skills they need to set up
small enterprises (http://www.injaz.org.jo/)
2. NAFES (Public and private sector) support research and development in the industrial sector
(http://www.nafes.org.jo/english.html)
3. YEA - Young Entrepreneurs Association (Private sector): helps in introducing and spreading the innovation culture in Jordan and the role of entrepreneurship in the development process. (http://www.yea.com.jo/) 4. Jordan's technology Incubator (Public sector): supports technology companies
(http://www.ipark.jo/)
5. Jordan innovation centre (Public sector): focuses on registration of patents, intellectual
property, and support new start-ups projects by consultancy regarding these activities.
(http://www.jic.jo/)
6. Queen Rania Center for Entrepreneurship - QRCE (Non Governmental Organisation):
supports students and trains them managerial skills, technical and entrepreneurial skills and
focus on technology. (http://www.qrce.org/?q=programs)
7. Jordan Upgrading & Modernisation Program JUMP (public sector and government)
supports small and medium enterprises through giving them technical support, consultancy and
training.
(http://www.nerc.gov.jo/RUE/EWSEDirectory/JUMP.html)
8. Jordan Enterprises Development Corporation - JEDCO) (Public sector): supports export
oriented companies to enhance the competitive strength of Jordan on the international market
(http://www.jedco.gov.jo/)
9. Technology Business Incubator - Philadelphia University (Private sector): develops
innovative and creative ideas by turning them into businesses successfully and enables ideas
owners gaining income
(http://www.philadelphia.edu.jo/arabic/university-centers/2015-03-10-09-07-06).
10. Yarmouk University: Academic entrepreneurship center of Excellence (Public sector):
create the well equipped incubator and the appropriate climate in order to rehabilitate students
and graduates to meet the evolving needs and changing requirements of the local and regional
labor market through cooperation and integrated efforts of all of the Academic entrepreneurship
center of Excellence, Yarmouk university and different economics sectors.
(http://www.yu.edu.jo/)
203
11. Jordan Enterprise Development Corporation (JEDCO): supporting the development
process of the implementation of innovative and creative ideas and transfer them successfully
in the market.
(http://www.jedco.gov.jo/joomla/index.php?option=com_content&id=269&Itemid=261&lang
=ar)
12- Department of incubator and scientific creativity - The Higher Council for Science and Technology HCST - Network Innovation Jordanian centers: helping owners of new start-ups by implementing the innovative and creative ideas successfully in the market. (http://hcst.gov.jo/ar/?p=76) 13- Al Urdonia li Ebdaa (Jordan corporation for entrepreneurship): supports new start-ups, especially outside Amman, to establish their own new business successfully. (http://www.bic.jo/) In addition financial sector for small and micro credits plays an important role in Jordan for the
financing of small and emerging new start-ups. The most important micro-credit companies are
(Middle East Micro Credit Company - MEMCC) which change its name to (Jordan Access to
Credit Program -JACP).
Business incubators in Jordan universities
Mohammad Omran al-Fawaz, former MBA student at Al Yarmouk University in the year 2008
wrote on his theses about "The role of business incubators in Jordan universities in directing
students toward entrepreneurship. This thesis aimed to identify the role of business incubators
in university in directing students toward entrepreneurship and to identify the student's tendency
towards entrepreneurship. The study contains 174 questionnaires and the result was as follow:
1. Business incubators provide a high level of services in the field of technical support and
evaluate the performance of employees and in the area of administrative and office related
services.
2. Business incubators provide a medium level of services in the field of finance, marketing,
training and consultancy.
3. There is a high level of tendencies of students toward entrepreneurial activities in cooperation
with University-incubator
4. There is a significant impact of the business incubators in university on students and their
tendency toward entrepreneurship entrepreneurial activities.
The most important condition for a successful university in respect of the role and effectiveness
of Business Incubators is that Universities have to be entrepreneurial: Beside teaching and
research universities have to introduce the entrepreneurial aspect (Rifai 2015).
Conclusion and Recommendations
After showing the important role of business incubators by supporting new startups,
creating new jobs, accelerating the development process we strongly recommend to increase
the number of business incubators in the whole country especially in universities in both sectors.
Business Incubator within universities have a special situation because universities can strongly
contribute by creating new entrepreneurial ideas through research activities, reducing the gap
between knowing and doing through transfer ideas into market and increase the success
probability of new startups by offering all requirements new startups need. Universities have
already all Business Incubator's requirements. Besides supporting new entrepreneurial ideas,
Business Incubators within universities have to encourage university staff and student to act
entrepreneurial guide them toward entrepreneurship.
References
204
Al-Azzam, Anwar / Musa, Sabbah (2010): The impact of Business Incubators in the success
of small businesses in: Administration and Economy", No. 83, 2010
Al-Wade, Mahmoud (2010):, The role of Business Incubators on the Economy. Al-Zarqa
University of Jordan
Albert, P. and Gaynor, L. (2003), “National contexts, incubator families and trends in
incubation-views from four countries”, paper presented at the 48th ICSB Conference, Belfast,
16-18 June.
Barrow, C. (2001), Incubators: A Realist’s Guide to the World’s Business Accelerators,
Wiley, Chichester.
Carayannis, E.G., Popescu, D., Sipp, C. and McDonald, S. (2006), “Technological learning
for entrepreneurial development in the knowledge economy (KE): case studies and lessons
learned”, Technovation, Vol. 26 No. 4, pp. 419-43.
Dettwiler, P., Lindelo ¨f, P. and Lo ¨fsten, H. (2006), “Utility of location: a comparative
survey between small new technology-based firms located on and off science parks:
implications for facilities management”, Technovation, Vol. 26 No. 4, pp. 506-17.
European Commission (2000). The European Observatory for SMEs. Sixth Report.
Enterprise Policy.
Felsenstein, D. (1994), “University-related science parks – “seedbeds” or “enclaves” of
innovation?”, Technovation, Vol. 14 No. 2, pp. 93-110.
Lee, S. and Osteryoung, J. (2004), “A comparison of critical success factors for effective
operations of university business incubators in the United States and Korea”, Journal of Small
Business
Management, Vol. 42 No. 4, pp. 418-27.
Lockett, A. and Wright, M. (2005), “Resources, capabilities, risk capital and the creation of
university spin-out companies”, Research Policy, Vol. 34, pp. 1043-57.
Loefsten, H. and Lindeloef, P. (2001), “Science parks in Sweden – industrial renewal and
development?”, R&D Management, Vol. 31 No. 3, pp. 309-22.
Loefsten, H. and Lindeloef, P. (2003), “Determinants for an entrepreneurial milieu: science
parks and business policy in growing firms”, Technovation, Vol. 23, pp. 51-64.
Markman, G., Phillip, P., Balkan, D. and Ganoids, P. (2005), “Entrepreneurship and
university-based technology transfer”, Journal of Business Venturing, Vol. 20 No. 2, pp. 241-
63.
Maura McAdam Susan Marlow, (2008),"A preliminary investigation into networking
activities within the university incubator", International Journal of Entrepreneurial Behavior
& Research, Vol. 14 Iss 4 pp. 219 241 Permanent link to this document:
http://dx.doi.org/10.1108/13552550810887390,
Mian, S.A. (1996), “Assessing value-added contributions of university technology business
incubators to tenant firms”, Research Policy, Vol. 25, pp. 325-35.
Nouira, S., Klofsten, M. and Dahlstrand, A. (2005), “The logic of the entrepreneur:
implications of the entrepreneur’s perception of early-stage financing”, International Journal
of Entrepreneurship and
Innovation, Vol. 6 No. 2, pp. 85-96.
205
Quintas, P., Wield, D. and Massey, D. (1992), “Academic-industry links and innovation:
questioning the science park model”, Technovation, Vol. 12 No. 3, pp. 161-75.
Rifai, Firas (2010): Unternehmertum, Humankapital und Innovation in der wirtschaftlichen
Entwicklung of Jordans, Marburg (Lahn) 2010. Dissertation on the Philipps University of
Marburg / Grrmany 2010.
Rifai, Firas / Siam Ahmad (2012): Business Angels Financing of Entrepreneurial Projects in
Jordan in: European Journal of Social Sciences ISSN 1450-2267 Vol.32 No.2 (2012), pp.
277-289
Rifai, Firas (2015): Striving to become an entrepreneurial University to bridge the gap
between knowing and doing – a study in Al-Zaytoonah University of Jordan,
EuropeanAmerican Journals, vol 3, Issue 7, December 2015, P. 47-56.
Rothschild, L. and Darr, A. (2005), “Technological incubators and the social construction of
innovation networks: an Israeli case study”, Technovation, Vol. 25 No. 1, pp. 59-69.
Safraz, M. (1997), “Assessing and managing the university technology business incubator: an
integrative framework”, Journal of Business Venturing, Vol. 12 No. 4, pp. 251-86.
Shane, S. (2002), “Executive forum: university technology transfer to entrepreneurial
companies”, Journal of Business Venturing, Vol. 17 No. 6, pp. 537-52.
Smilor, R.W. and Gill, M.D. (1986), The New Business Incubator – Linking Talent,
Technology, Capital and Know-how, Lexington Books, Lexington, MA.
Lindelof, P. and Loftsen, H. (2004), “Proximity as a resource base for competitive
advantage:university-industry links for technology transfer”, Journal of Technology Transfer,
Vol. 29 No. 3, pp. 311-326.
Lockett, A. and Wright, M. (2005), “Resources, capabilities, risk capital and the creation of
university spin-out companies”, Research Policy, Vol. 34, pp. 1043-57.
Shane, S. (2002), “Executive forum: university technology transfer to entrepreneurial
companies”, Journal of Business Venturing, Vol. 17 No. 6, pp. 537-52.
Thursby, J.G. and Kemp, S. (2002), “Growth and productive efficiency of university
intellectual property licensing”, Research Policy, Vol. 31 No. 1, pp. 109-124.
Vedovello, C. (1997), “Science parks and university-industry interaction: geographical
proximity between the agents as a driving force”, Technovation, Vol. 17 No. 9, pp. 491-531.
Zucker, L.G., Darby, M.R. and Armstrong, J.S. (2002), “Commercializing knowledge:
university science, knowledge capture and firm performance in biotechnology”, Management
Science, Vol. 48 No. 1, pp. 138-53
.

206
Competitive advantage based on human capital
and its impact on organizational sustainability
((Applied Study in Jordanian
Telecommunications Sector))
Dr. Abdel Aziz Al-Naddawi
Al- Zaytoonah University
Jordan
Abstract:
The current situation for business organizations is characterized on variation work
environments for continuation changing and developing , so the organizations seek to keep
pace with this development and operate to maintain the current business through the ability of
organizations to respond for the possibility of competitive advantage creation based on the
existence of a distinctive human capital that contributes to the creation the organizational
sustainability in the business sector , which owns the special properties with the potential to
create confidence and integration among the staff and top management which lead to the
organization growth and continuation
(Kurucz, 2013).
The emergence of a set of challenges in the knowledge economy had a clear reflection on
the business organizations that started to search for new mechanisms to compete and insure the
existence in the business world. Hence the concept of the competitive advantage based on
human capital as a necessary requirement to deal with these challenges either they were local,
regional or international on organizations (Global Institute, 2011), where the competitive
advantage based on human capital is the main generator of new ideas, to develop old ideas,
and contribute to help organization to enable them to expand their market share and maximizing
the value, and make them in a position to be able to seize opportunities, and achieve the
existence and continuation in the future (Ramstad, 2005). Also, to achieve the organizational
sustainability represented in the creation of the organization relationship sustainability, and
sustainable capacity for innovation and the sustainability of group work in the organization.
This study aimed to find the impact of the competitive advantage based on human capital
on organizational sustainability in Jordanian environment .
Keywords: Competitive Advantage , Human Capital , Organizational Sustainability
Introduction
The subject of sustainability and competitive advantage obtains a great interest by
researchers due to the role of the competitive advantage as a variable in the success of managing
work, , which the basis for progress, development, growth and continuation in various fields of
life which characterized by change and closely linked to the style of work used, and the extent
of understanding of the organization's psychology, also, the extent of influence in organization
and to achieve the harmony between finding the competitive advantage based on human capital
and creation of organizational sustainability which contribute to take responsibility and to
achieve the objective by creating the capacity to meet the current needs of the Organization
taking into account the future needs which is called sustainable growth (Ford, 2012). In the
pursuit of organizations to keep pace with growth and development, and to continue their
relations and the innovation ability and collective work therein, they should have to respond to

207
operate to find work mechanisms depending on the elements of competitive advantage in the
creation of a distinct case that contribute to the creation of the state of organizational
sustainability and encourage the development, strategic thinking and change (Chamjong, 2004).
This will help organizations to deal with the challenges they face and overcome them and to
achieve efficiency, effectiveness, and performance distinction, ensuring their survival and
continuation in light of this changing and disturbed environment (Bani Issa 2006). On the other
hand the emergence of the concept, which received considerable attention by researchers and
business organizations, the human capital especially with competition intensification in the
business field. The increase in the environmental uncertainty and emergence of the knowledge
economy, which resulted in the communications revolution and the phenomenon of information
explosion and spread . (Salman, 2009). Therefore, business organizations started looking for
new mechanisms for global competition as prerequisites to ensure survival in the business world
and in the light of these local, regional and international challenges, the human capital is
considered as a necessary requirement to deal with these challenges (Kasasbeh, 2010). The
human capital represents individuals who have the knowledge and organizational capabilities
enabling them to produce new ideas and develop the existing ideas that enable the organization
to expand its market share and maximize its strengths and address its weaknesses and put them
in a position in which they will be able to seize opportunities, to achieve competitive advantage
and achieve survival where organizations have only to continue the creation of sustainable
development (Catrin. B., 2011). Jordan is considered among countries that suffer from scarcity
in different resources, so the Jordanian government attached great interest in the development
of human resource as an important resource in the economic activity and as a result Jordan
allocated a part of its resources to education, and despite the limitations of these resources, the
interest in education by the government and the private sector continued although the presence
of the obstacles facing this attention. But Jordan has achieved his ambitions in the field of
human investment (Jordanian Ministry of Higher Education and Scientific Research, 2004). As
a result of the foregoing, this study has linked between the competitive advantage based on the
human capital and its impact on the achievement of organizational sustainability with its
dimensions (the sustainability of the organization relations, the sustainability of the innovation
ability and the sustainability of collective work) in the Jordanian Telecommunications
Companies Sector.
2. Study Methodology
2.1 Problem Statement
Today competitive advantage plays an important role in business organizations through
helping them to survive, continue and maintain their current functions by creating the
sustainability in the business sector (Kurucz, 2013), Perhaps, organizational objectives cannot
achieve without that the organization possesses competitive advantages and in particular the
existence of the intellectual capital as one of the key elements that makes competitive advantage
of the organizations and not buildings, appliances or equipment (Decehzo & Robbins, 2005).
But the human capital investment requires wise and leadership capacity sound which aware
of the importance of the human element and its components and has the ability to influence it
in a positive way, this leading to the human capital investment, in the best way for conversion
into a competitive advantage helping to create organizational sustainability and achieve the
organization’s objectives (Al-Dahhan, 2005). Hence, the questions of the study can be
developed through that human capital investment as an essential means to create a competitive
advantage for the organization and to enable it to continue and create organizational
sustainability in the best and enable the organization to achieve the vision of the future. In order
to counter the above problem methodically, it was formulated in many questions as follows:
What is the level of the human capital investment in the Jordanian Telecommunications
Companies Sector?
208
Does the human capital investment contribute in the creation of competitive
advantage in the Jordanian Telecommunications Companies Sector?
What is the effect of the presence of competitive advantage based on human capital in
creating the organizational sustainability and its elements to continuity and success in the
Jordanian Telecommunications Companies Sector?
2.2 Objectives of the Study:
The main objective of this study is to know the impact of the competitive advantage
through intellectual capital investment as one of the elements in the creation of organizational
sustainability in the Jordanian Telecommunications Companies Sector. From this main
objective we can designing the following objectives:
Create theoretical framework to identify the competitive advantage and the organizational
sustainability in terms of the concept, importance and dimensions.
Identify the intellectual capital in terms of the concept, importance and elements.
Clarify the relation between the variables above.
Identify the level of competitive advantage application in the Jordanian Telecommunications
Companies Sector.
Identify the level of the human capital investment in the Jordanian Telecommunications
Companies Sector.
Identify the impact of the competitive advantage presence based on human capital in creating
organizational sustainability in the Jordanian Telecommunications Companies Sector.
Submission of proposals and recommendations for decision-makers in the Jordanian
Telecommunications Companies Sector which may benefit them in their field.
2.3 Importance of the Study:
The importance of the study stems from the importance of the study sector, which is the
Jordanian Telecommunications Companies Sector being leading companies in the Jordanian
economy because of their prominent role was achieved in this economy as well as the economic,
social, intellectual and technological achievements in Jordanian society (Al-Sakarneh 2005)
, where this study helps the development and progress of this sector, so the importance of the
study comes as follows:
Importance of the Study for Researchers and Academicians:-
This study is considered as a reference for researchers and academicians in Jordan and the
Arab world, where this study will provide theoretical and practical frameworks about the role
of intellectual capital in the creation of competitive advantage to achieve organizational
sustainability. This study constitutes the base for the researchers and academicians to launch a
larger fields of research and investigation on the competitive advantage and organizational
sustainability in this sector and other sectors.
Importance of the Study for the directors in the Jordanian Telecommunications Companies
Sector:-
This study provides a contemporary references which showing the administrators and decision-
makers in the Jordanian Telecommunications Companies Sector, and how to invest intellectual
capital in the creation of competitive advantage to achieve organizational sustainability in their
companies so as to generate new ideas to help them positively to achieve the objectives of their
organizations.

209
Importance of the Study for Employees in the Jordanian Telecommunications Companies
Sector:-
This study provides telecommunications service providers a vision about the role of the
intellectual capital investment in the creation of a competitive advantage and achievement of
organizational sustainability which helping them to accomplish their business and generate new
ideas that can be discussed to reach the desired objective of the Jordanian Telecommunications
Companies Sector.
Model of the Study
Figure no. (1)
Independent Variable
Dependent Variable
Competitive Advantage Based
on Human Capital
organizational sustainability
► Sustainability of the Organization Relations
► Sustainability of the Innovation Ability
► Sustainability of the Collective Work
Reference: - prepared by the researcher
2.4 Hypotheses of the Study
Hypotheses of this study have been formulated according to the question of the study, its
objectives and its model. This hypotheses are the following :-
The main hypothesis is :-
H0: There is a statistically significant impact for competitive advantage based on human capital
to achieve
organizational sustainability in the Jordanian Telecommunications Companies Sector.
From this hypothesis we can formulated the following sub-hypotheses :-
H1: There is a statistically significant impact for competitive advantage based on human
capital to achieve
sustainability of the organizational relations in the Jordanian Telecommunications
Companies Sector.
H2: There is a statistically significant impact for competitive advantage based on human capital
to achieve
sustainability of the innovation ability in the Jordanian Telecommunications Companies
Sector.
H3: There is a statistically significant impact for competitive advantage based on human
capital to achieve
sustainability of the collective work in the organization within the Jordanian
Telecommunications
Companies Sector.
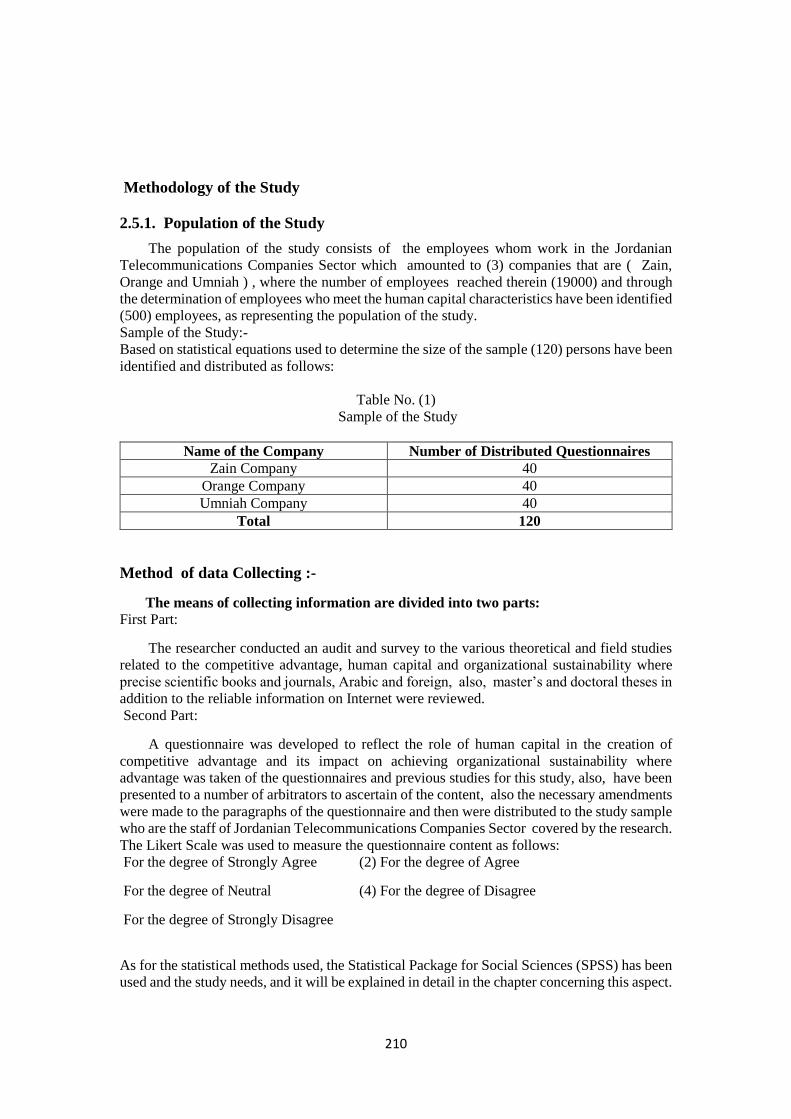
210
Methodology of the Study
2.5.1. Population of the Study
The population of the study consists of the employees whom work in the Jordanian
Telecommunications Companies Sector which amounted to (3) companies that are ( Zain,
Orange and Umniah ) , where the number of employees reached therein (19000) and through
the determination of employees who meet the human capital characteristics have been identified
(500) employees, as representing the population of the study.
Sample of the Study:-
Based on statistical equations used to determine the size of the sample (120) persons have been
identified and distributed as follows:
Table No. (1)
Sample of the Study
Name of the Company Number of Distributed Questionnaires
Zain Company 40
Orange Company 40
Umniah Company 40
Total 120
Method of data Collecting :-
The means of collecting information are divided into two parts:
First Part:
The researcher conducted an audit and survey to the various theoretical and field studies
related to the competitive advantage, human capital and organizational sustainability where
precise scientific books and journals, Arabic and foreign, also, master’s and doctoral theses in
addition to the reliable information on Internet were reviewed.
Second Part:
A questionnaire was developed to reflect the role of human capital in the creation of
competitive advantage and its impact on achieving organizational sustainability where
advantage was taken of the questionnaires and previous studies for this study, also, have been
presented to a number of arbitrators to ascertain of the content, also the necessary amendments
were made to the paragraphs of the questionnaire and then were distributed to the study sample
who are the staff of Jordanian Telecommunications Companies Sector covered by the research.
The Likert Scale was used to measure the questionnaire content as follows:
For the degree of Strongly Agree (2) For the degree of Agree
For the degree of Neutral (4) For the degree of Disagree
For the degree of Strongly Disagree
As for the statistical methods used, the Statistical Package for Social Sciences (SPSS) has been
used and the study needs, and it will be explained in detail in the chapter concerning this aspect.

211
Definitions of the Study Variables
The study included many of the main variables as explained by the model of the study and it
was necessary to
explain these variables, so can the reader understand their variables and here is an explanation
for these variables:
Competitive Advantage:
The ability and capabilities possessed by the organization in all its elements through
which it can make
something of high value that the competitors cannot imitate or offer better.
Intellectual Capital:
The intellectual ability capable to generate new and appropriate ideas a process , has a
high level of quality
and possess the ability to achieve equality and harmony between the various
components to reach the
desired objectives by employing and investing this intellectual ability properly for the
benefit of the
organization.
Human Capital:
A set of knowledge and experience, capabilities and skills for a group of employees in the
organization capable to achieve distinctive creations and solving traditional and non-
traditional problems based on tacit and apparent knowledge for employees .
Organizational Sustainability:
The process to keep and create a state of sustainability and continuity of the organization in
various fields in the light of unstable environment and achieve objectives efficiently and
effectively.
Sustainability of the Organization Relations :-
The ability of organization to communicate and to create reciprocal relations with
various parties
dealing with the organization.
Sustainability of the Innovation Ability :-
A set of resources, skills and abilities held by the employees who continuously
contribute to the
creation of new ideas and innovation ways that characterize the organization in its
performance and
achieve its competitive advantage.
Sustainability of the Collective Work :-
A set of management processes owned by the Organization which lead to complete
the work
continuously through the work teams and to emphasize the collectivism as a
managerial trait in
achieving the objectives.
212
3. The Theoretical Framework
3.1 Competitive Advantage
The subject of the competitive advantage is characterized by a high attraction to a large
number of researchers because of its impact in all areas of the organization where the
competitive advantage is of the most factors that have an impact on the success of organizations
(Al-Dahhan, 2005). As a result of the growing complexities in the business environment and
the increase in the intensity of competition between organizations, the need for indicators that
the organization possesses to present the best has emerged, as well as occupying a privileged
position in the market through its ability to provide a better product or service compared to
competitors. There are many of the concepts of competitive advantage , including the
(distinction of the organization for other organizations in the same field) Bakri, 2010, as well
(the pursuit of the organization to own special attributes that distinguish them from other
organizations working in the same field) Gould, 2008. From the foregoing it can be said that
the competitive advantage is the ability and capabilities possessed by the organization in all its
elements through which it can make something of high value that the competitors cannot imitate
or offer better through referring to a cognitive processes with a clear managerial methodology).
The possession of competitive advantage by the organization can help it to own means and
methods to meet the challenges of the market, as well as possessing the ability to meet the needs
of customers as a standard that determines the success of the organization without the other
organizations through the possession of the types of strategies as the empowerment strategy
emphasizing that the organization possesses the factors of successful production, fundamental
capabilities and its knowledge of the external environment factors, in addition to build
integration, which contributes to the expansion of the value chain, enabling it to achieve the
survival and continuity of the organization (Barnett, 2005).
3.2 Human Capital
The contemporary trends in modern management is heading towards a new subject
features that care about intellectual assets more than physical assets because maximizing the
physical assets comes as a result of the availability of intellectual assets and this new subject is
human capital, which has become in the era of technology the real stimulus in the success of
organizations (Cning-Fu Chang, 2015) .The human capital is ability intellectual capable of
generating new ideas, appropriate process and a high level of quality as a main stimulus for the
sustainable growth and achieve sustainable development which contribute to achieving the
optimum investment for different resources to reach the objectives (Smith, 2007). And also the
human capital is the driving force of the competitive advantage for business today, where
human capital represents the innate capacity acquired in individuals which lead to increase the
economic value added in all areas of business if properly invested. As a result of the importance
of this subject, researchers in Administrative Sciences gave great importance to human capital,
especially in developing countries (Patrick, 2015), where they provide a lot of concepts in
order to determine its concept, some considered it as part of the organization work and others
view it as including a set of components associated with the employees and a third group sees
that it includes the education, experience and skill possessed by the individuals while some
considered it as directly linked to the work (Greveet, 2006/ Fernandez, 2004).
3.3 Importance of Human Capital
The human element is the basis for organizations construction and development, and it
supports the organization’s success and continuity (Jawad, 2000) where the human capital
plays a key role in dealing with the problems faced by the organization, and the development
of appropriate solutions that leads to meet the challenges faced by the organization (Noe, 2009
).
Human capital is the main factor that makes the organizations success is a fact , not
buildings, equipment or trademarks (Decenzo & Robbins, 2005) and on this basis the human

213
capital has a great significance to the success, continuity and survival of the organizations.
Below is a detailed explanation of this importance:
The strategies related to human capital are considered as one of the important leading
strategies on which depend leading organizations that are looking for appropriate opportunities
where they cannot seize these opportunities only through talented employees and their
entrepreneurial abilities that lead to achieve the competitive advantage of business
organizations . (Morris, 2000) and (Koenig, 2001) confirmed that human capital is the main
arm of the organization in today’s world because of intellectual assets representing the hidden
force that ensures the survival of the organization and its success and profitability by working
to concentrate on the main idea that should be worked out when drawing support innovation
policies of human capital (Helen, 2015).
The human capital achieves the strategic objectives associated with improving the work
performance and development of organizational culture to reach the creativity and innovation
which leads to the success and survival of the organization (Dessler, 2003). The survival,
growth and continuity of the companies depends on the ability of employees to provide the
necessary and important knowledge for survival, ie, on the human capital that they own. In
addition to this, the importance of human capital emanates from achieving three basic
necessities that are (necessity for success, necessity to create new knowledge and the necessity
to achieve competitive advantage) through the ability to use characteristics convertible to
innovations of great significance to help decision-makers to take decisions related to sustainable
growth in the organization (Helen, 2015).
3.4Organizational Sustainability
The subject of sustainability is considered of the modern subjects that received
considerable attention from researchers where achieve profitability, increase market share and
achieve entrepreneurship and distinction are no longer the main subject in an instable
environment, but beyond that to how to create a state of sustainability and continuity and to
maintain the current business through the ability to meet the current needs for sustainable
growth (Ford, 2012) and how to it superior to their competitors. This requires organizations
attention to the sustainability of the competitive advantages now and in the future (Ramstad,
2005) and in various aspects (sustainability of the organization’s relations, sustainable ability
for innovation and sustainability of collective work) and its association to the elements of the
competitive advantage that contribute to this state achievement, in which the human capital
constitutes the key element in its continuation .
On the other hand many researchers went to define the concept of sustainability where
(White, 2009) defined it as the process of creating a continuous value for current and future
generations. And (Landrum, 2009) enhanced this concept when he said (The organization’s
ability to maintain the organization’s resources, assets and funds over the long term). And
(Jones, 2007) went to say that it is (the organization’s ability to remain in the exercise of their
activities in the long term and to achieve high growth rates). But (AZue, 2013) said it is (the
organization’s ability to continue and survive as a strong organization in the environment in
which it operates long-term time with the necessity to the presence of indicators reinforcing
this continuation to confirm the increase of this force).
The creation of organizational sustainability of all kinds require the availability of a set of
requirements as defined by (Barmwel & Alletanp, 2010) the most prominent are: the existence
of the organization continuation indicators, high rates of growth, attract the best customers,
achieve staff satisfaction and loyalty, optimum use of resources, support competitive ability,
search for points of strengths, weaknesses, opportunities and threats, and a continuous
commitment to the innovation processes and work to overcome the obstacles of organizational
sustainability represented in (multiple measurements to measure the sustainability, government
policies, lack of consistency between the sustainability and the business sector, the difficulty of
distinguishing between the opportunities and threats in the future, and lack of knowledge of
ways and means to motivate employees that help them to create a competitive advantage based
on human capital through the use of the organizational sustainability (OSM) (Neal, M.A.,
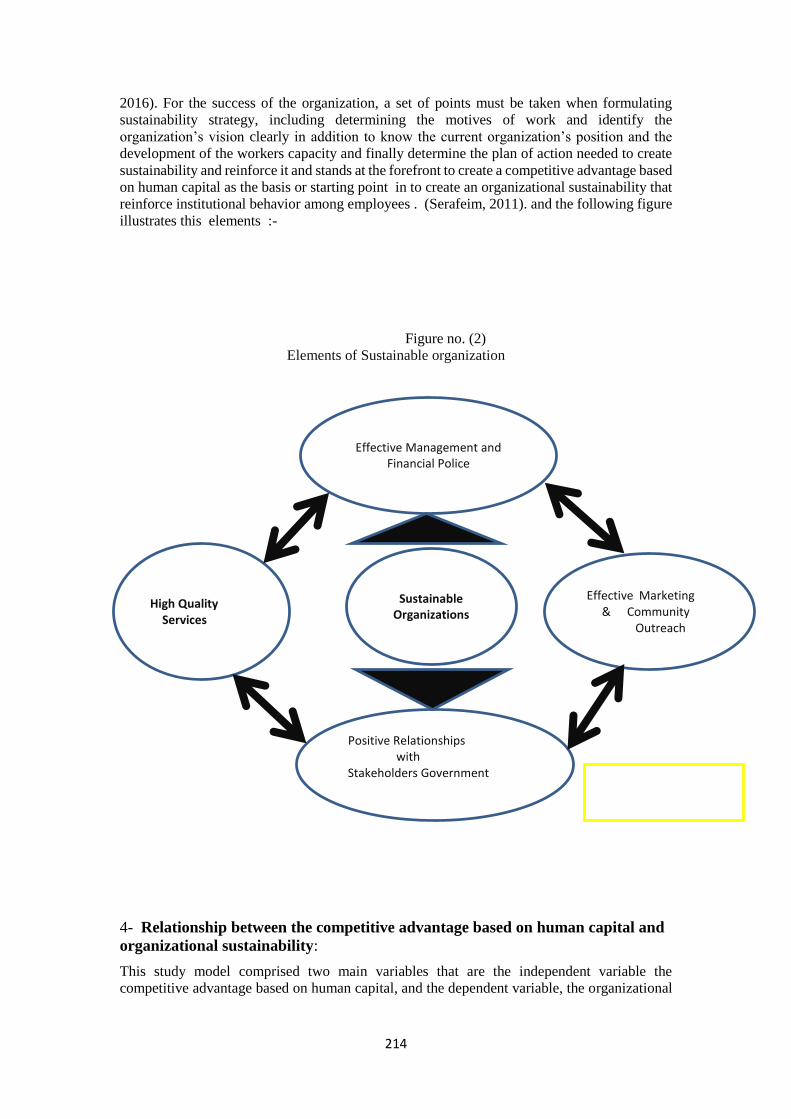
214
2016). For the success of the organization, a set of points must be taken when formulating
sustainability strategy, including determining the motives of work and identify the
organization’s vision clearly in addition to know the current organization’s position and the
development of the workers capacity and finally determine the plan of action needed to create
sustainability and reinforce it and stands at the forefront to create a competitive advantage based
on human capital as the basis or starting point in to create an organizational sustainability that
reinforce institutional behavior among employees . (Serafeim, 2011). and the following figure
illustrates this elements :-
Figure no. (2)
Elements of Sustainable organization
Reference: prepared by the research
4- Relationship between the competitive advantage based on human capital and
organizational sustainability:
This study model comprised two main variables that are the independent variable the
competitive advantage based on human capital, and the dependent variable, the organizational
Effective Management and Financial Police
Effective Marketing
& Community Outreach
High Quality
Services
Positive Relationships
with Stakeholders Government
Sustainable Organizations
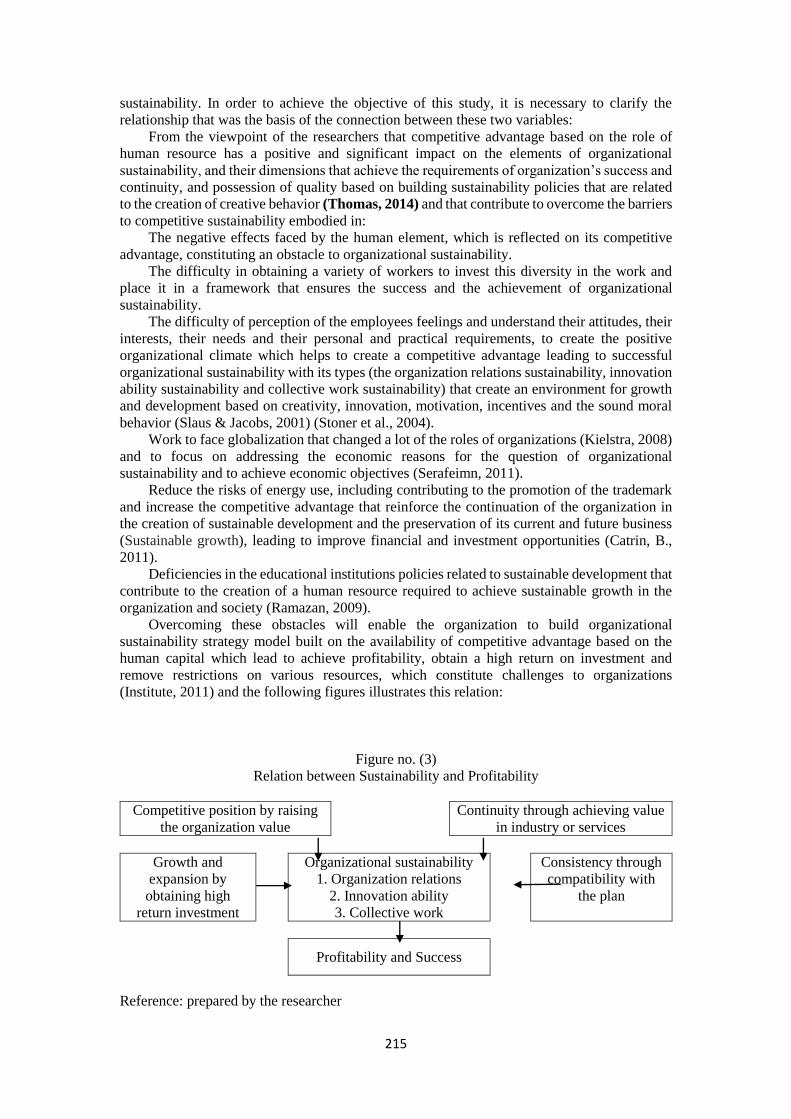
215
sustainability. In order to achieve the objective of this study, it is necessary to clarify the
relationship that was the basis of the connection between these two variables:
From the viewpoint of the researchers that competitive advantage based on the role of
human resource has a positive and significant impact on the elements of organizational
sustainability, and their dimensions that achieve the requirements of organization’s success and
continuity, and possession of quality based on building sustainability policies that are related
to the creation of creative behavior (Thomas, 2014) and that contribute to overcome the barriers
to competitive sustainability embodied in:
The negative effects faced by the human element, which is reflected on its competitive
advantage, constituting an obstacle to organizational sustainability.
The difficulty in obtaining a variety of workers to invest this diversity in the work and
place it in a framework that ensures the success and the achievement of organizational
sustainability.
The difficulty of perception of the employees feelings and understand their attitudes, their
interests, their needs and their personal and practical requirements, to create the positive
organizational climate which helps to create a competitive advantage leading to successful
organizational sustainability with its types (the organization relations sustainability, innovation
ability sustainability and collective work sustainability) that create an environment for growth
and development based on creativity, innovation, motivation, incentives and the sound moral
behavior (Slaus & Jacobs, 2001) (Stoner et al., 2004).
Work to face globalization that changed a lot of the roles of organizations (Kielstra, 2008)
and to focus on addressing the economic reasons for the question of organizational
sustainability and to achieve economic objectives (Serafeimn, 2011).
Reduce the risks of energy use, including contributing to the promotion of the trademark
and increase the competitive advantage that reinforce the continuation of the organization in
the creation of sustainable development and the preservation of its current and future business
(Sustainable growth), leading to improve financial and investment opportunities (Catrin, B.,
2011).
Deficiencies in the educational institutions policies related to sustainable development that
contribute to the creation of a human resource required to achieve sustainable growth in the
organization and society (Ramazan, 2009).
Overcoming these obstacles will enable the organization to build organizational
sustainability strategy model built on the availability of competitive advantage based on the
human capital which lead to achieve profitability, obtain a high return on investment and
remove restrictions on various resources, which constitute challenges to organizations
(Institute, 2011) and the following figures illustrates this relation:
Figure no. (3)
Relation between Sustainability and Profitability
Competitive position by raising
the organization value
Continuity through achieving value
in industry or services
Growth and
expansion by
obtaining high
return investment
Organizational sustainability
1. Organization relations
2. Innovation ability
3. Collective work
Consistency through
compatibility with
the plan
Profitability and Success
Reference: prepared by the researcher
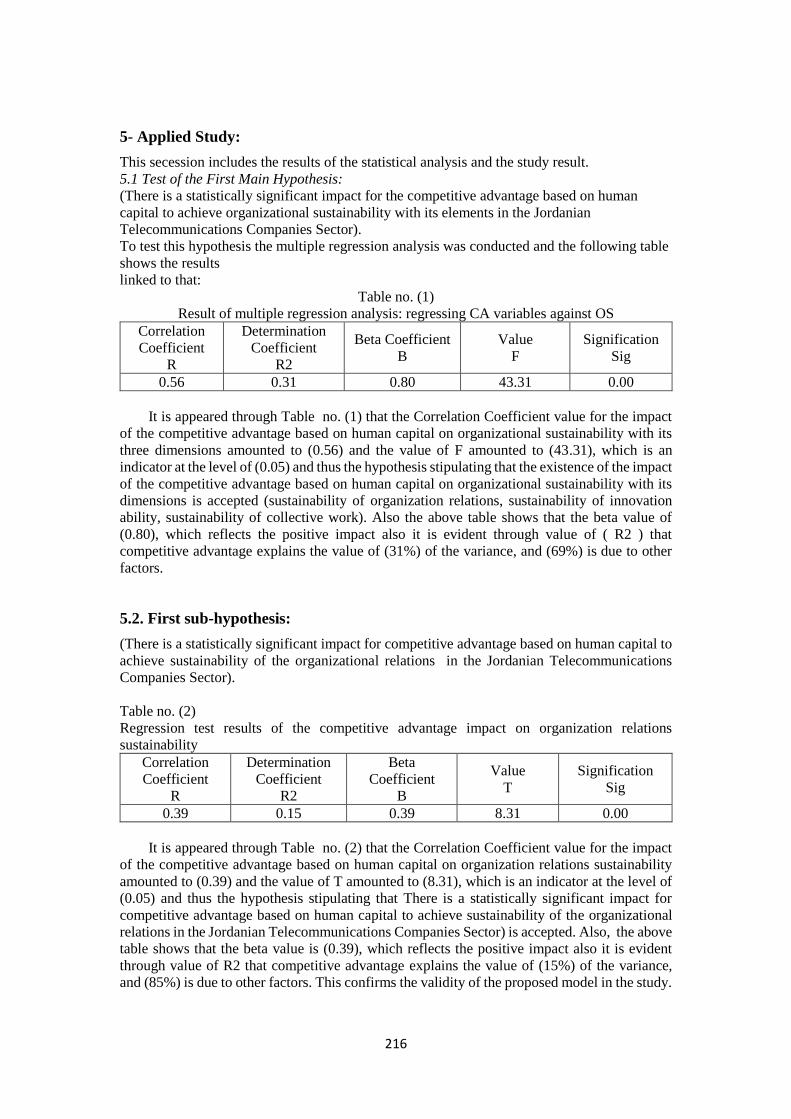
216
5- Applied Study:
This secession includes the results of the statistical analysis and the study result.
5.1 Test of the First Main Hypothesis:
(There is a statistically significant impact for the competitive advantage based on human
capital to achieve organizational sustainability with its elements in the Jordanian
Telecommunications Companies Sector).
To test this hypothesis the multiple regression analysis was conducted and the following table
shows the results
linked to that:
Table no. (1)
Result of multiple regression analysis: regressing CA variables against OS
Correlation
Coefficient
R
Determination
Coefficient
R2
Beta Coefficient
B
Value
F
Signification
Sig
0.56 0.31 0.80 43.31 0.00
It is appeared through Table no. (1) that the Correlation Coefficient value for the impact
of the competitive advantage based on human capital on organizational sustainability with its
three dimensions amounted to (0.56) and the value of F amounted to (43.31), which is an
indicator at the level of (0.05) and thus the hypothesis stipulating that the existence of the impact
of the competitive advantage based on human capital on organizational sustainability with its
dimensions is accepted (sustainability of organization relations, sustainability of innovation
ability, sustainability of collective work). Also the above table shows that the beta value of
(0.80), which reflects the positive impact also it is evident through value of ( R2 ) that
competitive advantage explains the value of (31%) of the variance, and (69%) is due to other
factors.
5.2. First sub-hypothesis:
(There is a statistically significant impact for competitive advantage based on human capital to
achieve sustainability of the organizational relations in the Jordanian Telecommunications
Companies Sector).
Table no. (2)
Regression test results of the competitive advantage impact on organization relations
sustainability
Correlation
Coefficient
R
Determination
Coefficient
R2
Beta
Coefficient
B
Value
T
Signification
Sig
0.39 0.15 0.39 8.31 0.00
It is appeared through Table no. (2) that the Correlation Coefficient value for the impact
of the competitive advantage based on human capital on organization relations sustainability
amounted to (0.39) and the value of T amounted to (8.31), which is an indicator at the level of
(0.05) and thus the hypothesis stipulating that There is a statistically significant impact for
competitive advantage based on human capital to achieve sustainability of the organizational
relations in the Jordanian Telecommunications Companies Sector) is accepted. Also, the above
table shows that the beta value is (0.39), which reflects the positive impact also it is evident
through value of R2 that competitive advantage explains the value of (15%) of the variance,
and (85%) is due to other factors. This confirms the validity of the proposed model in the study.

217
5.3. Second sub-hypothesis:
(There is a statistically significant impact for competitive advantage based on human capital to
achieve sustainability of the innovation ability in the Jordanian Telecommunications
Companies Sector).
Table no. (3)
Regression test results of the competitive advantage impact on the innovation ability
sustainability
Correlation
Coefficient
R
Determination
Coefficient
R2
Beta
Coefficient
B
Value
T
Signification
Sig
0.52 0.27 0.52 11.90 0.00
It is appeared through Figure no. (3) that the Correlation Coefficient value for the impact
of the competitive advantage based on human capital on innovation ability sustainability
amounted to (0.52) and the value of ( T ) amounted to (11.90), which is an indicator at the level
of (0.05) and thus the hypothesis stipulating that (There is a statistically significant impact for
competitive advantage based on human capital to achieve sustainability of the innovation ability
in the Jordanian Telecommunications Companies Sector) is accepted. Also, the above table
shows that the beta value of (0.52), which reflects the positive impact also it is evident through
value of R2 that competitive advantage explains the value of (27%) of the variance, and (73%)
is due to other factors. This confirms the validity of the proposed model in the study.
5.4. Third sub-hypothesis:
(There is a statistically significant impact for competitive advantage based on human capital
to achieve sustainability of the collective work in the organization within the Jordanian
Telecommunications Companies Sector).
Table no. (4)
Regression test results of the competitive advantage impact on the collective work
sustainability
Correlation
Coefficient
R
Determination
Coefficient
R2
Beta
Coefficient
B
Value
T
Signification
Sig
0.36 0.17 0.36 7.52 0.00
It is appeared through Figure no. (4) that the Correlation Coefficient value for the impact
of the competitive advantage based on human capital on collective work sustainability in the
organization amounted to (0.36) and the value of ( T ) amounted to (7.52), which is an indicator
at the level of (0.05) and thus the hypothesis stipulating that (There is a statistically significant
impact for competitive advantage based on human capital to achieve sustainability of the
collective work in the organization within the Jordanian Telecommunications Companies
Sector) is accepted. Also, the above table shows that the beta value of (0.36), which reflects
the positive impact. Also, it is evident through value of R2 that competitive advantage explains
the value of (17%) of the variance, and (83%) is due to other factors. This confirms the validity
of the proposed model in the study.
6 . Discuss the results
The results shown that the human capital has a great impact in the creation of the
competitive advantage for the telecommunication companies in Jordan, where the human
capital operates on the creation of the competitive advantage based thereon, that the human
capital constitutes the base in its creation and that the use of this competitive advantage is
working to achieve organizational sustainability for these companies and makes them possess

218
the sustainability in the relations of telecommunication companies with different bodies with
which they work and customers, achieving success and development of these companies
through the influence that appeared in the results of this study where amounted the value of (
T) is (8.31), which shown in table ( 2 ). As well as the permanent sustainability in finding
ability with these companies and their employees to generate new ideas (generation of new
knowledge) that make them characterized in the introduction of new ideas and the creation of
creativity in all areas of their work, making them distinct permanently and continuously on the
rest of the companies operating in the same sector or other sectors through the power of impact
that appeared in the results of the study, where amounted to (11.90) , table (3 ).
From another side the creation of collective work sustainability through the completion of
business in the telecommunications companies in accordance with the action teams had
characterized the companies from other companies and which has had a significant
consequences for the success of the companies in achieving the objectives efficiently and
effectively high where the impact value reached (7.52) as it shown in table ( 4 ) . Also by
looking at the overall condition of the companies, results shown that creating a competitive
advantage for companies based on the existence of a distinct human capital will contribute to
create and find a state of sustainability and continue and succeed to achieve objectives.
7. Conclusions and Recommendations of the Study
7.1 : Conclusions of the Study:
In the light of the results of the study and discussions many the conclusions can be
determined as following :-
There is a positive impact of human capital on creation the competitive advantage in the
Jordanian Telecommunications Companies Sector and create excellence .
The existence of a competitive advantage for telecommunication companies based on
human capital constitutes the ability of these companies to create organizational sustainability
and the continuation of success.
There is a positive effect of the presence of the competitive advantage, based on the
existence of efficient human capital, contribute to the creation of sustainability in companies
relations with the various parties inside and outside these companies.
There is a positive effect of the presence of the competitive advantage, based on the
existence of efficient human capital, contribute to the creation of sustainability in the ability of
companies to generate knowledge, create new ideas, maintain the creativity and find creative
ideas that contribute to the company’s development, progress and superiority over its
competitors.
There is a positive effect of the presence of the competitive advantage, based on the
existence of efficient human capital, contribute to the creation of collective work sustainability
.
Find human capital which contribute to create distinction and find work mechanisms
contribute to the attraction of distinctive elements.
Contribute to the creation of new work environment characterized by the presence of the
organizational sustainability in various areas of the telecommunication companies.
Find the competitive advantage based on a distinct capital is the optimum method that
should be used in telecommunications companies being contributes to the investment of human
capital optimally and achieve optimum organizational sustainability for companies in various
fields also contribute to achieve its vision and mission of the future.
7-2: Recommendations of the Study:
According to the conclusions of the study, the study recommends the following:
Working on the attraction of the distinct human capital in Jordanian Telecommunications
Companies Sector as well as find a sophisticated training programs contribute to the human
capital creation and provide them with the skills, abilities and knowledge they need to create
the competitive advantage for the companies in which they work will contribute to the
organizational sustainability of the companies.
219
Working on the creation of the competitive advantage based on the existence of distinct
human capital able to create this advantage that contributes to the success continuation of the
Jordanian telecommunications companies and invests the human capital working therewith
optimally to achieve organizational sustainability for the companies in various fields and
contributes to achieve the vision of the future.
Support the continuity of the Organization’s relationship through the creation of work
mechanisms contributes to the creation of continuous and well-developed relations with various
parties inside and outside the companies.
Participate for employees in setting-up the future plans of the organization and expand
these participation of the organization employees in the process of making decisions related to
their work and allow them to participate in setting-up the future plans that achieve the
distinctive and creative aspirations and the achievement of sustainable development for the
companies they work in.
Providing stimulating and favorable working environment for the development of the
skills and abilities of employees in the organization through working to determine the affecting
environmental elements and determine its impact and developing means to help taking
advantage thereof.
Taking into account the moral aspect when making decisions in the organization through
creating trust between the organization and employees and follow the methods that help to
overcome the difficulties faced by the organization and create the sustainable development of
the Jordanian Telecommunications companies.
Find work mechanisms generating new ideas and adopt and apply them to create new
knowledge and great achievements that contribute to the continuity and superiority of the
companies.
Adoption of the Action Teams as an important means to accomplish business and leave
the old formulas in the administrative work to achieve the sustainability of collective work in
the Jordanian telecommunications companies in order to achieve the overall organizational
sustainability.
References :-
Amazon, E.et al .(2009 )'' The problem of sustainability of organizational success in
public education institutions : A research on the education administration in Turkey ,''
. Procardia- Social and Behavioral Sciences. Vol. 1, Issue, 1, 2009. USA.
Aldahan, O. et at , (2005).'' Modern management concepts'' Jordanian books center.
Amman ,Jordan. ( In Arabic ).
Alsakarneh, B. (2005). ''Entrepreneurship strategies and their role in
achieving competitive advantage and improve the performance
of telecommunications companies in Jordan''. Master Theses University OF Amman
Arab Higher Studies, Amman , Jordan. ( In Arabic ).
Bani Issa, A. (2006). '' The impact of transformational leadership on performance in
public institutions in Jordan: A Field Study'' , Master Theses, University of
Jordanian , Amman , Jordan. ( In Arabic ).
Bradshaw, C.J.A.; Brook, B.W. ( 2014 )''Human population reduction is not a quick
fix for environmental problems"". Proceedings of the National Academy of
Sciences 2014.
Barnett, K., Mc Cormack, J. and Conner's, R. (2007). ''Transformational Leadership
in Schools Panacea Placebo or Problem'', Journal of Education Administration. Vol.
39 No. 1.
Chang, V. et al ( 2016 ) '' Organizational Sustainability Modeling '' International
Journal of Information Management , Vol. 36, Issue, 1 , Feberuary,2016 USA .
Ching-FU. Chang, et al ( 2015 ) '' Knowledge Spillovers, Human Capital and
Productivity '' Journal of Macronomics , December, 2015 , USA.

220
Cham Jong , M. (2004).'' Transformational or Transactional Leader'' Sport Light.
Vol. 24 No 2 ,2004
Decenzo,D.,& Robbins's.(2005).'' Fundamentals of Human Resource Management''
New Jersey, John wiley &Sons, Inc.
Dressler, G. (2003). '' Human Resource Management'' . New Jersey: prentice Hill.
David A. De Cenzo and Stephen P. Robbins( 2015)'' Fundamentals of Human Resource Management, 8th Edition'' Copyright by John Wiley & Sons, Inc. or related companies.
Elizabeth, C. k et al ( 2013 ) "Leadership Skills for a Sustainable World " University
of Toronto Press, Canada .
Fernandez-Feijoo , , and Silvia R., ( 2012) '' Transparent Information System for
Sustainability. A Sectorial Analysis '' Procardia Technology Journal . Volume 5, 2012
French, W.L. (2007). '' Human Resource Management '' (6th ed.). Houghton Mifflin
Company, Boston New York, USA.
Hoffman KA, et al 2008'' Replication and sustainability of improved access and
retention within the Network for the Improvement of Addiction Treatment'' Drug and
Alcohol Dependence Journal, Vol. 98 Issues,1-2 November 2008 .
Helen, M. et al ( 2015 ) '' Measuring the Impact of Innovative Human Capital on
Small firms Propensity to Innovate '' Research Policy, Vol. 44, Issue. 4, May, 2015.
USA .
Ivancevich, M.(2001). '' Human Resource Management '' . Boston :Mc Graw hill.
John W. Boudreau1,* and Peter M. (2005 ) '' Talent ship, talent segmentation, and
sustainability: A new HR decision science paradigm for a new strategy definition ''
Human Resource Management , Vol. 44 Issue 2 .
Jason Phillips , 2016 '', A quantitative evaluation of the sustainability or
unsustainability of three tunneling projects'' Tunneling and Underground Space
Technology Journal ,VOL. 51, January,2016.
Jawad, S. (2000), '' strategic management '' , Amman: Dar Hameid for publishing and
Distribution Jordan,
( In Arabic ).
Jounes, D.R. ( 2013 ) '' Organizational metaphor for ecological sustainability ''
Journal of Cleaner Production, Vol. 48 June, 2013 .
James M, and et al ( 2011 ) '' The next frontier for innovation, competition, and
productivity ''
McKinsey & Company.
Kasasbeh, M. et at (2010) .'The role of human resources management function in
the learning organization : a case study on the Talal Abu-Ghazaleh in Jordan''
Jordanian Journal in Business Administration. Vol. (6), No. (1).
Kuruez,E.,( 2013) '' Reconstructing Value: Leadership Skills for a Sustainable
World'' Handbook of Complexity and Management.
Lin Zhena, , et al ( 2009 ) '' Comparison of sustainability issues in two sensitive areas
of China'' Environmental Science & Policy Journal , Volume 12, Issue 8, December
2009.
Lozano, et al ( 2015 ) '' Teaching organizational change management for
sustainability '' Journal of Cleaner Production , Vol. 106, No. 1 , November, 2015 .
Michael L..,, Nicole D. l, and Bryan W. H. (2015 ) '' Sustainability Strategy in
Constrained Economic Times'' Long Range Planning Journal , Volume 48, Issue 2,
April 2015,
Morris, M. (2000). '' Entrepreneurial Intensity: sustainable advantages for Individuals
organizations & societies ''. Usa: quorum Book.
Mitch , A. ( 2016 ) '' Human Capital Risk: The Threat from inside '' Enterprise Risk
Management , 2016, USA.

221
Noe., et al. (2010). '' Human Resource Management: Gaining a Competitive
Advantage'' . Irwin, Boston, USA.
Oasis, K.T. and Simpllce, A. ( 2015 ) '' Intelligence , Human Capital and HIV/AIDS ''
Intelligence Journal , Vol. 53 , November- December, 2015 , USA .
Pennington, A. et at ( 2015 ) '' Early organizational diffusion of contemporary
policies : Narratives of sustainability and Talent management '' Procardia – Social and
Behavioral Sciences , Vol. 1 No. 1 , December, 2015 .
Patrick . G. et at ( 2015 ) '' Performance Assessment Vulnerability , Human Capital
and the Allocation of Aid Among Developing Countries '' World Development , June,
2015, USA.
Ramazan E. & Serhat S. ( 2009 ) " The problem of sustainability of organizational
success in public educational institutions: a research on the education administrators
in Turkey" Journal of Procedia - Social and Behavioral Sciences, Vol. 1, Issue 1,
Smith, A., &Smith, e. (2007).'' The role of training in the development of human
Resource Management in Australian organizations''. Human resource Development
International Journal . Vol. 10 No.3, p.p 263- 279.
Siddiqui. R. Sultan, H.A. (2013).'' Impact of Emotional Intelligence on Employees
Turnover Rate in FMCG''
Organizations. Pakistan Journal of Commerce and Social Sciences, Vol. 7 No. (2).
2013 .
Schermerhorn ( .2010 ).'' Management '' John Wiley & Sons, Inc., New York, USA.
Salman, J. (2009)'' Knowledge-based economy'', Dar Yazouri, Amman , Jordan . (
In Arabic ).
Susan A.M. and Christopher G.W. ( 20 ) '' The organizational Sustainability Journey
: Introduction to the special Issue. ''
Thomas, A.N. et al (2014 ) '' Organizational Sustainability Policies and Employee
green behavior '' Journal of Environmental Psychology , Vol. 38, June. 2014 , USA .
The Ministry of Higher Education and Scientific Research – Jordan ( 2004 )
www.Howard litwak.com
White L. and Noble , (2013)'' Strategic environmental assessment for sustainability:
A review of a decade of academic research'' Environmental Impact Assessment
Review Journal , Volume 42, September 2013
Wei C. & Qian. X. (2015)" Human capital investment in children: An empirical study of household child education expenditure in China, 2007 and 2011" Journal of China Economic Review , November 2015.
222
The learning organization: A foundation to
enhance the sustainable competitive advantage
of the service sector in Egypt
Dr. Wael Omran Aly
New Cairo Academy
Egypt
Abstract:
An organization’s ability to learn and translate that learning into action rapidly, is the
ultimate competitive advantage. The learning organization is the structure that facilitates the
abovementioned competitive advantage, it empowers employees, it enriches and enhances the
customer experience and collaboration with key business partners and ultimately boosts
business performance. Organizational learning is considered as the suitable process to develop
knowledge resources and capabilities/core competencies (human capital, social capital and
organizational capital) that engender ongoing values; which in turn yield persistence superior
performance; which lead to sustainable competitive advantage within the context of the
strategic management.
Then, the learning organization provide the necessary organic structure implying the
necessary disciplines, principles and policies; according to which the organizational learning
process had to take place - in the light of the environmental surroundings- to equip the human
resources with the updating knowledge, innovative capabilities, behaviors and culture
representing the convenient intellectual capital to produce ongoing value stream. Such value
stream deems as a sustainable competitive advantage for such organization.
This paper, therefore, explores, discusses and analyzes the integrated role of Learning
organization (as a structural entity) and the organizational learning (as an intrinsic know-how
process) that takes place within such context; in helping firms working in the service sector in
Egypt- whether they are public or private enterprises- to achieve sustainable competitive
advantage, as the service sector in Egypt is by the far the largest and fastest-growing economic
sector and accounts for almost 51 % of GDP. Whereby it represents the locomotive of
development for a developing country as Egypt.
Keywords: Learning organization, organizational learning, intellectual capital, strategic
management, service sector.
1- Introduction
The service sector in Egypt is a dynamic sector, whereby the organizations working in
Tourism, trade, banking, and shipping services on the Suez Canal constitute the main sources
of service sector revenue. They strive to innovate their services to satisfy the changeable needs
and wants of customers. Meanwhile, they are facing many challenges affecting their business
such as the severe competition from global competitors, the escalated technology development
and the fluctuated ecological determinants as one of the Arab spring countries
Therefore, the service sector companies in Egypt had to adapt with such environmental
challenges; to keep their market positioning whether in the domestic market or the global one.
In order to make such hope go through; the organizations working in such service realm had to
transform their traditional organizations into learning organizations. Which are able to absorb
and substitute their traditional thinking and actions into recent knowledge and advanced

223
practices via a group of talented employees /human resources who are continually enhancing
their capabilities to create what it will take to respond to changes, complexity and uncertainty .
In fact, The rate at which the organizations learn may become the only sustainable source
of competitive advantage (Senge, 1990). Then, the creation of the competitive advantage to
sustain within any organization; requires the adoption of an effective organizational learning
process to make the organization adaptive - adopting changing management approach - with its
internal and external environment. Moreover, to learn the organization via its intellectual capital
- using innovation techniques - how to engender an appropriate persistence value stream for
their market segments (productive organization).
Hence, in this paper the researcher aims firstly to shed light on sustainable competitive
advantage concept and learning significance. Secondly, to interpret the learning organization
concept and its principles. Thirdly, to suggest a strategic framework for organizational learning
process into the service sector. Fourthly, to identify the challenges facing the creation of
learning organization in the Egyptian service sector. Finally, to prescribe the different
reforming pillars necessary to transform the traditional service organizations in Egypt into
effective learning organizations; applying the recent organizational learning techniques and
knowledge management methods; to engender the convenient value stream that yields the
intended sustainable competitive advantage.
2- Sustainable competitive advantage concept and learning significance
A competitive advantage is what distinguishes you from the competitors in the minds of
your customers. Whether you are an employee, a business or a country, you need to have a clear
competitive advantage and communicate it to your customers. Before you can determine your
competitive advantage, you've got to know these three determinants (Aaker, D. 1989):
- What you produce. Whether it's a good or service, you've got to be very clear on what you
are providing. New technology can redefine that for you, so you've got to constantly stay on
top of how trends affect the benefits you provide. For example, the Internet meant that
newspapers had to redefine how they delivered the news.
- Target market. Who are your customers? You've got to know exactly who buys from you,
and how you can make them happier. This increases demand, the driver of all
economic growth. Newspapers found out their target market started to become older people,
who weren't as comfortable getting their news online.
- Competition. This is not just other similar companies or products, but anything else your
customer does to meet their needs. Newspapers thought their competition was other
newspapers, until they realized it was the Internet.
Once you are clear on these three determinants, then you can decide what benefit you
provide better than the competition to your target market. Reinforce that message in every
communication to your customers, including advertising, public relations, and even your
storefront and employees. If you are the employee, treat yourself as if you were in business for
yourself, because you are. Make sure your competitive advantage is reflected in your
appearance, your resume, and in how your communicate.
A company must create clear goals, strategies, and operations to sustain its competitive
advantage over time. The corporate culture and values of the employees must be in alignment
with those goals, as well. It's difficult to do all those things well, which is why very few
companies can create a sustainable competitive advantage.
In 1985, Harvard Business School professor Michael Porter wrote the definitive business
school textbook on the topic, called Competitive Advantage. In it, he outlined the three major
ways companies achieve sustainable advantage: cost leadership, differentiation and focus.

224
Although these main strategies were developed by researching companies, they can be useful
for everyone, from employees to countries, who is seeking to stand out. They are as follows
(Porter, 1985):
Cost leadership means you provide reasonable value at a lower price. Companies do this by
continuously improving operational efficiency. They usually pay their workers less, either by
providing intangible benefits such as stock options, benefits or promotional opportunities, or
by taking advantage of unskilled labor surpluses. As they get larger, they can take advantage of
economies of scale, and buy in bulk. However, sometimes they pay below the cost of living.
Their advantage can be threatened if they must comply with higher minimum wage laws.
Differentiation means you have a strong brand that clearly communicates how you deliver
benefits much better than anyone else. A company can achieve differentiation by providing a
unique or high-quality product, by delivering it faster, or by marketing it in a way that truly
reaches customers better. Instead of being a cost leader, the company with a differentiation
strategy can charge a premium price. That means they usually have higher profit margins.
Companies usually achieve differentiation with innovation, quality or customer service.
Innovation means you meet the same needs in a new way. Quality means you provide the best
product or service, and so might be higher priced. Customer service means going out of the way
to delight the customer.
Focus means you understand and service your target market better than anyone else. You can
use either a cost leadership or differentiation strategy, but you focus it on one specific target
market. Often it's a tiny niche that isn't being served by larger companies. Community banks
and tourism companies are an example of a segment that uses a focus strategy to gain
sustainable competitive advantage. They target local, small businesses, or high net worth
individuals. Their target audience enjoys the personal touch that such enterprises may not be
able to give, and they are willing to pay a little more in fees for this service. These enterprises
are using a differentiation form of the focus strategy.
Consequently, the sustainable competitive advantage (SCA) is when the firms strive for
unique characteristics in order to distinguish themselves from competitors in the eyes of the
consumer for a long period of time (Hoffman, 2000) . Then, Competitive advantage exists when
a particular company consistently outperforms other companies in the same industry. A
company is considered to be outperforming others if profits are higher than the competition's
profits. The competitive advantage is thought to be stronger when it lasts for a longer period of
time. Those companies who are able to maintain a competitive advantage for many years are
thought to have a sustainable competitive advantage. If sustainable competitive advantage is
dependent on maintaining a higher profit margin than other companies in the same industry,
how does a company set out to develop a strategy to both achieve and maintain competitive
advantage? The two main components of profit are that customers both value the goods and
services and will pay for them and that a company can keep production costs related to goods
and services low, so that there is a higher profit margin (John I. Njuguna, 2009).
Thus, Competitive advantage involves communicating a greater perceived value to a
target market than its competitors can provide. This can be achieved through many avenues
including offering a better-quality product or service, lowering prices and increasing marketing
efforts. On the other hand, Sustainable competitive advantage refers to maintaining a favorable
position over the long term, which can help boost a company's image in the marketplace, its
valuation and its future earning potential. It is the ability to offer superior customer value on an
enduring or consistent basis, a situation in which competitors are unable to easily imitate the
firm’s capacity for value creation (Collis and Montgomery, 1995). According to Barney (1991),
sustainable competitive advantage arises when the firm’s resources are valuable (the resources
help the firm create valuable products and services), rare (competitors do not have access to
them), inimitable (competitors cannot easily replicate them) and appropriate (the firm owns
them and can exploit them at will). Acquiring and preserving distinguish performance and
superior value stream are a function of the resources and capabilities brought to the competition;
representing the sustainable competitive advantage (Aaker, 1989; Barney, 1995).
225
Learning and knowledge management is emerging as a key factor to dealing with change
and developing competitive advantage. These knowledge resources and capabilities, resulting
from learning processes implies an improvement in response capacity through a broader
understanding of the environment (Dodgson, 1993; Sinkula, 1994).
Rebelo and Gomes (2008) state that learning is present in any organization because of the
intrinsic attributes of individuals and is an inevitable element of organizational life. However,
whether or not it is recognized and utilized will determine the success of any organization.
Learning organizations are able to go through change less painfully than non-learning
organizations because the resistance is reduced from the company owning a shared vision. They
further argue that it is not knowledge itself that brings about a competitive advantage but rather
how the knowledge is created and injected back into the organization's existing competences
via an effective organizational learning process (Marshall, J., & others, 2009).
Taking this argument further, the resources themselves do not bring about competitive
advantages but rather what a company is able to do as a result of these resources; this is what
is referred to as a firm’s core competencies and Capabilities which involve the formation of
complex internal patterns between people and other resources which lead to sustainable
competitive advantages (Murray and Donegan, 2003). It is through learning that these
competencies are created and realized. In similar, vein the existence of learning culture and the
establishment of an environment that facilitates and encourages ongoing learning can be a
significant factor in achieving valuable outcomes and organizational development necessary to
create a sustainable competitive advantage, this is what the learning organization aim to realize
(Smith, 2004).
3- The learning organization concept and perspectives
learning organizations (LO) can be defined as organizations where people continually
expand their capacity to create the results they truly desire, where new and expansive patterns
of thinking are nurtured, where collective aspiration is set free, and where people are
continually learning to see the whole together. The basic rationale for such organizations is that
in situations of rapid change only those that are flexible, adaptive and productive will excel.
For this to happen, it is argued, organizations need to discover how to tap people’s commitment
and capacity to learn at all levels (Senge,1990).
While all people have the capacity to learn, the structures in which they have to function
are often not contributing to reflection and engagement. Furthermore, people may lack the tools
and guiding ideas to make sense of the situations they face. Learning organizations are
continually expanding their capacity to create their future; which requires a fundamental shift
of mind among their members. In agreement with this Trim and Lee (2004) state that a learning
organization is particularly skilled at systematic problem solving and is better equipped with
the power of communication and information technology to face emerging threats in the
external environment. A learning organization can be defined as “an organization that focuses
on developing and using its information and knowledge capabilities in order to create higher-
valued information and knowledge, to change behaviors and improve bottom line results”, that
yields a competitive advantage (King, 2001). Moreover, the Learning Company is a vision of
what might be possible. It is not brought about simply by training individuals; it can only
happen as a result of learning at the whole organization level. So, a Learning Company is an
organization that facilitates the learning of all its members and continuously transforms itself
(Pedler et. al.,1991).
Learning organizations are characterized by total employee involvement in a process of
collaboratively conducted, collectively accountable change directed towards shared values or
principles (Watkins and Marsick, 1992). From theses definitions we see that for learning
organizations to be successful there must be a change in behavior, learning in itself is a change
process for improvement to adapt with various external environment forces. we can also
conclude that a company must assess and make use of its internal resource to create and sustain
competitive advantages.
226
3. 1 Learning Organizations perspectives
In accordance with the descriptions above, organizations that wish to lay claim to the title
need not only to be able to generate new knowledge, but to use it in a practical way- to practice
what they preach, as it were. This is not as easy as it sounds. Many organizations are in a
position to generate new knowledge, such as from customers, from the collective wisdom of
their members or from the world at large, yet in reality do not use this information as well as
they might. Garvin (1998) for example would see the ability to transfer knowledge quickly
around the organization as one of the key components of a learning organization, as well as the
ability to experiment and learn from experience. A useful set of descriptors of what a learning
organization might look like in practice is provided by Yang, Watkins and Marsick (2004).
They suggest five perspectives:
3.1.1 A System perspective
In terms of systems thinking, based primarily around the work of Senge (1990) , learning
organizations can not only adapt to changes in their business environment, but also have the
ability to create their own future to an extent . Although Senge does not go into specifics about
how this can be achieved, he places his five ‘disciplines’ at the Centre of these efforts. The so-
called ‘fifth discipline’- systems thinking- is based upon interrelationships between
organizational events and processes rather than linear cause – effect chains, and in being able
to see the overall process of change rather than ‘ snapshots’. The other four disciplines are team
learning, where the emphasis is on the learning activities of the group rather than on the
development of team process, shared visions, which are manifested in an ability to build a
shared picture for the future that helps generate real commitment rather than compliance, shared
mental models, which are internal images of how the world works, and personal mastery, which
involves continually clarifying and deepening personal vision, focusing energies, developing
patience and seeing reality objectively.
3.1.2 A Learning perspective
Peddler, Burgoyne, and Boydell (1991) identified some overlapping areas in which a
learning organization facilitates the learning of its members and as such transforms itself. The
approach is based on incorporating the traditional elements of management to support learning
at all organizational levels. For instance, they recommend adopting a learning approach to
strategy as well as participative policy making. In essence this means involving as many people
as is appropriate in these activities to both provide input and help disseminate output. Other
priorities include the establishment of a learning climate and self-development for everyone.
These principles are about creating opportunities for individuals to engage in learning within
the workplace as well as removing barriers preventing them from doing so.
3.1.3 A Strategic perspective
This approach is based on a need to understand the main strategic drivers necessary to
build learning capability Goh (1998), for example , contends that learning organizations have
five core strategic building blocks . These include clarity and support for mission and vision;
shared leadership and involvement; a culture that encourages experimentation; the ability to
transfer knowledge across organizational boundaries; and teamwork and co-operation. Further,
the strategic building blocks require two main supporting foundations. The first is an effective
organization design that is aligned with and supports them. The second consists of the
appropriate employee skills and competencies needed for the tasks and roles described therein.
These strategic building blocks can serve as practical guidelines for operational and managerial
practice, and along with the two supporting foundations they can also provide advice for
management and organizational consultants.

227
3.1.4 An Integrative perspective
Watkins and Marsick (1993) provide an integrative model of a learning organization. They
describe the process of learning within a learning organization As integrated with work of the
organization. In practice, organization members are aligned around a common vision, yet are
aware of and can adapt to their changing environment. As a by-product of their day-to-day
work, they generate new knowledge which they use, in turn, to create innovative products and
services to meet customer needs. The authors identified seven distinct but interrelated
dimensions of a learning organization at individual, team and organization Levels. These
include continuous learning; inquiry and dialogue; team learning; empowerment; embedded
systems; system connection; and strategic leadership. The learning organization is viewed as
one that has the capacity to integrate people and structures in order to move towards continuous
learning and change.
2.1.5 Building blocks perspective
Another influential view of what constitutes a learning organization comes from the work
of Garvin, Edmondson and Gino (2008). Recall that Garvin's description of a learning
organization, outlined earlier, suggests it's about creating, acquiring and transferring knowledge
and modifying behavior to reflect this. He and his colleagues offer three broad factors, also
called 'building blocks', seen as essential for organizational learning and adaptability. They are
a supportive learning environment, concrete learning processes and practices and leadership
that reinforces learning. A supportive learning environment comprises a number of elements.
Psychological safety is one. It must be acceptable for people to question authority but also for
them to be able to own up to mistakes. To do this the same learning environment must
demonstrate an appreciation of differing approaches and points of view. It must therefore be
open to new ideas and tolerate a degree of risk taking. Finally, supportive learning environments
allow time to reflect on what's being done and how it's being done. The second building block,
concrete learning processes and practices, is concerned with the generation, interpretation and
dissemination of internal and external knowledge around the organization. It is about having
systematized ways of capturing and sharing data from customers and the business environment
as well as from employees through their experience, the projects they undertake and the
business problems they solve. These processes and practices serve the purpose of getting
information to those who will use it. The third building block, leadership that reinforces
learning, necessitates leaders throughout the organization who are willing to encourage
dialogue, to listen to alterative points of view, and in general to foster a culture of learning.
2.2 Effective learning organization requirements
Despite the different starting points for the approaches and the perspectives outlined
above, some common principles for the learning organization effectiveness can be seen within
them, as follows (Cyril Kirwan, 2013):
- At the strategic level, a sense of vision (and in particular shared vision) is apparent in all
the organizational levels. Clear goals, and support for those goals are critical if the organization
is to make use of learning opportunities that arise from the challenges it faces.
- There is also the necessity for leaders (at all organizational levels) to share the vision
(sharing leaders). This should result in better performance because activities can be directed
more precisely towards the goals, but also because the more people that understand and share
the vision, the greater will be the amount of learning.
- Another important principle that appears to be central to learning organizations has to
do with the creation of a learning structure that is flexible and adaptable to changes in the
external environment . This structure should facilitate the creation, retention and transfer of
practical knowledge that can be used within and across organizational boundaries.
- The idea of a learning climate, where personal mastery, self-development for everyone,
education and training and continuous learning (primarily experiential) are embedded in the
way the organization goes about its business. This type of climate also encourages
228
experimentation, empowerment and dialogue and structures teams so that they work with and
learn from each other. The strength of a learning climate will also be seen in psychological
safety, in time given for reflection and in shared leadership and involvement.
- The importance to create continuous learning opportunities. In learning organizations,
learning is designed into work so that people can learn on the job and opportunities are provided
for ongoing education and growth.
- The necessity to promote inquiry and dialogue. In this situation, individuals develop
productive reasoning skills to express their views and the capacity to listen and inquire into the
views of others, The culture is such that it supports questioning, feedback and experimentation.
- The importance to encourage collaboration and team learning. What this means for the
organization is that work is designed to use groups to access different modes of thinking.
Groups are expected to work and learn together, and collaboration is valued and rewarded.
- It is imperative to create information technology systems to capture and share learning.
Both high- and low-information technology systems to share learning are created and integrated
with work. Of particular importance is that access is provided to these systems, and that they
are maintained.
- There is a requirement to empower people toward a collective vision. People in the
organization become involved in setting, owning and implementing this vision. Responsibility
is distributed close to decision making so that people are motivated to learn toward what they
are held accountable to do.
- It is essential to connect the organization to its environment. Individuals are helped to
see the effect of their work on the entire enterprise. In doing this they scan the environment and
use information to adjust work practices, and the organization is linked to its communities.
- The organization must provide strategic leadership for learning. Leaders have to model,
champion and support learning, and must use learning strategically for business results.
It would seem clear from the discussion above that becoming a learning organization is an
end to which many organizations aspire, given its links with performance and competitive
advantage in the knowledge economy. How therefore can the various characteristics and
principles outlined, which scholars and practitioners agree are of critical importance, be
integrated to create such an entity? It can be only integrated by the organizational learning
process; responsible to create and share knowledge all over the organization. Then, formulating
the intellectual capital; which represents the core of the learning organization and its decisive
competitive advantage.
Hence, a learning organization must have the persistence capacity to collect, store and
transfer knowledge via an effective organizational learning process to modify the behavior of
its team members to reflect new knowledge and insights; which can be used by such
organization towards the achievement of improved performance and then sustainable
competitive advantage.
4- Strategic framework for organizational learning process
Graham and Nafukho (2007) state the importance of making a clear distinction between a
“learning organization” and “organizational learning”, they believe that these concepts
should not be used in a way that suggests they are interchangeable. A learning organization is
concerned with bringing about a change in behavior that will lead to a company achieving its
desired state- transforming (Blackman and Henderson, 2005). Garavan (1997), suggests that
the Learning Organization (LO) represents the direction of the organization in a specific
structural context; while Organization Learning (OL) is seen as a heuristic operative device
used to sum up the learning activities within the organization. Sun and Scott (2003) imply that
the two streams are different but strongly related; organizational learning must reach a stage
where the transfer of learning and sharing of knowledge is made easier. Although learning
organization is a study of how organizations learn, the starting point will always be an analysis
of how individuals learn. In similar, Hoyle (1995) argues that organizational learning is
considered a way of articulating that organizational members are individual learners who

229
possess the ability to learn collaboratively. Then, organizational learning is considered as a
knowledge sharing process; furthermore, the competitive strategy of the firm that can create its
sustainable competitive advantage.
4.1 Organizational learning as a knowledge sharing process
Organizational learning refers to the sum total of individual and collective learning through
training programs, experience, experimentation and work interactions within the organization.
is the acquisition, sustenance or changing of meanings shared by people through cultural
devices and through the collective actions (Cook & Yanow, 1996). However, the concept of
organizational learning is subject to competing formulations and is an ongoing debate (Stewart,
1996). Most definitions deal with the learning processes and are rooted in social and cognitive
psychology (Lipshirtz, 2000). However, Miller (1996) defined organizational learning as a
process of coordinated systems change, with mechanisms built in for individuals and groups to
access, build and use organizational memory, structure and culture to develop long-term
organizational capacity. It is a dynamic process of creation, acquisition and integration of
knowledge aimed at the development of resources and capabilities that contribute to better
organizational performance (Lopez, Peon and Ordas, 2005). Whereas a single instance of
organizational learning may be relatively easy for other organizations to imitate, continuous
organizational learning has cumulative effects that are much more difficult to imitate (Denisi
et al., 2003). Previous studies (Huber, 1991; Dale, 1994; Nevis Debila and Gould, 1995;
Winter; 2000) have proposed four dimensions or phases of organizational learning process to
be knowledge acquisition, distribution, application and translation into organizational memory.
However, according to Dale (1994) organizational learning can be characterized as an intricate
three-stage process consisting of knowledge acquisition, dissemination and shared
implementation (interpretation).
Basically, the process phases of organizational learning can be described in terms of six
sequent steps (see fig.1), which continuously repeat themselves in the strategic management
context as follows (Pawlowsky, 2003) (Katie Smith & others, 2011) (Omran, 2015):
1. The definition of internal and external actors who create and consume knowledge (the
learning community vision and mission)
2. The identification of the learning needs and the information that seems relevant to learning,
to the creation (generation) of new knowledge, or both in the context of the internal and external
environment factors relative to the organization (learning strategic goals).
3. The exchange and diffusion of knowledge, either from the individual to the collective level
or at the collective level itself by identifying the high value sources of knowledge
(learning priorities and plans) .
4. The integration of knowledge into existing knowledge systems at a collective level, an
individual level, or both, or into procedural rules of the organization, by defining processes for
each steps whereby either integration or modification of the adopting system can take place
(learning policies and programs).
5. The transformation of the new knowledge into action and the reapplication of the knowledge
into organizational routines, so that it has effect on organizational behavior (e.g. the
development of new leadership styles or new products and services) (learning action plan).
6. Align resources such as staffing, incentives and support to new knowledge capabilities
creation to ensure its effectiveness; by monitoring and evaluating periodically the
organizational learning progress in realizing the intended learning goals to a successful
knowledge sharing process (learning evaluation and feedback).

230
Figure 1
Source: Katie Smith Milway, Amy Saxton, The Challenge of Organizational Learning,
Stanford social innovation review, summer 2011.
4.2 Organizational Learning as a Competitive Strategy
Organizational learning process -as we aforementioned- involves knowledge acquisition,
distribution, application and translation of this knowledge into organization resources
(organizational memory) such as databases, procedures and systems that can be used for
leveraging the firm. This implies that, when a firm acquires individual level knowledge
resources (human capital) through selection, training or experience and other learning activities,
it must find a way to leverage those resources to the team level and eventually to the
organizational level (Denisi, 2000). Otherwise, the effects of these knowledge-based resources
on competitiveness will be limited. The firm should develop systems, procedures and processes
(organizational capital) - at the organizational level- by which individuals that have the critical
knowledge can transmit this information to others who can use it. This implies that for an
organization to benefit from the learning process, it should put some effort in the management
of knowledge.
Furthermore, the learning process is intrinsic, social and collective and occurs not only
through the imitation and emulation of individuals, but also on collaboration and interaction in
understanding complex problems. The knowledge generated this way is translated into new
models of activities, routines and logic in the organization (Teece Pisano and Shuen, 1997).
Thus, through organizational learning, a firm can develop unique human and organizational
capital that are hard to imitate and that evolve continuously with the firm (Armstrong, 2001).
Armstrong argues that employees’ skills, knowledge and abilities (human capital) at the
individual level are intertwined with organizational culture to form unique resources that other
firms cannot acquire and apply.
Moreover, It is through social capital, knowledge conversations among all levels can take
place, that is, from individual to collective to organizational to inter-organizational and vice-
versa (Autio Yli-Renko and Sapienza, 2000). This social capital is broadly described by
researchers as an asset embedded in the relationship of individuals, committees, networks or
societies (Coleman, 1998).
Hence, human capital may be the most important and critical for competitive advantage
because it is the most difficult to imitate (Denisi, et al., 2003). However, human capital is more
mobile than other intangible resources (Teece et al, 1997) and therefore may seem an unlikely
source of sustained competitive advantage. Yet the mobility of human capital is less a threat to
competitive advantage than it would first seem to be because once an organization integrates
human capital with other complementary resources and uses this integration to create
organizational capabilities, losing one or a few individuals may not lead to a loss of competitive
advantage. This means that it is not enough to acquire individuals who have skills, knowledge
and abilities; it is also necessary to develop these abilities further and use them to develop
structures, systems, procedures and reputation (organizational capital) that allows the
organization to exploit the resources and gain competitive advantage (Denisi et al, 2003).
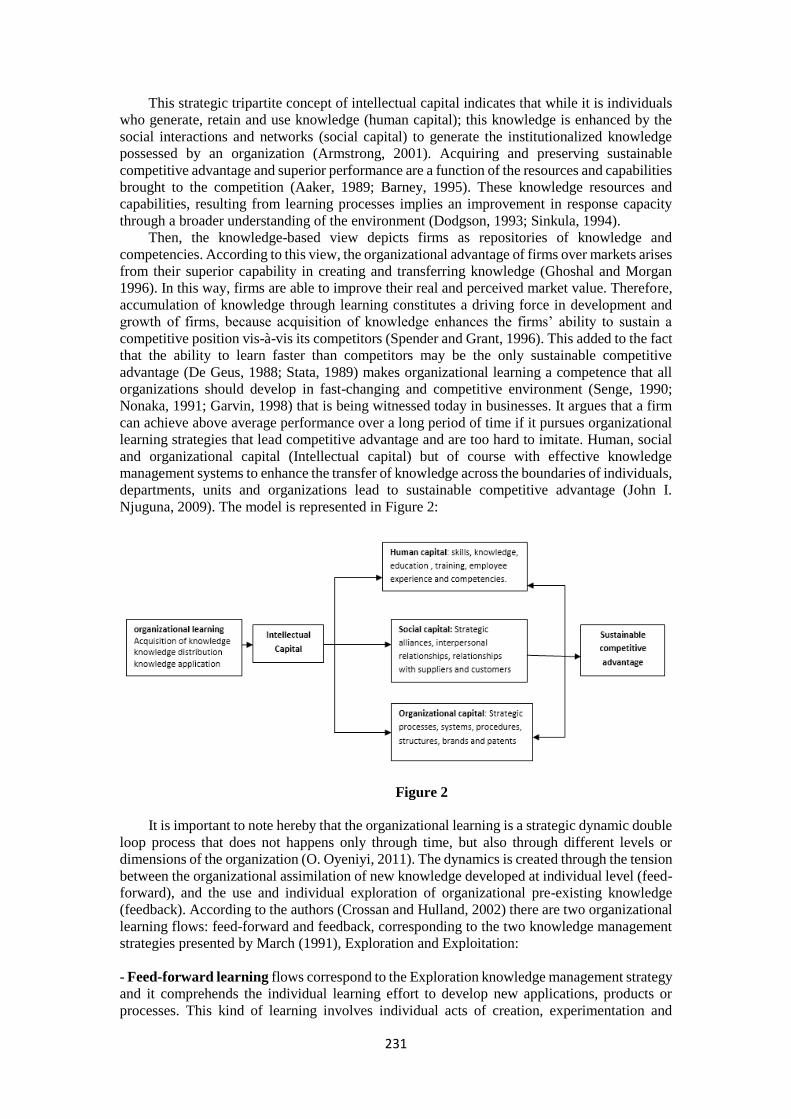
231
This strategic tripartite concept of intellectual capital indicates that while it is individuals
who generate, retain and use knowledge (human capital); this knowledge is enhanced by the
social interactions and networks (social capital) to generate the institutionalized knowledge
possessed by an organization (Armstrong, 2001). Acquiring and preserving sustainable
competitive advantage and superior performance are a function of the resources and capabilities
brought to the competition (Aaker, 1989; Barney, 1995). These knowledge resources and
capabilities, resulting from learning processes implies an improvement in response capacity
through a broader understanding of the environment (Dodgson, 1993; Sinkula, 1994).
Then, the knowledge-based view depicts firms as repositories of knowledge and
competencies. According to this view, the organizational advantage of firms over markets arises
from their superior capability in creating and transferring knowledge (Ghoshal and Morgan
1996). In this way, firms are able to improve their real and perceived market value. Therefore,
accumulation of knowledge through learning constitutes a driving force in development and
growth of firms, because acquisition of knowledge enhances the firms’ ability to sustain a
competitive position vis-à-vis its competitors (Spender and Grant, 1996). This added to the fact
that the ability to learn faster than competitors may be the only sustainable competitive
advantage (De Geus, 1988; Stata, 1989) makes organizational learning a competence that all
organizations should develop in fast-changing and competitive environment (Senge, 1990;
Nonaka, 1991; Garvin, 1998) that is being witnessed today in businesses. It argues that a firm
can achieve above average performance over a long period of time if it pursues organizational
learning strategies that lead competitive advantage and are too hard to imitate. Human, social
and organizational capital (Intellectual capital) but of course with effective knowledge
management systems to enhance the transfer of knowledge across the boundaries of individuals,
departments, units and organizations lead to sustainable competitive advantage (John I.
Njuguna, 2009). The model is represented in Figure 2:
Figure 2
It is important to note hereby that the organizational learning is a strategic dynamic double
loop process that does not happens only through time, but also through different levels or
dimensions of the organization (O. Oyeniyi, 2011). The dynamics is created through the tension
between the organizational assimilation of new knowledge developed at individual level (feed-
forward), and the use and individual exploration of organizational pre-existing knowledge
(feedback). According to the authors (Crossan and Hulland, 2002) there are two organizational
learning flows: feed-forward and feedback, corresponding to the two knowledge management
strategies presented by March (1991), Exploration and Exploitation:
- Feed-forward learning flows correspond to the Exploration knowledge management strategy
and it comprehends the individual learning effort to develop new applications, products or
processes. This kind of learning involves individual acts of creation, experimentation and

232
innovation, having in perspective the use of future knowledge. This learning flow moves to the
organizational level wide-spreads the individual contributions. Feed-forward - the transfer of
knowledge from the individual to the organization - corresponds to the Exploration.
- Feedback learning flows correspond to the Exploitation knowledge management strategy
and it comprehends all the organizational learning potential to refine pre-existing knowledge
and reuse it, applying current collective knowledge. This learning flow moves from the
organizational level to the individual level, wide-spreading the most efficient practices.
Feedback consists in getting institutionalized learning back to the individuals that means it
corresponds to the Exploitation.
Hence, there are important implications in balancing the tension between Exploration and
Exploitation (Crossan, 2004). As the firm that manages well organizational learning is able to
develop new and innovative ideas, as well as institutionalize and bring learning to the
individuals and apply it in the organization.
4- Challenges facing the creation of learning organization at the Egyptian service
sector.
The service sector is one of the three economic sectors; others include manufacturing
sector and agriculture sector. According to Oyejide and Bankole (2001) the service sector has
emerged as the dynamic sector whose importance has steadily reason in most economies since
the 1990’s and 2000’s. The service sector has continued to represent 60% of Gross National
Product (GNP) in most developed and developing countries -as Egypt- while having influence
on other sectors. Whereby the demand for services is relatively income elastic, as the economy
grows the consumption of services increases. The service sector is also important because it
provides support services to other sectors; for instance, it provides the manufacturing sector
with designs, transportation, financing and communication. The service sector is also known to
provide the economy with the highest rate of employment which in turn results in growth and
development of the economy. With the steady growth in this sector the level and intensity of
competition also increases as companies strive to gain a larger share of the market. Appelbaum
and Gallagher (2000) note that the recent shift away from manufacturing and towards service
has created a sense of urgency for organizations to tap into their intangible resources-
knowledge, skills and resources.
Egypt's economy is the second largest in the Arab world (after Saudi Arabia) and its
economic sectors reflect its size. The service sector is by the far the largest and fastest-growing
economic sector and accounts for almost 51 percent of GDP. Tourism, trade, banking, and
shipping services on the Suez Canal constitute the main sources of service sector revenue. since
2011 and till now Both tourism and the Suez Canal were hit hard by political uprisings and
terrorism challenges; which affect the economic climate in Egypt and make the foreign visitors
as well as investors staying away from the country. The government has moved to aggressive
promotion of domestic tourism to compensate for the loss of foreign tourism, and managed to
restore more than 60 percent of the pre -2010 tourist traffic by late 2015 (Egypt government
service portal). Meanwhile, the prospects of recovery in the Suez Canal sector, however, have
been less promising, with growth in that area rather slow, despite government plans to revive it
by digging the new branch of Suez canal and launching the newly economical development
zone there. Therefore recently, the rank of Egypt is retreated at the competitiveness index to
119 among 144 countries (global Competitiveness Report 2014-2015).
Hence, the government must strive to convert their traditional non-learning organizations into
learning organizations; able to create the effective knowledge sharing system. Such
organizational learning process is necessary to engender the appropriate intellectual capital;
leading to sustainable competitive advantage. Thus, firms working in the Egyptian service
sector can be able to improve their real and perceived market value.

233
Unfortunately, there are many challenges that may impede the Egyptian attempt to create
effective learning organizations to its service sector organizations; such challenges can be
classified into internal and external challenges.
4.1 Internal challenges
Such type of challenges shed light on the discrepancies that may exist within the internal
environment of the Egyptian organizations working at the service sector and can impede its
transformation to learning organizations; such challenges can be controllable by the
organizations management, they are as follows ( Handousa, 2010; Omran,2013; Yassin, 1994)
:
- Leadership does not set the example learning: The idea of organizational learning is
not championed and lessons experience are not incorporated.
- Management is insular: Management is isolated from the rest of organization and the
external environment.
- Management is arrogant, ignorant and complacent: Strong egos and previous success
cause managers not to be willing to recognize or admit their mistakes.
- Poor top – down: Information is provided on a need-to-know basis, with little
explanation.
- Not soliciting ideas: Management is unwilling to seek good ideas from employees.
- Lack of upward communication: Upward communication is ignored or channels are
blocked, and management considers constructive criticism to be an insult to existing
processes.
- lack of organizational culture supportive for learning and knowledge management
adoption.
- Lack of empowerment to learn and change: Lower-level employees are not encouraged
to experiment with new approaches or initiate change.
- Ineffective mental models: Management is not up to date with current realities and is
unwilling new possibilities and try different approaches.
- Preoccupation with the short term bottom line: Management focuses on cutting costs
to enhance current profitability rather taking the time to learn and invest in the future.
- Lack of holistic approach to change: Changes are either too few, too many, too late or
not implemented well.
- Lack of communication about change: Management does not provide sufficient
communication before, during, or after change.
- Fear and anxiety about change: Management’s fear of looking bad causes it not to ask
for advice from others.
- Change in leadership: Turnover, rotation, restructuring and the general lack of
continuity causes employees to resist change.
- Inadequate training: Top management does not provide sufficient time and funding for
job-specific and advancement-related training.
- Inadequate system for knowledge acquisition and sharing: There is no common
database to contribute, store, access and disseminate information.
- Unwillingness to use appropriate technology: Managers and employees do not embrace
new technology, including capitalizing on the full value of the internet.
- Lack of multidirectional communication: Departments are not communicating with
each other.
- Lack of performance measurement and accountability for poor performance: People
who do exceptional work are not rewarded and those who do poor work continue doing
poor work.
4.2 External challenges
Such type of challenges represent the external barriers that may affect negatively the
transformation of the organizations working at the service sector in Egypt, such barriers exit in

234
the external environment surrounding the organizations, they are uncontrollable by the
organization. In other words, such barriers had to be handle via outer actor as the government
and other societal agencies. These barriers are as follows:
4.2.1 Lack of Political Foresight and Commitment
The foresight and commitment of political leadership work as driving forces to implement
the learning organization model in service sector. In Egypt, few political governments tried to
reform the service organizations in order to establish the principles and elements of learning
organization (Omran, 2013). The reasons include: a lack of knowledge about the learning
organization and the organizational learning methodologies, the mentality of lengthening the
power, the lack of commitment and the fact that political leadership has never been cordial in
their attempt to revamp the running system of the non- learning organizations into learning
organizations; able to adapt with the external environment and produce the appropriate
intellectual capital, that yields the intended sustainable competitive advantage at the service
sector market (Fawzy Henien,2007; Khan, 1998).
4.2.2 Incapability of the Governments
The government needs capacity and concerted efforts to apply the learning organization
model in the service sector through reforms. For decades, almost all governments in Egypt have
miserably failed to demonstrate an extraordinary capacity to realize the recommendations of
the reform committees regarding the necessity of the learning organization creation (Omran,
2015).
4.2.3 Corruption
Corruption is deeply rooted in all aspects of life in Egypt. The whole economical sector as
well as the service sector has been plagued by both political and administrative corruption in a
form of bribery, abuse of authority, nepotism, favoritism, patronage, theft, and deceit (Fadel,
M, 2011). These phenomena have already emerged as a factor impeding the learning
organization-style reforms in Egypt.
4.2.4 The retreat of society culture and awareness about knowledge importance
The values of learning and knowledge creation in the Egyptian society are almost fainted.
Thus, the societal organizations didn't advocate learning organization model to be adopted at
the service sector realm; in spite of its importance in the sustainable competitive advantage
creation (Egyptian Cabinet IDSC, 2011).
4.2.5 Deplorable information technology infrastructure
The information technology infrastructure in Egypt is still uncompleted. As Egypt began
from several years an ambitious project to apply the e.government; but unfortunately such
project is crippled by the red tapes, corruption, the shortage of technical and financial resources
(Ola M. Khawaga, 2007).
5- The reforming pillars necessary to create effective learning organizations at the
Egyptian service sector
Making the transformation to the learning organization, in the context of the
aforementioned effectiveness requirements, is challenging as technology and management
information systems may need to be upgraded, and employees must greatly improve their
knowledge of learning organization (Egyptian Ministry of Planning, 2012). The process
of becoming a learning organization requires the adoption of good governance indices -as
participation accountability, transparency, etc...- as well as the new service management
principles (market oriented) by the organization. In short, the learning organization creation in

235
the Egyptian service sector requires the adoption of some important reforming pillars -as a
prerequisite- to overcome the aforementioned challenges and barriers. In this context, it is
important to differentiate between these reforming pillars, whereby some of them are internal
related to the organization management approach and techniques, and others are external related
to the progress of the external societal forces that surround the organization affecting its works.
5.1 The internal reforming pillars:
Such pillars are essential to transform non-learning organizations into learning
organizations; able to share knowledge and to create the appropriate intellectual capital. Then,
to engender the value stream which yields the sustainable competitive advantage in the service
sector in Egypt. These reforming pillars had to be fulfilled in the first place by the management
of the organization itself to overcome the aforementioned internal challenges. Such pillars tend
to revamp the structures (restructuring), the activities and the procedures (reengineering) and
the people (human resource approach) within the organization. On other words, they focus on
the governance of the organization. The occurrence of such reforming pillars is essential to
create the intended learning organization. Such pillars represent the motivator factors that yield
learning organizations; they are as follows:
5.1.1 Managerial reform
The intended managerial reform key elements in Egypt must include various forms of
decentralizing management, the creation of autonomous agencies and devolution of budgets
and financial control, increasing use of markets and competition in the provision of services
(e.g., contracting out and other market-type mechanisms), and increasing emphasis on
performance, outputs, outcomes and customer orientation (Larbi, 1999). Thus, The traditional
model of organization and delivery of services, based on the principles of bureaucratic
hierarchy, planning, centralization, direct control and self-sufficiency, as in the case of Egypt,
is being replaced by a market-based service management, or enterprise culture (Caiden, 2001).
Conclusively, the key elements of Management reform to be applied in Egypt realizing the
learning organization model had to be as follows (Pollitt, 1994) (Lynn, Laurence E., Jr., 1996)
(Cyril Kirwan, 2013):
1. The necessity for leaders (at all organizational levels) to apply the strategic management
methodology and to share their strategic visions (sharing leaders). This should result in better
performance because activities can be directed more precisely towards the goals, but also
because the more people that understand and share the vision, the greater will be the amount of
learning.
2. A shift in the focus of management from inputs and processes towards outputs and
outcomes, therefore, adopting the result based management is a must. Whereby an emphasis on
measurement and quantification is essential, especially in the form of systems of ‘performance
indicators’ and/or explicit ‘standards’.
3. The creation of a learning structure that is flexible and adaptable to changes in the
external environment . This structure should facilitate the creation, retention and transfer of
practical knowledge that can be used within and across organizational boundaries. Then, the
preference of lean/flat and autonomous organizational forms: decentralization (i.e. let the
managers manage / the right of managing).
4. More frequent deployment of market-type mechanisms (MTMs) for the delivery of
services (quasi-market solutions, compulsory competitive tendering).
5. Favoring contract-like relationships instead of hierarchical relationships.
6. Client and quality orientation; by generalize the E. government usage to all the kind of
services to ensure a quick responsiveness to people needs and desires.
7. Applying lean thinking methodology to services management; by maintaining an
effective value stream of value-added activities to satisfy citizens/clients needs in high quality,
lower cost and minimum time.

236
8. Adopting an organizational culture espousing values as inquiry and dialogue necessary
to create a learning climate in the organization, where personal mastery, self-development for
everyone, education and training and continuous learning (primarily experiential) are
embedded in the way the organization goes about its business. This type of climate also
encourages experimentation, empowerment and dialogue and structures teams so that they work
with and learn from each other. The strength of a learning climate will also be seen in
psychological safety, in time given for reflection and in shared leadership and involvement.
9. The organization must provide strategic leadership for learning. Leaders have to model,
champion and support learning, and must use learning strategically for business results.
10. Adjustment of staffing systems, training and human development sessions to enhance job
effectiveness, efficiency and employees' satisfaction. So, the right person who is capable, and
convinced to apply the learning organization principles and the organizational learning process;
will fill into the right post.
11. Create an effective code of ethics that advocates the learning organization values and
principles, in order to make the organizational culture supportive for learning organization
adoption within the service sector organizations.
12. Managerial leaders' commitment to apply learning organization principles and the
organizational learning strategic framework in the service sector will ease the implementation
of organizational learning policies and procedures; and also will diminish the employees'
resistance.
5.1.2 Partnership
In development co-operation, as service firms in Egypt, learning organization has to be
built on mutually beneficial partnership relationships based on trust among the stakeholders
involved in the learning intervention (Garvin & others, 2008). On other words, it is important
to encourage collaboration and team learning. What this means for the organization is that work
is designed to use groups to access different modes of thinking. Groups are expected to work
and learn together, and collaboration is valued and rewarded.
5.1.3 Accountability
Determining accountability should take into consideration the nature of the partnerships
in the learning intervention. Where strong partnerships are present, an organizational learning
process starts with shared performance expectations, continues with shared management
decision making and leads eventually to share accountability. There is a requirement to
empower employees in the learning organization toward a collective vision. Individuals in this
organization become involved in setting, owning and implementing this vision. Responsibility
is distributed close to decision making so that people are motivated to learn toward what they
are held accountable to do (Watkins & Marsick,1993). Thus, It is essential to connect the
organization to its environment. Individuals are helped to see the effect of their work on the
entire enterprise. In doing this they scan the environment and use information to adjust work
practices, and the organization is linked to its communities.
5.1.4 Transparency
Transparency is necessary to ensure the creation of information technology systems
within the service organizations to capture and share learning. Both high- and low-information
technology systems to share learning are created and integrated with work. Of particular
importance is that access is provided to these systems, and that they are maintained. Then, the
benefits of the learning organization principles are fully realized. Clarity is needed in defining
the respective roles and responsibilities of partners for the learning intervention, and
specifically the implementation of the organizational learning process (Peddler & others, 1991).
Appropriate disclosure of the methodologies used to create and share knowledge is critical to
create continuous learning opportunities. In learning organizations, learning is designed into

237
work so that people can learn on the job and opportunities are provided for ongoing education
and growth.
5.2 External reforming pillars
Such pillars are important to ensure the propagation of the learning organization thinking
in the society and to enhance its adoption as a managerial philosophy at the public and private
organizations working in the service sector in Egypt. These reforming pillars had to be fulfilled
in the first place via the government and other societal stakeholders -as the legislative authority
and the various civil society organizations- to overcome the aforementioned external
challenges. The occurrence of such reforming pillars help to create the intended learning
organization; but it is not enough to be solely, it must incorporate with the other aforementioned
internal reforming pillars. such pillars represent the hygiene system that enhance the creation
of learning organizations; they are as follows:
5.2.1 Legislative and legal reforming:
Legislations must be issued to modify the law of service corporation in Egypt to encourage
-via various economic incentives- the transformation of non-learning organization into learning
organization; able to produce, disseminate and share the necessary knowledge to realize the
sustainable competitive advantage. Moreover, it is essential to modify some laws to ease the
adoption of the learning organization in the service sector as the Egyptian laws for budgeting,
governmental accounting, financial and managerial auditing to become outcomes/results
oriented instead of being processes/regulations oriented. Also, we had to modify the
anticorruption and civil service laws, and also the employment laws in Egypt; to reconsider the
current rewards, incentives, promotions and penalties systems to be based on results
performance instead of rules/ regulations compliance. Finally, the current laws in Egypt had to
be reviewed by legal experts committees; to avoid any legal contradictions that may impede the
adoption of the suggested modifications on the aforementioned laws to the Egyptian socio
economical, political and cultural environment.
5.2.2 The completion of the information technology infrastructure
The information technology infrastructure in Egypt had to be completed. Especially, the
e.government matrix; whereby the government had to provide -for the achievement of such
important project- the necessary technical and financial resources.
5.2.3 Societal cultural awareness and training:
Various training programs and media campaigns in Egypt had to be designed and executed
to inform publics and employees about learning organization important role in the realization
of development objectives and its constructive effects on the community. In order to avoid their
potential resistance for learning organization model adoption at the service sector, and to make
individuals and institutions aware about relevant organizational learning procedures (Moore,
Mark, 1995). Hence, Different stakeholders in the Egyptian society such as families, media
institutions, various governmental apparatus, religious and educational institutions, and civil
society organizations must cooperate together and integrate their efforts. Then, they may be
able to create the effective partnership necessary for the application of organizational learning
strategic framework necessary to produce the suitable intellectual capital, yielding the intended
sustainable competitive advantage (Goh, 1998).
5.2.4 Political commitment
The foresight and commitment of political leadership had to work as driving forces to build
effective networks of partners in a good governance context; to implement effectively the
learning organization model in the service sector realizing its sustainable competitive
advantage; which is essential for the economical development of the society.

238
6- Conclusion
We note after the previous analysis that the service sector in Egypt need to be deregulated,
transforming the traditional non-learning organization into a new learning organization is a
must; to hold managers accountable for the creation and sharing of knowledge all over the
organization, via an effective organizational process, to engender the appropriate intellectual
capital; which can be a decisive tool to produce the necessary value stream; that may represent
the organizational sustainable competitive advantage. This is a fundamental change: from non-
learning organization in terms of traditional procedural compliance, to learning organization in
terms of efficiency and results (effectiveness and cost effectiveness), whereby an effective
organizational process takes place to make such organization adaptive with the surrounding
organization and productive of a value stream knowledge; that yields the intended sustainable
competitive advantage.
Accordingly, by analyzing the identified learning organization concepts and core
perspectives, the effective learning organization requirements were as follows: a sense of shared
vision had to be apparent in all the organizational levels to make use of learning opportunities
that arise from the challenges it faces, The organizational structure had to be flexible and
adaptable to changes in the external environment to facilitate the creation, retention and transfer
of practical knowledge that can be used within and across organizational boundaries, the
adoption of a learning climate where personal mastery, self-development for everyone,
education and training and continuous learning (primarily experiential) are embedded to
encourages experimentation, empowerment and dialogue and structures teams so that they work
with and learn from each other, The importance to encourage collaboration and team learning
where groups are expected to work and learn together, and collaboration is valued and
rewarded, the creation of information technology systems to capture and share learning, It is
essential to connect the organization to its environment. Individuals are helped to see the effect
of their work on the entire enterprise.
Moreover, Six cycled steps constitute the organizational learning process strategic
framework are suggested to be used in the Egyptian service sector. Such strategic framework
will begin firstly with the definition of internal and external actors who create and consume
knowledge (the learning community vision and mission). Secondly, the identification of the
learning needs and the information that seems relevant to learning to the creation (generation)
of new knowledge, or both in the context of the internal and external environment factors
relative to the organization (learning strategic goals). Then, the third step is to maintain the
exchange and diffusion of knowledge, either from the individual to the collective level or at the
collective level itself by identifying the high value sources of knowledge (learning priorities
and plans). The fourth step is The integration of knowledge into existing knowledge systems at
a collective level, an individual level, or both, or into procedural rules of the organization
(learning policies and programs). The fifth step, The transformation of the new knowledge into
action and the reapplication of the knowledge into organizational routines (learning action
plan). Finally, Align resources such as staffing, incentives and support to new knowledge
capabilities creation to ensure its effectiveness; by monitoring and evaluating periodically the
organizational learning process (learning evaluation and feedback).
Unfortunately, there are diverse challenges -as we aforementioned- to the creation of an
effective learning organization at the Egyptian service sector. Such challenges can be classified
into internal and external challenges. Consequently, in order to overcome such challenges it
necessitates the adoption of various reforming pillars relying on good governance indices and
market-oriented service management; such pillars can be classified into internal reforming
pillars as: Managerial reform, partnership, accountability and transparency; and external
reforming pillars as: legislative and legal reforming, societal cultural awareness and training
and political commitment.
Finally, we conclude hereby that an organization’s ability to learn and translate that
learning into innovative action rapidly, is the ultimate competitive advantage. The learning
organization is the structure that facilitates the abovementioned competitive advantage, it

239
empowers employees, it enriches and enhances the customer experience and collaboration with
key business partners and ultimately boosts business performance. Organizational learning is
considered as the suitable strategic process to develop knowledge resources and intellectual
capital (human capital, social capital and organizational capital) that engender ongoing values;
which in turn yield persistence superior performance; which lead to sustainable competitive
advantage.
References:
- Aaker, D. (1989). Managing assets and Skills: the key to a sustainable competitive
Advantage, California Management Review, 31, 2: 91-106.
- Barney, J. B. (1991). Firm resources and Sustained competitive advantage. Journal
of Management, vol. 17, no.1, pp. 99-120.
- Barney, J. B. (1995). Looking inside competitive advantage. Academy of
Management Executive, vol.17, no. 4, pp. 49-61.
- Collis, D. J., and Montgoemry, B. (1995). Competing on Resources strategy in
1990’s. Harvard Business Review, July-August, pp. 118-128.
- Cook, S. D., and Yanow, D. (1993). Culture and Organizational learning. Journal of
Management Inquiry, vol. 2, pp. 373-394.
- Dodgson, M. (1993). Technological learning, technology strategy and competitive
pressures. British Journal of Management, vol.2, p. 3.
- Hoffman, N.P. (2000). An Examination of the Sustainable Competitive Advantage
Concept: Past, Present, Future. Academy of Marketing Science Review, 2000, p. 4.
- Hoyle, E.(1995).‘The school as a learning organization’, paper presented at the
- AERA Conference, San Francisco, CA, April, pp, 5-12.
- Marshall, J., Smith, S. and Buxton, S. (2009). ‘Learning organization and
- organizational learning: What have we learned?’, Management Services, Vol. 53
No.
- 3, pp.36-43.
- John I. Njuguna, Strategic positioning for sustainable competitive advantage: an
organizational learning approach, KCA journal of business management, vol. 2,
issue 1 2009, pp.32-44.
- Murray, P. and Donegan, K. (2003). ‘ Empirical Linkages between firm
competencies
- and organizational learning’, The Learning Organization, Vol. 10 No.1, pp. 51-62.
- Smith, I.W. (2004), ‘ Continuing professional development and workplace learning
6:
- HRD and organizational learning’, Library Management, Vol.25, No.1, pp. 64-66.
- Senge, P. (1990) The fifth Discipline: The Art and Practice of the Learning
- Organization, New York: Doubleday, pp. 11-15.
- Senge, P.M. (1990), ‘The Leader’s New Work: Building Learning Organizations',
- Sloan Management Review, Fall, pp.7-23.
- Trim, P.R.J. and Lee, Y. (2004). ‘Enhancing customer service and organizational
- learning through qualitative research’, Qualitative Market Research: An
International
- Journal, Vol. 7 No. 4, pp. 284-292.
- King, W.R. (2001). ‘Strategies for creating a learning organization’, Information
- Systems Management, Vol.18, No. 1, pp. 12-20.
- Pedler, M., Burgoyne, J. and Boydell, T. (1991). The Learning Company. A
strategy for sustainable development, London: McGraw-Hill, pp. 3-5.
- Watkins, K. and Marsick, V. (1992) ‘Building the learning organization: a new role
for human resource developers’, Studies in Continuing Education vol. 14, no. 2, pp.
115-29.

240
- Watkins, K. and Marsick, V. (eds.) (1993,) Sculpting the Learning Organization.
Lessons in the art and science of systematic change, San Francisco: Jossey-Bass,
pp. 37-49 .
- Yang, B., Watkins, E. K., & Marsick, J. V. (2004). The construct of the learning
organization: dimensions, measurement, and validation. Human Resource
Development Quarterly, Vol. 15, 1, pp. 31–55.
- Garvin, D. A. (1998) “Building a learning organization”, Harvard Business Review
on Knowledge Management. Boston, MA: Harvard Business School Publishing,
47-80.
- Garvin, D. A. (2000) Learning in Action. A guide to putting the learning
organization to work, Boston, Mass.: Harvard Business School Press, pp. 74-82.
- Goh, S.C. (2003). Improving Organizational Learning Capability: Lessons Form
Two Case Studies. The learning Organization, vol.10, no. 4, pp. 216-227.
- Kirwan, Cyril, Making sense of organizational learning : putting theory into
practice, Gower Publishing Limited, UK, 2013, pp. 75-95.
- Garvin, Edmondson and Gino (2008), Is Yours a Learning Organization? Harvard
business review, March 2008, pp. 1- 10.
- Graham, C.M. and Nafukho, F.M. (2007), ‘Employees’ perception toward the
- dimension of culture in enhancing organizational learning’, The Learning
- Organization, Vol. 14 No. 3, pp. 281-292.
- Blackman, D. and Henderson, S. (2005), ‘Why learning organizations do not
- transform’, The Learning Organization, Vol. 12 No.1, pp. 42-56.
- Garavan, T. (1997), ‘The learning organization: a review and evaluation’, The
- Learning Organization, Vol. 4, No 1, pp. 18-29.
- Sun, P. Y. T., Scott, J. L. (2003), ‘Organizational learning and learning
organization’,
- The Learning Organization, Vol. 10, No.4, pp. 202-215.
- Stewart, J. (1996). Managing Change through Training and Development. London:
Kogan Page, pp. 56-71.
- Lipshirtz, R. (2000). Cited by Sun, P. Y., and Scott, J. L., (2003), Exploring the
divide Organizational learning and learning Organization. The learning
Organization, vol. 10, no. 4, pp. 202-215.
- Miller, D. A. (1996). A preliminary typology of Organizational learning:
Synthesizing the Literature, Strategic Management Journal, vol. 22, pp. 484-505.
- Lopez, S. P., Peon, J. M., and Ordas, J. V., (2005). Organizational Learning as a
Determining Factor in Business Performance. The Learning Organization, vol. 12,
no. 3, pp. 227-245.
- Huber, G. P. (1991). The Contributing Processes and the Literatures, Organization
Science, vol. 2, no. 1, pp. 88-115.
- Dale, W. (1994). Learning Organizations in Managing Learning. London:
Routledge, pp. 22-31.
- DeNisi, A. S., Hitt, M. A., and Jackson, S. E. (2003). The Knowledge Based
Approach to Sustainable Competitive Advantage. New York: Oxford University
press, pp. 38-49.
- Nevis, E. C., Debila, A. J., and Gould, J. M., (1995). Cited by Lopez, S. P. et al,.
(2005). Organizational Learning as a Determining Factor in Business Performance.
The Learning Organization, vol. 12, no. 3, pp. 227-245.
- Winter, S. (2000). The Satisfying Principle in Capability Learning, Strategic
Management Journal, vol. 21, pp. 981-96.
- Pawlowsky, P. (2003) “The Treatment of Organizational Learning in Management
Science”, In Dierkes, Antal, Child and Nonaka (Eds.) Handbook of Organizational
Learning & Knowledge. Oxford: Oxford University Press, pp. 62-88.
- Katie Smith Milway, Amy Saxton, The Challenge of Organizational Learning,
Stanford, social innovation review, May 20, 2011, pp. 1-8.
241
- Omran,Wael, A framework for results based management to the public sector in
Egypt: challenges and opportunities, Journal of Public Administration and
Governance, 2015, Vol. 5, No. 4, pp. 8-11.
- DeNisi, A.S. (2000). Performance appraisal and performance Management: A
multilevel analysis. In K. Klein and S. Kozlowski (Eds.) Multilevel theory,
Research and Methods in Organizations. San Francisco: Jossey–Bass, pp. 11-18.
- Teece, D., Pisano, G. and Shuen, A. (1997) “Dynamic capabilities and strategic
management”, Strategic Management Journal, vol. 18, no. 7, pp. 509-534.
- Armstrong, M. (2001), A Handbook of Human Resource Management and
Practices. London: Kogan Page, pp. 43-46.
- Ghoshal, F., and Morgan, L. K. (1996). Cited by DeNisi, A.S., Hitt,M.A., and
Jackson, S. E.,(2003). The Knowledge Based Approach to Sustainable competitive
Advantage. New York: Oxford University press, pp. 24-26.
- Spender, J. C., and Grant, R. (1996). Knowledge and the firm: Overview. Strategic
Management Journal, Special Issue, pp. 5-11.
- Stata, R. (1989), Organizational learning: The key to management innovation.
Sloan Management Review, vol. 30, Spring, pp. 63-74.
- De Geus, A. (1988), Planning as learning, Harvard Business Review, vol. 66, pp.
70-74.
- Nonaka, I. (1991). The knowledge-creating company. Harvard Business Review,
vol. 69, no. 6: pp. 96-104.
- Autio, E., Yli – Renko, H., and Sapienza, H. J. (2002). Social Capital, Knowledge
Acquisitionand Competitive Advantage in Technology –Based Young Firms.
Strategic Management Journal, Special Issue on Entrepreneurial Strategies and
Wealth Creation in
- the 21st
Century, pp. 12-20.
- Coleman, J. (1998). Social Capital in the creation of Human Capital. American
Journal of Sociology, vol. 94, pp.95-120.
- O. Oyeniyi, organizational learning and sustainable competitive advantage, journal
of economics and business research, vol. 27, no.1, 2011, pp. 102-117.
- Crossan, M. and Hulland, J. (2002) “Leveraging Knowledge through Leadership of
Organizational Learning”, In Choo and Bontis (Eds.) The Strategic Management of
Intellectual Capital and Organizational Knowledge, New York: Oxford University
Press pp. 711-723.
- March, J. (1991) “Exploration and Exploitation in organizational learning”,
Organization Science, vol. 2, pp. 71-87.
- Crossan, M. (2004) “Old wine in new bottles”, Impact - Management Research in
practice - an online monthly research publication by the Ivey Business School,
(May), vol. 8, no. 4, pp. 3-11.
- Oyejide, A.T. and Bankole, A.S. (2001), ‘Liberalization of the services sector in
- Nigeria: Implications of unilateral and multilateral approaches. Nigeria: AERC,
pp.13-19.
- Steven H. Appelbaum, John Gallagher, (2000) "The competitive advantage of
organizational learning", Journal of Workplace Learning, Vol. 12, no. 2, pp.40 - 56.
- Fawzy Henien, S., Egypt: Bad Blood’, in Jonathan Werve and Global Integrity (eds),
The Corruption Notebooks, Washington DC: Global Integrity, 2007.
- Porter, M. E. (1985). Competitive Advantage; Creating and Sustaining Superior
Performance. New York: The Free Press, pp. 23-35.
- Sinkula, J. M. (1994). Market Information Processing and Organizational Learning.
Journal of Marketing, 58, January, pp. 35-45.
- Rebelo, T.M. and Gomes, A.D. (2008), ‘Organizational learning and the learning
- organization: Reviewing evolution for prospecting the future’, the learning
- organization, Vol. 15 No. 4, pp. 294-308.

242
- Khan, Administrative Reforms in Bangladesh, Dhaka: University Press Limited,
1998, pp. 10- 22.
- Yassin, E. (ed.), Egyptian Bureaucracy, an Empirical Study, Cairo: Al Ahram
Center for Political and Strategic Studies, 1994, pp. 12-15.
- Fadel, M., Public Corruption and the Egyptian Revolution of January 25: Can
Emerging International Anti Corruption Norms Assist Egypt Recover
Misappropriated Public Funds? Harvard International Law Journal Online, Vol. 52,
2011, pp. 11- 19. www.harvardilj.org/online/ (accessed 5 October 2011).
- Ola M. Khawaga, challenges and opportunities for e. government application in
Egypt , Cairo university, faculty of economy and political sciences, economical
research and studies centre, economical papers, vol. 35, 2007, pp. 5-9.
- Omran, Wael, Bad Governance and Failure of Development Progress in Egypt:
Causes, Consequences and Remedies, Journal of Public Administration and
Governance, Vol. 3, No. 4, 2013, pp. 39-59.
- Egyptian Cabinet IDSC (Information and Decision Support Centre) Egyptian
Consumer’s Trust Index in Economic Performance, 2011.
- Larbi, George A., The New Public Management Approach and Crisis States,
UNRISD Discussion Paper, No. 112, Geneva, Switzerland, 1999, pp. 2- 15.
- Lynn, Laurence E., Jr., Public Management as Art, Science and Profession,
Chatham, NJ: Pittsburgh, PA University of Pittsburgh Press, 1996, pp.35-39.
- Caiden, N., “Public Service Professionalism for Performance Measurement and
Evaluation, Public Budgeting and Finance, vol. 18, no. 2, 1998, p.35.
- Pollitt, C., Modernizing the Management of the Public Services Sector: Between
Crusade and Catastrophe?” Paper Presented to the Administrative Development
Agency, Helsinki, Finland, 1994, pp. 23-42.
- Moore, Mark, Creating Public Value Strategic Management in Government,
Cambridge, MA: Harvard University Press,1995, pp.46-51.
- Egyptian Ministry of Planning ,The Strategic Framework for Economic and Social
Plans in Egypt till 2022, A Proposition Paper, 2012, pp. 2-44.
- www. Egypt government service portal.com (accessed 27/12/2015).
- www. global Competitiveness Report .com (accessed 11/12/2015).

243
A Framework for Implementing Knowledge
Management in E-Government
Issa Shehabat Emad Abu-Shanab
Yarmouk University Yarmouk University
Jordan Jordan
Abstract:
The adoption of e-government initiatives is faced by many challenges ranging from
technical, legal and behavioral. This paper will explore the literature to see how the research
community perceive the influence of knowledge management practices on the adoption and
success of e-government. Such influence will revolve around the power gained/lost by public
employees. The paper proposes two frameworks that depicts the overall perspective of the
interaction of e-government environment and knowledge management practices and processes.
The frameworks will provide a guide for researchers to help in utilizing knowledge
management into public sector practices. A conceptual analysis of such environment will be
explored and discussed.
Keywords: K-Government, E-government, knowledge, knowledge management, power,
public employees, Framework
Introduction
The new applications in e-government contributed to the improvement of the level and
cost of services provided to citizens and businesses. Such evolvement encouraged countries to
deploy such applications and projects and try to advance the level of adoption by citizens and
public employees. The adoption of e-government projects faces many challenges like the
technology needed and infrastructure in the country, the adequacy of legal framework, and the
behavioral issues facing such projects from citizens and employees perspective. It is vital for
governments to utilize such systems and improve it take-up regardless of its influence on a
specific category of stakeholders.
The requirements of e-government success necessitate the reengineering of some services
and the standardization of its implementation. Based on that, the knowledge acquired by public
employees is vital in the process of understanding its implementation success. Such knowledge
resides within public employees administering it since decades, where they will resist
surrendering such knowledge based on the resulting loss of their power. Research indicated that
risk of sharing knowledge is a challenge for spreading new innovations (Saleh & Abu-Shanab,
2010). Such dilemma requires a conscious effort to encourage public servants to buy into such
initiative (i.e. e-government) and share their knowledge related to their work and experience.
Losing the power of knowledge is the major concern of public employees, where governments
are facing some resistance in this regard.
This paper will try to explore the literature related to e-government and its requirements,
and how its implementation risks the public employees’ power. The second section in the
literature will review the work related to knowledge management and how we can acquire such
embedded knowledge and standardize it. Finally, the last section will explore the link between
such knowledge issue and the adoption of e-government projects. Section 3 will describe the
research methodology adopted. Section four will illustrate the data and the analysis process and
discuss the results. Finally, section five will include our conclusions and future work proposed.

244
Literature Review
The adoption of e-government is faced by many obstacles that range from technical, legal
to behavioral types. This limits its adoption and portrays the project to be a partial or total
failure. Governments need to bridge all obstacles facing the project and among them the human
adoption of such projects. Research in the area of e-government, where public employees are
the sample, is rare. This study will try to explore such area and see if the resistance to e-
government projects stems from public employees being overly protective with knowledge
sharing. The following sections will introduce e-government concept, knowledge management
concept, and the literature related to the obstacles among public employees towards sharing
their knowledge to promote the e-government process.
E-government concepts
E-government is defined as the application of information and communication technology
(ICT) and the Internet to offer digital services to citizens (World Bank, 2007; Bhatnagar, 2004),
improve the existing traditional ones (Heeks, 2008), and empower citizens to a better
participation in the democratic process (Yanqing, 2010). E-government is known for its
contribution to the public sector’s performance and the substantial improvement in service
provision (Jahanshahi et al., 2011; Abu-Shanab, 2013).
The most commonly known models related to the parties involved in the transactions
conducted through e-government portals are the following: 1) transactions between the
government and citizens (called G2C), 2) transactions between the government and businesses
(called G2B),and 3) transactions between the different constituents of government (called G2G)
and even its employees (G2E). Such classification is similar to the one adopted by the e-
commerce literature (Riad et al., 2010; Al-Naimat et al., 2012). A similar classification is
adopted but for the mobile government environment (Mengistu et al., 2009; Bataineh et al.,
2009; Deep & Sahoo, 2011).
The e-government concept was produced in the early 1990s and continued to evolve and
expand to include services, democracy, and social development. The United Nations issues an
e-government related report each two years, where their latest report indicated that most
countries of the world had some type of existence on the web, and published information
regarding their services (UNDESA, 2014). Still many countries lag in their progress in the last
two stages (transaction and transformation). Such issue requests more research to understand
the reasons behind such issue.
E-government success requests significant efforts in reengineering the process of
completing a service. Digital services offered by government are characterized by being
standard, short, authorized, and decentralized. The SPRINT methodology was utilized in e-
government projects to understand the process changes needed in this context (SPRINT is
Salford Process Reengineering Involving New Technology). Kawalek and Wastall (2005) used
the SPRINT method in three cases of e-government, and concluded that public organizations
prefer a less radical change process in their operations. The results of the previous research
indicate that public employees would not easily accept the radical changes required by the
reengineering process associated with e-government initiatives.
Another aspect of the reported literature is related to the corruption of public employees.
Abu-Shanab (2013) reported in his book that reducing corruption is a major contribution of e-
government projects. In another article, Abu-Shanab and his colleagues conducted a CFA
utilizing 390 responses from Jordanian citizens regarding a list of 21 items related to the factors
associated with corruption. Their results yielded three major dimensions: public performance
efficiency, transparency, and citizens’ satisfaction with public service (Abu-Shanab, Harb &
Al-Zoubi, 2013). More research emphasize that the Internet would open doors for eliminating
corruption (Lio et al., 2011), and e-government adoption will reduce corruption (Anderson,
2009). Other researchers proposed designing anti-corruption e-government systems (Kim et al.,
2009) to reduce corruption and increase transparency.

245
The previously mentioned UN e-government evolutionary stages can be aligned with their
key success focus areas. Figure 1 depicts our proposition in this regard. It is obvious that
transparency is a major focus when dealing with public information. Public data and
information can be shared with external parties (like citizens and businesses) free of charge and
on public portals. Such perspective is not always respected by public employees, which causes
some resistance to e-government projects. The resistance to change needs a strong leadership
and support for such projects or they will be doomed by failure.
Figure 1: E-government focus evolutionary model
In conclusion, e-government projects are vital national projects that support the
development of an open channel for service provision and social development. E-government
can be considered as the corner stone of reaching citizens and satisfying their service
requirements. Such projects require significant changes in the way governments and their
employees work, thus facing some resistance from public employees. One of the shapes of
resistance can be in the form of resisting knowledge sharing among e-government champions
and experts or public employees. The following section will introduce knowledge management
and its processes and dimensions.
Knowledge and its resources
Different types of contemporary organizations are facing a surge of transitions and
accelerating changes sweeping today’s world, on top of informatics and technical evolution.
This evolution relies on advanced scientific knowledge and the best use of information flow
resulting from the big developments in the information and communications technology (ICT)
in the world and Internet applications. As a result of these transitions, knowledge has become
one of the most significant strategic sources; moreover, it has become the strongest, most
influential, and dominating factor in an organization's success or failure (Schwandt & Marqurdt,
2000).
The other concept of knowledge is its holistic view. Through the components underlying
the phenomenon, this context is defined by Sowa as “the possession and inventory determinants
implicit and tacit (phenomenon) on the subject or specific operations, and the relationships to
their own procedures for positions that are dealt with” (Turban & Aronson, 1998, p. 202). With
any knowledge that reflects the experience and underlying expertise (implicit) of ideas, selves,
values, and estimates associated with people, the dynamics can be achieved by the completion
of interdependence and communication systems and relationships with the phenomenon.
According to Probst et al.’s view (2001, p. 7), the concept of knowledge “includes, in
addition to the reports and memoranda, the experiences of workers, their skills and the result
outcomes from assembled in groups and teams integrated”. Knowledge, according to this
concept, is a mix of tangible objects, such as reports and memos, and other intangibles that lie
246
in the individual’s skills and experiences. Perhaps the most important characteristic of this
concept is referring to the added value that represents knowledge, which produces a compilation
of individuals in groups and integrated teams. More comprehensively, knowledge is defined as
“every piece of information, tacit or explicit, that can be recalled by individuals to accomplish
their tasks perfectly or make right decisions” (Kubaisi, 2002, p. 48). However, there are many
other objectives that seek achievement through knowledge, such as providing advisory services
to others, and improve the decision making quality (Khasawneh & Abu-Shanab, 2013).
In the view of certain management theories, the most important aspects of knowledge
related to physical and financial assets is when the knowledge becomes central and strategically
located. Such situation makes organizational success depends on its ability to collect, produce,
and sustain the continuation of the information that represents the anchor of knowledge.
Accordingly, the main advantage of knowledge is its ability to assist management to overcome
all the difficulties they face and to overcome constraints. In addition, an advantage is its
substantial role in the proper functioning of the organization.
Knowledge resources are known to be the objects from where knowledge emerges or
where knowledge is contained or gathered. Intelligence, learning, and experience define the
knowledge limits of individuals (Saffady, 2000). It can be obtained from books, movies,
databases, images, maps, flow charts, novels, or even observation of behavior. These resources
could be divided into two types: documented and undocumented. Undocumented knowledge is
thoughts in the minds of individuals. There are several methods in which knowledge is
acquired, including extensive team work, phone and other communication means, e-mails,
publishing legal documents, or communication through the Internet (Hislop et al., 2000, p. 6).
Knowledge is classified according to its humanitarian perspective into two main types:
tacit knowledge and explicit knowledge. It is generally accepted that literature supports both
types (Nanoka & Takeuchi, 1995; Duffy, 2000; Daft, 2006; Heisig, 2001).Explicit knowledge
is the knowledge individuals can share. It includes all the data and information that could be
obtained and stored. Examples include stored data and information related to policies,
procedures, programs, budgets, and documents related to the system, in addition to the basis of
correction, operation, and communication and its standards and various functional operations
(Hijazi, 2005, p. 66).The second type of knowledge, tacit knowledge, is often stored in the
minds of individuals. It is obtained from accumulated past experiences; in most cases it will
have a personal impression, which makes it difficult to acquire, as it is stored inside the mind
of the knowledge owner.
Knowledge management
The field of knowledge management (KM) is relatively new, particularly at the application
level. It has been recognized only in the past few years, and afterwards some standards as well
as a growing awareness of the benefits have been realized from its application. At the end of
the twentieth century, attention was drawn to this subject because at the time the components
involved in the management of knowledge needed to re-adjust the value that would be utilized
in the market to meet the needs of the customer in the face of rapid changes taking place. The
need to manage knowledge emerged because of the increasing growth and necessity to diagnose
the flexibility of organizational structures, which could not cope with rapid change in the market
(Soo et al., 2002, p. 1). Perhaps the increasing use of ICT led to the evolution of available
information, which is one of the reasons that stimulated the emergence of KM. It was not a
challenge limited to finding information on an order or a specific project, but how to search
through the information available to find the most useful information for a particular purpose.
Another method is the ability of the growing information and communications technology that
have assisted additional processing and retrieval methods to obtain the information on storage,
which is necessary to the user.
The concept of KM is considered a modern concept in management science. It has gained
increased interest in the last two decades that has led to the emergence of many definitions for
the concept, which vary depending on the specialties of the researchers and various

247
perspectives. To understand and define KM, there are three basic portals; the following is a
description of each (Malhotra, 2001, p. 232-249):
The Informational Portal includes data processing and the management of information flow
activities, database development, and documenting business activities in an organization.
The Technical Portal is concerned with building and developing KM systems based on
information technology systems, such as data mining, data warehousing, expert systems,
analytical processing systems, instant information systems based on the Web, and others.
The Cultural Portal is concerned with behavioral or intellectual dimensions of KM through
handling the fields of collective learning, lifelong learning, and building learning-oriented
organizations.
In all these portals, KM seeks to provide administrative solutions through investing in
knowledge resources, building memory for knowledge, and focusing on knowledge exchange
and participation through a systematic methodological portal.
Shehabat et al (2009) write that treating organizational knowledge as a valuable strategic asset
is popular and emphasize the importance of effectively create, locate, capture and share
organizational knowledge to remain competitive.
Knowledge management and e-government
Like any other organization, public sector organizations have their political process, where
employees try to acquire power through diverse practices. This paper focus is on the KM
dimension and its influence on power distribution in public sector. The knowledge residing
within employees or public sector experts is an asset that gives them the needed power to retain
their jobs, get promoted and practice and gain self-interest. In this section, we will try to see the
literature related to knowledge management and e-government in an attempt to map this
relationship and see the type of challenges facing knowledge sharing and the factors interacting
in this domain.
Regardless of our perspective adopted in this research, service provision in e-government
domain is characterized by being volatile and requires governments to readjust frequently
(Heck & Rogger, 2003). The authors assert that such situation cannot be accommodated except
if knowledge management systems are adopted. Zhou and Gao (2007) tried to focus on KM
and its relationship to e-government environment. They based their work on a three subsystems
model: knowledge collection, knowledge organization, and knowledge application. Their
conceptual propositions regarding the Chinese environment concluded that the success of e-
government projects will depend on the ability of their knowledge management practices.
Another research analyzed the e-government environment and proposed an ontology that would
avoid the ambiguity of terms and definitions. The authors emphasized the role of knowledge
unit in e-government (or smart government environment (Fraser et al., 2003)).
The major dimensions, proposed by Salleh et al. (2009) to explore how KM can contribute
to e-government domain in Malaysia, were classified into two major categories: human and
technical infrastructure. The first included face to face meetings and paper documentation. The
second dimension included intranet, Internet access, and groupware facilities. The authors also
concluded that a KM strategy will help Malaysia realize the benefits of k-economy. Their
results asserted the role of communication methods and people’s knowledge.
In an attempt to explore the factors influencing the knowledge sharing process within e-
government, an empirical study utilized a questionnaire sent to employees in five South Korean
agencies (Kim & Lee, 2004). The study considered the following major dimensions (with their
sub-dimensions): Culture (visions and goals, trust, and social networks), structure
(centralization, formalization, and performance-based reward system), and information
technology (infrastructure and application, and end-user focus). The results indicated the
significance of social networks, performance-based reward system, infrastructure and
application, and years of work. Our proposition n this study can distill its premise from the
relationship of trust and social network in the cultural context. The second issue the reward

248
system, which emphasizes the role of motivation and power emphasis. The results of the
empirical system emphasized the influence of reward system, social network, years of work,
and infrastructure of KM.
Extending the previously mentioned issues influencing the knowledge sharing capabilities
in e-government context, employees need more support and a well-structured plan for learning
and awareness. In a study that utilized responses from 1100 public employees in the USA, the
researchers concluded that leadership efforts are needed to support employee’s learning and
innovation, and ensure that the organizational functional capabilities are well evaluated
continuously (Ryan et al., 2012). The authors also concluded that ICT is important for
leadership to facilitate KM processes in an e-government context e-government context.
The previous studies emphasized the role of human factors in adopting knowledge
practices in e-government context. Still, the previously reviewed papers were focused on two
major directions: first, the importance of knowledge management practices for the success of
e-government. The second issue is the importance of human factors in the success of knowledge
management practices and specifically knowledge sharing (human factors like training,
leadership, reward system, awareness, culture..etc). Based on this the relationship between
knowledge sharing and human factors is not empirically tested and need to be understood better
in an e-government context.
Managing the knowledge in the public sector is considered a challenging task, as
governmental departments actually create, capture, organize, and manage huge knowledge
resources. The pressures related to the effective implementation of knowledge on government
and governance are related to the following factors: The way it manages and uses the knowledge
resources, and how the effective use of knowledge assets may affect decentralization, policy
development, service delivery and other good governance practices.
While little literature is reported in relation to public sector and even less to e-government,
most literature on KM has been addressing issues, challenges, and opportunities for the private
sector. As an emerging practice, e-government aims at realizing the processes and structures
for utilizing the capabilities of information and communication technologies at different levels
of government and public sector for the purpose of enhancing governance. The key issues in
this transformation are based on adopting and going toward interoperable standards, developing
appropriate business models, creating legal and policy frameworks that will encourage
integration and governance arrangements that support both departmental responsibilities and
cross-enterprise approaches and responsibilities.
On the other hand, the private sector organizations and enterprises adopted new
management philosophies for their survival and for gaining competitive advantage.
Governments often follow the lead of the private sector institutions. Historically, research
indicated that most of management philosophies were first implemented in large companies of
the private sector; once proven to be successful in the field, they were adopted in other sectors.
Total quality management (TQM), business process reengineering (BPR), and enterprise
resource planning (ERP) are good examples. Now it is the right time for knowledge
management (KM). Governments now are realizing the importance of KM to their service
delivery to the public and policy making, and some of their departments are giving high priority
to put KM on their agenda (Metaxiotis, 2009).
Governments and public administrations are knowledge-intensive organizations. They
employ a very high percentage of specialized staff and professionals who manage important
knowledge domains. This is the case in different ministerial departments and in the judiciary
and regulatory agencies. A lot of public organizations are considered “intelligence
organizations” where human actors are involved in the process of information gathering, storing
and analyzing to produce information output for further use. It is important to ask the question:
“How does public administration know what it knows?” it becomes clear that even though there
is indeed a lot of knowledge in organizations, it is not necessarily available anywhere, anytime
and for anybody.
Designing and implementing a KM framework for the application in e-government is an
important and challenging task. It requires a huge coordination effort from many agencies,
departments, and policy makers. In addition to preparing the needed technology, governments

249
must pay attention to the supporting soft infrastructure (i.e. the laws, rules, and regulations that
must be changed) in order to facilitate the development of both the new infrastructure and
information and knowledge services. While most of the previous research studies have
investigated the possible application of KM in the public sector, few have focused on the
application of KM in e-government.
Conclusions and Future Work
This study aimed at proposing a model that depicts the interactions in the area of e-
government when utilizing knowledge management processes and practices. The focal point
of this framework model is to show the important role of information technologies in managing
public knowledge resources. The major objective of this process is to facilitate both the
knowledge developers and the stakeholders to improve the quality of e-government services
and create a public value that leads to the success of e-government. The following framework
shown in Figure 2 is our proposition.
Figure 2. Knowledge management – E-Government framework
Both e-government and knowledge management systems depend on hard and soft
infrastructure. Hard infrastructure is the know architecture of hardware and software need to
run such systems. The types of systems needed for the success of information systems are
transaction processing systems (TPS), management information systems (MIS), group decision
support systems (GDSS), databases and data warehouses, search tools, knowledge portals, and
content management systems. The other side of the coin, is the soft infrastructure, where
policies and regulations, processes and code of practice are the major components need for the
success of both KM and e-government initiatives.
It is vital for governments to utilize the practices of knowledge management to succeed in
offering their services effectively. We need to realize (as mentioned previously) that e-
government success depends on many dimensions other than service. One of these dimensions
is improving government performance. Knowledge management practices enrich such success
and improve public performance based on the following set of practices: establishing and
encouraging communities of practice (COP), collecting, verifying, storing, disseminating,
reusing, and sharing knowledge. Such set of practices will transform governments into
knowledge governments (K-government). The best utilization of ICT and the Internet to
entrench KM practices will not discard the concept of “e” government, but strengthen it with
“k” government image.

250
The previous process (KM practices vs. infrastructure) will not be enabled without the
adoption of the four major stakeholders in this environment: citizens, businesses, employees,
and management. The four categories are equally important in the success of e-government,.
Such success is crowned by more than one direction. The following are the major ones: better
service, improved participation, improved government performance, social development,
transparency, and good governance.
The previous framework is a comprehensive depiction of the reality of utilizing KM practices
in e-government domain. The notion of k-government is becoming a reality as public
institutions are transforming into knowledge entities. The future will carry more than e-
government, it will portray a k-government revolution, where all stakeholders are partners in
the best offerings of public sector.
References
- Abu-Shanab, E. (2013). Electronic government, a tool for good governance and
better service. A book published by the author (deposit number: 2013/2/355, call
number: 658.4038).
- Abu-Shanab, E., Harb, Y. & Al-Zo’bie, S. (2013). Government as an Anti-Corruption
Tool: Citizens Perceptions. International Journal of Electronic Governance, 2013,
6(3), 232-248.
- Al-Naimat, A., Abdullah, M., Osman, W. and Ahmad, F. (2012), “E-government
implementationproblems in developing countries”, 2nd World Conference on
Information Technology (WCIT-2011), a Publication of AWER Procedia of
Information Technology & ComputerScience, Antalya, Vol. 1, pp. 876-881.
- Anderson, T.B. (2009) ‘E-government as an anti-corruption strategy’, Information
Economics and Policy, 2009, 21(3), 201−210.
- Bataineh, M., Abu-Shanab, E., & Jdaitawi, A. (2009).M-Government in Jordan:
Today and the Future. Proceedings of the 4th International Conference on
Information Technology (ICIT 2009), Amman, Jordan, pp. 1-9.
- Bhatnagar, S. (2004). E-government from vision to implementation: A practical
guide with case studies. New Delhi: SAGE publications, first edition, 2004.
- Daft, R. (2006). Organization theory and design. Suoth-Western College Pub,2006.
9th Edition (2006).
- Deep, M., & Sahoo, G. (2011). M-Governance forbetter G2C service. Journal of
Internet Banking and Commerce, 16(1), 1–5.
- Duffy, J. (2000). The KM technology infrastructure. Information Management
Journal, Vol. 34, No. 2 , April 2000
- Fraser, J., Adams, N., Macintosh, A, & Mckay-Hubbard, A. (2003). Knowledge
Management Applied to E-government Services: The Use of an Ontology.
Proceedings of the 4th International Working Conference on Knowledge
Management in Electronic Government, Rohdes, Greece, May 26-28, 2003, pp. 116-
126.
- Heck, U. & Rogger, A. (2004). Knowledge Management for e-service delivery: A
conceptual approach within e-government. Proceedings of the 5th International
Working Conference on Knowledge Management in Electronic Government, Krems,
Austria, May 17-19, 2004, pp. 1-8.
- Heeks, R. (2008), What is E-Government? Accessed from the Internet in October
2015 from: http://www.egov4dev.org/success/definitions.shtml.
- Heisig, P., & Vorbeck, J. (2001). Benchmarking survey results. In Knowledge
management (pp. 97-123). Springer Berlin Heidelberg.
- Hijazi, H. (2005). Measuring the impact of understanding the dimensions of
knowledge management and employing them in Jordan. Doctoral dissertation,
Amman Arab University for Graduate Studies, Jordan.
251
- Hislop, D., Newell, S., Scarbrough, H., & Swan, J. (2000). Networks, knowledge and
power: Decision making, politics and the process of innovation. Technology
Analysis & Strategic Management, 12(3), 399-411.
- Jahanshahi, A., Khaksar, S., Yaghoobi, N. and Nawaser, K. (2011) ‘Comprehensive
model ofmobile government in Iran’, Indian Journal of Science and Technology,
4(9),1188–1197.
- Kawalek, P. & Wastall, D. (2005). Pursuing Radical Transformation in Information
Age Government: Case Studies Using the SPRINT Methodology, Journal of Global
Information Management, 2005, 13(1), 79-101.
- Khasawneh, R. & Abu-Shanab, E. (2013). Using KMS as a Tool to Improve Decision
Making Process. A book chapter in “Knowledge based Processes in Software
Development” edited by Saqib Saeed & Izzat Alsmadi, IGI Global, USA, (2013).
- Kim, S., Kim, H. and Lee, H. (2009) ‘An institutional analysis of an e-government
system foranti-corruption: the case of OPEN’, Government Information Quarterly,
2009, 26(1),42–50.
- Kim, S. & Lee, H. (2004). Organizational factors affecting knowledge sharing
capabilities in e-government: An empirical study. A chapter in a book titled:
Knowledge Management in Electronic Government, publication of the 5th IFIP
International Working Conference, KMGov 2004, Krems, Austria, May 17-19, 2004,
pp. 281-291.
- Metaxiotis, K. (2009). A Framework for Knowledge Management in E-Government.
A chapter in a book entitled: "Social and Political Implications of Data Mining:
Knowledge Management in E-Government", publication of Information Science
Reference; 1 edition (December 26, 2008), pp. 16 -27
- Kubaisi, S. A. (2002). Knowledge management and its impact on organizational
innovation: an exploratory study comparing a sample of mixed industrial sector
companies. Doctoral dissertation, Baghdad.
- Lio, M., Liu, M. and Ou, Y. (2011) ‘Can the internet reduce corruption? A cross-
country studybased on dynamic panel data models’, Government Information
Quarterly, 2011, Vol. 28(1),47–53.
- Malhotra, Y. (2001). Knowledge assets in the global economy: assessment of
national intellectual capital. Knowledge Management and Business Model
Innovation, 232-249.
- Mengistu, D., Zo, H., & Rho, J. J. (2009). M-government:Opportunities and
Challenges to DeliverMobile Government Services in Developing Countries,Fourth
International Conference on Computer Sciences and Convergence Information
Technology (ICCIT), IEEE, pp. 1445-1450.
- Nonaka, I., & Takeuchi, H. (1995). The knowledge-creating company: How Japanese
companies create the dynamics of innovation. Oxford university press.
- Probst, G., Raub, S., & Romhardt, K. (2001). Managing knowledge-Building blocks
for success. Organization Studies-Berlin-European Group For Organizational
Studies, 22(1), 186-186.
- Riad, A., El-Bakry, H. & El-Adl, G. (2010). A Novel DSS Framework for E-
government. International Journal of Computer Science Issues, 7(6), 33-37.
- Ryan, S., Zhang, X., Prybutok, V. & Sharp, J. (2012). Leadership and Knowledge
Management in an E-GovernmentEnvironment. Administrative Sciences,2012, 2(1),
63-81.
- Saffady, W. (2000). Knowledge Management.Information ManagementJournal, Vol.
34, No.3.
- Saleh, Z. & Abu-Shanab, E. (2010). The Role of Risk Related Knowledge in the
Diffusion of Internet Innovations. Journal of Information Knowledge Management,
Vol. 9(1), March 2010, pp. 31-39.
- Schwandt, D.R. and Marquardt, M.J. 2000. Organizational learning: from world-
class theories to global best practices. Boca Raton, FL: St. Lucie Press.

252
- Shehabat, Issa; Mahdi, Saad A; Khoualdi, Kamel E-learning as knowledge
management approach for intellectual capital utilization; The Turkish Online
Journal of Distance; Education; 2009; Vol 10; No 1
- Soo C, Devinney T, Midgley D and Deering A (2002) Knowledge management:
philosophy, processes, and pitfalls. California Management Review 44(4), 129–150.
- Salleh, K., Ahmad, S. & Ikhsan, S. (2009). Knowledge Management in Electronic
Government: The Organizational Readiness of Local Authorities in Malaysia. Public
Sector ICT Management Review, 3(1), january-June 2009, pp. 28-36
- Turban, E., & Aronson, J. (1998). Decision Support Systems and Intelligent Systems,
Prentice Hall. Upper Saddle River, New Jersey, USA.
- UNDESA (2014). United Nations e-government survey 2014: E-government for the
future we want. Washington: Department of Economic and Social Affairs, UN.
- World Bank. (2007). The World Bank definitions. Retrieved March 15, 2007, from
http://www.worldbank.org
- Yanqing, G. (2010). E-government: Definition, goals, benefits and risks.
International Conference on Management and Service Science (MASS), 24–26
August, 2010, Wuhan, China, pp. 1–4.
- Zhou, Z. & Gao, F. (2007). E-government and Knowledge Management,
International Journal of Computer Science and Network Security (IJCSNS), VOL.7
No.6, June 2007, p. 285-289.

253
INFORMATIZATION OF THE
CONTROLLED FROM DISTANCE
DIAGNOSTICATING OF THE STATE OF
THE COMPLEX TECHNICAL SYSTEMS
VYCHUZHANIN V.V
Odessa national marine
university
Ukraine
Abstract:
To the article the results of development and informatization of method of remote
monitoring, diagnosticians of the complex technical systems set on courts, are driven. The
analysis of the used methods of monitoring, diagnostics of the technical systems is conducted.
The method of remote monitoring diagnostics, being base on expert analysis of the state of the
complex technical systems, is described. Results over of development of unclear model are
brought for diagnosticating of the complex technical system, and also results of her research.
Application of the worked out method and his informatization allow to estimate the capacity of
the complex technical system under various conditions and modes of her exploitation, and also
to forecast the state of the system.
Keywords: Complex technical system, monitoring, diagnostics, forecasting, expert
analysis, fuzzy mode.
I. Introduction
Maritime security is related to the provision of health, and hence reliability of marine
complex technical systems (CTS). As a result, variable modes and operating conditions CTS
their performance is reduced, increasing the likelihood of system failure (Logan K.P.,2007;
ABB Marine, 2006.). The transition to ensure the operational reliability of process equipment
for its "actual state" makes it necessary to take measures to prevent and detect the causes of
failures CTS mandatory establishment of systems of technical monitoring and diagnosis of their
condition.
Evaluation of the equipment directly to the vessel is carried out based on measurements
and analysis of diagnostic parameters CTS, the number of which, as well as their
interconnections is large. The solution lies in the use of information systems for remote
monitoring and diagnostics (RMD) status CTS. Thus it is possible to take into account the
diagnostic features of different nature, getting solutions under conditions of incomplete, fuzzy
information.
Currently, designed and operated RMD information systems, based on different methods
of monitoring, diagnosing the state of the CTS (Andersen A.B., 2011; Asgeir J. Sørensen,
2013; Andersen T.M, Rasmussen M., 2011; Lauvdal T., Sørensen A J., 2000; Calabrese F.,
Corallo A., 2012). The complexity of technical systems, a variety of operating conditions
require revision of existing concepts of building systems and finding new RMD. Information
used for diagnosis in most cases is vague. For the development of diagnostic methods in recent
years, CTS established the feasibility of the mathematical apparatus of fuzzy logic to determine
the criteria for assessing the condition of the equipment and diagnostic decisions. This method
is based on a combination of traditional means of operational control with expert systems built

254
with the use of fuzzy logic methods (Abraham A. 2005; Zadeh L.A., 1965; Schneider M.,
Langholz G., 1996 ). Although automation technical inspection of CTS there for a long time,
now is not yet created such a system RMD, which would comprehensively assess the current
state of the ship CTS, provides early detection of defects and to predict the development
process. Current diagnostic methods are based on mathematical models that can display only
part of the properties and modes of ship CTS. Lack of scientific methods to solve problems of
creation of systems of RMD based on information technology, explains the reason for the fact
that the maritime complex in the percentage of successful implementations of such systems is
very low. Despite the diversity of existing methods of RMD, they need to be further developed
for ship CTS.
Thus, the solution to ensure the operational reliability of ship CTS on their "actual state"
creation and implementation of an expert system using fuzzy logic is overdue. From the solution
of the problem depends on the performance of the diagnostic centers distant from the CTS in
extreme operating conditions.
2. Problem formulation and backstepping transformation
The aim of the article is to provide a fuzzy expert system monitoring and diagnostics of
the ship CTS for the qualitative assessment of their condition.
An algorithm for constructing the information system allows you to organize RMD CTS
method of diagnostics division of the development process to logically the completed stages.
Dynamics of changes in the expert system CTS displayed when specifying sets of linguistic
variables, thermo-sets, fuzzy variables, basic sets, membership functions, the database in the
task of fuzzy criteria and fuzzy relationship.
Input data:
1. The non-linguistic (accurate) variables: x1; x2; x3. {x1, x2, x3}єX - the set of non-linguistic
variables. Non-linguistic variables are defined as the performance of CTS, which, using the
output of Sugeno is determined by performance of the system.
2. The linguistic variables: y1; y2; y3 - integrated criterion of quality, built on the basis of
desirability functions Harrington. D = y3 - linguistic variables. {y1, y2, y3}єY - set of linguistic
variables. The value of each of the linguistic parameters of diagnostic yu, which tasks can be
any number, translated into the corresponding desirability du
uu yd expexp (1)
The values of linguistic variables determined by the conclusion Mamdani. Desirability function
D - the geometric mean desirabilities individual valuation parameters: q yyyD 321
where q - the number of parameters diagnosis. All parameters, both linguistic and non-
linguistic, obtained by dynamic monitoring of CTS.
Output data:
Q - system availability. 100,0Q
Health model CTS is a functional map of the form
100,0yy,,x, 321321 QyYxxX (2)
Fuzzy sets
μ(X) μ(Y)= μÃ→B(Q), (3)
where à - fuzzy set, B - a clear set of
In developing the knowledge base of an expert system used results indexing converted into
three ranges of parameter values, respectively, for the three linguistic variables: low (L),
medium (M) and high (H) shown in Table 1.
Table 1. The values in the range of linguistic variables
Linguistic variable The value of the parameters
low medium high
y1 [a1…b1] [b1…c1] [c1…d1]
y2 [a2…b2] [b2…c2] [c2…d2]
y3 [a3…b3] [b3…c3] [c3…d3]

255
In Table 1, a1-a4, b1-b4, c1-c4, d1-d4, - boundary values of linguistic variables. The values of the
factors are expressed as deviations from averages for similar CTS. In the simulation, the
integrated influencing factors using fuzzy expert knowledge Mamdani type (Mamdani E.H.,
Assilian S., 1975). Elements of the antecedents of fuzzy rules based on the experience of experts
linked the logical operation "AND", are presented in Table 2.
The efficiency of the ship CTS studied considering three types of indicators of linguistic
variables. The boundaries of subdomains with constant elasticity of health - fuzzy, due to the
smooth transition of one type figures in the other. Proposed fuzzy Sugeno knowledge base for
modeling the competitiveness of the CTS (Takagi T., Sugeno M., 1985). Each rule knowledge
base models the one type. The coefficients in the conclusions of the rules set by the sensitivity
of the competitiveness of the relevant factors. Each element of the set has its own degree of
membership the higher the degree of membership, the greater the probability that the value is
normal. Membership functions or information for their construction are given by experts on the
basis of subjective preferences and do not have a random character.
Table 2. Fuzzy knowledge base for the linguistic variables
у1 у2 у3 Y
H H H H
H H M H
H M H H
H M M H
M H H H
L L L L
L L M L
L M L L
L M M L
M L L L
H L M M
H M L M
L H M M
L M H M
M H L M
M L В M
M M M M
By linguistic and linguistic variables, it carried out a general analysis on the findings of experts.
Odds experts selected by the method of paired comparisons Saaty, the results of which (in
general) for the first non-linguistic variable x1 in Table. 3.
Table 3. Results of pairwise comparisons of experts for the first non-linguistic variable x1
H M L
H 1/1 f/1 g/1
M 1/f 1/1 f/1
L 1/g 1/f 1/1
In Table 3, f - ratio H and to M, g - the ratio H to L to the first non-linguistic variable. Operations
on fractions for the first non-linguistic variables are given in Table 4.
Table 4. Actions over the fractions of the first linguistic variable x1
H M L Σx1 Ratio
H 1 f g Σ x11=1+f+g Σ x11/Σ x1
M 1/f 1 f Σ x12=1/f+1+f Σ x12/Σ x1
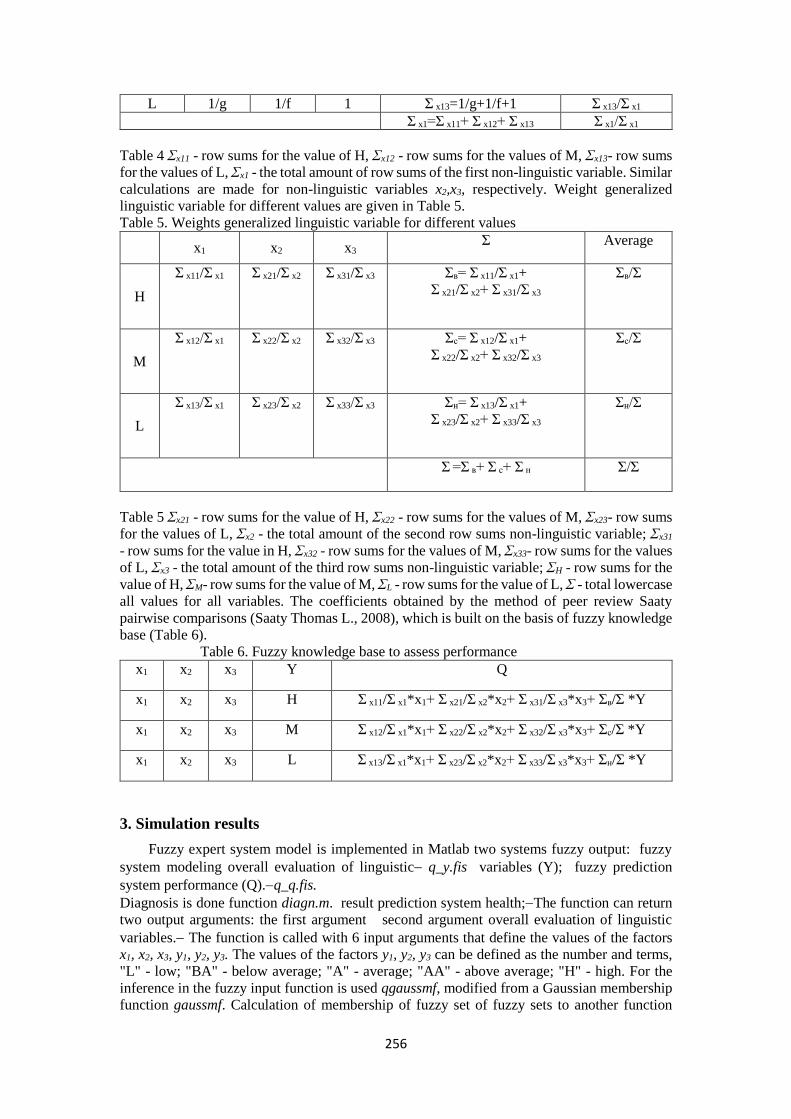
256
L 1/g 1/f 1 Σ x13=1/g+1/f+1 Σ x13/Σ x1
Σ x1=Σ x11+ Σ x12+ Σ x13 Σ x1/Σ x1
Table 4 Σx11 - row sums for the value of H, Σx12 - row sums for the values of M, Σx13- row sums
for the values of L, Σx1 - the total amount of row sums of the first non-linguistic variable. Similar
calculations are made for non-linguistic variables x2,x3, respectively. Weight generalized
linguistic variable for different values are given in Table 5.
Table 5. Weights generalized linguistic variable for different values
x1 x2 x3 Σ Average
H
Σ x11/Σ x1 Σ x21/Σ x2 Σ x31/Σ x3 Σв= Σ x11/Σ x1+
Σ x21/Σ x2+ Σ x31/Σ x3
Σв/Σ
M
Σ x12/Σ x1 Σ x22/Σ x2 Σ x32/Σ x3 Σс= Σ x12/Σ x1+
Σ x22/Σ x2+ Σ x32/Σ x3
Σс/Σ
L
Σ x13/Σ x1 Σ x23/Σ x2 Σ x33/Σ x3 Σн= Σ x13/Σ x1+
Σ x23/Σ x2+ Σ x33/Σ x3
Σн/Σ
Σ =Σ в+ Σ с+ Σ н Σ/Σ
Table 5 Σx21 - row sums for the value of H, Σx22 - row sums for the values of M, Σx23- row sums
for the values of L, Σx2 - the total amount of the second row sums non-linguistic variable; Σx31
- row sums for the value in H, Σx32 - row sums for the values of M, Σx33- row sums for the values
of L, Σx3 - the total amount of the third row sums non-linguistic variable; ΣH - row sums for the
value of H, ΣM- row sums for the value of M, ΣL - row sums for the value of L, Σ - total lowercase
all values for all variables. The coefficients obtained by the method of peer review Saaty
pairwise comparisons (Saaty Thomas L., 2008), which is built on the basis of fuzzy knowledge
base (Table 6).
Table 6. Fuzzy knowledge base to assess performance
x1 x2 x3 Y Q
x1 x2 x3 H Σ x11/Σ x1*x1+ Σ x21/Σ x2*x2+ Σ x31/Σ x3*x3+ Σв/Σ *Y
x1 x2 x3 M Σ x12/Σ x1*x1+ Σ x22/Σ x2*x2+ Σ x32/Σ x3*x3+ Σс/Σ *Y
x1 x2 x3 L Σ x13/Σ x1*x1+ Σ x23/Σ x2*x2+ Σ x33/Σ x3*x3+ Σн/Σ *Y
3. Simulation results
Fuzzy expert system model is implemented in Matlab two systems fuzzy output: fuzzy
system modeling overall evaluation of linguistic q_y.fis variables (Y); fuzzy prediction
system performance (Q).q_q.fis.
Diagnosis is done function diagn.m. result prediction system health;The function can return
two output arguments: the first argument second argument overall evaluation of linguistic
variables. The function is called with 6 input arguments that define the values of the factors
x1, x2, x3, y1, y2, y3. The values of the factors y1, y2, y3 can be defined as the number and terms,
"L" - low; "BA" - below average; "A" - average; "AA" - above average; "H" - high. For the
inference in the fuzzy input function is used qgaussmf, modified from a Gaussian membership
function gaussmf. Calculation of membership of fuzzy set of fuzzy sets to another function
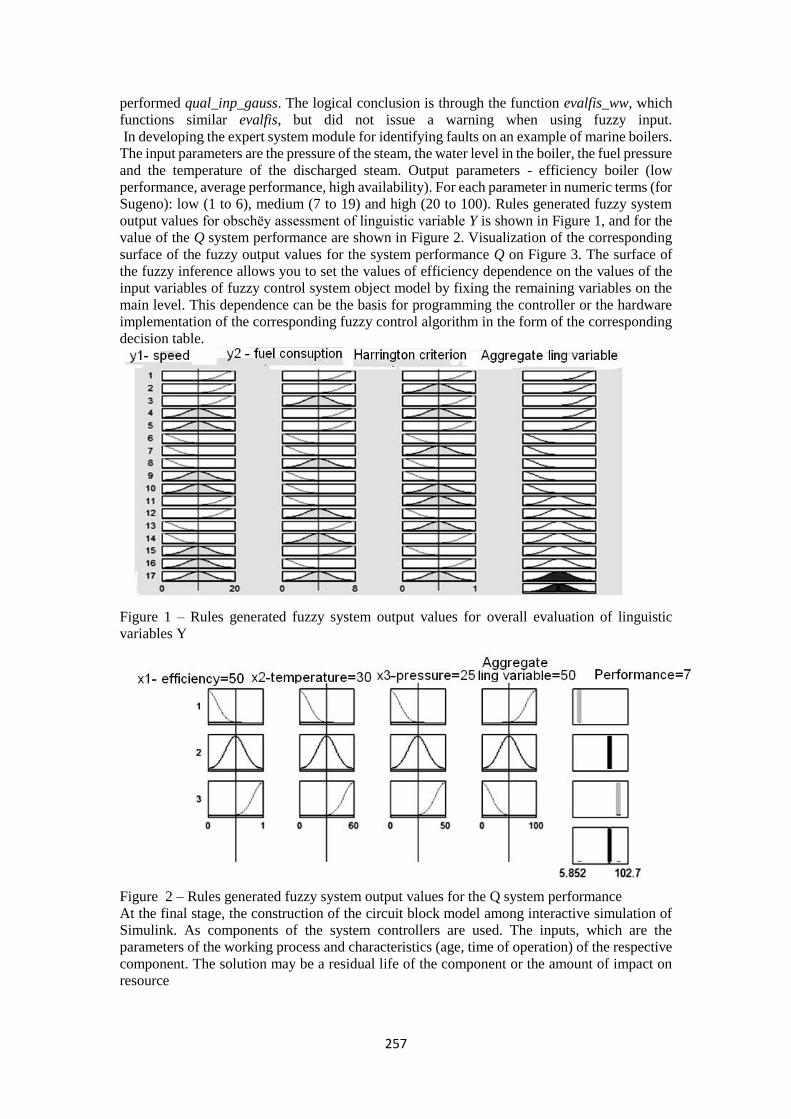
257
performed qual_inp_gauss. The logical conclusion is through the function evalfis_ww, which
functions similar evalfis, but did not issue a warning when using fuzzy input.
In developing the expert system module for identifying faults on an example of marine boilers.
The input parameters are the pressure of the steam, the water level in the boiler, the fuel pressure
and the temperature of the discharged steam. Output parameters - efficiency boiler (low
performance, average performance, high availability). For each parameter in numeric terms (for
Sugeno): low (1 to 6), medium (7 to 19) and high (20 to 100). Rules generated fuzzy system
output values for obschёy assessment of linguistic variable Y is shown in Figure 1, and for the
value of the Q system performance are shown in Figure 2. Visualization of the corresponding
surface of the fuzzy output values for the system performance Q on Figure 3. The surface of
the fuzzy inference allows you to set the values of efficiency dependence on the values of the
input variables of fuzzy control system object model by fixing the remaining variables on the
main level. This dependence can be the basis for programming the controller or the hardware
implementation of the corresponding fuzzy control algorithm in the form of the corresponding
decision table.
Figure 1 – Rules generated fuzzy system output values for overall evaluation of linguistic
variables Y
Figure 2 – Rules generated fuzzy system output values for the Q system performance
At the final stage, the construction of the circuit block model among interactive simulation of
Simulink. As components of the system controllers are used. The inputs, which are the
parameters of the working process and characteristics (age, time of operation) of the respective
component. The solution may be a residual life of the component or the amount of impact on
resource

258
Figure 3 – Visualization of the corresponding surface of the fuzzy output values to the Q system
performance
Figure 4 shows a possible embodiment of the layout of such a scheme with four input variables
t (temperature), efficiency, T and P, three levels of fuzzy inference, the differential assessment
of the variable P and integrated assessment of the output of the second level Qsl. Based on the
values of the variables t, efficiency is determined by the current value of the variable Q, which
is specified based on the value T. Variable P - the value of the life of the equipment under test,
differential assessments that complement the missing values are average values of the variable
and reset Qsl integrated assessment to 0 in case of replacement equipment. The last level
determines the final conclusion on the state of the equipment, depending on the storage
(integrated assessment) Qsl values and service life of the equipment.
Figure 4 – An example of an expert system built environment Matlab Simulink
Based on the data obtained at various criteria, availability depends on the CTS not linguistic
values of variables and values of linguistic variables and may vary dramatically as the upward
and downward dramatically depending on the combination of these variables.
The practical value of the results is that the proposed method of establishing a system of RMD
CTS for its actual condition can improve the efficiency of marine equipment CTS by reducing
downtime to repair, reduce the cost of repairs and disaster recovery equipment.
4. Conclusions
For the first time the methodological framework and principles for a new ship CTS scientific
direction - realization of intelligent control systems and the analysis of the functioning of the
CTS using expert fuzzy information.
Application of the proposed method allows to estimate the efficiency of any ship technical
systems with a minimum of information about it. The results of the current fuzzy model
developed through the use of expert analysis of data with high accuracy to estimate the
performance of ship technical systems and to decide on the further use of the system.
259
References
- Logan K. P. (2007). “Intelligent Diagnostic Requirements of Future All-Electric Ship
Integrated Power System”. Industry Applications, IEEE Transactions on, 43(1), pp.139
–149.
- ABB Marine (2006). “Process Control Systems: Remote Diagnostic Services”. PDF
file. ABB Oy,
- Andersen A. B. (2011). “Diagnostic System for Remote Real-Time Monitoring of
Marine Diesel-Electric Propulsion Systems” Leipzig, 45 p.
- Sørensen Asgeir J.(2013). “Marine Control Systems Propulsion and Motion Control
of Ships and Ocean Structures”, 536 p.
- Andersen T. M, Rasmussen M. (2003)_ “Aging management: monitoring of technical
condition of aging equipment”. ICMES. Helsinki, Finland.
- Lauvdal T., Sørensen A.J., Ådnanes A.K., Strand J.P., Hansen J.F., Sørdalen
O.J.(2000) “Marintronics: Optimizing marine power and automation systems
through Industrial IT” ABB Review , No. 1.
- Calabrese F., Corallo A., Margherita A., Zizzari A.A. (2012) “A knowledge-based
decision support system for ship-board damage control”, Expert Systems with
Applications, 39(9), pp.8204-8211.
- Abraham A. (2005) “Rule Based Expert Systems. Handbook for Measurement Systems
Designed” London: John Wiley and Sons Ltd., pp. 909-919.
- Zadeh L.A. (1965) “Fuzzy Sets”, Information and Control. Vol 8, pp. 338-353.
- Schneider M., Langholz G., Kandel A., Chew G. (1996) Fuzzy Expert System Tools.
USA: John Wiley & Sons.
- Mamdani E.H., Assilian S. (1975) “An Experiment in Linguistic Synthesis with a
Fuzzy Logic Controller”, International Journal of Man-Machine Studies. Vol. 7. No. 1,
pp. 1-13.
- Takagi T., Sugeno M. (1985) “Fuzzy idendfication of systems and its applications of
modeling and control” IEEE Transactions of Systems. Man and Cybernetics, pp.116-
132.
- Saaty Thomas L. (2008) “Decision making with the analytic hierarchy process” Int. J.
Services Sciences, Vol. 1, No. 1, pp. 83-98.
260
E-business Entrepreneurship and Long-term
Sustainability
Zaid M. Al Hawatmah Dr. Raed M Al-Qirem Dr. Khaled S. Al Omoush
Al-Zaytoonah University of Jordan
Jordan
Abstract:
The purpose of this research is to develop an institutional framework to investigate the
relationships between the drivers, the degree of e-business entrepreneurship, and the long-term
sustainability of business organizations. The framework proposes that institutional pressures
can explain the level of e-business entrepreneurship. The framework also proposes that the
degree of e-business entrepreneurship plays a pivotal role in the long-term sustainability. The
present study suggests that any effective strategy for long-term sustainability should include
the implementation and use of e-business capabilities. The present study contributes to a better
understanding of the existing theories and practices of e-business entrepreneurship and e-
innovations in today's business organizations. The results also could help provide insight into
drivers and the role of entrepreneurship in gaining long-term sustainability for manufacturing
firms with the strategies of e-business adoption and use.
Keywords: e-business entrepreneurship; the degree of entrepreneurship; long-term
sustainability; institutional pressures
Introduction
Today’s organizations operate in a highly competitive environment where sustainable
competitive advantage is imperative in the ever-changing business environment (Zhao, 2006;
White, 2009; Kanji and Chopra, 2010). Corporate entrepreneurship has been emphasized by
academics and literature as essential survival strategy for businesses in the new economy, and
is likely to take businesses above the threshold of sustainability (Hull et al., 2007; Scheepers et
al., 2007; White, 2009). Although the need to entrepreneurship has always existed, this has
been accentuated in recent years due to the acceleration of economic changes and growing
worldwide competition. Actually, the literature has stressed the critical importance of
entrepreneurship to organizations as it allows them to capitalize on their abilities to innovate
and quickly respond to opportunities and threats, thus providing an advantage over the
competitors.
Considering the prominent role of ICT in today's business environment, the literature (e.g.,
Hull et al., 2007; Kanji and Chopra, 2010; Beckman et al., 2012) indicated that any effective
strategy for long-term sustainability should include the implementation and use of ICT
resources and capabilities. The previous studies (e.g., Zhang and Dhaliwal, 2009; Beckman et
al., 2012; Zupic, 2014) explained that in order to gain and maintain sustainable competitive
advantage, e-entrepreneurship can no longer operate or be considered in isolation. E-business
has become a major trend in today's dynamic business environment, reaching into almost every
aspect of organizations' activities. Under the pressures of competition , the advent of cost-
effective Web services have leaved organizations no choice for but to incorporate these
technologies into their strategies and business processes.
The environment in which the organizations operate represents a primary source of
entrepreneurship (Miller, 1983; Covin and Slevin, 1991; Huse et al., 2005). Explaining why
organizations are exhibiting diversity with respect to the entrepreneurship degree in ICT
adoption and use, a broad base of literature (DiMaggio and Powell, 1983; Rogers, 1995; Oliver,
261
1997; Hsu et al., 2006; Zhang and Dhaliwal, 2009) has emphasized that organizations are not
an isolated entity, but is embedded in an economic, social, cultural and competitive
environment. The organizational entrepreneurs consistently use their institutional environment
networks to get ideas and gather information to supports the process of recognition and develop
entrepreneurial opportunities. In fact, a number of previous studies (Oliver, 1997; Zhang and
Dhaliwal, 2009) have suggested that resource dependency and institutional drivers are
indispensable to study the role ICT adoption and use in gaining a competitive advantage and
long-term sustainability.
Although there is a considerable body of literature in the larger area of business
entrepreneurship and entrepreneurial organizations, e-entrepreneurship is still largely
unexplored (Beckman et al., 2012; Zupic, 2014). There has been a considerable body of
literature in the field of e-business adoption from different perspectives. It is worth noting that
far less attention has been paid to study the adoption of e-business applications from
entrepreneurship perspective. In the context of e-business adoption, few validated measures of
firm-level entrepreneurship exist today. In addition, the related previous studies did not pay
attention to evaluate the degree of entrepreneurship in responses to the environmental driving
forces in terms of e-business applications and usage patterns. Instead, the focus of attention was
directed to evaluate the performance and benefits of e-business adoption and use. Furthermore,
the impact of entrepreneurship in e-business adoption and use on the long-term sustainability
of business organizations has received insufficient attention.
Given the aforementioned gap, the present study aims to develop an institutional model,
drawing on the institutional theory, to investigate the relationships between adoption drivers of
e-business entrepreneurship, the degree of entrepreneurship, and the long-term sustainability in
the business setting from entrepreneurship perspective.
2. Literature Review
In the context of firm-level entrepreneurship, Zhao (2006) defined entrepreneurship as the
introduction of a new idea, new products, a new organizational structure, a new production
process, or the establishment of a new organization by or within an existing organization.
Mitchel and Coles (2004) defined innovation as any successful change in any element that
enhances an on-going performance in delivering benefits. According to Lindgardt et al. (2009),
innovation turns into business model innovation when two or more elements of a business
model are reinvented to deliver value in a new way. Rogers (1995) described innovation
adoption as a process through which decision makers pass from first knowledge of an
innovation, to forming an attitude towards the innovation, to a decision to adopt or reject it, to
the implementation of the new idea. Many of the previous studies (e.g., Lumpkin and Dess,
1996; Shane and Venkataraman, 2000) confirmed the link between the entrepreneurship,
opportunities, and innovation.
Although there has been a considerable body of literature in the field of e-business
adoption from different perspectives, it is worth noting that far less attention has been paid to
study the adoption of e-business from the firm-level entrepreneurship perspective. Actually, e-
business entrepreneurship is still largely unexplored (Beckman et al., 2012; Zupic, 2014).
However, most of the previous studies have been devoted to understanding and explaining the
factors that influence the adoption decision of e-business applications from technology
acceptance perspective. A review of e-entrepreneurship literature also reveals that the previous
studies have paid a considerable intention to the influencing factors on e-business
entrepreneurship. For example, Foster and Lin (2003) investigated the impact of prior
knowledge and cultural background and individual differences in learning entrepreneurship and
their implications for Web-based instruction in e-business and e-commerce. Zhao (2006) also
investigated the factors that foster an interaction between the entrepreneurship and innovation
in e-business. Furthermore, Petti and Zhang (2011) offered an overview of the factors
influencing e- entrepreneurship capabilities. A considerable stream of research (e.g., Zahra and
Garvis, 2000; Hull et al., 2007) was oriented to investigate the value creation and outcomes of
exploiting entrepreneurial e-business opportunities. Another stream of research has been

262
devoted to examine the process of e-entrepreneurship and transforming into e-business
innovations (Strang and Chan, 2010; Petti and Zhang, 2011).
The long-term competitiveness and sustainability require organization to be more sensitive
to their external environment, respond rapidly and dynamically, and reproduce itself regarding
current and future conditions of the environment. A number of corporate entrepreneurship
models (e.g., Covin and Slevin, 1991) have advocated an integrative models that explain the
relationship between a company’s entrepreneurial state and its environment. As organizations
continue to explore strategies for sustainability in their mulita dimensional environments, the
previous studies (e.g., Crals and Vereek, 2005; Zhang and Dhaliwal, 2009) confirmed that the
environmental awareness is a necessity for long-term survival and sustainability. According to
Crals and Vereek (2005), entrepreneurship represents the way to find the right balance within
these environments. However, Institutional Theory (DiMaggio and Powell, 1983) has emerged
as a powerful approach for explaining why and how organizations adapt to their intuitional
environments. Over the past several decades, Institutional Theory has become an integral
reference framework for studying and understanding of organizational adoption of innovations
(Son and Benbasat, 2007; Zhang and Dhaliwal, 2009). It emphasizes that institutional
environments are crucial in shaping organizational structure and actions. However, the
literature (e.g., Teo et al. 2006; Kshetri, 2007; Son and Benbasat, 2007; Bhakoo and Sohal,
2008; Andreu et al., 2010) has emphasized the impact of institutional pressures on adopting e-
business innovations.
It is worth mentioning that the long-term sustainability significance in business context
and organizations growth continues to increase. According to Lumpkin and Dess (1996), the
level of entrepreneurial behavior by the organization allows it constantly to evaluate the
potential business opportunities that will bring growth and sustainability. It is worth noting that
the previous studies have ignored to a large degree the pivotal impact of institutional pressures
on e-business entrepreneurship. The previous studies have completely ignored the impact of
institutional pressures on the diversity of e-business entrepreneurship in their research models.
Furthermore, literature is lacking insights into the impact of e-business entrepreneurship on the
long-term sustainability for business organizations.
3. Research Model
The research model (Figure 1) proposes that the institutional coercive, mimetic, and
normative pressures have a direct impact on the degree of e-business entrepreneurship.
Furthermore, the study proposes that the degree of e-business entrepreneurship has a significant
impact on the long-term sustainability of business organizations.
Figure 1. Research Model
Below the elements of research model are discussed in more details.
Long-term Sustainability
Normative Pressures
Mimetic Pressures The Level of E-business
Entrepreneurship
Coercive Pressures
Innovativeness
Pro-activeness s Risk-taking
263
3.1 Institutional Pressures
DiMaggio and Powell (1983) identified three kinds of institutional forces that define how
organizations behave with regard to the innovation and institutionalization. These are coercive,
mimetic, and normative pressures. Each of these pressures is discussed below:
3.1.1. Coercive Pressures
Coercive pressures were derived from the Resource-Dependence Theory (DiMaggio and
Powell, 1983). The resource-based view is the outlook of an organization and its ability to
interpret its resource base and the resource requirements of the market in building a sustainable
business strategy (White, 2009). However, coercive pressures have been defined as formal and
informal pressures exerted on organizations by other organizations upon which
they are reliant and by the expectations of the society members within which organizations
operate (DiMaggio and Powell, 1983). According to this theory, a dominant organization that
controls scarce and important resources may demand that organizations dependent on it exhibit
similar structures, polices, programs, or technologies that serve its interests, where these
resource-dependent partners may comply with the demands to secure their own survival (Teo
et al., 2003).
Mimetic Pressures
The mimetic isomorphism process of institutional legitimacy occurs when organizations
tend to model themselves on other organizations in the same field that are considered to acquire
status-conferring legitimacy or social fitness in a wider social structure (DiMaggio and Powell,
1983). According to this kind of pressures, firms may consciously or unconsciously mimic the
practices of their business partners, peers, or competitors. In addition, mimetic pressures may
come from professional associations, where many organizations join it to benefit from the latest
best practices in their domain (Teo et al., 2003; Lai et al., 2006). DiMaggio and Powell (1983)
stated that this kind of pressures results from uncertainty in the surrounding environment.
3.1.3 Normative Pressures
Normative pressures are the third source of institutional isomorphic exerted by members
of social networks to meet the requirements of professionalization and the cognitive authority
of the organizational field. Normative forces result from the expectations of professionals
regarding how work should be conducted. These pressures manifest themselves through a
variety of sources, including trade associations, professional associations, accreditation
agencies, and supply chain members (Teo et al., 2006; Son and Benbasat, 2007). A focal
business with direct or indirect ties to other businesses that have adopted an innovation is able
to learn about that innovation, and is likely to be persuaded to behave similarly (Teo et al.,
2006). Normative forces faced by an organization stand to be increased by a higher prevalence
of e-business adoption among its business partners; and by its participation in professional,
trade, or business associations that support the adoption of such technology (Teo et al., 2006;
Lai et al., 2006; Son and Benbasat, 2007).
3.2 The degree of Entrepreneurship
The majority of entrepreneurship literature acknowledged the variation in the degree of
entrepreneurship of businesses. The literature confirms that different norms of corporate
entrepreneurship should exist between businesses and industries. However, a number of
previous studies (e.g., Shane and Venkataraman, 2000; Brown et al., 2001) described the degree
of entrepreneurship in terms of the extent of opportunity recognition and exploitation. Lumpkin
and Dess (1996) recommended five dimensions to be used in measuring the level of
entrepreneurship, including autonomy, competitive aggressiveness, pro-activeness,
innovativeness and risk-taking. Ligthelm (2010) examined the level of entrepreneurial in the
small business in the context of value creation. Brown et al. (2001) adopted different six
264
dimensions for assessing a firm’s degree of entrepreneurship, including strategic orientation,
resource orientation, management structure, reward philosophy, growth orientation, and
entrepreneurial culture. Zahra and George (2002) defined corporate entrepreneurship as the sum
of a corporate's efforts aimed at innovation, pro-activeness and risk taking. Wiklund (1999)
confirmed that in the majority of literature, the orientation of entrepreneurship has been
determined in terms of innovativeness, pro-activeness and risk-taking. A wide stream of
research (e.g., Miller, 1983; Dess et al., 1999; Zahra and George, 2002; Scheepers et al., 2007;
Tang et al., 2008) has agreed that firms’ degree of entrepreneurship could be seen as the extent
to which they innovate, act pro-actively, and take risks.
Based on the previous studies, the present research adopted three dimensions to be used in
measuring the level of entrepreneurship, including innovativeness, risk-taking, and pro-
activeness. The first dimension of the degree of entrepreneurship, namely innovativeness, refers
to the creation of new products, services and technologies (Scheepers et al., 2007). Actually,
this behavior has various outcomes. It may involve the restructuring and strategic renewal
within an existing enterprise to capitalize on emerging opportunities. In this regard, Rogers
(1995) defined the innovation as an idea, practice, or object that is perceived as new by the unit
of adoption. Mitchel and Coles (2004) also described innovation as any successful change in
any element that enhances an on-going performance in delivering benefits. At the same
direction, Lindgardt et al. (2009) stated that innovation turns into business model innovation
when two or more elements of a business model are reinvented to deliver value in a new way.
According to Huse et al (2005), one dimension of innovation involves the adoption of new
technologies.
The second dimension, pro-activeness, is an opportunity-seeking attitude, describing how
firms relates to an aggressive pursuit of market opportunities and a strong emphasis on wanting
to be among the first to adopt and use innovation in their industries ahead of the competitors
(Zahra and George, 2002). According to Lumpkin and Dess (1996), pro-active firms have a
greater tendency to lead than to follow in the development and adopting new technologies or
the introduction of new products and services. Miller (1983) considered pro-activeness as an
indication of a company’s determination to capture promising opportunities, rather than merely
responding to competitors’ actions.
The third dimension, risk-taking, involves the willingness to commit significant resources
to opportunities with a reasonable calculated chance of costly failure (Scheepers et al., 2007).
Miller (1983) described risk-taking in the context of firms which take untraditional initiatives
by venturing into the unknown and committing significant resources to ventures in uncertain
environments with insecure outcomes. Zahra and George (2002) also defined risk-taking as a
company’s disposition to support innovative projects, even when the perceived results from
these projects are uncertain. According to Miller (1983), the organizational culture that
encourages individual initiatives, risk-taking, and new ways of thinking; and rewarding
individuals with new ideas that contribute to innovation and business progress is a key element
of sustainable business performance.
In the context of entrepreneurship, it is reasonable to argue that there could be a variation
of businesses in their tendency for the discovery and exploitation the same opportunities
embedded within the same environment. However, many of studies (e.g., Hsu et al., 2006; Teo
et al., 2006) concluded that coercive pressures and the partners' power are among the most
important factors that explain the adoption of e-business. Furthermore, an empirical evidence
on the impact of mimetic pressures has been found in many studies (e.g., Thomas and
Ranganathan, 2005; Teo et al., 2006; Bhakoo and Sohal, 2008) examining the adoption of
different IT applications. The empirical research (e.g., Teo et al. 2006; Son and Benbasat, 2007;
Andreu et al., 2010) has also emphasized the impact of normative pressures on adopting e-
business applications.
3.3. Long-term Sustainability
For business organizations, entrepreneurship is not a goal in itself, but a mean to achieve
their strategic goals. Zahra and Garvis (2000) suggested that the outcomes have to be integral

265
part of studying entrepreneurial behavior. A considerable stream of research (e.g., Zahra and
Garvis, 2000; Hull et al., 2007; Ligthelm, 2010) has characterized the exploiting entrepreneurial
opportunities based on the value that they can create for the business. It is worth noting that
many of previous studies were oriented to investigate the outcomes of exploiting
entrepreneurial opportunities for creating value in terms of long-term sustainability. It is worth
mentioning that the sustainability significance in business context and organizations growth
continues to increase. In this context, Bateh et al. (2014) asserted that organizations worldwide
have adopted entrepreneurship strategies to develop a competitive advantage and leverage their
sustainability.
There still appears to be no consensus defining sustainability. For example, in the business
setting, Bateh et al. (2014) described it as longevity of the organization, maintenance of core
principles or purposes, and responsibility to external needs. According to Nieto (2009),
sustainability is about enhancing people, profit, and the planet in order to impact innovation
and sustainable business growth. Cohen and Winn (2007) described it as the examination of
how opportunities to bring into existence future goods and services are discovered, created, and
exploited, by whom, and with what economic, psychological, social, and environmental
consequences. More flexible definition of sustainability is a need to live in the present in ways
that do not jeopardize the future (Senge et al., 2008, p. 9).
Lumpkin and Dess (1996) confirmed that the level of entrepreneurial behavior by the
organization allows it constantly to evaluate the potential business opportunities that will bring
growth and sustainability. Actually, the literature (e.g., Oliver, 1997; Hull et al., 2007; Zhang
and Dhaliwal, 2009; Kanji and Chopra, 2010) confirmed that the adoption and use of ICT
innovations is indispensable to gain a sustainable competitive advantage, and, thus, to take
business organizations above the threshold of sustainability. Explaining the prominent role of
ICT in today's business environment, the literature (e.g., Zhao, 2006; Scheepers et al., 2007;
Zhang and Dhaliwal, 2009; Kanji and Chopra, 2010) asserted that any effective strategy for
gaining and maintaining a sustainable competitive advantage and, thus, long-term sustainability
should include the adoption and use of ICT resources and capabilities. Therefore, the
aforementioned discussion confirmed that the degree of e-business entrepreneurship has a
significant impact on the long-term sustainability of business organizations.
A review of the literature reveals an inconsistency in measures of long-term sustainability.
The variation in measures is attributable mainly to the lack of consensus on the definition of
sustainability, where the etiology of this concept has grown out of both the environmental and
social responsibility (Bateh et al., 2014). However, many of the previous studies (Ligthelm,
2010; Bateh et al., 2014) have measured the sustainability an integral element of companies’
performance using various criteria. Actually, in today’s dynamic and changing environment,
business organizations have to innovate in new areas, make complex decisions, originate
creative solutions, adapt and behave as human system to serve its survival, prosperity and
superiority. From this perspective, the measures of sustainability can be captured in terms of
survival, growth, and superiority. Therefore, the present study suggests the following
dimensions to measure the long-term sustainability to investigate the impact of e-business
entrepreneurship on the long-term fate of business organizations:
Enhance the social acceptance of firm existence.
Improve public image.
Increase customer's satisfaction and loyalty.
Enable long-term working relationship with supply chain members.
Gain a competitive advantage over competitors.
Increase the firm’s stock market value.

266
Increase market share.
Improve productivity.
Create new business models, product, and services.
Increase profits.
4. Discussion, conclusions, and implications
The constantly changing in the highly competitive environment of todays’ organizations
are come at an ever-increasing pace and more rapidly than ever before with a range of highly
complex, dynamic, and multi-faced challenges. These controversial changes and challenges
have a critical impact on the organizations’ ability to survive and to take their businesses above
the threshold of sustainability. Corporate entrepreneurship has been emphasized by academics
and literature as imperative strategy for businesses sustainability in today’s ever-changing
business environment. At the same time, the advances in e-business applications have given
impetus to emerge new entrepreneurial opportunities to business organizations and
entrepreneurs to rethink and reshape innovatively their business strategies gaining a long-term
competitiveness and sustainability.
It is worth noting that the previous studies have ignored to a large degree the pivotal impact
of institutional pressures on e-business entrepreneurship. Furthermore, literature is lacking
insights into the impact of entrepreneurship on the long-term sustainability for business
organizations. Therefore, the present study aimed to develop an institutional framework,
drawing on the institutional theory, to investigate the relationships between adoption drivers of
e-business innovations, degree of entrepreneurship, and the long-term sustainability, in the
business setting, from entrepreneurship perspective. The present study confirms the impact of
environmental pressures on the degree of e-business entrepreneurship. The findings also
suggest that the degree of e-business entrepreneurship plays a pivotal role in the long-term
sustainability
The results affirm that the environmental awareness is a necessity for long-term survival
and sustainability. At the time that environmental dynamism imposes heightened competitive
situations threatening the organizations’ ability to survive; it represents a major source of
entrepreneurship to gain competitive advantages and long-term sustainability. The results
suggested that any effective strategy for long-term competitiveness and sustainability should
include the adoption and use of e-business capabilities. The organizations consistently have to
employ their institutional environment networks to get ideas and gather information to support
the process of recognition and develop new entrepreneurial opportunities based on the
continuing advances in e-business applications. The results also suggest that organizations
continuously need to evaluate the degree of their e-business entrepreneurship. The diversity of
adoption and actual use of e-business applications can be used as a major indicator to the degree
of corporate entrepreneurship and the extant of exploiting new entrepreneurial opportunities.
Despite its contributions, there are some limitations, which can serve as directions for
future research. The research framework needs to be tested empirically. Although the business
entrepreneurship has been measured in previous research, the present study does not provide a
methodology to follow for studying investigate the relationships between adoption drivers of
e-business innovations, degree of entrepreneurship, and the long-term sustainability from
entrepreneurship perspective.

267
References
- Andreu, L., Aldás, J., Bigné, J., and, A. (2010). An analysis of e-business adoption and its
impact on relational quality in travel agency–supplier relationships. Tourism Management,
31(6), pp. 777–787.
- Bateh, J., Horner, D., Broadbent, A., Fish, D. (2014). Towards a theoretical integration of
sustainability: A literature review and suggested way forward. Journal of Sustainability
Management, 2(1), pp. 35–42.
- Beckman, C., Eisenhardt, K., Kotha, S., Meyer, A., and Rajagopalan, N. (2012). The role of
the entrepreneur in technology entrepreneurship. Strategic Entrepreneurship Journal, 6(3),
pp. 203–206.
- Bhakoo, V. and Sohal, A. (2008). An Assessment into the drivers of e-business adoption within
the Australian pharmaceutical supply chain. In proceedings of the 39th Annual Meeting of the
Decision Sciences Institute at Baltimore, Maryland, USA, 22–25 November (2008).
- Brown, T., Davidsson, P., and Wiklund, J. (2001). An operationalization of Stevenson's
conceptualization of entrepreneurship as opportunity-based firm behavior. Strategic
Management Journal, 22(10), pp.953–968.
- Cassivi L. (2006). Collaboration planning in a supply chain. Chain Management: An
International Journal, 11(3), pp. 249–258.
- Chatterjee, D., Grewal, R., and Sambamurthy, V. (2002). Shaping up for e-commerce:
Institutional enablers of the organizational assimilation of web technologies. MIS Quarterly,
26(2), pp.65–89.
- Cohen, B. and Winn, M. (2007). Market imperfections, opportunity and sustainable
entrepreneurship. Journal of Business Venturing, 22(1), pp. 29–49.
- Covin, J. and Miles, J. (1999). Corporate entrepreneurship and the pursuit of competitive
advantage. Entrepreneurship Theory and Practice, 23(3), pp. 47–63.
- Crals, E. and Vereeck, L. (2005). The affordability of sustainable entrepreneurship certification
for SMEs. International Journal of Sustainable Development & World Ecology, 12(2), pp.
173–183
- Dess, G., Lumpkin, G., and McGee, J. (1999). Linking corporate entrepreneurship to strategy,
structure, and process: Suggested research directions. Entrepreneurship Theory & Practice,
23(3), pp. 85–102.
- DiMaggio, P. and Powell, W. (1983). The iron cage revisited: Institutional isomorphism and
collective rationality in organizational fields. American Sociological Review, 48(2), pp. 147–
160.
- Foster, J. and Lin, A. (2003). Individual differences in learning entrepreneurship and their
implications for Web-based instruction in e-business and ecommerce. British Journal of
Educational Technology, 34(4), pp. 455–465.
- Hsu, P., Kraemer, K., and Dunkle, D. (2006). Determinants of e-business use in us firms.
International Journal of Electronic Commerce, 10(4), pp 9–45.
- Hull, C., Hung, Y., Hair, N., and Perotti, V. (2007). Taking advantage of digital opportunities:
a typology of digital entrepreneurship. International Journal of Networking and Virtual
Organizations, 4(3), pp. 290–303.
- Huse, M. Neubaum, D., and Gabrielsson, J. (2005). Corporate innovation and competitive
environment. International Entrepreneurship and Management Journal, 1(3), pp. 313–333.
- Kanji, G. and Chopra, P. (2010). Corporate social responsibility in a global economy. Total
Quality Management, 21(2), pp. 119–143.
- Lai, K.-H., Wong, C., and Cheng, T. (2006). Institutional isomorphism and the adoption of
information technology for supply chain management. Computers in Industry, 57(1), pp. 93–
98.
268
- Ligthelm, A. (2010). Entrepreneurship and small business sustainability. Southern African
Business Review, 14(3), pp. 131–153.
- Lindgardt, Z., Reeves, M., Stalk, G. Deimler, M. (2009). Business model innovation: when
the game gets tough change the game. The Boston Consulting Group,
http://www.bcg.com/documents/file36456.pdf.
- Lumpkin, G. and Dess, G. (1996). Clarifying the entrepreneurial orientation construct and
linking it to performance. Academy of Management Review, 21(1), pp. 135–72.
- Miller, D. (1983). The correlates of entrepreneurship in three types of firms. Management
Science, 29(7), pp. 770–791.
- Mitchell, D. and Coles, C. (2004), Business model innovation breakthrough moves. Journal of
Business Strategy, 25(1), pp. 16–26.
- Morris, M. and Kuratko, D. (2002). Corporate Entrepreneurship, Harcourt College
Publishers, Orlando, Florida.
- Nieto, D. (2009). Sustainability and the recession. Manager: British Journal of Administrative
Management, 65, 24–25.
- Oliver, C. (1997). Sustainable competitive advantage: Combining Institutional and resource-
based views. Strategic Management Journal, 18 (9), pp. 697–713.
- Ranganathan, C., Teo, T., and Dhaliwal, J. (2011). Assimilation and diffusion of web
technologies in supply-chain management: An examination of key drivers and performance
impacts. International Journal of Electronic Commerce, 9(1), pp. 127–161.
- Rogers, E. (1995). Diffusion of Innovations (4th ed.). New York: Free Press.
- Rogers, E. (2003). The diffusion of innovations, 5th ed., New York: Free Press.
- Saprikis, V. and Vlachopoulou, M. (2012). Investigating factors influencing use of b2b e-
marketplaces in Greek dirms: The b2b e-MarkFLU framework. International Journal of
Business Information and Technology, 1(1), pp. 43–66.
- Scheepers, R., Hough, J., and Bloom,J. (2007). Entrepreneurial intensity: A comparative
analysis of established companies in South Africa. South African Journal of Economic and
Management Sciences, 10(2), pp. 238–255.
- Senge, P., Smith, B., Kruschwitz, N., Laur, J., and Schley, S. (2008). The necessary revolution
How Individuals and Organizations Are Working Together to Create a Sustainable World.
New York: Doubleday.
- Shane, S. and Venkataraman, S. (2000). The distinctive domain of entrepreneurship research.
Academy of Management Review, 25(1), pp. 217–2221.
- Strang, K. and Chan, C. (2010). Simulating e-business innovation Process Improvement with
Virtual Teams Across Europe and Asia. International Journal of E-Entrepreneurship and
Innovation, 1(1), pp. 22–4.
- Tang, J. Tang, Z. Marino, D. Zhang, Y. and Li, Q. (2008). Exploring an inverted U-shape
relationship between entrepreneurial orientation and performance in Chinese ventures.
Entrepreneurship and Theory in Practice, 32(1), pp. 219–239
- Tarofder, A.K, Marthandan, G, Haque, A. (2010). Critical factors for diffusion of web
technologies for supply chain management functions: Malaysian perspective. European
Journal of Social Sciences, 12(3), pp. 490–505.
- Teo, H.H., Wei, K.K., and Benbasat, I. (2003). Predicting intention to adopt interorganizational
linkages: An institutional perspective. MIS Quarterly, 27(1), pp. 19-49.
- Teo, T., Ranganathan, C., and Dhaliwal, J. (2006). Key dimensions of inhibitors for the
deployment of Web-based business-to-business electronic commerce. IEEE Transactions on
Engineering Management, 53 (3), pp. 395–411.
- Thomas, D. and Ranganathan, C. (2005). Enabling e-business transformation through
alliances: Integrating social exchange and institutional perspectives. In Proceedings of the 38th
269
Hawaii International Conference on System Sciences (HICSS), 3-6 January, 2005, Big Island,
HI, USA.
- Truong, D. (2008). An empirical study of business-to-business electronic marketplace
usage: The impact of buyers' e-readiness. Journal of Organizational Computing and Electronic
Commerce, 18(2), pp. 112–130.
- Waddell, D., Singh, M., and Musa, A. (2006). Entrepreneurial opportunities on the internet,
in F. Zhao (ed.) Entrepreneurship and Innovations in E-Business: An Integrative
Perspective, Idea Group, Hershey, United States, pp. 179-199.
- White, P. (2009). Building a sustainability strategy into the business. Corporate Governance,
9(4), pp. 386–394.
- Zahra, S. and Garvis, D. (2000). International corporate entrepreneurship and firm
performance: The moderating effect of international environmental hostility. Journal of
Business Venturing, 15(5), pp.469–492.
- Zahra, S. and George, G. (2002). International entrepreneurship: the current status of the field
and future research agenda. In Hitt, M., Ireland, R., and Sexton, D. (eds), Strategic
entrepreneurship: Creating a new mindset, pp. 255–288.
- Zhang, C. and Dhaliwal, J. (2009). An investigation of resource-based and institutional
theoretic factors in technology adoption for operations and supply chain management.
International Journal of Production Economics, 120(1), pp. 252–269.
- Zhao, F. (2006). Entrepreneurship and innovation in e-business: an integrative perspective,
in F. Zhao (ed.) Entrepreneurship and Innovations in E-Business: An Integrative
Perspective, Idea Group, Hershey, United States, pp. 1–17.
- Zupic, I. (2014). The knowledge base of technology entrepreneurship. In Therin, F. (ed.)
Handbook of Research on Techno-Entrepreneurship: How Technology and Entrepreneurship
are Shaping the Development of Industries and Companies, Edward Elgar Publishing.

270
The Interest Rate Ratchet in an Accelerator-
Cash Flow Model of Gross Nonresidential Fixed
Investment for the USA between 1950 and 1988
Ibrahim Alloush
Al- Zaytoonah University
Jordan
I – Introduction:
Nonresidential business investment in new plant and equipment remains a crucial factor
in the functioning of the economy. It has been perceived as an instigator of actual and potential
output growth as the rise in capital formation due to increased investment leads to expanding
the capital component K in a production function for the whole economy. Given other things,
an increase in output brings a lower rate of inflation (Klingaman and Koshal, 1982, p.100).
Furthermore, an increase in the rate of investment for whatever reason, e.g., external aid, in an
economy characterized by constant technology and aggregate demand may reduce
unemployment, and augment the supply of capital goods thereby lowering their prices and
indirectly the prices of consumer goods.
Bearing in mind that investment in plant and equipment is the origin of productive physical
capital, Denison (1980) estimated that “capital had been the source of 19% of the 1948-73
growth rate” (p.223). Eleven percent of the decline in the average growth rate of national
income, from 3.65% in period 48-73 to 2.38% in the period 73-78, has been accounted for by
the drop in the rate of capital accumulation, of which the drop in investment expenditure for
new plant and equipment represents about three-fifths (Denison, 1980, p.222). According to
the same author, “capital was the source of 18-percent of the growth rate in potential national
income”, and the “use of an alternative classification that reallocates gains from economies of
scale among other growth sources instead of considering them a separate growth source would
raise the percentages for the contribution of capital, those for nonresidential business by as
much as one-eighth. They would then range from 16 to 23 percent in 1948 – 73”, depending
on how the series is defined (Denison, 1980, p.221). Hence, the statistics cited above emphasize
the importance of nonresidential fixed investment to growth in national income through the
impact of investment on the capital stock and the rate of accumulation.
International economic competition, such as between the U.S. and China, has bestowed
upon the issue of nonresidential fixed investment added importance to the extent that
competition has to do with productivity. Since productivity is related to increases in the capital-
labor ratio, i.e., capital deepening, and hence to the capital-output ratio which is in its own turn
dependent on the ratio of net investment to GNP, the whole question of nonresidential fixed
investment assumes added relevance. Of particular importance was the fact that “the ratio of
gross investment to GNP has been relatively stable while net investment has declined
significantly between 1948 and 1979, and that “the fall in net nonresidential investment has
been particularly sharp” (Feldstein, 1983, p.144). Furthermore, in estimating quantitatively the
potential productivity path of the U.S. economy between 1955 and 1978, Coen and Hickman
(1980) found that capital “deepening was second only to technical progress as a source of …
growth during the postwar years and is projected to remain so along the natural path” (p.218).
Table 1 below provides the historical estimates of Coen and Hickman of potential annual rates
of change of man-hour productivity.

271
Table 1: Contributing Sources and Annual Rates of Change of Potential Man-Hour
Productivity
Period Productivity Technical
Progress
Capital
Deepening
Capital
Utilization
Labor
Quality
Labor
Utilization
55-68 2.82 1.62 1.09 0.10 0.01 0.00
68-73 1.46 1.03 0.69 - 0.11 - 0.19 0.04
73-78 1.04 1.03 0.40 - 0.41 0.00 0.01
The main conclusion to be drawn from Table 1 is that productivity has been increasing at
a decreasing rate between 1955 and 1978, and that has been accompanied by an increase at a
decreasing rate in capital accumulation and a decrease in the rate of capacity utilization as well.
In either case, the implication is that variations in capital, especially nonresidential fixed capital,
and therefore variations in investment in this form of capital affect productivity as much as they
do GNP growth, employment, and inflation. Consequently, the purpose of this paper is to
understand these variations by constructing a theory of nonresidential fixed investment and
testing it empirically.
In section II of this paper, the most important trends in the investment literature are reviewed.
Since most models of nonresidential fixed investment start from the relationship between
investment and the capital stock, this relationship between the two is analyzed in the
beginning of section II and then applied throughout the rest of the Review of Literature.
Section III provides an evaluation of the literature reviewed extracting those elements used to
build the model described in section IV.
The thesis of section IV is that nonresidential fixed investment is a function of aggregate
demand, the ratchet interest rate, the rate of profit per capacity utilized, and the level of
nonresidential fixed investment in the previous period. The assumption of the relationship is
that all these variables correlate positively with gross nonresidential fixed investment, except
for the ratchet interest rate which should correlate negatively with investment.
Eventually, the results of the statistical test of the model are discussed in section V.
II – Review of the Literature:
A – The Accelerator Model
In 1917, J.M. Clark formulated the first accelerator model relating changes in investment to
changes in aggregate output. The relationship was postulated to be linear with the capital
stock as a constant multiple of the level of output, such that:
Kt d = α Yt-s ,
Where Kt d is the desired capital stock in period t, and Yt-s is the level of aggregate demand in
the period t – s where s is the number of lags. A base of productive capacity, K, would be
necessary to support the level of output demand, Y, in the capital goods sector or the whole
economy (J.M. Clark, 1917, pp.217-35). The capital stock is adjusted, however, through “net
investment, which, in turn equals (the flow of) gross investment – that is, the production of
investment goods – minus (the flow of) depreciation” (G. Ackley, 1978, p.612). Thus,
(2) Kt = Kt-1 + It-1 – δ Kt-1
where Kt is the capital stock in period t, Kt-1 is the capital stock of the previous period, It-1 is
the level of gross investment in the previous period, and δ is the rate of depreciation of the
capital stock.

272
Since the original accelerator model is implicitly assuming that Kt d = Kt, meaning that the
actual capital stock adjusts completely to the desired capital stock, substitute (2) into (1):
(1a) Kt = Kt-1 + It-1 – δ Kt-1= Kt d = α Yt-s
It-1 = α Yt-s – (1 – δ) Kt-1
Adding one time period to all the variables,
(1b) It = α Yt-s+1 – (1 – δ) Kt
Thus, the relationship between the desired capital stock and the level of aggregate demand
specified in equation (1) could be extended to the relationship between the desired level of
gross investment, the level of output demand, and the stock of capital:
Itd = α Yt-s+1 – (1 – δ) Kt
(Since the capital stock is always adjusted through changes in the level of net investment and
the rate of depreciation, the relationship between the desired capital stock and the desired
level of gross investment will henceforth be applied to all the models reviewed in this section
of the paper).
P.K.Clark (1979) points out, nevertheless, that economists were not satisfied with this simple
accelerator model because it suffered from the unrealistic built-in assumption that the “capital
stock could be instantaneously adjusted to the desired level at no additional cost … as if net
additions to capital were instantaneously available at a constant price” (P.K. Clark, 1979,
p.77). In addition, adjustment may be incomplete because the rising supply prices for capital
goods, installation costs, and production lags may increase costs to the point where only
partial adjustment is optimal (P.K. Clark, 1979, p.78).
A capital stock adjustment model of a dynamic nature was, henceforth, developed by Roy F.
Harrod in his “Essay in Dynamic Theory” in 1939 under the influence of Keynes’ The
General Theory of Employment, Interest, and Money (Rima, 1978, p.416). Following
Harrod’s model, an adjustment-cost approach was fully constructed by Eisner and Strotz
(P.K. Clark, 1979, p. 78), the pertinent version of which would be:
It - It-1 = λ (Itd - It-1) + ut ,
Where the difference between actual and optimal gross investment is eliminated at the speed
of the adjustment coefficient, λ. Substituting equation (3) into model (4), we get
Itd = λ α Yt-s – λ (1 – δ) Kt + (1 - λ) It-1 + ut ,
Which states that desired gross investment, Itd, is a function of output in period s, Yt-s, the
level of gross investment in the previous period, It-1, and the capital stock in period t, Kt,
subject to an adjustment coefficient, λ.
Model (5), however, is never used in this form. It is rather the basis upon which Keynesian,
neoclassical, or a synthesis of Keynesian-neoclassical models are built. Other variables, such
as Keynesian cash flow variables or neoclassical production functions are usually substituted
into the model. These variations are analyzed in the subsequent parts of this section.
B – Keynesian Flow Variables

273
One variation combines the original simple accelerator model, Kt d = Kt = α Yt-s , with cash
flow variables first laid out by Keynes as determinants of investment. In chapter 11 of his
General Theory, Keynes linked investment spending to the present value of stream of profit
flows expected from an extra built unit of capital accumulation. For a given investment
decision, Keynes considered cost and the flow of net returns from period 1 to period n. Then,
he evaluated the marginal efficiency of an investment project which he defined as the rate of
interest that will discount the present value of the project to zero. Kalecki (1969) developed
this approach most fully after economists had been working on the influence of flow variables
on various aspects of investment throughout the sixties. These economists emphasized,
following in the footsteps of Keynes, flow variables like the present value of profit flows, the
ability of firms to generate investment funds from profits and through debt finance, and the
level of net annual interest expense. In the eighties, it has been suggested that accelerator
variables like output, sales, or capacity utilization and flow variables like after-tax profit that
affect the finances of the firm and therefore its ability to invest, would have a strong positive
influence on nonresidential fixed investment. The flow form of interest, i.e., interest
commitments of firms, would have a negative impact (e.g., see Fazzari and Mott, 1986,
p.173). This school’s specification of model (5) then would be:
Itd = It = α Yt-s + ß Πt-s + γ Γ t-s + ut ,
Such that α > 0, ß > 0, and γ < 0, and where Π equals after-tax profit plus depreciation
allowance minus dividends, and Γ is the annual interest expense. As is obvious from model
(6), all independent variables are lagged by the period s. Finally, since the levels of optimal
and actual investment are implicitly assumed to be always equal (Itd = It), no adjustment term,
λ, is included.
C – The Accelerator-Flow Model
The simple accelerator-flow model described in part B of this section has evolved in several
directions in recent literature. Although cash flow variables are considered amongst the main
sources of internal funding of investment since they are generally cheaper than external
finance as proposed by Duesenberry in his book Business Cycles and Economic Growth
(McGraw-Hill, 1958), and although they predict the direction of future output and
profitability, flow variables would perform better when integrated in the adjustment-cost
framework. The purpose of such integration would be to combine flow variables with an
adjustment-cost approach. And the resulting accelerator-flow model has the additional
advantage of capturing the restraint imposed by the increasing marginal cost of supplying
capital, and the effect of the irreversibility of investments projects over and above the simple
flow model. Eisner (1978) is a leading proponent of this type of model.
Adding a profit variable to model (4), we obtain,
It - It-1 = λ (Itd - It-1 ) + ß Πt-s + ut,
Then substituting equation (3) into model (7), we get,
It = λ α Yt-s – λ (1 – δ) Kt + (1 - λ) It-1 + ß Πt-s + ut .
D – The Neoclassical Model
In the Classical tradition of Adam Smith and David Ricardo, profits are the source of all
capital accumulation. Investment is seen to respond to output demand, but increases in output
demand are the result of increases in capital accumulation. That’s because according to Say’s
Law supply creates its own demand. Technically, the output of any industry is a function of
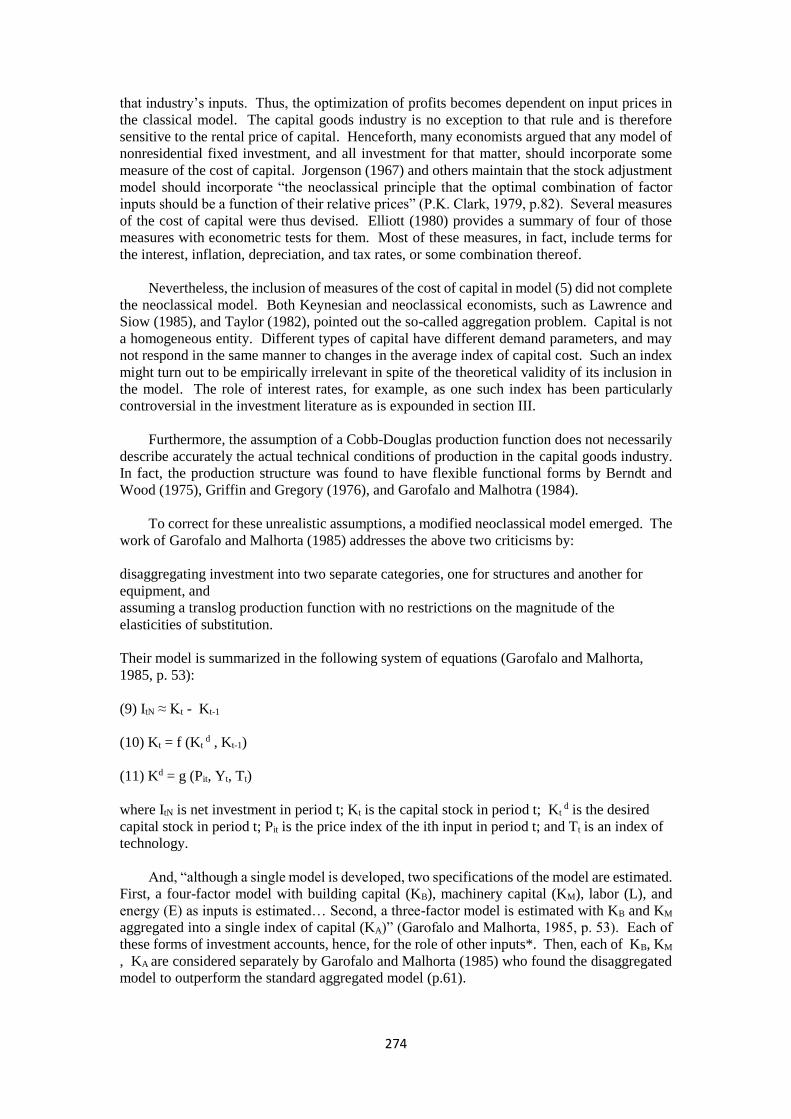
274
that industry’s inputs. Thus, the optimization of profits becomes dependent on input prices in
the classical model. The capital goods industry is no exception to that rule and is therefore
sensitive to the rental price of capital. Henceforth, many economists argued that any model of
nonresidential fixed investment, and all investment for that matter, should incorporate some
measure of the cost of capital. Jorgenson (1967) and others maintain that the stock adjustment
model should incorporate “the neoclassical principle that the optimal combination of factor
inputs should be a function of their relative prices” (P.K. Clark, 1979, p.82). Several measures
of the cost of capital were thus devised. Elliott (1980) provides a summary of four of those
measures with econometric tests for them. Most of these measures, in fact, include terms for
the interest, inflation, depreciation, and tax rates, or some combination thereof.
Nevertheless, the inclusion of measures of the cost of capital in model (5) did not complete
the neoclassical model. Both Keynesian and neoclassical economists, such as Lawrence and
Siow (1985), and Taylor (1982), pointed out the so-called aggregation problem. Capital is not
a homogeneous entity. Different types of capital have different demand parameters, and may
not respond in the same manner to changes in the average index of capital cost. Such an index
might turn out to be empirically irrelevant in spite of the theoretical validity of its inclusion in
the model. The role of interest rates, for example, as one such index has been particularly
controversial in the investment literature as is expounded in section III.
Furthermore, the assumption of a Cobb-Douglas production function does not necessarily
describe accurately the actual technical conditions of production in the capital goods industry.
In fact, the production structure was found to have flexible functional forms by Berndt and
Wood (1975), Griffin and Gregory (1976), and Garofalo and Malhotra (1984).
To correct for these unrealistic assumptions, a modified neoclassical model emerged. The
work of Garofalo and Malhorta (1985) addresses the above two criticisms by:
disaggregating investment into two separate categories, one for structures and another for
equipment, and
assuming a translog production function with no restrictions on the magnitude of the
elasticities of substitution.
Their model is summarized in the following system of equations (Garofalo and Malhorta,
1985, p. 53):
(9) ItN ≈ Kt - Kt-1
(10) Kt = f (Kt d , Kt-1)
(11) Kd = g (Pit, Yt, Tt)
where ItN is net investment in period t; Kt is the capital stock in period t; Kt d is the desired
capital stock in period t; Pit is the price index of the ith input in period t; and Tt is an index of
technology.
And, “although a single model is developed, two specifications of the model are estimated.
First, a four-factor model with building capital (KB), machinery capital (KM), labor (L), and
energy (E) as inputs is estimated… Second, a three-factor model is estimated with KB and KM
aggregated into a single index of capital (KA)” (Garofalo and Malhorta, 1985, p. 53). Each of
these forms of investment accounts, hence, for the role of other inputs*. Then, each of KB, KM
, KA are considered separately by Garofalo and Malhorta (1985) who found the disaggregated
model to outperform the standard aggregated model (p.61).

275
*Note: [Garofalo and Malhorta develop their reasoning in several pages of mathematical
derivations. To exemplify the influence of the production function on the stock of optimum
capital without reproducing Garofalo and Malhorta’s mathematics, a simplified summary of
Jorgenson’s pioneering analysis (1967) is provided.
Given the Cobb-Douglas production function, y = α Kγ L(1-γ)
)1()1(/ LKKy
KLKKy /][/ )1(
KyKy //
Setting the value of this marginal product (γy/K times p) equal to the rental price of
capital, c, and rearranging gives:
K = (p γy) / c = K*, where K* is the optimum capital stock (G. Ackley, 1978, p.634) (end of
note)].
Following the line of reasoning developed earlier in part A of this section on the
relationship between the capital stock and the level of investment, Kt is substituted with the
level of gross investment It , and Kt d with the level of desired gross investment It
d . Disregarding
equation (9), and substituting equation (11a) into (10a) below, we get the following functional
form for the modified neoclassical model in equation (12):
(10a) It - It-1 = λ (Itd
- It-1) + ut , i.e., model (4),
(11a) Itd = α Pit + β Yt + γ Tt – (1- δ) Kt ,
Now substituting (11a) into (10a) we get:
(12) It = λα Pit + λβ Yt + λγ Tt – λ(1- δ) Kt + (1 – λ)It-1 + ut .
E – The Q-Theory of Investment
While all the preceding four variations of investment models use a combination of real
variables relating to output, interest, and after-tax profits, the q-theory of investment, first
expounded by Jamis Tobin (1967), is modeled in a financial formula. “If the market value of
a firm exceeds the replacement cost of its assets, it can increase its market value by investing
in more fixed capital. Conversely, if the market value of a firm is less than the replacement
cost of its assets, it can increase the value of shareholders equity by reducing the stock of fixed
assets” (P.K.Clark, 1979, p.84). Thus, variations in investment will be dependent on variations
in Q, where Q equals the ratio of a firm’s value to its replacement cost of capital.
Thus, given
(4) It - It-1 = λ (Itd - It-1) + ut , where according to the q-theory of investment,
Itd = a Q t-s.
Substituting equation (13) above into model (4), we obtain
It = λ a Q t-s + (1 – λ) It-1 + ut.
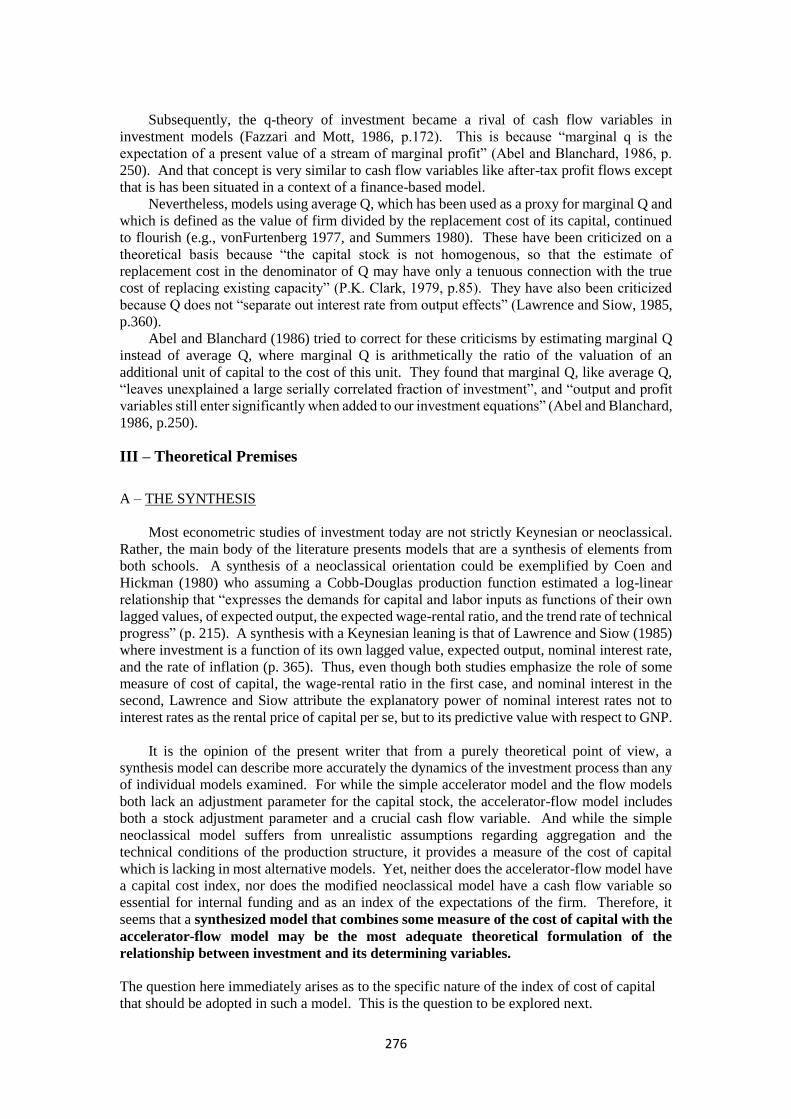
276
Subsequently, the q-theory of investment became a rival of cash flow variables in
investment models (Fazzari and Mott, 1986, p.172). This is because “marginal q is the
expectation of a present value of a stream of marginal profit” (Abel and Blanchard, 1986, p.
250). And that concept is very similar to cash flow variables like after-tax profit flows except
that is has been situated in a context of a finance-based model.
Nevertheless, models using average Q, which has been used as a proxy for marginal Q and
which is defined as the value of firm divided by the replacement cost of its capital, continued
to flourish (e.g., vonFurtenberg 1977, and Summers 1980). These have been criticized on a
theoretical basis because “the capital stock is not homogenous, so that the estimate of
replacement cost in the denominator of Q may have only a tenuous connection with the true
cost of replacing existing capacity” (P.K. Clark, 1979, p.85). They have also been criticized
because Q does not “separate out interest rate from output effects” (Lawrence and Siow, 1985,
p.360).
Abel and Blanchard (1986) tried to correct for these criticisms by estimating marginal Q
instead of average Q, where marginal Q is arithmetically the ratio of the valuation of an
additional unit of capital to the cost of this unit. They found that marginal Q, like average Q,
“leaves unexplained a large serially correlated fraction of investment”, and “output and profit
variables still enter significantly when added to our investment equations” (Abel and Blanchard,
1986, p.250).
III – Theoretical Premises
A – THE SYNTHESIS
Most econometric studies of investment today are not strictly Keynesian or neoclassical.
Rather, the main body of the literature presents models that are a synthesis of elements from
both schools. A synthesis of a neoclassical orientation could be exemplified by Coen and
Hickman (1980) who assuming a Cobb-Douglas production function estimated a log-linear
relationship that “expresses the demands for capital and labor inputs as functions of their own
lagged values, of expected output, the expected wage-rental ratio, and the trend rate of technical
progress” (p. 215). A synthesis with a Keynesian leaning is that of Lawrence and Siow (1985)
where investment is a function of its own lagged value, expected output, nominal interest rate,
and the rate of inflation (p. 365). Thus, even though both studies emphasize the role of some
measure of cost of capital, the wage-rental ratio in the first case, and nominal interest in the
second, Lawrence and Siow attribute the explanatory power of nominal interest rates not to
interest rates as the rental price of capital per se, but to its predictive value with respect to GNP.
It is the opinion of the present writer that from a purely theoretical point of view, a
synthesis model can describe more accurately the dynamics of the investment process than any
of individual models examined. For while the simple accelerator model and the flow models
both lack an adjustment parameter for the capital stock, the accelerator-flow model includes
both a stock adjustment parameter and a crucial cash flow variable. And while the simple
neoclassical model suffers from unrealistic assumptions regarding aggregation and the
technical conditions of the production structure, it provides a measure of the cost of capital
which is lacking in most alternative models. Yet, neither does the accelerator-flow model have
a capital cost index, nor does the modified neoclassical model have a cash flow variable so
essential for internal funding and as an index of the expectations of the firm. Therefore, it
seems that a synthesized model that combines some measure of the cost of capital with the
accelerator-flow model may be the most adequate theoretical formulation of the
relationship between investment and its determining variables.
The question here immediately arises as to the specific nature of the index of cost of capital
that should be adopted in such a model. This is the question to be explored next.

277
B – THE INTEREST RATE CONTROVERSY
Despite the standard assumption that investment and interest rates are inversely related,
much controversy surrounds this issue on the empirical level. Benanke (1983), using a q-theory
of investment approach to test date for the years 1947 – 79, found that an increase in real interest
rates of one-percent (holding nominal interest rates constant) decreases net equipment
investment by 12.1%, while investment in net structures decreased by only 6.3%. By contrast,
Feldstein (1983) found after using data for the years 1948 – 79 that “high interest rates may
have caused firms to reduce investment in long-lived structures by more than the reduction in
equipment investment” (p.148). To complicate things further, Lawrence and Siow (1985)
found while studying investment in producer equipment in the years 1947 –80 that “higher
nominal interest rates would be inversely related with new investment expenditure decisions,
despite the fact that real interest rates remained constant” (p.361). They, however, concluded
that even though “the real cost of capital does matter in explaining investment initially… this
effect is relatively small and becomes insignificant after two quarters in the case of producer
equipment” (p.374).
Other writers led by Clark (1979) state that the rental price of capital services “is not very
helpful in explaining quarterly data on business fixed investment in the United States over the
past twenty-five years”, 1954-1978 (p. 104). Clark, nevertheless, does not formally reject the
inverse relationship between interest rates and investment, but claims it must be estimated “with
more comprehensive data than quarterly aggregates” (1979, p.104). Clark then proceeds to
contradict Lawrence and Siow writing that this relationship is “likely to be felt gradually, over
long periods of time” (1979, p.104).
Consequently, the present writer agrees with Lawrence and Siow that “because of all these
conflicting results, how interest rates affect investment behavior remains inconclusive although
this is an important question in macroeconomic modeling and the theory of the business cycle”
(1985, p.360). Thus, it seems that the nature of the relationship between interest rate and
investment depends on whether tax and depreciation rates are included in the rental price of
capital services term, how the model is specified mathematically, and the number of distributed
lags, to choose a few among many possibilities.
Moreover, in view of the fact that most models use quarterly data, it appears appropriate
to take Clark’s advice regarding the need of “using more comprehensive data than quarterly
aggregates” in building a new model of investment. Hence, this paper examines historical
trends rather than quarter-to-quarter variations in an effort to focus on some of the more long
term and substantive causal factors.
Finally, this model will test the hypothesis presented in some recent articles that assert that
the relationship between real interest rates and investment is subject to a ratchet effect (Larkins
and Gill, 1985). The ratchet principle emphasizes the impact of the last highest value of real
interest rate on investment. Thus, as real interest rates rise, the cost of investing grows larger
which triggers shifts to new investment techniques designed to diminish cost. When interest
rates recede from their previous peak, the new technology remains installed until a still higher
interest rate is recorded. One example would be a rise in the cost of inputs compounded by a
higher rate of interest that induces businesses to invest in and adopt a new technology which is
neither labor nor energy-intensive (Feldstein, 1983, p. 148).
IV – Model and Data
In the preceding pages it was suggested that a synthesis of the accelerator-flow model that
incorporates some measure of interest rate would be more justified theoretically than the other
alternative models. It was also pointed out that since the exact relationship between interest

278
rates and investment is not yet established, the choice of any particular measure of interest rate
as a cost of capital goods is still open to experimentation. In this paper, interest rates are
included as a ratchet variable in an attempt to test its effect on business expenditure for new
plant and equipment, as proposed by Larkins and Gill (1985). In accordance with Clark’s
suggestion (1979, p. 104), annual data are used estimation purposes for the years 1950 – 1988.
Theoretically, the ratchet interest rate, Rt, and the level of real output, Yt, are hypothesized to
determine the level of the optimal or desired new business spending for plant and equipment,
Itd . This relationship could be written as follows:
Itd = a0 + (a1 – a2 Rt) Yt,
Whereby the impact of the ratchet real interest rate increases as the level of real output
increases; and where Yt is equal to real personal consumption, Ct, plus real gross investment,
It, plus real government spending, Gt, plus real net exports, Xt, i.e., Yt is equal to GNPt, thus
the identity:
(16) Yt ≈ Ct + It + Gt + Xt = GNPt
In defining Yt as real demand in the economy, we have adopted the principle that investment
in the capital goods sector is undertaken to support the activities of the rest of the economy,
which is an adaptation of the principle used by Larkins and Gill to describe the relationship
between inventories and final business sales (1985, p.18).
Model (4) which as be recalled states that the difference between actual and desired
investment is eliminated at the speed of the partial adjustment coefficient λ,
(4) It - It-1 = λ (Itd - It-1) + ut ,
where 0 ≤ λ ≤ 1. Hence, if λ = 1, the gap between actual and desired investment is narrowed
in the current period, whereas if λ = 0, the gap remains unbridged.
Substituting equation (15) into model (4),
(17) It - It-1 = λ [(a0 + (a1 – a2 Rt) Yt - It-1] + ut
In addition our model includes factors that impinge on the investment process without
being part of the accelerator or adjustment mechanisms. The most important among these are:
a cash flow variable as it is the source of internal funding for investment, and as it is the
source of future output and profitability. Since profit is targeted by economists as the prime
cash flow variable, we use real after-tax profits of non-financial corporate business without
inventory valuation adjustment and capital consumption allowance, πt. Profits, πt , are then
divided by a proxy for capacity utilization, the total manufacturing capacity utilization rate,
CPt. The resulting series, (πt / CPt), is technically a measure of the average profit per one-
percent of capacity utilized, where profit is measured in real billion dollars. It is expected that
the term (πt / CPt) will have a strong positive impact on the level of investment as the latter is
theorized to be a function of profits (vonUngern-Sternberg, 1980, p.747).
a dummy variable for recession years, DR, as it is expected the level of investment will
fall disproportionately in recession years due to bleak expectations on profits and output
demand.
A dummy variable, DT, to capture the change in tax parameters after the Economic
Recovery Tax Act, ERTA, which was signed into law in August 1981, but which began to exert

279
its impact on investment expenditure in 1983 – 1984. “The corporate income tax was …
reduced from 48 to 46 percent, and ERTA allowed accelerated depreciation of new capital
assets and a system of tax credits for investment. Both of these provisions decreased the
effective tax burden on new investment” (Schnitzer, 1987, p.134). Thus, the variable, DT, is
expected to have a positive impact on investment as a lower tax burden will increase after-tax
profits, and thereby shift the investment function upward.
Substituting πt , DR, and DT above into model (17), we obtain:
(18) It - It-1 = λ [(a0 +(a1 – a2 Rt)Yt - It-1] + a3 (πt / CPt) + a4 DR + a5 DT +
vt ,
where vt is the disturbance term.
Solving for the level of gross investment in the current period, It , we get:
(18a) It = λa0 + λa1 Yt – λa2 RtYt + (1 – λ) It-1 + a3 (πt / CPt) + a4 DR
+ a5 DT + vt ,
which is the final equation to be estimated with the OLS procedure. It should be noted,
however, that the coefficient of output demand, Yt, and that of the ratchet interest rate, Rt,
represent only short-run estimations of the impact of changes in these independent variables on
the level of investment. To calculate the long-run estimations, a1 and a2, λa1 and λa2 have to be
divided by λ which represents the speed of adjusting the actual to the desired level. How λ is
arithmetically obtained from the coefficient of the lagged investment variable, It-1 , will be
shown in the next section.
The data used in the estimation of model (18a) are all obtained from the Economic Report
of the President. Output demand, gross investment, and profits are all annual rates measured
in billions of current dollars then deflated by the Producer Price Index, base year – 1982. The
capacity utilization variable is represented by the output-capacity ratio for the manufacturing
sector annual rates.
The generation of numerical values for the ratchet interest rate variable is fairly simple.
First, the rate of change in the Producer Price Index, base year, 1982, is subtracted from
commercial paper rate (6 months) to derive real interest rates. The first value of the real rate of
interest is set equal to the first value in the ratchet series. If the second value of the real rate of
interest is greater than the first, the second value is recorded after the first ratchet value. If not,
the first ratchet value is retained throughout the subsequent years until the next higher real
interest rate comes along. Thus, the last highest value for the real interest rate is recorded so
long as it is above that of the preceding years. When this procedure is completed, we should
end up with a real interest rate series where the last highest value of the ratchet series where the
highest value of the ratchet series is the same as the last highest in the interest rates series.
V – RESULTS
Applying the OLS method to model (18a), and using the above annual data, the following
results are obtained:
It = - 22.86 – 0.039 Yt – 0.052 RtYt + 0.59 It-1 + 23.06 πt/CPt - 14.57 DR
+ 13.98 DT
Table 2: Estimated Coefficients and Associated T-Values
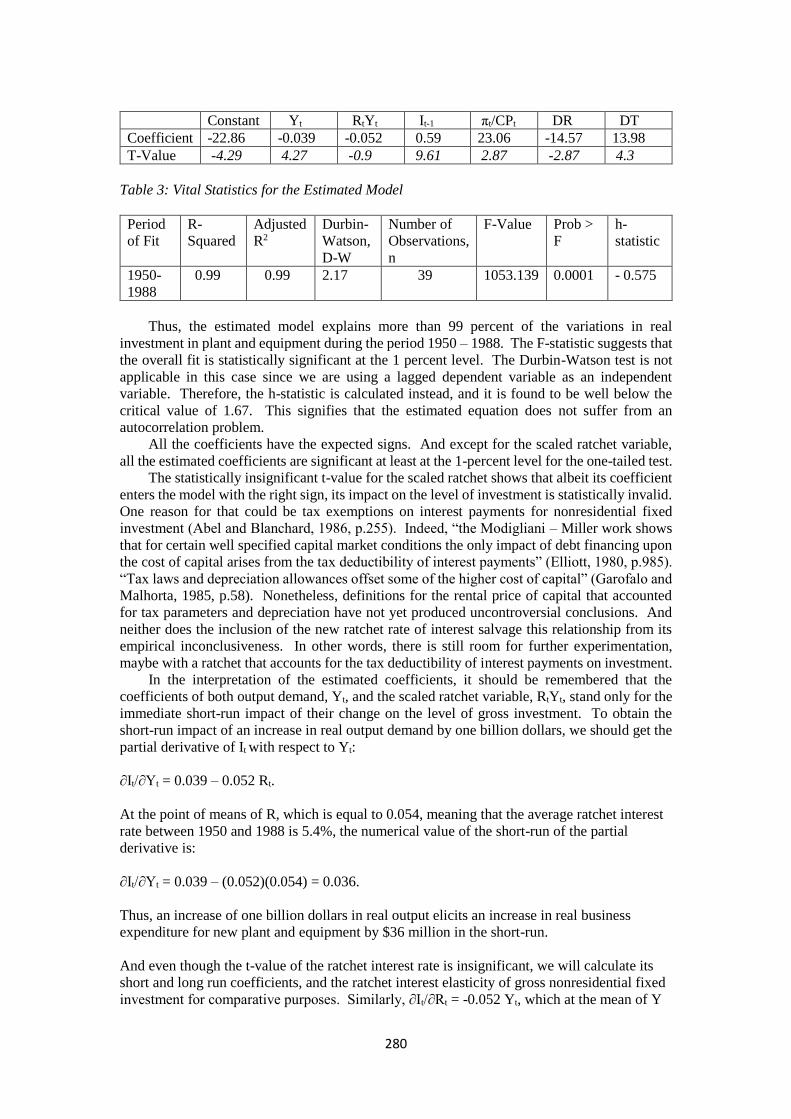
280
Constant Yt RtYt It-1 πt/CPt DR DT
Coefficient -22.86 -0.039 -0.052 0.59 23.06 -14.57 13.98
T-Value -4.29 4.27 -0.9 9.61 2.87 -2.87 4.3
Table 3: Vital Statistics for the Estimated Model
Period
of Fit
R-
Squared
Adjusted
R2
Durbin-
Watson,
D-W
Number of
Observations,
n
F-Value Prob >
F
h-
statistic
1950-
1988
0.99 0.99 2.17 39 1053.139 0.0001 - 0.575
Thus, the estimated model explains more than 99 percent of the variations in real
investment in plant and equipment during the period 1950 – 1988. The F-statistic suggests that
the overall fit is statistically significant at the 1 percent level. The Durbin-Watson test is not
applicable in this case since we are using a lagged dependent variable as an independent
variable. Therefore, the h-statistic is calculated instead, and it is found to be well below the
critical value of 1.67. This signifies that the estimated equation does not suffer from an
autocorrelation problem.
All the coefficients have the expected signs. And except for the scaled ratchet variable,
all the estimated coefficients are significant at least at the 1-percent level for the one-tailed test.
The statistically insignificant t-value for the scaled ratchet shows that albeit its coefficient
enters the model with the right sign, its impact on the level of investment is statistically invalid.
One reason for that could be tax exemptions on interest payments for nonresidential fixed
investment (Abel and Blanchard, 1986, p.255). Indeed, “the Modigliani – Miller work shows
that for certain well specified capital market conditions the only impact of debt financing upon
the cost of capital arises from the tax deductibility of interest payments” (Elliott, 1980, p.985).
“Tax laws and depreciation allowances offset some of the higher cost of capital” (Garofalo and
Malhorta, 1985, p.58). Nonetheless, definitions for the rental price of capital that accounted
for tax parameters and depreciation have not yet produced uncontroversial conclusions. And
neither does the inclusion of the new ratchet rate of interest salvage this relationship from its
empirical inconclusiveness. In other words, there is still room for further experimentation,
maybe with a ratchet that accounts for the tax deductibility of interest payments on investment.
In the interpretation of the estimated coefficients, it should be remembered that the
coefficients of both output demand, Yt, and the scaled ratchet variable, RtYt, stand only for the
immediate short-run impact of their change on the level of gross investment. To obtain the
short-run impact of an increase in real output demand by one billion dollars, we should get the
partial derivative of It with respect to Yt:
∂It/∂Yt = 0.039 – 0.052 Rt.
At the point of means of R, which is equal to 0.054, meaning that the average ratchet interest
rate between 1950 and 1988 is 5.4%, the numerical value of the short-run of the partial
derivative is:
∂It/∂Yt = 0.039 – (0.052)(0.054) = 0.036.
Thus, an increase of one billion dollars in real output elicits an increase in real business
expenditure for new plant and equipment by $36 million in the short-run.
And even though the t-value of the ratchet interest rate is insignificant, we will calculate its
short and long run coefficients, and the ratchet interest elasticity of gross nonresidential fixed
investment for comparative purposes. Similarly, ∂It/∂Rt = -0.052 Yt, which at the mean of Y
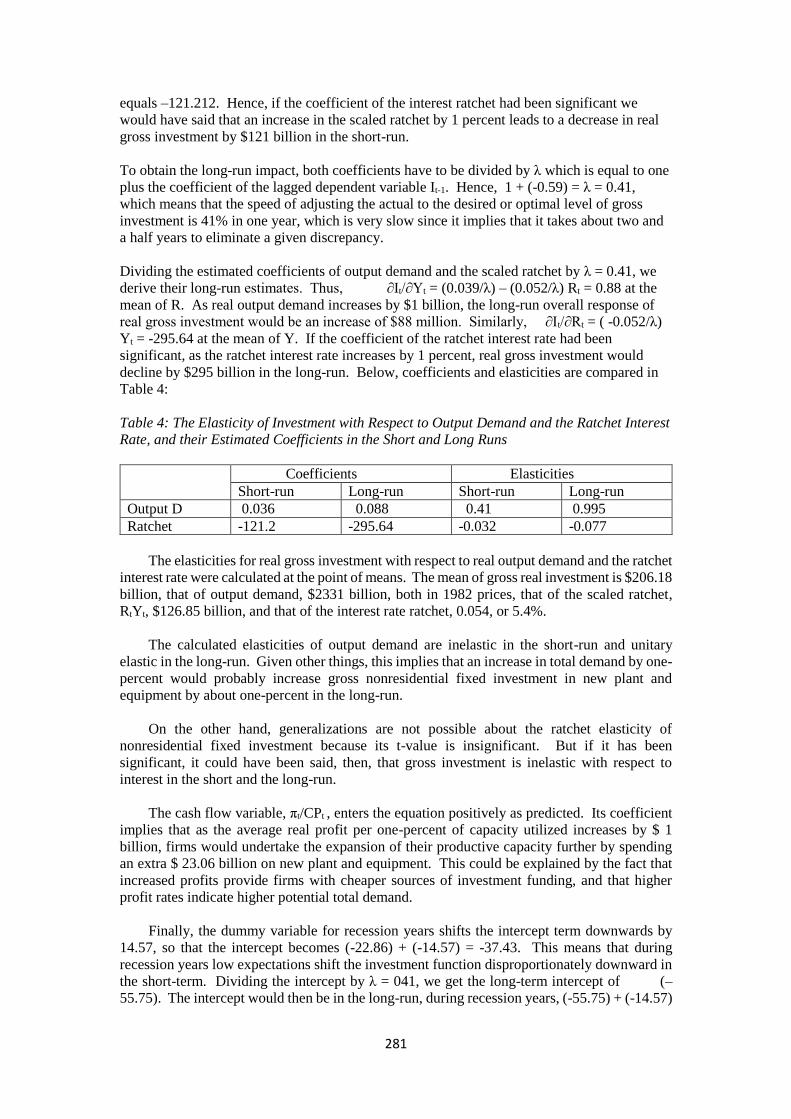
281
equals –121.212. Hence, if the coefficient of the interest ratchet had been significant we
would have said that an increase in the scaled ratchet by 1 percent leads to a decrease in real
gross investment by $121 billion in the short-run.
To obtain the long-run impact, both coefficients have to be divided by λ which is equal to one
plus the coefficient of the lagged dependent variable It-1. Hence, 1 + (-0.59) = λ = 0.41,
which means that the speed of adjusting the actual to the desired or optimal level of gross
investment is 41% in one year, which is very slow since it implies that it takes about two and
a half years to eliminate a given discrepancy.
Dividing the estimated coefficients of output demand and the scaled ratchet by λ = 0.41, we
derive their long-run estimates. Thus, ∂It/∂Yt = (0.039/λ) – (0.052/λ) Rt = 0.88 at the
mean of R. As real output demand increases by $1 billion, the long-run overall response of
real gross investment would be an increase of $88 million. Similarly, ∂It/∂Rt = ( -0.052/λ)
Yt = -295.64 at the mean of Y. If the coefficient of the ratchet interest rate had been
significant, as the ratchet interest rate increases by 1 percent, real gross investment would
decline by $295 billion in the long-run. Below, coefficients and elasticities are compared in
Table 4:
Table 4: The Elasticity of Investment with Respect to Output Demand and the Ratchet Interest
Rate, and their Estimated Coefficients in the Short and Long Runs
Coefficients Elasticities
Short-run Long-run Short-run Long-run
Output D 0.036 0.088 0.41 0.995
Ratchet -121.2 -295.64 -0.032 -0.077
The elasticities for real gross investment with respect to real output demand and the ratchet
interest rate were calculated at the point of means. The mean of gross real investment is $206.18
billion, that of output demand, $2331 billion, both in 1982 prices, that of the scaled ratchet,
RtYt, $126.85 billion, and that of the interest rate ratchet, 0.054, or 5.4%.
The calculated elasticities of output demand are inelastic in the short-run and unitary
elastic in the long-run. Given other things, this implies that an increase in total demand by one-
percent would probably increase gross nonresidential fixed investment in new plant and
equipment by about one-percent in the long-run.
On the other hand, generalizations are not possible about the ratchet elasticity of
nonresidential fixed investment because its t-value is insignificant. But if it has been
significant, it could have been said, then, that gross investment is inelastic with respect to
interest in the short and the long-run.
The cash flow variable, πt/CPt , enters the equation positively as predicted. Its coefficient
implies that as the average real profit per one-percent of capacity utilized increases by $ 1
billion, firms would undertake the expansion of their productive capacity further by spending
an extra $ 23.06 billion on new plant and equipment. This could be explained by the fact that
increased profits provide firms with cheaper sources of investment funding, and that higher
profit rates indicate higher potential total demand.
Finally, the dummy variable for recession years shifts the intercept term downwards by
14.57, so that the intercept becomes (-22.86) + (-14.57) = -37.43. This means that during
recession years low expectations shift the investment function disproportionately downward in
the short-term. Dividing the intercept by λ = 041, we get the long-term intercept of (–
55.75). The intercept would then be in the long-run, during recession years, (-55.75) + (-14.57)

282
= -70.32, which shows that a recession would shift investment downward in the long-run even
further.
By comparison, the dummy variable denoting the change in tax rules shifts the intercept
term upwards by 13.98, so that it becomes in the short-run (-22.86) + (13.98) = - 8.57, which
shows that the tax laws introduced in the beginning of the eighties have had a positive impact
on nonresidential fixed investment. The same institutional change in tax rules has a long-run
effect that is also positive albeit weaker. Thus in the long-run, (-55.75) + (13.98) = -41.77 is
the intercept of the investment function in the aftermath of the change in tax parameters.
The statistical results analyzed above show that while no exact relationship, if any, could
be established between the ratchet interest rate, on one hand, and gross nonresidential fixed
investment on the other, investment is mostly influenced by total output demand and the
average profit rate per unit of capacity utilized. The influence of output demand in the whole
economy is both short-run and long-run with the long-run impact well above than twice the
short-run effect. The potent effect of the profit variable corroborates the findings of other
papers, e.g., Eisner, 1978, and Fazzari and Mott, 1986, which emphasize the role of cash flow
variables, like profit, to investment.
The output demand elasticity of gross investment which is almost unitary elastic in the
long-run suggests that policy recommendations oriented towards stimulating output might
better stimulate investment than policies that seek to control investment through interest rates.
This is because according to this paper, and many others, a definite causality could not be
established between interest rates and gross nonresidential fixed investment in new plant and
equipment. A ratchet interest rate variable does not clear the ambiguity that shrouds this
relationship even in the context of an accelerator-cash flow model.
Bibliography
Abel, A.B. and Blanchard, O.J., “The Present Value of Profits and Cyclical Movements in
Investment”, Econometrica, March 1986, 54(2), pp. 249 –73.
Ackley, G., “Macroeconomics: Theory and Policy”, London: Macmillan, 1978.
Bernanke, B.S., “The Determinants of Investment: Another Look”, American Economic
Review, May 1983, 73(2), pp.71-75.
Berndt, E.R. and Woods, D.O., “Technology, Prices, and the Derived Demand for Energy”,
Review of Economics and Statistics, 1975, 57(3), pp. 259 – 68.
Clark, J.M., “Business Acceleration and the Law of Demand: A Technical Factor in
Economic Cycles”, Journal of Political Economy, March 1917, 25, pp.217 – 35.
Clark, P.K., “Investment in the 1970’s: Theory, Performance, and Prediction”, Brookings
Papers on Economic Activity, 1979, (1), pp. 73 –117.
Coen, R.M. and Hickman, B.G., “Investment and Growth in an Econometric Model of the
United States”, American Economic Review, May 1980, 70(2), pp. 214-9.
Denison, E.F., “The Contribution of Capital to Economic Growth”, American Economic
Review, May 1980, 70(2), pp.220-4.
Duesenberry, J.S., “Business Cycles and Economic Growth”, New York: McGraw-Hill, 1958.
Eisner, R., “Factors in Business Investment”, Cambridge, Mass.: National Bureau of
Economic Research, 1978.
Elliott, J.W., “The Cost of Capital and U.S. Capital Investment: A Test of Alternative
Concepts”, Journal of Finance, September 1980, 35(4), pp. 981-99.
Fazzari, S.M. and Mott, T.L., “The Investment Theories of Kalecki and Keynes: An Empirical
Study of Firm Data, 1970-1982”, Journal of Post-Keynesian Economics, Winter 1986-87,
9(2), pp. 171-87.
Feldstein, M., “Has the Rate of Investment Fallen?”, Review of Economics and Statistics,
February 1983, 65(1), pp.144-9.
283
vonFurstenburg, G.M., “Corporate Investment: Does Market Valuation Matter in the
Aggregate?”, Brookings Papers on Economic Activity, 1977, (2), pp. 347-97.
Garofalo, G.A. and Malhorta, D.M., “Input Substitution in the Manufacturing Sector during
the 1970’s: A Regional Analysis”, Journal of Regional Science, 1984, 24(1), pp. 51-63.
--------------------------------------------- “The Impact of Changes in Input Prices on Net
Investment in U.S. Manufacturing”, Atlantic Economic Journal, December 1985, 13(4), pp.
52-62.
Griffin, J.M. and Gregory, P.R., “An Inter-Country Translog Model of Energy Substitution
Responses”, American Economic Review, 1976, 66(5), pp. 845-57.
Harrod, R.F., “An Essay in Dynamic Theory”, Economic Journal, March 1939, 49.
Jorgenson, D.W., “The Theory of Investment Behavior”, in Determinants of Investment
Behavior, edited b Robert Ferber, New York: National Bureau of Economic Research, 1967.
Kalecki, M., “The Theory of Economic Dynamics”, New York: Kelly, 1969.
Keynes, J.M., “The General Theory of Employment, Interest, and Money”, London:
MacMillan, 1936.
Klingaman, D. and Koshal, R.K., “A Model of United States Inflation, 1959 – 80”, Atlantic
Economic Review, September 1982, 10(4), pp.100.
Larkins, D. and Gill, G.S., “Interest Rates and Aggregate Inventory Investment”, Survey of
Current Busines, June 1985, 65(6), pp.17-20.
Lawrence, C. and Siow, A., “Interest Rates and Investment Spending: Some Empirical
Evidence for Postwar U.S. Producer Equipment, 1947 –1980”, Journal of Business, October
1985, 58(4), pp. 359-75.
Rima, I.H., “Development of Economic Analysis”, Illinois: Irwin, 1978.
Schnitzer, M.C., “Comparative Economic Systems”, Cincinati: South-Western, 1987.
Summers, L., “Taxation and Corporate Investment: A q Theory Approach”, Brookings Papers
on Economic Activity, 1980, (1), pp. 57-107.
Taylor, J., “The Swedish Investment Funds System as a Stabilization Rule”, Brookings
Papers on Economic Activity, 1982, (1), pp.57-107.
Tobin, J., “A General Equilibrium Approach to Monetary Theory”, Journal of Money, Credit,
and Banking, 1969, 1(1), pp.15-30.
VonUngen-Sternberg, T., “Current Profits and Investment Behavior”, Bell Journal of
Economics, Autumn 1980, 11(2), pp.745-8.

284
Using NSGAII for Solving Multi-objective
Master Production Scheduling Problems with
Application
Omar R. Jasim Jalal A. Sultan
University of Al-Hayat University of Mosul
Iraq Iraq
Abstract:
The master production schedule (MPS) problem is a typical NP-hard problem. So,
searching for the global optimal solution in a MPS problem usually demands an effort most
industries are not willing to pay. Therefore, the use of meta-heuristics that generates good
solutions in reasonable computer time becomes an attractive alternative. In this paper, a Non-
dominated Sorting Genetic Algorithm-II (NSGA-II) is used to solving multi-objective master
production schedule (MOMPS). The NSGAII is a very effective algorithm for solving multi-
objective optimization problems and finding optimal Pareto front. The MOMPS was applied in
the Cement plant in Mosul city. The application involves determine the gross requirements by
demand forecasting using artificial neural networks, in addition to determination of the
available capacity of each production line by estimating the parameter values of Renewal
Process model for all failures and calculating the availability. The results related that multi-
objective model was presented suitable framework for MOMPS and optimum use.
Keywords—Master Production Schedule; Non-Dominated Sorting; Genetic Algorithm;
Multi-Objective Optimization.
1. Introduction
The key success of a manufacturing company to be competitive in recent globalization is
to satisfy customer’s requirement on time with good quality of products and services.
Obviously, this will be a challenging mission for decision makers particularly in today’s highly
dynamic market environment which is characterized by short product life-cycle, high product
variety (customization), unpredictable demand pattern and short customer lead times. The
gaining competitive advantage is being more difficult due to the uncertainty of the market
environment. It’s required smooth communication and effective coordination between
marketing/sales and manufacturing department to ensure that the company resources can cope
the varying customer demand. Master Production Schedule (MPS) is a function in Production
Management System, which provides mechanism for the dynamic interaction between
marketing and manufacturing [14].
In most industries worldwide, the creation of an MPS considers conflicting objectives,
such as maximization of service levels, efficient use of resources, and minimization of
inventory levels. Unfortunately, the complexity and effort demanded for the creation of a master
plan grows rapidly as the production scenario increases, especially when resources are limited,
which is the case for most industries. Due to such complexity, industries usually use simple
heuristics implemented in spreadsheets that provide a quick plan, but can compromise
efficiency and costs [12].
In general, master scheduling problems are NP-hard problems, that is, unlikely there is no
an algorithm that can find an optimal MPS solution in polynomial time. In practical, this means
that the processing time required to solve such problem will quickly and enormously grow as
the problem size grows. For this reason, truly optimal solution is quite difficult to be found.

285
Therefore, meta-heuristic or evolutionary algorithms such as genetic algorithm, simulated
annealing, tabu search, etc. are also employed to obtain optimum solution [16].
The main advantages of Evolutionary algorithms are: they do not require the objective
function to be differentiable or continuous, they do not require the evaluation of gradients and
they can escape from local minima [5].
In this paper, a NSGAII is used to solving multi-objective master production schedule
(MOMPS). The purpose of this paper is to apply the MOMPS in the cement plant. The
application involves determine the gross requirements by demand forecasting using artificial
neural networks and determination of the available capacity of each production line.
The paper is organized as follows: Section 2 present a brief revision of master production
scheduling and genetic algorithms. The multi-objective genetic algorithm NSGAII to solve
BAP has been proffered in Section 3. In Section 4, a MOMPS has been created for the
cement plant. The conclusion of this study has been presented in Section, 5.
2. A BIT FROM PRODUCTION PLANNING OPTIMIZATION AND GENETIC
ALGORITHMS
This section explain some of the fundamental concepts behind production planning, in
particular, master production scheduling and genetic algorithms.
2.1 Master production scheduling: Basics
According to the American Production and Inventory Control Society (APICS), a master
production plan is a declaration of what the company expects to manufacture, which become a
series of planning decisions that drives the material requirements planning (MRP) system. It
represents what the company intends to produce expressed in configuration, quantities and
specific dates. The master plan is not a sales forecast, which represents a demand declaration.
It should take into consideration the demand, pending orders, material availability, projected
ending inventory levels, capacity availability, managerial policies and goals, among others. The
master plan is the result of the master production scheduling [7].
MPS problems usually involve conflicting objectives, like minimizing inventory and set-
up times, and maximizing service levels. Because of all this, use of heuristics and meta-
heuristics are suggested for the resolution of these types of problems. Several artificial
intelligence metaheuristics have been applied to optimization, among them, genetic algorithms,
taboo search, ant colony, beam search and simulated annealing)[12].
Wu et al. (2002) [19] built a mathematical model of MPS and developed a genetic
algorithm incorporating several techniques to satisfy constraints for making an optimized MPS
of production lines with both assembly and processing. Vieira & Ribas (2004) [5] applied
simulated annealing to solve production planning problem, more specially, master production
schedule. Soares & Vieira (2008) [12] introduced new genetic algorithm structure for solving
MPS problem. This study formulates the fitness function, which aims to minimize inventory
level, maximize service level, minimize overtime and minimize inventory level below safety
stock.
2.2 Mathematical Model of MPS
The master production schedule problem can be mathematically modeled as a mixed integer
program as follows [14]:
𝑀𝑖𝑛 𝐸𝐼 =∑ ∑ 𝐸𝐼𝑘𝑝
𝑃𝑝=1
𝐾𝑘=1
𝑇𝐻 (1)
𝑀𝑖𝑛 𝑅𝑁𝑀 =∑ ∑ 𝑅𝑁𝑀𝑘𝑝
𝑃𝑝=1
𝐾𝑘=1
𝑇𝐻 (2)
𝑀𝑖𝑛 𝐵𝑆𝑆 =∑ ∑ 𝐵𝑆𝑆𝑘𝑝
𝑃𝑝=1
𝐾𝑘=1
𝑇𝐻 (3)

286
𝑀𝑖𝑛 𝑂𝐶 = ∑ ∑ 𝑂𝐶𝑟𝑝
𝑃
𝑝=1
𝑅
𝑟=1
(4)
𝑠𝑢𝑏𝑗𝑒𝑐𝑡 𝑡𝑜:
𝐵𝐼𝑘𝑝 = {𝑂𝐻𝑘 𝑖𝑓(𝑝 = 1)
𝐸𝐼𝑘(𝑝−1) 𝑖𝑓(𝑝 > 1) (5)
𝐸𝐼𝑘𝑝 = 𝑚𝑎𝑥 [0, ((𝑀𝑃𝑆𝑇𝑘𝑝 + 𝐵𝐼𝑘𝑝) − 𝐺𝑅𝑘𝑝)] (6)
𝑀𝑃𝑆𝑇𝑘𝑝 = ∑ 𝑀𝑃𝑆𝑘𝑝𝑟
𝑅
𝑟=1
(7)
𝑀𝑃𝑆𝑘𝑝𝑟 = 𝐵𝑁𝑘𝑝𝑟 ∗ 𝐵𝑆𝑘𝑝𝑟 (8)
𝑅𝑁𝑀𝑘𝑃 = 𝑚𝑎𝑥 [0, (𝐺𝑅𝑘𝑝 − (𝑀𝑃𝑆𝑇𝑘𝑝 + 𝐵𝐼𝑘𝑝))] (9)
𝐵𝑆𝑆𝑘𝑝 = max[0, (𝑆𝑆𝑘𝑝 − 𝐸𝐼𝑘𝑝)] (10)
𝐶𝑈𝐻𝑟𝑝 = ∑(𝑀𝑃𝑆𝑘𝑟𝑝)
𝑈𝑅𝑘𝑟
𝐾
𝑘=1
(11)
𝐶𝑈𝐻𝑟𝑝 ≤ 𝐴𝐶𝑟𝑝 (12)
𝑂𝐶𝑟𝑝 = 𝑚𝑎𝑥[0, (𝐶𝑈𝐻𝑟𝑝 − 𝐴𝐶𝑟𝑝)] (13)
In this formulation, each character expresses the value as follows. 𝐾: Total quantity of
different products, 𝑅: Total quantity of different productive resources, 𝑃: Total number of
planning periods, 𝑇𝐻: Total planning horion, 𝐸𝐼𝑘𝑝: Ending inventory level generated for
product 𝑘 at period 𝑝, 𝑅𝑁𝑀𝑘𝑝: Requirements not met for product 𝑘 at period 𝑝, 𝐵𝑆𝑆𝑘𝑝:
Quantity bellow safety inventory level for product 𝑘 at period 𝑝, 𝑂𝐶𝑟𝑝: Over capacity needed
at resource 𝑟 at period 𝑝, 𝐵𝐼𝑘𝑝: Initial inventory level of the product 𝑘 at period 𝑝, 𝑂𝐻𝑘: Initial
available inventory (on-hand), at the first scheduling period, 𝐺𝑅𝑘𝑝: Gross requirement for
product 𝑘 at period 𝑝, 𝐵𝑆𝑘𝑝: Standard lot size for product 𝑘 at period 𝑝, 𝑁𝑅𝑘𝑝: Net requirement
for product 𝑘 at period 𝑝, considering infinity capacity, 𝑆𝑆𝑘𝑝: Safety inventory level for product
𝑘 at period 𝑝, 𝑈𝑅𝑘𝑟 : Production rate for product 𝑘 at resource 𝑟 (units per hour), 𝐴𝐶𝑟𝑝:
Available capacity, in hours, at resource 𝑝 at period 𝑝, 𝐵𝑁𝑘𝑝𝑟: Quantity of standard lot sizes
needed for the production of the product 𝑘 at resource 𝑟, at period 𝑝 (number of lots), 𝑀𝑃𝑆𝑘𝑝𝑟:
Total quantity to be manufactured of the product 𝑘 at resource 𝑟 at period 𝑝, 𝑀𝑃𝑆𝑇𝑘𝑝: Total
quantity to be manufactured of the product 𝑘 at period 𝑝 (considering all available resources),
𝐶𝑈𝐻𝑟𝑝: Capacity used from the resource 𝑟 at period 𝑝, 𝐶𝑈𝑃𝑟𝑝: Percent rate obtained from the
relation of the number of hours consumed from the resource 𝑟 at period 𝑝, and the available
number of hours to the same resource and period.
3. .Multiobjective Genetic Algoritm For MOMPS
Multi-objective optimization is a research topic attracting much attention because many
optimization problems involve multiple and conflicting objectives and a compromise may have
to be made among these objectives. The most important concept in multi-objective optimization
is Pareto optimality. A solution is Pareto optimal if it is not dominated by any other solution in
terms of all objectives considered [2]. Since a number of solutions may be Pareto optimal, the
task of multi-objective optimization is to find as many as possible such non dominated
solutions, and this task is quite complex. In this section, a simulation-based multi-objective
optimization method that combines simulation evaluation of performance and meta-heuristic
search with multi-objective genetic algorithms called NSGA-II is adapted for the optimization
of bed allocation. We use a multi-objective optimization method because there are more than
one objective in bed allocation optimization especially patient admission rate and human
resources.

287
GA is a search technique based on the mechanism of natural selection and reproduction
introduced by Holland and is used to search large, non-linear solution spaces where expert
knowledge is lacking or difficult to encode and where traditional optimization techniques fall
short. It starts with an initial set of randomly generated solutions called population and each
individual in the population is called chromosome representing a solution. Each chromosome is
composed of a set of elements called genes. At each iteration (generation) of GA, all newly
generated chromosomes are evaluated using a fitness function to determine their qualities. High
quality chromosomes are selected to produce offspring chromosomes through genetic operators,
namely, crossover and mutation. After a number of generations, the GA converges to a
chromosome which is very likely to be an optimal solution or a solution close to the optimum
[3].
3.1 NSGA II Principle
NSGA-II computes successive generations of a population of solutions belonging to non-
dominated fronts. The non-dominated set is identified and constitutes the non-dominated front
of level 1 or front 1. In order to find the individuals in the next non-dominated front, the solutions
of front 1 are discounted temporarily and the above procedure is repeated. This process continues
until all fronts are identified. In order to maintain diversity in the population, the crowding-
distance is used. The overall structure of the NSGAII is specified by Algorithm 1 [13].
Algorithm 1: NSGAII overall structure
Create the initial population 𝑃 of size 𝑛
Evaluate the 𝑛 solutions using simulation
Sort 𝑃 by non domination
Compute the crowding distance of each solution
while Stopping Criterion do
Create and add 𝑛 children to 𝑃 (using genetic operators: selection, crossover and mutation of
two parents)
Sort 𝑃 by non domination
Compute the crowding distance of each solution
𝑛𝑒𝑤𝑃 = ∅ 𝑖 = 1 while |𝑛𝑒𝑤𝑃| + |𝑓𝑟𝑜𝑛𝑡(i)| ≤ n do
Add front(i) to newP
𝑖 = 𝑖 + 1 end while
𝑚𝑖𝑠𝑠𝑖𝑛𝑔 = 𝑛 − |𝑛𝑒𝑤𝑃| if 𝑚𝑖𝑠𝑠𝑖𝑛𝑔 ≠ 0 then
Sort the solutions by descending order of the crowding distance
for j =1 to missing do
Add the jth solution of front(i) to newP
end for
𝑃 = 𝑛𝑒𝑤𝑃 end if
end while
3.2 GA Components for Multi-Objective MPS
In this study, the BAP has two objectives, namely patient admission rate and nursing hours, to
optimize. Basic operations that characterize our adapted NSGA-II are explained as follows.
a.Input Informatin

288
For the master scheduling optimization, the software implemented takes into consideration as
much parameters as possible found in actual industrial environments:
number and description of products;
number and description of productive resources (production lines, workstations, machines,
production cells);
number and description of time periods and duration for each period (periods with different
durations are allowed);
initial (on-hand) inventories—product quantities in the beginning of the planning horizon;
gross requirements—needed quantity per product per period, estimated from forecasting and
customers orders;
batch sizes—production standard lot sizes per product per period;
safety inventory level per product per period;
production rate—the quantity a resource can manufacture of a product per time unit;
setup time per product, non-depended on operation sequence; and
available capacity per resource per period.
b. Chromosome Strtuctured
The composition and shape of the country (chromosome) in MPS problems differs in the way
of representation from the most representations found in the literature, which consider a single
chromosome represented by a single bit vector structure. Fig. 1 illustrate the conceptual model
for the structure implemented for a scenario with three products, four resources, and three
periods [15].
The structure uses an alphabet to represent a country as a set of integer positive numbers. Each
sphere in the structure represents a gene. A set of genes makes a branch, which represents the
distribution of quantities to be made at the various available resources for a given product at a
specific time period.
A set of branches composing the branch group represents the total distribution of quantities to
be made of all the products at every resource, in a given time period. The complete MPS
individual is made of a set of branch group. The length of this set is given by the number of
time periods in the master plan horizon. The set of MPS countries making a population will
evolve according to the NSGAII configuration in search for the best country (solution or master
schedule).
Fig. 1. Structure of the MPS Chromosome
c. Initial Population Creation
The NSGA-II starts the search by generating a population of candidate solutions. In our
implementation, The size of the population (number of countries) and the way the initial
population is created have a significant influence in the performance of the algorithm and to

289
the quality of the results. The ideal situation would be to have the greatest possible diversity of
countries to better through the search space. The pseudo code of population creation function
for multi resources, multi products and multi periods may be written as follows:
for k=1:K
for r=1:R
if UR(k,r)≠ 0
for p=1:FP
IP=randi([0,round(GR(k,p)/BS(k,p))],nPop,1)*BS(k,p);
Pop=[Pop IP];
IP=[];
end
else
for p=1:P
IP=zeros(nPop,1);
Pop=[Pop IP];
IP=[];
end
end
end
end
Where randi([imin,imax],m,n) returns m-by-n matrix containing integer values drawn from the
discrete uniform distribution on the interval (imin,imax) [10]. This heuristic approach fills up
the most possible diversity, with values always respecting the standard lot size restriction.
Consider a hypothetical situation where the gross requirement for a given product at a certain
time period (time bucket) is 3,000 units, the standard lot size is 500 units, and there are four
possible productive resources available to make the product, the genes for the first country in
the population in the first period would be “{0;500;1,000;1500}” second country would have
“{2,000; 3,000; 2,500; 500}”, and so on, sequentially for all individuals in the population.
d. Selection
Selection is a process in which chromosomes are chosen according to their fitness function
value or their rank value. In this study, the tournament parent selection is used. Tournament
selection is one of selection methods in genetic algorithms which runs a tournament among a
few individuals chosen at random from the population and selects the winner (the one with the
best fitness) for crossover. The tournament size used in our computational experiments is 2.
e. Crossover and Mutation
The crossover produces new offspring chromosomes from parent individuals. Two new
chromosomes are created by exchanging some genes of two parent chromosomes. We use in
our implementation the single-point crossover. This kind of crossover creates a pair of offspring
by exchanging parts of the parents after a randomly chosen crossover point.
The mutation includes adding and subtracting one bed to different random genes in the
chromosome. The function of mutation is to maintain the diversity of the population in order to
prevent too fast convergence of the algorithm.
f. Crowding Distance Calculation
As the overall population size of P is 2n, we cannot accommodate all fronts in the new parent
population (newP) of size n. The non accommodated fronts are simply deleted. When the last
allowed front is considered, there may exist more solutions in the last front than the remaining
slots in the new population. In order to avoid arbitrarily choosing individuals, we choose the
individuals that can assure diversity between the considered ones; that is what we call a niching
strategy. For this reason, we calculate the crowding distance measuring the Euclidean distance

290
between the neighboring individuals in each front (Fig. 1). The Algorithm 2 describes the
crowding distance procedure [13].
Algorithm 2: Crowding distance calculation
Let 𝜁 the number of solutions
for each solution 𝑖 do
Initialize the distance to 0
for each objective 𝑚 do
Sort the solutions according to the objective 𝑚
𝑑1 = 0, 𝑑𝜁 = ∞
for 𝑖 = 2 to (𝜁 − 1) do
𝑑𝑖 = 𝑑𝑖 + (𝑓𝑚𝑖+1 − 𝑓𝑚
𝑖−1)/(𝑓𝑚𝑀𝐴𝑋 − 𝑓𝑚
𝑀𝐼𝑁) end for
end for
end for
Where 𝑓𝑚𝑖 is the value of the objective function 𝑚 of the ith solution. Thereafter, those strings
with largest crowding distance values are chosen to become the new parent population. Once
the non-dominated sorting is over, the new parent population, 𝑛𝑒𝑤𝑃, is created by choosing
solutions of different non-dominated fronts.
Fig. 1. Crowding distance
g. Stopping Conditions
There are no universal stopping conditions accepted for multi-objective genetic algorithms. In
this study, we simply stop our algorithm after a given number of iterations (Ng).
4. CREATE MOMPS FOR Cement plant
In this section, we create a master production schedule to kufa cement plant. The plant was
established in 1977, and currently provides two types of products.
A.Determine Input Parameters of MPS
Table 1 shows the details of MPS parameters required to create MPS problem of cement plant.
The production rates in table 2. is primary before calculating availability. TABLE 7. THE INPUT PARAMETERS OF MPS
Parameters Value
𝐾 2 (C1,C2)
𝑅 9 (BO1,BO2,BN1,BN2,BW1,BW2, HO1,HO2,HN)
P 6 weeks
URkp Table 2.

291
𝐵𝑆𝑘𝑝 10 ton for all products and all periods
𝑂𝐻𝑘 (49500, 3600)
𝑆𝑆𝑘𝑝 (33000, 2800)
𝐴𝐶𝑟𝑝 128 hours/week for each resource
𝑂𝐿𝑚𝑎𝑥 28 hours/week for each resource
TABLE 2. THE PRIMARY PRODUCTION RATES (TON/HOUR)
Res. C1 C2
BO1 6.88 0.00
BO2 6.88 0.00
BN1 46.25 0.00
BN2 46.25 0.00
BW1 68.75 0.00
BW2 68.75 0.00
HO1 0.00 4.69
HO2 0.00 4.69
HN 59.38 0.00
B. Determine Production Rates
To determine production rates, we must simulate the random machine failure following a
certain probabilistic distribution. The scenario of this simulation is to apply failure on active
work stations. Nine failure controls STO_1, STO_2, … , STO_9 are set to trigger the random
failure in work stations BO1, BO2,….,HN respectively. In this study, we apply the Renewal
Process model with normal distribution to analyze nine data sets, each one belongs to one of
the types of failure. By using Least squares method, we estimate the parameter values for all
failures, which are presented in Table 3. Table14. The availability values according to estimated
parameters.
TABLE 3. THE PARAMETER VALUES FOR ALL FAILURES
Failure Res. Availability MTTF MTBF
𝜇 𝜎 𝜇 𝜎
STO_1 BO1 22.68% 18.55 3.2 5.44 2.9
STO_2 BO2 6.71% 22.39 18.9 1.61 1.5
STO_3 BN1 14.19% 20.59 18.9 3.41 1.6
STO_4 BN2 72.21% 6.67 2.4 17.33 8.1
STO_5 BW1 51.23% 11.71 10.9 12.29 4.8
STO_6 BW2 88.22% 2.82 0.1 21.17 4.1
STO_7 HO1 28.62% 17.13 2.8 6.87 2.5
STO_8 HO2 0.86% 23.79 23.8 0.21 0.1
STO_9 HN 12.79% 20.93 19.1 3.07 2.8
TABLE 4. THE PRODUCTION RATES (TON/HOUR)
Res. C1 C2
BO1 1.56 0.00
BO2 0.46 0.00
BN1 6.56 0.00
BN2 33.40 0.00
BW1 35.22 0.00
BW2 60.65 0.00
HO1 0.00 1.34
HO2 0.00 0.04
HN 7.60 0.00
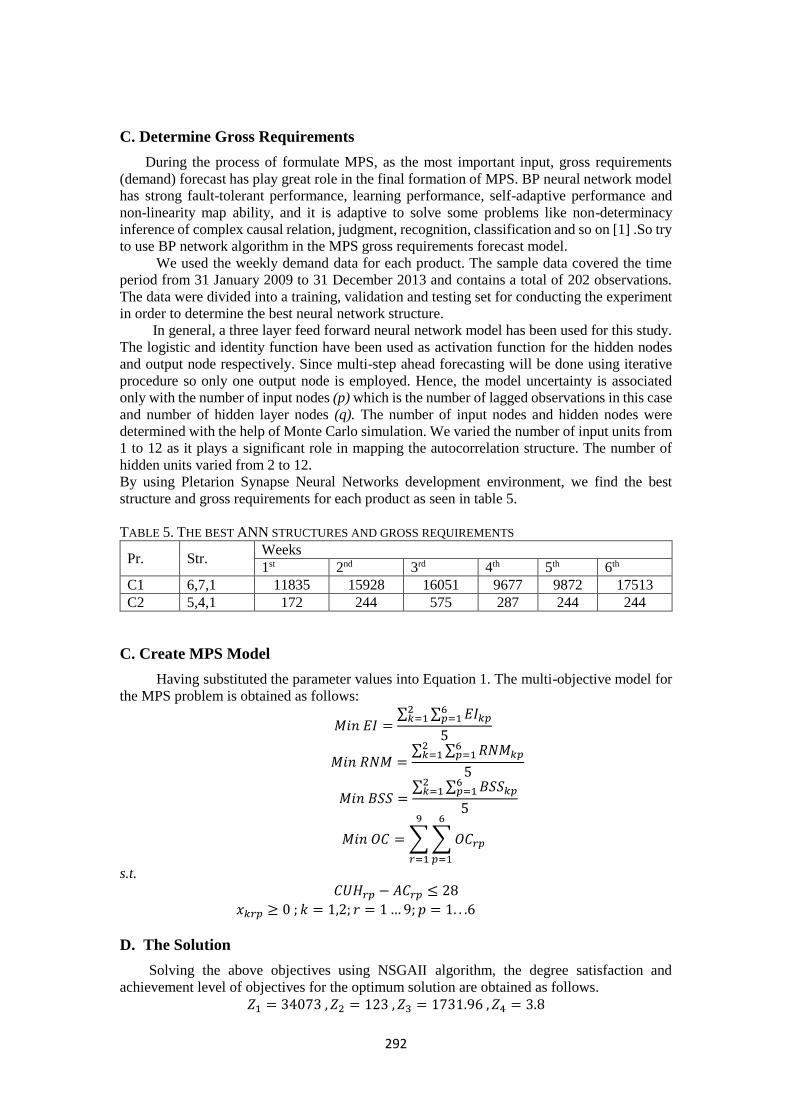
292
C. Determine Gross Requirements
During the process of formulate MPS, as the most important input, gross requirements
(demand) forecast has play great role in the final formation of MPS. BP neural network model
has strong fault-tolerant performance, learning performance, self-adaptive performance and
non-linearity map ability, and it is adaptive to solve some problems like non-determinacy
inference of complex causal relation, judgment, recognition, classification and so on [1] .So try
to use BP network algorithm in the MPS gross requirements forecast model.
We used the weekly demand data for each product. The sample data covered the time
period from 31 January 2009 to 31 December 2013 and contains a total of 202 observations.
The data were divided into a training, validation and testing set for conducting the experiment
in order to determine the best neural network structure.
In general, a three layer feed forward neural network model has been used for this study.
The logistic and identity function have been used as activation function for the hidden nodes
and output node respectively. Since multi-step ahead forecasting will be done using iterative
procedure so only one output node is employed. Hence, the model uncertainty is associated
only with the number of input nodes (p) which is the number of lagged observations in this case
and number of hidden layer nodes (q). The number of input nodes and hidden nodes were
determined with the help of Monte Carlo simulation. We varied the number of input units from
1 to 12 as it plays a significant role in mapping the autocorrelation structure. The number of
hidden units varied from 2 to 12.
By using Pletarion Synapse Neural Networks development environment, we find the best
structure and gross requirements for each product as seen in table 5.
TABLE 5. THE BEST ANN STRUCTURES AND GROSS REQUIREMENTS
Pr. Str. Weeks
1st 2nd 3rd 4th 5th 6th
C1 6,7,1 11835 15928 16051 9677 9872 17513
C2 5,4,1 172 244 575 287 244 244
C. Create MPS Model
Having substituted the parameter values into Equation 1. The multi-objective model for
the MPS problem is obtained as follows:
𝑀𝑖𝑛 𝐸𝐼 =∑ ∑ 𝐸𝐼𝑘𝑝
6𝑝=1
2𝑘=1
5
𝑀𝑖𝑛 𝑅𝑁𝑀 =∑ ∑ 𝑅𝑁𝑀𝑘𝑝
6𝑝=1
2𝑘=1
5
𝑀𝑖𝑛 𝐵𝑆𝑆 =∑ ∑ 𝐵𝑆𝑆𝑘𝑝
6𝑝=1
2𝑘=1
5
𝑀𝑖𝑛 𝑂𝐶 = ∑ ∑ 𝑂𝐶𝑟𝑝
6
𝑝=1
9
𝑟=1
s.t.
𝐶𝑈𝐻𝑟𝑝 − 𝐴𝐶𝑟𝑝 ≤ 28
𝑥𝑘𝑟𝑝 ≥ 0 ; 𝑘 = 1,2; 𝑟 = 1 … 9; 𝑝 = 1. . .6
D. The Solution
Solving the above objectives using NSGAII algorithm, the degree satisfaction and
achievement level of objectives for the optimum solution are obtained as follows.
𝑍1 = 34073 , 𝑍2 = 123 , 𝑍3 = 1731.96 , 𝑍4 = 3.8
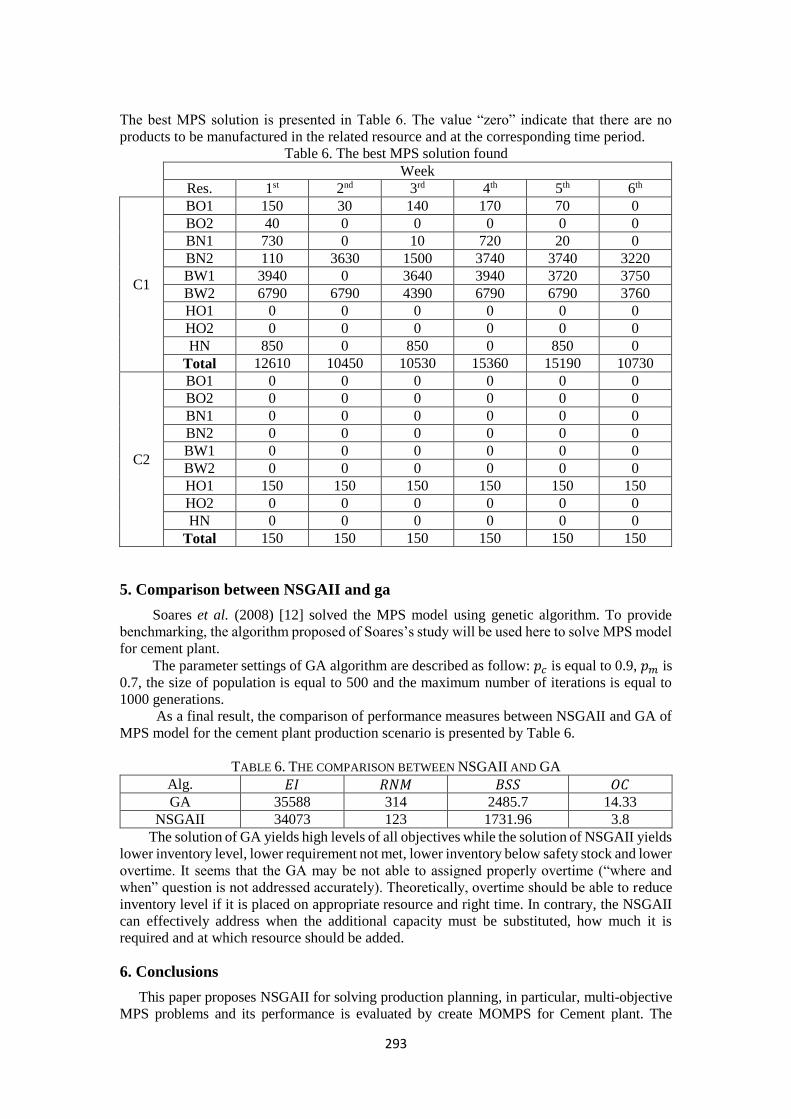
293
The best MPS solution is presented in Table 6. The value “zero” indicate that there are no
products to be manufactured in the related resource and at the corresponding time period.
Table 6. The best MPS solution found
Week
6th 5th 4th 3rd 2nd 1st Res.
0 70 170 140 30 150 BO1
C1
0 0 0 0 0 40 BO2
0 20 720 10 0 730 BN1
3220 3740 3740 1500 3630 110 BN2
3750 3720 3940 3640 0 3940 BW1
3760 6790 6790 4390 6790 6790 BW2
0 0 0 0 0 0 HO1
0 0 0 0 0 0 HO2
0 850 0 850 0 850 HN
10730 15190 15360 10530 10450 12610 Total
0 0 0 0 0 0 BO1
C2
0 0 0 0 0 0 BO2
0 0 0 0 0 0 BN1
0 0 0 0 0 0 BN2
0 0 0 0 0 0 BW1
0 0 0 0 0 0 BW2
150 150 150 150 150 150 HO1
0 0 0 0 0 0 HO2
0 0 0 0 0 0 HN
150 150 150 150 150 150 Total
5. Comparison between NSGAII and ga
Soares et al. (2008) [12] solved the MPS model using genetic algorithm. To provide
benchmarking, the algorithm proposed of Soares’s study will be used here to solve MPS model
for cement plant.
The parameter settings of GA algorithm are described as follow: 𝑝𝑐 is equal to 0.9, 𝑝𝑚 is
0.7, the size of population is equal to 500 and the maximum number of iterations is equal to
1000 generations.
As a final result, the comparison of performance measures between NSGAII and GA of
MPS model for the cement plant production scenario is presented by Table 6.
TABLE 6. THE COMPARISON BETWEEN NSGAII AND GA
Alg. 𝐸𝐼 𝑅𝑁𝑀 𝐵𝑆𝑆 𝑂𝐶
GA 35588 314 2485.7 14.33
NSGAII 34073 123 1731.96 3.8
The solution of GA yields high levels of all objectives while the solution of NSGAII yields
lower inventory level, lower requirement not met, lower inventory below safety stock and lower
overtime. It seems that the GA may be not able to assigned properly overtime (“where and
when” question is not addressed accurately). Theoretically, overtime should be able to reduce
inventory level if it is placed on appropriate resource and right time. In contrary, the NSGAII
can effectively address when the additional capacity must be substituted, how much it is
required and at which resource should be added.
6. Conclusions
This paper proposes NSGAII for solving production planning, in particular, multi-objective
MPS problems and its performance is evaluated by create MOMPS for Cement plant. The

294
NSGAII can solve efficiently the multi objective model of MPS. It has ability to determine
intelligently how much, when, and where the additional capacities (overtimes) are required such
that the inventory can be reduced without affecting customer service level. The comparison
results show the efficiency and capabilities of the proposed algorithm in finding the optimum.
The performance achieved is quite satisfactory and promising for solving MPS models.
7. References
B. Zhang, and M. Hue, "Forecasting with artificial neural networks", The state of the art,"
International Journal of Forecasting, vol. 14, 1998.
D.E. Goldberg," Genetic Algorithms in Search Optimization & Machine Learning", Addison-
Wesley. Reading, 1989.
G.E. Vieira, F. Favaretto, and P.C. Ribas," Comparing genetic algorithms and simulated
annealing in master production scheduling problems", Proceeding of 17th International
Conference on Production Research. Blacksburg, Virginia, USA, 2004.
G.E. Vieira, and C.P. Ribas," A new multi-objective optimization method for master production
scheduling problems using simulated annealing" International Journal of Production Research,
Vol. 42, No. 21, Pp.4609-4622 , 2003 .
G.E. Vieira," A practical view of the complexity in developing master production schedules:
fundamentals, examples, and implementation", In J. W. Herrmann. Handbook of Production
Scheduling, Springer, Maryland, USA pp. 149-176, 2004.
J.A. Sultan,"Proposed Hybrid Techniques for Solving Fuzzy Multi-Objective Linear
Programming with Application. Master thesis", university of Mosul, Mosul, Iraq ,2013.
J. Cox, J. Blackstone," APICS Dictionary", 10th edn. APICS, Alexandria ,2001.
J. F. Proud," Master Scheduling", 2nd Edition, John-Wile-Sons Inc., 1999.
J.H. Holland," Adoption in Natural and Artificial Systems", University of Michigan, Ann Arbor
,1975.
MathWorks. Matlab Documentation. MathWorks Inc., 2004.
M. Garey, and D. Johnson," Computer, complexity and intractability. A guide to theory of NP-
Completeness", Freeman, San Francisco, USA ,1979.
M.M. Soares, and G.E. Vieira," A New multi-objective optimization method for master
production scheduling problems based on genetic algorithm", International Journal of
Advanced Manufacturing Technology, DOI 10.1007/s00170-008-1481-x. ,2008.
N. S. Slack, " Operation Management. Prentice Hall", 3rd Edition, New Jersey, USA ,2001.
P. Higgins, and J. Browne," Master production scheduling a concurrent planning approach.
Production Planning & Control", Vol. 3, no.1.pp 2-18 ,1992 .
P. Ribas," Análise do uso de têmpera simulada na otimização do planejamento mestre da
produção", Pontifícia Universidade Católica do Paraná, Curitiba, 2003.
S. Supriyanto," Fuzzy Multi-Objective Linear Programming and Simulation Approach to the
Development of Valid and Realistic Master Production Schedule", Doctor thesis, university of
Duisburg, Essen, Germany, 2011.
T. Bäck ," Evolutionary algorithms in theory and practice", New York, Oxford Univ Press
,1996.
T.E. Vollmann, W.L. Berry, and D.C. Whybark," Manufacturing planning and control system",
New York. 4rd Edition, McGraw-Hill, 1997.
Y. Wu, M. Liu, and C. Wu," A genetic algorithm for optimizing the MPS of a processing-
assembly production line with identical machines", Proceedings of the First International
Conference on Machine Learning and Cybernetics. Beijing, 2002.
295
The Impact of High Quality Relationship on
Innovative Work Behavior Of Employees Through
Psychological Wellbeing, A Case Of Pharmaceutical
Sector
Asad Afzal Humayon Rizwan Qaiser Danish Ahmad Usman Shahid
COMSATS institute of
information technology University of the Punjab
COMSATS institute of
information technology
Pakistan Lahore Pakistan
Ihtisham Munir Jawad Shahid
University of the Punjab University of the Punjab
Lahore Lahore
Abstract:
The impact of qualities and experiences of high quality relationship is of great value to the companies
and field of human resource. Pakistan is facing critical situation regarding qualities and experiences of
relationship of employees. Innovative work behavior of employees has not been studied in developing
countries like Pakistan. In order to assist the business in pharmaceutical sector this study is aimed at
investigating the effect of experiences and qualities of high quality relationship on innovative work
behavior of employees. Pharmaceutical sector was considered for this study as this sector has significant
contribution in Gross Domestic Product (GDP) of Pakistan. This research was quantitative in nature in
which data was collected from managerial and non-managerial employees of pharmaceutical sector. Total
310 questionnaires were completely filled and entered in SPSS for analysis. Correlation analysis was
performed in SPSS to show relationship between the variables. Model was tested through structural
equation modeling in AMOS and goodness of fit indices were estimated using Hu and Bentler (2010)
criteria and all the values were found to show good fit model. To test the mediation among variables through
regression the SOBEL test was used as a supplemental test. All the direct and mediational hypotheses were
accepted. The results reveal that the psychological wellbeing mediates the relationship between
experiences, qualities of high quality relationship and innovative work behavior. Limitation of the study
and managerial implications were also discussed along with guideline for future research.
Keywords: Qualities of relationship, Experiences of relationship, Psychological Wellbeing, Innovative
work Behavior and Pharmaceutical Sector.
INTRODUCTION
Capacities and experiences of high quality relationship have an effect on the innovative work behavior
of employees since long time to researchers and practitioners. Researchers found that how effectively these
constructs help to enhance the psychological wellbeing of employees by contributing the technical and
structural core of organization by implementing the measures to improve the innovative work behavior of

296
employees. Capacities of high quality relationship have three dimensions which are connectivity, emotional
carrying and tensility of employees within the organization. While experiences of high quality relationships
consist of mutuality and positive regard of workers within the organizations. This study investigated the
impact of capacities and experiences of high quality relationships on employee’s creative work behavior
which is being mediated by psychological wellbeing. Three dimensions being used in order to measure the
aptitudes of high quality relationships including Emotional Aptitude, tensility and connectivity while
experiences of high quality relationships are dimensioned into Mutuality and Positive Regard. This study
explains whether the relationship between these interpersonal relationships and innovative work behavior
of employees is mediated by psychological wellbeing or not? The direct association between capacities,
experiences of high quality relationships and innovative work behavior through different analysis.
Organizations want to keep their employees innovative because when capacities and experiences of
employees working in the organization will be high, they will work creatively and resultantly perform well
for the wellbeing of the organization. Organizational creativity is a complicated phenomenon which enables
a structure to follow the environmental and technically latest capabilities and maintain competitive position
in the market. Psychological wellbeing also play a vital role in the well performance of organization when
employees are psychologically and emotionally strong they work creatively and in a unique way.
Interactional relationships at work place have an important effect on the employee’s psychological
wellbeing and innovative work behavior. High quality relationships are those streams through which
employees behave well in the organization and work innovatively to create a competitive advantage for
other firms. In public sector organizations these capacities and experiences of relationships are low as
compared to private sector organizations in Pakistan. Previous researcher proved that there exists a
significantly positive relationship between these variables. Dutton and Heaphy, (2003) proposed that
experiences and capacities of high quality relationships become a reason to explore and define the features
that make a supportive work environment between two people. At the same time employees who experience
high quality relationship have a feeling of esteem and associated with the firm which supports them to fulfill
the probability followed by problems with solutions. Our study is based on the work of Dutton and Heaphy,
(2003) who provided this conception to explain this relationships. The first cluster explains the features and
capacities of high quality relationships while the other captured the experience of every person in the
relationship. Psychological wellbeing has a mediatory role in our study which mediates the relationship
between independent and dependent variable and it’s scale is developed by Heun, (2001). Innovative work
behavior keeps the organization within the market and maintain its competitive advantage and is in direct
relationship with these relationships and it’s scale was developed by Ettlie and O'Keefe, (1982). Previous
investigations showed that there exists positive and direct relationship between these variable (Carmeli,
2009).
The problem of this study is to examine the impact of capacities and experiences of high quality
relationships, by considering the intervening play of psychological wellbeing in the pharmaceutical sector
of Lahore, Pakistan. Innovative work behavior of employees is of significant importance for the
management of any organization. Revealing the most important reason of innovative work behavior will
help the management to take important measures to take important decisions regarding that. The objective
of this study is to examine the connection between capacities and experiences of high quality relationship
and innovative work behavior in the presence of mediating variable psychological wellbeing.
The study of examining the impact of capacities and experiences of high quality relationships on
innovative work behavior of employees will be of great value to the pharmaceutical sector and human
resource development companies. This study is a contribution to many studies that captured this main
concept so that it is important human in resource scenario. This investigation will assist to those
organizations that have a desire to implement these concepts in order to progressively improve the
innovative work behavior of employees. This study will also be an addition to the existing body of
knowledge nationally as well as internationally in the relevant field. This study aims at to develop more
interest in this scenario so that the research in future could be conducted in the context of different sectors.

297
LITERATURE REVIEW
2.1. Capacities of High Quality Relationships
The present era is the competing one and for every organization, it is important to construct
interpersonal relationship between workers and management in order to sustain a reputation in a market.
Interpersonal relationship has significant impact on people at work place (Dutton & Ragins, 2007). Through
high-quality interpersonal relationship at work place, people engage in learning behavior that helps an
organization for achieving its desire goals (Lewin and Regine, 2000). The capacities of relationship enable
members to exchange their views, ideas, information and experience for solving problems and establish
new conduct for improving work process and outcomes. These relationships and associations have some
bearing on the personnel working in an organization, on their involvement in some socialistic attitudes and
on the coordination cooperation and interaction and identification of faults (Weick and Roberts, 1993).
Relationship has different capacities and functional characteristics like emotional carrying capacity,
tensility and connectivity. Emotional carrying capacity describes the level of positive as well as adverse
feelings. These relations demonstrate a higher emotional facing aptitude which proposes that an individual
face multi dimensions feelings of each other. By establishing a culture of sharing ideas and thoughts and
exchanging analytical data, new innovations can be created. Kozlowski and Ilgen, (2006), proposed that by
encouraging positive alterations at work environment organizations can enhance these relationships.
Argote, (1999) proposed that some learning behaviors can be implemented to improve work behaviors and
to carry on the steps of reflections, due to that we can enhance and share the knowledge base. Previous
studies investigated that there is very little information available about the facilitation of these types of
behaviors in organizations but some observers have also notices that the investigation about these learning
behaviors mostly remained unobserved (Carmeli, 2007, p. 41). At work place these relations are the base
factors if employed by personnel can assist the organization for the achievement of its goals. Researchers
investigated that aptitude of these relations and their dimensions focus on the short description of the extent
of these relational naught at workplace and it assist in making the organization of gaining its value. Previous
researches proposed that these high connections are demonstrated by higher extent of connectivity and in
higher aptitude relationships there exists lot of experiences according to a specific environment appreciated
by vitality and positive esteem. Actually studies have demonstrated that these types of interpersonal
relationships are the benchmarks for developing a higher level of learning behavior in any organization
(Dodgson, 1993).
Emotional Carrying Capacity
Emotional carrying capacity can be briefly termed as an association’s capability to deal with all types
of emotional feelings according to the situation (Carmeli, 2009). Emotional carrying capacity is the level
of showing all dimensions of feelings in organizations. Emotions are one of the parts of people daily life
experience in workplace and it assists us to know the relationships with others (Fineman, 2000). Having
more emotional carrying capacity in a relationship presents greater quality of the relationship between two
or more people and they can manage and control emotions of each other more efficiently. Having greater
emotional carrying capacity people did not have problem to convey their sentiments to each other, having
no fear to communicate objectionable thoughts rather they will more convenient to demonstrate such a
vexing feelings in a favorable way. Greater emotional carrying capacity makes a positive understanding
among persons and they feel easy to reveal their irritating views. Greater emotional carrying capacity in a
relationship has more acceptability for each other and they feel more comfortable to say their emotions
positive and negative and this build better understanding for them (Dutton and Heaphy, 2003).
According to Dutton and Heaphy, (2003) there are three properties of Emotional carrying capacity
which are communication of maximum emotions to interactive person, showing the negative ones and do
it in a positive and developing manner. Stephens et al., (2013) said that It is visible, stated or unstated
actions of different individuals that convey their inner feeling and sentiments about a particular situation.
Kennedy-Moore and Watson, (2001) proposed that emotional communication can be considered as a

298
significant source of knowing each other’s instant reactions of a particular dealing in a workplace. Weiss
and Cropanzano, (1996) said that by sharing of emotion provide frankness and trust and bring people close,
which can affect the productivity directly enabling people for more emotions will also increase their loyalty
to the organization.
Dutton and Ragins, (2007b) proposed that solid emotions can affect the relationship, obligation and
productivity. Kelly and Barsade, (2001) proposed that more information sharing will be helpful for solving
the problems and it will also enhance the commitment of the participants. She further explores that
expressing more emotions, confronting them boldly and response it positively even the negative ones, will
build a trustworthy, committed, friendly, and empathetic relationship. Thoits, (1996) investigated that in
an interaction different people demonstrate different emotions, understanding those emotions; they can
learn how to use them by positively reacting them and observers can judge the commitment in this regard.
Bandura, (1986) said, being conscious of others and attentive what they like and dislike and how they
will response and what they can feel, will lead a trustful and confident connection and more acceptability.
Individuals can make quick decisions relating to particular event and can obtain more opportunities and
choices. Ambady et al., (2000) estimated that expression of both positive and negative emotions in a suitable
way is recognizable component and in any interaction lead a very important role to judge, understands and
conclude the situation. It also provides the basis for the high quality relationships. Stephens, (2011) argued
that this issue is being discussed for many years and past research shows that either to reveal or conceal
emotion, it provides flexible environment and it depends upon the situation and behaviors give some reason.
Tensility
Tensility is the aptitude of any association to face and to perform in different situations and the capacity
to bounce back after setbacks (Dutton and Heaphy, 2003). A relationship having tensility have more
acceptibilty for relationship partners, it includes the ability to setback, endure stress, withhold and cooerate
in pressure and difficult situations. A higher quality relationship will have larger tesility. Tesility arouse in
a relationship of higher quality and it demonstrates the acceptibility of relationship partners. Carmeli et al.,
(2009) Tensility in a relationship indicates the level of cooperation in different difficult situations and the
tough times showing the support, help in tentions, clashes and bend a high quality relationship. Dutton and
Heaphy, (2003) proposed that tensile strength and tensile pressure are the aptitudes of a relationship usually
used to appraise the quality of a relationship in the situations of crashes pressure. It includes how the
relationship partners deal with one another when there exist some kind of pressure, tention, conflict or stress
in the working environment and how efficiently the manage such situations and find an effective solution
pertains at that time. The tensile strain limit is characterized as the most extreme tractable strain that
strengthen on the ductile strain limit. It is a simple and widely used guaging the relationship level.
Swaddiwudhipong et al., (2003) proposed that tesility in a relationship is its capacity to accommodate in
difficulties face the hurdles in working place withstanding during the strains and stress managing the stress
and obtaining the solution it is a level of empathy containg in a relationship to handle and deal with the
obstacles providing the relationship partners a place for worktogether and to do things for others.
2.1.3. Connectivity
Carmeli et al., (2009) proposed that Connectivity can be defined as the openness level in relationships
to listen new ideas, influences, attentiveness to new opportunities and people. It is the level of openness
and inspiration for development in a relationship. Dutton and Heaphy, (2003) and Marcial and Heaphy,
(2004) connectivity assists the individuals to gain the possible benefits and progress chances from different
situations seek and learn new ideas, building a trustful environment at workplace through connectivity.
Relationship partners learn how to accept different people; they become observant for new opportunities
and chances to avail it and to take use it properly and efficiently they use those ideas for the benefit of
whole system. Connectivity provides such an environment for relationship partners which support them to
seek new opportunities take chances encourage them to discover and implement new ways to obtain their
goals it provide harmless and convenient workplace, people openly and bravely listen others either they
299
came from strange source or pattern, it builds a safe bond among them, they want to try new techniques and
styles.
Edmondson, (1999) proposed that connectivity also plays a vital role in relationships and places
such connections that enable the relationship partners to learn and grow and eventually creativity.
Hargadon, (2006) investigated that connectivity not only individually effect the innovative behavior but it
also creates a strong interpersonal relationship among the employees and then bring out the innovative
behavior. Amabile, (1998) explained that if the relationship partners have more connectivity will be able
to create a strong bond with each other, they fell more secure to share their ideas feelings and emotions to
each other and will be able to work on new things boldly and confidently. Amabile, (1998) people work
together need a level of easiness and satisfaction so that they can feel enjoyment at their work and it may
become entertaining for them. Furthermore he stated that connectivity with the boss will provide a sense a
safety and inspiration to work on new ideas and opportunities and an appreciated performance can be
produced at the end.
Amabile, (1998) proposed that Supervisor’s connectivity with their juniors will create a compassion
and carefulness and assistance for the employees to perform in better way, and increase the possibilities of
maximum with minimum. A connective environment will also create a free and frank communication and
it increase the level of understanding and in such an environment creativity and innovation will be
promoted. Amabile et al., (2005) explained that connective environment among the coworkers is now
highly admired and required by the organizations where innovation and creativity give them the competitive
edge because connectivity in the relationship is highly associated with the creativity and innovation.
Carmeli, (2009) explained that a relationship containing the connectivity flexible enough for the novelty
and encourage new ideas and opportunities.
Carmeli et al., (2009) found that connectivity is allied with innovative behavior and due to the straight
relationship of connectivity and innovative behavior people will become more creative, find new ways and
solutions of respective problems. Amabile, (1996) explained that People will feel mentally relaxed secure
and easy to explore their ideas, implement their new plans apply their techniques. Connectivity with the
managerial staff and seniors will provide juniors or subordinates energy, self-confidence better
understanding or communication to share their ideas their new approaches they recognize their place and
will be praised for their work which is related to the stress free environment that is brought out by
connectivity. Amabile, (1998) proposed that seniors help lessen the stress cooperate and understand the
feelings of their appreciate for their good performance due to compassion which is formed by the
connectivity rather a less connective environment effect badly upon the performance and innovative
behavior of the employee, they feel insecure, depressed and hesitated in a workplace where lack of
connectivity exists (Albrecht and Hall, 1991, Schawlow, 1997, Delbecq and Mills, 1985). Creativity
requires peace of mind (Kanter, 1983) and stress free environment which came in to existence with the
better connectivity, new ideas can be brought out through the sharing of feelings, emotions and open
communication. Carmeli, (2009) proposed that in higher quality relationship connectivity and reliance a
vital role for creativity and innovation, emotional sharing and tensility which is critically important for this.
People learn by sharing their experiences their information and skills that is blessed through better
connectivity and understanding among them. Carmeli et al., (2013) explained in former studies that
workplace connectivity for recognition and proper solutions for the problem which in turn brings the
creativity and innovation.
EXPERIENCES OF HIGH QUALITY RELATIONSHIPS
Mutuality
It expresses how much people participate in high quality relationships for each other’s development
(Jordan, 1991). Researcher proposed that mutuality is the name of mutual sharing of ideas, thoughts, notions

300
and emotions in which people got involve for creating a good relation. Mutuality focuses on the condition
when employee got involved and participates in any work mutually. Jordan, (1991) further proposed that
sense of cooperation and coordination enhance the sense of mutual consent for self-disclosure in
accomplishment of any task. Identical processes are also recognized in these relationships for the
encouragement of mutual understanding to develop a feeling of surety (Sarnat, 2001). Walsh et al., (2002)
in his study showed that a feeling of mutuality was the most important factor influencing trainees’
willingness to disclose mistakes to their supervisors. Hence, when there is a high degree of mutuality, there
is greater mutual empathy, which fosters a sense of psychological safety.
Positive Regard
It represents the degree to which persons experience the feelings of being known or loved (Rogers,
1951). Researcher have investigated that the personnel who demonstrate strong relationships have a sense
of belongingness and esteem for others even this relation is for a limited time. Individuals who are respected
by other employees within an organization are due to the reason that they got valued for their presentation.
When an employee respects other employee, they demonstrate a scenario of belongingness and positive
regard for each other, they develop a sense of social respect which makes a feeling of ability (Dutton,
2003b). When people understand that they are valued for their work, it encourages them to share and speak
about their problems without got frightened from any harsh result. Edmondson, (2004) proposed that the
feeling of competency makes a person confident about the monitoring and judgment about their basic point
and it makes them more competent and more regarded towards their goal. But when people in a strong
association or connection with each other want to create their value, it develops an environment in which
employees can free express their feelings about their ideas.
PSYCHOLOGICAL WELLBEING
Psychological wellbeing is person’s ability to manage complex environments to suit personal needs
and values, sense of autonomy in thoughts, continued growth and development as person, self-acceptance,
establish ties to others and pursuits meaningful goals. According to Ryff, (1989a) and Ryff, (1989b),
psychological wellbeing constitute following components of psychological wellbeing including a
constructive behavior towards a person, high quality relationships among employees, a feeling of self-
determination, freedom from casual standards, having a clear objective and faith, one’s environmental
mastery and extrovert towards personality development. There are many sub fields for psychological
wellbeing variable which may be same mindedness and self-acceptance. The characters neuroticism and
extraversion have been powerfully related with adverse and optimistic psychological well-being (Diener,
1999).
Self-acceptance is acceptance of self in spite of deficiencies, According to Shepard, (1978), self-
acceptance is an individual's satisfaction or happiness with himself, and is thought to be necessary for
good mental health. Self-acceptance involves self-understanding, a realistic, albeit subjective, awareness of
one's strengths and weaknesses. It results in an individual's feeling about himself that he is of "unique
worth".
According to Diener, (1997), psychological wellbeing may be in the form of thoughts or in the form
of affect. The cognitive part of psychological wellbeing is an evidence grounded consideration of life, like
when a person analyzes cognitive and evaluative decisions about one’s gratification about life completely
and the affective part is a hedonic assessment directed by feelings and spirits like incidence with which
people experience dispositions in response to their lives. The supposition behind this idea is that many
people assess their life as either good or bad, so they are generally able to offer conclusions and sometimes
people consistently experience emotions, which have a constructive impact or a negative effect.
Consequently, people have a level of particular well-being even if they do not often deliberately consider
about it, and the psychological system offers practically a relentless assessment of what is happening to the
person.

301
INNOVATIVE WORK BEHAVIOR
Innovative work behavior is a purposeful conception, introduction and implementation of new
thoughts for the given task, group or organization for achieve a common goal (Janssen, 2000). Innovative
behavior is an employee’s intentional introduction or application of new ideas, products, processes, and
procedures to his or her work role, work unit, or organization (West and Farr 1989, 1990b). Innovation has
to do with the production or adoption of useful ideas and idea implementation ((Kanter, 1988). Engaging
in innovative acts in a workplace brings benefits and costs for employees beyond a sense of intrinsic
enjoyment ((Janssen, 2003),
Janssen, (2000) proposed that if a constant stream of originations is to be recognized then every
employee must be ready and capable to transform that he or she must retain inventive work comportment.
Employee innovative behavior is a significant asset that allows an organization to be successful in a lively
business environment (Kanter, 1983., West & Farr., 1990a). Engaging in innovative acts in a workplace
brings benefits and costs for employees beyond a sense of intrinsic enjoyment (Janssen, 2003). De Jong
and Den Hartog, (2008) investigated that the significance of constant innovations has also been frazzled in
workplace on numerous general controlling ideologies like total quality management. For teams, the
interactive, relational processes among members can ease the sharing of information, learning processes,
and the development of adaptive solutions to problems which leads to innovation (Paulus & Nijstad, 2003).
Employees working in an organization should know the possible failures will be tolerated during the
investigation for creativity and it will not be punishable and it is necessary for the casual innovation in that
workplace (Deacon, 2008). Curiosity in discrete innovation has also cause investigations being conceded
out in the backgrounds of temperament physiognomies, productivities, and conduct. In the present age it is
mandatory for managers to try new stuff, be innovative and creative and advance the procedure. West and
Farr, (1989) proposed that innovative behavior in the place of work is believed as composite behavior
consisting of a set of three different behavioral tasks, idea generation, idea promotion, and idea realization.
According to Carmeli and Spreitzer, (2009) employees’ innovative work behavior is the groundwork
of any high-performance association and is superficial particularly in a knowledge-based economy where
imperceptible assets come to the vanguard. Although innovations are intentionally performed to provide
benefits (West, 1989; West & Farr, 1989) and it may be necessary for an individual employee to invest
substantial and demanding efforts in generating, promoting, and realizing innovative change. West and
Farr, (1989) proposed that innovative behavior in the place of work is believed as composite behavior
consisting of a set of three different behavioral tasks, idea generation, idea promotion, and idea realization.
Knowledge sources are the basic building blocks in facilitating creativity and innovation in
organizations and enable them to create a value (Grant, 1996)). Employees who worked as an organization’s
front liner dealing with their clients are more capable to see probabilities for alteration and improvement in
effort developments and procedures which many may be undetectable to managers or others authorized
work places responsible for revolution in the association (Carmeli and Spreitzer, 2009). Innovative behavior
is demarcated here as the deliberate establishment, overview, and application of new ideas within a work
role, group, or organization, in order to benefit role performance, the group, or the organization.
2.5 Hypotheses development
(Figure: Proposed hypothesized model)

302
Figure 2.0
2.5.1. Hypotheses Development
Direct hypotheses
H 1: There exists a positive relationship between emotional carrying capacity, tensility, connectivity and
innovative work behavior.
H 2: There exist a positive relationship between mutuality, Positive regard and innovative work behavior
H 3: There exist a positive relationship between psychological wellbeing and innovative work behavior.
H 4: There exist a positive relationship between emotional carrying capacity, tensility, connectivity and
psychological wellbeing.
H 5: There exist a positive relationship between mutuality, Positive regard and psychological wellbeing.
Mediation hypotheses
H 6 a: Psychological Wellbeing mediates the relationship between Emotional Carrying Capacity and
Innovative work behavior.
H 6 b: Psychological Wellbeing mediates the relationship between Tensility and Innovative Work
Behavior.
H 6 c: Psychological Wellbeing mediates the relationship between Connectivity and Innovative Work
Behavior.
H 7 a: Psychological Wellbeing mediates the relationship between Mutuality and Innovative Work
Behavior.
H 7 b: Psychological Wellbeing mediates the relationship between Positive Regard and Innovative Work
Behavior.
METHODOLOGY
The description of our study includes design of research, size of sample and data collection procedures.
This section also explains the data collection instrument being applied, target population, sample size and
the procedures of survey being applied in detail. This study investigated the influence of capacities and
experiences of high quality relationships on employee innovative work behavior. Three dimensions being
used in order to measure capacity of high quality relationship: emotional carrying capacity, tensility and
connectivity while two dimensions of experiences of high quality relationship being used which are

303
mutuality and positive regard. This study explains whether the relationship between capacities, experiences
of high quality relationship and innovative work behavior by psychological wellbeing or not? The direct
relationship between variables of high quality relationships and innovative work behavior is also being
explained in this study through different analysis. This study used self-administered questionnaires for the
data collection from the respondents. The current study tried to focus the pharmaceutical companies in
Lahore, Pakistan. The different industries were selected randomly to collect the data, so the sample selected
for this study represents the entire population of pharmaceutical sector hospitals of Lahore. For this study
402 questionnaires were distributed among the employees of different private sector pharmaceutical
companies of Lahore, Pakistan. Convenience sampling technique is used in order to distribute the
questionnaires among hospitals. So 350 questionnaires were distributed among firms and 310 of which
were correctly and completely filled questionnaires. Total 310 questionnaires were correctly filled and the
overall response rate was 88%. The current study is based on the primary data. Personally administered
questionnaires were used for data collection. The measures of different variables used in this questionnaire
were adopted from the previous research. The two pages questionnaire consists of the questions of variables
and at the demographics in start. First five questions were asked regarding the variable emotional carrying
capacity. Next four questions were related to tensility, three questions related to positive regard, four
questions regarding mutuality, five questions related to psychological wellbeing and last six questions were
regarding innovative work behavior.
Data collection and data analysis
Mean and Standard Deviation of the variables
The values of the mean of all the respective variables are given in the table 4.4.1. The values of the
mean and standard deviation of Emotional Carrying Capacity, Tensility and Connectivity, Mutuality,
Positive Regard, Innovative Work Behavior and Psychological Wellbeing are M= 3.3884, 3.6462, 3.9121,
3.7339, 3.7183, 3.8586, 3.5632 with Standard Deviation 0.62, 0.70, 0.64, 0.57, 0.68, 0.59 and 0.75
respectively. The mean value of Mutuality is highest with 3.9121, indicating that employees are very
towards mutual cooperation within the organization.
Table 1: Mean and Standard Deviation of the variables
Variables Chronbach’s Alpha Mean Std. Deviation
Emotional carrying capacity 0.563 3.3884 0.62099
Tensility 0.662 3.6462 0.70541
Connectivity 0.670 3.9121 0.64779
Mutuality 0.594 3.7339 0.57922
Positive regard 0.655 3.7183 0.68910
Psychological wellbeing 0.742 3.5632 0.75372
Innovative work Behavior 0.724 3.8586 0.59573
The reliability of the variable emotional carrying capacity is r = 0.563, same as the reliability of the
measure tensility and connectivity are r = 0.662 and 0.670 respectively. The reliability of the measure
mutuality and positive regard are r = 0.594 and r = 0.655 respectively. Similarly the reliability values of the
psychological wellbeing and innovative work behavior are r = 0.742 and r = 0.724 respectively.
Correlation among variables
Table 2.0: Correlation among Variables

304
Variables
Emotion
al
carrying
capacity
Tensilit
y
Connectivit
y
Mutualit
y
Positiv
e
regard
Psychologic
al wellbeing
Innovativ
e work
Behavior
Emotional
carrying
capacity
1
Tensility .205** 1
Connectivit
y
.285** .360** 1
Mutuality .297** .287** .476** 1
Positive
regard
.379** .210** .374** .329** 1
Psychologic
al wellbeing
.447** .272** .212** .448** .343** 1
Innovative
work
Behavior
.364** .323** .401** .408** .289** .412** 1
The Pearson’s product moment co-efficient of correlation was found between emotional carrying
capacity, Tensility, Connectivity, Mutuality, Positive Regard, Psychological wellbeing and innovative work
behavior. The correlation between emotional carrying capacity and tensility is r = .205, p < 0.01, indicating
that there is a positive relationship between both the variables. The correlation between emotional carrying
capacity and connectivity is r = .285, indicating positive relationship with p < 0.01. There exist a positive
relationship between emotional carrying capacity and Mutuality is r = .297 which is positive with the value
of p < 0.01. The Pearson’s correlation was found between emotional carrying capacity and positive regard
is .379, p < 0.01, which indicates that there exist a positive relationship between both the variables.
Similarly, there exist a positive relationship between emotional carrying capacity and psychological
wellbeing with the value of r = .447, p < 0.01 indicating high positive relationship among the variables.
Finally, Pearson’s product moment co-efficient of correlation was found between emotional carrying
capacity and innovative work behavior with the value of r = .364, p < 0.01. The above table showed that
the dimensions of variables of high quality relationship are positively correlated with the innovative work
behavior and psychological wellbeing with the p value less than 0.01.
Measurement Model
Table for standardized estimates
Table 3.0 Standardized Regression Weights: (Group number 1 - Default model)
Estimate
EC5 <--- ECC .667
EC4 <--- ECC .524
EC3 <--- ECC .349
EC1 <--- ECC .490
T4 <--- Tensility .495
T3 <--- Tensility .690
T2 <--- Tensility .815
T1 <--- Tensility .489
C4 <--- Connectivity .536
C3 <--- Connectivity .620

305
Estimate
C2 <--- Connectivity .698
C1 <--- Connectivity .581
PR3 <--- Postive .564
PR2 <--- Postive .655
PR1 <--- Postive .670
M1 <--- Mutuality .574
M3 <--- Mutuality .608
M4 <--- Mutuality .593
PW1 <--- Wellbeing .651
PW2 <--- Wellbeing .604
PW3 <--- Wellbeing .612
PW4 <--- Wellbeing .718
IB6 <--- Workbehavior .434
IB3 <--- Workbehavior .620
IB2 <--- Workbehavior .782
IB1 <--- Workbehavior .639
Figure 2.0 Measurement Model

306
Table 4.0 Model fit summary
Model fit indices Measurement Threshold
X2 310
CMIN/DF 2.468 < 3 good ; < 5 Permissible
CFI o.798 Closer to 1 ; Good
GFI 0.860 >0.90
AGFI o.820 < 0.80
RMR 0.059 < 0.06
RMSEA 0.069 < 0.06
PCLOSE 0.000 > o.o5
AMOS gives a set of indices which are affective to evaluate whether or not the data confirmed to the
hypothesized model. These indices reveal the degree to which the variables associate with one another as
the model would estimate. In this study Chi square, CMIN/DF, Comparative fit indices (CFI), Goodness of
Fit Index (GFI), Adjusted Goodness of Fit Index (AGFI) and Route Mean Square Error of Approximation
(RMSEA) were used to evaluate the model fitness. Chi square is a common goodness-of-fit evaluator to
find out overall model fitness. Chi square value of 310 with 142 DFs, is significant at p < 0.001. Dividing
chi square value by degree of freedom we get 2.63 which indicates a good fit within the recommended
range of less than 5(Carmines & McIver, 1981), CMIN/DF (the likelihood ratio of chi square) value is
2.468 < 5 indicates a good fit. Another commonly reported statistic is the Goodness of Fit Index (GFI) as
its name suggest. If its value closer to 0.90 or higher indicates a good fit while the Adjusted Goodness of
Fit Index value (AGFI) is 0.820 reflect a good fit. In this study, the measurement model is perfect fit model
where GFI value is 0.860 and AGFI value is 0.820. Comparative fit index (CFI) examines the fit of a user-
specified solution relative to a limited baseline model in which the covariance’s among all variables is
hypothesized as fixed to zero or no association among input indicators . The CFI values varieties from 0 to
1 .The value of CFI nearer to 1 interprets the model as very good fit Overall results indicated that the
measurement model accepted as a good fit with the help of Chi-Square, CMIN/DF, CFI, GFI, AGFI, RMR,
RMSEA and PCLOSE indices.

307
Structural Equation Modeling
Figure 3.0 Structural Equation Modeling
Table 4.0 Model Fitness
CMIN/DF RMR GFI AGFI CFI RMSEA PCLOSE
2.500 0.056 0.873 0.829 0.818 0.070 0.000
Table for standardized estimates
Table 5.0 Standardized Regression Weights: (Group number 1 - Default model)
Estimate
Wellbeing <--- ECC .449
Wellbeing <--- Tensility .076
Wellbeing <--- Connectivity -.274
Wellbeing <--- Postive .080
Wellbeing <--- Mutuality .554
Workbehavior <--- Wellbeing .231
These variables showed significant and positive association with Affective commitment because regression
weight of relationships exceeds 0.
Mediation Analysis using Structural models

308
Mediation can be defined as the existence of a predictor which have an impact on the other variable
by the interposition of another variable (Preacher and Hayes, 2008; Little et al., 2007). Investigating
mediation in highly complicated models explains the procedure through which one construct have an impact
on the other variable (Little, et al., 2007). According to MacKinnon, et al., (2002) there are many procedures
to test the mediation effects, but the mostly used method is ‘causal steps strategy’ of Baron and Kenny
(1986). Preacher and Hayes, (2008) proposed that causal step strategy can only effective when the sample
size is huge.
Baron and Kenny (1986) causal strategy model proposed that three conditions must be fulfilled for
mediation analysis see figure 4.12 for details):
X and Y are expressively correlated (path a)
M is expressively associated with Y (path b)
With the arrival of M, the relationship of X and Y reduces.
Figure 4.0 Mediation Model of Baron and Kenny
Psychological wellbeing as mediator between emotional carrying capacity and innovative
work behavior
Mediation analysis for path of Emotional Carrying Capacity (ECC)- Psychological Wellbeing (PWB
)-Innovative Work Behavior (IWB) is presented in figure 4.4 constituting three paths ECC-PSW (a), PWB-
IWB (B) and ECC-IWB (c). When these paths were observed through SEM, it was noticed that model was
fit with acceptable fitness indices (X2 = 123.998, Df=46, p=0.000, GFI=0.940, AGFI= 0.898, CFI= 0.890,
RMSEA= 0.074, CMIN/DF = 2.695)
Model Fitness Indices
X2 = 123.998, Df=46, p=0.000,
GFI=0.940, AGFI= 0.898, CFI= 0.890,
RMSEA= 0.074, CMIN/DF = 2.695
Figure 5.0
Mediation Analysis (ECC-PWB-IWB)
a
X Y
M b
c
ECC IWB
PWB β= 0.577
p = 0.000
β= 0.422
p = 0.001
β= 0.141
p = 0.217

309
Psychological wellbeing as mediator between emotional Tensility and innovative work
behavior
Mediation analysis for path of Emotional Carrying Capacity (T)- Psychological Wellbeing (PWB)-
Innovative Work Behavior (IWB) is presented in figure 4.4 constituting three paths T-PSW (a), PWB-IWB
(B) and T-IWB (c). After observing these paths through structural modeling equation (SEM), it was
observed that model was perfectly fit with acceptable fitness indices (X2 = .8863, DF=24, p=0.000,
GFI=0.955, AGFI= 0.915, CFI= 0.916, RMSEA= 0.076, CMIN/DF = 2.787)
Model Fitness Indices
X2 = .8863, DF=24, p=0.000,
GFI=0.955, AGFI= 0.915, CFI= 0.916,
RMSEA= 0.076, CMIN/DF = 2.787
Figure 6.0
Mediation Analysis (T-PWB-IWB)
Psychological wellbeing as mediator between Connectivity and innovative work behavior
Mediation analysis for path of Emotional Connectivity (C)- Psychological Wellbeing (PWB)-Innovative
Work Behavior (IWB) is presented in figure 4.4 constituting three paths C-PSW (a), PWB-IWB (B) and
C-IWB (c). The observed paths proved that the model is fir with the model fit indices of (X2 = 110.572,
DF=46, p=0.000, GFI=0.945, AGFI= 0.907, CFI= 0.918, RMSEA= 0.067, CMIN/DF = 2.404)
.
Model Fitness Indices
X2 = 110.572, DF=46, p=0.000,
GFI=0.945, AGFI= 0.907, CFI= 0.918,
RMSEA= 0.067, CMIN/DF = 2.404
Figure 7.0
Mediation Analysis (C-PWB-IWB)
Psychological wellbeing as mediator between Mutuality and innovative work behavior
Mediation analysis for path of Mutuality (M)- Psychological Wellbeing (PWB)-Innovative Work
T IWB
PWB β= 0.326
p = 0.002
β= 0.159
p = 0.064
β= 0.457
p = 0.000
C IWB
PWB β= 0.281
p = 0.001
β= 0.343
p = 0.000
β= 0.435
p = 0.000

310
Behavior (IWB) is presented in figure 4.4 constituting three paths M-PSW (a), PWB-IWB (b) and M-
IWB (c). The observed paths proved that the model is fir with the model fit indices of (X2 = 99.229,
DF=36, p=0.000, GFI=0.944, AGFI= 0.898, CFI= 0.911, RMSEA= 0.075, CMIN/DF = 2.756).
Model Fitness Indices
X2 = 99.229, DF=36, p=0.000,
GFI=0.944, AGFI= 0.898, CFI= 0.911,
RMSEA= 0.075, CMIN/DF = 2.756
Figure 8.0
Mediation Analysis (M-PWB-IWB)
Psychological wellbeing as mediator between positive regard and innovative work behavior
Mediation analysis for path of Mutuality (PR)- Psychological Wellbeing (PWB)-Innovative Work
Behavior (IWB) is presented in figure 4.4 constituting three paths PR-PSW (a), PWB-IWB (b) and PR-
IWB (c). The observed paths proved that the model is fit with the model fit indices of (X2 = 106.559,
DF=37, p=0.000, GFI=0.937, AGFI= 0.887, CFI= 0.906, RMSEA= 0.078, CMIN/DF = 2.880).
Model Fitness Indices
X2 = 106.559, DF=37, p=0.000,
GFI=0.937, AGFI= 0.887, CFI= 0.906,
RMSEA= 0.078, CMIN/DF = 2.880
Figure 9.0
Mediation Analysis (PR-PWB-IWB)
M IWB
PWB β= 0.607
p = 0.000
β= 0.222
p = 0.058
β= 0.418
p = 0.004
PR IWB
PWB β= 0.513
p = 0.000
β= 0.330
p = 0.003
β= 0.273
p = 0.013

311
5. FINDINGS AND CONCLUSION
5.1.1 Direct Hypotheses
The results of regression analysis show that all direct hypotheses are accepted. The results reflect that
there exist a positive relationship between independent variables (capacities and experiences of high quality
relationship), dependent variable (Innovative work behavior) and mediating variable (Psychological
wellbeing). The results also show the significant direct and positive relationship between the mediating
variable, psychological wellbeing and dependent variable, innovative work behavior.
5.1.2 Mediation Hypotheses
The results of SOBEL test for Mediation show that all mediation hypotheses are accepted. The results
reflect that the variable psychological wellbeing mediates the relationship capacities, experiences of high
quality relationship and innovative work behavior. Mediation testing revealed that in the presence of
mediating variable psychological wellbeing, there is a significant direct effect between experiences of high
quality relationship, capacities of high quality relationship (emotional carrying capacity, tensility and
connectivity) psychological wellbeing and innovative work behavior. The results show that there exists full
mediation among the variables in our study.
5.2 Conclusion
The purpose of this study was to examine the impact of capacities and experiences of high quality
relationship on innovative work behavior of employees with the mediating role of psychological wellbeing.
This study contributed to existing body of knowledge. Results indicated that the hypothesized model of
innovative work behavior, psychological wellbeing, capacities of high quality relationship and experiences
of high quality relationship fit the data well. Our observation found that there is a significant direct and
positive relationship between dependent variable, mediating variable and independent variables. The results
also show the significant direct and positive relationship between the mediating variable, psychological
wellbeing and innovative work behavior. Further, the mediating variable psychological wellbeing mediates
the relationship between dependent and independent variable. The results reflect that there exists a full
mediation among these variables in our study.
5.3 LIMITATIONS and RECOMMENDATIONS
Limitations
There are several limitations of this study. This study is limited in the sense that it captures only the
pharmaceutical sector employees; it could not be carried out on the employees belonging to other sectors
as well. This study only examines the mediating effect of psychological wellbeing on the innovative work
behavior of employees. It could be carried out to examine the mediating effect of psychological wellbeing
on other variables as well. This study covers the pharmaceutical sector of only one city, Lahore Pakistan.
It could be carried out on total pharmaceutical sector of Pakistan with more resources and time.
Recommendations
Managers can improve the innovative work behavior of employees of pharmaceutical sector by the
proper enhancement of capacities of high quality relationship. Policy makers can improve the innovative
work behavior of employees of pharmaceutical sector by the proper coordinating the experiences of high
quality relationship of employees with each other. Organizations should take measures to improve the
psychological wellbeing of employees of pharmaceutical sector by the proper implementation of the
capacities of high quality relationship. Higher management should improve the psychological wellbeing of

312
employees of pharmaceutical sector by reducing the gap among employees to enhance high quality
relationship.
References
Amabile,, T. M. (1998) “A Model of Creativity and Innovation in Organizations,” In: B. M. Staw and L.L.
Cumming, Eds., Research in Organizational Behavior, JAI Press, Greenwich, Vol. 10, No. 2, pp. 123-167.
Amabile, T. M. & Conti, R. (1999). “Changes in the Work Environment for Creativity during Downsizing,”
Academy of Management Journal, Vol. 42, No. 6, pp. 630- 640.
Albrecht, T. L. & Hall, B. J. 1991. Facilitating talk about new ideas: The role of personal relationships in
organizational innovation. Communications Monographs, 58, 273-288.
Amabile, T. M. 1996. Creativity and innovation in organizations, Harvard Business School Boston.
Amabile, T. M. 1998. How to kill creativity, Harvard Business School Publishing.
Amabile, T. M., Barsade, S. G., Mueller, J. S. & Staw, B. M. 2005. Affect and creativity at work.
Administrative science quarterly, 50, 367-403.
Ambady, N., Bernieri, F. J. & Richeson, J. A. 2000. Toward a histology of social behavior: Judgmental
accuracy from thin slices of the behavioral stream. Advances in experimental social psychology, 32, 201-
271.
Argote L. 1999. Organizational Learning: Creating, Retaining and Transferring Knowledge. Kluwer
Academic:Boston.
Argote L, Gruenfeld D, Naquin C. 2001. Group learning in organizations. In Groups at Work: Advances in
Theory and Research, Turner ME (ed.). Lawrence Erlbaum Associates: Mahway, NJ; 369–411.
Bandura, A. 1986. Social foundations of thought and action, Englewood Cliffs, NJ Prentice Hall.
Carmeli, A. 2009. High-quality relationships, individual aliveness and vitality, and job performance at
work. Research on Emotion in Organizations, 5.
Carmeli, A., Brueller, D. & Dutton, J. E. 2009. Learning behaviours in the workplace: The role of high-quality interpersonal relationships and psychological safety. Systems Research and Behavioral Science, 26,
81-98.
Carmeli, A., Gelbard, R. & Reiter-Palmon, R. 2013. Leadership, Creative Problem-Solving Capacity, and
Creative Performance: The Importance of Knowledge Sharing. Human Resource Management, 52, 95-121.
Delbecq, A. L. & Mills, P. K. 1985. Managerial practices that enhance innovation. Organizational
dynamics, 14, 24-34.
Deacon, J. (2008). The Contribution of Knowledge Management practices in generating a Corporate
Culture of Innovation, Graduate School of Business Leadership University of South Africa, and 30
November.
Diener, E., Suh, E. M., Lucas, R. E., & Smith, H. L. (1999). Subjective well-being: Three decades of
progress. Psychological Bulletin, 2, 276–302.
Dodgson M. 1993. Learning, trust, and technological collaboration. Human Relations 46: 77–94.
Dutton, J. E. & Heaphy, E. D. 2003. The power of high-quality connections. Positive organizational
scholarship: Foundations of a new discipline, 3, 263-278.
Dutton, J. E. & Ragins, B. R. 2007a. Exploring positive relationships at work: Building a theoretical and
research foundation, Lawrence Erlbaum Associates Mahwah, NJ.
Dutton, J. E. & Ragins, B. R. 2007b. Moving Forward: Positive Relationships at Work as a Research
Frontier.
Dutton J.E, Heaphy E.D. 2003. The power of high-quality relationships at work. In Positive Organizational
Scholarship, Cameron KS, Dutton JE, Quinn RE (eds). Berrett-Koehler Publishers: San Francisco; 263–
278.
Edmondson, A. 1999. Psychological safety and learning behavior in work teams. Administrative science
quarterly, 44, 350-383.
Fineman, S. 2000. Emotion in organizations, Sage.

313
Grant, R. M. 1996. Toward a Knowledge-Based Theory of the firm. Strategic management journal, 17, 109-
122.
Hargadon, A. B. 2006. Bridging old worlds and building new ones: Toward a microsociology of creativity.
Creativity and innovation in organizational teams, 199-216.
Janssen, O. 2000. Job demands, perceptions of effort-reward fairness and innovative work behaviour.
Journal of Occupational and organizational psychology, 73, 287-302.
Janssen, O. 2003. Innovative behavior and job involvement at the price of conflict and less satisfactory
relations with co-workers. Journal of Organizational and Occupational Psychology, 76: 347–364.
Janssen, O., Van de Vliert, E., & West, M. 2004. The bright and dark sides of individual and group
innovation:A special issue introduction. Journal of Organizational Behavior, 25: 129–145.
Jordan, J. V. 1991. Women's growth in connection: Writings from the Stone Center, Guilford Press.
Kanter, R. M. 1983. The Change Masters: Binnovation and Entrepreneturship in the American Corporation,
Touchstone Book.
Kelly, J. R. & BARSADE, S. G. 2001. Mood and emotions in small groups and work teams. Organizational
behavior and human decision processes, 86, 99-130.
Kanter. R, 1988, Wben a thousand flowers bloom: Structural, collective, and social conditions for
innovation in organizations. In B. M. Staw & L. L. Cummings (Eds,), Research in organizational behavior,
vol 10: 169-211. Greenwich, CT: JAI Press.
Kennedy-Moore, E. & Watson, J. C. 2001. How and when does emotional expression help? Review of
General Psychology, 5, 187.
Lewin R, Regine B. 2000. The Soul at Work. Simon & Schuster: New York.
Marcial, L. & Heaphy, E. 2004. The role of positivity and connectivity in the performance of business
teams. American Behavioral Scientist, 47, 740-765.
Rogers, C. R. 1951. Client-centered therapy: Its current practice, implications and theory. London:
Constable.
Schawlow, A. 1997. Motivating creativity in organizations.
Shepard, L. A. (1978). Self-acceptance: The evaluative component of the self-concept construct. American
Educational Research Journal, 16(2), 139-160. West, M. A. and J. L. Farr (1989). "Innovation at work:
Psychological perspectives." Social Behaviour.
Stephens, J. P. 2011. High quality connections. Oxford University.
Stephens, J. P., Heaphy, E. D., Carmeli, A., Spreitzer, G. M. & Dutton, J. E. 2013. Relationship quality and
virtuousness: Emotional carrying capacity as a source of individual and team resilience. The Journal of
Applied Behavioral Science, 0021886312471193.
Swaddiwudhipong, S., Lu, H.-R. & Wee, T.-H. 2003. Direct tension test and tensile strain capacity of
concrete at early age. Cement and concrete research, 33, 2077-2084.
Weick K.E, Roberts K. 1993. Collective mind in organizations: Heedful interrelating on flight decks.
Administrative Science Quarterly 38: 357– 381.
Weiss, H. M. & Cropanzano, R. 1996. Affective events theory: A theoretical discussion of the structure,
causes and consequences of affective experiences at work.
West, M. A. & Farr, J. L. 1989. Innovation at work: Psychological perspectives. Social Behaviour.
314
Higher Education System in Pakistan and Transition
to Knowledge Economy
Dr. Riaz Ul Haq Tariq Muhammad Ayub Buzdar
National Accreditation Council Islamabad University Faisalabad
Pakistan Pakistan
Abstract:
The medium term plan of HEC, Pakistan, put the knowledge economy at the center point. This paper
analyzes the higher education situation of Pakistan in light of various indicators like knowledge &
technology index, patent output and patent uptake, and various other indices. The performance is dismally
poor. The nature of current industry in Pakistan is also discussed. It is concluded that the present situation
of governance, faculty quality, and funding of R&D is a mismatch. There is a strong need to re-look and
re-engineer our higher education system, especially public sector, to be able to contribute to the national
economy and to national prosperity. There are fears that retrofitting of system may not work. A complete
overhauling is proposed, which seems impossible within the dynamics of present governance model.
Keywords: Patents; Innovation; Research & Development; H Index
Introduction
The concept of knowledge economy has transformed the traditional concept of knowledge from a
philosophical and pure academic reference to an economic connotation. Under this emerging concept,
knowledge is not a mere belief and state of mind but a set of experiences learned and reflected through
human practices (Jensen, 2012; Turner, 2012). World Bank accepted four pillars of knowledge economy
including economic and institutional regime, education and skill of population, information infrastructure,
and innovation system (WorldBank, 2007). Developed and emerging global economies have concentrated
to win advancements in these four pillars and pursued a paradigm shift in their economic frontiers (de la
Paz-Marín, Gutiérrez, & Hervás-Martínez, 2015). Literature demonstrates that a number of countries
moved very quickly towards knowledge based economy whereas many economies were very slow in this
process. Knowledge production and dissemination mechanisms highly contribute for success in such
endeavors. These mechanisms generally operate under higher education systems and are aimed to influence,
promote, and comprehensively nurture all four pillars of the knowledge based economies. Countries with
emerging economies vary in their efforts for developing and transfiguring innovative and knowledge
economy promoter educational systems (Weber, 2011).
Higher education system in Pakistan remained under high criticism due to not meeting global tasks of skill
development, technological advancement and knowledge economy formation (Bano & Taylor, 2014; Lodhi
& Zaman, 2012). We in this article reviewed the growth of higher education in Pakistan concentrating on
its contribution in realizing the task of knowledge based economy in the country. We analyzed Pakistani
efforts comparing its performance against different economic and educational indicators with SAARC
(South Asian Association for Regional Cooperation) countries.
Nature of Pakistan Economy

315
Pakistan’s economy remained dependent on agricultural products especially that have export
potentials. Many indicators demonstrate that agriculture sector positively contributes in economic growth
of the country. The crop economy provides raw material to the industrial sector, which increases
employment opportunities and promotes the country exports (Afzal, 2006; Henneberry & Khan, 2000).
Composition of Pakistan economy shows that agriculture sector is sharing more 20-25% of the GDP since
2008-09. Agriculture and services including transport and communication are demonstrating positive
growth since 2008-09. Otherwise remaining sectors of Pakistan economy including industry, large-scale
manufacturing, construction, wholesale and retail trade and finance and insurance were demonstrating
negative growth rate in 2008-09. The situation, however, changed in four years and the country
demonstrated positive growth rate in all reported sectors of the economy (NationalBankofPakistan, 2014).
A regional comparison demonstrates that the export of goods and services provided 13% share in the
GDP of Pakistan in 2013 whereas for Bhutan, India and Bangladesh these shares were 40%, 25% and 20%
respectively. The imports of goods and services of Pakistan are 20% of its GDP whereas for Bhutan, India
and Bangladesh these shares are 63%, 28% and 27% respectively (WorldBank, 2014b). The share of
imports of goods and services in Pakistan GDP is 53% higher than the share of exports of Goods and
services. However this ratio is 57%, 12% and 35% for Bhutan, India and Bangladesh. Less share of export
of services and goods and a widening gap between the exports and imports unveil the fragile conditions of
Pakistan economy that is also reflected in many international economic reports. For instance, the World
Bank forecasting for the years 2014, 2015, and 2016 situates Pakistan among the South Asian countries
with lowest GDP growth rates (WorldBank, 2014a). It is estimated that Bhutan, India and Sri Lanka would
perform better than Pakistan in next two years. Pakistan, on the other hand, has observed a stagnant
condition in the shares of three major sectors of Pakistan’s economy (agricultural, industrial, and services)
since 2008-09 (NationalBankofPakistan, 2014) and the situation may persist in near future (WorldBank,
2014a).
Figure 1. Charges for the use of intellectual property in payments and receipts between residents and
nonresidents for the authorized use of proprietary rights (such as patents, trademarks, copyrights, industrial
processes and designs including trade secrets, and franchises) and for the use, through licensing agreements,
of produced originals or prototypes (such as copyrights on books and manuscripts, computer software,
cinematographic works, and sound recordings) and related rights (such as for live performances and
television, cable, or satellite broadcast). Data are in millions of current U.S. dollars. Source: (WorldBank,
2014b)
Comparison of the gaps between shares of export and import of goods and services in GDPs of
different countries strengthens the idea that this gap reduces in the countries that have developed knowledge
based economies. Another major indicator of economic output of knowledge production is gaining property
rights. Data show that gaps between payments and receipts of property rights have widened in previous
years in Pakistan (see figure 1). It reflects a deteriorating condition of intellectual and technical
advancements, which are closely linked with economic stagnation in the country. In next section of this
106117 123
161.41
5338
4 7.54
0
50
100
150
200
2006 2008 2010 2012Payments Receipts

316
paper, we try to examine the reasons of this economic recession in the context of knowledge economy,
research, innovation and higher education. It is important to investigate how Pakistan’s economy is utilizing
knowledge and innovation as capital and economy revolutionizer, and to what extent higher education in
Pakistan has potential to turn the economy from traditional to a knowledge based track.
Pakistan’s Preparedness for Knowledge Economy
Knowledge economy establishes its foundation on academic and technological innovation and research.
Global Innovation Index (GII) 2014 situates Pakistan in second last position in the SAARC region. India
gains highest position in the GII securing 76th position out of 143 countries scoring 33.7/100 points (Dutta,
Lanvin, & Wunch-Vincent, 2014). Pakistan is on 134th position with the score of 24.0/100. Only Nepal is
lagging behind Pakistan with 136th position in the SAARC region (table 1). The Global Innovation Index
provides ranking of 143 countries in which Pakistan stands on 134th position. Only nine countries in the
report perform lesser than Pakistan in the global innovation index.
Figure 2. Comparison of SAARC countries’ ranking out of 143 countries on Global Innovation Index.
Data for Afghanistan and Maldives are not available. Source: Global Innovation Index 2014, published by
World Intellectual Property Organization (WIPO), editors: Dutta, et al. (2014).
The concept of innovation is highly related with knowledge production and absorption. Use of
knowledge as capital generator has revolutionized higher education systems globally. Investment in human
capital and research is considered vital for constructing knowledge base economy (Turner, 2012).
Deteriorate and static condition of Pakistan economy and a lower performance in global innovation index
may be linked with the lesser investment in human capital and research. Consequently Pakistan
demonstrates lower ranking (139th position out of 143 countries) in human capital and research index with
the score of only 09.8/100 (Table 01). Three areas of human capital and research are projected in the index
in which Pakistan performance is comparatively better in research and development securing 68th position.
Pakistan score in research and development indicator is 9.8/100 whereas India gets 31st position with the
score of 32. It shows that despite a comparatively better position in global ranking Pakistan’s score is
significantly low in research and development, which produces problematic consequences for the country
economy. The worsened situation in school and tertiary education has further exploited the results of lesser
investment in research and development. Pakistan ranks on 141st and 124th position in the indicators of
school and tertiary education, respectively securing 10.7 and 8.9 scores out of 100. These scores are lowest
in the SAARC region. Lesser ranking in research and development and deteriorate positioning in school
and tertiary education in Pakistan produced complex results in knowledge and technology output index.
Pakistan scored 21.9 points in knowledge and technology output index whereas India’s score was 32.2
against this indicator. Sri Lanka and Bangladesh also demonstrated better position than Pakistan. The scores
of Pakistan against the three indicators of knowledge and technology outputs i.e. knowledge creation,
knowledge impact and knowledge diffusion are 10.0, 29.7 and 26.0 respectively.
76
86
105
129134 136
60
70
80
90
100
110
120
130
140
150
India Bhutan Sri Lanka Bangladesh Pakistan Nepal

317
Table 1
Comparison of values/scores (0-100) obtained by SAARC countries on different indicators of Global
Innovation Index
Indicators India Bhutan Sri Lanka Bangladesh Pakistan Nepal
Global Innovation Index 33.7 31.8 29.0 24.4 24.0 23.8
Human Capital & Research 22.7 17.0 17.1 14.1 09.8 15.5
Education (School) 24.7 42.3 29.9 20.6 10.7 31.5
Tertiary Education 11.7 08.8 18.2 15.0 08.9 12.6
Research & Development 32.0 00.0 03.4 05.1 09.8 02.8
Knowledge & Technology Outputs 32.2 02.8 26.5 22.2 21.9 11.2
Knowledge Creation 18.4 05.1 07.1 06.1 10.0 11.4
Knowledge Impact 34.1 02.5 34.9 29.9 29.7 02.4
Knowledge Diffusion 44.1 00.7 37.5 30.5 26.0 19.9
Business Sophistication 28.0 29.3 19.8 14.9 19.3 31.3
Knowledge Workers 25.0 31.1 23.6 11.8 17.5 38.3
Innovation Linkages 38.9 43.4 21.9 25.5 20.1 28.0
Knowledge Absorption 20.2 13.3 13.9 07.3 20.3 27.6
Source: Global Innovation Index 2014, published by World Intellectual Property Organization (WIPO),
editors: Dutta, et al. (2014). Data for Afghanistan and Maldives are not available.
India, Bhutan, Sri Lanka and Bangladesh performed better than Pakistan in human capital and research
index. The countries are also higher than Pakistan in knowledge and technology outputs except Bhutan.
Though Pakistan’s ranking is comparatively higher in research and development index with 68th position
and second in the SAARC region yet its score against the indicator (9.8) is very low than India (32.0) and
other countries of the region. One result of comparatively higher ranking in research and development may
the relatively higher ranking of Pakistan in knowledge creation indicator in the SAARC region. Pakistan
demonstrates 79th position in knowledge creation index securing 3rd position in the SAARC region.
However, the scores Pakistan obtained in research and development and knowledge creation indicators are
significantly low (table 1).
Figure 3. Comparison of H Index (2013) obtained by SAARC countries. Source: The SCImago Journal &
Country Ranking based on Scopus database. URL: http://www.scimagojr.com/countryrank.
The gap between knowledge creation in India and Pakistan is also visible in H Index. India scored 341
in H Index for the year 2013 whereas Pakistan’s score was 130 (see figure 3). H Index shows the numbers
of article (from the country), that receive h citations. Pakistan and India score 10.0 and 18.4 on knowledge
creation indicator in global innovation index respectively. Citations and citable documents contribute in
knowledge creation activities of the country. Though Pakistan is performing comparatively better than other
SAARC countries (except India) in H index and knowledge creation indicator yet it demonstrates weak
341
130 112 96 8024 20 18
0
100
200
300
400
H Index
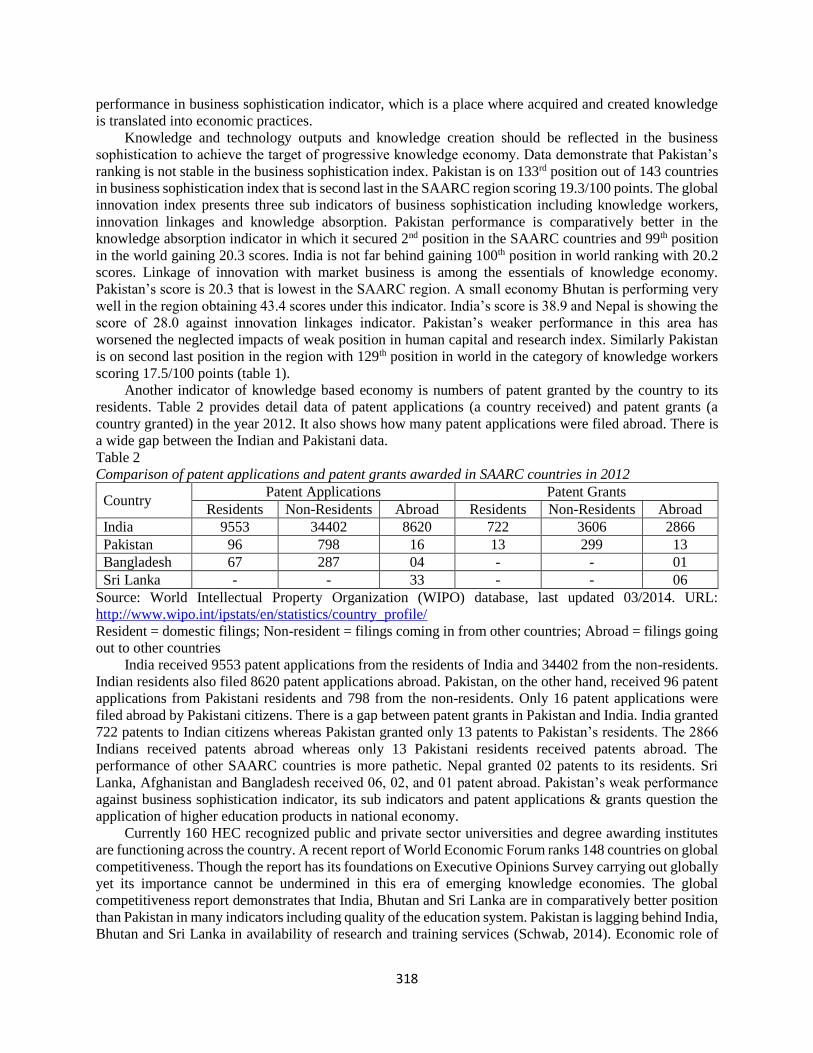
318
performance in business sophistication indicator, which is a place where acquired and created knowledge
is translated into economic practices.
Knowledge and technology outputs and knowledge creation should be reflected in the business
sophistication to achieve the target of progressive knowledge economy. Data demonstrate that Pakistan’s
ranking is not stable in the business sophistication index. Pakistan is on 133rd position out of 143 countries
in business sophistication index that is second last in the SAARC region scoring 19.3/100 points. The global
innovation index presents three sub indicators of business sophistication including knowledge workers,
innovation linkages and knowledge absorption. Pakistan performance is comparatively better in the
knowledge absorption indicator in which it secured 2nd position in the SAARC countries and 99th position
in the world gaining 20.3 scores. India is not far behind gaining 100th position in world ranking with 20.2
scores. Linkage of innovation with market business is among the essentials of knowledge economy.
Pakistan’s score is 20.3 that is lowest in the SAARC region. A small economy Bhutan is performing very
well in the region obtaining 43.4 scores under this indicator. India’s score is 38.9 and Nepal is showing the
score of 28.0 against innovation linkages indicator. Pakistan’s weaker performance in this area has
worsened the neglected impacts of weak position in human capital and research index. Similarly Pakistan
is on second last position in the region with 129th position in world in the category of knowledge workers
scoring 17.5/100 points (table 1).
Another indicator of knowledge based economy is numbers of patent granted by the country to its
residents. Table 2 provides detail data of patent applications (a country received) and patent grants (a
country granted) in the year 2012. It also shows how many patent applications were filed abroad. There is
a wide gap between the Indian and Pakistani data.
Table 2
Comparison of patent applications and patent grants awarded in SAARC countries in 2012
Country Patent Applications Patent Grants
Residents Non-Residents Abroad Residents Non-Residents Abroad
India 9553 34402 8620 722 3606 2866
Pakistan 96 798 16 13 299 13
Bangladesh 67 287 04 - - 01
Sri Lanka - - 33 - - 06
Source: World Intellectual Property Organization (WIPO) database, last updated 03/2014. URL:
http://www.wipo.int/ipstats/en/statistics/country_profile/
Resident = domestic filings; Non-resident = filings coming in from other countries; Abroad = filings going
out to other countries
India received 9553 patent applications from the residents of India and 34402 from the non-residents.
Indian residents also filed 8620 patent applications abroad. Pakistan, on the other hand, received 96 patent
applications from Pakistani residents and 798 from the non-residents. Only 16 patent applications were
filed abroad by Pakistani citizens. There is a gap between patent grants in Pakistan and India. India granted
722 patents to Indian citizens whereas Pakistan granted only 13 patents to Pakistan’s residents. The 2866
Indians received patents abroad whereas only 13 Pakistani residents received patents abroad. The
performance of other SAARC countries is more pathetic. Nepal granted 02 patents to its residents. Sri
Lanka, Afghanistan and Bangladesh received 06, 02, and 01 patent abroad. Pakistan’s weak performance
against business sophistication indicator, its sub indicators and patent applications & grants question the
application of higher education products in national economy.
Currently 160 HEC recognized public and private sector universities and degree awarding institutes
are functioning across the country. A recent report of World Economic Forum ranks 148 countries on global
competitiveness. Though the report has its foundations on Executive Opinions Survey carrying out globally
yet its importance cannot be undermined in this era of emerging knowledge economies. The global
competitiveness report demonstrates that India, Bhutan and Sri Lanka are in comparatively better position
than Pakistan in many indicators including quality of the education system. Pakistan is lagging behind India,
Bhutan and Sri Lanka in availability of research and training services (Schwab, 2014). Economic role of

319
higher education demands a knowledge based linkage between university and finance producers e.g.
agriculture, industry and business. Ultimate results of application of knowledge in industry are uptake and
registration of patents, as well as receipts of intellectual property rights, which demonstrates a significant
shift in the composition of economy. We in Pakistan are facing a static situation in the economy in this
regard and Gross Development Products (GDP) is fundamentally relying on agriculture and services
sectors.
Conclusions
Pakistan predominantly keeps an agrarian economy producing agricultural products that are directly
exportable or provided to industrial sector as raw materials. However the emerge of knowledge based
economies has aroused the need of intervening innovation and knowledge capital into traditional agrarian
and industrial economies. More than half share of GDP of Pakistan is occupied by services sector.
Agricultural and industrial sectors share in rest of the economy. This ratio is majorly stagnant from several
years. The average GDP growth rate as well as forecast for 2014, 2015 and 2016 situates Pakistan in the
countries who demonstrate reasonably lower GDP growth. We attempted to trace out the reasons of this
economic recession assessing the country’s performance against basic components of knowledge economy.
We found that Pakistan is second last country in the SAARC region in global innovation index securing
134th position out of 143 global economies. Pakistan’s performance is lowest against the indicator of
human capital and research in the region. Though Pakistan performed comparatively better in research and
development indicator securing second position in the region yet the gap between first ranked India (32
points) and second ranked Pakistan (9.8 points) in the region questioned the commitment of Pakistan higher
education sector with research and development. A wide gap between the values of H Index for India (341)
and Pakistan (130) also explore this issue. Similar gap is also visible in patents grants of India (4328) and
Pakistan (312) in the year 2012. Share of the exports of goods and services in GDP was significantly lower
for Pakistan (13%) than Bhutan (40%), India (25%) and Bangladesh (20%) in the year 2013. Share of the
imports of goods and services is 53% higher than the share of exports of Goods and services in Pakistan
GDP. This ratio is very low for India (12%) and Bangladesh (35%). Gap between the payments and receipts
of intellectual property rights is also widening. Pakistani residents (individual and companies) received
$7.54 million of intellectual property rights in 2012 whereas payments of Pakistani individuals and
companies for the said period were $161.41million. It demonstrates that Pakistani residents (including
academia, researchers, scientists, technologists etc.) are not integrating and using their achievements for
promoting national economy. We concluded in this paper that not only the structure of higher education
and research is weak in the country but the situation in applying knowledge outcome in practical economy
is also unsatisfactory. Global competitiveness report 2014 ranked Pakistan lower than Sri Lanka, India, and
Bhutan in the indicator of quality of education system. Innovation linkages of Pakistan are also in lowest
position in the SAARC region. This paper recommends a paradigm shift in the educational preferences
especially at higher level in Pakistan. Universities and research institutes should initiate more ventures for
research and development. A mechanism that focuses on introduction, application and integration of higher
education inventions and innovations in industry and economy is also recommended. Higher education
system, in this regard, can revolutionize the traditional concept of economy to a knowledge based economy
in Pakistan.
References
- Afzal, M. (2006). Causality between exports, world income and economic growth in Pakistan.
International Economic Journal, 20, 63-77.
- Bano, S., & Taylor, J. (2014). Universities and the knowledge-based economy: perceptions from a
developing country. Higher Education Research & Development, 1-14.
- de la Paz-Marín, M., Gutiérrez, P. A., & Hervás-Martínez, C. (2015). Classification of countries’
progress toward a knowledge economy based on machine learning classification techniques. Expert
Systems with Applications, 42, 562-572.

320
- Dutta, S., Lanvin, B., & Wunch-Vincent, S. (2014). The Global Innovation Index 2014: The human
factor in innovation. Geneva, Switzerland: World Intellectual Property Organization.
- Henneberry, S. R., & Khan, M. E. (2000). An Analysis of the Linkage Between Agricultural
Exports and Economic Growth in Pakistan. Journal of International Food & Agribusiness
Marketing, 10, 13-29.
- Jensen, H. S. (2012). The Changing Role of Knowledge in the Knowledge Economy: Concepts of
Knowledge and Knowledge Management. In K. I. Westeren (Ed.), Foundations of the Knowledge
Economy: Innovation, Learning and Clusters. Cheltenham, UK: Edward Elgar.
- Lodhi, S., & Zaman, K. (2012). Perspectives of the knowledge-based economy on the educational
sector: spotlight on Pakistan. Knowledge Management for Development Journal, 8, 128-140.
- NationalBankofPakistan. (2014). Economic Indicators Pakistan. In. Karachi: National Bank of
Pakistan.
- Schwab, K. (2014). The Global Competitiveness Report 2013–2014. Geneva: World Economic
Forum.
- Turner, D. A. (2012). Higher education: Centre stage or in the wings of the knowledge economy—
A review essay. International Journal of Educational Development, 32, 835-837.
- Weber, A. S. (2011). The role of education in knowledge economies in developing countries.
Procedia - Social and Behavioral Sciences, 15, 2589-2594.
- WorldBank. (2007). Building Knowledge Economies: Advanced Strategies for Development.
Washington DC: World Bank.
- WorldBank. (2014a). Global Economic Prospects. Washington, DC: The World Bank.
WorldBank. (2014b). World Development Indicators. Washington, DC: The World Bank.
.

321
EFFECT OF CORE COMPETENCE ON
SUSTAINABLE COMPETITIVE ADVANTAGES
OF BATIK BANYUMAS SMALL AND MEDIUM
ENTERPRISES
Rawuh Edy Priyono Nurul Anwar Rahab
Jenderal Soedirman
University
Jenderal Soedirman
University
Jenderal Soedirman
University
Indonesia Indonesia Indonesia
Abstract:
Increasing competition threatens the attractiveness of an industry and reducing the profitability of batik
banyumas owners. Banyumas batik small and medium enterprises (BBSMEs) therefore focus on gaining
sustainable competitive advantage to enable them respond to, and compete effectively in the market. By
identifying their core competences, firms are able to concentrate on areas that give them a lead over
competitors, provide a competitive advantage and increase its performance. This study seeks to determine
the relationship between firm core competence, competitive advantage and performance of small and
medium enterprises. Survey conducted on 58 owner and manager of small firm of Banyumas batik in
Banyumas Region. The study used convenience sampling method. Respondents in this study were the
owners and managers of Small to Medium Sized Enterprises of batik industry in Banyumas Region, Central
Java, Indonesia. A questionnaire will be administered to the sample chosen for the study.
Data was analysed by multiple regression analysis. The testing result showed that relationship
competence, adaptation competence and innovation competence has significantly effect on firms
innovativeness. Competitiveness significantly effect on small and medium industry business performance.
The ability of entrepreneurs to build business network has eased an information exchange and also to make
a social relatedness in order to improve the competitive advantage. The result of the study provides
contribution to Resources-Based View (RBV) theory, where the companies were able to improve all their
capabilities in enhancing the competitive advantage and small and medium firm’s performance.
Keywords : Core competence; Competitive Advantage; Performance; Batik; Banyumas
Introduction
The role of small medium enterproses (SMEs) in economic development and growth is crucial, and its
contribution is not only in developing countries but also in developed ones. SMEs is considered as the
exceptional industry since this kind of industry does not only absorb the larger sales force compared to the
larger industry, but it also provides the most significant contribution to the national gross domestic product
(GDP) (Tambunan, 2009). In the frame of national economy performance, SMEs has contributed 56 percent
to the total GDP of Indonesia. This indicates that more than half of the Indonesian‟s economy has been
supported by the SMEs (Kementerian Negara Koperasi and UKM, 2014). The development and SMEs role
is not minor, since they can provide huge contribution in worker absorption. Many efforts have been
performed by SMEs to create competitiveness, such as building a relationship with a larger industry, create
a proper management, convenient technology, and continuous innovation.

322
Based on the data from Badan Pusat Statistik (Bureau of Statistics), Central Java (2009), textile
industry has provided the largest contribution to the economy of Central Java. Batik is one of the work of
art and it becomes the famous heritage of Indonesia. Batik has been adored by many countries. Batik has
made Indonesia to be one of the excellent countries that produces the most unique silky traditional fabric
in the world. This label comes from a long-standing tradition of batik, which has deeply rooted in
Indonesian culture, as a rich various, creative and artistic tradition. In addition, batik has also been
acknowledged by the United Nations Educational, Scientific, and Cultural Organization (UNESCO) as
“Intangible World Heritage” in October 2009. The similar label was also given to “keris” (traditional
personal sacred weapon) and puppets. In Central Java province, there are many batik industry clusters i.e.
Solo, Pekalongan, Banyumas and sragen. Compored with batik from Solo, Pekalongan and Yogyakarta,
Batik Banyumas still unknown but Banyumas Government try hard to promote Batik Banyumas as a part
of local product which can penetrate international market. The introduction of imported batik in Indonesia
becomes a threat and also a chance for batik industries, especially in Pekalongan, to maintain their
competitive advantage and business performance. The ability to access government’s support, adaptability
on business environment and the ability to build business relationship will be the most important factors in
maintaining batik‟s competitive advantage in the market (Meutia, 2012).
Small and medium-sized enterprises (SMEs) sector has an important role to play in developing
economies not only in economic development, but also in poverty alleviation and job creation. The sector
faces a number of constraints especially in accessing finance, markets; training and technology. The sector
faces both problems and opportunities that affect their competitiveness. However, research carried earlier
on small-scale enterprises reveal that the performance of a number of them is less than satisfactory. Various
local studies have been conducted by Rahab, Najmudin and Istiqomah (2013) who study about stategy to
develop local economic through industrial core competence. Another study, Anwar, Rahab and Priyono
(2015) who did a study problems and challenge to create sustainable competitive advantage of Banyumas
Batik Small and Medium Enterprises (BBSMEs). Rahab, Anwar, and Priyono (2015) researched on the
significance of value chain up grading to support competitiveness of Banyumas Batik Industry. Meutia
(2013) explore about role of innovation creativity, business network and adaptability on competitive
advantage. There is limited empirical evidence on effects sources of core competence on competitive
advantage and performance of Batik Banyumas industry. This study seeks to fill the existing research gap
by conducting a study to determine the relationship between core competence, competitive advantage and
performance of BBSMEs in Banyumas region.
Unfortunately, some literatures show the lack of consistency on main factors to reach the success of
SME (O‟Regan and Ghobadian, 2004). The studies have found mixed views; some experts stated that SMEs
success is heavily influenced by the individual itself that is the entrepreneur and also the parties who explain
the importance of external factors and internal factors coming from the outside environment such as
economic condition, government’s policy. On the other hand, the availability of financial support and the
nature of infrastructure support (Yusuf, 1995) has also found to explain that entrepreneurs as the owner of
the business plays an important role in deciding the success of a business (Baum and Locke, 2004; Che
Rose et al., 2006; Man and Lau, 2005). External network is one succeeding factor in business because
through the business network an industry will be able to share the information; exchange the useful
information benefited both sides (Flora and Flora, 1993; Malecki, 1996; Woolcock, 1998). Even though
there is a positive evaluation in social capital’s role in firm’s development, yet some researchers argued
that social relationship would not always push the process of innovation development, on the contrary it
will create belief, community development, higher tolerance to the external side and the creation of new
ideas (Glaeser et al., 1995; Putzle, 1997). An entrepreneur who has high social capital (based on extensive
social network, status, personal relatedness, and existing reference) will tend to accept more funds from the
investor compared with another entrepreneurs who has lower rate in these dimensions (Shane and Cable,
1998). External network provides a support such as access to the opportunity and resources; as a result, it
will finally influence the micro-business performance (Burt, 1992; Johannisson, 1996).
The ability to build business network will enable the SMEs owner to reach any business information,
particularly for the information that comes from the outside of his company. Keats and Hit (1998) stated
323
that dynamic environment significantly related to the performance. The result of this is hoped to show an
influence of business environment on the company’s performance (Hansen and Wenerfelt, 1989). There
have been two factors that triggered the companys performance. The first is the role of external factors in
determining the company‟s success; meanwhile the second one highlights the internal aspects of MSE,
especially the entrepreneurs’ characteristic. Study which focuses on external factors, generally observed
the government‟s role in creating a conducive environment to reach the small business’ success (Hazlina,
2007). Meutia (2013) find that business network significantly affected competitive advantage.
Innovation Capacity is another factor contributing to the SMEs competitiveness. Wahyono (2002)
stated that continuous innovation in an organization was the basic needs to reach the competitive advantage.
Conventionally, innovation can be expressed as a breakthrough in adapting the dynamic environment,
which is related with new products. Nevertheless, simultaneously with the development of a company,
innovation caters new ideas and new process application. Innovation is also viewed as company‟s
mechanism in adapting with dynamic environment. Any changes in business environment have forced the
companies to create any new thoughts, new ideas, and to offer the innovative products. Innovation has an
important part in SMEs improvements because it will not only be the important tool to maintain the
company‟s survival, but it also to win the strenuous competition. Batik is a product of high innovation,
which becomes one of the Indonesian cultures that need to be maintained its existence. Innovation
competence, ability to adapt with business environment change (adaptation competence) and relationship
competence will be the important variables in improving competitiveness and the SMEs business
performance. These variables have partially been investigated by previous researches on the SMEs, but
they have been no study performed to explore the competitive advantage of batik industry, especially batik
banyumas small medium enterprises in Banyumas region. Based on these explanation, this study aim to
investigate effect of core competence dimensions (innovation competence, adaptation competence and
relationship competence) on sustainable competitive advantage.
Literature Review and Hypothesis Development
Firm Core Competence
The definition of core competence varies among researchers. According to Selznick (1957) and Porter
(1986), a core competence allows a firm to be different from its competitors in the same field of activity.
Hamel and Heene (1994), Dosi and Teece (1998) state that a core competence is defined as the skills and
the resources that allow a firm to achieve its goals. According to Hamel and Prahalad (1990), a core
competence is the knowledge of the company. The resource-based view (RBV) approach to firm core
competence argues that firms possess resources, a subset of which enables them to achieve sustainable
competitive advantage, and a further subset which leads to superior long-term performance (Barney, 1991;
Grant, 1991). The question of what drives the performance of a firm is a central issue in contemporary
research on strategy that applies the of strategy (Barney, 2001; Farjoun, 1998). Strategic competence is a
central driver of firm performance (Pehrsson, 2001). The concept is primarily an outgrowth of the resource-
based view of strategy (Barney, 1991, 2001; Grant, 1991). In this view, resources essentially are said to
confer competitive advantage to the extent that the resources must be difficult to create, buy, substitute, or
imitate (Barney, 1991; Lippman and Rumelt, 1982). In line with this, strategic competence is considered
to be a crucial source of heterogeneity that enables the firm to achieve competitive advantage and generate
high performance. Sustainable competitive advantage is the unique position that an organization develops
in relation to competitors that allows it to outperform them consistently (Hofer & Schendel, 1978).
The resource-based theory is considered as a useful framework to research and understand the
dynamics of firms in their attempts to attain sustainable competitive advantage. Resource-based theories
hold that enterprises with valuable, rare and inimitable resources have the potential of achieving superior
outcomes thereby achieving sustainable competitive advantage (Wiklund and Shepherd 2003). Birney
(1991) describes resources as inputs in a firm‟s production process. Resources are usually categorized as

324
either property-based or knowledge-based resources (Wiklund and Shepherd 2003). Property-based
resources refer typically to tangible input resources while knowledge-based resources are the ways in which
firms combine and transform tangible input resources. Knowledge-based resources are important in
providing sustainable competitive advantage. Resource-based theories have largely focused on
categorizing resources and examining the relationships between resource configurations and firm
performance in its ultimate goal of attaining competitive advantage. Little attention has been devoted to
examining the relationships between different resource configurations.
Sustainable Competitive Advantage
The idea of a Sustainable Competitive Advantage (SCA) surfaced in 1984, when Day (2004),
suggested types of strategies that may help to sustain the competitive advantage. The actual term SCA
emerged in 1985, when Porter discussed the basic types of competitive strategies that a firm can possess
(low-cost or differentiation) in order to achieve a long-run SCA. Interestingly, no formal conceptual
definition was presented by Porter in his discussion. Day and Wensley (1988) admit that there exists "no
common meaning for „SCA‟ in practice or in the marketing strategy literature". Barney (1991) has
probably come the closest to a formal definition by offering the following: "A firm is said to have a
sustained competitive advantage when it is implementing a value creating strategy not simultaneously
being implemented by any current or potential competitors and when these other firms are unable to
duplicate the benefits of this strategy (italics in original). Although lacking a formal definition, Coyne
(1986) contributed to the construct by proposing that in order to possess an SCA, consumers must perceive
some difference between a firm’s product offering and the competitors offering.
In achieving sustainable competitive advantage in organizations, Barney (1991) argues that valuable,
rare, and inimitable resources are necessary but not sufficient to facilitate better outcomes. Firms must also
have an appropriate organization culture in place to take advantage of these resources. An entrepreneurial
orientation fits in this context as it offers an important measure of the way firms are organized (Wiklund
and Shepherd, 2003). Entrepreneurial orientation refers to a firm’s strategic orientation, capturing specific
entrepreneurial aspects of decision-making styles, methods and practices (Lumpkin and Dess, 1996).
Previous studies (such as Kimuyu and Omiti, 2000; Zeller 1994) have largely focused on the direct link
between individual strands or configurations of personal resources and access to bank credit while less
attention has been devoted to how small enterprises can utilize these resources more effectively it its pursuit
of sustainable competitive advantage.
Performance of Small and Medium Enterprise
SMEs growth is often closely associated with firm overall success and survival. Growth has been used
as a simple measure of success in business. Growth is the most appropriate indicator of the performance
for surviving SMEs. Moreover, growth is an important precondition for the achievement of other financial
goals of business. From the point of view of an SMEs, growth is usually a critical precondition for its
longevity. Young firms that grow have twice the probability of survival as young non-growing firms. It has
been also found that strong growth may reduce the firm’s profitability temporarily, but increase it in the
long run (Parker, 1989). However, there are several conceptual and empirical challenges in the study of
firm growth. Firm growth in general refers to increase in size. In research, firm growth has been
operationalized in many ways and different measures have been used. This may be one reason for the
contradictory results reported by previous studies, though other explanations have also been presented. The
most frequently used measure for growth has been change in the firm‟s turnover.
However, it has been found that these measures, which are frequently used in the SMEs context, are
strongly intercorrelated. Such an intercorrelation may not exist among capital-intensive large companies.
Most studies of firm growth have focused on large companies or new venture, while the growth of
established, long-lived SMEs seems to have attracted much less attention. In fact, many organizational life
cycle models present growth as one stage of development in the organizational life cycle. On the other
hand, it has been shown that most new jobs are created by existing, not new, SMEs.
325
Relationship between Core competence On Competitiveness
Network theory shows that the ability of the SMEs owner to get access into rare sources could
economically be secured through a competence to build relationship with others, and this in turn will
contribute to the business‟ success (Zhao and Aram, 1995). Florin (2003) stated that relationship with others
provides added value to their member by letting them to gain access to social resources which are implanted
in a relationship, where the relationship itself provides a means to the SMEs owner to get external resources
which are needed by the organization (Jarillo, 1989). Granovetter (1983) stated that individual who has
business relationship, consist of relatives and colleague will likely gain an access to larger information
compared with the individual who does not link to a network. Based on this reasoning, Fischer and Reuber
(2003) stated that company owner needs to develop and improve its relationship with external environment
to enhance their business growth. Network can improve social capital of SMEs owners (Coleman, 1988)
since an access to the information is implanted in retrieved network. Therefore, Granovetter (1983)
concluded that individual who has business relationship consist of family and friends (strong relatedness)
will likely gain an access to larger information compared with the individual who have no kind of this
relationship with others. Based on this logical reasoning, Fischer and Reuber (2003) stated that the owner
of an organization needs to improve their relationship with external environment to enhance the business
growth. Based on these empirical evidences, it can be generated hypothesis,
Hypothesis 1. Relationship competence have a positive impact on firm’s competitiveness
Environment is the entire condition of external environment, which influences an organization.
Environment consists of internal and external environment. Internal environment is closely related with the
entire condition of an organization such as resources, capability, and core competence, which are owned,
by an organization (Hitt et al., 2001). Meanwhile, the external environment includes the general
environment, type of industry and competitors. The lack of market power and dynamic environment
surrounds the company as a consequence of new emerged markets faced by the SMEs makes it to be
susceptible to any external influence compared to the toughness of a bigger company (Man and Lau, 2002).
Baringer (1997) found that an organisation, which has a rapid growth enable to operate in a friendlier
environment, compared to the organisation that has a slower pace. This clearly indicates that there is a
positive influence of the environment‟s opportunity on the business competitive advantage.
According to Amit and Schoemaker (1993), organization has to be able to adapt itself with a fast
changing environment and technology to achieve its competitiveness. The previous studies (Beal, 2000;
Sinkovics et al., 2004; Barokah, 2009) stated that adaptation competence affects the competitivenss. The
competence of entrepreneurs in adapting themselves to business environment becomes an internal source,
which is hard to be imitated by other companies, and this in turn will create competitiveness for the
organization itself. Based on the above explanation and previous empirical findings, the second hypothesis
can be generated,
H2: Adaptation competence have a positive impact on firm’s competitiveness
Environment that is characterized by a rapid changing of customers preference, technology, and
competition, a company must create competitive advantage to survive. The ability of an organization to
innovate, keep its organisation learning, market orientation and entrepreneurship have been considered as
the main capability of a company to reach its competitive advantage (Hult and Ketchen, 2001; Hurley and
Hult, 1998; Ireland et al, 2001). These capabilities also help the company to reach its competitive advantage
and create a trend in the market. Former study explained that each of the four capabilities has adequately
provided a power, although it does not give enough strength to develop a continuous competitive advantage.
Competitive advantage is closely related with the developing generation of innovative product, and it in
turn provides an advantage for the companies to win the competition. According to Chiarvesio (2004), a
leading company is characterized by dynamic strategic behaviour in their ability to innovate, have a proper
relationship management with market, suppliers, internationalize the process, organize and manages the
business network by creating a new value for the customer (Mizik and Jacobson, 2003). Based on this
explanation and previous empirical findings, hypothesis can be constructed,
H3: Inovation competence have a positive impact on firm’s competitiveness
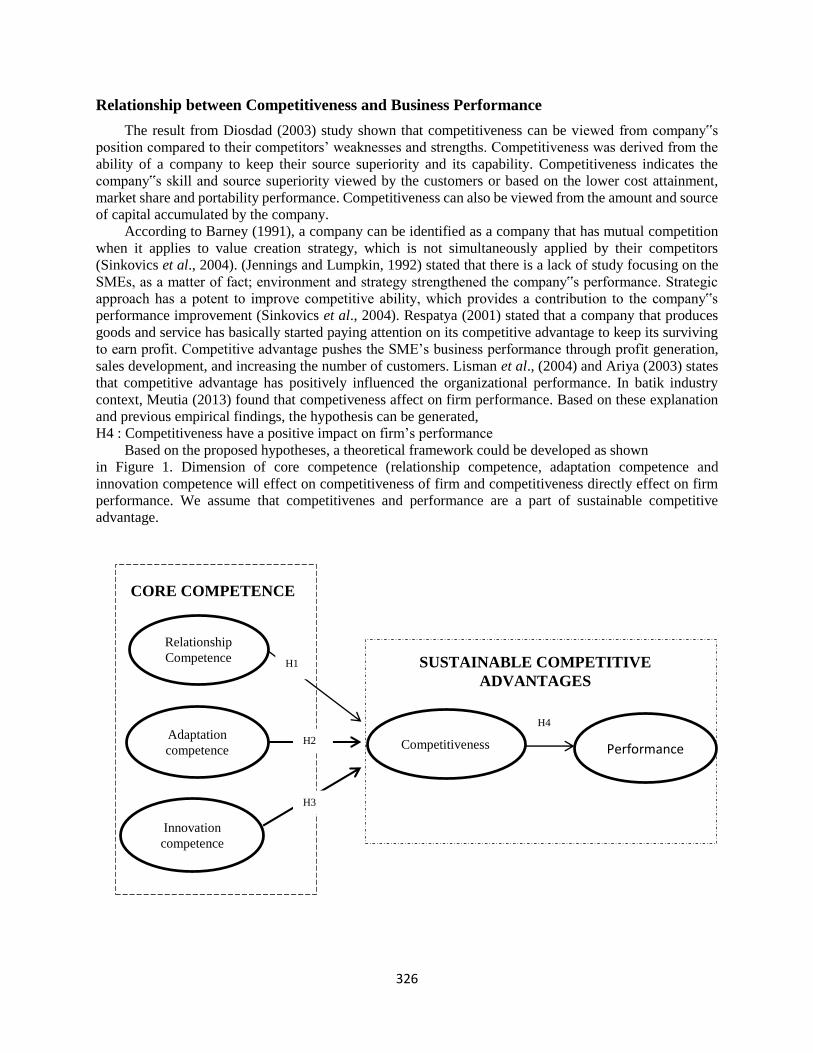
326
Relationship between Competitiveness and Business Performance
The result from Diosdad (2003) study shown that competitiveness can be viewed from company‟s
position compared to their competitors’ weaknesses and strengths. Competitiveness was derived from the
ability of a company to keep their source superiority and its capability. Competitiveness indicates the
company‟s skill and source superiority viewed by the customers or based on the lower cost attainment,
market share and portability performance. Competitiveness can also be viewed from the amount and source
of capital accumulated by the company.
According to Barney (1991), a company can be identified as a company that has mutual competition
when it applies to value creation strategy, which is not simultaneously applied by their competitors
(Sinkovics et al., 2004). (Jennings and Lumpkin, 1992) stated that there is a lack of study focusing on the
SMEs, as a matter of fact; environment and strategy strengthened the company‟s performance. Strategic
approach has a potent to improve competitive ability, which provides a contribution to the company‟s
performance improvement (Sinkovics et al., 2004). Respatya (2001) stated that a company that produces
goods and service has basically started paying attention on its competitive advantage to keep its surviving
to earn profit. Competitive advantage pushes the SME’s business performance through profit generation,
sales development, and increasing the number of customers. Lisman et al., (2004) and Ariya (2003) states
that competitive advantage has positively influenced the organizational performance. In batik industry
context, Meutia (2013) found that competiveness affect on firm performance. Based on these explanation
and previous empirical findings, the hypothesis can be generated,
H4 : Competitiveness have a positive impact on firm’s performance
Based on the proposed hypotheses, a theoretical framework could be developed as shown
in Figure 1. Dimension of core competence (relationship competence, adaptation competence and
innovation competence will effect on competitiveness of firm and competitiveness directly effect on firm
performance. We assume that competitivenes and performance are a part of sustainable competitive
advantage.
Relationship
Competence
Adaptation
competence
Innovation
competence
CORE COMPETENCE
Competitiveness Performance
SUSTAINABLE COMPETITIVE
ADVANTAGES
H1
H2
H3
H4
327
Research Method
This study use quantitative approach. Population of this study is the owner and manager of batik
banyumas small and medium enterprises (BBSMEs) of batik banyumas in 5 (five) regency. Data collection
was done through directly survey in Juni until Juli 2015 using purposive sampling technique. The BBSMEs
selected based on the purposive sampling technique with the following criteria: (i) it has at least 3 years
working experience. This is to evaluate trend and the dynamic of batik market, (2) it has permanent workers
which means that the company is relatively stable and able to continuously produce, (3) it involves not only
distribution activities, but also production activities, (4) and it covers marketing nationwide.
Total of 67 BBSMEs were included in the study. In total (67) questionnaires were distributed to the
managers or owners. The number of usable returned questionnaires was (58) giving response rate 86
percent, a rate that is regarded as good. The survey was administered directly. The Questionnaire was in
Indonesia, which is the communication language in Indonesia. A majority of the respondents (83 percent)
were male. Fifty five percent of the respondents were (40–60) old and the majority of respondent (63
percent) with job experience between (4–8) years .
Measurement and Data Analysis
To test hypothesis, we used regersion analysis by SPPS software 20. Two steps of detailed statistical
analysis of data were involved. At the first stage, descriptive statistic analysis was performed to extract the
mean and standard deviation of underlying study variables core competence, competitive advantage,
organizational performance and their dimensions. At the second stage, multiple regression analysis was
performed to understand the relationship among these variables. To measure the variables investigated in
the study, few indicators are used based on previous researches and theories. As for the variable relationship
competence, three indicators were used, namely: (i) the amount of network with production sector; (ii) the
amount of network with the supplier; (iii) the amount of network with distribution channel. The second
variable of the study is the adaptation competence on business environment. It is defined as the ability to
adapt with dynamic uncertain environment such as the adaptability with the changes in customer's
preference, market changes, competition, and the government‟s policy alteration and technology speed
(Covin and Slevin, 1989; Stamp, 2008; Hazlina, 2010; Mc Ginnis, 1993). Innovation competence are
measured by three indicators: (i) design innovation (ii) motif design innovation (iii) technogy innovation.
Meanwhile, competitiveness is the government‟s ability to provide an added value to win the competition.
It is the result of product differentiation between competitor and it is not only a product of differentiation
(Coyne, 1997). competitiveness indicators include: (i) the creation of better customer loyalty compared to
the competitor, (ii) the creation of better product development compared to the competitor, (iii) the creation
of better technological development compared to the competitor, (iii) and the creation of more various
product development compared to the competitor. Finally, the business performance was measured by four
indicators, namely: (i) sales development, (ii) working capital growth, (iii) customer growth, and (iv) profit
development (Wiklund, 1999; Wiklund and Shepherd, 2005; Stamp, 2008).
Analysis and results
Table 1. shows summary statistics of the metric variables in the study. A check of correlations among
the metric dependent variables found few significant correlations, and none that reached as high as 0,5,
indicating that there were no problems with multicollinearity between variables.
Table 1. Mean of metric variable
Variable Mean SD
Relationship Competence
REL1 1.83 0.22
REL2 1.95 0.22
REL3 1.96 0.21
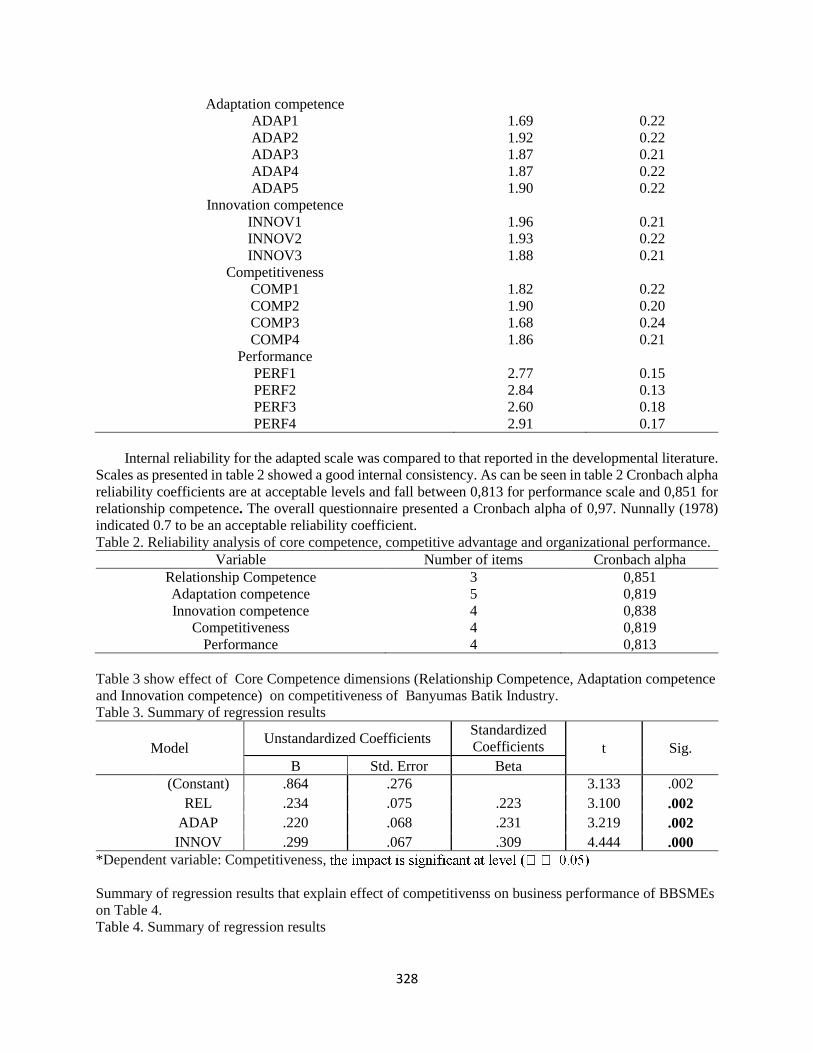
328
Adaptation competence
ADAP1 1.69 0.22
ADAP2 1.92 0.22
ADAP3 1.87 0.21
ADAP4 1.87 0.22
ADAP5 1.90 0.22
Innovation competence
INNOV1 1.96 0.21
INNOV2 1.93 0.22
INNOV3 1.88 0.21
Competitiveness
COMP1 1.82 0.22
COMP2 1.90 0.20
COMP3 1.68 0.24
COMP4 1.86 0.21
Performance
PERF1 2.77 0.15
PERF2 2.84 0.13
PERF3 2.60 0.18
PERF4 2.91 0.17
Internal reliability for the adapted scale was compared to that reported in the developmental literature.
Scales as presented in table 2 showed a good internal consistency. As can be seen in table 2 Cronbach alpha
reliability coefficients are at acceptable levels and fall between 0,813 for performance scale and 0,851 for
relationship competence. The overall questionnaire presented a Cronbach alpha of 0,97. Nunnally (1978)
indicated 0.7 to be an acceptable reliability coefficient.
Table 2. Reliability analysis of core competence, competitive advantage and organizational performance.
Variable Number of items Cronbach alpha
Relationship Competence 3 0,851
Adaptation competence 5 0,819
Innovation competence 4 0,838
Competitiveness 4 0,819
Performance 4 0,813
Table 3 show effect of Core Competence dimensions (Relationship Competence, Adaptation competence
and Innovation competence) on competitiveness of Banyumas Batik Industry.
Table 3. Summary of regression results
Model Unstandardized Coefficients
Standardized
Coefficients t Sig.
B Std. Error Beta
(Constant) .864 .276 3.133 .002
REL .234 .075 .223 3.100 .002
ADAP .220 .068 .231 3.219 .002
INNOV .299 .067 .309 4.444 .000
*Dependent variable: Competitiveness,
Summary of regression results that explain effect of competitivenss on business performance of BBSMEs
on Table 4.
Table 4. Summary of regression results
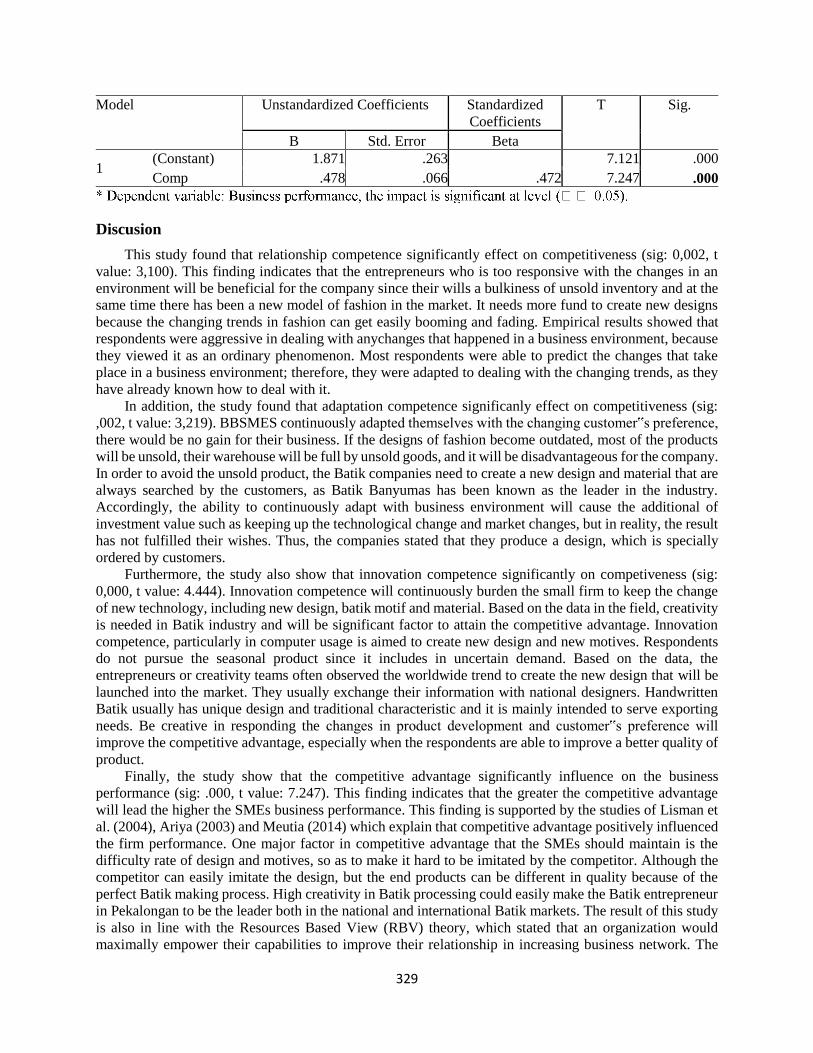
329
Model Unstandardized Coefficients Standardized
Coefficients
T Sig.
B Std. Error Beta
1 (Constant) 1.871 .263 7.121 .000
Comp .478 .066 .472 7.247 .000
Discusion
This study found that relationship competence significantly effect on competitiveness (sig: 0,002, t
value: 3,100). This finding indicates that the entrepreneurs who is too responsive with the changes in an
environment will be beneficial for the company since their wills a bulkiness of unsold inventory and at the
same time there has been a new model of fashion in the market. It needs more fund to create new designs
because the changing trends in fashion can get easily booming and fading. Empirical results showed that
respondents were aggressive in dealing with anychanges that happened in a business environment, because
they viewed it as an ordinary phenomenon. Most respondents were able to predict the changes that take
place in a business environment; therefore, they were adapted to dealing with the changing trends, as they
have already known how to deal with it.
In addition, the study found that adaptation competence significanly effect on competitiveness (sig:
,002, t value: 3,219). BBSMES continuously adapted themselves with the changing customer‟s preference,
there would be no gain for their business. If the designs of fashion become outdated, most of the products
will be unsold, their warehouse will be full by unsold goods, and it will be disadvantageous for the company.
In order to avoid the unsold product, the Batik companies need to create a new design and material that are
always searched by the customers, as Batik Banyumas has been known as the leader in the industry.
Accordingly, the ability to continuously adapt with business environment will cause the additional of
investment value such as keeping up the technological change and market changes, but in reality, the result
has not fulfilled their wishes. Thus, the companies stated that they produce a design, which is specially
ordered by customers.
Furthermore, the study also show that innovation competence significantly on competiveness (sig:
0,000, t value: 4.444). Innovation competence will continuously burden the small firm to keep the change
of new technology, including new design, batik motif and material. Based on the data in the field, creativity
is needed in Batik industry and will be significant factor to attain the competitive advantage. Innovation
competence, particularly in computer usage is aimed to create new design and new motives. Respondents
do not pursue the seasonal product since it includes in uncertain demand. Based on the data, the
entrepreneurs or creativity teams often observed the worldwide trend to create the new design that will be
launched into the market. They usually exchange their information with national designers. Handwritten
Batik usually has unique design and traditional characteristic and it is mainly intended to serve exporting
needs. Be creative in responding the changes in product development and customer‟s preference will
improve the competitive advantage, especially when the respondents are able to improve a better quality of
product.
Finally, the study show that the competitive advantage significantly influence on the business
performance (sig: .000, t value: 7.247). This finding indicates that the greater the competitive advantage
will lead the higher the SMEs business performance. This finding is supported by the studies of Lisman et
al. (2004), Ariya (2003) and Meutia (2014) which explain that competitive advantage positively influenced
the firm performance. One major factor in competitive advantage that the SMEs should maintain is the
difficulty rate of design and motives, so as to make it hard to be imitated by the competitor. Although the
competitor can easily imitate the design, but the end products can be different in quality because of the
perfect Batik making process. High creativity in Batik processing could easily make the Batik entrepreneur
in Pekalongan to be the leader both in the national and international Batik markets. The result of this study
is also in line with the Resources Based View (RBV) theory, which stated that an organization would
maximally empower their capabilities to improve their relationship in increasing business network. The

330
result from this study also explains that competitive advantage will be reached if innovation creativity is
continuously employed since innovation is one of the major capabilities in an organization.
Conclusion
This study provides empirical evidence of the relationship between core competence, competitive
advantage and organizational performance. We consider core competence to be a vital determinant of
competitive advantage and organizational performance. The study provides empirical evidence of the
effects of core competence on competitiveness of batik banyumas industry. Study confirm that all three
dimensions of core competence (relationship competence, adaptation competence and innovation
competence) were significant in explaining firm’s competitiveness. This current study also find that
competitiveness of batik indutry effect on firm’s performance. Therefore, BBSMEs owners can use the
current findings to develop strategies that deepen competitive advantage and enhance organizational
performance. The current findings may be used by managers to differentiate themselves in a competitive
batik banyumas industry marketplace. To remain competitiveness and obtain sustainable competitive
advantages, owners of BBSMEs can try to increase organizational performance by managing each
dimension of core competence i.e. relationship competence, adaptation competence and innovation
competence in the context of BBSMEs.
This implies that the BBSMEs could improve their sustainable competitive advantages by enhancing
its competitiveness and its performance following the resources based view theory. In designing strategy
for improving the SME business performance, limitations of the study should be noted. Further studies on
these issues are hoped to taken care of these study limitations. This study only investigated variables from
internal side of a company, while none of the external variables such as business environment and
governmen’s support was investigated. Another limitation of this study is we only used limited BBSMEs
in Barlinmascakeb area, so its finding cannot be generalization for batik industry in another place and
country.
Acknowledgement
The authors gratefully acknowledge financial support from Higher Educational Directorate, Ministry
of National Education, Republic of Indonesia by 2015 National Strategic Research Grant Program. We also
thank to anonymous reviewers and review editor for valuable suggestions.
References
Amit, R. and Schoemaker. (1993). “Strategic asset and organizational rent”. Strategic Management
Journal. Vol. 14, pp. 33-46.
Anwar, Nurul; Rahab and Rawuh Edy Priyono (2015). “Core Competence Of Batik Banyumas
Industry: Problems And Challenge To Create Sustainable Competitive Advantage”. International
Journal of Applied Business and Economic Research, Vol. 13, No.1.
Ariya, W.N. (2003).”Sources of competitive advantage and firm performance: The case of Sri Lankan
value-added Tea producers”. Asia Pacific Journal of Management. Vol. 20, pp. 73-90.
Barney.J.B. (1991). “Firm resource and sustained competitive advantage”. Journal of management.
Pp. 99-120.
Barney, J. (1995). “Looking inside for competitive advantage”, Academy of Management Executive,
Vol. 9 No. 4, pp. 49-61.
Barney, J. (2001). “Is the resource-based view a useful perspective for strategic management research?
Yes”, Academy of Management Review, Vol. 26 No. 1, pp. 41-56.
Barokah, S.N. (2009). “Studi tentang Faktor-Faktor yang Mempengaruhi Kualitas Strategi Bersaing
untuk Meningkatkan Kinerja Perusahaan pada KUKM Pengrajin Kulit di Manding- Bantul”.
Program Studi Magister Manajemen Program Pasca Sarjana Universitas Diponogoro Semarang.

331
Barringer, B.R. and Jeffrey S. H. (2000). “Walking a Tightrope: Creating Value through Inter-
organizational Relationships”. Journal of Management. Vol. 26, No. 3, pp. 367-403.
Baum, J.R. and Locke, E.A. (2004). “The relationship of entrepreneurial traits, skill, and motivation
to subsequent venture growth”. Journal of Applied Psychology, Vol. 89, No.4, pp. 587-598.
Beal, M.R. (2000). “Competing Effectively: Environmental Scanning, Competitive Strategy, and
Organizational Performance in Small Manufacturing Firms”. Journal of Small Business Management,
Milwaukee. Vol. 38, No. 1, pp. 27-47.
Burt, R. S. (1992). Structural holes. Cambridge: Harvard University Press.
Chiarvesio, M., (2004). ”From local networks of SMEs to virtual districts? Evidence from recent
trends in Italy”. Research Policy. Vol. 33, No. 10. pp. 1509-28.
Coleman, J. S. (1988). “Social capital in the creation of human capital”. American Journal of
Sociology. Vol. 94, pp. 95120.
Covin J.G and Slevin. (1989). “Strategic management of small firm in hostile and benign
environment”. Strategic Management Journal. Vol. 10, No. 1, pp 75-87.
Coyne, K. P. (1997). “Sustainable Competitive Advantage – What It Isn‟t”. Journal of Strategy. Vol.
25, No. 4. Diosdad, A. (2003). “Pengaruh Budaya Perusahaan Terhadap Keunggulan Bersaing”.
Jurnal Sains Pemasaran Indonesia. Vol. 2, No. 3 (Desember), pp. 256-278.
Day, GS, Wensley, R. (2008). “Assessing Advantage: A Framework for Diagnosing Competitive
Superiority”. Journal of Marketing, Vol. 12, No.1.
Fischer, E., and Reuber, R.A. (2003). “Support for rapid-growth firms: a comparison of the views of
founders, government policymakers, and private sector resource providers”. Journal of Small Business
Management. Vol. 41. No. 4. 346–365.
Flora, C. B., and Flora, J. L. (1993). “Entrepreneurial social infrastructure: a necessary ingredient”.
Annals of the Academy of Political and Social Science. Vol. 529, pp. 48–58.
Florin, J., Lubatkin, M. and Schulze, W. (2003). “A social capital model of high-growth ventures”.
Academy of Management Journal. Vol. 46, pp. 374-396.
Ghozali, I. (2011). Aplikasi Analisis Multivariate Dengan Program SPSS. Semarang: BP Universitas
Diponegoro.
Glaeser, E. L., Sacerdote, S. B., and Scheinkman, J. A. (1995). “Crime and social interactions”.
Quarterly Journal of Economics. Vol. 111, pp. 507–548.
Granovetter, M.,S. (1983). “Economic Action and Social Structure the Problem in Embededness”.
American Journal of Sociology. Vol 91 pp. 481-510.
Grant, R.M. (1991). The resource based theory of competitive advantage: implications for strategy
formulation. California Management Review 33 (3), 114–135.
Hamel, G and Prahalad, C.K. (1990). “The core competence of the corporation”. Harvard Business
Review, Vol. 68 No. 3: 79-92.
Hamel, G., and Prahalad, C. (1994). The concept of core competence, in Hamel, G. And Heene, A.
(Eds), Competence-Based Competition, Wiley, New York, NY: 11-33.
Hair, J. F. (2010). Multivariate Data Analysis. Seventh Edition.London: Prentice-Hall International
(UK) Limited.
Hamel, G and Prahalad, C.K. (1990). “The core competence of the corporation”. Harvard Business
Review, Vol. 68 No. 3: 79-92.
Hamel, G and Prahalad, C.K. (1990). “The core competence of the corporation”. Harvard Business
Review, Vol. 68 No. 3: 79-92.
Hamel, G., and Prahalad, C. (1994). The concept of core competence, in Hamel, G. And Heene, A.
(Eds), Competence-Based Competition, Wiley, New York, NY: 11-33.
Hansen. S. and Wernerfelt. B. (1989). “Determinants of Firm Performance: The Relative Importance
of Economic and Organizational Factors”. Strategic Management Journal. Vol. 10, No. 5, pp. 399-
411.

332
Hazlina. (2007). “A Cross cultural study of entrepreneurial competencies and entrepreneurial success
in SMES in Australia and Malaysia”. Thesis the University of Adelaide.
Hazlina. (2010). “Is Entrepreneurial Competency and Business Success Relationship Contingent Upon
Business environment?”. A Study of Malaysian SMES Emerald Group Publishing.
Hitt, M.A., Ireland, R. D., Camp, S. M., and Sexton, D. L. (2001),” Strategic Entrepreneurship:
Entrepreneurial strategies For Wealth Creation”. Strategic Management Journal. Vol. 22, pp. 479-
491.
Hofer, C.W., Schendel, D. (1978). Strategy Formulation: Analytical Concepts. West Publishing, St.
Paul, MN.
Hult, G.T.M, and Ketchen D.J. (2001). “Does market orientation matter? A test of the relationship
between positional advantage and performance”. Strategic Management Journal. Vol. 22, No. 9, pp.
899–906.
Hurley, R.F, and G.T.M. Hult. (1998). “Innovation, market orientation an organizational learning: An
integration and empirical examination”. Journal of Marketing, Vol. 62, pp. 42-54.
Ireland, R.D., Hitt, M.A., Camp, S.M. and Sexton, D.L. (2001). “Integrating Entrepreneurship and
Strategic Management Actions to Create Firm Wealth”. Academy of Management Executive. Vol. 15,
No. 1.
Jarillo, C.J. (1988). “On strategic networks”. Strategic Manag Journal. Vol. 9, pp.31–41.
Jennings, D.E, and Lumpkin (1992). “Insights between Environmental Scanning Activities and
Porter's Generic
Strategies: An Empirical Analysis”. Journal of Management. Vol. 18, pp. 791-803.
Johannisson, B. (1996). “The dynamics of entrepreneurial networks”. In: Reynolds, P., et al. (Eds.).
Frontiers of Entrepreneurship Research. pp. 253–267.
Keats, B.W., and Hitt, M.A. (1988). “A causal model of linkages among environmental dimensions,
macro organizational characteristics, and performance”. The Academy of Management Journal. Vol.
31, pp. 570-598.
Lisman, Chan, Shaffer, Margaret A. and Snape, ED. (2004). “In search of sustained competitive
advantage: The impact of organizational culture, competitive strategy and human resource
management practices on firm performance”. International Journal of Human Resource Management.
Vol.15, No.1, pp.15-3
Malecki, E. J., and Tootle, D. M. (1996). “The role of networks in small firm competitiveness”.
International Journal of Technology Management, Vol. 11, No. 2, pp. 43–57.
Man, T., and Lau, T. (2002). “The competitiveness of small and medium enterprises. A
conceptualisation with focus on entrepreneurial competencies”. Journal of Business Venturing. Vol.
17, No.2, pp.123–142.
Man, T., and Lau T. (2005). “The Context of entrepreneurship in Hong Kong”. Journal of Small
Business and Enterprise Development. Vol. 12, No.4, pp. 464-481.
McGinnis. (1993). “Logistic Strategy Organizational Environmental and Time Competitiveness”.
Journal of Business Logistic. Vol. 14, pp. 1-23.
Meutia. (2012). “Pengembangan Kompetensi Sosial Kewirausahaan Untuk Meningkatkan
Keunggulan Bersaing dan Kinerja Bisnis UKM. UKM Batik di Kota Pekalongan”. PhD Thesis. Undip.
Semarang.
Meutia. (2013). “Improving Competitive Advantage and Business Performance through the
Development of Business Network, Adaptability of Business Environment and Innovation Creativity:
An Empirical Study of Batik Small and Medium Enterprises (SME) in Pekalongan, Central Java,
Indonesia”. Aceh International Journal of Social Sciences, 2 (1): 11 - 20
Mizik, N., and Jacobson, R. (2003). “Trading off between value creation and value appropriation: the
financial implications of shifts in strategic emphasis”. Journal of Marketing. Vol. 67, pp. 63-76

333
O” Regan, N., and Ghobadian, A. (2004). “The importance of capabilities for strategic direction and
performance”. Management decision. Vol.42, No. 2, pp.292-312.
Putzel, J. (1997). “Accounting for the „dark side‟ of social capital: reading Robert Putnam on
democracy”. Journal of International Development. Vol. 9, No. 7, pp. 939–949.
Rahab; Nurul Anwar, Rawuh, Edy Priyono (2015). “Value Chain Up Grading To Support
Competitiveness Of Batik Banyumas Industries”. Proceedings of the Australasian Conference on
Business and Social Sciences 2015, ISBN: 978-0-9925622-1-2
Rahab, Najmudin and Istiqomah. (2013). “Local Economic Development Strategy Based on Local
Industrial Core Competence”. International Journal of Business and Management, Vol. 8, No. 16.
Respatya. D.M. (2001). “Analisa pengaruh strategi pelayanan prima dan fasilitas terhadap kepuasan
nasabah pada PT. Bank Negara Indonesia (Persek Kantor Cabang Semarang”. Thesis. Magister
Manajemen Universitas Diponegoro.
Sinkovics, Rudolf. R, Roath and Anthony, S. (2004). “Strategic Orientation, Capabilities, and
Performance in Manufacturer- 3 PL Relationships”. Journal of Business Logistics.
Stamp. (2008). “Entrepreneurial orientation and new venture performance: The moderating Role of
Intra - and Extra industry social capital”. Academy of management journal. Vol. 51, No.1, pp. 97-111.
State Ministry of Cooperatives and SMEs. (2009). Tambunan, T. (2009). UMKM di Indonesia.
Penerbit Ghalia Indonesia. Jakarta.
Wahyono. (2002). “Orientasi Pasar dan Inovasi: Pengaruhnya Terhadap Kinerja Pemasaran”. Jurnal
Sains Pemasaran Indonesia. Vol. 1, No.1.
Wiklund, J. (1999). “The sustainability of the entrepreneurial orientation- performance relationship”.
Entrepreneurship: Theory and Practice. Vol.24, No.1, pp.37-49.
Wiklund, J., and Shepherd, D.A., (2005). “Entrepreneurial orientation and small business
performance; a Configurational Approach”. Journal of Business Venturing. Vol. 20, pp. 71-91.
Woolcock, M. (1998). “Social Capital and Economic Development; toward a theoretical synthesis
and policy framework”. Theory and Society, In Elinor O and T.K. Ahn. Foundation of Social capital.
Massachusetts: Edward Elgar Publishing Limited.
Yusuf, A. (1995). “Critical success factor for small business perceptions of south Pacific
entrepreneur”. Journal of small business management. Vol.33, No.2, pp.68-73.
Zhao, L., and Aram, J. D. (1995). “Networking and growth of young technology- intensive ventures
in China”. Journal of Business Venturing. Vol. 10, No. 5, pp. 349-370.

334
Assessing the Impact Greening Information
Technology Tools and Technologies on Organizational
Sustainability
Dr. Mahmood Badr Ridha Al Obidi Dr. Abdel-Rahman Ismail
Al Zaytoonah University of Jordan Al Zaytoonah University of Jordan
Jordan Jordan
Abstract:
It is more than ever that organizations are increasingly being pressured governments and people to
become socially responsible. This is what is often referred to as organizational sustainability. Based on
literature reviewed for this study, organizations can achieve their sustainability goals and initiative using
different means and methods that can assist in cutting down on energy consumption and the reduction CO2
emission. The literature reviewed for this study focused on the utilization of Information Technology (IT)
as an enabler of organizational sustainability. Not much research efforts have focused on assessing the
impact of certain IT tools and technologies on organizational sustainability. This study will assess the
impact of specific “green” IT tools and technologies. These are: Collaboration tools, Cloud Computing for
power management, Automation of workstation shutdown when not in use, Workflow technologies, Virtual
Networking, Cloud Computing for resource optimization, Virtual Private Networks (VPN), Electronic
Mail (Email), and Video Conferencing.
Keywords: Sustainability, Green IT, Corporate Responsibility, Green Computing
Introduction
Information Technology (IT) has proved itself to be a very reliable strategic business partner that
enabled organizations to accomplish such strategic goals as operational excellence, efficient decision
making processes, and competitiveness which ultimately led to organizational survival. Today,
organizations, on a whole, have increasingly being pressured by people and governments to implement
practices that meet the demands of their ethical, social, and environmental responsibilities. Therefore, due
to the social consequences of how organizations handle such pressures, a whole new concept in
organizational management has arisen today which often referred to as corporate citizenship also known as
corporate sustainability. Today, more than ever, organizational leaders are vigorously planning and keenly
pursuing to transform their organizations into becoming organizationally sustainable (Benn, S., Dunphy,
D., & Griffiths, A. 2014). Large multinational organizations such as Coca-Cola, Wal-Mart, and Nestle have
made it mandatory upon their suppliers to start implementing sustainability practices in their operations.
For these organizations, as well as many others, corporate sustainability has become a key strategic
organizational initiative that they must plan for and implement in order meet the demands of becoming
socially responsible. Corporate sustainability initiatives and reporting is no longer a burdensome task upon
corporate leaders, but rather a continuous effort that is becoming the norm of daily business operations
(Baskin, 2014).
The impact of the advances in technology and telecommunications have introduces a whole new set
of global challenges in the early twenty-first century. A survey conducted by CIO magazine in 2008 of 280
IT executives, indicate that IT executives on a whole are in fact moving towards adopting the “greening”

335
of their IT operations initiative. According to the survey, these executive indicated that two principal
reasons that they are adopting such initiative: cost-cutting by becoming more energy efficient and to become
more socially responsible. Grant Thornton LLP (2007) conducted a survey of more than 500 business
executives. According to this survey, all of the business executives surveyed agree that for the organization
to be sustainable will certainly have a positive impact on the organization’s reputation, its ability to realize
its strategic goals, and profitability. Of those executives surveyed, 77% believe that their organizations’
sustainability initiatives will have a significant impact on their business strategies for years to come.
The role of IT in assisting organizations in achieving corporate sustainability has been investigated
and researched in recent years. However, the amount of research that has been conducted on which specific
IT tools and technologies that can assist the organization in becoming sustainable has been minimal.
Nevertheless, the role of IT in assisting organizations in meeting their sustainability initiatives has been
effective in enhancing the organization’s capabilities to improve its economic as well as its environmental
performance (Ekins, 2000). IT has also been considered an enabler of ecological competence due to its role
in such sustainable activities as efficient energy consumption, efficient logistics and transportation (Hilly,
et al. 2006). Therefore, it is the goal of this study to take into consideration specific “greening” IT tool and
technologies in order to measure their utilization by organizations towards the goal of becoming sustainable.
LITERATURE REVIEW
The concept of Corporate Sustainability (CS) which is also referred to as Corporate Social
Responsibility (CSR) is not a new one in the business literature. According to Marrewijk and Were (2003),
corporate sustainability denotes the deliberate organizational undertakings, which are often voluntary, that
make evident the insertion of societal as well as ecological apprehensions in the organizational processes
and transactions (Scientific American, 2013). Much of the literature investigated for this study refer to the
role of IT in assisting organizations in meeting their social responsibility and sustainability initiatives as
Green IT or Green Computing. These two terms refer to the utilization of IT resources and tools in an
ecologically sustainable way, thus encouraging and assisting the organization in becoming socially
responsible. Much of the IT research regarding the impact of Green Computing on business sustainability
has predominantly been devoted to the efforts of making IT and its tools more energy efficient and more
environmentally. Not much research has been devoted to the practices that organizations must undertake to
utilize IT as an enabler of business sustainability. According to Murugesan (2008), Green Computing
should be focused on the efforts of developing, engineering, utilizing, and the discarding of IT related
hardware such as computers, monitors and storage devices in a competent and responsible manner that will
not impact the environment in a negative way. In other word, the question becomes: Should we manufacture
“Green IT” or should we utilize IT in a “Green” manner to accomplish business sustainability? In this
context, Green IT is seen as the responsibility of the manufactures of IT related tools and equipment as well
as the end users (the organizations) who use such tools and equipment. However, for the purposes of this
study, the focus will be on the utilization of IT as a “greening agent” by organizations in a manner that will
assist these organizations in meeting their organizational sustainability initiatives.
According to Molla et al. (2008), the role of IT in assisting organizations in meeting their sustainability
initiatives can be approached from the standpoint that IT plays an important role in decreasing the negative
environmental impacts of the organization’s computing infrastructure. Brooks et al. (2010) indicates that
the utilization of such infrastructure should include changes to the way that the organization conducts its
daily business in a way that will improve energy consumption; therefore decreasing the negative
environmental impacts of the organization’s computing infrastructure. To accomplish that, Brooks et al.
further indicates that the organization must adopt Green IT tools and technologies that will assist the
organization in becoming sustainable. Based on the literature reviewed for this study, several Green IT
tools and practices have been identified that are widely considered as having major positive impact in
assisting organizations in becoming sustainable. These greening IT tools and practices are:
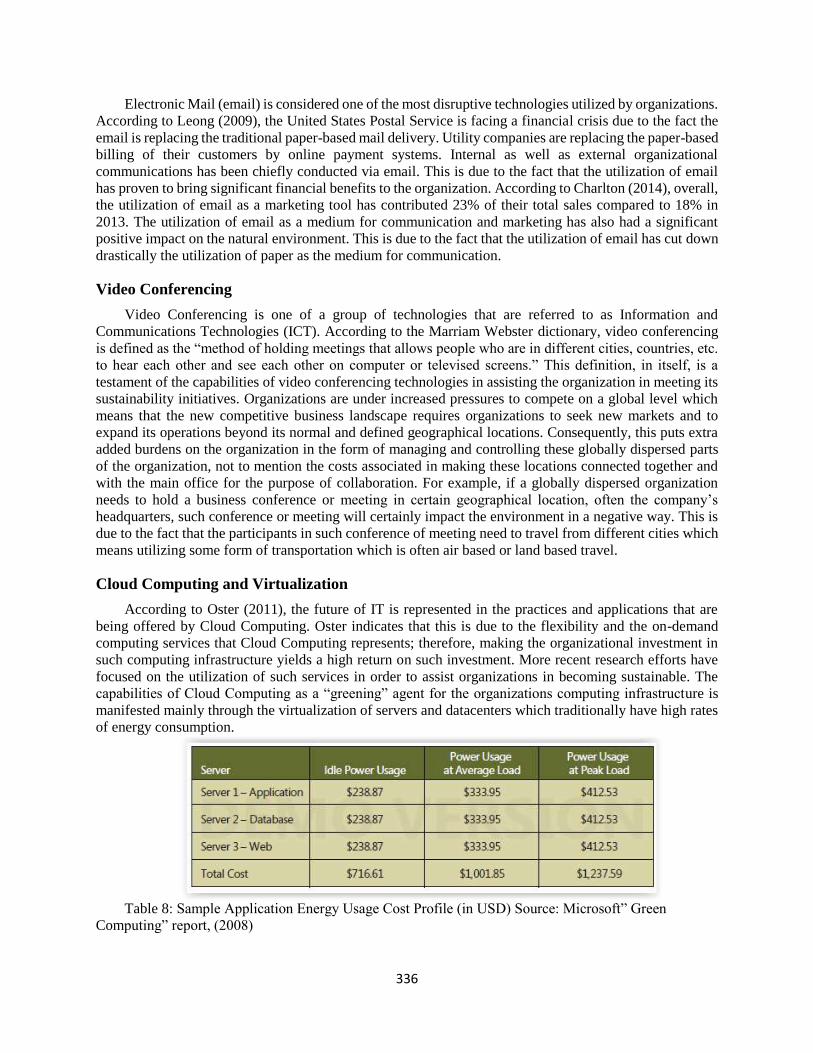
336
Electronic Mail (email) is considered one of the most disruptive technologies utilized by organizations.
According to Leong (2009), the United States Postal Service is facing a financial crisis due to the fact the
email is replacing the traditional paper-based mail delivery. Utility companies are replacing the paper-based
billing of their customers by online payment systems. Internal as well as external organizational
communications has been chiefly conducted via email. This is due to the fact that the utilization of email
has proven to bring significant financial benefits to the organization. According to Charlton (2014), overall,
the utilization of email as a marketing tool has contributed 23% of their total sales compared to 18% in
2013. The utilization of email as a medium for communication and marketing has also had a significant
positive impact on the natural environment. This is due to the fact that the utilization of email has cut down
drastically the utilization of paper as the medium for communication.
Video Conferencing
Video Conferencing is one of a group of technologies that are referred to as Information and
Communications Technologies (ICT). According to the Marriam Webster dictionary, video conferencing
is defined as the “method of holding meetings that allows people who are in different cities, countries, etc.
to hear each other and see each other on computer or televised screens.” This definition, in itself, is a
testament of the capabilities of video conferencing technologies in assisting the organization in meeting its
sustainability initiatives. Organizations are under increased pressures to compete on a global level which
means that the new competitive business landscape requires organizations to seek new markets and to
expand its operations beyond its normal and defined geographical locations. Consequently, this puts extra
added burdens on the organization in the form of managing and controlling these globally dispersed parts
of the organization, not to mention the costs associated in making these locations connected together and
with the main office for the purpose of collaboration. For example, if a globally dispersed organization
needs to hold a business conference or meeting in certain geographical location, often the company’s
headquarters, such conference or meeting will certainly impact the environment in a negative way. This is
due to the fact that the participants in such conference of meeting need to travel from different cities which
means utilizing some form of transportation which is often air based or land based travel.
Cloud Computing and Virtualization
According to Oster (2011), the future of IT is represented in the practices and applications that are
being offered by Cloud Computing. Oster indicates that this is due to the flexibility and the on-demand
computing services that Cloud Computing represents; therefore, making the organizational investment in
such computing infrastructure yields a high return on such investment. More recent research efforts have
focused on the utilization of such services in order to assist organizations in becoming sustainable. The
capabilities of Cloud Computing as a “greening” agent for the organizations computing infrastructure is
manifested mainly through the virtualization of servers and datacenters which traditionally have high rates
of energy consumption.
Table 8: Sample Application Energy Usage Cost Profile (in USD) Source: Microsoft” Green
Computing” report, (2008)

337
Table 9: Sample Application Energy Usage Cost Profile (in pounds CO2) Source: Microsoft” Green
Computing” report, (2008)
According to Mell and Grance (2011, p. 2), Cloud Computing includes the following services:
Software as a Service (SaaS), which provides the ability provided to the consumer is to use the
provider’s applications running on a cloud infrastructure2. The applications are accessible from various
client devices through either a thin client interface, such as a web browser (e.g., web-based email), or a
program interface. The consumer does not manage or control the underlying cloud infrastructure including
network, servers, operating systems, storage, or even individual application capabilities, with the possible
exception of limited user-specific application configuration settings.
Platform as a Service (PaaS). The capability provided to the consumer is to deploy onto the cloud
infrastructure consumer-created or acquired applications created using programming languages, libraries,
services, and tools supported by the provider.3 The consumer does not manage or control the underlying
cloud infrastructure including network, servers, operating systems, or storage, but has control over the
deployed applications and possibly configuration settings for the application-hosting environment.
Infrastructure as a Service (IaaS). The capability provided to the consumer is to provision processing,
storage, networks, and other fundamental computing resources where the consumer is able to deploy and
run arbitrary software, which can include operating systems and applications. The consumer does not
manage or control the underlying cloud infrastructure but has control over operating systems, storage, and
deployed applications; and possibly limited control of select networking components (e.g., host firewalls).
RESEARCH METHODOLOGY
The aim of this study is to measure the extent of the utilization of Green IT tools and technologies by
organizations towards the goal of becoming sustainable. This study utilized the Survey Questionnaire
method for collecting the data needed. Such method is an appropriate one utilized in such quantitative
studies (Cooper & Schindler, 2004, p. 161.) The results of this study will provide solid evidence that the
organizational utilization of Green IT tools and technologies will certainly assist the organization in
becoming sustainable. Further, the results of this study also provided a classification of the “greening
capability” of each of these Green IT tools and technologies that are considered in this study. Please refer
to Appendix B for a complete listing of the questionnaire used in this study.
Analysis Means and Methods
Survey questionnaire was analyzed by using the following scale:
Answer Option Weight
Strongly Agree 4
Agree 3
Neutral 2

338
Disagree 1
Strongly Disagree 0
Table 10: Survey Questions Scale
Upon the collection of participants’ responses, the mean and standard deviation were calculated for
each question. Based on these calculations, the following categorization was used to determine the
average weight for each question:
Low if average weight is less than 2.0
Medium if average weight is between 2.0. – 3.0
High if average weight is above 3.0
Table 11: Questions weights based on the scale provided in Table 3
The survey questionnaire that was utilized in this study was developed online using the services of the
Google Forms®. Participants in this study were informed of the straightforward nature of the survey as well
as the purpose of the research. Participants were informed that participation in the study was strictly
confidential and voluntary. Participants were informed that they were not required to reveal their identity
in any shape or form. The privacy and safety of all participants in the survey was safeguarded.
Sample
Arbitrary collection of participants from a population that has an equal chance of participating was
utilized in this study. The target number of participants in the survey was 300 active organizational leaders
and executives who work for large US based for-profit organizations. This number of participants is
consistent with previous similar studies. Such method of data collection is an effective one since it would
be easier to collect the data where it would be stored in a central repository where access to such data is
protected and efficient. The data collected for this study was then directly imported into Microsoft Excel
2010®. The direct import of data from a database eliminates the chances of errors if data was to be recorded
manually from paper-based surveys.
VALIDITY AND RELIABILITY
To ensure the validity and reliability of the research instrument utilized for this research effort, a pre-
test pilot was conducted which included 30 participating large Jordanian companies. These companies were
selected to participate in this study due to their large IT operations. Limiting the participants to for-profit
organizations was to aid in the validity of the study since non-for-profit organizations might not be
concerned with being competitive (Ness, 2005) which is mandatory for this study.
BIAS
Mowshowitz (1981) indicates that avoiding bias and attaining impartiality in computing associated
research is virtually impossible since such research is frequently founded on questions correlated with
policies related to the implementation and application of technology. Mowshowitz further proclaims that
in an effort to lessen the chances for bias, a researcher should circumvent taking too many positions or own
viewpoints. Consequently, no position, as to whether IT has a positive or negative relationship with
organizational sustainability, is taken in this study. This is in an effort to diminish or remove any chances
of bias in the findings and conclusion of this study. Moreover, the researcher has adopted the utilization of
quantitative methods for the examination and analysis of the data collected. An online survey questionnaire
has been selected as the mechanism for data collection. Such instrument has the predisposition to
significantly decrease the probabilities for bias since there is no direct interaction between the researcher
and the participants (Neuman, 2000). The data collected for this study was instantly stored in a protected
database. The online survey was available for a period of one month after which it was taken offline and
data collected was then exported to an Excel spreadsheet which was then examined and analyzed. Lastly,
the findings and conclusions of this research effort is open for discussion and examination amid those who
are concerned in both the academic and the business fields.

339
ETHICAL CONSIDERATIONS
Participants were invited to partake in this research effort using invitations that were sent to them via
electronic mail (email). Please refer to Appendix D for the actual invitation that was sent to these
participants. It was made clear to these participants the researcher’s name, the purpose of the study, why
and how they have been nominated to participate, and the anticipated length of their participation. The
invitations also enclosed details related to such essential issues as the confidentiality and privacy of each
participant. Participants were made cognizant that their contribution to this research effort was strictly
voluntary and that they can withdrawal from completing the survey at any time. Lastly, participants were
given instructions on how to acquire the research results and findings if they wish to do so.
FINDINGS AND DISCUSSION
Invitations to participate in this study were emailed to 300 representatives of large for-profit US
organizations. The number of participants was 37 out of the 300 representatives which translate into a
12.66% response rate. The survey questionnaire utilized for this study was divided into three sections as
follows:
1. The first section included Questions 1 through 7. These questions were designed to gauge
organizational commitment to and their perception of sustainability.
2. The second section included Questions 8 through 13. These questions were designed to
discover the organizational benefits and goals for adopting and implementing sustainability
initiatives.
3. The third section included Questions 14 through 22. These questions were designed to
discover the extent of organizational utilization of a selected set of what is considered “greening”
IT tools and technologies. These tools and technologies included:
a. Collaboration tools
b. Cloud Computing for power management
c. Automation of workstation shutdown when not in use
d. Workflow technologies
e. Virtual Networking
f. Cloud Computing for resource optimization
g. Virtual Private Networks (VPN)
h. Electronic Mail (Email)
i. Video Conferencing
Since the goal of this study is to examine the organizational utilization of these “greening” IT tools
and technologies as enablers of organizational sustainability, the discussion and findings of this study will
focus on the set of questions (14 through 22) that directly assist in meeting this goal.

340
Figure 41: Average response rate for each of “greening” IT tools and technologies.
In the following section, a detailed discussion of the findings for each of the survey questions
(questions 14 through 22) that relate the utilization of “greening” IT tools and technologies will be
presented.
My organizations utilizes collaboration tools available in Web 2.0 such as tagging, RSS, and Wikis in
order to facilitate more efficient communication and distribution of information
The total number of respondents was 37 out of which 28 respondents indicated that they agree and 9
respondents indicated that they strongly agree that their organizations do indeed utilize collaboration tools
and technologies in order to facilitate more efficient communication and distribution of information. The
average response rate was 3.22 which indicates a high degree of agreement by respondents as to the
utilization of such collaboration tools and technologies towards achieving efficient organizational
communications channels.
My organization is utilizing Cloud Computing technologies and techniques in an effort to achieve
more resourceful utilization of IT resources and operations
The total number of respondents was 37 out of which 23 respondents indicated that they agree and 10
respondents indicated that they strongly agree that their organizations do indeed utilize Cloud Computing
technologies and techniques in an effort to achieve more resourceful utilization of IT resources and
operations. A total number of 4 respondents indicated that they do not know if their organizations utilize
Cloud Computing technologies and techniques in an effort to achieve more resourceful utilization of IT
resources and operations. The average response rate was 3.03 which indicates a high degree of agreement
by respondents as to the utilization of Cloud Computing technologies and techniques in an effort to achieve
more resourceful utilization of IT resources and operations.
My organization utilizes IT tools and techniques in order to automate the power management of
personal computers
The total number of respondents was 37 out of which 28 respondents indicated that they agree and 9
respondents indicated that they strongly agree that their organizations do indeed utilize IT tools and
techniques in order to automate the power management of personal computers. The average response rate
was 3.25 which indicates a high degree of agreement by respondents as to the utilization of IT tools and
techniques in order to automate the power management of personal computers.

341
My organization utilizes workflow technologies in order to reduce the amount of printing
The total number of respondents was 37 out of which 23 respondents indicated that they agree and 9
respondents indicated that they strongly agree that their organizations do indeed utilize workflow
technologies in order to reduce the amount of printing. Four respondents indicated that they do not know
and 1 respondent indicated that they disagree that their organizations utilize workflow technologies in order
to reduce the amount of printing. The average response rate was 3.09 which indicates a high degree of
agreement by respondents as to the utilization of workflow technologies in order to reduce the amount of
printing.
My organization utilizes virtual network servers in order to decrease the dependence on physical
hardware
The total number of respondents was 36 out of which 25 respondents indicated that they agree and 10
respondents indicated that they strongly agree that their organizations do indeed utilize virtual network
servers in order to decrease the dependence on physical hardware. One respondent indicated that they do
not know. The average response rate was 3.14 which indicates a high degree of agreement by respondents
as to the utilization of virtual network servers in order to decrease the dependence on physical hardware.
My organization utilizes Cloud Computing technologies to optimize resources
The total number of respondents was 36 out of which 22 respondents indicated that they agree and 11
respondents indicated that they strongly agree that their organizations do indeed utilize Cloud Computing
technologies to optimize resources. Four respondents indicated that they do not agree. The average response
rate was 3.03 which indicates a high degree of agreement by respondents as to the utilization of Cloud
Computing technologies to optimize resources.
My organization utilizes Virtual Private Networks (VPN) to allow employees to work from home
The total number of respondents was 37 out of which 23 respondents indicated that they agree and 8
respondents indicated that they strongly agree that their organizations do indeed utilize Virtual Private
Networks (VPN) to allow employees to work from home. One respondent indicated that they do not know
while 5 respondents indicated that they disagree. The average response rate was 2.91 which indicates a
medium degree of agreement by respondents as to the utilization of Virtual Private Networks (VPN)
by their organizations to allow employees to work from home
My organization utilizes email extensively in order to eliminate paper-based communication
The total number of respondents was 37 out of which 21 respondents indicated that they agree and 16
respondents indicated that they strongly agree that their organizations do indeed utilize email extensively
in order to eliminate paper-based communication. The average response rate was 3.44 which indicates a
high degree of agreement by respondents as to the extensive utilization of email in order to eliminate paper-
based communication.
My organization utilizes Video Conferencing and Internet based techniques such as Webinars to
communicate with remote employees and business partners
The total number of respondents was 37 out of which 23 respondents indicated that they agree and 13
respondents indicated that they strongly agree that their organizations do indeed utilize Video Conferencing
and Internet based techniques such as Webinars to communicate with remote employees and business
partners. One respondent indicated not knowing. The average response rate was 3.31 which indicates a high
degree of agreement by respondents as to the utilization of Video Conferencing and Internet based
techniques such as Webinars to communicate with remote employees and business partners.
CONCLUSION, RECOMMENDATIONS, AND FUTURE RESEARCH
The business and IT literature includes many studies and research efforts that are geared towards
assisting organizations in achieving their sustainability initiatives. In this context, an organization that is
seeking to achieve its sustainability goals and initiatives must take into consideration the powerful role of
Information Technology (IT) in assisting these organizations in accomplishing such goals and initiative.
This study has provided solid evidence that IT and its related tools and technologies are in fact assisting
organizations in realizing their sustainability goals and initiatives.

342
Average Response Rate
Average Weight (Based on Table 3)
Email 3.44 High
Video Conferencing 3.31 High
Automation of PCs Shutdown 3.25 High
Collaboration Tools 3.22 High
Virtual Networking 3.14 High
Workflow Technologies 3.09 High
Cloud Computing for Power Management 3.03 High
Cloud Computing for Resource optimization 3.03 High
Virtual Private Networking (VPN) 2.91 Medium
Table 12: Classification of each IT Greening IT tools and technologies based on the Average
Response Rate
This study took into consideration certain “greening” IT tools and technologies that are considered as
enablers of organizational sustainability. These tools and technologies included: Collaboration tools, Cloud
Computing, automation of workstation shutdown, Workflow technologies, Virtual Networking, Virtual
Private Networks (VPN), Electronic Mail (Email), and Video Conferencing. Based on the average
participants’ response rate, each of these technologies had a high rate of agreement among survey
participant except for VPN which had a medium rate of agreement. The top two highest scoring among
these tools and technologies were Email and Video conferencing.
The utilization of email by organizations as the means of communicating has been considered a major
factor in helping organizations achieve their sustainability initiatives. According to the United Nation’s
Food and Agriculture Organization (FAO), the paper industry consumes 11% of the wood harvested from
forests around the World. According to Alcatel-Lucent (2011) the utilization of email is helping
organizations in significantly decreasing carbon emissions through the replacement of paper documents
used for billing and payment by electronic bill payment methods.
The global nature of the business landscape today has made mandatory upon organizations to utilize
different tools and technologies that will achieve optimum communications between the globally dispersed
parts of the organization. Video Conferencing technologies will certainly enable the organization to
accomplish efficient internal communication. Not only that, but also assist the organization in realizing its
sustainability initiatives since such technologies drastically cut down the reliance on traditional means of
transportation which are known to contribute significant amounts of pollutants. According to Nash (2011),
an assessed value of $5.8 million dollars was saved by CIO Magazine on its related business travel by using
Video Teleconference (VTC). Nash further indicates that the utilization of VTC has contributed to a
decrease of 7,500 metric tons of CO2 emissions in just air travel for CIO Magazine during the year 2010.
According to Alcatel-Lucent (2011) ICT technologies such as teleconferencing and videoconferencing have
considerably reduced business travel which has in turn decreased Greenhouse Gases (GHGs) significantly.
Cloud Computing, even though it was not among the highest scoring “greening” IT tools and
technologies based on the findings of this study, it has the potential to be a powerful factor in enabling
organization in realizing their sustainability goals. According to Microsoft “Green Computing” report
(2008), “Cloud computing provides the next big thing in computing — some interesting architectural
constructs, some great potential from a monetary aspect, and a very real option to provide a more
environmentally friendly computing platform. ” (p. 11) Therefore, it is the recommendation of this study
that organization should investigate and consider the potential positive impact that Cloud Computing has
on organizational sustainability. Future research efforts should take into consideration further investigation
such potential. Future research efforts should also focus on attempting to quantitatively assess the positive
impact that each of the “greening” IT tools and technologies on organizational sustainability. Other
“greening” IT tools and technologies should also be taken into consideration is such research efforts.
343
REFERENCES
- Benn, S., Dunphy, D., & Griffiths, A. (2014). Organizational Change for Corporate
Sustainability. Routledge,
- ISBN: 978-0-415-69548-0.
- Baskin, D. (2014), Sustainability goals and reporting, Financial Executive Research Foundation
- Van Marrewijk, M., & Werre, M. (2003). Multiple levels of corporate sustainability. Journal of
Business Ethics,
- 44(2-3), p. 107-119.
- Ekins, P. Economic Growth and Environmental Sustainability: The Prospects for Green Growth;
Routledge:
- London, UK, 2000.
- Scientific American. Wal-Mart Requires Suppliers to Reveal Environmental Impacts. Scientific
American, 16
o July 2009. Available online: http://www.scientificamerican.com/article.cfm?id= walmart-
environmental-impacts-labels (accessed on 21 May 2013).
- S. Murugesan, (2008), Harnessing green IT: Principles and practices, IT Professional, Vol. 10,
No. 1
- Brooks, S., Wang, X., & Sarker, S. (2010). Unpacking green IT: A review of the existing
literature.
- Proceedings of the Americas Conference on Information Systems 2010, Lima, Peru.
- Molla, A., Cooper, V., Corbitt, B., Deng, H., Peszynski, K., Pittayachawan, S., & Teoh, S.
(2008). E-readiness
o to greadiness: Developing a green information technology readiness framework.
Proceedings o f the 19"1 Australasian Conference on Information Systems, Christchurch,
New Zealand.
- Leong, J. (2009) Confronting A Disruptive Technology, retrieved on 2/1/2015 from
o http://mailingsystemstechnology.com/ME2/dirmod.asp?sid=E8941DB3E6A4499196334
DC6734E5945&nm=Contact+Us&type=Publishing&mod=Publications::Article&mid=8
F3A7027421841978F18BE895F87F791&tier=4&id=5038C9B68FAA4F2F89631A3AF
C8D6670
- Charlton, G. (2014), Email remains the best digital channel for ROI, retrieved on 2/1/2015 from
- https://econsultancy.com/blog/64614-email-remains-the-best-digital-channel-for-roi/
- Nash, D. (2011), Green IT And Sustainability: Leading By Example To Conserve Natural
Resources, CIO
- Magazine
- Alctel-Lucent Technologies (2011), Information and Communication Technologies: Enablers of a
low-carbon
- economy, Strategic White Paper, AlcaTel-Lucent
- Oster, M. (2011), Cloud computing: What you need to know before making the change,
ForwardThinking,
- Issue no. 18, Grant Thornton LLP
- Mell, P. Grance, T.(2011), The NIST Definition of Cloud Computing: Recommendations of the
National
- Institute of Standards and Technology, NIST Special Publication 800-145
- .

344
New business model for pharmaceutical companies to
enhance competitiveness and create social value "
Glaxo Smith Kline (GSK) MODEL "
Dr: Fellague Mohamed Dr: Meddah Araibi Elhadj Dr: Kherchi Ishak
University of Hassiba
Benbouali
University of Hassiba
Benbouali
University of Hassiba
Benbouali
Algeria Algeria Algeria
Abstract:
This paper aims to provide shared value as a new business model for pharmaceutical companies to
create social value and enhance company competitiveness. Based on the dedicative approach we analysed
Glaxo Smith Kline programs that created shared value, we provide new way of doing business for
pharmaceutical companies.
Key words: Shared value, Social value, Business value, business model, companies’ competitiveness,
Glaxo smith Kline.
Introduction:
An increasing number of companies are turning their attention to the vast health needs of our global
population, and finding business opportunities in saving and extending lives. Pharmaceutical and medical
device companies are now seizing opportunities to create shared value, they are beginning to realize that,
in many cases, meeting some needs of the underserved in low- and middle-income countries may prove an
important source of future growth and profitability.
Business are not profit from causing a social problems, business profit from solving a social
problems, and this is a fundamental opportunity for business today to impact and address this social
problems. Companies can create social value and economic value simultaneously, this new business model
" shared value " is a new way to boost companies competitiveness.
The fundamental problem of this study is related to the way Glaxo smiths Kline (GSK) creates
social value and enhances competitiveness, so the question is:
How Glaxo smiths Kline create social value and enhance competitiveness simultaneously!
What shared value means? How can we create shared value? Is this the new business model for
Pharmaceutical companies? How can shared value enhance the competitiveness of a company?
This study aims to provide the concept of shared value as a new business model where we can solve
social problems and in the same time make profit for company. We also provide the GSK model for
addressing social problems.
1. Shared value definitions:
Shared value can be defined as policies and operating practices that enhance the competitiveness
of a company while simultaneously advancing the economic and social conditions in the communities in
which it operates (Porter .M.E & Kramer.M.2011,p66).

345
Shared value creation is a way of re-connecting a company with the society it is embedded in
through identifying and expanding the connections between societal and economic progress, This means
recognizing societal needs not exclusively as a burden on the business that only brings higher costs, but as
a way to improve business performance while creating added value for the society as well (Lapiņa.I,
Borkus.I, Stariņeca.O. 2012,p1606).
Shared value is a way of doing business that considers the society and environment not just as
external settings that a company is operating in, but as an integral part of the business. Thinking of how to
improve society’s wellbeing becomes a step in thinking of how to achieve better business
results(Lapiņa.I, Borkus.I, Stariņeca.O. 2012,p1607).
Creating economic value by creating societal value as one of the most powerful driving forces of
productivity, innovation and growth and as the only possibility to recover lost legitimacy from society
(Schmitt.J. 2014, p22).
"Creating shared value company" no longer thinks of profitability only, but rather focuses on
achieving sustainable competitiveness through simultaneously delivering positive impact on society and
environment. The activities should thus be based on long term investment in the company competiveness
and social/environmental objectives (Stephenson. C. 2008, p772)
Creating shared value in health is about competing to meet unmet health needs in low-resource
populations across all countries and regions of the world ( Peterson.K, Pfitzer.M, Mazzuri.S, Wendel.C,
Hooson.C. 2014, p4).
2. Creating shared value and other terms:
2.1. shared value and corporate social responsibility:
Businesses create shared value when they can make a profit, create economic value while
simultaneously meeting important social needs or important social goals like improving environmental
performance, reducing problems of health, improving nutrition, reducing disability, improving safety, and
helping people save for retirement (Driver.M. (2012, p423).
Corporate social responsibility is fundamentally about taking resources from the business, and
investing those resources in being a good corporate citizen: recycling, giving money to social causes,
reporting on social and environmental impacts, and engaging employees in community works.
Shared Value is aimed at changing how the core business operates strategy, structure, people,
processes and rewards in order to deliver triple bottom line returns (Moore.C . 2014,p4).
The fundamental distinction is that CSR is about doing something separate from the business and
CSV is about integrating social and environmental impact into the business, using that integration to drive
economic value.
2.2. Shared value and social innovation:
Social innovation is a new ways to reach aims, in particular new organizational forms, new
regulations, new lifestyles, which alter the direction of social change and which solve problems better than
former practices. They should be worth being imitated and institutionalized (Schmitt.J. 2014,p4 ).
Social innovation is new ideas that work in meeting social goals. Innovative activities and services
that are motivated by the goal of meeting a social need and that are predominantly developed and diffused
through organizations whose primary purposes are social (Mulgan G 2006,p145).
The basic idea of shared value is that there are many opportunities in meeting these societal
needs to actually create economic value in the process. Shared value is where you do both.
3. How pharmaceutical companies created shared value:
3.1. How shared value is created in general:
346
Companies can create economic value by creating societal value. There are three distinct ways to
do this: by reconceiving products and markets, redefining productivity in the value chain and building
supportive industry clusters at the company’s locations. Each of these is part of the virtuous circle of shared
value; improving value in one area gives rise to opportunities in the others.
3.1.1. Reconceiving Products and Markets:
Reconceiving products and markets means on the one hand rethinking a company’s products with
regard to society’s needs and the benefit or harm which is inherent to them. This might include better
nutrition or banking systems adapted to the needs of analphabets in rural sites of developing countries
(Porter .M.E & Kramer.M,op,cit,p65).
Meeting needs in underserved markets often requires redesigned products or different distribution
methods. These requirements can trigger fundamental innovations that also have application in traditional
markets (Porter .M.E & Kramer.M, op, cit, p8).
3.1.2. Redefining Productivity in the Value Chain:
Redefining Productivity in the Value Chain is the second pillar of the shared value concept. A
company’s value chain offers many opportunities to create shared value by enhancing value chain
productivity or by finding new ways of collaboration with partnering companies new ways of collaboration
shall be applied, like increasing their access to inputs, sharing technology, or providing financing. Also, the
downward side of the value chain has to be considered. The discovery of new distribution channels that
have less environmental impact is presented as one example (Schmitt.J ,214.p23).
3.1.3. Enabling Local Cluster Development
No company is self-contained; the success of every company is affected by the supporting
companies and infrastructure around it. Productivity and innovation are strongly influenced by “clusters,”
or geographic concentrations of firms, related businesses, suppliers, service providers and logistical
infrastructure in a particular field.
Clusters are prominent in all successful and growing regional economies and play a crucial role in
driving productivity, innovation, and competitiveness (Porter .M.E & Kramer.M,op,cit, p9).
When a firm builds clusters in its key locations, it also amplifies the connection between its success
and its communities’ success (Porter et al.,2011 p9).
3.2. How Pharmaceutical companies created shared value:
Two factors are necessary to create shared value. First, companies need to reorient themselves to
systematically and relentlessly uncover new, unmet needs, and find new and better ways to address them,
second, to achieve meaningful impact and attractive economic returns, firms need to do so at scale (Porter
.M.E . 2014,p 8).
Face a double burden of infectious diseases and non-communicable diseases (NCDs), such as
cardiovascular disease, diabetes, and cancer. Meeting these needs is challenging, even for
sophisticated corporations (Porter .M.E . 2014,p 3).
Missing skills and knowledge, limited market information, ineffective regulation, inadequate health
systems, and limited funding or inability of patients to pay present firms with huge barriers to entry. To
overcome these barriers, companies are investing in three levels of shared value (see Table 1).
Table 1: Levels of Shared Value Creation for Pharmaceutical Companies

347
Reconceiving Products and
Markets
Redefining Productivity
in the Value Chain
Enabling Local Cluster
Development
R&D for drugs, vaccines,
and devices that fill unmet
health needs
• Adaptation of existing
products to
reduce complexity and cost
• Tailored product
offerings to meet
local market conditions
Collaborative and homegrown
R&D
to reduce cost and risk
• Efficient, local supply chains
and manufacturing to reduce
production costs
• Locally-adapted sales and
distribution to penetrate new
markets and better meet patient
needs
Behavior-change campaigns to
increase the sophistication of
demand for health care
• Health system strengthening
to enable delivery of needed
products
and services.
• Advocacy and capacity
building to strengthen policy and
the regulatory environment
Source: Porter .M.E, Competing by Saving Lives: How Pharmaceutical and Medical Device Companies Create Shared Value in Global Health, FSG.USA, 2014, p4.
Efforts to create shared value across the three levels are mutually reinforcing, Productive and
lower-cost value chains are essential to introducing redesigned product portfolios to underserved
markets (Porter .M.E . 2014,p 4).
Strong clusters can enable firms to serve population segments that were previously out of reach,
and can open up new, lower-cost manufacturing and distribution options. Leading firms are beginning to
design multi-level approaches to harness this multiplier effect, though the right combination will be unique
to a particular company and market (Porter .M.E . 2015).
Efforts to create shared value across the three levels are also mutually reinforcing (see shape 1).
Productive and lower-cost value chains are essential to connecting redesigned product portfolios to
underserved markets (Porter .M.E . 2014,p 33). . Strong clusters can enable firms to serve population segments that were previously out of reach, and
can open up new, lower-cost manufacturing and distribution options (Porter .M.E . 2014a,p 30).
Shape 1: Efforts to create shared value are mutually reinforcing
Porter .M.E (2014): Competing by Saving Lives: How Pharmaceutical and Medical Device Companies
Create Shared Value in Global Health, FSG, and p16.
4. Shared value between social value and business value:
The most advanced companies have begun to look at social engagement through a different lens
entirely. Rather than seeing business and society in opposition, they recognize the enormous potential of
business to contribute to social progress. At the same time, they understand that firms depend on healthy
and well-functioning societies to thrive (Bockstette.V& Stamp.M. 2011,p4).
Such companies seek to create “shared value” incorporating social issues into their core business
strategies to benefit both society and their own long-term competitiveness (see shape 2 below).
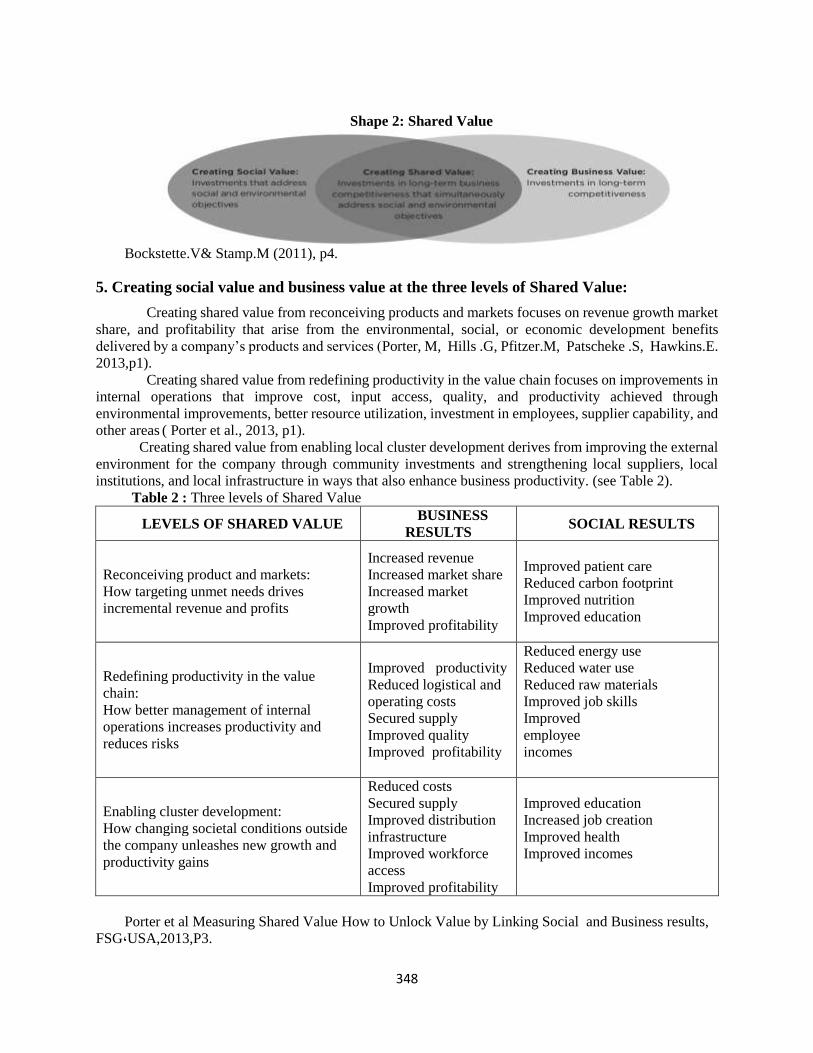
348
Shape 2: Shared Value
Bockstette.V& Stamp.M (2011), p4.
5. Creating social value and business value at the three levels of Shared Value:
Creating shared value from reconceiving products and markets focuses on revenue growth market
share, and profitability that arise from the environmental, social, or economic development benefits
delivered by a company’s products and services (Porter, M, Hills .G, Pfitzer.M, Patscheke .S, Hawkins.E.
2013,p1).
Creating shared value from redefining productivity in the value chain focuses on improvements in
internal operations that improve cost, input access, quality, and productivity achieved through
environmental improvements, better resource utilization, investment in employees, supplier capability, and
other areas ( Porter et al., 2013, p1).
Creating shared value from enabling local cluster development derives from improving the external
environment for the company through community investments and strengthening local suppliers, local
institutions, and local infrastructure in ways that also enhance business productivity. (see Table 2).
Table 2 : Three levels of Shared Value
LEVELS OF SHARED VALUE BUSINESS
RESULTS SOCIAL RESULTS
Reconceiving product and markets:
How targeting unmet needs drives
incremental revenue and profits
Increased revenue
Increased market share
Increased market
growth
Improved profitability
Improved patient care
Reduced carbon footprint
Improved nutrition
Improved education
Redefining productivity in the value
chain:
How better management of internal
operations increases productivity and
reduces risks
Improved productivity
Reduced logistical and
operating costs
Secured supply
Improved quality
Improved profitability
Reduced energy use
Reduced water use
Reduced raw materials
Improved job skills
Improved
employee
incomes
Enabling cluster development:
How changing societal conditions outside
the company unleashes new growth and
productivity gains
Reduced costs
Secured supply
Improved distribution
infrastructure
Improved workforce
access
Improved profitability
Improved education
Increased job creation
Improved health
Improved incomes
Porter et al Measuring Shared Value How to Unlock Value by Linking Social and Business results,
FSG،USA,2013,P3.

349
6. The Shared Value Measurement Process:
There are four steps to measure shared value: (Porter et al., 2013, p2)
Step 1: Identify the social issues to target:
The starting point for shared value is identifying and prioritizing specific social issues that
represent opportunities to increase revenue or reduce costs. This requires a systematic screening of unmet
social needs and gaps and an analysis of how they overlap with the business across the three levels of shared
value. The result of this step is a list of prioritized social issues that a shared value strategy can target.
Step 2: Make the business case:
After identifying potential social impact at one or more of the three levels, the next step is to
develop a solid business case based on research and analysis of how social improvement will directly
improve business performance.
This step includes identifying the targets and specifying the activities and costs involved for each
shared value opportunity, modeling the potential business and social results relative to the costs (i.e., value
creation potential), and making a go/no-go decision.
Step 3: Track progress: Using the business case as a roadmap, companies then track progress against the desired targets,
as with any performance improvement process. This step includes tracking inputs and business activities,
outputs, and financial performance (revenues and costs) relative to projections.
Step 4: Measure results and use insights to unlock new value: The final step focuses on validating the anticipated link between social and business results and
determining whether the outlay of corporate resources and efforts produced a good joint return.
7.Who is GlaxoSmithKline?
GlaxoSmithKline (GSK) is a British multinational pharmaceutical, biologics, vaccines and
consumer healthcare company headquartered in London, United Kingdom. It is the world's fourth-largest
pharmaceutical company measured by 2009 prescription drug sales (after Pfizer, Novartis, and Sanofi)
(FACTBOX,p2015) . It was established in 2000 by the merger of Glaxo Wellcome plc (formed from the
acquisition of Wellcome plc by Glaxo plc) and SmithKline Beecham plc (formed from the merger of
Beecham plc and SmithKline Beckman Corporation, which was formed by combining the Smith Kline
French and Beckman companies).
GSK has a portfolio of products for major disease areas including asthma, cancer, virus control
infections, mental health, diabetes and digestive conditions. It also has a large consumer healthcare division
that produces and markets oral healthcare and nutritional products, drinks and over the counter medicines,
including Sensodyne, Boost, Horlicks,Lucozade and Ribena (GSK Corporation,2015)
8.GlaxoSmithKline approaches enhance competitiveness and create social value:
GlaxoSmithKline designed multi-pronged approaches to provide holistic solutions to social and
business problems, GlaxoSmithKline applied all three approaches to creating shared value (table3, 4,
5).

350
Table 3. Reconceiving Products and Markets
Area of Activity
Approaches
Company
Tailored product
offerings to meet
local
market conditions
Product portfolio
selection
Tiered pricing
Adapted packaging
to reduce unit cost
or
improve safety
GSK set prices for its patented products in the least
developed
countries at a maximum of 25 percent of the price in the
U.K.
or France.
GSK repackaged its Ventolin asthma medication from a
200-dose pre-filled inhaler at $5 each to packs of two to
three
doses retailing for just a few cents.
Porter .M.E (2014): Competing by Saving Lives: How Pharmaceutical and Medical Device
Companies,Create Shared Value in Global Health,FSG,p22.
GSK efforts to reconceived products and markets are perhaps the most advanced across the three
levels of shared value, GSK have adopted tiered or discounted pricing for poor consumers, and redeveloping
existing product lines to meet the needs of these new markets.
Table 4. Redefining Productivity in the Value Chain
Area of Activity
Approaches
Company
Collaborative and
homegrown R&D to
reduce cost and risk
Investment in new or
existing local research
institutions
Collaborative
approaches to reduce
cost and share
development risk
GSK created a new, jointly-owned
company, ViiV
Healthcare, that combines
compounds owned by both firms
to
create a viable pipeline for new
HIV medicines
Locally-adapted sales
and distribution to
penetrate new markets
and better meet patient
needs
Sales force
reconfiguration
New distribution
approaches
GSK is working with its
distributors to share the risk of
switching
to a higher volume model to
ensure that price reductions
are passed on to patients
Porter .M.E (2014): Competing by Saving Lives: How Pharmaceutical and Medical Device
Companies, Create Shared Value in Global Health,FSG,p23
Gsk learn how to deliver reconceived products to new markets, investments to boost value chain
productivity will become more common, Innovative partnerships are emerging to share the risks and reduce
the costs of R&D, such as ViiV Healthcare (Porter .M.E . 2014,p 22).
Table 5. Enabling Local Cluster Development
Area of Activity
Approaches
Company

351
Behavior-change campaigns to
increase the sophistication of
demand for pharmaceuticals
products
Social marketing to increase
health seeking behavior by
patients, Patient education
about disease management
partnership with Population
Services International in all over
the world.
Porter .M.E (2014): Competing by
Saving Lives: How
Pharmaceutical and Medical
Device Companies, Create Shared
Value in Global Health,FSG,p4
Porter .M.E (2014): Competing by Saving Lives: How Pharmaceutical and Medical Device
Companies, Create Shared Value in Global Health, FSG, and p24.
GSK invest in health care clusters within low- and middle-income countries to improve patient
awareness and demand, health systems, and the policy and regulatory environment, it not only bolster their
own ability to reach new markets, but it also provide value to society that goes beyond the immediate benefit
of their medicines (Porter .M.E . 2014,p 23).
9. GSK efforts and programs to create social value:
In order to create social and economic value GlaxoSmithKline has developed a set of programs,
these programs aims to enhance our understanding of how GlaxoSmithKline as a business create value.
9.1. The health for all programs:
GSK has made such an efforts to provide health for all: (GSK Annual report, 2014a, p6)
9.1. 1. Open innovation
GSK Adapt the open innovation R&D model, currently used for Diseases of the
Developing World, to apply to other areas of great unmet medical need and scientific challenge,
including infectious disease and Alzheimer’s disease, by 2015.
Created the world’s first Open Lab for non-communicable diseases in Africa.
Working with other pharmaceutical companies and academics to conduct a major study in
dementia research, Continued working with the IMI’s New Drugs 4 Bad Bugs collaboration related to
antibiotic research.
9.1. 2. Developing vaccines that don’t need to be kept cold:
Invest in the development of vaccines that don’t require continuous refrigeration, making
distribution easier and less expensive.
Invested US$1.8 million in research to enable a critical liquid component used in our
malaria vaccine candidate to remain stable in hotter climates, working with the Bill and Melinda Gates
Foundation.
9.1. 3.Better access to medicines and vaccines:
Extended our tiered pricing approach to prescription medicines as well as vaccines, asking
countries to pay based on their wealth and ability to pay; committed to freeze vaccine prices for Gavi
graduating countries for ten years.

352
9.1. 4.Building products to better meet needs:
Worked with partners to develop an inhaled form of oxytocin, which can prevent women
dying from pregnancy-related causes, and to reformulate an antiseptic used in mouthwash to reduce
newborn deaths.
9.1. 5.Reducing child Mortality:
Continued our partnership with Save the Children which aims to reach one million
children, matched employee fundraising of £1 million, launched second Health Innovation Award,
obtained EMA agreement of pathway for chlorhexidine gel, and established Emergency Response work
stream.
9.1. 6.Strengthening healthcare infrastructure:
Continue to work with partners to support the development and strengthening of healthcare
infrastructure. We anticipate this could improve access to healthcare for 20 million underserved people
by 2020 (vs. 2012).
Re-invested £6 million profits in Least Developed Countries to strengthen healthcare
systems and partnered with the World Health Organization (WHO), the International
Telecommunication Union, Vodafone, Barclays and others to pilot innovative healthcare delivery
systems.
9.1. 7.Eliminating and controlling neglected tropical diseases:
Donated a further 858 million albendazole tablets to help eliminate LF and control intestinal worms;
made progress towards identifying a preclinical candidate to combat the leishmaniasis parasite through our
collaboration with the University of Dundee and Wellcome Trust.
9.1. 8.Fighting malaria:
Build on our 30-year commitment to contribute to the fight against malaria through
continued R&D investment and partnerships on the ground.
Filed the world’s first malaria vaccine candidate, RTS,S for regulatory approval; started
phase III trials for tafenoquine to treat P. vivax malaria.
9.2. Responsible behavior programs:
GSK has made such an efforts to embedding ethical behavior across the business through: (GSK
Annual report, 2014a, p7)
9.2.1. Transparency in clinical trial data
Led the development of www.clinicalstudydatarequest.com where researchers can now
request access to anonymised patient level data from over 1,000 clinical trials
by GSK and other companies.
9.2.2. Minimizing animal Testing

353
Launched a strategic initiative that has the potential to reduce our reliance on animal
studies; continued looking for new ways to develop medicines using human cells and tissues together
with the European Bioinformatics Institute and the Sanger Institute.
9.2.3. Promoting Human Rights
Increased focus on the human rights impacts identified by an external assessment of our
business, for example through our global Third Party Oversight program.
9.2.4. Engaging with patient advocacy groups and political stakeholders
Demonstrate that all GSK interactions with patient advocacy groups and political
stakeholders are conducted appropriately, ethically and transparently.
Enhanced Global Standard Operating Procedures on public policy group and government
official engagement; first full year of implementation of an Emerging Markets and Australasia patient
advocacy strategy to broaden and deepen interactions with patient groups, whilst embedding the highest
levels of transparency and governance.
9.3. Supporting people programs:
GSK has made such efforts and gave employees the opportunity to use their expertise to support
non-profit organizations addressing major global health challenges, while building their own skills and
experience through: (GSK Annual report, 2014a, p8)
9.3.1. Protecting the health and well-being of our people:
Continue to create a working environment that inspires people to grow and perform in a
healthy and resilient way.
Provided preventive healthcare for over 14,000 employees and their families in 15
countries; over 5,200 of employees have participated in programs to improve personal resilience; injury
and illness rate down 4% from 2013.
9.3.2. Promoting inclusion and diversity:
Increased proportion of women in management from 41% to 42%; developing global
standards to measure businesses’ disability performance.
9.3.3. Community volunteering to create change:
98 employees volunteered with 39 non-profit organizations through our PULSE program;
established a Volunteer Ambassador Network in 30 countries to develop locally relevant programs.
9.4. Protect the planet programs:
GSK committed to reduce the environmental impacts of operations products, GSK has made such
an efforts to protect the planet: (GSK Annual report, 2014a, p9)
9.4.1. Aiming to be carbon neutral:
Reduce our overall carbon footprint by 25% by 2020 (vs. 2010) and have a carbon neutral
value chain by 2050.

354
Cut Scope 1 and 2 emissions from our operations by 11% since 2013 and 19% since 2010;
Scope 3 emissions up by 2%, this remains a challenge as the sales
of our propellant based inhalers continue to grow.
9.4.2. Reducing our water impact:
By 2020, reduce our water impact across the value chain by 20% (vs. 2010).
Cut operational water use by 5% in 2013 and 20% since 2010 – hitting our 2015 target a
year early; completed a four-year assessment to measure water impact across the value chain; recertified
to Carbon Trust’s Water Standard.
9.4.3. Reducing our waste:
By 2020, reduce our operational waste by 50% (vs. 2010).
We generated 159,000 tons of waste from our operations, 4% less than in 2013 and 11%
less than 2010. Sent 6% of waste to landfill compared to 10% in 2010. 48 sites achieved zero waste to
landfill.
9.4.4. Building sustainability in our supply chain:
We remain committed to building a sustainable supply chain for our
Nutrition portfolio Changes to market dynamics within the portfolio are impacting our sourcing model
so we are currently reviewing this commitment.
10. GSK programs enhanced company competitiveness:
GSK efforts and programs to create social value yield a value for the company, business value and
financial value:
10.1. GSK programs create value to enhance company competitiveness:
GSK efforts and programs create value for the company: (GSK Annual report, 2014b, p8)
Gsk have a significant global commercial presence in more than 150 markets, a network
of 84 manufacturing sites in 36 countries and large R&D centers in the UK, USA, Belgium and China.
Since 2008 GSK have reshaped our global footprint to improve access to high growth
potential markets including those in Asia Pacific, Latin America and Japan.
GSK Group turnover £23.0bn in 2014
Diversification delivering organic growth, Emerging Market sales up from c. 16% of
turnover in 2008 to 27% today.
£34 billion in returns paid to shareholders, including £24 billion of dividends and £10
billion of buy-backs. Dividend up from 57p in 2008 to 80p for 2014.
£3.5 billion cumulative annual cost savings delivered through a range of restructuring
programmes since 2008.
£400 million of incremental savings delivered through restructuring initiatives and ongoing
cost reduction.

355
10.2. GSK programs create financial value to enhance company competitiveness:
GSK efforts and programs create financial value for the company: (GSK Annual report, 2014b,
p&"13)
Core operating profit was £6.6 billion. Excluding currency effects.
Free cash flow was £2.6 billion.
Sales of new products were £1.5 billion in 2014, grew 84% and represented 8% of
Pharmaceutical and Vaccines turnover.
During 2014, GSK returned £4.1 billion to shareholders via dividends and share buy-backs.
10.3. GSK programs create business value to enhance company competitiveness:
GSK efforts and programs create business value for the company:(GSK Annual report, 2014b, p2)
1st 2014 Access to Medicine Index.
100% All countries have fully implemented new sales force compensation model.
1st Company to file for regulatory approval for malaria vaccine candidate.
84% Dow Jones Sustainability Index scores, putting us in top 2% of the pharmaceutical
sector.
11. The new business model and GSK global reach :
GSK is a science-led global healthcare company that researches and develops innovative
Pharmaceutical, Vaccines and Consumer Healthcare products:
11.1. Pharmaceuticals:
GSK Pharmaceuticals business develops and makes medicines to treat a broad range of acute and
chronic diseases. Our portfolio is made up of innovative and established medicines and we have leading
global positions in respiratory disease and HIV.GSK Pharmaceuticals business Total turnover is £15.5bn,
and represents 67.3% of Group turnover (Table 6).
Table6: Sales by therapy area
GSK Annual report, responsible business supplement, 2014, p7.
11.2. Vaccines:
GSK Vaccines business is one of the largest in the world. We have a broad portfolio of over 30
paediatric, adolescent, adult and travel vaccines. In 2014, we distributed approximately 800 million doses
in 170 countries.
GSK Vaccines business Total turnover is £3.2bn which represents 13.9% of Group turnover (Table
7).
Table 7: Sales by product line
Sales by therapy area £m
Respiratory 6,181
Oncology 1,202
Cardiovascular, metabolic and urology 965
Immuno-inflammation 214
Other pharmaceuticals 2,407
ViiV Healthcare (HIV) 1,498
Established Products 3,011

356
Sales by product line
£m
Infanrix/Pediarix 828
Boostrix 317
Cervarix 118
Fluarix and FluLaval 215
Hepatitis 558
Rotarix 376
Synflorix 398
Other 382
GSK Annual report, responsible business supplement, 2014,p8.
11.3. Consumer Healthcare:
Our Consumer Healthcare business is one of the largest in the world, driven by science and values.
We develop and market products in four categories – Wellness, Oral health, Nutrition and Skin health and
our brands are available in over 100 countries. GSK Consumer Healthcare Total turnover is£4.3bn which
represents 18.8% of Group turnover (Table 8).
Table 8 : Sales by category
Sales by category
£m
Wellness 1,596
Oral health 1,797
Nutrition 633
Skin health 310
GSK Annual report, responsible business supplement, 2014,p8.
Conclusion:
Creating shared value is not social responsibility, philanthropy, or even sustainability, but is a new
way to achieve economic success, and that it gives rise to the next major transformation of business
thinking.
CSV is a rather novel concept that argues the societal progress is at the heart of a company’s
economic success, and tending to society’s issues holds ample opportunities for improved competitiveness
and value creation of the organization.
The new business model Shared value provide a big opportunity for business corporations to make
more profit and achieve growth, in the same time solving a social problems and create value for society.
Nevertheless, pharmaceutical and medical device companies have an extraordinary opportunity to
help reduce global suffering and ill-health by building a competitive advantage in the low- and middle-
income countries that will underpin future industry growth. Firms that engage in this area can become
engines of progress for the global health field. They can be engaged partners rather than neutral suppliers.
GSK have already start to change the way of doing business and apply the concept of shared value
in pharmaceutical sector, shared value allowed GSK to reduce cost, makes more profit, and solve a social
problems. We hope this article serves to illustrate the scale of that opportunity, and triggers discussion and
innovation around ways to capitalize on it.

357
Notes and References:
1. Bockstette.V& Stamp.M. (2011). Creating Shared Value: How-to Guide for the New
Corporate (R)evolution,FSG,USA, ,p4.
2. Driver.M. (2012). Social Entrepreneurship and the Transformation of Capitalism, Academy
of Management Learning & Education, Vol. 11, No. 3, p423.
3. FACTBOX-The 20 largest pharmaceutical companies. 26/10/ 2015,
http://www.reuters.com/article/2010/03/26/pharmaceutical-mergers-
idUSN2612865020100326.
4. GSK Annual report (2014a) , responsible business supplement, , p6.
5. GSK Annual report (2014b) , Full report, , p6.
6. GSK Corporation, about as, 28/10/ 2015, www.gsk.com/en-gb/about-us/
7. Lapiņa.I, Borkus.I, Stariņeca.O. (2012). Corporate Social Responsibility and Creating Shared
Value: Case of Latvia,World Academy of Science, Engineering and Technology. Vol: 6,
p1606.
8. Michael E. Porter, Advancing the Shared Value Proposition,
22/08/2015,www.thecro.com/topics/social-responsibility/advancing-the-shared-value-
proposition.
9. Moore.C .(2014). Corporate social responsibility and creating shared value: what's the
difference, Heifer International, p4.
10. Mulgan G (2006). The process of social innovation innovations: technology governance.
Globalization 2. p145.
11. Peterson.K, Pfitzer.M, Mazzuri.S, Wendel.C, Hooson.C. (2014), Measuring Shared Value
Innovation and Impact in Health A Guide for Corporate Practitioners, FSG, p4.
12. Porter .M.E & Kramer.M. (2011). Creating Shared Value, Harvard Business Review,P66.
13. Porter .M.E .(2014). Competing by Saving Lives: How Pharmaceutical and Medical Device
Companies Create Shared Value in Global Health,FSG, ,p8.
14. Porter, M, Hills .G, Pfitzer.M, Patscheke .S, Hawkins.E.( 2013).Measuring Shared Value,
How to Unlock Value by Linking Social and Business Results FSG,USA, ,p1.
15. Schmitt.J.( 2014). Social Innovation for Business Success, Best Masters, Fachmedien
Wiesbaden, Germany,p22.
16. Stephenson. C. (2008) Creating Shared Value: The Inseparability of Business and Society,
Ivey Business Journal, vol. 74, no. 4, p772.

358
Advanced Aspects on Sustainable Biometric Security
Innovation
Prof. Dr. Muzhir Shaban Al-Ani
Anbar University
Iraq
Abstract:
It is important to know that absolute security does not exist, and the main goal of the security system
is to reach an optimal approach that satisfies the customer requirements. Biometric systems automatically
recognize individuals based on their physiological and behavioral characteristics. Image data security plays
an important role in personal identification. They are needed in different fields like banking, organizations,
passport control etc. We propose a framework for integrating the biometrics features with various models
that improves the personal verification system. In the proposed framework, first the soft biometric trait such
as weight is matched.
Keywords: Security Innovation, Biometric Techniques, Hybrid Security, Fusion Security.
1. Introduction
Biometrics deals with life measurement, in which it is associated with the utilization of physiological
and behavioral characteristics to distinguish an individual. It’s a new way to verify authenticity. Biometrics
utilizes biological characteristics or behavioral features to recognize an individual. 1858 first systematic
capture of hand images for identification purposes was recorded. In real a biometrics system is a pattern
identification system that uses various patterns such as iris patterns, retina design and biological
characteristics like fingerprints, facial geometry, voice recognition and hand recognition and so forth.
Biometric recognition system provides possibility to verify one’s identity simply by determining “who these
people are” instead of “what these people possess or may be remembered”. The very fact that
makes it really interesting is that the various security codes like the security passwords and the PIN
number could be interchanged among people but the physical traits cannot be. The principle use of
biometric security is to change the existing password system. There are numerous pros and cons of
Biometric system that must be considered [1,2].
2. Traditional Security
Traditional security system may face with many problems [3]:
Based on passwords, or identification cards
Can be lost easily.
Can be forgotten easily.
Can be stolen easily.
Can be used by a thief or intruder to access data.
359
Problems may appear with current security systems [4]:
Increasing use of IT technology that need more effort to protect data.
Each person may have multiple accounts/passwords.
It is difficult to remember so many passwords, so we need to create simple password using
such as birthdays, wife, friends name, dog, cat … etc.
It is easy to crack passwords, because most passwords are simple and weak.
For strong passwords, it is difficult to remember multiple such passwords and it is easy to
forget them.
3. Advantages and Disadvantages of Biometrics
By basing a security system on the physiological features rather than a few keystrokes or a password,
the possibilities of fraud are drastically reduced. The biometric industry is now emerging and is rapidly
gaining acceptance from governments, companies and individuals. Already, there are many industries
employing biometrics, including the U.S. Immigration and Naturalization Service, major western countries
armies, international banks, governments and healthcare organizations. The European Union also moves
towards creating standards for biometric passports which will be deployed in the near future, while Britain
plans to issue new identity cards which include biometrics. There are many types of biometrics, but among
the most common are scanning fingerprints, voices, faces, retinas or irises. Computer hardware and
software programs have been developed to scan a thumb print. Face recognition is the measurement of
certain characteristics, such as the distance between eyes. Retina scanning has the computer camera
inspecting the pattern of veins in a human eye. And, finally, iris scanning takes retina scanning one step
further by concentrating on the color pattern surrounding one's pupils. Key features of voice biometric that
differentiate it from other types of biometric procedure are that it is non-invasive and that it can be
performed remotely by telephone or via Internet. Approaches such as fingerprint analysis and retina
scanning are much less acceptable to users. In addition, the cost and complexity of the systems required for
fingerprint or retinal scanning far exceed that of the single microphone of a voice-based system that is, in
any case, already provided in typical PC systems, the telephone and the mobile handsets. Voice biometric
systems generally include classical pattern recognition components; that is data acquisition, pre-processing,
feature extraction and classification. The main advantage that biometric can offer is security and
convenience. Among the various types of biometric technologies available, voice recognition is one of the
cheapest to implement. Iris scanning provides high security and is convenient in that it allows the users to
keep their glasses on throughout the scan. A biometric system is not based on a standard true or false system
but by utilizing a threshold of acceptance closeness to the user's characteristic different levels of physical
security, authenticity, integrity and confidentiality can be established. While biometric authentication
includes several advantages it does have some drawbacks as well. Even though difficult, but not impossible,
fingerprints and pictures can be copied from anywhere and voice can be recorded. Another major drawback
is the cost associated with these technologies with iris scanning as being more pricey [5,6].
4. Biometric Techniques
There are four operations stages of a uni-modal biometric recognition system as shown in figure (1)
[7,8 ]:
Biometric data acquisition.
Data evaluation and feature extraction.
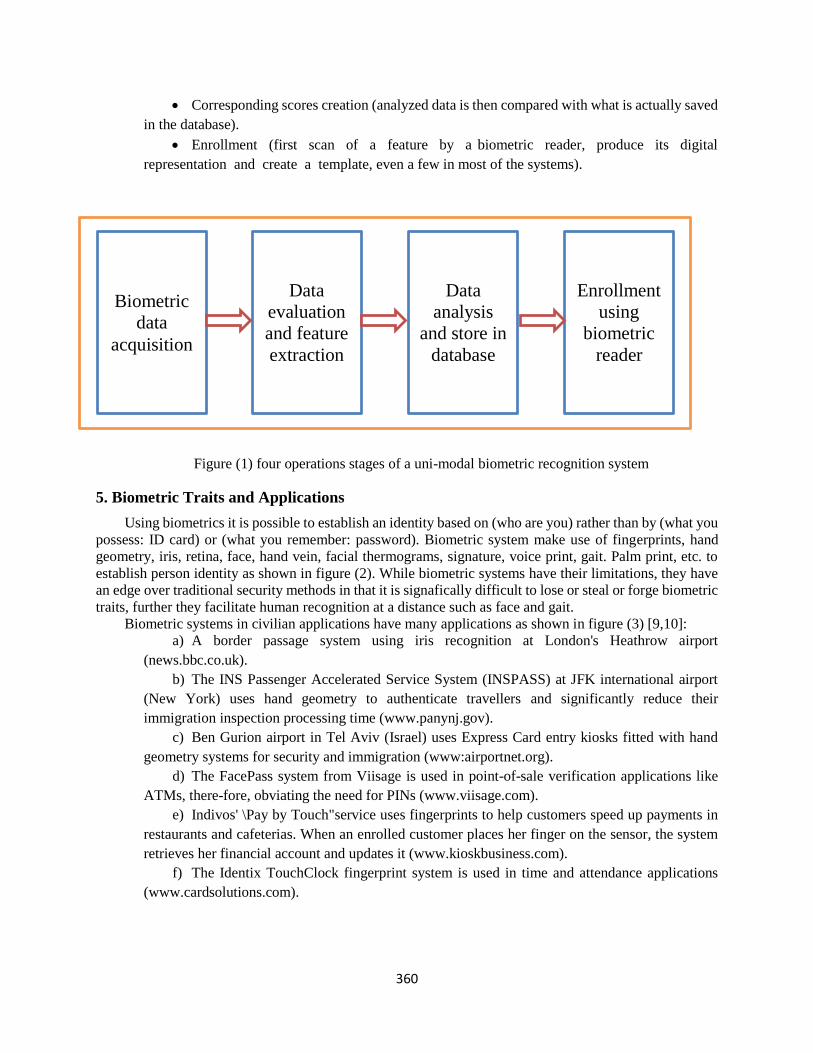
360
Corresponding scores creation (analyzed data is then compared with what is actually saved
in the database).
Enrollment (first scan of a feature by a biometric reader, produce its digital
representation and create a template, even a few in most of the systems).
Figure (1) four operations stages of a uni-modal biometric recognition system
5. Biometric Traits and Applications
Using biometrics it is possible to establish an identity based on (who are you) rather than by (what you
possess: ID card) or (what you remember: password). Biometric system make use of fingerprints, hand
geometry, iris, retina, face, hand vein, facial thermograms, signature, voice print, gait. Palm print, etc. to
establish person identity as shown in figure (2). While biometric systems have their limitations, they have
an edge over traditional security methods in that it is signafically difficult to lose or steal or forge biometric
traits, further they facilitate human recognition at a distance such as face and gait.
Biometric systems in civilian applications have many applications as shown in figure (3) [9,10]:
a) A border passage system using iris recognition at London's Heathrow airport
(news.bbc.co.uk).
b) The INS Passenger Accelerated Service System (INSPASS) at JFK international airport
(New York) uses hand geometry to authenticate travellers and significantly reduce their
immigration inspection processing time (www.panynj.gov).
c) Ben Gurion airport in Tel Aviv (Israel) uses Express Card entry kiosks fitted with hand
geometry systems for security and immigration (www:airportnet.org).
d) The FacePass system from Viisage is used in point-of-sale verification applications like
ATMs, there-fore, obviating the need for PINs (www.viisage.com).
e) Indivos' \Pay by Touch"service uses fingerprints to help customers speed up payments in
restaurants and cafeterias. When an enrolled customer places her finger on the sensor, the system
retrieves her financial account and updates it (www.kioskbusiness.com).
f) The Identix TouchClock fingerprint system is used in time and attendance applications
(www.cardsolutions.com).
Biometric
data
acquisition
Data
evaluation
and feature
extraction
Data
analysis
and store in
database
Enrollment
using
biometric
reader

361
Figure (2) Biometric traits
Figure (3) Biometric system in civilian applications
6. Proposed Biometric Approach
Many biometric systems are implemented to perform various applications and most of them are
concerned on biometric security. A biometric system is a pattern recognition system that operates by
acquiring biometric data (physical biometric and behavioral biometric) from an individual, extracting a

362
feature set from the acquired data, and comparing this feature set against the template set in the database.
Depending on the application context, a biometric system may operate either in verification level or
identification level.
The proposed biometric approach is implemented with the following components as shown in figure
(4) :
Data acquisition: in which introduce the biometric data such as face image and fingerprint
image.
Preprocessing: in which these images are enhanced and resized to unify the size of images
to pass to the next step.
Gray images: in which converting the color images into gray images.
Feature extraction: in which extract the needed features from images.
Fusion process: in which integrate the features in different steps to extract new features
used for the next step.
Decision making: in which comparing the stored features with new enter features in order
to generate the accurate decision.
Figure (4) components of biometric approach
7. Implemented System and Results
To perform this system first we collect a number of biometric data using acquiring devices, these
images are stored to be processed later. The implemented approach passes into many steps to generate the
corresponding results.
7.1 Data Acquisition
This step including receives the face image and fingerprint image and converting these images into
digital form as shown in figure (5).
Face acquisition
Face Pre-
processing
Convert to
Gray images
Face Feature
extraction
Fusion process
Fingerprint acquisition
Fingerprint Pre-
processing
Convert to
Gray images
Fingerprint Feature
extraction
Fusion process
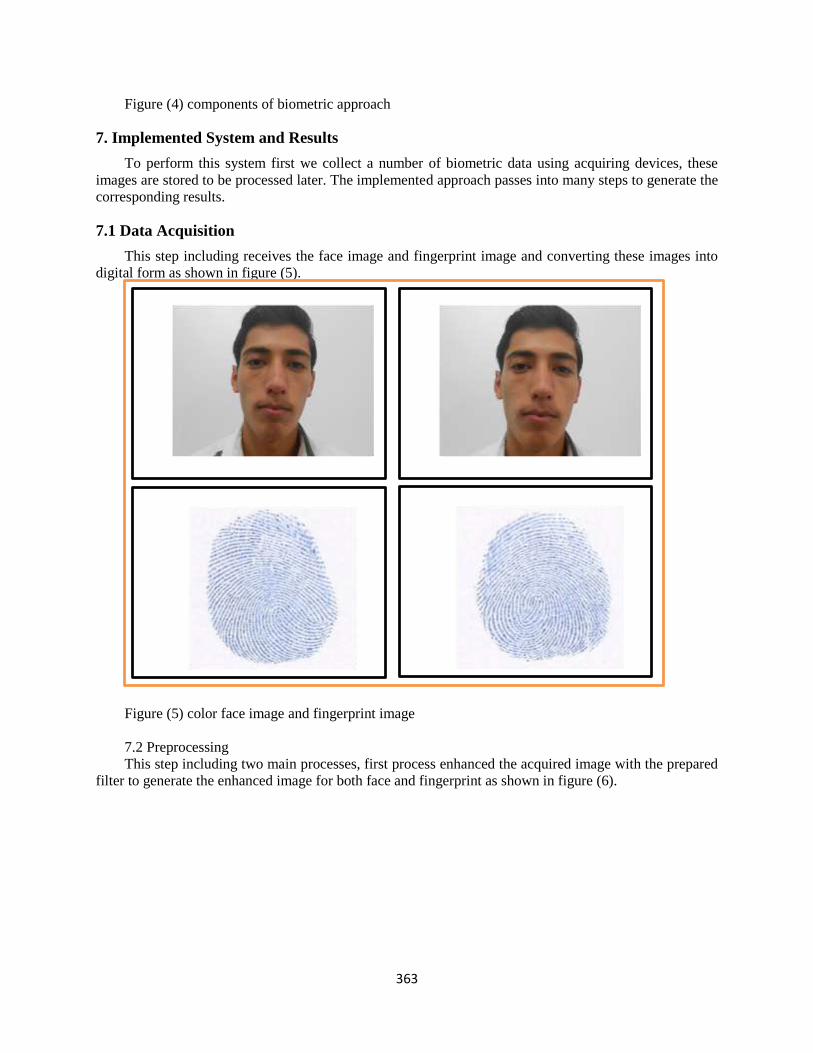
363
Figure (4) components of biometric approach
7. Implemented System and Results
To perform this system first we collect a number of biometric data using acquiring devices, these
images are stored to be processed later. The implemented approach passes into many steps to generate the
corresponding results.
7.1 Data Acquisition
This step including receives the face image and fingerprint image and converting these images into
digital form as shown in figure (5).
Figure (5) color face image and fingerprint image
7.2 Preprocessing
This step including two main processes, first process enhanced the acquired image with the prepared
filter to generate the enhanced image for both face and fingerprint as shown in figure (6).

364
Figure (6) enhanced image for both face and fingerprint
7.3 Gray Images
This step including converting the enhanced color image into gray scale image for both face and
fingerprint as shown in figure (7). The histogram of gray scale image for both face and fingerprint as shown
in figure (8).

365
Figure (7) gray scale face image and fingerprint image
Figure (8) histogram of gray scale face image and fingerprint image
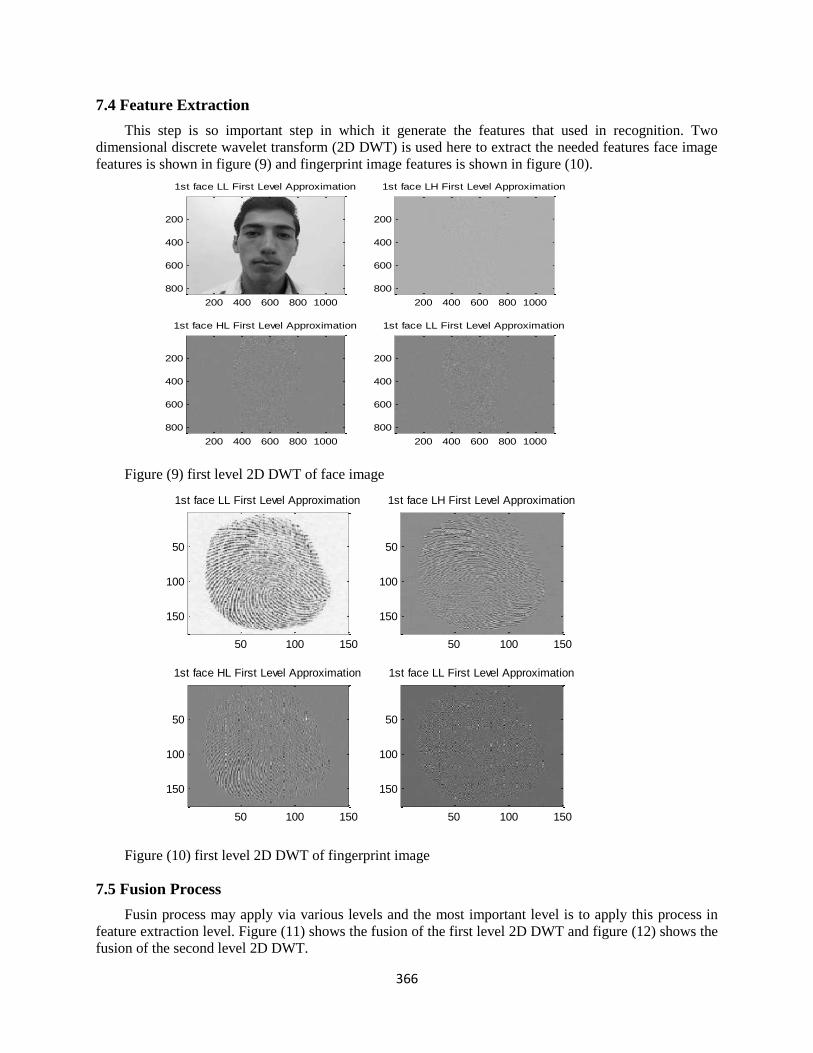
366
7.4 Feature Extraction
This step is so important step in which it generate the features that used in recognition. Two
dimensional discrete wavelet transform (2D DWT) is used here to extract the needed features face image
features is shown in figure (9) and fingerprint image features is shown in figure (10).
Figure (9) first level 2D DWT of face image
Figure (10) first level 2D DWT of fingerprint image
7.5 Fusion Process
Fusin process may apply via various levels and the most important level is to apply this process in
feature extraction level. Figure (11) shows the fusion of the first level 2D DWT and figure (12) shows the
fusion of the second level 2D DWT.
1st face LL First Level Approximation
200 400 600 800 1000
200
400
600
800
1st face LH First Level Approximation
200 400 600 800 1000
200
400
600
800
1st face HL First Level Approximation
200 400 600 800 1000
200
400
600
800
1st face LL First Level Approximation
200 400 600 800 1000
200
400
600
800
1st face LL First Level Approximation
50 100 150
50
100
150
1st face LH First Level Approximation
50 100 150
50
100
150
1st face HL First Level Approximation
50 100 150
50
100
150
1st face LL First Level Approximation
50 100 150
50
100
150

367
Figure (11) fusion of the first level 2D DWT
Figure (12) fusion of the second level 2D DWT
8. Future Biometric Trends in Security
Using biometric technology to recognize citizens and customers, coupled with streamlined processes
and effective organizational design, will not only deliver strong identify management capabilities but also
lead to better business outcomes and, ultimately, high performance. The application of biometrics in daily
activities are expected to deeply transform our life: examples include the services offered in e-commerce,
e-banking, registered travelers schemes, smart environments and ambient intelligence.
dwt
dwt
idwt
FU
SIO
N
Fusion of DecompositionsSynthesized Image
Decomposition 2Image 2
Decomposition 1Image 1
dwt
dwt
idwt
FU
SIO
N
Fusion of DecompositionsSynthesized Image
Decomposition 2Image 2
Decomposition 1Image 1

368
The future trends of biometric identification tasks may include various fields and applications some of
these trends may be concentrated on:
Analysis of internal structure of body parts.
Analysis of Body shape recognition.
Analysis of face vibrations during speaking.
Analysis of other electrical and magnetic fields created by human body.
Movement of hands, eyes, lips or any part of the body.
Recognizing expressions of the person.
Recognizing additional actions.
Personal identification using odor.
Personal identification using electromagnetic emission.
9. Conclusion
This paper presents an introduction on numerous biometric techniques undertaking the comparison
examination regarding widely used biometric identifiers and also the identification strategies. As this
is a new technology for most of the peoples since it has simply been implemented in public areas
for short time period. There are numerous applications along with alternative solutions used in security
techniques. It provides benefits that may improve our lives in such a way by increasing security
and efficiency, decreasing scams and reducing password administrator cost. Despite the fact the
biometrics security systems still have many issues like data privacy, physical privacy, and spiritual
arguments etc.
References
[1] Rupinder Saini , Narinder Rana, “COMPARISON OF VARIOUS BIOMETRIC
METHODS”, International Journal of Advances in Science and Technology (IJAST), Vol 2
Issue I (March 2014).
[2] Joseph N. Pato and Lynette I. Millett, Editors; Whither Biometrics Committee;
National Research Council (2010), “Biometric Recognition: Challenges and Opportunities”.
[3] Yampolskiy, R. V. & Govindaraju, V. (2007). Direct and Indirect Human Computer
Interaction Based Biometrics, Journal of Computers, Vol. 2, No. 10, December 2007.
[4] Soutar, R. D., Stojanov, S., Gilroy R., & Kumar, B. V. (1998). Biometric encryption using
image processing. SPIE, Optical Security and Counterfeit Deterrence Techniques II, 3314,
San Jose, CA, USA, , SPIE Digital Library, 1998.
[5] A. J. Harris and D. C. Yen, Biometric authentication. assuring access to information,
Information Management & Security 10/1, pp. 12-19, 2002.
[6] J.L. Dugelay, J.C. Junqua, C. Kotropoulos, and R. Kuhn, Recent Advantages in Biometric
Person Authentication, ICASSP 2002 , International Conference on Acoustics, Speech and
Signal Processing , May 13, 2002, Orlando, Florida, USA.
[7] Anil K. Jain, Arun Ross and Salil Prabhakar (2004), “An Introduction to Biometric
Recognition.”
[8] A. K. Jain, A. Ross, and S. Prabhakar. An Introduction to Biometric Recognition. IEEE
Transactions on Circuits and Systems for Video Technology, Special Issue on Image- and
Video-Based Biometrics, 14(1):4–20, January 2004.
[9] R. Zunkel, “Hand geometry based authentication," in Biometrics: Personal Identication in
Networked Society (A. K. Jain, R. Bolle, and S. Pankanti, eds.), ch. 4, pp. 87-102, Kluwer
Academic Publishers, 1998.
[10] L. O'Gorman, \Fingerprint verification," in Biometrics: Personal Identification in a
Networked Society (A. K. Jain, R. Bolle, and S. Pankanti, eds.), pp. 43-64,Kluwer Academic
Publishers, 1999.

369
Using Structural Equation Modelling to Evaluate the
Hotel Restaurants’ Service Quality Dimensions,
Satisfaction and Customer's Loyalty
Ahmad Puad Mat Som Ala`a Nimer AbuKhalifeh
Universiti Sultan Zainal Abidin University Sains
Malaysia Malaysia
Abstract:
The aim of this research is to investigate the relationships among service quality, satisfaction, and
customer loyalty in a hotel restaurant context. The sample consisted of 430 respondents who stayed at four
and five star hotels in Jordan. A structured questionnaire, with a five-point Likert scale, was used.
Confirmatory factor analysis (CFA) and structural equation modelling (SEM) were used to analyse the
casual relationships between service quality, customer satisfaction, and customer loyalty and to evaluate
the hypotheses regarding relationships among model constructs. All the hypotheses developed in the study
were positively confirmed, reinforcing the theory and previous research on this field. The study also reveals
interesting implications in service quality, satisfaction, and customer loyalty, useful to academics and
practitioners. Managers will find this research helpful in better understanding these variables and their roles
on their hotels. This study could not be generalized widely to other locations or countries.
Keywords: Service Quality, Customer Satisfaction, Hotel Restaurants, Customer Loyalty.
Introduction
Service quality has been the subject of substantial interest by both practitioners and scholars in recent
years, spurred on by the original work by (A. Parasuraman, V. A. Zeithaml, & L. L. Berry, 1985). An
important reason for the interest in service quality by practitioners results from the belief that this has a
beneficial effect on bottom line performance for the firm. Nevertheless, practitioners frequently tend to use
the terms service quality and customer satisfaction interchangeably. Among academics the satisfaction
constructs is recognised as being distinct and has developed along fairly independent lines from service
quality (Oliver, 1980). The concepts of hotel restaurants service quality; customer satisfaction and customer
loyalty are associated to each other. Theoretically, the expectancy (disconfirmation) paradigm in process
theory can provide the foundation for this study, with service quality as an antecedent construct and
customer loyalty as an outcome variable of customer satisfaction. A better sympathetic of the effects of
service quality and customer satisfaction on customer loyalty can help academics in the growth of a model
of hotel restaurants. It can also provide practitioners with indications as to where best to devote marketing
notice and service corporate resources. This study seeks to contribute to the development of conceptual
framework that integrates customer loyalty, service quality and customer satisfaction. It reviews the
literature on these three constructs and outlines the expected relationship in a research model. Appropriate
measures are identified and research are carried out among four and five star hotels restaurants’ customers
and tourists in Jordan to test the hypothesis relationship. Service loyalty, with its final effect on repurchasing
by customers, is possibly one of the most important constructs in hospitality industry. Certainly, loyal

370
customers that indulge in repeat purchases are the bed rock of any hotels. One of the more clear questions
relates to the demographic characteristics of how these can be used for segmentation purposes (Frank,
1967). Though, work the integrates the role of service loyalty within the context of other service marketing
variables like hotel restaurants service quality and customer satisfaction has received less attention.
Service quality
Many researchers in the hospitality industry perceived service quality as a critical issue. Valarie. A.
Zeithaml (1988) defined service quality as the customer judgement about the overall excellence of a
product. Reeves and Bednar (1994) provided several definitions of quality. They branded quality in terms
of excellence, value, conformance to specifications and meeting or exceeding customers’ expectations of
service rendered. For Mudie and Cottam (2010) service quality meant service providers must adhere to a
set of unwritten rules in “conformance to requirements” set by the customers. Juran (1989) distinct quality
as fitness for use it means that the product meets the customer’s needs and is free of deficiencies. Spencer
(1994) equated quality as the act of satisfying or delighting the customer with the necessary service. In the
same light, other researchers suggested that quality needs maybe defined by the customers (Grönroos, 1984;
A. Parasuraman, V. A. Zeithaml, & L. Berry, L., 1988a; Reeves & Bednar, 1995). As such service quality
is based upon customer’s needs and wants for a certain degree of quality (Haemoon. Oh, 2000; Sparks,
Butcher, & Pan, 2007).
In the 1990s, customer’s perception of quality has gained primary focus in service quality studies
(Kwortnik & Han, 2011; Haemoon. Oh, 2000; Wall & Berry, 2007). Subsequently, quality as the customer’s
perception of service excellence become a popular definition among many scholars in the field of service
quality study (Parasuraman, Berry, & Zeithaml, 1990; A. Parasuraman, V. A. Zeithaml, & L. L. Berry,
1988b). And another well-known definition is relative superiority of performance (Bitner & Hubbert, 1994;
Gronroos, 1982). There are also others who included attitude in the definition of service quality (Cronin &
Taylor, 1992; Parasuraman et al., 1988b). Bitner and Hubbert (1994) have slightly differing view when
they define service quality as the customers’ overall impression of the relative inferiority of the organization
and its services. A. Parasuraman, V. Zeithaml, A.,, and L. Berry, L. (1985) add on the definition by stating
that service quality is a degree and direction of discrepancy between customers’ service perceptions and
expectations. Valarie. A. Zeithaml (1988) definite perceived quality as how the customers assesses the
overall fineness and superiority of the product or services provided and can also described in two different
types of approaches, namely expectation performance and performance model. Valarie A Zeithaml,
Parasuraman, and Berry (1990) outlined the discrepancy between customers’ expectations or desire and
their perceptions as a definition of quality. These definitions of service quality are based on a comparison
of the service quality perceptions before using the service and the actual performance after using the service
(Gronroos, 1982; A. Parasuraman et al., 1985; Parasuraman et al., 1988b).
Definitions of service quality further attested that the dimensions of service quality is the difference
between what customers expect from a service and their perceptions of how the service is performed
(Grönroos, 1984; Lehtinen & Lehtinen, 1982; A. Parasuraman et al., 1985). Service quality is precise as the
amount of deviation between customers’ perceptions of service performance from the normative
expectation of that particular service. Afterward, the definition of service quality was fine tuned as “the
overall evaluation of a specific service firm that results from comparing the firm’s performance with the
customer’s general expectations of how firms in the hotel industry should perform (A. Parasuraman et al.,
1985). While, Waller (1996 p.152) defined the quality as “ the totality of features and characteristics of the
product or service that bear on its ability to meet a given needs’’.
Customer Satisfaction

371
The importance of customer satisfaction has long been recognized, both in hospitality research and in
the broader research environment (J. D. Barsky & Labagh, 1992; Cadotte, 1979; Ma, Qu, Wilson, &
Eastman, 2013; Skogland & Siguaw, 2004; Sulek & Hensley, 2004; Yüksel & Rimmington, 1998).
Satisfying customers is a fundamental component of the marketing concept (J. Barsky & Nash, 2003; Enz,
2004). It is the link to business performance as an antecedent of repeat purchase behaviour that has
encouraged the research interest in customer satisfaction (J. D. Barsky & Labagh, 1992; Haemoon Oh &
Parks, 1997; Wirtz, 1993). For the customers, there is the tendency to link perceived service quality with
satisfaction, where perceived service quality is a global judgment or attitude, relating to dominance of the
service, whereas satisfaction refers to a specific transaction with regard to the perceived service quality
(Namkung & Jang, 2010; Haemoon. Oh, 2000; Parasuraman et al., 1988a). As noted by Oliver (1993), the
word “satisfaction” is derived from the Latin satis (enough) and facere (to do or make). A related word is
“satiation” which loosely means “enough” or “enough to excess”. These terms illustrate the point that
satisfaction implies a filling or fulfilment. Thus, consumer satisfaction can be viewed as the customer’s
fulfilment response. Oliver and DeSarbo (1988) framework views satisfaction as a state of fulfilment related
to reinforcement and arousal, low arousal fulfilment is described as “satisfaction as contentment”, which
assumes only that the product or service performs satisfactorily in an ongoing, passive sense. V. A.
Zeithaml, Bitner, and Gremler (2009) mentioned that satisfaction as the customer’s evaluation of a product
or service in terms of whether that product or service has met the customer’s needs and expectations. Failure
to meet needs and expectations is assumed to result in dissatisfaction with the product or service. Gerson
(1993), stated that, “satisfaction is the customer’s perception that his or her expectations have been meet or
surpassed”. Giese and Cote (2000) provide an overview of customer satisfaction, which can be influenced
by three components related to the affective, focus and temporal response. The affective response deals
with the intensity with which a particular customer reacts to a certain service or product delivery and the
satisfaction varies between individuals. The next component depends on the customers’ focus or demand
for an exacting product choice, purchase or consumption. As for the temporal response, customer
satisfaction may vary according to the situation but this is usually limited in duration. Oliver (1981)
summarizes current thinking on satisfaction in the following definition “[satisfaction is a] summary
psychological state resulting when the emotion surrounding disconfirmed expectations is coupled with the
consumer’s prior feelings about the consumption experience” (p. 27).
From the perspective of the cognitive component, the customer’s evaluation of the perceived
performance in terms of its adequacy in comparison to some kind of expectation standards is taken into
consideration (Oliver, 1980; Wirtz, 1993). Liljander and Strandvik (1997) outlined satisfaction as an
emotional component, which compromises various emotions, including happiness, sadness, dissatisfaction,
surprise and disappointment. In addition, Cronin and Taylor (1992) and Patterson, Johnson, and Spreng
(1996) discovered that the impact of customer satisfaction on repurchase intention in a range of services is
significant. From a similar perspective, Venetis and Ghauri (2004) concluded that client satisfaction is
indisputably the key factor that influences the loyalty of current clients in any professional service, whereas
Crosby, Evans, and Cowles (1990) suggested that trust and satisfaction may strongly influence future sales
opportunities in personal selling situations.
In this light, Finkelman and Goland (1990) explained that there is a need for companies to have a
comprehensive understanding of customers’ expectations at every stage of forming their experiences.
Companies are also required to expand the procedures of establishing and supporting the system of
rewarding and evaluation to satisfy customers. The same scholars divided the elements of customers into
the product, the sale, the after-sale process, location, overnight stay and culture. The after-sale process
includes the interest of customers and the treatment of complaints which should be fulfilled, and customers
should be acquainted with the whole process. The main reason for the after-sale process is to make the
customer aware that the hotel is showing interest in their purchase and especially to illustrate the amount
of respect accorded to them.
Incidentally, customer satisfaction is the result of a customer’s perception of value received in a
transaction or relationship, where value equals perceived service quality relative to customer acquisition
cost and price (Babajide, 2011). In the same view, many other studies are concerned with the significant

372
relationship between customer satisfaction and customer perceptions (Babajide, 2011; Gupta, McLaughlin,
& Gomez, 2007; Kang & James, 2004; Swimberghe & Wooldridge, 2014 ). Therefore, customer
satisfaction has been observed in this research to be acting as a mediating variable in the link between hotel
restaurants’ service quality perceptions and customer loyalty. Kotler and Keller (2011) referred to
satisfaction as a personal feeling of happiness or disappointment with the result from the comparison
between realized performance and the person’s expectations. Practitioners and writers tend to use the terms
“satisfaction” and “service quality” interchangeably (V. A. Zeithaml et al., 2009), but researchers have
attempted to be more specific about the meaning and measurement of the two concepts, resulting in
considerable debate (Parasuraman, Zeithaml, & Berry, 1994). Consensus is that the two concepts are
fundamentally different in terms of their underlying causes and outcomes (Brady & Cronin Jr, 2001; Oliver,
1993).
Although they have certain things in common, satisfaction is generally viewed as a broader concept,
whereas service quality focuses specifically on dimensions of service. Based on this view, perceived service
quality is a component of customer satisfaction (V. A. Zeithaml et al., 2009). Service quality is a focused
evaluation that reflects the customer’s perception of reliability, assurance, responsiveness, empathy and
tangibles (Parasuraman et al., 1988b). Satisfaction, on the other hand, is more inclusive and it is influenced
by perceptions of service quality, product quality and price, as well as situational factors and personal
factors.
Customer Loyalty
Over the past thirty years, loyalty has been debated by academics, with the core issue being the
dimensionality and measurement of the construct. Loyalty appears to be a complex multi-dimensional
construct (Dick & Basu, 1994; Ha, 1998; Javalgı & Moberg, 1997). Yet during this period, views on loyalty
have oscillated between uni-dimensional and two- dimensional views. Early research pursued either an
attitudinal (Guest, 1944) or a behavioural approach (Cunningham, 1956) and this is still prevalent today.
However, in the 1990s, research emerged which attempts to integrate both the attitudinal and behavioural
dimensions of loyalty into two distinct but important constructs (Baldinger & Rubinson, 1996; Dick &
Basu, 1994). Loyalty is thus defined as the relationship between an individual's attitudinal predisposition
towards an object and the repeat patronage of that object.
Szmigin and Carrigan (2001) defined customer loyalty as the consumer’s commitment towards a
product, brand, marketer, or services above and beyond that for the competitors in the market place, and
usually the commitment results in repeat purchase. Therefore, a loyal customer of a particular hotel is one
who will choose to continue staying with the same service provider and is more likely to try new products
introduced by the hotel and to recommend the hotel’s services to other customers (Bowen & Chen, 2001).
Linton (1993) defined customer loyalty as one of the most important issues facing businesses today. Teich
(1997) claimed that loyalty is developed over a period of time from a consistent record of meeting, and
sometimes even exceeding, customer expectations. From the cost point of view, Levesque and McDougall
(1993); McDougall and Levesque (2000) emphasise that loyal customers are beneficial to service providers
because they “often cost less to service, spend more as their time with the firm lengthens, and provide a
good source for new business”. Mittal and Lassar (1998) state that loyal customers also lead to lower
marketing costs, more efficient operations and higher profits.
Kotler, Bowen, and Makens (1999) argue that it costs five times more to attract and catches a new
customer as compared to the cost of keeping a current customer happy, as much effort and cost are required
to persuade satisfied customers to switch over from their current service providers. He supported his
argument with facts that illustrated that companies can enhance profit from twenty-five percent to eighty-
five percent by reducing customer defections by five percent as this result can be achieved through
delivering high customer satisfaction. Gremler and Brown (1996) distinct service loyalty as the extent to
which a customer displays repeat purchasing behaviour from a service provider, acquires a positive
attitudinal disposition toward the provider, and deliberately uses the same provider every time they need to
use the same service. From another perspective, Caruana (2002) defined service loyalty as a collective

373
affective response of varying intensity, with a time specific point of determination and limited duration,
directed toward focal aspects of product acquisition and/or service consumption. Bloemer and Kasper
(1995) argued that true loyalty is when the same customer actually buys the same brand time and again. In
this context, true loyalty encompasses a non-random, behavioural response with results from an evaluation
process that results in commitment. According to Valarie A Zeithaml, Berry, and Parasuraman (1996),
loyalty is a multi-dimensional construct that includes both positive and negative responses.
In line with this, a number of empirical studies have demonstrated that some customers stayed with an
organization even if they were dissatisfied because they perceived that they had no other choice (Holmlund
& Kock, 1996; Mittal & Lassar, 1998; Valarie A Zeithaml et al., 1996). From this, it can be deduced that a
satisfied customer is not always a loyal customer, since a loyal customer may at times be dissatisfied with
certain services provided. While we are on the subject Colgate, Stewart, and Kinsella (1996) argued that it
is not necessary for customer defection to be the inverse of loyalty. Levesque and McDougall (1993)
supported this argument by explaining that sometimes there may be shortcomings with the service provided,
but about half of the customers would still continue using the same service. A few scholars have explained
these phenomena by claiming that those customers choose to remain loyal due to high switching costs; they
perceived that alternatives are no better and are limited by location issues, time or money constraints, habit
or behaviour opposing change (Bitner, Booms, & Tetreault, 1990). Although satisfaction may not be the
overall cause of customer loyalty, a dis-satisfied customer would definitely look for alternatives in future.
With the present situation whereby customer are becoming more and more demanding, in future satisfaction
may become the absolute cause of customer loyalty (Hayes, 2008).
Research Design
The study is designed to use quantitative research methods. A quantitative approach is helped to
explain present circumstances, or examine relationship among the variables (Creswell, 2013; Firestone,
1987; Scandura & Williams, 2000; Yin, 2013). The reason of using survey research design is to answer
research questions and test the hypothesis of this research (Burns, 1997; De Vaus, 2002; Trochim &
Donnelly, 2001). The design examines the relationship among hotel restaurants’ service quality dimensions,
customer satisfaction and customer loyalty. The findings, through using this research design, will further
validate the impact of each independent variable on overall loyalty. For the purpose of this research, a
survey questionnaire was employed.
Population and Sampling Framework
A population represents all the individual elements, items or objects whose characteristics are being
studied. The population that is being studied is also called the target population (Mann, 2007). The specific
target population for this research was customers who stayed at four and five star hotels in Amman, Irbid,
Madaba, Dead Sea, Petra and Aqapa, Jordan. According to MOTA (2013), there were reported 61 four and
five star architecturally designed hotels in these destinations. In 2013, there were approximately 3,056,228
hotel rooms in Jordan with an average occupancy rate of 43.8% (MOTA, 2013). The unit analysis of the
study was individual hotel customer, and the population consists of four and five star hotel customers from
either local or international. The reasons for choosing these tourist destination hotels were a) geographical
area would be thoroughly evaluated, rather than choosing samples across the whole country, b) Jordan is a
primary spot for tourists’ destination and gateway to Middle East countries, c) the association with Amman,
Irbid, Madaba, Dead Sea, Petra and Aqapa environment could also ease the data collection process.
FINDINGS
In this study service quality is a second-order construct which is made up of five first order constructs
including tangibles, empathy, assurance, reliability and responsiveness. As shown in Table 1, 11 items were
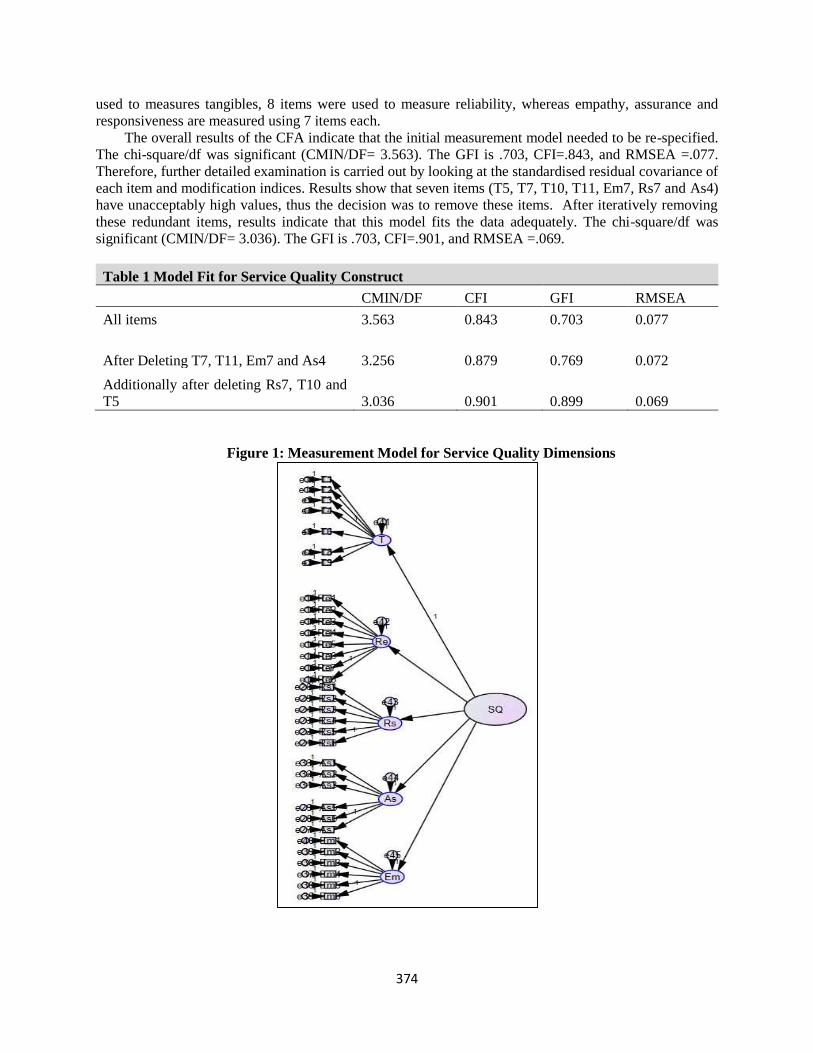
374
used to measures tangibles, 8 items were used to measure reliability, whereas empathy, assurance and
responsiveness are measured using 7 items each.
The overall results of the CFA indicate that the initial measurement model needed to be re-specified.
The chi-square/df was significant (CMIN/DF= 3.563). The GFI is .703, CFI=.843, and RMSEA =.077.
Therefore, further detailed examination is carried out by looking at the standardised residual covariance of
each item and modification indices. Results show that seven items (T5, T7, T10, T11, Em7, Rs7 and As4)
have unacceptably high values, thus the decision was to remove these items. After iteratively removing
these redundant items, results indicate that this model fits the data adequately. The chi-square/df was
significant (CMIN/DF= 3.036). The GFI is .703, CFI=.901, and RMSEA =.069.
Table 1 Model Fit for Service Quality Construct
CMIN/DF CFI GFI RMSEA
All items 3.563 0.843 0.703 0.077
After Deleting T7, T11, Em7 and As4 3.256 0.879 0.769 0.072
Additionally after deleting Rs7, T10 and
T5 3.036 0.901 0.899 0.069
Figure 1: Measurement Model for Service Quality Dimensions

375
Nineteen items were used to measure the one-factor model of customer satisfaction. The overall results
of the CFA indicate that the initial measurement model needed to be re-specified. The chi-square/df was
significant (CMIN/DF= 5.622). The GFI is .815, CFI=.886, and RMSEA =.104. Therefore, further detailed
examination is carried out by looking at the standardised residual covariance of each item and modification
indices. Results show that two items (CS12 and CS19) have unacceptably high values, thus the decision
was to remove these items. After iteratively removing these redundant items, results indicate that this model
fits the data adequately. The chi-square/df was significant (CMIN/DF= 3.619). The GFI is .898, CFI=.951,
and RMSEA =.078. (Table 2 and Figure 2).
Table 2: Model Fit for Customer Satisfaction Construct
CMIN/DF CFI GFI RMSEA
All items 5.622 0.886 0.815 0.104
After Deleting CS12,
CS19 3.619 0.951 0.898 0.078
Figure 2: Measurement Model for Customer Satisfaction
Following table 3 presents summary of all the deleted items.
Table3: Summary of deleted items
Constructs Dimensions
Initial No.
of Items
Deleted No. Of Items
in Individual
Measurement
Deleted Items in
Individual
Measurement
Service Quality Tangibles 11 4 T5, T7, T10, T11

376
Reliability 8 0
Responsiveness 7 1 Rs7
Assurance 7 1 As4
Empathy 7 1 Em7
Customer Satisfaction 19 2 CS12, CS9
Customer Loyalty 6 0
Total 65 9
Sex items were used to measure the one-factor model of customer Loyalty. The overall results of the
CFA indicate that the initial measurement model did not need to be re-specified, so none of the items were
deleted. The chi-square/df was significant (CMIN/DF= 0.080). The GFI is .957, CFI=.972, and RMSEA
=.080. (Table 3 and Figure 3).
Table 4: Model Fit for Customer Loyalty Construct
CMIN/DF CFI GFI RMSEA
All items 4.845 0.972 0.957 0.080
Figure 3: Measurement Model for Customer Loyalty
Reliability and Validity of the Constructs
Following the establishment of the uni-dimensionality step and before testing the hypotheses in the
structural model, the reliability and validity of the underlying constructs were assessed (Wulf, Odekerken-
Schröder, & Iacobucci, 2001). For this purpose, the constructs discussed in step one were assessed for

377
reliability using construct reliability (CR), and average variance extracted (AVE), and for validity using
construct, convergent and discriminant.
Reliability of the measures in this study was first assessed using confirmatory factor analysis (CFA).
In using confirmatory factor analysis, CR and AVE were calculated from model estimates using the CR
formula and AVE formula given by (Fornell & Larcker, 1981). (Bagozzi & Yi, 1988) recommended that
CR should be equal to or greater than .60, and AVE should be equal to or greater than .50. Based on these
assessments, measures used within this study were within the acceptable levels supporting the reliability of
the constructs (see Table 5).
Table 5: Standardized Confirmatory Factor Loadings
Variables Items Factor Loadings C.R AVE
Tangibles
T1 0.675
0.508 0.846
T2 0.666
T3 0.701
T6 0.700
T8 0.686
T9 0.72
Reliability
Re1 0.768
0.584 0.907
Re2 0.786
Re3 0.791
Re4 0.834
Re5 0.76
Re6 0.718
Re7 0.682
Re8 0.685
Responsiveness
Rs1 0.748
0.604 0.901
Rs2 0.829
Rs3 0.773
Rs4 0.747
Rs5 0.81
Rs6 0.752
Assurance
As1 0.826
0.638 0.913
As2 0.767
As3 0.769
As5 0.817
As6 0.817
As7 0.793
Empathy
Em1 0.683
0.538 0.874 Em2 0.673
Em3 0.763

378
Em4 0.755
Em5 0.717
Em6 0.801
Service quality 0.583 0.891
Customer Loyalty
Cl1 0.799
0.65 0.918
Cl2 0.871
Cp3 0.857
Cl4 0.798
Cl5 0.752
Cl6 0.754
Customer Satisfaction
Cs1 0.826
0.592 0.984
Cs2 0.73
Cs3 0.713
Cs4 0.771
Cs5 0.797
Cs6 0.833
Cs7 0.807
Cs8 0.754
Cs9 0.823
Cs10 0.807
Cs11 0.794
Cs13 0.756
Cs14 0.722
Cs15 0.72
Cs16 0.779
Cs17 0.787
Cs18 0.703
P < 0.05
As for validity, confirmatory factor analysis has also been used to assess construct, convergent and
discriminant validity. Empirically, construct validity exists when the measure is a good representation of
the variable the researcher intends to measure. As (Bagozzi, 1980) argued, construct validity is a necessary
perquisite for theory testing. In this study, results obtained from goodness-of- fit indices confirmed
construct validity (Hsieh & Hiang, 2004). As for convergent validity, evidence has been found in which all
factor loadings for items measuring the same construct are statistically significant (J. C. Anderson &
Gerbing, 1988; Holmes-Smith, Coote, & Cunningham, 2006). As indicated in Table 5, all factors included
high loadings (greater than .50) and were statistically significant (P<0.05). The results of AVE presented
in Table 5 provide an additional support for convergent validity. Finally, discriminant validity was assessed
using two methods. First, taking (Hooper, Coughlan, & Mullen, 2008) suggestions that the estimated
correlations between factors should not be higher than .85, each measurement model was subject to this
assessment. That is, redundant items that caused high correlations among factors were deleted, revealing
evidence of discriminant validity (see measurement models tested in previous sections). Discriminant
validity of the constructs was also checked. The bold values in Table 6 shows the AVE Values of each
construct, whereas the other values are the squared correlation coefficients between constructs. The results
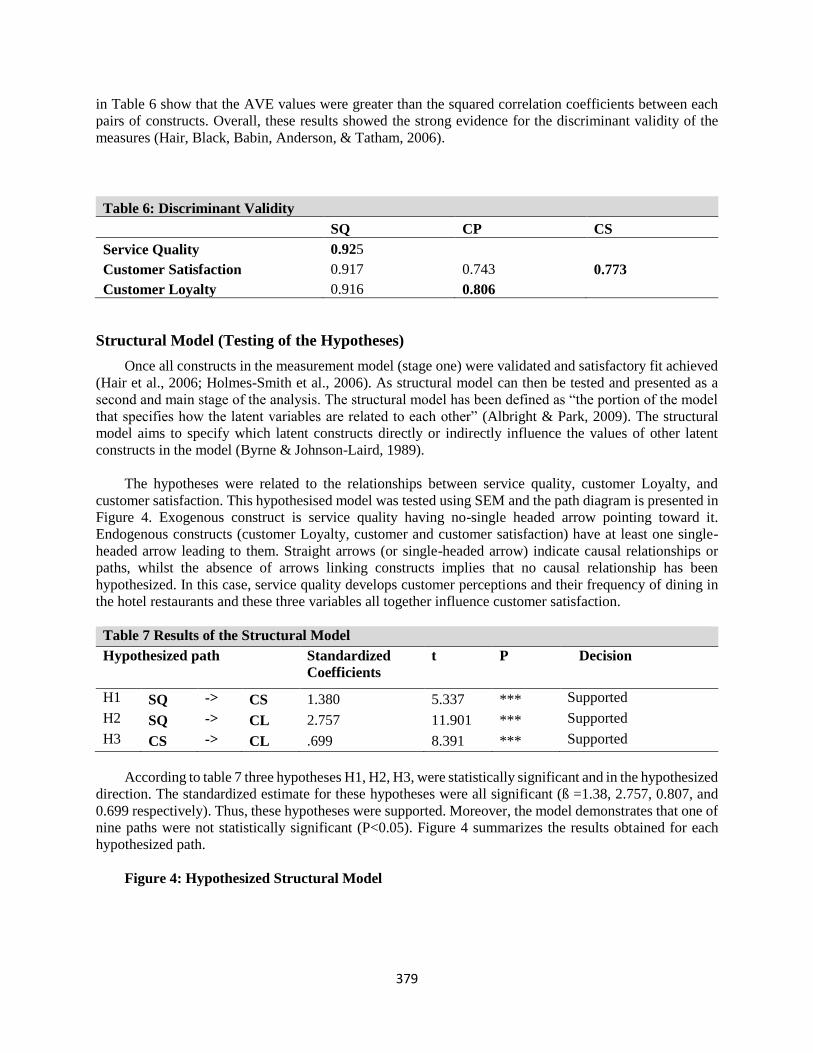
379
in Table 6 show that the AVE values were greater than the squared correlation coefficients between each
pairs of constructs. Overall, these results showed the strong evidence for the discriminant validity of the
measures (Hair, Black, Babin, Anderson, & Tatham, 2006).
Table 6: Discriminant Validity
SQ CP CS
Service Quality 0.925
Customer Satisfaction 0.917 0.743 0.773
Customer Loyalty 0.916 0.806
Structural Model (Testing of the Hypotheses)
Once all constructs in the measurement model (stage one) were validated and satisfactory fit achieved
(Hair et al., 2006; Holmes-Smith et al., 2006). As structural model can then be tested and presented as a
second and main stage of the analysis. The structural model has been defined as “the portion of the model
that specifies how the latent variables are related to each other” (Albright & Park, 2009). The structural
model aims to specify which latent constructs directly or indirectly influence the values of other latent
constructs in the model (Byrne & Johnson-Laird, 1989).
The hypotheses were related to the relationships between service quality, customer Loyalty, and
customer satisfaction. This hypothesised model was tested using SEM and the path diagram is presented in
Figure 4. Exogenous construct is service quality having no-single headed arrow pointing toward it.
Endogenous constructs (customer Loyalty, customer and customer satisfaction) have at least one single-
headed arrow leading to them. Straight arrows (or single-headed arrow) indicate causal relationships or
paths, whilst the absence of arrows linking constructs implies that no causal relationship has been
hypothesized. In this case, service quality develops customer perceptions and their frequency of dining in
the hotel restaurants and these three variables all together influence customer satisfaction.
Table 7 Results of the Structural Model
Hypothesized path Standardized
Coefficients
t P Decision
H1 SQ -> CS 1.380 5.337 *** Supported
H2 SQ -> CL 2.757 11.901 *** Supported
H3 CS -> CL .699 8.391 *** Supported
According to table 7 three hypotheses H1, H2, H3, were statistically significant and in the hypothesized
direction. The standardized estimate for these hypotheses were all significant (ß =1.38, 2.757, 0.807, and
0.699 respectively). Thus, these hypotheses were supported. Moreover, the model demonstrates that one of
nine paths were not statistically significant (P<0.05). Figure 4 summarizes the results obtained for each
hypothesized path.
Figure 4: Hypothesized Structural Model
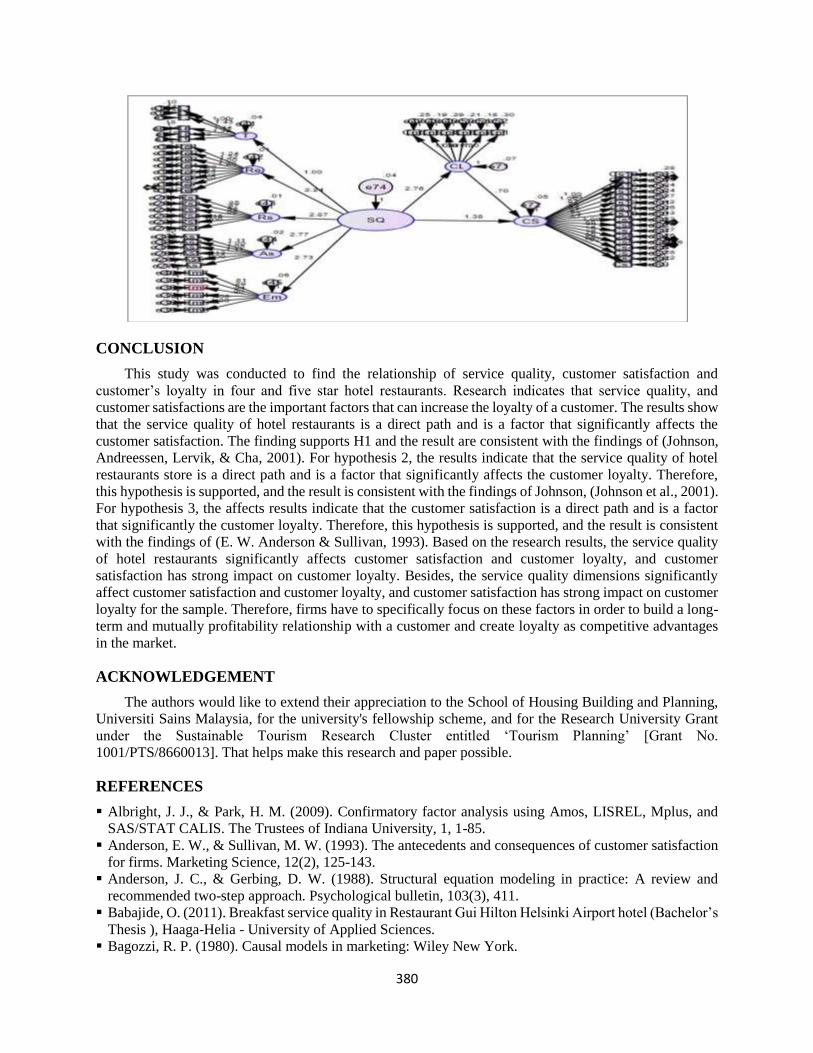
380
CONCLUSION
This study was conducted to find the relationship of service quality, customer satisfaction and
customer’s loyalty in four and five star hotel restaurants. Research indicates that service quality, and
customer satisfactions are the important factors that can increase the loyalty of a customer. The results show
that the service quality of hotel restaurants is a direct path and is a factor that significantly affects the
customer satisfaction. The finding supports H1 and the result are consistent with the findings of (Johnson,
Andreessen, Lervik, & Cha, 2001). For hypothesis 2, the results indicate that the service quality of hotel
restaurants store is a direct path and is a factor that significantly affects the customer loyalty. Therefore,
this hypothesis is supported, and the result is consistent with the findings of Johnson, (Johnson et al., 2001).
For hypothesis 3, the affects results indicate that the customer satisfaction is a direct path and is a factor
that significantly the customer loyalty. Therefore, this hypothesis is supported, and the result is consistent
with the findings of (E. W. Anderson & Sullivan, 1993). Based on the research results, the service quality
of hotel restaurants significantly affects customer satisfaction and customer loyalty, and customer
satisfaction has strong impact on customer loyalty. Besides, the service quality dimensions significantly
affect customer satisfaction and customer loyalty, and customer satisfaction has strong impact on customer
loyalty for the sample. Therefore, firms have to specifically focus on these factors in order to build a long-
term and mutually profitability relationship with a customer and create loyalty as competitive advantages
in the market.
ACKNOWLEDGEMENT
The authors would like to extend their appreciation to the School of Housing Building and Planning,
Universiti Sains Malaysia, for the university's fellowship scheme, and for the Research University Grant
under the Sustainable Tourism Research Cluster entitled ‘Tourism Planning’ [Grant No.
1001/PTS/8660013]. That helps make this research and paper possible.
REFERENCES
Albright, J. J., & Park, H. M. (2009). Confirmatory factor analysis using Amos, LISREL, Mplus, and
SAS/STAT CALIS. The Trustees of Indiana University, 1, 1-85.
Anderson, E. W., & Sullivan, M. W. (1993). The antecedents and consequences of customer satisfaction
for firms. Marketing Science, 12(2), 125-143.
Anderson, J. C., & Gerbing, D. W. (1988). Structural equation modeling in practice: A review and
recommended two-step approach. Psychological bulletin, 103(3), 411.
Babajide, O. (2011). Breakfast service quality in Restaurant Gui Hilton Helsinki Airport hotel (Bachelor’s
Thesis ), Haaga-Helia - University of Applied Sciences.
Bagozzi, R. P. (1980). Causal models in marketing: Wiley New York.

381
Bagozzi, R. P., & Yi, Y. (1988). On the evaluation of structural equation models. Journal of the academy
of marketing science, 16(1), 74-94.
Baldinger, A. L., & Rubinson, J. (1996). "Brand loyalty: the link between attitude and behaviour". Journal
of Advertising Research, 36(6), 22-34.
Barsky, J., & Nash, L. (2003). Customer satisfaction applying concepts to industry-wide measures.
Cornell Hotel and Restaurant Administration Quarterly, 44(5-6), 173-183.
Barsky, J. D., & Labagh, R. (1992). A Strategy for Customer Satisfaction. Cornell Hotel and Restaurant
Administration Quarterly, 33(5), 32-40.
Bitner, M. J., Booms, B. H., & Tetreault, M. S. (1990). The service encounter: diagnosing favorable and
unfavorable incidents. The Journal of Marketing, 54, 71-84.
Bitner, M. J., & Hubbert, A. R. (1994). Encounter satisfaction versus overall satisfaction versus quality:
the customer's voice. service quality: new directions in theory and practice. Thousand Oaks, CA: Sage(In
Rust, R.T., & Oliver, R.L. (Eds.), 72-94.
Bloemer, J. M., & Kasper, H. D. (1995). The complex relationship between consumer satisfaction and
brand loyalty. Journal of economic psychology, 16(2), 311-329.
Bowen, J. T., & Chen, S.-L. (2001). The relationship between customer loyalty and customer satisfaction.
International Journal of Contemporary Hospitality Management, 13(5), 213-217.
Brady, M. K., & Cronin Jr, J. J. (2001). Some new thoughts on conceptualizing perceived service quality:
a hierarchical approach. Journal of marketing, 65(3), 34-49.
Burns, R. B. (1997). Introduction to research methods. Australia: Addison Wesley Longman.
Byrne, R. M., & Johnson-Laird, P. (1989). Spatial reasoning. Journal of memory and language, 28(5),
564-575.
Cadotte, E. R. (1979). The Push-Button Questionnaire: A New Tool for Measuring Customer
Satisfaction. Cornell Hotel and Restaurant Administration Quarterly, 19(4), 70-79.
Caruana, A. (2002). Service loyalty: the effects of service quality and the mediating role of customer
satisfaction. European Journal of Marketing, 36(7/8), 811-828.
Colgate, M., Stewart, K., & Kinsella, R. (1996). Customer defection: a study of the student market in
Ireland. International Journal of Bank Marketing, 14(3), 23-29.
Creswell, J. W. (2013). Research design: Qualitative, quantitative, and mixed methods approaches.
United States of America: Sage publications.
Cronin, J. J., & Taylor, S. A. (1992). Measuring service quality: a re-examination and extension. Journal
of Marketing, 56(3), 55-68. .
Crosby, L. A., Evans, K. R., & Cowles, D. (1990). Relationship quality in services selling: an
interpersonal influence perspective. The Journal of Marketing, 54(3), 68-81.
Cunningham, R. M. (1956). Brand loyalty-what, where, how much. Harvard business review, 34(1), 116-
128.
De Vaus, D. A. (2002). Surveys in social research (5 ed.). Australia: Psychology Press.
Dick, A. S., & Basu, K. (1994). Customer loyalty: toward an integrated conceptual framework. Journal
of the academy of marketing science, 22(2), 99-113.
Enz, C. A. (2004). Issues of Concern for Restaurant Owners and Managers. Cornell Hotel and Restaurant
Administration Quarterly, 45(4), 315-332
Finkelman, D. P., & Goland, A. R. (1990). How not to satisfy your customers. The McKinsey Quarterly,
2(4), 2-12.
Firestone, W. A. (1987). Meaning in method: The rhetoric of quantitative and qualitative research.
Educational researcher, 16(7), 16-21.
Fornell, C., & Larcker, D. F. (1981). Evaluating structural equation models with unobservable variables
and measurement error. Journal of Marketing Research, 39-50.
Frank, R. E. (1967). Correlates of buying behavior for grocery products. The Journal of Marketing, 81,
48-53.
Gerson, R. (1993). Measuring customer satisfaction. Canada Thomson Place, Boston MA.

382
Giese, J. L., & Cote, J. A. (2000). Defining consumer satisfaction. Academy of marketing science review,
1(1), 1-22.
Gremler, D. D., & Brown, S. W. (1996). "Service Loyalty: Its Nature, Importance, and Implications," in
Advancing Service Quality: A Global Perspective, B. Edvardsson, S. W.Brown, R. Johnston, et al., eds.
New York: International Service Quality Association.
Gronroos, C. (1982). Strategic Manage ment and Marketing in the Service Sector. Helsignfors: Swedish
School of Economics and Business Adminis tration.
Grönroos, C. (1984). A service quality model and its marketing implications. European Journal of
Marketing, 18(4), 36-44.
Guest, L. (1944). Brand loyalty revisited: A twenty-year report. Journal of Applied Psychology, 48(2),
93.
Gupta, S., McLaughlin, E., & Gomez, M. (2007). Guest Satisfaction and Restaurant Performance. Cornell
Hotel and Restaurant Administration Quarterly, 48(3), 284-298.
Ha, C. L. (1998). The theory of reasoned action applied to brand loyalty. Journal of Product & Brand
Management, 7(1), 51-61.
Hair, J. F., Black, W. C., Babin, B. J., Anderson, R. E., & Tatham, R. L. (2006). Multivariate data analysis
(Vol. 6). New York: Pearson Prentice Hall Upper Saddle River, NJ.
Hayes, B. E. (2008). Measuring customer satisfaction and loyalty: survey design, use, and statistical
analysis methods. United States of America ASQ Quality Press.
Holmes-Smith, P., Coote, L., & Cunningham, E. (2006). Structural equation modeling: From the
fundamentals to advanced topics. Melbourne: SREAMS.
Holmlund, M., & Kock, S. (1996). Relationship marketing: the importance of customer-perceived service
quality in retail banking. Service Industries Journal, 16(3), 287-304.
Hooper, D., Coughlan, J., & Mullen, M. (2008). Structural equation modelling: Guidelines for
determining model fit. Articles, 2.
Hsieh, Y.-C., & Hiang, S.-T. (2004). A study of the impacts of service quality on relationship quality in
search-experience-credence services. Quality control and applied statistics, 49(6), 687-688.
Javalgı, R., & Moberg, C. (1997). Service Loyalty: Implications for Providers. The Journal of Services
Marketing, 11(3), 165-179.
Johnson, M. D., Andreessen, T. W., Lervik, L., & Cha, J. (2001). The evolution and future of national
customer satisfaction index models. Journal of Economic Psychology,
, 245, 22- 217.
Juran, J. M. (1989). Juran on leadershipfor quality: An executive handbook. New York: Wilson, CT:
Juran Institute.
Kang, G.-D., & James, J. (2004). Service quality dimensions: an examination of Grönroos’s service
quality model. Managing Service Quality, 14(4), 266-277.
Kotler, P., Bowen, J. T., & Makens, J. C. (1999). Marketing for Hospitality and Tourism, 5/e. India:
Pearson Education
Kotler, P., & Keller, K. (2011). Marketing management 14th edition. New York: Prentice Hall.
Kwortnik, R. J., & Han, X. (2011). The Influence of Guest Perceptions of Service Fairness on Lodging
Loyalty in China*. Cornell Hospitality Quarterly, 52(3), 321-332.
Lehtinen, U., & Lehtinen, J. R. (1982). Service quality: a study of quality dimensions. Finland: Service
Management Institute, Helsinki
Levesque, T. J., & McDougall, G. H. G. (1993). "Managing customer satisfaction: the nature of service
problems and customer exit, voice and loyalty” Asia Pacific Journal of Quality Management. , 2(2), 40-
58.
Liljander, V., & Strandvik, T. (1997). Emotions in service satisfaction. International journal of service
industry management, 8(2), 148-169.
Linton, I. (1993). Building customer loyalty. United Kingdom: Universities Press, Pitrnan Publishing.
Ma, E., Qu, H., Wilson, M., & Eastman, K. (2013). Modeling OCB for Hotels: Don’t Forget the
Customers. Cornell Hospitality Quarterly, 54(3), 308-317

383
Mann, P. S. (2007). Introductory statistics. New York: John Wiley & Sons.
McDougall, G. H., & Levesque, T. (2000). Customer satisfaction with services: putting perceived value
into the equation. Journal of Services Marketing, 14(5), 392-410.
Mittal, B., & Lassar, W. M. (1998). Why do customers switch? The dynamics of satisfaction versus
loyalty. Journal of Services Marketing, 12(3), 177-194.
MOTA. (2013). Tourists, Touristics nights, and length of Stay for Package Tours by Countries Groups
for the Period, Jan.- Sep. 2012- 2013. Amman, Jordan: Retrieved from
http://www.mota.gov.jo/ar/Default.aspx?tabid=120.
Mudie, P., & Cottam, A. (2010). Management and marketing of services: Routledge.
Namkung, Y., & Jang, S. (2010). Service Failures in Restaurants: Which Stage of Service Failure Is the
Most Critical? Cornell Hospitality Quarterly, 51(3), 323-343.
Oh, H. (2000). Diners' Perceptions of Quality, Value, and Satisfaction: A Practical Viewpoint. Cornell
Hotel and Restaurant Administration Quarterly, 41(3), 58-66
Oh, H., & Parks, S. C. (1997). Customer satisfaction and service quality: a critical review of the literature
and research implications for the hospitality industry. Hospitality Research Journal, 20(3), 35-64.
Oliver, R. L. (1980). A cognitive model of the antecedents and consequences of satisfaction decisions.
Journal of marketing research, 17(4), 460-469.
Oliver, R. L. (1981). Measurement and evaluation of satisfaction processes in retail settings. Journal of
Retailing, 57(3), 25.
Oliver, R. L. (1993). A conceptual model of service quality and service satisfaction: compatible goals,
different concepts. Advances in services marketing and management, 2(4), 65-85.
Oliver, R. L., & DeSarbo, W. S. (1988). Response determinants in satisfaction judgments. Journal of
consumer research, 14, 495-507.
Parasuraman, A., Berry, L., L., & Zeithaml, V. A. (1990). An Empirical Examination of Relationships in
an Extended Service Quality Model. Marketing Research, 34-44.
Parasuraman, A., Zeithaml, V., A.,, & Berry, L., L. . (1985). A Conceptual Model of Service Quality and
Its Implications for Future Research. The Journal of Marketing, 49(4), 41-50.
Parasuraman, A., Zeithaml, V. A., & Berry, L., L. (1988a). A Multiple-Item Scale for Measuring
Consumer Perceptions of Service Quality Journal of Retailing, 64(1), 12-40.
Parasuraman, A., Zeithaml, V. A., & Berry, L. L. (1985). A conceptual model of service quality and its
implications for future research. The Journal of Marketing, 41-50.
Parasuraman, A., Zeithaml, V. A., & Berry, L. L. (1988b). SERVQUAL: A multiple -Item Scale For
Mueasuring Consumer Perceptions Of Service Quality Journal of Retailing, 64(1), 5-6.
Parasuraman, A., Zeithaml, V. A., & Berry, L. L. (1994). Reassessment of expectations as a comparison
standard in measuring service quality: implications for further research. The Journal of Marketing, 58(1),
111-124.
Patterson, P. G., Johnson, L. W., & Spreng, R. A. (1996). Modeling the determinants of customer
satisfaction for business-to-business professional services. Journal of the academy of marketing science,
25(1), 4-17.
Reeves, C. A., & Bednar, D. A. (1994). Defining quality: alternatives and implications. Academy of
management review, 19(3), 419-445.
Reeves, C. A., & Bednar, D. A. (1995). Quality as symphony. The Cornell Hotel and Restaurant
Administration Quarterly, 36(3), 72-79.
Scandura, T. A., & Williams, E. A. (2000). Research methodology in management: Current practices,
trends, and implications for future research. Academy of management journal, 43(6), 1248-1264.
Skogland, I., & Siguaw, J. A. (2004). Are your satisfied customers loyal? Cornell Hotel and Restaurant
Administration Quarterly, 45(3), 221-234.
Sparks, B., Butcher, K., & Pan, G. (2007). Understanding Customer-Derived Value in the Timeshare
Industry. Cornell Hotel and Restaurant Administration Quarterly, 48(1), 28-45.
Spencer, B. A. (1994). Models of organization and total quality management: a comparison and critical
evaluation. Academy of management review, 19(3), 446-471.
384
Sulek, J. M., & Hensley, R. L. (2004). The Relative Importance of Food, Atmosphere, and Fairness of
Wait: The Case of a Full-service Restaurant. Cornell Hotel and Restaurant Administration Quarterly,
45(3), 235-247
Swimberghe, K. R., & Wooldridge, B. R. (2014 ). Drivers of Customer Relationships in Quick-Service
Restaurants: The Role of Corporate Social Responsibility. Cornell Hospitality Quarterly.
Szmigin, I., & Carrigan, M. (2001). Wherefore customer loyalty. Journal of Financial Services Marketing,
6(1), 6-8.
Teich, I. (1997). Holding on to customers: the bottom-line benefits of relationship building. Bank
Marketing, 29(2), 12-13.
Trochim, W. M., & Donnelly, J. P. (2001). Research methods knowledge base (3 ed.). United Kingdom:
Thompson Educational Publishing, Inc.
Venetis, K. A., & Ghauri, P. N. (2004). Service quality and customer retention: building long-term
relationships. European Journal of Marketing, 38(11/12), 1577-1598.
Wall, E. A., & Berry, L. L. (2007). The Combined Effects of the Physical Environment and Employee
Behavior on Customer Perception of Restaurant Service Quality. Cornell Hotel and Restaurant
Administration Quarterly, 48(1), 59-69.
Waller, K. (1996 p.152). Quality Improving Food and Beverage Performance (pp. 153-190): Oxford:
Butterworth-Heinemann.
Wirtz, J. (1993). A critical review of models in consumer satisfaction. Asian Journal of Marketing, 2(1),
7-22.
Wulf, K. D., Odekerken-Schröder, G., & Iacobucci, D. (2001). Investments in consumer relationships: a
cross-country and cross-industry exploration. Journal of marketing, 65(4), 33-50.
Yin, R. K. (2013). Case study research: Design and methods. Thousand Oaks: Sage publications.
Yüksel, A., & Rimmington, M. (1998). Customer-Satisfaction Measurement: Performance Counts.
Cornell Hotel and Restaurant Administration Quarterly, December, 39(6), 60-70.
Zeithaml, V. A. (1988). Consumer perceptions of price, quality, and value: a means-end model and
synthesis of evidence. The Journal of Marketing, 52, 2-22.
Zeithaml, V. A., Berry, L. L., & Parasuraman, A. (1996). The behavioral consequences of service quality.
The Journal of Marketing, 60, 31-46.
Zeithaml, V. A., Bitner, M. J., & Gremler, D. D. (2009). Services Marketing Integrating Customer Focus
Across the Firm New York: McGraw-Hill. Zemke
Zeithaml, V. A., Parasuraman, A., & Berry, L. L. (1990). Delivering quality service: Balancing customer
perceptions and expectations. United States of America: Free Press - Simon Schuster, Old Tappan, New
Jersey.

385
Arabia versus Persia: Is this what the Arab Spring
ended with?
Saad Ghaleb Yasseen Saeb Farhan Al Ganideh
Al Zaytoonah University of Jordan Al Zaytoonah University of Jordan
Jordan Jordan
Abstract:
The sectarian violence in the Middle East has changed the face of the Arab Uprisings and has extended
violence between Sunni and Shiite Muslims to a wider scale. The current investigation explores economic
and social implications of the Sunni-Shiite Muslim tension and competition to control the Middle East. The
study aims to examine the influence of demographic and socio-physiological variables on feelings of
animosity Arabs express toward Iran and purchasing its products. The research design is quantitative. Data
were collected from 108 Arab Sunni Muslim Jordanians who live in the capital of Jordan, Amman and the
northern Irbid city over a period of 4 weeks, June, 2014. The results showed that younger Jordanians and
Jordanians who express high level of internationalism hold less feelings of animosity against Iran than their
other counterparts. Also, it was found that Jordanians’ feelings of animosity against Iran has been translated
into unwillingness to purchase Iranian products. Limitations of this research overall are related to
employing a convenience sample and the relatively small sample size. Feelings of animosity Arab express
toward Iran are not alarmingly high, nonetheless, such negative feelings should not be ignored by neither
Iranian global marketers nor by Arab local marketers. To the best of the author’s knowledge, there is a
death of studies that explored the social and business implications of the current Arab Spring events.
Keywords: Animosity; ethnic conflict; Arabs, internationalism; group threat; Arab Spring; Iran; Sunni;
Shiite.
1 Introduction
International economic, political, social and military disputes make it much more complex for
marketers to go global. In fact, current global context, which includes civil wars, regime change,
and military conflicts, presents a real challenge for international business (Nes et al., 2012).
Globalization, competitiveness and technology have increased the varieties of products available
in global markets, and thus, led more individuals all over the world to be more familiar with more
foreign products and brands (Nijssen and Douglas, 2004). In addition to the diversity in culture,
dynamic business environment adds to the complexity of going global (Wang and Heitmeyer,
2006). Researchers have paid good attention to how political actions, diplomatic crises, armed
conflicts may impact demand for products sourced from offending countries (Nes et al., 2012).
Global marketing managers from offending countries should carefully position their products with
respect to local consumers’ expectations (Parker et al., 2011).
Understanding consumers’ buying behavior in times of financial crisis, political conflicts,
military events and social unrest is vital to global marketers to develop effective marketing
strategies during such tough times (Good and Huddleston, 1995). Despite the Arab Spring
Uprisings have started as movements for more equity, democracy, transparency, and better quality
of life, things have not ended up in the same domain. Ethnic, sectarian, historical and economic
386
dispute between Saudi Arabia and Iran have changed the face of the Arab Spring to a more of
sectarian war between Sunni-Shiite Muslims. The sectarian conflict between the two regional
powers can be seen clearly in Syria, Bahrain, Iraq, and Yemen. Future uncertainty caused by the
Arab Spring events adds to the young generation frustration in Arab countries including Jordan.
Indeed, the Arab Spring harmed the economies of Middle East countries and that resulted in more
poverty, unemployment, and insecurity within the whole Middle East (Al Ganideh and Good,
2015). The Arab Spring started as a young-people revolution for more dignity, freedom,
democracy, and transparency in the whole Arab world (Ali, 2014). According to Helfont and
Helfont (2012) the Arab Uprising reshaped and transformed international relations among the
Middle East countries. In the beginning, the Arab Spring represents an attempt by young Arabs to
improve their social and political systems by replacing dictatorships with democratic regimes.
Nonetheless, sectarian dispute between Arab Sunni countries and Shaite Iran dominated the events
of the Arab Spring (Guzansky and Berti, 2014).
Combining religion and politics is an issue that provokes continued debates in new Arab
political systems (Ali, 2014). Rivalry between Saudi Arabia and Iran has motivated both countries
to expand their regional influence and to establish regional domination (Guzansky and Berti,
2014). Long standing and historical ethnic, sectarian and religious conflicts between Arabs and
Persians, influenced their views towards each other as it can be understood from various press
reports.
Iran felt threatened by the growing power of Sunni Islamic parties and militias in traditional
Arab Sunni powers such as Egypt, Syria, Libya and Tunisia (Helfont and Helfont, 2012). Through
the current events of the Arab Uprising Iran seeks “to expand its regional influence and to establish
regional hegemony, relies on both its historic partner, Hezbollah, as well as on the Alawite regime
in Syria to support its foreign policy and (resistance) agenda” (Guzansky and Berti, 2014, p.137).
Yet, the absence of a good model for Arab countries regarding how to develop a successful
relationship between politics and religion in Arab Spring countries has made combining the two a
very complex job for new democracies (Ali, 2014). Nonetheless, there is a dearth in academic
research when it comes to studying economic and social consequences of the current Arab Spring
events on Arabs and Persians. The current study aims to explore the economic and social
implications of the Arab/Sunni –Persian/Shiite tension which has become recently one of the main
Arab Spring features. More specifically, this paper examines feeling of animosity (if any) Sunni
Arabs might hold toward Iran and whether such feelings of animosity will be translated into
unwillingness to purchase products sourced from Iran. Furthermore, the study aims to examine the
influence of demographics (age, gender, and income) and socio-physiological variables
(nationalism, patriotism, and internationalism) on feelings of animosity (if any) Sunni Arabs hold
toward Iran.
2 Theoretical Background
2.1 Arabs and Persians in the Shadow of the Arab Spring: Then and now
The Arab Spring events started in Tunisia in January 2011 shocked the globe, scared non-
democratic countries all over the world, including the Middle East and North Africa countries, and
reminded the globe with the revolutions of 1848 which looks, somehow, similar to the Arab
Uprisings (Weyland, 2012). Arab Spring revolutions were fueled by extreme poverty and high
unemployment between young educated people which led to tremendous economic injustice for
young Arabs who felt little hope for social and economic mobility (Malik and Awadallah, 2013).

387
According to Costello et al. (2015), Arab uprising protests engulfed the Arab World due to the
absence of economic, justice and political opportunities for young Arab generations. The economic
failure for Arab Spring countries could be attributed to the weak trade relationships between the
Arab countries, the high dependence on public sector, the absence of a vibrant private sector, the
dangerous dearth of manufacturing, and the clear failure of both of the education system and the
economic structure (Malik and Awadallah, 2013). The big gap between young Arabs’
socioeconomic aspirations and real life, redistribution of income and wealth and high degree of
authoritarianism of political economies push them out to streets to ask for regime change (Rougie,
2016). In addition, the sharp price increases in basic commodities and growing economic
inequality also contributed to the Arab Spring (Costello et al., 2015). In fact, Arab Education
systems do not match Arab economic needs which cause many young Arabs’ chances to get jobs
are minimal. Young Arabs people are not only unemployed, but also they are unemployable due
to the failing of education systems (Malik and Awadallah, 2013). Many segments of the poor
Arabs played central parts in Arab Uprisings and the natural connection between poor Arabs and
religion (Islam) paved the way for Islamic parties to dominate the Arab Spring events ( Bayat,
2015). Furthermore, Arab countries’ system suffered a failing social contract between
governments and governed” (Parasiliti, 2003, p.152).
Since, Iran's Islamic Revolution in 1979, Iran's connections with militant Muslim
organizations were used “as evidence of its interfering in their internal affairs and of fomenting
instability. This in turn has enabled them to justify a policy of pressuring Iran and of isolating it
diplomatically” (Hunter, 1988, p.730). Despite Islamic unity was one of the main principles of the
Iranian Islamic revolution ethnicity, sectarianism and Arab-Persian competition motivated Islamic
Republic opponents to manipulate Iran’s image all over the World, including Islamic countries
(Hunter, 1988). Recently, according to Chomsky (2006), Iran’s interference in Iraq and in East of
Saudi Arabia triggers problems between the Islamic Republic and the Arab Countries, including
Saudi Arabia. Also, ambitions to control most of the world oil was not something that the U.S.A
government fancies. Iran is the only Islamic Shiate country where the majority of Iranians adhere
to Twelver Shiism, thus, Shiism is the official country’s religion (Hunter, 1988). The strong appeal
by Iranians to Shiites’ symbols has been used as a propaganda of Sunni Arab countries toward Iran
(Hunter, 1988). The historical alliance between the Lebanese Twelver Shiites and Syrian Alawis
regime has not only contributed to the rise of the political and military power of the Shiite
community but also to the decline of the Sunni-Shiite relationship and the increase of the Sectarian
dispute between the Arabs and Iran (AbuKhalil, 1990). Iraq-Iran war contributed to the Arab-
Iranian dispute particularly as Saddam Hussein presented himself and his country during the eight
year war as the defenders of the Arab nation (Parasiliti, 2003).
There is a dearth of research about the influence of sectarianism on politics within the Middle
East and North Africa countries, in the shadow of the Arab spring, where sectarianism seems to shape
the current Arab Spring events particularly with the escalating disputes between Sunni Arab
countries leaded by Saudi Arabia and Iran. The two regional power radical differences regarding
the Arab Spring events in Syria, Yemen, Bahrain, and Iraq dominate the Arab Spring Uprisings.
The relationship between sectarianism and American politics gained good attention from political
science and religious studies who debated about the decline in sectarianism in societies (i.e. Evans,
2006; Bruce, 2000; Hunter, 1991; Steensland et al., 2000; O'Toole, 1976). According to Evans
(2006) “Theory in the sociology of religion suggests that a prerequisite for cooperative coalitions
among religious groups on political matters is a decline in sectarianism” p.195.

388
2.2 Ethnic conflicts
According to, Hewitt (1977), “ethnic group is one whose members differ from members of
other groups with regard to one or more ascriptive characteristics (race, language, or religion) and
whose members typically feel solidarity with other members of their group and different from
members of other groups ” p. 151. Ethnicity is a cultural phenomenon which can be defined as a
collective identity and solidarity whereby individuals perceive themselves as a one group sharing
same physical features such as skin, color, and racial characteristics (Amanolahi, 2005). Religion
and language are of the most important factors that shape ethnic identity (Amanolahi, 2005).
Despite multiculturalism existed for thousands of years, pre-modern societies’ conflicts were not
viewed as mainly ethnic (Riggs, 1998). Through the history, rivalry between rulers and tribes were
understood in non-ethnic terms and even slavery was not related to ethnic identity and slaves
mainly called more humane treatment (Riggs, 1998).
Ethnic violence is defined as violence between groups drawn from different ethnic
communities or violence over any issue that affects the situation of one ethnic community relative
to the other (Hewitt, 1977). Earlier, Bates (1993) connected ethnic conflicts to competing over
scarce resources and concluded favoritism of own ethnic group when it comes to resources’
allocation. According to Sadowski (1998), most of ethnic conflicts are related to either to religious
or tribal rivalries and such conflicts are much more savage and genocide that traditional wars
(Sadowski, 1998). Esteban and Ray (2011) developed a religious/ethnic model where social
intolerance and discrimination against out-group could be the response for ethnic activism and
violence. Ethnic conflicts are less likely to occur in developed and more economically globalized
countries (Sadowski, 1998). Fanaticism increase ethnic violence and makes it harder to be
eliminated (Sadowski, 1998). Generally, there is a strong linkage between political competition and ethnic identification as
ethnic identities could be used as a tool to access to political power (Eifert et al., 2010). Rival
ethnicities can compete politically, economically or militarily to achieve their own interests
(Caselli and Coleman, 2013). Patrimonialism and political familism lead could explain many of
ethnic and religious conflicts all over the world including Arab countries where Patrimonialism
and political familism are blamed for the backwardness of most Arab countries and their lacks of
democracy and human rights (Joseph, 2011). Religious and ethnic minorities have suffered from
systematic discrimination in Middle East countries such as Iran and Sudan (Lybarger, 2007).
Many scholars studied the recent global ethnic conflicts in Rwanda, Sri Lanka, Lebanon,
Bosnia and Kosovo to understand what led to such horrifying ethnic conflicts which took millions
of people's lives (i.e. Hewitt, 1977; Maynes, 1993; Riggs, 1998; Khosla, 1999; Swee, 2014;
Sadowski, 1998). Martin (1999) linked ethnic conflicts to countries that share long border and to
areas where poverty is high and resources are scarce. Earlier, Hewitt (1977) indicated that despite
conflict between different ethnic groups occurs in many societies, its brutality differs between
societies, such as Lebanon where ethnic conflict had taken lives and in other societies, such as
Switzerland where conflict diminished with years”. According to Swee (2014), Bosnia was a very
ethnically diverse former Yugoslav republic and interethnic relations, over years, between
Bosniaks, Serbs and Croats were harmonious under the Yugoslav regime which enforced its people
to be only nationally-centered. Nonetheless, ethnic violence spread all over the country during the
Bosnian War in 1992 where about 100,000 people had been killed (Swee, 2014). According to
Caselli and Coleman (2013) ethnicity’s salience differs based on both time and place. For example,
ethnicity’s salience is not constant over the time as communities give priority to ethnic identities
from time to time and sometimes ethnicity is given no importance at all (Caselli and Coleman,

389
2013). High level of ethnic diversity increases the risk of civil war while ethnic diversity decreases
the risk of ethnic conflict, and interestingly the risk of ethnic conflict is low when societies are
either very homogenous or very diverse (Tangerås and Lagerlöf, 2009). Ethnic conflicts have not
increased post to the cold war period neither as a result due to the global power intervention and,
contrary to expectations, over one-half ethnic conflicts happened due to regional power
interventions (Khosla, 1999). Against to this notion, Riggs (1998) maintained international
interventions increased ethnic conflicts which have become a global concern, and claims that
multiculturalism and current modernization might decrease inter-group tension, civil wars, ethnic
nationalism, and genocide proved not true (Riggs, 1998).
The connection between ethnic feelings and the concept of ethnocentrism is solid as
ethnocentrism is conceived as a sociological concept and a philosophy that clarifies the
relationships between in-group and out-group (Adorno et al., 1950; Hammond and Axelrod, 2006;
Shimp, 2004; Sumner, 1906). Earlier in 1906, Sumner conceptualized ethnocentrism as "View of
things in which one’s own group is the center of everything, and all others are scaled and rated
with reference to it; each group nourishes its own pride and vanity, boasts itself superior, exalts its
own divinities, and looks with contempt on outsiders" (1906,p.13). The concept of ethnocentrism
entails strong in-group sentiments besides strong out-group sentiments as out groups are perceived
as inferior and in-groups are perceived as superior (Chang and Ritter, 1976; Navarrete and Fessler,
2006; Shimp, 1984).
Hutchinson and Smith (1996) p.5 indicated that “Ethnocentrism is often used in social
psychology on an individual or interpersonal level as a synonym for disdain of the stranger. But it
can also have a collective historical referent, as the sense of uniqueness, centrality, and virtue of
an ethnie in its relations with other ethnicities”.
Ethnocentric tendencies leads individuals to conceive their own ethnic group as the center of
the universe, and it entails wide range of anti-group behaviors towards other ethnicities (Levine
and Campbell, 1972). Adorno et al. (1950) argued that ethnocentrism is an ideological system
distinguished between in-groups (individuals belong to and identify with) and out-groups
(antithetical to the in-groups where individuals do not express sense of belonging to) whereby
individuals blindly reject out-groups' individuals, cultures and values. Levine and Campbell (1972)
understood the concept of ethnocentrism as a parallel concept to egocentrism ideology as it scales
one's own group cultural values to other groups' cultural values and ideologies. The concept of
ethnocentrism could give a good understanding of how animosities might arise between different
nations and ethnicities.
2.3 Animosity
Animosity is a strong emotion coming up due to previous or ongoing military, political, or
economic events (Ang et al., 2004; Klein et al., 1998; Lee et al., 2003). Feelings of animosity
towards other nations can be as an outcome of a territorial dispute such as India-Pakistan dispute
over Kashmir area (Riefler and Diamantopoulos, 2007); previous military event or war such as
China-Japan dispute as a result of The Second Sino-Japanese War (Klein et al., 1998); diplomatic
dispute such as Australia-France dispute as a result of 1995–96 French nuclear tests (Ettenson and
Klein, 2005); feelings of economic animosity which grow as a results of feelings of economic
dominance or control such as Asian countries and the U.S.A during the 1997 Asian financial crisis
(Ang et al., 2004). Religious animosity, results from lack of respect and understanding of other
people's beliefs, feelings of animosity between different Lebanese groups is a good example for
such type of animosity (Kisirwani, 1980). Ethnic animosity results from holding negative feelings

390
towards other ethnicities and the Greek-Turks ethnic conflict is a good example in this case (Nakos
and Hajidimitriou, 2007). Feelings of animosity can be exist even within the same country, and
such feelings could be a result of long standing local ethnic dispute (the case of former
Yugoslavia), local religious clash (the case of Muslims and Christians in Lebanon), linguistic
based-dispute (the case of Belgium), dispute over independence (the case of Catalonia-Spain),
feelings of animosity toward immigrants (German nationalist and immigrants) (i.e. Connolly,
2013; Kisirwani, 1980; Moufakkir, 2014; Pilet, 2005; Nakos and Hajidimitriou, 2007; Dauncey
and Morrey, 2008; Peñaloza, 1995). Feelings of animosity can be either a stable or situational
animosity whereas stable animosity is related to emotions arising towards an “enemy” country due
to historical long-standing conflict, and situational animosity refers to feelings of animosity which
results due to a current circumstance. Nonetheless, animosity toward a particular offender country
cannot easily be eliminated (Fong et al., 2013). Reputation and trust have a central role in
decreasing individuals’ negative emotions, such as animosity, toward offending countries
(Jiménez and San Martín, 2010).
Researchers in sociology, business and political science applied the concept of animosity to
consumer behavior to better understand why individuals buy or do not products sourced from an
“enemy” country (Moufakkir, 2014). Animosity towards a current or former enemy influences
willingness to buy products sourced from that country (Klein et al., 1998; Parker et al., 2011).
Research studied extensively the relationship between animosity and willingness to purchase
products sourced from an offending country (Klein et al., 1998; Nijssen and Dauglas, 2004; Ang
et al., 2004; Ettenson and Klein, 2005). A number of researchers confirmed the relationship
between feelings of animosity and product ownership (i.e. Klein et al., 1998; Klein, 2002; Bahaee,
and Pisani, 2009; Nes et al., 2012; Shoham et al., 2006). Demographics were found to predict
feelings of animosity (Al Ganideh and Elahee, 2014; Al Ganideh, 2008; Bahaee and Pisani, 2009).
Feelings of animosity influences consumers purchase decisions independently of product
judgments (Klein, 2002; Klein et al., 1998). Individuals with high animosity feelings toward a
specific country may realize that its products are high quality products. Generally, consumers do
not denigrate the quality of products of the country they do not like and animosity influences
consumers purchase decisions independently of product judgments (Klein, 2002; Klein et al.,
1998).
Indeed, the U.S.A and Japan have dominated the animosity literature as offender countries.
Animosity researchers focused mainly on exploring feelings of animosity toward the two countries
due to their past military and economic controversial history. The U.S.A has been examined as an
offender country in many studies (i.e. Ishii, 2009; Parker et al., 2011; Little et al., 2009; Bahaee
and Pisani, 2009; Nes et al., 2012; Al Ganideh and Elahee, 2014). Many researchers have explored
animosity toward Japan (i.e. Klein et al., 1998; Shin, 2001; Klein, 2002; Ang et al., 2004; Leong
et al., 2008). Germany has been employed as an offender country by a number of researchers (i.e.
Nijssen and Dauglas, 2004). France also has been used as an offender country (i.e. Ettenson and
Klein, 2005; Chan et al., 2010). Events such as World War II, Asian economic crisis, historical
ethnic events have dominated animosity literature as events that arise animosity (i.e. Klein et al.,
1998; Shin, 2001; Klein, 2002; Nijssen and Dauglas, 2004; Ang et al., 2004; Smith and Qianpin,
2010; Ang et al., 2004; Kesic et al., 2005; Leong et al., 2008).
Nationalism, patriotism and internationalism were found to have a direct effect on animosity,
which in turn predicts purchase behavior and willingness to buy products sourced from aggressor
country (Shoham et al., 2006; Ishii, 2009; Guido et al., 2010). Nationalism is commitment and
readiness to sacrifice for the nation bolstered by animosity toward other ethnic groups (Druckman,

391
1994). Generally, nationalists score high on love of country and also score high on hostility
towards foreigners and other nations (Kosterman and Feshbach, 1989). Nationalistic individuals
express more aggressive feelings toward other ethnic groups and countries than are less
nationalistic individuals (Druckman, 1994). “Nationalism stresses the cultural similarity of its
adherents and, by implication, it draws boundaries vis-à-vis others, who thereby become outsiders”
(Eriksen, 1996, p.30). Nationalism has significant effects on attitudes towards other countries and
towards purchasing local and global products (Rawwas et al., 1996). Nationalism offers a form of
representation the joining of state, territoriality and culture (Friedland, 2001, p.138). Individuals
differ in their level of national attitude (Dekker et al., 2003). Nationalism focuses on national
superiority and on downward comparisons to other nations (Lee et al., 2003). Patriotism refers to
“Loyalty to the civic group to which one belongs by birth or the other group bond. It is a sentiment
of fellowship and cooperation in all hopes, works, and suffering of the group” (Sumner, 1906,
p.15). Patriotism is a solid commitment and ready determination to sacrifice for the nation
(Druckman, 1994). Patriotism is related to level of love and pride in one’s nation and the degree
of attachment and commitment to one’s own country (Lee et al., 2003). High patriotic feelings
influence individuals’ economic behavior and motivate them to buy only products made in their
countries and to avoid purchasing foreign products (Balabanis et al., 2001). Internationalism
reflects “Interest in ganging knowledge about international affairs and other countries and nations”
(Sampson and Smith, 1957, p.99). In fact, internationalism refers to “emotional support for
international sharing and welfare, and empathy for the people of other countries’ (Lee et al., 2003,
p.492). Internationalism entails preference for international support, cooperation and unity
(Karasawa, 2002). Overall, internationalists may score low in hostility (Kosterman and Feshbach,
1989).
This study contributes to knowledge by exploring the Arabs’ feelings of animosity towards
Iran in the shadow of the Arab Spring. In addition, it explores which segments of Arabs express
higher animosity towards Iran and how feelings of animosity Arab express towards Iran differs
based on their nationalistic or internationalist feelings.
3 Methodology
Jordan is a suitable context for the current investigation as the country, compared to other
Arab countries, enjoyed good stability (Helfont and Helfont, 2012). Jordan is an excellent
representative of other Arab countries in terms of ethnicity as almost all Jordanians are Arabs and
Sunni Muslims. The current investigation aims to study one of central aspects regarding the Arab
Spring current events; Arab-Iranian relationships from the perspective of normal Arab people.
3.1 Measures
Data were collected from Jordanian nationals from the two largest cities in the country, namely
Amman (the capital of the country) and Irbid (the largest northern city) over a period of 4 weeks,
June, 2014. Surveys were collected from shopping malls from the two cities. A female facilitator
(senior undergraduate business student) advised shoppers at food courts at these malls if they
would like to participate in the study. Data were collected from subjects who agreed to participate.
The total number of usable surveys was 108 out of 121 collected surveys. The used measures for
the current study were translated into Arabic language by two researchers (PhD holders) who are
fluent in English and Arabic in focus group style meetings. Indeed, the researchers discussed and
translated the items one by one. The final version of the survey is the one that the researchers

392
agreed on. The subjects were asked questions regarding to their gender, age, income, education,
and geographic location.
Feeling of Animosity
To measure Jordanians’ feelings of animosity toward Iran, four items (5-point Likert scale)
were used (i.e. I feel angry toward Iran). The scale developed originally by Klein et al. (1998).
Willingness to purchase products
Four items (5-point Likert scale) used and modified by Klein et al. (1998) originally from
Wood and Darling 1993) (i.e, I would feel guilty if I bought an Iranian product). The higher the
score, the more unwilling the subject was to purchase products from a country.
Nationalism
Five items (5-point Likert scale) adopted from Kosterman and Feshbach (1989) were used to
measure Jordanians’ level of nationalism (i.e. the first duty of every young Jordanian is to honour
the national Jordanian history and heritage).
Patriotism
Jordanians’ patriotism level was measure using five items (5-point Likert scale) developed
originally by Kosterman and Feshbach (1989). (i.e. I love my country).
Internationalism
To measure Jordanians’ internationalism, subjects were asked to answer five items (5-point
Likert scale) adopted from Kosterman and Feshbach (1989) (i.e. the alleviation of poverty in other
countries is their problem, not ours).
3.2 Participants
Approximately 65.7% of the subjects were males. Regarding the age of respondents, about
60% of them were between 18 and 25 years of age, 13.0% of the subjects were between the age of
26 and 35, and 14.8% were between the age of 36 and 46. Only 5% of the subjects were above the
age of 46. The majority of the respondents (53.7%) were residents of Amman city, while 40.7%
of them were residents of northern Irbid city. About 85% of the subjects hold a bachelor degree
and almost 10% had a high school certificate. The results showed that 12.0% of the subjects had
household monthly incomes less than 350 JD (US$ 490), 42.6 % of them had household monthly
income between 350-800 JD (US$ 490-1120), 16.7% household incomes of subjects were between
800-1200 JD (US$1120-1680), and only 16.7% incomes of them were more than 1200JD (US$
1680).
4 Data analysis and conclusions
This study examines feeling of hostility (if any) Sunni Arab Jordanians hold toward Iran. In
addition, it explores the influence that feelings of animosity (if any) might have on Jordanians’
willingness to purchase products made in Iran. Moreover, the study aims to examine the influence
of demographics (gender, age, income) and socio-physiological variables (nationalism, patriotism
and internationalism) on feelings of animosity Jordanians hold toward Iran. Table 1 shows the
correlation of the used measures in the study. It is clear that Cronbach's alphas for the five scales
were above 0.68 which suggested a reasonably good reliability and consistent with previously
reported coefficients about these scales.

393
Table 1
Correlation matrix of the used measures
Measure α 1 2 3 4 5
1. Animosity towards Iran 0.96 1.00
2. Willingness to purchase Iranian Products 0.84 0.76** 1.00
3. Nationalism 0.68 0.07 0.03 1.00
4. Patriotism 0.93 0.17 0.14 0.58** 1.00
5. Internationalism 0.88 -0.24* -0.23* 0.29** 0.29** 1.00
Notes. * P < 0.05 (2-tailed). **P< 0.01 level (2-tailed)
Table 2 shows that almost half of Jordanians express negative feeling toward Iran and will not
forgive it for its role in the Arab Spring current events. Approximately 40% of subjects do not like
to see Iran wins in sports competition and feel angry towards their Muslim neighboring country.
Less than third of Jordanians avoid purchasing Iranian products and will never buy a product made
in Iran.
Table 2
Jordanians’ animosity toward Iran and willingness to purchase Iranian products
Item Mean SD Agree Neutral Disagree
I dislike Iran 3.45 1.37 48.2% 27.8% 22.3%
I do not like to see Iranian teams winning in
sports competition
3.30 1.38 37.9% 37.0% 23.1%
I feel angry toward the Iranians 3.42 1.32 40.8% 38.0% 19.4%
I will never forgive Iran for its role in the
Arab Spring
3.58 1.31 49.1% 32.4% 16.7%
I would feel guilty if I bought an Iranian
product
3.06 1.31 29.7% 38.0% 29.6%
When possible, I avoid buying Iranian
products
3.09 1.35 30.5% 36.1% 30.5%
Whenever available, I would prefer to buy
products made in Iran
3.46 1.20 15.7% 38.0% 44.4%
I would never buy an Iranian product 2.92 1.30 26.0% 36.1% 36.1%
A hierarchal regression technique was conducted to explore the joint influence of Jordanians’
nationalism, patriotism, and internationalism levels on their feelings of animosity toward Iran over
and above that accounted for by the demographic variables namely, age, gender and income. In
this used statistical technique, predictors were entered in two blocks with demographics entered
first to provide a baseline for the model and then nationalism, patriotism, and internationalism
were entered in the second block. The two models proved to be statistically significant based on
the results of ANOVA test. The results (Table 3) show that demographic variables explain 12.4%
of Jordanians’ animosity toward Iran and the addition of nationalism, patriotism, and
internationalism increases R2 by 11.6%. Internationalism has the strongest statistical significant
influence on Jordanians’ feelings of animosity toward Iran with ß= -0.34. Jordanians’ with high
internationalism feelings showed less feelings of animosity toward Iran. Age was the second
strongest predictor for animosity Jordanians hold toward Iran with ß=0.28. The older Jordanians,
the more feelings of animosity showed toward Iran. Income, gender, nationalism, and patriotism
do not influence statistically feelings of animosity Jordanians express toward Iran. Table 3
Regression on feelings of animosity toward Iran
Predictors β Sig.
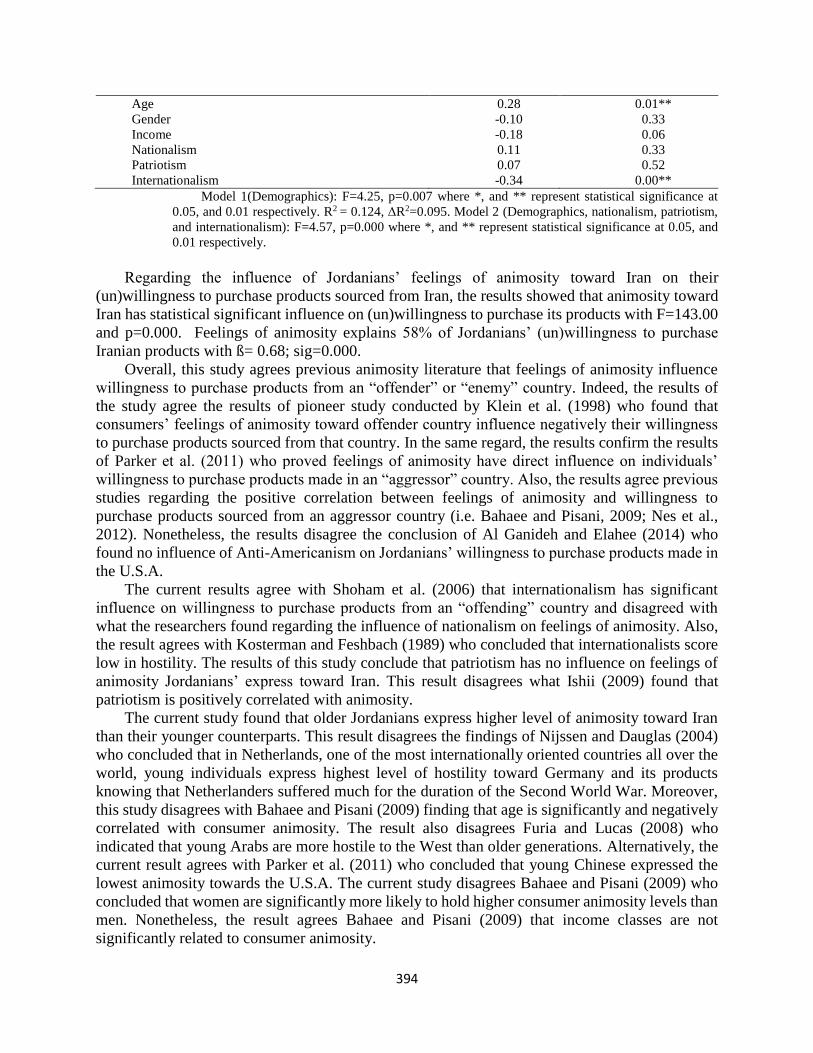
394
Age 0.28 0.01**
Gender -0.10 0.33
Income -0.18 0.06
Nationalism 0.11 0.33
Patriotism 0.07 0.52
Internationalism -0.34 0.00**
Model 1(Demographics): F=4.25, p=0.007 where *, and ** represent statistical significance at
0.05, and 0.01 respectively. R2 = 0.124, ΔR2=0.095. Model 2 (Demographics, nationalism, patriotism,
and internationalism): F=4.57, p=0.000 where *, and ** represent statistical significance at 0.05, and
0.01 respectively.
Regarding the influence of Jordanians’ feelings of animosity toward Iran on their
(un)willingness to purchase products sourced from Iran, the results showed that animosity toward
Iran has statistical significant influence on (un)willingness to purchase its products with F=143.00
and p=0.000. Feelings of animosity explains 58% of Jordanians’ (un)willingness to purchase
Iranian products with ß= 0.68; sig=0.000.
Overall, this study agrees previous animosity literature that feelings of animosity influence
willingness to purchase products from an “offender” or “enemy” country. Indeed, the results of
the study agree the results of pioneer study conducted by Klein et al. (1998) who found that
consumers’ feelings of animosity toward offender country influence negatively their willingness
to purchase products sourced from that country. In the same regard, the results confirm the results
of Parker et al. (2011) who proved feelings of animosity have direct influence on individuals’
willingness to purchase products made in an “aggressor” country. Also, the results agree previous
studies regarding the positive correlation between feelings of animosity and willingness to
purchase products sourced from an aggressor country (i.e. Bahaee and Pisani, 2009; Nes et al.,
2012). Nonetheless, the results disagree the conclusion of Al Ganideh and Elahee (2014) who
found no influence of Anti-Americanism on Jordanians’ willingness to purchase products made in
the U.S.A.
The current results agree with Shoham et al. (2006) that internationalism has significant
influence on willingness to purchase products from an “offending” country and disagreed with
what the researchers found regarding the influence of nationalism on feelings of animosity. Also,
the result agrees with Kosterman and Feshbach (1989) who concluded that internationalists score
low in hostility. The results of this study conclude that patriotism has no influence on feelings of
animosity Jordanians’ express toward Iran. This result disagrees what Ishii (2009) found that
patriotism is positively correlated with animosity.
The current study found that older Jordanians express higher level of animosity toward Iran
than their younger counterparts. This result disagrees the findings of Nijssen and Dauglas (2004)
who concluded that in Netherlands, one of the most internationally oriented countries all over the
world, young individuals express highest level of hostility toward Germany and its products
knowing that Netherlanders suffered much for the duration of the Second World War. Moreover,
this study disagrees with Bahaee and Pisani (2009) finding that age is significantly and negatively
correlated with consumer animosity. The result also disagrees Furia and Lucas (2008) who
indicated that young Arabs are more hostile to the West than older generations. Alternatively, the
current result agrees with Parker et al. (2011) who concluded that young Chinese expressed the
lowest animosity towards the U.S.A. The current study disagrees Bahaee and Pisani (2009) who
concluded that women are significantly more likely to hold higher consumer animosity levels than
men. Nonetheless, the result agrees Bahaee and Pisani (2009) that income classes are not
significantly related to consumer animosity.

395
Feelings of animosity Jordanians express toward Iran should not be ignored by neither Iranian
global marketers nor by Arab local marketers. Nonetheless, international Iranian marketers who
target Arab countries should realize that Arab Spring implications might influence negatively the
chances of selling their products in Arab markets. On the other hand, Arab marketers who compete
Iranians should build on this issue and highlight the Iranian country-of-origin of their competitors
and their products. It is vital for Iranian international marketers who target Arab countries to be
aware of the importance of modification their marketing and communications strategies in way
that decrease the influence of animosity Jordanians expressed toward Iran. A possible approach to
overcome feelings of animosity Arab consumers showed toward Iran could be by focusing more
on internationalism connections to their products and not to highlight its Iranian country-of-origin.
Moreover, any promotional campaign should produce a better outcome by targeting young
consumers as they showed less feelings of animosity toward Iran than their older counterparts did.
Using marketing communications that focus on national Jordanian or Arabian or Islamic symbols
might encourage locals to be more positive towards products sourced from Iran. Indeed,
advertising can be used to boost or reduce the influence of consumer animosity has on willingness
to purchase products originating from an offender country. International Iranian marketers are
much recommended to develop marketing communications that suit consumer sentiments in
Jordan. The main focus of Iranian marketing managers should be driven away from their product’s
country-of-origin and should focus more on product quality and features.
Overall, the results of this research may not be generalizable to all individuals in Jordan and
other Arab countries due to employing a convenience sample and the relatively small sample size.
Future research needs to be extended to other categories in Jordanian society and other Arab
countries, particularly to rich Arab Gulf States. One interesting thing will be the duplication of this
research objectives from Iraqi perspective. Iraq seems to be a suitable context for exploring the
main notion of this research. Examining feelings of animosity (if any) in Iraq’s three main areas
(Kurdistan- north of Iraq; Sunni provinces north and center of the country; and the Shiite provinces
in the south and center in Iraq) will be interesting and will provide researchers and politicians by
important information about how Arabs, Kurds, Sunni, and Shiite perceive Iran and its policies.
References
AbuKhalil, A. (1990). ‘Syria and the Shiites: Al-Asad's policy in Lebanon’ Third World Quarterly, Vol.12 No. 2,
pp. 1-20.
Adorno, T. W., Frenkel-Brunswik, E., Levinson, D. J., and Sanford, R. N. (1950). ‘The authoritarian personality’,
New York: Harper and Row Publishers.
Al Ganideh, S. F. (2008). ‘An investigation into consumer animosity amongst young educated
Jordanians’, International Journal of Management Cases, Vol.10 No.3, pp.638-650.
Al Ganideh, S. F. and Elahee, M. N. (2010). ‘Arab Spring and Jordanian Consumers' Animosity Toward Foreign
Products: What Managers Need to Know?’, Journal of Comparative International Management, Vol. 15 No.1, pp.
86-102.
Al Ganideh, S. F. and Elahee, M. N. (2014). ‘Understanding Anti- Americanism among Arab consumers: The case
of Jordan’, Journal of Competitiveness Studies, Vol.22 No.1/2, pp. 71-87.
Al Ganideh, S. F. and Good, L. K. (2015). ‘Understanding abusive child labor practices in the shadow of the Arab
spring’, Journal of Children’s Services, Vol.10 No.1, pp. 76-91.
Ali, T. M. (2014). ‘Post-political Transitions in Arab Spring Countries: The Challenges’, Procedia-Social and
Behavioral Sciences, Vol.109, pp.250-256.
Amanolahi, S. (2005). ‘A note on ethnicity and ethnic groups in Iran’, Iran & The Caucasus, pp.37-41.
Ang, S., Jung, K., Leong, S., Pornpitakpan, C. and Tan S. (2004). ‘Animosity towards economic giants: What the
little guys think’, Journal of Consumer Marking, Vol.21 No.3, pp. 190-207.

396
Avraham, E. (2015). ‘Destination image repair during crisis: Attracting tourism during the Arab Spring
uprisings’, Tourism Management, Vol.47, pp. 224-232.
Bahaee, M. and Pisani, M. J. (2009). ‘Iranian consumer animosity and US products: A witch's brew or
elixir?’, International Business Review, Vol.18 No.2, pp. 199-210.
Balabanis, G., Diamantopoulos, A., Mueller, R. D. and Melewar, T. C. (2001). ‘The impact of nationalism,
patriotism and internationalism on consumer ethnocentric tendencies’, Journal of International Business Studies,
Vol.31 No.1, pp.157-175.
Bates, R. H. (1983). ‘Modernization, ethnic competition, and the rationality of politics in contemporary Africa: State
versus ethnic claims’, African policy dilemmas, Vol.152, p.171.
Bayat, A. (2015). ‘Plebeians of the Arab Spring’, Current Anthropology, Vol.56 No. S11, pp. S33-S43.
Bruce, S. (2000). ‘Zealot politics and democracy: The case of the new Christian Right’, Political Studies, Vol.48
No.2, pp. 263-282.
Caselli, F. and Coleman, W. J. (2013). ‘On the theory of ethnic conflict’, Journal of the European Economic
Association, Vol.11 No. S1, pp. 161-192.
Chan, T. S., Chan, K. K. and Leung, L. C. (2010). ‘How consumer ethnocentrism and animosity impair the economic
recovery of emerging markets’, Journal of Global Marketing, Vol.23 No.3, pp. 208-225.
Chang, E. C. and Ritter, E. H. (1976). ‘Ethnocentrism in black college students’, The Journal of Social
Psychology, Vol.100 No.1, pp. 89-98.
Chomsky, N. (2006). ‘Failed states: The abuse of power and the assault on democracy’, New York: Metropolitan
Books.
Connolly, C. K. (2013). ‘Independence in Europe: Secession, Sovereignty, and the European Union’, Duke Journal
of Comparative & International Law, VoL.24, p. 51.
Costello, M., Jenkins, J. C. and Aly, H. (2015). ‘Bread, Justice, or Opportunity? The Determinants of the Arab
Awakening Protests’, World Development, Vol. 67, pp.90-100.
Dauncey, H. and Morrey, D. (2008). ‘Quiet contradictions of celebrity Zinedine Zidane, image, sound, silence and
fury’, International Journal of Cultural Studies, Vol.11 No.3, pp. 301-320.
Dekker, H., Malova, D. and Hoogendoorn, S. (2003). ‘Nationalism and its explanations’, Political Psychology, pp.
345-376.
Druckman, D. (1994). ‘Nationalism, patriotism, and group loyalty: A social psychological perspective’, Mershon
International Studies Review, pp. 43-68.
Eifert, B., Miguel, E. and Posner, D. N. (2010). ‘Political competition and ethnic identification in Africa’, American
Journal of Political Science, Vol. 54 No.2, pp. 494-510.
Eriksen, T. (1996). ‘Ethnicity, Race, Class and Nation’, In J. Hutchinson and A. Smith. Ethnicity.1st Edition.
London, New York: Oxford Readers.
Esteban, J. and Ray, D. (2011). ‘A model of ethnic conflict’, Journal of the European Economic Association, Vol.
9 No.3, pp. 496-521.
Ettenson, R. and Klein, J. (2005). ‘The fallout from French nuclear testing in the South Pacific: a longitudinal study
of consumer boycotts’, International Marketing Review, Vol.22 No.2, pp. 199-224.
Evans, J. H. (2006). ‘Cooperative coalitions on the religious right and left: Considering the resilience of
sectarianism’, Journal for the scientific study of religion, Vol.45 No.2, pp. 195-215.
Friedland, R. (2001). ‘Religious nationalism and the problem of collective representation’, Annual Review of
Sociology, pp.125-152.
Furia, P. A. and Lucas, R. E. (2008). ‘Arab Muslim attitudes toward the West: Cultural, social, and political
explanations’, International Interactions, Vol.34 No.2, pp.186-207.
Good, L. K. and Huddleston, P. (1995). ‘Ethnocentrism of Polish and Russian consumers: Are feelings and
intentions related?’, International Marketing Review, Vol.12 No.5, pp. 35–48.
Guido, G., Prete, M. I., Tedeschi, P., and Dadusc, l. (2010). ‘Effects of Jewish-Italian Consumer Animosity towards
Arab products: The Role of Personality’ Marketing Management Journal, Vol.20 No.1, pp. 1-18.
Guzansky, Y. and Berti, B. (2014). ‘Is the New Middle East Stuck in Its Sectarian Past? The Unspoken Dimension
of the “Arab Spring” ’, Orbis, Vol. 57 No.1, pp. 135-151.
Hammond, R. A. and Axelrod, R. (2006). ‘The evolution of ethnocentrism’, Journal of Conflict Resolution, Vol.50
No.6 , pp. 926-936.
Helfont, S. and Helfont, T. (2012). ‘Jordan: Between the Arab Spring and the Gulf Cooperation
Council’, Orbis, Vol.56 No.1, pp. 82-95.
397
Hewitt, C. (1977). ‘Majorities and minorities: a comparative survey of ethnic violence’, The Annals of the American
Academy of Political and Social Science, Vol.433 No.1, pp. 150-160.
Hunter, J. D. (1991). ‘Culture wars’, New York: Basic.
Hunter, S. T. (1988). ‘Iran and the Spread of revolutionary Islam’, Third World Quarterly, Vol.10 No.2, pp. 730-
749.
o Hutchinson, J. and Smith, A. (1996). ‘Ethnicity’, 1st Edition. London, New York: Oxford Readers.
Ishii, K. (2009). ‘Nationalistic sentiments of Chinese consumers: The effects and determinants of animosity and
consumer ethnocentrism’, Journal of International Consumer Marketing, Vol.21 No.4, pp. 299-308.
Jiménez, N. H. and San Martín, S. (2010). ‘The role of country-of-origin, ethnocentrism and animosity in promoting
consumer trust: The moderating role of familiarity’, International Business Review, Vol.19 No.1, pp. 34-45.
Joseph, S. (2011). ‘Political familism in Lebanon’, The ANNALS of the American Academy of Political and Social
Science, Vol. 636 No.1 pp. 150-163.
Karasawa, M. (2002). ‘Patriotism, nationalism, and internationalism among Japanese citizens: An epicemic
approach’, Political Psychology, Vol.23 No.4, pp. 645–666.
Kesic, T., Piri Rajh, P., and Vlasic, G. (2005). ‘ The role of nationalism in consumer ethnocentrism and the animosity
in the post-war country’, In Proceedings of the 34 th European Marketing Conference. Milan Italy.
Khosla, D. (1999). ‘Third world states as interveners in ethnic conflicts: Implications for regional and international
security’, Third World Quarterly, Vol.20 No.6, pp.1143-1156.
Kisirwani, M. (1980). ‘Foreign interference and religious animosity in Lebanon’, Journal of Contemporary History,
pp. 685-700.
Klein, J. G. (2002). ‘Us versus them, or us versus everyone? Delineating consumer aversion to foreign
goods’, Journal of International Business Studies, pp.345-363.
Klein, J. G., Ettenson, R. and Morris, M. D. (1998). ‘The animosity model of foreign product purchase: An empirical
test in the People's Republic of China’, Journal of Marketing, Vol. 60 No.1, pp. 89-100.
Kosterman, R. and Feshbach, S. (1989). ‘Toward a measure of patriotic and nationalistic attitudes’, Political
Psychology, Vol.10 No.2, pp. 257-274.
Lee, W. N., Hong, J. Y. and Lee, S. J. (2003). ‘Communicating with American consumers in the post 9/11 climate:
An empirical investigation of consumer ethnocentrism in the United States’, International Journal of
Advertising, Vol.22 No.4, pp. 487-510.
Leong, S. M., Cote, J. A., Ang, S. H., Jung, K., Kau, A. K., Tan, S. J., et al. (2008). ‘Understanding consumer
animosity in an international crisis: Nature, antecedents, and consequences’, Journal of International Business
Studies, Vol. 39 No.6, pp. 996–1009.
Levine, R.A. and Campbell, D. T. (1972). ‘Ethnocentrism; Theories of Conflict, Ethnic Attitudes, and Group
Behaviour’, New York: John Wiley and Sons, Inc.
Little, J.P., Little, E., and Cox, K.C. (2009). ‘U.S. consumer animosity towards Vietnam: A comparison of
generations’, Journal of Applied Business Research, Vol. 26 No.6, pp. 13-22.
Lybarger, L. D. (2007). ‘For church or nation? Islamism, secular-nationalism, and the transformation of Christian
identities in Palestine’, Journal of the American Academy of Religion, Vol.75 No.4, pp. 777-813.
Malik, A. and Awadallah, B. (2013). ‘The economics of the Arab Spring’, World Development, Vol. 45, pp. 296-
313.
Martin, T. (1999). ‘Borders and Ethnic Conflict: The Soviet Experiment in Ethno-Territorial
Proliferation’, Jahrbücher für Geschichte Osteuropas, pp. 538-555.
Maynes, C. W. (1993). ‘Containing ethnic conflict’, Foreign Policy, Vol. 90, pp. 3-21.
Moufakkir, O. (2014). ‘What’s immigration got to do with it? Immigrant animosity and its effects on
tourism’, Annals of Tourism Research, Vol. 49, pp. 108-121.
Nakos, G. E. and Hajidimitriou, Y. A. (2007). ‘The impact of national animosity on consumer purchases: The
modifying factor of personal characteristics’, Journal of International Consumer Marketing, Vol. 19 No.3, pp. 53-
72.
Navarrete, C. D. and Fessler, D. M. (2006). ‘Disease avoidance and ethnocentrism: The effects of disease
vulnerability and disgust sensitivity on intergroup attitudes’, Evolution and Human Behavior, Vol. 27 No. 4, pp.
270-282.
Nes, E. B., Yelkur, R. and Silkoset, R. (2012). ‘Exploring the animosity domain and the role of affect in a cross-
national context’, International Business Review, Vol. 21 No. 5, pp. 751-765.

398
Nijssen, E. J. and Douglas, S. P.(2004). ‘Examining the animosity model in a country with a high level of foreign
trade’, International Journal of Research in Marketing, Vol. 21 No.1, pp. 23-38.
Operario, D. and Fiske, S. T. (2001). ‘Ethnic identity moderates perceptions of prejudice: Judgments of personal
versus group discrimination and subtle versus blatant bias’, Personality and Social Psychology Bulletin, Vol. 27
No.1, pp. 550-561.
O'Toole, R. (1976). ‘Underground" Traditions in the Study of Sectarianism: Non-Religious Uses of the Concept"
Sect’, Journal for the Scientific Study of Religion, pp.145-156.
Parasiliti, A. T. (2003). ‘The causes and timing of Iraq's wars: A power cycle assessment’, International Political
Science Review, Vol. 24 No. 1, pp. 151-165.
Parker, R. S., Haytko, D. L. and Hermans, C. M. (2011). ‘Ethnocentrism and its effect on the Chinese consumer: a
threat to foreign goods?’, Journal of Global Marketing, Vol. 24 No. 1, pp. 4-17.
Peñaloza, L. (1995). ‘Immigrant consumers: Marketing and public policy considerations in the global
economy’, Journal of Public Policy & Marketing, Vol. 14 No. 1, pp. 83-94.
Pilet, J. B. (2005). ‘The adaptation of the electoral system to the ethno-linguistic evolution of Belgian
consociationalism’, Ethnopolitics, Vol. 4 No 4, pp. 397-411.
Rawwas, M. Y., Rajendran, K. N. and Wuehrer, G. A. (1996). ‘The influence of worldmindedness and nationalism
on consumer evaluation of domestic and foreign products’, International Marketing Review, Vol. 13 No. 2, pp. 20-
38.
Riefler, P. and Diamantopoulos, A. (2007). ‘Consumer animosity: a literature review and a reconsideration of its
measurement’, International Marketing Review, Vol. 24 No. 1, pp. 87-119.
Riggs F.W. (1998). ‘The modernity of ethnic identity and conflict’, International Political Science Review, Vol. 19
No. 3, pp. 269-288.
Rougier, E. (2016). ‘Fire in Cairo: Authoritarian-redistributive social contracts, structural change and the Arab
spring’, World Development, Vol. 78, pp.148–171.
Sadowski, Y. (1998). ‘Ethnic Conflict’, Foreign Policy, Vol. 111, pp. 12-23.
Sampson, D. L. and Smith, H. P. (1957). ‘A scale to measure world-minded attitudes’, The Journal of Social
Psychology, Vol. 45 No. 1, pp. 99-106.
Shimp, T. A. (1984). ‘Consumer ethnocentrism: the concept and a preliminary empirical test’, Advances in
Consumer research, Vol. 11 No. 1, pp. 285-290.
Shin, M. (2001). ‘The animosity model of foreign product purchase revisited: does it work in Korea?’, Journal of
Empirical Generalisations in Marketing Science, Vol. 6 No. 1, pp. 6-14.
Shoham, A., Davidow, M., Klein, J. G. and Ruvio, A. (2006). ‘Animosity on the home front: The Intifada in Israel
and its impact on consumer behavior’, Journal of International Marketing, Vol. 14 No. 3, pp. 92-114.
Smith, M. and Qianpin, L. (2010). ‘The role of occupation in an integrated boycott model: A cross regional study
in China’, Journal of Global Marketing, Vol. 23 No.2, pp. 109-126.
Steensland, B., Robinson, L. D., Wilcox, W. B., Park, J. Z., Regnerus, M. D. and Woodberry, R. D. (2000). ‘The
measure of American religion: Toward improving the state of the art’, Social Forces, Vol. 79 No. 1, pp. 291-318.
Sumner, W. G. (1906). ‘Folkways: A study of the sociological importance of usages, manners, customs, mores, and
morals’, New York: Ginn
Swee, E. L. (2014). ‘Together or Separate? Post-Conflict Partition, Ethnic Homogenization, and the Provision of
Public Schooling’, Journal of Public Economics, Vol. 128, pp. 1–15.
Tangerås, T. P. and Lagerlöf, N. P. (2009). ‘Ethnic Diversity, Civil War and Redistribution’,. The Scandinavian
Journal of Economics, Vol. 111 No. 1, pp. 1-27.
Wang, Y. and Heitmeyer, J. (2006). ‘Consumer attitude toward US versus domestic apparel in
Taiwan. International’, Journal of Consumer Studies, Vol. 30 No.1, pp. 64-74.
Weyland, K. (2012). ‘The Arab Spring: Why the surprising similarities with the revolutionary wave of
1848?’, Perspectives on Politics, Vol. 10 No.4, pp. 917-934.
Wood, V. R. and Darling, J. R. (1993). ‘The marketing challenges of the newly independent republics: product
competitiveness in global markets’, Journal of International Marketing, pp.77-102.
399
The Role of Macroeconomic Stability in Enhancing
Jordan's Economic Competitiveness
Dr. Abdallah Shawawreh Dr. Hamad Kasasbeh
AL-Zaytoonah University of Jordan AL-Zaytoonah University of Jordan
Jordan Jordan
Abstract:
The main hypothesis examined in this paper that exogenous shocks including financial crisis and
regional stability have negatively affected macroeconomic stability in Jordan and worsened the
competitiveness and doing business indicators. The analysis indicated that macroeconomic indicators
during the period 2000-2009 were stable and improving. This was reflected in the improvement of most of
competitiveness indicators monitored by specialized international reports. However, when the Jordanian
economy was hit by sever exogenous shocks the Jordanian economy competitiveness declined and
worsened.
Ι- Introduction:
Jordan is a small open economy٫ located in the heart of Arab world. Jordan economy is a market –
Oriented economy٫ with abundant skilled human resource٫ and limited natural resources. The economy is
high vulnerable to external shocks and demented on workers remittances and foreign did.
During the past ten years٫ Jordan has faced three major external shocks. The first one was the high
increase in international oil& food prices during 2007&2008٫ and the second external shock٫ was the global
financial & economic crises of late 2008. The Arab spring events of 2010 were the third major external
shock hit Jordan over the past Five years. Conflict in neighboring Iraq & Syria was affecting Jordan through
distortion to trade toutes٫ failing tourism receipt٫ weak investment٫ and large influxes of refuges.
As a result of that٫ Jordan has managed to stabilize its economy in the face of the above- mentioned
external shocks. By the end of 2012٫ Jordan has entered into a $2 billion stand-by agreement with the IMF.
The main objectives of the agreement are to correct fiscal & external imbalances and thereby restore
confidence in Jordan economy٫ and enhancing its competitiveness. This is because macroeconomic stability
is important for business promoting and important also for the overall competitiveness of the economy (1).
The purpose of this paper is to study the role of macroeconomic stability in Enhancing Jordan's
Economics competitiveness. The main hypothesis to be examined in this paper is that " external shocks
have negative impact on macroeconomic stability in Jordan and worsened the competitiveness and doing
business." Therefore٫ when Jordan adopted the stand by Management (513A) with the IMF٫
macroeconomic stability achieved٫there by overall competitiveness and doing business indicators
improved.
Π. An overview of Jordan's Recent Economic Situation:
Despite the unfavorable external environment during the first decade of this century, the ambitious
and rigorous reform programs had placed the Jordanian economy on the path of strong and outward-oriented
growth. Real GDP had been steadily growing, recording a growth rate of …% on average during 2000-
2009, such growth performance was outstanding by regional and international standards, especially in view
of the recent exogenous shock formed by the surge in international oil prices.
400
Foreign direct investment (FDI) and other private capital inflows continued to pour into Jordan,
tangible positive results in terms of export expansion, stock market capitalization, as well as monetary and
fiscal stability. As for the budget position and after implementing a stringent fiscal adjustment package,
Jordan’s fiscal situation was back on track despite the repercussions of the still high international oil prices.
These positive achievements came only after Jordan has undertaken numerous reform measures in all
sectors of the economy, including public finance, trade liberalization, investment deregulation, financial
and banking sector, as well as good governance and institutional and legislative reforms.
Jordan has been hit by a series of severe shocks over the past few years. Conflicts in neighboring Syria
and Iraq have created considerable economic and social pressures; the authorities estimate that Jordan is
hosting 1.2 million Syrians (over one fifth of Jordan’s non-refugee population), the majority of which are
refugees. At the same time, low-cost gas imports from Egypt have gradually come to a near complete halt,
requiring more expensive fuel imports, which led to large losses by the electricity company NEPCO4. (IMF
Staff Report 2015)
A worsened regional environment and uncertainty are hurting output and jobs. Growth dropped to 2
percent y-o-y in 2015Q1, reflecting largely the flared up tensions in the region taking a toll on exports and
tourism. Inflation remains low. Headline CPI inflation rebounded to very low rates, reflecting primarily a
partial recovery in transportation costs from higher oil prices and an acceleration in food prices.
There is a slight uptick in private sector credit growth. Corporate credit growth picked up in the first
quarter and some firms are said to have sought credit from abroad 400oadied by lower oil prices, the current
account deficit continues to narrow. Energy imports fell by one third in first quarter of 2015 and remittance
inflows increased. This offset the decline in merchandise exports and tourism receipts.
The budget over-performed by end of Program period. Revenue collection improved and the decline
in expenditures induces the overall balance from JD 1.8 billion in 2012 to almost 0.5 million in 2014. The
agreement made with Shell for LNG delivery, will substantially reduce NEPCO’s losses starting 2015.
Monetary policy was loosened further. The Central Bank of Jordan (CBJ) lowered interest rates by 25
basis points (bps) in early July (the second cut this year after a 25-bps reduction in February).
Macroeconomic environment was stabilized after the finalization of the Stan-by Arrangement with
IMF, however, public debt is still high stood at almost 90% of GDP and constitute a major challenge.
Ш. Overall Competitiveness of Jordan:
The Global competitiveness report of the world bank forum defines competitiveness as of the
International economic organizations that issued competitiveness reports define competitiveness as the set
of institutions, policies, and factors that determine the level of productivity of a country. The level of
productivity, in turn, sets the level of prosperity that can be reached by an economy. The productivity
level also determines the rates of return obtained by investments in an economy, which in turn are the
fundamental drivers of its growth rates. In other words, a more competitive economy is one that is likely
to grow faster over time.
The last decade has seen remarkable changes in Jordan’s economy, socio-economic makeup and
competitiveness. While Jordan has made great strides in its economic growth and competitiveness, there is
room for improvement, as the following report will detail. In summary, Jordan has
suffered minor setbacks, in terms of competitiveness. Specifically, in such areas as government
spending and business capability, the nation’s rankings have dropped over recent years. The nation has
made significant improvement in minimizing inflation and making the establishment of firms easier.
We will try to prove below that competiveness and doing Business in Jordan deteriorated in aftermath
of the financial crises and the Arab Spring.
a) Jordan's Competitiveness Indicators

401
Jordan is the 64 most competitive nation in the world out of 144 countries ranked in the 2015-2016
edition of the Global Competitiveness Report published by the World Economic Forum (WEF), where
Jordan maintained the same level as in the previous year, as well as Jordan came in the seventh rank
according to the Arab world after Qatar, UAE, Saudi Arabia, Kuwait, Bahrain and Oman.
This report based on three key indicators (Basic Requirements, Efficiency enhancers and Innovation
and sophistication factors). These indicators are grouped in 12 pillars; these are in turn organized into 3 sub
indexes.
The following table shows the rank of Jordan according to Global Competitiveness Index (GCI) 2015-
2016 and 2014-2015:
Table 1: Global Competitiveness Index (GCI) 2015-2016/2014-2015
Key Indicators 2015-2016
(Rank out of 140)
2014-2015
(Rank out of 144)
Basic Requirements 75 73
1st Pillar: Institutions 36 37
2nd Pillar: Infrastructure 70 131
3d Pillar: Macroeconomic Environment 130 71
4th Pillar: Health and Primary
Education
54 47
Efficiency Enhancers 67 70
5th Pillar: Higher Education and Training 50 48
6th Pillar: Goods Marker Efficiency 39 40
7th Pillar: Labor Market Efficiency 93 94
8th Pillar: Financial Market Development 71 66
9th Pillar: Technological Readiness 76 73
10th Pillar: Market Size 76 88
Innovation and Sophistication 40 42
11th Pillar: Business Sophistication 40 42
12th Pillar: Innovation 40 41
Source: GCI 2015-2016 &2014 -2015
b) Jordan Doing Business Indicators
A diagnosis of economy including ranking on the ease of doing business, is an essential tool for policy
makers. Also useful is to know how it ranks relative to comparator economies and relative to the regional
average. Jordan has been ranked 113th out of 189 countries in the World Bank's 2016 Ease of Doing
Business report, which was released lately. The World Bank said the Jordan’s economy had dropped by
six places from its ranking last year, when it stood at 107.
According to this report, the World Bank said that in regard to the "10 pillars", Jordan did not make
any improvements and in fact retreated in seven topics, while maintaining its same position in three pillars.
In the category of "starting a business", the Kingdom's economy moved down from 83 to 88;in "dealing
with construction permits", it remained unchanged at 103. Concerning "getting electricity", the Kingdom
regressed from 55 to 56 and in "registering property", it dropped from 96 to 98, while the "getting credit"
criterion remained unchanged at 185.
In regards to "protecting minority investors", the Kingdom regressed from 162 to 163, and regarding
"paying taxes" from 46 to 52, while "trading across borders" saw a 1-point decrease, from 49 to 50.
As regards "enforcing contracts", Jordan’s rank dropped from 122 to 126 and in relation to "resolving
insolvency", it remained at 146. Economies are ranked from 1 to 189 on their Ease of Doing Business, with
rank 1 being the highest "ease".

402
A high Ease of Doing Business ranking means the country's regulatory environment is more conducive
to starting and operating a local firm.
Rankings are determined by sorting the aggregate distance to frontier scores on 10 topics, each
consisting of several indicators, and giving equal weight to each topic. A cording to doing business report.
Report٫The most problematic for doing business in Jordan٫are:
- Access to financing.
- Inadequately educated labor force.
- Tax rates.
- Restrictive labor regulations.
- Inefficient government bureaucracy.
- Complexity of tax regulations
- Government instability/coups.
- Insufficient capacity to innovate.
- Corruption.
Table 2.1 Summary of Doing Business indicators for Jordan
Indicator Rank DB 2016 DB 2015 Change
Overall Rank 113 107 -6
Starting a business 88 83 -5
Dealing with Construction Permits 103 103 0
Getting Electricity 56 55 -1
Registering Property 98 96 -2
Getting Credit 185 185 0
Protecting Minority Investors 163 162 -1
Paying Taxes 52 46 -6
Trading Across Boarders 50 49 -1
Enforcing Contracts 126 122 -4
Resolving Insolvency 146 146 0
Source: Doing Business database.
(V)Effect of macroeconomic stability in Jordan competitiveness
The main hypothesis we will try to prove below that exogenous shocks including financial crisis and
regional stability has worsened Jordan competitiveness and doing business.
Table 3: Gordan major macrooeconomic indectorrs(2000-2014)

403
Source: C.B.J monthly statistic Bulletin several Editions.
Mof monthly Finance Bulletin several Editions
)a )Economic Growth and GCI
Economic growth rate were at average of 6.5% during the period 2000-2009, then begins to decline to
an average of 2.7% during 2010-2014. The slowdown of economy, in the first period as indicated below
from 8.6% to 5.5%, was escorted by worsening in the competitiveness indicator (GCI) from 34 to 48.
How as the economy entered into a sharp slowdown during 2010-2014 competitiveness was worsening
into much sever rank to reach 64 in 2014 compared to 50 in 2010. Here, one can argue that the economy
lost some of its competitiveness due to several factors among those instability in the region and cut of gas
supply from Egypt, which led to large losses by the electricity company NEPCO. Ultimately, this induces
a high increase in public debt to finance NEPCO Losses.
One may argue here when Jordan adopted the Strand by-Arrangement (SBA) program under the IMF
macroeconomic environment improved to much stable environment, economic growth ascended little bit
and in parallel the GCI rank increased from 68 in 2013 to 64 in 2014.
201420132012201120102009200820072006200520042003200220012000Indicators
Economic Indicators
3.12.82.72.62.35.57.28.28.18.18.64.15.85.34.5Real GDP %2.85.64.84.45-0.713.94.76.33.52.62.31.91.80.6Inflation (CPI)%
Financail indicators
2.35.58.36.85.68.92.25.14.25.32.72.73.83.53.4Ovrall balance as percent of GDP/including Grants %
80.880.175.565.461.157.154.867.668.88488.898.298.496.299.8Net public debt /GDP %
28.624.123.026.424.926.732.732.732.534.336.636.231.432.933.1Total Revenues /GDP %15.915.315.315.015.917.017.720.420.019.817.715.014.715.716.0Tax Revenues/GDP%30.929.731.333.230.435.734.837.836.639.639.338.935.336.436.5Total Expenditures /GDP %
External sector6.810.315.210.27.15.29.316.811.5180.311.85.24.50.3Current Account/GDP %
32.934.734.130.625.726.332.637.733.639.829.619.618.122.425.7Trade Palance /GDP
55.350.330.251.465.264.349.756.657.253.259.665.651.440.546.1Oficial Reserves /GDP
Banking & money sector30,26127,59324,97024,37822,50520,29818,10315,98814,59213,11911,5649,9699,3688,7218,225Foreign currency deposits (Million JD)
9.7%10.5%2.4%8.3%10.9%12.1%13.2%9.6%11.2%13.4%16.0%6.4%7.4%6.0%Growth deposits19,51719,17818,06216,10514,68813,60913,41511,90010,3968,6196,8775,9255,8085,7575,359Total cridet facilities (Million JD)
1.8%6.2%12.2%9.6%7.9%1.4%12.7%14.5%20.6%25.3%16.1%2.0%0.9%7.4%Growth Facilites2.943.7854.3092.9172.152.6454.6495.1476.4954.6292.8052.1252.8753.8755.75Overnight Deposits Window Rate
3.454.286.753.7763.0873.78N/A6.1826.4686.51N/AN/AN/AN/AN/AInterst Rate on treasury Bills (12 month)
646864716550484952423534344547The Global compatitiveness ranking
11910695107104948074737474N/AN/AN/AN/A DoingBuusiness- Ranking

404
(b )Public Debt and GCI
Similar argument can be made here too, during the period 2000-2009 when public debt to GDP has
declined from 99.8% in 2000 to 68% in 57% in 2009 competitiveness improved from 47 GCI rank to
almost 35 respectively. However, during 2010-2014 as public debt increased to 80% by 2014 the GCI
rank worsened to 64 in 2014 from 50 in 2010.
However, during the period 2009-2014 the increase in public debt to 80.8% in 2014 was due to an
exogenous shock caused by the cut of Egyptian gas, the government to borrow more by almost JD 4.5
billion to finance NEPCO losses, this shock cause the GCI indicators to deteriorate.
(c)Tax Revenues and Doing Business
Similar argument can be made to the relation public debt to GDP revenue and doing Business as
indicated below
80.880.175.5
65.461.157.154.867.6
68.8
8488.8
98.298.496.299.86468
647165
50484952
42353434
4547
0
10
20
30
40
50
60
70
80
0
20
40
60
80
100
120
201420132012201120102009200820072006200520042003200220012000
%
%GDP/الدين العام )GCI-Ranking) مؤشر التنافسية العالمية

405
(d)Tax Revenues and GCI
Tax revenues declined from almost 20% of GDP in 2005 to 17% in 2009, this pattern was accompanied
by worsening in the rank of GCI from 42 to 50 respectively. During the period 2010-2014 the tax revenues
declined from 17% to almost 15% this decline in tax revenues usually caused by of slow economic activity
as explained above was also accompanied by worsening in GCI rank to almost 68. One may argue here
when Jordan adopted the Strand by-Arrangement (SBA) program under the IMF revenues picked up and
the GCI rank increased from 68 in 2013 to 64 in 2014.
(V)External Sector and Doing Business
External Sector measured by Trade Balance to GDP during 2004-2009 indicated a stable relationship
with doing business indicators, however during 2009-2014 trade balance increased from 26% to 35% doing
business indicators worsened from 94 to 106.
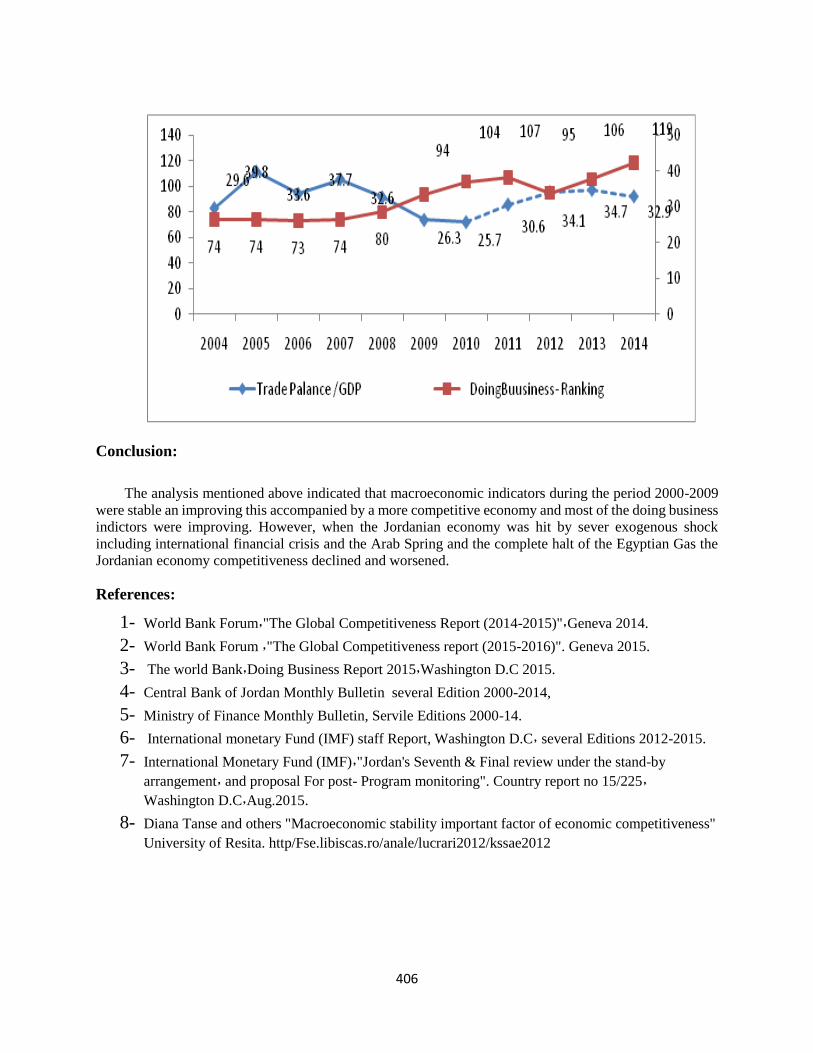
406
Conclusion:
The analysis mentioned above indicated that macroeconomic indicators during the period 2000-2009
were stable an improving this accompanied by a more competitive economy and most of the doing business
indictors were improving. However, when the Jordanian economy was hit by sever exogenous shock
including international financial crisis and the Arab Spring and the complete halt of the Egyptian Gas the
Jordanian economy competitiveness declined and worsened.
References:
1- World Bank Forum٫"The Global Competitiveness Report (2014-2015)"٫Geneva 2014.
2- World Bank Forum ٫"The Global Competitiveness report (2015-2016)". Geneva 2015.
3- The world Bank٫Doing Business Report 2015٫Washington D.C 2015.
4- Central Bank of Jordan Monthly Bulletin several Edition 2000-2014,
5- Ministry of Finance Monthly Bulletin, Servile Editions 2000-14.
6- International monetary Fund (IMF) staff Report, Washington D.C٫ several Editions 2012-2015.
7- International Monetary Fund (IMF)٫"Jordan's Seventh & Final review under the stand-by
arrangement٫ and proposal For post- Program monitoring". Country report no 15/225٫
Washington D.C٫Aug.2015.
8- Diana Tanse and others "Macroeconomic stability important factor of economic competitiveness"
University of Resita. http/Fse.libiscas.ro/anale/lucrari2012/kssae2012

407
PUBLIC DEBT INTEREST FREE BORROWING
FROM THE CENTRAL BANK
Dr.Randa Sharafeddine
Al Jinan University
Lebanon
Abstract:
The high public debt can impact competitiveness and the future growth performance of an economy
in the longer term. The stability of the macroeconomic environment is important for business and for the
overall competitiveness of a country. Running fiscal deficits limits the government’s future ability to react
to business cycles. The government cannot provide services efficiently if it has to make high-interest
payments on its past debts and firms cannot operate efficiently when inflation rates are out of hand. In sum,
the economy cannot grow in a sustainable manner unless the macro environment is stable. In this article,
we will discuss a system in which the State would have the right to obtain financing from its Central Bank.
This theory is based on the fact that a State is deemed unable to default its debts; this is not applicable to
another type of economic agent. We are going to see how States put themselves in a weak position that led
them to be deep in debt today. Also, we will imagine how States could be quite free from their current
public debt, especially with the example of the French public debt.
This article is about our monetary and financial system. The main objectives would be the end of
expansion and recession periods, through a better economic stability; a fairer distribution of the income
resulting from money creation; and the building of a more reliable global financial system. This article
explores the possibility for a Central Bank to finance the State's investments at zero interest rate 0%, like
was the case when they had this right. This study will show that this model is viable, and would allow the
collectivity to pay back the public debt and lower the taxes at the same time.
1. INTRODUCTION
This article starts focusing on the monetary creation, which is the basis of our financial system. It talks
about its control, which has been transferred from the States to the Central Banks and then to the
Commercial Banks. It explores the reasons of this changes and the situation it created, particularly regarding
the public debts that started at this time and which kept on growing ever since. We feel concerned about
the public debt and have thought several times about how States end up so deep in debt. It is a major problem
that most of the States in the world are facing today. This problem gets bigger and bigger every year, it
happens that sometimes politicians talk about reducing it when elections are approaching, but in fact, this
problem is never taken care of. But who is going to pay it back? And how did the States develop such an
enormous debt?
For taking the monetary creation subject further and using it to analyze the financial system, and find
in there solutions to its instability, a very interesting book, written by Nobel Prize 'Maurice Allais'5, titled
''the financial crisis: for deep reform of the financial and monetary institutions'', linking monetary creation
and financial system. It was really helpful and led me to take this article one step further. Maurice Allais
5 French economist Maurice Allais, Nobel Prizewinner in Economic Science in 1988
408
believes that the way out of such crises is best achieved through structural reforms through, adjusting the
rate of interest to 0% and revising the tax rate to about 2%.
Those reforms would take time to implement and would face many interests, but at the end, they would
benefit the collectivity and it would especially aim at making our financial system more stable, before it
collapses.
1.1. The Link Between Public Debt and Competitiveness
High public debt can impact competitiveness and the future growth performance of an economy in the
longer term. In general, the impact of public debt on competitiveness depends to a large extent on how it is
spent. The accrual of public debt can enhance competitiveness if it is used to finance investments that raise
productivity, such as upgrading schools or supporting research. However, if debt is used to finance present
consumption, it burdens the economy in the long run with little tangible benefit. Indeed, in addition to
crowding out private investment, which may also reduce growth, higher debt implies that interest payments
and debt service will take up a bigger share of the government budget, forcing a reduction in public spending
in other areas.
Public spending cuts may have an adverse effect on competitiveness, especially if investments in
growth-enhancing areas are affected. There is no doubt that reducing public investments for health,
education, research and development (R&D), or the maintenance of infrastructure will erode
competitiveness over the medium to longer term. R&D and education especially are among the areas that
matter most for the competitiveness of advanced economies. Investments in these areas should therefore be
preserved as much as possible. Given the importance of public investment in the competitiveness,
enhancing areas such as education or innovation for future competitiveness, policymakers must measure
very carefully the effects of reducing such investments, as this may endanger future growth and prosperity.
This would have the unfortunate effect of converting short-term financial difficulties into longer-term
competitiveness weaknesses. Policymakers should therefore focus on measures to enhance competitiveness
that would strengthen their countries’ growth potential and thus improve the budgetary situation. In
peripheral European economies that have accumulated debt over the past years while their competitiveness
has not improved, competitiveness enhancing reforms would support economic growth and thus create a
virtuous cycle that could make high debt burdens more sustainable.
According to Hugh Dalton (1929) 'a distinction on public debt is often drawn between "reproductive
debt" and "deadweight debt". The former is debt which is fully covered, or balanced, by the possession of
assets of equal value; the latter is debt to which no existing assets correspond. Public debt, which is fully
covered by public assets, is analogous to the capital of a company, and the creditors of the public authority
are analogous to debenture holders in such a company. The interest due to them is normally obtained from
the income-yielding power of the assets, or, in other words, is normally paid out of income derived by the
public authority from the ownership of property or the conduct of enterprises. The interest on deadweight
debt, on the other hand, must be obtained from some other source of public income, generally, that is to
say, from taxation'.
1.2. Money Creation
We know that money creation is the basis of our financial system. The Commercial banks now control
the economy, while the State has given away this economic regulation power. Banks can now create almost
as much money as they want, as long as they make profit out of it, and they do. They don’t care, and it is
not their role, about economic stability and Social equity…
Two theories of Money Creation compete since the early of the nineteenth century:
409
- The currency principle: supported by David Ricardo6, this theory holds that the amount of
currency in circulation must be regulated according to the desire of the banks to create, or not the
money, where profit maximization plays the main role in money creation;
- The banking principle: this theory is contrary to freedom of monetary creation, and this is based
on the needs of growth in the economy supported by Ludwig Von Mises7 (1912).
The monetary creation appeared when bankers who kept people's gold gave banknotes in certification
of deposit, banknotes that were used to pay on markets. Then basing on the fact that chances for all the
depositors to come at the same time asking for their gold was really low, they started issuing more banknotes
than they had gold. The monetary creation was born, contingently, by chance.
In history, money has taken various forms through a process of dematerialization, objects, base metals,
precious metals, paper, and finally electronics. However, these currencies have been living together before
being preferred or abandoned. The most important was probably the gold that was used as bargaining chips
long before becoming used as a convertible currency in order to ensure their stability. For example, in the
early 20th century, a gram exchanged against 0.29 grams of gold and 7.32 grams a pound, which gave us a
pound to 25.24 francs. Thus gold was the basis of the international financial system.
In 1914, France abandoned the gold for banknotes, but kept the convertibility of bank money in gold.
In 1944, at Bretton Woods, the ounce (31 grams) is set to $ 35. Then, even if central banks keep gold in
their coffers, demonetization of gold at the international level is effective in 1976 when a reference to gold
is removed in the IMF Articles of Agreement.
Today, gold represents nothing since money isn’t convertible into gold anymore. Money has nothing
to see with something material. It is created by banks and only depends on people’s trust that other people
are willing to accept banknotes in payment of merchandises or services. In our economies, commercial
banks are the one allowed to issue money and Central Banks aren’t, not even to finance their State’s
investment.
Did you know that when you borrow money from a bank, the bank issues the money, meaning it creates
it from nothing, ex nihilo? If you're not familiar with our monetary system, it's normal. No one knows this
fact, even if it the basis of our financial system. Lending money, for banks, doesn't mean ''I lend you some
money I have'' but ''I trust you to be able to pay me back''. The bank actually creates the money when you
need it. This is how the quantity of money we have on earth has been growing so much over the years.
Money is created by banks from nothing to be then lent to borrowers against interests. How can
commercial banks create almost as much money as they want, and then lend something they didn't own in
the first place charging interests? How the monetary creation power that at first belonged to States was,
through successive steps, transferred from the States to the private bank?
Banknotes and coins are only a fraction of the existing currency; deposit money now represents over
90%. This is partly why, as the Central Banks are called ''emission institute'', their power of action is
relatively low. They still play an independent and effective role with the effect of their interest rate that has
effect on the global economy.
Banks create money purely and simply, ''ex nihilo'', in other words, from scratch. They create the
money by writing a simple book by entering their balance sheet assets and liabilities in the amount of credit.
Appropriations do deposits, and not vice versa.
6David Ricardo was a British political economist. He was one of the most influential of the classical economists, along
with Thomas Malthus, Adam Smith, and James Mill. Born: April 18, 1772, London, United Kingdom. Died:
September 11, 1823, Gatcombe Park, United Kingdom
. 7 Ludwig Heinrich Edler von Mises was a theoretical Austrian School economist of the classical liberal school. Born:
September 29, 1881. Died: October 10, 1973, New York City, New York, United States

410
Thus, when a credit is granted by an institution with the power to create money, that money will be
accepted as payment in the same way that a currency would represent a deposit of gold. Maurice Allais,
Nobel laureate in economics, reminds us in his book; Today’s world wide crisis: For deep reforms of
financial and monetary institutions: "Basically, the credit mechanism leads to a creation of means of
payments scratch [from scratch], because the holder of a deposit with a bank considers it a cash available,
while at the same time, the bank has lent the greater part of this deposit, which re-filed or not a bank, is
considered an available cash by its recipient".
At each credit transaction, there is duplication. In total, the credit mechanism leads to a creation of
money out of nothing by mere book entries.''
As a result of this process, banks have really slim cover for the money they create. Most of the money
they create only corresponds to debt, and banks would be only able to give to their customer more than
20% of their money back. But of course, the system assumes that not everybody is going to ask for his
money at the same time. The following scheme represents the portion of the money circulating that is more
or less covered by money banks actually own.
2. THE BANK OF FRANCE
Since the advent of the euro and the establishment of the European Central Bank, the Bank of France
was deprived of any real power over monetary policy. But it was long the heart of the French monetary
system, sometimes saving, sometimes disparaged. Here is a brief history of this institution.
Under Napoleon, with Canteleu and perregaux, proposed to make what later became the bank of
France, a genuine issue of Institute, funded by the public, but independent of it. In April 1803 it received
the exclusive privilege of issuing banknotes.
In return for this favor it must come to the aid of various governments for their funding. This will be
first to finance wars and to meet expenses of any kind.
From 1911, the treaties had the Treasury as the standing creditor, the Institute emission is induced to
finance the First World War and its consequences: it became the military arm of the State for distribution
of credit and monetary stability.
The bank of France will become a creditor of the State, but will eventually oppose the demands of
more and more insistent advances of governments. The influence of government becomes final with the
nationalization of July 1936 which transformed the Bank of France in a State monopoly, so that even if
continues to behave like an ordinary school, it grants credits based on the economic needs of the nation.
Then, on 30 January 1973, involving the reform of the statutes of the State Treasury which is Article
25 which blocks any possibility of advance of the Bank of France to the Treasury: '' the Treasury cannot be
a presenter of its own affects the discount of the France''. It's the end of the period when the public debt was
free. Then this idea will be reinforced in 1992 when the Maastricht Treaty in Article 104 (cited below).
Treaty of Maastricht
Article 104.1
No ECB and central banks of member States , grant overdrafts or any other type of credit institutions or
organs of the Community, central governments, regional authorities, local or other authorities public law,
or public undertakings of Member States the purchase directly from them by the ECB or national central
banks of debt instrument is also prohibited.
The Euro was introduced in Europe in January 1999. Nevertheless, banknotes and coins denominated in
Euro became effectively present in the market starting January 2002. This was considered as a big
revolution in the world of money. What happened is that several countries decided to let go of their domestic
currency in order to adopt a single currency, the Euro. Consequently, the monetary policy among these
countries has been unified under the governance of the European Central Bank (ECB) and the national
central bank of each member state.

411
2.1. How the public debt in France came about?
According to Salim Lamrani8 (2012), France till 1973 did not have a debt problem and the national
budget was balanced. The state could borrow directly from the Bank of France to finance the building of
schools, road infrastructure, ports, airlines, hospitals and cultural centers, something that it was possible to
do without being required to pay an excessive and inflated interest rate. Thus, the government rarely found
itself in debt. Nonetheless, on January 3, 1973, the government of President George Pompidou -- Pompidou
was himself a former general director of the Rothschild Bank -- influenced by the financial sector, adopted
Law no.73/7 focusing on the Bank of France. It was nicknamed the "Rothschild law" because of the intense
lobbying by the banking sector which favored its adoption. Formulated by Olivier Wormser, Governor of
the Bank of France, and Valéry Giscard d'Estaing, then Minister of the Economy and Finance, it stipulates
in Article 25, that "the State can no longer demand discounted loans from the Bank of France."
As a result, the French state is now prohibited from financing the public treasury through zero interest
loans 0% from the Bank of France. Instead, it must seek loans on the open financial markets. Therefore, the
state is forced to borrow from and pay interest to private financial institutions, when until 1973; it could
create the money it used to balance its budget through the Central Bank. With this quasi-monopoly,
commercial banks now have been granted the power to create money through credit, whereas previously
this had been the exclusive prerogative of the Central Bank, that is to say of the state itself. As a result,
commercial banks are getting rich off the backs of taxpayers.
Furthermore, thanks to the fractional reserve banking system, private banks can lend up to six times
more than the amount they actually have in reserve. Thus, for every euro they possess, they can loan six
euros through the system of money creation through credit. As though this were not enough, they can also
borrow as much money as needed from the Central Bank at a rate of 0 percent to 18 percent, as we see in
the case of Greece. Today, money creation through credit accounts for 90 percent of all money in circulation
in the euro zone.
This situation has been denounced by the French economist and Nobel laureate, Maurice Allais, who
wished to see money creation reserved to the state and the Central Bank.
"All money creation must be the prerogative of the state and the state alone: Any money creation other
than that of the basic state-created currency should be prohibited in a way that eliminates the so-called
'rights' that have arisen around private bank creation of money. In essence, the ex nihilo money creation
practiced by the private banks is similar -- I do not hesitate to say this because it is important that people
understand what is at stake here -- to the manufacture of currency by counterfeiters, who are justly punished
by law. In practice both lead to the same result. The only difference is that those who benefit are not the
same."
Today, French debt has grown to over 1,700 billion euros. Between 1980 and 2010, the French
taxpayer paid more than 1400 billion euros to private banks in interest on the debt alone. Without the 1973
law, the Maastricht Treaty and the Lisbon Treaty, the French debt would be hardly 300 billion euros.
France pays 50 billion euros in interest annually, making this the largest item in the national budget,
coming even before education. With that kind of money, the government would be able to build 500,000
public housing units or create 1.5 million jobs in the public sector (education, health, culture, leisure), each
with a net monthly salary of 1,500 euros. In this way, French taxpayers are robbed of over 1 billion euros
weekly, money that accrues to the benefit of the private banks. Clearly, the state has given the richest group
of people in the country the fantastic privilege of enriching themselves at taxpayers' expense. And it has
asked for nothing in return, and has not made the slightest effort to do so.
Moreover, this system allows the financial world to subject the political class to its interests and dictate
economic policy through the rating agencies, which are in turn financed by private banks. Indeed, if a
8 Salim Lamrani (2012), Doctor, Paris Sorbonne, Paris IV University, Lecturer, University of La Reunion.
Translated from the French by Larry R. Obeig.

412
government adopts a policy contrary to the interests of the financial market, these agencies lower the rating
scores awarded to states, something that has the immediate effect of increasing interest rates.
Meanwhile, when the state and the European Central Bank bailout ailing private banks, they do so
with interest rates lower than those same financial institutions charge the state. In reality they are conducting
de facto nationalizations without receiving the slightest benefit, for example, being granted decision-
making authority within the banks administrative councils.
The credit system established in France in 1973, and since ratified by the treaties of Maastricht and
Lisbon, has but a single goal: to enrich private banks off the backs of taxpayers. It is unfortunate that a
debate on the origins of public debt is not occurring in the media or in Parliament itself, even though
resolving the debt problem would require nothing more than restoring the exclusive right of money creation
to the Central Bank.
2.2. How are Private Banks Getting Rich off the Backs of the Citizens
The Financial crisis of 2008 had its impact on the Eurozone and resulted in very large current account
deficits and massive public debts. This rendered financial institutions very risky and resulted in a lack of
confidence among investors. What’s more, it implied a reduction in potential output and an increase in
unemployment rates. The restriction in credit availability and the increase in interest rates made it hard for
countries with very high debt burden to finance their debt payments. Increasing exports was a possibility
for peripheral countries to be able to repay their debt. However, this was not possible due to price
competitiveness. Furthermore, the reduction in income and austerity measures made the situation even more
difficult because of recession. Tension is rising across the Eurozone and the prospect of member states,
leaving the Euro is highly probable.
According to Salim Lamrani (2012), all European countries find themselves confronted with debt
problems that impact sustainable public finances. The crisis has not spared France, the world's fifth largest
economic power, something that makes private banks quite happy.
No European nation has been spared the problem of public debt, even if the severity of the crisis varies
from one capital to another. On the one hand, there are the "good students," such as Bulgaria, Romania, the
Czech Republic, Poland, Slovakia, and the Baltic and Scandinavian states, all of which enjoy a debt lower
than 60 percent of their GDP. On the other hand, there are the four "dunces" whose public debt surpasses
100 percent of their GDP: Ireland (108 percent), Portugal (108 percent), Italy (120 percent), and Greece
(180 percent). Between the two extremes are found the rest of the European Union countries, such as France
(86 percent), whose debt oscillates between 60 percent and 100 percent of GDP. High public debt levels
generally bring about higher interest rates across the economy, which in turn raise the cost of finance for
businesses, crowding out the private investment that is so crucial for growth. Moreover, as public debt
levels rise, governments are under pressure to raise taxes, which can further suppress business activity.
Still, it is common knowledge that the austerity policies promoted by the European Union, the
European Central Bank and the International Monetary Fund that are currently being applied across the Old
world, are economically inefficient. In fact, they result in the opposite of what was intended. Rather than
restarting growth, they reduced expenditures; depressed salaries and retirement benefits; dismantling public
services, including education and health care; destroying the work code and social benefits, in addition to
the catastrophic social and human consequences that this causes, inevitably lead to a reduction in
consumption. Inevitably, companies cut production and wages and lay off workers. As a logical
consequence, the resources that flow from the state are cut back, while the entities dependent upon the state
explode, creating a vicious cycle, for which Greece is the poster boy. Because of this, several European
countries now find themselves in recession.
413
3. MONETARY CREATION POWER
Now, who should have the control over the monetary creation power? Why can’t States be financed
by their Central Bank? What are the issues? We will see in a first time that the interdiction to the Central
Banks to finance States is responsible for the French public debt and try to imagine an alternative system.
This is why we will enlarge the question to who should have the control over the monetary creation power
and why?
From a couple of decades, the economic and finance world is going on a deregulation trend. This
deregulation is based on the idea that markets are the best solution to maximize resources allocation and
therefore the States should not interfere with the market or the less the better. It is in this global idea that
the monetary creation power has been entirely given to commercials banks and taken from Central Banks
and States’ control.
This is how from 1973 in France the State had to borrow the money it needed from commercial banks
instead of being able to borrow it from the Banque de France, like it was possible before. This means when
it borrows money, the State now has to pay interests to the banks since commercials banks have to protect
themselves against inflation plus they have to be profitable and so to fix interests rates over the inflation
rate.
Today, in modern economies, central banks cannot finance government deficits to zero, or at least to
a limited rate of inflation, as was the case that there are few decades in France and elsewhere worldwide.
When tradable treasury bonds were created in 1985, it was to modernize the management of public
debt. These vouchers are now open to all stakeholders. This has resulted, more or less directly, a sharp
increase in public debt from 20% in 1980 to 64% in 2007. The State was the largest issuer of securities
monetary and financial liabilities in recent years.
Certainly, today, all States are in debt in a manner somewhat similar to that of France. In addition, in
November2005, the rating agency Standard & Poor's said that the quality of the French public debt
deteriorated, while remaining at AAA rated (highest rating on a scale of existing. The OAT (fungible
Treasury bonds) with a yield above 4% are more than ever the licensee in a context of crisis in which
investors and investors looking for attractive returns, but above all safe.
The weight of these interests in the annual State budget is something very heavy. In France, it
corresponds, for example, to the whole of the income tax. The payment of interest on debt is the second-
largest expense in the State budget, after that of National Education. He therefore created a huge crowding
and simply due to interest payments. Imagine what could be the public finances without the burden of this
debt!
This economy of debt begins to pose problems and show its limits more or less. We say that fiscal
policy is sustainable if it does not lead to an accumulation of "excessive" debt that is to say at a level of
debt, no major changes, could not be covered by future budget surpluses. The financing of this debt excludes
the use of a "Ponzi scheme" where the State would issue indefinitely new loans to pay interest and principal
payments due. The borrowing capacity of the State is limited in quantity.
4. MODERN ECONOMIES
In a globalized economy, it is hardly conceivable that States will still have the power to create money
they need because it contradicts the principles of free competition. Indeed, States would be too tempted to
use these indirect free credits to help their businesses. Moreover, the Maastricht Treaty prohibiting central
banks to finance the States is indicative of the fact that economies are subject to Community rules can use
each ticket as it wishes.
Also, according to Dominique Plihon in his book "Money and its mechanisms", one of the main
reasons that prompted the French public authorities to modernize the capital markets is the need to finance
public deficits in good condition. Indeed, when the Bank of France had the power to refuse granting of
credits to the State, it could have the effect of reducing stimulus plans by providing insufficient funding,

414
for example. The State now borrowing on the markets is sure to have the money it needs when it needs it,
even build up a debt that will be reimbursed during better days.
So are the ideas that have led governments in a context of deregulation, to shift the power of money
creation in the private side. The most worrying is the increasing debt of States exponentially, and likely
eventually to undermine market confidence in the solvency of the States. This would result in an increase
in interest rates Treasury bills, adding to a little more weight in the interests of the State budget, and to a
more distant perspective, the denial of economic agents to finance that debt. However, solutions exist, as
we shall see in the next section.
To sum up, this decision has been taken for the following reasons:
- The State can now borrow all the money it needs for its investments and operation without having
to ask the Banque de France and have its action dependent on this institute's willingness or not loan the
money;
- The Banque de France was indirectly controlled by politics and the agenda may push them to ask
for more money than they really need. This can lead to an excessive creation of money, leading to inflation
and so to the currency's loss of value. It is mechanical. Indeed, the monetary management has to be led on
a long term basis and politics trend to think too short;
- Finally, having to borrow money with interest would be an incentive for governments to have
balanced budget since having an increasing debt would not be maintainable on a long term orientation.
4.1. Money control and Public financing
We know that money creation is the basis of our financial system. In this section, after stating how important
the power of money creation is, we will discuss the hypo book of a system in which the State would have
the right to obtain financing from its Central Bank. This theory is based on the fact that a State is deemed
unable to fault its debts. It is not applicable to another type of economic agent.
We are going to see how States put themselves in a weak position that led them to be deep in debt today.
Also, we will imagine how States could be quite free from their current public debt, especially with the
example of the French public debt.
"Give me control over the currency issue of a nation, and I shall not worry about those who make its
laws". Mayer Amschel Rothschild, Rothschild banking dynasty founder, 1743-1812
This quotation comes from the founder of the dynasty of Rothschild, one of the most famous families in
the business world. More recently, so what happened to the world crisis whose magnitude was forgotten
since the 30s, banks cut loans to companies and individuals for fear of future insolvency of these economic
agents. What happened on the side of government? It was obliged to guarantee a hare of personal deposits
to prevent bankruptcies, and to inject money into the economy out of its pocket. The economy depends on
the willingness of banks to take risks and the State is powerless to the whims and desires of banks to grant
credits or not.
Who benefits?
''Then we must proclaim a fundamental right of man is to be effectively protected against unfair operation,
if not dishonest, the market economy is currently allowed or even encouraged by inappropriate legislation". Maurice Allais, Today’s world wide crisis.
Consequences: What would be a budget without the interests?
After seeing the catastrophic situation of the French public debt since the abandonment of the power of
money creation to commercial banks, what would be the French State without the weight of this debt and
to what extent it might be possible to return to funding from the State Bank of France to zero. To begin,
what would have been even balances the annual budgets of the State from 1980 to 2006 without the burden
of debt interest:

415
Year Actual accumulated
debt in Euro
Interest paid estimate
in Euro
Interest free accumulated
debt in Euro
1979 229,15 229,15
1980 224,71 29,6 195,14
1981 236,61 36,2 170,82
1982 279,65 40,5 173,36
1983 298,06 39,4 152,41
1984 328,76 39,3 143,8
1985 351,22 37,2 129,07
1986 374,58 30,6 121,8
1987 409,62 37 119,86
1988 429,53 38 101,75
1989 456,33 38,9 89,62
1990 481,59 46,6 68,32
1991 494,23 44,2 36,8
1992 551,74 45 49,33
1993 626,33 40,6 83,28
1994 682,25 48,1 91,11
1995 781,2 55,5 143,52
1996 823,51 51,2 125,64
1997 854,14 47,2 109,05
1998 888,8 41,1 102,58
1999 904,03 42 75,76
2000 913,48 49,5 35,69
2001 926,35 46,5 2,09
2002 973,04 46,8 1,97
2003 1051,19 42,3 37,81
2004 1105,69 44,9 47,45
2005 1156,61 39,1 59,23
2006 1142,2 44,4 0,45
The table shows an encrypted manner, though there can be only an estimate, that the deficits are due
only at the interest burden of debt. So when we hear that the State can no longer fund the operation of
hospitals, the pension system and health, or investments such as construction of social housing, it is of
course no question of tackling the problem from this angle. What would people do then if they were told
that their salaries could be increased through lower payroll taxes, if only there was not the burden of debt
on the shoulders of the State, and especially that it is technically possible to wipe out that debt?
Central Bank, founding texts of the European Union as the Treaty of Lisbon or Maastricht as well as
ECB attest this ban in a very formal way. A point where, it will be hard to come back, 60% of the debt is
held by foreign investors, the money thus outside the French circuit is probably neither imposed nor
reinvested in France. All this is problematic as its borrowed money comes from money created ex nihilo
by commercial banks. The borrowing by the State could be conceived at the time or money was
representative of a certain quantity of gold that could become scarce in nature. But now it is totally
paperless, it does not have the same rationale.
4.2. What if States can be funded by Central Bank?
We’ve seen so far that the States have given the monetary creation power to the commercial banks,
forbidding itself to be financed by its central bank. This resulted as the creation of a massive public debt.

416
Now, we will propose an alternative system to the system in place now that could solve the problem of debt
without the risk of creating a large imbalance somewhere.
Basic principles
- We assume monetary creation is removed from private banks.
- The State is an economic agent whose solvency is considered indisputable.
- Currency is in essence a collective, whose total privatization can therefore be considered illegitimate.
- Only investment expenses are concerned, operating expenditure should be financed by the tax.
4.3.Central Bank allowed financing the State
Again, the State is an economic agent whose solvency is considered to be infallible. State loans are
qualified assets without risk that is to say that the State is supposed never lacking in debt. Also, State bonds
rates them even qualified for rate of return without risk.
From this observation, in this system, the State would be entitled to be funded by its Central Bank
interest-free, just as it did forty years ago. The State may thus find a budget balanced without changing its
tax policy. We remain in the approach to zero-rated funding strictly reserved for public investment, by
admitting that the risk of non-repayment is null.
On the other hand, we have to face the risk of excessive use of this power of monetary creation. As we
saw earlier, inflation is the main threat to this configuration of power. Also, the establishment of its needs
will therefore have to be more or less in line with the anticipation of future growth of GDP and other
economic expectations such that it balances budgets.
Deadlines would be imposed in order that these credits are a promise to pay in a distant future, and a
maximum debt ratio would be allowed to State. If deadlines are not met, the State could even have its
borrowing possibilities frozen.
4.4. A necessarily independent Central Bank
To manage State investment funding, an organization's main objective would be the guarantor of monetary
stability, e.g. a Central Bank. It would be strictly independent of the Government, that is to say, that the
Government would have no direct or indirect means of action on it.
To do this, the leaders of this bank would access the function by election or appointment any other medium
imaginable for any independent policies, trade unions, captains or other persons having direct interests with
the Central Bank. They would later have a long and non-renewable term in order to minimize the influences
of the voting or decision makers (masses or specific individuals) always.
This does not mean that Central Bank shall have the power to decide what will be done to create money,
making it responsible for fiscal and monetary policy, and depriving the power to govern the economy
elected Government. The Central Bank will only decide quantities it can grant to Governments based on
their sustainable growth needs and their future ability to refund money.
5. THE USE OF THE CENTRAL BANK
This theory would be based upon the following ideas: a State can’t fail to pay back is debts; the money
is something collective and it can’t be totally privatized; only investments’ financing are considered.
Besides, we are not talking of taking the monetary creation power back from banks.
The State would be able to borrow the money it needs in order to invest in whatever needs to be done.
Those investments and the money generated to pay it back would be planned in advance over a certain
period of time. In case of late payments, loans could be frozen until previous have been paid back to prevent
any massive debt creation. The State would be loaned the money from an independent Central Bank.
417
Independent from the politics powers in order not to influence its action from the politics’ electoral agenda.
If the Central Bank would be able to accept or not the loans requests from the government, it would not be
able to discuss what the government would do with it, in order to leave them the power of directing the
economy, what they are actually elected for. The Central Bank would have for only worries the State’s
ability to respects pay back plans, and the currency stability. Since we are today using the Euros, those
decisions need to be taken from a global Central Bank like the BCE (Banque Centrale Européenne), which
would allow loans for each State individually.
Those financing would allow States to get back good budgets balances and on a long term to pay back
the public debt. States would save a lot of money that people would get back paying less taxes. The only
losing parties would be private investors that would lose the goods and risk free return on investment of
public obligations.
It would give back the States the economic power they lost. It would give them back a capacity of
action that used to be huge, but which has been reduced over time. This power reduced, the State is
weak when it needs to regulate the economy. And wherever the State has its control reduced, others
forms of power appear, and, when this happens by accident, it is rarely for the best.
5.1. Consequences and learning
As we just saw, today, the world economy is based on a comprehensive system of credits that is to say
from promises to pay in the future, drawing from each other, that might be in the form of a pyramid of
debts. For immediate, almost all experts see hardly any other solution, if required by commercial banks, the
institutes emission pressures and the IMF, that the creation of new means of payment to face of depreciation
and interest of their debts, even by weighing even this burden for the future payment.
Let’s go back to the subprime crisis and this incredibly early prediction by Thomas Jefferson:
« I believe that banking institutions are more dangerous to our liberties than standing armies. If the
American people ever allow private banks to control the issue of their currency, first by inflation, then by
deflation, the banks and corporations that will grow up around [the banks] will deprive the people of all
property until their children wake-up homeless on the continent their fathers conquered. The monetary
creation power should be taken from the banks and restored to the people, to whom it properly belongs. »
Thomas Jefferson, 1743 – 1826, The Writings of Thomas Jefferson, Memorial Edition.
After taking a look at what happened, we can have second thoughts about this quotation. How
the world could have been so blind to the pervert effects of the uncontrolled credit mechanism while a man
warned us centuries ago, with a disconcerting accuracy?
For the past decades, a wave of deregulation has blown over the financial world, involving the
disappearance of any obstacle to the free movement of goods, services and capital. According to
this theory, the disappearance of all obstacles to these movements would be both necessary and sufficient
for optimal allocation of resources throughout the world condition. Every country and every social group
would see their situation improved. Market was seen as likely to lead to a stable balance, completely
effective, that could operate on a global scale. In all circumstances, it was appropriate to submit to this
discipline.
Supporters of this theory, this new fundamentalism, had become too dogmatic as supporters of
communism before its final collapse with the fall of the Berlin wall in 1989. This liberal orientation has
been reinforced by the communism doctrine collapse. Since an omnipotent State wasn’t the solution, an
omnipotent market was at the time the best system for everyone. For them, the application of this globalist
doctrine was needed in all countries, and if difficulties presented in this application, they could be only
temporary and transitional. The total opening towards the outside was a necessary condition, and evidence
was given by the extremely rapid progress of emerging countries of the world. For developed countries, the
removal of tariff barriers or other was a condition of their growth, as it showed conclusively the undoubted
success of the Asian Tigers, and repeated yet; the West had to follow their example for unprecedented
growth and full employment.

418
Such was fundamentally the doctrine of global and uncontrolled economy which had imposed itself
upon the world and which had been considered as opening a new golden age at the dawn of the 21th Century.
This doctrine established the undisputed creed of all the big international organizations these last two
decades, including but not limited to the World Bank, the International Monetary Fund, the World Trade
Organization, the Organization for Economic Cooperation and Development, or the Organization of
Brussels.
Two major factors have played a decisive role in this global crisis of unprecedented magnitude after
the crisis of 1929:
1. Potential instability in the financial and monetary system global;
2. Globalization of the economy both in monetary terms and in real terms.
Here is the learning to understand out of it
1. With the monetary creation control, private banks are responsible for inflation and deflation which
means expansion period and crisis following it; they accept crisis. They are not responsible for economic
stability while they bear the tools to ensure it.
2. Banks don't bear the responsibility of economic stability. They are interested in profit. But the credits
(loans mortgages) they grant are responsible of the economic periods.
3. The credit system is naturally instable. To be healthy, it has to be controlled
4. The monetary creation power cannot be given to private banks and needs to be controlled by the
collectivity, meaning the State, meaning a Central Bank.
In fact, what had to happen is reached. World economy, which was devoid of any real regulatory
system and was developed in an anarchic framework, could not only lead sooner or later to major
difficulties.
Indeed, at the basis of contemporary crisis is the uncontrolled loan of credits by private banks allowing
expansion as long as investors trust the future, which can last a while. During this time, economic agents
contract huge debts (like mortgages or other company’s investments) that are profitable only if the
situation keeps up. When doubts about the future start showing up, people who had taken engagement or
invested too much money can’t get a return on their investment or simply pay back their loans. Banking
institutions need to be reformed also because they are instable. They finance long term investments with
money they have on a short term basis from their savers.
As a result, we assist today to the collapse of the global free trade doctrine, which was gradually
imposed by the existing system. The free market was considered as the invisible power for optimal
allocation of resources throughout the world. In fact, what had to happen? The global world economy,
which was devoid of any real control, which was developed in an anarchic framework, could only
reach, sooner or later, to major difficulties.
“Indeed, the new order world, or the so-called world order has collapsed and could only collapse.
Evidence of the facts eventually outweighs the doctrinal incantations.''
Mr. Allais, today’s worldwide crisis
What have we seen so far? Money is something immaterial and can be created at will. The question
of money creation is purely political. In major developed countries, the States have then contracting
enormous debts.
Commercial banks have the power to create the money at will, whenever they judge it good for them.
They are somehow responsible for economic stability, without officially bearing this responsibility. The
financial world is built over a pyramid of debts, making economic agents inter-dependents. This financial
system, which has developed in an anarchic manner, has led to several crises against which States have
been powerless.
6.2. The world in a tight situation

419
More recently, Maurice Allais saw in 1999, in The Global crisis today as "inappropriate" the current
structure of money supply. He believes the current system is unstable and risky, liabilities and claims
are not necessarily the same horizon and the risk of massive liquidity withdrawals by savers is always
possible. Thus, according to Allais, "The entire global economy today is based on gigantic pyramids of
debt, building upon each other in a delicate balance." He calls for a system where money creation is not the
rule, in a framework of fixed exchange rate regime.
In major developed countries, the States have given up the control of the money to the private sphere.
This had for effect to force them to borrow money from the commercial banks, paying them interest, which
lead States contracting huge debts. The paying back of the public debts is still a question. This led the States
to be deeply in debt, which make it hard for them to borrow money when it is necessary. For example, to
avoid banks to go bankrupt.
In the meantime, the financial world has been deregulated over the decades. Commercial banks
and investors has been let free to create complex financial products, speculate on inflation, trade in
hedge funds and so on. The anarchy in which the world has grown led it to happen fragile, unsure, and
unstable. Economic agents are interdependent and the fall of one takes many down with it. And there’s few
the State can do about it because, as said earlier.
1. States are in deep debts and their borrowing capacity is weak
2. Private banks are the only one controlling the money creation
3. Commercial banks are therefore responsible of economic stability, without officially bearing the burden
Those three facts make today’s world instable. There is a need for a change. When the crisis struck,
everyone admitted it. Banks, newspapers, States, public opinion, economists… Despite their weak action
power, all over the world, States saved the banks when the system was in danger. If they hadn’t done so,
the whole system may have collapsed, on a worldwide basis. No one wants it to happen. This would be a
major disaster. Therefore, there is an urgent need for deeply reforming the financial system, to strengthen
it. Otherwise, the next crisis may be the last.
We are now going to set up the bases of what should be the new system. We are going to look at the
weaknesses of the current system, and try to make it safer, stronger, more reliable, and more ready to face
crises. A system that would eliminate, or at least reduce, the amplitude of the expansion / crisis periods the
economy has been growing around.
With an experience of at least two centuries, all kinds of disorders and the estate expansion and
recession periods observed constantly, must be considered as two major factors that have amplified them
significantly are creating money and purchasing by ex nihilo credit mechanism and financing of long-term
funds borrowed short-term investments. However, it could easily be fixed to these two factors by overall
reform which would otherwise terminate cyclical fluctuations, at least to considerably reduce the scale.
In fact, as we saw in the first part, the current system of credit, including historical origin was entirely
contingent, and seems totally irrational, and this for five reasons:
1. Creating irresponsible money and buying power by commercial banks;
2. Financing long-term funds borrowed short-term investments;
3. High sensitivity of the cyclical credit mechanism;
4. Financial instability it creates;
5. And finally the impossibility of any effective system by the public credit control and Parliament, due to
its extraordinary complexity.
This reform must be based on two very basic principles:
Monetary creation should be the State and the State only. Any other than the currency basis by the
Central Bank monetary creation must be impossible, so that disappear ''false rights'' currently resulting from
the commercial banking currency creating.

420
Any financing of a given asset must be done according the borrower capacity to pay back the loan
at the time of the loan, not speculating on long term predictions.
The mechanism of credit reform should thus make impossible both currency ex nihilo creation
and borrowing short-term to fund long term loans , by not only allowing loans to haul more than borrowed
funds deadlines. As we saw previously, enables banks to finance investments in the long term on the basis
of loans of depositors in the short term, resulting in permanent and potential system instability.
Creation of Scriptural currency depends on a dual commitment, willingness to banks to lend, and the
willingness of economic agents to borrow. In times of prosperity, this dual desire exists and the Scriptural
currency increases. In times of recession, this dual desire disappears, and the Scriptural currency decreases.
Indeed, without the creation of money and you can purchase scratch allows the credit system, never
extraordinary increases in stock market courses there before major crises are possible. Thomas Jefferson
wrote:
“Bank paper must be suppressed, and the circulating medium must be restored to the nation to whom
it belongs. It is the only fund on which they can rely for loans; it is the only resource which can never fail
them, and it is an abundant one for every necessary purpose. Treasury bills, bottomed on taxes, bearing or
not bearing interest, as may be found necessary, thrown into circulation will take the place of so much gold
and silver, which last, when crowded, will find an efflux into other countries, and thus keep the quantum
of medium at its salutary level. Let banks continue if they please, but let them discount for cash alone or
for treasury notes.”
Thomas Jefferson, 1743 – 1826, The Writings of Thomas Jefferson, Memorial Edition.
Thomas Jefferson, doesn’t want to suppress the banks. They are in fact a need for economic expansion,
supplying financings, loans, and means of payments. They enhance the economic growth. But the monetary
creation must be controlled by a central bank, and according to the actual economic growth.
This double condition implies a profound change of banking and financial structures based on total
banking activities dissociation as they find today and their allocation to three categories of separate and
independent institutions:
1. Deposit banks ensuring only, for any operation of loan, cash receipts and payments, custody deposits
of their customers, the costs invoiced to it, and cannot contain any discovered; customer accounts. The
bank's fees would be source of the income the Bank would get.
2. Lending banks that would offer loans and mortgages at specific terms, and lending funds that they had
to borrow on a longer terms, the total loan amount not exceeding the total borrowed funds;
3. Business banks that would find their funding borrowing directly from the private sphere or the lending
banks, and investing the funds borrowed in the economy.
In principle, such a reform would make impossible monetary creation and ex nihilo by banking and
borrowing short-term purchasing power to finance more long term loans. It would only shorter than those
corresponding to the borrowed funds maturity loans. Lending banks and merchant banks use intermediaries
between savers and borrowers. They would be subject to a mandatory requirement: borrow long-term to
lend in the shorter term, contrary to what happens today.
In the current system, the three banks are one in most of the cases. This drives them dependent from
one another. The money you save is used by the business section of the bank to invest. It also covers (on
a fractional basis) the loans the bank grants. If one of them encounters difficulties, it can drag the other
down. If the stock market in which the savers’ money is invested goes down, the bank can go bankrupt and
the person who just deposited his money loses it.
In the new order, those three activities would be separated. This strongly reduces the risk of systemic
crisis. If the stock market goes down, it doesn’t mean that people’s savings are going to be in danger in case
of the business bank goes bankrupt.

421
6. CONCLUSION
The monetary system as it stands today has appeared contingently, by accident. The principle of
monetary creation ex nihilo has allowed the worldwide economy to grow faster, but in a more and more
anarchic, or liberal, environment. Its control and benefits now belong to the private sphere, which is not
only unfair, but also generator of crisis.
The commercial banks now control the economy, while the State has given away this economic
regulation power. Banks can now create almost as much money as they want, as long as they make profit
out of it, and they do. They don’t care, and it is not their role, about economic stability and social equity.
The legal (and non-mechanical) obligation for the States to borrow the needed funds to finance its
investments from the money markets has gained. Promoting liberalism, States deprived themselves from
the capacity to be financed by its Central Bank. It has been the case in France since 1973. Ever since, States
are deep in debt. It created the need for States to lower its investments and higher taxes to pay private
investors. This had for main effect the paralyses States’ budget and capacity of action. The worst being that
if the State had, during all these years, been able be financed by its Central Bank, meaning without having
to pay interest, countries would not be so deep in debt.
In addition to be unfairly controlled by the private sphere, the monetary creation system is generator
of economic instability. Potentially unlimited quantities of currency that can be offered by commercial
banks allow speculators to invest as much as they want, as long as they trust the future. This creates periods
of fast economic growth that always ends up in crises when they are too fast. Crises that follow are
attributable to uncontrolled and unreasoned investments by commercial banks.
For these two reasons at least, the monetary creation control must be given to a Central Bank. This
independent entity would be granted the possibility to finance the State’s investment at no interest.
Profits made in interests by the money created would be used to repay the existing debt. This would give
the public the power to 1) easily borrow money when the situation requires it 2) ensure the economic
competitiveness, stability and growth. The increased control of the Central Bank over the supply of money
evolution would keep it in congruence with the actual economic growth, thus preventing over monetary
creation, resulting in crises.
7. RECOMMENDATION
After having analyzed the current global financial system weaknesses, we would advocate the
following recommendation:
1. The power of monetary creation must be restored to the collectivity, which it belongs to. It must not be
given to politics, but to an independent Central Bank that would have for role to control the supply of money
and economic stability.
2. The banking industry has to be split up in three independent entities: deposit, lending and investment
banking. This would protect depositor from bankruptcy and banks from massive withdrawal risks.
3. Stock markets need to quote stock prices on a daily basis, trading software need to be forbidden, and
banks should not be able to speculate for themselves.
The main objectives would be the end of expansion and recession periods, through a better economic
stability; a fairer distribution of the income resulting from money creation; and the building of a more
reliable global financial system and improved competitiveness.
REFERENCES
Allais, Maurice, (1999), La Crise Mondiale d'aujourdhui. 1st ed. France: C. Juglar.

422
Maurice Allais (1998), "For profound reforms of the world’s financial and monetary institutions",
three-part series, appeared in the French daily Le Figaro on Oct. 12, March 26, and April 2, issues,
Copyright Le Figaro, no. 9812009
André-Jacques Holbecq et Philippe Derudder, (2015), Dette Publique une Affaire Rentable. 3rd ed.
Yves Michel.
Bofinger, Peter, (2001), "Monetary policy: goals institutions, strategies and instruments", Oxford:
Oxford University.
Dinopoulos, E. and Petsas, I. (2000), "Greece and the Euro". Gainesville, FL. University
of Florida. Department of Economics; available from
http://citeseerx.ist.psu.edu/viewdoc/download?doi=10.1.1.199.5492&rep=rep1&type=pdf ; Internet
(Accessed: 4/10/ 2015).
Eichengreen, B. (1992), "Should the Maastricht treaty be saved?", Princeton University,
Princeton studies in international finance web site; available from
http://www.princeton.edu/~ies/IES_Studies/S74.pdf; Internet; (Accessed: 6/11/2015).
European Central Bank. (2012),"Government finances in the euro area (as a percentage of
GDP"); available from http://www.ecb.int/stats/gov/html/dashboard.en.html;
Internet; (Accessed: 5/16/ 2015).
European Union. “Conditions for membership”; available from http://ec.europa.eu/
enlargement/policy/conditions-membership/index_en.htm; Internet; (Accessed:
5/22/2013).
Estralla, Arturo and Mishkin, Frederic, (1997), Is there a role for monetary aggregates in the conduct
of monetary policy? California: Cambridge.
Etienne, Chouard's (2007), "non-ce-n-est-pas-trop-cher-le-financement-des-besoins-collectifs-est-
rendu-scienmment-ruineux", Available at: http://etienne.chouard.free.fr/Europe/forun/index.php?
(Accessed: 9/17/2015).
Hugh, Dalton (1929), Principles of Public Finance, George Routledge, Broadway House, London
"Les faux monnayeurs" (1999), “the money counterfeiters”, Available at:
http://www.fauxmonnayeurs.org/ (Accessed: 9/17/2015).
Ludwig Von Mises, (1912), The Theory of Money and Credit, Translated from German to English by
J.E. Batson 1934, Publisher: Ludwig Von Mises Institute.
"Money Creation", (2015), Available at:http://en.wikipedia.org/wiki/Money_creation. (Accessed:
8/30/2015).
Norris, M. and Mackanzie, M. (2011). “How did European financial crisis start?”
available from http://www.npr.org/ 2011/09/12/140409300/how-did-europes-financial-crisis-start ;
Internet; (Accessed 6/14/2015).
Plihon, Dominique, (2008), La monnaie et ses mécanismes, 5th ed. Paris: La Decouverte.
"Pour ceux qui croient à une politique monétaire active", (2015). Available at: http://www.chomage-
et-monnaie.org/Documentshtml/MonPerPub.html (Accessed: 17/9/2015).
Robert Toulemon, (2009). Le Nouveau Journal. Available at:
http://toulemon.blogspot.com.au/2009/02/un-changement-de-paradigme.html (Accessed: 9/15/2015)
Salim Lamrani (2012) "How Private Banks are getting Rich off the Backs of the Citizens", Available
at: www.huffingtonpost.com/.../public-debt-in-france- (Accessed: 10/9/2015).
Xavier Sala-i-Martin Professor, Chief Advisor of the Centre for Global Competitiveness and
Performance, "The Global Competitiveness Report", (2011-2012), Columbia University, Editor
Professor Klaus Schwab, World Economic Forum.
-

423
Information Policy Interactions: Net Neutrality and
Access to Information in US and India
Ramesh Subramanian
Quinnipiac University
USA
Introduction
As the Internet gains an almost ubiquitous status in much of today’s world, free and open access to the
Internet has become an increasing concern. The World Summit on the Information Society (WSIS),
convened in Geneva under the auspices of the United Nations in December 2003, reaffirmed the criticality
of free and open access to information in its Declaration of Principles. The Declaration stated that such
access is important to maintain and strengthen human rights, to enable sustainable development and to
enhance the quality of life for all. The same year, a Columbia University Media Law professor, Tim Wu,
coined the term Net Neutrality (Wu, 2003). The principle of net neutrality is that governments and Internet
service providers (ISPs) should treat all data on the Internet equally, and not discriminate or charge
differential prices to different users. The proponents of net neutrality aim to promote and advance the core
principle of open access to the Internet. The argument is that access to information via the Internet is the
critical factor that drives innovation, growth and sustainability in today’s global economy. Indeed, access
to the Internet is increasingly considered a basic right. Net neutrality is at its core a public policy and
regulatory issue, and assumes that access to the Internet will be governed by policy and regulations. The
issue of net neutrality has gained high import in many countries around the world, and net neutrality debates
are becoming more prevalent at present.
This paper examines and compares the progress of net neutrality in the US and India. These two nations
are very important and useful in the discussion on net neutrality. Both are large, and at times dysfunctional
democracies. The US is a developed, mature economy with the highest GDP (IMF, 2015), whereas India is
an emerging economy, with the highest GDP growth at present. The US and India have the third and second
largest number of Internet users, respectively. Both countries have enshrined the freedom of expression in
their Constitutions. Yet both have significant sections of their populations (albeit to a lesser degree in the
US) that do not have optimum levels of access to the Internet. A study of the paths taken by the two with
respect to net neutrality will thus offer useful information in understanding the core issues pertaining to net
neutrality, historical differences in the approaches taken by the two, the positive and negative aspects of the
approaches, and provide a basis for other nations to frame open access or net neutrality policies.
The paper begins by tracing the historical foundations of net neutrality, which is based on the principles
of monopoly franchise and common carriage originating in England. Then the paper traces the gradual
evolution of the common carriage concept into net neutrality in the US. The US has a long history with
respect to the application of common carriage prior to the Internet era, and the more recent debates on net
neutrality after the advent of the Internet. India, on the other hand, does not have that long a history with
respect to the Internet as well as net neutrality. However, its stance with respect to this issue, as well as the
policy interactions that are taking place at present are very useful and illustrative, especially to understand
the issues of net neutrality in a developing nation. Net neutrality in India is therefore addressed next. Finally,
the paper concludes with an analysis of the different approaches adopted and results achieved thus far by
these two countries on the issue of net neutrality.

424
Methodology
Our objective is to explain transformations in net neutrality in US and India in terms of interactions
among various players, civil society, private interests, and technological developments. We explore the
interactions that have produced and continue to produce telecommunications policies that address the issue
of equal and non-discriminatory access to information to all citizens. We study the history and evolution
focusing on interactions among civil society, political and regulatory bodies, Internet service providers,
content providers, transnational governance bodies and users. Therefore, our methodology consists of
historiographic research, and interviews and published opinions of civil society players and representatives
from the industry and academic communities. The historical discussion and governmental views have been
excerpted from published policy papers, reports and judgments from court cases.
Historical Foundations of Net Neutrality
To understand the justifications and arguments for net neutrality, we need to start at the origins of the
concept. The origins of net neutrality can be traced to a 1672 essay by Sir Matthew Hale, Chief Justice of
the Kings Bench in the United Kingdom. In that essay, De Portibus Maris, he enunciated the concept of
monopoly franchise (McAllister, 1930). The essay laid out his case for regulation of a monopoly by
discussing the public and private uses of wharves (piers for mooring boats and ships). In those times, a river
technically belonged to the king. A wharf owner was a private entity allowed to build a wharf on the river
and operate businesses on it. According to Hale, this monopoly position of the wharf owner could not be
used to restrict the wharf only to some customers. All citizens should have access to the wharf. Though
privately constructed and owned, wharves are, in Hale’s words, “affected with a publick [sic] interest” that
makes them legitimate subjects of regulation (Hale, 1787).
In this case, the wharf owner became a “common carrier.” Under the monopoly franchise concept, a
carrier may be granted special rights, such as access rights, and in return, the carrier should not discriminate
among users, or exclude certain users from the use of the carrier, and the carrier should not charge excessive
fees due to its monopoly position (Jones, 1980; Riordan & Sappington, 1987). Thus, as early as the
seventeenth and eighteenth century, certain regulations governed and facilitated equal access to certain
common resources.
US and the Common Carrier
Early Telegraph Regulations
The US courts adopted this concept of common carrier as common law in deciding many cases over
the last two hundred-plus years. But the ground work for regulating the common carriers in the US was laid
in the years following the invention of the telegraph. The telegraph was invented by Samuel Morse in 1838.
In 1843, the US Congress funded $30,000 to construct a telegraph line from Washington, D.C., to Baltimore
– a distance of 40 miles. Soon the deployment of the telegraph became widespread, and by 1860s the
Western Union Telegraph Company became the market leader. Telegraph lines were laid alongside railway
lines, with easements to public lands granted by the government. In addition to its commercial use, the
telegraph proved its usefulness during the American Civil War from 1861-1985. Noticing this, US policy
makers realized the need to regulate the telegraph, and passed legislated from 1845 to 1879. As early as
1848 the state of New York enacted comprehensive telegraph legislation. The regulatory aspects of the
legislation were included in sections 11 and 12. They required service to all customers, including other
telegraph companies, on a non-discriminatory basis (State of New York, 1848).
Telephone Regulations
The telephone was patented in 1876 by Alexander Graham Bell, and the Bell Telephone Company was
started in 1877. Just as in the telegraph, telephone lines had to be constructed, on easements of public lands
leased from the government. Bell later became the American Telephone and Telegraph Company and

425
occupied a dominating position in the industry. It started aggressively defending its business against
competition from other independent telephone companies, and refused to sell them equipment or provide
interconnections (Burch, 1985; John, 2010). Fearing that this would lead to unequal telephone access to the
citizens, the US lawmakers once again enacted equal access laws. In almost all states, existing telegraph
legislation was made applicable to telephone companies. Thus, while telephone companies were given
access to use public thoroughfares and exercise the power of public domain, they were also subject to
statutory responsibilities just like the telegraph companies.
Emergence of Regulatory Agencies
An Interstate Commerce Commission (ICC) was set up in 1887 which initially oversaw the railroad
industry, but eventually was expanded to include bus services, telegraph and telephones. This was the
emergence of a commission set up to regulate telecommunications. Along with many regulations, telephone
companies could only merge upon ICC approval. But this last aspect (i.e. governing mergers) seems to
indicate that the government was actually beginning to ease some of its own regulations and restrictions on
telecommunications companies, and making allowances for mergers to take place under certain conditions.
Regulating Mass Communication - Radio
The radio was invented by Guglielmo Marconi in 1896, and the first radio broadcasts started in New
York in 1907. The Radio Act was passed in 1912 by the US Congress which gave the Department of
Commerce (DoC) authority to issue licenses to radio operators. The Act was further strengthened in in 1927
with the creation of the Federal Radio Commission (FRC), and more provisions to ensure that the public
interest was adequately served by a radio station. This is because just like the telegraph and telephone
infrastructure, the 'public' at large own the radio spectrum but individuals could be licensed to use it.
Important provisions of the Act were created to ensure that there was equality of transmission facilities,
reception and service, and that freedom of expression was protected (Sterling & Kittross, 2002; Messere,
1997). Because the number of users seeking licenses exceeded the number of channels available, the
Congress chose selection criteria based on the "public interest, convenience and/or necessity" (Messere,
1997).
However, despite all these Acts, the US government did not succeed in fully controlling the growth of
monopolies in the telecommunications and mass communications sectors. By 1934, the telecom sector was
run primarily by a few “natural monopolies” such as AT & T and Western Union. The US Congress sought
to unify the regulating authorities by combining the ICC and the FRC through enacting the Communications
Act of 1934, which created the Federal Communications Commission (FCC). The FCC was given broad
latitude to establish "a rapid, efficient, nation-wide, and world-wide wire and radio communication service”
(Messere, 2002).
Regulating Television
The television arrived in 1927, and radio companies started television broadcasts by 1928. By the
1950s, cable television was introduced. Regulating television and cable television also became the FCC’s
bailiwick. Initially, various television broadcasters were using different proprietary standards, requiring
different television sets to view programs. In 1941 the FCC convened the National Television System
Committee to arrive at broadcast standards. The FCC was also responsible for granting permission to air
advertisements on various channels and granting broadcast licenses. When the telephone companies started
offering cable television, the FCC was also concerned with making sure that existing telephone monopolies
did not further enhance their positions through cable TV offerings. The FCC was also concerned that since
the telephone companies controlled the distribution infrastructure (i.e. telephone poles and conduits), they
could exert control over competing service providers. This led to court cases being filed by and against the
FCC (McKenna, 1985).

426
60 years of the Communications Act and the FCC
The Communications Act was not revised until 1996. By then, technology had advanced exponentially.
But during this long period, the FCC had to address several types of new issues. The original intent of
regulations was based on the need to ensure that all citizens were served equally and without discrimination
when pubic goods (e.g. public lands, radio spectrum, etc.) were allocated for use by private entities. But
over time, there were competing interests: The FCC was required to ensure that there was adequate
competition while at the same time ensuring adequate freedom for companies to innovate. There was also
the issue of freedom of expression guaranteed by the First Amendment of the Constitution, and whether the
FCC was enabling or stifling the freedom of expression of corporations through some of its regulatory
actions. There were numerous court cases, leading to some momentous changes, such as the break-up of
AT&T, cases relating to foreign attachments on telephone equipment provided by companies (i.e. Hush-a-
phone (Auerbach, 2009)), extending telephone lines through wireless devices (i.e. Carterphone (McKenna,
1985)), etc. There is a vast body of work detailing the various court cases. Analysts have applauded as well
as criticized the FCC’s actions over this long period. A range of detailed analyses and viewpoints can be
found in the 1985 Special Issue supplement commemorating the 50th Anniversary of the Communications
Act of 1934, in the Federal Communications Law Journal (Federal Communications Law Journal, 1985).
Internet, Information Explosion and the Telecommunications Act of 1996
By 1996, new technologies such as satellite communications, computer networking and broadband
networks were becoming more and more accessible and popular among the public. Inter-networking and
the development of the World Wide Web in the early 1990s led to a spate of new companies being formed.
E-Commerce started gaining traction. The telecommunications industry as a whole was enjoying
tremendous growth. Congress decided to overhaul the Communications Act of 1934, which was seen as
cumbersome and outmoded. The newly rewritten legislation was called the Telecommunications Act of
1996 and was passed on February 1, 1996. President Clinton signed the bill into law on February 8, 1996.
The new law made several changes to existing regulations in radio and television broadcasting; cable
television; telephone services; Internet and online computer services; and telecommunications equipment
manufacturing.
The new Act placed more emphasis on enhancing competition in the industry as a way to spur the
development of new services in broadcasting, cable, and telecommunications. It also reasserted the role of
Congress as the main policymakers in telecommunications. The Act required the FCC to dismantle several
of the oversight rules that were specified in the Communications Act of 1934. President Clinton stated that
the new Act would “stimulate investment, promote competition, (and) provide open access for all citizens
to the Information Superhighway (The Museum of Broadcast Communications, n.d.).”
Many public interest groups protested what they saw as a substantial weakening of FCC, and power
gains by special interest groups and the industry. They argued that the weakening of regulations, especially
with respect to media ownership and the public interest aspects, would enable a few media companies to
completely control the market. This would in turn cause a digital divide, as many parts of the country would
be deemed to be of low market value, from a revenue generation point of view. It would also lead to
discrimination in the type and quality of services made available to the public at large.
Common Carriage evolves into Net Neutrality
Timothy Wu, a professor of media law at Columbia University is credited with coining the term
Network Neutrality or Net Neutrality in 2003 (Wu, 2003). He defines the term in the web site
www.timwu.org: “Network neutrality is best defined as a network design principle. The idea is that a
maximally useful public information network aspires to treat all content, sites, and platforms equally (Wu,
n.d.).” Ever since Tim Wu’s enunciation of net neutrality, the concept has gained tremendous attention
among legal scholars, activists, and academics. Many debates have ensued between Internet activists and
corporate lobbyists, politicians and university professors, and between minority groups in rural locations

427
and large governmental agencies in urban settings. Net neutrality battles have also been fought in courts
and in the media. It is also actively discussed at universities and in churches. Yet there has been no decisive
victory for any one side yet, or even a resolution. The term remains vague, and is often misused or
misinterpreted. Basically, it is important to note that net neutrality is in principle the same concept as the
“common carrier” rules of earlier times – that a common carrier who has been given certain special access
to public goods should be required to grant equal access to all citizens, without any discrimination.
So in the era of the Internet, the term “net neutrality” refers to the principle that Internet Service
Providers (ISPs) should not block or slow down Internet traffic from competing content providers with a
view to speed up their own content, or charge differential pricing based on the content or geographic
location of the consumer. This is especially in view of the fact that the ISPs and cable operators have been
granted special right-of-way access to public lands or other concessions by the government. According to
Susan Crawford, a professor of Law in at Harvard Law School, and President Barack Obama's Special
Assistant for Science, Technology, and Innovation Policy in 2009, the Internet “is like water, electricity,
sewage systems: Something that each and all Americans need to succeed in the modern era (The
Freedomist, 2009).”
Net Neutrality Battles and Unsolved Issues
These pro-net neutrality stances have been opposed by many in the telecommunications industry and
by those who adhere to strict free-market philosophy and believe that regulating net neutrality will curb
innovation and competition. They have filed lawsuits in opposition to a FCC 2005 “Broadband Policy
Statement” which listed some consumer entitlements, such as access the Internet content of their choice
[without restrictions], etc. The FCC stated that this was to “encourage broadband deployment and preserve
and promote the open and interconnected nature of the public Internet (F.C.C., 2005).”
The anti-net neutrality camp has had some important victories. In 2005, incumbent ISPs successfully
lobbied with the FCC to repeal their categorization as “common carriers,” as that categorization required
them to grant bandwidth to new ISPs at discounted rates (Corley & Stephens, 2010). In another case, in
2008 the FCC barred Comcast from using certain peer-to-peer management techniques that would in effect
slow down other traffic. But this action by the FCC was rejected by a Washington, D.C. appeals court in
2009.
Since 2005 several US legislators have tried to pass laws that would affect net neutrality. Many of
these have been killed by Congress. Bills that have managed to pass, such as Texas Republican Joe Barton’s
“Communications Opportunity, Promotion and Enhancement Bill of 2006” (COPE) have provisions that
actually weaken net neutrality.
In 2008, the FCC issued an order prohibiting Comcast, a major ISP, from resorting to certain network
management policies that throttled peer-to-peer data transmissions by customers. Comcast filed a legal
appeal against the order, and in 2010 the US Court of Appeals – D.C. Circuit vacated the FCC order by
holding that the FCC did not have any jurisdiction over Comcast, as Comcast was not deemed a common
carrier. This was followed by another setback for the FCC in 2014. In 2010 the FCC issued a set of
regulations called “FCC Open Internet Order” that aimed to formally establish net neutrality concepts. One
of the orders was to ensure there was no blocking or unreasonable discrimination in providing Internet
access. However, Verizon appealed against this order, and the US Court of Appeals - D. C. Circuit vacated
the order in 2014 (US Court of Appeals - D.C. Circuit, 2014). These two cases are considered a major loss
to net neutrality proponents and a victory to those opposed to the concept.
In November 2014, President Barak Obama entered the fray and made a speech urging the FCC to
take up strong rules to protect net neutrality. As of this writing, the tussle between the proponents and
opponents of net neutrality continue without any clear decision or result. However, if one were to go by the
court rulings, the opponents have won clear victories. Thus what started as a policy to enforce and regulate
“common carrier” communications providers so as to provide all citizens with equal access to information
has now become an issue of pro- and anti- free markets, and whether such policies will constrain or enhance
innovation.

428
In the following sections, we study the history and approach that India has taken in the quest to achieve
net neutrality.
Net Neutrality and India
The Indian experience on net neutrality offers notable contrasts with that of the US discussed above.
Firstly, India was under British colonial rule for almost two centuries, from 1757 to 1947. This colonial
experience has deeply influenced and shaped India’s telecommunications policies in pre- and post- colonial
times. Secondly, post-independence policies have tended to have socialist leanings, with the state playing
an important role in laying down policies. The focus has been towards national development and poverty
reduction. As in the case of the US above, we start with a brief historical account of telecommunications
policies and trace how those have evolved into net neutrality policies.
The Arrival of Telegraph and the Indian Telegraph Act of 1885
In 1848, James Andrew Broun Ramsay, Marquee of Dalhousie (1812 – 1860), also known as Lord
Dalhousie, was appointed the governor - general of India by the East India Company. His mission was
simple: to unify India, a land of numerous kingdoms, and control it. Under him, the first telegraph lines in
India were laid in 1851 by the British government. These were mostly installed near Calcutta, which was
then the headquarters of the British government in India. The British rulers were primarily interested in
telecommunications as a law-and-order maintenance tool (Headrick, 1988). There was no question of public
interest. The governing apparatus of the colonial rulers planned, constructed and controlled the telegraph
systems.
The importance of the telegraph in asserting the authority of the British became apparent during the
Indian Rebellion of 1857, when a group of Indian soldiers serving under the East India Company rebelled
against the British, and rapidly captured large areas controlled by the British (Hibbert, 1980). Many
accounts mention the use of the telegraph by the British to quickly relay information on the movements of
the mutineers, and the uprising was eventually subdued. The British government passed the Indian
Telegraph Act in 1885, whereby it retained “exclusive privilege of establishing, maintaining and working
telegraphs (IndiaKanoon.org, n.d.).”
Arrival of the Telephone and Benign Neglect of the Telephone after Independence
Less than five years after the Bell Telephone Company was set up in the US, in 1881, a British firm,
The Oriental Telephone Company, brought the first telephone service to India. A few other firms were also
granted license to operate telephone services in urban centers until 1944 by the British government (Mann,
n.d.). At the time of India’s independence in 1947, these firms had set up 321 telephone exchanges, mostly
in five Indian cities, 86,000 working lines and 338 long-distance public-call offices. The telephone density
(teledensity9) was a very low 0.25 (Mody, 1995). Telephones also came under the Telegraph Act of 1885.
At the time of independence, the Indian government decided that its telegraph and telephone systems
would be a government monopoly administered by its own civil service (Menon, 1999). Thus, at the time
of independence, all foreign telecommunications companies were nationalized to create the Posts,
Telephone and Telegraph (PTT) a state-run monopoly run by the Department of Communications. In doing
this, the central government retained complete control of telecommunications, a legacy of British colonial
rule.
After independence the Indian leaders embarked on a socialist model of development which imposed
harsh restrictions on foreign imports. The focus was on complete self-reliance. Anything foreign was
considered with suspicion. Under the PTT monopoly, telephones were not considered as an essential
service. Rather, it was considered to be a luxury. New telephone lines were added only to cities and
Teledensity is the number of telephone connections for every hundred individuals living within an area. 9

429
metropolitan centers. The service and maintenance were poor. International connectivity was poor. A 2003
report of the International Telecommunications Union shows that in 2002, the PTT had a waiting list of
over 1.6 million for telephone connections (Goodrick, 2003). During the years of the PTT monopoly, rural
telecommunications infrastructure underwent a benign neglect. This was partly because of the enormous
cost of developing infrastructure in rural India, and partly because of the rural populace’s low level of
economic development, which severely undercut such a population’s ability to pay for telecommunications
service. Thus vast sections of the Indian populace did not have any access to information even four decades
after independence.
The situation became a vicious cycle. Lack of economic development reduced the ability of the
populace to pay for communications services, and without revenues, and lackadaisical support from the
government, the telecommunications sector went into a state of benign neglect. The situation began to
change only in the early 1980s when the Indian leaders, faced with acute balance of payment issues, finally
realized that the years of socialist economic policies were not working and that the Indian economy had to
undergo liberalization. The economic liberalization policies started in the 1980s also ushered in liberalized
telecommunications policies.
Tentative Steps Towards Corporatization: The DOT, MTNL and VSNL
The first steps to enhance access to information to the vast Indian public were taken in 1985, when the
Department of Telecommunications was created, separate from posts and telegraphs. This was followed in
1986 by the creation of the Mahanagar Telephone Nigam Limited (MTNL), a public-sector “corporation”
to run the telephone services in metropolitan areas such as Delhi and Mumbai. The Videsh Sanchar Nigam
Limited is another public-sector corporation, was also created 1986 to run international
telecommunications. But these corporations were still controlled, directly or indirectly, by the DoT.
Top-down Telecommunications Development
In 1994, the National Telecom Policy was announced. The expectations of the industry were however,
dashed, as much of the nation’s telecom developmental work was left under control of the DOT. Private
industry was relegated to take up supplementary work of telecom development. The DOT imposed strict
conditions on private enterprises getting into the telecom sector with a view to ensuring a balanced
telecommunications growth, especially growth in rural areas (Bagchi, 2000). While this was not such a
good deal for private telecom companies, it is clear that the government wanted more role in ensuring rural
development through more access to information. This is almost similar to the early US attempts to regulate
telecom, except that in India, the private sector’s role was not much apparent at this time. Some of the
conditions in the National Telecom Policy 1994 included (from Bagchi, 2000):
The private entity had to be a joint company formed with the participation of an Indian
company
Licensees must give at least 10 per cent of all lines to rural areas
The licensee’s network must cover all the districts in the area within 24 month
Prices charged by the DoT (where it was the competitor) would be ceiling for the prices
that private sector firms could charge; of course, they had the freedom to charge a lower rate
While such regulations had national development in mind, they did not in any way enhance innovation
driven by market competition. The situation was almost diametrically opposite that of the US approach.
The unrealistic policies discouraged several private enterprises from entering the telecommunications
market, and as a result, rural telecommunications access suffered the most.
In an attempt to remedy the situation in 1997, the Telecommunications Regulatory Authority of India
(TRAI) was set up as an independent arbitrary authority to manage and influence the telecommunications
industry. TRAI was granted the power to regulate and oversee all telecommunications matters, and thus
enjoyed power over the DoT, which was until then the telecommunications policy-maker.

430
The New Telecom Policy of 1999 and Gradual Liberalization
In 1999, a new Telecom Policy was announced. The aim was to start afresh, as prior policy changes
had not brought forth the liberalization or the increase in teledensity as expected, especially in rural areas.
The objectives of the new National Telecom Policy (1999) were, as noted by Bagchi (2000):
Provision of universal service to all uncovered areas, including rural areas
Create a modern telecom infrastructure taking into account the convergence of IT, media,
telecom
Transform telecom sector to a competitive environment providing equal opportunities and
level playing field for all players
The policy also set several landmarks and targets to be achieved in the next ten years, such as (Bagchi,
2000):
Telephone on demand by the year 2002
Teledensity of 7 by 2005 and 15 by 2010
Telecom coverage of all villages by 2002
Increase rural teledensity from 0.5 to 4 by 2010
Internet access to all district headquarters by October 2000
Internet access to all villages by 2002
The new policy certainly attracted more private sector interest. However, the private sector was
moving rapidly towards wireless telecom. This trend started in 1991, when the DOT started issuing licenses
to private companies offering wired and wireless services. The private companies, no doubt realizing the
enormous infrastructure that would be required to bring wired connections to rural India, chose to focus
more on wireless telecom. Thus, the old paradigm of land-line telecom rapidly began to be leap-frogged.
Numerous private companies started to get into the telecom sector as a result.
In 2000, the government realized that TRAI had to be reconstituted, with more powers and
independence. By this time, deregulation of Indian telecommunications was really beginning to happen.
Wireless service providers have begun to proliferate in the Indian telecommunications arena. National
teledensity rates started to increase rapidly, as can be seen from the chart (Figure 1) below.
As can be noted from Figure 1, by March 2015, India’s rural teledensity was an impressive 48.37, and
overall teledensity was 79.38. However, as the figures show, much of the improvement has come from
wireless penetration rather than wired penetration. This was possible only because private companies were
allowed to operate in the telecom sector stating in the early 1990s. It is arguable that if private companies
were not allowed into the telecom sector, the government-run enterprises would be focused on developing
the previous generation technology, namely wired telecommunications. However, it should be noted here
that the private telecom operators do not have a “free ride” absent of all regulations. In fact, Indian private
telecom operators continue to operate under strict targets and regulations especially with respect to the
number of customers and regions served. Licenses to operate are issued by the DOT. But despite that, the
scenario in India clearly differs markedly from that in the US.

431
Figure 5: TRAI Highlights 2015
Broadband in India
India got its first Internet connection in 1986, through the ERNET project. But Internet access was
restricted to certain academic and scientific institutions and government agencies. Public Internet services
were first rolled out in India in 1995 by the government-run VSNL. However, for the first ten years, Internet
connectivity was spotty, and the connections were very slow, and restricted to 56Kbps dial-up connections.
Despite that, Indians, especially in urban India, flocked to use and experience the Internet wherever they
could find a connection. Internet cafes mushroomed in the mid-1990s.
The government formulated a comprehensive broadband policy in 2004. It defined broadband as "an
always-on Internet connection with download speed of 256 kbps or above (TRAI, 2010)." The policy thus
laid out the licensing requirements for private operators who were interested in providing broadband
services. This paved the way for the entry of private Internet service providers. However, the Internet
penetration was still lower than government expectations. This was due to the fact that the last mile to the
customer was still controlled by the government-run BSNL and MTNL. Nevertheless, Internet penetration
started increasing rapidly from 2005 onwards. There were 0.18 million broadband connections in March
2005. This increased to 10.3 million by September 2010. Internet-based commerce was beginning to
accelerate.
In 2010, 3G and 4G spectrum was auctioned in India to wireless providers. The auctions were very
successful, and in September 2010, Tata Docomo became the first wireless operator to provide 3G services
in India (Press Trust of India, 2010). Wireless broadband access completely changed the climate for Internet
in India. E-Commerce started to flourish. By 2015, broadband subscribers were numbered at 120 million
(TRAI, 2015), and India has rapidly become the country with the third largest number of Internet users in
the world, with over 375million users (Internet World Stats, 2016).

432
The Net Neutrality Debate Comes to India
The tremendous growth of wireless services and wireless broadband in India over the last decade has
greatly increased the economic prospects of rural areas and the rural populace. It is greatly reduced the
urban-rural divide. There was not much discussion of the concept of net neutrality, because the government
had always actively regulated and set rules for private companies to operate in the telecom sector. The
government routinely set targets with respect to the areas and the number of (rural) customers served and
licenses were granted or revoked based upon the results achieved. As a result, the private telecom operators
have always operated under very low profit margins, depending upon volume for their profits and growth.
However, this situation started to change by 2012. The private wireless operators began to notice that
customers started using Internet-based apps like WhatsApp, which was covered by their data plans, to
conduct voice conversations. The CEO of Bharti Airtel, the largest wireless operator in India, began to
suggest that Internet companies like YouTube should pay interconnect charges to wireless companies.
Later, the company suggested that companies like Facebook and Google should share revenues with
wireless service providers. But these suggestions did not see any results. Then the situation changed in
2014, when Airtel, announced additional charges to customers for making voice calls (VoIP calls) using
Internet-based applications such as WhatsApp and Skype. The company clearly saw a decrease to its own
voice-based revenues through these apps.
This led to a big outcry in India, and charges that Airtel was violating the principle of net neutrality
began to circulate. In response, in March 2015, TRAI released a formal consultation paper on Regulatory
Framework for Over-the-top (OTT) services, seeking comments from the public. The paper provided a long
list of over-the-top (OTT) services that might fall under the category that could be charged separately by
wireless providers. The TRAI statement indicated that it did not see Airtel as violating net neutrality and
that it was not illegal, as there was no legal framework for net neutrality in India. The intent of TRAI was
to ask the public for comments. However, its tone was widely criticized by the public, activists, academics
and politicians alike, who saw TRAI as caving to Airtel’s proposal to charge differential fees and for
seeming to provide a formal vehicle to achieve it.
In response to all the criticism, on February 8, 2016, TRAI released a statement prohibiting
discriminatory tariffs for data services. This ruling hailed been hailed by the world-wide Internet
community.
Analysis and Conclusion
The above discussion has attempted to discuss the concept of net neutrality, and provide a comparison
of net neutrality discussion in the US and India. Net neutrality is a very important concept that directly
affects access to information, which in turn affects the development and growth of nations and the well-
being of citizens. In order to maintain sustainable growth, it is critical to enhance and maintain net
neutrality.
It is clear from the above discussion that the two countries have approached net neutrality in
diametrically opposite ways. In the US, early attempts to regulate telecommunications has gradually met
with opposition from those who perceive such regulations to be against free-market principles and a
constraint on innovation. However, proponents and analysts such as Tim Wu note that innovation and
regulation need not be a zero-sum game. The court victories by opponents of net neutrality seem to come
with threats such as the potential to engage in discriminatory service practices. This would go against the
basic principle of common carriage, whereby a monopoly franchise is granted use of a public good and is
in return expected to provide services without any discrimination. But the court rulings are not likely to end
the discussion on net neutrality any time soon, and more protracted battles are likely to ensue in the future.

433
In India, the focus has of the government has always been on national development, education, and
poverty reduction, rather than enhancing free-market. To that end, the Indian government formulated
socialist-leaning policies over the years, only to find limited success. Success was in fact achieved only
after restrictive policies were relaxed and private operators were allowed to enter the telecommunications
sector. But with the tremendous new growth in Internet and the Internet service providers, issues similar to
those in the US are beginning to appear, in the form of demands by wireless ISPs to be allowed to enhance
revenues through differential pricing for services. These attempts have been put on hold by the most recent
ruling by TRAI. But it is likely that there will be challenges to this ruling in the future. It is important for
India to enact laws that will accommodate its developmental needs while also allowing for free-market and
innovations to flourish in the private sector.
References
Auerbach, K. (2009, February 4). HUSH-A-PHONE CORPORATION and Harry C. Tuttle, Petitioners,
v. UNITED STATES of America and Federal Communications Commission. Retrieved May 31, 2012,
from http://www.cavebear.com/archive/ialc/hush-a-phone.htm
Bagchi, P. (2000, December). Telecommunications reform and the State in India: The contradiction of
private control and government competition | CASI Occasional paper # 13. Center for Advanced Study
of India, University of Pennsylvania.
Burch, D. (1985). Common Carrier Communications by Wire and Radio: A Retrospective. Federal
Communications Law Journal, 37, 85.
Corley, K., & Stephens, J. (2010, June). Net Neutrality: Opposing Sides Divided Over Meaning, Impact
- Part 1. San Francisco Daily Journal. Retrieved from http://www.sdma.com/net-neutrality-opposing-
sides-divided-over-meaning-impact-06-10-2010/
F.C.C. (2005, September 23). FCC-05-151A1. Retrieved from
http://hraunfoss.fcc.gov/edocs_public/attachmatch/FCC-05-151A1.pdf
Federal Communications Law Journal. (1985). 50TH ANNIVERSARY OF THE
COMMUNICATIONS ACT: SPECIAL SUPPLEMENT: Communications Law -- A Half Century Later
(Vol. 73).
Goodrick, J. (Ed.). (2003). Access indicators for the information society. Geneva: International
Telecommunication Union.
Hale, M. L. (1787). De Portibus Maris. In F. Hargrave’s Tracts Relative to the Law of England (pp. 77–
78). Dublin: Hargrave.
Headrick, D. R. (1988). The Tentacles of Progress: Technology Transfer in the Age of Imperialism,
1850-1940. Oxford University Press.
Hibbert, C. (1980). The Great Mutiny: India 1857. London: Allen Lane.
IMF. (2015, October). World Economic Outlook Database October 2015. Retrieved February 12, 2016,
from http://www.imf.org/external/pubs/ft/weo/2015/02/weodata/index.aspx
IndiaKanoon.org. (n.d.). Section 4(1) in The Indian Telegraph Act, 1885. Retrieved February 13, 2016,
from http://indiankanoon.org/doc/1281561/
Internet World Stats. (2016, February 2). Asia Internet Usage Stats Facebook and Population Statistics.
Retrieved February 14, 2016, from http://www.internetworldstats.com/stats3.htm
John, R. (2010). Network Nation: Inventing American Telecommunications. Cambridge, MA, USA and
London, UK: Belknap Press of Harvard University Press.
Jones, W. (1980, April 4). Cybertelecom :: CC Concept as Applied to Telecom. Retrieved May 28, 2012,
from http://www.cybertelecom.org/notes/jones.htm
Mann, M. (n.d.). Telecommunication and the Public Sphere in British India, 1850-1950 — Institute of
Asian and African Studies [Page]. Retrieved February 13, 2016, from https://www.iaaw.hu-
berlin.de/en/region/southasia/research/projects/completed/communication
434
McAllister, B. P. (1930). Lord Hale and Business Affected with a Public Interest. Harvard Law Review,
43(5), 759–791.
McKenna, R. (1985). Preemptions under the Communications Act. Federal Communications Law
Journal, 37(3), 10–63.
Menon, A. R. (1999, May). India: Adopting a Pro-Competitive Policy for Telecommunications.
Retrieved from
http://www.commercialdiplomacy.org/ma_projects/ma_india1.htm#the%20history%20of%20telecom
munications%20services%20in%20india
Messere, F. (1997, August 22). Home of the Federal Radio Commission Archives. Retrieved May 26,
2012, from http://www.oswego.edu/~messere/FRCpage.html
Messere, F. (2002). Analysis of the Federal Communications Commission - Overview. Retrieved May
27, 2012, from http://www.oswego.edu/~messere/FCC1.html
Mody, B. (1995). State consolidation through liberalization of telecommunications services in India.
Journal of Communication, 45(4).
Press Trust of India. (2010, April 9). 3G spectrum auction begins smoothly, top telecom operators in
fray - Times of India. Retrieved February 14, 2016, from
http://timesofindia.indiatimes.com/business/india-business/3G-spectrum-auction-begins-smoothly-top-
telecom-operators-in-fray/articleshow/5776917.cms?
Riordan, M. H., & Sappington, D. E. M. (1987). Awarding Monopoly Franchises. American Economic
Review, 77(3), 375–387.
State of New York. Act of May 12, 1848, NY Laws, L.1848 Transportation Corporations Law § 11
(1848).
Sterling, C. H., & Kittross, J. M. (2002). Stay Tuned: A History of American Broadcasting. Psychology
Press.
The Freedomist. (2009, September 27). Internet Czar Susan Crawford is Net Neutrality Advocate-
Broadband redistribution- socialist-style | The Freedomist. Retrieved May 22, 2012, from
http://freedomist.com/2009/09/internet-czar-susan-crawford-is-net-neutrality-advocate-broadband-
redistribution-socialist-style/
The Museum of Broadcast Communications. (n.d.). U.S. POLICY: TELECOMMUNICATIONS ACT
OF 1996. Retrieved June 1, 2012, from http://www.museum.tv/eotvsection.php?entrycode=uspolicyt
TRAI. (2010, December 8). Recommendations on National Broadband Plan. Retrieved February 14,
2016, from
http://www.trai.gov.in/WriteReadData/Recommendation/Documents/Rcommendation81210.pdf
TRAI. (2015, November 18). Press Release - Highlights of Telecom Subscription Data as on 30th
September, 2015. Retrieved February 14, 2016, from
http://www.trai.gov.in/WriteReadData/PressRealease/Document/PR_No.65_TSD_Sep_15.pdf
US Court of Appeals - D.C. Circuit. (2014, January 14). Verizon v. FCC. Retrieved February 13, 2016,
from
https://www.cadc.uscourts.gov/internet/opinions.nsf/3AF8B4D938CDEEA685257C6000532062/$file/
11-1355-1474943.pdf
Wu, T. (2003). Network Neutrality, Broadband Discrimination. Journal of Telecommunications and
High Technology, 2, 141.
Wu, T. (n.d.). Network Neutrality FAQ. Retrieved May 16, 2012, from
http://timwu.org/network_neutrality.html

435
Public Listing, Context and CSR: The Effects of Legal
Origin
Geoffrey Wood Salim Chahine Marc Goergen
University of Essex,
Wivenhoe Park, Colchester
American University in
Beirut Cardiff University
UK Lebanon UK
Chris Brewster
University of Reading
UK
Abstract:
The literature on legal origin argues that legal institutions mold what firms do: within common law
systems, shareholder rights are much stronger, reducing agency issues. We explore whether publicly-listed
companies are more likely to have corporate social responsibility (CSR) codes than privately-held
companies, and whether the association between a public listing and the existence of a CSR code is affected
by the company’s location within a specific institutional and cultural setting. We conclude that proposals
to introduce more ethical dimensions to the behavior of firms need to be thought through: what works in
one location may be inappropriate in another.
1. Introduction
The rising interest in corporate social responsibility (CSR) around the globe has raised questions about
the impact of stock exchange listing and of institutional setting, since in some countries stock exchanges
are less influential. Carter et al. (2000: 219) define CSR as: “…the managerial consideration of non-market
forces or social aspects of corporate activity outside of a market or regulatory framework and includes
consideration of issues such as employee welfare, community programs, charitable donations, and
environmental protection.”
Committing to and developing CSR activities is a means whereby firms indicate their role in society,
either in response to external pressures and/or in order to enhance their reputation (Carroll, 2000). CSR is
associated with reputation, considered a corporate asset which management must conserve and enhance to
secure a competitive advantage, through its greater anticipation of, and responsiveness to, external changes.
From a financial perspective, and based on the so-called ‘universal owner’ hypothesis, CSR may be driven
by shareholders, such as pension funds, recognizing the virtues of long-term sustainability in their holdings
(Hawley and Williams, 2000; Deakin and Hobbs, 2007). For example, Becchetti et al. (2012) find that
investors track socially responsible companies and react negatively to firms exiting the Domini 400 Social
Index.10 CSR may therefore be an effective tool to increase the support of ‘ethically responsible’ consumers
and improve firm image and reputation. In turn, this would have a positive effect on individuals’
consumption of the firm’s products and services and investment choices (Becker-Olsen et al., 2006; Park
et al., 2014; Shea, 2010).
; corporate : communityattributesidentifies strengths and weaknesses for each of the following This index 10
governance; diversity; employee relations; environment; human rights; product quality; and controversial business
issues. When the stock no longer passes the qualitative screening process, the stock is excluded from the index.

436
Within the literature on comparative corporate governance, there has been growing interest in the
effects of legal origin on firm practices, as a means of accounting for unevenness in firm performance and
societal outcomes. It is held that, under common law systems, shareholders enjoy greater rights, and this
will mold the choices made by managers; the former are more able to reign in the latter, and subject them
more closely to their agenda than is the case within the different manifestations of civil law (La Porta et al.,
2008; Qi et al., 2011). However, a limitation of this literature is its limited focus on the law and macro-
economic outcomes, with the firm being depicted as a mere transmission belt. In other words, there is a
tendency to neglect variations in intra-firm dynamics and practices (c.f. Wood et al., 2014). This paper
seeks to redress this shortfall through an evaluation of comparative survey evidence. It explores the extent
to which firms are formally committed to social responsibility according to whether they are common law
or not.
In the common law system, shareholders are legally privileged and, it is argued that the key to
economic success is competition (La Porta et al., 2008). Countervailing stakeholder power is relatively
weak. In the civil law countries, shareholders are seen as just one amongst a number of stakeholders (the
others being managers, employees and their trade unions, communities and governments) that have a
legitimate impact on what the firm does (refer to Appendix 1 for the list of common and civil law countries).
Co-operation between businesses and between businesses and governments is seen as positive, rather than
anti-competitive. Some countries will have more regulation on CSR than others, particularly for publicly-
listed companies (Pagano et al., 1998).
In other words, the world can be divided into systems with shareholder primacy (common law systems)
and those where it is mediated in some way or another (La Porta et al., 2008; Hall and Soskice, 2001).
Importantly, it can be argued that whilst shareholder power is weaker in civil law countries, there is much
difference in organizational priorities and practices between them. A common criticism of legal origins
theory is that the panel of countries encompassed in the original analysis is very selective, and, in particular,
that the categories encompass countries at very different stages of development (Du, 2010). In the dataset
used for this article, the common law category encompasses only the mature developed liberal market
countries; however, the civil law countries encompass a range of transitional and more peripheral countries.
Hence, we first of all explore the differences between common law and civil law countries. In a subsequent
step, we remove transitional or emerging market economies.
In a second instance, we explore the impact of stock market listing. Listed firms may be pressurized
by stock markets into being more socially responsible, or at least more likely to have written CSR codes.
Such firms are more subject to public scrutiny than unlisted ones and, arguably, are impelled to be seen to
be taking CSR issues more seriously (van Cranenburgh et al., 2013) and this may even apply to small and
medium sized companies (Sen and Cowley, 2013). Therefore, we verify whether publicly-listed companies
that are exposed to public scrutiny are more likely to have a CSR code than privately-listed companies. We
also verify whether the association between a public listing and the existence of a CSR code is affected by
the location of the company, common or civil law.
The remainder of the paper is organized as follows. The next section presents our review of the
literature and our hypotheses. The methodology section discusses the data sources and the measures we use
to test our hypotheses. We then present the findings that listed firms are more likely to have a written CSR
statement than unlisted ones; that firms in common law countries are more likely to have written statements
than those in civil law countries; and that such statements are correlated with more employee-friendly
management practices. In the conclusion section we draw these threads together and argue that our findings
show the importance of taking into account a broad range of contextual differences when considering
proposals to introduce more ethical dimensions to the behavior of firms: what works in one location may
be inappropriate or difficult to sustain in another.

437
2. Review of the Literature and Development of Hypotheses
Legitimacy and CSR
Since poor relations with a wide range of stakeholders (especially as a result of the increasing media
spotlight) can ultimately lead to customers ‘voting with their dollars’, social responsibility issues may
assume a great importance in a wide range of settings. Yet, the relative prioritization of profitability
concerns versus stakeholder and societal wellbeing is likely to vary according to context, reflecting
variations in societal features, and formal and informal regulation.
Neo-liberal approaches to the firm traditionally suggested that “the social responsibility of business is
to increase its profits” (Friedman, 1970: 1). This would suggest that, in common law countries, where
shareholder rights are stronger, there would be less emphasis on socially responsible behavior. However,
legitimacy theory would suggest that businesses should create a socially responsible image to gain
acceptance and legitimization for their actions from their stakeholders. Legitimacy is defined as “a
generalized perception or assumption that the actions of an entity are desirable, proper or appropriate within
some socially constructed system of norms, values, beliefs and definitions” (Suchman, 1995: 574).
Legitimacy theory is based on the idea that society allows businesses to exist according to a ’social contract’
which is granted by stakeholders on the basis of how they perceive the organization (Suchman, 1995).
Legitimacy can be considered as the outcome of the perception of the public and the society (Aerts and
Cormier, 2009). Therefore, a company’s long-term survival may depend on whether stakeholders perceive
its actions as in line with basic societal norms.
From a cognitive legitimacy perspective, it could be argued that firms may develop CSR practices to
enhance their image and maintain or improve their legitimacy. Moreover, multinational enterprises
(MNEs), operating in an integrated world economy, are the focus of media attention (Crane et al., 2008),
thus possibly impelling them to further improve CSR, even in contexts where there are limited legal
constraints. Media and pressure groups have exposed companies’ activities and caused them to adopt
policies or take actions in a quest to extend their legitimacy (Palazzo and Scherer, 2006; van Cranenburgh
et al., 2013). Such pressure provides incentives for companies to seek to respond in such a way as to gain
approval and recognition for their commitments (Boiral, 2003).
However, if voluntary explicit CSR measures represent efforts to overcome periodic crises of
legitimacy, it could be argued that they are in the gift of firm owners or managers, to be tendered or
withdrawn at any time (Matten and Moon, 2008: Mellahi et al., 2010). In other words, such initiatives are
likely to be episodic, with firms valuing flexibility to extend or withdraw CSR initiatives.
Listing and CSR
Organizations can gain more legitimacy by actively seeking support from the largest number of
stakeholders possible. External pressure on companies results in companies being more likely to subject
themselves to self-regulation and behaving, or encouraging stakeholders to believe they will behave, in a
manner that the latter consider socially responsible.
However, Aupperle et al. (1985) found no link between CSR and organizational performance. Looking
at US publicly-traded firms, Ioannou and Serafeim (2014) found that in the 1990s analysts tended to view
a commitment to CSR as an agency failure but, more recently, this tendency has reversed, with socially
responsible listed firms being assessed more optimistically (Cheah et al., 2011). Hence, we hypothesize the
following:
Hypothesis 1a. Listed firms are more likely to have a CSR statement, whether written or verbal.
Further, investors in the financial markets should be able to exercise greater pressures on listed
companies, pushing them to make formal commitments in written form. Written codes represent a more
formal obligation and “are voluntary statements that commit organizations, industries, or professions to
specific beliefs, values, and actions, and/or that set out appropriate ethical behavior” (Crane and Matten,
2007: 175). There is an expectation that listed firms will make more written information available as to
their present condition, policies and strategies, than their unlisted counterparts, to attract and retain
investors.

438
Hypothesis 1b. Listed firms are more likely to have a written CSR statement.
Legitimacy, CSR and Varieties of Capitalism
How does CSR vary across different institutional settings? On the one hand, it could be argued that in
firms in common law countries are more likely to engage in social responsibility (Langlois and
Schlegelmilch 1990). This is for two reasons. Firstly, the countervailing power of insider interests, such as
workers’ representation, is weaker when shareholder rights are stronger (Jackson and Apostolakou, 2010).
Secondly, firms in countries with shareholder primacy are likely to be particularly sensitive to customer
pressures and investor concerns, given their focus on profits (Matten and Moon, 2008).
On the other hand, for the reasons outlined above, legitimacy crises are more likely in common law
countries, and that may lead to periodic CSR initiatives to compensate for trust shortfalls (Mellahi et al.,
2010). In other words, in contexts where firms are under the greatest pressure to maximize shareholder
value, and stakeholder rights are weaker, ethical failings may be more likely. In turn, to offset any
reputational damage, firms may be impelled to promote their ethical credentials explicitly (Matten and
Moon, 2008), although there is empirical evidence to the contrary (Gjølberg, 2009). Indeed, CSR may be
viewed by shareholders as unjustified empire building by managers to enhance their personal prestige, in
effect misusing shareholders’ money (Friedman, 1970). In common law countries, shareholders have the
power to rein in managers, forcing them to concentrate on the immediate bottom line and giving them less
freedom to engage in such activities. Even if stakeholder wellbeing is salient to the firm, the operations of
markets may impact on managerial perceptions (Tashman and Raelin, 2013).
This leads us to two further hypotheses. Firstly, it could be argued that in common law countries, firms
are less held to account, due to the absence of countervailing stakeholder power, than elsewhere. Reflecting
this:
Hypothesis 2a. Firms in common law countries are less likely to have a CSR statement.
Secondly, it could be argued that, impelled by legitimacy concerns but pulled by short-term pressures
to maximize profits, firms operating in such jurisdictions would be less likely to have a written CSR
statement, embarking on periodic CSR initiatives characterized by regularly changing public statements of
goodwill in response to periodic reputational crises, but ones to which the firm is not formally committed
for a sustained period of time (Matten and Moon, 2008). Within the civil law countries, by contrast,
investors are more likely to be patient (see Dore, 2000). They are more likely to value the potential benefits
for an organization accruing from being socially responsible, even if it entails upfront costs and, hence, are
more likely to encourage organizations to tie themselves into formal commitments to CSR in the hope of
long-term gains. Fogarty (1995) argues that written codes of conduct are an expression of the attention
accorded to stakeholder interests (Sacconi, 1999). They tie firms down and are more difficult to renege on
than verbal statements. Further, weaker institutional coverage in emerging, transitional and/or peripheral
economies might mean that less can be taken for granted than would be the case in mature institutional
settings (Hancke et al., 2007) and, hence, firms adopting a CSR code due to stakeholder pressures, and/or
in response to reputational issues, will be under some pressure to do so formally and in writing.
Hypothesis 2b: Firms in common law countries are less likely to have written than verbal CSR
statements.
One way of testing a firm’s commitment to CSR is to evaluate the kind of employment practices that
it adopts. If the focus is on shareholder value, the interests of a range of other stakeholders may be
jeopardized (Harrison and Wicks, 2013). Bučiūnienė and Kazlauskaitė (2012) found that organizations that
had more systematic and developed approaches to human resource management (HRM) also had more
developed CSR policies. On the one hand, devoting more attention to HRM does not necessarily mean that
the policies adopted will be employee-friendly: for example, resources could be ploughed into stringent
forms of employee performance management. On the other hand, if CSR is impelled by stronger stakeholder
rights – as the hypotheses on greater CSR in civil law countries would suggest – then CSR is likely to be
manifested in greater responsibility towards employees (Dore 2000). Thus, firms with a CSR statement
might retain employees rather than dismiss them and, if they have to downsize, do it through voluntary
rather than enforced mechanisms (Goergen et al., 2013). We expect less outsourcing, lower staff turnover

439
and higher levels of training. In other words, security of tenure and investment in people (c.f. Whitley,
1999) will be greater in firms that have CSR statements. So:
Hypothesis 3. Firms with more developed approaches to employee management are also more likely
to have CSR statements.
3. Data and Methodology
To test our hypotheses, we followed a multi-stage data selection process. Our firm-level data consist
of 6,155 firms for 31 countries included in the 2009/10 wave of the Cranet survey on employment practices
(for full details see Brewster et al., 2004; and Parry et al., 2013). These surveys are conducted every four
to five years and cover all major sectors within the target economies and all organizations with over 100
employees. The Cranet survey records HRM policies and practices. Seventy percent of respondents are at
HR director level and the others are CEOs or specialists. Given the sensitivity of the questions asked,
responses are anonymous.
To obtain our sample, we selected pairs of listed or unlisted firms that are located in common vs. civil
law countries. We also focused on firms that are within a similar class of profitability measured on a Likert
scale ranging from 1 (lowest) to 5 (highest profitability) (i.e. firms that have the same flexibility in terms
of implementing CSR activities), in the same industry (i.e. similar business practices) and have the closest
size, i.e. +/ -10%, as measured by the number of employees (i.e. firms that have the same internal pressures
from their employees). We first excluded 1,868 firms with missing data on the number of employees,
profitability, industry, and CSR statement and another 947 firms with missing data on the control variables.
This resulted in a sample of 3,340 firms from 28 countries, including 2,036 listed firms and 1,304 unlisted
firms. One of the countries had listed firms only (Denmark with 264 firms); it was excluded as we could
therefore not match pairs of listed and unlisted firms. The remaining sample included 3,076 firms, with
1,773 listed and 1,303 unlisted firms from 27 countries. Using our matching criteria, we lost seven
additional countries, ending up with data for 20 countries. Our final sample includes 244 firms (122 pairs
of common law and civil law firms), which represent pairs of listed and unlisted companies within the same
class of profitability, same industry, and within a close range of size.
To test our hypotheses about the likelihood of a firm having a (written) CSR code, we estimate the
following probit equations at the firm level. The equations specify the hypothesized sign for each variable’s
coefficient. We shall further elaborate on the coefficients’ signs below.
CSR = α + β1 Listed dummy β2 Common Law dummy + β3 LnSize + β4 Family dummy
+ β5 MNE dummy + β6 M&A dummy + β7 Investor Rights + β8 LnGDP
+ Industry dummies + ε (1)
CSR = γ δ1 Common Law dummy + δ2 Listed Common Law dummy
+ δ3 Listed Civil Law dummy + δ4 LnSize + δ5 Family dummy
+ δ6 MNE dummy + δ7 M&A dummy + δ8 Investor Rights + δ9 LnGDP
+ Industry dummies + η (2)
Where, CSR is calculated as follows. We first measure CSR by CSR Variable within an ordered probit
regression. This variable is equal to zero in the absence of a CSR code (verbal or written), one if there is a
verbal CSR code, and two if there is a written CSR code. We then run a series of regular, i.e. binomial
probit regressions. We first use CSR dummy which equals one if the firm has a CSR code (written or verbal),
and zero otherwise. We also use two different dependent variables indicating whether there is a written
CSR code or a verbal one. Written CSR dummy is equal to one if the firm has a written CSR code, and zero
otherwise. Verbal CSR dummy is equal to one if the firm has a verbal CSR code, and zero otherwise.
We include various independent variables in our regressions. To test the validity of hypotheses 1a and
1b, we use Listed dummy which is equal to one if the firm is listed, and zero otherwise. The validity of
hypotheses 2a and 2b is tested using Common Law dummy, which is set to one if the firm is in a common
law country, and zero otherwise. We also use Listed Common Law dummy and Listed Civil Law dummy,
which are self-explanatory.

440
We control for firm size measured by the logarithm of the total number of employees as large
companies with high visibility are more likely to disclose their CSR practices (Deegan et al., 2002; Gray et
al., 1995; Guthrie and Parker, 1989; Patten, 1991; Woodward et al., 1996). Our regressions include Family
dummy as family firms have more personal relationships with their employees and customers. They are also
more concerned about their image and reputation than non-family firms, and as such we expect family firms
to be more likely to have a CSR statement (Dyer and Whetten, 2006; Goergen and Renneboog, 2010).
Family dummy is equal to one if the firm is owned and/or controlled by primarily one family, and zero
otherwise.
We also include MNE dummy which is equal to one if the firm has a presence in more than one country,
and zero otherwise. As they straddle institutional domains, MNEs are less influenced by informal and
formal regulations within a single national context than their domestic counterparts (Morgan, 2012).
However, as MNEs are more likely to have a higher profile than domestic firms, they will be more
susceptible to negative publicity. And, MNE approaches to CSR will be influenced by host country
pressures (Bondy and Starkey, 2014). Hence, MNEs take up voluntary CSR codes in order to defend their
reputation and market position. Weaver et al. (1999) explain that companies that are subject to media
pressure are more likely to invest in policies that will help restore lost legitimacy and avoid future negative
media attention. Hence, we expect MNEs more likely to have CSR codes. Avi-Yonah (2005) describes the
transformations undergone by the corporate form over time, and argues that CSR is legitimate and
normatively accepted with the growth of corporations even when it does not contribute to long-run
shareholder wealth. We therefore predict a positive association between CSR and M&A activity during the
three-year period prior to our study (as measured by M&A dummy).
The likelihood of having a CSR statement might also be related to investor rights and the extent of
enforcement of laws in a society, and simply to its economic wealth (GDP) (Chih et al., 2008; Welford,
2005), since in less developed countries and/or where society cannot enforce its own rules there will be less
value in legitimacy. We control for investor rights and economic development using the Djankov et al.
(2008) anti-self-dealing index and GDP level, respectively. Djankov et al.’s (2008) anti-self-dealing index,
Investor Rights, measures the level of protection enjoyed by minority shareholders. We use the natural
logarithm of the GDP, LnGDP, rather than raw GPD to control for skewness. Given that companies in some
industries may be more visible and may therefore be more exposed to public scrutiny, we also use industry
dummies.
To test the validity of hypothesis 3, we examine whether CSR statements are in line with CSR practices
of the sample firms. We expect companies with a CSR statement to have good employment change
practices, lower staff turnover and higher levels of training. First, Employment Change is an ordinal variable
which reflects whether (i) there was growth, stagnation or a reduction in the firm’s employment figures and
(ii), if there was downsizing, how the downsizing was carried out. Ways of downsizing are ordered from
least harsh to most harsh. In line with Goergen et al. (2013), Employment Change is equal to zero if the
company increased its number of employees during the last three years, one if the number of employees
remained the same, two if there was a recruitment freeze, three if the company used redeployments, four if
it had voluntary redundancies, five if it used early retirements, six if it went down the route of no renewal
of fixed/temporary contract, seven if it used outsourcing or outplacement, and eight if there were
compulsory redundancies. Increased Number of Employees is a dummy variable, which is equal to one if
there were no restrictive employment practices (i.e. two to eight above) and there was an increase in the
number of employees, and zero otherwise. Stable Number of Employees is set to one if there were no
restrictive employment practices and the number of employees remained the same, and zero otherwise. The
following dummy variables indicate the use of particular employment practices and are self-explanatory:
Recruitment Freeze, Redeployment, Voluntary Redundancies, Early Retirements, No Renewals of
Fixed/temporary Contracts, Outsourcing or Outplacement, and Compulsory Redundancies. Second, we use
Annual Staff Turnover calculated as the annual percentage of staff turnover. Finally, Training Index is the
total number of training days over staff turnover per category of employees (managerial, professional,
clerical, and manual). Training Index ranges from zero to five, and is equal to the sum of the four dummy
variables related to High Number of Days per Year Training (as a Percentage of Staff Turnover) per

441
category of employee as well as High Percentage Annual Payroll Costs Spent on Training dummy.
Alternatively, we use a dummy variable, which is equal to one if the value for Training Index for a given
firm is higher than the sample median, and zero otherwise.
4. Empirical Results
Table 1 presents descriptive statistics for the full sample of 244 firms as well as the sub-samples of
firms from common law countries and firms from civil law countries. Just over half of the sample firms
have a CSR statement (written or verbal); this percentage is significantly higher for the civil law countries
(64.8%).compared to the common law ones (45.9%) (the difference is significant at the 1% level).
Moreover, 36.9% of the sample firms have a written CSR statement and 18.4% have a verbal statement.
Again, a larger percentage of firms from the civil law countries have a written CSR statement (44.3%)
compared to firms from common law countries (29.5%) (the difference is significant at the 5% level).
However, there is no difference in the percentage of firms with a verbal CSR statement between the two
legal families. The sample includes 51.6% of firms that are listed and the average firm has 1,214 employees
and, by construction, there is no difference in means for the number of employees between the two sub-
samples.
One third of the firms are family firms (34.4%), and 53.3% are MNEs. Some 41.8% of firms were
involved in a merger and acquisition deal (M&A) during the last three years prior to the survey, and they
are located in countries with average investor rights of 0.565 and average GDP of $5,297 billion. As
expected, the firms from the civil law countries are more likely to be family firms and MNEs, and they are
less likely to have gone through M&As as compared to those from common law countries (the difference
being significant at the 10% level or better). The civil law countries also have lower investor rights and a
lower GDP than the common law countries (at the 1% level), albeit that the original panel of countries
includes many emerging or transitional economies. As noted above, we subsequently revisit our analysis
with these countries removed.
Table 2 shows the correlations between the variables: listed firms are more likely to have a CSR
statement, and this is more likely to be a written statement. Firms from common law countries are less
likely to have a CSR statement.


443


445
Table 3 reports the results from the ordered probit regression with CSR Variable as the dependent
variable (regression (1a)). It also presents the results from estimating three regular, binomial probit
regressions using as the dependent variable CSR dummy (regression (1b)), Written CSR dummy (regression
(1c)), and Verbal CSR dummy (regression (1d)). Regressions (1a) and (1b) show that listed firms are more
likely to have a CSR statement (at the 5% level), and regression (1c) suggests an even more significant
association between listed firms and those with a written CSR statement (at the 1% level). Regression (1d)
shows no significant association between a public listing and the existence of a verbal CSR statement. This
provides support for hypotheses 1a and 1b. Further, firms from common law countries are less likely to
have a CSR statement as reflected by the significantly negative Common Law dummy in regressions (1a),
(1b) and (1c). This suggests that hypothesis 2a is valid. Firms from common law countries are also less
likely to have a written CSR statement (regression (1d)). This supports hypothesis 2b.
As to the control variables, all four regressions suggest that a CSR statement (of either form) and
a written CSR statement are more likely for larger firms (at the 5% level or better). Firms that have had
M&A activity in the three years preceding the survey are more likely to have a CSR statement (at the
10% level), and this is more likely to be a verbal CSR statement (at the 5% level). Family firms are more
likely to have a verbal CSR statement (at the 5% level). Finally, firms in countries with greater GDP are
less likely to have a verbal CSR statement (at the 5% level). The results for the control variables are
similar for the binomial probit and ordered probit regressions.

446
Table 4 is similar to Table 3, but distinguishes between listed common law firms and others. Like
Table 3, it includes an ordered probit regression (regression (2a)) and three binomial probit regressions
(regressions (2b), (2c) and (2d)). Regressions (2a) and (2b) suggest that firms from common law countries
are less likely to have a CSR statement (at the 10% level), further supporting hypothesis 2a. In contrast,
listed firms from civil law countries are more likely to have a CSR statement (at the 10% level or better),
qualifying our earlier support for hypothesis 1b. Moreover, regression (2c) suggests that firms from
common law countries are less likely to have a written CSR statement (at the 10% level). On the contrary,
listed firms from civil law countries are more likely to have a written CSR statement (at the 1% level)
whereas they are less likely to have a verbal CSR statement (regression (2d) and at the 10% level). While
we found support for hypothesis 2b for the case of all, i.e. listed as well as unlisted, common law based
firms, regression (2c) suggests that the listing status of common law countries does not have an impact.
Hence, hypothesis 2b is valid for all firms from common law countries, whether listed or not. As to the
control variables, Table 4 shows similar patterns to those in Table 3.
447
Table 5 is a first step towards testing the validity of hypothesis 3. It presents descriptive statistics for
the employment practices for the entire sample as well as for the sub-samples of firms from civil law and
common law countries. Employment Change has a value of 2.328, with a value of two indicating an
employment freeze and three indicating redeployment. The average value for Employment Change for firms
from civil law countries (1.672) is significantly lower (at the 1% level) than for firms from common law
countries (2.984). The less stringent employment practices of firms from civil law countries should be seen
in the light of the conclusions drawn from Tables 3 and 4 that firms from civil law countries are more likely
to implement good CSR practices as reflected by the existence of a CSR statement. Breaking down
Employment Change into its individual components, 56.1% of companies have had an increase in the
number of employees and 13.1% maintained their number of employees during the last three years. A
significantly larger percentage (at the 10% level) of firms from civil law countries increased the number of
employees compared to common law countries. For the remaining 30.8% of sample firms, the decrease in
the number of employees was mainly driven by recruitment freezes (28.3% of the firms), redeployment
(24.2%), compulsory redundancies (23.4%), followed by the other reasons. Recruitment freezes,
compulsory redundancies, and redeployment were significantly higher in common law countries compared
to civil law countries (at the 10% level or better). Note that the percentage of firms using the various
practices is greater than one (100%) given that some firms used several practices to decrease the number of
employees.
Table 5 also indicates that average annual staff turnover was 15.19%; there is no significant difference
between the firms from civil law countries and those from common law ones. The percentage of annual
payroll costs spent on training is equal to 4.63% on average; again there is no significant difference between
the two sub-samples. The average number of days of training is 8.77 days per year for management, 10.06
days for professionals, 6.69 days for clerical staff, and 6.11 days for manual laborers. There is a significantly
higher number of days of training offered to management, professionals and clericals in civil law countries
(at the 5% level or better). When we adjust the annual number of days of training by staff turnover (as firms
with high turnover will be forced to engage in a greater amount of basic induction training), we still find a
higher number of days of training for both managers and clerical employees (at the 5% level or better) for
the firms from civil law countries. Further, a higher percentage of firms from civil law countries than firms
from common law ones that offer high (i.e. above median) levels of training for all four categories of
employees (at the 10% level or better). Finally, Training Index (ranging from zero to five) includes the four
dummy variables indicating whether the number of days of training per category of employee is greater
than the sample median as well as the dummy variable indicating whether the percentage of annual payroll
costs spent on training is greater than the sample median. The average for Training Index is 1.6; it is
significantly higher for firms from civil law countries (at the 1% level). Therefore, hypothesis 3 seems
valid: firms with CSR statements are more likely to have more developed HRM approaches.
Table 6 consists of four matrices or panels. The first two panels study the impact on Employment
Change of each combination of the two legal families (common or civil law) with the presence or absence
of a CSR statement (written or verbal) (Panel A1), and with the listing status (unlisted vs. listed) (Panel
A2). The next two panels, Panels B1 and B2, are the equivalent panels for the impact on Training Index.

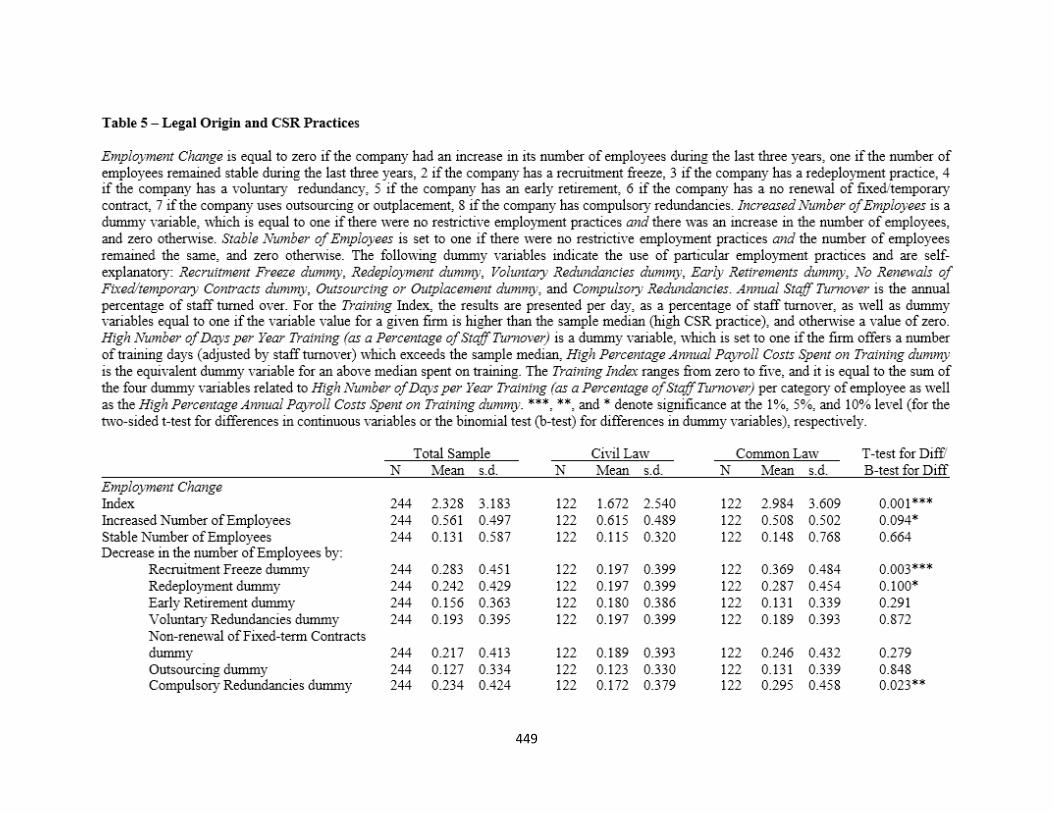
449

450

451

452
Panel A1 shows that employment practices are significantly less harsh (at the 5% level or better) in
firms from civil law countries, regardless of whether they have a CSR statement. However, the existence
of a CSR statement is not associated with specific employment practices for firms from the same legal
family. Similarly, Panel A2 suggests that the listing status of a firm does not affect its employment practices.
Panels B1 and B2 suggest that training is always significantly higher (at the 10% level or better) in
firms from civil law countries. Again, the existence of a CSR statement and the listing status do not have a
significant impact. All that matters is legal family. Overall, the results from Table 6 are consistent with
those from Table 5: legal origin has a significant impact on the HRM practices, providing further support
for hypothesis 3.
5. Robustness Tests
But, what about possible differences among civil law countries? What happens if we distinguish
between mature countries and those of more peripheral or transitional status? We remove South Africa from
the common law category, and all Eastern European and Mediterranean civil law countries that might be
considered as peripheral or transitional. This includes 46 companies from Bulgaria, Cyprus, Greece,
Hungary, Lithuania, Russia, Serbia, Slovakia, and the Turkish Cypriot Community in the common law
country. Table 7 reports the equivalent regressions to those from Table 3 (the regressions that include Listed
dummy) and Table 4 (the regressions that include Listed common law dummy and Listed civil law dummy),
but it is based on observations from mature civil and common law countries only.
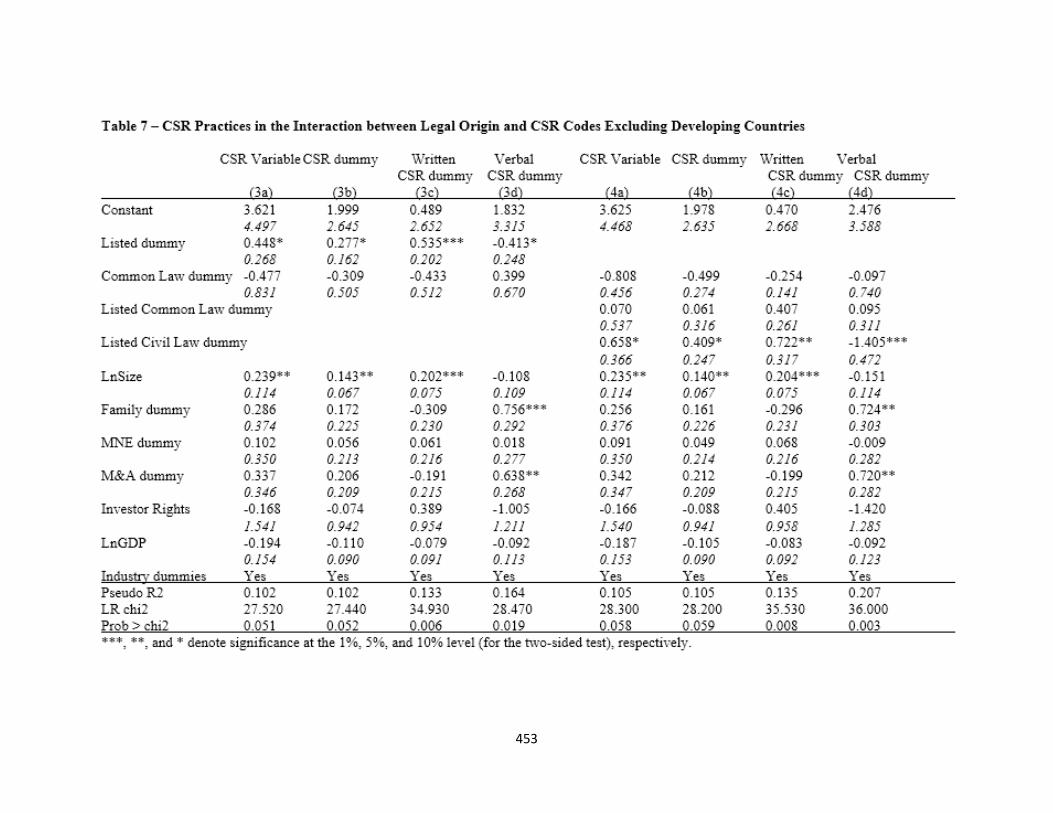
453

454
The table confirms the results from Tables 3 and 4. Again, listed firms are more likely to have a written
CSR statement, whereas those from common law countries are less likely to have a (written) CSR statement.
Furthermore, listed firms from civil law countries are more likely to have a CSR statement, which is more
likely to be a written statement. This provides further support for hypotheses 1a, 1b, 2a, and 2b. Contrary
to what is argued by La Porta et al. (2008), Allen (2012) argues that both common and civil law systems
confer distinct advantages (Allen, 2012). Hence, it could be argued that stronger stakeholder rights and
deeper, more embedded, relations between firms and other actors in civil law countries will encourage more
sustainable approaches to social responsibility than elsewhere.
6. Conclusion
Formally committing the firm to a written CSR agenda diminishes the room for maneuver by owners,
and their relative ability to focus on maximizing short-term returns (Carroll, 2000). This means that
investment horizons may determine the nature of commitment to CSR. There is however a limit to this
argument when it comes to employment practices: corporate social responsibility (CSR) in relation to
employees seems to be largely unaffected by the existence of CSR statements.
We found that formal CSR statements were more common in firms from civil law countries,
particularly in listed firms. This could reflect the extent to which greater information on such firms is in the
public domain – making it easier to hold them to account – and/or could be because such firms are likely
to have more resources to plough back into CSR. Whilst, clearly, legitimacy concerns and associated,
culturally rooted expectations are an important issue in determining CSR, the compensatory argument –
that firms are more likely to seek to be seen to be socially responsible in settings where ethical lapses are
more likely – has limits. Any explicit CSR behavior is then likely to be episodic and/or within informally
set parameters rather than formalized written commitments to CSR that may be difficult to withdraw.
This paper adds to the growing body of literature that applies comparative institutional analysis to firm
level policies and practices, seeking to move beyond the finance literature’s traditional focus on formal
rules. It demonstrates that the relationship between setting and practice is a complex one, and that outcomes
reflect both regulation and organization specific characteristics. It also highlights the importance of greater
informality and flexibility in CSR commitments in common law countries in comparison with civil law
ones. Finally, employment practices in common law countries were less employee-friendly, irrespective of
whether they had a written CSR statement or not.
Overall, the paper makes the point that proposals to introduce more ethical dimensions to the
behavior of firms need to be thought through, taking account of a broader range of contextual differences
than simply formal regulation: what works in one location may be inappropriate or difficult to sustain in
another.
References
Aerts, W., & D. Cormier. 2009. Media legitimacy and corporate environmental communication.
Accounting, Organizations and Society, 34(1): 1-27.
Allen, F. 2012. Financing firms in different countries. In G. Wood, & M. Demirbag (Eds.), Handbook
of institutional approaches to international business: 41-64. Cheltenham: Elgar.
Amable, B. 2003. The diversity of modern capitalism. Oxford: Oxford University Press.
Aupperle, K., Carroll, A., & Hatfield J. 1985. An empirical examination of the relationship between
corporate social responsibility and profitability, Academy of Management Journal, 28(2): 446-463.
Avi-Yonah, R. S. 2005. The cyclical transformations of the corporate form: A historical perspective on
corporate social responsibility, Law and Economics Working Papers Archive: 2003-2009. Paper 38.
Becchetti, L., Ciciretti, R., Hasan, I., & Kobeissi N. 2012. Corporate social responsibility and
shareholder's value, Journal of Business Research 65(11): 1628-1635.
455
Becker-Olsen KL, Cudmore AB, & Hill P. R. 2006. The impact of perceived corporate social
responsibility on consumer behavior, Journal of Business Research, 59(1): 46-53.
Boiral, O. 2003. The certification of corporate conduct: issues and prospects, International Labour
Review, 142(3): 317-341.
Bondy, K., Matten, D., & Moon J. 2008. Multinational corporation codes of conduct: Governance
tools for corporate social responsibility?, Corporate Governance: An International Review, 16(4):
294-311.
Bondy, K., & Starkey K. 2014. The dilemmas of internationalization: Corporate social responsibility
in the multinational corporation, British Journal of Management, 25(1): 4-22.
Brewster, C., Chahine, S., Goergen, M., & Wood, G. 2013. Trust, Owner Rights, Employees and Firm
Performance, Journal of Business Finance and Accounting, 40(5&6): 589-619.
Brewster, C., Mayrhofer, W., & Morley, M. (Eds.) 2004. Human resource management in Europe.
Evidence of Convergence? Oxford: Elsevier Butterworth-Heinemann.
Bučiūnienė, I., & Kazlauskaitė, R. 2012. The linkage between HRM, CSR and performance
outcomes, Baltic Journal of Management, 7(1): 5-24.
Carter, C. R., Kale, R., & Grimm, C. M. 2000. Environmental purchasing and firm performance: An
empirical investigation, Transportation Research Part E, 36(3): 219-228.
Carroll, A. B. 2000. Ethical challenges for business in the new millennium: Corporate social
responsibility and models for management morality, Business Ethics Quarterly, 10(1): 33-42.
Cheah, E.-T., Jamali, D., Johnson, J. E. V., & Sung, M.-C. 2011. Drivers of corporate social
responsibility attitudes: The demography of socially responsible investors, British Journal of
Management, 22(2): 305-323.
Chih, H-L, Shen, C-H, & Kang, F-C. 2008. Corporate social responsibility, investor protection, and
earnings management: Some international evidence, Journal of Business Ethics, 79(1): 179-198.
Crane A., & Matten, D. 2007. Business ethics managing corporate citizenship and sustainability in
the age of globalization. New York: Oxford University Press.
Crane, A., Matten, D., & Spence, L. J. 2008. Corporate social responsibility. Readings and cases in
a global context. Abingdon: Routledge.
Deakin, S., & Hobbs, R. 2007. False dawn for CSR? Shifts in regulatory policy and the response of
the corporate and financial sectors in Britain, Corporate Governance: An International Review,
15(1): 68-76.
Deegan, C., Rankin, M., & Tobin, J. 2002. An examination of the corporate social and
environmental disclosures of BHP from 1983-1997. A test of legitimacy theory, Accounting,
Auditing and Accountability Journal, 15(3): 312-343.
Djankov, S., R. La Porta, F. Lopez-de-Silanes, A. Shleifer, & Vishny, R. W. 2008. The law and
economics of self-dealing, Journal of Financial Economics, 88(3): 430-465.
Dore, R. 2000. Stock market capitalism: Welfare capitalism. Cambridge: Cambridge University
Press.
Du, J. 2010. Institutional quality and economic crises: Legal origin theory versus colonial strategy
theory. Review of Economics and Statistics, 92(1): 173-179.
Dyer W. G. Jr., & Whetten, D.A. 2006. Family firms and social responsibility: Preliminary evidence
from the S&P 500, Entrepreneurship Theory and Practice, 30(6): 785-802.
Fogarty, T. 1995. Accountant ethics: A brief examination of neglected sociological dimensions,
Journal of Business Ethics, 14(2): 103-115.
Friedman, M. 1970. The social responsibility of business is to increase its profits. New York Times
Magazine, September 13 : 32-33, 122-124.
Gjølberg, M. 2009. The origin of corporate social responsibility: Global forces or national legacies?,
Socio-Economic Review, 7(4): 605-637.
456
Gray, R. H., Kouhy, R., &. Lavers, S. 1995. Corporate social and environmental reporting. A review
of the literature and a longitudinal study of UK disclosure, Accounting, Auditing and Accountability
Journal, 8(2): 47-77.
Goergen, M., Brewster, C., & Wood, G. 2013. The effects of the national setting on employment
practice: The case of downsizing, International Business Review, 22(6): 1051-1067.
Goergen, M., Renneboog, L. 2010. The social responsibility of major shareholders. In G. Aras, & D.
Crowther (Eds.) The Gower handbook of corporate governance and social responsibility: 287-305.
Farnham: Gower.
Guthrie, J., & Parker, L. D. 1989. Corporate social reporting: A rebuttal of legitimacy theory,
Accounting and Business Research, 19(76): 343-352.
Hancke, B., Rhodes, M. & Thatcher, M. 2007. Introduction. In B. Hancke, M. Rhodes, & M.
Thatcher (Eds.), Beyond varieties of capitalism: Conflict, contradiction, and complementarities in
the European economy: 3-38. Oxford: Oxford University Press.
Hawley, J. and A. Williams 2000. The rise of fiduciary capitalism: How institutional investors can
make corporate America more democratic. Philadelphia: University of Pennsylvania Press.
Harrison, J., & Wicks, A. 2013. Stakeholder theory, value and firm performance, Business Ethics
Quarterly, 23(1): 97-124.
Ioannou, I., & Serafeim, G. 2014. The impact of corporate social responsibility on investment
recommendations: analysts’ perceptions and shifting institutional logics, Strategic Management
Journal, 35(1): 1-23.
Jackson, G., & Apostolakou, A. 2010. Corporate social responsibility in Western Europe: An
institutional mirror or substitute?, Journal of Business Ethics, 94(3): 371-394.
Jackson, G., & Deeg, R. 2008. Comparing capitalisms: Understanding institutional diversity and its
implications for international business, Journal of International Business Studies, 39(4): 540-561.
La Porta, R., Lopez-de-Silanes, F., & Shleifer, A. 2008. The Economic Consequences of Legal
Origins, Journal of Economic Literature, 46(2): 285-332.
Langlois, C., & Schlegelmilch, B. 1990. Do corporate codes of ethics reflect national character?
Evidence from Europe and the United States, Journal of International Business Studies, 21(4): 519-
539.
Matten, D., & Moon, J. 2008. ‘Implicit’ and ‘explicit’ CSR: A conceptual framework for a
comparative understanding of corporate social responsibility, Academy of Management Review,
33(2): 404-424.
Mellahi, K., Morrell, K., & Wood, G. 2010. The ethical business. London: Palgrave.
Morgan, G. 2012. International business, MNCs and national systems. In M. Demirbag, & G. Wood
(Eds.), Handbook of Institutions and International Business. Cheltenham: Elgar.
Pagano, M., Panetta, F., & Zingales, L. 1998. Why do companies go public? An empirical analysis,
Journal of Finance, 53(1): 27-64.
Palazzo, G., & Scherer, A. 2006. Corporate legitimacy as deliberation: A communicative
framework, Journal of Business Ethics, 66(1): 71-88.
Park, J., Lee, H.& Kim, C. 2014. Corporate social responsibilities, consumer trust and corporate
reputation: South Korean consumers’ perspectives, Journal of Business Research, 67(3): 295-302.
Parry, E. Stavrou, E., & Lazarova, M. (Eds.) 2013. Global trends in human resource management.
Basingstoke: Palgrave Macmillan.
Patten, D. M. 1991. Exposure legitimacy, and social disclosure, Journal of Accounting and Public
Legitimacy, 10(4): 297-308.
Qi, Y., Roth, L., & Wald, J. 2011. How legal environments affect the use of bond covenants, Journal
of International Business Studies, 42(2): 235-262.
Sacconi, L. 1999. Codes of ethics and contractarian constraints on the abuse of authority within
hierarchies: A perspective from the theory of the firm, Journal of Business Ethics, 21(2&3):189-202.
457
Sen, S., & Cowley, J. 2013. The relevance of stakeholder theory and social capital theory in the
context of CSR in SMEs: An Australian Perspective, Journal of Business Ethics, 118(2): 413-427.
Shea, L .J. 2010. Using consumer perceived ethicality as a guideline for corporate social responsibility
strategy: A commentary essay, Journal of Business Research, 63(3): 263-264.
Suchman, M. C. 1995. Managing legitimacy: Strategic and institutional approaches, Academy of
Management Review, 20(3): 571-610.
Tashman, P., & Raelin, J. 2013. Who and what really matters to the firm, Business Ethics Quarterly,
23(4): 591-616.
Van Cranenburgh, K., Liket, K., & Roome, N. 2013. Management responses to social activism in an
era of corporate responsibility, Journal of Business Ethics, 118(3): 497-513.
Weaver, G. R. Trevino, L. K., & Cochran, P. L. 1999. Corporate ethics programs as control systems:
influences of executive commitment and environmental factors, Academy of Management Journal,
42(1): 41-57.
Welford, R. 2005. Corporate social responsibility in Europe, North America and Asia, Journal of
Corporate Citizenship, 17(20): 33-52.
Whitley, R. 1999. Divergent capitalisms. Oxford: Oxford University Press.
Wood, G., Dibben, P., & Ogden, S. 2014. Comparative capitalism without capitalism, and production
without workers: The limits and possibilities of contemporary institutional analysis, International
Journal of Management Reviews, forthcoming.
Wood, G., & Frynas, G. 2006. The institutional basis of economic failure: Anatomy of the
segmented business system, Socio-Economic Review, 4(2): 239-277.
Woodward, D.G., Edwards, P., Birkin, F. 1996. Organizational legitimacy and stakeholder
information provision, British Journal of Management, 7(4): 329-347.
Appendix 1
Civil Law Countries
Austria
Belgium
Bulgaria
Cyprus
France
Germany
Greece
Hungary
Japan
Lithuania
Russia
Serbia
Slovakia
Slovenia
Switzerland
Turkish Cypriot Community
Common Law Countries
South Africa
Australia
United Kingdom
USA

458
Foreign Business Activities, Foreignness of the VC
Syndicate, and IPO Performance
Marc Goergen Samer Saade Salim Chahine
Cardiff University American University of
Beirut
American University of
Beirut
UK Lebanon Lebanon
Abstract:
This paper examines the role played by foreign venture capital firms (VCs) in affecting the IPO
premium of US IPO firms. We find that US VC-backed IPOs benefit from the foreignness of the VC
syndicate (via the presence and distance of foreign VCs), which generates ample growth potential for
investee firms, which in turn translates into a higher IPO premium. More precisely, we find evidence of a
non-linear relationship between foreign VCs and the IPO premium; the latter first increases with the
foreignness of the VC syndicate, and then decreases. While the initially positive effect of foreign VCs lends
support to the resource-based and institutional theories, the subsequently negative effect suggests that
greater presence and distance reduce the VC syndicate’s effectiveness in properly monitoring the IPO firm.
Our findings also indicate that foreign VCs foster the foreign business activities of US IPO firms, and that
after controlling for the endogenous determination of foreign business activities, greater foreign VC
presence and distance combined with the IPO firm’s foreign business activities increase the IPO premium.
Keywords: venture capital, initial public offerings, foreignness of the VC syndicate, foreign business
activities, international presence, resource-based view, legitimacy.
JEL classification: G23, G23, G24, G28, G32, G34, L32
1. INTRODUCTION
Assessing the value of firms going public can be tricky, as such firms frequently do not have extensive
financial track records that can be used to value them and to extrapolate trends for future performance.
Entrepreneurs are thus likely to build legitimacy for their new ventures (Ahlstrom and Bruton, 2001), acting
as an antidote for the business’s liability of newness (Stinchcombe, 1965).11 Building legitimacy for the
IPO firm is critical for creating a perception of enhanced chances of survival and growth potential.
Legitimacy is a means to attract additional resources such as top managers and financial resources
(Zimmerman and Zeitz, 2002), and legitimacy could be further strengthened by strategic actions such as
the internationalization of the firm. Indeed, foreign business activities may confer legitimacy and reduce
the uncertainty surrounding the IPO firm, reflecting its ability to generate revenues beyond its domestic
environment.
Firms may also gain legitimacy by building ties with foreign professional investors such as venture
capital firms (VCs). A close tie with a foreign VC would give the IPO firm access to a pool of international
resources, otherwise not available. It would also certify the quality of the firm as VCs are known for their
superior capabilities of assessing the value of IPO firms (Stuart et al., 1999). In this paper, we examine the
that newly established challengesAccording to Stinchcombe (1965), the liability of newness refers to the many 11
firms face given their young age and that make them prone to failure.
459
extent to which foreign business activities and foreign VCs (via their presence and distance) constitute
important factors in investors’ valuation of an IPO firm.
As the IPO firm embarks on setting the offer price, it receives feedback from investors via the
roadshows that it conducts with the underwriter. Further feedback may be provided during the book
building process. The offer price is thus an expression of how much investors are willing to pay for the IPO
shares. Setting the offer price much higher or lower than the firm’s intrinsic value might make investors
avoid the offering. The IPO premium, i.e. the difference between the offer price and the pre-IPO book value
per share expressed as a fraction of the offer price (Nelson, 2003; Rasheed et al., 1997), is preferred over
other valuation metrics, such as underpricing, the stock price, and the offer price, as it incorporates the book
value of the firm’s assets as reported in the IPO prospectus. It hence reflects a more robust estimate of
investors’ perceived future value of the firm and the firm’s earnings potential (Lester et al., 2006).12 In turn,
the IPO offer price represents the price that during the pre-IPO roadshows investors have expressed to be
willing to pay (Welbourne and Andrews, 1996). We expect firms with an international presence at the time
of their IPO to have greater growth opportunities than those with a purely domestic presence, which would
be reflected by a higher IPO premium. Although we focus on the IPO premium in what follows, in
robustness tests we examine the impact of foreign business activities as well as foreign VCs on IPO
underpricing. We expect both to lower IPO underpricing. We find evidence of this.
From a resource-based perspective, a firm’s internationalization consists of developing and
maintaining specific knowledge and resources that differentiate it from firms operating within their national
boundaries, as well as a means of reducing uncertainty (Johanson and Wiedersheim-Paul, 1975; Shama,
1995). Establishing foreign business activities is considered as an important way for a firm to improve its
global competitive advantage (Nachum and Zaheer, 2005; Dunning, 1996; Hitt et al., 1994) and thus
increasing shareholder value (Bowe et al., 2010). More importantly, expanding its business beyond the
national boundaries allows the firm to benefit from substantial growth opportunities through developing its
core business competencies and its knowledge of foreign markets (Hitt et al., 2006; Barlett and Ghoshal,
1989). Foreign business activities also reflect the firm’s ability to establish further ties with various
constituencies in the global market as well as its ability to attract and manage new and diverse stakeholders
(Bell et al., 2014). Similarly, attracting a foreign VC may be considered as a token of trust by a foreign
investor seeking value maximization. Importantly, foreign VCs may act as resource providers and
supporters of the firm’s international growth and development, which is likely to increase the IPO premium.
This paper makes three major contributions to the existing literature. First, it adds to prior literature on
IPO performance by identifying two important and novel determinants of the IPO premium. These
determinants are the foreign business presence and the foreignness of the VC syndicate, which both increase
the IPO premium of US IPO firms.
Second, this paper extends the existing literature on value added by foreign VCs via the monitoring
and development of their US portfolio companies (e.g., Nahata et al., 2014; Chemmanur et al., 2012;
Makela and Maula, 2006). Building on the resource-based and institutional theories, we argue that foreign
VCs provide their portfolio companies with ample growth opportunities that translate into a higher IPO
premium. More specifically, we hypothesize that US portfolio companies benefit from the foreignness of
the VC syndicate. Such foreignness reflects both the (degree of) presence of foreign VCs (as measured by
foreign lead VC ownership, the proportion of foreign VCs in the VC syndicate, and foreign VC ownership),
and the distance between the IPO firm and the foreign VCs (as measured by the number of foreign VC
mother tongues, their average geographic distance to the USA, and their average cultural distance). While
the positive effect on the IPO premium is supported at low levels of foreign VC presence and distance, we
find that the increasing foreignness of the VC syndicate limits VCs’ effectiveness in properly monitoring
their investees. More precisely, and after controlling for domestic VC presence and distance, we find
evidence of a non-linear relationship between the IPO premium and foreign VC presence and distance,
measures used in the IPO literature. (2009) for a discussion about the different performance et al. See Certo 12

460
whereby the IPO premium first increases and then decreases with higher levels of foreignness of the VC
syndicate as measured by foreign VC presence as well as foreign VC distance from the IPO firm.
Third, we study the role played by foreign VCs in developing the international activities of their US
portfolio companies and find that foreign VCs support the international exposure and foreign business
activities of US IPO firms. Importantly, we find that foreign VCs strengthen the positive impact of foreign
business activities on the IPO premium.
The remainder of this paper is organized as follows. Section 2 reviews the literature and develops the
hypotheses. Section 3 presents the data sources, describes the sample, and discusses the methodology.
Section 4 presents the empirical results and Section 5 conducts extensive robustness and endogeneity
checks. Finally, Section 6 concludes and discusses the relevance of our results.
2. LITERATURE REVIEW
2.1. Foreign presence and IPO premium
The internationalization of a firm creates opportunities to develop value maximizing activities in
addition to those available to purely domestic firms (Errunza and Senbet, 1981). Previous literature puts
forward additional benefits from foreign business activities. Michel and Shaked (1986) as well as Beamish
(1999) show that firms with foreign business activities have lower total and systematic risk compared to
purely domestic firms. Importantly, investors tend to respond positively to internationalization as it
leverages growth opportunities and innovation compared to purely domestic companies (Zahra et al., 2000).
For example, greater foreign exposure, and more generally greater global exposure, is rewarded by an
increase in the firm’s price to earnings ratio given the reduction in systematic risk (Aggarwal, 1979).
Finally, compared to domestic earnings, foreign earnings have a larger positive effect (2.4 times larger) on
abnormal returns (Bodnar and Weintrop, 1997) and this effect is driven by the greater growth expectations
of multinational operations and earnings as compared to domestic operations and earnings (Garrod and
Rees, 1998).
Prior empirical research confirms a positive relationship between internationalization and firm
performance in the US context. Foreign business activities are recognized by investors and are reflected
through higher share prices (e.g., Errunza and Senbet, 1981; Doukas and Travlos, 1988; Agmon and
Lessard, 1997; Delios and Beamish, 1999; Lu and Beamish, 2001). By the same token, Berry and
Sakakibara (2008), who investigate the internationalization of Japanese firms, show that their performance
increases after they develop experience of and learning about the foreign markets. Finally, Desai et al.
(2009) show that firms that established a foreign presence between 1982 and 2004 also expanded their
domestic operations during the same period, which is likely to translate into even higher profitability and
performance.
Based on the above literature, foreign business activities likely improve a company’s growth potential,
and might therefore represent an important determinant of the premium paid by investors for its IPO shares.
This leads us to our first hypothesis.
Hypothesis (1): The IPO premium is positively related to the foreign business activities of the IPO firm.
2.2. Foreignness of the VC syndicate and IPO premium
The role played by VCs in certifying and monitoring their portfolio companies has been well
documented in prior literature. Typically VCs are associated with more successful IPOs, as reflected by
better short- and long-run IPO performance. However, there is as yet little evidence on the role played by
foreign VCs in affecting the value creation and growth opportunities of their investees. Tykvova and Walz
(2007) argue that German companies benefit from the expertise of more experienced and reputable foreign
VCs compared to local German VCs that are younger and less established, not independent, and mostly

461
public VCs. They find that German companies backed by foreign VCs have better long-run post-IPO
performance and lower firm-specific volatility than other IPOs.13
Dai et al. (2012) and Devigne et al. (2013) examine the effect of the involvement of foreign VCs on
the IPO exit performance and growth of Asian and European portfolio companies. They find that companies
with foreign VC backing are more likely to have a successful IPO compared to firms backed by local VCs.
Nahata et al. (2014) as well as Chemmanur et al. (2012) report similar findings for a sample of 9,000 and
30,071 VC-backed portfolio companies from 32 emerging and 45 developed countries, respectively. In
sum, foreign VCs are better at selecting their portfolio companies, they allow for better risk diversification,
provide better monitoring of their portfolio companies (Makela and Maula, 2006), and show greater
commitment towards their investees than local VCs (Maula and Makela, 2003).
Guo and Jian (2013) provide further support for the positive effect of foreign VCs on the performance
of IPO firms for the case of China. They show that foreign VCs create more value for the Chinese
manufacturing firms they invest in than domestic VCs. Similarly, Jiang et al. (2014) find that IPOs listed
on the Chinese SME market and backed by foreign VCs have a higher premium and lower underpricing
than their non VC-backed peers. More generally, foreign investors might exert pressure for increased
internationalization in order to increase shareholder value (Bowe et al., 2010; Strange et al., 2009). In
particular, their familiarity with the capital and product markets of their home country may be valuable
during their portfolio companies’ expansion into foreign markets (Schertler and Tykvova, 2011).
Nevertheless, foreign VCs investing in the US might face a liability of foreignness due to their lack of
local market knowledge. Such liability arises from the unfamiliarity with the environment, including
cultural and language differences. It also arises from the costs of coordinating business activities across
cultural and geographic distances (Zaheer, 1995) and the costs of higher uncertainty (Podolny, 2005). To
overcome such liability, foreign VCs need to incur significant monitoring and information collection costs
as they might lack the local market knowledge of their investees (Li, 2012; Chemmanur et al., 2012). As
the presence of foreign VCs within the VC syndicate of US portfolio companies becomes more pronounced,
their monitoring and information collection costs become prevalent and may deter them from properly
monitoring their portfolio companies.
Hence, while the increased presence of foreign VCs can create more growth opportunities for the
portfolio companies, past a certain level their presence may negatively affect the quality of monitoring by
the VC syndicate. Hence:
Hypothesis (2): The IPO premium first increases with the presence of foreign VCs, and then decreases
once their presence exceeds a certain level.
The above hypothesis focuses on the impact of the presence of foreign VCs on the business
development of their portfolio companies internationally. However, what may matter is the distance in
space and culture between the VCs and the portfolio firm. More precisely, more distant foreign VCs may
offer access to untapped growth potential in foreign markets and hence enhance the success of their
investees (Deloitte, 2010).
Conversely, VCs that are geographically close to their portfolio companies are better able to provide
them with monitoring and value creation (Wright et al., 2005), resulting in a more successful IPO
(Cumming and Dai, 2010). Cross-border VC investment is associated with decreasing communication and
less efficient management participation and interaction when the VCs are distant from their portfolio
companies, which is in line with increasing transaction costs described in Williamson (1966). Such
transaction costs, coupled with high information asymmetry may limit foreign VCs’ ability to identify and
monitor their portfolio companies (Bell et al., 2012). The cultural and geographic distances between the
head offices of the VCs and the cities of incorporation of the IPO firms are also an important determinant
There is also evidence that the monitoring role of VCs depends on the institutional framework of their country of 13
origin (Aguilera et al., 2008). Chahine and Saade (2011) find that foreign VCs originating from countries with greater
(weaker) shareholder protection than that prevailing in the US monitor their portfolio companies more (less)
extensively, which results in lower (higher) underpricing.

462
of VCs’ investment behavior and exit performance. Such distances may hinder the commitment of foreign
VCs to their portfolio companies (Maula and Makela, 2003), decrease VC effectiveness, and negatively
affect exit performance (Li et al., 2014). As the distance between the VCs and their investee increases,
inefficiencies within the VC syndicate will intensify, and this will exacerbate VCs’ ability to effectively
monitor their investee. We expect that foreign VCs that are closer exert a more positive influence on the
growth potential of their IPO firms. Hence:
Hypothesis (3): The IPO premium first increases with the distance between the VCs and their investee,
and then decreases as the distance becomes even greater.
2.3. Foreign VCs, internationalization of portfolio companies, and IPO premium
The research on the internationalization of VCs emphasizes the role of legitimacy (Zaheer, 1995) as
well as the role of the institutional and organizational learning contexts (Li and Zahra, 2012; Meuleman
and Wright, 2011) in the development of cross-border syndication. However, only few studies have
attempted to unveil the effect of foreign VCs on the internationalization and the other strategic outcomes
of their IPO firms. For example, Humphery-Jenner and Suchard (2013) study the effect of foreign VCs on
Chinese IPOs and find that the likelihood of success of the IPO firm increases when the foreign VC
collaborates with a joint venture partner. A possible reason for this is that foreign VCs are involved in IPOs
at the strategic level, i.e. they evaluate potential acquisitions of other firms and assist with strategic
planning, compared to domestic VCs whose involvement tends to be limited to the operational level (Pruthi
et al., 2003).14
Nonetheless, in line with the literature on the liability of foreignness (Zaheer, 1995), firms initiating
foreign business activities may lack legitimacy with the market participants of the foreign country and may
thus face a greater liability of foreignness. To overcome this legitimacy issue, companies that seek to
internationalize their operations may establish foreign alliances to help them enter and navigate in foreign
markets (Bruton et al., 2010). Foreign VCs may thus provide their investees with legitimacy in the market
which helps their internationalization (Makela and Maula, 2005). In fact, foreign VCs may provide access
to international networks, as well as help with the establishment of foreign offices, the recruitment of new
staff, and attracting foreign customers. They may also provide knowledge about the legal environment and
provide contacts with investors and financiers (Lutz and George, 2012; Makela and Maula, 2005; Makela
and Maula, 2008). The reputation and international knowledge of the foreign VC also serve as important
catalysts for the internationalization, especially for technology firms in the US (Fernhaber and McDougall-
Covin, 2009). As a result, the foreignness of the VC syndicate is an important determinant of firms’ ability
to expand internationally and gain legitimacy in foreign markets (Alcantara et al., 2006). From a resource-
based perspective, the presence and the distance of foreign VCs within the VC syndicate of IPO firms with
foreign business activities is likely to further support their international expansion. Hence:
Hypothesis (4): The presence of foreign VCs increases the positive association between the IPO
premium and foreign business activities.
Hypothesis (5): The distance between the foreign VCs and the IPO firm increases the positive
association between the IPO premium and foreign business activities.
3. Data Sources, Sample and Methodology
This section states the data sources and describes the sample selection process and methodology.
3.1. Data sources and sample
The authors use the following strategic variables: developing new strategies to meet changing circumstances, 14
evaluation of acquisitions once the firm becomes well established, helping to form and manage the board, seeking
additional equity finance, and acting as a sound board.

463
This study examines how foreign VCs affect the performance and the internationalization of 1,200
IPOs completed between January 01, 1995 and December 31, 2011. Our sample is drawn from the entire
population of 5,932 IPOs in the US markets as obtained from Thomson Financial Securities Data Company
(SDC). Similar to previous literature, we first removed IPOs representing all ADRs, REITs, unit offerings,
carve-outs and spinoffs, closed-end funds, foreign IPOs, and penny stocks (IPOs with an offer price below
USD 5). There were 2,294 such IPOs. This resulted in a sample of 3,638 IPOs, including 1,979 VC-backed
IPOs and 1,659 non VC-backed IPOs. We then matched our subsample of VC-backed IPOs with the list of
companies in VentureXpert database, and we excluded 602 VC-backed IPOs for which we had incomplete
data about VC members (undisclosed VC firms or missing data). We then matched the remaining sample
of 3,036 IPOs (1,377 VC backed IPOs and 1,659 non-VC-backed IPOs) with data from both Thomson
Financial Database and Datastream about firm characteristics and foreign business activities, including
foreign sales, foreign assets, and foreign net income. We dropped 1,059 companies for which we could not
determine whether they have or do not have foreign activities at IPO (563 VC-backed IPOs and 496 non
VC-backed IPOs). We also excluded 777 IPOs with missing data on firm characteristics and CEO origin
(402 VC-backed IPOs and 375 non VC-backed IPOs). The final sample includes 1,200 IPOs (412 VC-
backed IPOs and 788 non VC-backed IPOs) for which we hand-collected detailed data on the characteristics
of VC firms from the VentureXpert database and/or the VCs’ websites. We used the Center for Research
in Securities Prices (CRSP) data on closing stock prices, and the IPO prospectuses to collect data on CEO
origin.
Table 1 shows the sample’s representativeness of the entire population of US VC-backed firms over
1995-2011. Panel A presents the distribution across time for both the sample and the population of VC-
backed IPOs: the sample’s distribution across time is similar to that of the overall population. Similarly,
Panel B shows that the sample is representative of the population when it comes to the distribution of IPOs
across industries, i.e. across the one-digit Standard Industrial Classification (SIC) codes. Table 1 thus
confirms the sample’s representativeness of the population.

464
3.2. Methodology
Our testable hypotheses relate to the effects of the foreignness of the VC syndicate (as measured by
foreign VC presence and distance) as well as foreign business activities on the IPO premium. Prior research
uses three proxies for internationalization: foreign sales to total sales, foreign assets to total assets (LiPuma
2012; Blonigen and Wooster, 2003; Stopford and Dunning, 1983; Daniels and Bracker, 1989), and foreign
net income to total net income (Kotabe et al., 2002).We use the same three proxies. In robustness checks,
and in line with Sullivan (1994), we measure foreign business activities using a dummy variable equal to
one if the IPO firm has any type of foreign business activities (i.e. foreign sales, foreign assets, or foreign
net income), and zero otherwise.
Importantly, foreign business activities may not be exogenous as foreign VCs may be selecting IPO
firms with existing foreign business activities. To address this potential endogeneity issue, we apply a three-
stage least-squares (3SLS) regression system, consisting of the following system of simultaneous equations:

465
Foreign Business Activities = α0 + α1 Foreignness of the VC Syndicate (via Presence or Distance) +
α2 Foreign CEO dummy + α3 Market Capitalization + α4 Hi-tech dummy + α5 LnAge + Industry dummies +
Year dummies + ε (1)
IPO Premium = β0 + β1 Foreign Business Activities + β2 Foreignness of the VC Syndicate (via Presence
or Distance) + β3 Foreignness of the VC Syndicate Squared (via Presence or Distance) + β4 Foreign
Business Activities x Foreignness of the VC Syndicate + β5 Market Capitalization + β6 Hi-tech dummy +
β7 LnAge + β8 Lock-up Period + β9 Underwriter Reputation + β10 Bubble dummy + β11 Market Return +
Industry dummies + Year dummies + ξ (2)
Where, the first stage regression, i.e., equation (1), measures the magnitude of foreign business
activities, proxied by the proportion of foreign sales out of total sales, the proportion of foreign assets out
of total assets, and the proportion of foreign income out of total income. The second stage regression, i.e.,
equation (2), explains IPO performance measured by IPO Premium, which is defined as the difference
between the offer price and the book value per share expressed as a fraction of the offer price. Again, this
measures the price premium paid by the IPO investors in excess of the IPO firm book value, and represents
investors’ expectations of the firm’s value (Welbourne and Andrews, 1996; Rasheed, et al., 1997).
The first-stage regression within the 3SLS model includes an instrumental variable that should be
correlated with the dependent variable, i.e., foreign business activities, but should not be correlated with
the dependent variable of the second-step regression, i.e., the IPO premium. We thus include Foreign CEO
dummy as an instrumental variable (IV). Foreign CEO dummy is equal to one if the CEO of the IPO firm
is a foreigner, and zero otherwise. This is in line with prior research suggesting that US firms that switch
from US CEOs to foreign CEOs experience an increase in their foreign assets and foreign sales (Blonigen
and Wooster, 2003) and that the foreign nationality of the CEO contributes to increased exporting activities
(Sala and Yalcin, 2012). We find that Foreign CEO dummy is a valid instrumental variable since it is
correlated with foreign business activities, but not with the IPO premium.
We consider a VC to be foreign if the VC’s country of incorporation is not the USA. To examine the
effect of the foreignness of the VC syndicate, we use six different variables to measure the presence and
distance of foreign VCs. These six variables include three proxies for presence: (1) Foreign Lead VC
Ownership which is the number of shares owned by the lead foreign VC over the total number of shares
outstanding prior to IPO. In line with Lee and Wahal (2004), we consider the VC with the earliest
investment to be the lead VC. For 143 IPO firms with more than one lead VC, whether foreign or domestic,
we use the one with the highest ownership as the lead VC ownership.15 Wang and Wang (2011) indicate
that lead VCs are typically the most active investors and play a leading role in monitoring and
professionalizing their investees. As such, the foreignness of the VC syndicate would be reinforced if
foreign VCs took the lead of the VC syndicate. We also use (2) Proportion of Foreign VCs which is equal
to the number of foreign VCs over the number of VCs in the IPO firm’s VC syndicate. Finally, we use (3)
Foreign VC Ownership which is equal to the number of shares owned by foreign VCs over the total number
of shares outstanding, both measured immediately prior to IPO.
We also use three proxies for distance which include: (1) Average Foreign VC Distance, i.e. the
average of the distances, in miles, between each foreign VC head office and the city of incorporation of the
IPO firm. Prior literature also cites the geographic distance between the portfolio company and the VC as
a major factor affecting the latter’s involvement in the former (Dai et al., 2012; Aizenman and Kendall,
2012; Chemmanur et al., 2012).
We also use (2) Number of Foreign VC Mother Tongues, i.e. the number of foreign mother tongues
among the VC syndicate. If the VC’s mother tongue is not English, then this may represent a barrier that
severely limits the VC’s involvement in its investee. Finally, we use (3) Average Foreign VC Cultural
Distance to measure cultural differences between the foreign VC’s country of origin and its investee’s home
country. In line with prior literature (Dai et al., 2012; Chemmanur et al., 2012; Kogut and Singh, 1988), we
calculate Average Foreign VC Cultural Distance as a measure of cultural distance using Hofstede’s (1980)
have any IPO firms where all the lead VCs are foreign. We do not 15
466
four dimensions of national culture: power distance, uncertainty avoidance, masculinity, and
individualism.16
In addition to using the domestic equivalent for foreign VC lead ownership, proportion of foreign VCs,
foreign VC ownership, and average foreign VC distance,17 we also use a set of control variables that prior
literature finds to be determinants of IPO performance. In particular, we use IPO firm size and age, and we
expect smaller firms and younger firms to have more growth opportunities than larger or more established
and mature firms. We thus expect IPO firm size and age to be negatively associated with the IPO premium.
We measure firm size by Market Capitalization which is the total number of shares outstanding
immediately after the IPO times the offer price. In line with Loughran and Ritter (2004), Firm Age is the
difference, in years, between the IPO date and the firm’s incorporation date. Additionally, hi-tech firms
have more intangible assets and greater potential for growth. Hence, we include Hi-tech dummy which is
equal to one if the IPO firm is a hi-tech firm,18 and zero otherwise, and we expect it to positively affect the
IPO premium.
The existence of a lock-up period as well as its length has been suggested as a signal of the IPO’s
quality. Bruton et al. (2010) show that lock-up agreements are used by VCs to signal their confidence in
their portfolio firms, and we expect the length of the lock-up period to positively affect the IPO premium.
Lock-up Period is equal to the difference, in days, between the IPO date and the end of the lock-up period
(Chahine and Goergen, 2011).
Underwriter reputation is also considered an important signaling mechanism as reputable underwriters,
given their greater standing compared to the other underwriters, are able to attract the better issuing firms
(Paleari et al., 2014). In turn, issuing firms underwritten by more reputable underwriters attract more
investors and have a greater IPO premium given that they charge a higher offer price relative to their book
value per share (Chemmanur and Krishnan, 2012). Underwriter reputation is based on the underwriter
ranking in Loughran and Ritter (2004), which in turn relies on the classification of Carter and Manaster
(1990), and is on a scale of zero to nine, ranging from the least to the most prestigious underwriter.
We also control for the momentum effect by including Market Return, the pre-IPO market return,
which according to Aaij and Brounen (2002) is positively associated with IPO value. In line with Derrien
(2005), Market Return is the weighted average of the daily returns on a CRSP equally weighted portfolio
over the 3 months preceding the IPO date, where the average daily return for the least recent month is given
a weight of 1, the return for the second month preceding the IPO date a weight of 2, and the daily average
return of the last month prior to the IPO date a weight of 3. Finally, we add Bubble dummy which is equal
to one if the IPO was completed during the 1999-2000 period, and zero otherwise. This period was
characterized by greater availability of capital in the financial markets as well as higher valuation multiples,
thus leading to a positive association between the IPO premium and the bubble dummy (Ljungqvist, 2007;
16 Similar to Kogut and Singh (1988), the cultural distance between a given foreign VC’s country of origin j and the
USA (US), the home country of all of the IPO sample companies, is computed as follows:
𝐶𝑢𝑙𝑡𝑢𝑟𝑎𝑙 𝐷𝑖𝑠𝑡𝑎𝑛𝑐𝑒𝑗 = ∑(𝐼𝑖𝑗 − 𝐼𝑖,𝑈𝑆)/𝑉𝑖
4
4
𝑖=1
where i refers to the four dimensions of national culture as stated above, Iij represents Hofstede’s index for cultural
dimension i and country j, and Vi represents the variance of the index across dimension i. Cultural distance is equal to
the average of the culture distances between the country of origin of each foreign VC and the US. do not apply for domestic VC firms as The number of VC mother tongues and the average VC cultural distance 17
they share the same mother tongue and culture with their investees. 18 Hi-tech firms are defined as in Loughran and Ritter (2004). They are as those with SIC codes 3571, 3572, 3575,
3577, 3578 (computer hardware), 3661, 3663, 3669 (communications equipment), 3671, 3672, 3674, 3675, 3677,
3678, 3679 (electronics), 3812 (navigation equipment), 3823, 3825, 3826, 3827, 3829 (measuring and controlling
devices), 3841, 3845 (medical instruments), 4812, 4813 (telephone equipment), 4899 (communications services),
7371, 7372, 7373, 7374, 7375, 7378, and 7379 (software).

467
Ritter and Welch, 2002). We further control for differences across industries and time using industry
dummies and year dummies, respectively.
4. EMPIRICAL RESULTS
We start by discussing descriptive statistics. We then analyze the association between IPO
performance, foreign business activities, and foreign VCs.
4.1. Descriptive statistics
Table 2 shows the descriptive statistics for the sample, including the mean, the standard deviation, and
the quartiles (Q1, Q2 or median, Q3, and Q4). Panel A presents the descriptive statistics for foreign and
domestic VC presence and distance for the subsample of the 412 VC-backed IPOs. The VC syndicate (VC
Syndicate) is comprised of 4.738 VC firms on average. The average proportion of ownership of foreign
(Foreign Lead VC Ownership) and domestic lead VCs (Domestic Lead VC Ownership) to the number of
outstanding shares before IPO is 0.017 and 0.153, respectively. The average proportion of foreign VCs
(Proportion of Foreign VCs) and domestic VCs, i.e. the number of foreign VCs and that of domestic VCs
to the total number of VCs within the VC syndicate, is 0.073 and 0.927, respectively. Foreign VCs and
domestic VCs own an average of 3.1% and 32.2% of shares outstanding immediately prior to the IPO,
respectively. Not tabulated, focusing on the foreign VCs that are involved in 109 of the 1,377 VC-backed
IPOs, the average proportion of foreign VCs and domestic VCs is 27.7% and 72.3%, respectively.
Moreover, Foreign VCs and domestic VCs own an average 11.8% and 26.6%, respectively.
The average number of foreign mother tongues of foreign VCs within the VC syndicate (Number of
Foreign VC Mother Tongues) is 0.199. The average of the distances between the location of the foreign VC
or that of the domestic VC, on the one hand, and the city of incorporation of the IPO firm on the other hand
(Average Foreign VC Distance and Average Domestic VC Distance) is roughly 1,239 and 787 miles,
respectively. Additionally, the average cultural distance (Average Foreign VC Cultural Distance) between
the IPO firm and each of its foreign VCs is 0.121, on a scale of 0 to 6.63, based on the four cultural
dimensions as per Hofstede’s (1980) measure of cultural distance. Looking at the sub-sample of 109 VC-
backed IPOs involving foreign VCs, the average cultural distance increases to 1.65, which is almost equal
to the average VC cultural distance of the 149 countries (including the USA) covered by the Hofstede Index,
including the US.

468
Panel B presents the descriptive statistics for the firm characteristics for the entire sample of the 1,200
VC-backed and non VC-backed IPOs. The sample firms exhibits an average IPO premium of 66.9%, thus
having value paid by investors that is above and beyond the book value of their shares. This is slightly
lower than the 68.62% reported in Welbourne and Andrews (1996) for a sample of 136 IPOs completed in

469
1988. The IPO premium displays slightly negative skewness (the mean of 66.9% is lower than the median
of 69.9%). The average proportion of foreign sales (Proportion Foreign Sales) is 0.124. The average
proportion of foreign assets is 0.047, and the average proportion of foreign net income is 0.053.
Additionally, 20.3% of IPO firms have a foreign CEO at the time of going public.
When examining the remaining IPO firm characteristics, we find that the average IPO market
capitalization is $593.819 million with a positive skewness, thus indicating that the sample includes a few
very large IPOs. We also find that 44.5% of the IPOs are in high technology sectors (Hi-tech dummy).
Additionally, the average age of the firms at the IPO (Firm Age) is roughly 20 years, with a median age of
about 10 years. The average length of the lock-up period (Lock-up Period) is roughly 174 days. The average
IPO is taken public by a prestigious underwriter (Underwriter Reputation) as reflected by the high average
reputation ranking of 7.72, and 17.3% of the IPOs in our sample are taken public during the Internet
bubble.19 Finally, the prevailing market conditions prior to the time of going public are characterized by a
weighted average market return of 0.8%.
The correlation matrix, which is not reported for the sake of brevity but available upon request,
indicates that the IPO premium is highly and positively correlated with the ownership of foreign lead VCs,
the proportion of foreign VCs, foreign VC ownership, the number of foreign VC mother tongues, the
average foreign VC distance, and the average foreign VC cultural distance (all significant with p=1%). This
provides preliminary support for the positive impact of foreign VCs on the IPO premium.20 Importantly,
the variance inflation factor (VIF) is lower than 1.82, which rejects the existence of multicollinearity.
4.2. The effect of the foreignness of the VC syndicate and foreign business activities on the
IPO premium
Table 3 examines the effect of the foreignness of the VC syndicate and foreign business activities on
the IPO premium. It uses a three-stage least-squares (3SLS) model that allows for the simultaneous
determination of foreign business activities as proxied by the proportion of foreign sales, foreign assets,
and foreign income and the IPO premium. The table has three panels and each panel uses a different
measure of foreign business activities.
Panel A uses the proportion of foreign sales as a measure of foreign business activities. Regressions
(1a) to (1f) (the first-step regressions) in Panel A control for the potential endogenous determination of
foreign sales, whereas regressions (2a) to (2f) (the second-step regressions) examine the effect of the
predicted foreign sales on the IPO premium. The predicted proportion of foreign sales is included in
regressions (2a) to (2f). The various regressions, designated by the letters a to f, use different proxies for
foreign and domestic VC presence and distance. On the one hand, foreign and domestic VC presence is
measured by foreign and domestic lead VC ownership in regressions (1a) and (2a), the proportions of
foreign VCs and domestic VCs in regressions (1b) and (2b), and foreign VC ownership and domestic VC
ownership in regressions (1c) and (2c). On the other hand, VC distance is measured by the number of
foreign VC mother tongues in regressions (1d) and (2d), the logarithm of the average foreign VC distance
in regressions (1e) and (2e), and the average foreign VC cultural distance in regressions (1f) and (2f). If
applicable, we also include the domestic equivalent for VC distance as a control variable.
According to Carter and Manaster (1990) and Loughran and Ritter (2004), underwriters with a reputation ranking 19
greater than 7.1 are considered to be reputable or prestigious underwriters.
We also perform several tests of equality of means for the IPO premium (these tests are not tabulated) that involve 20
dividing the sample according to whether IPO firms have foreign VCs or not and whether IPO firms have foreign
business activities or not. The results show that IPO firms with no foreign VCs and no foreign business activities have
the lowest IPO premium. The IPO premium increases as firms are exposed to foreign business activities and to foreign
VC. The highest IPO premium levels are observed for IPO firms that have both foreign VC (presence or distance) and
foreign business activities. The above differences in means are all significant (p=5% or better).

471
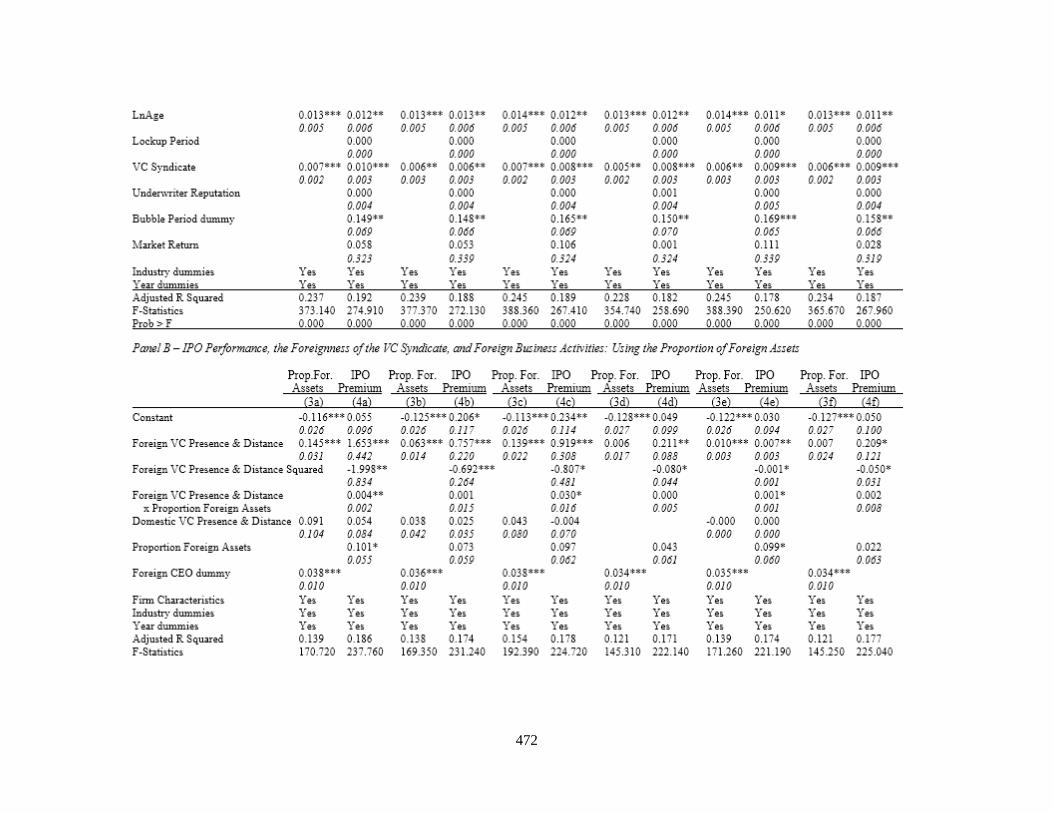
472

473

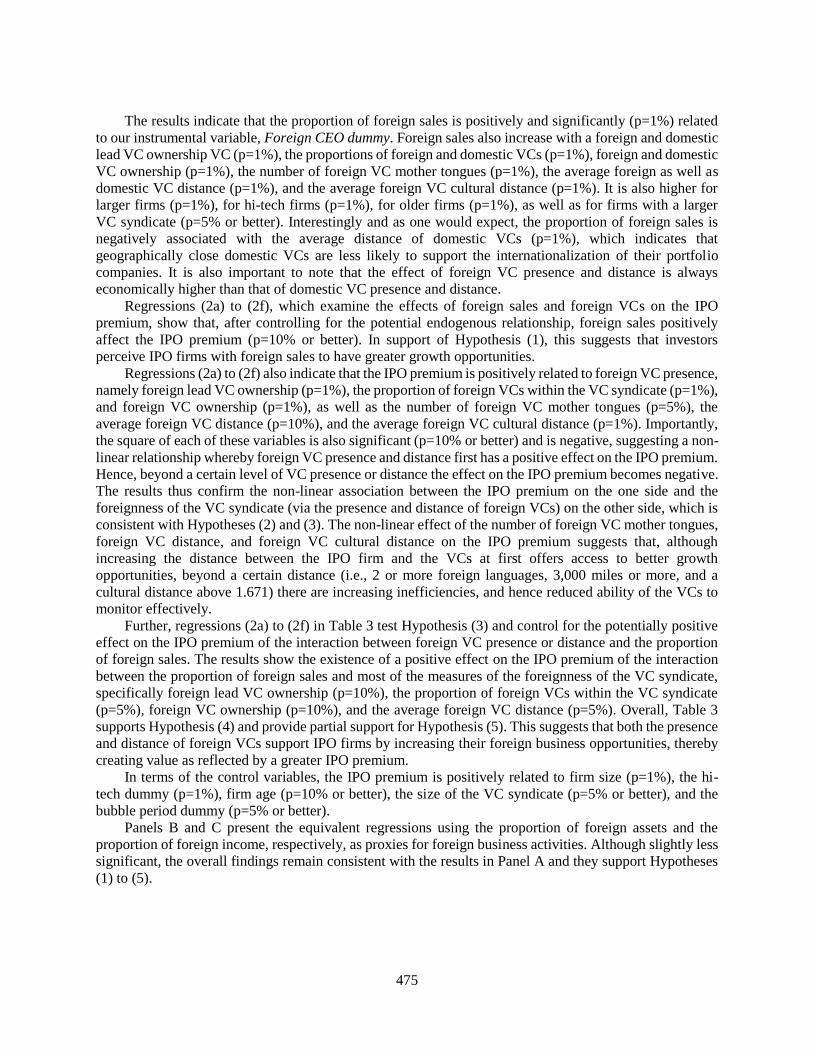
475
The results indicate that the proportion of foreign sales is positively and significantly (p=1%) related
to our instrumental variable, Foreign CEO dummy. Foreign sales also increase with a foreign and domestic
lead VC ownership VC (p=1%), the proportions of foreign and domestic VCs (p=1%), foreign and domestic
VC ownership (p=1%), the number of foreign VC mother tongues (p=1%), the average foreign as well as
domestic VC distance (p=1%), and the average foreign VC cultural distance (p=1%). It is also higher for
larger firms (p=1%), for hi-tech firms (p=1%), for older firms (p=1%), as well as for firms with a larger
VC syndicate (p=5% or better). Interestingly and as one would expect, the proportion of foreign sales is
negatively associated with the average distance of domestic VCs (p=1%), which indicates that
geographically close domestic VCs are less likely to support the internationalization of their portfolio
companies. It is also important to note that the effect of foreign VC presence and distance is always
economically higher than that of domestic VC presence and distance.
Regressions (2a) to (2f), which examine the effects of foreign sales and foreign VCs on the IPO
premium, show that, after controlling for the potential endogenous relationship, foreign sales positively
affect the IPO premium (p=10% or better). In support of Hypothesis (1), this suggests that investors
perceive IPO firms with foreign sales to have greater growth opportunities.
Regressions (2a) to (2f) also indicate that the IPO premium is positively related to foreign VC presence,
namely foreign lead VC ownership (p=1%), the proportion of foreign VCs within the VC syndicate (p=1%),
and foreign VC ownership (p=1%), as well as the number of foreign VC mother tongues (p=5%), the
average foreign VC distance (p=10%), and the average foreign VC cultural distance (p=1%). Importantly,
the square of each of these variables is also significant (p=10% or better) and is negative, suggesting a non-
linear relationship whereby foreign VC presence and distance first has a positive effect on the IPO premium.
Hence, beyond a certain level of VC presence or distance the effect on the IPO premium becomes negative.
The results thus confirm the non-linear association between the IPO premium on the one side and the
foreignness of the VC syndicate (via the presence and distance of foreign VCs) on the other side, which is
consistent with Hypotheses (2) and (3). The non-linear effect of the number of foreign VC mother tongues,
foreign VC distance, and foreign VC cultural distance on the IPO premium suggests that, although
increasing the distance between the IPO firm and the VCs at first offers access to better growth
opportunities, beyond a certain distance (i.e., 2 or more foreign languages, 3,000 miles or more, and a
cultural distance above 1.671) there are increasing inefficiencies, and hence reduced ability of the VCs to
monitor effectively.
Further, regressions (2a) to (2f) in Table 3 test Hypothesis (3) and control for the potentially positive
effect on the IPO premium of the interaction between foreign VC presence or distance and the proportion
of foreign sales. The results show the existence of a positive effect on the IPO premium of the interaction
between the proportion of foreign sales and most of the measures of the foreignness of the VC syndicate,
specifically foreign lead VC ownership (p=10%), the proportion of foreign VCs within the VC syndicate
(p=5%), foreign VC ownership (p=10%), and the average foreign VC distance (p=5%). Overall, Table 3
supports Hypothesis (4) and provide partial support for Hypothesis (5). This suggests that both the presence
and distance of foreign VCs support IPO firms by increasing their foreign business opportunities, thereby
creating value as reflected by a greater IPO premium.
In terms of the control variables, the IPO premium is positively related to firm size (p=1%), the hi-
tech dummy (p=1%), firm age (p=10% or better), the size of the VC syndicate (p=5% or better), and the
bubble period dummy (p=5% or better).
Panels B and C present the equivalent regressions using the proportion of foreign assets and the
proportion of foreign income, respectively, as proxies for foreign business activities. Although slightly less
significant, the overall findings remain consistent with the results in Panel A and they support Hypotheses
(1) to (5).

476
5. ROBUSTNESS TESTS: DIVERSIFICATION, ALTERNATIVE PERFORMANCE
MEASURES, AND SELECTION BIAS
This section contains two different types of robustness tests. The first type of robustness tests examines
the effect of international diversification – using the number of countries in which the IPO firm is present
– as a proxy for foreign business activities, and checks whether our results are upheld using both the IPO
premium and IPO underpricing as a measure of IPO performance.
The second type of robustness tests adjusts in a different way from the above 3SLS models for the
possibility that foreign VCs select portfolio companies with existing foreign business activities. They do so
by adopting a Heckman procedure that controls for the potential endogeneity arising from VC firms
selecting firms with existing foreign business activities, proxied by Foreign Business Activities dummy. In
what follows, we motivate these robustness tests and then discuss the results obtained from these tests.
5.1. IPO performance, foreign VCs and international diversification
Prior research documents that higher levels of geographic diversification increase firm performance
(e.g., Delios and Beamish, 1999; Bodnar et al., 1997; Errunza and Senbet, 1981). International
diversification adds value since it increases revenues by expanding the firm’s market power (Kogut, 1983),
reduces the fluctuation in revenues as the firm spreads its investment risk across many countries (Kim et
al., 1993), allows the firm to exploit and augment resources in foreign markets (Strange et al., 2009), and
lowers costs as the firm benefits from the arbitrage opportunities of price differences across various national
input and output markets (Hennart, 1982).
Table 4 investigates the effects of diversification, using the total number of foreign countries in which
the IPO firm has subsidiaries, on both the IPO premium and underpricing. Given that we do not have access
to data on the percentage of sales per country, we use the total number of foreign countries where the firm
has a physical presence, i.e. has a subsidiary, as a measure of diversification. This is consistent with Hitt et
al. (1997) who define international diversification as the number of different foreign markets in which a
firm operates. Moreover, in addition to the IPO premium, underpricing may be used as a proxy for the risk
premium required by investors to participate in the IPO (see Benveniste and Spindt, 1989). Hence, we use
underpricing as an alternative dependent variable. Underpricing is equal to the difference between the
closing price on the first day of trading and the offer price expressed as a proportion of the latter. As
international diversification may reflect the ability of the firm to diversify economic risk, it may result in a
lower risk premium, i.e. lower underpricing. Although not reported in tabular form, the average
underpricing of the sample is equal to 18.5%, with a median of 7.5%.
The regressions in Table 4 are based on an instrumental variable (IV) regression model, which corrects
for a potential selection bias whereby foreign VCs select IPO firms with existing foreign business activities.
Regressions (7a) to (7f) are the first-step regressions. More specifically, they are Poisson regressions, using
the various proxies for VC foreignness, from which we extract the predicted value of the number of
countries where the IPO firm has a subsidiary. This predicted value is then used in the second-step
regressions, in regressions (8a) to (8f), to explain the IPO premium, and regressions (9a) to (9f) to explain
IPO underpricing.

477

478

479
The Poisson regressions (7a) to (7f) show that international diversification is positively
related to the various proxies for both foreign VC presence and distance (p=1%). In contrast,
only domestic VC presence, but not domestic VC distance has a significant and positive effect
on international diversification. Importantly, the effect of foreign VC presence is significantly
higher than that of domestic VC presence in the case of ownership and the proportion in the
VC syndicate (p=5%). International diversification also increases for firms with a foreign CEO
(p=1%) which is in line with our initial prediction when we discussed the validity of our
instrumental variable. Although not tabulated, international diversification is positively related
to firm size (p=1%) and firm age (p=1%).
Regressions (8b) to (8e) show the existence of a positive relationship between the IPO
premium and the number of countries where the IPO firm is present (p=10% or better), thus
indicating that international diversification adds value to US IPO firms. In addition, the IPO
premium first increases with the foreignness of VC firms (p=1%), and then decreases beyond
a certain level of foreign VC presence and distance (p=10% or better). The IPO premium is
also positively related to the interaction between foreign VC presence or distance and
international diversification, which is consistent with our previous findings. In contrast,
domestic VC presence and distance does not have a significant effect on the IPO premium.
Moreover, regressions (9a) and (9c) show that the IPO underpricing decreases with the
number of countries where the IPO firm has a subsidiary (p=10%). Also, regressions (9a), (9c),
(9d) and (9f) indicate that underpricing first decreases, and then increases above a certain level
of VC foreignness (p=10% or better), this is the case for foreign lead VC ownership, foreign
VC ownership, the number of foreign VC mother tongues and foreign VC cultural distance,
respectively. Further, regressions (9c) to (9f) show that IPO underpricing decreases in the
interaction between VC presence or distance and international diversification (p=10% or
better). Similar to what was observed in Panel B for the case of the IPO premium, domestic VC
presence and distance does not have any significant impact on IPO underpricing.
To sum up Table 4, international diversification, as proxied by the number of foreign countries
where the IPO firm has subsidiaries, provides growth opportunities as well as mitigates part of
the risk faced by IPO investors.
5.2. Endogeneity of the choice of the IPO firm
In this section, we adjust for the possibility that foreign VCs may invest in IPO firms with
existing foreign business activities in a different way, i.e. by using a two-step Heckman
selection procedure. Foreign Business Activities dummy, which proxies for foreign business
activities, takes the value of one if the IPO firm is involved in any form of foreign business
activities, i.e. foreign sales, foreign assets, or foreign net income, and zero otherwise. The
Heckman procedure includes the following two steps. The first step consists of a probit
regression, the selection equation (1), estimating the probability that the IPO firm has foreign
business activities as well as the inverse Mills’ ratio. The second step consists of an OLS
regression, equation (2), which includes the Mills’ ratio in addition to the variables of interest
affecting the IPO premium. The inverse Mills’ ratio (Lambda) is included in the second-step
regression to obtain unbiased coefficient estimates for Foreign Business dummy and the other
explanatory variables.
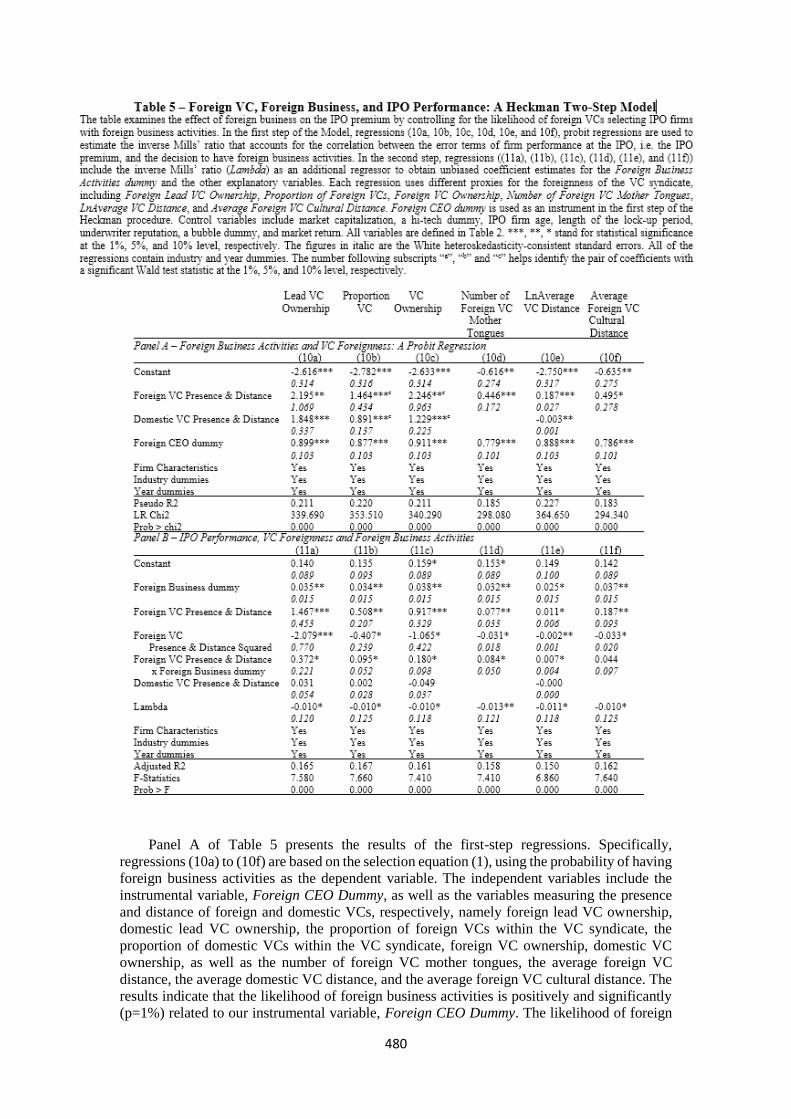
480
Panel A of Table 5 presents the results of the first-step regressions. Specifically,
regressions (10a) to (10f) are based on the selection equation (1), using the probability of having
foreign business activities as the dependent variable. The independent variables include the
instrumental variable, Foreign CEO Dummy, as well as the variables measuring the presence
and distance of foreign and domestic VCs, respectively, namely foreign lead VC ownership,
domestic lead VC ownership, the proportion of foreign VCs within the VC syndicate, the
proportion of domestic VCs within the VC syndicate, foreign VC ownership, domestic VC
ownership, as well as the number of foreign VC mother tongues, the average foreign VC
distance, the average domestic VC distance, and the average foreign VC cultural distance. The
results indicate that the likelihood of foreign business activities is positively and significantly
(p=1%) related to our instrumental variable, Foreign CEO Dummy. The likelihood of foreign
481
business activities also increases with the various proxies of foreign VC presence and distance
(p=1%). Foreign business activities are also more likely in the presence of domestic VCs, but
less likely for firms with geographically closer domestic VCs (p=5% or better).
Regressions (11a) to (11f) in Panel B of Table 5 examine the effects of the foreign business
activities dummy and the presence and distance of foreign VCs on the IPO premium. The
inverse Mills’ ratio is negative and significant (p=10% or better) in all the regressions, thus
suggesting that there is a selection bias. Furthermore, the IPO premium is positively related to
the foreign business activities dummy (p=10% or better), thus supporting Hypothesis (1).
Additionally, the IPO premium first increases with foreign VC presence and distance (p=10%
or better), and then once a certain level as been reached it decreases with further foreign VC
presence and distance (p=10% or better). This supports Hypothesis (2).
Moreover, the IPO premium increases with the interaction between the foreign business
activities dummy and foreign VC presence and distance (p=10%), except for the average
foreign VC cultural distance, which does not affect the IPO premium. Our results thus suggest
that the IPO premium has an inverted U-shaped relationship with the presence and distance of
foreign VCs. Overall, the results support Hypotheses (1) to (5).
6. CONCLUSION AND DISCUSSION
This paper investigates the effect of foreign business activities and the foreignness of the
VC syndicate, measured by foreign VC presence and distance, on the IPO premium of US VC-
backed IPO companies. In line with the resource-based view, we find that the IPO premium is
positively affected by foreign business activities. We also find that, after controlling for the VC
selection bias, foreign VC presence and distance in US IPO companies at first positively affect
the IPO premium, thus suggesting that foreign VCs create value added for US IPO firms.
However, past a certain level, foreign VC presence and distance negatively affect IPO
performance. To sum up, our results suggest that there exists an inverse U-shaped relationship
between foreign VC presence or distance and the IPO premium. Further, foreign VC presence
and distance strengthen the association between the IPO premium and foreign business
activities.
The results of this research have important implications for IPO firms as well as for VCs,
and in particular foreign VCs. They suggest that the IPO premium increases with the firm’s
ability to operate in foreign environments and its ability to attract foreign investors that can
strategically support its future operations, notably in terms of international activities. Given the
superior IPO performance of firms backed by foreign VCs, our research suggests that VC
syndicates in the US benefit from foreign VCs, as VC syndicates formed of both US VCs and
foreign VCs are likely to better monitor and assist the future development of their investees.
However, the right balance between foreign and domestic VCs in the syndicate is important.
Indeed, at first foreign VC presence (as measured by foreign lead VC ownership, the proportion
of foreign VCs, and foreign VC ownership) and distance (as measured by the number of foreign
VC mother tongues, as well as geographic and cultural distances) have a positive effect on the
IPO premium. However, beyond a certain level the effect of foreign VCs on the IPO premium
becomes negative.
References
Aaij, S. and D. Brounen (2002), ‘High-tech IPOs: a Tale of Two Continents’, Journal of
Applied Corporate Finance, Vol. 15, No. 1 (Spring), pp. 87-94.
Agmon, T. and D. Lessard (1977), ‘Investor Recognition of Corporate International
Diversification’, Journal of Finance, Vol. 32, No. 4 (September), pp. 1049-1055.
Ahlstrom, D. and G. Bruton (2001), ‘Learning from Successful Local Private Firms in
China: Establishing Legitimacy’, Academy of Management Executive, Vol. 15, No. 4
(November), pp. 72-83.

482
Aggarwal, R. (1979), ‘Multinationality and Stock Market Valuation: An Empirical Study of
U.S. Markets and Companies’, Management International Review, Vol. 19, No. 2 (May),
pp. 5-21.
Aguilera, R., I. Filatotchev, H. Gospel, and G. Jackson (2008), ‘An Organizational Approach
to Comparative Corporate Governance Costs, Contingencies and Complementarities’,
Organization Science, Vol. 19, No. 3 (February), pp. 475-492.
Aizenman, J. and J. Kendall (2012), ‘The Internationalization of Venture Capital’, Journal
of Economic Studies, Vol. 39, No. 5 (September), pp. 488-511.
Alcantara, L., H. Mitsuhashi, and Y. Hoshino (2006), ‘Legitimacy in International Joint
Ventures: It is Still Needed’, Journal of International Management, Vol. 12, No. 4
(December), pp. 389-407.
Bartlett, C. and S. Ghoshal (1989), Managing Across Borders: The Transnational Solution
(Harvard Business Review Press).
Beamish, P. (1999), ‘The Role of Alliances in International Entrepreneurship’, Research in
Global Strategic Management, Vol. 7, pp. 43–61.
Bell, G., C. Moore, and H. Al-Shammari (2014), ‘Country of Origin and Foreign IPO
Legitimacy: Understanding the Role of Geographic Scope and Insider Ownership’,
Entrepreneurship Theory and Practice, Vol. 38, No. 1 (January), pp. 185-202.
Bell, G., I. Filatotchev, and R. Aguilera (2014), ‘Corporate Governance and Investors’
Perceptions of Foreign IPO Value: An Institutional Perspective’, Academy of Management
Journal, Vol. 57, No. 1 (January), pp. 301-320.
Bell, G., I. Filatotchev, and A. Rasheed (2012), ‘The Liability of Foreignness in Capital
Markets: Sources and Remedies’, Journal of International Business Studies, Vol. 43, No. 2
(February), pp. 107-122.
Benveniste, L. and P. Spindt (1989), ‘How Investment Bankers Determine the Offer Price
and Allocation of New Issues’, Journal of Financial Economics, Vol. 248, No. 2, pp. 343-
361.
Berry, H. and M. Sakakibara (2008), Resource Accumulation and Overseas Expansion by
Japanese Multinationals’, Journal of Economic Behavior and Organization, Vol. 65, No. 2
(February), pp. 277-302.
Blonigen, B. and R. Wooster (2003), ‘CEO Turnover and Foreign Market Participation’,
Working Paper (NBER).
Bodnar, G. and J. Weintrop (1997), ‘The Valuation of the Foreign Income of US
Multinational Firms: A Growth Opportunities Perspective’, Journal of Accounting and
Economics, Vol. 24, No. 1 (December), pp. 69-97.
Bodnar, G., C. Tang, and J. Weintrop (1997), ‘Both Sides of Corporate Diversification: The
Value Impacts of Geographic and Industrial Diversification’, Working paper (NBER).
Bowe, M., I. Filatotchev, and A. Marshall (2010), ‘Integrating Contemporary Finance And
International Business Research’, International Business Review, Vol. 19, No. 5 (October),
pp. 435-445.
Bruton, G., D. Ahlstrom, and H.-L. Li (2010), ‘Institutional Theory and Entrepreneurship:
Where are We Now and Where Do We Need to Move in the Future?’, Entrepreneurship
Theory and Practice, Vol. 34, No. 3 (May), pp. 421-440.
Bruton, G., I. Filatotchev, S. Chahine, and M. Wright (2010), ‘Governance, Ownership
Structure and Performance of IPO Firms: The Impact of Different Types of Private Equity
Investors and Institutional Environments’, Strategic Management Journal, Vol. 31, No. 5
(May), pp. 491–509.
Carter, R. and S. Manaster (1990), ‘Initial Public Offerings and Underwriter Reputation’,
Journal of Finance, Vol. 45, No. 4 (September), pp. 1045-1067.
Certo, T., T. Holcomb, and M. Holmes (2009), ‘IPO Research in Management and
Entrepreneurship: Moving the Agenda Forward’, Journal of Management, Vol. 35, No. 6
(December), pp. 1340-1378.

483
Chahine, S. and M. Goergen (2011), ‘VC Board Representation and Performance of US
IPOs’, Journal of Business Finance and Accounting, Vol. 38, Nos. 3&4 (April/May), pp.
413-445.
Chahine, S. and S. Saade (2011), ‘Shareholder Rights and the Effect of the Origin of Venture
Capital Firms on the Underpricing of US IPOs’, Corporate Governance: An International
Review, Vol. 19, No. 6 (November), 601-621.
Chemmanur, T. and K. Krishnan (2012), ‘Heterogeneous Beliefs, IPO Valuation, and the
Economic Role of the Underwriter in IPOs’, Financial Management, Vol. 41, No. 4
(Winter), pp. 769-811.
Chemmanur, T., T. Hull, and K. Krishnan (2012), ‘Do Local and International Venture
Capitalists Play Well Together? A study of International Venture Capital Investments’,
Working paper (SSRN).
Cumming, D., and N. Dai (2010), ‘Local Bias in Venture Capital Investments’, Journal of
Empirical Finance, Vol. 17, No. 3 (June), pp. 362-380.
Dai, N., H. Jo, and S. Kassicieh (2012), 'Cross-border Venture Capital Investments in Asia:
Selection and Exit Performance’, Journal of Business Venturing, Vol. 27, No. 6
(November), pp. 666-684.
Daniels, J. and J. Bracker (1989), ‘Profit Performance: Do Foreign Operations Make a
Difference?’, Management International Review, Vol. 29, No. 1 (February), pp. 46-56.
Delios, A., P. Beamish (1999), ‘Geographic Scope, Product Diversification and the
Corporate Performance of Japanese Firms’, Strategic Management Journal, Vol. 20, No. 8
(August), pp. 711–727.
Deloitte, 2010, ‘Global trends in venture capital: Outlook for the future’, Available Online:
http://www.deloitte.com/assets/
Derrien, F. (2005), ‘IPO Pricing in “Hot Market” Conditions: Who Leaves Money on the
Table’, Journal of Finance, Vol. 60, No. 1 (February), pp. 487-521.
Desai, M., F. Foley, and J. Hines (2009), ‘Effects of the Foreign Activities of US
Multinationals’, American Economic Journal: Economic Policy, Vol. 1, No. 1 (February),
pp. 181-203.
Devigne, D., T. Vanacker, S. Manigart, and I. Paeleman (2013), ‘The role of domestic and
cross-border venture capital investors in the growth of portfolio companies’, Small
Business Economics, Vol. 40, No. 3 (October), pp. 553-573.
Doukas, J. and N. Travlos (1988), ‘The Effect of Corporate Multinationalism on
Shareholders’ Wealth: Evidence from International Acquisitions’, Journal of Finance, Vol.
43, No. 5 (December), pp. 1161-1175.
Dunning, J. (1996), ‘The Geographical Sources of the Competitiveness of Firms: Some
Results of a New Survey’, Transnational Corporations, Vol. 5, No. 3 (November), pp. 1–
29.
Errunza, V. and L. Senbet (1981), ‘The Effects of International Operations on the Market
Value of the Firm: Theory and Evidence, Journal of Finance, Vol. 36, No. 2 (June), pp.
401-417.
Fernhaber, S. and P. McDougall-Covin (2009), Venture Capitalists as Catalysts to New
Venture Internationalization: The Impact of their Knowledge and Reputation Resources’,
Entrepreneurship Theory and Practice, Vol. 33, No. 1 (January), pp. 277-295.
Garrod, N. and W. Rees (1998), ‘International Diversification and Firm Value’, Journal of
Business Finance and Accounting, Vol. 25, Nos. 9&10 (November/December), pp. 1255-
1281.
Guo, D. and K. Jiang (2013), ‘Venture Capital Investment and the Performance of
Entrepreneurial Firms: Evidence from China’, Journal of Corporate Finance, Vol. 22
(September), pp. 375–395.
Heckman, J. (1979), ‘Sample Selection Bias as a Specification Error’, Econometrica, Vol.
47, No. 1 (January), pp. 153-161.
Hennart, J.-F. (1982), A Theory of Multinational Enterprise (University of Michigan Press).

484
Hitt, M., L. Tihanyi, T. Miller, and B. Connelly (2006), ‘International Diversification:
Antecedents, Outcomes, and Moderators’, Journal of Management, Vol. 32, No. 6
(December), pp. 831-867.
Hitt, M., R. Hoskisson, and D. Ireland (1994), ‘A Mid-range Theory of the Interactive
Effects of International and Product Diversification on Innovation and Performance’,
Journal of Management, Vol. 20, No. 2 (April), pp. 297–326.
Hofstede, G. (1980), Cultural Consequences, International Differences in Work-related
Values (SAGE Publications, Abridged Edition).
Humphery-Jenner, M. and J.-A. Suchard (2013), ‘Foreign Venture Capitalists and the
Internationalization of Entrepreneurial Companies: Evidence from China’, Journal of
International Business Studies, Vol. 44, No. 6 (August), pp. 607-621.
Jiang, P., C. Cai, K. Kease, M. Wright, and Q. Zhang (2014), ‘The Role of Venture
Capitalists in Small and Medium-sized Enterprise Initial Public Offerings: Evidence from
China’, International Small Business Journal, Vol. 32, No. 6 (September), pp. 619-643.
Johanson, J. and F. Wiedersheim-Paul (1975), ‘The Internationalization of the Firm ? Four
Swedish Cases’, Journal of Management Studies, Vol. 12, No. 3 (May), pp. 305–323.
Kim, C., P. Hwang, and W. Burgers (1993), ‘Multinationals' Diversification and the Risk-
return Trade-off’, Strategic Management Journal, Vol. 14, No. 4 (May), pp. 275-286.
Kogut, B., (1983), ‘Foreign Direct Investment as a Sequential Process’, in K. Charles and
D. Andretsch (eds.), The Multinational Corporation in the 1980s (The MIT Press), pp. 38-
56.
Kogut, B. and H. Singh (1988), ‘The Effect of National Culture on the Choice of Entry
Mode’, Journal of International Business Studies, Vol. 19, No. 3 (April), pp. 411-432.
Kotabe, M., S. Srinivasan, and P. Aulakh (2002), ‘Multinationality and Firm Performance:
the Moderating Role of R&D and Marketing Capabilities’, Journal of International
Business Studies, Vol. 31, No. 1 (February/March), pp. 70-98.
Lee, P. and S. Wahal (2004), ‘Grandstanding, Certification and the Underpricing of Venture
Capital Backed IPOs’, Journal of Financial Economics, Vol. 73, No. 2 (August), pp. 375-
407.
Lester, R., T. Certo, C. Dalton, D. Dalton, and A. Cannella (2006), ‘Initial Public Offering
Investor Valuations: An Examination of Top Management Team Prestige and
Environmental Uncertainty’, Journal of Small Business Management, Vol. 44, No. 1
(January), pp. 1-26.
Li, Y. and S. Zahra (2012), ‘Formal Institutions, Culture, and Venture Capital Activity: a
Cross-country Analysis’, Journal of Business Venturing, Vol. 27, No. 1 (January), pp. 95-
111.
Li, Y., I. Vertisnky, and J. Li (2014), ‘National Distances, International Experience, and
Venture Capital Investment Performance’, Journal of Business Venturing, Vol. 29, No. 4
(July), pp. 471-489.
LiPuma, J. (2012), ‘Internationalization and the IPO Performance of New Ventures’, Journal
of Business Research, Vol. 65, No. 7 (July), pp. 914–921.
Ljungqvist, A. (2007), ‘IPO Underpricing’, in B.E. Eckbo (ed.), Handbook of Corporate
Finance (North-Holland).
Loughran, T. and J. Ritter (2004), ‘Why Has IPO Underpricing Changed Over Time?’,
Financial Management, Vol. 33, No. 3 (Fall), pp. 5-37.
Lu, J. and P. Beamish (2001), ‘The Internationalization and Performance of SMEs’,
Strategic Management Journal, Vol. 22, Nos. 6&7 (June/July), pp. 565-586.
Lutz, E. and G. George (2010), ‘Entrepreneurial Aspiration and Resource Provisioning: The
Role of Venture Capital in New Venture Internationalization’, Working Paper (SSRN).
Makela, M. and M. Maula (2005), ‘Cross-border Venture Capital and New Venture
Internationalization: An Isomorphism Perspective’, Venture Capital: An International
Journal of Entrepreneurial Finance, Vol. 7, No. 3 (February), pp. 227-257.
485
Makela, M. and M. Maula (2006), ‘Interorganizational Commitment in Syndicated Cross-
border Venture Capital Investments’, Entrepreneurship: Theory and Practice, Vol. 30, No.
2 (March), pp. 273-298.
Makela, M. and M. Maula (2008), ‘Attracting Cross-border Venture Capital: The Role of a
Local Investor’, Entrepreneurship and Regional Development, Vol. 20, No. 3 (May), pp.
237-257.
Maula, M. and M. Makela (2003), ‘Cross-border Venture Capital’, in A. Hyytinen and M.
Pajarinen (ed.), Financial Systems and Firm Performance: Theoretical and Empirical
Perspectives (ETLA), pp. 269-291.
Meuleman, M. and M. Wright (2011), ‘Cross-border Private Equity Syndication:
Institutional Context and Learning’, Journal of Business Venturing, Vol. 26, No. 1
(January), pp. 35-48.
Michel, A. and I. Shaked (1986), ‘Multinational Corporations Versus Domestic
Corporations: Financial Performance and Characteristics’, Journal of International
Business Studies, Vol. 17, No. 3 (April), pp. 89-100.
Nachum, L. and S. Zaheer (2005), ‘The Persistence of Distance? The Impact of Technology
on MNE Motivations for Foreign Investment’, Strategic Management Journal, Vol. 26, No.
8 (August), pp. 747-767.
Nahata, R., S. Hazarika, and K. Tandon (2014), ‘Success in Global Venture Capital
Investing: Do Institutional and Cultural Differences Matter?’, Journal of Financial and
Quantitative Analysis, forthcoming.
Nelson, T. (2003), ‘The Persistence of Founder Influence: Management, Ownership, and
Performance Effects at Initial Public Offering’, Strategic Management Journal, Vol. 24,
No. 8 (August), pp. 707–724.
Paleari, S., A. Signori, and S. Vismara (2014), ‘How Do Underwriters Select Peers When
Valuing IPOs?’, Financial Management, Vol. 43, No. 4 (Winter), pp. 731-755.
Podolny, J. (2005), Status Signals (Princeton University Press).
Pruthi, S., M. Wright, and A. Lockett (2003), ‘Do Foreign and Domestic Venture Capital
Firms Differ in their Monitoring of Investees?’, Asia Pacific Journal of Management, Vol.
20, No. 2 (June), pp. 175-204.
Rasheed, A., D. Datta, and R. Chinta (1997), ‘Determinants of Price Premiums: A Study of
Initial Public Offerings in the Medical Diagnostics and Devices Industry’, Journal of Small
Business Management, Vol. 35, No. 4 (October), pp. 11–23.
Ritter, J. and I. Welch (2002), ‘A Review of IPO Activity, Pricing and Allocations’, Journal
of Finance Vol. 57, No. 4 (September), pp. 1795-1828.
Sala, D. and E. Yalcin (2012), ‘Export Experience of Managers and the Internationalization
of Firms’, Working Paper (University of Southern Denmark).
Schertler, A. and T. Tykvova (2011), ‘Venture Capital and Internationalization’,
International Business Review, Vol. 20, No. 4 (August), pp. 423-439.
Shama, A. (1995), ‘Entry Strategies of U.S. Firms to the Newly Independent States, Baltic
States, and Eastern European Countries’, California Management Review, Vol. 37, No. 3
(Spring), pp. 90–109.
Stinchcombe, A. (1965), ‘Social Structure and Organizations’, in M. James (ed.), Handbook
of Organizations (Rand McNally), pp. 142-193.
Stopford, J. and J. Dunning (1983), The World Directory of the Multinational Enterprises
1982-1983 (Gale Research Company).
Strange, R., I. Filatotchev, T. Buck, and M. Wright (2009), ‘Corporate Governance and
International Business’, Management International Review, Vol. 49, No. 4 (September),
pp. 395-407.
Stuart, T., H. Hoang, and R. Hybels (1999), ‘Interorganizational Endorsements and the
Performance of Entrepreneurial Ventures’, Administrative Science Quarterly, Vol. 44, No.
2 (June), pp. 315–349.
486
Sullivan D. (1994), ‘Measuring the Degree of Internationalization of a Firm’, Journal of
International Business Studies, Vol. 25, No. 2 (February/March), pp. 325-342.
Tykvova, T. and U. Walz (2007), ‘How Important is Participation of Different Venture
Capitalists in German IPOs?’, Global Finance Journal, Vol. 17, No. 3 (March), pp. 350-
378.
Wang, L. and S. Wang (2011), ‘Cross-border Capital Performance: Evidence from China’,
Pacific-Basin Finance Journal, Vol. 19, No. 1 (March), pp. 71-97.
Welbourne, T. and A. Andrews (1996), ‘Predicting Performance of Initial Public Offerings:
Should Human Resource Management Be in the Equation?’, Academy of Management
Journal, Vol. 39, No. 4 (August), pp. 891–919.
Williamson, J. (1966), ‘Profit Growth and Sales Maximization’, Economica, Vol. 33, No.
129, (February), pp. 1-16.
Wright, M., S., Pruthi, and A. Lockett (2005), ‘International Venture Capital Research: From
Cross-Country Comparison to Crossing Borders’, International Journal of Management
Reviews, Vol. 7, No. 3 (September), pp. 135-165.
Zaheer, S. (1995), ‘Overcoming the Liability of Foreignness’, Academy of Management
Journal, Vol. 38, No. 2 (April), pp. 341-363.
Zahra, S., D. Ireland, and M. Hitt (2000), ‘International Expansion by New Venture Firms:
International Diversity, Mode of Market Entry, Technological Learning, and Performance’,
Academy of Management Journal, Vol. 43, No. 5 (October), pp. 925-950.
Zimmerman, M. and G. Zeitz (2002), ‘Beyond Survival: Achieving New Venture Growth
by Building Legitimacy’, Academy of Management Review, Vol. 27, No. 3 (July), pp. 414–
431.
487
Protection of fair competition A study under the
rules of Jordanian unfair competition Code no
(51) of the year (2000) and competition Code no
(33) of the year (2004)
Dr. Muneer Mohammad Alofishat Dr. Yaseen Mohammad Al-Juboori
Al-Zaytoonah University of Jordan Al-Zaytoonah University of Jordan
Jordan Jordan
Introduction
The unfair competition, is every breach to any legal or contractual obligation, or to
economical public order which it occurs, harms the clients of the third person or his competitive
efficiency.
After Jordan became a member of the world trade organization on 11th April of the year
2000, Jordan's government adopted a new economic strategy, in a way that Jordan's legal
system has developed in the ten years since then. Jordan political system, originally undertook
the economic reforms to bring the economic and the trade regime in a compliance with the
world trade organization (WTO) agreements21.
Moreover, as an outcome of joining the (WTO) Jordan has liberalized its trade and services
sectors, providing market access to foreign investors and service providers of WTO members
according to the law and regulations of Jordan.
Therefore, there is a strong demand for a well-organized market-place which aims to offer
business environment and a consumer who is well-informed. Obviously, the impact of
Globalization is now leading to increase the activity of marketplace in Jordan. This increase in
activity has manifold sources, such as cross-border investment by multinational firms,
privatization of state-owned entities, lowered trade barriers, and government downsizing22.
Nonetheless, the Jordanian code of competition was issued by the Jordanian government
on August, the 15th of the year (2002) then approved by the parliament on 1st Sept. of the year
(2004), which is called competition law No: (33) of the year (2004)23.
The Law of competition main purpose is to establish the necessary mechanism to ensure
the proper functioning of markets in Jordan, besides that, to protect and promote competition
widely in Jordan24.
The competition Law intend to expand to cover all goods, services and commerce in
Jordan, in addition to any economic activities that occur in foreign countries but have an effect
inside Jordan25.
21 Haytham Hani Abu Karaky, Competition Policy and Consumer Protection Policy in Jordan, Penn
State International Law Review, Vol. 29, Fall 2010. 22 Derek Irland, Competition Policy and Consumer Protection, Policy Options Oct. 1997, at 27-28. 23 Competition Law, No. 33, AL-Jarrida Al-Rasmiya (Offical Gazette), No. 4673 at 4157 (Sept. 1,
2004), Jordan. 24 Ruba Qalyoubi, Competition Law in the Arab Countries-Jordan as a case study 42, cited by Hetham
H. Abu Karky, Op. cit, P. 337. 25 Article (3) of Competition Law.
488
In fact, the competition gains its existence from the principle of trade liberty. Therefore, it
may be said that it is so necessary to ensure practicing the market mechanisms to an extent that
does not harm or even touch public interest26.
Theoretically, there is no any sort of authority rules the prices in the market order, but one
authority, which organizes the trade relations, it is the authority of offer and demand. In this
article I will elucidate the subject of organizing competition as a first step to adjust market
competition among commercial enterprises, then this must be followed by preventing persons
of power and influence from taking advantage of their position.
The protection of competition cannot fly over competitive market without too means,
firstly: organization of competition, secondly: preventing any abuse to the controlled position.
Outline of the article:
i. Determination of competition rules upon which the competition is organized.
ii. Fixing the rules concerning prevention of monopoly practices.
i) Determination of Rules of Competition:
Undoubtedly, the corner stone of protecting competition is relied on figuring out the rules
which aim to organizing competition. These rules form the legal system that adjust transaction
under the market order. If that so, we should deals with this matter in two aspect, they are as
follows:
1- Fixing the competitive markets.
2- Rules adjusting these markets.
1-1) Fixing the Competitive Markets:
There are two kinds of competitive markets, one of them is qualitative markets and the
other is Geographical. Concerning the qualitative markets. These markets acquire two elements,
they are certain products and Geographical scope1.
While concerning the Geographical markets means the Geographical area that the
competition circumstances are in incompliance. Then may take in to consideration the chances
of probable competition.
1-2) Rules Adjusting Competitive Markets:
Under the market order the role of the state in commercial activity if we have admitted
that trade must be free of any barriers, consequently we admitted that markets must be free.
Freedom of markets means that competition between producers and merchants must be
taken care of and preserved.
1-2-1) Agreements or Practices Prejudice to Rules of Fixing Prices:
In markets order, fixing prices of the producer is affected strongly by the powers of
offer and demand. Every seller wishes to sell his commodities or services with the highest prices
in order to achieve high standard of profit. Whereas, in alternative every purchaser wishes to
buy in a lowest prices, then they meet at certain price agreed upon by them.
The way that the producer or the wholesale merchant regarding determining the price
of re-sale production, may be considered as a prejudice agreements or prejudice practices to
competition.
While/ there is no harm to competition rules granting low prices or setting different
commissions.
26 Hussein Mahi, Protection of Competition, 1st ed. Modern library, 2007, P. 5.
1 Hussein Almahi, Competition Protection, Op-cit, P. 21-23.
489
Furthermore, it may be considered as a breach to the rules of competition, the
distinction in the price of the product between different purchasers.
1-2-2) Agreements of Practices Prejudice to Rules of Interring and staying in
competition Markets, Investments and Manufacturing:
There are many agreements considered as causing harm and prejudice to competition for
they aim to obstacle people from interring competition markets, for examples, the agreement
between many distributers of pharmaceutical production, which aim to reject the sale to
pharmacies those dealing with a new competitor in the market, despite the better commercial
conditions1.
The Jordanian law was very keen to provide on such a statement that include, prevention
of production in market, totally or partially from certain person.
ii) Fixing the Rules Concerning Prevention of Monopoly Practices:
2-1) Concept of Monopolization:
Monopolization is the willful acquisition or maintenance of monopoly power in a relevant
market as opposed to growth as a consequence of superior product, business acumen or
historical accident2. This means that to be liable for Monopolization, a defendant must have possessed not only
monopoly power but also an intent to monopolize3. Monopoly power is usually defined for antitrust
purposes as the power to fix prices or exclude competitors in a given market. Such power is generally
inferred from the fact that a firm has captured a predominant share of the relevant market. Although the
exact percentage share necessary to support an inference of monopoly power remains unclear and courts
often look at other economic factors (such as the existence in the industry of barriers to the entry of new
competitors).
The way leads to achieve balance between encouraging enterprises to become stronger
against the foreign enterprises and not to breach the free competition rules, is enacting legal
rules which guarantee the fair and equal competition, they are under the code calls, the law of
unfair competition and commercial secrets.
2-2) Unfair Competition:
Article (2) states, that “Any act is considered as an act of unfair competition, if is
opposed with honorable practices in commercial and industrial affairs especially, as follows:
1- Acts by its nature cause ambiguity with an enterprise of one of the competitors, his
products or his commercial or industrial activities.
2- Any claims various to the fact in practicing trade…”
3- Any data or claims cause by its use in trade misleading the public regarding the
products or the way of manufacturing such a products…”.
2-3) Consumers and Competition Policy:
Competition Policy and consumer protection have a deep impact on the functioning of
markets. The goal the competitive law is to preserve and to enhance the competitive structure
of markets for commodities and for services. Proper competition helps to ensure that all
consumers who need a certain good or service will be able to obtain it at a price which reflects
the real coast of the commodity or service4.
1 http://www.finances.gouv.fr/reglementation/avis/consei/concurrence
2 United States U. Grinnell Corp. U.S. sup 1966, cited by Mallor, Barnes, Bowers, Langvard, Business
Law, 12 ed., 2005.
3
4 see: Hetham Hani Abu Karaky Op-Cit., P. 341. See also, Fernando Gomez Pomar, EC Consumer
Protection Law and EC Competition Law, Cited by Hetham, Abu Karaky, Op-Cit., P. 341

490
The term “Protection of Competition” refers to the prevention of private restrictive
practices that might hinder or block competition, those in the form of anti- competitive
cooperation between markets participants as well as unilateral abuse of market power5.
The main objectives of competition policy to some extent will intersect with consumer -
Protection policy. While competition policy pursues the efficient functioning of the market,
consumer protection works to ensure that consumers can make will informed decisions and
sellers will perform the promises they have undertaken about the products they offer1.
One objective of the competition law is to create a climate conductive to businesses
through the stimulation of business by preventing anti- competitive business practices.
Ultimately, practice will safeguard the public interest, improve the efficiency of Jordan’s
economy, and increase the consumer welfare2.
Another objective of the competition law is to preserve and promote competition as a
means of ensuring the efficient allocation of resources, which in turn results in better quality
products and services, more choices and lower prices for consumers3.
Several provision of the competition law embrace the promotion of consumer welfare, for
instance:
1- Article 7(B) requires enterprises seeking to exempt an agreement or a practice from
the requirements of article 5 and 6 to show that the agreement or the practice in
question achieves certain benefits to consumers4.
2- Article 11(A) (1) entrusts the minister of industry and trade with clearing
concentration transactions if their competitive effects out weight their anti-
competitive effects, for instance, when they lead to lower prices.
3- Article 17(A) states that private-sector enterprises, licensed consumer-protection
association, and any group of at least five consumers who have suffered harm can
directly complain to the public prosecutors regarding to any violation of the
competition law.
Conclusion:
Protection of fair competition plays a key role in Jordanian economic policies. Therefore, must
many factors be arises, they are as follows:
1- It must be not to leave the market uncontrolled by rules of competition and consumer
protection.
2- The purpose of legal organization to the rules of competition is not only to face the
prejudice acts and transactions, but to organize these action and to adjust these practices
in order to protect competition.
3- Competition policy and consumer-protection policy have a deep impact on the
functioning of markets for perfect competition ensures that all consumers who need
certain commodities or certain services will obtain it at the prices which reflects it real
costs.
4- In front of continuous changes all over the globe in the circus tenses of the world trade
and following up to the international obligation relating to provide a legal climate
which is suitable to competition and free trade, and to achieve adjustment to Jordanian
market, we hope that the law of unfair competition, and the law of competition have
full application in reality in order to organize competition and monopoly in a way
which may serve trade and economy.
.
5 Hetham, Hani Abu Karaky, Op-Cit., P. 342.
1 Daniel Agustino, Competition, consumer protection, and objective of competition Law, commission
for the supervision of business competition, 1,3, (Aug. 2006).
2 Hetham Abu Karaky, Op-Cit., P. 343.
3 Qalyoubi, Supra, note q at 57.
4 Hetham Abu Karaky, Op-Cit., P. 343.
491
The impact of Synergy on Teamwork
Performance: Group Analysis Perspective
Prof. Tareq Shareef Younus
Ahlia University
Bahrain
Abstract:
The research aim is to investigate the operational concept of synergy. Through critical
reviewing to the relative literature, the theoretical gap found; many authers generated a
theoretical clarification to synergy. This research investigated the operationalization of the
concept; the theory is important but not enough value to the team work and group formation
based on definitions. This research is questioning the possibilities of transmitting the synergy
concept into an objective explanation; using mathematical calculation and statistical
investigation of the correlation and impact of synergy on teamwork and group performance.
However, research objectives and hypothesis are stated based on the inductive research
approach. Research data has generated based on virtual group performance and fed the
statistical analysis with what have been calculated through mathematical formulas. Research
outcomes are interpreted according to the statistical context.
Key Words: Synergy, Teamwork, Group Work, Performance, Group Formation.
Introduction
The original generation of the term synergy is derived from the Greek word synergos,
which means "working together." In business usage, synergy refers to the ability of two or more
units or companies to generate greater value working together than they could working
apart(Goold, M., & Campbell, A. 1998). Therefore, it is used within its context in all forms of
group work.
Teamwork also is an old term, it has been founded since 1934 which is considered as
attributes of sociable work in the United States. Therefore, synergy, teamwork and groupwork
are used interchangeably towards the same end, which is improving the performance of a groups
and teams in the organization.
The above concepts were not understood technically until recent theories grouped under
the area of organizational behavior.
Furthermore, the emergence of the new extended concept of what has been used
extensively in managing work groups which are reflecting the interaction and cooperation in
the team members or groups. The term synergy is widely used with the above concepts. French,
et al 2008, defined synergy to have in mind the conception of a whole that is larger than the
total of its components. (Chen 2016). However, synergy is the process of interaction or cooperation of two or more
organizations, substances, or other agents to produce a combined effect greater than the sum of
their separate effects. The above terms (teamwork, group work and synergy) had been
considered in the organization behavior literature as ultimate factors toward excellence
organizational performance. Synergy driven approach to make teams and workgroups and to
assign tasks are strategically demanded in creating competitive advantages.
Consequently, through reviewing literature in this area of research nothing found about
how the mechanism of synergy is objectively assessed related to the group performance and
achievement. This research sought to createthe mechanism for assessing the synergy linked to
the different teams and groups work.

492
Research Background and literature review
Critical stance has been taken in reviewing relevant literature that highlighted the
importance of synergy in assessing the teamwork performance and group work in different
organizations. The review map provided rational steps in highlighting the definitions, impact,
relationships of relevant concepts of synergy and teamwork/group work concepts.
Business dictionary defines the synergy as “A state in which two or more
things work together in a particularly fruitful way that produces an effect greater than
the sum of their individual effects. Expressed also as "the whole is greater than the sum
of parts."
Synergy is a term that is most commonly used in the context of mergers and acquisitions.
Synergy, or the potential financial benefit achieved through the combining of companies, is
often a driving force behind a merger. Shareholders will benefit if a company's post-merger
share price increases due to the synergistic effect of the deal. The expected synergy achieved
through the merger can be attributed to various factors, such as increased revenues, combined
talent and technology, or cost reduction (Amabile, 1993).
However, Literature on synergy provided many definitions to synergy as a system concept
which highlighted the collaborative, interactions, knowledge sharing, experience exchange and
value added to the group performance (Wagner, G., Schramm-Klein and Steinmann, 2016).
Against this background synergy is an objective based calculation of the quality of team
performance which should focus on the qualities of team formation based on skills, experience,
qualifications, and area of specialization for those who are committed to the assigned tasks by
an organization (Larsson& Finkelstein1999); this need to be elaborated on an inductive
approach how this work?
However, based on reviewing the literature and current research theme the conceptual
model is promoted. Teamwork, on the other hand is linked to the concept of synergy, the
concepts presented by many authors focused on team formation and promoted some insights to
improve team cooperation, interactions and leadership in the team. The focal point has got to
build cohesive efforts to reach the intended group goals (Gnizy,Shoham& Asseraf 2016).
Group work based on a team concept and synergy should be supported by a healthy
environment; if the teamwork confronted by many obstacles which limit the group work
performance the synergy outcome will be affected as well. However, a synergistic and
collaborative team should consider in forming a group work instead of just forming groups
based on the mechanistic group concept (Silber and others, 2016). In this research, we propose
that group work is formed according to the team spirit which the objective perspective model
is considered.
Conceptual Model
Established in the research concept which is brought forth through the literature review,
the model constructed as in figure (1) to reflect the abstractions of research variables which
support the research propositions and objectives.

493
Figure (1)
Conceptual Model
Research Methodology
This research paper is an exploratory type which is used to find out what is happening
if the synergy concept applied on team/group work? New insight will be approached
to the group work behavior.
Participants
This case of exploratory research needs to target focus groups and purposeful research
sample. The groups have been chosen based on the similarities in their assignments and
assigned jobs to them.
Those groups have agreed to grant access to their estimated data outcome. So, ten
observations for ten paired groups have been chosen. The total observations are
(2*10=20).
The paired groups have been assigned to them technical tasks which need to be
performed within a time span. The different time spans were determined according to
the group skills and experiences.
Research Objectives
The research aims to assess the way of teamwork performance calculation and to set up
the group work paradigm which reflects the intended purposes from using such concepts in
organizations.
Nevertheless, the research will bring into consideration the following sub- objectives:
To place the mechanism of synergy linked to the group performance.
Assess the individual, group performance and the performance of groups based on the
synergy concept.
Performance
Synergy
Group Work
Teamwork

494
To find the impact of synergy concept implementation of the group work performance.
To explore the new paradigm within the context of synergy variables.
The above objectives will provide a clear understanding the real meaning and expected
management intended outcomes which improve the organization performance through group
management.
Research Questions
Based on the above literature review an idea is generated and flowed from research objectives
which addressed the following questions:
1- What is the context of synergy mechanism which leads to leveraging the group work
performance measures?
2- How the group work performance should be directed in terms of individual group work
compared to the group work governed by synergy context?
3- What is the impact that synergy will make changes in the outcome of group work
performance?
Research Significance
This research provides a clear insight to those who are responsible for group formation/
Team building and the team leaders in any organization.
Many other justifications stand behind this research; promoting objective assessment of the
expected outcome from the group work and team performance.
Research Hypothesis
The following hypotheses are considered:
H1: There are significant differences between individual group's outcome in
performing similar tasks.
H2: Performing tasks within the context of synergy has significant impact on the
group achievement
Purpose and Aims
The above research hypothesis will be tested statistically to achieve the research
Research Instrument and Data Gathering
The research data gathering has approached the simulation perspective which focuses on
virtual group task performance based on the task assigned to the group. The timely completion
of the task is determined according to the completion expected a due date. The variation among
selected groups is determined based on the task schedule which is performed by different
groups with the same task through a series of actions.
Mathematical calculations used as a tool to get the synergy effects as follows:
(Mathportal.org)
A System view is taken to make an inductive insight to generate data linked to the research
problem. The following diagram clarifies this approach:

495
Figure (2)
System Simulation Perspective
(*) Where:
t1 is the time taken by the first group,
t2 is the time taken by the second group,
tb is the time taken by both groups.
Explanation
The formula for group work problem is:
1/tb= 1/t1 + 1/t2
All observations and synergy calculations are generated based on the above formula.
Nevertheless, calculations provided primary data that applied in the quantitative approach
for analysis, the qualitative approach also used for check purposes.
Research Validity and Reliability
A Discussion group has been conducted with the colleagues from who have had deep
experience and skills in math’s and statistics and management area of specializations to run
face validity for the research tool and measurement. Their views and feelings have been needed
which led to using the query tool in generating research data.
Reliability also computed through SPSS V.17 which is important to yield consistent
findings and analysis output. Cronbach alpha for this measurement is 74%, which is accepted
in this type of research.
Data Analysis
This section indicates the analysis for generating data in the table (1).
Table (1)
Estimated Time needed to accomplish the team work task by days
Observations Team/ Group 1
ET Days= t1
Team/Group 2
ET Days= t2
Team/ Group
tb Days Synergy
1 30 40 17.14
2 25 50 16.67
3 40 70 25.45
4 25 50 16.67
5 66 48 27.79
6 55 60 28.7
7 37 39 18.99
8 80 66 36.16
9 39 45 20.89
10 70 72 35.49
Observation
Group 1 and 2
Transformation
Formula
1tb=1t1+1t2
Output based on Time Span*

496
Below are the methods used in statistical analyzes for the data in table (1):
1. Descriptive Analysis
The average time span of individual groups, both groups and synergy output to find the
variations in performance for the same task. These descriptive parameters will show
the importance of objective calculations toward factual based evidence of accurate time
span for any teamwork, performance based on group formation which should match
the group member’s efficient nomination and skills needed to be in the group. This
concept will eliminate the variance of time span gap among groups performance.
Moreover, the standard deviation parameter will be calculated to prove that the
objective method as a rational process to generate undebatable parameter reflected in
the synergy formula.
However, table (2) presents the descriptive findings from the input data of this research.
Table (2)
Descriptive Statistics: T1, T2 and Synergy
N Mean Std. Deviation
T1 10 46.70 19.75
T2 10 54.00 12.16
Synergy 10 24.40 7.50
Valid N (listwise) 10
The findings presented in table (2) provide clear gaps between group time span in
individual groups and dual groups, the mean and SD for team team1 46.70 and SD
19.75. The gap found in comparing these figures with the means and standard
deviations of the team 2 and the parameters of synergy calculations.
This gap proves the context of hypothesis one in this research.
2. Simple regression and correlation analysis
Looking at the correlation and impact that synergy has an impact on
rationalizing group work efforts toward efficient teamwork, performance, the
correlation and linear regression have implemented for analysis.
The correlation between groups - teams included in this research and the synergy is
calculated through transforming the observed figures for all teams and the synergy
parameter table (3) presents the output statistical analysis.
Table (3)
Correlation between Synergy and Teamwork Groups
Teamwork
Groups Synergy
TG Pearson Correlation 1 .993**
Sig. (2-tailed) .000
N 10 10
Synergy Pearson Correlation .993** 1
Sig. (2-tailed) .000
N 10 10
**. Correlation is significant at the 0.01 level (2- tailed).

497
The correlation is 99% and significantly correlated at 0.01 significant levels, which
show that the synergy concept is an important factor related to the teamwork group
formation, and therefore, the required performance level.
Regression analysis based on the preposition that the synergy as independent
variable has an effect on group team work performance as a generic theoretical
concept, this concept changed over into this research in terms of objective
based calculation, table (4) presents the regression parameters which are
applied to look into the context of the second hypothesis of this inquiry.
Table (4)
Regression Model Summary
Model R R Square Adjusted R Square Std Error of the
Estimate
1 0.99a 0.98 0.98 1.75
a. Predictors: (Constant), Synergy
Regression analysis presented in table (4) shown the value of R2= 98%I significant at 0.000
which means that there is an impact of synergy on teamwork groups. The results, support for
accepting the second research hypothesis.
ANOVA analysis findings in the table (5) shown that the value of F test is 589.887 significant
at 0.000.
Table (5)
ANOVAb Analysis
Model Sum of Squares df Mean Square F Sig.
1 Regression 1819.844 1 1819.844 589.887 .000a
Residual 24.681 8 3.085
Total 1844.525 9
a. Predictors: (Constant), Synergy
b. Dependent Variable: TG
The research regression model is defined and constructed according to regression analysis
and the findings of the table (6). Variance inflation factors (VIF) measure how much the
variance of the estimated regression coefficients is inflated as compared to when the predictor
variables are not linearly related., In this context the collinearity statistics, the tolerance value
is 1.00, and the VIF value is 1.00 which means that there is no multicollinearity problem
existed on this model.
Table (6)
Coefficienta
Model Unstandardized
Coefficients
Standardized
Coefficients
t Sig.
Collinearity
Statistics
B Std. Error Beta Tolerance VIF
1 (Constant) 4.094 1.984 2.064 .073
Synergy 1.896 .078 .993 24.288 .000 1.000 1.000
a. Dependent Variable: TG
Regression Model as constructed based on the above analysis is as follows:
Y= 4.094 + 1.896*X

498
Conclusion
The current research focused on the functionality of the term synergy, it does not stand for a
generic concept, but it stresses the employability of the interaction context of the term
synergy.
Approaching this topic from the organization behavior area intends to generate new concepts
for the group work formation and teamwork mechanism within well-defined tasks and
responsibilities attached to the teamwork.
The value of this approach will create a priory foundation planning platform to determine
required timeline for achieving teamwork task based on selecting suitable skilled,
experienced, dedicated, self- mastered, and visionary people to be in the squad.
Investigations and elaborations to the generated statistical facts proved that synergy concept
provides a new measurement for teamwork performance which could be reached through
the current research way of calculating which highlighted the gap between objective based
task planning and classical approach used for group/ teamwork formation.
Recommendations
In order to follow a rational step in forming a group work and team work spirit,
management should consider the logical clarification to the task load that the team will perform.
The generic concept of synergism is not enough to make a more outcome of group work unless
the concept attached to a mathematical calculations which accounts threshold point of time line
needed for teamwork achievement.
Clear selection criteria should be taken on to appoint the team members in terms of real
prior experience, skills and member profile behavior; investigation of past accomplishment and
commitment are vital to integratingThe the selection process into group and team formation.
Recent focus on team leader and management should be considered in targeting synergy
outcome and group performance.
Current research generates transformation view toward an integrated sequence of synergy
input; linked to the quality of group and team formation.
References
Amabile, T. M. (1993). Motivational synergy: Toward new conceptualizations of intrinsic and
extrinsic motivation in the workplace. Human resource management review, 3(3), 185-201.
Chen, Y. C. (2016). The Impact of Different Parliamentary Oversight Systems under Semi-
presidentialism upon Practical Oversight Behaviors-A Comparison between Taiwanese
Legislative Yuan and French National Assembly (2008-2012).
Gnizy, I., Shoham, A., & Asseraf, Y. (2016). Does Firm Strategic International Orientations
Synergize?. In Let’s Get Engaged! Crossing the Threshold of Marketing’s Engagement
Era (pp. 677-678). Springer International Publishing.
Goold, M., & Campbell, A. (1998). Desperately seeking synergy. Harvard Business
Review, 76(5), 131-143.
Larsson, R., & Finkelstein, S. (1999). Integrating strategic, organizational, and human resource
perspectives on mergers and acquisitions: A case survey of synergy realization. Organization
science, 10(1), 1-26.
Silber, J. H., Rosenbaum, P. R., Ross, R. N., Ludwig, J. M., Wang, W., Niknam, B. A., ... &
Fleisher, L. A. (2016). Indirect Standardization Matching: Assessing Specific Advantage and
Risk Synergy. Health services research.
Wagner, G., Schramm-Klein, H., & Steinmann, S. (2016). The Role of Synergy and
Complementarity in a Multichannel E-Commerce System. InLooking Forward, Looking Back:
Drawing on the Past to Shape the Future of Marketing (pp. 661-661). Springer International
Publishing.


