Clients’ expectations from and satisfaction with medicine retail outlets in Gondar town,...
12
© 2015 Workye et al. This work is published by Dove Medical Press Limited, and licensed under Creative Commons Attribution – Non Commercial (unported, v3.0) License. The full terms of the License are available at http://creativecommons.org/licenses/by-nc/3.0/. Non-commercial uses of the work are permitted without any further permission from Dove Medical Press Limited, provided the work is properly attributed. Permissions beyond the scope of the License are administered by Dove Medical Press Limited. Information on how to request permission may be found at: http://www.dovepress.com/permissions.php Integrated Pharmacy Research and Practice 2015:4 1–12 Integrated Pharmacy Research and Practice Dovepress submit your manuscript | www.dovepress.com Dovepress 1 ORIGINAL RESEARCH open access to scientific and medical research Open Access Full Text Article http://dx.doi.org/10.2147/IPRP.S75819 Video abstract Point your SmartPhone at the code above. If you have a QR code reader the video abstract will appear. Or use: http://dvpr.es/1D8Am1g Clients’ expectations from and satisfaction with medicine retail outlets in Gondar town, northwestern Ethiopia: a cross-sectional study Mulualem Workye 1 Sewunet Admasu 2 Tamrat Abura 1 Yared Belete 1 Yonas Getaye 2 Fitsum Sebsibe Teni 1 Abdrrahman Shemsu Surur 3 1 Pharmaceutics and Social Pharmacy Unit, 2 Clinical Pharmacy Unit, 3 Pharmaceutical Chemistry Unit, School of Pharmacy, College of Medicine and Health Sciences, University of Gondar, Gondar, Amhara Regional State, Ethiopia Correspondence: Fitsum Sebsibe Teni Pharmaceutics and Social Pharmacy Unit, School of Pharmacy, College of Medicine and Health Sciences, University of Gondar, PO Box 1181, Gondar, Amhara Regional State, Ethiopia Tel +251 91 133 3607 Fax +251 58 114 1240 Email fi[email protected]m Purpose: The aim of this study was to assess clients’ level of expectation from and satisfaction with medicine retail outlets (MROs) in Gondar town, northwestern Ethiopia. Patients and methods: An institutions-based cross-sectional study was conducted from April 20 to May 5, 2014, by sampling five pharmacies and eight drug stores through simple random sampling. Clients, 424, who came to the MROs during the study period were included in the study. Data were collected using structured questionnaires measuring expectations and satisfaction of clients using a Likert scale of 1–5 through face-to-face interviews. Results: Out of the total 424 interview encounters, 422 (99.5% response rate) questionnaires were included in the analysis, of which 61.1% were of males. The overall mean expectation of respondents toward MRO setting and services was 3.82 and that of satisfaction of the respon- dents was 3.02. More than three-quarters (76.8%) of the respondents expected medicines in affordable prices from MROs, but nearly half (44.8%) were not satisfied with it. Much more than half (58.5%) of the respondents were dissatisfied with the comfort and convenience of private counseling area. Also, nearly half (47.6%) of the respondents claimed that pharmacy professionals did not provide information regarding the storage condition of medications. There was statistically significant difference in overall expectation (t=2.707, P=0.007) and satisfaction (t=2.260, P=0.024) with the setting and services of MROs between respondents who claimed to know the difference between a pharmacy and a drug store and those who claimed they did not. Conclusion: Clients’ expectation from MRO services was high, with average satisfaction. The overall expectation and satisfaction of the respondents toward MROs were lower in those who reported they did not know the difference between a pharmacy and a drug store than in those who claimed to know the difference. Supportive supervision by the town’s health bureau on the MROs is recommended to help improve clients’ satisfaction. Keywords: community, drug store, pharmacy, pharmacy professional, services Introduction Client satisfaction can be defined as a personal evaluation of the patient on the health care services and providers. 1 It is an integral component of the quality of health care. 2 Satisfaction reflects the realities of care as well as the preferences and expectations of the patient. 3 To ensure higher quality of pharmaceutical services and better outcomes, enhancement in the communication, convenience, and courtesy are important. High satisfaction promotes positive health behaviors, such as compliance and continuity with providers. Adhering to medication schedules and stability in visiting the same health care professionals are improved with higher satisfaction levels. 4,5
-
Upload
independent -
Category
Documents
-
view
2 -
download
0
Transcript of Clients’ expectations from and satisfaction with medicine retail outlets in Gondar town,...
© 2015 Workye et al. This work is published by Dove Medical Press Limited, and licensed under Creative Commons Attribution – Non Commercial (unported, v3.0) License. The full terms of the License are available at http://creativecommons.org/licenses/by-nc/3.0/. Non-commercial uses of the work are permitted without any further
permission from Dove Medical Press Limited, provided the work is properly attributed. Permissions beyond the scope of the License are administered by Dove Medical Press Limited. Information on how to request permission may be found at: http://www.dovepress.com/permissions.php
Integrated Pharmacy Research and Practice 2015:4 1–12
Integrated Pharmacy Research and Practice Dovepress
submit your manuscript | www.dovepress.com
Dovepress 1
O R I g I n a l R e s e a R c h
open access to scientific and medical research
Open access Full Text article
http://dx.doi.org/10.2147/IPRP.S75819
Video abstract
Point your SmartPhone at the code above. If you have a QR code reader the video abstract will appear. Or use:
http://dvpr.es/1D8Am1g
clients’ expectations from and satisfaction with medicine retail outlets in gondar town, northwestern ethiopia: a cross-sectional study
Mulualem Workye1
sewunet admasu2
Tamrat abura1
Yared Belete1
Yonas getaye2
Fitsum sebsibe Teni1
abdrrahman shemsu surur3
1Pharmaceutics and social Pharmacy Unit, 2clinical Pharmacy Unit, 3Pharmaceutical chemistry Unit, school of Pharmacy, college of Medicine and health sciences, University of gondar, gondar, amhara Regional state, ethiopia
correspondence: Fitsum sebsibe Teni Pharmaceutics and social Pharmacy Unit, school of Pharmacy, college of Medicine and health sciences, University of gondar, PO Box 1181, gondar, amhara Regional state, ethiopia Tel +251 91 133 3607 Fax +251 58 114 1240 email [email protected]
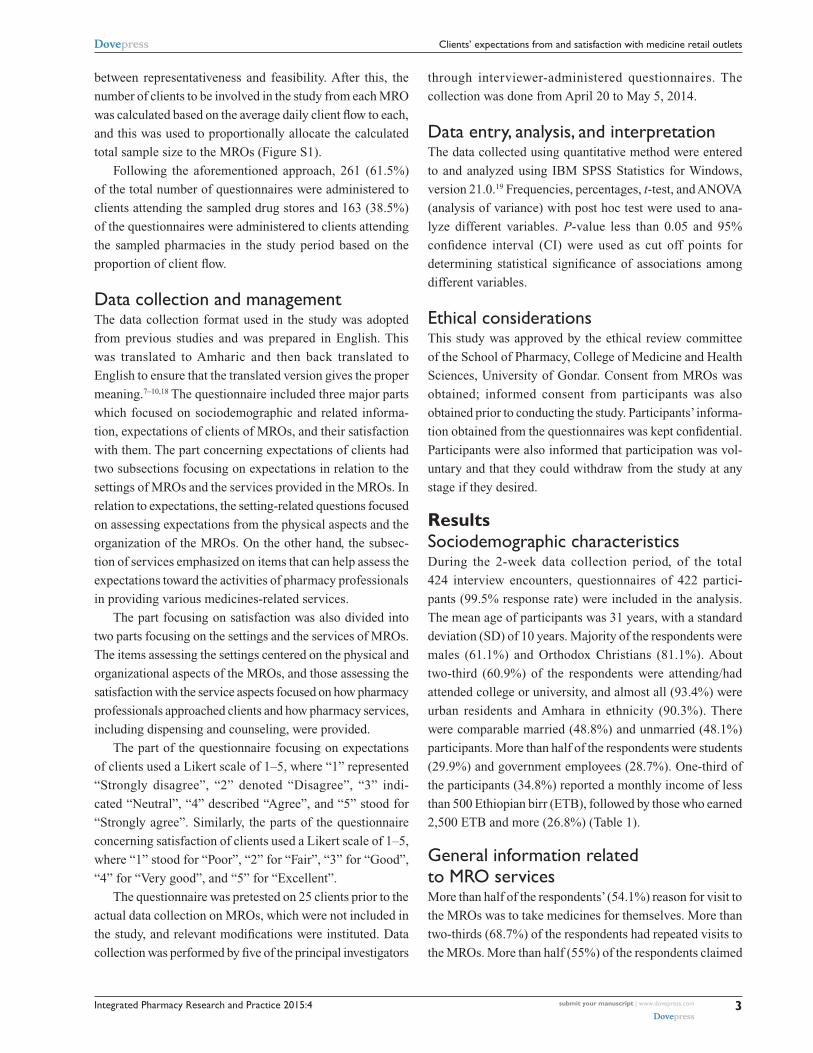
Purpose: The aim of this study was to assess clients’ level of expectation from and satisfaction
with medicine retail outlets (MROs) in Gondar town, northwestern Ethiopia.
Patients and methods: An institutions-based cross-sectional study was conducted from
April 20 to May 5, 2014, by sampling five pharmacies and eight drug stores through simple
random sampling. Clients, 424, who came to the MROs during the study period were included
in the study. Data were collected using structured questionnaires measuring expectations and
satisfaction of clients using a Likert scale of 1–5 through face-to-face interviews.
Results: Out of the total 424 interview encounters, 422 (99.5% response rate) questionnaires
were included in the analysis, of which 61.1% were of males. The overall mean expectation of
respondents toward MRO setting and services was 3.82 and that of satisfaction of the respon-
dents was 3.02. More than three-quarters (76.8%) of the respondents expected medicines in
affordable prices from MROs, but nearly half (44.8%) were not satisfied with it. Much more
than half (58.5%) of the respondents were dissatisfied with the comfort and convenience of
private counseling area. Also, nearly half (47.6%) of the respondents claimed that pharmacy
professionals did not provide information regarding the storage condition of medications.
There was statistically significant difference in overall expectation (t=2.707, P=0.007) and
satisfaction (t=2.260, P=0.024) with the setting and services of MROs between respondents
who claimed to know the difference between a pharmacy and a drug store and those who
claimed they did not.
Conclusion: Clients’ expectation from MRO services was high, with average satisfaction. The
overall expectation and satisfaction of the respondents toward MROs were lower in those who
reported they did not know the difference between a pharmacy and a drug store than in those
who claimed to know the difference. Supportive supervision by the town’s health bureau on the
MROs is recommended to help improve clients’ satisfaction.
Keywords: community, drug store, pharmacy, pharmacy professional, services
IntroductionClient satisfaction can be defined as a personal evaluation of the patient on the health
care services and providers.1 It is an integral component of the quality of health care.2
Satisfaction reflects the realities of care as well as the preferences and expectations of
the patient.3 To ensure higher quality of pharmaceutical services and better outcomes,
enhancement in the communication, convenience, and courtesy are important. High
satisfaction promotes positive health behaviors, such as compliance and continuity
with providers. Adhering to medication schedules and stability in visiting the same
health care professionals are improved with higher satisfaction levels.4,5

Integrated Pharmacy Research and Practice 2015:4submit your manuscript | www.dovepress.com
Dovepress
Dovepress
2
Workye et al
Knowledge of consumer expectation and satisfaction is
extremely important in determining the success of service
provision.6 Satisfaction of patients with the services provided
in community pharmacies is among the important elements
in making the services successful.7
Different instruments such as Patient Satisfaction with
Pharmaceutical Care: Update of a Validated Instrument,
validated Patient Satisfaction with Pharmacy Performance
Questionnaire (PSPP-Q), and other tools have been devel-
oped and validated to measure patients’ expectations and
satisfaction toward medicine retail outlet (MRO) services.7,8
By using these instruments, different studies were done in
various countries, including Qatar, England, Canada, and
different results of client expectations and satisfaction have
been reported.9–11
In Ethiopia, pharmacy services in the community set-
tings are provided by pharmacies, drug stores, and rural
drug vendors. These institutions are collectively known
as MROs. Based on this classification, a pharmacy is an
establishment retailing medicines which is managed by a
pharmacist registered with a relevant body and licensed to
dispense medicines for humans and compound prescribed
preparations. A drug store, on the other hand, is a medicines
retail establishment managed by a pharmacist or druggist (a
pharmacy professional with a diploma level of qualification)
registered and licensed to dispense medicines for humans. A
rural drug vendor is categorized in Ethiopia as a medicines
retail establishment led by a druggist or a pharmacy techni-
cian (lower level of qualification than druggists) registered
and licensed to dispense medicines for humans. In addition
to this, pharmacy, drug store, and rural drug vendors also
differ among them with regard to the legal requirements
they have to fulfill to function and the scope of services
and medicines provided in them. Pharmacies are required
to have rooms for dispensing, storage, and compounding (if
compounding service is provided), an office, and a restroom.
Similarly, drug stores and rural drug vendors are expected to
contain a dispensing room, a store, an office, and a restroom.
However, the size of the required rooms varies among the
MROs, and the variety of medicines and medical devices
handled in them increases from rural drug vendors through
drug stores to pharmacies.12
Most of the limited researches in the area of pharmaceuti-
cal sciences and services in our country have been focused on
health institution-based prescription pattern assessments and
some basic researches.13–15 To the best of literature searches
done, there were no studies which assessed expectations
and satisfaction of MRO clients toward the services they
get in Ethiopia. However, there have been reports of vari-
ous complaints about the service by community drug retail
outlets, with no empirical evidence to support them. So this
study was done to help narrow the information gap in this
respect by documenting the satisfaction level of clients of
MROs of Gondar town.
The objective of this study was to assess clients’ level of
expectations from and satisfaction with MROs in Gondar
town, northwestern Ethiopia.
Methodsstudy area and designThe study was conducted on clients of MROs in Gondar
town, northwestern Ethiopia. The town has one referral and
teaching hospital, one private general hospital, a number of
health centers and private clinics, and 53 MROs (19 pharma-
cies and 34 drug stores).16 An institutions-based cross-
sectional study design was employed to assess the level of
expectation from and expectations and satisfaction of clients
with services of MROs.
sample size determination and sampling procedureThe sample size was determined by using a single mean
formula:17
n =−Z p p
W
2
2
1( )
where n is the sample size required; W, marginal error
of 5% (W=0.05); Z, the degree of accuracy required at 95%
confidence level =1.96; and p=2.5 out of 5 on a Likert scale,
or 0.5 (50%) level of satisfaction. This was done because
no previously published finding on MROs was found in
our country to the best of literature search done. Using the
aforementioned formula, the sample size was calculated as
follows:
n = =( . ) ( . ) ( . )
( . )
1 96 0 5 0 5
0 05385
2
2
After adding 10% of the calculated sample size for pos-
sible nonresponse, the final sample size was 424 clients.
The sampling procedure followed in this study involved
two steps. First, the selection of MROs was performed
by simple random sampling. Among the total 53 MROs
(19 pharmacies and 34 drug stores) in the town, 5 pharmacies
and 8 drug stores were selected. These constituted about 25%
of the respective MRO which was chosen as a compromise
Integrated Pharmacy Research and Practice 2015:4 submit your manuscript | www.dovepress.com
Dovepress
Dovepress
3
clients’ expectations from and satisfaction with medicine retail outlets
between representativeness and feasibility. After this, the
number of clients to be involved in the study from each MRO
was calculated based on the average daily client flow to each,
and this was used to proportionally allocate the calculated
total sample size to the MROs (Figure S1).
Following the aforementioned approach, 261 (61.5%)
of the total number of questionnaires were administered to
clients attending the sampled drug stores and 163 (38.5%)
of the questionnaires were administered to clients attending
the sampled pharmacies in the study period based on the
proportion of client flow.
Data collection and managementThe data collection format used in the study was adopted
from previous studies and was prepared in English. This
was translated to Amharic and then back translated to
English to ensure that the translated version gives the proper
meaning.7–10,18 The questionnaire included three major parts
which focused on sociodemographic and related informa-
tion, expectations of clients of MROs, and their satisfaction
with them. The part concerning expectations of clients had
two subsections focusing on expectations in relation to the
settings of MROs and the services provided in the MROs. In
relation to expectations, the setting-related questions focused
on assessing expectations from the physical aspects and the
organization of the MROs. On the other hand, the subsec-
tion of services emphasized on items that can help assess the
expectations toward the activities of pharmacy professionals
in providing various medicines-related services.
The part focusing on satisfaction was also divided into
two parts focusing on the settings and the services of MROs.
The items assessing the settings centered on the physical and
organizational aspects of the MROs, and those assessing the
satisfaction with the service aspects focused on how pharmacy
professionals approached clients and how pharmacy services,
including dispensing and counseling, were provided.
The part of the questionnaire focusing on expectations
of clients used a Likert scale of 1–5, where “1” represented
“Strongly disagree”, “2” denoted “Disagree”, “3” indi-
cated “Neutral”, “4” described “Agree”, and “5” stood for
“Strongly agree”. Similarly, the parts of the questionnaire
concerning satisfaction of clients used a Likert scale of 1–5,
where “1” stood for “Poor”, “2” for “Fair”, “3” for “Good”,
“4” for “Very good”, and “5” for “Excellent”.
The questionnaire was pretested on 25 clients prior to the
actual data collection on MROs, which were not included in
the study, and relevant modifications were instituted. Data
collection was performed by five of the principal investigators
through interviewer-administered questionnaires. The
collection was done from April 20 to May 5, 2014.
Data entry, analysis, and interpretationThe data collected using quantitative method were entered
to and analyzed using IBM SPSS Statistics for Windows,
version 21.0.19 Frequencies, percentages, t-test, and ANOVA
(analysis of variance) with post hoc test were used to ana-
lyze different variables. P-value less than 0.05 and 95%
confidence interval (CI) were used as cut off points for
determining statistical significance of associations among
different variables.
ethical considerationsThis study was approved by the ethical review committee
of the School of Pharmacy, College of Medicine and Health
Sciences, University of Gondar. Consent from MROs was
obtained; informed consent from participants was also
obtained prior to conducting the study. Participants’ informa-
tion obtained from the questionnaires was kept confidential.
Participants were also informed that participation was vol-
untary and that they could withdraw from the study at any
stage if they desired.
Resultssociodemographic characteristicsDuring the 2-week data collection period, of the total
424 interview encounters, questionnaires of 422 partici-
pants (99.5% response rate) were included in the analysis.
The mean age of participants was 31 years, with a standard
deviation (SD) of 10 years. Majority of the respondents were
males (61.1%) and Orthodox Christians (81.1%). About
two-third (60.9%) of the respondents were attending/had
attended college or university, and almost all (93.4%) were
urban residents and Amhara in ethnicity (90.3%). There
were comparable married (48.8%) and unmarried (48.1%)
participants. More than half of the respondents were students
(29.9%) and government employees (28.7%). One-third of
the participants (34.8%) reported a monthly income of less
than 500 Ethiopian birr (ETB), followed by those who earned
2,500 ETB and more (26.8%) (Table 1).
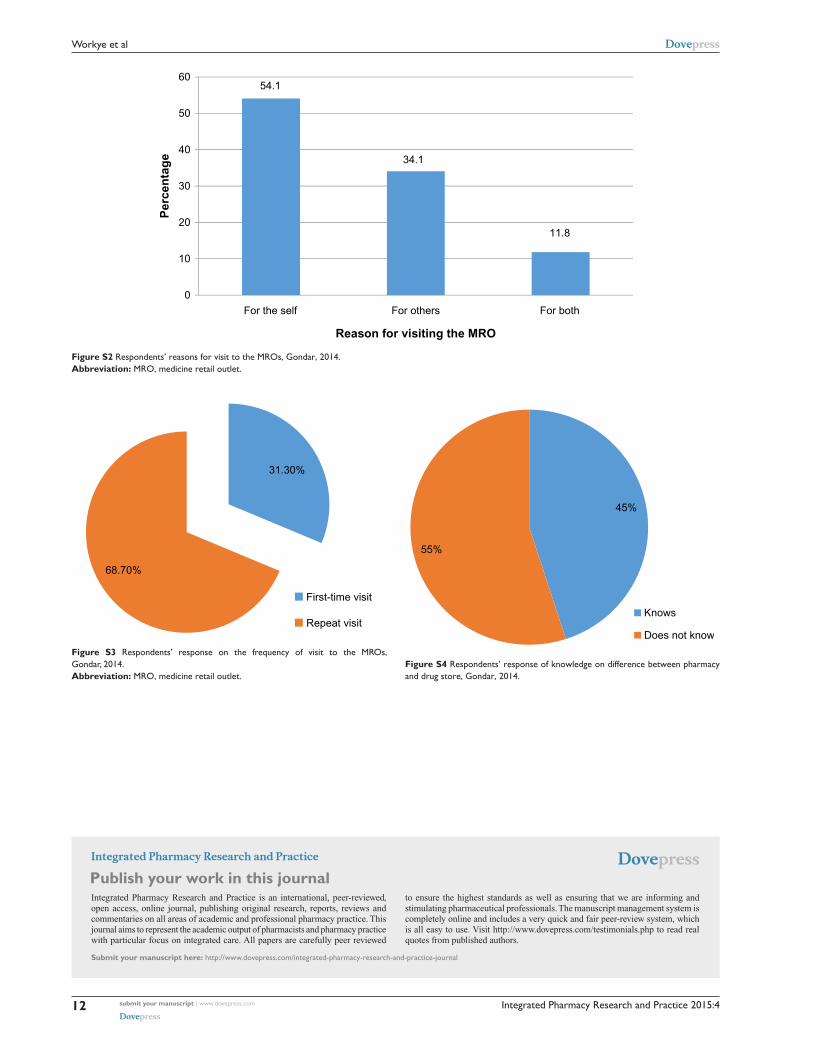
general information related to MRO servicesMore than half of the respondents’ (54.1%) reason for visit to
the MROs was to take medicines for themselves. More than
two-thirds (68.7%) of the respondents had repeated visits to
the MROs. More than half (55%) of the respondents claimed
Integrated Pharmacy Research and Practice 2015:4submit your manuscript | www.dovepress.com
Dovepress
Dovepress
4
Workye et al
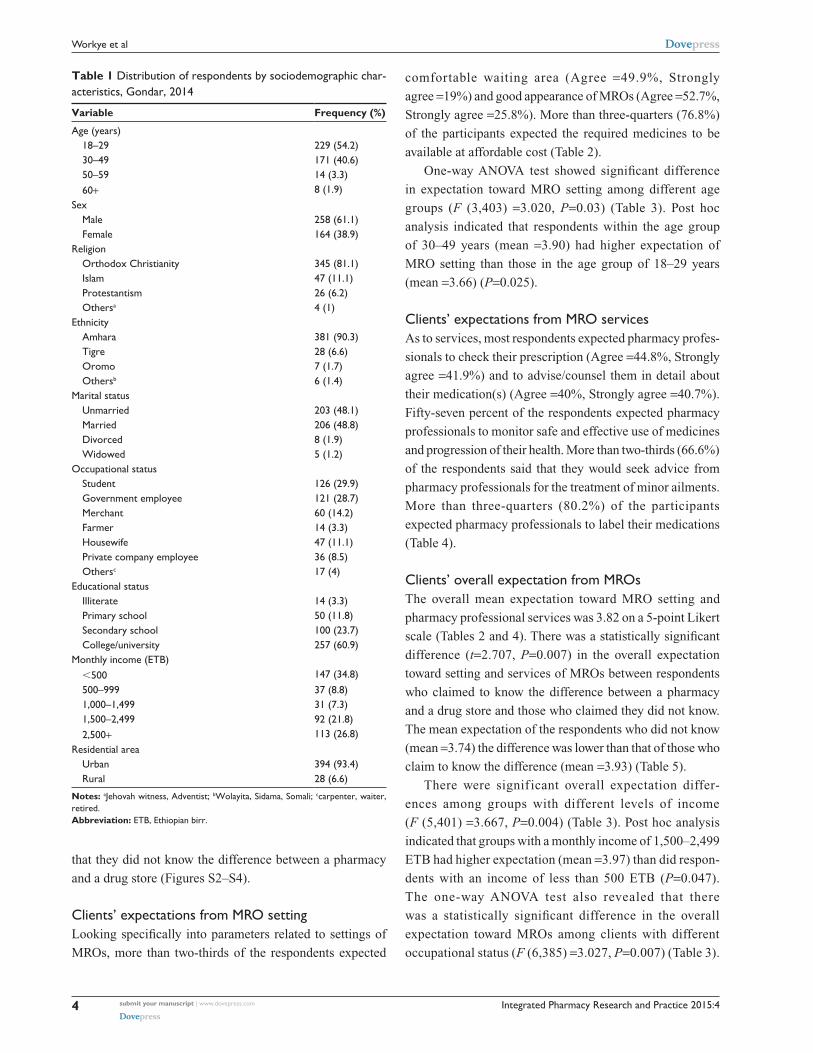
Table 1 Distribution of respondents by sociodemographic char-acteristics, gondar, 2014
Variable Frequency (%)
age (years) 18–29 229 (54.2) 30–49 171 (40.6) 50–59 14 (3.3) 60+ 8 (1.9)sex Male 258 (61.1) Female 164 (38.9)Religion Orthodox christianity 345 (81.1) Islam 47 (11.1) Protestantism 26 (6.2) Othersa 4 (1)ethnicity amhara 381 (90.3) Tigre 28 (6.6) Oromo 7 (1.7) Othersb 6 (1.4)Marital status Unmarried 203 (48.1) Married 206 (48.8) Divorced 8 (1.9) Widowed 5 (1.2)Occupational status student 126 (29.9) government employee 121 (28.7) Merchant 60 (14.2) Farmer 14 (3.3) housewife 47 (11.1) Private company employee 36 (8.5) Othersc 17 (4)educational status Illiterate 14 (3.3) Primary school 50 (11.8) secondary school 100 (23.7) college/university 257 (60.9)Monthly income (eTB) ,500 147 (34.8) 500–999 37 (8.8) 1,000–1,499 31 (7.3) 1,500–2,499 92 (21.8) 2,500+ 113 (26.8)Residential area Urban 394 (93.4) Rural 28 (6.6)
Notes: aJehovah witness, adventist; bWolayita, sidama, somali; ccarpenter, waiter, retired.Abbreviation: eTB, ethiopian birr.
that they did not know the difference between a pharmacy
and a drug store (Figures S2–S4).
clients’ expectations from MRO settingLooking specifically into parameters related to settings of
MROs, more than two-thirds of the respondents expected
comfortable waiting area (Agree =49.9%, Strongly
agree =19%) and good appearance of MROs (Agree =52.7%,
Strongly agree =25.8%). More than three-quarters (76.8%)
of the participants expected the required medicines to be
available at affordable cost (Table 2).
One-way ANOVA test showed significant difference
in expectation toward MRO setting among different age
groups (F (3,403) =3.020, P=0.03) (Table 3). Post hoc
analysis indicated that respondents within the age group
of 30–49 years (mean =3.90) had higher expectation of
MRO setting than those in the age group of 18–29 years
(mean =3.66) (P=0.025).
clients’ expectations from MRO servicesAs to services, most respondents expected pharmacy profes-
sionals to check their prescription (Agree =44.8%, Strongly
agree =41.9%) and to advise/counsel them in detail about
their medication(s) (Agree =40%, Strongly agree =40.7%).
Fifty-seven percent of the respondents expected pharmacy
professionals to monitor safe and effective use of medicines
and progression of their health. More than two-thirds (66.6%)
of the respondents said that they would seek advice from
pharmacy professionals for the treatment of minor ailments.
More than three-quarters (80.2%) of the participants
expected pharmacy professionals to label their medications
(Table 4).
clients’ overall expectation from MROsThe overall mean expectation toward MRO setting and
pharmacy professional services was 3.82 on a 5-point Likert
scale (Tables 2 and 4). There was a statistically significant
difference (t=2.707, P=0.007) in the overall expectation
toward setting and services of MROs between respondents
who claimed to know the difference between a pharmacy
and a drug store and those who claimed they did not know.
The mean expectation of the respondents who did not know
(mean =3.74) the difference was lower than that of those who
claim to know the difference (mean =3.93) (Table 5).
There were signif icant overall expectation differ-
ences among groups with different levels of income
(F (5,401) =3.667, P=0.004) (Table 3). Post hoc analysis
indicated that groups with a monthly income of 1,500–2,499
ETB had higher expectation (mean =3.97) than did respon-
dents with an income of less than 500 ETB (P=0.047).
The one-way ANOVA test also revealed that there
was a statistically significant difference in the overall
expectation toward MROs among clients with different
occupational status (F (6,385) =3.027, P=0.007) (Table 3).
Integrated Pharmacy Research and Practice 2015:4 submit your manuscript | www.dovepress.com
Dovepress
Dovepress
5
clients’ expectations from and satisfaction with medicine retail outlets
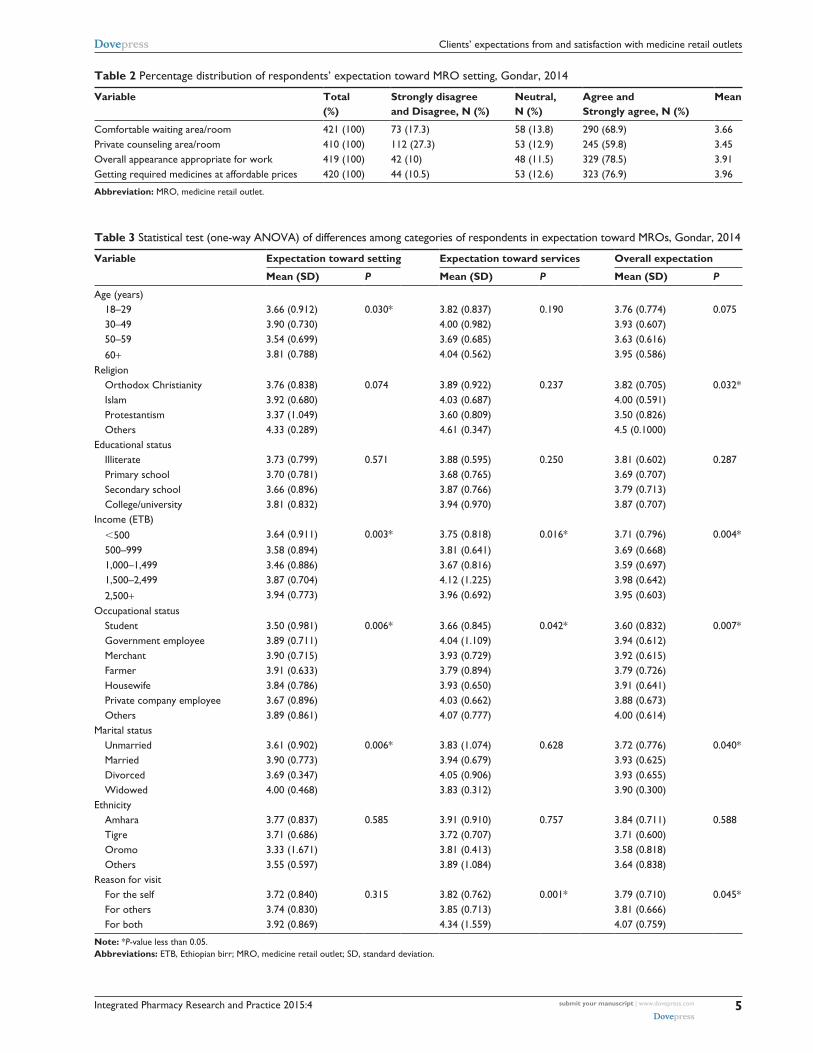
Table 2 Percentage distribution of respondents’ expectation toward MRO setting, gondar, 2014
Variable Total (%)
Strongly disagree and Disagree, N (%)
Neutral, N (%)
Agree and Strongly agree, N (%)
Mean
comfortable waiting area/room 421 (100) 73 (17.3) 58 (13.8) 290 (68.9) 3.66Private counseling area/room 410 (100) 112 (27.3) 53 (12.9) 245 (59.8) 3.45Overall appearance appropriate for work 419 (100) 42 (10) 48 (11.5) 329 (78.5) 3.91getting required medicines at affordable prices 420 (100) 44 (10.5) 53 (12.6) 323 (76.9) 3.96
Abbreviation: MRO, medicine retail outlet.
Table 3 statistical test (one-way anOVa) of differences among categories of respondents in expectation toward MROs, gondar, 2014
Variable Expectation toward setting Expectation toward services Overall expectation
Mean (SD) P Mean (SD) P Mean (SD) P
age (years) 18–29 3.66 (0.912) 0.030* 3.82 (0.837) 0.190 3.76 (0.774) 0.075 30–49 3.90 (0.730) 4.00 (0.982) 3.93 (0.607) 50–59 3.54 (0.699) 3.69 (0.685) 3.63 (0.616) 60+ 3.81 (0.788) 4.04 (0.562) 3.95 (0.586)Religion Orthodox christianity 3.76 (0.838) 0.074 3.89 (0.922) 0.237 3.82 (0.705) 0.032* Islam 3.92 (0.680) 4.03 (0.687) 4.00 (0.591) Protestantism 3.37 (1.049) 3.60 (0.809) 3.50 (0.826) Others 4.33 (0.289) 4.61 (0.347) 4.5 (0.1000)educational status Illiterate 3.73 (0.799) 0.571 3.88 (0.595) 0.250 3.81 (0.602) 0.287 Primary school 3.70 (0.781) 3.68 (0.765) 3.69 (0.707) secondary school 3.66 (0.896) 3.87 (0.766) 3.79 (0.713) college/university 3.81 (0.832) 3.94 (0.970) 3.87 (0.707)Income (eTB) ,500 3.64 (0.911) 0.003* 3.75 (0.818) 0.016* 3.71 (0.796) 0.004* 500–999 3.58 (0.894) 3.81 (0.641) 3.69 (0.668) 1,000–1,499 3.46 (0.886) 3.67 (0.816) 3.59 (0.697) 1,500–2,499 3.87 (0.704) 4.12 (1.225) 3.98 (0.642) 2,500+ 3.94 (0.773) 3.96 (0.692) 3.95 (0.603)Occupational status student 3.50 (0.981) 0.006* 3.66 (0.845) 0.042* 3.60 (0.832) 0.007* government employee 3.89 (0.711) 4.04 (1.109) 3.94 (0.612) Merchant 3.90 (0.715) 3.93 (0.729) 3.92 (0.615) Farmer 3.91 (0.633) 3.79 (0.894) 3.79 (0.726) housewife 3.84 (0.786) 3.93 (0.650) 3.91 (0.641) Private company employee 3.67 (0.896) 4.03 (0.662) 3.88 (0.673) Others 3.89 (0.861) 4.07 (0.777) 4.00 (0.614)Marital status Unmarried 3.61 (0.902) 0.006* 3.83 (1.074) 0.628 3.72 (0.776) 0.040* Married 3.90 (0.773) 3.94 (0.679) 3.93 (0.625) Divorced 3.69 (0.347) 4.05 (0.906) 3.93 (0.655) Widowed 4.00 (0.468) 3.83 (0.312) 3.90 (0.300)ethnicity amhara 3.77 (0.837) 0.585 3.91 (0.910) 0.757 3.84 (0.711) 0.588 Tigre 3.71 (0.686) 3.72 (0.707) 3.71 (0.600) Oromo 3.33 (1.671) 3.81 (0.413) 3.58 (0.818) Others 3.55 (0.597) 3.89 (1.084) 3.64 (0.838)Reason for visit For the self 3.72 (0.840) 0.315 3.82 (0.762) 0.001* 3.79 (0.710) 0.045* For others 3.74 (0.830) 3.85 (0.713) 3.81 (0.666) For both 3.92 (0.869) 4.34 (1.559) 4.07 (0.759)
Note: *P-value less than 0.05.Abbreviations: eTB, ethiopian birr; MRO, medicine retail outlet; sD, standard deviation.

Integrated Pharmacy Research and Practice 2015:4submit your manuscript | www.dovepress.com
Dovepress
Dovepress
6
Workye et al
Table 4 Percentage distribution of respondents’ expectation toward MRO services, gondar, 2014
Variable Total (%) Strongly disagree and Disagree, N (%)
Neutral, N (%)
Agree and Strongly agree, N (%)
Mean
checking my prescriptions for completeness and accuracy 420 (100) 28 (6.7) 28 (6.7) 364 (86.6) 4.2counsel/advise me in detail about my medications 420 (100) 37 (8.8) 44 (10.5) 339 (80.7) 4.11counsel and advise me on the treatment of minor ailments 416 (100) 50 (12) 89 (21.4) 277 (66.6) 3.77Monitor safe and effective use of medicines and the progress in my health
411 (100) 85 (20.7) 92 (22.4) 234 (56.9) 3.54
counsel/advise me about my disease and provide general advice on healthy lifestyle
416 (100) 70 (16.8) 98 (23.6) 248 (59.6) 3.57
label my medications with appropriate instructions 418 (100) 39 (9.3) 44 (10.6) 335 (80.1) 4.01Abbreviation: MRO, medicine retail outlet.
Table 5 statistical test (t-test) of differences between categories of respondents in expectation toward MROs, gondar, 2014
Variable Expectation toward setting Expectation toward services Overall expectation
Mean (SD) P Mean (SD) P Mean (SD) P
sex Male 3.76 (0.871) 0.792 3.87 (0.759) 0.522 3.8295 (0.709) 0.951 Female 3.74 (0.792) 3.93 (1.080) 3.8250 (0.703)Type of MRO Drug store 3.80 (0.871) 1.270 3.98 (0.952) 0.009* 3.8861 (0.694) 0.028* Pharmacy 3.69 (0.785) 3.74 (0.760) 3.7229 (0.717)Residential area Urban 3.76 (0.840) 0.542 3.91 (0.859) 0.117 3.8436 (0.698) 0.090 Rural 3.66 (0.859) 3.62 (0.840) 3.5960 (0.786)Frequency of visit First time 3.73 (0.873) 0.722 3.77 (0.802) 0.074 3.7559 (0.745) 0.186 Repeat 3.76 (0.827) 3.94 (0.927) 3.8588 (0.687)Knowledge of the difference between pharmacy and drug store Knows 3.87 (0.814) 0.008* 4.01 (1.013) 0.014* 3.9317 (0.683) 0.007* Doesn’t know 3.65 (0.851) 3.79 (0.766) 3.7396 (0.714)
Note: *P-value less than 0.05.Abbreviations: MRO, medicine retail outlet; sD, standard deviation.
The post hoc test showed that the overall expectation
toward MROs was higher in those who were government
employees (mean =3.94) than in those who were students
(mean =3.6), P=0.005.
clients’ satisfaction with MRO settingThe respondents had a relatively low mean satisfaction on
the comfort and convenience of waiting area, cost of the
medicine, and comfort and convenience of the counsel-
ing room, with a mean satisfaction of 2.78, 2.67, and 2.43,
respectively. But they were satisfied on the waiting time
(mean =3.65) (Table 6).
clients’ satisfactions with MRO servicesAmong the parameters the participants rated low in their
satisfaction level was the question whether pharmacy
professionals’ main effort was to improve the former’s health
and not to get a profit. In this parameter the participants’
mean satisfaction was 2.52. Most respondents claimed that
pharmacy professionals did not advise about proper storage,
initiate counseling without being asked for advice, or tell
about side effects, with a mean satisfaction of 2.63, 2.74,
and 2.67, respectively (Table 7).
There was a statistically significant difference in the sat-
isfaction toward MRO services among clients with different
reasons for visit (F (2,381) =5.866, P=0.003) (Table S1). Post
hoc analysis showed the satisfaction of respondents to MRO
services to be higher in those who took medicines for both
(for self and others) (mean =3.17) compared with those who
took for themselves (mean =2.96) (P=0.004).
clients’ overall satisfaction with MROsThe respondents were considered as satisfied with the
services in the MROs when the average was higher than 3
(a score considered as “Good”). The overall satisfaction
of the respondents was 3.02. Respondents who claimed to
know the difference between a pharmacy and a drug store
reported a higher level of satisfaction (mean =3.1) than did

Integrated Pharmacy Research and Practice 2015:4 submit your manuscript | www.dovepress.com
Dovepress
Dovepress
7
clients’ expectations from and satisfaction with medicine retail outlets
Table 6 Percentage distribution of respondents’ satisfaction with MRO setting, gondar, 2014
Variable Total (%) Poor and Fair, N (%)
Good, N (%)
Very good and Excellent, N (%)
Mean
convenience of the location of MRO 422 (100) 71 (16.8) 196 (46.5) 155 (36.7) 3.29The cleanliness of MRO 422 (100) 95 (22.5) 187 (44.3) 140 (33.2) 3.19The air conditioning and temperature in the MRO 418 (100) 105 (25.1) 177 (42.3) 136 (32.6) 3.15The lighting condition in the MRO 418 (100) 92 (22.0) 168 (40.2) 158 (37.8) 3.26comfort and convenience of waiting area 421 (100) 180 (42.7) 146 (34.7) 95 (22.6) 2.78availability of the medicines you need 420 (100) 122 (29.1) 185 (44) 113 (26.9) 3.00The cost of the medicines you need 420 (100) 184 (43.8) 153 (36.4) 83 (19.8) 2.67Provision of clear and well-organized service 422 (100) 101 (23.9) 191 (45.3) 130 (30.8) 3.09Waiting time until getting the service 417 (100) 58 (13.9) 130 (31.2) 229 (54.9) 3.65comfort and convenience of private counseling area/room 414 (100) 242 (58.5) 85 (20.5) 87 (21.0) 2.43
Abbreviation: MRO, medicine retail outlet.
Table 7 Percentage distribution of respondents’ satisfaction with MRO services, gondar, 2014
Variable Total (%) Poor and Fair, N (%)
Good, N (%)
Very good and Excellent, N (%)
Mean
Being polite and respectful toward clients 422 (100) 43 (10.2) 150 (35.5) 229 (54.3) 3.68Taking time to listen to what you want 419 (100) 122 (29.1) 122 (29.1) 175 (41.8) 3.24answering queries you may have 419 (100) 78 (18.6) 165 (39.4) 176 (42.0) 3.38adequately informing about interactions between prescribed medications and with food
417 (100) 137 (32.8) 140 (33.6) 140 (33.6) 3.03
Main effort was to improve my health and not to profit as much as possible on my account
393 (100) 228 (58.0) 78 (19.9) 87 (22.1) 2.52
Initiated counseling about my prescribed medicine without being asking for advice
406 (100) 194 (47.8) 108 (26.6) 104 (25.6) 2.69
adequately explained what the medicine does or checked whether I already know this
418 (100) 172 (41.1) 125 (29.9) 121 (29) 2.83
explained how to take my medicines or checked whether I already know this
419 (100) 140 (33.4) 152 (36.3) 127 (30.3) 2.98
Told me about side effects of my prescribed medicines 419 (100) 185 (44.2) 107 (25.5) 127 (30.3) 2.74label my medicines in readable and understandable instructions for their use
419 (100) 135 (32.2) 129 (30.8) 155 (37.0) 3.11
gives information about the proper storage of my medication 420 (100) 200 (47.6) 106 (25.2) 114 (27.2) 2.63Overall satisfaction with the services of MROs 420 (100) 93 (22.2) 169 (40.2) 158 (37.6) 3.2
Abbreviation: MRO, medicine retail outlet.
respondents who claim they did not know (mean =2.93)
(t=2.260, P=0.024) (Table S2).
DiscussionAssessing the level of expectations and satisfaction of cli-
ents with their health care services has become important
globally.20 Similarly, considerable research supports using
satisfaction rating to measure the quality of care from the
patients’ perspective.21 Among the 422 participants, the
overall mean expectation toward MRO setting and pharmacy
professional services was high (mean =3.82). This showed
a promising result for pharmacy professionals, as their role
as health care providers seems to be understood by clients.
Similar high levels of expectations from different aspects of
community pharmacy services were reported by studies in
Saudi Arabia and Spain.22,23
Fifty-seven percent of the respondents agreed that they
expected pharmacy professionals to monitor the safe and
effective use of medicines as well as the progress of clients’
health. In a pilot study in Qatar that interviewed clients,
more than 70% of respondents disagreed that the pharmacy
professional was expected to monitor the patients’ health
progress to ensure the safe and effective use of medications.
In contrast, the present study reported better awareness on
the roles of pharmacy professionals.9
Two-thirds (66.6%) of the respondents said that they
would seek the pharmacist’s advice in the case of minor
illnesses. This was comparable with the findings in Jordan
(63%) and Northern Ireland, which reported that 67% of the
clients would not hesitate to ask the pharmacist for advice
regarding the treatment of minor ailments.24,25 This finding
can be considered as an indication of a potential area for
Integrated Pharmacy Research and Practice 2015:4submit your manuscript | www.dovepress.com
Dovepress
Dovepress
8
Workye et al
the future in further developing and raising the standards
of practice to meet these expectations among clients in
the town.
A very high proportion (87%) of the participants agreed or
strongly agreed that they expected pharmacy professionals to
check the completeness and accuracy of the prescription. This
might be related to the fact that filling prescriptions is the
most common duty of pharmacy professionals known to
clients as it is the major role currently.
There was a statistically significant difference in the
overall expectation toward setting as well as services of
MROs between the respondents who claimed to know
the difference between a pharmacy and a drug store and
those who claimed they did not. The mean expectation of
respondents who claimed to know (3.93) is higher than
the mean expectation of respondents who did not claim to
know (3.74), with a P-value of 0.007. This may be because
of better awareness among clients who claimed to know
the difference about MROs, which in turn pushed up their
expectations.
This study revealed that clients who visited drug stores
had higher expectations toward the overall services of MROs
(P=0.028). This may be due to a lack of knowledge on the
difference between a pharmacy and a drug store, or there
may not be actual service difference between a pharmacy
and a drug store, or else the service quality of the drug store
may be better.
The overall result of the study showed a significant dif-
ference of expectation among groups with different monthly
income (P-value of 0.004). The post hoc analysis indicated
that groups with a monthly income of 1,500–2,499 ETB had
a higher overall expectation than those whose income was
less than 500 ETB. This might have resulted as the majority
of the respondents in this group were government employees
(mean expectation =3.94, P=0.007) who had higher education
and had good awareness toward MROs.
More than half of the respondents in this study were dis-
satisfied by the comfort and convenience of private counsel-
ing area; this might have resulted from the absence of private
counseling area/room in the MROs.
A very large proportion (86.2%) of the study participants
were satisfied with waiting time to get service; this could
be explained by the fact that pharmacy professionals do
not provide detailed information about drugs, as supported
by other findings in this study (advice about side effects
[mean =2.74] and about storage condition [mean =2.63]).
Nearly half (44.8%) of the respondents were not comfortable
with the cost of medicines; this could relate to the higher price
of drugs in private MROs compared with reduced price of
medicines in public/aid organizations’ MROs.
More than 70% of the respondents agreed that the phar-
macy professionals took time to listen and answer their
questions. This was very much higher than that reported
in the Qatar study, which was 37% for the same question.9
About 42% of the respondents rated the question related to
the idea that pharmacy professionals’ main effort was to
improve their health instead of profiting on clients’ account
as satisfactory. This was higher than the Qatar study report
(28%) and the England study report (26%).9,11
About 90% of the respondents claimed that pharmacy
professionals were polite and respectful toward clients.
This might be explained through the idea that being polite
and respectful toward customers improves business pros-
pects, or it could show professional ethics being followed in
this respect. Half of the respondents agreed that pharmacy
professionals initiate advice without being asked. This is
comparatively higher than the finding of the study in Saudi
Arabia, which was 38.5%.22
Almost half of the respondents reported being dissatisfied
as information regarding the storage of medicines was not
provided to them. This might be pharmacy professionals’
ignorance in delivering such information with thought that
the clients do know this information, or it might be related to
the common dispensing shortcomings such as poor labeling
and packaging/repackaging practices.26
This study showed that the overall satisfaction of the
respondents was 60.5%, which was lower than the satisfac-
tion rate of USA (85% satisfaction level).27 It was better than
the findings reported in Zambia (a 36% satisfaction).28 This
study showed an overall mean satisfaction of 3.02, which
was better than that reported by the study conducted in Addis
Ababa to assess the quality of pharmacy services in govern-
ment hospitals (a mean satisfaction of 2.7).29
Statistical test (t-test) of the analysis showed a significant
difference of satisfaction among respondents who claimed to
know the difference between a pharmacy and a drug store.
The mean satisfaction of those who claimed to know the dif-
ference was higher (P=0.024). This might be because clients
who knew the difference had a better understanding of the
services provided in the MROs.
ConclusionIn this study, the overall client expectation from MRO ser-
vices was high. The highest expectation was found regarding
checking prescriptions for completeness and accuracy, and
the lowest went to monitoring safe and effective use of the
Integrated Pharmacy Research and Practice 2015:4 submit your manuscript | www.dovepress.com
Dovepress
Dovepress
9
clients’ expectations from and satisfaction with medicine retail outlets
medicines to ensure the progress of their health. The overall
expectation of the respondents toward MROs was low in
those who did not know the difference between a pharmacy
and a drug store compared than in those who claimed to
know the difference.
On the other hand, the overall satisfaction level of clients
with MROs was found to be average. Areas of lower satisfac-
tion level were found regarding comfort and convenience of
private counseling area. A relatively high satisfaction level
was reported regarding the pharmacy professionals’ polite
approach and high respect and also the waiting time to get
services. From these findings, it was recommended that the
Gondar Town Health Bureau should take initiatives in pro-
viding regular supportive supervision to MROs to help them
maintain the standard and quality of their settings and ser-
vices, which will improve the satisfaction of their clients.
AcknowledgmentsThe authors acknowledge the support of the School of
Pharmacy, College of Medicine and Health Sciences,
University of Gondar, in facilitating the data collection
process. The authors also appreciate the clients who par-
ticipated in the study and the MROs for their cooperation in
the data collection.
DisclosureNo financial support was gained in the conduct of this study.
The authors report no conflicts of interest in this work.
References1. Oparah BC, Kikanme LC. Consumer satisfaction with community
pharmacies in Warri, Nigeria. Res Social Adm Pharm. 2006;2(4): 499–511.
2. Donabedian A. Explorations in quality assessment and monitoring: the definition of quality and approaches to its assessment. Ann Arbor, MI: Health Administration 1992;3(5):123–125.
3. Sitzia J, Wood N. Patient satisfaction: a review of issues and concepts. Soc Sci Med. 1997;45:1829–1843.
4. Ware JE, Davies AR. Behavioral consequences of consumer dissatisfac-tion with medical care. Eval Program Plann. 1983;6:185–210.
5. Zastowny TR, Roghmann KJ, Cafferata GL. Patient satisfaction and the use of health services: explorations in causality. Med Care. 1989;27: 705–723.
6. Farris KB, Stenton SB, Samnani M, Samycia D. How satisfied are your patients? Can Pharm J. 2000;133(8):32–36.
7. Larson LN, Rovers JP, MacKeigan LD. Patient satisfaction with phar-maceutical care: update of a validated instrument. J Am Pharm Assoc. 2002;42:44–50.
8. Hovart N, Kos M. Development and initial validation of a partial satisfac-tion with pharmacy performance questionnaire (PSPPQ). Eval Health Prof. 2010; 33:197–215.
9. El Hajj MS, Salem S, Mansoor H. Public’s attitudes towards community pharmacy in Qatar: a pilot study. Patient Prefer Adherence. 2011;5: 405–422.
10. Kamei M, Teshima K, Fukushima, N, Nakamura T. Investigation of patients’ demand for community pharmacies: relationship between phar-macy services and patient satisfaction. Yakugaku Zasshi. 2001;121(3): 215–220.
11. Hargie O, Morrow N, Woodman C. Consumer perceptions of and attitudes to community pharmacy services. Pharm J. 1992; 249,988–991.
12. Ethiopian Food Medicine and Health Care Administration and Control Authority (EFMHACA). Model Directive for Inspection and Licens-ing of Medicines Retail Outlets (in Amharic). Addis Ababa, Ethiopia. [Cited December 2013]. Available from: http://www.fmhaca.gov.et/documents/Directive%20%20for%20Medicine%20Manufucturing%20Establishmen%20%202013.pdf. Accessed April 20, 2014.
13. Desta Z, Abula T, Gebre-Yohannes A, Worku A. Drug prescribing pat-terns for outpatients in three hospitals in north-west Ethiopia. Ethiop J Health Dev. 2002;16(2):183–189.
14. Desta Z, Abula T, Beyene L, Fantahun M, Yohannes AG, Ayalew S. Assessment of rational drug use and prescribing in primary health facili-ties in northwest Ethiopia. East Afr Med J. 1997;74(12):758–763.
15. Federal Ministry of Health, World Health Organization. Rational Drug Use. Assessment of the Pharmaceutical Sector in Ethiopia, Federal Ministry of Health, World Health Organization; 2003.
16. Gondar Town Health Bureau. Report on the number of medicines retail outlets in Gondar town [unpublished report]; 2014.
17. Lwanga SK, Lemeshow S. Sample Size Determination for Health Studies: A Practical Manual. Geneva, Switzerland: World Health Organization; 1991:1–5.
18. Briesacher B, Corey R. Patient satisfaction with pharmaceutical services at independent and chain pharmacies. Am J Health Syst Pharm. 1997;54: 531–536.
19. IBM Corp. IBM SPSS Statistics for Windows, Version 21.0. Armonk, NY: IBM Corp. Released 2012.
20. Smith M, Engelbrecht B. Guide to assessing client satisfaction at district hospitals. A collaborative project between the National Department of Health and the Health Systems Trust; 2001. Available from: http://www.hst.org.za/sites/default/files/clientguide.pdf. Accessed April 17, 2014.
21. Ware JE, Davies AR, Rubin HR. Patients’ assessments of their care. In: The Quality of Medical Care: Information for Consumers. Washington, DC: US Office of Technology Assessment; 1988:231–247.
22. Al-Arifi M. Patients’ perception, views and satisfaction with pharma-cists’ role as health care provider in community pharmacy setting at Riyadh, Saudi Arabia. Saudi Pharm J. 2012;20:323–330.
23. Gastelurrutia MA, de San Vicente OG, Erauncetamurgil O, Odriozola I, Ferna´ndez-Llimos´ F. Customers’ expectations and satisfaction with a pharmacy not providing advanced cognitive services. Pharm World Sci. 2006;28(6):374–376.
24. Wazaify M, Younes A, Abu-Gharbieh E, Tahaineh L. Societal perspec-tives on the role of community pharmacists and over-the-counter drugs in Jordan. Pharm World Sci. 2008;30:884–889.
25. McElnay JC, Nicholl AJ, Grainger Rousseau TJ. The role of the com-munity pharmacist – a survey of public opinion in Northern Ireland. Int J Pharm Pract. 1993;2:95–100.
26. Food, Medicine and Healthcare Administration and Control Authority (FMHACA) of Ethiopia. Manual for Medicines Good Dispensing Practice. 2nd ed. Addis Ababa, Ethiopia. [Cited May 2012]. Available from: http://www.fmhaca.gov.et/documents/Medicines_Good_Dispensing_Manual_second_edition_2012.pdf. Accessed April 18, 2014.
27. Stergachis A, Maine LL, Brown L. The 2001 national pharmacy con-sumer survey. J Am Pharm Assoc. 2002;42:568–576.
28. Victor M. Client satisfaction with pharmacy care in Lusaca district, Zambia. Pharm World Sci. 32:145–147.
29. Eshetu E, Gedif T. Quality of pharmaceutical care in government hospitals of Addis Ababa, Ethiopia [Master’s Thesis]. Department of Pharmaceutics and Social Pharmacy, Addis Ababa University; 2010.
Integrated Pharmacy Research and Practice 2015:4submit your manuscript | www.dovepress.com
Dovepress
Dovepress
10
Workye et al
Supplementary materials
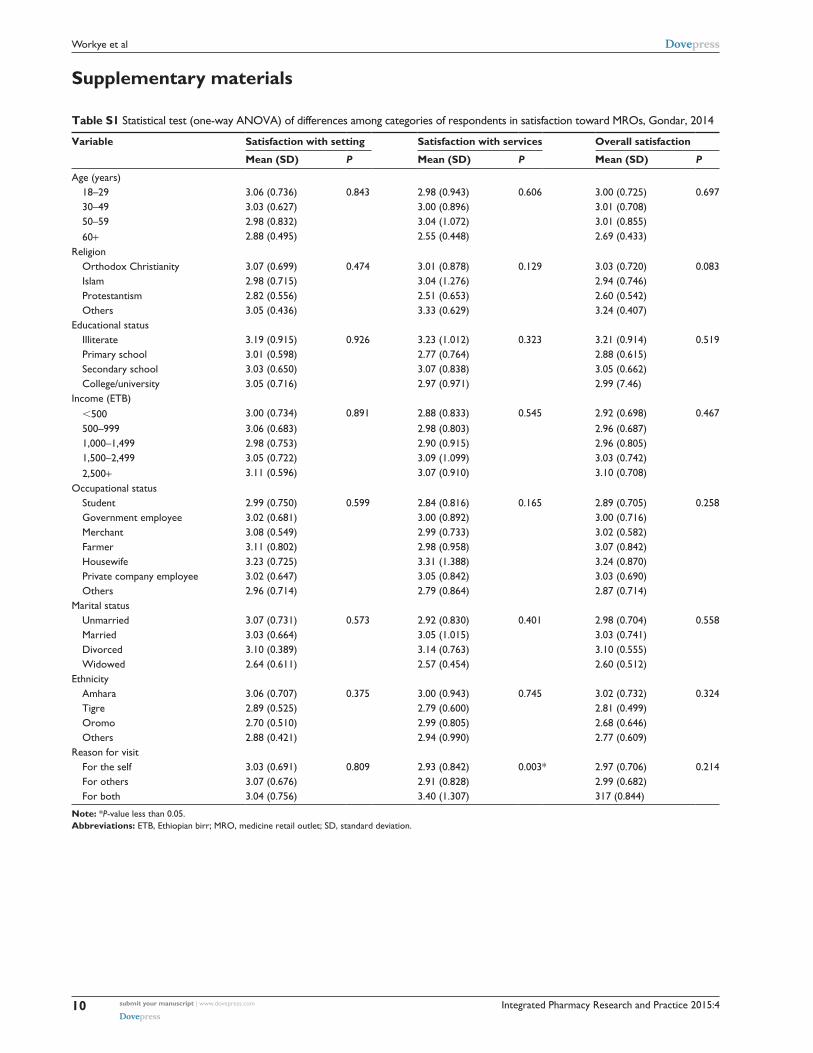
Table S1 statistical test (one-way anOVa) of differences among categories of respondents in satisfaction toward MROs, gondar, 2014
Variable Satisfaction with setting Satisfaction with services Overall satisfaction
Mean (SD) P Mean (SD) P Mean (SD) P
age (years) 18–29 3.06 (0.736) 0.843 2.98 (0.943) 0.606 3.00 (0.725) 0.697 30–49 3.03 (0.627) 3.00 (0.896) 3.01 (0.708) 50–59 2.98 (0.832) 3.04 (1.072) 3.01 (0.855) 60+ 2.88 (0.495) 2.55 (0.448) 2.69 (0.433)Religion Orthodox christianity 3.07 (0.699) 0.474 3.01 (0.878) 0.129 3.03 (0.720) 0.083 Islam 2.98 (0.715) 3.04 (1.276) 2.94 (0.746) Protestantism 2.82 (0.556) 2.51 (0.653) 2.60 (0.542) Others 3.05 (0.436) 3.33 (0.629) 3.24 (0.407)educational status Illiterate 3.19 (0.915) 0.926 3.23 (1.012) 0.323 3.21 (0.914) 0.519 Primary school 3.01 (0.598) 2.77 (0.764) 2.88 (0.615) secondary school 3.03 (0.650) 3.07 (0.838) 3.05 (0.662) college/university 3.05 (0.716) 2.97 (0.971) 2.99 (7.46)Income (eTB) ,500 3.00 (0.734) 0.891 2.88 (0.833) 0.545 2.92 (0.698) 0.467 500–999 3.06 (0.683) 2.98 (0.803) 2.96 (0.687) 1,000–1,499 2.98 (0.753) 2.90 (0.915) 2.96 (0.805) 1,500–2,499 3.05 (0.722) 3.09 (1.099) 3.03 (0.742) 2,500+ 3.11 (0.596) 3.07 (0.910) 3.10 (0.708)Occupational status student 2.99 (0.750) 0.599 2.84 (0.816) 0.165 2.89 (0.705) 0.258 government employee 3.02 (0.681) 3.00 (0.892) 3.00 (0.716) Merchant 3.08 (0.549) 2.99 (0.733) 3.02 (0.582) Farmer 3.11 (0.802) 2.98 (0.958) 3.07 (0.842) housewife 3.23 (0.725) 3.31 (1.388) 3.24 (0.870) Private company employee 3.02 (0.647) 3.05 (0.842) 3.03 (0.690) Others 2.96 (0.714) 2.79 (0.864) 2.87 (0.714)Marital status Unmarried 3.07 (0.731) 0.573 2.92 (0.830) 0.401 2.98 (0.704) 0.558 Married 3.03 (0.664) 3.05 (1.015) 3.03 (0.741) Divorced 3.10 (0.389) 3.14 (0.763) 3.10 (0.555) Widowed 2.64 (0.611) 2.57 (0.454) 2.60 (0.512)ethnicity amhara 3.06 (0.707) 0.375 3.00 (0.943) 0.745 3.02 (0.732) 0.324 Tigre 2.89 (0.525) 2.79 (0.600) 2.81 (0.499) Oromo 2.70 (0.510) 2.99 (0.805) 2.68 (0.646) Others 2.88 (0.421) 2.94 (0.990) 2.77 (0.609)Reason for visit For the self 3.03 (0.691) 0.809 2.93 (0.842) 0.003* 2.97 (0.706) 0.214 For others 3.07 (0.676) 2.91 (0.828) 2.99 (0.682) For both 3.04 (0.756) 3.40 (1.307) 317 (0.844)
Note: *P-value less than 0.05.Abbreviations: eTB, ethiopian birr; MRO, medicine retail outlet; sD, standard deviation.

Integrated Pharmacy Research and Practice 2015:4 submit your manuscript | www.dovepress.com
Dovepress
Dovepress
11
clients’ expectations from and satisfaction with medicine retail outlets
MROs (53) inGondar town
Pharmacies(19)
5pharmaciesselected
1 45
2 18
3 45
4 45
5 9
Drug stores(34)
8 drugstores
selected
6 31
7 48
8 23
9 31
10 31
11 58
12 23
13 15
MRO IDNumber of clientssampled
Figure S1 Flowchart of sampling procedure (selected from each MRO using average daily client flow).Abbreviation: MRO, medicine retail outlet.
Table S2 statistical test (t-test) of differences between categories of respondents in satisfaction with MROs, gondar, 2014
Variable Satisfaction with setting Satisfaction with services Overall satisfaction
Mean (SD) P Mean (SD) P Mean (SD) P
sex Male 3.04 (0.691) 0.882 2.96 (0.862) 0.657 3.00 (0.722) 0.995 Female 3.05 (0.697) 3.01 (1.014) 3.00 (0.713)Type of MRO Drug store 3.01 (0.704) 0.226 3.01 (0.960) 0.386 3.01 (0.715) 0.758 Pharmacy 3.10 (0.671) 2.93 (0.960) 2.98 (0.725)Residential area Urban 3.06 (0.682) 0.121 2.98 (0.923) 0.818 3.01 (0.712) 0.484 Rural 2.84 (0.814) 2.94 (0.906) 2.90 (0.792)Frequency of visit First time 3.04 (0.669) 0.922 2.85 (0.842) 0.063 2.93 (0.705) 0.224 Repeat 3.05 (0.704) 3.04 (0.950) 3.03 (0.722)Knowledge of the difference between pharmacy and drug store Knows 3.12 (0.711) 0.062 3.08 (0.843) 0.060 3.10 (0.706) 0.024* Does not know 2.99 (0.673) 2.90 (0.972) 2.93 (0.719)
Note: *P-value less than 0.05.Abbreviations: MRO, medicine retail outlet; sD, standard deviation.
Integrated Pharmacy Research and Practice
Publish your work in this journal
Submit your manuscript here: http://www.dovepress.com/integrated-pharmacy-research-and-practice-journal
Integrated Pharmacy Research and Practice is an international, peer-reviewed, open access, online journal, publishing original research, reports, reviews and commentaries on all areas of academic and professional pharmacy practice. This journal aims to represent the academic output of pharmacists and pharmacy practice with particular focus on integrated care. All papers are carefully peer reviewed
to ensure the highest standards as well as ensuring that we are informing and stimulating pharmaceutical professionals. The manuscript management system is completely online and includes a very quick and fair peer-review system, which is all easy to use. Visit http://www.dovepress.com/testimonials.php to read real quotes from published authors.
Integrated Pharmacy Research and Practice 2015:4submit your manuscript | www.dovepress.com
Dovepress
Dovepress
Dovepress
12
Workye et al
54.1
34.1
11.8
0
10
20
30
40
50
60
For the self For others For both
Per
cen
tag
e
Reason for visiting the MRO
Figure S2 Respondents’ reasons for visit to the MROs, gondar, 2014.Abbreviation: MRO, medicine retail outlet.
31.30%
68.70%
First-time visit
Repeat visit
Figure S3 Respondents’ response on the frequency of visit to the MROs, gondar, 2014.Abbreviation: MRO, medicine retail outlet.
45%
55%
Knows
Does not know
Figure S4 Respondents’ response of knowledge on difference between pharmacy and drug store, gondar, 2014.