![Delivering value[s] - AnnualReports.com](https://static.fdokumen.com/doc/165x107/631698069076d1dcf80b7972/delivering-values-annualreportscom.jpg)
people, passionately delivering on clients' needs
246
people, passionately delivering on clients’ needs Integrated Annual Report 2019
-
Upload
khangminh22 -
Category
Documents
-
view
2 -
download
0
Transcript of people, passionately delivering on clients' needs

people, passionately delivering
on clients’ needsIntegrated Annual Report 2019
CA
PIT
EC
BA
NK
HO
LDIN
GS
LIMIT
ED
INT
EG
RA
TE
D A
NN
UA
L RE
PO
RT
2019

people, passionatelydelivering on clients’ needs
In 2019, we have a bank with 13 774 employees, 840 branches and 11.4 million clients. Our fundamentals make banking simple, accessible, affordable and personal for everyone. We value relationships and increasingly engage on social platforms with our stakeholders. We believe in doing business responsibly. This is reflected in how we deliver our Global One solution and who we employ. We focus on building a strong talent pipeline and appoint people for their potential. We take responsibility for their training and development.
We are developing fun, digital and educational ways to increase financial literacy for clients and employees. We won the latest awards for the top South African bank, the most loved bank and the most innovative brand, among others. Our Global One solution remains simple and transparent: transact, save, insure and credit.
Our operating environment continues to be shaped by a challenging economic landscape. The unsecured credit market remains active and well regulated. We implemented the new IFRS 9 Accounting Standard. In terms of risk management, we have clearly defined roles, responsibilities and policies. Our motivation remains to create sustainable value for all our stakeholders.

The glossary explains some of the words, expressions, acronyms and abbreviations used in this reportBanking is simple. To write about banking and adhere to all the regulations and frameworks for reporting, means that we use words, expressions, acronyms and abbreviations that might not always be easy to understand. There is a glossary in the appendices that explains some of these.
Get in touch – we want to hear from youIf you would like to know more about us, please visit our website www.capitecbank.co.za. If you want to suggest improvements to this report, email us at [email protected]. We do regular investor and results presentations. If you would like to know about these, or attend, send your contact details to [email protected].
This report is about Capitec Bank Holdings Limited (Capitec), which is listed on the JSE. It owns the operating subsidiary Capitec Bank Limited (Capitec Bank). Capitec Bank is a leading South African retail bank that focuses on essential banking services and provides innovative transaction, savings, insurance and unsecured lending products to individuals. Capitec’s mission is to make banking simple and transparent to help clients – regardless of their level of income or assets – improve their financial lives through a single solution, called Global One.
What to know when you read this reportForward-looking statements are not guaranteesIn this report, certain statements (words such as “anticipates”, “estimates”, “expects”, “projects”, “believes”, “intends”, “plans”, “may” “will” and “should” and similar expressions) are forward-looking. These relate to, among other things, the plans, objectives, goals, strategies, future operations and performance of Capitec. These statements are not guarantees of future operating, financial or other results and involve certain risks, uncertainties and assumptions. Actual results and outcomes may differ materially from those expressed in or implied by such statements.
The Capitec board has given the report their stamp of approvalThe board takes responsibility for overseeing the integrity and completeness of this report. The board members collectively applied their minds to the preparation and presentation of this report. The board and the audit, human resources and remuneration (REMCO) and the social and ethics committees considered the accuracy and completeness of this report and are satisfied with the reliability of all data and information.
There are tools to help you navigate through the reportBecause this report is integrated, you will find different levels of information that relate to the same subject in different sections of the report. We use page references as shortcuts to help you find these connections.

Key performance indicators 4
Leadership reviews 6
The Capitec Way 29
Our business context 62
Our strategic goals and insights 70
Leadership teams and governance oversight 74
Risk management report 88
Remuneration report 116
Social responsibility 135
About this report 141
Appendices 142
Annual financial statements 146
Statutory information 242

2019 2018Change %2019/2018 2017 2016
ProfitabilityInterest income(2) R’m 15 501 15 474 0 14 934 13 413Net loan fee and insurance income(3) R’m 1 507 1 380 9 495 (83)Total lending, investment and insurance income less loan fee expense(2)(3) R’m 17 008 16 854 1 15 429 13 330Interest expense R’m (4 510) (4 184) 8 (3 552) (2 884)Net lending, investment and insurance income(2)(3) R’m 12 498 12 670 (1) 11 877 10 446Net transaction fee income R’m 6 464 5 127 26 3 923 3 020Other R’m 3 (1) – (1)Funeral income(4) R’m 54 – – –Income from operations(2)(3)(4) R’m 19 019 17 796 7 15 800 13 465Credit impairment charge(2)(8) R’m (4 450) (5 280) (16) (5 121) (4 401)Net income(2)(3)(4)(8) R’m 14 569 12 516 16 10 679 9 064Income from associates R’m 2 3 (33) – –Operating expenses R’m (7 494) (6 364) 18 (5 439) (4 591)Income before tax(2)(3)(4)(8) R’m 7 077 6 155 15 5 240 4 473Tax(3)(4) R’m (1 781) (1 685) 6 (1 434) (1 244)Preference dividend R’m (9) (12) (25) (16) (16)Discount on repurchase of preference shares R’m (2) – – –Earnings attributable to ordinary shareholders
Basic R’m 5 285 4 458 19 3 790 3 213Headline R’m 5 292 4 461 19 3 793 3 222
Net transaction fee income to net income % 44 41 37 33Net transaction fee income to operating expenses % 86 81 72 66Cost-to-income ratio(2) % 39 36 34 34Return on ordinary shareholders equity % 28 27 27 27Earnings per share
Attributable cents 4 571 3 855 19 3 278 2 779Headline cents 4 577 3 858 19 3 281 2 787Diluted attributable cents 4 562 3 843 19 3 267 2 773Diluted headline cents 4 568 3 846 19 3 270 2 781
Dividends per shareInterim cents 630 525 20 450 375Final cents 1 120 945 19 800 680Total cents 1 750 1 470 19 1 250 1 055
Dividend cover x 2.6 2.6 2.6 2.6 AssetsNet loans and advances R’m 44 515 40 927(1) 9 39 205 35 760Financial instruments at amortised cost(5) R’m 49 208 39 387(1) 25 30 605 24 989Financial assets – equity instruments at FVOCI (Available-for-sale financial assets) R’m 100 100 0 100Other R’m 4 723 3 139 50 2 988 1 794Current income tax asset R’m 286 –(1) – 53Deferred income tax asset R’m 1 596 1 168(1) 37 460 349Total assets R’m 100 428 84 721(1) 19 73 358 62 945LiabilitiesRetail deposits and wholesale funding R’m 76 443 64 030 19 55 582 47 940Other R’m 2 309 2 447(1) (6) 1 658 1 346Total liabilities R’m 78 752 66 477(1) 18 57 240 49 286EquityShareholders’ funds R’m 21 676 18 244(1) 19 16 118 13 659Capital adequacy ratio % 34 35(1) 34 35Net asset value per ordinary share cents 18 676 15 681(1) 19 13 809 11 663Share price cents 130 621 83 246 57 72 500 47 400Market capitalisation R’m 151 033 96 255 57 83 830 54 807Number of shares in issue ’000 115 627 115 627 115 627 115 627Share options
Number outstanding ’000 640 777 (18) 963 868Number outstanding to shares in issue % 0.6 0.7 0.8 0.8 Average strike price cents 50 644 38 561 31 31 755 28 520Average time to maturity months 18 19 20 27
4 | Capitec Bank Holdings Limited
key performance indicators
Key performance indicators
Leadership reviews
The Capitec Way
Our business context
Our strategic goals and insights
Leadership teams and governance oversight

2019 2018Change %2019/2018 2017 2016
OperationsBranches 840 826 2 796 720Employees 13 774 13 333 3 13 069 11 440Active clients ’000 11 386 9 868 15 8 569 7 269ATMs and DNRs
Own 2 090 1 895 10 1 653 1 236Partnership 2 921 2 750 6 2 371 2 469Total 5 011 4 645 8 4 024 3 705
Capital expenditure R’m 1 141 829 38 1 000 704Credit salesValue of credit card disbursements/drawdowns R’m 6 193 3 949 57 864Value of term loans advanced R’m 24 775 24 343 2 26 362 24 228Value of total loans advanced(10) R’m 30 968 28 292 9 27 226 24 228Number of total loans advanced(6) ’000 4 889 3 947 24 3 508 3 684Average of total credit card disbursements/drawdowns R 1 974 2 296 (14) 3 703 –Average of total term loans advanced R 14 145 10 934 29 8 051 6 577Average of total loans advanced R 6 334 7 168 (12) 7 761 6 577Credit bookGross loans and advances R’m 54 879 47 642 15 45 135 40 891Up-to-date Stage 1 R’m 41 587 37 165(1) 12 39 076 34 527Up-to-date with SICR Stage 2 R’m 3 765 4 401(1) (14)Total up-to-date R’m 45 352 41 566(1) 9 39 076 34 527Arrears – up to 1 month in arrears Stage 2 R’m 1 087 1 003 8 1 641 1 458Arrears – 2 and 3 months in arrears Stage 3 R’m 1 389 1 697(11) (18) 1 214 839Total arrears up to 3 months R’m 2 476 2 700 (8) 2 855 2 297Application for debt review within 6 months Stage 3 R’m 70 108(1)(11) (35)Up-to-date that rescheduled from up-to-date (not yet rehabilitated(7)) Stage 3 R’m 856 1 085 (21) 1 088 1 818Up-to-date that rescheduled from arrears (not yet rehabilitated(7)) Stage 3 R’m 1 272 1 277 (0) 1 583 1 542Total up-to-date that rescheduled (not yet rehabilitated(7)) R’m 2 128 2 362 (10) 2 671 3 360More than 3 months in arrears and legal status Stage 3 R’m 4 853 – – –Expected recoveries receivable(8) Stage 3 R’m – 906 (100) 533 707Total provision for credit impairment R’m 10 364 6 715(1) 54 5 930 5 131Net loans and advances R’m 44 515 40 927(1) 9 39 205 35 760Total provision for credit impairment to stage 3 (excluding expected recoveries receivable) and stage 2 (up to 1 month in arrears) coverage % 109 130(1) 107 91 Repayments R’m 38 100 35 974 6 33 236 29 388Gross credit impairment charge(2) R’m 4 917 6 560 (25) 6 246 5 255Bad debts recovered(8) R’m 467 1 280 (64) 1 125 854Net credit impairment charge(2) R’m 4 450 5 280 (16) 5 121 4 401Net credit impairment charge(2) to average gross loans and advances % 8.7 11.4 11.9 11.4 Total lending and insurance income (excluding investment income)(2)(3)(9) R’m 14 448 15 008 (4) 14 362 12 837Net credit impairment charge(2) to total lending and insurance income (excluding investment income)(2)(3)(9) % 30.8 35.2 35.7 34.3 Retail deposits and wholesale fundingWholesale funding R’m 5 078 6 206 (18) 7 543 10 154Retail call savings R’m 45 141 34 909 29 30 117 24 152Retail fixed savings R’m 26 224 22 915 14 17 922 13 634
(1) Transition to IFRS 9 Financial Instruments on 1 March 2018. These figures as at 28 February 2018 were adjusted accordingly. Please refer to the audited transitional report on our website that illustrates the impact of implementing IFRS 9 on 1 March 2018. (https://resources.capitecbank.co.za/Capitec_-_IFRS9_transitional_report.pdf)
(2) In the current year, under IFRS 9, interest income and credit impairment charge are recognised on a net basis for all loans classified as stage 3 (R1 073 million netting reversal for the year ended February 2019)
(3) Insurance profit is received from the cell captive as a dividend after tax. The tax expense on insurance profit is included in the net insurance income line for the financial year ended February 2019
(4) Funeral income is received from the cell captive as a dividend after tax. The tax expense is included in funeral income(5) Cash, cash equivalents, money market funds, term deposits and other financial investments(6) Includes credit card. For the number of loans advanced, every month in which the credit card is utilised is counted(7) Not yet rehabilitated – Clients are deemed to be rehabilitated once they have made contractual payments for 6 consecutive months. Once rehabilitated, the
loan is classified as up-to-date(8) Under IFRS 9, no future expected receivable is recognised post write-off. The R906 million receivable was run-down in the current year and reduced bad
debts recovered(9) Interest received on loans, initiation fees, monthly service fee and net insurance income(10) Net of loans settled through loan consolidations(11) In the transition report application for debt review within 6 months and arrears – 2 and 3 months in arrears were aggregated
Integrated Annual Report 2019 | 5
Risk management report
Remuneration report
Social responsibility
About this report
Appendices Annual financial statements

Banking is about people, passionately delivering on clients’ needsWe remain focused on delivering on our purpose: to enable clients to improve their financial lives. This is done with an unwavering commitment to the 4 fundamentals that have made Capitec so successful.
Simplicity, our brand essence, permeates through the way we design our banking solutions, pricing, digital services and communication. We believe that simplicity, delivered transparently, puts our clients in control of their money.
We are determined to deliver solutions that provide value for money to clients. Our cost-conscious culture and innovative processes and technology allow us to reduce the cost of banking. We pass the saving on to our clients, making banking more affordable.
We continue to make banking accessible through our 840 branches (14 new) and the extended trading hours of over 300 Sunday banking branches. We however also accelerated our digital banking development and are experiencing significant growth in this regard, with over 5.2 million clients using digital channels to access their money from anywhere at any time.
The Capitec brand is further differentiated by a personalised, omni-channel client experience that aims to build long-term relationships with our clients. We created 441 new jobs and now employ 13 774 people focused on understanding clients’ needs, and developing or delivering better experiences across our physical and digital service channels.
The industry is experiencing a challenging economic climate in addition to the prospect of new competitors. Our strategy remains to focus on our clients with a combination of digital banking, a branch network, and relevant and insightful communication to help them bank better. This, combined with our ability to adapt to the changing needs of clients, new markets and new technology will remain Capitec’s competitive advantage today and in the future.
Earnings up by 19%Continued growth is testimony to staying true to our fundamentals. Clients trust a solution that they understand, which is reliable and transparent. This focus resulted in an enhanced credit offering and an increase in transactions due to sustained acquisition of banking clients.
Our client base has grown by 15% to 11.4 million clients (2018: 9.9 million). On average 127 000 clients joined us per month this year.
Easy to use and always in controlOur marketing and pricing strategy promotes transacting on our self-service solutions (including the banking app, internet banking, USSD (primarily feature phones), in-branch self-service terminals and dual note recyclers (DNRs)) which frees up capacity in branches to ensure that our clients receive more personalised service. We therefore give our clients the freedom to decide whether they want to go to a branch or whether to do their banking at the time and place that suits them.
Self-service terminal and DNR transactions have increased in volume by 111% to 18 million and 55% to 29 million respectively at the end of February 2019. Net transaction fee income grew by 26%. Clients continue to move from cash to card with 62% of value spent on card (February 2018: 59%).
The security of our clients’ money and personal information is important to us and was considered in the design of our banking app. Over 2.2 million clients actively use the banking app to make payments, buy prepaid or manage their accounts on a daily basis. The volume of banking app transactions has increased by 75% to 343 million for the financial year (February 2018: 196 million). The app provides a simple, personalised user experience. We cover the cost of the data when our clients make use of the app.
Improved processes and advanced technology increased efficiency and allowed us to make digital banking more affordable by lowering our fees. On 1 March 2019, transaction fees for payments made via the banking app, internet banking or USSD were reduced from R1.60 to R1.00 and the monthly administration fee of our Global One account was reduced from R5.80 to R5.00. By taking all the digital banking fees and the monthly administration fee into consideration, we are putting R360 million back into our clients’ pockets. To balance this, we increased the cost of cash withdrawal fees at ATMs for amounts over R1 000. The risk of cash handling in South Africa has increased significantly over the last few years. As an alternative, real-time clearance is a simple solution for clients to facilitate immediate payment on our banking app and internet banking. This is much safer than carrying cash around. We are leading the industry by having reduced the real-time payment fees to the other banks from R10.00 to R8.00.
Trust in our brandRetail deposits increased by 23% to R71 billion. Clients currently earn a minimum of 5% interest per year on any positive balance on their debit or credit cards. During the 2019 financial year we paid out R3.9 billion in interest on retail call, fixed deposits and credit card accounts.
6 | Capitec Bank Holdings Limited
chairman’s andCEO’s report
Key performance indicators
Leadership reviews
The Capitec Way
Our business context
Our strategic goals and insights
Leadership teams and governance oversight

Wholesale funding decreased by 18% from R6.2 billion to R5.1 billion during 2019. The funding requirement of the loan book is met by retail fixed deposits, retained earnings and wholesale funding.
One funeral plan, more coverWe identified a need for a client-centric, affordable funeral plan.
The value proposition from a pricing, benefit and service experience perspective has contributed to the market acceptance of the offering. The Capitec funeral plan has benefits such as the waiver of the waiting period if transferring existing risk cover from a registered insurer, and a new-born premium waiver benefit that celebrates additions to clients’ families at no cost for up to 6 months while still enjoying cover and peace of mind.
The plan is transparent, easy to understand and is available via our 840 branches and on the banking app. 80% of the policies to date were issued in the branch. This is further evidence of how important our branch network remains to best serve clients. At financial year-end more than 360 000 policies were active. We are pleased that we could expand on our Bank Better, Live Better principle with the Capitec funeral plan, and help our clients to manage their broader financial needs.
Credit for the right reasonsWhen clients understand credit, they use it responsibly. This assists them in reaching their financial goals.
We encourage our clients to match the term of the loan that they take to the purpose for which they require the loan. Consequently, 56% of the value of loans were at shorter terms or lower values, compared to what the client qualified for.
We have also initiated a debt alleviation program to assist clients that have experienced a loss of income outside of their control.
Extension of creditThe effect of credit optimisation strategies resulted in a decrease in the shorter term credit products and increase in longer term loans. Against the background of a lacklustre economy, and increased credit risk-taking in the unsecured credit market, we introduced further granting restrictions. We curbed granting to clients who exhibited tendencies to frequently borrow the maximum amount on offer and we built on our prudent approach applied in affordability assessments by increasing our minimum living expenses threshold. Notwithstanding this, we grew and optimised our book through a focus on client quality
and protecting the book from clients prone to go under debt review.
It is our strategy to drive the price of unsecured lending lower. Those clients with positive credit behaviour receive our best interest rates and we have a lower return on equity target for these clients. The average interest rate charged for this group was 17.5% compared to the book average of 24%. Our unsecured lending rates go as low as 12.9% and we charge credit insurance on the actual amount of outstanding debt and not on the original amount advanced. This differentiates the Capitec credit protection plan in the market.
Our credit card offer has been well-received by the market, with a monthly fee that remained unchanged at R35 and an interest rate as low as prime. With an average of 14 000 new credit card clients per month, disbursements increased by 57% to R6.2 billion. At 28 February 2019, the gross credit card book was R3.6 billion and comprises approximately 3% of the total South African retail credit card market.
Loan revenueWe implemented International Financial Reporting Standards (IFRS) 9, the revised accounting standard for financial instruments, on 1 March 2018. Under IFRS 9, once a loan rolls into stage 3 (non-performing book), the interest recognised on the loan is netted after deducting the related provision. This net interest recognition decreased total interest received on loans and the related net credit impairment charge by R1.1 billion for the current year. This aspect of the change has no impact on the overall profit, but results in increasing the cost-to-income ratio.
Loan book, impairments and bad debts written offThe loan book performed well with a strict credit extension policy applied. The total net loans and advances include 87% of up-to-date loans (1 March 2018: 84%). Loans up to 3 months in arrears decreased by 8%. From 1 March 2018, under IFRS 9, up-to-date with a significant increase in credit risk (SICR) and total up-to-date that rescheduled (not yet rehabilitated) decreased 14% and 10% respectively.
At 28 February 2018, under IAS 39, the previous accounting standard, loans and advances were written off at the earlier of when they were more than 3 months in arrears or had a legal status. Under IFRS 9, loans can only be written off when there is no reasonable expectation of recovery. We consider this point to be when a loan has a present value of future recovery of less than 5%.
Integrated Annual Report 2019 | 7
Risk management report
Remuneration report
Social responsibility
About this report
Appendices Annual financial statements

A large portion of loans more than 3 months in arrears have therefore not yet been handed over or written off due to the change in write-off policy. This has resulted in a build-up of loans on the balance sheet that are more than 3 months in arrears, with an appropriate provision. Previously these loans were written off.
After transition to IFRS 9 our focus on maximising collections continues. We utilise a combination of cutting edge machine learning and regression score card techniques to complement our years of operational experience in this environment.
No receivable is recognised post write-off for any possible recoveries and any amount received post write-off will
be recognised as a bad debt recovered. The expected recoveries receivable on 1 March 2018 (R906 million) represented the net present value of expected future recoveries on loans that were written off previously under IAS 39 (the receivable). Under IFRS 9, no future expected receivable is recognised post write-off. As a result, the receivable was run-down in the current period and bad debts recovered were reduced by R906 million.
The table below represents the appropriate change in write-off, related movement in credit impairment and bad debts recovered under IFRS 9 compared to the prior period under IAS 39.
Credit impairment charge 2019 2018Change %2019/2018
Bad debts written off R’m 1 268 6 662 (81)
Movement in credit impairment* R’m 3 649 (102)
Gross credit impairment charge* R’m 4 917 6 560 (25)
Bad debts recovered R’m (467) (1 280) (64)
Net credit impairment charge* R’m 4 450 5 280 (16)
* In the current period, under IFRS 9, the credit impairment charge is recognised on a net basis for all loans classified as stage 3, reducing interest and bad debt written off by R1 073 million for the year ended February 2019.
The coverage of 109% for the total provision for credit impairment to stage 3 (excluding expected recoveries receivables) and stage 2 (up to 1 month in arrears) reflects that our provisioning methodology remains conservative.
TaxInsurance income and funeral income is received from the related cell captives as a dividend after tax. In the current year, the tax attributable to the profits on cell captives was deducted from the net insurance income and funeral income and excluded from the tax expense line. This has resulted in the effective tax rate, as disclosed, decreasing to 25.2% for the current year. Together with the tax paid in the cell captives, the effective tax rate for the bank remains approximately 28%.
Credit ratingsS&P Global Ratings affirmed Capitec Bank’s ratings on 22 November 2018 with a stable outlook. We have a global long-term rating of BB and a short-term global rating of B. The South African long-term national scale
rating is zaAA and the short-term rating is zaA-1+. Our global long-term rating is the same as the sovereign rating, as well as those of other large South African banks.
Strong capital levels and healthy liquidityWe have sufficient capital to meet our growth requirements. At 28 February 2019 the capital adequacy ratio (CAR) was 33.9%.
The IFRS 9 transition after applying the phase-in resulted in a 0.5% decrease in the CAR based on the current year’s capital and risk-weighted assets.
IFRS 16, that relates to leases, with an implementation date of 1 March 2019, will result in an estimated reduction of 1.3% to 1.5% in the CAR, for which no phase-in period is applicable. IFRS 16 brings operating leases onto the balance sheet as right-of-use assets with a corresponding liability.
We are awaiting regulatory approval for the acquisition of Mercantile Bank Holdings Limited. The transaction will
8 | Capitec Bank Holdings Limited
Key performance indicators
Leadership reviews
The Capitec Way
Our business context
Our strategic goals and insights
Leadership teams and governance oversight

be funded out of cash reserves and no additional equity will be required. The impact of this acquisition on our CAR can be met by the reallocation of assets in the investment portfolio.
Investing in growth and efficiencyOperating expenses increased by 18%, in line with earnings growth. The increase was driven by information technology, security costs, an increase in employees in the digital and credit value streams, new product offerings and salary incentives due to the 57% share price increase. We are building a new head office which we expect to be completed in 2020. The new building will increase operational efficiencies and collaboration between the business units that are currently distributed across a number of buildings.
We are implementing a new SAP general ledger, human resources and procurement system to establish high-performance support services capability, efficiencies and to assist in increasing throughput.
ProspectsOur continued investment in new payment solutions, digital development and advanced data and analytics will allow us to offer retail clients easier ways to bank and more personalised credit offers.
We regard the acquisition of Mercantile Bank Holdings Limited as a strategic move to accelerate the development of a unique business banking offer for our clients.
Changes in board compositionOn 28 November 2018, Daniel Petrus Meintjes was appointed as an independent non-executive director. He has comprehensive business experience and insight. We welcome him to the board.
Nonhlanhla Mjoli-Mncube will retire from the board effective 31 May 2019. We thank her for her 15 years’ dedicated service to the group.
DividendThe directors declared a final gross dividend of 1 120 cents per ordinary share (February 2018: 945 cents per ordinary share) on 27 March 2019, bringing the total dividends for the 2019 financial year to 1 750 cents per share (February 2018: 1 470 cents per share). There are 115 626 991 ordinary shares in issue.
The final dividend meets the definition of a dividend in terms of the Income Tax Act (Act 58 of 1962). The dividend amount, net of South African dividend tax of 20%, is 896 cents per share. The distribution is made from income reserves. Capitec’s tax reference number is 9405376840.
Last day to trade cum dividend Monday, 15 April 2019
Trading ex-dividend commences Tuesday, 16 April 2019
Record date Thursday, 18 April 2019
Payment date Tuesday, 23 April 2019
Share certificates may not be dematerialised or rematerialised from Tuesday, 16 April 2019 to Thursday, 18 April 2019, both days inclusive.
The chief financial officer’s review is available at www.capitecbank.co.za.
On behalf of the board
Riaan Stassen Gerrie FourieChairman Chief executive officer
Stellenbosch28 March 2019
Integrated Annual Report 2019 | 9
Risk management report
Remuneration report
Social responsibility
About this report
Appendices Annual financial statements

Headline earnings growth of 19%The growth in headline earnings was driven by strong client acquisition which led to higher transactional volumes combined with enhanced credit management in a very competitive market. This complemented our focus to stay true to our fundamentals of a personal experience that is simple, affordable and accessible to all clients.
A total dividend of 1 750 cents (2018: 1 470 cents) was declared for the year. The dividend cover was maintained at 2.6 times to provide us with the opportunity to grow, improve and innovate in the future.
The compound annual growth rates (CAGR) are as follows:
%
Since listing in 2002
%
Last 10 years
%
Last 5 years
%
Last 3 years
%Last year
%
Headline earnings 32 33 21 18 19
Headline earnings per share 27 29 21 18 19
Dividend per share 27 29 21 18 19
Share price 51 46 48 40 57
The year under reviewOur ability to serve millions of clients and address their financial needs through our Global One solution remained one of the key underlying factors in delivering the results.
Highlights of the 2019 financial year:• The trust in our brand was tested in January 2018 with
the allegations published by a short seller. This impacted our share price and deposit book at the time and both recovered and grew due to us remaining transparent in everything we do and addressing all allegations timeously and effectively in the market.
• On 1 March 2018, we successfully implemented International Financial Reporting Standard (IFRS) 9: Financial Instruments. For a detailed overview of our transition to IFRS 9, please refer to our transitional report, which is available on our website at https://resources.capitecbank.co.za/Capitec_-_IFRS9_transitional_report.pdf.
• The Capitec funeral cover product was launched on 21 May 2018 and we are pleased with the market acceptance to date.
• During the financial year we invested a further R180 million and increased our shareholding in Cream Finance Holdings Limited (Creamfinance) to 40.25%. The investment provides Capitec with the opportunity to learn more about the behavioural trends, regulators and legislation in the foreign market and gain insight into the development of foreign online consumer credit markets.
• On 22 November 2018, we announced that our bid to acquire Mercantile Bank Holdings Limited was successful. The acquisition price is R3.2 billion and will be adjusted by any change in the net asset value from 30 April 2019 to the completion date of the transaction, when all conditions have been met.
• For the month of January 2019 we experienced the largest uptake of clients in our history and our active client base now exceeds 11 million. For us, this is a confirmation that we are delivering a client-centric solution.
We strongly believe that the commitment to our clients, the Capitec team and the delivery of our simple solutions have cemented a foundation for us to improve, grow and diversify further with the vision of remaining relevant and sustainable.
10 | Capitec Bank Holdings Limited
CFOreport
Key performance indicators
Leadership reviews
The Capitec Way
Our business context
Our strategic goals and insights
Leadership teams and governance oversight

SaveFunding The debt-to-equity ratio increased slightly from 3.5:1 to 3.6:1 in 2019 due to continued strong growth in retail deposits. Total deposit funding increased by R12 billion to R76 billion.
Total retail deposits increased by 23% to R71 billion (2018: R58 billion). Retail call deposits and retail fixed deposits grew by 29% and 14% respectively. The strong growth in retail deposits was driven by the 15% growth in clients and is a true reflection of our clients’ trust in our brand. The average maturity of retail fixed deposits was 16.9 months at February 2019 (2018: 18.1 months).
Wholesale funding (institutional bond and other funding) declined by 18% to R5 billion in 2019. Wholesale funding was deliberately managed lower due to the loan book growth, compared to strong retail fixed deposits and earnings growth.
To retain our presence in the debt capital market, we auctioned R500 million in bonds in May 2018 that were 3.6 times over-subscribed. Due to the strong investor appetite for wholesale funding, we will consider a further issuance during the 2020 financial year.
The weighted average maturity of wholesale funding was 14.9 months at February 2019 (2018: 19.7 months).
LiquidityThe approach to liquidity risk remains conservative. The management of liquidity takes preference over the optimisation of profits. This conservative approach results in the inherent compliance with the Basel 3 liquidity coverage ratio (LCR) and the net stable funding ratio (NSFR).
Compliance with the LCR was required from 1 January 2015, with a minimum required ratio of 60%, increasing to 100% by 2019. Our LCR exceeded these minimums with a ratio of 1 450% (2018: 1 878%). Compliance with a NSFR of 100% was required from 2018 onwards. Our NSFR is 196% (2018: 206%).
To reduce liquidity risk, call deposits are only allowed to fund cash flows shorter than 6 months. The surplus funds compared to operational requirements are R44.3 billion (2018: R34.7 billion) and are invested in low risk, liquid, interest-bearing instruments.
The weighted average remaining maturity of the investment portfolio at 28 February 2019 was 77 days (28 February 2018: 76 days). None of the longer-term investments have an original contractual maturity of longer than one year which assists in the management of interest rate risk.
201920182017201620152014
COMPOSITION OF DEPOSITS (R’m)
0.2
14 617
Wholesale deposits Retail fixed savingsRetail call savings
0.3
11 152 10 1547 543 6 206 5 078
14 167
8 984
19 298
10 731
24 152
13 634
30 117
17 922
34 909
22 915
45 141
26 224
Otherunlisted
negotiableinstruments
Listedsenior bonds
Subordinateddebt-listed
bonds
Subordinateddebt-unlisted
bonds
Local andinternational
bi-laterals
WHOLESALE FUNDING BY NATURE (R’m)
2018 2019
100 99
553 509
1 929
1 337
2 738 2 737
886
396
Integrated Annual Report 2019 | 11
Risk management report
Remuneration report
Social responsibility
About this report
Appendices Annual financial statements

Credit ratings Capitec Bank is rated by S&P Global Ratings (S&P). The ratings were affirmed on 22 November 2018:
Global – “BB” long-term rating – “B” short-term rating
National – “zaAA” long-term rating – “zaA-1+” short-term rating
The global scale long-term ratings carry a stable outlook.
Capital Capitec remains well capitalised with a capital adequacy ratio (CAR) of 33.9% (2018: 35.7%) and a core equity ratio (CET1) of 32.8% (2018: 33.9%). The bank continues to meet all prudential requirements.
Preference shares and subordinated debt instruments are subject to the applicable phase-out rules in terms of Basel 3. Non-qualifying perpetual preference shares amounting to R31 million and subordinated debt amounting to R619 million were redeemed during the financial year.
The IFRS 9 transition after applying the phase-in resulted in 0.5% decrease in the CAR ratio based on the current year’s capital and risk weighted assets.
The implementation of IFRS 16 from 1 March 2019 will have an estimated impact of between 1.3% and 1.5% on the CAR ratio, which is not subject to phase-in.
InsureWe are pleased with the market uptake of the Capitec funeral cover plan. The cover plan is a simple contract, and one that Capitec can leverage through branches or the app using existing infrastructure and systems. At financial year end more than 360 000 policies were active.
The funeral income recognised on the income statement is received from the cell captive as a dividend after tax, subject to our profit share agreement. Funeral income includes the tax expense, commission fee earned from the cell captive as well as planned and experienced profits after claims paid.
Similar to all other solutions we offer, the funeral product is priced to achieve a desired return on equity while at the same time delivering real value to clients.
Our mobile app functionality for buying and maintaining a funeral plan was an industry first when it launched. Clients who purchase cover via our remote app experience further savings on their premiums.
We are excited about the value the Capitec funeral cover plan creates, as we seek to diversify our income stream.
YTD CHANGE IN CAR%
35.7%
9.2%
(3.2%)
0.5%
(0.5%)(0.5%)
(1.2%)(0.9%)
(1.5%)
(3.7%)33.9%
February2019
Cash andother
investments
Bookgrowth RWA
Operational risk
Other riskweighted assets
IFRS 9transitionphase in
Non-qualifyingprefs andsub debt
Dividendsreserving
Dividendspaid
Annual profit2019
February2018
12 | Capitec Bank Holdings Limited
Key performance indicators
Leadership reviews
The Capitec Way
Our business context
Our strategic goals and insights
Leadership teams and governance oversight

Transact Net transaction fee income grew by 26% to R6 464 billion in the 2019 financial year. The net transaction fee income to net income ratio increased to 44% (2018: 41%), while the net transaction fee income to operating expenses ratio increased to 86% (2018: 81%).
By 2022 we want to cover 100% of our operating expenses through our transactional income.
We continue to focus on growing our quality banking clients, whom we define as those clients who have a stable inflow into their account and stable product usage over a consecutive 3-month period. Quality banking clients have increased by 16% in 2019.
Over 2.2 million clients actively use the banking app. In addition to the mobile app, we still offer Unstructured Supplementary Service Data (“USSD”) services which enables us to make our financial solutions available to wider group of clients.
Our net transaction fee income from our digital channels (banking app and USSD) have increased by 47% from R494 million to R723 million.
We do however, acknowledge that not every client has the ability or the desire to access their financial services via digital channels. To ensure we remain accessible to all, we value our branch network that increased to 840 this year (2018: 826). The net transaction fee income from branch related transactions have increased by 15% to R1 387 million and contributes to 21% of the total net transaction fee income.
Investment in self-service banking innovation remains an integral part of our strategy to help our clients to effectively manage their own financial lives and remain in control of their money.
Our self-service banking (mobile app, internet banking, self-service terminals, Dual Note Recycler (“DNR”) and USSD) channels have continued to improve in line with our current strategic objective. The net transaction fee income relating to these channels have increased by 52%.
Self-service terminals and DNRs at the branches save clients’ time and money and creates capacity for consultants to better serve clients. Self-service terminal transactions increased by 111% to 17.5 million (2018: 8.3 million) and DNR transactions increased by 55% to 29.0 million (2018: 18.7 million).
2019201820172016
NET TRANSACTION FEE INCOME (R’m)
Net transaction fee income
Net transaction fee income to operating expenses coverage
Net transaction fee income % of net income
3 020
66%
33%37%
41%44%
72%
81%
86%
3 923
6 464
5 127
2019201820172016
SELF SERVICE BANKING (R’m)
Internet Cellphone banking appGrowth year-on-year
USSDSelf service terminal DNR
91%
68%
52%
Integrated Annual Report 2019 | 13
Risk management report
Remuneration report
Social responsibility
About this report
Appendices Annual financial statements

Credit The fierce competition and economic conditions impacted the unsecured market during 2019. However, our ability to continuously enhance our granting strategy resulted in an improved credit book and client composition.
We analyse the financial health of our clients and monitor and identify trends within the market to continuously enhance our granting strategy. Our strong growth of Global One clients further aids our analyses and gives us a competitive edge.
Loan granting strategyThe reason why clients approach credit providers for credit is that they have specific requirements. These requirements include the need for emergency cash, education, second-hand vehicles, and housing.
In order to execute on this solution, we incorporate a comprehensive assessment of the client’s behaviour, affordability and source of income. For the assessment, we use information from the credit bureau, bank statements and payslips. We apply 2 parallel disposable income calculations i.e. the NCA affordability assessment regulations calculation, and our own disposable income calculation that maintains conservative buffers. We then apply the most stringent of the 2. Branch staff have no credit granting discretion and all exceptions are managed and monitored by a centralised specialist team.
During the loan application process, we present the maximum loan amount, maximum term and maximum instalment to the client. Within these constraints, the client may select any combination that best suits him or her. We encourage clients to take up credit for shorter periods of time and for smaller amounts. This is done through a pricing model that discounts the interest rate in instances where clients select a term that is shorter than the maximum for which they qualify. This is due to the manner in which the pricing for risk model reacts to the lower default rates for such clients.
When existing clients apply for further credit, we conduct a full credit assessment. If a client qualifies for further credit, it can be extended as a further agreement in addition to the current credit; or the client can have the existing credit consolidated into a new credit agreement. This is only available to clients if instalments are up-to-date on all Capitec loans and to clients who have a satisfactory credit risk.
Our scoring models react to instances where a client repeatedly takes up credit, and when their debt-to-income ratio becomes too high. In such instances we limit the term and amount of credit offered to clients or we decline the application for credit.
Acquisition and retention strategies are built on the principles of the client’s credit behaviour (willingness to pay), affordability and source of income. Rehabilitation strategies are need-driven to assist clients based on their unique circumstances.
Unforeseen circumstances may lead to reduced income or increased expenditure for the client. These circumstances may include:• employers that reduce overtime and bonuses or place
staff on short pay due to difficult economic conditions;• strikes;• clients may be forced to change employment at reduced
salaries due to poor performance or health problems; or• financial problems faced by employers.
These instances may result in a client missing an instalment on a loan and being in arrears.
If the client is in arrears due to challenges regarding the client’s inability to repay the debt, we either negotiate with the client to immediately bring the arrears instalments up to date, or we attempt to help and manage the situation through agreeing a course of action with the client by amending the loan agreement (loan reschedule).
The first solution is preferable, as it:• reduces arrears if the client pays on the same date;• improves our cash flow;• helps restore the client to a creditworthy position; and• limits the overall cost of credit for clients.
We have extensive history that measures the yields we can receive by handing clients over to external debt collectors. We monitor the cash flow yields that we receive from this process against internal collection processes, including rescheduling. We optimise the strategy for different client groups and use handover samples for each strategy to monitor the relative performance and validate the strategy for each client group.
14 | Capitec Bank Holdings Limited
Key performance indicators
Leadership reviews
The Capitec Way
Our business context
Our strategic goals and insights
Leadership teams and governance oversight

Factors that we consider in delivering the optimal strategy for a client include:• the risk profile and payment history of the client;• the arrears status of the client;• whether the client was rescheduled previously;• the credit exposure amount;• free cash flow estimates derived from clients’ bank
accounts or credit bureau records (salary less debit orders); and
• any information we have about the client’s employer.
Depending on a combination of factors, the optimal strategy is to encourage clients with some free cash flow or limited credit exposure to bring arrear instalments up to date; or assist clients that have cash flow difficulty but have good behaviour history, to reduce their instalments and extend the term of the credit agreement (i.e. reschedule). When there is a clear temporary interruption of income such as a strike or a client is on maternity leave, we may allow a reduced instalment for a short period (typically 3 months) with subsequent increased instalments, in order to assist the client through this period (i.e. variable reschedule).
We use system-based rules to limit instances where we allow rescheduling. The rules engine determines whether clients are eligible for rescheduling as well as the maximum term for which the loan can be extended. We do not reschedule all loans that meet our criteria, as this depends on the individual circumstances of each client applying to reschedule.
We monitor the performance and cure rate of reschedules using a segmented approach to ensure that it remains within the bank’s risk appetite. This process allows us to optimise collections and reduce clients’ debt levels. Our aim is always to partner with our clients through both good and tough times and act in their best interest.
Loan sales
Term loanWe achieved loan sales (new credit granted) of R24.8 billion this year (2018: R24.3 billion) although the number of loans granted during the year decreased to 1.8 million from 2.2 million.
Loan sales do not include any rescheduled loans. Rescheduling is an amendment to an existing loan contract with no credit granted. No initiation fees are charged on rescheduled loans.
Loan sales in the 61 to 84 months category increased by 11% in 2019, driven by the strategic focus on higher income earning clients, improving the performance of the credit book.
The average credit granted of total term loans granted increased from R10 934 to R14 145.
In the 13 to 36 month category we experienced a 20% increase of R1.3 billion in 2019. The increase was due to the increase in loans where clients decided to take shorter term loans at lower interest rates than the full loan for which they qualify. These results align with our strategy to support clients to take credit for the right reasons and periods.
The average credit granted greater than 6 months increased from R32 133 to R35 332.
We report the net amount of credit issued and we exclude the consolidation loans from loan sales in this analysis.
Credit cardThe 2019 financial year is the second full year that our credit card has been in operation. By 28 February 2019, approximately 445 000 cards were in issue, with disbursements increasing by 57% to R6.2 billion (28 February 2018: R3.9 billion).
In each month that a credit card is utilised, 1 loan is counted towards the number of loans and advances granted.
The average disbursement amount granted decreased from R2 296 to R1 974 due to a increased number of loans granted at a lower value during the 2019 financial year.
At 28 February 2019, the gross credit card book was R3.6 billion and comprises approximately 3.0% of total South African retail credit card market.
Integrated Annual Report 2019 | 15
Risk management report
Remuneration report
Social responsibility
About this report
Appendices Annual financial statements

Total lending and insurance income (excluding investment income)
Total lending and insurance income reconciliation (R’m) 2019 2018
Change %
Interest income on loans and advances to clients(1) 11 935 12 440 (4%)Loan origination fees 787 776 1%Monthly service fee 931 919 1%Net insurance income(2)(3) 795 873 (9%)
Total lending and insurance income 14 448 15 008 (4%)
Loan fee expense(4) (219) (412) (47%)
Total net lending and insurance income 14 229 14 596 (3%)
(1) In the current year, under IFRS 9, interest income and credit impairment charge are recognised on a net basis for all loans classified as Stage 3 (R1 073 million netting reversal for the year ended February 2019).
(2) Insurance and funeral profit is received from the related cell captives as a dividend after tax. The tax expense on insurance profit is included in net insurance and funeral income for the financial year ended 28 February 2019.
(3) Third-party cell captive net insurance income from 6 May 2016.(4) First-party cell captive insurance expense on loans granted before
6 May 2016 that are still on the credit book.
Total net lending and insurance income decreased by 3% from R14 596 million to R14 229 million. The main drivers behind the decrease in total lending and insurance income are the transition to International Financial Reporting Standard (IFRS) 9: Financial Instruments and the tax effect on insurance income, presented in the table above.
Credit card
1 – 6months
7 – 12months
13 – 36 months
37 – 48 months
49 – 60 months
61 – 84 months
Total
2018 (R’m)
2019 (R’m)
2018 % of total
2019 % of total
28 292
30 968
100
100
3 949
6 193
14.0
20.0
1 833
1 300
6.5
4.2
1 029
1 045
3.6
3.4
1 353
1 379
4.8
4.5
6 312
7 567
22.3
24.4
4 373
4 039
15.5
13.0
3 959
3 334
14.0
10.8
5 484
6 111
19.3
19.7
Credit facility
0
1 000
2 000
3 000
4 000
5 000
6 000
7 000
LOAN SALES BY PRODUCT (R’m)
Interest income on loans and advances, initiation fees and monthly services fees decreased by 4% to R11 935 million (2018: R12 440 million). Under IFRS 9, both interest income and credit impairment charge are recognised on a net basis for loans in stage 3 resulting in a zero profit impact. In addition to the net interest recognition our enhanced granting strategy of shorter term loans at lower interest rates (13 to 36 months) and the increase in longer term lower interest rate loans also resulted in lower interest yields which further contributed to the decrease.
Insurance income is received from the related cell captives as a dividend after tax. In the current period, the tax attributable to the profits from the cell captives of R309 million was deducted from the net insurance income. This has resulted in the 9% decrease to R795 million.
The loan fee expense due to our first-party cell captive structure has decreased by 47% (2018: 36%) in the 2019 financial year. The first-party insurance expense relates to loans issued prior to National Credit Act (“NCA”) amendments on 6 May 2016 and third-party net insurance relates to loans issued after this date. The first-party loan book rolls off over time as amounts are repaid and credit is extended under the third-party cell captive.
16 | Capitec Bank Holdings Limited
Key performance indicators
Leadership reviews
The Capitec Way
Our business context
Our strategic goals and insights
Leadership teams and governance oversight

Net insurance
incomeCreditcard
Creditfacility
1 – 6 months
7 – 12 months
13 – 36 months
2018
2019874 239 179 335 474 2 952 2 758
37 – 48 months
3 280
49 – 60 months
3 917
61 – 84 months
14 596795
Loan feeexpense
(412)(219) 683 93 237 236 2 581 2 575 2 980 4 268 14 229
Total
TOTAL NET LENDING AND INSURANCE INCOME(EXCLUDING INVESTMENT INCOME) (R’m)
-4000
400
1 200
2 000
2 800
3 600
4 400
Application of Expected Credit Losses (ECL) modelFrom 1 March 2018, we transitioned and applied the ECL model in terms of IFRS 9.
ECL is calculated as an unbiased, probability weighted amount which is determined by evaluating the range of reasonably possible outcomes, the time value of money and considering all reasonable and supportable information including that which is forward-looking.
The most significant class of financial asset subject to an ECL is loans and advances. Loans and advances comprise a large number of small, homogeneous assets. We use an ECL provisioning model based on historical roll rates using the Markov chain method.
We stratify the Markov roll rate results into similar groups to ensure results are stable and appropriate to predict future cash flows for clients with similar characteristics. We stratify on the group’s aspects such as client risk groups, time on book, product term, payment frequency (monthly, fortnightly or weekly), default statuses, employment, industry and rescheduling status, and the behaviour score of the client.
Furthermore, the model combines the roll rate matrices with a loan amortisation model on a loan-by-loan basis. The specific features of each loan such as balance, interest rate, fees, remaining term, instalments and arrears status, combined with the roll rates applicable to loans with the same characteristics, estimate the expected cash flow and balance amortisation of the loan. The rolled up results enable us to analyse portfolio and segmented views.
Forward-looking economic assumptions are incorporated into the model where relevant and where they influence credit risk. These assumptions are incorporated using the group’s most likely forecast for a range of macro-economic assumptions. Three forward-looking scenarios are incorporated into the range of reasonably possible outcomes (base case, negative and positive scenarios).
The period over which the ECL is calculated is limited to the maximum contractual period.
The resultant ECL calculation amounts to the excess of the balance of a loan above the present value of its expected cash flows, discounted using the effective interest rate on the financial instrument as calculated at initial recognition (initiation fee plus interest).
The key inputs used for measuring ECL are: • probability of default (PD); • loss given default (LGD); and • exposure at default (EAD).
PD is an estimate of the likelihood of default over a given time horizon. PDs are estimated considering the contractual maturities of exposures and estimated prepayment rates. The estimation is based on current conditions, adjusted to take into account estimates of future conditions that will impact the PD.
The calculation is based on a statistical model that predicts the future repayment performance of clients based on their arrears status, model segment and tenure.
Integrated Annual Report 2019 | 17
Risk management report
Remuneration report
Social responsibility
About this report
Appendices Annual financial statements

Future cash flows and arrears status probabilities are generated from which an expected ECL provision is calculated. The prediction of future repayment is based on observed roll rates over the last 12 months. Roll rates refer to the rates at which clients transition or roll from a repayment status in a given month to a repayment status in the following month.
LGD is an estimate of the loss arising on default. LGD models for unsecured assets consider time of recovery and recovery rates. The calculation is on a discounted cash flow basis.
EAD is an estimate of the exposure at a future default date, taking into account expected changes in the exposure after the reporting date, including repayments of principal and interest, and expected drawdowns on committed facilities.
The EAD is calculated by creating an amortisation structure for each account. This structure includes the expected monthly repayment, as well as the projected monthly cumulative repayment status probabilities and the cash flows associated with every repayment status.
Our modelling approach for EAD reflects expected changes in the balance outstanding over the lifetime of the loan exposure that are permitted by the current contractual terms, such as amortisation profiles, early repayment or overpayment, changes in utilisation of undrawn commitments and credit mitigation actions taken before default. We use EAD models that reflect the characteristics of the portfolios.
The developing and measuring of the group’s processes for measuring ECL, including the monitoring of Significant Increases in Credit Risk (SICR), the incorporation of economic forward-looking information and the methods used to calculate ECL and ensuring that polices and procedures are in place to appropriately maintain and validate models used to measure ECL, are overseen by the group’s credit committee. The internal audit function performs regular audits to ensure that established controls and procedures are both adequately designed and implemented.
IFRS 9’s ECL model requires the classification and measurement of ECL using the general model for loans and advances measured at amortised cost. In essence, the general model is a three stage model. Capitec has interpreted the three stages as being up-to-date (stage 1), up-to-date loans with SICR and loans up to 1 month in arrears (stage 2) and credit impaired (stage 3). Loans and advances within stage 1 are measured based on a 12 month ECL and a lifetime ECL is determined for loans and advances within stage 2 and stage 3.
Stage 1:
The ECL model is applied in terms of IFRS 9 stages as follows:
An ECL is recognised at the time of initial recognition of the financial debt instruments and represents the lifetime cash shortfall arising from possible default events up to 12 months into the future from the balance sheet date.
An ECL continues to be determined on this basis until there is a SICR event or the financial debt instrument becomes credit impaired.
A cash shortfall is the difference between the cash flows that are due in accordance with the contractual terms of the loan and the cash flows that the group expects to receive over the contractual life of the loan.
Loans and advances, up-to-date loans and clients that applied for debt review more than 12 months ago that are currently performing are included in stage 1.
Stage 2:
We monitor loans and advances subject to impairment requirements at each reporting date to determine whether evidence exists that there has been a SICR since initial recognition of the loan and advance.
We identify SICR for clients that are up-to-date on their loans, but who have reached certain behaviour risk thresholds or specific events have occurred that raise a SICR flag in the model. The ECL is extended to a lifetime ECL for these clients.
We consider the following to be a SICR for all loans and advances extended to the client:• A client who has been reported as being unemployed;• A client with a term loan that is up-to-date, but with a
Capitec credit card which is in arrears;• A client with a behaviour score that has decreased below
the internal SICR threshold set by the group; and• A client with an updated granting score below the
internal SICR threshold set by the group.
We consider reasonable and supportable information based on our historical experience, credit risk assessment and forward-looking information (including macro-economic factors) when determining whether the credit risk (i.e. the risk of default) of loans and advances has increased significantly since initial recognition. The ECL framework aligns with our credit granting strategy.
We have set certain behaviour and granting score thresholds which are used to identify SICR.
18 | Capitec Bank Holdings Limited
Key performance indicators
Leadership reviews
The Capitec Way
Our business context
Our strategic goals and insights
Leadership teams and governance oversight

The purpose of the behaviour score in the ECL model is to provide a measure of an existing client’s propensity to default on a loan within 12 months. The score was built on a client level, utilising Capitec loans and savings account information, as well as the credit exposure and repayment behaviour at external credit providers. The behaviour score is updated monthly on all existing loan clients to ensure that Capitec has a consistently updated view of the client.
The updated granting score in the ECL model aims to provide an assessment of SICR on a collective basis for groups of exposure that share similar credit characteristics in order to account for forward-looking information that may not be identified at an individual loan level.
The updated granting view is simply a reinterpretation of the information available at granting date and is not an updated view on the client. Updated client information is incorporated in the behaviour score.
The SICR thresholds are reviewed on an annual basis to ensure that they are able to identify SICR throughout the lifetime of the loan.
The following loans and advances are included in stage 2:• up-to-date loans with a SICR;• loans up to 1 month in arrears and;• clients that applied for debt review between 6 and
12 months ago which are currently performing.
Stage 3 – Credit impaired:
Loans and advances are considered impaired if there is objective evidence of impairment as a result of events that occurred after initial asset recognition (known as loss events). These loss events have an adverse impact on the asset’s estimated future cash flows that can be measured reliably.
We define loans and advances as being ‘credit-impaired’ when one or more events that have a detrimental impact on the estimated future cash flows of the financial asset has occurred. Loans and advances are considered to be credit impaired upon the occurrence of any of the following events:• the client is currently under debt review;• the client is handed over for collection or has a legal
status; • the client is in default. We define default as the point at
which the client is past due on 2 contractual payments, i.e. more than 1 month in arrears;
• clients that applied for debt review less than 6 months ago and are currently performing;
• up-to-date loans rescheduled from up-to-date (not yet rehabilitated); or
• up-to-date loans rescheduled from arrears (not yet rehabilitated).
Interest on loans and advances categorised as stage 3 is recognised in the income statement and balance sheet, net of ECL impairments.
It is a fundamental principle of IFRS 9 that the ECL impairment provision that the group holds against potential future credit losses should not only depend on the health of the economy presently, but should take into account changes to the economic environment in the future.
To capture the effects of changes to the economic environment in the future, the forward-looking model considers economic variables specific to South Africa that directly impact the group’s clients. We utilise the Bureau of Economic Research (BER) macro-economic outlook for the country over a planning horizon of at least 3 years. The outlook is provided to the asset and liability committee (ALCO) for review and approval.
Write-off is a derecognition event:
Following the implementation of IFRS 9, loans and advances are written off when it is has been determined that the reasonable expectation of recovery is less than 5% of gross balance before write-off.
On 1 March 2018, when we transitioned to IFRS 9, we informed the market that we would apply a partial write-off policy. The policy was to immediately write off 20% of all loans rolling into debt review and 70% for accounts handed over or in legal status. The partial write-off was supported by statistical evidence. The write-off point of the remaining balance was then determined by the time since last payment (TSLP) received on a loan. For loans in debt review, the remaining 80% of the loans were written off 16 months TSLP and for loans handed over 6 months TSLP.
Subsequent to transition, we refined and simplified the method to estimate the point of write-off by applying a more scientific method aligned to handover scores. This is now defined as follows:• Loans in debt review: 4 consecutive missed payments
after termination of debt review.• Loans handed over: handover score less than the
predetermined threshold or handover score more than predetermined threshold and 4 consecutive missed payments.
The change in methodology aligns with operations and collections strategies.
Integrated Annual Report 2019 | 19
Risk management report
Remuneration report
Social responsibility
About this report
Appendices Annual financial statements

Credit bookThe following terminology is used when referring to the credit quality of loans and advances to clients:
Loans status 2019 – Description (IFRS 9)
Up-to-date Clients that are fully up to date with their original contractual obligations or amended contractual obligations and rehabilitated post rescheduling, are classified as up-to-date.
Arrears Arrears reflect the outstanding balances, where 1 or more instalments (or part of an instalment on any of the client’s loans and advances) remain unpaid after the contractual payment date, that is 1 day past the contractual payment date. The arrears balance therefore includes rescheduled loans when the amended instalment was not paid in full.
Rescheduling Rescheduling refers to an amendment of the original terms of the loan contract, as formally agreed between the bank and the client. Rescheduling is used as a rehabilitation mechanism for clients in arrears who are contacted successfully by centralised collections. It is also used as a proactive mechanism to assist up-to-date clients who contact the bank when wanting to reschedule their loans due to changes in their circumstances. No initiation fee is charged on a rescheduled loan as no new credit is granted. Rescheduled loans do not form part of loan sales.
Rehabilitated Clients with rescheduled loans are deemed to be rehabilitated once they have made contractual payments for 6 months post rescheduling and are up-to-date with their amended contractual obligations. This is supported by statistical analysis.
Rescheduled from up-to-date not rehabilitated
These are loans and advances relating to clients that were fully up to date with their original contractual obligations, have contacted the bank to reschedule the original terms of their loan due to a change in their circumstances and have made payment under the rescheduled terms. These loans are up-to-date with their amended contractual obligations post rescheduling but have not yet made payments for 6 consecutive months under the amended contract.
Rescheduled from arrears not rehabilitated
These are loans and advances relating to clients that were in arrears and were subsequently rescheduled and have made payment under the rescheduled terms. These clients are up-to- date with their amended contractual obligations but have not yet made payments for six consecutive months under the amended contract.
Application for debt review
Clients that apply for debt review are identified as credit impaired, and the related loan is classified as stage 3 for the first 6 months following application.
Clients that applied for debt review more than 6 months ago that are up-to-date are identified as SICR and the related loan is classified as stage 2 between 6 to 12 months following application.
Clients that applied for debt review more than 12 months ago and remained up-to-date and the related loan is classified as stage 1 subject to the SICR assessment.
Expected recoveries receivable
The expected recoveries receivable under IAS 39 that existed at transition date were transferred to stage 3.
Stage 1 These are loans and advances which are up-to-date with no indication of SICR, clients that applied for debt review more than 12 months ago and remained up to date, as well as loans that have been rescheduled from up-to-date or arrears and have been rehabilitated.
20 | Capitec Bank Holdings Limited
Key performance indicators
Leadership reviews
The Capitec Way
Our business context
Our strategic goals and insights
Leadership teams and governance oversight

Loans status 2019 – Description (IFRS 9)
Stage 2 These are loans and advances that have raised a SICR flag due to:• unemployment;• behaviour score below the threshold;• granting score below the threshold; or• a client that has a term loan that is up-to-date but has a credit card in arrears.
Stage 2 also includes loans that are up to 1 month in arrears, as well as clients that applied for debt review between 6 to 12 months ago, but who are performing.
Stage 3 These are loans and advances that are more than 1 month in arrears or:• have been rescheduled but not yet rehabilitated;• where the client has applied for debt review less than 6 months ago and are currently performing;• is currently under debt review; or• has another legal status (among others, under administration).
Write-off Loans are written off when there is no reasonable expectation of recovery. This point is defined as a loan with a present value future recovery of less than 5% of the gross balance before write-off.
Integrated Annual Report 2019 | 21
Risk management report
Remuneration report
Social responsibility
About this report
Appendices Annual financial statements

Analysis of net loans and advances by status – 28 February 2019 (IFRS 9)
Stage 1 Stage 2 Stage 3
R’mUp-to-
date
Up-to-date loans and advances with SICR
and applied
for debt review
>6 months
Up to 1 month
in arrears
2 and 3 months
in arrears
Re-scheduled
fromup-to-date (not yet re-habilitated)
Re-scheduled
from arrears
(not yet re-habilitated)
More than 3 months
in arrears, legal
statuses and
applied for debt
review <6 months(1)(2)
Expected recoveries receivable Total
Balance at 28 February 2019
Gross loans and advances 41 587 3 765 1 087 1 389 856 1 272 4 923 – 54 879
Cumulative provision (2 671) (771) (582) (1 097) (345) (534) (4 364) – (10 364)
Net loans and advances 38 916 2 994 505 292 511 738 559 – 44 515
ECL coverage % 6.4 20.5 53.5 79.0 40.3 42.0 88.6 – 18.9
% of total gross loans and
advances 75.8 6.9 2.0 2.5 1.6 2.3 8.9 –
(1) Includes loans that are currently up to 1 month in arrears that were previously rescheduled but have not been rehabilitated.(2) In the transition report application for debt review within 6 months and arrears – 2 and 3 months in arrears were aggregated.
Analysis of net loans and advances by status – 1 March 2018 (IFRS 9)
Stage 1 Stage 2 Stage 3
R’mUp-to-
date
Up-to-date loans and advances with SICR
and applied for debt
review >6 months
Up to 1 month
in arrears
2 and 3 months
in arrears
Re-scheduled
fromup-to-date (not yet re-habilitated)
Re-scheduled
from arrears
(not yet re-habilitated)
More than 3 months
in arrears, legal
statuses and applied
for debt review
<6 months(1)(2)
Expected recoveries receivable Total
Balance at 1 March 2018
Gross loans and advances 37 165 4 401 1 003 1 697 1 085 1 277 108 906 47 642
Cumulative provision (2 675) (1 033) (558) (1 311) (462) (609) (67) – (6 715)
Net loans and advances 34 490 3 368 445 386 623 668 41 906 40 927
ECL coverage % 7.2 23.5 55.6 77.3 42.6 47.7 62.0 – 14.1
% of total gross loans and
advances 78.0 9.2 2.1 3.6 2.3 2.7 0.1 2.0
(1) Includes loans that are currently up to 1 month in arrears that were previously rescheduled but have not been rehabilitated.(2) In the transition report application for debt review within 6 months and arrears – 2 and 3 months in arrears were aggregated.
22 | Capitec Bank Holdings Limited
Key performance indicators
Leadership reviews
The Capitec Way
Our business context
Our strategic goals and insights
Leadership teams and governance oversight

The most significant impact of IFRS 9 is the change in write-off policy, which changed the composition of the loan book and provision. Previously, loan balances were written off at the earlier of having a legal status, e.g. debt review, deceased or handed over, or being 3 months or more in arrears. An expected recovery receivable was raised on the loans written off.
Under IFRS 9, loans and advances are written off when it has been determined that no reasonable expectation of recovery exists. We consider this point to be when a loan has a present value future recovery less than 5% of the gross balance before write-off.
The consequence of the new write-off policy is that loan balances that were previously written off under the old write-off policy are now kept on book longer.
The stage 1 up-to-date book increased by 12% compared to 1 March 2018 while up-to-date loans with SICR decreased by 14% from R4.4 billion to R3.8 billion.
Loans up to 3 months in arrears can be compared to the prior year under IAS 39. At year end, loans up to 3 months in arrears decreased by 8%.
Loans more than 3 months in arrears increased to R4.9 billion with a related credit impairment of R4.4 billion (89% provision coverage) being on book as at 28 February 2019.
The total up-to-date loans rescheduled from up-to-date and arrears (not yet rehabilitated) decreased by 10%. The decrease is a direct result of enhancements made on rescheduling strategies.
Clients that have applied for debt review within the last 6 months decreased by 35% from 1 March 2018. Clients under debt review, clients more than 3 months in arrears and legal status are included in stage 3.
The net loans and advances in stage 1 as a percentage of total net loans and advances improved to 87% (1 March 2018: 84% ). The quality and performance of the book is well aligned with our enhanced credit strategy.
The expected recoveries receivable (R906 million) on 1 March 2018 represent the net present value of expected future recoveries on loans that were written off in full previously under IAS 39 (the receivable). Under IFRS 9, no future expected receivable is recognised post write-off. The receivable was settled in the current period and bad debts recovered reduced by R906 million.
Our provisioning methodology remains conservative. The coverage ratio for all stage 3 loans (excluding expected recoveries receivable) and stage 2 (up to 1 month in arrears) is 109% (1 March 2018: 130%).
28 February 20191 March 2018
Stage 3 Provision for doubtful debts
Stage 2 (Up to one month in arrears)
4 167
6 715
4 401
1 003
3 765
8 440
1 087 10 364
The table below illustrates the appropriate change in write-off, related movement in credit impairment and bad debts recovered under IFRS 9 compared to the prior period under IAS 39.
Net provision for credit impairment charge (R’m) 2019 2018
Change %
Bad debts written off 1 268 6 662 (81)
Movement in credit impairment 3 649 (102)
Gross provision of credit impairment
charge 4 917 6 560 (25)
Bad debts recovered (467) (1 280) (64)
Net provision for credit impairment
charge 4 450 5 280 (16)
Under IFRS 9, the credit impairment charge is recognised on a net basis for all loans in stage 3.
Integrated Annual Report 2019 | 23
Risk management report
Remuneration report
Social responsibility
About this report
Appendices Annual financial statements

0%
2%
4%
6%
8%
12%
10%
M0
M2
M4
M6
M8
M10
M12
M14
M16
M18
M20
M22
M24
M26
M28
M30
M32
M34
M36
M38
M40
M42
M44
FY2016Qtr.1
FY2016Qtr.2
FY2016Qtr.3
FY2016Qtr.4
FY2017Qtr.1
FY2017Qtr.2
FY2017Qtr.3
FY2017Qtr.4
FY2018Qtr.1
FY2018Qtr.2
FY2018Qtr.3
FY2018Qtr.4
FY2019Qtr.1
FY2019Qtr.2
FY2019Qtr.3
FY2019Qtr.4
7 – 12-MONTH LOANS (FINANCIAL YEAR QUARTERLY VIEW)
M0
M2
M4
M6
M8
M10
M12
M14
M16
M18
M20
M22
M24
M26
M28
M30
M32
M34
M36
M38
M40
M42
M44
0%
2%
4%
6%
10%
14%
13 – 36-MONTH LOANS (FINANCIAL YEAR QUARTERLY VIEW)
8%
12%
FY2016Qtr.1
FY2016Qtr.2
FY2016Qtr.3
FY2016Qtr.4
FY2017Qtr.1
FY2017Qtr.2
FY2017Qtr.3
FY2017Qtr.4
FY2018Qtr.1
FY2018Qtr.2
FY2018Qtr.3
FY2018Qtr.4
FY2019Qtr.1
FY2019Qtr.2
FY2019Qtr.3
FY2019Qtr.4
Vintage graphsWe grant credit on risk-based pricing that includes the probability that a client may default on payments. Default in the graphs below, is defined as the client being more than 90 days in arrears, legally handed over to external debt collectors or under debt review.
The vintage graphs below express the balance at risk at the time a loan goes into arrears as a percentage of the total original instalments (capital, interest, initiation fees,
monthly fees and insurance) expected for loans granted in a given quarter. The vintage graphs reflect our expectation of clients defaulting on payments and our ability to appropriately adapt pricing in specific loan categories to match our granting strategy and risk appetite.
Vintage graphs are tracked monthly against price risk targets which ensures that our risk appetite is not exceeded.
24 | Capitec Bank Holdings Limited
Key performance indicators
Leadership reviews
The Capitec Way
Our business context
Our strategic goals and insights
Leadership teams and governance oversight

M0
M2
M4
M6
M8
M10
M12
M14
M16
M18
M20
M22
M24
M26
M28
M30
M32
M34
M36
M38
M40
M42
M44
0%
2%
4%
6%
10%
14%
37 – 48-MONTH LOANS (FINANCIAL YEAR QUARTERLY VIEW)
8%
12%
FY2016Qtr.1
FY2016Qtr.2
FY2016Qtr.3
FY2016Qtr.4
FY2017Qtr.1
FY2017Qtr.2
FY2017Qtr.3
FY2017Qtr.4
FY2018Qtr.1
FY2018Qtr.2
FY2018Qtr.3
FY2018Qtr.4
FY2019Qtr.1
FY2019Qtr.2
FY2019Qtr.3
FY2019Qtr.4
M0
M2
M4
M6
M8
M10
M12
M14
M16
M18
M20
M22
M24
M26
M28
M30
M32
M34
M36
M38
M40
M42
M44
0%
2%
4%
6%
8%
12%
10%
49 – 60-MONTH LOANS (FINANCIAL YEAR QUARTERLY VIEW) FY2016Qtr.1
FY2016Qtr.2
FY2016Qtr.3
FY2016Qtr.4
FY2017Qtr.1
FY2017Qtr.2
FY2017Qtr.3
FY2017Qtr.4
FY2018Qtr.1
FY2018Qtr.2
FY2018Qtr.3
FY2018Qtr.4
FY2019Qtr.1
FY2019Qtr.2
FY2019Qtr.3
FY2019Qtr.4
M0
M2
M4
M6
M8
M10
M12
M14
M16
M18
M20
M22
M24
M26
M28
M30
M32
M34
M36
M38
M40
M42
M44
0%
1%
2%
3%
4%
6%
8%
5%
61 – 84-MONTH LOANS (FINANCIAL YEAR QUARTERLY VIEW)
7%
FY2016Qtr.1
FY2016Qtr.2
FY2016Qtr.3
FY2016Qtr.4
FY2017Qtr.1
FY2017Qtr.2
FY2017Qtr.3
FY2017Qtr.4
FY2018Qtr.1
FY2018Qtr.2
FY2018Qtr.3
FY2018Qtr.4
FY2019Qtr.1
FY2019Qtr.2
FY2019Qtr.3
FY2019Qtr.4
Integrated Annual Report 2019 | 25
Risk management report
Remuneration report
Social responsibility
About this report
Appendices Annual financial statements

Investing in growth and efficienciesDue to IFRS 9 and the interest recognition on a net basis, the cost-to-income ratio increased to 39% (2018: 36%). By adjusting the income to a gross basis to compare year-on-year, the cost-to-income ratio would have increased by only 1% from last year. Operating expenses have increased by 18% from R6.4 billion to R7.5 billion in line with earnings growth.
The increase in operating cost and capital commitments is an investment in our future growth and ability to unlock efficiency. A majority of the increased cost in salaries is due to the focus on further developing and enhancing our digital and credit offerings.
In August 2018, we broke ground to build our own head office that will allow all staff to collaborate under one roof. We are excited about the increased productivity, strategic alignment and culture growth that will be unlocked.
September 2018 saw us embark on a project to implement a new SAP general ledger, procurement and human resource system to support the increase in growth, drive processing efficiency and enhance decision-making capacity. We plan to implement the first phase of the project with respect to a new general ledger system by September 2019.
Forward looking
Mercantile Bank Holdings LimitedMercantile Bank will provide many opportunities in the market to better serve small-to-medium enterprises and owner-managed businesses. The acquisition of Mercantile Bank Holdings Limited will obviate the need to reinvent and create new systems and processes anew and thus fast track Capitec’s objective to expand its focus to a broader bank strategy.
The transaction is subject to regulatory approvals. All regulatory applications have been prepared and submitted to the Prudential Authority, the Minister of Finance and the Competition Commission. The acquisition is now pending the outcome from the regulatory authorities.
IFRS 16IFRS 16: Leases, will become effective from 1 March 2019.
The group will apply IFRS 16 using the modified retrospective approach and therefore the comparative information for the financial year ending 28 February 2020 will not be restated.
The group will recognise lease liabilities in relation to all leases which had previously been classified as ‘operating leases’ under the principles of IAS 17 Leases. These liabilities will be measured at the present value of the remaining lease payments, discounted using the group’s incremental borrowing rate as of 1 March 2019.
The associated right-of-use assets will be measured at the amount equal to the lease liability, adjusted by the amount of any prepaid of accrued lease payments relating to the lease recognised in the balance sheet as at 28 February 2019.
On 1 March 2019, we will recognise lease liabilities estimated at R2.6 billion and right-of-use assets of approximately R2.5 billion.
26 | Capitec Bank Holdings Limited
Key performance indicators
Leadership reviews
The Capitec Way
Our business context
Our strategic goals and insights
Leadership teams and governance oversight

RegulationThe regulatory environment constantly changes. We continue to proactively contribute to and manage our regulatory environment by taking care of the interests of all our stakeholders and clients.
The table below summarises the status of these developments and their impact:
Regulator Status
South African Reserve Bank (SARB)
The Authenticated Collections/DebiCheck system, which aims to provide a more secure debit order collection system to replace the existing AEDO and NAEDO systems, pilot was implemented on 1 August 2018. The banks and users are in a system stabilisation phase to repair the remaining technical challenges while gradually increasing the volumes on the new system. The Reserve Bank Directive stated that the system must be fully implemented by 31 October 2019. The impact of changes will be addressed in our processes.
Review of various methods used for calculating the capital requirements for credit risk (which includes counterparty credit risk exposures and the large exposures framework) and the introduction of a method for holding capital on interest rate risk positions. Capitec is involved in the working groups that are part of assessing these developments.
The Deposit Insurance Scheme (DIS), a wholly owned subsidiary of the SARB, which will require banks to contribute to the fund was introduced. Contributions will be based on the level of covered deposits, which covers up to R100 000 per client deposit.
Department of Trade and Industry (DTI) and National Credit Regulator (NCR)
The National Credit Amendment Bill [B 30 – 2018], which provides for the establishment of a debt intervention solution for consumers who, on average, earn no more than R7 500 per month and who have unsecured debt of no more than R50 000, is in the finalisation stage. Despite many objections from industry, little has been changed to the proposed Bill. The draft Bill still makes provision for repayment suspension of up to 24 months and the expungement of debt. It furthermore places an obligation on the credit provider to ensure that the consumer enters into and maintains credit life insurance for the duration of the term of the credit agreements.
The Bill may also adversely affect the supply of credit to borrowers in certain income thresholds, which could have negative implications for financial inclusion. There may also be an increase in moral hazard on the part of some borrowers who may enter into further credit arrangements in anticipation of debt being expunged.
NCA Section 103 In Duplum: University of Stellenbosch Law Clinic versus BASA (as well as most of the banks, including Capitec)
The law clinic argues that all collection fees, including attorneys’ and advocates’ fees, form part of the in duplum calculation in order to determine whether the in duplum amount is reached. The clinic also argues that the calculation of the in duplum amount applies even after judgment is granted and that the in duplum calculation does not start once again after judgment is granted.
The banks, represented by the Banking Association of South Africa, argues that the legal fees of attorneys and advocates do not form part of collection costs and should therefore not be taken into consideration when calculating the NCA in duplum amount. BASA also argues that judgment creates a new debt and after judgment is granted the calculation of the in duplum amount starts to run again on the new judgment debt. The view of Capitec and the other banks was taken into consideration when BASA filed the opposing affidavit.
Integrated Annual Report 2019 | 27
Risk management report
Remuneration report
Social responsibility
About this report
Appendices Annual financial statements

Regulator Status
Financial Sector Conduct Authority (FSCA)
The Financial Sector Conduct Authority (FSCA) was established in April 2018 as a dedicated market conduct regulator, with full jurisdiction over all financial institutions in South Africa. Historically, the SARB focused on the prudential oversight of banks while the FSB regulated banks’ intermediation only in respect of the FAIS Act. Market conduct of banks will now be directly regulated by the FSCA, with the National Credit Regulator (NCR) continuing to regulate consumer credit extension.
In 2017, Treasury commissioned the World Bank to undertake a study to provide independent research on the extent to which banks in South Africa treat their retail customers fairly in relation to transactional and fixed-deposit accounts. The study’s analysis and recommendations as well as public comments on the study will help shape the FSCA’s approach to regulating the way banks treat their customers, including the development of conduct standards for banks.
The draft Conduct of Financial Institutions Bill (COFI) has also been published. The COFI Bill is the next phase of the legislative reforms aimed at strengthening the regulation of how the financial services sector treats its customers. The banking industry, through BASA, is commenting on the Bill.
We are well prepared for the challenges in 2020 with the focus remaining on our clients, the Capitec team and the delivery of market-leading solutions.
André du Plessis
Chief financial officer
28 | Capitec Bank Holdings Limited
Key performance indicators
Leadership reviews
The Capitec Way
Our business context
Our strategic goals and insights
Leadership teams and governance oversight

It is all about people, passionately delivering
on clients’ needs.
This is how we create sustainable value
for all our stakeholders.
the capitec
way
Integrated Annual Report 2019 | 29
Risk management report
Remuneration report
Social responsibility
About this report
Appendices Annual financial statements

Our motivationAt Capitec, our mission is to help clients improve their financial lives. We guide and assist our clients to financially interact with the world as it evolves. We believe that banking should not cost our clients excessive amounts of time or money and should enable them to spend their time and money on the things that are most important to them.
We believe we can make banking simpler, more affordable, accessible and personalised. We do this differently by being transparent. During this financial year, an average of 127 000 new active clients joined us every month: this means they have a need for which we provide a relevant solution. We also receive awards that confirm the excellence of our value proposition and approach.
The market opportunityWe understand that banking is not people’s first priority. However, it is a necessity. We see an opportunity in saving people time and money.
We go back to the basics. By offering what is in the best interest of the client, we make it possible for people to choose a unique and most affordable way to control their money.
South Africans make daily financial choices. They might not be aware of all their options and may make decisions that bring short-term relief but will not help them to live better financially in the long term. Capitec helps them to see the bigger picture and make better choices.
We see an opportunity in the number of people that are not yet part of the formal banking system. According to the Broadcast Research Council of South Africa, 15% of South Africans aged 15 and above do not have a bank account.
How we do businessOur behaviour as Capitec peopleCapitec is committed to ethical behaviour. We believe in putting the client first, working with energy and taking ownership.
Through our behaviour, we build trust and long-term relationships, externally with clients, and internally with colleagues. The values that govern the behaviour of our employees in their interactions are:• Client first• Energy• Ownership
These corporate values are manifested in a range of policies that specify the ethical conduct expected from all employees. These include actions to deal with corruption
and bribery, guidelines on receiving and giving gifts and the exclusion of political party sponsorships. We frequently communicate these policies and our commitment to legal and regulatory compliance to our employees.
The social and ethics committee monitors and regularly reviews the relevant policies to ensure that an ethical culture is effectively embedded. The board remains ultimately responsible for creating an ethical culture throughout the group.
We respect human rightsOur approach to human rights is confirmed in a human rights statement that has been approved by the social and ethics committee. We recognise that our business contributes to economic welfare and therefore has a role to play in human progress. Sound human rights practices deliver commercial rewards for all stakeholders over the long term. Companies that apply human rights policies are better prepared to prevent human rights abuses and effectively deal with transgressions.
Here is an extract from Capitec’s human rights statement:• Capitec commits itself to uphold the equality and dignity
of all people it engages with and to recognise their basic human rights.
• The people that the bank engages with include all stakeholders, ranging from employees to shareholders and groups with vested interests, such as societies.
• Capitec will apply these principles without deviation and correct any contrary behaviour where it is within our power and ability to do so.
• Where human rights abuse exists, and it is not within the ability of Capitec to correct the behaviour, the group will disassociate itself from practitioners who commit these abuses and apply the necessary influence to change behaviour.
Doing business according to 4 fundamentalsThe Capitec Way describes how we do business according to 4 fundamentals:• Simplicity• Affordability• Accessibility• Personalised experience
We apply these fundamentals in how we behave and how we think about our business. This includes product and branch design, pricing, processes and communication. Banking is complex, but we design for simplicity and transparency in the eyes of the client and always adhere to our fundamentals.
30 | Capitec Bank Holdings Limited
the journey
Key performance indicators
Leadership reviews
The Capitec Way
Our business context
Our strategic goals and insights
Leadership teams and governance oversight

Be the leader in client centric design and delivery, and nurture our passion for helping clients to improve their financial lives.
Develop cohesive teams with visionary leadership, self driven learning and an unwavering passion for the brand.
Cultivate a high performance culture that is emphatic about delivering value to our clients, to our team members and to our shareholders.
client
deliver
people
We enable clients to improve their financial lives
SimplicityAffordabilityAccessibilityPersonalised Experience
C lient FirstEnergyOwnership
do we exist?
our fundamentalsour behaviour (CEO)do we behave?
do we offer?
Integrated Annual Report 2019 | 31
Risk management report
Remuneration report
Social responsibility
About this report
Appendices Annual financial statements

Our core resources
Our 4 business fundamentals
simplicity
affordability
accessibility
personalised experience
our valuecreation process
We use CAPITAL derived from retained earnings, shareholder funds and deposits to ensure that the bank remains well capitalised.
We employ PEOPLE for their potential and their fit with our culture and values. They provide us with the attitude and skills to achieve our strategic objectives. We create employment in local communities, remunerate fairly and are committed to providing equal opportunities.
Robust policies, internal controls and accurate reporting ensure effective risk, compliance and capital management. Our board and management provide LEADERSHIP, expertise and are committed to an ethical culture.
Our INFRASTRUCTURE consists of leased buildings, data centres, ATMs, IT systems and remote banking solutions. Our products are supported on a single system with appropriate disaster recovery plans and security.
With extensive data collection and analysis capabilities we use ARTIFICIAL INTELLIGENCE to enhance innovative thinking in line with our core fundamentals. We continuously offer new ways of banking such as Masterpass, tap-and-go and cash-send features.
11 million+ clients use Global One to transact, save, insure and access credit
• Core resources• Business activities• Enhanced insights• Innovation
Core capabilities
32 | Capitec Bank Holdings Limited
Key performance indicators
Leadership reviews
The Capitec Way
Our business context
Our strategic goals and insights
Leadership teams and governance oversight

Value created by helping clients improve their financial lives.
We are working towards a future that is characterised by a client’s choice of engagement with the bank. In the future, branches are small and nimble and clients can access our Global One solution in the palm of their hands. We will continue to find partners and will keep talking to our clients on the streets, online and via video. We plan to play a growing role in saving people time and money.
Our businessactivities
We design for the client: products, services, infrastructure and systems are designed with client needs in mind.
We have scalable processing capacity: we use data for service support. Our data scorecards help us understand client behaviour to improve pricing for risk and to anticipate client needs.
We deliver quick and efficient services through our digital presence and capability: we rely less on branches and cash – more on devices and functionality.
Decisions are fast, consistent and clear: we have a flat structure with strict policy guidelines and a risk management framework that sets boundaries in terms of risk tolerance. We manage key risks according to their impact and likelihood.
We measure and manage in detail: because we have a single, systemic view of the business, we can measure and manage branch activity (such as waiting time and speed of service), employee performance, downtime and productivity actively in detail. The level of detail is one of our competitive advantages and helps us to continuously improve.
Integrated Annual Report 2019 | 33
Risk management report
Remuneration report
Social responsibility
About this report
Appendices Annual financial statements

SimplicitySimplicity is at the heart of our positioning in the market and the essence of how Capitec operates. We use technology as an enabler of simplicity: it helps us deliver products in a way that makes banking easy and transparent for our clients. We create a paperless experience for clients and focus on direct engagement.
Everything we do is done with the client in mind. Simplicity applies to the way we structure our product offering with a flat, fixed-pricing structure, our advanced service processes and in the way we communicate with our clients.
A simple front-end solution often requires complicated background (back-end) systems and processes. We make a significant investment in system development and planning to ensure a product and pricing offer that is well differentiated, transparent, easy for our consultants to deliver and easy for our clients to use.
Traditional banking can be daunting, complex and hierarchical. Simplicity and transparency give our clients control: if you deliver a simple banking solution transparently, people know what they are getting and they feel in control of their banking and financial decisions.
Accessibility Accessibility means ensuring that clients can access our Global One solution from anywhere, at any time and in any way, to place them in control of their banking.
Our 840 branches are easy to access. They are in malls and shopping centres next to the anchor retail tenant instead of in banking halls, or in other locations that are convenient for our clients.
Our advanced cashless branch systems allow us to open up the entrances to our branches without significant security. We offer digital solutions within the bank, including self-service terminals and dual note recyclers.
Our electronic queue management system allows clients to wait without standing in queues. We trade for longer hours on weekdays than other banks. Over 310 branches, mainly in shopping centres, are open 7 days a week.
The complete Global One solution is available via internet banking, Unstructured Supplementary Service Data (USSD) and our mobile banking app, which has been designed to be simple and easy to use. We interact with clients on social media and via our client-care centre 24 hours a day, 7 days a week.
ourfundamentals
34 | Capitec Bank Holdings Limited
Key performance indicators
Leadership reviews
The Capitec Way
Our business context
Our strategic goals and insights
Leadership teams and governance oversight

AffordabilityAffordability means ensuring that our clients always get value for money. We achieve this by running a low-cost business that delivers value for money.
We understand the competitive landscape and ensure that the fees on our Global One solution are among the most affordable in the market. This is part of our out-of-branch transacting strategy, which encourages clients to use more affordable self-service and automated banking options. Self-service and electronic channels save clients time and money. Using these facilities also creates capacity in our branches to serve new clients and assist those with more complex banking needs.
We approach our stakeholder relationships with affordability in mind: we manage employee cost frugally while remaining competitive in acquiring and retaining the right talent.
Affordability is also an outcome of our talent development investment decisions as these increase efficiency and realise potential.
Personalised experience We create a personalised experience for clients by giving them freedom to choose. Every client is seen for the individual they are.
We combine digital accessibility with personal relationships. In this way, we get to understand the unique financial needs and goals of each client. This way we can help clients manage their money in the best way possible.
Clients have access to both our branch and client-care network service consultants. Our emphasis here is on personal, face-to-face experiences built on conversations. Our branches are designed to facilitate this: clients are greeted by the hand and served seated in such a way that they and the consultant can both see the computer screen. This empowers clients to choose the personalised options they want and to feel in control of the process.
Our branch managers are located at the front of the branch instead of in an office at the back, to ensure that they are visible and accessible. As the champions of client service, they personally welcome new clients when a new account is opened.
We measure a client’s experience from the moment they enter a branch to the time they leave the branch. This helps us find improvement opportunities to reduce waiting time and improve the client’s overall experience of our service.
Our consultants are recruited from the areas in which their branch operates, as they are familiar with the community and can serve clients in their home language.
“The reason I joined Capitec is because it makes everything
simple. For me, I am not the type
of person that like things that are
complicated.” Capitec client
Integrated Annual Report 2019 | 35
Risk management report
Remuneration report
Social responsibility
About this report
Appendices Annual financial statements

Investors, analysts and
rating agencies
EmployeesSociety
Government and regulators
Clients
We believe that value resides in relationships. By buildings relationships, we can offer superior banking. Our primary stakeholders form a network of relationships.
Our stakeholders help us to remain relevant. They keep us focused on what is important and give us legitimacy. Together with our stakeholders, we are able to create value for all.
We engage actively with stakeholders on the channels that they prefer, which range from social media to our call centre and face-to-face meetings. The interconnected nature of our stakeholders is becoming most visible on social media platforms.
Responsibility for overall stakeholder relationships resides with the executive management committee (EXCO). The board’s social and ethics committee is responsible for monitoring relationships through its key focus areas:• Social and economic development• Good corporate citizenship• Environmental, health and public safety• Impact of the group’s activities and services• Consumer relations• Labour and employment relationships
We have more than 116 000 followers – the highest organic engagement rate per post of all South African banks. Page growth increased by 34% over the past year.
We have over 24 000 followers – the largest following and the highest organic engagement of all financial services providers in South Africa. We were the first bank to launch Instagram TV with videoclips featuring influencers, resulting in 85 000 engagements.
YouTube
Our 3 ads had a total of 541 600 views:• Rethink credit, realise dreams• One plan, more cover• Credit stories
We have a highly engaged audience of over 93 000 followers, with a page growth of 37% over the past year.
We have just over 500 000 followers – the second-largest following among South African banks. The Facebook page grew by 13% over the past year.
36 | Capitec Bank Holdings Limited
our networkof relationships
Key performance indicators
Leadership reviews
The Capitec Way
Our business context
Our strategic goals and insights
Leadership teams and governance oversight

Our primary stakeholder groups are listed below. Secondary stakeholder groups include suppliers, non-governmental organisations (NGOs) and smaller related interest groups.
ClientsSimplicity is the
ultimate sophistication
According to the latest Broadcast Research Council of South Africa (BRC) Products and Brands Module survey, Capitec Bank has the lion’s share of South Africa’s adult banking customer base. According to the survey, 85% of South Africans aged 15 and above have a bank account and 44% of the 85% have a personal account with Capitec Bank.
Our active clients increased by 82% over the past 5 years and surpassed 11 million in this financial year. Altogether 46% of our clients are primary banking clients.
Our clients come first. We elicit feedback from clients through social media, from the way they rate their interactions with us and by collecting data through transactions. This enables us to review our product and service offering to better differentiate Capitec. It has helped us to transform the banking experience for our clients: we have longer opening hours, open branch designs and self-service options.
Investors, analysts and rating agenciesResponsible financial
returns
Capitec’s investors comprise a mix of retail depositors, shareholders, bondholders and other debt funders. They enable us to invest in growth while maintaining conservative liquidity levels. The ratings assigned to Capitec Bank by rating agencies play a role in the availability and pricing of funding for operations and growth.
In the spirit of transparency, we started live-streaming our annual general meeting (AGM) and asset management and investor presentations, so anyone can view the events from anywhere in the world.
Details of our ownership profile are set out on page 242. Key management holds shares in Capitec, which ensures that they are sensitive to the risks and rewards of shareholders. The latter expect a secure and stable group that operates with integrity and offers sustainable returns.
EmployeesEmployer of choice
Our employee numbers increased by 34% over the past 5 years and currently 85% of the employees we employ are 35 years and younger.
Employees are valued for their unique potential and talent, as they represent the face of the business and maintain the client relationships that we value. They are also our main source of intellectual capital and innovation.
Read more about our employees from page 38.
SocietyMore than a bank
Capitec’s mission is to make banking simple and transparent to help people improve their financial lives. This means providing for basic banking needs while assisting people to manage and plan for their financial priorities and commitments. Our communities offer a pool of employees and potential clients. We care for their welfare and contribute to their development and empowerment. Read more about this in the section on social responsibility from page 135.
Government and regulators
Transparency is key
By complying with governmental and regulatory requirements, we contribute to a healthy banking system and credit market in South Africa. We value good relationships with these stakeholders and they enable us to provide input on policies and regulations that may affect our operations.
Our capital management is important to the government and regulators. We have always maintained healthy capital adequacy ratios, which results in a stable business positioned for growth.
Read more about our regulatory environment on page 27, 28 and 67 and find more detail on regulatory bodies and legislation in the risk management report from page 88.
Integrated Annual Report 2019 | 37
Risk management report
Remuneration report
Social responsibility
About this report
Appendices Annual financial statements

Our business relies on employees who are able
to deliver on our strategic objectives by upholding our
values and working according to the Capitec Way.
93% of employees are from designated groups* 85% of our workforce is 35 years and younger
* Designated groups are defined as per the Employment Equity Act.
South Africa’s unemployment rate was at 27.1% on Q4 2018 according
to Statistics South Africa. The youth unemployment is at 54.7%
38 | Capitec Bank Holdings Limited
ouremployees
Key performance indicators
Leadership reviews
The Capitec Way
Our business context
Our strategic goals and insights
Leadership teams and governance oversight

We believe in our people’s willingness and potential to make a meaningful contribution to Capitec’s sustainable growth and success. We aim to unlock our people’s potential. We therefore engage with them with a sincere desire to understand what they need and want, to ensure motivation, engagement and commitment.
Employment challenges in our operating environmentPeople working for banks all over the world are facing employment challenges: they need to develop digital skills, choose between a new variety of employment contracts and be able to manage change and complexity on many levels. To attract employees, banks in turn have to offer integrated employee experiences that mirror what they are offering customers. Banks also have to demonstrate the kind of leadership that brings transformation and builds trust.
In our operating context on page 62 we set out some of the South African challenges that affect our clients and employees, for example high levels of unemployment, transport costs and crime. During the expansion of our footprint as a bank, Capitec created significant new employment opportunities. More recently, the number of new positions at branches started to level out. We continue to target a proportionally younger employee pool when doing recruitment, particularly in less urban areas where the average unemployment rate is markedly higher than the national average for the entire population.
As an employer, we help improve South Africa’s employment situation by doing the following:• Creating job opportunities• Focusing our recruitment where possible on young
people who need to gain work experience and build their skills
• Offering job security to a younger demographic that is exposed to higher unemployment rates
• Providing training and development for employees • Offering career opportunities and reward strategies that
are aligned to what employees value
Capitec’s own challenges within the South African context include specific employee-related matters such as:• Continuously attracting scarce skills, remaining relevant
when competing for and signing on sought-after talent• External financial stresses on employees in the
increasingly challenging economic environment• Providing and maturing leadership and
management skills
MaleFemale
Branch employees Non-branch employees
74%
26%
39%
61%
20%8%
Totalemployees
13 774
Male and female
Age profile
OUR EMPLOYMENT PROFILE AND APPROACH
31–35 years26–30 years≤ 25 years46–50 years41–45 years36–40 years
≥ 51 years
42%
23%
4%
2% 1%
Integrated Annual Report 2019 | 39
Risk management report
Remuneration report
Social responsibility
About this report
Appendices Annual financial statements

74% of our employees work in our 840 branches, where we prioritise employing matriculants from surrounding communities. We appoint people for their potential as we take on the responsibility of providing appropriate learning and development opportunities. This approach means that we offer jobs where they are most needed: for young people and in areas where the real unemployment rate is higher than the national average. We also drive a branch employee profile that is aligned to the local demographic of each branch. This supports our commitment to employment equity and diversity in our workforce profile.
Diversity and inclusivityWe emphasise the benefits of diversity among our employees. We support this by maintaining a fair and equitable work environment. Read more about Capitec’s B-BBEE approach on page 137.
Diversity at management level remains a challenge. This is exacerbated by aspects particular to these positions, such as their job location, scarcity of specialist skills required and low turnover. Strategies to address challenges in diversification of our employee profile are integrated into Capitec’s people initiatives and are highlighted in the relevant sections below.
Workforce profile(1)
Male Female Foreign nationals
Occupational levels African Coloured Indian White African Coloured Indian White Male Female Total
Top management 2 0 0 8 0 0 0 0 0 0 10
Senior management 4 2 1 53 0 1 0 5 0 0 66
Professionally qualified and
experienced specialists and
mid-management
27 41 14 265 15 25 6 97 8 2 500
Skilled technical
and academically
qualified workers,
junior management,
supervisors, foremen and
superintendents
446 280 74 305 857 330 72 227 9 5 2 605
Semi-skilled and
discretionary
decision-making
2 524 705 121 240 4 954 1 290 165 270 2 10 10 281
Unskilled and defined
decision-making
2 2 0 0 0 0 0 0 0 0 4
Total permanent 3 005 1 030 210 871 5 826 1 646 243 599 19 17 13 466
Temporary employees 1 0 0 1 2 2 0 3 0 0 9
Grand total 3 006 1 030 210 872 5 828 1 648 243 602 19 17 13 475
(1) Data as per Equity Report submitted to the Department of Labour for the period January 2018 to December 2018, as per the Department’s statutory requirements.
We know that there is a direct correlation between a great employee experience and a great client experience. We asked ourselves this year:• Are we diverse and inclusive enough to deliver a
sustainable service and product to our clients compared to our competitors?
• As employees, do we know how to emotionally appeal and connect with all existing and potential clients in a sustainable manner?
We believe that the combination of diversity (acknowledging visible and invisible differences) and inclusion (the quality of the organisational environment) brings competitive advantage. It delivers high levels of employee collaboration, retention, engagement and morale.
We identified the drivers for diversity and inclusion in Capitec and developed a plan to manage our diversity pipeline from pre-employment. Some of our drivers include the external bursary programme, the graduate development programme, targeted equity learnerships and our internal bursary programme. Through the appropriate selection, support and mentoring, we strengthen Capitec’s future diversity profile.
40 | Capitec Bank Holdings Limited
Key performance indicators
Leadership reviews
The Capitec Way
Our business context
Our strategic goals and insights
Leadership teams and governance oversight

We track our progress through the following indicators:
94% 100% 89%of participants in Banking Sector Education and Training Authority (BANKSETA) learnerships are from designated groups and 65% are female
of our graduate development programme participants are from designated groups and 75% are female
of internal bursaries for tertiary studies were awarded to designated groups and 59% are female
93% 79% 74%of permanent employees are from designated groups
of our external bursars are from designated groups and 46% are female
of our management learning participants are from designated groups and 57% are female
This workforce profile is a snapshot of the organisation’s distribution of employees across prescribed occupational levels, gender and equity groups, as at the end of December 2018. The Employment Equity (EE) Act regulates the reporting format requirements and requires the report’s submission to the Department of Labour annually.
Note that there were meaningful changes in the company’s EE reporting this year in terms of the reporting period, and categorisation of employees. This makes comparisons between this year and last year’s workforce profiles
impractical, but sets up the organisation for improved progress measurement in the future.
The reporting period now runs from January to December, compared to December to November in previous years. The workforce profile published in last year’s Annual Integrated Report was at the end of November 2017. We have also improved the evaluation measures for categorising employees into the prescribed occupational levels. This means that the workforce profile now has a change in distribution compared to last year caused largely by the improved categorisation, and not by actual movement within the organisation.
Integrated Annual Report 2019 | 41
Risk management report
Remuneration report
Social responsibility
About this report
Appendices Annual financial statements

Our workplace culture and employee value propositionOur people philosophy is rooted in the following:• Our passion for client-centricity • The belief that people are at the core of our business• Our drive for results • Our entrepreneurial past• A simplified human resources offering
The Capitec culture is based on three focus areas i.e. people, client and delivery. We shape our culture towards “passionate” people who deliver consistently on our clients’ needs.
We want employees to gain value from their employment. To us, employment is an experience that encompasses Capitec’s purpose, values and ethics and a portfolio of rewards.
Read more about our approach to recognition and rewards in the remuneration report on page 116.
Talent acquisitionTo remain competitive, we need to attract employees who have the appropriate skills , diversity, experience and values required by our business model and ambitions.
In the past year, 2 124 employees were appointed to new or vacant positions. Altogether 8% of these positions required information technology (IT) skills. Certain IT skills have become highly sought-after owing to Capitec’s strategic and competitive positioning. We adapt our sourcing and acquisition approach to the required skills segments in the market to reach, engage and sell our opportunities to these sought-after candidates.
We use job-specific sourcing and selection strategies that best suit the nature of the talent we seek for each position, rather than following a single-channel approach. In large areas of the business, including the entry level, this translates to hiring for potential and training for competence. In more specialised areas, we hire experienced and competent employees.
We focused more on improving efficiency in branches this year. Because the required mix of skills and experience in the branches continues to evolve, our aim is to make appointments that will support an evolving bank of the future. Our recruitment process includes a holistic assessment of candidates to determine whether the person fits in terms of the position, our service model and our values.
Talent retentionWe want to identify and develop suitable and motivated employees who are able to be considered for future senior leadership positions. This forms part of our intentional retention and succession planning.
We are committed to the development of employees from within.
This ensures that we can retain talented employees and continue growing our business and delivering services. To manage talent retention, we use robust talent metrics, diagnostics and performance review discussions. We limit human capital risks by analysing employee data, predicting and managing succession needs and identifying opportunities for talent development.
Retention challenges are: • our uniquely young employee profile; • the high mobility of suitable employment equity
candidates in the general market; and• the competition for sought-after skills in the industry
(such as technology skills).
We continue addressing retention challenges by offering internal development and career path opportunities. At the same time, we are investing in graduate development and learnerships to expand the pool of available candidates. We also employ our flat hierarchy structure to create exposure opportunities not available in other companies. This is often cited by employees as a meaningful retention factor.
42 | Capitec Bank Holdings Limited
Key performance indicators
Leadership reviews
The Capitec Way
Our business context
Our strategic goals and insights
Leadership teams and governance oversight

Succession planning is a challenging aspect of retention in a business environment in which there are low levels of retirement and turnover in senior positions. Succession candidates are identified and assessed in terms of potential and technical skills. We have created structured opportunities for exposure and integration. Specific senior positions have been earmarked for potential equity appointments.
We track employee turnover in comparison to the financial services industry average, as supplied by PricewaterhouseCoopers Inc (PwC) in their Salary and Wage Movement survey results. Although we consider this PwC figure as our upper limit, we aim to continuously improve our relative rate.
The adjacent graph illustrates the average turnover for the financial industry for the past 5 calendar years compared to that of Capitec over the same period. This shows that Capitec’s employee turnover is consistently lower than that of the financial industry. (1) Turnover figures stated are calculated as total separations for
the calendar year divided by total number of employees at the end of the calendar year, to enable comparison with financial industry turnover figures over the same period.
CAPITEC EMPLOYEE TURNOVER RATE PER CALENDAR YEAR VERSUS THE FINANCIAL INDUSTRY AVERAGE (%)
2013 2014 2015 2016 2017
18.60
12.00
14.00
16.00
18.00
20.00
22.00
24.00
Capitec(1) Financial industry average (PwC survey)
16.00
19.3018.30
17.1016.10
20.5014.80
20.2014.30
2018
13.0114.70
Capitec’s employee tenure profile reflects a rapidly growing business.
Tenure (years)
2019 %
2018
%
<3 54 61
4 – 6 24 22
7 – 9 13 10
10 – 12 5 4
13 – 15 2 2
16 – 22 2 1
Integrated Annual Report 2019 | 43
Risk management report
Remuneration report
Social responsibility
About this report
Appendices Annual financial statements

Talent developmentTalent development is a team effort involving human resources, line management and employees.
The design and delivery phases of learning programmes involve senior management to ensure that programmes meet business objectives. All learning is centralised and done in-house under direction of subject-matter experts. This ensures that we meet our service objectives and fundamentals in terms of new products, services and legislative requirements. It allows us to adapt talent development in response to changing client needs and creates closer alignment between learning, design and delivery functions.
We measure learning effectiveness through learner satisfaction, knowledge, skills retention and the application of learning in the workplace.
Formal learning interventions measured
Number of employees attending courses 2019 2018 2017
Induction/on-boarding 2 361 1 849 3 632
Functional/technical 1 767 3 877 3 607
Management and leadership 4 810 793 2 016
Compliance 1 068 198 296
Number of completed distance learning courses 2019 2018 2017
Induction/on-boarding 9 795 7 329 10 291
Functional/technical 24 108 16 368 17 914
Management and leadership 1 789 3 243 4 168
Compliance 14 018 14 840 13 283
There were a few notable changes in the formal learning initiatives measured this year:• We had a strong focus on improving the leadership
behaviours at all levels of the business through creating ongoing leadership events and courses.
• Our approach to functional/technical training includes a focus on ongoing distance-learning solutions that are aligned with our Learning Organisation model.
• The increase in compliance-related courses can be ascribed to our focus on Health and Safety in our branch network.
We made big strides on our journey to turn Capitec into a learning organisation. This included initiatives to change the mindset of employees to appreciate the importance and value of continuous development.
We made a combination of online and facilitated learning initiatives available on demand to stimulate a learning culture.
We upgraded the learning management system to make our digital learning more accessible and improve our learning technology capability.
We increased the reach and effectiveness of our learnership programmes, aimed at improving competencies and the engagement levels of our people.
Leaders at all levels attended leadership interventions focusing on inspirational leadership, improving the cohesiveness of teams and developing our employees towards a positive Capitec culture.
Client-centricity remains a key focus area and is instrumental in understanding our clients. We continued the implementation of programmes to foster this approach. We continuously focus on increasing selling skills and product knowledge levels of new and existing client-facing employees.
Future prioritiesPriorities for the next year include the following:• Continue to develop great leaders by embedding the
foundation that was laid during the past year and investing in innovative ongoing leadership development opportunities
• Focus on team cohesiveness to enhance our ability to achieve business goals and improve employee engagement levels
• Work towards maturing our digital learning strategy, including online learning resources and advanced learning technology functionalities
• Invest in a continuous development process and supporting tool to transform Capitec into a learning organisation
• Develop a formal education strategy to guide our investment in tertiary qualifications (degrees and learnerships), including the implementation of a generic management learnership course for first-line managers
Talent managementOur employees have clear performance, development and career goals. This helps us to engage on matters that create value for them and for Capitec. Talent diagnostic and review discussions, combined with the analysis of people data, succession needs, development opportunities and potential risks, provide input for future decisions and planning.
44 | Capitec Bank Holdings Limited
Key performance indicators
Leadership reviews
The Capitec Way
Our business context
Our strategic goals and insights
Leadership teams and governance oversight

Our talent management approach includes the following elements:• A business-driven and dynamic performance
management system is used to optimise group and individual performance, and to assist in identifying talent and development opportunities.
• An external bursary programme supports long-term talent pipelines in IT, finance, credit and business development. The number of external bursars has grown to 28 during the past financial year and 11 of the current external bursars joined Capitec in early 2019.
• A graduate development programme supports the diversification of our management profile. A total of 5 graduates have successfully completed the programme and entered the business in 2018. There are currently 16 graduates in the programme, including 8 graduates finalising their rotation in 2019, and another 8 joined Capitec in early 2019.
• Talent diagnostic and review sessions are held to indicate succession needs, development opportunities and risks to be managed. A formal process of talent potential assessments was introduced in 2018 to proactively identify and develop suitable and motivated employees who can be considered for future senior leadership positions.
Performance managementCapitec’s performance management practices are well established and support our focus on continuous improvement. We continuously improve performance by:• refining our management operating systems (MOS)
to track variances in performance;• individual employee performance agreements that
form the basis of regular review conversations;• bi-annual performance assessments; and• individual performance development plans.
The MOS links group-wide strategic initiatives and key performance indicators (KPIs) to divisional goals and measures, which in turn cascade through every level to all employees. MOS is a reporting channel that provides a weekly and monthly view. It integrates personal performance measures to align the entire group.
Employee engagementLine managers are responsible for people practices throughout our employee value chain. This is consistent with our open culture and flat structure. Employees engage and develop their talent when there is a healthy relationship between line managers and the employees who report to them. Good working relationships ensure that both parties take responsibility for their actions and performance.
Our employee relations approach includes the following:• Proactively encouraging 2-way communication across
all levels• Employee-related policies, including (but not limited to)
disciplinary, grievance and sexual harassment policies• Communicating these policies to employees to provide
clarity and guidance• Continuous monitoring to ensure compliance with
applicable legislation
We are implementing a human resource management system to track, manage and support employees from their first point of contact with us. This end-to-end solution includes performance management and integration with the learning management system and our payroll solution. The system will be rolled out during the 2020 financial year.
This will help to ensure that employees experience transparency and fairness in their engagement with the business. We respect confidentiality and are open about processes and requirements. This contributed to the fact that there was no loss of working hours due to industrial action this year.
We ensure similar employee experiences across all branches – in the same way that clients enjoy a single product and a consistent service experience. An example of this culture is how we put employees in control of their own earnings. They are guided on package structuring but have options that they can adapt to their unique circumstances.
We offer a wide range of employee benefit programmes, including:• An employee wellness programme (also extended to
family members)• Risk benefits (life, capital and temporary disability cover)• Funeral cover• Medical aid and health insurance• Gap cover• Retirement planning • Free remote banking • Discounts on loan interest• A bursary scheme including employees’ family members
Capitec and SASBO (the Finance Union) entered into a recognition agreement where basic organisational rights were afforded to the union. These rights provide for deductions of union subscriptions, access to the workplace and leave for trade union activities.
Integrated Annual Report 2019 | 45
Risk management report
Remuneration report
Social responsibility
About this report
Appendices Annual financial statements

Becoming financially healthy is not a one-off event. It is a series of small financial steps and decisions, which over time become valuable. Financial inclusion is a central aim of the banking sector, seeking to improve the range, quality and availability of financial services and products focusing on the under-served and financially excluded.
We want to enable peer-to-peer learning and community engagement to inspire positive action. The Capitec Foundation was awarded the African Leader in Secondary Education Funding award by the African Leaders 4 Change Awards in October 2018.
Becoming financially healthy is not about how much money you earn, but what you do with the money you have.
46 | Capitec Bank Holdings Limited
ourapproach
Key performance indicators
Leadership reviews
The Capitec Way
Our business context
Our strategic goals and insights
Leadership teams and governance oversight

Consumer educationConsumer financial education is at the heart of improving lives, especially if we can support this through actions that can actually help clients. This includes supporting them to make better decisions and to create financial capability. At the end of the day this improves their lives and provides us with better quality clients.
We increased internal capacity to develop scalable financial education solutions that can be delivered to more people and that promote more informed and consumer financial decisions and discipline. Our financial health, marketing and communications teams created innovative solutions that challenge traditional financial education methods and are true to Capitec’s core fundamentals. While we continue to support industry-led and face-to-face consumer education initiatives, the focus is on digital solutions.
These solutions consist of:• Formal modular online education solutions• Personalised, relevant insights based on client data• Embedded learning in a fun and interactive digital
environment• Optimising social media to deliver financial content• Digital tools that enable improved real-time decision-
making and action
During the past financial year we focused on the following specific initiatives:• We continued our support of The Banking Association of
South Africa’s (BASA’s) flagship generic financial literacy programme, StarSaver, which encourages a culture of saving among young people and promotes volunteerism and collaboration in the banking industry.
• Capitec sponsored the printing and distribution of 170 000 copies of GRAD MAG, a magazine aimed at first-generation first-year students. The magazine contains helpful articles, covering topics such as money management, time management, nutrition, study methods and goal setting. GRAD MAG is issued in partnership with Ruda Landman’s Readers Unite initiative, StudyTrust and Van Schaik publishers and is endorsed by the South African National Resource Centre.
Integrated Annual Report 2019 | 47
Risk management report
Remuneration report
Social responsibility
About this report
Appendices Annual financial statements

• We launched the pilot version of an online financial education platform to a select group of Capitec clients and Capitec employees. The platform contains modular courses on topics such as important financial concepts, saving, budgeting and credit.
• Summit Financial Partners and Capitec partnered to co-facilitate and execute a financial improvement and skills development programme for clients. The first elements of the programme were face-to-face workshops to encourage better financial behaviour related to credit, budgeting and saving.
• We ran a peer-to-peer education campaign in Soccer Laduma, South Africa’s largest weekly newspaper by volume. The campaign invited readers to submit their personal financial success stories based on different monthly themes. The objective was to inspire people to improve their own financial lives through the stories of ordinary people.
• Media and communication campaigns, including Rethink credit, realise dreams, Rethink Black Friday and a financial health readiness series contributed to our vision of helping clients to improve their financial lives. These campaigns were all aimed at encouraging responsible financial behaviour.
Our approach and prioritiesFinancial education and capability have become key components of Capitec’s value proposition. We offer simple, affordable and accessible banking solutions to millions of South Africans. Since inception, we have responded to the challenge of financial inclusion by providing greater accessibility to banking. Our accessibility approach ensures that branches are located in areas closer to communities, places of work and public transportation.
We combined accessibility with corporate citizenship and social responsibility initiatives aimed at financial education.
Our priorities for the next financial year include delivering embedded learning in a fun and interactive digital environment. We will also provide data-driven, personalised
and relevant insights to support the financial journeys of our individual clients and employees. We are developing decision-assist tools that enable clients to automate their money management and optimise their financial decisions about credit and savings.
The Capitec FoundationThe Capitec Foundation was established in June 2015 as our main vehicle for social initiatives. The Foundation is an independent non-profit organisation with a multipronged approach focusing on:• school management development;• teacher development; and • learner support.
The Foundation aims to give young South Africans a brighter future by upskilling them with the necessary numeracy and financial life skills to manage their financial lives. This enables them to get access to tertiary studies and employment to bring change to their respective communities and the country as a whole. Our focus on skills development supports the United Nations’ Sustainable Development Goal that drives quality education (SDG 4).
The Foundation is governed by a board of trustees and follows the Capitec risk management process. There are approved policies that guide us on how to choose and fund programmes.
The Capitec social and ethics committee also receives reports on the activities of the Foundation.
Numeracy and financial literacy support
This year our focus moved from learner to teacher development:
Maths tutor programmeWe recruited and trained university students doing their postgraduate degrees in education. We offer them training and opportunities to act as maths teachers to gain experience. This programme has the potential to have a positive impact on 4 500 learners per tutor in their teaching lifetime.
School management development programme by the University of Cape Town (UCT) and the Graduate School of Business (GSB) This programme aims to upskill individuals in leadership roles at schools to help schools perform better. Altogether 23 school principals in the Western Cape and 21 in the Eastern Cape participated. Since 2012, 128 principals and over 130 000 learners benefited.
“I would love to have this programme every year. Learners see a different perspective on how to save and why it is important.” Principal, Primary School, Western Cape
48 | Capitec Bank Holdings Limited
Key performance indicators
Leadership reviews
The Capitec Way
Our business context
Our strategic goals and insights
Leadership teams and governance oversight

Teacher development programmeThe teacher development programme is aimed at in-service teachers, with 43 from the Eastern Cape and 7 from the Western Cape who participated. The programme upskills teachers to improve their teaching. Some of the challenges that we experience in running these programmes include social issues such as gangsterism, dysfunctional schools or a lack of infrastructure, especially technology.
Donations by the FoundationThe Foundation donated to 29 organisations that shelter abused women and children in the past financial year.
CAPITEC FOUNDATION DONATIONS PER PROVINCE
21%
7%
10%
45%
7%
10%
KwaZulu-NatalGautengFree StateWestern Cape Eastern Cape
North West
Employee volunteer projectsNew volunteer programmes were launched to support and encourage employees to become involved in community outreach initiatives. These included the Hooked on Helping project, where 309 employees crocheted more than 320 blankets for shelters and support centres including:• Senior Citizens, Randfontein• Tembisa Aids Centre, Sutherland• Youth Outreach, Stellenbosch• Mum’s Tea (collective donations were given to Benjamin
Generation’s Children Charity), KwaZulu-Natal• The Legacy Centre, Kayamandi, Stellenbosch
“The crochet drive was launched at our head office in Stellenbosch. The aim was to crochet or knit as many blankets as possible. The Hooked on Helping team had great success and through this initiative the blankets were distributed to communities in need.”Ellen-Ann Finnemore, Capitec employee
Integrated Annual Report 2019 | 49
Risk management report
Remuneration report
Social responsibility
About this report
Appendices Annual financial statements

“These awards, and the fact that they reflect diverse areas of the business, indicate that we are all on the right track. Our focused approach is making an impact in the market and we are the brand of choice for many. The Lafferty Award is a particularly strong indicator as it measures the expectation gap between what the company is communicating across various channels and what clients are experiencing when interacting with the brand. We’ve all worked very hard to keep this expectation gap as small as possible and I’d like to congratulate everyone on this achievement.” Gerrie Fourie, CEO
Key performance indicators
Leadership reviews
The Capitec Way
Our business context
Our strategic goals and insights
Leadership teams and governance oversight

ourachievementsWe are recognised for how we do business
We do not target awards, or measure our success based on them. We do acknowledge the recognition of our efforts and value this as a confirmation of our strategy and continued focus on doing what is in the best interest of our clients.
#1 Lafferty Top 500 Banks Worldwide
For the third year in a row, Capitec Bank was ranked the top South African bank in the Lafferty global rankings and came in third overall in the world.
The Lafferty Banking methodology uses 19 separate metrics to assess 500 banks for overall quality. The sample includes a cross-section of banks that represent regions and markets across the world.
October 2018
#1 Solidarity Bank Charges Report 2018
Capitec offers the most affordable bank account when taking interest earned into account.
The report compares bank charges of personal transactional accounts offered by the 5 largest banks in South Africa. To be compared, accounts have to be open to any member of the public.
October 2018
#1 BrandsEye’s South African Banking Sentiment Index 2018
Capitec is the Most Loved Bank on Social Media.
The index analysed 1.7 million consumer social media posts about the 5 major retail banks from September 2017 to August 2018.
October 2018
#1 Sunday Times Top 100 Companies Award
Capitec Bank Holdings Limited was selected as the 2018 Sunday Times Top Company for its share performance on the JSE over the past 5 years.
This is calculated on share-price performance on a R10 000 investment from 1 September 2013 to the end of August, after taking into account normal and special dividends and bonus shares reinvested. As of 2018, the winning company was required to have held a market capitalisation of R5 billion from 1 September 2013.
Capitec Bank Holdings Limited (JSE: CPI) opened at R185 in 2013 and closed at R1 002.75 at the end of August, with an annual compound growth of 42.65%. This means that R10 000 invested in 2013 would have delivered R59 064 in 2018.
November 2018
#1 Kantar Millward Brown
Capitec received the award for the Most Innovative Brand among the Top 30 brands in South Africa and was ranked as the 20th Most Valuable Brand.
Brands were selected for inclusion in the BrandZ™ Top 30 Most Valuable South African Brands 2018 based on the unique and objective BrandZ™ brand valuation methodology, which combines extensive and ongoing consumer insights with rigorous financial analysis.
November 2018
#1 Forbes World’s Best Bank Survey
Capitec named the best bank in South Africa.
Global media company, Forbes Media, in partnership with market research firm Statista, released its first-ever ranking of the World’s Best Banks in 2019. The survey measured the best banks in nearly 2 dozen countries.
The banks were rated on overall recommendations and satisfaction while trust, terms and conditions, customer services, digital services and financial advise were surveyed.
February 2019
#1 Sunday Time Top Brands Awards
Capitec retained its number one position in the retail banks category.
October 2018
Integrated Annual Report 2019 | 51
Risk management report
Remuneration report
Social responsibility
About this report
Appendices Annual financial statements

“It closes late, so whenever I have those last-minute transactions, it’s there. It is different from other banks.” Capitec client
To help our clients bank better, we follow a service-support process that informs and sets out the options from which clients can choose. This allows them to compare alternatives within the Global One solution: transact, save, insure and credit. They can then structure their solutions according to their individual preferences under Global One.
The service process is supported by real-time paperless processing, side-by-side consulting and simplified choices on product alternatives. Clients who apply for credit are taken through further steps in the service-support process: we talk them through their sources of income, obligations and living expenses. We combine this with internal and external data sources, including a review of the client’s bank statements. We help them understand their rights and obligations and the risks and costs of the credit they are applying for.
Personal service is best executed in smaller branches, as they require minimal administrative and security support. This has a dual effect: it is attractive to clients and enables system-driven, paperless processes. We focus on service quality, support and addressing client needs, rather than dealing with the administrative tasks of the service processes.
Because our offer is simplified, and the administrative requirements are system-driven, we recruit consultants based on their ability to interact constructively and support clients. Training is focused on needs analysis and interactive skills and not on administrative knowledge.
Branch managers focus on service quality and efficiency. They are present in the branch and remain in touch with client needs and service logistics.
Branches are cashless and all transactions and decisions are fully incorporated into the front-end system. This enables us to provide branch services from at least 08:00 to 17:00 on weekdays and from 08:00 to 13:00 on Saturdays and Sundays in retail areas, such as shopping malls.
Our simplified product offerings and processes result in our clients receiving superior service. This is confirmed by our range of awards, set out on page 51.
We measure the successful delivery of our solution as part of our daily performance tracking. We manage this through our MOS. This integrated review system is used to manage strategy, operations and risk. The MOS ensures that key performance areas and key results indicators are aligned with our objectives, business plans and budgets. Identified risks are measured against key risk indicators.
52 | Capitec Bank Holdings Limited
uniquedelivery
Key performance indicators
Leadership reviews
The Capitec Way
Our business context
Our strategic goals and insights
Leadership teams and governance oversight

Integrated Annual Report 2019 | 53
Risk management report
Remuneration report
Social responsibility
About this report
Appendices Annual financial statements

transactWhy do clients transact using Global One?We guide and assist our clients to transact and financially interact with the world as it evolves. Global One allows our clients to do transactions worldwide using a card or mobile device.
Clients want to make payments, deposit or withdraw cash, transfer money, check their balances, be able to manage debit orders and be notified of any activity on their account. They can do all of these with the Global One solution.
Global One offers full self-service transacting and fees are among the lowest in the market.
More than 5 million clients pay R50 or less in bank fees per month. Clients save time and money by paying people and accounts via our app. They also pay zero data costs to use our banking app.
Clients use our app to keep track of their debit orders and dispute unauthorised debit orders that can make them lose money.
We continue to focus on growing our quality banking clients, whom we define as those clients with a stable inflow into their account and stable product usage over a consecutive 3-month period. Our ability to grow this segment relies on a growing economy, increased employment and consumer confidence.
We offer the following transact channels:• 840 Capitec branches• 5 011 ATMs and dual note recyclers (DNRs)• Online shopping• Mobile banking application• USSD mobile banking• Internet banking• Card• Merchant solutions• Employer salary transfer facility
By 2022 we want to cover 100% of our operating expenses through transactional income. Currently 86% is covered.
Main transaction/savings account
“Best bank when it comes to charges, cellphone banking and the user-friendly app. No surprise charges whatsoever.” Capitec client
54 | Capitec Bank Holdings Limited
Key performance indicators
Leadership reviews
The Capitec Way
Our business context
Our strategic goals and insights
Leadership teams and governance oversight

What are the risks associated with transactions?Capitec and clients are exposed to risks when transacting. These include, for example, the risk of fraud, theft and ethical breaches. To mitigate this, our branches are cashless and all transactions and decisions are fully incorporated into the front-end system.
In response to an industry-wide increase in illegal debit orders, we are part of project DebiCheck. Capitec has participated in the industry pilot programme since July 2017. We assist transaction clients to take control of their money by allowing them to confirm any new debit order going off their bank account. Authentication can be either via a card and PIN, through a branch visit for personal assistance, on our app, or via USSD or our call centre.
Credit card fraud is pervasive and is not limited to a physical credit card. It includes credit card data that can be used to transact online.
We recently implemented a new card-not-present solution to improve the security features and efficiency of the process by getting clients to confirm an online purchase via the app or USSD. In addition, by registering for the Capitec Masterpass™, clients can protect their credit card details and do safe online shopping.
Clients can now transact by using the Capitec Masterpass™ – a digital wallet that simplifies the payment process by storing a client’s payment information in 1 location.
The Capitec Masterpass™ app, powered by Mastercard®, activates online shopping for all credit card users. Clients no longer need to register their card or use the Mastercard® SecureCode™ for online shopping.
When making a payment, the merchant does not see or receive any credit card details, regardless of whether it is an in-store or online payment. Digital wallets also only access the funds that a client makes available. Other security measures include authentication methods such as fingerprint scans, passwords and even a password pattern.
The app is free to download and there are no fees or charges to clients to use the Capitec Masterpass™ app.
The improved app was activated at merchants in June 2018 and formally launched as a Capitec product for cardholders in July 2018.
We will be launching tap-and-go functionality for Capitec cards in 2019.
0
200
400
600
800
1 000
NUMBER OF BRANCHES
2015 2016 2017 2018 2019
668
720
796
826
840
0
2 000
4 000
6 000
8 000
10 000
12 000
2015 2016 2017 2018 2019
NUMBER OF ACTIVE CLIENTS (’000)
6 244
7 269
8 569
9 868
11 386
1 000
2 000
3 000
4 000
5 000
6 000
7 000
TRANSACTION FEE INCOME TREND
2015 2016 2017 2018 2019
6 464
3 923
5 127
3 020
2 608
0
20
40
60
80
100
0
Net transaction fee income (R’000)Net transaction fee income to operating expenses (%)
65
66
72
81
86
Integrated Annual Report 2019 | 55
Risk management report
Remuneration report
Social responsibility
About this report
Appendices Annual financial statements

saveWhat our savings offering entailsWe do everything we can to keep our banking costs as low as possible. Together with our highly competitive interest rates, saving is easy and interest is earned from day 1.
Clients have access to 4 savings plans and have the freedom to give each plan a name according to what they are saving for, for example a car deposit or holiday, or setting money aside in case of an emergency.
Salient features of our offering:• Transaction savings account: serves as the client’s
main account• Flexible savings account: clients can choose the amount
and the term• Fixed-term savings account: this can be single or
multiple deposits• Tax-free savings account: allows clients to invest for
their future
Clients typically save for 3 reasons:• to buy something;• for their future; and• to earn monthly interest.
“I managed to get an internship in Pretoria. The standard of living was very high and I had to send money home every month. After 4 months I still had no savings. It then dawned on me that the only reason I could not save was that I had told myself that I was not earning enough money to save for future needs. What is enough money then? Honestly, no one earns enough money, but some people are able to save. I decided to open a savings account to start putting some money aside. By the time my contract came to an end, I still had money in my bank account.” Mxolisi Ngongoma, Capitec client
4 savings plans defined by you
56 | Capitec Bank Holdings Limited
Key performance indicators
Leadership reviews
The Capitec Way
Our business context
Our strategic goals and insights
Leadership teams and governance oversight

What are the risks associated with savings?Depositors want their money to be safe. Clients’ savings might be at risk in the case of a major unforeseen event, such as a global financial crisis. We ensure that our capital levels remain well above what is required by law. By deliberately maintaining substantial levels of capital, we protect client deposits.
We manage our clients’ funds in a diligent and conservative way. Client deposits are invested in simple and easy-to-understand interest-bearing investments such as South African National Treasury Bills. These investments are, on average, for periods shorter than 3 months, with no single investment longer than 1 year. We use our equity, the wholesale funds received from institutions and the bulk of fixed-term client deposits to lend out to individual clients.
With the growth in retail deposits over the past few years, Capitec has been relying less on more expensive wholesale funding, which is a saving for the business.
Read more about the way in which we manage risks related to liquidity and capital management in the risk management report from page 88.
0
10 000
20 000
30 000
40 000
50 000
RETAIL CALL SAVINGS (R’m)
2015 2016 2017 2018 2019
45 141
30 117
34 909
24 15219 298
0
5 000
10 000
15 000
20 000
25 000
30 000
RETAIL FIXED SAVINGS (R’m)
2015 2016 2017 2018 2019
26 224
17 922
22 915
13 63410 731
WHOLESALE FUNDING (R’m)
2015 2016 2017 2018 20190
2 000
4 000
6 000
8 000
10 000
12 000
5 078
7 543 6 206
10 154
11 152
Integrated Annual Report 2019 | 57
Risk management report
Remuneration report
Social responsibility
About this report
Appendices Annual financial statements

insureWhy do we offer insurance options?It is estimated that the average funeral in South Africa can cost anything between R40 000 and R200 000. The venue, style of memorial service, location and number of people all have a large impact on overall costs.
When people are feeling overwhelmed by grief and have many unexpected arrangements to make, a funeral plan can ensure that they are financially prepared. A funeral plan avoids the need to dip into savings or find another suitable financial product on short notice – and the potential negative impact on monthly cash flows.
According to a study done by FinMark in 2017, 55% of the South African adult population have funeral cover. For those without formal funeral cover, options to self-insure include communal burial societies and stokvels. Formal insurance is sold through a variety of channels, including financial advisers, brokers, banks and retailers.
Funeral cover is a simple contract, and one that Capitec can leverage through branches or the app using existing infrastructure and systems. Our app functionality for buying and maintaining a funeral plan is an industry first.
Further insure benefits include:• A newborn premium cover waiver for 6 months • Double accidental death benefit• A death premium waiver for 6 months • A voluntary policy pause for up to 6 months
Credit insurance is required for credit terms of 7 months and longer to cover death, permanent or temporary disability, unemployment, the inability to earn an income or retrenchment. While Capitec offers this insurance, clients have the option to provide us with an alternative policy of their choice, as long as it meets our minimum requirements.
What are the risks associated with insurance?
Insurance safeguards a client’s future cash flows and protects a client from the impact of unexpected events.
Capitec carries risk in the form of having to pay additional benefits against what was envisaged at the inception of a contract with a client. Read more about what we do to mitigate this risk in the risk management report from page 88.
Credit life insurance Capitec funeral plan
“My brother passed on in June and there was no money to bury him, even though we knew that he had been struggling with diabetes for years. The reason I did not make any attempt to plan for his funeral is the stigma behind the belief that you make money from the death of a family member if you have a funeral policy for them. This is still haunting me when I think of taking out funeral cover for other family members. I think a funeral policy should be about easing the financial burden and, most of the time, it is the service itself that is more important than worrying about catering and all other things that we worry about.” Kate Tau, Capitec client
58 | Capitec Bank Holdings Limited
Key performance indicators
Leadership reviews
The Capitec Way
Our business context
Our strategic goals and insights
Leadership teams and governance oversight

Integrated Annual Report 2019 | 59
Risk management report
Remuneration report
Social responsibility
About this report
Appendices Annual financial statements

creditOur credit offering• Personal term loans: personalised credit and terms up to
R250 000 over 84 months• Credit card: with up to R150 000 credit limit• Home loan: up to R5 million over 240 months • Credit facility: up to R5 000
Capitec did an online survey to gauge consumers’ credit literacy, which saw more than 5 300 responses. The use of debt for productive reasons was found to be a top priority among South Africans.
We asked the question: What would you do with a R100 000 loan?
The most popular answers were:• Start a business (40%)• Improve my home/apartment (24%)• Consolidate debt (20%)• Put a deposit on a home (16%)
Salient features of our credit offering• Clients can choose between the amount they want, the
monthly instalment that suits their pocket, or the option that gives them the lowest interest rate.
• Credit is approved in minutes and the money is available immediately.
• Interest rates are fixed for the period and start at prime.• Clients have the option to consolidate all existing loans
for easier monthly repayments.• In line with the best interest of the client, credit insurance
is only paid on the outstanding balance of the loan.• Credit can be managed proactively by using the
Capitec app.
“I was stressing. How do you say no to your child’s dreams? I applied for loans, but I was worried about high interest rates. I did not want to take credit that would set me back financially. Capitec approved me instantly and offered me a low interest rate of 14.3%. I could help her realise her dreams.” Chumani Mphalala, Capitec client
Choose personalised credit plans
60 | Capitec Bank Holdings Limited
Key performance indicators
Leadership reviews
The Capitec Way
Our business context
Our strategic goals and insights
Leadership teams and governance oversight

What are the risks associated with credit?Read more about Capitec’s credit risks and how these are mitigated in the risk management report from page 88.
Capitec and clients are exposed to risks when offering and accessing credit. Using credit wisely helps clients to:• build a good credit record to improve their chances to get
credit when they need it most and at a better interest rate;• be in control of their financial lives; and• have more money available for their money goals.
Not using credit wisely can lead to:• increased stress, which can have a negative impact on a
client’s family and work life;• not qualifying for credit in future;• over-indebtedness; and• the client’s assets being repossessed.
Capitec’s credit-granting model includes a robust assessment of client affordability before granting loans, as well as an assessment of the client’s free cash flow to ensure that a buffer is available.
Read more about our operating environment, including the credit industry, from page 62.
We launched the Rethink credit, Realise dreams campaign where we partnered with businessman Vusi Thembekwayo. The campaign encouraged consumers to take out credit for the right reasons.
Our personalised credit solution achieves the best possible credit limit, over the optimal repayment term, with the best interest rate. This is offered to clients based on their past banking and credit behaviour, affordability and the stability of their source of income, using data from credit bureau records, bank statements and payslip information.
TOTAL PROVISION FOR CREDIT IMPAIRMENT TO STAGE 3 (EXCLUDING EXPECTED RECOVERIES RECEIVABLE) AND
STAGE 2 (UP TO 1 MONTH IN ARREARS) COVERAGE %
2015 2016 2017 2018(1) 2019
0
50
100
150
200
109
107
130
91
97
VALUE OF TOTAL LOANS ADVANCED (R’m)
2015 2016 2017 2018 20190
6 000
12 000
18 000
24 000
30 000
36 000
30 968
27 226
28 29224 22819 417
0
9 000
18 000
27 000
36 000
45 000
NET LOANS AND ADVANCES (R’m)
2015 2016 2017 2018(1) 2019
44 51539 205
40 92735 760
32 484
(1) IFRS 9 transition at 1 March 2018.
(1) IFRS 9 transition at 1 March 2018.
Integrated Annual Report 2019 | 61
Risk management report
Remuneration report
Social responsibility
About this report
Appendices Annual financial statements

S&P Global Ratings affirmed Capitec’s ratings on 22 November 2018 with a stable outlook. We have a global long-term rating of BB and a global short-term
rating of B. The South African long-term national scale rating is zaAA and the short-term rating is zaA-1+.
Our global long-term rating is the same as the sovereign rating, as well as those of other large South African banks.
The South African economy stepped out of a technical recession in December 2018 with 2.2% quarter-on-quarter
growth in the third quarter. It was the country’s second recession since 1994 (Stats SA).
The South African Reserve Bank (SARB) announced an increase of 25 basis points in the repurchase rate to
6.75% per year, effective from 23 November 2018.
Capitec credit clients are protected from the direct impact of interest rate increases as
Capitec loans are granted at fixed interest rates.
our business context
Our business is exposed to South African economic trends,
political instability and low growth prospects while being shaped
by changes in the regulatory landscape. By maintaining
healthy relationships with all our stakeholders, we are able to work
towards better financial lives for all.
62 | Capitec Bank Holdings Limited
Key performance indicators
Leadership reviews
The Capitec Way
Our business context
Our strategic goals and insights
Leadership teams and governance oversight

The total number of jobs decreased by 69 000 in the second quarter of 2018 (April–June), bringing the total number of persons employed in the formal non-agricultural sector of South Africa to 9 748 000.
At Capitec, we define primary banking clients as those who make regular deposits, mainly salaries. When people lose their jobs, they don’t have a regular income. This affects their ability to access credit, impacting on the growth of our loan book and volumes of transactions. It may also put strain on their ability to repay loans. 11% of our clients access credit.
Annual food inflation continues to slow despite the increase in value-added tax (VAT). In fact, some food items are actually cheaper than they were a year ago. Consumers are typically paying less for products in the oil, bread, fruit and sugar categories. Bread and cereal prices were 3.1% lower in June 2018 than in June 2017. Fruit prices fell by 3.2% over the same period. A closer look at the data suggests that much larger forces than VAT are at play: tough economic conditions and the recovery from drought.
Lower food inflation means there is some relief for our lower-income clients as food and transport make up a significant portion of their disposable income. By keeping our banking fees low, we help them to have more money available for savings.
A longer-term analysis of labour statistics shows that the tourism sector is playing a larger role in job creation than other major industries. In the 4 years from 2014 to 2017, tourism created just over 64 000 net new jobs, outperforming larger industries such as transport and communication, mining, utilities (electricity, gas and water) and manufacturing. The finance and other business services industry was the largest contributor to job creation overall, increasing employment by about 407 000 jobs during 2014 to 2017.
We are committed to job creation as employment is a building block towards financial independence and well-being. We employed 441 more people at Capitec during the past financial year. Our acquisition of Mercantile Bank will also give us the opportunity to help grow smaller businesses in the same way that we have been supporting our retail clients.
The general level of crime has increased in 2016/17 and 2017/18. Household crime increased by 5% to a total of 1.5 million incidences while individual crime also increased by 5% to a total of 1.6 million incidences, affecting 1.4 million individuals aged 16 and above. The percentage of households whose members feel safe walking in their neighbourhoods during the day declined from 84.8% in 2016/17 to 79.1% in 2017/18. The level of satisfaction with the police and courts continued to decline, more rapidly in the case of courts.
Crime affects everyone. As a bank, we were further concerned about the dramatic increase in cash-in-transit (CIT) heists this year. We encourage digital transactions to avoid the risks associated with cash. Crime also relates to cyberattacks. Capitec did not experience any data breaches this year and continues to protect our clients’ data and money through the best security policies and practices available.
Annual fuel inflation was 25.3% in July 2018. This was the highest annual fuel inflation rate since December 2011.
Our clients are very sensitive to higher fuel and transport cost. This was exacerbated by continued increases in water and electricity costs, which put their disposable income under pressure. Electricity prices alone have increased by about 356% over the past 10 years, compared to inflation of 74%. Changes in transport and energy costs have a greater impact on clients’ ability to repay loans compared to movements in interest rates.
External factors impacting Capitec and banking in South Africa
Stats SA provides a range of research points that summarise local economic and social trends. These describe the pressures that our clients are experiencing and help us understand what they need to improve their financial lives.
Integrated Annual Report 2019 | 63
Risk management report
Remuneration report
Social responsibility
About this report
Appendices Annual financial statements

Other factorsThe SARB issued 3 new banking licences in 2017. These are the first licences issued to new banks in more than a decade. The grant of a banking licence is subject to specific regulatory conditions, including shareholding in the bank and approval by the Competition Commission of South Africa. The new banks all have a fully digital approach, which significantly reduces the traditional high-cost barriers to entry. Plans are also underway to remodel the South African Post Office into a fully-fledged bank.
The past financial year also saw the liquidation of VBS Mutual Bank, highlighting the importance of good controls, governance and trust in the system.
A weaker economic environment allows Capitec to attract more transactional banking clients who seek affordable solutions for their day-to-day banking requirements.
We are well hedged against interest rate movements, which means that the bank’s profitability is not materially affected by movements in interest rates.
Uncertainty regarding the future value of the currency will have an impact on the cost of some goods and services that are not sourced locally. The bank has no unhedged currency exposure on debt raised.
The South African unsecured credit marketAccording to BASA, the unsecured lending market in South Africa is significant. The National Credit Regulator’s (NCR’s) Credit Bureau Monitor for September 2018, estimates that there are 24.1 million credit-active consumers in South Africa. Of these, 37% have impaired credit records. The number of people with impaired records has declined since 2015 and is currently at levels last seen in September 2011.
Unsecured lending is a critical tool for financial inclusion – especially if managed responsibly by both lenders and borrowers. Banks, as the lenders, are strictly regulated and are subject to regular inspections and engagement by the relevant authorities.
The total number of applications for credit increased by 10.4% to 43.4 million for the 12 months ended September 2018, and the rejection rate for applications was 51%.
PROVINCIAL DISTRIBUTION OF CREDIT GRANTED: Q3 2018
Source: Consumer Credit Market Report, Third Quarter, September 2018
Western Cape16.66%
Eastern Cape5.88%
Northern Cape1.82%
Free State4.08% KwaZulu-Natal
13.60%
Limpopo4.14%
North West3.63%
Mpumalanga6.72%
Gauteng42.53%
Other0.95%
0
5
10
15
20
25
30
35
40
2018 Q3
2018 Q2
2018 Q1
2017 Q4
2017 Q3
2017 Q2
2017 Q1
2016 Q4
2016 Q3
CREDIT GRANTED (% DISTRIBUTION)
Source: Consumer Credit Market Report, Third Quarter, September 2018
Mortages Credit facilities
Unsecured credit Development credit
29.78%31.42%
21.34%
14.10%
2.39%1.07%
Secured credit
Short-term credit
The unsecured credit share of total credit granted increased to R116.4 billion, which is 22% of total credit granted. Unsecured credit transactions include all transactions where the lender does not have any security (other than credit facilities). It includes short-term credit.
Unsecured credit agreements with a repayment period of between 3.1 and 5 years dominated Rand values and numbers.
64 | Capitec Bank Holdings Limited
Key performance indicators
Leadership reviews
The Capitec Way
Our business context
Our strategic goals and insights
Leadership teams and governance oversight

Total retail credit market (loans and advances for 12 months to September 2018)
Unsecured and short-term credit market (granted by income group for 12 months to September 2018)
Gross income (R’m) 2018 2017 2016 2015
R0 – R5 500 8 009 9 245 12 927 11 319
R5 501 – R10 000 15 993 14 792 17 087 16 831
R10 001 – R15 000 19 456 17 381 18 061 17 143
R15 000 plus 72 943 56 627 50 277 42 056
Total 116 401 98 045 98 352 87 421
Market (R’m)
Credit type 2018 2017 2016 2015
Secured credit 171 378 162 418 149 458 154 705
Mortgage 156 693 145 981 145 202 143 702
Unsecured and short-term 116 401 98 045 98 352 87 421
Credit facility 71 693 61 705 52 902 69 121
Development 6 451 15 435 12 398 6 473
Total 522 616 483 584 458 312 461 422
Capitec market share of unsecured and short-term credit (2017: 26.6%)22.9%Capitec market share of total credit market (2017: 5.4%)5.5%
Read more about Capitec’s credit-granting model from page 94.
Integrated Annual Report 2019 | 65
Risk management report
Remuneration report
Social responsibility
About this report
Appendices Annual financial statements

Trends in the credit market
Agreement type
To Q32018R’m
2017R’m
To Q32017R’m
2016R’m
Trend Q32017/2018
(%)
Trend Q32017/2016
(%)
Trend 2016/2017
(%)
Trend2016/2015
(%)
Mortgages 115 363 149 969 108 638 142 906 6 3 5 (3)
Secured credit 125 011 166 597 120 230 149 874 4 12 11 (3)
Credit facilities 54 184 64 280 46 771 53 868 16 20 19 (18)
Unsecured credit 77 751 37 490 62 425 85 182 25 0 3 9
Short-term 9 859 12 897 9 171 12 660 8 (1) 2 (16)
Developmental credit 4 738 14 659 12 946 13 078 (63) 22 12 77
Grand total 386 905 495 892 360 181 457 568 7 8 8 (2)
Total rand value of unsecured credit granted by size of agreements
R0K – R3K 465 702 541 928 (14) (28) (24) (48)
R3.1K – R5K 1 069 1 189 855 1 283 25 (14) (7) (30)
R5.1K – R8K 1 677 1 853 1 316 2 054 27 (13) (10) (13)
R8.1K – R10K 2 050 2 694 2 004 3 017 2 (9) (10) 13
≤R10K 5 261 6 438 4 716 7 282 11 (14) (12) (16)
R10.1K – R15K 3 956 4 571 3 239 5 012 22 (13) (9) 6
>R15.1K 68 533 7 648 54 469 72 888 26 3 5 13
Grand total 77 751 87 490 67 140 92 464 16 (1) (5) 7
Total rand value of unsecured credit by income category
≤R10K 13 477 17 941 13 022 21 998 3 (20) (18) (7)
R10.1K – R15K 12 713 15 402 11 141 15 566 14 (2) (1) 4
>R15K 51 555 54 134 38 252 47 610 38 11 14 21
Grand total 77 745 87 477 62 415 85 174 25 0 3 9
Current portion of gross debtor’s book
Mortgages 848 255 828 183 817 762 798 361 4 4 4 2
Secured credit 377 461 368 273 361 506 346 937 4 6 6 3
Credit facilities 195 243 190 899 187 286 184 301 4 4 4 2
Unsecured credit 141 689 131 008 126 612 123 771 12 4 6 5
Short-term 1 772 2 065 1 870 2 186 (5) (9) (1) (17)
Developmental credit 44 962 41 950 39 041 39 576 15 1 6 28
Grand total 1 609 382 1 562 378 1 534 077 1 495 132 5 4 4 3
66 | Capitec Bank Holdings Limited
Key performance indicators
Leadership reviews
The Capitec Way
Our business context
Our strategic goals and insights
Leadership teams and governance oversight

Capitec operates in a highly regulated environment. Regulation safeguards clients and the system by making it safe to bank and ensuring the stability of financial institutions, including the payments system. The SARB is responsible for bank regulation and supervision. It issues banking licences and monitors activities related to the Banks Act, Act 94 of 1990.
With the new Financial Sector Regulation Act, Act 9 of 2017, that was signed into law in August 2017, our regulatory landscape changed: the SARB’s mandate is now explicit about financial stability, a new Prudential Authority (PA) was created and a new market regulator established.
The SARB and the PA are our main regulatory stakeholders. We engage with them daily. Our reporting to them includes, for example, a liquidity report where we explain any capital movements. These reports are essential for industry regulation but also help them understand the unique aspect of our business. We believe that transparency and information sharing are critical in our relationship with regulators, as this enables the system to function at its best – which is in our clients’ interest.
We are also regulated by the NCR, which is responsible for the healthy functioning of the South African credit industry. This includes promoting the development of an accessible credit market to low-income earners.
Other regulatory bodies have broad jurisdiction over other aspects of our banking business, including interest rates and fees charged to borrowers, capital adequacy, marketing and selling practices, advertising, licensing agents, terms of business and permitted investments.
Capitec endeavours to maintain healthy relationships with regulators and continued compliance with regulatory requirements. As a member of BASA, we continue to participate in and engage on industry-related matters. We attend regular BASA meetings and workshops. We see a move towards principle-based rather than traditional rules-based regulation happening. While these fundamental changes can be perceived as a risk, we find opportunities to improve our business.
Read more about how we respond to regulation in the risk management section from page 88.
Deposit insurance schemeThe SARB and the National Treasury are setting up a new deposit insurance scheme (DIS) which will protect taxpayer funds and reduce the social and economic cost caused by bank failures. This will bring South Africa in line with international best practice. We expect the new DIS to be implemented before the end of the 2019 calendar year.
Levies BillThe establishment of new regulatory bodies, such as the PA, requires funding. A new Levies Bill is expected to take effect in 2019. National Treasury, together with the regulators, developed a detail costing of regulators considering the latest levy formulas. Capitec will be subject to these new levies, which are expected to increase significantly in line with heightened supervision requirements.
Anti-money-laundering (AML) and CTF (counter-terrorist-financing)AML refers to the policies and legislation that require us to proactively monitor clients to prevent money-laundering and corruption. Financial crimes are reported to the PA. They have developed and implemented a risk-based approach framework to identify, assess and understand all money-laundering and terrorist-financing risks faced by entities under its supervision. Whereas AML previously formed part of our compliance measures, responsibility has been split to also include an operational accountability. This ensures that there is appropriate segregation of oversight. The SARB conducts regular compliance meetings on site.
We launched a risk-based assessment (RBA) project to mitigate money-laundering and terrorist-financing risk, to ensure that we adhere to the principles of treating customers fairly and to confirm financial inclusion. Our RBA framework continues to evolve as we gather more information and test our risk-scoring model towards the April 2019 implementation date. We are currently developing risk assessment methodologies to assess our clients, products, channels and transactions to document inherent risks. This will be followed by an evaluation of existing controls and the identification of areas where stronger control measures are necessary.
Debt reliefThe National Credit Amendment Bill was passed by the National Assembly in September 2018. The Bill encourages and enforces responsible lending and borrowing, and allows intervention in the case of over-indebted consumers earning R7 500 per month or less. The first step in the intervention process involves debt restructuring: clients then have 5 years to pay their debt. We remain committed to applying debt-relief measures to assist our clients, based on their unique circumstances.
Recent regulatory changes
Integrated Annual Report 2019 | 67
our regulatoryenvironment
Risk management report
Remuneration report
Social responsibility
About this report
Appendices Annual financial statements

“Capitec Bank has been a breeze, from customer service to apps – too good.”Capitec client
68 | Capitec Bank Holdings Limited
Key performance indicators
Leadership reviews
The Capitec Way
Our business context
Our strategic goals and insights
Leadership teams and governance oversight

Integrated Annual Report 2019 | 69
Risk management report
Remuneration report
Social responsibility
About this report
Appendices Annual financial statements

Client experience is about delighting every client every time they interact with Capitec. When we fail we recover fast and beyond expectation.
The key measurables of success are the number of clients that rate their experience as “great”. There are also indirect measures like net sentiment (positive minus negative) based on client interactions on social media.
ProgressCapitec interacts with clients through multiple channels based on their unique profile. We use these platforms to drive directed campaigns and product communication.
85% of clients who provided feedback indicated that they had a “great” experience in their interactions in a Capitec branch.
Our employees have been involved in a range of client-centricity workshops to ensure that the voice of the client is understood and used when designing new processes, products and service experience.
Focus areas FY2022• Create an omni-channel client
experience that is seamless, consistent and personalised
• Migrate clients and branches from consultant-driven service to self-service that is supported by consultants only when the client requires it
• Create a world-class client-service experience and a client-centric culture
• Enable personalised, two-way, real-time digital communications on any channel, from anywhere and at any time to drive better behaviour
• Provide educational and supporting tools that will enable clients to improve their financial lives
Client experience
We want to improve the pace and quality of services and products that Capitec delivers to the market. We also want to maintain high levels of availability of Capitec’s IT systems.
A key measurement is the number of initiatives that get delivered to the market on a rolling 6-month basis.
ProgressThe Capitec Way has been maturing to increase predictability and consistency of delivery and include non-IT teams in planning.
A dedicated team has been established to deliver credit products and services to the market (credit value stream).
Focus areas FY2022 • Scale and mature our Way of Work
(WoW) methodology, organisational structure and capacity to deliver in a fast-changing environment
• Improve the speed of initiatives delivered
• Deliver initiatives on average within 6 months across the enterprise portfolio/book of work
• Create a stable technology architecture (platform) that allows quick integration and changes
Business delivery
Every year the EXCO runs a series of strategic workshops, informed by input from a wide range of employees, to review our goals. This leads to the definition of the medium to long term intent and direction of the organisation. We set ourself ambitious 3-year goals with shorter term targets (1-year) that supports us in achieving these goals. Once we’ve set our goals we determine how we are going to achieve these goals through a collaborative business planning and budgeting process which asks the question “how will we fund our plan” and “what are the initiatives that we need to achieve our goals” per divisional area. These plans are meticulously measured through a series of integrated KPIs on both a team and individual level, as this is linked to our remuneration strategy. This ensures that the organisation aligns with strategy and everyone knows exactly what is expected of them.
A large proportion of key management’s pay mix consists of long-term incentives (LTIs). LTIs are based on year-on-year growth in headline earnings. We believe that our strategic goals will deliver headline earnings growth as the key measure of sustainable operating performance.
our strategic goalsand process
70 | Capitec Bank Holdings Limited
Key performance indicators
Leadership reviews
The Capitec Way
Our business context
Our strategic goals and insights
Leadership teams and governance oversight

We want to create an enabling, self-sustaining environment in which Capitec people can grow and contribute towards helping other people work and live better.
Key measures of success include overall group vacancy rate and the percentage employment equity (EE) candidates starting at Capitec.
ProgressWe delivered various leadership interventions including cohesive team sessions to create team charters, held leadership workshops, presented middle-management leadership courses and operational and regional management development programmes and hosted guest speakers.We identified the talent pipeline for senior management through the future fit programme.We successfully delivered the 2017 and 2018 graduate development programme with 5 and 8 candidates participating respectively, as well as bursary programmes.We conducted an analysis of the current Capitec employee value proposition (EVP) and defined which actions we need to implement in 2019.Our vacancy rate has been below target (4%) with an average of 3% and the percentage of EE starters above 90% for this financial year.
Focus areas FY2022• Develop great leaders• Diversity and inclusivity• Learning organisation• “Work Better, Live Better”
PeopleWe aim to increase revenue streams from new categories of products such as funeral cover and lines of business, including the entry of Capitec into business banking with key focus on merchants or small and medium-sized enterprises (SMEs).
This is measured based on how the market adopts the products and the income generated by the new revenue stream.
ProgressWe successfully delivered funeral cover to the market in collaboration with Sanlam and sold over 500 000 policies to date.
We enabled QR payments through the roll-out of Capitec Masterpass™ to over 5 000 Capitec merchants.
Successful bid to acquire Mercantile Bank Holdings Limited
Focus areas FY2022Business banking• Deliver Capitec Business Banking
to the market
Insurance• Establish Capitec as a provider of
choice for insurance products
Live Better• Establish Capitec Live Better
benefits as in integral part of the Global One offering
New products and add-ons
For Capitec, a quality client is an outcome of clients trusting the brand and using our products and services.
We achieve this outcome when we get clients to use us as their primary bank (e.g. salary deposit, debit orders and product usage) or when they have characteristics that make them a good credit client. We measure this by the growth in number of quality banking clients.
ProgressThe number of quality clients increased by 18.9% in the past financial year.We continuously enhanced the Capitec credit-granting model to provide better value to clients and reduce the number of clients that default on credit.We increased the number of clients that:• use the app;• use their card as a method of
payment;• pay their salary into their Capitec
Global One account; and • use the Global One account to their
pay debit orders.We launched the first client benefits with 3rd parties through the Live Better Benefits programme.
Focus areas FY2022• Grow market share to 10% by 2022
and to 15% by 2025 of total South African credit market
• Increase quality banking clients to 4.26 million and clients earning above R10 000 to 2 million
Client quality
Integrated Annual Report 2019 | 71
Risk management report
Remuneration report
Social responsibility
About this report
Appendices Annual financial statements
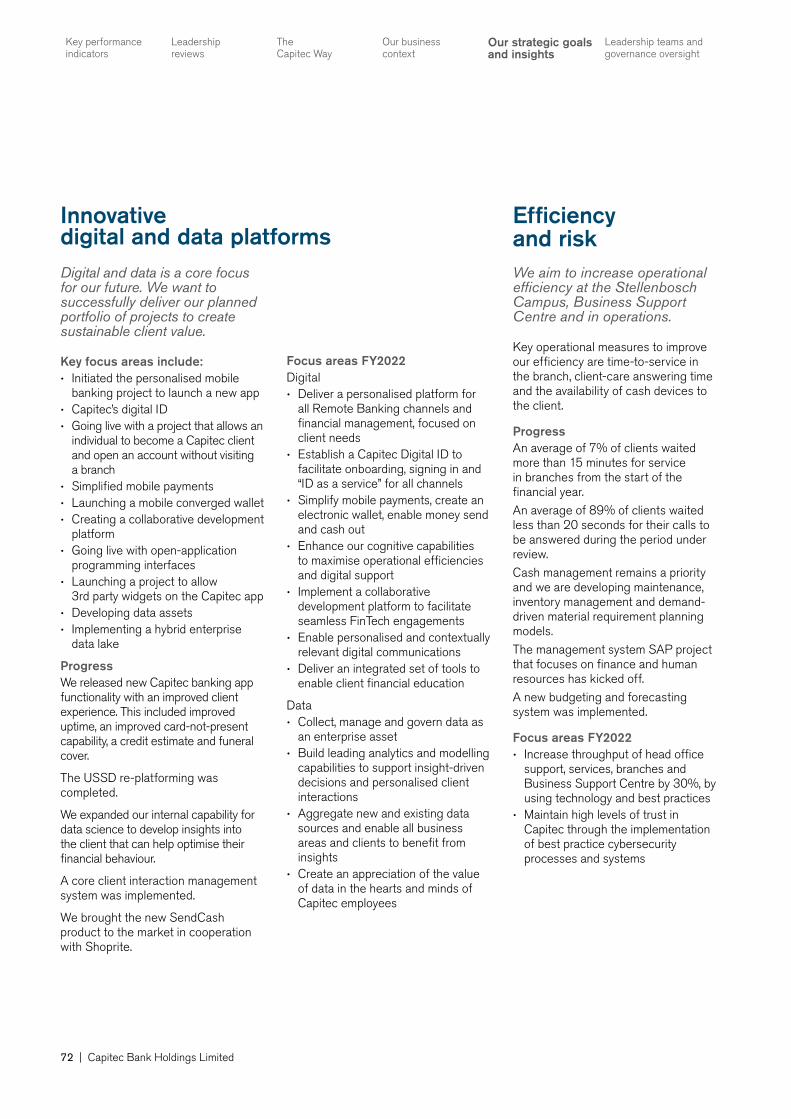
We aim to increase operational efficiency at the Stellenbosch Campus, Business Support Centre and in operations.
Key operational measures to improve our efficiency are time-to-service in the branch, client-care answering time and the availability of cash devices to the client.
ProgressAn average of 7% of clients waited more than 15 minutes for service in branches from the start of the financial year.
An average of 89% of clients waited less than 20 seconds for their calls to be answered during the period under review.
Cash management remains a priority and we are developing maintenance, inventory management and demand-driven material requirement planning models.
The management system SAP project that focuses on finance and human resources has kicked off.
A new budgeting and forecasting system was implemented.
Focus areas FY2022• Increase throughput of head office
support, services, branches and Business Support Centre by 30%, by using technology and best practices
• Maintain high levels of trust in Capitec through the implementation of best practice cybersecurity processes and systems
Efficiency and risk
Digital and data is a core focus for our future. We want to successfully deliver our planned portfolio of projects to create sustainable client value.
Key focus areas include: • Initiated the personalised mobile
banking project to launch a new app • Capitec’s digital ID• Going live with a project that allows an
individual to become a Capitec client and open an account without visiting a branch
• Simplified mobile payments• Launching a mobile converged wallet• Creating a collaborative development
platform• Going live with open-application
programming interfaces• Launching a project to allow
3rd party widgets on the Capitec app• Developing data assets• Implementing a hybrid enterprise
data lake
ProgressWe released new Capitec banking app functionality with an improved client experience. This included improved uptime, an improved card-not-present capability, a credit estimate and funeral cover.
The USSD re-platforming was completed.
We expanded our internal capability for data science to develop insights into the client that can help optimise their financial behaviour.
A core client interaction management system was implemented.
We brought the new SendCash product to the market in cooperation with Shoprite.
Innovative digital and data platforms
Focus areas FY2022Digital• Deliver a personalised platform for
all Remote Banking channels and financial management, focused on client needs
• Establish a Capitec Digital ID to facilitate onboarding, signing in and “ID as a service” for all channels
• Simplify mobile payments, create an electronic wallet, enable money send and cash out
• Enhance our cognitive capabilities to maximise operational efficiencies and digital support
• Implement a collaborative development platform to facilitate seamless FinTech engagements
• Enable personalised and contextually relevant digital communications
• Deliver an integrated set of tools to enable client financial education
Data• Collect, manage and govern data as
an enterprise asset• Build leading analytics and modelling
capabilities to support insight-driven decisions and personalised client interactions
• Aggregate new and existing data sources and enable all business areas and clients to benefit from insights
• Create an appreciation of the value of data in the hearts and minds of Capitec employees
72 | Capitec Bank Holdings Limited
Key performance indicators
Leadership reviews
The Capitec Way
Our business context
Our strategic goals and insights
Leadership teams and governance oversight

2019 Risk themes
11
12
8
13
1
4
5
6
7
2
3
910
14
Likelihood
Change in our fundamentals
Diminishing client service
Inability to adapt to new technologies
Inadequate business continuity
Losing focus
Reputational riskData theft
Scalability of systems
People risk
Model risk
Internal/External Fraud
Cyberattacks
Regulation and cost of compliance Succession
planning
Movement since 2018
Impact
Integrated Annual Report 2019 | 73
our strategic risks
Risk management report
Remuneration report
Social responsibility
About this report
Appendices Annual financial statements

Non-executive directorsMichiel Scholtz du Pré le Roux (69)BComm LLB, DComm (hc)
Michiel was Capitec and Capitec Bank’s chairman from 2007 until 31 May 2016 when he stepped down. He continues to serve on the board as a non-executive director. He was the bank’s chief executive officer until 2004.
Michiel was appointed to Capitec’s board on 1 March 2001 and to Capitec Bank’s board on 6 April 2000.
Nonhlanhla Sylvia Mjoli-Mncube (60)BA, MA (City and regional planning)
Nonhlanhla manages her own company, Mjoli Development Group, and was the economic adviser to a former deputy president of South Africa. She has worked as a town and regional planner in South Africa and as a survey research supervisor at Washington State University. She was an executive director of a subsidiary of Murray & Roberts. She was the chairman of the National Urban Reconstruction and Housing Agency (NURCHA), the Rural Housing Loan Fund, Women for Housing and the Open Society Institute in South Africa. She is a fellow of the Massachusetts Institute of Technology and a Harvard University Leadership alumnus. She has won several business women’s awards and is a director of Ansys, Pioneer Foods, Tongaat Hulett, and Zeder Investments.
Nonhlanhla was appointed to Capitec and Capitec Bank’s boards on 26 January 2004.
Nonhlanhla will retire from the board effective 31 May 2019.
Petrus Johannes Mouton (42)BComm (Maths)
Piet is the chief executive officer of PSG Group. He serves as a director on the boards of various PSG Group companies, including Curro Holdings, PSG Konsult and Zeder Investments. He has been active in the investment and financial services industry since 1999.
Piet was appointed to Capitec and Capitec Bank’s boards on 5 October 2007.
Chris Adriaan Otto (69)BComm LLB
Chris has been an executive director of PSG Group since its formation and has served as a non-executive director since February 2009. He is also a director of Distell Group, Kaap Agri and Zeder Investments.
Chris was appointed to Capitec and Capitec Bank’s boards on 6 April 2000.
Riaan Stassen (65)BComm (Hons), CA(SA)
Chairman of the board and the directors’ affairs committee
Riaan joined Capitec Bank as managing director in 2000 and served as chief executive officer of Capitec and Capitec Bank from March 2004 until his retirement on 31 December 2013. He succeeded Michiel le Roux as chairman of the board on 1 June 2016. He gained extensive experience in wholesale distribution and banking and held senior positions in both environments before joining Capitec. Riaan was awarded the Cape Times KPMG Business Personality of the Year award in 2007. The nomination criteria for this award included business and entrepreneurial excellence and outstanding company performance. He also serves on the board of PSG Konsult.
Riaan was appointed to Capitec and Capitec Bank’s boards on 1 March 2001.
74 | Capitec Bank Holdings Limited
leadershipteams
Key performance indicators
Leadership reviews
The Capitec Way
Our business context
Our strategic goals and insights
Leadership teams and governance oversight

Independent Non-executive directorsLindiwe Angela Dlamini (49)BA (Law), LLM (Tax Law)
Chairperson of the human resources and remuneration committee
Lindi was the group executive: human resources at PPS until 31 October 2018. Previously she was the managing director: retail at Alexander Forbes Group Holdings (2013–2015) and group executive: emerging consumer markets at Liberty Holdings (2011–2013). At Liberty Group she gained extensive experience in various legal and risk management roles as well as in operations and customer services (1998–2011).
Lindiwe was appointed to Capitec and Capitec Bank’s boards on 6 April 2017.
Kabelo Makwane (42)BComm
Chairman of the social and ethics committee
Kabelo is the managing director for Accenture, Africa. Previously he was the managing director of Microsoft, Nigeria (2013–2016), which he successfully developed into a stand-alone subsidiary of Microsoft Corporation. He gained extensive experience in IT and sales during his career at Storgate Africa (2001), Datacentrix (2001–2003), Unisys (2004), Cisco Systems (2004–2009) and Microsoft South Africa (2009–2013).
Kabelo was appointed to Capitec and Capitec Bank’s boards on 6 April 2017.
John David (Jock) McKenzie (72)BSc (Chemical Eng), MA
Chairman of the risk and capital management committee and lead independent director
Jock serves on the boards of a number of companies. He was the chairman and chief executive officer of Caltex Petroleum Corporation until 2001. He was extensively involved in the merger of Caltex, Chevron and Texaco and was president – Asia, Middle East and Africa – of Chevron-Texaco until 2004. Between 1997 and 2003 he was a member of a number of advisory boards in Singapore, including the American Chamber of Commerce. He was the founding president of the South Africa–Singapore Business Council and a member of the Singapore Economic Development Board. Since 2004 he has served as a consultant to the Energy Market Authority and Temasek Holdings in Singapore and acted as the chairman of the Commission of Inquiry into the Singapore Electricity and Gas Supply Systems. In South Africa, he has consulted for, among others, Sasol, the South African Petroleum Industry Association’s investigation into the impact of the global economic crisis on the South African oil industry and other related topics. He currently serves on the boards of Coronation Fund Managers, Sappi and Zululand Distilling Company and is the chairman of the UCT Foundation, the Carleton Lloyd Educational Trust and the Rondebosch Schools Education Trust.
Jock was appointed to Capitec and Capitec Bank’s boards on 1 March 2012.
Jean Pierre Verster (38)BCompt (Hons), CA(SA), CFA, CAIA
Chairman of the audit committee
Jean Pierre is currently an equity portfolio manager at Fairtree Capital. Previous positions include investment analyst at 36ONE Asset Management and analyst and portfolio manager at Melville Douglas Investment Management. Prior to entering the investment management industry, he fulfilled various roles within the Standard Bank Group, including that of credit and corporate research analyst in the bank’s Global Markets Research division, where he analysed the financial position of companies from a credit perspective. In 2005, he started his career as a financial manager in the insurance services environment. In 2006, he gained experience as an internal auditor in the retail banking environment.
Jean Pierre was appointed to Capitec and Capitec Bank’s boards on 23 March 2015.
Daniel Petrus Meintjes (62)BPL Hons (Industrial Psychology), AMP
Danie served as chief executive officer of the Mediclinic group from 2010 up to his retirement on 1 June 2018. He currently serves as a non-executive director on the board of Mediclinic International.
Danie joined the Mediclinic group in 1985 as a hospital manager. He was appointed as a member of Mediclinic’s executive committee in 1995 and as a director in 1996. He was seconded to serve as a senior executive of the Mediclinic group’s operations in Dubai in 2006 and appointed as chief executive officer of Mediclinic Middle East in 2007.
He served as a non-executive director of Spire Healthcare Group from 2015 up to his retirement in May 2018.
Danie was appointed to Capitec and Capitec Bank’s boards on 28 November 2018.
Integrated Annual Report 2019 | 75
Risk management report
Remuneration report
Social responsibility
About this report
Appendices Annual financial statements

Executive directorsGerhardus Metselaar Fourie (55)BComm (Hons), MBA
Chief executive officer (CEO)
Gerrie was head: operations at Capitec Bank from 2000 until his appointment as chief executive officer of Capitec and Capitec Bank effective 1 January 2014. He started his career at Stellenbosch Farmers’ Winery in 1987 in the financial planning department and was later appointed as the area general manager of KwaZulu-Natal and later Gauteng. He serves on the Mastercard MEA advisory board as well as on the board of Creamfinance.
Gerrie was appointed to Capitec and Capitec Bank’s boards on 20 September 2013.
André Pierre du Plessis (57)BComm (Hons), CA(SA)
Chief financial officer (CFO)
André joined Capitec Bank in 2000 as the executive: financial management. He has extensive experience in business advisory services, financial consulting and strategic and financial management. He was the chief executive of financial management for Boland PKS and NBS Boland Group from 1996 to 2000. He was a partner at Arthur Andersen, where he was employed from 1986 to 1996. He serves on the boards of Creamfinance, Praelexis and a non-profit organisation, Community Keepers.
André was appointed to Capitec and Capitec Bank’s boards on 2 May 2002.
Nkosana Samuel Mashiya (43) MComm (Economics)
Executive: risk management
Nkosana joined Capitec Bank on 1 November 2015. He was the deputy registrar of banks at the SARB since 2011. He was responsible for the policy framework to guide the prudential supervision and regulation of the financial conglomerates in South Africa since 2014 and was acting managing director of the Co-operative Banks Development Agency since 2011. Previously he worked at the National Treasury as chief director: international finance (2010 to 2011), chief director: financial sector development (2006 to 2010) and director: banking development (2002 to 2006). Nkosana started his career as a lecturer at the University of Johannesburg (1998 to 2001). He later moved to the University of Natal as a lecturer (2001 to 2002) before joining National Treasury.
Nkosana was appointed to Capitec and Capitec Bank’s boards on 1 June 2016.
Company secretaryYolande Mariana Mouton (52)BSc (Hons) MSc
Yolande joined the Capitec group in 2000 and served as assistant company secretary from 2001 until November 2015 when she was appointed as company secretary of the Capitec group. Prior to entering banking, she was a researcher at the University of Stellenbosch Medical Faculty (1993 to 1998).
At Capitec we believe in ethical leadership and set the tone for ethics from the top. Ethical behaviour is integrated into how we operate.
76 | Capitec Bank Holdings Limited
Key performance indicators
Leadership reviews
The Capitec Way
Our business context
Our strategic goals and insights
Leadership teams and governance oversight

Executive management committee
Jacobus Everhardus Carstens (50)BCompt (Hons), CA(SA)
Executive: credit
Jaco joined Capitec Bank in 2004. He gained extensive experience in the credit environment at Old Mutual Bank from 2000 to 2004, serving at various times as head of credit, head of credit risk: policy and decision support, and assistant divisional manager: credit, pricing and decision support. Previous positions include manager at Boland Bank from 1997 to 1999 and assistant manager at Ernst & Young from 1992 to 1997.
Francois Viviers (36)BComm (Hons)
Executive: marketing and communications
Francois joined Capitec Bank as national brand manager in 2011. During 2015 and 2016 he fulfilled various positions at Capitec Bank, namely head: client relationship marketing and head: marketing and corporate affairs. He served on the executive management committee as a development member during 2015. He was appointed as executive: marketing and communications on 1 June 2016. Previously he was marketing manager at Shoprite (Africa and Indian Ocean Islands) (2006–2011) and gained extensive experience as part of Shoprite’s South African brand team (2005).
In addition to the CEO, CFO and executive: risk management, the EXCO comprises the following members:
André Olivier (51)BComm (Hons), CA(SA)
Executive: business development
André joined Capitec Bank in 2000 and has been responsible for business development ever since. Card services were incorporated into his portfolio in 2009. He was the financial risk manager at Boland PKS, after which he was head of operations for Pep Bank, in the bank’s micro-lending division from 1997 to 2000. He gained audit and business advisory experience with Arthur Andersen.
Hendrik Albertus Jacobus Lourens (53)BComm (Hons), CA(SA)
Executive: operations
Henk joined Capitec Bank’s predecessor in 1999 as head of the branch acquisitions department. He was appointed as Capitec’s operations manager responsible for the Northern Cape, Western Cape, Eastern Cape, Free State and KwaZulu-Natal in 2001. He held this position until 2007 when he became the national sales manager. Henk was appointed as executive: operations on 1 January 2014. Before joining Capitec Bank, Henk was the financial director of Group Five Building – Western Cape. He started his career with Ernst & Young.
Willem de Bruyn (48)BSc (Hons), (Computer Science)
Executive: IT
Wim joined Capitec Bank on 1 November 2014. He was chief information officer at Standard Bank until 2014, responsible for personal and business banking in South Africa and across 18 African countries. He has been extensively involved in the retail banking strategy, has international experience in IT management and has implemented large-scale projects during his career. He started his career with Standard Bank as a software developer in 1992.
Leonardus Venter (57)BA (Hons), MA (Industrial psychology)
Executive: business support centre
Leon joined Capitec Bank as head of human resources in 2000. He was appointed as executive: business support centre in 2009. Previous positions include human resources manager at Iridium Africa (1998–1999), manager of human resources and support at Telkom SA (1993–1997) and area personnel manager at Iscor (1986–1992).
Nathan Stephen Tlaweng Motjuwadi (52)BA (Hons), UED, MBA
Executive: human resources
Nathan joined Capitec Bank in 2010 with almost 15 years’ experience in the human resources/training environment. Prior to joining the bank, he was employed by XPS Services, Cyborg Systems, Coca-Cola (SA) (based in South Africa and London) and Danone SA. Nathan started his career as a teacher and head of department (English and History) from 1993 to 1995. He also lectured part-time at Unisa’s School of Business Leadership.
There are 2 development seats on the EXCO to provide senior employees with the opportunity to gain experience at an executive level. The incumbents rotate annually. The seats were filled by Grant Hardy, Head: financial management and Sharon van Horsten, head: recruitment and selection during the 2019 financial year. The development members for the 2020 financial year are Anbann Chetti, Head: financial management and Wilhelm Koster, Head: credit client strategy.
Integrated Annual Report 2019 | 77
Risk management report
Remuneration report
Social responsibility
About this report
Appendices Annual financial statements

Capitec Bank Holdings Limited 1999/025903/06 Registered bank-controlling company incorporated in the
Republic of South Africa and listed on the JSE.
40.25%
CreamfinanceHE 335345
Incorporated in Cyprus
International online consumer lending
33.33%
Praelexis Proprietary
Limited2012/149960/07
Incorporated in RSA
Machine-learning specialist
100%
Capitec Bank Limited
1980/003695/06
Incorporated in RSA
Retail bank
100%
Capitec Properties Proprietary
Limited1998/007658/07
Incorporated in RSA
Property holding company
100%
Keymatrix Proprietary
Limited1999/010617/07
Incorporated in RSA
Dormant
Keynes Rational Corporate Services
Proprietary Limited
1999/0014817/07
Incorporated in RSA
Dormant
100%
78 | Capitec Bank Holdings Limited
group structure
Key performance indicators
Leadership reviews
The Capitec Way
Our business context
Our strategic goals and insights
Leadership teams and governance oversight

We adhere to our 4 core fundamentals in all decisions: simplicity, affordability, accessibility and personalised experience. These drive ethical behaviour in our working environment.
We have applied the King IV™(1) principles, explained our arrangements on our website and made the related disclosures in this report. The online register in the investor centre on www.capitecbank.co.za contains a summary and references.
Our risk management approach and arrangements are set out in the risk management report on page 88.
The awards received by Capitec this year confirm our legitimacy as a bank and as a good South African corporate citizen. Read more on page 51.
(1) Copyright and trademarks are owned by the Institute of Directors in Southern Africa NPC and all of its rights are reserved.
Integrated Annual Report 2019 | 79
goodgovernance
Risk management report
Remuneration report
Social responsibility
About this report
Appendices Annual financial statements

We lead by example and adhere to our 4 core fundamentals in all decisions: simplicity, affordability, accessibility and personalised experience. The principle of simplicity and transparency creates control and underpins our corporate governance. This ensured a solid foundation in a year where many South African corporate reputations and transactions were under intense scrutiny by shareholders and activists.
Maintaining an ethical cultureOur working environment demands high ethical standards and our rules apply equally to all, regardless of position. Ethical practices pervade our business dealings and our interactions with stakeholders.
Employees have access to a range of policies that give guidance on ethical conduct on the company’s intranet and are encouraged to live out the Capitec Way behaviours: to act with energy, take ownership and put the client first. This can be done by challenging upwards and downwards to ensure robust decision-making and by reporting suspicious behaviour to management. Employees can also use our disciplinary code or Tip-offs Anonymous – the contact details are on the company’s intranet.
The social and ethics committee monitors ethical behaviour by the company and its employees. No material ethical breaches were reported this year. The committee’s report can be found on page 135.
Measuring good performanceThe Capitec Way is to create ownership and use measurement to facilitate improved performance. Management identifies issues quickly at twice-weekly meetings and acts accordingly.
Our board approves the business plan for each year and tracks performance against key indicators at each board meeting. Our performance track record supports this: we have been creating value for our stakeholders since Capitec was established in 2001. This was confirmed when Capitec Bank came out on top in the 2018 Sunday Times Top 100 Companies, based on Capitec’s share performance on the JSE over the past 5 years.
Ensuring effective controlBest governance practice and management requirements direct us to implement control measures and report accordingly. The board is ultimately responsible for effective control through its committee structure and approved policies, supported by the MOS and the collaborative risk, compliance and internal audit functions.
Our ability to identify the correct data and report accordingly to the respective board committees provides the board with the comfort that they have oversight of data they can trust.
Our MOS offers an integrated review system to manage objectives, business plans, budgets and risk. The MOS measures operational and resource efficiency on all levels of the business. This supports effective decision-making based on accurate and real-time data.
Maintaining legitimacyTo strengthen our drive to improve people’s financial lives and make banking better, we foster strong relationships with all contributing stakeholders. We interact with regulators to find industry solutions and meet with investors to help them understand our performance.
In our branches, we greet clients with a handshake and do regular surveys and data analyses to get to know them better. This helps us make banking simple, accessible and affordable. Our management team members spend time in the branches talking to clients. They track complaints and monitor social media to garner insights into what people say about Capitec.
We recruit branch employees from local communities and invest in social initiatives that focus on education and financial life skills programmes.
The directors’ affairs committee is tasked with monitoring corporate governance and there have been no material breaches during the year. The main key focus for the past financial year was board succession planning.
Responsibility for overall stakeholder engagement resides with the EXCO, who rely on different functions to engage with specific stakeholders. The social and ethics committee carries governance responsibility
80 | Capitec Bank Holdings Limited
Key performance indicators
Leadership reviews
The Capitec Way
Our business context
Our strategic goals and insights
Leadership teams and governance oversight

for monitoring relationships with stakeholders. Our stakeholder group remains constant but the topics of engagement change every year based on our operating environment and client offering.
Our boardCapitec’s board of directors is ultimately responsible for the Capitec group in its entirety. It instructs and oversees a management and control structure that directs and executes all functions within the group. The Capitec Bank board is identical to that of Capitec.
Our directors have a fiduciary duty to act with care and skill and to exercise their powers and perform their functions as directors in the best interest of the group. Each director has declared that he/she undertakes to:• act in good faith towards the Capitec group;• avoid conflict between his/her other interests and the
interests of the Capitec group; and• place the interest of the Capitec group and its depositors
above all other interests.
Directors are required to disclose matters that may potentially result in a conflict of interest. A declaration of interest is circulated for sign-off by each director at all board meetings. No director may offer a service, product or cooperation agreement to the group on behalf of any organisation in which he or she has a direct or indirect interest at a meeting of the board or its committees. Such service, product or agreement may be offered to the management of the company, by the management of the related organisation. If a decision to acquire the service or product or conclude the agreement is ultimately referred to the board, the concerned director is required to recuse her-/himself.
Directors, EXCO and all employees with access to key management reports have to obtain clearance to trade in Capitec shares. The chairman of the board, the CEO, the CFO and the company secretary are mandated to authorise clearance to deal in Capitec shares.
No trading is allowed during closed periods or when information exists that may affect the share price that has not been disclosed to the public. Director trading as well as trading by the company secretary and any of
their associates is published on the JSE Stock Exchange News Service (SENS) in accordance with regulatory requirements.
Our board takes full responsibility as the governing body of Capitec and is satisfied that it fulfilled its responsibilities in accordance with its charter, King IV™, the JSE Listings Requirements, the Companies Act, Act 71 of 2008, as amended, and applicable statutory and regulatory requirements for the financial year.
Changes were made to the board charter this year to clarify the responsibilities of the lead independent director and to align with a new directive from the Prudential Authority on the independence criteria for board members.
How the board functionsThe board remains ultimately responsible for ensuring that its approved strategy is implemented, and that the group’s purpose is fulfilled. The board also accepts its responsibility to ensure that risks are adequately identified, measured, managed and monitored and that good governance is maintained. The board discharges its duty through policies and frameworks supported by 6 board committees.
At the core of our success is effective and ethical leadership provided by an experienced and skilled board of directors and executive management committee.
Integrated Annual Report 2019 | 81
Risk management report
Remuneration report
Social responsibility
About this report
Appendices Annual financial statements

Comprehensive management reports are submitted to the board for each meeting and relevant reports are distributed to the committees to facilitate in-depth perspectives. These reports include industry matters and external factors that may affect Capitec. The annual board conference addresses pertinent matters and future strategy.
EXCO, together with a number of subcommittees, manages the business through a system of internal controls that function throughout the group. This promotes the awareness of risk and good governance in every area of the business and instils a culture of ethical behaviour and compliance.
Our board-approved delegation-of-authority framework consists of charters and policies. Detailed roles and responsibilities as well as authority limits have been assigned to individuals and committees. The board has confirmed, based on the recommendation of its sub-committees and reports provided by management, the internal and external auditors and policies and procedures implemented at Capitec, that it is satisfied that internal controls are appropriate and that the duties of staff are sufficiently segregated to support the strength of internal controls. The board further confirmed its satisfaction that it has fulfilled its responsibilities in accordance with its charter.
Human resources and remuneration
committee (REMCO)
More on p 84
3
Capitec board
13
Directors’ affairs committee
More on p 83
10
Executive committee
(EXCO)
More on p 85
12
Risk and capital management committee
(RCMC)
More on p 84
6
Audit committee
More on p 83
3
Social and ethics
committee
More on p 85
3
Board composition and diversityWe believe in inclusivity and equity at board level, subject to merit. The composition of the board is reviewed annually by an evaluation subcommittee of the directors’ affairs committee.
• Gender diversity target as per our policy: at least 10% 2019: 15%
• Race diversity target as per our policy: 25% 2019: 31%
Read more about the diversity in skills and experience of our board members in the profiles from page 74.
A new director was appointed during the year. We appoint directors according to a policy that prescribes a transparent process. The directors’ affairs committee, under leadership of the chairman, presides over board appointments. When specific skills are required, candidates are identified and recommended to the full board for endorsement. With the board’s sanction and subject to the Prudential Authority not objecting to the appointment, the individual is approached and formally appointed. Shareholders have the opportunity at the AGM following the appointment of a new director, to endorse or veto the appointment.
82 | Capitec Bank Holdings Limited
Key performance indicators
Leadership reviews
The Capitec Way
Our business context
Our strategic goals and insights
Leadership teams and governance oversight

Newly appointed board members are formally inducted through a programme comprising reading, interviews and exposure to bank operations, such as visits to call centres and branches. All board members have an open invitation to attend training presented by the Gordon Institute of Business Science (Gibs) and ad hoc training is presented in-house from time to time. Presentations are aimed at enhancing directors’ insight into developments at the bank and legislation and regulations that affect the group. The new director will attend the banking board leadership programme presented by Gibs, biennially, in 2020.
The board is satisfied that its composition reflects the appropriate mix of knowledge, skills, experience and diversity.
Board performance and independence evaluationsThe effectiveness of the board is managed throughout the year and any areas of concern are addressed as they arise. The board is also assessed annually via an internally conducted formal process that deals with individual directors and the board and its various committees.
The results of the assessment for the 2019 financial year indicated that the board may be strengthened by additional technical expertise and increased independence as guidance in the future composition of the board. The board is satisfied that it continues to function well and that the evaluation contributes to continuous improvement of the board’s performance and effectiveness.
The independence of non-executive directors and factors that may impair their independence are evaluated annually. The board is satisfied that the independence of Ms Dlamini and Messrs Makwane, McKenzie, Meintjes and Verster remains unaffected.
The chairmanOur chairman is not independent and is therefore assisted by a lead independent director, whose role is determined by the board charter. According to the charter, the lead independent director provides leadership in situations where the chairman is deemed to have conflicting interests. A board-approved policy specifies how we ensure a balance of power and authority at board level. No one individual has unfettered decision-making powers.
The chief executive officerOur chief executive officer (CEO) is appointed by the board. He is responsible for leading the EXCO in formulating and developing the group objectives and implementing the strategies approved by the board. The roles and duties of the chairman and the CEO are separated.
The CEO chairs the EXCO, thereby leading the implementation and execution of approved strategy, policy and operational planning. The CEO is accountable and reports to the board on the progress made on the approved business plan at every board meeting.
The REMCO formally evaluates the performance of the CEO against agreed performance measures and targets, at least annually. The REMCO is responsible for succession planning for the CEO.
Company secretaryYolande Mouton is the company secretary of the Capitec group. The company secretary acts as a conduit between the board and the organisation and is responsible for board administration, liaising with the Companies and Intellectual Property Commission and the JSE Limited and providing corporate governance services to the board. Board members have access to legal and other independent professional expertise when required and at the cost of the group through the company secretary. The directors’ affairs committee has expressed their satisfaction with this arrangement.
The directors’ affairs committee reviewed the qualifications, experience and competence of the company secretary through discussion and assessment and noted that she had performed all formalities and substantive duties timeously and in an appropriate manner. The committee confirmed its satisfaction in all instances.
The company secretary is not a director of any company in the Capitec group and has, to date, maintained a professional relationship with board members. She has given direction on good governance, as and when required. The committee is satisfied that she maintains an arm’s-length relationship with the board.
Integrated Annual Report 2019 | 83
Risk management report
Remuneration report
Social responsibility
About this report
Appendices Annual financial statements

Attendance of board and committee meetingsThe board meets 6 times a year. A quorum comprises a majority of directors of which as least 50% must be non-executive. The board is satisfied with the level of attendance of meetings, which enabled it to fulfil its responsibilities according to its charter.
Committee BoardAudit
committee
Directors’affairs
committee RCMC REMCO
Socialand ethicscommittee
Number of meetings 6 3 2 4 2 2
R Stassen 6 3(1) 2 4 2(1) –
L Dlamini 5 2(1) 2 – 2 2
AP du Plessis 6 3(1) – 4 – –
GM Fourie 6 3(1) – 4(1) 2(1) –
MS du Pré le Roux 6 3(1) 2 – 2(1) –
K Makwane(4) 5 2 2 – – –
NS Mashiya 6 3(1) – 4(1) – 2
JD McKenzie 5 3 2 3 2 –
DP Meintjes(2)(3) 2 – – – – –
NS Mjoli-Mncube 6 3(1) 2 – – –
PJ Mouton 6 3(1) 2 4 – 2
CA Otto 6 3(1) 2 4 2 –
JP Verster 6 3 2 4 – –
(1) Attendance by invitation.(2) Mr Meintjes was appointed to the board on 28 November 2018.(3) Mr Meintjes was appointed to the risk and capital management committee on 22 February 2019.(4) Mr Makwane was appointed to the social and ethics committee on 22 February 2019.
84 | Capitec Bank Holdings Limited
Key performance indicators
Leadership reviews
The Capitec Way
Our business context
Our strategic goals and insights
Leadership teams and governance oversight

Board committeesApart from the directors’ affairs committee, which is required in terms of the Banks Act to comprise only non-executive directors, the composition of all committees is reviewed annually by the directors’ affairs committee and approved by the board.
All committees comprise at least 3 members. All board members are welcome to attend committee meetings, although they do not have voting rights in committees of which they are not members. The following committees, comprising directors and executives, are in place to deal with specific risks facing the group in a structured manner and in accordance with board-approved charters.
Audit committee
CompositionIndependent non-executive directors• JP Verster (chairman)• K Makwane• JD McKenzie
Management attendees• AP du Plessis• GM Fourie• NS Mashiya• J-HC de Beer (compliance)• D Flannery (internal audit)
By invitation • All directors• External auditors
QuorumAt least 50%, but not fewer than 2 members
Purpose• The committee considers the combined
assurance arrangements with focus on internal audit, compliance and external audit. The RCMC monitors risk management in the group.
• The committee evaluates the adequacy and efficiency of the internal control systems, accounting practices, information systems and auditing processes applied within the group companies in the day-to-day management of their business.
• The committee evaluates the going-concern status of the group.
• The committee considers the continuous independence of the external auditors.
• The committee considers the integrity of the annual financial statements and the sustainability matters forming part of the integrated annual report.
• The audit committee report, dealing with the requisite disclosures, is included in the annual financial statements.
• The audit committee reviewed the annual financial statements for correctness and recommended these for approval by the board.
2019/20 focus areas• Implementation of IFRS 16
The audit committee is satisfied that it has fulfilled its responsibilities according to its charter for the year.
Directors’ affairs committee
Composition• R Stassen (chairman)• All non-executive directors
QuorumAt least 50%
Purpose• The committee monitors the effectiveness of
corporate governance.• The committee deals with matters relating to
the nomination of new directors, according to a board-approved policy.
• The committee deals with the evaluation of the performance of the board and its committees – it usually delegates the responsibility to a subcommittee consisting of the members of the REMCO.
2019/20 focus areas• Independence of the board
The directors’ affairs committee is satisfied that it has fulfilled its responsibilities according to its charter for the year.
Integrated Annual Report 2019 | 85
Risk management report
Remuneration report
Social responsibility
About this report
Appendices Annual financial statements

Risk and capital management committee (RCMC)
CompositionIndependent non-executive directors• JD McKenzie (chairman)• JP Verster• DP Meintjes
Non-executive directors• PJ Mouton• CA Otto
Executive director• AP du Plessis
Management attendees• GM Fourie• NS Mashiya• JE Carstens• J-HC de Beer• A Keizer (risk officer)• D Flannery • P Govender (head:
anti-money laundering)
QuorumAt least 50%, but not fewer than 2 members
Purpose• The committee assists the board in evaluating
the adequacy and efficiency of the risk and capital management systems and processes and the significant risks facing the group.
• The committee monitors that risk assessment is performed continuously.
• The chairmen of the audit and the risk and capital management committees serve on the respective committees to facilitate increased effectiveness of the respective functions.
2019/20 focus areas• Continued monitoring and
consideration of risks and related opportunities.
The RCMC is satisfied that it has fulfilled its responsibilities according to its charter for the year.
Human resources and remuneration committee (REMCO)
CompositionIndependent non-executive directors• LA Dlamini (chairperson)• JD McKenzie
Non-executive director• CA Otto
Management attendees• GM Fourie• NST Motjuwadi
By invitation• MS du Pré le Roux• R Stassen
QuorumAt least 50%, but not fewer than 2 members
Purpose• The committee ensures that remuneration
policies and practices are established in accordance with the provisions of the Banks Act and its regulations and sound corporate governance practices.
• The committee ensures that practices are observed to attract and retain individuals to create sustainable value for all stakeholders.
2019/20 focus areas• Continuous review of
remuneration to ensure fairness and reasonability
• Broadening the existing performance accountability and its influence on remuneration
• Further progress on transparency, while monitoring developments in best-practice recommendations on disclosure
• Ongoing employee engagement to drive mutual understanding and ensure continued remuneration and benefit relevance for the employee
The REMCO is satisfied that it has fulfilled its responsibilities according to its charter for the year.
86 | Capitec Bank Holdings Limited
Key performance indicators
Leadership reviews
The Capitec Way
Our business context
Our strategic goals and insights
Leadership teams and governance oversight

Social and ethics committee
Composition Independent non-executive directors• PJ Mouton
(outgoing chairman)• K Makwane (chairman)
(as of 22 February 2019)• LA Dlamini
Executive director• NS Mashiya
Management attendees• A Keizer• NST Motjuwadi• YM Mouton
QuorumAt least 50%, but not fewer than 2 members
Purpose• The committee monitors activities relating
to social and economic development, good corporate citizenship and the environment, to promote the collective well-being of society, thereby facilitating the sustainable growth of the group.
• The committee tracks the impact of the group’s activities and service, with specific focus on client and employee relations.
2019/20 focus areas• Ethics: substance over form
The social and ethics committee is satisfied that it has fulfilled its responsibilities according to its charter for the year.
Large exposures committee
Composition • RCMC (refer to previous
page)
Management• JE Carstens• GM Fourie• NS Mashiya
QuorumMajority of members Meets as required
Purpose• The committee approves credit exposures in
excess of 10% of bank capital on an ad hoc basis as may be required.
Executive committee (EXCO)
CompositionAs per pages 76 to 77; and the 2 annually elected development members
QuorumAt least 3 of the following: CEO, CFO, executive: risk management and executive: operations (quorum members) or replacement members as appointed by EXCO, subject to at least 2 being quorum members
Purpose • The committee conducts operational decision-
making.• The committee implements board-approved
strategic decisions.• The committee conducts ongoing approvals of
an administrative nature.
Meeting frequency• Meets twice a week with an extended monthly
meeting.
2019/20 focus areas• Healthy organisation• Project development
Integrated Annual Report 2019 | 87
Risk management report
Remuneration report
Social responsibility
About this report
Appendices Annual financial statements

We manage risks to ensure that we can continue creating sustainable value for stakeholders. We do this in a responsible way and have a culture of risk management. This directs behaviour to best align with the Capitec risk appetite.
The outcomes of effective risk management are higher levels of certainty about potential risks and ways to mitigate these, and an improved ability to achieve our strategic objectives.
Enterprise risk management frameworkOur enterprise risk management framework governs risk management and aims to continuously improve our risk culture. This requires an integrated approach in all business areas.
There is evidence of more awareness and an increase in the reporting of risks from employees. Collaboration with internal audit is an effective mechanism to identify new or emerging risks. Our risk culture was tested this year by unanticipated events such as the Viceroy reports. In all cases our crisis management plans proved to be effective and agile. The enterprise risk management framework defines Capitec’s risk management universe, structure, policies and processes. No changes were made to the framework this year: the focus was on the maturity of implementation.
The governance of riskThe board remains ultimately responsible for ensuring that risks are adequately identified, measured, managed and monitored and that good governance is maintained. The board monitors the implementation of the risk strategy, approves the risk appetite and ensures that risks are managed within tolerance levels.
Capitec’s risk universe consists of 6 risk categories that are managed by EXCO and 3 risk management committees: the risk committee (RISCO), the credit committee (CC) and the asset and liability committee (ALCO). These committees report to the RCMC, which has been mandated by the board to oversee risk management.
Operational risk
RISCO
ALCO
CC
EXCO
Reputational risk
Market risk
Credit risk
Business risk
Capital and liquidity risk
Capitec board
RCMC
Enterprise risk management governance The RCMC, which is composed of executive, non-executive and independent non-executive directors, oversees risk management according to a board-approved charter. The committee meets quarterly and includes senior management attendees with representation from risk, credit, compliance and internal audit. This ensures that a consistent risk appetite is shared by management and the board. We believe the composition of the RCMC is important to ensure that proper governance is maintained and that healthy risk discussions are encouraged from a forward-looking perspective while also taking past risk events into account.
* Denotes text in the risk management report that forms part of the group’s audited annual financial statements.
*
*
*
88 | Capitec Bank Holdings Limited
risk management
Key performance indicators
Leadership reviews
The Capitec Way
Our business context
Our strategic goals and insights
Leadership teams and governance oversight

1 Executive management considers and mitigates operational risks and compliance.
Inte
rnal2
Risk functions such as the compliance forum, audit forum and enterprise risk management services provide an integrated view and validation of risks for all levels of the business on an ongoing basis. The continuity management team (CMT), ALCO and the credit committee (CC) review risks, agree on mitigating actions and assign responsibilities.
3Internal audit provides independent validation and review of risk management and compliance processes at all levels on an ongoing basis.
4Various external risk audits and interventions are done by the SARB, the NCR, external audit, external assurance providers, advisory services and verification agencies.
Ext
erna
l
5The Capitec board sub-committees (audit, RCMC and directors’ affairs) oversee all aspects of risk and compliance management.
EXCOSemi-weekly
ECC Weekly
CMTQuarterly
ALCOMonthly
CCMonthly
Audit forumMonthly
Compliance forum Quarterly
External audit
RCMCQuarterly
Directors’ affairs committeeBi-annually
Audit committee Tri-annually
RISCOQuarterly
Risk and compliance levels of management and oversight: Roles, risk nature and frequency
5 levels of risk management We use 5 levels of risk management to ensure integrated, objective and effective identification, monitoring, response and evaluation of risk. The EXCO is at the core of risk management: at their weekly operational meetings, risks are reported and addressed as a first line of defence.
Risk and compliance information flow and reportingIn a business as usual scenario, risk and compliance information flows outward from the EXCO according to structured agendas, roles and responsibilities. The board monitors that risk is governed holistically and in such a way that it supports Capitec in achieving its strategic objectives.
In the case of a material risk event, EXCO will immediately inform key representatives on the board, and inform individuals on the relevant levels of risk management.
This year we formalised risk and compliance as second-line functions with oversight roles rather than a reporting function. Internal audit remains the third line of defence. Our comprehensive and integrated risk management governance structure consists of committees with varying areas of responsibility to ensure that the full risk universe is covered.
EXCO
Board of directors
1 2 3 4 5*
* Denotes text in the risk management report that forms part of the group’s audited annual financial statements.
Integrated Annual Report 2019 | 89
Risk management report
Remuneration report
Social responsibility
About this report
Appendices Annual financial statements

Directors’ affairs committeeBi-annually
Capitec boardBi-monthly
Large exposures committee
Ad hoc
Compliance forum
Executive meetingsWeekly
REMCOAnnually
Credit committee (CC)
Monthly
Internal audit forum
Social and ethics committeeBi-annually
Asset and liability committee (ALCO)
Monthly
Executive credit committee
(ECC)Weekly
Continuity management team (CMT)
RCMCQuarterly
Risk committee (RISCO) Quarterly
Model governance committee
(MTSC)
Data committee (DC)
Audit committeeTri-annually
Data governance steering committee
Quarterly
Combined assurance
Risk and regulatory oversight
committee (RROC)
Policy steering committee(POLCO)
EXCO
Non-executive and executive members
Committee chairs are EXCO members
Forum chairs are EXCO members
Management working committees with EXCO chair in most cases
90 | Capitec Bank Holdings Limited
Key performance indicators
Leadership reviews
The Capitec Way
Our business context
Our strategic goals and insights
Leadership teams and governance oversight

Risk management process elements
Risk identificationHeads of business carry the primary responsibility for the risks in the group, particularly to identify and manage risk appropriately. The risk management department facilitates risk self-assessment workshops, where appropriate, to assist. Identified risks are formally documented on our risk registers and have designated risk owners. Mitigation plans are tracked against predetermined timelines and monitored. The necessary escalation processes are in place.
Risk evaluationRisks are evaluated in terms of 2 criteria: likelihood and impact when materialising. We consider the inherent and residual side of risk. Our board-approved risk matrix allows for consistency in the evaluation of risk. The risk management department supports the business heads by providing independent oversight and monitoring across the group on behalf of the board and relevant committees. Risk management is headed by an executive risk officer who owns and maintains risk frameworks, maintains risk governance structures and manages regulatory relationships regarding risk matters.
Risk reportingWe believe risk reporting should be clear, concise and put management and the board in a position to make informed risk decisions. Because we believe risk should be managed as part of our daily operations, we developed key risk indicators to assess risk against predetermined tolerance levels. To ensure we report the right risks to the right people at the right time, we adopted the Basel Committee on Banking Supervision principles for effective risk data aggregation and risk – reporting practices under BCBS 239 or commonly known as RDARR.
Embedded RDARR principles in our data management and risk management practicesWe believe that adapting RDARR principles is not enough but that it has to be embedded in our business. Our risk and data management practices are well aligned at present and our data strategy will ensure we continues to improve as we grow.
The board and senior management promote and monitor the efforts of embedding these principles throughout the business. We strive to continuously mature our data governance and risk management practices.
• Define a strong governance framework, risk data architecture & IT infrastructure
• Ensure risk data aggregation capabilities & risk reporting practices and subject to strong governance
• Design, build & maintain data architecture and IT infrastructure
• Generate accurate, reliable and up to date risk data across the banking group activities in order to identify and report risk exposures, concentration and emerging risks
I. Overarching Governance and InfrastructureRDARR
II. Risk Data Aggregation Capabilities
III. Risk Reporting Practices IV. Supervisory Review, tools and coordination
• Ensure reports are accurate, convey aggregated risk data and are reconciled and validated
• Ensure reports are comprehensive, clear, useful and set on a frequency which meets recipients’ requirements
• Supervisors should periodically review and evaluate compliance to these principles
• Ensure reports are comprehensive, clear, useful and set on a frequency which meets recipients’ requirements
Integrated Annual Report 2019 | 91
Risk management report
Remuneration report
Social responsibility
About this report
Appendices Annual financial statements

Our risk appetite and toleranceOur risk appetite is the level of risk we are willing to accept while pursuing our objectives.
As expected from a bank, Capitec’s highest exposure is in the credit risk environment, where we define the appetite level through our pricing model. We aim to achieve a targeted return on equity (ROE) on all credit products. The pricing model combines the revenue and operational costs for a specific loan product and derives the total credit losses that can be absorbed over the term of the product to achieve our targeted ROE.
We adopted a zero appetite towards any risk events related to discrimination. For other operational risk events we have a low appetite, which means that the bank will not knowingly expose itself to the risk that these events occur. To determine risk tolerances, we consider outcome measures for our key objectives, such as revenue growth, market share, client satisfaction or earnings per share. We then consider the range of outcomes above and below the targets that are acceptable. The tolerances are measured by the Capitec MOS indicators.
Operational riskAudit committee
BO
AR
D
RCMC
Data management
Legal
Forensics
Credit risk and capital management
Combinedassurance
Compliance
Enterprise risk management
Internal audit
Risk management and combined assuranceCapitec has a wide range of functions and roles that contribute to combined assurance. Collaboration between functions such as the internal audit and the risk function, for example, is entrenched in annual work plans and feedback processes.
In Capitec both the audit committee and the RCMC oversee the combined assurance model, which includes:• establishing and analysing the risk environment;• enabling an effective internal control environment;• supporting the integrity of information used for internal
decision-making by management, the board and its committees; and
• supporting the integrity of external reports.
The internal players in combined assurance are illustrated below:
* Denotes text in the risk management report that forms part of the group’s audited annual financial statements.
*
92 | Capitec Bank Holdings Limited
Key performance indicators
Leadership reviews
The Capitec Way
Our business context
Our strategic goals and insights
Leadership teams and governance oversight

Stress testing, contingency planning and business continuityThe bank conducts integrated scenario-based recovery planning to prepare for contingencies. In addition to the SARB’s requirements, the bank conducts recovery planning to ensure that it is well prepared to withstand capital, liquidity and operational risk shocks. We have started implementing a business continuity tool that will enable us to develop our own scenarios in future, based on an analysis of drivers for the different business divisions.
A continuity management team is responsible for all aspects of business continuity. The board-approved business continuity framework and methodology are based on ISO 22301. The framework is linked to the disaster recovery plan.
The business continuity and disaster recovery plans contain procedures to be followed should an extreme event occur. The disaster recovery and evacuation plans were tested successfully during the year. The IT disaster recovery plans are tested continuously.
Future focus areas for risk managementWe are exploring options to automate risk management due to the nature and complexity of risks. This includes an automated alert system and will address any deviations from a target range. This tool will also focus on the analysis of data to improve the efficiency of risk management.
Integrated Annual Report 2019 | 93
Risk management report
Remuneration report
Social responsibility
About this report
Appendices Annual financial statements

The RCMC has oversight through its credit subcommittee, which sets credit strategy, approves credit policy and monitors credit risk to be within appetite tolerance, provisions and changes in the operating environment. The executive credit committee (ECC) reports on the credit risk policy-monitoring decisions for each of the stages in the credit life cycle. Financial governance is applied through pricing and provisioning models, regulatory reporting and the internal capital adequacy assessment process (ICAAP). A modelling technical subcommittee (MTSC) has been established to provide a forum for the technical discussion, coordination and direction in setting modelling standards, methodologies and techniques. Integrated risk management is applied across all stages of the credit life cycle.
Detail about the South African unsecured credit market is provided in the section on our business context from page 62.
The risk of loss arising from the failure of a client or counterparty to meet its financial obligations. Our credit risk primarily arises from unsecured retail credit lending.
*
*
* Denotes text in the risk management report that forms part of the group’s audited annual financial statements.
94 | Capitec Bank Holdings Limited
creditrisk
Key performance indicators
Leadership reviews
The Capitec Way
Our business context
Our strategic goals and insights
Leadership teams and governance oversight

Credit risk management decisions are made throughout the credit life cycle with the aim of improving the financial lives of our clients. Various credit management controls such as credit policies, data, models and risk indicators are in place to guide these decisions according to agreed principles and tolerance levels. At each stage, we consider the impact on the probability of default, exposure at default, loss given default, pricing, provisions and profitability.
Our credit-granting approachOur personalised credit solution achieves the best possible credit limit, over the optimal repayment term, with the best interest rate. This is offered to clients based on their past banking and credit behaviour, affordability and the stability of their source of income. We also use data from credit bureau records, bank statements and payslip information.
Our credit-granting approach evolves as we improve our understanding of client needs, behaviours and risk profiles and as we respond to changes in the economic and regulatory environment. The low-growth economic environment means we are taking a cautious approach to credit granting. We apply a sophisticated statistical model when granting credit. We continue to incorporate more machine-learning algorithms and more transactional data into our credit risk-scoring model.
In addition to the comprehensive credit risk-scoring assessment, a client also needs to pass a rigorous affordability assessment to qualify for credit.
Client affordability is assessed by considering the client’s sustainable income, existing debt repayment obligations and other necessary expenses in line with regulatory requirements. We also perform a Capitec disposable income calculation in parallel and use the more conservative outcome of the 2.
The credit application process and calculations are automated and client data is captured based on standardised rules to ensure compliance. Quality is assured through loan reviews and ongoing training of service consultants.
Our credit-granting model puts clients in control of their own credit decisions by providing a range of credit offers. They can choose between offers that maximise the loan amount or credit limit to suit their funding needs, offers that minimise the monthly instalment to suit their cash flow, and offers that minimise the cost of credit.
In the coming year we will focus on enhancing client retention.
Credit collection and reschedulingOffering sustainable credit products and client rehabilitation strategies play a vital role in fostering long-term client relationships and achieving Capitec’s financial goals. We use the regulated non-authenticated early debit order (NAEDO) system to collect instalments from clients. Early-stage arrears are managed by a centralised function that uses an arrears segmentation strategy based on a client-behaviour score as a risk migration tool. Rescheduling is offered as a rehabilitation mechanism, by amending existing credit agreements, to arrears clients who have a propensity to rehabilitate and as a proactive mechanism to non-arrears clients in order to mitigate credit losses.
Unforeseen circumstances may lead to reduced income or increased expenditure for the client. If the client is in arrears due to debt repayment challenges, we either negotiate with the client to bring the arrears instalments up to date, or we attempt to help manage the situation by amending the loan agreement (loan reschedule).
Various forms of rescheduling are available to offer suitable solutions to address the underlying cause of the arrears. A data-driven treatment model has been implemented to assist call-centre agents in offering the optimal arrangement or rescheduling option to a client, based on the client’s risk profile, financial need and ability to honour the arranged treatment.
*
*
* Denotes text in the risk management report that forms part of the group’s audited annual financial statements.
*
*
Integrated Annual Report 2019 | 95
Risk management report
Remuneration report
Social responsibility
About this report
Appendices Annual financial statements

Factors that we consider in delivering the optimal strategy for a client include:• the risk profile and payment history of the client;• the arrears status of the client (one or 89 days in arrears,
for example);• whether the client was rescheduled previously;• the credit exposure amount;• free cash-flow estimates derived from the client’s bank
accounts or credit bureau records (salary less debit orders); and
• any information we have about the client’s employer.
This process allows us to optimise collections and reduce clients’ debt levels. Our aim is always to partner with our clients through both good and tough times and act in their best interest.
A payment propensity model is used to determine which clients are retained for in-house collection. Clients with a low propensity to cure in-house are handed over to an external debt collector (EDC) for outsourced recoveries. Outsourced recoveries are performed by a number of EDCs with different capabilities, ranging from high-volume call centres to lower-volume legal collections. Debt is sold when the expectation of future payments, as estimated by an internal valuation methodology, is considered too low.
We monitor the proceeds (yield) that we receive from this outsourced process against internal collection processes, including rescheduling. We use holdout samples to evaluate the success of new collections and recoveries to further optimise yield.
Apart from the above rehabilitation options, a client also has access to statutory mechanisms, such as debt counselling. Over the last few years we have observed a rise in debt counselling, along with a reduction of the average age of the debt in debt counselling, in line with mounting economic pressures.
We also launched a credit assistance programme to help clients in instances where they have lost income or where expenses increased beyond their control. The programme offers a unique debt-relief solution and will help improve consumer financial literacy. This initiative also provides learning that will be useful for the implementation of the anticipated National Credit Amendment Bill.
Credit management framework
Grant
Collections
Recover/repeat
Credit life cycle
Account management
Strategy setting and appetite
Risk and performance management
Data analyticsand modelling
Data gatheringand staging
Policies and controls
Returnon equity
MOS/key riskindicators
Business intelligence/end user computing
Management informationsystem/general ledger
System and processes and people
Need addressed through responsible borrowingClient
*
* Denotes text in the risk management report that forms part of the group’s audited annual financial statements.
96 | Capitec Bank Holdings Limited
Key performance indicators
Leadership reviews
The Capitec Way
Our business context
Our strategic goals and insights
Leadership teams and governance oversight

Credit risk reportingCredit risk is monitored daily, weekly and monthly by key risk indicators such as accept rates and take-up rates regarding sales. Book measurements include arrears, instalment collection success, centralised collection activities, treatments and balances rolling into a fully provided state.
With the implementation of IFRS 9, we changed our financial reporting on credit loss impairments. The change in the financial reporting standard enabled better alignment with our strategy of managing credit risk that uses the migration in behaviour and granting scores.
We expanded our efforts to reconcile the elements of probability, price and provisions. Our focus is to optimise profit for the credit portfolios, not only in total but also at various levels of segmentation. This has entailed increasing capacity allocated to the credit and finance teams, with more collaboration and technological support.
We regularly assess the levels of provisions through coverage ratios to ensure that we adequately provide for the risk profile of the loan book. For rescheduled loans, we also follow a conservative approach to provisioning based on validated rehabilitation.
Credit risk trainingAll new service consultants complete intensive training in simulated environments and are required to pass stringent assessments before they can work in the live environment, initially under supervision. We continuously provide credit training to ensure that each service consultant understands and can adhere to the latest policies and procedures. The need to understand credit risk resulted in the development of a BANKSETA-accredited learnership package. This is the starting point towards a qualification in banking and unsecured lending as a prospective career.
We continue to focus on purpose-driven lending as the starting point to credit decisions and aim to offer a full device agnostic digital end-to-end solution for all credit requirements of our market.
*
* Denotes text in the risk management report that forms part of the group’s audited annual financial statements.
Counterparty credit riskCapitec has limited counterparty credit risk in terms of the Banks Act regulations, as we do not operate a trading book. Our exposures are limited to hedges entered into to mitigate interest rate and currency risk in the banking book, and resale investment transactions concluded as part of cash management activities.
Investment credit riskCapitec has a low risk appetite regarding investing surplus cash and liquidity buffers. Surplus cash is invested in the wholesale money markets, at the discretion of treasury, subject to the parameters defined by the RCMC.
Treasury targets a weighted average maturity of 90 days for the cash portfolio and maintains a healthy stock of highly liquid investments. A hold-to-maturity approach is used. The yield must be commensurate with any increase in risk.
Other credit riskCorporate insurersWe select corporate insurers to insure the loan book against death and retrenchment, and to cover property and casualty insurance needs based on sufficient underwriting capacity and an appropriate reinsurance strategy.
SuppliersThe supplier and counterparty risk committee assesses and the CC approves prepayment and inventory exposure limits to suppliers as part of the procurement policy, to limit operational and financial risk. Read more about counterparty, investment and other credit risks in the audited annual financial statements from page 146.
*
Integrated Annual Report 2019 | 97
Risk management report
Remuneration report
Social responsibility
About this report
Appendices Annual financial statements

Analysis of regulatory credit exposure
Average gross exposure(1)
Average gross period-end exposure(2) (4)
Exposure post-risk mitigation(2) (3) (4) Risk weights(5)
Basel 3 exposure categories R’000 28 Feb 2019 28 Feb 2018 28 Feb 2019 28 Feb 2018 28 Feb 2019 28 Feb 2018 %
On balance sheet
Corporate(6) 6 157 970 4 339 309 6 402 202 3 764 555 6 262 852 3 628 931 100
Sovereign(7) 12 628 587 11 977 984 13 176 711 13 096 689 13 176 711 13 089 771 0
Banks (claims <3 months
original maturity) 14 422 645 9 502 551 11 877 158 11 666 113 10 156 473 10 242 254 20
Banks (claims >3 months
original maturity) 7 305 578 5 279 692 10 331 464 3 720 150 10 331 464 3 720 150 50/100
Banks (derivatives >3 months
Aaa to Aa3) – – – – – – 20
Banks (derivatives >3 months
A1 to Baa3) 20 551 71 551 8 479 15 184 8 479 15 184 50
Retail personal loans
With unidentified impairments 45 837 897 44 083 394 46 345 711 43 628 225 46 345 711 43 628 225 75
With identified impairments(8) 7 638 058 3 862 755 8 440 489 2 133 889 8 440 489 2 133 889 various
Subtotal 94 011 286 79 117 236 96 582 214 78 024 805 94 722 179 76 458 404
Off balance sheet
Corporate guarantees – – – – – – 100
Retail personal loans
Retail guarantees – – – – – – 75
Committed undrawn facilities – – – – – – 75
Conditionally recoverable
commitments(9) 566 592 570 502 911 740 796 274 911 740 796 274 0
Total exposure 94 577 878 79 687 738 97 493 954 78 821 079 95 633 919 77 254 678
As required by the Banks Act and its regulations (which incorporate the Basel requirements):
(1) Average gross exposure is calculated using daily balances for the last 6 months.(2) Items represent exposure before the deduction of qualifying impairments on advances.(3) Represents exposure after taking into account any qualifying collateral. Amounts are shown gross of impairments, which are deducted to calculate
risk-weighted assets.(4) “Corporate” and “bank” exposures were calculated based on an average, using daily balances for month 6 of the respective reporting periods. All other
items are the balances at the respective month-ends.(5) The risk weightings reflected are the standard risk weightings applied to exposures, as required by the regulations. Risk weights for exposures (other
than retail) are determined by mapping the exposure’s Moody’s international grade rating to a risk-weight percentage using the mapping table (see table below). The risk weightings for retail exposure are specified directly in the banking regulations. A standard risk weight of 75% is applied to performing retail exposures while impaired exposures attract a standard 100% risk weight, net of allowed impairments.
(6) 95.3% (Feb 2018: 95.5%) of corporate (unrated) aggregate gross period-end exposure relates to investments in money market unit trusts.(7) Sovereign comprises investments in RSA treasury bills and SARB debentures. These exposures are zero-risk-weighted.(8) An ageing of impaired advances based on arrears status is shown in Note 7 to the financial statements. According to banking regulations, those retail
personal loans that have been provided for in excess of 50% of the outstanding balance, are risk-weighted at 50%.(9) These commitments are as a result of undrawn credit facility and undrawn credit card amounts. The bank’s contractual commitment is revocable should a
client not meet their contractual obligations or where the bank has determined that the client’s credit risk profile has changed. 64.0% (Feb 2018: 48.1%) is expected to be drawn down within 1 month. As these commitments are revocable, there is no capital charge in terms of the standardised approach for credit risk.
98 | Capitec Bank Holdings Limited
Key performance indicators
Leadership reviews
The Capitec Way
Our business context
Our strategic goals and insights
Leadership teams and governance oversight

Long-term credit assessmentAaa to Aa3
%A1 to A3
%Baa1 to Baa3
%Ba1 to B3
%Below B3
%Unrated
%
Sovereigns 0 20 50 100 150 100
Public sector entities 20 50 50 100 150 50
Banks 20 50 50 100 150 50
Security firms 20 50 50 100 150 50
Banks: Short-term claims 20 20 20 50 150 20
Security firms: Short-term claims 20 20 20 50 150 20
Corporate entities 20 50 100 150 100
Short-term credit assessmentP-1 %
P-2 %
P-3 %
Other %
Banks and corporate entities 20 50 100 150
Rating grades and related risk weights
Integrated Annual Report 2019 | 99
Risk management report
Remuneration report
Social responsibility
About this report
Appendices Annual financial statements

100 | Capitec Bank Holdings Limited
The RCMC and the audit committee have oversight of operational risks through the RISCO. The executive risk officer and his
team are responsible for implementing and maintaining frameworks and policies.
They also manage internal and external relationships of risk matters.
Read more about our business context from page 62.
operational risk
The risk of loss resulting from in adequate or failed internal processes, people
and systems, or from external events.
Key performance indicators
Leadership reviews
The Capitec Way
Our business context
Our strategic goals and insights
Leadership teams and governance oversight

We make informed decisions about operational risk, guided by the enterprise risk management framework and the risk committee. We believe in collaborative and cohesive relationships within the business to encourage transparency and trust and to ensure consistent risk management practices. This creates a risk culture, which is essential to identify, manage and mitigate operational risk that can occur anywhere in the business: from head office to our 840 branches.
Good risk management practices suggest we should at least stand back from our daily risk registers once a year. We reconsider known issues and revisit the entire risk landscape and its potential impact on the objectives of the bank. This top-down assessment aligns our business plans and focus areas appropriately.
Our systems and processes support a centralised view of all risks in the group. This view is continuously enriched with information from our risk self-assessment workshops. In combination with near-miss and incident analysis, we create a holistic view of operational risk. Mitigation is shared in the combined risk function collaboration to give unified assurance. Key risk indicators are used to monitor assessed risks.
Fraud riskWe use technology to prevent exposure to fraud and to ensure that we are at the forefront of fraud prevention. Our fraud policy outlines what constitutes fraud and corruption. It details the procedures to follow where fraud or corruption is suspected or discovered. We co-operate with government and industry role players to ensure the successful apprehension and conviction of the perpetrators of financial crime. These crimes include bribery and corruption charges.
Information technology riskThe persistent pursuit to provide clients with simplified banking drives Capitec to focus on innovative methods of technology application and solutions. We aim to protect client information, to apply controls and compliance consistently, and to develop new controls.
We have a mature information security approach that consistently monitors and remediates areas of concern where our clients and company information could be at risk.
Information technology governance is implemented according to the Capitec IT governance policy. The policy is built on a strong framework that incorporates principles and controls defined in international standards, such as the Control Objectives for Information and Related Technologies (COBIT), the Information Security Forum (ISF) Standard of Good Practice, and ISO 25999 and 27001/2.
The way in which we aligned and structured the framework and the way in which strategic plans are designed, ensure that our IT strategy is created, approved, reviewed and implemented to align with the business strategy, with a focus on our clients. We work according to a 6 month planning process to align IT initiatives in each IT function with business objectives that can be tracked on a weekly and monthly basis, to achieve set targets.
The IT governance framework defines the IT organisational structure and the policies and procedures to facilitate good governance and compliance practices regarding IT. Weekly EXCO meetings and formal IT prioritisation meetings provide platforms to discuss strategic IT matters and initiatives and align priorities.
These meetings focus on IT risks and potential issues. They ensure that situations that could threaten the availability of systems, or the confidentiality and integrity of information, are identified and discussed at a senior management level. Important issues are handled with the appropriate level of urgency and focus.
Formal visits by the SARB every 2 years include a full- day assessment of our IT risk management capability. We also report any incidents or relevant information to them via the monthly Capitec reporting pack. This ensures that our regulator is kept up to speed with any emerging or developing technology risks.
IT complianceThe information security and risk department acts as the compliance function for IT and facilitates frequent assessment of the status of legal and regulatory compliance matters. We track and report progress on all compliance matters.
Information security management systemThe Capitec information security policies and standards provide the basis on which controls are developed to protect sensitive client and business information systems. Our information security management system is based on ISO 27001/2 standards and the best-practice principles of the ISF Standard of Good Practice. The information security manager is responsible for information security management.
Integrated Annual Report 2019 | 101
Risk management report
Remuneration report
Social responsibility
About this report
Appendices Annual financial statements

Cybersecurity Capitec has a dedicated team focusing solely on the protection, detection and response to cybersecurity within the bank. We test our own IT controls for weaknesses to improve our security and response times. Capitec is involved in industry initiatives, such as the South African Banking Risk Information Centre (SABRIC), to establish and embed well-coordinated security response mechanisms in the event of major security threats to the banking industry or individual banks.
Information riskData drives our business model and operations. Good data practices not only ensure compliance and the safeguarding of our information assets but also form the foundation of our competitive advantage as a bank.
Capitec operates in a highly regulated industry where data breaches could have a disastrous impact on an organisation’s reputation and sustainability. The RDARR principles, in particular, require a clear organisational strategy for data governance, quality, infrastructure and information risk management.
In the past year, we focused on staying abreast of regulatory requirements such as the Protection of Personal Information Act, Act 4 of 2013 and RDARR and on increasing Capitec’s ability to take informed risks decisions. Our current and future focus areas include:• Data governance and ownership• Data architecture and information management• Data quality management• Information security
ComplianceWe regard the interconnectedness of the banking industry and the reliance of the economy and citizens on banks as important drivers in our approach to comply with legislation.
The bank has a dedicated function, as prescribed by the Banks Act, to manage compliance risk. The function comprises 2 sections: compliance and anti-money-laundering. The head of compliance reports to the audit and RCMC committees and submits reports to the directors’ affairs committee.
Our compliance policy, which forms part of the compliance framework, and our compliance manual and compliance programme, defines the ways in which the board and CEO are assisted to ensure that we operate with integrity, comply with legal and regulatory requirements and work according to ethical standards.
Our compliance universe consists of applicable laws and is reviewed annually to ensure that these remain relevant and current as we grow and launch new products.
The compliance function helps to foster a culture that creates awareness and recognises the value of compliance risk identification, assessment, management, monitoring and reporting as part of the bank’s ongoing activities.
Notable regulators that play a role in compliance requirements and direct our conduct are:• the SARB;• the NCR;• the JSE Limited;• the Financial Intelligence Centre;• the Financial Sector Conduct Authority (FSCA); and• the Information Regulator.
We received no material regulatory penalties, sanctions or fines for contraventions of or non-compliance with statutory obligations. Read more about the regulatory requirements that affect Capitec in the section on our business context from page 62.
InsuranceA comprehensive insurance programme covers operational risk losses such as fraud, theft, professional liability claims, damage to physical assets and the cost of business interruption. The opportunity cost of lost revenue is not covered.
market risk
102 | Capitec Bank Holdings Limited
Key performance indicators
Leadership reviews
The Capitec Way
Our business context
Our strategic goals and insights
Leadership teams and governance oversight

Market risk is addressed at least on a monthly basis by the ALCO.
Read more about market risk in the CFO report from page 10.
The risk of a potential decrease in stakeholders’ value due to adverse
changes in market prices and rates negatively impacting assets
and liabilities.
*
*
* Denotes text in the risk management report that forms part of the group’s audited annual financial statements.
market risk
Integrated Annual Report 2019 | 103
Risk management report
Remuneration report
Social responsibility
About this report
Appendices Annual financial statements

Market risk generally has a wide impact and is often outside our control. It includes equity, bond and commodity price changes and fluctuations in exchange and interest rates. Our exposure to market risk is mainly due to inherent interest rate risk in retail banking activities, which are defined as the “banking book” by Basel.
Interest rate riskMarket-driven interest rates can adversely affect our profitability and the value of the Capitec balance sheet.
We have a conservative approach to liquidity. Whereas other retail banks operate floating-rate mortgage books and have to minimise the impact of rate changes on the value of their equity, we offer fixed interest rates on retail term loans. These factors result in an inherent interest rate repricing mismatch for Capitec.
We operate well within our target range and even if there is a 2% shock on interest rates in either direction, we would experience an impact of less than 1% on the bank’s profit.
Fixed interest rate retail loansThe interest charged on all unsecured retail loans is based on fixed interest rates. This protects loan clients from the effect of rising interest rates. They therefore do not have the risk of increasing instalments on their loans.
The impact of the liquidity strategyThe Capitec approach to liquidity is to match long-term loans with long-term funding. However, the longer-term funding can initially be sourced with a floating coupon, contributing to the repricing mismatch.
Call deposits are not used to fund long-term loans. These floating-rate deposits are matched in a floating-rate investment portfolio.
The effect of shareholders’ equityA natural mismatch position arises when there are more rate-sensitive assets than rate-sensitive liabilities. This mismatch is due primarily to ordinary shareholders’ equity, a consequence of our conservative leveraging. Traditionally, equity is considered as non-rate-sensitive. Capitec targets a fixed ROE. Given that our principal asset class is unsecured retail lending at fixed rates and given the allocation of a large portion of equity to funding of these assets (in line with the philosophy of matching the funding of longer-term assets with long-term funds), part of the mismatch between assets and liabilities due to equity funding is considered matched.
Managing interest rate riskThe asset and liability management (ALM) policy precludes taking speculative or trading positions on the banking book. In general, ALCO aims to match the fixed or floating-rate nature of funding with the fixed and floating-rate elements of the loan book and surplus cash positions. To manage mismatches, long-term floating-rate liabilities may be swapped to fixed rates.
Our appetite for interest rate risk is managed according to set limits that are applied using balance sheet and earnings measures. We assess the impact of rate changes on the net present value of the retail loan book and related funding, and the potential impact of an open position on current and future profitability.
Regulatory sensitivity analysis of equity – 200 basis point shift
2019R’000
2019 %
2018 R’000 %
Increase (760 837) (2.7) (699 604) (3.3)
Decrease 785 186 2.8 722 962 3.4
The sensitivity analysis is calculated by modelling the impact on equity of parallel shifts of 200 basis points on the yield curve on the balance sheet. The analysis is performed on a full-lifetime run-off basis, using the discounted cash-flow approach, in line with the requirements of the Banks Act. This gives an indication of how the value of shareholders’ funds may change if there is a shift in interest rates.
Insurance riskWhen loan clients are granted credit for terms 7 months and longer, the group requires the loan client to have credit insurance to cover death, unemployment or inability to earn an income (other than disability), temporary and permanent disability. The loan client has the right to either provide the group with an existing policy to cover this requirement or take out an insurance policy with another insurer. As an option available to our loan clients, the group, in the normal course of business, offers them the opportunity to enter into credit insurance contracts.
The significant type of insurance contract offered by the group is the credit insurance described above. The group carries no insurance risk on the funeral product.
The credit insurance contracts offered by the group to its loan clients is through a cell captive arrangement underwritten by a cell captive insurer. The group is the
*
* Denotes text in the risk management report that forms part of the group’s audited annual financial statements.
*
*
104 | Capitec Bank Holdings Limited
Key performance indicators
Leadership reviews
The Capitec Way
Our business context
Our strategic goals and insights
Leadership teams and governance oversight

owner of a cell that holds the credit insurance underwritten by the cell captive insurer. As part of its arrangement with the cell captive insurer, the group has entered into a binder agreement to manage the collection of premiums, payment of claims and the residual net cash being remitted to the provider of the cell captive arrangement.
The cell captive arrangement is considered to have transferred significant insurance risk to the group (see accounting policy 2.15 in the annual financial statements) due to the contractual requirement imposed on the group to maintain the solvency of the cell. To mitigate this insurance risk, the group, in consultation with the cell captive insurer, elected to reinsure the insurance risk contained within the cell captive, with the significant portion being placed with A- (S&P) credit-rated insurance companies. This results in the group essentially being the reinsurer of last resort should the reinsurers not honour the reinsurance contract and the group would have to recapitalise the cell should losses be incurred.
Reinsurance relates only to the death, unemployment and a portion of permanent and temporary disability components of the credit life insurance policies underwritten by the cell captive insurer.
The cell captive insurer is responsible for evaluating the retained insurance risk in terms of statistical and underwriting disciplines according to the approved mandate for the cell captive arrangement. The insurance contract liabilities for the retained insurance risk are disclosed in Note 9 – Net insurance receivables to the annual financial statements.
The main risks to which the group is exposed include:• mortality and morbidity risks: the risk that actual
experience in respect of the rates of mortality and morbidity may be higher than that assumed in pricing and valuation, depending on the terms of different products;
• contract-persistency risk: the risk that policyholders may cease or reduce their contributions or withdraw their benefits and terminate their contracts prior to the contractual maturity date of a contract;
• expense risk: the risk that the group may experience a loss due to actual expenses being higher than that assumed when pricing and valuing policies; and
• business volume risk: the risk that the group may not sell sufficient volumes of new business to meet the expenses associated with distribution and administration.
Equity riskCapitec does not deal in equity instruments. The bank has limited exposure to equity investments.
Currency riskThis is the risk that profitability and shareholders’ equity will be adversely affected by changes in exchange rates between the Rand and the foreign currencies in which assets and liabilities are denominated.
Currency risk has a minimal impact on Capitec’s operations as all its operations are in South Africa. Imported capital equipment and technological support services result in limited exposure to currency fluctuations. However, these transactions are fully hedged by means of forward exchange contracts. There was no foreign currency funding at 28 February 2019.
Hedging market riskALCO only allows derivatives to be used for hedging risk in the banking book:• Interest rate swaps are used to convert floating-rate to
fixed-rate funding, to achieve the objective of matching the fixed-rate nature of assets and funding.
• Forward foreign-exchange contracts are used to cover obligations relating to capital equipment, technology and technology support services needed for the core banking activities.
Any hedges cover the complete exposure on the underlying transaction. Read more about all aspects of market risk in the audited annual financial statements from page 215.
* *
* Denotes text in the risk management report that forms part of the group’s audited annual financial statements.
Integrated Annual Report 2019 | 105
Risk management report
Remuneration report
Social responsibility
About this report
Appendices Annual financial statements

ALCO oversees the activities of treasury, which operates in terms of an approved ALM policy. ALCO assesses capital adequacy on a monthly basis. This includes a historical and future capital positioning review and a quarterly report to the RCMC. Capital adequacy and the use of regulatory capital are reported to the SARB every month, in line with the requirements of the Banks Act.
Read more about capital and liquidity management in the CFO report from page 10 and in the audited annual financial statements from page 146.
capital &liquidityThe risk of losses from not having cash to honour commitments on time.
* Denotes text in the risk management report that forms part of the group’s audited annual financial statements.
*
*
106 | Capitec Bank Holdings Limited
Key performance indicators
Leadership reviews
The Capitec Way
Our business context
Our strategic goals and insights
Leadership teams and governance oversight

Risk management and capital management are interdependent. In line with regulatory requirements, we hold risk capital as a reserve for all residual risks that remain after cost-effective risk management techniques, impairment provisioning and risk mitigation have been applied. Residual risk exists as there is potential for unexpected losses as well as volatility in the expected losses to occur in the future that are not captured in terms of IFRS.
Capital managementCapitec’s principal objectives when managing capital are to:• Ensure that the return on capital targets are achieved
through efficient capital management, and adequate capital is available to support the growth of the business
• Ensure that there is sufficient risk capital with a capital buffer for unexpected losses to protect depositors and shareholders and to ensure sustainability through the business cycle
The 2 principles counterbalance each other by aiming to maximise returns for shareholders, but not at the expense of other stakeholders. This approach prevents the adoption of high-risk/high-reward strategies. It also safeguards long-term sustainability while maintaining satisfactory returns for all stakeholders. Implicit in this approach is compliance with the prudential requirements of the Banks Act and maintaining a strong capital base to support the development and growth of the business.
Capital to manage risk and growthCapitec retains capital for risk on the existing portfolio and to support risk arising from planned growth. Supply and demand factors have an impact on capital adequacy.
Supply-side risk Supply-side risk relates to procuring appropriate capital resources at appropriate pricing and times, to keep ahead of any changes in the technical calculation of capital adequacy, to maintain capital buffers at the stipulated requirements of regulators and to meet the expectations of shareholders.
Demand-side riskDemand-side risk involves monitoring the growth in risk-weighted assets. This in turn drives the growth in regulatory and our own internal capital requirements.
Our internal risk management function addresses the demand-side risk, which encompasses risks that have a negative impact on earnings and capital.
Capital managementThe group’s principal objectives when managing capital are to:• address the expectations of shareholders and optimise
business activities to ensure return on capital targets are achieved through efficient capital management;
• ensure that the group and bank hold sufficient risk capital. (Risk capital caters for unexpected losses that may arise, protects shareholders and depositors and thereby assures the sustainability of the bank through the business cycle); and
• comply with the capital supervisory requirements of the SARB as codified in the Banks Act 1990 (as amended) and related regulations.
The group has an Internal Capital Adequacy Assessment Process (ICAAP), which on an ongoing basis drives the group’s position on capital management. The ICAAP reviews the historic, current and future capital positioning of the group, both from an internal and a regulatory capital perspective.
* Denotes text in the risk management report that forms part of the group’s audited annual financial statements.
* *
Integrated Annual Report 2019 | 107
Risk management report
Remuneration report
Social responsibility
About this report
Appendices Annual financial statements

The table below summarises the composition of regulatory capital for the group and the bank:
Group Bank
R’000 2019 2018 2019 2018
Composition of qualifying regulatory capital
Ordinary share capital 5 649 020 5 649 020 6 105 981 6 105 981
Foreign currency translation reserve 4 619 3 158 – –
Accumulated profit 15 950 142 13 153 434 14 790 738 12 331 048
21 603 781 18 805 612 20 896 719 18 437 029
Regulatory adjustments
– Intangible assets in terms of IFRS (316 282) (283 011) (316 282) (283 011)
– Specified advances 480 650 (12 035) 481 313 (8 511)
– Unappropriated profit (856 407) (1 128 678) 856 407 (1 128 678)
Common Equity Tier 1 capital (CET1) 20 911 742 17 381 888 20 205 343 17 016 829
Issued preference share capital(7) 81 603 112 803 81 603 112 803
Phase out – non-loss absorbent(1) (3 912) (9 216) (3 912) (9 216)
Additional Tier 1 capital (AT1) 77 691 103 587 77 691 103 587
Tier 1 capital (T1) 20 989 433 17 485 475 20 283 034 17 120 416
Issued subordinated debt 1 822 000 2 441 000 1 822 000 2 441 000
Phase out – non-loss absorbent (1) (1 822 000) (2 076 600) (1 822 000) (2 076 600)
Deduction for third-party capital issued by bank subsidiary(2) – (80 962) – –
Total subordinated debt – 283 438 – 364 400
Unidentified impairments 624 762 519 230 624 762 519 230
Tier 2 capital (T2) 624 762 802 668 624 762 883 630
Qualifying regulatory capital 21 614 195 18 288 143 20 907 796 18 004 046
CET 1 % 32.8 33.9 32.2 33.3
AT 1% 0.1 0.2 0.1 0.2
T1 % 32.9 34.1 32.3 33.5
T2 % 1.0 1.6 1.0 1.7
Total capital adequacy %(3) 33.9 35.7 33.3 35.2
108 | Capitec Bank Holdings Limited
Key performance indicators
Leadership reviews
The Capitec Way
Our business context
Our strategic goals and insights
Leadership teams and governance oversight

Group Bank
R’000 2019 2018 2019 2018
Composition of required regulatory capital
On balance sheet 5 706 267 4 602 965 5 743 468 4 621 702
Off balance sheet 4 739 – 4 739 –
Credit risk 5 711 006 4 602 965 5 748 207 4 621 702
Operational risk 879 306 683 940 866 622 683 002
Equity risk in the banking book 51 291 56 819 48 375 41 872
Other assets 685 946 355 777 558 647 345 109
Total regulatory capital requirement (4) 7 327 549 5 699 501 7 221 851 5 691 685
Composition of risk-weighted assets(5)
On balance sheet 49 619 716 41 374 966 49 943 202 41 543 388
Off balance sheet 41 209 – 41 209 –
Credit risk 49 660 925 41 374 966 49 984 411 41 543 388
Operational risk 7 646 139 6 147 776 7 535 845 6 139 346
Equity risk in the banking book 446 009 510 730 420 654 376 379
Other assets 5 964 751 3 197 993 4 857 796 3 102 106
Total risk-weighted assets 63 717 824 51 231 465 62 798 706 51 161 219
Total assets based on IFRS 100 427 749 84 957 233 100 061 284 84 850 405
Total risk-weighted assets - adjustments(6) (36 709 925) (33 725 768) (37 262 578) (33 689 186)
Total risk-weighted assets - regulatory 63 717 824 51 231 465 62 798 706 51 161 219
(1) Starting 2013, the non-loss absorbent AT1 and T2 capital is subject to a 10% per annum phase-out in terms of Basel 3.(2) Starting 2013, a deemed surplus attributable to T2 capital of subsidiaries issued to outside third parties is excluded from group qualifying capital in terms of
the accelerated adoption of Basel 3. This deduction phases in at 20% per annum.(3) The total capital adequacy ratio percentage is determined by dividing the total qualifying regulatory capital by total risk-weighted assets.(4) This value is 11.500% (2018: 11.125%) of risk-weighted assets, being the Basel global minimum requirement of 8%, the South African country-specific
buffer of 1.00% (2018: 1.25%) and the Capital Conservation Buffer of 2.500% (2018: 1.875%) (disclosable in terms of SARB November 2016 directive in order to standardise reporting across banks). In terms of the regulations the Individual Capital Requirement (ICR) is excluded.
(5) Risk-weighted assets are calculated by using regulatory percentages applied to the statement of financial position, in order to establish the base for calculating the required regulatory capital.
(6) The adjustments reflect mainly the impact of the regulatory percentages and the addition of a risk-weighted equivalent for operational risk.(7) The base value of preference shares phasing out in terms of Basel 3 is R258 969 000. At year-end, 68.49% (2018: 56.44%) of these shares had been
repurchased as they no longer contributed to qualifying regulatory capital.
Integrated Annual Report 2019 | 109
Risk management report
Remuneration report
Social responsibility
About this report
Appendices Annual financial statements

Internal capital adequacy assessment processWe run an internal capital adequacy assessment process (ICAAP) which, on an ongoing basis, shapes the group’s position on capital management. The ICAAP reviews the historic, current and future capital positioning of the group, both from an internal and a regulatory capital perspective.
The ICAAP also addresses the management of capital and solvency risk, as well as risks arising from the pro-cyclicality of business operations through the economic cycle. This involves broad-based participation from key risk owners and is subject to periodic review by internal audit and relevant external consulting specialists that benchmark our process against best practice. The ICAAP is submitted annually to the SARB for review.
This year we updated the ICAAP economic capital model to calculate expected losses and concentration risk. In addition, we calculated capital requirements using the advanced internal ratings-based (AIRB) approach.
Functions and processes of the ICAAP include:• determining capital sufficiency through a review of the
historical and future capital positioning:– reviewing the historical and future capital positioning
from a regulatory, shareholders’ and an internal capital perspective;
– forecasting capital supply requirements, including stressing the budget and/or forecast to determine the sufficient capital requirement in a downturn of the economic cycle; and
– allowing the regulator to assess the bank’s capital-planning strategy;
• managing the bank’s approach to raising capital that is required to underwrite the risks of the business:– raising capital when conditions are conducive to
doing so and the sustainability, reputation and price optimisation benefits offset any issuing cost; and
– planning ROE as an input of investment decisions and the credit-granting model.
Basel 3Basel 3 sets the minimum standards required to comply with the longer-term prudential liquidity ratio. We calculate our regulatory capital requirement for credit and operational risk by using a percentage applied to the risk-weighted assets of the business. Various methods are used to calculate risk weights in terms of the Banks Act. Capitec uses the standardised approach to calculate risk-weighted assets for credit and equity risks in the banking book. Our calculation of operational risk is governed by the alternative standardised approach (ASA).
Capitec operates a mono-line banking business through a portfolio of retail banking assets. All other ancillary assets exist to support this business.
The impact of Basel 3 on capital adequacy measurement:
Loss absorbencyBasel 3 loss-absorbency rules require additional tier 1 (AT1) and tier 2 (T2) capital instruments to have a clause in the agreement that enables the regulator to convert them to ordinary shares or write them down in the event of the resolution of the financial institution (a bailout by public institutions). The clause provides the regulator with alternate legal options in the event that a bank crisis must be resolved.
All capital that does not meet the new loss-absorbency requirements will be phased out over a period of 10 years. Subordinated debt will be phased out at the earlier of 10 years or based on actual maturity, where applicable. An overall ceiling limit that reduces by 10% per year was set on 1 January 2013, based on the outstanding capital value of non-loss absorbent AT1 and T2 instruments at the time.
Subsidiary third-party capitalBasel 3 limits the contribution of preference share capital and subordinated debt issued by subsidiaries, in the group capital adequacy ratio. This consolidation deduction is being phased in at 20% per year from 1 January 2013. The limitation aims to encourage the issue of capital by holding companies, rather than by subsidiaries.
Leverage ratioThe leverage ratio acts as a capital floor to the Basel risk-adjusted capital-adequacy framework. Capitec had a calculated regulatory leverage ratio of 5 times common equity tier 1 (CET1) capital at the end of the financial year (2018: 5 times CET1). The maximum allowed leverage in South Africa is 25 times CET1 capital.
CAPITAL ADEQUACY BY TIER (%)
CapitecFeb 2019
CapitecFeb 2018
2018Basel 3
SA minimum
2019Basel 3
SA minimum
1.00.1
32.8
CET1 T2AT1
1.6
0.2
33.9
2.25
1.5
7.375
2.25
1.75
7.5
110 | Capitec Bank Holdings Limited
Key performance indicators
Leadership reviews
The Capitec Way
Our business context
Our strategic goals and insights
Leadership teams and governance oversight

CET1: Common Equity Tier 1 capital: ordinary share capital and reserves after Basel deductions.• AT1: Additional Tier 1 capital: Capitec’s perpetual
preference shares qualify as entry-level AT1 capital and are subject to phasing out in terms of Basel 3 as they do not meet new loss-absorbency standards.
• T2: Tier 2 capital: Capitec Bank’s subordinated debt instruments qualify as entry-level T2 capital and are subject to phasing out in terms of Basel 3 as they do not meet new loss-absorbency standards. Subordinated debt is issued by the bank subsidiary as the interest cost is offset against revenue. This debt is regarded as third-party capital, subject to additional phasing-out rules, at a consolidated level. No subordinated debt instruments were issued by Capitec during the financial year.
• Globally, the Basel 3 minimum capital adequacy percentage is 8%.
• The 2019 Basel 3 South African minimum includes the South African country buffer of 1.00% (2018: 1.25%). The level of this buffer is at the discretion of the SARB and is subject to periodic review.
• The 2019 Basel 3 South African minimum includes the capital conservation buffer of 2.500% (2018: 1.875%), which was phased in from the beginning of 2016. All banks must maintain this buffer to avoid regulatory restrictions on the payment of dividends and bonuses.
• Excluded from the South African minimum are the Basel 3:
Bank-specific buffers Bank-specific buffers include the individual capital requirement (ICR) and domestic systemically important bank (D-SIB) buffer. In terms of the Banks Act regulations, banks may not disclose their ICR requirement and D-SIB status. Any D-SIB requirement will be phased in over 4 years commencing January 2016. Current regulations state that the South African country risk buffer and the D-SIB buffers on a combined basis cannot be more than 3.5%.
Countercyclical buffer This buffer can range between 0% and 2.5% at the discretion of the monetary authorities. It is not expected that this buffer will be applied on a permanent basis; it will only be applied when credit growth exceeds real economic growth. The implementation period commenced in January 2016 with the rate of 0%.
HaircutsHaircuts are to be applied against a deemed surplus attributable to minority and third-party capital issued by subsidiaries. Phasing in started in 2013 at 20% per year.
Restrictions on the transfer of regulatory capitalGiven Capitec’s simple structure and the fact that all the operations are in South Africa, the only restrictions on the transfer of ordinary equity reserves relate to the statutory limitations on investments in certain associates as defined in the Banks Act. Subordinated debt issued by Capitec Bank is not available for distribution to Capitec.
Capital recovery planA capital recovery plan detects possible capital stress occurrences and provides guidance on appropriate actions to respond to early-warning signs. As it is difficult to obtain additional capital in times of stress, Capitec has a proactive and preventative approach to capital procurement. Management makes use of positive market conditions and positioning to obtain additional capital.
Liquidity riskWe mitigate liquidity risk by ensuring that Capitec has access to sufficient or acceptable cash and cash equivalents to fund increases in assets and meet our obligations as they become due, without incurring unacceptable losses. We adhere to more stringent internal liquidity measurements than required by Basel 3.
Our approach to liquidity risk remains conservative. There were no changes to the liquidity policy over the past financial year. The management of liquidity takes preference over the optimisation of profits.
To reduce liquidity risk, call deposits are only allowed to fund cash flows shorter than 6 months. Funding that is surplus to operational requirements totalled R44.2 billion (2018: R34.7 billion). These are invested in low-risk, liquid, interest-bearing instruments. These assets provide a positive return.
The liquid asset requirement of R2 328.0 million (2018: R2 277.5 million) is held in order to comply with regulatory liquidity requirements and consists of treasury bills. The intention is to hold all treasury bills to full maturity.
For cash-planning purposes, we use the contractual mismatch and not the behavioural mismatch.
* Denotes text in the risk management report that forms part of the group’s audited annual financial statements.
*
*
*
Integrated Annual Report 2019 | 111
Risk management report
Remuneration report
Social responsibility
About this report
Appendices Annual financial statements

Contractual and behavioural liquidity mismatchesContractual and behavioural mismatches both benefit from the high component of equity funding. This creates a greater surplus of asset cash flows over liability cash flows than at banks with lower capital ratios. The main difference between the behavioural and contractual mismatches relates to the treatment of retail call deposits. 92.3% of these deposits (2018: 91%) are reflected as stable based on a standard deviation measure of volatility, which is considered reasonable for business-as-usual conditions.
Capitec complied with all regulatory liquidity capital requirements during the current and previous year.
The liquidity coverage ratio (LCR)The LCR is a 30-day stress test, using 90 days (actual data points for the quarter) to calculate an average for the quarter. It requires banks to hold sufficient high-quality liquid assets to cover envisaged net outflows. These outflows are calibrated using prescribed Basel factors applied to assets and liabilities in a static run-off model. Basel definitions are used to identify high-quality liquid assets.
2019 2018 2017 2016
LCR (%) 1 450 1 878 1 152 1 040
High-quality liquid
assets (R’m) 16 352 18 056 9 266 6 671
Net outflow (R’m) 1 128 962 804 641
As Capitec has a net cash inflow after applying the run-off factors, outflows for the purpose of the ratio are deemed to be 25% of gross outflows.
A ratio of 100% or more represents compliance in terms of Basel 3 requirements. The requirement to comply is being phased in from 2015 and a ratio of 100% was required from 1 January 2019.
CONTRACTUAL AND BEHAVIOURAL LIQUIDITY MISMATCHES (R’m)
0 – 1 month 0 – 3 months 0 – 1 year > 1 year
2 424
24 994
18
Contractual (R’m)Behavioural (R’m)
Percentage undiscounted assets (%)Percentage discounted assets (%)
(21)
(13)
3
19
24
38
47
33 370
53 153
65 654
(20 250)
(12 739)
17 877
INDUSTRY COMPARISON – CUMULATIVE CONTRACTUALLIQUIDITY MISMATCHES (%)
1 month 2 months 3 months 6 months > 1 year
(15)
(35)
(25)
(5)
5
15
25
35
(30)
(15)
1 year
Capitec percentage of assets – February 2019Total banking industry percentage of assets – December 2018
(12)(34)
(8)(35)
(4)(35)
7(35)
255
112 | Capitec Bank Holdings Limited
Key performance indicators
Leadership reviews
The Capitec Way
Our business context
Our strategic goals and insights
Leadership teams and governance oversight

The net stable funding ratio (NSFR)The NSFR is designed to ensure closer matching of long-term asset cash flows with long-term funding cash flows. It also strongly relies on retail deposit funding. A ratio of 100% or more represents compliance.
2019 2018 2017 2016
NSFR (%) 196 206 187 145
Required stable
funding (R’m) 46 548 37 205 35 337 34 406
Available stable
funding (R’m) 91 044 76 621 66 187 49 968
The NSFR is calculated according to the SARB rules. Capitec’s conservative approach to liquidity management has resulted in compliance with these 3 Basel ratios on a level that is consistently higher than required.
Retail call deposit limit ratio (RCDR) percentage The RCDR is an internal ratio, looking at the next 6 months. The purpose of the ratio is to indicate whether retail call deposits are being lent out long and if we need to change our strategy and acquire more wholesale funding. This ratio should be equal or greater than 100% on an ongoing basis. Our internal liquidity-stress early-warning indicator ratio is set at 107%.
Retail call deposit toleranceThe retail call deposits liquidity tolerance is a treasury tool to indicate how quickly the bank can pay back deposits. This is done by applying future cash from loans, wholesale and fixed-term maturities to any current cash deficit that may arise.
Capitec’s average days’ tolerance for the financial year was 1 day(s) and the maximum tolerance for the year was 18 day(s).
The liquidity recovery planThe liquidity recovery plan requires that the bank has a liquidity monitor, a set of triggers developed to help identify the early stages of a liquidity crisis. The monitor addresses 2 phases of liquidity difficulty, namely:
Early stageThis is the lower-risk stage that provides management with more opportunity to manage the bank out of a potential crisis.
Late stageThis is the high-risk stage where management’s opportunities for corrective action are limited by the circumstances.
After a range of stress indicators were assessed, it was evident, on an overall balanced basis, that neither early- nor late-stage liquidity stress exists.
Integrated Annual Report 2019 | 113
Risk management report
Remuneration report
Social responsibility
About this report
Appendices Annual financial statements

Reputational risk is managed directly at an executive management level and escalated to the board in case of significant events.
Read more about reputational risk in the governance report from page 88.
reputationalriskThe current or prospective risk to earnings and capital arising from an adverse perception of Capitec by clients, counterparties, investors, employees or regulators.
114 | Capitec Bank Holdings Limited
Key performance indicators
Leadership reviews
The Capitec Way
Our business context
Our strategic goals and insights
Leadership teams and governance oversight

Reputational risk is managed on an ongoing basis through a policy framework that details expected behaviour of the business and employees. It guides us on the monitoring of employee behaviour and specific client responses as well as to society in general. This includes precise and transparent reporting through our integrated annual report, annual financial statements and other public statements.
Our risk-mitigation strategy includes:• a centralised policy on media;• an escalation process for complaints; and• clear relationships with stakeholders.
We actively manage the results of any reputational incident. The Viceroy incident highlighted the potential scope of reputational risk and resulted in enhanced awareness of this risk.
A security incident and event-monitoring solution is used to proactively monitor intelligence to identify and respond to incidents, including cyberattacks. Our social media monitoring tool tracks all posts related to Capitec. Various software, processes and procedures were implemented to ensure ethical and responsible use of technology and information, thereby protecting our reputation.
The risk management function is tasked with ensuring that stress testing is embedded in operational processes so that it is intuitive, relevant and part of the mainstream business activities.
Integrated Annual Report 2019 | 115
Risk management report
Remuneration report
Social responsibility
About this report
Appendices Annual financial statements

94.91% of total votes were in favour of our remuneration policy at the 2018 AGM.
95.33% of total votes were in favour of our implementation report at the 2018 AGM.
Long-term incentives form a large part of both key and senior managements’ total remuneration package, providing alignment to shareholder interests.
Key management has a significant personal shareholding, ensuring direct alignment with shareholders.
We embarked on a job evaluation process to ensure internal equity and fair pay practices across the company.
remunerationreportOur remuneration philosophy originates from our stewardship of stakeholder interests.
116 | Capitec Bank Holdings Limited
Key performance indicators
Leadership reviews
The Capitec Way
Our business context
Our strategic goals and insights
Leadership teams and governance oversight

Part 1: Background statementOur remuneration report comprises 3 parts. Part 1 consists of a background statement in the form of a letter from the human resources and remuneration committee (REMCO) chairman, reporting on factors that influenced the remuneration policy, and forward-looking approaches. Part 2 contains the forward-looking remuneration policy. Part 3 illustrates the implementation of the remuneration policy over the financial year.
Letter from the REMCO chairpersonIt gives me great pleasure to present to you our remuneration report for the 2019 financial year on behalf of the remuneration committee.
Capitec grew strongly in the year under review, as discussed in the CEO and CFO’s reports on pages 6 and 10 respectively. Headline earnings increased by 19% from R4.5 billion to R5.3 billion, which equated to a growth of 13% more than consumer price index (CPI) plus gross domestic product (GDP). This was coupled with a return on equity (ROE) of 28%. Our leadership team successfully executed our strategic priorities for the year and are to be commended for this in a year that saw consumers under inflationary pressures and job losses. The REMCO is satisfied with the implementation of the remuneration policy in the year. More details about the implementation of the remuneration policy is set out in Part 3 of the remuneration report.
Capitec remains focused on developing remuneration strategies that best serve stakeholder interests through sustainable growth. Remuneration is based on the success ful implementation of these strategies so as to ensure that we only reward actions that advance stakeholder interests and that pay is appropriately aligned to performance. We continually monitor developments in regulation, best practice and related changes in the market that may have an impact on our approach to remuneration and regularly take input from stakeholders into consideration. We have engaged independent external remuneration consultants to ensure that our remuneration policy remains fit for purpose in a dynamic and changing environment and aligned to the achievement of our strategies. In particular, we see our remuneration policy as key to our ability to attract and retain talent in a market where the battle for talent is fierce.
During the year under review, in addition to the standing agenda items, the REMCO oversaw the following actions:• Reviewed best market practice regarding approaches
and mechanisms with which to attract and retain our future talent succession pool. This resulted in us implementing the new Restricted Share Plan (RSP).
• Further aligned senior management Group A and B (as defined in the table on the next page) with shareholder interests by enhancing the senior management performance bonus scheme to include a choice to purchase restricted shares with unvested bonus balances.
• Embarked on a job evaluation process to ensure internal equity and fair pay practices across the company.
• Reviewed our formal internal pay policies and processes to ensure that these policies and processes are fair and equitable.
Our remuneration policy remains largely unchanged, other than for the future talent succession pool, which is impacted by the implementation of the new RSP. The RSP is described in more detail below.
The following sets out our overarching remuneration philosophy, business drivers, pay mix as well as future areas of focus, providing essential context for the rest of the report.
Our remuneration philosophyOur remuneration philosophy originates from our steward-ship of stakeholder interests. We develop strategies that best serve stakeholder interests through sustainable growth. Remuneration is based on the successful implementation of these strategies, ensuring performance-aligned pay.
This philosophy is integrated across all employee levels to ensure that we only reward actions that advance stakeholder interests. Our strategies and key performance indicators are communicated to employees upfront to ensure clarity, alignment, transparency and collaboration across the business. We take care to remain relevant in the market and to compete effectively for critical talent.
The preceding chapters on our business context (page 62) and leadership review (page 6) describe in detail the internal and external factors that influenced company performance. Notwithstanding our continued sound financial results, frugality and the responsible use of our resources remain entrenched in our culture and demonstrate our commitment to our fundamental principle of affordability. This pillar underpins the sustainability of our relationships with our clients and employees. With this in mind, we drive innovation, continuous improvement and internal talent development to grow income, produce efficiencies and realise our people’s potential. This, in
Integrated Annual Report 2019 | 117
Risk management report
Remuneration report
Social responsibility
About this report
Appendices Annual financial statements

Group Focus Strategic view RemunerationPeriod of income deferral
Key management (including CEO, CFO and Executive: risk management )
Leading strategy formulation
Longest term TGP, STI, LTI (equity instruments)
6 years
Senior management Group A
Strategic delivery (key management / future talent succession pool)
Medium to long term TGP, LTI (senior management performance bonus scheme and RSP)
3 to 5 years
Senior management Group B (including critical roles)
Critical tactical delivery (Group A succession pool)
Medium term TGP, LTI (senior management performance bonus scheme)
3 years
Other employees Operational Short term TGP, STI 1 year
The pay mix, illustrated with all proportions assuming on-target performance:
Keymanagement
SeniorGroup A
SeniorGroup B
Otheremployees
LTI TGPSTI
50%
1.257.25
10%40%
30%70%
20%80%
10%90%
To ensure that key management’s pay mix aligns with their long-term focus, a large proportion of the package is delivered in LTI and STI forms a small proportion of total remuneration. Key management LTIs are subject to personal performance criteria at grant and company performance criteria at vesting.
LTIs are awarded to senior management subject to annual company performance (year-on-year growth in headline earnings per share (HEPS)) being on or above target, and personal performance being satisfactory. Awards are settled in 3 cash tranches spread equally over 3 years.
turn, helps us to manage our salary bill while remaining competitive in acquiring and retaining the right talent.
We apply appropriate remuneration structures and proportional splits of total remuneration into total
guaranteed pay (TGP), short-term incentive (STI) and long-term incentive (LTI) according to levels of influence (operational, tactical and strategic) and corresponding time horizons (short-, medium-, and long-term).
For other employees the main component of total remuneration is TGP. These employees take part in the annual performance bonus (a STI) which is subject to company performance targets (year-on-year growth in HEPS) being achieved or exceeded. In specific business units, employees may also take part in department-specific STI programmes that drive focused production targets.
A key focus point during the year under review was the attraction and retention of key future talent to ensure that we have a strong pipeline of future successors in place. After extensive internal consultation and debate, Capitec implemented a new RSP aimed at the retention of employees forming part of the future talent succession pool and aligning these employees’ interests with those of the business and its shareholders. Executive directors do not participate in this scheme and all shares awarded under the scheme will be purchased in the market.
The RSP will be used in two ways. First, it will be used as a retention tool for staff identified in the future talent succession pool. Succession candidates may be awarded a set of cash value, with which restricted shares are purchased in the market, with no performance measures, limited to an amount of up to 50% of their annual guaranteed remuneration package. The shares will be subject to a restriction on disposal for 2 years. In the 3rd year, participants will be entitled to sell up to one-third, in the 4th year up to two-thirds, and in the 5th year, all the shares.
Secondly, employees in the senior management performance bonus scheme A-pool are offered the opportunity to buy shares, purchased in the market, with their cash bonus. If they make this choice, they are
118 | Capitec Bank Holdings Limited
Key performance indicators
Leadership reviews
The Capitec Way
Our business context
Our strategic goals and insights
Leadership teams and governance oversight

awarded an additional 10% in cash to purchase shares. All shares purchased are restricted and subject to forfeiture for 3 years. The shares will vest in equal tranches in years 2 and 3.
Feedback from stakeholders Shareholder engagement is a crucial part of our stakeholder engagement. Therefore, the REMCO charter specifies we should adequately disclose information to stakeholders to “facilitate constructive engagement with all relevant stakeholders, including shareholders”. The REMCO is pleased that in 2018 the remuneration policy and implementation report respectively received 94.91% and 95.33% of total votes in favour.
Notwithstanding the favourable votes received, we noted the input of those shareholders who did not vote in favour of (either) the remuneration policy and the implementation report. Although we do not have any actionable outcomes to report following our engagement with shareholders, we are pleased that shareholders approached us with their concerns and that we were able to have constructive engagements. We will continue to engage with our shareholders in the year ahead.
During the 2020 financial year, in addition to the above, the REMCO and management will focus on the following:
Remuneration aspect Forward-looking approach for the 2020 financial year
Retention of critical skills:• IT and digital• Finance/credit/data analytics
Capitec will review the total reward packages of these employees, together with appropriate retention mechanisms in order to ensure that these employees are remunerated in line with market and have received appropriate incentives for purposes of retention.
Attracting staff skilled in data analytics
Data analytics capability is a highly sought-after skill at Capitec and many other companies as a result of the 4th Industrial Revolution. We will review our strategy with regard to attracting (and then retaining) individuals with the right capabilities and values for roles at Capitec.
Transformation We will ensure that our internal human resource and pay policies support transformation across Capitec.
At the 2019 AGM, shareholders will have the opportunity to vote on remuneration. In line with the JSE Listings Requirements, there will be 2 separate votes on the remuneration policy (Part 2) and its implementation (Part 3).
External advice to the REMCO during the yearDuring the 2019 financial year, Capitec enlisted the services of independent remuneration advisers, PwC, to advise and assist with various remuneration matters, including the design of the RSP. The REMCO is satisfied that PwC’s services as rendered were independent and objective.
Forward-looking approachIn line with our charter, the REMCO continuously evaluates the remuneration policy against best practice and feedback received from stakeholders. The REMCO and management review employee remuneration and benefits continuously, taking into account, among other things, fairness and reasonability and key management remuneration in the context of overall employee remuneration. This involves being sensitive to the need for corporates to address unfair income disparities and employees’ socio-economic challenges. We progressively evolve our disclosure with the aim of ensuring that our reporting is transparent and accessible, and in line with best practice.
We believe the Capitec remuneration policy supports the long-term business strategy of the company and look forward to receiving our stakeholders’ support.
Lindi DlaminiChairperson: REMCO
Integrated Annual Report 2019 | 119
Risk management report
Remuneration report
Social responsibility
About this report
Appendices Annual financial statements

Part 2: Remuneration philosophy and policyThe remuneration policy, governed by the REMCO, promotes the achievement of company strategic objectives and risk management to foster enduring value creation for stakeholders.
REMCOThe REMCO operates in terms of its board-approved charter, which adheres to section 64C of the Banks Act, Act 94 of 1990 (the Banks Act). The charter is reviewed annually.
The REMCO’s mandate is to ensure that we establish and observe remuneration policies and practices that:• attract and retain individuals able to create enduring and
sustainable value; and• address remuneration risks inherent in the banking
environment.
In carrying out its mandate, the REMCO has unrestricted access to all the activities, records, property and employees of the company. In addition, the committee may access external legal or other independent professional advice to execute its responsibilities as detailed in its charter.
The REMCO consists of 3 non-executive directors, 2 of whom are independent. The members of the committee are:• LA Dlamini• JD McKenzie• CA Otto
The REMCO met formally twice this year. In addition, the topics were discussed on less formal occasions leading up to the formal meetings. Both of the REMCO meetings were attended by the following attendees:
Key activities of the REMCO during the 2019 financial year• Focused on developing remuneration policies to
support key and senior management succession plans. This resulted in the introduction of the RSP with 94 employees invited to participate.
• Introduced the RSP to assist in driving employees’ sense of ownership through the election to exchange the pre-tax cash payment under the LTI for restricted shares. The first opportunity was taken up by 71% of eligible employees.
• As tasked by the board through the REMCO charter, confirmed that remuneration policies, processes and practices are implemented and continuously maintained to, as a minimum, comply with the requirements specified in regulation 39(16)(a) of the Banks Act and King IV™ and take into account stakeholder feedback.
• Monitored remuneration practices and adherence to the remuneration policy, having met formally twice and informally on an ad hoc basis, as deemed necessary.
• Reviewed organisation-wide remuneration policies in line with best practice and governance standards on an annual basis, including key management bonuses and incentive schemes.
• Fulfilled delegated responsibilities in respect of the Capitec Bank Holdings Share Trust.
• Evaluated and approved all annual increases for Capitec employees, including those relating to directors: proposed non-executive directors’ fees to the board for recommendation to the shareholders for consideration at the AGM.
• As required by Basel and King IV™, annually consider whether the remuneration structures continue to effectively align remuneration with performance according to shareholder interests and acceptable risk-taking.
Composition of the REMCO as at 28 February 2019
Attendee Role Capacity
LA Dlamini Chairperson Independent non-executive director
JD McKenzie Member Independent non-executive director
CA Otto Member Non-executive director
MS du Pré le Roux Non-voting invitee Non-executive director
GM Fourie Non-voting invitee CEO
NST Motjuwadi Non-voting invitee Executive: human resources
R Stassen Non-voting invitee Non-executive director (chairman of the board)
120 | Capitec Bank Holdings Limited
Key performance indicators
Leadership reviews
The Capitec Way
Our business context
Our strategic goals and insights
Leadership teams and governance oversight

• The REMCO charter incorporates the regulations to the Banks Act. The committee therefore regularly considers whether the remuneration structures continue to be effective, align with shareholder expectation and remain within a required risk framework. It is satisfied that these requirements are met.
General remuneration principlesThe following remuneration principles support our remuneration philosophy (as explained in Part 1, from page 117).
Considering performance; determining increasesAs a general principle, increases (including those of executive directors and key management) are determined by taking into account the following factors:• Performance of the individual, team and company• Competence• Forecast profitability• Economic factors, including CPI
Capitec continuously monitors the competitiveness of employees’ TR through external benchmarking. For non-board employees the company uses PwC’s REMchannel® remuneration survey. For executive and non-executive directors (NED), a comparator group of JSE-listed companies similar in size of market cap and/or industry is used to ensure that our employees are remunerated fairly and in line with the market. In addition, Capitec looks at the remuneration for the 4 largest South African banks, as the company’s closest competitors. The following companies are used:• Absa Limited (previously Barclays Africa Group Limited)• Discovery Limited• FirstRand Limited• Growthpoint Properties Limited• Nedbank Group Limited• PSG Group Limited• Remgro Limited• RMB Holdings Limited• Sanlam Limited• Shoprite Holdings Limited• Standard Bank Limited• Tiger Brands Limited• Woolworths Holdings Limited
The REMCO annually reviews and approves the salary increases of each individual member of the executive committee. The REMCO is further presented with the proposed salary increase pool for all employees across Capitec, which is then reviewed and debated by the REMCO. The REMCO approves the annual salary increase pool and provides the authority to the CEO and divisional executives to distribute the increases as appropriate.
Fair and responsible remunerationKey management remuneration should be fair and responsible in the context of overall employee remuneration. As a responsible employer, Capitec is sensitive to socio-economic challenges and the need for corporates to address unfair income disparities in society.
In our journey to do our part in fighting unemployment, we annually appoint matriculants who are put through an intense two-year training programme to provide them with the skills and experience necessary to help our clients in branches across South Africa and help us grow our business. Although these employees are initially appointed at a frugal starting salary, their individual performance is reviewed every 6 months, at which time their salaries have the potential to increase at greater than the inflation rate.
In addition, we constantly seek to ensure that the implementation of our remuneration policy results in fair and responsible remuneration and that employees have access to flexible employee benefits that are affordable and accessible.
Continuous effortsContinuous efforts in this regard include:• Driving employee awareness and take-up of benefits and
training to realise more value for employees, with special attention to lower levels where there are challenges in terms of exposure and understanding how benefits improve employees’ quality of life.
• Continued support of the credit health and general financial wellness of employees through education, awareness and credit rehabilitation in partnership with a specialist service provider.
• As part of ensuring internal fair pay practices, continuing to ensure that equal pay is provided for work of equal value so that there are no income disparities based on gender, race or any other unacceptable grounds of discrimination. This includes regularly conducting job evaluations and benchmarking.
Integrated Annual Report 2019 | 121
Risk management report
Remuneration report
Social responsibility
About this report
Appendices Annual financial statements
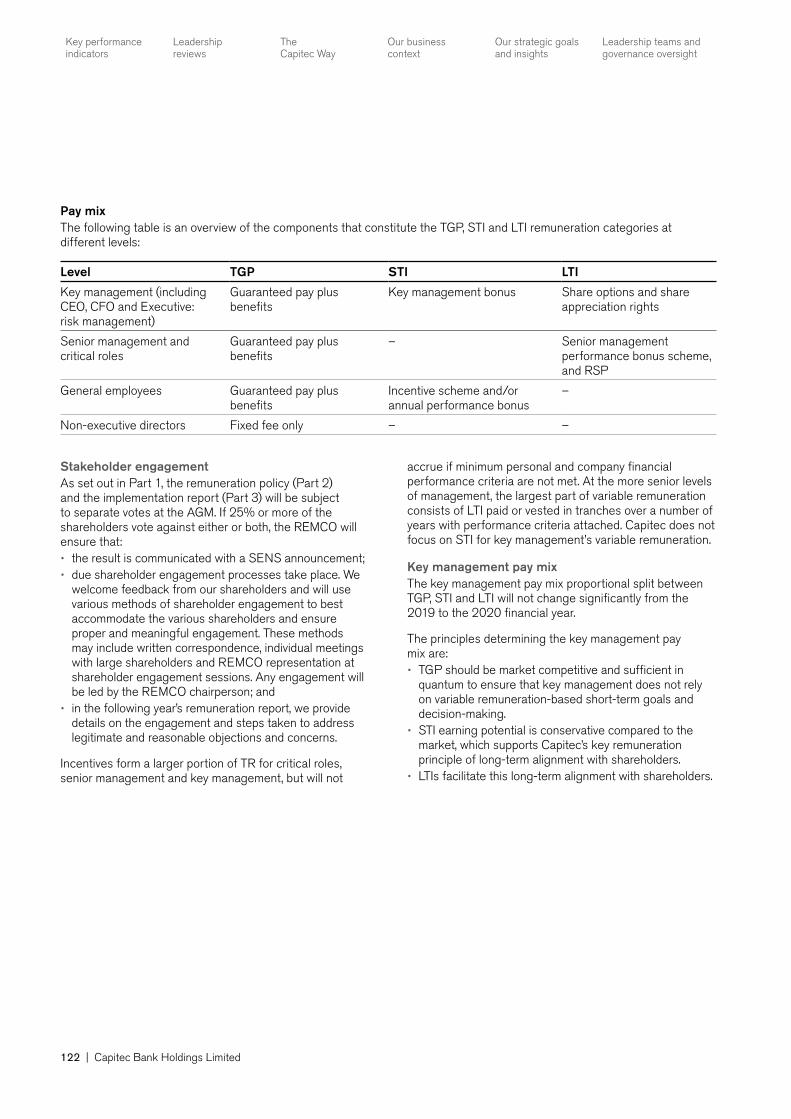
Stakeholder engagementAs set out in Part 1, the remuneration policy (Part 2) and the implementation report (Part 3) will be subject to separate votes at the AGM. If 25% or more of the shareholders vote against either or both, the REMCO will ensure that:• the result is communicated with a SENS announcement;• due shareholder engagement processes take place. We
welcome feedback from our shareholders and will use various methods of shareholder engagement to best accommodate the various shareholders and ensure proper and meaningful engagement. These methods may include written correspondence, individual meetings with large shareholders and REMCO representation at shareholder engagement sessions. Any engagement will be led by the REMCO chairperson; and
• in the following year’s remuneration report, we provide details on the engagement and steps taken to address legitimate and reasonable objections and concerns.
Incentives form a larger portion of TR for critical roles, senior management and key management, but will not
Pay mixThe following table is an overview of the components that constitute the TGP, STI and LTI remuneration categories at different levels:
Level TGP STI LTI
Key management (including CEO, CFO and Executive: risk management)
Guaranteed pay plus benefits
Key management bonus Share options and share appreciation rights
Senior management and critical roles
Guaranteed pay plus benefits
– Senior management performance bonus scheme, and RSP
General employees Guaranteed pay plus benefits
Incentive scheme and/or annual performance bonus
–
Non-executive directors Fixed fee only – –
accrue if minimum personal and company financial performance criteria are not met. At the more senior levels of management, the largest part of variable remuneration consists of LTI paid or vested in tranches over a number of years with performance criteria attached. Capitec does not focus on STI for key management’s variable remuneration.
Key management pay mixThe key management pay mix proportional split between TGP, STI and LTI will not change significantly from the 2019 to the 2020 financial year.
The principles determining the key management pay mix are:• TGP should be market competitive and sufficient in
quantum to ensure that key management does not rely on variable remuneration-based short-term goals and decision-making.
• STI earning potential is conservative compared to the market, which supports Capitec’s key remuneration principle of long-term alignment with shareholders.
• LTIs facilitate this long-term alignment with shareholders.
122 | Capitec Bank Holdings Limited
Key performance indicators
Leadership reviews
The Capitec Way
Our business context
Our strategic goals and insights
Leadership teams and governance oversight

Element Calculation minimum On target Above target
TGP TGP at 1 March 2019, see page 127. Benefits assumed in line with those paid in the 2019 financial year and contributions to the share purchase scheme assumed to be zero.
STI Nil 33% of annual TGP 54% of annual TGP
LTI Nil The maximum number of instruments granted in the 2019 financial year that might vest multiplied by the fair value on grant.
The maximum number of instruments granted in the 2019 financial year that might vest multiplied by the share price on grant.
The graphs below set out the pay mix of Capitec’s executive directors for minimum, on-target and above-target performance. They demonstrate the strong pay-for-performance culture that is a core principle of our remuneration philosophy. The graphs assume the following:
TGPTGP for key management is informed by:• the Capitec approach to the key management pay mix
described above; and• how TGP forms part of TR at market median (or the
upper quartile in instances where this is warranted).
Executive directors are remunerated for services as employees of Capitec Bank. No fees are paid for their services as directors of any other companies in the group.
STICapitec’s key management remuneration policy and pay mix provide a modest cash STI but requires considerable performance. This is in line with Capitec’s policy of risk alignment and encouraging long-term vision and decision-making by key management, as opposed to short-term goal setting.
Key aspects of the STI (key management bonus)The annual STI is designed to recognise the achievement of company financial performance measures and a combination of strategic measures linked to Capitec’s overall business strategy. The STI is self-funded and settled in cash.
Capitec takes the following holistic approach to determining the STI value: • The STI value is based primarily on the achievement
of company financial performance measured as year-on-year HEPS growth. Incremental increases above on-target performance correlate directly with the percentage of STI payable.
• Capitec also takes the achievement of personal KPIs into account as part of its holistic approach in reviewing performance. Personal KPIs are contracted with the REMCO by each member of key management and are continuously monitored throughout the year. While not specifically linked to the 6 capitals (set out by the International Integrated Reporting Council), the personal KPIs cover a broad spectrum of capitals and, most importantly, are aligned with Capitec’s strategic priorities. These measures are set out in a balanced scorecard under the following categories: – Efficiency – Business delivery – Diversity income stream – People – Quality clients – Innovative Digital and Data – Service experience
STI FixedLTI
Minimum StretchOn-target
GM FOURIE
100%11 676
27 829
58 450
43%43%
14%
20%69%
11%
Minimum StretchOn-target
AP DU PLESSIS
STI FixedLTI
100%9 181
19 93946%
39%15%
23%40 764
65%12%
Minimum StretchOn-target
NS MASHIYA
STI FixedLTI
100%4 358
53%
29%
17%
15%
30%
56%
8 217
15 063
Integrated Annual Report 2019 | 123
Risk management report
Remuneration report
Social responsibility
About this report
Appendices Annual financial statements

• Targets are set by the REMCO annually to ensure that they are truly stretching and only reward exceptional performance. At the end of the financial year, the REMCO assesses the level of financial and personal performance and determines the STI payment to be made to each member of key management.
• Although the STI is uncapped, the additional amount earned for performance above target is minimal. This ensures that the STI earned remains modest when looking at the pay mix as a whole.
• Failing on-target performance in either personal or company performance will warrant no payment.
Key management’s earning potential for STI:
Percentage year-on-year growth in HEPS
Payment as percentage
of annual TGP
Below target No payment
On-target 33%
Stretch (indicative only) 54%
LTIAs part of their annual review of remuneration, the REMCO reviews best practice in respect of LTIs. This includes reviewing the type of instrument, appropriate performance measures and operation of malus and clawback. The REMCO believes that the current LTI structures are the most appropriate for Capitec.
Senior management performance bonus schemeSenior management and roles identified as critical to the success of the organisation (specifically excluding key management and directors) are participants of the senior management performance bonus scheme. The goal of the scheme is to motivate a medium-term strategic focus for these employees.
Characteristics of the scheme include:• Cash-settled• Performance-based criteria include minimum personal
performance and minimum company performance (growth in HEPS) to qualify for an award
• Benefits vest and pay out over 3 years in 3 equal tranches
• Forfeiture of all balances in the scheme on termination of employment other than formal retirement, death, permanent disability or retrenchment.
• 75% of balances in the scheme are paid out on early retirement from 60 to 64 years, and the full balance is paid at the normal retirement age of 65
During the year, the REMCO and management reviewed the scheme to provide for greater alignment with shareholders and to allow participants to benefit from the success of the company. We introduced the choice for participants to elect that all or a portion of the award
be delivered in Capitec shares. Where employees opt for shares, they will also receive a match of 10% of their award in additional restricted shares. The shares will vest in equal tranches in years 2 and 3.
Key management LTILTIs for key management are awarded annually as a percentage of TGP. Share options and share appreciation rights (SARs) are granted on an equal basis (i.e. each 50%).
Share optionsWith an option, employees are entitled, but not obliged, to purchase Capitec ordinary shares at an agreed date in the future for a predetermined price. The option price is set equal to the market value of the share, being the 30-day volume weighted average share price on the JSE immediately preceding the day on which the options are granted. The number of shares the employee can purchase is determined by company performance measures. The options vest in years 3, 4, 5 and 6 after grant, in 25% tranches. Participants have a 6-month period after the date on which the options vest to exercise their right to purchase the shares.
Share appreciation rightsSARs operate similarly to the options detailed above i.e. option price, performance measures and vesting and exercise periods. SARs are settled in cash as opposed to equity. The amount settled is equal to the growth in share price above the option price. The SARs scheme is a simple, effective instrument and does not dilute issued share capital. SARs are granted at the same time and on the same terms (other than settlement) as the options.
Performance measures and vesting periodBeyond the minimum personal performance measures for participation (KPIs contracted with the REMCO), vesting is subject to the following company performance measures, for all awards of SARs and options:
MeasureMinimum requirement for vesting Weighting
HEPS Growth exceeding CPI plus GDP plus 4%
50%
Return on equity (ROE)
Outperform the average ROE of the 4 traditional banks in South Africa (Absa Bank Limited, FirstRand Bank Limited, Standard Bank Limited, Nedbank Group Limited)
50%
Capitec chose an earnings metric and a return metric (equally weighted) as company performance measures for vesting to ensure that the combination motivates key management to drive both measures as opposed to one measure at the cost of the other. The targets set are absolute targets and there is no threshold. This is because Capitec believes that performance below minimum requirements does not warrant vesting.
124 | Capitec Bank Holdings Limited
Key performance indicators
Leadership reviews
The Capitec Way
Our business context
Our strategic goals and insights
Leadership teams and governance oversight

Targets are measured over a cumulative 3-year performance period. After the initial 3-year financial performance period, vesting is subject to continued employment for years 4, 5 and 6.
The extent to which the performance measures are met will determine the percentage vesting. If the HEPS measure is met, but not the ROE measure, 50% will vest and vice versa. If both measures are met, 100% will vest, and if neither are met, nothing will vest.
Restricted Share Plan – Future TalentThe RSP will be used as a retention tool for staff identified in the future talent succession pool. Key management does not participate in the RSP. Succession candidates may be awarded restricted shares with no performance measures, equal to up to 50% of their annual guaranteed remuneration package. The shares will be subject to a restriction on disposal for 2 years. In the 3rd year, participants shall be entitled to sell up to one-third, in the 4th year up to two-thirds, and in the 5th year all the shares. Participants receive all shareholder rights from the award date, including dividend and voting rights.
Termination of employment and effect on unvested LTIIn the case of just-cause dismissal or resignation, all unvested LTIs are forfeited. In the case of death or ill health, the REMCO has discretion to allow automatic vesting of all unvested LTIs. The following table sets out the vesting of LTI on retirement, subject to the REMCO’s discretion:
Retirement ageOptions, SARs and RSP awards
Before 60 years Forfeit all non-vested options, SARs and RSP awards
From 60 years to 64 years
75% of options, SARs and RSP awards will vest at the original future vesting dates
At 65 years 100% vesting of all options, SARs and RSP awards at the original future vesting dates
Share dilution usage for LTISince the establishment of Capitec, 17.4 million options have been exercised. To date, 5.83 million ordinary shares have been issued in settlement of these exercised options. The balance of ordinary shares required to settle options that have been exercised were acquired in the market.
In terms of the Capitec Bank Holdings Share Trust (the Trust) deed, a maximum of 11.53 million ordinary shares may be issued for purposes of the Trust (scheme allocation), after which shareholder approval must be obtained to determine a new scheme allocation.
The past dilutive effect of issues of ordinary shares for purposes of the Trust since the inception of Capitec remains at 5.04% of the issued ordinary share capital of Capitec as at 28 February 2019.
The potential future dilutive effect is limited to 4.93% of the issued ordinary share capital of Capitec as at 28 February 2019.
Executive director and key management contractsExecutive directors and other members of key management do not have fixed-term or bespoke key management contracts, but are employed in terms of the group’s standard contract of employment. The notice period for termination of service is 1 calendar month. This was amended during the 2015 financial year so that the notice period for new key management appointments is 3 months.
Normal retirement age ranges from 60 to 65 years, unless the board requests to extend this term.
No additional payments are made to key management upon termination of employment (apart from those required in terms of labour legislation) and they do not receive sign-on bonuses.
Upon termination of employment, all STIs are forfeited. Unvested LTI will be treated in accordance with the LTI policy (refer to page 128, termination of employment and effect on unvested LTI).
Alignment of remuneration with risk, and minimum shareholding requirementsThe REMCO forms part of the formal risk governance framework and its charter mandates it to assess the appropriateness of the risk/reward relationship in remuneration structures. The REMCO is guided by the following:• inherent risks in the business model;• the risk-taking and delegation structure; and• the status of the risk barometer as an indicator of the
existence and management of risk.
The REMCO reviews variable remuneration and incentive plans to ensure that they are based on a measurable end result.
Risk and compliance employees’ remunerationRemuneration levels and structures for risk and compliance employees are determined as part of the annual budget process and are subject to oversight by the REMCO. This happens independently of the relevant risk departments. The audit committee ensures that these employees are correctly and fairly remunerated. During the year under review, Capitec introduced a further measure in the form of a bonus cap to ensure that the remuneration of employees in internal audit roles are in line with best practice. Bonuses for internal audit employees are capped
Integrated Annual Report 2019 | 125
Risk management report
Remuneration report
Social responsibility
About this report
Appendices Annual financial statements

at 500% of an employee’s monthly salary (41.67% of their annual salary).
Minimum shareholding requirements (MSRs)MSRs expose key management to the same risks and rewards faced by Capitec’s shareholders.
Capitec’s key management voluntarily hold an outright share ownership (through direct shareholding and not unvested LTI) that is not less than the value of the following proportion of their respective TGP as at 28 February 2019.
PositionMinimum holding
in proportion to TGP
CEO 300%
CFO 300%
Key management 100%
The minimum holding should be retained until termination of employment. The percentage shareholding should be achieved within 5 years from 1 March 2016 or within 5 years of a key management appointment.
Shareholding is measured annually using the average value of the Capitec share price over a period of 52 weeks, expressed as a percentage of key management’s TGP.
Non-executive director feesNED remuneration is based on a fixed-fee structure not related to meeting attendance. The chairman of the board is paid a retainer and receives no further payment for committee membership. Board members receive a retainer for board membership and for each board committee on which they served. No fee is paid for the directors’ affairs committee.
NEDs do not qualify for any STI.
No new LTI allocations are made to NEDs. However, previous tenure as a member of key management may result in legitimate vesting of a previously awarded LTI.
NEDs are reimbursed for their direct and/or indirect expenses reasonably and properly incurred in the performance of their duties. NEDs who, in terms of tax requirements, supply a tax invoice with VAT, receive their approved NED fees accordingly.
Proposed 2020 NED feesThe following proposed 2020 NED fees will be tabled for approval by shareholders (in terms of the Companies Act, Act 71 of 2008) at the AGM to be held on 31 May 2019. Refer to special resolution number 1 in the notice of the AGM.
During the year under review, Capitec conducted an external benchmarking exercise as part of reviewing the NED fees. The same comparator group was used as for the executive directors, as set out on page 133. The benchmarking exercise identified that the 2019 fees paid to Capitec’s NEDs tend towards the lower quartile of the comparator group. In considering the 2020 NED fees recommended by management, the following factors were noted:• The difficulty of attracting suitable NEDs who are fit
and proper• The increase in corporate malfeasance and corporate
failures that has heightened the governance and oversight role of NEDs
• Ongoing changes to the regulatory landscape and regulatory frameworks that have increased the governance burden on NEDs
• Personal and professional risk associated with holding such office
The proposed increases serve to bring the fees in line with the median of the comparator group while remaining below the average when measured against the 4 traditional banks. While it is noted that the increases represent a meaningful adjustment, the board believes it is necessary to ensure the continued attraction of suitable talent.
Directors’ fees (R’000) 2019 2020Change
(%)
Chairman of the board 1 390 2 500 80
Lead independent director 250 300 20
Directors 325 450 38
Chairman of the audit committee 350 450 29
Chairman of the risk and capital management committee 350 450 29
Chairman of the REMCO 270 350 30
Chairman of the social and ethics committee 120 200 67
Audit committee member 120 200 67
Risk and capital management committee member 120 200 67
REMCO member 120 150 25
Social and ethics committee member 65 80 23
Committee member 65 70 8
Directors’ affairs committee – – –
126 | Capitec Bank Holdings Limited
Key performance indicators
Leadership reviews
The Capitec Way
Our business context
Our strategic goals and insights
Leadership teams and governance oversight

Part 3: Implementation reportThe REMCO is satisfied that remuneration practices for the financial year comply with the remuneration policy and that there were no deviations from the policy.
Capitec performed well during the year, with a resulting HEPS growth of 19 and ROE of 28. In keeping with our remuneration philosophy, we balanced strong financial performance with the principle of frugality to ensure sustainability of our relationships with our clients, shareholders and employees.
This part of the report provides insight into the implementation of our remuneration policy during the year ended 28 February 2019. It details the remuneration paid to both executive directors and non-executive directors, in particular: • The TGP increases approved in line with the Capitec TR
policy approach• STI performance versus the outperformance of targets set• The LTI awards granted in the reporting year to eligible
employees ensuring continued retention and alignment with shareholders and pay-for-performance philosophy
• The LTI awards vesting in the reporting year – the performance period for the first SARs and options with performance measures – which resulted in a vesting of 100% demonstrating the company’s strong performance over the period
• The fair value of unvested LTI awards remaining, which demonstrated alignment between directors and shareholders
• An overview of the incremental TR growth over the past 4 years compared to some key financial metrics (being the value added to shareholders in terms of metrics such as HEPS, ROE and share price growth)
• A single remuneration figure for the value of actual TGP paid, STI paid and any LTI vesting in the 12 months following year-end
• The executive directors’ shareholding compared to minimum shareholding requirement
• The NED fees paid to individuals for their services as board and committee members as approved by shareholders.
TGPThe TGP increases awarded to executive directors were in line with the average awarded to all employees over the 2019 financial year. The average awarded to all employees was 8.2%.
The table below sets out the approved increases in executive director TGP for the 2019 financial year. Note that the actual TGP figures paid are included in the single-figure table (on page 132). The reason for deviation of actual payment from approved payment is the inclusion of the risk benefit (based on approved TGP), any unpaid leave the individual may have taken in a particular year, and the increases only taking effect from 1 May every year.
Executive directors
2019(R)
2018(R)
Change (%)
GM Fourie 11 825 000 10 750 000 10
AP du Plessis 9 271 976 8 278 580 12
NS Mashiya 4 365 168 4 044 600 8
Integrated Annual Report 2019 | 127
Risk management report
Remuneration report
Social responsibility
About this report
Appendices Annual financial statements

STIAs set out in the remuneration policy, a small proportion of key management remuneration is delivered through the STI. The REMCO believes that the performance targets set annually are stretching and only reward appropriate levels of performance. The performance measure table below compares the executive directors’ STI paid with on-target earning potential, the company performance measure, and targets on which the payment was based.
Performance measure Weighting Performance targetActual
performance
Actual vesting
%
HEPS 50% Growth exceeding CPI + GDP + 4% 18.6 50
ROE 50% Outperform the average ROE of the 4
traditional banks in South Africa
28 50
Executive directors 2019 STI amount(R’000)
GM Fourie 4 651
AP du Plessis 3 647
NS Mashiya 1 718
The REMCO reviewed both Capitec’s financial performance and the performance of each executive in respect of their personal KPIs for the year. The year-on-year growth in HEPS of 18.6% was above the 15% target. Following rigorous discussions on Capitec’s overall performance, the REMCO approved an STI payment of 39.3% of TGP for the 2019 financial year. The REMCO is satisfied that the level of STIs earned for the 2019 financial year is an accurate reflection of company and individual performance.
LTIThe following section sets out details of the instruments granted during the year, instruments vesting during the year (included in the single-figure table) and instruments that remain unvested at the end of the financial year. For instruments exercised during the year, we set out the cash value received on exercise.
LTI awards granted in the reporting yearIn line with our remuneration policy as set out in Part 2 (page 120), grants of options and SARs were made to executive directors during the year. Options and SARs are subject to the performance measures set out on page 124. Details of the number of shares and the options price are set out in the unvested awards table on page 130.
Performance measure Performance targets*Actual
performance
Percentage year-on-year growth in HEPS 14.9% 15.0% 19.0% 23.0% 18.6%
Percentage of TGP payable 0.0% 33.3% 40.0% 46.7% 39.3%
* Straight-line vesting between points
LTI awards vesting in the reporting yearFor the financial year ended, Capitec has options and SARs both with and without performance measures vesting. All awards vest in equal tranches in years 3, 4, 5 and 6. Capitec has reviewed the methodology set out in the King IV™ guidance notes issued by the South African Reward Association (SARA) and the Institute of Directors in Southern Africa (IoDSA). For options and SARs that have performance measures, the guidance notes suggest that the value of options and SARs is include in the single-figure table at the year-end aligned with when the performance period ends. As Capitec uses tranche vesting, there is a significant timing misalignment between the end of the performance period (3 years) and the achievement of the employment condition and resultant vesting (years 3, 4, 5 and 6). For this reason, the REMCO has taken the decision to report the value in the single-figure table in respect of the options and SARs that are due to vest within 12 months of financial year-end regardless of whether performance measures are attached or not. This ensures consistency of treatment between awards with and without performance measures, and more accurately reflects the economic value to participants at the time of vesting.
Achievement of performance measuresThe table below sets out the achievement of performance measures for the 2017 options and 2017 SARs. The performance measures are the same for both instruments.
128 | Capitec Bank Holdings Limited
Key performance indicators
Leadership reviews
The Capitec Way
Our business context
Our strategic goals and insights
Leadership teams and governance oversight

The table below sets out details of the value of awards included in the single-figure table on page 132. We used a year-end share price of R1 306.21.
Executive Type of instrument
2014 awards(R’000)
2015 awards(R’000)
2016 awards(R’000)
2017 awards(R’000)
Value of sharesincluded in single-
figure table(R’000)
GM Fourie Options 12 371 5 086 21 370 7 640 46 467
SARs 12 371 2 034 10 157 7 640 32 202
Total 24 742 7 120 31 527 15 280 78 669
AP du Plessis Options 4 834 6 589 16 223 4 670 32 315
SARs 4 834 2 635 7 710 4 670 19 848
Total 9 668 9 224 23 933 9 340 52 163
NS Mashiya Options 6 810 1 623 8 424
SARs 3 919 1 623 5 542
Total 10 729 3 246 13 966
LTI unvested awardsThe following table sets out the unvested instruments remaining for each executive director. It includes a calculation of the indicative value of unvested instruments at the end of the 2019 financial year and a calculation of the cash value of instruments exercised in the 2019 financial year. The methodology used in determining these values is in line with the guidance notes issued by SARA and IoDSA.
Before studying the table, it is important to consider the following:• The first grant with performance measures applicable
was made in 2017 and the first tranche vested in February 2019. As such, the table sets out the awards which vested in respect of this first tranche, as well as the number of awards which lapsed following the testing of the performance measures.
• The indicative value of unvested instruments is an estimated value and is not an actual reflection of the value of the award that will vest in future.
• The cash value of instruments exercised in the year represents the gain made on the exercise of instruments during the year.
• The indicative value of unvested instruments and the cash value of instruments exercised in the year should not be added together.
The table below sets out the resultant number of shares available for vesting based on the achievement of performance measures.
Executive Type of instrumentShares
awarded
Performancemeasure
achievement %
Strike priceR
Number of shares available
for vesting
GM Fourie Options 36 677 100 473.05 36 677
SARs 36 677 100 473.05 36 677
Total 73 354
AP du Plessis Options 22 420 100 473.05 22 420
SARs 22 420 100 473.05 22 420
Total 44 840
NS Mashiya Options 7 791 100 473.05 7 791
SARs 7 791 100 473.05 7 791
Total 15 582
Integrated Annual Report 2019 | 129
Risk management report
Remuneration report
Social responsibility
About this report
Appendices Annual financial statements

Date of award
Number ofinstruments
awardedStrike price
R
Number ofinstruments vested and
exercised
Number ofinstruments
lapsed
Closingnumber
of unvestedinstruments
Indicativevalue
of unvestedand/or
unexercisedinstruments
R’000
Number ofinstruments
exercised in year
Share price at which
instrumentswere
exercised R
Cash value of
instrumentsexercised
in year R’000
GM FourieOptions
2013 20 000 198.52 20 000 – – – 5 000 844 3 227 2014 17 500 201.4 13 125 – 4 375 4 832 4 375 957.4 3 308 2014 27 500 209.83 20 625 – 6 875 7 528 6 875 1 079.54 5 979 2015 18 330 196.43 13 748 – 4 583 5 084 4 583 957.4 3 488 2016 91 487 371.88 45 744 – 45 744 43 000 22 872 844 10 798 2017 36 677 473.05 – – 36 677 31 446 – – – 2018 25 507 705.93 – – 25 507 17 358 – – – 2019 22 957 881.76 – – 22 957 13 438 – – – SARs2013 20 000 198.52 20 000 – – – 5 000 874 3 377 2014 17 500 201.4 13 125 – 4 375 4 832 4 375 874 2 943 2014 27 500 209.83 20 625 – 6 875 7 528 6 875 1 090 6 051 2015 6 225 0.01 4 669 – 1 556 2 031 1 556 874 1 360
2016 31 106 0.01 15 553 – 15 553 20 165 7 777 874 6 797 2017 36 677 473.05 – – 36 677 31 446 – – – 2018 25 507 705.93 – – 25 507 17 358 – – – 2019 22 957 881.76 – – 22 957 13 438 – – – AP du PlessisOptions2013 20 000 198.52 20 000 – – – 5 000 844 3 227 2014 17 500 201.4 13 125 – 4 375 4 832 4 375 848.01 2 829 2015 23 746 196.43 17 810 – 5 937 6 587 5 937 844 3 845 2016 69 454 371.88 34 727 – 34 727 32 644 17 364(1) 846/848.01(1) 8 2462017 22 420 473.05 – – 22 420 19 223 – – – 2018 15 714 705.93 – – 15 714 10 693 – – – 2019 15 121 881.76 – – 15 121 8 851 – – – SARs2013 20 000 198.52 20 000 – – – 5 000 874 3 377 2014 17 500 201.4 13 125 – 4 375 4 832 4 375 874 2 943 2015 8 065 0.01 6 049 – 2 016 2 631 2 016 874 1 762 2016 23 614 0.01 11 807 – 11 807 15 308 5 904 874 5 160 2017 22 420 473.05 – – 22 420 19 223 – – – 2018 15 714 705.93 – – 15 714 10 693 – – – 2019 15 121 881.76 – – 15 121 8 851 – – – NS MashiyaOptions2016 35 500 539.88 8 875 – 26 625(2) 20 831 – – – 2017 7 791 473.05 – – 7 791 6 680 – – – 2018 5 414 705.93 – – 5 414 3 684 – – – 2019 4 749 881.76 – – 4 749 2 780 – – – SARs2016 12 000 0.01 3 000 – 9 000(2) 11 640 – – – 2017 7 791 473.05 – – 7 791 6 680 – – – 2018 5 414 705.93 – – 5 414 3 684 – – – 2019 4 749 881.76 – – 4 749 2 780 – – –
(1) The tranche that vested during the year was exercised in 2 transactions: 10 937 options were exercised at a share price of R846.00, and 6 427 options were exercised at a share price of R848.01.
(2) As at the year end, the 2nd tranche of NS Mashiya’s 2016 options and 2016 SARs had vested but not been exercised.
130 | Capitec Bank Holdings Limited
Key performance indicators
Leadership reviews
The Capitec Way
Our business context
Our strategic goals and insights
Leadership teams and governance oversight

Key management value creationThe table below compares the headline earnings of Capitec over the past 6 years, with the total executive remuneration paid in that year. The REMCO is satisfied that the level of executive pay as a proportion of headline earnings is reasonable considering the value created for investors over the period, in comparison to the incremental
Performance versus incremental remuneration increaseHeadline earnings
R’m
Total executiveremuneration
R’m*
Remunerationas percentage of
headline earnings%
ROE%
2019 5 292 109 2 28
2018 4 461 84 2 27
2017 3 793 90 2 27
2016 3 222 101 3 27
2015 2 547 62 2 25
2014 2 017 41 2 23
Value created over 4-year period versus remuneration
cost differential 2 745 47 – –
* Includes all key management’s TGP, STI and LTI at fair value granted during the year and measured on the reporting date.
An important factor to consider is the rising share price over the same period, as illustrated in the following graph:
0
200
400
600
800
1 000
1 200
1 400
1 600
CAPITEC HOLDINGS LIMITED SHARE PRICE (JSE: CPI)
Feb – 12 Feb – 13 Feb – 14 Feb – 15 Feb – 16Aug – 12 Aug – 13 Aug – 14 Aug – 15 Aug – 16 Feb – 18Feb – 17 Aug – 17
185
188
184
401
474
725
832
Aug – 18 Feb – 19
1 306
total executive remuneration increase over the same period. Note that the value included below in respect of total executive remuneration differs from that in the single-figure table as it uses the fair value at grant for LTIs rather than the indicative value of awards that have vested.
Integrated Annual Report 2019 | 131
Risk management report
Remuneration report
Social responsibility
About this report
Appendices Annual financial statements

Executive director shareholdingIn the 2017 financial year, the REMCO introduced MSRs for executive directors and other key management (see the related section under Part 2: Remuneration philosophy and policy, on page 120.)
The REMCO is satisfied that all MSRs were met for the 2019 financial year as:• the CEO and CFO are within their MSRs, exhibiting
a strong buy-in to the principle of alignment with shareholder interests; and
• the Executive: risk management is on track to achieving the 100% TGP required within the first 5 years of appointment to the position.
Executive directors(R’000)
Guaranteed pay Benefits TGP
Contributionto employee
sharepurchase scheme STI LTI
TRfor the year
2019
GM Fourie 11 646 30 11 676 – 4 651 78 669 94 996
AP du Plessis 9 106 74 9 181 – 3 647 52 163 64 991
NS Mashiya 4 314 44 4 358 – 1 718 13 966 20 042
25 066 148 25 215 – 10 016 144 798 180 029
2018
GM Fourie 10 625 78 10 703 251 4 049 41 641 56 644
AP du Plessis 8 170 77 8 247 – 3 118 30 228 41 593
NS Mashiya 4 001 41 4 042 – 1 523 5 094 10 659
22 796 196 22 922 251 8 691 76 963 108 896
Executive director single figureThe following table illustrates a single remuneration figure for the value of guaranteed pay, benefits, STI and LTI. The corresponding value for the preceding year is included. The increase in the single remuneration figure between FY18 and FY19 is driven by an increase in the value of LTIs included in the calculation. This increase is due to the significant share price growth of 57% that Capitec has experienced during the current financial year.
The percentage shareholding as at financial year-end is:
Position% shareholding in proportion
to TGP
CEO 14 668%
CFO 11 671%
Executive: risk management 22%
Shareholding is measured annually using the average value of the Capitec share price over a period of 52 weeks, expressed as a percentage of key management’s TGP.
Non-executive director actuals (as approved at previous AGM)NEDs received no other remuneration or benefits beside directors’ fees. NEDs are reimbursed for their direct and/or indirect expenses reasonably and properly incurred in the performance of their duties. NEDs who, in terms of tax requirements, supply a tax invoice with VAT, receive their approved NED fees accordingly.
132 | Capitec Bank Holdings Limited
Key performance indicators
Leadership reviews
The Capitec Way
Our business context
Our strategic goals and insights
Leadership teams and governance oversight

For the financial year, NED fees were as follows (excluding any reimbursement and VAT):
Non-executive directors (R’000) 2019 2018Change
%
R Stassen (chairman) 1 390 1 300 7
CA Otto 685 670 2
LA Dlamini(1) 660 325 103
K Makwane(2) 445 271 64
JD McKenzie 1 165 670 74
DP Meintjes(3) 84 – 100
JP Verster 795 610 30
MS du Pré le Roux 325 300 8
NS Mjoli-Mncube 325 360 (10)
PJ Mouton 685 480 43
Total 6 559 4 986 32
(1) Appointed on 6 April 2017 and appointed as the REMCO chairperson on 22 February 2018.(2) Appointed on 6 April 2017.(3) Appointed on 28 November 2018.
Integrated Annual Report 2019 | 133
Risk management report
Remuneration report
Social responsibility
About this report
Appendices Annual financial statements

Remuneration analysis
BankStrategic
managementSenior
managementOther
employees Total
Financialstatementreference
Employees Number 12 111 13 651 13 774
Key
performance
indicators
Remuneration awards
Fixed R’000 62 235 172 867 2 889 449 3 124 551
Cash remuneration R’000 62 235 172 867 2 889 449 3 124 551 Note 24
Variable R’000 437 787 129 485 224 702 791 974
Cash staff performance bonus R’000 23 518 1 178 224 702 249 398
Cash bonus bank R’000 2 816 95 341 – 98 157
Share options(1) R’000 237 795 17 912 – 255 707 Note 24
Share appreciation rights(1) R’000 173 658 15 054 – 188 712 Note 24
Variable remuneration
Employees receiving awards Number 12 111 13 651 13 774
Non-deferred R’000 23 518 31 235 224 702 279 455
Deferred R’000 414 269 98 250 – 512 519
Outstanding deferred remuneration R’000 618 966 127 709 – 746 675
Cash bonus bank R’000 2 840 88 165 – 91 005 Note 18
Share options(1) R’000 365 557 16 760 – 382 317 Note 39
Share appreciation rights(1) R’000 250 569 22 784 – 273 353 Note 40
Deferred remuneration paid out R’000 226 775 109 599 – 336 374
Cash bonus bank R’000 3 357 75 826 – 79 183
Share options(1) R’000 124 842 16 714 – 141 556
Share appreciation rights(1) R’000 98 576 17 059 – 115 635
Employees’ exposure to adjustments R’000 618 966 127 709 – 746 675
Implicit adjustments R’000 618 966 36 704 – 655 670
Post explicit adjustments R’000 – 91 005 – 91 005
Total remuneration exposed to adjustments R’000 618 966 127 709 – 746 675
Implicit adjustments R’000 618 966 36 704 – 655 670
Post explicit adjustments R’000 – 91 005 – 91 005
Reductions due to post explicit adjustments R’000 – – – –
(1) The remuneration relating to share options and share appreciation rights for strategic management, includes the costs relating to R Stassen, a former executive director which retired on 31 December 2013 and is currently involved as chairman of the board from 27 May 2016, as well as three executive officers who retired during the previous 3 financial years.
134 | Capitec Bank Holdings Limited
Key performance indicators
Leadership reviews
The Capitec Way
Our business context
Our strategic goals and insights
Leadership teams and governance oversight

The social and ethics committee monitors the group’s activities with regard to:• social and economic development;• good corporate citizenship;• environmental, health and public safety;• impact of the company’s activities and services;• consumer relations; and• labour and employment relationships.
The committee functions within the ambit of an annually reviewed board-approved charter and meets twice a year.
The members of the social and ethics committee are:• Kabelo Makwane (independent non-executive chairman);• Lindi Dlamini (independent non-executive director); and• Nkosana Mashiya (executive: risk management).
Piet Mouton served as chairman during the 2019 financial year. Kabelo Makwane was appointed as new chairman on 22 February 2019.
Read more about the committee members’ qualifications and experience in their profiles on pages 74 to 77.
The executive: human resources, operational risk manager and company secretary are invited to attend all meetings of the committee. The chairman may invite such executives and senior management as appropriate to attend and be heard at meetings of the committee.
Integrated Annual Report 2019 | 135
social ðics report
Risk management report
Remuneration report
Social responsibility
About this report
Appendices Annual financial statements

The company demands a high standard of ethical conduct in its business practices and its dealing with stakeholders. Employees have access to a range of policies giving guidance on ethical conduct on the company’s intranet and are encouraged to ask questions, report suspicious activities to management or through Tip-offs anonymous and to uphold the Capitec Way. Ethics coaching is incorporated in general employee training to guide staff with regard to expected ethical conduct. The legal, compliance, internal audit, forensic and training departments all form part of the assurance process to facilitate an ethical outcome in the company’s activities.
The committee reviewed the matters over which they are required to preside during the year and based on the reports submitted to the committee and discussions had with management, is of the view that appropriate policies, systems and internal controls are in place, supported by a conscientious management team, to promote ethical conduct, good corporate citizenship, environmental care, fair labour practices and sound consumer relations.
Social and economic development • Total economic value distributed in the 2019 financial year – page 142• Our fundamentals and values – pages 34 and 35• Human rights – page 30• Zero tolerance for fraud and corruption – page 101• Employment equity – page 40• B-BBEE – pages 137 to 138
Good corporate citizenship • Social responsibility – pages 135 to 136; and page 46.• Our stakeholders – pages 36 and 37• Our awards – page 51
Environment and health and public safety and impact of company’s activities and of its products and services
• Pages 30 to 37; 139 to 140
Consumer relations and commitment to consumer protection laws
• Pages 67, 101 and 102• The committee is satisfied that appropriate systems and internal
controls are in place to facilitate compliance with relevant legislation and prevailing codes of best practice.
Labour and employment • Pages 38 to 45; 116 to 119
The committee is of the opinion that the Capitec group complies, in material respects, with legislation, regulations and codes of best practice relevant to the committee’s mandate. The committee is satisfied that it has fulfilled its responsibilities in accordance with its terms of reference for the year.
Piet MoutonOutgoing chairman of the social and ethics committee
Group activities monitored during the year
136 | Capitec Bank Holdings Limited
Key performance indicators
Leadership reviews
The Capitec Way
Our business context
Our strategic goals and insights
Leadership teams and governance oversight

We are committed to B-BBEE as a corporate responsibility and a uniquely South African social and economic challenge.
We adhere to the requirements of the amended Financial Sector Code (FSC) which actively promotes a transformed and globally competitive financial sector. This contributes to the establishment of an equitable society by providing accessible financial services to black people and by directing investment into targeted sectors of the economy.
Our most recent verification confirmed the bank’s B-BBEE status as a level 4 contributor.
Summary of Capitec Bank’s scorecard(1)
Element 2019 2018(1) 2017 2016
Ownership 14.28 16.54 9.19 11.42
Management 8.14 8.09 3.26 2.93
Employment equity(2) – – 6.63 6.19
Skills development 14.71 11.27 9.01 9.00
Preferential procurement 11.55 9.90 15.27 15.26
Enterprise development 11.00 5.84 1.58 2.09
Socio-economic development 5.21 3.00 1.28 1.15
Empowerment financing 12.00 12.00 12.00 12.00
Access to financial services 11.59 11.40 9.30 9.29
Total 88.48 78.04 67.52 69.33
(1) Provisional B-BBEE scorecard. The scorecard changed in December 2017, therefore the 2018 and 2019 numbers are not comparable to the years before.(2) Employment equity is included in management for 2018 and 2019.
Integrated Annual Report 2019 | 137
broad-based black economic empowerment
Risk management report
Remuneration report
Social responsibility
About this report
Appendices Annual financial statements

Embedding diversity and inclusionIn December 2017 the Financial Services Sector scorecard changed, which saw us dropping to a level 6 contributor. At Capitec Bank we see empowerment as more than just a scorecard, and we set up a strategy not only to increase our score on the scorecard to regain a level 4, but also started a diversity and inclusion programme to understand inclusion of minority and excluded groupings. This is in support of extending our employment equity programme.
Social and enterprise developmentOur strategy towards various Socio Economic, Enterprise Development and Consumer Finance programmes led to a spend of more than R60 million, as well as investment in excess of R90 million, on Supplier Development programmes.
Empowering financingCapitec Bank achieved 12 points in the targeted investment component by reaching its allocated target for the measurement period by providing financing for affordable housing to clients with a household income of less than R24 000 per month.
Access to financial servicesThe bank reached the target for the product-related access component by attracting lower-income clients to take up the bank’s savings account offering. The total monthly cost of operation was well below the industry standard and the bank subsequently achieved all the available points. The take-up of the bank’s remote banking offering by the lower-income clients also exceeded the industry target. This resulted in full recognition for this component.
138 | Capitec Bank Holdings Limited
Key performance indicators
Leadership reviews
The Capitec Way
Our business context
Our strategic goals and insights
Leadership teams and governance oversight

South Africa, in accordance with the global focus on climate change, is committed to reducing domestic greenhouse gas (GHG) emissions. Corporate entities are the largest contributors to GHG emissions. For this reason, all corporates are responsible for contributing to this effort. Capitec acknowledges this responsibility and the manner in which we live our core values underpins this responsibility.
Capitec has adopted a board-approved strategy to focus on efficient electricity management, as this is the single largest contributor to our carbon footprint. Thanks to the nature of our products and services, we are a low contributor to overall GHG emissions with an associated limited impact on the environment. This does not reduce our responsibility to do what we can to limit our impact on the environment. We continuously evaluate how we can evolve our processes to benefit our clients and other stakeholders. The natural outflow from this ongoing improvement cycle is the efficient use of and saving on the use of scarce resources. An example is our service project roll-out that limits paper usage and less travelling because we have centralised certain verification processes.
Governance of our environmental responsibilityThe social and ethics committee monitors the group’s activities with regard to environmental matters.
ElectricityCapitec relies on Eskom for all its electricity requirements. During the year, 30 193 MWh (2018: 30 407 MWh) of electricity was consumed.
PaperCapitec only purchases paper approved by the Forest Stewardship Council (FSC) and attempts to source local products, considering cost-effectiveness against the background of an increase in branches and employees.
Waste and recyclingEmployees at head and regional offices are required to recycle paper in special paper bins and are encouraged to use the special bins provided for recyclable materials. The primary focus is to recycle paper and tins. Altogether 13 368 kg (2018: 11 948 kg) paper and 1 357 kg (2018: 1 179 kg) tins were recycled. Electronic equipment is disposed of and recycled by accredited third parties. In total, 15 576 kg (2018: 12 678 kg) of electronic equipment was recycled.
Carbon footprintMethodologyWe use the following: • GHG protocol – Corporate Accounting and Reporting
Standard (revised edition)• Emission conversion factors as published by the
Department for Environment, Food and Rural Affairs (DEFRA)
• An operational control approach• The 2012 financial year as base year – the 2012 base
year emissions were restated to take into consideration the change in the DEFRA emissions factors, as amended during 2016.
Assumptions• The calculation of our carbon footprint is limited to
Capitec Bank. All other group entities are considered immaterial.
• Employee commute is excluded due to insufficient data.• Estimated electricity usage based on calculated averages
was used for the baseline footprint. Consumption for 2019 was based on accurate records. Some instances required the use of averages due to certain electricity usage data not being available. Such instances were, however, limited and had an immaterial impact.
Target• To reduce, or at least maintain, the GHG protocol scope 1
and 2 emissions per full-time employee.
Integrated Annual Report 2019 | 139
the environment
Risk management report
Remuneration report
Social responsibility
About this report
Appendices Annual financial statements

Carbon footprint (tCO2e)GHG protocol scope 2019 2012 baseline
Scope 1: Direct emissions from 485 146
Fuel used in directly controlled or owned equipment 36 1
Fuel used in directly owned or controlled vehicles 35 82
Air-conditioning and refrigeration gas refills 414 63
Scope 2: Indirect emissions from purchased electricity 30 193 22 971
Purchased electricity – Eskom 30 193 22 971
Total scope 1 and 2 30 678 23 117
Scope 3: Indirect emissions from: 8 806 5 115
Business travel – rental vehicles 46 46
Business travel – commercial airlines 1 686 1 711
Business travel – employee-owned vehicles 2 663 2 012
Product distribution – cash in transit 3 306 944
Paper usage 1 105 402
Total scope 1, 2 and 3 39 484 28 232
Intensity footprint (tCO2e)2019 2012 baseline
GHG protocol scopePer full-time
employeePer m²
floor spacePer full-time
employee
Per m²
floor space
Scope 1 emissions 0.04 0.00 0.02 0.00
Scope 2 emissions 2.19 0.12 3.19 0.15
Total 2.23 0.12 3.21 0.15
The carbon footprint is not subject to independent assurance.
Although there was a 40% increase in the overall footprint between the baseline and the current year emissions, there was a 31% (for scope 1 and 2 emissions) reduction in the footprint measured according to the intensity footprint per full-time employee. Our target is to reduce or remain constant with our baseline year emissions measured according to the full-time employee equivalent.
140 | Capitec Bank Holdings Limited
Key performance indicators
Leadership reviews
The Capitec Way
Our business context
Our strategic goals and insights
Leadership teams and governance oversight

We believe that our integrated annual report should reflect our core fundamentals in the way we report. We invite you to let us know whether we have achieved this for our financial year ended 28 February 2019.
Scope and boundary of our reportThis report provides information on the governance, performance and prospects of Capitec Bank Holdings Limited and its subsidiaries (Capitec or the group). Non-financial information relates to our strategy, opportunities, risk, people and governance. Capitec is a bank-controlling company and is listed on the Johannesburg Stock Exchange (JSE) equity market. Capitec Bank Limited (Capitec Bank), a wholly owned subsidiary, houses all material operations and has bonds listed on the interest rate market of the JSE. It contributed 97% of the group’s profit for the financial year. There has been no material change to the products and services Capitec Bank offers since the publication of the previous integrated annual report. The remaining subsidiaries are listed on page 78 under our group structure.
We base the information in this report on local and international requirements and frameworks, including:• International Financial Reporting Standards (IFRS);• The Companies Act, Act 71 of 2008, as amended;• The JSE Listings Requirements; and• King IV™.
The group complies with the principles of corporate governance as set out in King IV™. Stakeholders are referred to the website (www.capitecbank.co.za/investor-relations) where full details regarding the application of the principles set by King IV™ are provided.
Combined assuranceThe audit committee and the RCMC are responsible for overseeing our combined assurance model and objectives, which include:• enabling an effective internal control environment;• supporting the integrity of information used for internal
decision-making by management, the board and its committees; and
• supporting the integrity of external reports.
Capitec’s internal assurance providers, namely risk management, compliance and internal audit, collaborate on combined assurance initiatives to support the board, and to effectively cover the group’s significant risks and material matters. Assurance regarding the annual financial statements in this report is provided in the independent auditor’s report (page 150). Where considered appropriate, external sources have been used to provide independent information for elements of the integrated annual report other than the financial statements. Sections of the risk management report that form part of the audited annual financial statements have been highlighted accordingly.
Reporting suiteThis report is our primary communication about our performance for the 2019 financial year and contains the full annual financial statements. Further reporting elements include our results presentation, SENS announcements and our website: www.capitecbank.co.za. Capitec Bank issues a separate financial report, available in the investor centre under investor relations on the website.
Reporting approach and feedbackWe purposely avoided lengthy standard disclosures to ensure that this report remains relevant to Capitec and its stakeholders. We provide simple, transparent feedback about our performance, governance and prospects. This ensures that shareholders and other stakeholders can formulate a view on the group’s long-term sustainability. In compiling this report, we considered all the reports submitted to the board and EXCO for discussion, any stakeholder feedback, key risk factors and strategic objectives. We appreciate feedback that helps us improve our reporting transparency, quality and comparability. Please send any comments to the company secretary at [email protected].
Integrated Annual Report 2019 | 141
about this report
Risk management report
Remuneration report
Social responsibility
About this report
Appendices Annual financial statements

Capitec Bank contributes value to the local economy and creates wealth for its stakeholders as reflected below:
R’000 2019 2018
Direct economic value generated
Interest income 15 501 072 15 474 457
Loan fee income 931 470 919 328
Net insurance income 794 977 873 524
Transaction fee income 8 473 959 6 925 526
Funeral income 53 456 –
Other income 2 973 (994)
Net impairment charge on loans and advances to clients (4 450 245) (5 279 990)
Share of net profit of associates 1 965 2 535
Total direct economic value generated 21 309 627 18 914 386
Economic value distributed
To suppliers in payment of operating expenses 4 497 177 4 391 014
To employees 3 750 303 3 189 895
Ordinary dividends 1 821 125 1 531 483
Preference dividends 8 785 12 023
Interest paid to providers of wholesale funding 601 517 745 293
Interest paid to savings clients 3 908 032 3 439 156
To providers of funds 6 339 459 5 727 955
Normal tax 2 152 404 1 639 385
Value added tax 717 713 358 991
Unemployment insurance 21 568 19 900
Skills development levies 29 757 29 682
Property rates and taxes 16 325 14 470
To the public purse 2 937 767 2 062 428
To the community 56 946 10 585
Total economic value distributed 17 581 652 15 381 877
Economic value retained for expansion and growth
Retained income 3 465 501 2 927 211
Depreciation and amortisation 633 459 560 150
Deferred tax (370 985) 45 149
Total economic value retained for expansion and growth 3 727 975 3 532 510
Year ended 28 February 2019
142 | Capitec Bank Holdings Limited
statement of economic value added
Key performance indicators
Leadership reviews
The Capitec Way
Our business context
Our strategic goals and insights
Leadership teams and governance oversight

Integrated Annual Report 2019 | 143
glossaryAcronym Description
AGM Annual general meeting
AIRB Advanced internal ratings-based
ALCO Asset and liability committee
ALM Asset and liability management
ALSI JSE All Share Index
AMPS All Media and Products Survey
AT1 Additional tier 1
ATM Automated Teller Machine
BANKSETA Banking Sector Education and Training Authority
BASA Banking Association of South Africa
Basel Basel Committee on Banking Supervision
B-BBEE Broad-based Black Economic Empowerment
C.Connect Electronic Communications
C.Net Web-based employee portal
Capitec Bank pillars
Simplicity, Affordability, Accessibility and Personalised
experience
Capitec Bank Capitec Bank Limited
Capitec Capitec Bank Holdings Limited
CC Credit committee
CCS Centralised collection services
CET1 Common equity tier 1
CICAAP Capitec internal capital adequacy assessment process
CMT Continuity management team
CPA Credit Providers Association
CPI Consumer price index
CSI Corporate Social Investment
DEFRA UK Department for Environment, Food and Rural Affairs
DIS Deposit insurance scheme
DMTN Domestic Medium Term Note Programme
DNR Dual note recycler
DPS Dividends per share
DR Disaster recovery
D-SIB Domestically systemically important bank
ECC Executive credit committee
ECL Expected credit loss
EDC External debt collector
EDF Enterprise development fund
EE Employment equity
EEA2 Employment Equity Act form 2
EME Exempt micro-enterprise
EPS Earnings per share
EVP Employee value proposition
EXCO Executive management committee
FICA Financial Intelligence Centre Act, Act 38 of 2001
Acronym Description
FRN Floating rate note
FSC Forest Stewardship Council
GDP Gross domestic product
GHG Greenhouse gas
GRI Global Reporting Initiative
HEPS Headline Earnings per Share
IA Internal Audit
IAR Integrated annual report
ICAAP Internal capital adequacy assessment process
ICR Individual capital requirement
IFRIC International Financial Reporting Standards
Interpretations Committee
IFRS International Financial Reporting Standards
IIRC International Integrated Reporting Council
IIRF International Integrated Reporting Framework
IoDSA Institute of Directors in Southern Africa
IRM Integrated risk management
ISMS Information security management system
IT Information Technology
JIBAR Johannesburg Interbank Agreed Rate
JSE Johannesburg Stock Exchange
King IV™ King IV Report on Corporate Governance™ for
South Africa, 2016
LCR Liquidity coverage ratio
LDT Last day of trade
LRP Liquidity recovery plan
LSM Living standards measure
LTI Long-term incentive
Moody’s Moody’s Investors Services Inc.
NAEDO Non-authenticated early debit order
NCA National Credit Act, Act 34 of 2005
NCD Negotiable Certificate of Deposit
NCR National Credit Regulator
NSFR Net stable funding ratio
OCR Optical character recognition
PASA Payments Association of South Africa
PD Probability of default
POCA Prevention of Organised Crime Act, Act 121 of 1998
Polproc Policies and procedures department
POS Point-of-Sale Merchant
Primary banking client
When we refer to primary banking clients, we mean
clients who make regular deposits, mainly salaries
PwC PricewaterhouseCoopers Inc.
QSE Qualifying small enterprise
Risk management report
Remuneration report
Social responsibility
About this report
Appendices Annual financial statements

144 | Capitec Bank Holdings Limited
Acronym Description
Quality client Quality banking clients are those clients who have
stable inflows into their account and stable product
usage over a consecutive 3-month period.
RBA Risk-based assessment
RCDR Retail call deposit limit ratio
RCMC Risk and capital management committee
REMCO Human resources and remuneration committee
Remote banking
Remote banking refers to both banking app and USSD
transactions
RISCO Risk committee
ROE Return on equity
SAMOS South African Multiple Options Settlement
SAR Share appreciation rights
SARA South African Reward Association
SARB South African Reserve Bank
Acronym Description
SARs Share Appreciation Rights
SARS South African Revenue Services
SST Self service terminals
Stats SA Statistics South Africa
STI Short-term incentive
T2 Tier 2
TGP Total guaranteed pay
the group Capitec Bank Holdings Limited and subsidiaries
TMPS Total measured procurement spend
TR Total remuneration
USSD Unstructured Supplementary Service Data
VAT Value added tax
VWAP Volume weighted average price
WACC Weighted average cost of capital
Key performance indicators
Leadership reviews
The Capitec Way
Our business context
Our strategic goals and insights
Leadership teams and governance oversight

“There is no reason for me to think of another bank other than @CapitecBankSA, you have been there for me whenever I needed help. Best interest rates and your staff is excellent.” Capitec client
Integrated Annual Report 2019 | 145
Risk management report
Remuneration report
Social responsibility
About this report
Appendices Annual financial statements

146 | Capitec Bank Holdings Limited
The preparation of the audited Capitec Bank Holdings Limited consolidated and separate financial statements was supervised by the chief financial officer, André du Plessis, CA(SA)
Capitec Bank Holdings Limited consolidated and separate financial statements
Statement of responsibility by the board of directors 147
Certificate by the company secretary 147
Audit committee report 148
Directors’ report 149
Independent auditor’s report 150
Statements of financial position 155
Income statements 156
Statements of other comprehensive income 157
Statements of changes in equity 158
Statements of cash flows 160
Notes to the annual financial statements 161

Integrated Annual Report 2019 | 147
Risk management report
Remuneration report
Social responsibility
About this report
Appendices Annual financial statements
Statement of responsibility by the board of directorsCapitec Bank Holdings Limited and its subsidiaries (‘the group’)
The directors are responsible for the preparation, integrity and fair presentation of the consolidated and separate annual financial statements of Capitec Bank Holdings Limited. The annual financial statements, comprising the statements of financial position at 28 February 2019, income statements, statements of comprehensive income, statements of changes in equity, statements of cash flows for the year then ended and the notes to the financial statements which include a summary of significant accounting policies and other explanatory notes, have been prepared in accordance with International Financial Reporting Standards (IFRS) and the Companies Act of South Africa, Act 71 of 2008, as amended (Companies Act) and include amounts based on judgements and estimates made by management. In addition, the directors are responsible for preparing the directors’ report.
The directors consider that the most appropriate accounting policies, consistently applied and supported by reasonable and prudent judgements and estimates have been used in the preparation of the annual financial statements and that all statements of IFRS that are considered applicable have been applied. The directors are satisfied that the information contained in the annual financial statements fairly presents the results of operations for the year and the financial position of the group and company at year-end. The directors also prepared the directors’ report and the other information included in the integrated annual report and are responsible for both its accuracy and consistency with the annual financial statements.
The directors’ responsibility includes maintaining adequate accounting records. The accounting records should disclose, with reasonable accuracy, the financial position of the companies to enable the directors to ensure that the financial statements comply with relevant legislation.
Capitec Bank Holdings Limited operates in a well-established control environment, which is documented and regularly reviewed. The control environment incorporates risk management and internal control procedures, which are designed to provide reasonable, but not absolute, assurance that assets are safeguarded and that the risks facing the business are controlled.
The consolidated annual financial statements were prepared on a going concern basis. Based on their assessment the directors have no reason to believe that the group or any
company in the group will not continue as a going concern in the foreseeable future. The viability of the group is supported by the consolidated annual financial statements.
The group adhered to the Code of Corporate Practices and Conduct (Code).
The group’s external auditor, PricewaterhouseCoopers Incorporated, audited the financial statements and their report is presented on pages 150 to 154.
The annual financial statements set out on pages 155 to 241 were approved by the board of directors and signed on its behalf on 27 March 2019 by:
Riaan Stassen Gerrie FourieChairman Chief executive officer
Certificate by the company secretary
I hereby confirm, in my capacity as company secretary of Capitec Bank Holdings Limited, that for the year ended 28 February 2019, the company has filed all required returns and notices in terms of the Companies Act, and that all such returns and notices are to the best of my knowledge and belief true, correct and up to date.
Yolande Mouton
Stellenbosch27 March 2019

148 | Capitec Bank Holdings Limited
Key performance indicators
Leadership reviews
The Capitec Way
Our business context
Our strategic goals and insights
Leadership teams and governance oversight
Audit committee reportCapitec Bank Holdings Limited and its subsidiaries (the group)
The Capitec Bank Holdings group audit committee (the committee) is an independent statutory committee appointed by the board of directors in terms of section 64 of the Banks Act (Act 94 of 1990) (Banks Act) and section 94 of the Companies Act (Act 71 of 2008) (Companies Act) to the extent applicable.
The committee is comprised of 3 independent non-executive directors. The committee met 3 times during the year with 100% attendance by members at the meetings.
The committee’s responsibilities include statutory duties in terms of the Companies Act, as well as responsibilities assigned to it by the group’s board of directors. The committee’s terms of reference are set out in a board-approved charter and are detailed in the corporate governance review.
The committee conducted its affairs in compliance with, and discharged its responsibilities in terms of, its charter for the year ended 28 February 2019.
The committee performed the following statutory duties during the period under review:
• Satisfied itself that the external auditor is independent of the company, as set out in section 94(8) of the Companies Act, and suitable for reappointment by considering, inter alia, the information stated in paragraph 22.15(h) of the JSE Listings Requirements
• Ensured that the appointment of the auditor complied with the Companies Act, and any other legislation relating to the appointment of an auditor
• In consultation with executive management, agreed to the engagement letter, terms, audit plan and budgeted fees for the 2019 financial year
• Approved the nature and extent of non-audit services that the external auditor may provide
• Nominated for election at the annual general meeting, PricewaterhouseCoopers Inc. as the external audit firm
• Satisfied itself, based on the information and explanations supplied by management and obtained through discussions with the independent external auditor and internal auditors, that the system of internal financial controls is effective and forms a basis for the preparation of reliable financial statements
• Reviewed the accounting policies and the group financial statements for the year ended 28 February 2019 and, based on the information provided to the committee, considers that the group complies, in all material respects, with the requirements of the Companies Act, the Code and IFRS
• Undertook the prescribed functions in terms of section 94(7) of the Companies Act, on behalf of the subsidiary companies of the group
The committee performed the following duties assigned by the board during the period under review:
• Considered the sustainability report forming part of the integrated annual report and satisfied itself that the information is reliable and consistent with the financial results. The committee, at its meeting held on 27 March 2019, recommended the integrated annual report for approval by the board of directors
• Ensured that the group’s internal audit function is independent and has the necessary resources and authority to enable it to discharge its duties
• The committee approved the internal audit charter and the annual audit plan
• The committee met with the external auditor and with the head of the internal audit function without management being present
• The committee satisfied itself in terms of the JSE Listings Requirements 3.84(g)(i) that the group financial director has appropriate expertise and experience
Jean Pierre VersterChairman
27 March 2019

Integrated Annual Report 2019 | 149
Risk management report
Remuneration report
Social responsibility
About this report
Appendices Annual financial statements
Directors’ reportYear ended 28 February 2019
The directors present their report to shareholders for the year ended 28 February 2019.
Nature of the business
Capitec Bank Holdings Limited (‘Capitec’ or ‘the company’) was incorporated in South Africa on 23 November 1999 and registered as a bank controlling company, as envisaged by the Banks Act, on 29 June 2001. Capitec was listed in the Banks sector of the JSE Limited on 18 February 2002.
The company holds 100% of its principal subsidiary, Capitec Bank Limited (‘Capitec Bank’). Capitec Bank is a leading South African retail bank which focuses on essential banking services and provides innovative savings, transacting and unsecured lending products to individuals.
Review of operations
The operating results and the state of affairs of the company and the group are fully disclosed in the annual financial statements and commentary is provided in the chief financial officer’s report, which is included in the integrated annual report.
Share capital
No ordinary shares were issued during the year ended 28 February 2019. The number of shares in issue amounted to 115 626 991 (February 2018: 115 626 991).
No ordinary shares were repurchased during the year and 345 658 (February 2018: 423 137) preference shares were repurchased.
Dividends to shareholders
The company declared the following dividends for the year under review and the previous year:
2019 2018
Ordinary dividend (cents per share)
Interim 630 525
Final 1 120 945
Preference dividend (cents per share)
Interim 421.67 438.68
Final 418.82 423.56
The final ordinary dividend for 2019 was approved by the directors on Wednesday, 27 March 2019. In terms of the requirements of IFRS no accrual was made for this dividend.
The board performed a solvency and liquidity test in accordance with section 4 of the Companies Act (Act 71 of 2008) when dividends were declared.
Subsidiaries and associates
Information relating to the company’s financial interest in its subsidiaries is presented in the notes to the annual financial statements.
Directors and company secretary
Information relating to the directors and company secretary are included from page 74 to page 77 of the integrated annual report.
DP Meintjes was appointed to the board on 28 November 2018. The directors’ interest in share capital and contracts, and directors’ remuneration are disclosed in the notes to the annual financial statements.

150 | Capitec Bank Holdings Limited
Key performance indicators
Leadership reviews
The Capitec Way
Our business context
Our strategic goals and insights
Leadership teams and governance oversight
Report on the audit of the consolidated and separate financial statements
Our opinion
In our opinion, the consolidated and separate financial statements present fairly, in all material respects, the consolidated and separate financial position of Capitec Bank Holdings Limited (the Company) and its subsidiaries (together the Group) as at 28 February 2019, and its consolidated and separate financial performance and its consolidated and separate cash flows for the year then ended in accordance with International Financial Reporting Standards and the requirements of the Companies Act of South Africa.
What we have audited
Capitec Bank Holdings Limited’s consolidated and separate financial statements set out on pages 155 to 241 comprise:
• the consolidated and separate statements of financial position as at 28 February 2019;
• the consolidated and separate income statements for the year then ended;
• the consolidated and separate statements of other comprehensive income for the year then ended;
• the consolidated and separate statements of changes in equity for the year then ended;
• the consolidated and separate statements of cash flows for the year then ended; and
• the notes to the financial statements, which include a summary of significant accounting policies.
Certain required disclosures have been presented elsewhere in the Capitec Bank Holdings Limited Integrated Annual Report 2019, rather than in the notes to the financial statements. These are cross-referenced from the financial statements and are identified as audited.
Basis for opinion
We conducted our audit in accordance with International Standards on Auditing (ISAs). Our responsibilities under those standards are further described in the Auditor’s responsibilities for the audit of the consolidated and separate financial statements section of our report.
We believe that the audit evidence we have obtained is sufficient and appropriate to provide a basis for our opinion.
Independence
We are independent of the Group in accordance with the Independent Regulatory Board for Auditors Code of Professional Conduct for Registered Auditors (IRBA Code) and other independence requirements applicable to performing audits of financial statements in South Africa. We have fulfilled our other ethical responsibilities in accordance with the IRBA Code and in accordance with other ethical requirements applicable to performing audits in South Africa. The IRBA Code is consistent with the International Ethics Standards Board for Accountants Code of Ethics for Professional Accountants (Parts A and B).
Our audit approach
Overview
Overall group materiality• Overall group materiality: R353.8 million, which represents 5% of consolidated profit before tax.
Group audit scope• The group audit scope included the audit of Capitec Bank Holdings Limited and its consolidated entities, the only significant entity being
Capitec Bank Limited.
Key audit mattersKey audit matter that relates to the audit of the consolidated financial statements:
• Expected credit losses (ECL) on loans and advances
Independent auditor’s reportTo the Shareholders of Capitec Bank Holdings Limited

Integrated Annual Report 2019 | 151
Risk management report
Remuneration report
Social responsibility
About this report
Appendices Annual financial statements
As part of designing our audit, we determined materiality and assessed the risks of material misstatement in the consolidated and separate financial statements. In particular, we considered where the directors made subjective judgements; for example, in respect of significant accounting estimates that involved making assumptions and considering future events that are inherently uncertain. As in all of our audits, we also addressed the risk of management override of internal controls, including among other matters, consideration of whether there was evidence of bias that represented a risk of material misstatement due to fraud.
Materiality
The scope of our audit was influenced by our application of materiality. An audit is designed to obtain reasonable assurance whether the financial statements are free from material misstatement. Misstatements may arise due to fraud or error. They are considered material if individually or in aggregate, they could reasonably be expected to influence the economic decisions of users taken on the basis of the consolidated financial statements.
Based on our professional judgement, we determined certain quantitative thresholds for materiality, including the overall group materiality for the consolidated financial statements as a whole as set out in the table below. These, together with qualitative considerations, helped us to determine the scope of our audit and the nature, timing and extent of our audit procedures and to evaluate the effect of misstatements, both individually and in aggregate on the financial statements as a whole.
Overall group materiality R353.8 million
How we determined it 5% of consolidated profit before tax
Rationale for the materiality benchmark applied
We chose profit before tax as the benchmark because, in our view, it is the benchmark against which the performance of the Group is most commonly measured by users, and is a generally accepted benchmark. We chose 5% which is consistent with quantitative materiality thresholds used for profit-oriented companies in this sector.
How we tailored our group audit scope
We tailored the scope of our audit in order to perform sufficient work to enable us to provide an opinion on the consolidated financial statements as a whole, taking into account the structure of the Group, the accounting processes and controls, and the industry in which the Group operates.
Capitec Bank Limited is the only component scoped in for group reporting due to its financially significant contribution to profit before tax and total assets of the Group. Capitec Bank Limited operates in South Africa. The investments in Cream Finance Holding Limited, an associate which is registered in Cyprus, and Praelexis Proprietary Limited, an associate registered in South Africa, were excluded from our audit scope as they are considered financially insignificant to the group. We performed analytical review procedures over these insignificant entities at a group level.
In establishing the overall approach to the group audit, we determined the type of work that needed to be performed by us, as the group engagement team, in order to issue our audit opinion on the consolidated financial statements of the Group. The group engagement team is the statutory auditor of all the entities within the Group, with the exception of the investment in associates.
Key audit matters
Key audit matters are those matters that, in our professional judgment, were of most significance in our audit of the consolidated and separate financial statements of the current period. These matters were addressed in the context of our audit of the consolidated and separate financial statements as a whole, and in forming our opinion thereon, and we do not provide a separate opinion on these matters.
We communicate the key audit matter that relates to the audit of the consolidated financial statements of the current period in the table below. We have determined that there are no key audit matters to communicate in our report with regard to the audit of the separate financial statements of the Company of the current period.

152 | Capitec Bank Holdings Limited
Key performance indicators
Leadership reviews
The Capitec Way
Our business context
Our strategic goals and insights
Leadership teams and governance oversight
Key audit matter How our audit addressed the key audit matter
Expected credit losses (ECL) on loans and advances
Refer to note 3 (Critical accounting estimates and judgements in applying accounting policies – expected credit loss on loans and advances), note 7 (Net loans and advances), note 2.5 (Accounting policy – Impairment – amortised cost), note 2.19.1 (Accounting policy – IFRS 9 Financial Instruments), note 29.1 (Credit risk), note 29.2 (Impairment – Measurement of the expected credit loss (ECL)), for the related disclosures.
At 28 February 2019, gross unsecured loans and advances amounted to R54.9 billion against which an ECL of R10.4 billion was raised.
The ECL was calculated by applying International Financial Reporting Standard (IFRS) 9 Financial Instruments (IFRS 9), as described in the notes to the financial statements, which was adopted for the first time on 1 March 2018.
In calculating the ECL, the key areas of significant management judgement and estimation included:• Determining whether evidence exists that there has been a significant
increase in credit risk (SICR) since initial recognition of the financial instrument, by considering shifts in calculated behavioural and granting scores, beyond determined thresholds.
• Determination of the write-off point. The Group considers the point at which there is no reasonable expectation of further recovery to be made when the expected present value of projected future recoveries is less than 5% of the gross balance before write-off. This point is estimated based on account status, behavioural score and consecutive missed payments.
• Determining and weighting of assumptions used in the forward-looking economic model. Three forward-looking scenarios are probability weighted by management to determine the ECL (positive, negative and a baseline scenario). The group utilises the 3 year macro-economic outlook of the Bureau of Economic Research to project future changes in unemployment and the real wage rate. These scenarios are then linked to Probability of Defaults (PDs) and Loss Given Defaults (LGDs) to derive a forward looking ECL.
• Determining event driven management ECL overlays. Management increase the results produced by the modelled output for events that influence the modelled output, which are not yet captured by the model.
• Calibrating of the ECL statistical model components (Probability of Default “PD”, Exposure at Default “EAD”, Loss Given default “LGD”) used to estimate the timing and amount of the forecasted cash flows based on historical default data, roll rates and recoveries. The group stratifies aspects such as client risk groups, time on book, product term, payment frequency, default statuses, employment, industry and rescheduling status and the behaviour score of the client. Management judgement is required to consider how historical data is used to project ECL.
We determined the ECL on loans and advances to be a matter of most significance to our current year audit due to the following:• the first time adoption of IFRS 9 by the Group;• the magnitude of the ECL;• the degree of judgement and estimation applied by management in
determining the ECL.
Our audit procedures addressed the key areas of significant judgement and estimation in determining the ECL on loans and advances as follows:
Evaluation of SICR• We recalculated the impact of SICR, applying the assumptions and
data included in management’s model, including the performance of rehabilitated accounts.
• We tested the performance of SICR thresholds applied and the resultant transfer rate into stage 2 for SICR. This included benchmarking of the volume of up to date accounts transferred to stage 2 based on history.
• We performed a sensitivity analysis of SICR to determine the impact of change in SICR thresholds on the ECL recognised.
• We evaluated management’s supporting documentation for the performance of behavioural scores, granting scores and the correlation of these to default rates.
• We obtained an understanding of management’s process for identifying employer groups under stress and found these employer groups to have been considered in management’s calculation of the granting scores.
Determination of write-off point• For the term lending portfolio, we evaluated management’s
assessment of historical post write-off recoveries, to determine the point at which there was no reasonable expectation of further recovery.
• Through recalculation, we tested the application of the IFRS 9 write-off policy, including the exclusion of post write-off recoveries from the Loss Given Default (LGD).
Inclusion of forward looking information and macro-economic variables in the ECL • We considered the assumptions used in the forward looking economic
model, specifically around the forward-looking scenarios used, the macro-economic variables considered as well as the macro-economic outlook. We compared these to our own actuarial statistics and independent market data.
• We tested the performance and sensitivity of the forward looking model in order to evaluate whether the chosen macro-economic factors and model fit provide a reasonable representation of the impact of macro-economic changes on the ECL results.
Event driven management overlays in the ECL• We assessed the reasonableness of event driven overlays raised by
management, based on our understanding of the industry, emerging risks and regulatory changes. Based on our reperformance of the ECL model, we considered effects already taken into account by the ECL model to determine whether the impact of the overlay was not double counted.
• We evaluated whether these overlays were subject to an appropriate governance process.
Calibrating of ECL statistical model components (PD, EAD, LGD)• We obtained an understanding of the methodologies and assumptions
used by management in the various ECL model components and how these were calibrated to use historical information to estimate future cash flows.
• In gaining this understanding, we re-performed the ECL model.
We found the accounting policies and the credit impairment methodologies applied by management to loans and advances to be in accordance with IFRS 9 – Financial Instruments.

Integrated Annual Report 2019 | 153
Risk management report
Remuneration report
Social responsibility
About this report
Appendices Annual financial statements
Other information
The directors are responsible for the other information. The other information comprises the information included in the Capitec Bank Holdings Limited Integrated Annual Report 2019, which includes the Directors’ Report, the Audit Committee Report and the Certificate by the Company Secretary as required by the Companies Act of South Africa. Other information does not include the consolidated and separate financial statements and our auditor’s report thereon.
Our opinion on the consolidated and separate financial statements does not cover the other information and we do not express an audit opinion or any form of assurance conclusion thereon.
In connection with our audit of the consolidated and separate financial statements, our responsibility is to read the other information identified above and, in doing so, consider whether the other information is materially inconsistent with the consolidated and separate financial statements or our knowledge obtained in the audit, or otherwise appears to be materially misstated.
If, based on the work we have performed, we conclude that there is a material misstatement of this other information, we are required to report that fact. We have nothing to report in this regard.
Responsibilities of the directors for the consolidated and separate financial statements
The directors are responsible for the preparation and fair presentation of the consolidated and separate financial statements in accordance with International Financial Reporting Standards and the requirements of the Companies Act of South Africa, and for such internal control as the directors determine is necessary to enable the preparation of consolidated and separate financial statements that are free from material misstatement, whether due to fraud or error.
In preparing the consolidated and separate financial statements, the directors are responsible for assessing the Group and the Company’s ability to continue as a going concern, disclosing, as applicable, matters related to going concern and using the going concern basis of accounting unless the directors either intend to liquidate the Group and/or the Company or to cease operations, or have no realistic alternative but to do so.
Auditor’s responsibilities for the audit of the consolidated and separate financial statements
Our objectives are to obtain reasonable assurance about whether the consolidated and separate financial statements as a whole are free from material misstatement, whether due to fraud or error, and to issue an auditor’s report that includes our opinion. Reasonable assurance is a high level of assurance, but is not a guarantee that an audit conducted in accordance with ISAs will always detect a material misstatement when it exists. Misstatements can arise from fraud or error and are considered material if, individually or in the aggregate, they could reasonably be expected to influence the economic decisions of users taken on the basis of these consolidated and separate financial statements.
As part of an audit in accordance with ISAs, we exercise professional judgement and maintain professional scepticism throughout the audit. We also:
• Identify and assess the risks of material misstatement of the consolidated and separate financial statements, whether due to fraud or error, design and perform audit procedures responsive to those risks, and obtain audit evidence that is sufficient and appropriate to provide a basis for our opinion. The risk of not detecting a material misstatement resulting from fraud is higher than for one resulting from error, as fraud may involve collusion, forgery, intentional omissions, misrepresentations, or the override of internal control.
• Obtain an understanding of internal control relevant to the audit in order to design audit procedures that are appropriate in the circumstances, but not for the purpose of expressing an opinion on the effectiveness of the Group’s and the Company’s internal control.
• Evaluate the appropriateness of accounting policies used and the reasonableness of accounting estimates and related disclosures made by the directors.

154 | Capitec Bank Holdings Limited
Key performance indicators
Leadership reviews
The Capitec Way
Our business context
Our strategic goals and insights
Leadership teams and governance oversight
• Conclude on the appropriateness of the directors’ use of the going concern basis of accounting and, based on the audit evidence obtained, whether a material uncertainty exists related to events or conditions that may cast significant doubt on the Group’s and the Company’s ability to continue as a going concern. If we conclude that a material uncertainty exists, we are required to draw attention in our auditor’s report to the related disclosures in the consolidated and separate financial statements or, if such disclosures are inadequate, to modify our opinion. Our conclusions are based on the audit evidence obtained up to the date of our auditor’s report. However, future events or conditions may cause the Group and/or Company to cease to continue as a going concern.
• Evaluate the overall presentation, structure and content of the consolidated and separate financial statements, including the disclosures, and whether the consolidated and separate financial statements represent the underlying transactions and events in a manner that achieves fair presentation.
• Obtain sufficient appropriate audit evidence regarding the financial information of the entities or business activities within the group to express an opinion on the consolidated financial statements. We are responsible for the direction, supervision and performance of the group audit. We remain solely responsible for our audit opinion.
We communicate with the directors regarding, among other matters, the planned scope and timing of the audit and significant audit findings, including any significant deficiencies in internal control that we identify during our audit.
We also provide the directors with a statement that we have complied with relevant ethical requirements regarding independence, and to communicate with them all relationships and other matters that may reasonably be thought to bear on our independence, and where applicable, related safeguards.
From the matters communicated with the directors, we determine those matters that were of most significance in the audit of the consolidated and separate financial statements of the current period and are therefore the key audit matters. We describe these matters in our auditor’s report unless law or regulation precludes public disclosure about the matter or when, in extremely rare circumstances, we determine that a matter should not be communicated in our report because the adverse consequences of doing so would reasonably be expected to outweigh the public interest benefits of such communication.
Report on other legal and regulatory requirements
In terms of the IRBA Rule published in Government Gazette Number 39475 dated 4 December 2015, we report that PricewaterhouseCoopers Inc. has been the auditor of Capitec Bank Holdings Limited for 18 years.
PricewaterhouseCoopers Inc. Director: Michael MeyerRegistered Auditor
Johannesburg 27 March 2019

Integrated Annual Report 2019 | 155
Risk management report
Remuneration report
Social responsibility
About this report
Appendices Annual financial statements
Statements of financial positionAs at 28 February 2019
GROUP COMPANY
R’000 Notes 2019 2018 2019 2018
Assets
Cash, cash equivalents and money market funds 4 29 144 530 25 090 728 12 220 2 793
Financial investments (Held-to-maturity investments)* 5 10 732 394 11 780 934 – –
Term deposit investments 6 9 331 297 2 528 331 – –
Net loans and advances 7 44 514 684 41 814 395 – –
Other receivables 8 1 642 526 721 827 3 909 5 652
Net insurance receivable 9 236 391 245 204 – –
Derivative assets 10 479 129 – –
Financial assets – equity instruments at FVOCI (Available-for-sale financial assets)* 11 100 000 100 000 – –
Current income tax asset 286 046 107 154 – –
Interest in associates 12 317 193 134 352 308 073 128 658
Interest in subsidiaries 12 – – 5 735 031 5 751 481
Property and equipment 13 2 209 847 1 754 342 – –
Intangible assets 14 316 283 283 011 – –
Deferred income tax asset 15 1 596 079 396 827 – –
Total assets 100 427 749 84 957 234 6 059 233 5 888 584
Liabilities
Derivative liabilities 41, 42 14 704 54 576 – 3 210
Retail deposits 16 71 365 285 57 824 498 – –
Other liabilities 17 2 202 631 1 913 921 7 952 8 928
Wholesale funding 16 5 078 328 6 205 726 – –
Provisions 18 91 005 66 835 – –
Group loans payable 12 – – 13 461 –
Total liabilities 78 751 953 66 065 556 21 413 12 138
Equity
Capital and reserves
Ordinary share capital and premium 19 5 649 020 5 649 020 5 649 020 5 649 020
Cash flow hedge reserve 20 (9 588) (26 737) – –
Foreign currency translation reserve 20 4 619 3 158 – –
Retained earnings 15 950 142 13 153 434 307 197 114 623
Share capital and reserves attributable to ordinary shareholders 21 594 193 18 778 875 5 956 217 5 763 643
Non-redeemable, non-cumulative, non-participating preference share capital and premium 19 81 603 112 803 81 603 112 803
Total equity 21 675 796 18 891 678 6 037 820 5 876 446
Total equity and liabilities 100 427 749 84 957 234 6 059 233 5 888 584
* Denotes classification of financial assets under IAS 39 in the previous reporting period.

156 | Capitec Bank Holdings Limited
Key performance indicators
Leadership reviews
The Capitec Way
Our business context
Our strategic goals and insights
Leadership teams and governance oversight
Income statementsYear ended 28 February 2019
GROUP COMPANY
R’000 Notes 2019 2018 2019 2018
Lending, investment and insurance income 21 17 227 519 17 267 309 225 215
Interest income 21 15 501 072 15 474 457 225 215
Loan fee income 21 931 470 919 328 – –
Net insurance income 9 794 977 873 524 – –
Lending and investment expenses (4 729 317) (4 597 316) – –
Interest expense 21 (4 509 549) (4 184 449) – –
Loan fee expense 21 (219 768) (412 867) – –
Net lending, investment and insurance income 12 498 202 12 669 993 225 215
Transaction fee income 8 473 959 6 925 526 – –
Transaction fee expense (2 009 669) (1 798 483) – –
Net transaction income 6 464 290 5 127 043 – –
Dividend income 22 – – 2 024 341 1 643 831
Credit impairments 23 (4 450 245) (5 279 990) – –
Funeral income 53 456 – – –
Other income/(expense) 2 973 (994) 4 854 4 263
Net income 14 568 676 12 516 052 2 029 420 1 648 309
Operating expenses 24 (7 493 811) (6 363 337) (5 079) (4 478)
Share of net profit of associates 12 1 965 2 536 – –
Operating profit before tax 7 076 830 6 155 251 2 024 341 1 643 831
Income tax expense 25 (1 781 419) (1 684 534) – –
Profit for the year 5 295 411 4 470 717 2 024 341 1 643 831
Earnings per share (cents)
Basic 26 4 571 3 855
Diluted 26 4 562 3 843

Integrated Annual Report 2019 | 157
Risk management report
Remuneration report
Social responsibility
About this report
Appendices Annual financial statements
Statements of other comprehensive incomeYear ended 28 February 2019
GROUP COMPANY
R’000 Notes 2019 2018 2019 2018
Profit for the year 5 295 411 4 470 717 2 024 341 1 643 831
Other comprehensive income that may subsequently be reclassified to profit or loss 17 149 (15 001) – –
Cash flow hedge reserve recognised during the year 20 5 009 59 116 – –
Cash flow hedge reclassified to profit and loss for the year 20 18 809 (79 951) – –
Income tax relating to cash flow hedge 20 (6 669) 5 834 – –
Foreign currency translation reserve recognised during the year 20 1 461 3 158 – –
Total comprehensive income for the year 5 314 021 4 458 874 2 024 341 1 643 831

158 | Capitec Bank Holdings Limited
Key performance indicators
Leadership reviews
The Capitec Way
Our business context
Our strategic goals and insights
Leadership teams and governance oversight
Statements of changes in equityYear ended 28 February 2019
R’000 Notes
Ordinary share capital and premium
Preferenceshare capitaland premium
Foreigncurrency
translationreserve
Cash flowhedge
reserveRetainedearnings Total
GROUP
Balance at 29 February 2017 5 649 020 150 998 – (11 736) 10 329 731 16 118 013
Total comprehensive income for the year – – 3 158 (15 001) 4 470 717 4 458 874
Transactions with shareholders and directly recorded in equity – (38 195) – – (1 647 014) (1 685 209)
Ordinary dividend 28 – – – – (1 531 483) (1 531 483)
Preference dividend 28 – – – – (12 023) (12 023)
Employee share option scheme: value of employee services – – – – 36 709 36 709
Shares acquired for employee share options at cost 35 – – – – (224 918) (224 918)
Proceeds on settlement of employee share options 35 – – – – 73 787 73 787
Tax effect on share options – – – – 11 648 11 648
Preference shares repurchased – (38 195) – – (734) (38 929)
Balance at 28 February 2018 5 649 020 112 803 3 158 (26 737) 13 153 434 18 891 678
Changes on initial application of IFRS 9 2.19 – – – – (648 039) (648 039)
Restated balance at 1 March 2018 5 649 020 112 803 3 158 (26 737) 12 505 395 18 243 639
Total comprehensive income for the year – – 1 461 17 149 5 295 411 5 314 021
Transactions with shareholders and directly recorded in equity – (31 200) – – (1 850 664) (1 881 864)
Ordinary dividend 28 – – – – (1 821 125) (1 821 125)
Preference dividend 28 – – – – (8 785) (8 785)
Employee share option scheme: value of employee services – – – – 31 950 31 950
Shares acquired for employee share options at cost 35 – – – – (215 199) (215 199)
Proceeds on settlement of employee share options 35 – – – – 63 254 63 254
Tax effect on share options – – – – 101 098 101 098
Preference shares repurchased – (31 200) – – (1 857) (33 057)
Balance at 28 February 2019 5 649 020 81 603 4 619 (9 588) 15 950 142 21 675 796
Notes 19 19 20 20

Integrated Annual Report 2019 | 159
Risk management report
Remuneration report
Social responsibility
About this report
Appendices Annual financial statements
R’000
Ordinary share capital and
premium
Preference share capital and premium
Foreigncurrency
translationreserve
Retained earnings Total
COMPANY
Balance at 29 February 2017 5 649 020 150 998 – 15 607 5 815 625
Total comprehensive income for the year – – – 1 643 831 1 643 831
Ordinary dividend – – – (1 532 058) (1 532 058)
Preference dividend – – – (12 023) (12 023)
Preference shares repurchased – (38 195) – (734) (38 929)
Balance at 28 February 2018 5 649 020 112 803 114 623 5 876 446
Restated balance at 1 March 2018 5 649 020 112 803 – 114 623 5 876 446
Total comprehensive income for the year – – – 2 024 341 2 024 341
Ordinary dividend – – – (1 821 125) (1 821 125)
Preference dividend – – – (8 785) (8 785)
Preference shares repurchased – (31 200) – (1 857) (33 057)
Balance at 28 February 2019 5 649 020 81 603 – 307 197 6 037 820
Notes 19 19

160 | Capitec Bank Holdings Limited
Key performance indicators
Leadership reviews
The Capitec Way
Our business context
Our strategic goals and insights
Leadership teams and governance oversight
Statements of cash flowsYear ended 28 February 2019
GROUP COMPANY
R’000 Notes 2019 2018 2019 2018
Cash flow from operating activities
Cash flow from operations 32 16 383 423 13 673 845 2 022 647 1 649 669
Income taxes paid 33 (2 813 119) (1 741 445) – –
13 570 304 11 932 400 2 022 647 1 649 669
Cash flow from investing activities
Acquisition of property and equipment 13 (910 875) (686 499) – –
Disposal of property and equipment 9 151 32 340 – –
Purchase of intangible assets 14 (230 127) (142 943) – –
Loans from group companies – – (1 289) 25 884
Disposal of preference shares in subsidiary – – 31 200 38 195
Investment in term deposit investments 6 (10 557 000) (3 153 000) – –
Redemption of term deposit investments 6 3 947 000 7 159 000 – –
Acquisition of financial investments 5 (12 611 392) (12 904 350) – –
Redemption of financial investments 5 13 655 132 6 650 176 – –
Increase in short-term money market investments (14 745) (13 896) – –
Interest acquired in associates 12 (179 415) (128 658) (179 415) (128 658)
(6 892 271) (3 187 830) (149 504) (64 579)
Cash flow from financing activities
Dividends paid 34 (1 830 659) (1 544 900) (1 830 659) (1 545 475)
Preference shares repurchased 19 (33 057) (38 929) (33 057) (38 929)
Issue of institutional bonds and other funding 16 500 000 500 000 – –
Redemption of institutional bonds and other funding 16 (1 119 000) (1 110 000) – –
Shares acquired for settlement of employee share options 35 (215 199) (151 131) – –
Participants’ contribution on settlement of options 35 63 254 – – –
(2 634 661) (2 344 960) (1 863 716) (1 584 404)
Net increase in cash and cash equivalents 4 043 372 6 399 610 9 427 686
Cash and cash equivalents at the beginning of the year 25 069 977 18 670 367 2 793 2 107
Cash and cash equivalents at the end of the year 4 29 113 349 25 069 977 12 220 2 793

Integrated Annual Report 2019 | 161
Risk management report
Remuneration report
Social responsibility
About this report
Appendices Annual financial statements
Notes to the annual financial statementsYear ended 28 February 2019
1. General information
1.1 Nature of business
The company’s main business is that of a bank controlling company as envisaged in the Banks Act, 1990. The company’s subsidiaries conduct retail banking.
1.2 Review of operations
The operating results and the state of affairs of the company and the group are fully set out in the attached statements of financial position, income statements, statements of other comprehensive income, statements of changes in equity, statements of cash flows and the notes thereto.
The group’s earnings attributable to ordinary and preference shareholders amounted to R5 295.4 million (2018: R4 470.7 million).
1.3 Directors and secretary
Information relating to the directors and company secretary is in chapter 6 of the integrated annual report.
1.4 Group details
The group’s place of domicile and country of incorporation is the Republic of South Africa and it has a primary listing on the JSE.
Registered office: 1 Quantum Street, Techno Park, Stellenbosch, 7600.
2. Accounting policies
The principal accounting policies applied in the preparation of these consolidated and separate financial statements are set out below. These policies have been consistently applied to all the years presented, unless otherwise stated.
2.1 Basis of preparation
The group’s consolidated and company’s separate annual financial statements are prepared in accordance with IFRS as issued by the IASB, its interpretations adopted by the IASB, the South African Institute of Chartered Accountants (SAICA), the SAICA financial Reporting Guidelines as issued by the Accounting Practises Committee and financial announcements as issued by the Financial Reporting Standards Council, the JSE Listing Requirements, and the South African Companies Act.
The consolidated financial statements have been prepared under the historical cost convention, as modified by the revaluation of financial instruments held at fair value through profit or loss as well as instruments carried at FVOCI (available-for-sale securities).
Refer to Note 2.19 for new standards and interpretations not yet adopted.
The preparation of financial statements in conformity with IFRS requires the use of certain critical accounting estimates. It also requires management to exercise its judgement in the process of applying the group’s accounting policies. The areas involving a higher degree of judgement or complexity, or areas where assumptions and estimates are significant to the consolidated financial statements are disclosed in note 3.
The group applied the transitional requirements of IFRS 9 with respect to the classification and measurement of financial assets as well as the measurement of the expected credit loss (ECL) retrospectively at the date of initial application.

162 | Capitec Bank Holdings Limited
Key performance indicators
Leadership reviews
The Capitec Way
Our business context
Our strategic goals and insights
Leadership teams and governance oversight
2. Accounting policies (continued)
2.1 Basis of preparation (continued)
The difference between the carrying amount of financial assets reported in terms of IAS 39 and that as determined with reference to IFRS 9 has been recognised in the group’s opening retained earnings at 1 March 2018. The group has not restated its previous reporting periods, as permitted in IFRS 9.
The group has continued to account for hedges in terms of IAS 39 hedge accounting on adoption of IFRS 9. Consequently the amendments to IFRS 7 disclosures have also been applied to the current period. The comparative period notes disclosures repeat those disclosures made in the prior year.
In the notes to the financial statements, amounts denoted as current are expected to be recovered/settled no more than 12 months after the reporting period. Amounts denoted as non-current are expected to be recovered more than 12 months after the reporting period.
2.2 Basis of consolidation
The consolidated financial statements include those of the company, all its subsidiaries, associates and the share incentive trust.
Subsidiaries are all entities (including structured entities) over which the group has control. The group controls an entity when the group is exposed to, or has rights to, variable returns from its involvement with the entity and has the ability to affect those returns through its power over the entity. Subsidiaries are fully consolidated from the date on which control is transferred to the group. They are deconsolidated from the date that control ceases.
Intercompany transactions, balances and unrealised gains on transactions between group companies are eliminated.
Investments in subsidiaries are accounted for at cost less allowance for impairment. The carrying amounts of these investments are reviewed annually and written down for impairment where considered necessary.
Currently the group does not have non-controlling interests as all subsidiaries are wholly owned.
Associates are all entities over which the group has significant influence but not control, generally accompanying a shareholding of 20% and up to 50% of the voting rights of the associate. Where the group holds less than 20%, other indicators, such as the right to representation on decision-making boards or committees are considered. The group’s investment in associates includes the difference in initial cost versus our share of net assets acquired and any accumulated impairment loss.
Investment in associates is initially recognised at cost and at group level is accounted for according to the equity method. Under the equity method, on initial recognition the investment in associate is recognised at cost, and the carrying amount is increased or decreased to recognise the group’s share of the post-acquisition profits or losses in profit or loss, and the group’s share of movements in other comprehensive income in other comprehensive income. Distributions received from the associate will reduce the carrying amount of the investment.
In the event that the group’s share of losses in an investment in an associate equals or exceeds its interest in the associate, including any other unsecured long-term receivables, the group does not recognise further losses, unless it has incurred obligations or made payments on behalf of the respective associate.
Unrealised gains on transactions between the group and its associates are eliminated to the extent of the group’s interest in these entities. Unrealised losses are also eliminated unless the transaction provides evidence of an impairment.
The group determines at each reporting date whether there is objective evidence if any investment in the respective associates is impaired. If this is the case, the difference between the recoverable amount of the said associate and its carrying value is recognised on the income statement.
Refer to 2.14. – Foreign currency translation of foreign associate.

Integrated Annual Report 2019 | 163
Risk management report
Remuneration report
Social responsibility
About this report
Appendices Annual financial statements
2.3 Cash, cash equivalents and money market funds
Cash, cash equivalents and money market funds comprise balances with less than three months’ maturity from the date of acquisition, including: cash, balances with central banks, resale agreements, treasury bills and other eligible bills, amounts due from banks, non-bank money market investments, fixed and notice deposits with original maturities less than three months and short-term government securities. Cash and cash equivalents are stated at cost which approximates fair value due to the short-term nature of these instruments.
Financial instruments purchased under short-term agreements to resell, at either a fixed price or the purchase price plus a lender’s rate of return, with an original maturity date of less than 3 months, including government bonds, are included under cash and cash equivalents. The difference between the purchase and sales’ price is treated as interest and amortised over the life of the resale agreement using the effective interest rate method.
Mandatory reserve deposits with the SARB must be maintained at the average required by the SARB over a one month period and are non-interest bearing. These deposits may be used to manage significant intra – and inter-day cash outflows but are not considered as available for normal cash planning purposes. A total of 70% of the balance is available without requiring prior regulatory approval.
2.4 Financial instruments
2.4.1 Financial instruments applied from 1 March 2018
The group recognises financial assets on the statement of financial position once it becomes a party to the contractual terms of the particular financial instrument.
At initial recognition, the group measures a financial asset at its fair value plus, in the case of financial assets not at fair value through profit or loss (FVTPL), transaction costs that are directly attributable to the acquisition of the financial asset. Transaction costs of financial assets carried at FVTPL are expensed in the income statement.
Financial assets are derecognised when the rights to receive cash flows from the financial assets have expired or where the group has transferred substantially all risks and rewards of ownership.
IFRS 9 contains a new classification and measurement approach for financial assets. The group classifies its financial assets on the basis of the entity’s business model for managing the financial assets and the contractual cash flow characteristics of the financial asset.
The categories of held to maturity, loans and receivables and available-for-sale financial assets under IAS 39 have been eliminated under IFRS 9.
From 1 March 2018, the group classifies its financial assets into the following categories:
• Measured at amortised cost
• Fair value through other comprehensive income (FVOCI)
• Fair value through profit or loss (FVTPL)
The group assesses its business model by portfolio of financial assets that are managed together and evaluates the following factors:
• How the performance of the portfolio is evaluated and reported to group management;
• How the portfolio managers (if applicable) are compensated, including whether management is compensated based on the fair value of the assets or the contractual cash flow collected;
• The risks that affect the performance of the business model and how those risks are managed; and
• The frequency, volume and timing of sales in prior periods, the reasons for such sales and expectation of future sale activities.
The contractual cash flow characteristics are evaluated based on whether the contractual cash flows consist solely of payments of principal and interest (SPPI). This assessment includes assessing whether the financial asset has a contractual term that would change the timing or amount of contractual cash flows. The group considers whether the contractual cash flows are subject to any contingent events that would change the amount and timing of cash flows, leverage features, prepayment and extension terms and features that would modify the consideration of the time value of money.

164 | Capitec Bank Holdings Limited
Key performance indicators
Leadership reviews
The Capitec Way
Our business context
Our strategic goals and insights
Leadership teams and governance oversight
2. Accounting policies (continued)
2.4 Financial instruments (continued)
2.4.1 Financial instruments applied from 1 March 2018 (continued)
2.4.1.1 Financial assets:
(a) Debt instruments – amortised costThe following items are the significant debt instruments held by the group:
i) loans and advances to clients that are recognised when funds are advanced to the borrowers.
Loan consolidations are treated as a de-recognition of the loans as the contractual cash flows from the financial asset expire.
In instances where the group reschedules a credit agreement, the cash flows are renegotiated with the client, but the effective interest rate remains the same and there are therefore no gains or losses.
When a client goes into debt review, cash flows are renegotiated and in some instances the effective interest rate is affected by the modification of the agreement. Modification gain or loss is disclosed in note 7.
ii) fixed and term notice deposits are non-derivative financial assets with fixed or determinable payments. They arise when the group invests cash with other banks. These instruments comprise fixed deposits with original maturities longer than three months, deposit investments with the contractual option to call the funds after a period longer than three months and deposits that have effective contractual notice periods greater than three months.
These classes of debt instruments are held for the collection of their contractual cash flow and their cash flows represent solely payments of principal and interest and therefore are measured at amortised cost. Interest income from these financial assets is included in interest income on the group’s income statement using the effective interest rate method. Impairment losses are presented as part of net provision for doubtful debts charge on the group’s income statement.
(b) Equity instruments – FVOCIThe following item is the only significant equity instrument of the group:
i) Equity investment in African Bank Holdings Limited
The group has elected at date of initial application of IFRS 9 to irrevocably designate its equity investment at FVOCI. This election results in fair value gains and losses being recognised in other comprehensive income and not subsequently being reclassified to profit or loss, including on disposal. Impairment losses (and reversal of impairment losses) are not reported separately from other changes in fair value. Dividends, when representing a return on such investments, continue to be recognised in the income statement when the group’s right to receive such payments is established. Refer to note 11.
(c) Financial instruments – FVTPLThe following item is the only significant financial instrument held at fair value through profit or loss:
i) Derivative assets and derivative liabilities
Derivatives are classified as held for trading and measured at FVTPL unless they are designated as part of a qualifying hedge. All derivative contracts are carried as assets when the fair value is positive and as liabilities when the fair value is negative. Derivatives are held only to cover economic exposures. The use of derivatives is restricted to the hedging of forecast cash flows for specific transactions. Currently derivatives are limited to interest rate swaps and forward foreign exchange contracts.

Integrated Annual Report 2019 | 165
Risk management report
Remuneration report
Social responsibility
About this report
Appendices Annual financial statements
2.4.1.2 Financial liabilities
The group recognises a financial liability once it becomes a party to the contractual terms of the financial instrument. Financial liabilities, other than those held at fair value through profit or loss, are recognised initially at fair value, generally being their issue proceeds net of transaction costs incurred and subsequently stated at amortised cost using the effective interest rate method.
A financial liability, or part of a financial liability, is derecognised once the obligation specified in the contract relating to the financial liability is discharged, cancelled or has expired.
2.4.1.3 Derivative financial instruments and hedging activities
Derivative financial instruments exclude equity instruments that are accounted for in terms of IFRS 2 Share-based payments.
Derivatives are initially recognised at fair value on the date a derivative contract is entered into and are subsequently re-measured at fair value. Transaction costs are expensed. The method of recognising the resulting gain or loss depends on whether the derivative is designated as a hedging instrument, and if so, the nature of the item being hedged. Fair values are obtained from quoted market prices, where available, alternatively using valuation techniques or based on observable market prices where possible, failing which estimates are used.
Interest rate swaps are valued on a discounted cash flow basis using yield curves appropriate for the relevant swap rates. Quoted market prices are used where available and estimates are derived from quoted prices where required.
All contracts are carried as assets when the fair value is positive and as liabilities when the fair value is negative. Derivatives are held only to cover economic exposures.
The group designates certain derivatives as:
(a) hedges of a particular risk associated with a recognised asset or liability or a highly probable forecast transaction (cash flow hedge); or
(b) economic hedges if not qualifying in terms of the accounting criteria classified as fair value through profit or loss.
The use of derivatives is restricted to the hedging of forecast cash flows for specific transactions. Currently derivatives are limited to interest rate swaps and forward foreign exchange contracts.
2.4.1.4 Treatment of hedges qualifying as cash flow hedges
The effective portion of changes in the fair value of derivatives that are designated and qualify as cash flow hedges is recognised in other comprehensive income and deferred within equity. The gain or loss relating to the ineffective portion is recognised in the income statement immediately.
Amounts accumulated in equity are reclassified to profit or loss in the periods when the hedged item affects profit or loss (for example, when the interest payments that are hedged are recognised as an expense). The gain or loss relating to the effective portion of interest rate swaps hedging variable rate borrowings is recognised in the income statement within interest expense. Refer to note 42 for separate disclosure.
When a hedging instrument expires or is sold, or when a hedge no longer meets the criteria for hedge accounting, any cumulative gain or loss existing in equity at that time remains in equity and is recognised when the forecast transaction is ultimately recognised in the income statement. When a forecast transaction is no longer expected to occur, the cumulative gain or loss that was reported in equity is immediately transferred to the income statement within movement in financial instruments held at fair value through profit or loss disclosed under operating expenses.

166 | Capitec Bank Holdings Limited
Key performance indicators
Leadership reviews
The Capitec Way
Our business context
Our strategic goals and insights
Leadership teams and governance oversight
2. Accounting policies (continued)
2.4 Financial instruments (continued)
2.4.1 Financial instruments applied from 1 March 2018 (continued)
2.4.1.4 Treatment of hedges qualifying as cash flow hedges (continued)
At the inception of the transaction the group designates the relationship between hedging instruments and hedged items, as well as its risk management objectives and strategy for undertaking various hedging transactions. The group also documents its assessment, both at hedge inception and on an ongoing basis, of whether the derivatives that are used in hedging transactions are highly effective in offsetting changes in cash flows of hedged items. Movements on the hedging reserve in shareholders’ equity are shown in note 20.
2.4.1.5 Treatment of economic hedges classified as fair value through profit or loss
Where applicable changes in the fair value of these derivatives classified as fair value through profit and loss are taken to profit or loss immediately on remeasurement.
The fair values of various derivative instruments used for hedging purposes are disclosed in notes 41 and 42.
2.4.2 Financial instrument policy applied at 28 February 2018
The group recognises financial assets on the statement of financial position once it becomes a party to the contractual terms of the particular financial instrument.
Financial assets are derecognised when the rights to receive cash flows from the financial assets have expired or where the group has transferred substantially all risks and rewards of ownership.
Management determines the categorisation of its financial instruments at initial recognition.
2.4.2.1 Financial assets:
(a) Financial instruments designated at fair value through profit or lossThis category has two subclasses: financial assets held for trading, and those designated at fair value through profit or loss at inception. A financial asset is categorised as held for trading if acquired principally for the purpose of selling in the short term or if so designated by management. Derivatives are categorised as held for trading unless they are designated as hedges.
Purchases and sales of financial assets at fair value through profit or loss are recognised on trade-date, being the date on which the group commits to purchase or sell the asset.
Gains and losses on financial assets at fair value through profit or loss are measured as the difference between the fair values and the carrying amounts adjusted for dividend income and are included in the income statement.
(b) Held-to-maturity investmentsFinancial assets at amortised cost are held-to-maturity, non-derivative financial assets with fixed or determinable payments and fixed maturities that the group’s management has the positive intention and ability to hold to maturity.
These assets are initially recognised at fair value plus any directly attributable transaction costs. Subsequent to initial recognition, they are measured at amortised cost using the effective interest rate method.
Interest on held-to-maturity investments calculated using the effective interest rate method is recognised in the statement of profit or loss as part of interest income.

Integrated Annual Report 2019 | 167
Risk management report
Remuneration report
Social responsibility
About this report
Appendices Annual financial statements
(c) Loans and receivablesLoans and advances are non-derivative financial assets with fixed or determinable payments that are not quoted in an active market, other than:
• those that the entity intends to sell immediately or in the short term, which are categorised as held for trading, and those that the entity upon initial recognition designates as at fair value through profit or loss;
• those that the entity upon initial recognition designates as available-for-sale; or
• those for which the holder may not recover substantially all of its initial investment, other than because of credit deterioration.
They arise when the group provides money, goods or services directly to a debtor with no intention of trading the advance. Included within this category are:
(i) loans and advances to clients that are recognised when funds are advanced to the borrowers and are carried at amortised cost using the effective interest rate method;
(ii) fixed and term notice deposits are non-derivative financial assets with fixed or determinable payments. They arise when the group invests cash with other banks. These instruments comprise fixed deposits with original maturities longer than three months, deposit investments with the contractual option to call the funds after a period longer than three months and deposits that have effective contractual notice periods greater than three months. The investments are made with the intention to hold them to maturity and collect the contractual cash flows. Fixed and term notice deposits are carried at amortised cost using the effective interest rate method.
(d) Available-for-sale investmentAn equity investment is measured at fair value with unrealised gains or losses recognised directly in other comprehensive income in the available-for-sale reserve. When the asset is disposed of, the cumulative gain or loss previously recognised in other comprehensive income is reclassified to the income statement. If an available-for-sale instrument is determined to be impaired, the respective cumulative unrealised losses previously recognised in other comprehensive income are included in the income statement in the period in which the impairment is identified.
Dividends earned while holding available-for-sale financial investment are recognised in the income statement when the right to payment has been established.
2.4.2.2 Financial liabilities
The group recognises a financial liability once it becomes a party to the contractual terms of the financial instrument. Financial liabilities, other than those held at fair value through profit or loss, are recognised initially at fair value, generally being their issue proceeds net of transaction costs incurred and subsequently stated at amortised cost using the effective interest rate method.
A financial liability, or part of a financial liability, is derecognised once the obligation specified in the contract relating to the financial liability is discharged, cancelled or has expired.
2.4.2.3 Derivative financial instruments and hedging activities
Derivative financial instruments exclude equity instruments that are accounted for in terms of IFRS 2 Share-based payments.
Derivatives are initially recognised at fair value on the date a derivative contract is entered into and are subsequently re-measured at fair value. Transaction costs are expensed. The method of recognising the resulting gain or loss depends on whether the derivative is designated as a hedging instrument, and if so, the nature of the item being hedged. Fair values are obtained from quoted market prices, where available, alternatively using valuation techniques or based on observable market prices where possible, failing which estimates are used.

168 | Capitec Bank Holdings Limited
Key performance indicators
Leadership reviews
The Capitec Way
Our business context
Our strategic goals and insights
Leadership teams and governance oversight
2. Accounting policies (continued)
2.4 Financial instruments (continued)
2.4.2 Financial instrument policy applied at 28 February 2018 (continued)
2.4.2.3 Derivative financial instruments and hedging activities (continued)
Interest rate swaps are valued on a discounted cash flow basis using yield curves appropriate for the relevant swap rates. Cross currency swaps are valued on a discounted cash flow basis using foreign exchange market curves appropriate for the relevant swap rates. Quoted market prices are used where available and estimates are derived from quoted prices where required.
All contracts are carried as assets when the fair value is positive and as liabilities when the fair value is negative. Derivatives are held only to cover economic exposures.
The group designates certain derivatives as:
(a) hedges of a particular risk associated with a recognised asset or liability or a highly probable forecast transaction (cash flow hedge), or
(b) economic hedges if not qualifying in terms of the accounting criteria classified as fair value through profit or loss.
The use of derivatives is restricted to the hedging of forecast cash flows for specific transactions. Currently derivatives are limited to interest rate swaps and forward foreign exchange contracts.
2.4.2.4 Treatment of hedges qualifying as cash flow hedges
The effective portion of changes in the fair value of derivatives that are designated and qualify as cash flow hedges is recognised in other comprehensive income and deferred within equity. The gain or loss relating to the ineffective portion is recognised immediately in the income statement.
Amounts accumulated in equity are reclassified to profit or loss in the periods when the hedged item affects profit or loss (for example, when the interest payments that are hedged are recognised as an expense). The gain or loss relating to the effective portion of interest rate swaps hedging variable rate borrowings is recognised in the income statement within interest expense.
When a hedging instrument expires or is sold, or when a hedge no longer meets the criteria for hedge accounting, any cumulative gain or loss existing in equity at that time remains in equity and is recognised when the forecast transaction is ultimately recognised in the income statement. When a forecast transaction is no longer expected to occur, the cumulative gain or loss that was reported in equity is immediately transferred to the income statement within movement in financial instruments held at fair value through profit or loss disclosed under operating expenses.
The group documents at the inception of the transaction the relationship between hedging instruments and hedged items, as well as its risk management objectives and strategy for undertaking various hedging transactions. The group also documents its assessment, both at hedge inception and on an ongoing basis, of whether the derivatives that are used in hedging transactions are highly effective in offsetting changes in cash flows of hedged items. Movements on the hedging reserve in shareholders’ equity are shown in Note 20.
2.4.2.5 Treatment of economic hedges classified as fair value through profit or loss
Where applicable changes in the fair value of these derivatives classified as fair value through profit and loss are taken to profit or loss immediately on remeasurement.
The fair values of various derivative instruments used for hedging purposes are disclosed in Note 41.

Integrated Annual Report 2019 | 169
Risk management report
Remuneration report
Social responsibility
About this report
Appendices Annual financial statements
2.5 Impairment – amortised cost
2.5.1 Impairment – amortised cost policy applied from 1 March 2018
The group applied the expected credit loss (ECL) model on all financial debt instruments that are classified at amortised cost as well as undrawn commitments.
2.5.1.1 Impairment – measurement
ECL is calculated as an unbiased, probability weighted amount which is determined by evaluating the range of reasonably possible outcomes, the time value of money and considering all reasonable and supportable information including that which is forward-looking.
The most significant class of financial asset subject to an ECL is loans and advances. Loans and advances comprise a large number of small, homogeneous assets. The group uses an ECL provisioning model based on historical roll rates using the Markov chain method.
The group stratifies the Markov roll rate results into similar groups to ensure results are stable and appropriate to predict future cash flows for clients with similar characteristics. The group stratifies aspects such as client risk groups, time on book, product term, payment frequency (monthly, fortnightly or weekly), default statuses, employment, industry and rescheduling status and the behaviour score of the client.
Furthermore, the model combines the roll rate matrices with a loan amortisation model on a loan-by-loan basis. The specific features of each loan such as balance, interest rate, fees, remaining term, instalments and arrears status, combined with the roll rates applicable to loans with the same characteristics, enables the group to estimate the expected cash flow and balance amortisation of the loan. The rolled up results enable the group to analyse portfolio and segmented views.
Forward-looking economic assumptions are incorporated into the model where relevant and where they influence credit risk. These assumptions are incorporated using the group’s most likely forecast for a range of macro-economic assumptions. Three forward-looking scenarios are incorporated into the range of reasonably possible outcomes (negative, positive and base case scenarios).
The period over which the ECL is calculated is limited to the maximum contractual period.
The resultant ECL calculation amounts to the excess of the balance of a loan above the present value of its expected cash flows, discounted using the effective interest rate on the financial instrument as calculated at initial recognition (initiation fee plus interest).
2.5.1.2 Impairment – recognition
Stage 1An ECL is recognised at the time of initial recognition of the financial debt instruments and represents the lifetime cash shortfall arising from possible default events up to 12 months into the future from the balance sheet date.
An ECL continues to be determined on this basis until there is a significant increase in credit risk (SICR) event or the financial debt instrument becomes credit impaired.
A cash shortfall is the difference between the cash flows that are due in accordance with the contractual terms of the loan and the cash flows that the group expects to receive over the contractual life of the loan.
For loans and advances, up-to-date loans are included in stage 1.
Clients that applied for debt review more than 12 months ago and remained up-to-date are classified as stage 1 subject to the SICR assessment.

170 | Capitec Bank Holdings Limited
Key performance indicators
Leadership reviews
The Capitec Way
Our business context
Our strategic goals and insights
Leadership teams and governance oversight
2. Accounting policies (continued)
2.5 Impairment – amortised cost (continued)
2.5.1 Impairment – amortised cost policy applied from 1 March 2018 (continued)
2.5.1.2 Impairment – recognition (continued)
Stage 2The group monitors financial debt instruments subject to impairment requirements at each reporting date to determine whether evidence exists that there has been a significant increase in credit risk (SICR) since initial recognition of the financial instrument.
The group identifies SICR for clients that are up-to-date on their loans, but who have reached certain behaviour risk thresholds or specific events have occurred that raise a SICR flag in the model. The 12 month ECL is extended to a lifetime ECL for these clients.
The group considers the following to be SICR for all loans and advances extended to the client:
• A client who has been reported as being unemployed;
• A client with a term loan that is up-to-date, but has a Capitec credit card which is in arrears. The term loan is identified as SICR;
• A client with a behaviour score that has decreased below the internal SICR threshold set by the group; and
• A client with an updated granting score below the internal SICR threshold set by the group.
The following loans and advances are included in stage 2:
• Up-to-date loans with SICR;
• Loans up to 1 month in arrears and;
• Loans that applied for debt review between 6 and 12 months ago which are currently performing.
Stage 3 – Credit impairedFinancial debt instruments are considered impaired if, and only if, there is objective evidence of impairment as a result of events that occurred after initial asset recognition (known as loss events). These loss events have an adverse impact on the asset’s estimated future cash flows that can be measured reliably.
The group defines loans and advances as being ‘credit-impaired’ when one or more events that have a detrimental impact on the estimated future cash flows of the financial asset has occurred. Loans and advances are considered to be credit impaired upon the occurrence of any of the following events:
• client is placed under debt review;
• client is handed over for collection or has another legal status;
• client is in default. The group defines default as the point at which the client is past due on 2 contractual payments, i.e. more than 1 month in arrears;
• loans which applied for debt review less than 6 months ago which are currently performing;
• up-to-date loans that rescheduled from up-to-date (not yet rehabilitated); or
• up-to-date loans that rescheduled from arrears (not yet rehabilitated).
Interest on loans and advances categorised as stage 3 is recognised in the income statement and balance sheet, net of ECL impairments.
2.5.1.3 Impairment – Loan write-offs applied from 1 March 2018
Write-off is a derecognition event.
Following the implementation of IFRS 9, loans and advances are written off when it is has been determined that no reasonable expectation of recovery either in its entirety or in portion exists.
Under IAS 39, loans and advances that would have previously been written off when the loans and advances were in a legal status or in arrears for more than 3 months; under IFRS 9 loans and advances continue to be recognised until no reasonable certainty exists that any further recovery is expected on these loans and advances.

Integrated Annual Report 2019 | 171
Risk management report
Remuneration report
Social responsibility
About this report
Appendices Annual financial statements
The group considers the point at which there is no reasonable expectation of further recovery to be when the loan has a present value of future recovery less than 5% of the gross balance before write-off. This point, applied from 1 March 2018, provides a simpler and more reliable method to that intended to be applied at transition that considered partial write-offs and time since last payment. It is currently estimated as loans:
(1) Terminated from debt review:• 4 consecutive missed payments
(2) Loans that have been handed over/other legal status:• handover scores less than the predetermined threshold; or• handover score more than the predetermined threshold with 4 consecutive missed payments.
The expected recoveries receivable represents the present value of expected future recoveries net of impairments receivable on loans and advances that were written off in full prior to 1 March 2018.
The expected recovery receivable is assessed for impairment using a lifetime ECL from 1 March 2018, and placed in stage 3.
Where actual cash flow exceeds the amount written off, the excess is disclosed as bad debts recovered.
2.5.2 Impairment of advances applied at 28 February 2018
Loans and advances are stated at amortised cost net of identified impairments and incurred but unidentified impairments.
Loans and advances are considered impaired if, and only if, there is objective evidence of impairment as a result of events that occurred after initial asset recognition (known as loss events) and these loss events have an adverse impact on the assets’ estimated future cash flows that can be measured reliably.
Objective evidence that loans and advances may be impaired includes the following observable data:
(a) A breach of contract, such as a default or delinquency in interest or principal payments. In this regard, instalments past due date are considered in breach of contract.
(b) Historical loss experience of groups of financial assets with similar repayment terms.
(c) Data indicating that there is a measurable decrease in the estimated future cash flows from a group of financial assets since the initial recognition of those assets, although the decrease cannot yet be identified with the individual financial assets in the group including:• adverse changes in the payment status of borrowers in the group; or• national or local economic conditions that correlate with defaults on the assets in the group.
In determining whether a loss event has occurred, loans and advances are subjected to regular evaluations of the overall client risk profile and payments record.
The historical loss experience is adjusted on the basis of observable data to reflect the effects of current conditions that did not affect the period on which the historical loss experience is based and to remove the effects of conditions in the historical period that do not currently exist.
On a collective basis, the group assesses whether objective evidence of impairment exists for groups of financial assets with similar repayment terms. If there is objective evidence that an impairment loss on loans and advances has been incurred, the amount of the loss is measured as the difference between the assets’ carrying amounts and the present value of estimated future cash flows (excluding future credit losses that have not yet been incurred) discounted at the respective financial assets’ original effective interest rates (the recoverable amount).
The methodology and assumptions used for estimating future cash flows are reviewed regularly to reduce differences between loss estimates and actual loss experience.
All impaired loans and advances are reviewed on a monthly basis and any changes to the amount and timing of the expected future cash flows compared to previous estimates will result in a change to the charges for impairment of loans and advances in the income statement.

172 | Capitec Bank Holdings Limited
Key performance indicators
Leadership reviews
The Capitec Way
Our business context
Our strategic goals and insights
Leadership teams and governance oversight
2. Accounting policies (continued)
2.5 Impairment – amortised cost (continued)
2.5.2 Impairment of advances applied at 28 February 2018 (continued)
2.5.2.1 Identified impairment
Loans and advances within the group comprise a large number of small, homogeneous assets. Statistical techniques are used to calculate impairment allowances collectively, based on historical default and recovery rates. These statistical analyses use as primary inputs the extent to which accounts in the portfolio are in arrears and historical loss experience on the eventual losses encountered from similar delinquent portfolios.
These statistics feed discounted cash flow models, which have been developed for each of the loan products offered by the group. The models are updated periodically in order to reflect appropriate changes in inputs.
Models contain both judgemental and non-judgemental inputs. The extent of judgement utilised in models developed for new loan products is greater than that for older products, given the limited historical experience available for the new products.
In outline, the statistical analyses are performed on a portfolio basis as follows:
• Loans and advances are monitored on a product basis, with each month’s advances being treated as a discrete portfolio, on which an analysis of the run-off of recoveries, in period buckets and stratified between default statistics, is performed in order to develop a historical base for statistics on probability of default (PD).
• These derived statistics, based on actual experience, are used in plotting default values on a model curve that reflects the risk profile of the portfolio.
• Clients in arrears by more than 90 days are handed over for collection and written-off. The estimated recoveries is then discounted at the contractual rates and recognised in gross loans and advances.
• Upon write-off, the accrual of interest income on the original term of the advance is discontinued.
• The expected amount outstanding when default occurs that is not subsequently recovered, or the loss given default (LGD), is taken into account in calculating the impairment allowance.
Loans and advances with outstanding balances that would otherwise have been reflected as past due are included in loans and advances not past due, due to renegotiated payment terms. The renegotiated loans are subject to continuous individual or collective impairment assessment. Loans that were past due and have been renegotiated within the past six months are separately disclosed and are subject to stricter impairment assessment than loans renegotiated more than six months ago. Past due renegotiated loans cease to be disclosed separately if they are up to date six months after being rescheduled. If a rescheduled loan goes into arrears, it forms part of the loans in arrears classification.
2.5.2.2 Incurred but unidentified impairment
In addition to the impairment estimated for assets with recognised objective evidence of impairment, an estimate is made for impairments associated with those assets in the statement of financial position that are impaired, but for which objective evidence is not yet available.
• The impairment calculation utilises the results of the statistical analyses referred to above to estimate the proportion of assets in each portfolio that are likely to display objective evidence of impairment over the emergence period. The emergence period is defined as the experience of the length of time that it takes for objective evidence to become apparent after the asset has become impaired.
• In considering the occurrence of a loss event over the life of a loan, it is assumed that there is a constant risk of the loss event occurring at any point in the life of the loan.
• For a portfolio of loans in a particular month most of the provision is recognised in the early stages of the contractual period, as the outstanding loan balances are larger.
Loans and advances impaired on this basis are reflected as loans not past due.

Integrated Annual Report 2019 | 173
Risk management report
Remuneration report
Social responsibility
About this report
Appendices Annual financial statements
2.5.2.3 Loan write-offs
Clients (and the related impairment allowance accounts) are written off at the earliest of when they are in arrears for 90 days or more or legal hand-over occurs.
2.6 Interest-free loans granted
Interest-free group loans with no written terms.
2.7 Current tax
Income tax payable on profits, based on the applicable tax law, is recognised as an expense in the period in which profits arise. The current income tax charge is calculated on the basis of the tax laws enacted or substantively enacted at the statement of financial position date.
2.8 Deferred tax
Deferred income tax is provided, using the liability method, on temporary differences arising between the tax bases of assets and liabilities and their carrying amounts for financial reporting purposes. Deferred income tax is determined using tax laws and rates that have been enacted or substantively enacted by the reporting date and are expected to apply when the related deferred income tax asset is realised or the deferred income tax liability is settled.
The principal temporary differences arise from depreciation of property and equipment, provisions for doubtful debts, revaluation of certain financial assets and liabilities, prepaid expenses and tax losses carried forward. Deferred tax assets are raised only to the extent that it is probable that future taxable income will be available against which the unused tax losses can be utilised.
Deferred tax assets and liabilities are only offset when there is both a legal right to set-off and an intention to settle on a net basis.
2.9 Property and equipment
Land and buildings comprise a sectional title development right, land being developed and completed buildings. All property and equipment is stated at historical cost less depreciation. Historical cost includes expenditure that is directly attributable to the acquisition of the items.
Subsequent costs are included in the assets’ carrying amount or are recognised as a separate asset, as appropriate, only when it is probable that future economic benefits associated with the item will flow to the group and the cost of the item can be measured reliably. All other repairs and maintenance costs are charged to the income statement during the financial period in which they were incurred.

174 | Capitec Bank Holdings Limited
Key performance indicators
Leadership reviews
The Capitec Way
Our business context
Our strategic goals and insights
Leadership teams and governance oversight
2. Accounting policies (continued)
2.9 Property and equipment (continued)
Land is not depreciated. Depreciation on other assets is calculated using the straight-line method to allocate their cost to their residual values over their estimated useful lives, which currently are as follows:
• Automated teller machines 10 years
• Banking application hardware 3 – 5 years
• Buildings 50 years
• Computer equipment 3 – 7 years
• Motor vehicles 5 years
• Office equipment 5 – 8 years
The assets’ residual values and useful lives are annually reviewed and adjusted, if appropriate.
Gains and losses on disposals are determined by comparing proceeds with carrying amounts. These are included in the income statement.
2.10 Intangible assets
2.10.1 Computer software
Computer software licences are acquired and are capitalised on the basis of the costs incurred to acquire and bring to use the specific software. Computer software is carried at cost less accumulated amortisation and impairment losses.
Costs associated with developing and maintaining computer software programmes are recognised as an expense as incurred. Costs that are directly associated with the creation of identifiable and unique systems controlled by the group, and that will probably generate economic benefits beyond one year, are recognised as intangible assets. Other development expenditures are recognised as an expense as incurred.
Amortisation on computer software is calculated using the straight-line method to allocate their cost to their residual values over their estimated useful lives, which currently are as follows:
• Banking application software 6 years
• Desktop application software 2 – 4 years
• Server software 3 – 5 years
2.10.2 Internally generated intangible assets
Development costs that are directly attributable to the design and testing of identifiable and unique software products controlled by the group are recognised as intangible assets when the following criteria are met:
• it is technically feasible to complete the software product so that it will be available for use;
• management intends to complete the software product and use or sell it;
• there is an ability to use or sell the software product;
• adequate technical, financial and other resources to complete the development and to use or sell the software product are available; and
• the expenditure attributable to the software product during its development can be reliably measured.
Other development expenditures that do not meet these criteria are recognised as an expense when incurred. Development costs previously recognised as an expense are not recognised as an asset in a subsequent period.
Amortisation on internally generated intangible assets is calculated using the straight-line method to allocate their cost to their residual values over their estimated useful lives, which currently are as follows:
• Internally generated intangible assets 3 – 10 years
The assets’ useful lives are annually reviewed and adjusted where appropriate.

Integrated Annual Report 2019 | 175
Risk management report
Remuneration report
Social responsibility
About this report
Appendices Annual financial statements
2.11 Impairment of non-financial assets
Equipment and other non-financial assets (for example property and computer software) are reviewed for impairment losses whenever events or changes in circumstances indicate that the carrying amount may not be recoverable. An impairment loss is recognised for the amount by which the carrying amount of the asset exceeds its recoverable amount, which is the higher of an asset’s net selling price and value in use. For the purpose of assessing impairment, assets are grouped at the lowest levels for which there are separately identifiable cash flows (cash-generating units). Non-financial assets that suffered impairment are reviewed for possible reversal of the impairment at each reporting date.
2.12 Share capital
2.12.1 Categories of share capital
Authorised share capital consists of • ordinary shares;
• non-redeemable, non-cumulative, non-participating preference shares; and
• convertible or written-off, loss-absorbent preference shares.
2.12.2 Share issue costs
Incremental costs directly attributable to the issue of new shares or options are shown in equity as a deduction, net of tax, from the proceeds.
2.12.3 Dividends declared
Dividends on ordinary shares and preference shares that are classified as equity are recognised in equity in the period in which they have been approved by the group’s directors. Dividends for the year that are declared after the statement of financial position date are dealt with in the directors’ report.
2.12.4 Treasury shares
Where the company or other members of the group purchase the company’s equity share capital, the consideration paid is deducted from total shareholders’ equity as shares held by the group until they are cancelled or sold.
2.12.5 Preference shares
As the preference shares are non-redeemable, non-cumulative, and non-participating they are included in equity.
2.13 Employee benefits
2.13.1 Pension obligations
The group contributes to a provident fund classified as a defined-contribution fund.
For defined-contribution plans, the group pays fixed contributions to privately administered provident fund plans on a contractual basis. The group has no further payment obligations once the contributions have been paid. The contributions are recognised as employee benefit expenses when they are due. Prepaid contributions are recognised as an asset to the extent that a cash refund or a reduction in the future payments is available.
2.13.2 Share-based compensation
The group operates equity-settled, share-based compensation plans. The fair value of the employee services received in exchange for the grant of the options is recognised as an expense. The total amount to be expensed over the vesting period is determined by reference to the fair value of the options on grant date, excluding the impact of any non-market vesting conditions (for example, profitability and sales growth targets). Non-market vesting conditions are included in assumptions about the number of options that are expected to become exercisable. At each statement of financial position date, the entity revises its estimates of the number of options that are expected to vest. It recognises the impact of the revision of original estimates, if any, in the income statement, and a corresponding adjustment to retained income in the statement of changes in equity over the remaining vesting period.

176 | Capitec Bank Holdings Limited
Key performance indicators
Leadership reviews
The Capitec Way
Our business context
Our strategic goals and insights
Leadership teams and governance oversight
2. Accounting policies (continued)
2.13 Employee benefits (continued)
2.13.2 Share-based compensation (continued)
The group also has cash-settled, share-based compensation plans. The fair value of the liability incurred for employee services received is recognised as an expense over the vesting period. Until the liability is settled, the group remeasures the fair value of the liability at each reporting date and at the date of settlement, with any changes in value recognised in profit or loss for the period.
2.13.3 Performance incentive scheme
The group operates a performance incentive scheme for senior and other employees, who are seen to be in leadership roles critical to the current and future success of the group’s business.
The amount recognised as a liability is the present value of the obligation at the end of the reporting period. The rate used to discount the obligation is determined by reference to market yields at the end of the reporting period on government bonds. The currency and term of the bonds is consistent with the currency and term of the obligation.
The employee service cost is recognised in the income statement as the obligation arises.
2.14 Foreign currency translation
2.14.1 Functional and presentation currency
Items included in the financial statements of each of the group’s entities are measured using the currency of the primary economic environment in which the entity operates (‘the functional currency’). The consolidated financial statements are presented in South African Rand (‘Rand’), which is the group, and company’s functional and presentation currency. The financial statements of all the subsidiaries are also presented in Rand, which is their functional and presentation currency. The investment in associate is translated to South African Rand at the exchange rate prevailing at the reporting date. The equity accounted earnings are translated to South African Rand at the average exchange rate for the period. Gains or losses on translation are recognised in other comprehensive income and presented within equity in the foreign currency translation reserve (‘FCTR’).
2.14.2 Transactions and balances
Foreign currency transactions are translated into the functional currency using the exchange rates prevailing on the date of the transaction. Foreign currency balances are translated into rand at the reporting period end exchange rates. Exchange gains and losses on such balances are taken to profit or loss. Exchange gains and losses on balances of a foreign operation are taken to Other Comprehensive Income.
2.15 Net insurance receivable
Insurance contracts are defined as those contracts or agreements containing significant insurance risk. Significant insurance risk arises if an insured event could cause the issuer of the insurance contract to pay significant additional benefits as envisaged at the inception of the contract. Such contracts remain designated as insurance contracts until all rights and obligations are extinguished or expire.
The group has provided capital to the third party cell captive and allows the group to benefit from the ring-fenced insurance business. The cell captive arrangement effectively represents an investment in separate classes of shares in the cell captive insurer, which entitles the group to participate in the insurance profits generated in terms of insurance policies sold to the group’s loan clients. The group’s participation is restricted to the results of the insurance business which is placed with the licensed cell captive insurer. The group also earns interest on the capital and retained profits in the cell captive.
The cell captive arrangement exposes the group to insurance risk on the reinsured and retained insurance risk components in the cell captive. The group’s insurance risk on the reinsured component relates to the risk that the reinsurer will fail to honour its obligations under the reinsurance agreement. The group’s insurance risk on the retained component relates to the risk that there will be insufficient capital available to honour the claims made by the policyholders in the cell captive arrangement.

Integrated Annual Report 2019 | 177
Risk management report
Remuneration report
Social responsibility
About this report
Appendices Annual financial statements
The group’s exposure to insurance risk for both the reinsured and retained components in the cell captive is evidenced by the group’s obligation to maintain the solvency of the cell captive structure.
With respect to the retained insurance risk, judgement is required in determining the actuarial movements of the insurance contract liabilities held by the cell captive. There is uncertainty with regards to the claims that will be made by customers, which is dependent on a number of unpredictable factors. The group makes this judgement based on the best estimate and in accordance with Standards of Actuarial Practice (“SAP”) 104 principles.
The insurance risk associated with the investment in the cell captive arrangement is disclosed as a non-current asset in the statement of financial position as “Net insurance receivable”.
2.16 Revenue recognition
2.16.1 Interest income and expense
Interest income and expense are recognised in the income statement for all instruments measured at amortised cost and at fair value through profit or loss using the effective interest rate method. Interest income and expense are recognised separately from other fair value movements.
The effective interest rate method is a method of calculating the amortised cost of a financial asset or a financial liability and of allocating the interest income or interest expense over the relevant period. The original effective interest rate is the rate that exactly discounts estimated future cash payments or receipts through the expected life of the financial instrument or, when appropriate, a shorter period to the net carrying amount of the financial asset or financial liability. When calculating the original effective interest rate, the group estimates cash flows considering all contractual terms of the financial instrument (for example, prepayment options) but does not consider future credit losses. The calculation includes all fees paid or received between parties to the contract that are an integral part of the effective interest rate.
Once a financial asset or a group of similar financial assets have been written down as a result of an impairment loss, interest income is recognised using the rate of interest used to discount the future cash flows for the purpose of measuring the impairment loss, which is the effective interest rate calculated at origination of the financial asset measured at amortised cost.
Loan origination fees that relate to the creation of a financial asset are amortised over the expected term of the loan on an effective interest rate basis and included in interest income.
2.16.2 Loan Fee income and expenses
Service-related loan fee income is recognised when the services are provided.
Loan fee expenses comprise credit insurance premiums paid and are recognised when the services are received from the first party credit life insurance cell captive.
2.16.3 Transaction income and expenses
Transaction income and expenses are recognised on an accrual basis in the period in which the services are rendered.
Transaction fee income and expenses arise due to the use of the Group’s branch, ATM and POS networks, along with the various electronic banking channels that the Group has, namely the banking app, USSD and internet banking platform.
2.16.4 Dividend income
Dividend income is recognised in the income statement when the entity’s right to receive payment is established. Dividends on listed preference shares accrue on a day-to-day basis based on the terms of the underlying instruments. Dividend income is recognised separately from other fair value movements.
2.16.5 Net insurance income
Net insurance income represents the movement before distributions paid to the group in the net insurance receivable and comprises profits from the third party cell captive after reinsurance and tax. Investment returns have been included in interest income.

178 | Capitec Bank Holdings Limited
Key performance indicators
Leadership reviews
The Capitec Way
Our business context
Our strategic goals and insights
Leadership teams and governance oversight
2. Accounting policies (continued)
2.16 Revenue recognition (continued)
2.16.6 Funeral income
Funeral income comprises dividends and commission from a cell captive profit-sharing arrangement after reinsurance.
Capitec entered into a cell captive agreement that is 100% reinsured by a third party. The group is the owner of a cell, through a preference share investment, that holds the credit insurance underwritten by the cell captive insurer. This preference share investment is classified as a receivable measured at fair value through P&L. Capitec would not be required to recapitalise the cell if any losses were to be suffered by the in-force policies. Due to the reinsurance risk being transferred to the third party, Capitec does not have an obligation to recapitalise the cell.
Funeral income is received from the cell captive as a dividend after tax. The tax expense is included in funeral income.
2.17 Segment reporting
The executive management committee, headed by the CEO has been identified by the group as the chief operating decision maker (CODM), who are responsible for assessing the performance and allocation of resources of the group.
The group reports a single segment – retail banking within the South African economic environment. The business is widely distributed with no reliance on any major clients. In addition, no client accounts for more than 10% of revenue.
The CODM regularly review the operating results of the retail banking segment for which discrete financial information is made available on a monthly basis and against which performance is measured and resources are allocated across the segment.
Within the segment are a number of products and services that the group derives its revenue from. These include:
• Transactional and deposit-taking banking services of which transaction fee income is disclosed on the face of the consolidated income statement;
• Loan products that are granted to loan clients. There are three products granted by the segment, namely term loans and credit facilities and credit cards. Details of these loans are disclosed in note 7. Interest earned, monthly service fees and net insurance income is disclosed in Note 21; and
• Profit sharing arrangement with regards to the funeral insurance policy sold by the group.
Although the group operates within the South African economic environment, the group does hold an investment in Cream Finance, located in Cyprus with subsidiaries based in a number of European countries. Cream Finance is an associate over which the group does not have control.
2.18 Leases
2.18.1 Where a group company is the lessee
Leases where a significant portion of the risks and rewards of ownership are retained by the lessor are classified as operating leases. Payments made under operating leases, net of any incentives received from the lessor, are charged to the income statement on a straight-line basis over the period of the lease.
When an operating lease is terminated before the lease period has expired, any penalty payment to the lessor is recognised as an expense in the period in which termination takes place.
2.18.2 Where a group company is the lessor
Rental from the subletting of leased premises is recognised on a straight-line basis over the lease term. Subletting is incidental to the group’s occupation of certain properties.

Integrated Annual Report 2019 | 179
Risk management report
Remuneration report
Social responsibility
About this report
Appendices Annual financial statements
2.19 Effective standards, interpretations and amendments to published standards applied for the first time during the current financial year
2.19.1 IFRS 9 Financial Instruments and amendments to IFRS 9 (effective 1 March 2018)
The group adopted IFRS 9 on 1 March 2018. The group has not restated its comparative financial statements for the adoption of IFRS 9. Accordingly, the impact of adopting IFRS 9 has resulted in an adjustment to the group’s opening retained earnings on the date of initial application (DIA).
Impact on the statement of financial position as at 1 March 2018
The table below summarises the IFRS 9 transition impact on the group’s statement of financial position as at 1 March 2018 by statement of financial position line item.
Condensed consolidated statement of financial position
R’000
Group IAS 39
as at 28 February
2018
IFRS 9Classification
andMeasurement(1)
IFRS 9 ECL
Group IFRS 9
as at 1 March
2018
Assets
Financial investments 39 400 122 – (13 386) 39 386 736
Available-for-sale financial assets(1) 100 000 – – 100 000
Loans and advances to clients 41 814 395 – (886 669) 40 927 726
Other assets 3 138 736 – – 3 138 736
Current income tax asset(2) 107 154 – (107 154) –
Deferred income tax asset(2) 396 827 – 770 490 1 167 317
Total assets 84 957 234 – (236 719) 84 720 515
Other liabilities(3) 66 065 556 – 411 320 66 476 876
Total liabilities 66 065 556 – 411 320 66 476 876
Equity –
Equity attributable to ordinary shareholders 18 778 875 – (648 039) 18 130 836
Non-redeemable, non-cumulative, non-participating preference share capital and premium 112 803 – – 112 803
Total equity 18 891 678 – (648 039) 18 243 639
Total equity and liabilities 84 957 234 – (236 719) 84 720 515
(1) The investment in African Bank is an equity investment and as such has been designated at fair value through OCI. Previously, the investment had been recognised as an available for sale security. All other financial assets retained their measurement basis as amortised cost under IFRS 9.
(2) Change in deferred tax and current income tax relates to the increase in the ECL provisions and change in tax law under the new section 11(jA) of the Income Tax Act of 1962 which is effective from the date that IFRS 9 applies.
(3) Increase in Other liabilities relates to the increase in current year taxation due to changes in the Tax Act section 11(jA).
Impact on the statement of changes in equity as at 1 March 2018
The below table summarises the IFRS 9 transition impact on the group’s statement of changes in equity as at 1 March 2018.
Condensed statement of changes in equity
R’000
Group IAS 39 at
28 February2018
IFRS 9 ECL
Group IFRS 9
at 1 March 2018
Ordinary share capital and share premium 5 649 020 – 5 649 020
Preference share capital and premium 112 803 – 112 803
Retained earnings 13 153 434 (648 039) 12 505 395
Foreign currency translation reserve 3 158 – 3 158
Cash flow hedge reserve (26 737) – (26 737)
Total equity 18 891 678 (648 039) 18 243 639

180 | Capitec Bank Holdings Limited
Key performance indicators
Leadership reviews
The Capitec Way
Our business context
Our strategic goals and insights
Leadership teams and governance oversight
2. Accounting policies (continued)2.19 Effective standards, interpretations and amendments to published standards applied for the first time during
the current financial year (continued)
2.19.1 IFRS 9 Financial Instruments and amendments to IFRS 9 (effective 1 March 2018) (continued)
Impact of IFRS 9 and amendments to IFRS 9 on loans and advances as at 1 March 2018
IAS 39 versus IFRS 9
IAS 39 Up-to-date
Re-scheduled
from up-to-date
not re-habilitated
Re-scheduled
from arrears not re-
habilitated Arrears
Expected recoveries receivable(4) Total
Gross loans and advances 41 673 695 1 085 352 1 277 234 2 699 936 906 273 47 642 490
Cumulative provision (3 234 766) (188 907) (649 648) (1 754 774) – (5 828 095)
Net loans and advances 38 438 929 896 445 627 586 945 162 906 273 41 814 395
Provision % 7.8 17.4 50.9(5) 65.0 – 12.2
Stage 1 Stage 2 Stage 3
IFRS 9 Up-to-date
Up-to-dateloans andadvanceswith SICR
and applied for
debt review>6 months
Up to1 month
in arrears
Re-scheduled
from up-to-date
not re-habilitated
Re-scheduled
from arrears not re-
habilitated
More than1 month in
arrears(3),legal
statuses,and
applied for debt
review <6 months
Expectedrecoveriesreceivable(4) Total
Gross loans and advances 37 164 807 4 401 434 1 002 862 1 085 352 1 277 234 1 804 528 906 273 47 642 490
Cumulative provision (2 674 424) (1 032 799) (558 281) (462 365) (609 432) (1 377 463) – (6 714 764)
Net loans and advances 34 490 383 3 368 635 444 581 622 987 667 802 427 065 906 273 40 927 726
Provision % 7.2(1) 23.5(2) 55.7 42.6(2) 47.7(5) 76.3 – 14.1
(1) The provision percentage for up-to-date under IFRS 9 reduces to 7.2% from 7.8% under IAS 39 even though a 12 month ECL is applied versus a 3 month emergence period methodology. The main reason is due to up-to-date loans with SICR transferring to stage 2, where a lifetime ECL is applied under IFRS 9 compared to a 3 month emergence period provision under IAS 39.
(2) The increase in the ECL under IFRS 9 for this category of loans and advances relates to the change from a 3 month emergence period to a lifetime ECL.
(3) This includes loans that are currently up to 1 month in arrears that were previously rescheduled but have not rehabilitated.(4) Shown net of provisions.(5) Although the ECL model predicts a lower default rate on rescheduled clients, the provision is maintained at the same rate when the client was in
arrears, until the rescheduled client starts performing in terms of the rescheduled arrangement.
Taxation impact
The adoption of IFRS 9 results in a tax credit to the group’s reserves on the DIA based on the statutory tax rate of 28%.
The amended tax legislation in section 11(jA) of the Income Tax Act, which is effective from when IFRS 9 applies, allows for a 25% doubtful debt allowance relating to the impairment (stage 1). The allowance is increased to 40% where the impairment is measured at an amount equal to the lifetime ECL (i.e. stage 2), and to 85% where the impairment is on a lifetime ECL and the loan meets the definition of “default” in terms of Regulation 67 of section 90 of the Banks Act (stage 3).
Effectively, from our 2019 tax year of assessment, we will claim 25% allowance on stage 1, 40% on stage 2 and 85% allowance on loans classified as stage 3.
The increase in the impairment provisions in terms of IFRS 9, together with the proposed change in the tax treatment, results in an increase in deferred tax asset of R770 million. In addition, the liability for current tax was increased by R518 million to take into account the increase in tax payable due to the changes in the amended tax legislation. At 1 March 2018, the group’s current income tax asset of R107 million was set off against the current tax liability of R518 million, resulting in a net liability for current tax of R411 million.

Integrated Annual Report 2019 | 181
Risk management report
Remuneration report
Social responsibility
About this report
Appendices Annual financial statements
The application of IFRS 9 compared to previous IAS 39 on the loan life cycle is illustrated below:
IAS 39Up-to-date loans IAS 39 Arrears IAS 39
Write-off
IAS 39 Expected recoveries receivable
IAS 39 Off-balance sheet undrawn commitments
IFRS 9Stage 2
IFRS 9Stage 3
IFRS 9Write-off
IFRS 9Stage 1
12 month ECL provision on up-to-date loans and advances without
SICR(1)(2)
Rehabilitated– rescheduled
from up-to-date(1)
– rescheduled from arrears(1)
12 month ECL provision provided
for potential of further drawdown on
credit cards
No post write-off receivable raised as loans and advances
are only written off once there is no reasonable expectation of
recovery
Residual balance at DIA retained
Forward-looking macro-economic elements taken into account in the economic
model
Occurs only when there is no reasonable expectation of
recovery
Lifetime ECL on up-to-date
loans and advances
with SICR(1)(2)
Lifetime ECL provision for
loans and advances
which are up to 1 month in arrears
Lifetime ECL provision for
loans and advances who have applied
for debt review >6 months
and are performing(1)
Lifetime ECL provision for
loans and advances which are more than
1 month in arrears
Business efficiencies determine
fixed point in time where a non-paying client would
automatically be handed over
Lifetime ECL provision for – loans and
advances that applied for debt review
– under debt review
– handed over/other legal status
Lifetime ECL provision for
loans and advances which are:
– rescheduled from up-to-date not rehabilitated – rescheduled from arrears
not rehabilitated
Forward-looking macro-economic elements taken into account in the economic model
(1) Where behavioural scores are within stage 1, otherwise categorised as stage 2(2) Significant increase in credit risk
Three month emergence period provision on up-to-date and all
rescheduled not rehabilitated loans and advances
Lifetime provision on 1 to 3 months in arrears loans and advances
Written off More than 3 months in arrears loans and advances
written off
Receivable raised for recoverable portion of loans and advances that were written off
Probability of further drawdown
on credit card
Expected recoveries receivable
Legal status Write-offArrearsOff-balance
sheet undrawn commitments
Up-to-date loans
Forward-looking macro-economic elements taken into account where an impairment event had been incurred but not yet
reported
Loans and advances life cycle – IAS 39
Loans and advances life cycle – IFRS 9

182 | Capitec Bank Holdings Limited
Key performance indicators
Leadership reviews
The Capitec Way
Our business context
Our strategic goals and insights
Leadership teams and governance oversight
2. Accounting policies (continued)
2.19 Effective standards, interpretations and amendments to published standards applied for the first time during the current financial year (continued)
2.19.1 IFRS 9 Financial Instruments and amendments to IFRS 9 (effective 1 March 2018) (continued)
The diagram below depicts the SICR decision tree applied to loans and advances:
Write-off
Write-off
Yes
Yes
Yes
No
No
No
Stage 2
Stage 3
Stage 3
Stage 1
No
No
Stage 1General provisions(1)
25% tax allowance(2)
Change in credit risk
Stage 2 General provisions(1)
40% tax allowance(2)
Stage 3Specific provisions(1)
85% tax allowance(2)
12 month impairment provisions Lifetime impairment provisions
The following decision tree is performed to determine in which stage the loans and advances should be:
Is the loan in legal status, i.e. in debt
review, or has been handed over?(3)
1
Yes
Yes
No
Is the loan up-to-date, but rescheduled? 3
Yes
Have six consecutive payments been made on the rescheduled loan? No, the loan is not rehabilitated.
Yes, the loan is rehabilitated.
Is the loan up-to-date, but the loan indicates a significant increase in credit risk due to:1. unemployment;2. a granting score that is above the granting threshold;3. a behaviour score that is above the behavioural threshold; or4. term loan is up-to-date but the client’s credit card is in arrears.
Is the loan up-to-date?
Yes
2
• Up-to-date loans with SICR
• Loans up to 1 month in arrears
• Application for debt review >6 months
• Up-to-date loans and advance
• Rescheduled from arrears and rehabilitated
• Rescheduled from up-to-date and rehabilitated
• More than 1 month in arrears • Up-to-date loans rescheduled from arrears and not rehabilitated • Up-to-date loans rescheduled from up-to-date and not rehabilitated • Application for debt review • Under debt review, handed over or other legal status • Residual post-write-off recoverable loans and advances from IAS 39
(expected recoveries receivable)
Up to 1 month in arrears
(1) As per SARB directive D5/2017.(2) As per section 11(jA) of the Income Tax Act of 1962.(3) Refer to note 2.5.1.3.
Stage 2
More than 1 month in arrears Stage 3
Stage 3
4 consecutive missed payments and termination of debt review.
• Handover score less than the predetermined threshold; or
• Handover score more than the predetermined threshold with 4 consecutive missed payments.
Under debt review
Handed over

Integrated Annual Report 2019 | 183
Risk management report
Remuneration report
Social responsibility
About this report
Appendices Annual financial statements
The following is a high-level overview of the changes of total impairment loss provisions under IAS 39 to those under IFRS 9, showing the key factors driving the increase in the impairment loss provision.
Loans and advances status as reported in the 2018 financial statements
Treatment under IAS 39
Treatment under IFRS 9
Up-to-date loans and advances, rehabilitated rescheduled loans
The group applied an incurred but not yet reported (IBNR) emergence period of three months for all up-to-date loans.
IFRS 9 requires a minimum 12 month ECL for loans and advances for which there has not been a SICR.
SICR is identified for loans and advances that are up-to-date, but have reached certain behaviour risk thresholds or specific events have occurred that raise a SICR flag in the model, extending to a lifetime ECL.
Rescheduled from up-to-date and arrears not rehabilitated
The group applied an IBNR emergence period of three months for all non-rehabilitated rescheduled loans.
The difference in the arrears provision and the rescheduling provision was released over a period of 12 months.
Loans and advances rescheduled from up-to-date and arrears not rehabilitated have a lifetime ECL under stage 3.
Rescheduled from up-to-date:Loans rescheduled from up-to-date are considered to be stage 1 once these loans have rehabilitated, unless their behaviour score is seen as a SICR, in which case the loan will be in stage 2.
Rescheduled from arrears:Loans rescheduled from arrears are considered to be stage 1 once these loans have rehabilitated, unless their behaviour scores are seen as a SICR, where the client will remain in stage 2.
Arrears The group applied a lifetime impairment provision for arrears as one payment missed was defined as a loss event under IAS 39.
The expected lifetime of the loans and advances were calculated with reference to the group’s policy to write-off loans at the earliest of when loans and advances were more than 3 months in arrears or legal status has occurred.
Loans that are up to one month in arrears are seen as stage 2 and have a lifetime ECL.
Loans that are more than one month in arrears are seen as stage 3, being credit impaired and have a lifetime ECL applied.
The expected lifetime of loans and advances are now calculated with reference to the group’s updated write-off policy under IFRS 9.
Expected recovery receivable A receivable was raised by the group for the present value of future expected cash flows arising from the recoverable portion of loans written off.
No receivable is recognised for expected cash flows arising from the recoverable portion of loans written off, due to the change in definition of write-off under IFRS 9.
The balance at DIA remained in loans and advances and a lifetime ECL was applied. Cash collected relating to this balance will be used to settle the balance. The receivable was recovered in the current year. Any additional cash will be disclosed as a bad debt recovered.
Write-off Loans and advances at the earliest of more than 3 months in arrears or that had a legal status were fully derecognised. An expected recovery receivable was raised at the write-off point.
Loans and advances are only written off when there is no reasonable expectation of recovery. Loans previously written off are not written back. No expected recovery receivable is raised after write-off.
The period to write-off is therefore significantly longer under IFRS 9.
Forward-looking macro-economic assumptions
The group already took forward-looking information into account on the up-to-date loans and advances, where an impairment event had been incurred but not yet reported.
IFRS 9 requires that forward-looking macro-economic assumptions be applied to both the 12 month and lifetime ECL calculation.

184 | Capitec Bank Holdings Limited
Key performance indicators
Leadership reviews
The Capitec Way
Our business context
Our strategic goals and insights
Leadership teams and governance oversight
2. Accounting policies (continued)
2.19 Effective standards, interpretations and amendments to published standards applied for the first time during the current financial year (continued)
2.19.2 IFRS 15 Revenue from Contracts with Customers (effective 1 March 2018)
IFRS 15 Revenue from Contracts with Customers was adopted on 1 March 2018. The accounting policy was updated to reflect the terminology in the new standard but it had no impact on the financial information reported in the current or comparative period.
Capitec assessed revenue recognised from contracts with customers by nature, amount, timing and uncertainty of revenue and cash flows that are affected by economic factors. Based on this assessment, revenue is appropriately dis-aggregated for loan fee income, transaction fee income and funeral income.
Interest income and expenses continue to be recognised using the effective interest rate method for financial instruments measured at amortised cost in terms of IFRS 9.
2.19.3 Other
• Amendments to IFRS 2 Share-based Payments (effective 1 March 2018)
• Annual improvements to IFRS’s 2014 – 2016 cycle (1 March 2018)
• IFRIC 22 Foreign Currency Transactions and Advance Consideration
These amendments have no impact on measurements of assets and liabilities at the previous year-end. Comparatives are provided for new disclosures where required by the standards.
2.20 Standards, interpretations and amendments to published standards that are not yet effective
Certain effective new standards, amendments and interpretations to existing standards have been published that are mandatory for the group’s accounting periods beginning on or after 1 March 2019 or later periods but which the group has not early adopted, as follows:
Title Impact
IFRS 16 Leases (effective 1 March 2019) High
The group will apply IFRS 16 using the modified retrospective approach and therefore the comparative information for the financial year ending 28 February 2020 will not be restated and will continue to be reported under IAS 17 and IFRIC 4.
IFRS 16 introduces a single lessee accounting model and requires a lessee to recognise right-of-use assets and liabilities for all leases with a term of more than 12 months, unless the underlying asset is of low value. As a consequence, a lessee recognises depreciation of the right-of-use asset and interest on the lease liability, and also classifies cash repayments of the lease liability into a principal portion and an interest portion and presents them in the statement of cash flows.
The group has assessed the requirements of IFRS 16 and considers the impact to be high given the changes in the composition of the statement of financial position and the income statement.
The group will recognise lease liabilities estimated at R2.6 billion in relation to leases that were previously classified as operating leases under IAS 17. The associated right-of-use asset will be approximately R2.5 billion. The estimates include the determination of lease extensions based on hindsight.
IFRS 17 Insurance Contracts (effective 1 March 2021)
Low
The group has not yet assessed the impact IFRS 17 will have on the insurance liabilities contained within the net insurance receivable presented on the face of the statement of financial position.
Amendment to IAS 1 Presentation of Financial Statements and IAS 8 Accounting Policies, Changes in Accounting Estimates and Errors
No impact
Amendment to IFRS 3 Business combinations No impact
Amendments to IAS 28 Investment in Associates and Joint Ventures
No impact

Integrated Annual Report 2019 | 185
Risk management report
Remuneration report
Social responsibility
About this report
Appendices Annual financial statements
3. Critical accounting estimates and judgements in applying accounting policiesThe preparation of financial statements for the group requires management to make estimates that affect the reported amounts in the financial statements and accompanying notes. Management applies their knowledge of current events and actions that may be undertaken in the future but actual results may ultimately differ from estimates. The following represents the most material estimates and judgements applied in preparing these financial statements. They relate to the determination of the Expected Credit Loss (ECL) on loans and advances and are discussed below.
3.1 Judgements
3.1.1 Significant increases in credit risk (SICR)
In terms of IFRS9, all loans and advances are assessed at each reporting date to determine whether there has been a significant increase in credit risk (SICR). In cases where SICR has occurred an impairment equal to the lifetime expected credit loss (ECL) is recognised. If, at reporting date the ECL has not increased the group recognises a 12 month ECL. The group identifies SICR on clients that are up-to-date on their loans but who have been subject to SICR events.
The group considers the following to be SICR events:
• Shifts in behaviour score beyond certain thresholds. A behaviour score is utilised in the ECL model to provide a measure of a client’s propensity to default in the next 12 months. The score was built on a client level, using Capitec’s loan and savings account information, as well as credit exposure and payment behaviour at external credit providers. The score is updated monthly on all existing loan clients to ensure a consistent view of the client. The score also separately considers the performance of rescheduled accounts, which are assumed to have rehabilitated if they have made contractual payments for 6 months and are up to date with their amended contractual obligations.
• A granting score that is below the threshold set by the group. The updated granting score in the ECL model aims to provide an assessment of SICR on a collective basis for groups of exposure that share similar credit characteristics, such as same employer group, in order to account for forward-looking information that may not be identified at an individual loan level.
• Clients that have been reported as unemployed, impacting on granting scores.
• Term loans that are up-to-date while the client’s credit card is in arrears, impacting on behaviour scores.
In addition, a lifetime ECL is recognised on all loans that reflect arrears.
Impact of SICR on ECL Positive Base Negative
Shifting of the SICR threshold by 5%* R’m 633 730 852
Percentage change on total SICR ECL % 13.2 0.0 16.7
* Reflects the full stage 2 ECL if the deterioration or improvement in the factor used, as a behavioural or granting scores threshold, is stressed by 5%.
3.1.2 Loan write-offs
Loans are written off when there is no reasonable expectation of further recovery. Refer to note 2.1.5.3.

186 | Capitec Bank Holdings Limited
Key performance indicators
Leadership reviews
The Capitec Way
Our business context
Our strategic goals and insights
Leadership teams and governance oversight
3. Critical accounting estimates and judgements in applying accounting policies (continued)3.2 Estimates
3.2.1 Forward-looking information
It is a fundamental principle of IFRS9 that the ECL impairment provision that the group holds against potential future losses should take into account changes in the economic environment in the future.
To capture the effects of changes to the economic environment the group utilises the Bureau of Economic Research (BER) macro-economic outlook for the country over a planning horizon of at least 3 years. The outlook is provided to the asset and liability committee (ALCO) for review and approval.
Three economic scenarios (negative, baseline and positive scenario) are taken into account when calculating future expected credit losses. The probability of each scenario is determined by management estimation.
The relevance to Capitec’s book is proven by a historic linear relationship between a change in a basket of macro-economic variables, mainly comprising changes in unemployment and real wage rates. The three scenarios project the future change in the basket, which is translated into an expected change in bad debt. Management has assigned a probability of 60% to the baseline scenario, 35% to the negative scenario and 5% to the positive scenario for the 12 month forecast.
Impact of forward looking information on ECL R’m% change
in ECL
Probability weighted impact of all 3 scenarios 361
100% negative scenario 480 33%
100% baseline scenario 390 8%
100% positive scenario 294 (19%)
3.2.2 Event driven management credit estimates
Certain events/risks arise from time to time that may not be incorporated into the statistical forward looking model. In such instances, the additional inclusions into the ECL are reviewed and approved by the credit committee (CC) on a monthly basis.
These events, for which an amount was included in ECL, include the introduction of DebiCheck from October 2019. DebiCheck will have an impact on the collection of cash flows on loans and advances with clients who move their bank accounts, change debit order dates or where changes in the rescheduled contractual cash flows are greater than 1.5 times the original debit order. If the client fails to electronically confirm the updated debit order, the group could fail to collect the agreed upon instalment from the client on the agreed upon loan date.
Also included is management’s estimate relating to certain specific economic events such as the impact of load-shedding and mining strikes on employer groups as well as adjustments of the impact of new entrants on projected loan recoveries.
3.2.3 Modelling assumptions
Historical data may not always be reflective of the future. The way in which it is used by statistical ECL models (PD, EAD, LGD) to estimate the timing and amount of the forecasted cash flows based on historical default data, roll rates and recoveries, requires consideration of sub-segments. These include aspects such as client risk groups, time on book, product term, payment frequency, default statuses, employment, industry and rescheduling status and the behaviour score of the client.

Integrated Annual Report 2019 | 187
Risk management report
Remuneration report
Social responsibility
About this report
Appendices Annual financial statements
GROUP COMPANY
R’000 2019 2018 2019 2018
4. Cash, cash equivalents and money market fundsCash on hand 3 601 994 3 472 067 – –
Bank balances 13 236 342 15 693 569 12 220 2 793
Resale agreements: Corporate 506 222 403 672 – –
Resale agreements: Banks 10 605 141 4 363 010 – –
Central bank balances
Mandatory reserve deposits with central bank 1 163 650 1 137 659 – –
Cash and cash equivalents 29 113 349 25 069 977 12 220 2 793
Non-cash adjustment: ECL (4 315) – – –
Money market unit trusts 35 496 20 751 – –
Total cash, cash equivalents and money market funds 29 144 530 25 090 728 12 220 2 793
Maximum exposure to credit risk 29 144 530 25 090 728 12 220 2 793
Current 29 144 530 25 090 728 12 220 2 793
Stage 1 with no movement between stages12-month ECL of R4.3 million (1 March 2018: R2.7 million)
Cash, cash equivalents and money markets are classified as financial assets measured at amortised cost.
5. Financial investments (Held-to-maturity investments)*Interest-bearing instruments(1)
Balance at the beginning of the year 11 780 934 5 326 724 – –
Additions 12 611 392 12 904 350 – –
Interest accrued(2) 891 332 603 278 – –
Expected credit loss (ECL) (8 663) – – –
Maturities – capital (13 655 132) (6 650 176) – –
Maturities – interest accrued(2) (887 469) (403 242) – –
Total investments at amortised cost 10 732 394 11 780 934 – –
Maximum exposure to credit risk 10 732 394 11 780 934 – –
Current 10 732 394 11 780 934 – –
Stage 1 with no movement between stages12-month ECL of R8.7 million (1 March 2018: R9.5 million)
* Financial investments were classified as held to maturity measured at amortised cost in 2018. Under IFRS 9, these financial instruments met the criteria to be classified as financial assets measured at amortised cost.
(1) Interest-bearing instruments are unlisted instruments with a maturity greater than three months from date of acquisition. This figure comprises South African National Treasury bills. These factors were considered when determining the ECL.
(2) Comparatives previously included both interest and capital within additions and maturities respectively. The current year figures show both interest and capital separately, the prior year was amended to reflect this more granular disclosure.

188 | Capitec Bank Holdings Limited
Key performance indicators
Leadership reviews
The Capitec Way
Our business context
Our strategic goals and insights
Leadership teams and governance oversight
GROUP COMPANY
R’000 2019 2018 2019 2018
6. Term deposit investments Term deposit investments
Balance at the beginning of the year 2 528 331 6 600 749 – –
Additions 10 557 000 3 153 000 – –
Interest accrued(3) 442 787 474 765 – –
Expected credit loss (ECL) (2 888) – – –
Maturities – capital (3 947 000) (7 159 000) – –
Maturities – interest accrued(3) (246 933) (541 183) – –
Total term deposit investments(1)(2) 9 331 297 2 528 331 – –
Maximum exposure to credit risk 9 331 297 2 528 331 – –
Current 9 331 297 2 528 331 – –
Stage 1 with no movement between stages12-month ECL of R2.9 million (1 March 2018: R0.7 million). Term deposits are classified at amortised cost.
(1) All balances are due by banks and have original maturity dates of more than three months but contractually less than one year. Investments comprise term-to-notice and fixed term instruments. (Refer to note 29.1 Credit Risk Ratings for ratings). These factors were taken into account when determining the ECL.
(2) R3.09 billion of the balance serves as security for the guarantee to acquire Mercantile Bank. Refer to note 43. (3) Comparatives previously included both interest and capital within additions and maturities respectively. The current year figures show both
interest and capital separately, the prior year was amended to reflect this more granular disclosure.
GROUP COMPANY
R’000 2019 2018 2019 2018
7. Net loans and advancesMaturity analysis
Current (less than 1 year) 20 885 166 16 718 014 – –
Demand to 1 month 4 047 202 2 132 062 – –
1 to 3 months 3 351 444 2 870 556 – –
3 months to 1 year 13 486 520 11 715 396 – –
Non-current (more than 1 year) 34 602 721 31 601 961 – –
1 to 2 years 14 797 886 13 484 033 – –
2 to 5 years 19 317 510 17 645 690 – –
More than 5 years 487 325 472 238 – –
Total 55 487 887 48 319 975 – –
Loan origination fees (608 742) (677 485) – –
Gross loans and advances 54 879 145 47 642 490 – –
Term loans and credit facility 51 250 898 45 628 376 – –
Credit card 3 628 247 2 014 114 – –
Provision for credit impairments (ECL) (10 364 461) (5 828 095) – –
Net loans and advances(1) 44 514 684 41 814 395 – –
Current 16 754 947 14 467 177 – –
Non-current 27 759 737 27 347 218 – –
Maximum exposure to credit risk
Net loans and advances 55 487 887 48 319 975 – –
Retail loan commitments(2) 911 740 796 274 – –
Maximum exposure to credit risk 56 399 627 49 116 249 – –
(1) The group currently does not hold any loans and advances that are past due but not impaired.(2) There are irrevocable commitments totalling R911.7 million (2018: R796.3 million) relating to 64% (2018: 48%) of products that may be drawn
down without any credit intervention from Capitec within 1 month. Loan commitments are stage 1 with no movement between stages.

Integrated Annual Report 2019 | 189
Risk management report
Remuneration report
Social responsibility
About this report
Appendices Annual financial statements
The following terminology is used by the group when discussing the credit quality of loans and advances to clients:
Loans status 2019 – Description (IFRS 9)2018 – Description (IAS 39)
Up-to-date Clients that are fully up to date with their original contractual obligations or amended contractual obligations and rehabilitated post rescheduling, are classified as up-to-date.
Same description applied as detailed under 2019
Arrears Arrears reflect the outstanding balances, where 1 or more instalments (or part of an instalment on any of the client’s loans and advances) remain unpaid after the contractual payment date, that is 1 day past the contractual payment date. The arrears balance therefore includes rescheduled loans when the amended instalment was not paid in full.
Same description applied as detailed under 2019
Rescheduling Rescheduling refers to an amendment of the original terms of the loan contract, as formally agreed between the group and the client. Rescheduling is used as a rehabilitation mechanism for clients in arrears who are contacted successfully by centralised collections. It is also used as a proactive mechanism to assist up-to-date clients who contact the group when wanting to reschedule their loans due to changes in their circumstances. No initiation fee is charged on a rescheduled loan as no new credit is granted. Rescheduled loans do not form part of loan sales.
Same description applied as detailed under 2019
Rehabilitated Clients with rescheduled loans are deemed to be rehabilitated once they have made contractual payments for 6 months post rescheduling and are up-to-date with their amended contractual obligations. This is supported by statistical analysis.
Same description applied as detailed under 2019
Rescheduled from up-to-date not rehabilitated
These are loans and advances relating to clients that were fully up to date with their original contractual obligations, have contacted the group to reschedule the original terms of their loan due to a change in their circumstances and have made payment under the rescheduled terms. These loans are up-to-date with their amended contractual obligations post rescheduling but have not yet made payments for 6 consecutive months under the amended contract.
Same description applied as detailed under 2019
Rescheduled from arrears not rehabilitated
These are loans and advances relating to clients that were in arrears and were subsequently rescheduled and have made payment under the rescheduled terms. These clients are up-to-date with their amended contractual obligations but have not yet made payments for six consecutive months under the amended contract.
Same description applied as detailed under 2019
Application for debt review Clients that apply for debt review are identified as credit impaired, and the related loan classified as stage 3 for the first 6 months following application.
Clients that applied for debt review more than 6 months ago that are up-to-date are identified as SICR and the related loan classified as stage 2 between 6 to 12 months following application.
Clients that applied for debt review more than 12 months ago and remained up-to-date; the related loan is classified as stage 1 subject to the SICR assessment.
Clients that applied for debt review were impaired taking into account the historical roll rates for this segment of clients
Expected recoveries receivable
The expected recoveries receivable that existed at transition date was disclosed as stage 3.
The net present value of expected future recoveries on loans written off.
Stage 1 These are loans and advances which are up-to-date with no indication of SICR as well as loans that have been rescheduled from up-to-date or arrears and have been rehabilitated.
Stage 2 These are loans and advances that have raised a SICR flag due to:• Unemployment• Behaviour score below the threshold• Granting score below the threshold• A client that has a term loan that is up-to-date but has a credit card in arrears
Stage 2 also includes loans that are up to 1 month in arrears, as well as loans that applied for debt review more than 6 months ago, but who are performing.

190 | Capitec Bank Holdings Limited
Key performance indicators
Leadership reviews
The Capitec Way
Our business context
Our strategic goals and insights
Leadership teams and governance oversight
7. Net loans and advances (continued)
Stage 3 These are loans and advances that are more than 1 month in arrears or:• have been rescheduled but not yet rehabilitated;• where the client applied for debt review less than 6 months ago;• is currently under debt review; or• has another legal status (amongst others, under administration).
Write-off Loans are written off when there is no reasonable expectation of further recovery.
The group considers this point to be when the loan has a present value of future recovery of approximately 5%. This is currently estimated based on account status, behavioural score and consecutive missed payments. This current estimate, applied from 1 March 2018, provides a simpler and more reliable method to that intended to be applied at transition, that considered partial write-offs and time since last payment. Refer to note 2.5.1.3.
The earlier of loan balances that have a legal status, e.g. debt review or deceased, handed over or are 3 months or more in arrears, are subsequently written off.
Credit risk exposure
The following tables contain an analysis of the credit risk exposure of financial instruments for which an ECL allowance is recognised. The gross carrying amount of financial assets below also represents the Group’s maximum exposure to credit risk on these assets.
Analysis of net loans and advances by status – 28 February 2019
Stage 1 Stage 2 Stage 3
R’00012 month
ECL Lifetime ECL Lifetime ECL
Up-to-date
Up-to-date loans
with SICR and
applied for debt
review>6 months
Up to 1 month
in arrears
2 and 3 months in
arrears
Re-scheduled
from up-to-date (not yet rehabilitated)
Re-scheduled
from arrears (not yet
rehabilitated)
More than 3 months in arrears,
legal statuses
and applied for debt
review<6 months
Expected recoveries receivable Total
Gross loans and advances 41 587 493 3 764 623 1 086 541 1 388 736 856 394 1 271 887 4 923 471 – 54 879 145
Credit impairment (ECL) (2 671 379) (770 597) (581 911) (1 097 400) (344 826) (534 249) (4 364 099) – (10 364 461)
38 916 114 2 994 026 504 630 291 336 511 568 737 638 559 372 – 44 514 684
ECL coverage (%) 6.4 20.5 53.5 79.0 40.3 42.0 88.6 18.9
The credit quality of Stage 1 loans is detailed on the pages that follow for this note. The internal credit rating risk buckets used to explain this of low risk, medium risk and high risk are subjectively determined by bucketing accounts by behavioural scores. New loans may be granted to certain high-risk clients, depending on the credit-granting strategy and granting scorecards. The credit quality of Stage 2 loans is reflected in the differentiation of exposure buckets between “Up to 1 month in arrears” and “Up-to-date loans with SICR and applied for debt review more than 6 months ago”. The increased ECL coverage ratio detailed above reflects the financial impact of the increased risk. The internal credit rating for the former bucket is high risk due to arrears. For the latter bucket, the internal credit rating is reflected as R1.2 billion low risk, R1.3 billion medium risk and R1.3 billion as high risk. The increased risk resulting from SICR events is detailed in note 3.1.1.

Integrated Annual Report 2019 | 191
Risk management report
Remuneration report
Social responsibility
About this report
Appendices Annual financial statements
Analysis of net loans and advances by status – 1 March 2018
Stage 1 Stage 2 Stage 3
R’000 Up-to-date
Up-to-dateloans andadvanceswith SICR
and applied for
debt review> 6 months
Up to1 month
in arrears
Re-scheduled
from up-to-date
not re-habilitated
Re-scheduled
from arrears not re-
habilitated
More than1 month in
arrears,legal
statuses,and
applied for debt
review < 6 months
Expectedrecoveriesreceivable Total
Gross loans and advances 37 164 807 4 401 434 1 002 862 1 085 352 1 277 234 1 804 528 906 273 47 642 490
Cumulative provision (2 674 424) (1 032 799) (558 281) (462 365) (609 432) (1 377 463) – (6 714 764)
Net loans and advances 34 490 383 3 368 635 444 581 622 987 667 802 427 065 906 273 40 927 726
Provision % 7.2 23.5 55.7 42.6 47.7 76.3 14.1
Analysis of net loans and advances by status – 28 February 2018
Performing bookNon-performing
book
R’000 Up-to-date
Rescheduledfrom up-to-datenot rehabilitated Subtotal
Rescheduledfrom arrears not
rehabilitated Subtotal Arrears
Expectedrecoveriesreceivable Total
Gross loans and advances 41 673 695 1 085 352 42 759 047 1 277 234 44 036 281 2 699 936 906 273 47 642 490
Credit impairment (3 234 766) (188 907) (3 423 673) (649 648) (4 073 321) (1 754 774) – (5 828 095)
38 438 929 896 445 39 335 374 627 586 39 962 960 945 162 906 273 41 814 395
Provision % 7.8 17.4 8.0 50.9 9.2 65.0 12.2

192 | Capitec Bank Holdings Limited
Key performance indicators
Leadership reviews
The Capitec Way
Our business context
Our strategic goals and insights
Leadership teams and governance oversight
7. Net loans and advances (continued)
Analysis of gross loans and advances
R’000 Stage 1 Stage 2 Stage 3Expected
recoveries Total
Balance at 1 March 2018 37 164 807 5 404 296 4 167 114 906 273 47 642 490
Net loan sales(1) 32 394 884 (1 020 656) (405 881) – 30 968 347
New loan sales(1) 43 711 610 – – – 43 711 610
Loans derecognised (other than write-off)(1) (11 316 726) (1 020 656) (405 881) – (12 743 263)
Income accrued for the year* 13 777 786 1 118 324 740 927 – 15 637 037
Transfers
Stage 1 to Stage 2 (5 278 256) 5 278 256 – – –
Stage 1 to Stage 3 (6 799 033) – 6 799 033 – –
Stage 2 to Stage 3 – (1 746 142) 1 746 142 – –
Stage 3 to Stage 2 – 327 089 (327 089) – –
Stage 3 to Stage 1 785 419 – (785 419) – –
Stage 2 to Stage 1 1 855 634 (1 855 634) – – –
Repayments (32 313 391) (2 654 190) (2 226 618) (906 273) (38 100 472)
Write-offs (357) (179) (1 267 721) – (1 268 257)
Balance at 28 February 2019 41 587 493 4 851 164 8 440 488 – 54 879 145
* The income accrued for the year comprises interest received on loans, initiation fees, monthly service fees and gross insurance income.(1) New loan sales includes new loans issued on consolidating loans. The loans settled are disclosed separately.
Modifications on loans and advances – 28 February 2019
R’000
Amortisedcost before
modification
Net modification
loss
Debt review 1 797 483 668 263
1 797 483 668 263
Credit quality of gross loans and advances shown in up to date
R’0002019
Stage 12018
IAS 39
Up-to-date(1) 38 934 944 39 452 802
Up-to-date – rescheduled from up-to-date(2) 1 897 304 1 228 460
Up-to-date – rescheduled from arrears(2) 755 245 992 433
41 587 493 41 673 695
(1) Based on internal credit ratings, the up-to-date book of R38.9 billion is rated as R25.1 billion low risk, R12.3 billion as medium risk and R1.5 billion as high risk.
(2) The up-to-date – rescheduled from up-to-date and fully rehabilitated book is rated as R1.1 billion low risk and R0.8 billion medium risk. The up-to-date – rescheduled from arrears and fully rehabilitated book is rated as medium risk.
Factors impacting and contributing to significant changes in the ECL during the current period:• Net new loan sales of R31.0 billion contributed to R4.0 billion to the ECL at 28 February 2019.• The stage 1 up-to-date book increased by 12% compared to 1 March 2018 while up-to-date loans with SICR and
applied for debt review between 6 and 12 months ago decreased by 14% from R4.4 billion to R3.8 billion.• Total arrears from 1 to 3 months in stages 2 and 3 decreased to R2.5 billion while the net loans and advances
grew by 9%.• The total up-to-date loans rescheduled from up-to-date and arrears less than 6 months ago (not yet rehabilitated) in
stage 3 decreased by 10%, thereby decreasing the stage 3 ECL.• The factors set out above resulted in more loans in lower risk buckets, reducing ECL coverage by 1%. Overall ECL
coverage, however, increased by 5% compared to 1 March 2018 due to the group implementing a new write-off policy on transition to IFRS 9. Loans are written off when there is no reasonable expectation of recovery. This has resulted in loans remaining on book for a longer period, increasing stage 3 loans by R4.9 billion. These loans have an ECL coverage ratio of 89%.
The impact of forward-looking information on the ECL was R361 million.

Integrated Annual Report 2019 | 193
Risk management report
Remuneration report
Social responsibility
About this report
Appendices Annual financial statements
Stage 1 Stage 2 Stage 3Unidentified impairment
Identified impairment Total
At 1 March 2017 4 011 869 1 918 508 5 930 377
Provision for doubtful debts raised 61 452 (163 734) (102 282)
Balance at 28 February 2018 4 073 321 1 754 774 5 828 095
Change in initial application of IFRS 9 2 674 424 1 591 080 2 449 260 (4 073 321) (1 754 774) 886 669
Restated balance at 1 March 2018 2 674 424 1 591 080 2 449 260 6 714 764
Movement in the income statement
New loan sales 1 643 069 780 057 1 780 375 4 203 502
Transfer from stage 1 to stage 2 (139 488) 349 039 – 209 552
Transfer from stage 1 to stage 3 (360 255) – 2 622 389 2 262 134
Transfer from stage 2 to stage 3 – (493 610) 1 052 741 559 131
Transfer from stage 2 to stage 1 72 252 (388 034) – (315 782)
Transfer from stage 3 to stage 1 41 222 – (302 060) (260 838)
Transfer from stage 3 to stage 2 – 63 399 (143 947) (80 548)
Remain in same stage (507 050) (93 607) 394 511 (206 146)
Loans and advances settled in current year (915 565) (408 951) (346 073) (1 670 589)
Write-offs (26 208) (147 461) (476 342) (650 010)
Stage 3 interest not recognised – – (1 016 166) (1 016 166)
Change in model assumptions and methodology 188 977 100 595 325 885 615 458
Balance at 28 February 2019 2 671 379 1 352 508 6 340 574 10 364 461
GROUP COMPANY
R’000 2019 2018 2019 2018
8. Other receivables Financial receivables 1 418 992 579 424 3 777 5 285
Deposits 33 283 33 398 – –
SARB settlement balance 991 691 211 710 – –
Other receivables 348 265 334 316 3 777 5 285
Funeral income receivable 45 753 – – –
Non-financial receivables 223 534 142 403 132 367
Prepayments(1) 223 534 142 403 132 367
Total other receivables 1 642 526 721 827 3 909 5 652
Current 1 622 169 718 349 3 909 5 652
Non-current 20 357 3 478 – –
Maximum exposure to credit risk 1 642 526 721 827 3 909 5 652
(1) Prepayments refer to monthly rental paid in advance and client cards inventory.

194 | Capitec Bank Holdings Limited
Key performance indicators
Leadership reviews
The Capitec Way
Our business context
Our strategic goals and insights
Leadership teams and governance oversight
GROUP COMPANY
R’000 2019 2018 2019 2018
9. Net insurance receivable(1)
Opening balance 245 204 255 360 – –
Net insurance income(3) 794 977 873 524 – –
Interest on investment 25 275 22 214 – –
Distribution paid to the group (829 065) (905 894) – –
236 391 245 204 – –
Net insurance income
Residual from cell captive business after reinsurance(2) 794 977 873 524 – –
Net insurance income 794 977 873 524 – –
Current 236 391 245 204 – –Non-current – – – –
(1) The amount receivable from the insurer represents the right to the residual interest in the cell captive reduced by distributions declared by the cell captive insurer on the specific class of preference shares held by the group.
(2) The residual from the cell captive business after reinsurance represents net results after premiums received, claims paid and reinsurance paid. (3) Insurance profit is received from the cell captive as a dividend after tax. The tax expense on insurance profit is included in the net insurance
income line for the financial year ended February 2019.
10. Derivative assetsDerivatives(1)(2) 479 129 – –
Current (21) 129 – –Non-current 500 – – –
(1) Refer to notes 41 and 42 for more information on derivatives.(2) The amount represents the maximum exposure to credit risk.
11. Financial assets – equity instruments at FVOCI (Available-for-sale financial assets)*Unlisted securities(1)
Balance at the beginning and end of the year 100 000 100 000 – –
Total financial assets – equity instruments at FVOCI 100 000 100 000 – –
* The investment was classified as available-for-sale in 2018, but upon transition to IFRS 9, the classification was changed to FVOCI with no fair value movements being recycled to the income statement.
(1) Capitec Bank is a participant in a consortium that recapitalised African Bank. The other members of the consortium comprise the Public Investment Corporation and five other South African banks.

Integrated Annual Report 2019 | 195
Risk management report
Remuneration report
Social responsibility
About this report
Appendices Annual financial statements
GROUP COMPANY
R’000 2019 2018 2019 2018
12. Interest in subsidiaries and associatesInterest in subsidiaries
Investment in unlisted subsidiaries at cost(1) – – 5 735 031 5 766 232
Loans from subsidiaries(2) – – (13 461) (14 751)
Total interest in subsidiaries – – 5 721 570 5 751 481
Subsidiaries Domicile Holding Nature of business
Capitec Bank Limited South Africa 100% Banking
Keynes Rational Corporate Services Proprietary Limited South Africa 100% Dormant
Capitec Properties Proprietary Limited South Africa 100% Property
Keymatrix Proprietary Limited South Africa 100% Dormant
Capitec Bank Holdings Share Trust South Africa – Share incentive trust
(1) All holdings are in the ordinary and preference share capital of the subsidiaries. Preference shares were repurchased by the subsidiary during the year.
(2) Repayable on demand, bears interest as agreed from time to time and no fixed repayment terms have been set.
Interest in associates
Creamfinance
Opening balance 109 352 – 103 658 –
Interest acquired 179 415 103 658 179 415 103 658
Share of profit(2) 1 610 2 536 – –
Foreign currency translation reserve 1 461 3 158 – –
Total interest in Creamfinance 291 838 109 352 283 073 103 658
Praelexis
Opening balance 25 000 – 25 000 –
Interest acquired – 25 000 – 25 000
Share of profit 355 – – –
Total interest in Praelexis 25 355 25 000 25 000 25 000
Total interest in associates 317 193 134 352 308 073 128 658
Associates Domicile Holding Nature of business
Cream Finance Holding Ltd(1) Cyprus 40.25% Lending
Praelexis Proprietary Limited South Africa 33.33% Artificial Intelligence
(1) The interest in Cream Finance Holdings Ltd increased from 19.43% to 40.25% during the current financial year.(2) The Share of profit from 1 January 2018 to 31 December 2018 is included.

196 | Capitec Bank Holdings Limited
Key performance indicators
Leadership reviews
The Capitec Way
Our business context
Our strategic goals and insights
Leadership teams and governance oversight
GROUP COMPANY
R’000 2019 2018 2019 2018
12. Interest in subsidiaries and associates (continued)Cream Finance Holding Ltd
Reconciliation to carrying amounts
Non-current assets 170 093 104 886 170 093 104 886
Current assets 937 301 615 250 937 301 615 250
Non-current liabilities (206 247) (317 201) (206 247) (317 201)
Current liabilities (702 348) (295 501) (702 348) (295 501)
Net assets at 100% 198 799 107 434 198 799 107 434
The group’s share of net assets at acquisition 86 713 20 874 86 713 20 874
Difference in initial cost versus our share of net assets acquired 196 360 82 784 196 360 82 784
Cost amount of investment in Creamfinance 283 073 103 658 283 073 103 658
Share of profit and foreign currency translation 8 765 5 694 – –
Carrying amount of investment in Creamfinance 291 838 109 352 283 073 103 658
Praelexis Proprietary Limited
Reconciliation to carrying amounts
Non-current assets 1 251 1 049 1 251 1 049
Current assets 34 849 33 680 34 849 33 680
Non-current liabilities – – – –
Current liabilities (1 051) (604) (1 051) (604)
Net assets at 100% 35 049 34 125 35 049 34 125
The group’s share of net assets at acquisition 11 374 11 374 11 374 11 374
Difference in initial cost versus our share of net assets acquired 13 626 13 626 13 626 13 626
Cost amount of investment in Praelexis 25 000 25 000 25 000 25 000
Share of profit 355 – – –
Carrying amount of investment in Praelexis 25 355 25 000 25 000 25 000

Integrated Annual Report 2019 | 197
Risk management report
Remuneration report
Social responsibility
About this report
Appendices Annual financial statements
GROUP (R’000)
Assets underconstruction –
Buildings Land andbuildings
Computerequipment
Officeequipment
and vehicles Total
13. Property and equipment2019Opening net book value – 145 759 862 741 745 842 1 754 342
Additions* 200 764 – 471 552 238 559 910 875
Disposals – – (10 065) (8 227) (18 292)
Depreciation charge – (573) (213 351) (223 154) (437 078)
Net book value at the end of the year 200 764 145 186 1 110 877 753 020 2 209 847
Cost 200 764 145 992 2 246 374 1 428 703 4 021 833
Accumulated depreciation – (806) (1 135 497) (675 683) (1 811 986)
Net book value at the end of the year 200 764 145 186 1 110 877 753 020 2 209 847
Non-current 200 764 145 186 1 110 877 753 020 2 209 847
2018Opening net book value – 109 622 772 193 641 580 1 523 395
Additions – 57 843 316 931 311 725 686 499
Disposals – (21 024) (3 524) (10 732) (35 280)
Depreciation charge – (682) (222 859) (196 731) (420 272)
Net book value at the end of the year – 145 759 862 741 745 842 1 754 342
Cost – 145 993 1 848 411 1 355 040 3 349 444
Accumulated depreciation – (234) (985 670) (609 198) (1 595 102)
Net book value at the end of the year – 145 759 862 741 745 842 1 754 342
Non-current – 145 759 862 741 745 842 1 754 342
* Assets under construction relate to the construction of our new head office, which commenced during the financial year. Building is expected to be completed during 2020. Refer to note 36 for capital commitments.
GROUP (R’000) Computer
software(1)
Internallygeneratedintangible
assets(2) Total
14. Intangible assets2019Opening net book value 283 011 – 283 011
Additions 213 403 16 724 230 127
Disposals (474) – (474)
Amortisation charge (196 381) – (196 381)
Net book value at the end of the year 299 559 16 724 316 283
Cost 776 204 16 724 792 928
Accumulated amortisation (476 645) – (476 645)
Net book value at the end of the year 299 559 16 724 316 283
2018Opening net book value 279 946 – 279 946
Additions 142 943 – 142 943
Disposals – – –
Amortisation charge (139 878) – (139 878)
Net book value at the end of the year 283 011 – 283 011
Cost 587 935 – 587 935
Accumulated amortisation (304 924) – (304 924)
Net book value at the end of the year 283 011 – 283 011
(1) Computer software comprises primarily of main banking infrastructure applications, which are purchased from our respective vendors.(2) Internally generated intangible assets comprise assets under construction relating to SAP Software, expected to be completed in 2023. Refer to
note 36 for capital commitments.

198 | Capitec Bank Holdings Limited
Key performance indicators
Leadership reviews
The Capitec Way
Our business context
Our strategic goals and insights
Leadership teams and governance oversight
GROUP
R’000
Impairments, provisions
and accrualsShare-based
payments Cash flow
hedge Capital
allowances Prepayments Total
15. Deferred income tax asset
2019
Balance at the beginning of the year 409 083 42 418 10 298 (45 090) (19 882) 396 827
IFRS 9 transitional adjustment 770 490 – – – – 770 490
Income statement charge 395 288 – – (19 317) (4 987) 370 984
Credited directly to equity – 64 447 – – – 64 447
Debited to equity through other comprehensive income – – (6 669) – – (6 669)
Balance at the end of the year(1) 1 574 861 106 865 3 629 (64 407) (24 869) 1 596 079
2018
Balance at the beginning of the year 511 891 – 4 464 (39 494) (16 932) 459 929
Income statement charge (36 603) – – (5 596) (2 950) (45 149)
Debited directly to equity (23 787) – – – – (23 787)
Credited to equity through other comprehensive income – – 5 834 – – 5 834
Balance at the end of the year(1) 451 501 – 10 298 (45 090) (19 882) 396 827
Estimated to be recovered within 1 year –
Estimated to be recovered after 1 year 1 596 079
1 596 079
(1) Deferred income taxes are calculated on all temporary differences under the liability method using an effective tax rate of 28% (2017: 28%). The deferred tax assets are stated at the rate at which the assets are expected to be realised and are fully recoverable.

Integrated Annual Report 2019 | 199
Risk management report
Remuneration report
Social responsibility
About this report
Appendices Annual financial statements
GROUP COMPANY
R’000 2019 2018 2019 2018
16. Retail deposits and wholesale fundingRetail funding
By maturity
Within 1 month 46 470 518 36 050 140 – –
1 to 3 months 2 719 456 2 332 182 – –
3 months to 1 year 10 641 494 9 297 982 – –
1 to 2 years 4 624 199 3 463 227 – –
2 to 5 years 6 909 618 6 680 967 – –
Deposits(1) 71 365 285 57 824 498 – –
Wholesale funding
By maturity
Within 1 month 69 066 93 504 – –
1 to 3 months 303 124 660 627 – –
3 months to 1 year 1 948 044 1 055 117 – –
1 to 2 years 1 559 473 2 196 385 – –
2 to 5 years 1 147 362 2 145 452 – –
More than 5 years 51 259 54 641 – –
Bonds(1) 5 078 328 6 205 726 – –
By nature
Retail funding
Retail call savings 45 140 650 34 908 877 – –
Retail fixed deposits 26 224 635 22 915 621 – –
71 365 285 57 824 498 – –
Wholesale funding(3)
Subordinated debt – unlisted bonds 508 640 552 889 – –
Subordinated debt – listed bonds(2) 1 336 980 1 928 971 – –
Listed senior bonds(2) 2 737 447 2 738 062 – –
Unlisted negotiable instruments 396 490 885 622 – –
Other wholesale funding 98 771 100 182 – –
5 078 328 6 205 726 – –
Total retail deposits and wholesale funding 76 443 613 64 030 224 – –

200 | Capitec Bank Holdings Limited
Key performance indicators
Leadership reviews
The Capitec Way
Our business context
Our strategic goals and insights
Leadership teams and governance oversight
16. Retail deposits and wholesale funding (continued)
DescriptionNominal amount Issue date Term Rate
Subordinated debt analysis
Subordinated debt – unlisted bonds – floating rate R500 million(3) 2012/07/06 7 years 3-month JIBAR plus 4.75%
Subordinated debt – listed bonds – floating rate R400 million(3) 2012/08/23 7 years 3-month JIBAR plus 4.49%
Subordinated debt – listed bonds – fixed rate R350 million 2012/08/23 7 years R204 government bond plus 4.60%
Subordinated debt – listed bonds – floating rate R572 million(3) 2012/12/14 7 years 3-month JIBAR plus 4.49%
Listed senior bonds analysis
Senior debt – listed bonds – fixed rate R450 million 2013/05/06 7 years R208 government bond plus 2.50%
Senior debt – listed bonds – floating rate R500 million(3) 2015/11/02 5 years 3-month JIBAR plus 2.60%
Senior debt – listed bonds – fixed rate R500 million 2016/05/06 5 years R208 government bond plus 2.40%
Senior debt – listed bonds – floating rate R250 million(3) 2016/05/06 3 years 3-month JIBAR plus 2.20%
Senior debt – listed bonds – floating rate R500 million(3) 2017/05/12 3 years 3-month JIBAR plus 2.00%
Senior debt – listed bonds – floating rate R500 million(3) 2018/05/21 3 years 3-month JIBAR plus 1.53%
Unlisted negotiable instruments analysis
Negotiable certificate of deposit – fixed rate R100 million 2016/08/08 3 years 3-year mid swap plus 1.60%
Negotiable certificate of deposit – fixed rate R21 million 2017/02/13 3 years 3-year mid swap plus 1.50%
Negotiable certificate of deposit – fixed rate R6 million 2017/03/09 3 years 3-year mid swap plus 1.70%
Negotiable certificate of deposit – fixed rate R46 million 2017/06/08 5 years 5-year mid swap plus 2.40%
Floating rate note R100 million(3) 2017/11/24 3 years 3-month JIBAR plus 1.60%
Negotiable certificate of deposit – fixed rate R33 million 2018/01/22 5 years 5-year mid swap plus 2.00%
Negotiable certificate of deposit – fixed rate R12 million 2018/03/09 3 years 3-year mid swap plus 1.50%
Negotiable certificate of deposit – fixed rate R22 million 2018/03/09 1 year 1-year mid swap plus 1.00%
Negotiable certificate of deposit – fixed rate R41 million 2018/04/10 5 years 5-year mid swap plus 2.00%
Negotiable certificate of deposit – fixed rate R5 million 2018/04/10 3 years 3-year mid swap plus 1.50%
Negotiable certificate of deposit – fixed rate R4 million 2018/04/10 1 year 1-year mid swap plus 1.00%
Other wholesale funding analysis
Bilateral loan – fixed rate R90 million 2004/01/12 20 years Fixed rate of 11% NACM
(1) All deposits and bonds are unsecured.(2) Comprises notes listed on Capitec Bank’s DMTN programme registered on the JSE’s interest rate board.(3) Wholesale funding issued at variable rates is hedged through interest rate swap agreements as set out in notes 20 and 42. The nominal value
of hedged funding totals R3 322 million and consists of:Subordinated debt – unlisted bonds R500 millionSubordinated debt – listed bonds R972 millionListed senior bonds R1 750 millionUnlisted negotiable instruments R100 million
Reconciliation of movements in cash flows arising from financing activities
Subordinated debt – unlisted
Subordinated debt – listed
Senior listed bonds
Total
Opening balance at 1 March 2018 552 889 1 928 971 2 738 062 5 219 922
Instruments issued – – 500 000 500 000
Instruments redeemed (44 000) (575 000) (500 000) (1 119 000)
Interest expense accrued 62 887 203 531 266 310 532 728
Swap interest accrued (730) (3 368) (13 054) (17 152)
Interest paid (62 406) (217 154) (253 871) (533 431)
Balance at 28 February 2019 508 640 1 336 980 2 737 447 4 583 067
Other funding (Operating activities: unlisted negotiable instruments and other wholesale funding) 495 261
Total wholesale funding 5 078 328

Integrated Annual Report 2019 | 201
Risk management report
Remuneration report
Social responsibility
About this report
Appendices Annual financial statements
GROUP COMPANY
R’000 2019 2018 2019 2018
17. Other liabilities
Trade payables 1 073 792 938 648 443 670
Dividends payable 7 509 8 258 7 509 8 258
Accruals 847 977 766 739 – –
Share appreciation rights (note 40) 273 353 200 276 – –
Total other liabilities 2 202 631 1 913 921 7 952 8 928
Current 1 821 597 1 571 976 7 952 8 928
Non-current 381 034 341 945 – –
18. Provisions
Performance incentive scheme(1)
Balance at the beginning of the year 66 835 81 024 – –
Addition 67 741 46 107 – –
Used during the year (43 571) (60 296) – –
Balance at the end of the year 91 005 66 835 – –
Non-current 91 005 66 835 – –
(1) Senior management qualify for a cash-settled performance bonus scheme. The scheme rewards managers based on the growth in headline earnings per share and, in order to foster a long-term approach by management, the bonus is paid out over a 3-year period. The bonuses that have been earned and that will be paid out in the 2021 and 2022 financial years are included in provisions. The bonus to be paid in the 2020 financial year is included in accruals.

202 | Capitec Bank Holdings Limited
Key performance indicators
Leadership reviews
The Capitec Way
Our business context
Our strategic goals and insights
Leadership teams and governance oversight
GROUP COMPANY
R’000 2019 2018 2019 2018
19. Share capital and premiumAuthorised
Ordinary shares(4)
500 000 000 shares of R0.01 each 5 000 5 000 5 000 5 000
Non-redeemable, non-cumulative, non-participating preference shares
100 000 000 shares of R0.01 each 1 000 1 000 1 000 1 000
Loss absorbent preference shares (conversion)(5)
100 000 000 shares of R0.01 each 1 000 1 000 1 000 1 000
Loss absorbent preference shares (write-off)(5)
100 000 000 shares of R0.01 each 1 000 1 000 1 000 1 000
8 000 8 000 8 000 8 000
Issued(1)
115 626 991 (2018: 115 626 991) shares of R0.01 each at par 1 156 1 156 1 156 1 156
Share premium 5 647 864 5 647 864 5 647 864 5 647 864
Ordinary share capital and premium 5 649 020 5 649 020 5 649 020 5 649 020
904 049 (2018: 1 249 707) shares of R0.01 each at par 9 12 9 12
Share premium 81 594 112 791 81 594 112 791
Non-redeemable, non-cumulative, non-participating preference share capital and premium(2) 81 603 112 803 81 603 112 803
Total issued share capital and premium(2)(3) 5 730 623 5 761 823 5 730 623 5 761 823
(1) All issued ordinary and preference shares are fully paid up. No ordinary shares were cancelled in the current or prior year. 345 658 (2018: 423 137) preference shares with a value of R31.2 million (par and premium) (2018: R38.2 million) were repurchased and cancelled during the year. This was done as they no longer qualified as regulatory capital in terms of the regulations relating to banks.
(2) The preference shares carry a coupon rate of 83.33% of the prime rate on a face value of R100 per share. The base value of preference shares phasing out in terms of Basel 3 is R258 969 000. At year-end, 68.48% (2018: 56.45%) of these shares had been repurchased as they no longer contributed to qualifying regulatory capital.
(3) Refer to note 35 for detail regarding the buy back of shares to settle share options. During the year a loss of R151.9 million (R109.4 million after tax) (2018: R151.1 million (R108.8 million after tax) was realised on settlement of share options as reflected in the statement of changes in equity.
(4) At the annual general meeting held on 25 May 2018, shareholders authorised that 5 781 350 shares equal to 5% of the issued ordinary shares of the company (2018: 5%) be placed under the control of the directors until the next annual general meeting.
(5) In addition to the above authority, shareholders further authorised that loss-absorbent convertible capital securities to a maximum aggregate issue price not exceeding R1.5 billion, but subject to a conversion into ordinary shares not exceeding 10 600 000 ordinary shares (over and above the authority above), be placed under the control of the directors until the next annual general meeting.

Integrated Annual Report 2019 | 203
Risk management report
Remuneration report
Social responsibility
About this report
Appendices Annual financial statements
GROUP COMPANY
R’000 2019 2018 2019 2018
20. Cash flow hedge reserve and foreign currency translation reserveCash flow hedge reserve
Balance at the beginning of the year (26 737) (11 736) – –
Amount recognised in other comprehensive income during the year 5 009 59 116 – –
Amount reclassified from other comprehensive income to profit and loss for the year 18 809 (79 951) – –
(2 919) (32 571) – –
Deferred tax recognised in other comprehensive income during the year (6 669) 5 834 – –
Balance at the end of the year(1) (9 588) (26 737) – –
Foreign currency translation reserve
Balance at the beginning of the year 3 158 –
Amount recognised in other comprehensive income during the year 1 461 3 158
Balance at the end of the year(2) 4 619 3 158
(1) The hedging reserve is released to the income statement on realisation of the interest expense on the hedged items. The hedged items comprise floating rate DMTN bonds, unlisted floating rate subordinated debt, a rand-denominated bi-lateral loan and negotiable floating rate notes (‘FRNs’). Refer to note 42 for additional disclosure.
(2) The foreign currency translation reserve relates to the gain or loss on translation of the group’s investment in a foreign associate. This investment is denominated in EUR and amounted to EUR18.3 million (R292 million).

204 | Capitec Bank Holdings Limited
Key performance indicators
Leadership reviews
The Capitec Way
Our business context
Our strategic goals and insights
Leadership teams and governance oversight
GROUP COMPANY
R’000 2019 2018 2019 2018
21. Net lending, investment and insurance incomeInterest income
Loans and advances 11 934 978 12 439 709 – –
Loan origination fees 787 560 775 807 – –
Non-bank money market placements 496 893 – –
Money market funds and term deposit investments 1 729 494 1 522 756 – –
Treasury bills – less than 3 months 1 743 21 972 – –
Bank balances 2 319 6 294 225 215
Resale agreements 127 220 79 658 – –
Debentures – 1 517 – –
Interest-bearing instruments(3) 917 262 625 851 – –
Total interest income 15 501 072 15 474 457 225 215
Loan fee income
Monthly service fee 931 470 919 328 – –
Net insurance income(1) 794 977 873 524 – –
Total loan fee and insurance income 1 726 447 1 792 852 – –
Total lending, investment and insurance income 17 227 519 17 267 309 – –
Interest expense
Retail savings (1 839 676) (1 626 026) – –
Retail fixed deposits (2 068 356) (1 813 130) – –
Other unlisted wholesale (8 693) (79 824) – –
Subordinated debt (266 418) (297 452) – –
Domestic Medium Term Notes (266 310) (283 035) – –
Negotiable deposits (57 339) (82 468) – –
Other (2 757) (2 514) – –
Total interest expense (4 509 549) (4 184 449) – –
Loan fee expense(2) (219 768) (412 867) – –
Total lending, investment and insurance expense (4 729 317) (4 597 316) – –
Net lending, investment and insurance income 12 498 202 12 669 993 225 215
(1) Refer to note 9. Credit life insurance net income on the 3rd party cell captive for loans issued subsequent to 6 May 2016.(2) Credit life insurance cost on the 1st party cell captive for loans issued prior to 6 May 2016.(3) Includes treasury bills with a maturity greater than 3 months.

Integrated Annual Report 2019 | 205
Risk management report
Remuneration report
Social responsibility
About this report
Appendices Annual financial statements
GROUP COMPANY
R’000 2019 2018 2019 2018
22. Dividend incomeOrdinary dividends – – 2 015 556 1 631 808
Preference dividends – – 8 785 12 023
Dividend income – – 2 024 341 1 643 831
23. Credit impairmentsBad debts written off 1 268 257 6 662 691 – –
Movement in provision for credit impairments(1) 3 649 162 (102 282) – –
Bad debts recovered(2) (467 174) (1 280 419) – –
Net impairment charge 4 450 245 5 279 990 – –
(1) The movement in provision for credit impairments is disclosed in note 7.(2) Bad debts recovered include R6.1 million in recoveries on loans written off after 1 March 2018.
24. Operating expensesThe following are more significant items included in operating expenses:
Loss on disposal of property, plant and equipment 9 142 2 940 – –
Loss on scrapping of intangibles 474 – – –
Depreciation on property, plant and equipment 437 078 420 272 – –
Amortisation of computer software 196 381 139 878 – –
643 075 563 090 – –
Advertising and marketing 222 636 200 760 2 674 1 877
Bank charges 308 257 257 061 17 6
Consumables 272 645 239 619 – 38
Communications 196 030 204 573 – –
Security 304 827 258 553 – –
Information technology 327 636 259 170 – –
Operating lease rentals
Land and buildings 502 972 461 510 – –
Office equipment 39 929 – –
503 011 462 439 – –
Income from subletting (2 285) (2 224) – –
Auditor’s remuneration
Audit fees 14 785 5 921 3 3
Other services 555 2 612 – –
15 340 8 533 3 3
Employee costs
Salaries and bonus costs 3 472 106 2 995 857 – –
Equity-settled share-based payment 31 950 36 709 – –
Cash-settled share appreciation rights 188 712 107 567 – –
Social security cost 108 860 99 344 – –
Training cost 76 160 60 075 – –
Training refund (6 511) (5 701) – –
3 871 277 3 293 851 – –

206 | Capitec Bank Holdings Limited
Key performance indicators
Leadership reviews
The Capitec Way
Our business context
Our strategic goals and insights
Leadership teams and governance oversight
GROUP COMPANY
R’000 2019 2018 2019 2018
25. Income tax expenseCurrent tax 2 152 404 1 639 385 – –
Deferred tax (370 985) 45 149 – –
Income tax expense 1 781 419 1 684 534 – –
Effective tax rate (%) 25 27 – –
The tax on the profit before tax differs from the theoretical amount that would arise using the basic normal company tax rate as follows:
Operating profit before tax 7 076 830 6 155 251 2 024 341 1 643 831
Tax calculated at a tax rate of 28% 1 981 512 1 723 470 566 815 460 273
Adjustments for prior periods 75 000 (728) – –
Income not subject to tax(1) (237 071) (465) (566 815) (460 273)
Expenses not deductible for tax purposes(2) 901 – – –
Allowances not in income statement(3) (38 687) (37 525) – –
Movement in unutilised tax losses (236) (218) – –
Income tax expense 1 781 419 1 684 534 – –
Estimated tax losses at year-end available for utilisation against future taxable income 9 008 10 088 – 237
Net calculated tax losses carried forward 9 008 10 088 – 237
Tax relief calculated at current tax rates 2 522 2 825 – 66
(1) This relates to exempt income in the form of dividends received from both the credit life insurance and funeral insurance cell captive arrangements for group, and dividend from Capitec Bank Limited for company.
(2) Donations.(3) Other permanent differences in the form of learnership agreements.
GROUP
R’000 2019 2018
26. Earnings per share attributable to ordinary shareholdersNet profit after tax 5 295 411 4 470 717
Preference dividend (8 785) (12 023)
Discount on repurchase of preference shares (1 857) (734)
Net profit after tax attributable to ordinary shareholders 5 284 769 4 457 960
Weighted average number of ordinary shares in issue (thousands) 115 627 115 627
Adjustment for:
Exercise of share options 226 371
Weighted average number of ordinary shares for diluted earnings per share (thousands) 115 853 115 998
Basic earnings per share (cents)(1) 4 571 3 855
Diluted earnings per share (cents)(2) 4 562 3 843
(1) Basic earnings per share is calculated by dividing the net profit after tax attributable to ordinary equity holders by the weighted average number of ordinary shares in issue during the year.
(2) To calculate diluted earnings per share, the net profit after tax attributable to ordinary equity shareholders is divided by the weighted average number of ordinary shares in issue adjusted to assume conversion of all potentially dilutive ordinary shares. Potentially dilutive shares consist of share options. The number of shares that could have been acquired at fair value (the average annual share price of the company’s shares) is determined based on the monetary value of the subscription rights attached to outstanding options. The result is compared to the number of shares that would have been issued assuming the exercise of the share options. The difference is added to the weighted average number of shares as an issue of ordinary shares for no consideration. No adjustment is made to earnings.

Integrated Annual Report 2019 | 207
Risk management report
Remuneration report
Social responsibility
About this report
Appendices Annual financial statements
GROUP
R’000 2019 2018
27. Headline earnings per share attributable to ordinary shareholdersNet profit attributable to ordinary shareholders 5 284 769 4 457 960
Non-headline items
Loss on disposal of property and equipment 9 142 2 940
Income tax charge – property and equipment (2 560) 164
Derecognition of intangible assets 474 –
Income tax charge – intangible assets (133) –
Headline earnings 5 291 692 4 461 064
Headline earnings per share (cents) 4 577 3 858
Diluted headline earnings per share (cents) 4 568 3 846
28. DividendsThe company declared the following dividends for the current and previous financial years:
R’000Dividends per
share (DPS) Rand Declared LDT Date paid
2019
Ordinary dividend
Interim 630 728 450 25 Sep 2018 16 Oct 2018 22 Oct 2018
Final(1) 1 120 1 295 022 27 Mar 2019 15 Apr 2019 23 Apr 2019
Preference dividend
Interim 421.67 4 999 31 Aug 2018 18 Sep 2018 25 Sep 2018
Final 418.82 3 786 28 Feb 2019 18 Mar 2019 25 Mar 2019
2018
Ordinary dividend
Interim 525 607 042 27 Sep 2017 17 Oct 2017 23 Oct 2017
Final 945 1 092 675 26 Mar 2018 17 Apr 2018 23 Apr 2018
Preference dividend
Interim 438.68 6 730 31 Aug 2017 19 Sep 2017 26 Sep 2017
Final 423.56 5 293 28 Feb 2018 19 Mar 2018 26 Mar 2018
(1) The directors declared a final dividend of 1 120 cents per share (2018: 945 cents per share) in respect of 2019 on 27 March 2019 amounting to a dividend of R1 295 million (2018: R1 093 million). These financial statements do not reflect this dividend payable, which will be accounted for in shareholders’ equity as a regulatory appropriation of retained earnings in the year ending 28 February 2019, which is in line with recommended accounting practice.

208 | Capitec Bank Holdings Limited
Key performance indicators
Leadership reviews
The Capitec Way
Our business context
Our strategic goals and insights
Leadership teams and governance oversight
29. Financial risk managementThe board of directors is responsible for risk management and views it as an integral part of providing a responsible return on shareholders’ equity.
Note 29 should be read with the sections in the risk management report from page 88 to 113 of the integrated annual report.
To assist the board, the group is managed through a system of internal controls functioning throughout the entities. Risk awareness pervades every aspect of the business and is the responsibility of each employee of the group. The board established a risk and capital management committee (RCMC) comprising 2 independent non-executive directors, that operate in compliance with a formal charter. The committee assists the board in reviewing the processes followed to identify risk and in assessing the potential impact of identified risks in the group environment.
Specific risks are dealt with in a structured manner by the following subcommittees comprising executives and senior management:
• Credit committee – credit and counterparty risk
• Assets and liability committee (ALCO) – interest rate, market, liquidity, counterparty, currency and capital adequacy risk
• Risk committee – legal, compliance, technology, operational and reputational risk
The RCMC ensures that risk assessment is an ongoing process and that a formal risk assessment is undertaken at least quarterly. The group operates in a structured manner with defined processes and procedures, enabling risk assessment within a controlled environment. Accordingly, an assessment of key risks is performed and weightings are assigned based on impact and probability. Existing controls are assessed and, if necessary, adjusted. Thereafter reports are generated at regular intervals to enable monitoring of risk levels.
29.1 Credit risk
Refer to page 94 to 99 of the Integrated annual report for the qualitative disclosure of credit risk, marked as audited, as well as note 7.
The group grants retail loans for which no security is obtained and accordingly the entire balance as per the balance sheet is exposed to credit risk. Exposure to systemic credit risk is regarded as being potentially higher due to the demographic credit characteristics of the client base. However, exposure to single-name concentration credit risk is low due to the nature (smaller average loan sizes) and distribution (numerous individuals across the spectrum of economic sectors and provinces) of the loan book.
Credit risk is managed through every stage of the credit life cycle by following a combination of governance, decision support and business support. Governance includes regulators, industry associations, the group’s financial governance and committees which supports and influences credit strategy. Decision support is a specialist credit risk statistical analysis team that develops credit models and scorecards that are aligned with business strategies and credit risk appetite. Credit risk management is provided by other areas of business to ensure optimisation of the granting, collections and recoveries models and systems.
Measures taken by the group to limit credit risk to acceptable levels include, inter alia, the application of standard credit acceptance procedures to assess potential clients, daily monitoring of collectible balances at both branch and head office level and monitoring by the RCMC.
The key to consideration regarding credit risk management for the group, is to maintain the retail lending book within the group’s credit risk appetite through customised acquisition, retention and rehabilitation strategies.
The reason why clients approach credit providers for credit is that they have specific requirements. These requirements include the need for emergency cash, education, second-hand vehicles, and housing.

Integrated Annual Report 2019 | 209
Risk management report
Remuneration report
Social responsibility
About this report
Appendices Annual financial statements
In order to execute on this solution, we incorporate a comprehensive assessment of the client’s behaviour, affordability and source of income. For the assessment, we use information from the credit bureau, bank statements and payslips. We apply 3 parallel disposable income calculations i.e. the NCA affordability calculation, a Capitec client disposable income calculation that maintains conservative buffers and the client’s own calculation. We then apply the most stringent of the 3. Branch staff have no credit granting discretion and all exceptions are managed and monitored by a centralised specialist team.
During the loan application process, we present the maximum loan amount, maximum term and maximum instalment to the client. Within these constraints, the client may select any combination that best suits him or her. We encourage clients to take up credit for shorter periods of time and for smaller amounts. This is done through a pricing model that discounts the interest rate in instances where clients select a term that is shorter than the maximum for which they qualify. This is due to the manner in which the pricing for risk model reacts to the lower default rates for such clients.
When existing clients apply for further credit, we conduct a full credit assessment. If a client qualifies for further credit, it can be extended as a further agreement in addition to the current credit; or the client can have the existing credit consolidated into a new credit agreement. This is only available for clients if instalments are up-to-date on all Capitec loans and to clients who have a satisfactory credit risk.
Our scoring models react to instances where a client repeatedly takes up credit, and when their debt to income ratio becomes too high. In such instances we limit the term and amount of credit offered to clients or we decline the application for credit.
Acquisition and retention strategies are built on the principles of the client’s credit behaviour (willingness to pay), affordability and source of income. Rehabilitation strategies are need-driven to assist clients based on their unique circumstances.
Unforeseen circumstances may lead to reduced income or increased expenditure for the client. The circumstances may include:
• employers that reduce overtime and bonuses or place staff on short pay due to difficult economic conditions;
• strikes;
• clients may be forced to change employment at reduced salaries due to poor performance or health problems; or
• financial problems faced by employers.
These instances may result in a client missing an instalment on a loan and being in arrears.
If the client is in arrears due to challenges regarding the client’s inability to repay the debt, we negotiate with the client to either immediately bring the arrears instalments up to date, or we attempt to help and manage the situation through agreeing a course of action with the client by amending the loan agreement (loan reschedule).

210 | Capitec Bank Holdings Limited
Key performance indicators
Leadership reviews
The Capitec Way
Our business context
Our strategic goals and insights
Leadership teams and governance oversight
29. Financial risk management (continued)
29.1 Credit risk (continued)
The first solution is preferable, as it:
• reduces arrears if the client pays on the same date;
• improves our cash flow;
• helps restore the client to a creditworthy position; and
• limits the overall cost of credit for clients.
Practically, there is a risk that placing too much pressure on clients (such as expecting clients in financial distress to repay 2 instalments in a single month when they cannot afford to do so) can be counter-productive. In such a case, clients could refuse to cooperate, stop communicating with us and stop paying instalments.
We have extensive history that measures the yields we can receive by handing clients over to external debt collectors. We monitor the cash flow yields that we receive from this process against internal collection processes, including rescheduling. We optimise the strategy for different client groups and use handover samples for each strategy to monitor the relative performance and validate the strategy for each client group.
Factors that we consider in delivering the optimal strategy for a client include:
• the risk profile and payment history of the client;
• the arrears status of the client;
• whether the client was rescheduled previously;
• the credit exposure amount;
• free cash flow estimates derived from clients’ bank accounts or credit bureau records (salary less debit orders); and
• any information we have about the client’s employer.
Depending on a combination of factors, the optimal strategy is to encourage clients with some free cash flow or limited credit exposure to bring arrear instalments up to date; or assist clients that have cash flow difficulty but have good behaviour history, to reduce their instalments and extend the term of the credit agreement (i.e. reschedule). When there is a clear temporary interruption of income such as a strike or a client is on maternity leave, we may allow a reduced instalment for a short period (typically 3 months) with subsequent increased instalments, in order to assist the client through this period (i.e. variable reschedule). We hand over clients and write the loan off, when the problem appears to relate to the clients’ unwillingness or inability to pay.
We use system-based rules to limit instances where we allow rescheduling. The rules engine determines whether clients are eligible for rescheduling as well as the maximum term for which the loan can be extended. We do not reschedule all loans that meet our criteria, as this depends on the individual circumstances of each client applying to reschedule. Successfully treating clients that were in arrears increases the overall quality of the loan book, as clients who would otherwise have been written off remain on balance sheet. We do however, treat, monitor and separately disclose the performance of these clients. (See provisions discussed below.)
We monitor the performance and cure rate of reschedules using a segmented approach to ensure that it remains within the banks risk appetite. Refer to note 7 for reschedule information.
This process allows us to optimise collections and reduce clients’ debt levels. Our aim is always to partner with our clients through both good and tough times and act in their best interest.

Integrated Annual Report 2019 | 211
Risk management report
Remuneration report
Social responsibility
About this report
Appendices Annual financial statements
Credit risk mitigation
Interest rate limits and fees for credit agreements were changed on 6 May 2016 by the National Credit Regulator (NCR). Prior to this date, we charged our clients an all-inclusive rate and Capitec insured the loan book against death and retrenchment. We continue to insure our pre-May 2016 loan book through a first party cell captive structure. Following the changes from May 2016, all loans granted that are greater than 6 months require our clients to take out credit life insurance. This protects them against the unfortunate event of retrenchment, temporary or permanent disability and loss of income, and in the case of death; there is no claim against their deceased estate for any amount outstanding. We provide our clients with the option to take out the appropriate credit life insurance through a third party cell captive. The exposure within the cell captives is fully re-insured to the reinsurance market except for temporary disability cover which has been retained by the cell captive.
Measurement of ECL
The key inputs used for measuring ECL are:
• probability of default (PD);
• loss given default (LGD); and
• exposure at default (EAD).
PD is an estimate of the likelihood of default over a given time horizon. PDs are estimated considering the contractual maturities of exposures and estimated prepayment rates. The estimation is based on current conditions, adjusted to take into account estimates of future conditions that will impact the PD.
The calculation is based on a statistical model that predicts the future repayment performance of clients based on their arrears status, model segment and tenure. Future cash flows and arrears status probabilities are generated from which an expected ECL provision is calculated. The prediction of future repayment is based on observed roll rates over the last 12 months. Roll rates refer to the rates at which clients transition or roll from a repayment status in a given month to a repayment status in the following month.
LGD is an estimate of the loss arising on default. LGD models for unsecured assets consider time of recovery and recovery rates. The calculation is on a discounted cash flow basis.
EAD is an estimate of the exposure at a future default date, taking into account expected changes in the exposure after the reporting date, including repayments of principal and interest, and expected drawdowns on committed facilities.
The EAD is calculated by creating an amortisation structure for each account. This structure includes the expected monthly repayment, as well as the projected monthly cumulative repayment status probabilities and the cash flows associated with every repayment status.
The group’s modelling approach for EAD reflects expected changes in the balance outstanding over the lifetime of the loan exposure that are permitted by the current contractual terms, such as amortisation profiles, early repayment or overpayment, changes in utilisation of undrawn commitments and credit mitigation actions taken before default. The group uses EAD models that reflect the characteristics of the portfolios.

212 | Capitec Bank Holdings Limited
Key performance indicators
Leadership reviews
The Capitec Way
Our business context
Our strategic goals and insights
Leadership teams and governance oversight
29. Financial risk management (continued)
29.2 Impairment – Measurement of the expected credit loss (ECL)
The developing and measuring of the group’s processes for measuring ECL, including the monitoring of significant increases in credit risk (SICR), the incorporation of economic forward looking information and the methods used to calculate ECL and ensuring that polices and procedures are in place to appropriately maintain and validate models used to measure ECL, are overseen by the group’s credit committee. The internal audit function performs regular audits to ensure that established controls and procedures are both adequately designed and implemented.
Impairment implementation
Staged approach to the determination of ECL
IFRS 9’s ECL model requires the classification and measurement of ECL using the general model for loans and advances measured at amortised cost. In essence, the general model is a three stage model. Capitec has interpreted the three stages as being up-to-date (stage 1), up-to-date loans with SICR and loans up to 1 month in arrears (stage 2) and credit impaired (stage 3). Loans and advances within stage 1 are measured based on a 12 month ECL and a lifetime ECL is determined for loans and advances within stage 2 and stage 3.
Significant increase in credit risk (SICR)
The group considers reasonable and supportable information based on the group’s historical experience, credit risk assessment and forward-looking information (including macro-economic factors) when determining whether the credit risk (i.e. the risk of default) of loans and advances has increased significantly since initial recognition. The assessment of SICR is key in determining when to move from measuring an impairment provision based on a 12 month ECL to one that is based on a lifetime ECL (the move from stage 1 to stage 2). The group’s ECL framework aligns with the group’s credit granting strategy.
SICR
As disclosed in note 2.5, the group monitors financial debt instruments subject to impairment requirements at each reporting date to determine whether evidence exists that there has been a significant increase in credit risk (SICR) since initial recognition of the financial instrument. If there has been a significant increase in credit risk the group will measure the loss allowance based on lifetime rather than 12-month ECL.
In terms of IFRS 9, all loans and advances exposures are assessed at each reporting date (“monthly”) to determine whether there has been a SICR, in which case an impairment provision equal to the lifetime expected loss is recognised. If, at the reporting date, the credit risk on a financial instrument has not increased significantly since initial recognition, the group measures the impairment provision at an amount equal to the 12 month ECL. The group identifies SICR for clients that are up-to-date on their loans, but who have reached certain behaviour risk thresholds or where specific events have occurred that raise a SICR flag. The 12 month ECL is extended to a lifetime ECL for these clients.
The group has set certain behaviour and granting score thresholds which are used to identify a significant increase in credit risk.
The purpose of the behaviour score in the ECL model is to provide a measure of an existing client’s propensity to default on a loan within 12 months. The score was built on a client level, utilising Capitec loans and savings account information, as well as the credit exposure and repayment behaviour at external credit providers. The behaviour score is updated monthly on all existing loan clients to ensure that Capitec has a consistently updated view of the client.
The updated granting score in the ECL model aims to provide an assessment of SICR on a collective basis for groups of exposure that share similar credit characteristics in order to account for forward-looking information that may not be identified at an individual loan level.
The updated granting view is simply a reinterpretation of the information available at granting date and is not an updated view on the client. Updated client information is incorporated in the behaviour score.
The SICR thresholds are reviewed on an annual basis to ensure that they are able to identify SICR throughout the lifetime of the loan.

Integrated Annual Report 2019 | 213
Risk management report
Remuneration report
Social responsibility
About this report
Appendices Annual financial statements
Incorporation of forward-looking information
It is a fundamental principle of IFRS 9 that the ECL impairment provision that the group holds against potential future credit losses should not only depend on the health of the economy presently, but should take into account changes to the economic environment in the future.
To capture the effects of changes to the economic environment in the future, the forward-looking model considers economic variables specific to South Africa that directly impacts the group’s clients. The group utilises the Bureau of Economic Research (BER) macro-economic outlook for the country over a planning horizon of at least 3 years. The outlook is provided to the asset and liability committee (ALCO) for review and approval. Refer to note 3.
Write-off policy
Under IAS 39, loans and advances were written off at the earlier of loan balances that were more than 3 months in arrears or had a legal status, e.g. debt review or handed over. An expected recovery receivable was raised at the write-off-point.
Under IFRS 9, loans can only be written off when there is no reasonable expectation of recovery. The group therefore applies write-off for loans when the present value of projected future recoveries is less than 5% of the gross balance before write-off. Refer to note 2.5.1.3.
All recoveries after write-off are recognised as bad debts recovered.
The group only invests centrally managed cash surpluses and liquidity buffers in cash and liquid assets with the SARB, National Treasury, South African registered banking entities and money market funds of high credit standing. Potential exposure to concentration credit risk exists principally in cash and cash equivalents, financial investments and term deposit investments (notes 4.5 and 6). Concentrations are controlled using ALCO recommended limits which are monitored and enforced by the credit committee, and monitored and approved by the RCMC. This ensures that the financial assets that the group may place with any one counterparty are limited, by reference to the long-term and short-term credit ratings assigned for that counterparty by Moody’s.

214 | Capitec Bank Holdings Limited
Key performance indicators
Leadership reviews
The Capitec Way
Our business context
Our strategic goals and insights
Leadership teams and governance oversight
29. Financial risk management (continued)
Credit quality of investments
At statement of financial position date the international long-term credit ratings, using Moody’s ratings, were as follows:
R’000 Notes Aaa to
A3 Baa1 to
Baa3 Below
Baa3 Not
rated Adjustment(5) Total carrying
amount
2019
Cash on hand 4 – 3 601 994 – – – 3 601 994
Bank balances(1) 4 2 13 223 923 – 12 417 (4 281) 13 282 061
Resale agreements(4) 4 – 10 605 141 – 506 222 (34) 11 111 329
Short-term corporate bills 4 – – – – – –
Central bank balances(3) 4 – 1 163 650 – – – 1 163 650
Treasury bills (<3 months) 4 – – – – – –
Money market funds(2) 4 – – – 35 496 – 35 496
Treasury bills (>3 months) 5 – 10 741 057 – – (8 663) 10 732 394
Negotiable certificates of deposit (>3 months) 5 – – – – – –
Term deposit investments(4) 6 811 086 8 413 100 110 000 – (2 889) 9 331 297
SARB settlement and other receivables 8 – 991 691 – 348 265 – 1 339 956
Net insurance receivable 9 – 236 391 – – – 236 391
Derivative assets 41, 42 – 479 – – – 479
811 088 48 977 426 110 000 902 400 (15 867) 50 785 047
2018
Cash on hand 4 – 3 472 067 – – – 3 472 067
Bank balances(1) 4 25 275 15 667 767 – 527 – 15 693 569
Resale agreements 4 – 4 363 010 – 403 672 – 4 766 682
Central bank balances(3) 4 – 1 137 659 – – – 1 137 659
Money market funds(2) 4 – – – 20 750 – 20 750
Treasury bills (>3 months) 5 – 11 625 522 – – – 11 625 522
Negotiable certificates of deposit (>3 months) 5 – 155 412 – – – 155 412
Term deposit investments(4) 6 1 303 077 1 225 254 – – – 2 528 331
Other receivables 8 – 211 710 – 334 316 – 546 026
Net insurance receivable 9 – 245 204 – – – 245 204
Derivative assets 41, 42 129 – – – – 129
1 328 481 38 103 605 – 759 265 – 40 191 351
(1) The bank balances were with 9 institutions (2018: 9), with the maximum exposure to one institution being R13 057 million (2018: R8 092 million).
(2) Money market funds consist of money market unit trusts. The placements were with 5 institutions (2018: 3).(3) All central bank balances are with the SARB and includes the mandatory reserve deposit requirement.(4) The balance is the maximum exposure to credit risk.(5) The adjustment relates to ECL. The credit ratings determine the ECL raised.

Integrated Annual Report 2019 | 215
Risk management report
Remuneration report
Social responsibility
About this report
Appendices Annual financial statements
29.3 Interest rate risk
The exposure to interest rate risk is managed within the board-approved tolerances. These tolerances are monitored at RCMC and ALCO and escalated according to the tolerance bands. The current group interest rate profile is monitored by ALCO, which meets monthly and considers the results of management’s analysis of the impact of interest rates on the group, including inter alia, the results of various models. The risk arising from volatility in interest rates is lower on a relative basis when compared to other risks in the business due to the higher net interest income margin earned on the retail unsecured lending portfolio.
Capitec’s interest rate risk position is primarily the result of offering fixed-rate retail term loans and a conservative liquidity strategy. Interest rate management has a number of drivers, including mismatches in the repricing of assets and liabilities, changes in yield curve risk, optionality inherent in certain products and basis risk.
ALCO only allows derivatives for the hedging of interest rate risk in the funding book. Interest rate swaps are used to convert floating-rate to fixed-rate funding with the objective of economically matching fixed-rate assets with fixed-rate liabilities and floating-rate assets with floating-rate liabilities. The nominal amounts and the payment dates of hedging instruments (interest rate swaps) match the hedged item (floating-rate liabilities) exactly from origination of the hedge and, as a consequence, there is 100% hedge effectiveness.
Forward foreign-exchange contracts are used to cover obligations relating to capital equipment, technology and technology support services needed for core banking activities.
Cash flow interest rate risk
Cash, cash equivalents, money market funds and term deposit investments are invested in a mix of instruments earning a fixed rate of interest and those paying interest based on a floating rate. The group has discretion over the rates paid on its demand savings deposits and pays a fixed interest on its fixed-term retail deposits. Wholesale funding comprises a mix of floating and fixed-rate instruments. The group’s most significant financial assets, loans and advances, which are carried at amortised cost, are exposed to fixed rates.
The group actively manages interest rate risk by minimising its exposure to the fixed-rate financial assets by in part cash flow hedging elements of its variable rate funding book to a fixed rate. Interest rate swaps have the economic effect of converting floating rate debt to fixed-rate debt. The net unmatched position, resulting from the group’s exposure to variable rate funding from its retail deposits, exposes the group to cash flow interest rate risk.
Compliance with the prescribed maximum interest rates
The NCA prescribes the ceilings for the maximum interest rates that may be charged for retail lending. The group operates within the ambit of the NCA ceilings when pricing its retail loans and advances to clients.

216 | Capitec Bank Holdings Limited
Key performance indicators
Leadership reviews
The Capitec Way
Our business context
Our strategic goals and insights
Leadership teams and governance oversight
29. Financial risk management (continued)
29.3 Interest rate risk (continued)
Sensitivity analysis
ALCO meets monthly and considers the results of management’s analysis of the impact of interest rates on the group which includes, inter alia, the results of various models and the impact of interest rate strategy on the gross margin.
The sensitivity analysis below reflects the impact of a 200 basis point increase or decrease in the South African interest rate environment:
• Immediately following the reporting date for a period of 1 year
• Considering the contractual maturity buckets of financial assets and liabilities, with fixed interest rate instruments becoming variable on maturity
• Including notional derivative cash flows, included in repricing maturity buckets
Impact on income statement
200 basis points 2019 2018
R’000 Pre-tax Pre-tax
Increase (111 408) (84 695)
Decrease 111 408 84 695

Integrated Annual Report 2019 | 217
Risk management report
Remuneration report
Social responsibility
About this report
Appendices Annual financial statements
29.4 Currency risk
The exposure to foreign currency purchase risk relating to the importation of capital equipment, technology and technology support services needed for the core banking activities is managed through the purchase of forward foreign exchange contracts.
Foreign currency exposures as a result of the investment in foreign associates is disclosed in the consolidated statement of changes in equity (refer to note 20).
29.5 Other market risk
Market prices and rates typically include equity, bond and commodity prices, currency exchange and interest rates. Our exposure to market risk is mainly due to interest rate risk arising on the retail banking activities.
29.6 Liquidity risk
The group manages liquidity cautiously with a low appetite for liquidity risk and operates a conservative maturity profile which is monitored by ALCO in terms of an approved Asset and Liability Management (ALM) policy. The maturity profile reflects the deliberate strategy of funding longer term assets with a significant portion of long-term funding with limited use of core call deposit funding. Our conservative approach at times results in the holding of cash in excess of immediate operational requirements. Funding that is surplus to operational requirements is managed in terms of the liquidity philosophy to ensure that obligations can be met as they become due without incurring unacceptable losses.
The table below analyses the group’s assets and liabilities into maturity groupings based on the remaining period, at statement of financial position date, to the contractual maturity date. The table was prepared on the following basis:
• Asset and liability cash flows are presented on an undiscounted basis with an adjustment to reflect the total discounted result.
• The cash flows of floating rate financial instruments are calculated using published forward market rates at statement of financial position date.
• The cash flows of the derivative financial instruments are included on a gross basis.
• Contractual cash flows with respect to items which have not yet been recorded on the statement of financial position are excluded. Refer to note 36.
• Conditionally revocable retail loan commitments totalling R911.7 million (2018: R796.3 million) are not included in the liquidity analysis. The commitments are a result of undrawn loan amounts. The loans are advanced with a contractual repayment period of one month or less.
• The group’s contractual commitment is revocable should a client not meet their contractual obligations or where the group has determined that the client’s credit risk profile has changed. A total of 64.0% (2018: 48.1%) of these commitments is expected to be drawn down within one month. As these are one month loans, repayment of any future draw downs must also occur within the month.
• Adjustments to loans and advances to clients relate to initiation fee income.
• Non-cash liabilities, representing leave pay and the straight-lining of operating leases, are disclosed as adjustments to trade and other payables.
Refer to pages 88 to 113 of the integrated annual report for more on management’s objectives, policies and processes for managing the risk.

218 | Capitec Bank Holdings Limited
Key performance indicators
Leadership reviews
The Capitec Way
Our business context
Our strategic goals and insights
Leadership teams and governance oversight
29. Financial risk management (continued)
29.6 Liquidity risk (continued)
Maturities of financial assets and financial liabilities (1)(2) – R’000 Note
Demand to 1 month
1 to 3 months
3 months to 1 year
More than 1 year Adjustment(4) Total
2019
Undiscounted assets
Cash and cash equivalents – sovereigns 4 1 163 650 – – – – 1 163 650
Cash and cash equivalents – banks 4 22 538 055 5 494 806 – – (4 315) 28 028 546
Short-term corporate bills 4 – – – – – –
Money markets unit trusts – corporate other 4 35 496 – – – – 35 496
Financial investments – sovereigns and banks(5) 5 1 471 610 1 728 260 7 936 690 – (8 663) 11 127 897
Term deposit investments 6 24 403 1 102 809 8 586 860 – (2 889) 9 711 183
Financial assets – equity instruments at FVOCI 11 – – – 100 000 – 100 000
Loans and advances to clients – retail personal 7 5 223 786 5 498 162 21 749 520 56 588 732 (608 742) 88 451 458
Loans and advances to clients – corporate other 7 23 372 – – – – 23 372
Other receivables 8 1 198 819 115 080 84 734 20 359 – 1 418 992
Net insurance receivable 9 – – 236 391 – – 236 391
Derivative assets 10 – 59 (83) 575 – 551
Current income tax asset – – 286 046 – – 286 046
Undiscounted assets 31 679 191 13 939 176 38 880 158 56 709 666 (624 609) 140 583 582
Adjustments for undiscounted assets (1 218 922) (2 273 769) (8 975 529) (21 986 088) – (34 454 308)
Discounted assets
Loan impairment provision 7 (3 021 694) (563 073) (2 038 570) (4 741 124) – (10 364 461)
Total discounted assets 27 438 575 11 102 334 27 866 059 29 982 454 (624 609) 95 764 813
Undiscounted liabilities
Retail deposits 16 46 497 973 2 866 125 11 495 083 14 022 798 – 74 881 979
Wholesale funding 16 72 154 371 916 2 222 196 3 034 663 – 5 700 929
Current income tax liabilities – – – – – –
Trade and other payables 17 1 148 611 566 352 106 634 141 754 239 280 2 202 631
Derivative liability 272 2 599 7 389 5 316 – 15 576
Provisions 18 – – – 91 005 – 91 005
Undiscounted liabilities 47 719 010 3 806 992 13 831 302 17 295 536 239 280 82 892 120
Adjustments for undiscounted liabilities to depositors (30 544) (215 494) (1 128 074) ( 2 766 055) – (4 140 167)
Total discounted liabilities 47 688 466 3 591 498 12 703 228 14 529 481 239 280 78 751 953
Net liquidity excess/(shortfall)(6) (19 061 513) 9 569 111 23 010 286 34 673 006 (863 889) 47 327 001
Cumulative liquidity excess/(shortfall)(2) (19 061 513) (9 492 402) 13 517 884 48 190 890 47 327 001 47 327 001

Integrated Annual Report 2019 | 219
Risk management report
Remuneration report
Social responsibility
About this report
Appendices Annual financial statements
Maturities of financial assets and financial liabilities (1)(2) – R’000 Note
Demand to 1 month
1 to 3 months
3 months to 1 year
More than 1 year Adjustment(4) Total
2018
Undiscounted assets
Cash and cash equivalents – sovereigns 4 1 137 659 – – – – 1 137 659
Cash and cash equivalents – banks 4 17 768 738 6 237 218 – – – 24 005 956
Money markets unit trusts – corporate other 4 20 751 – – – – 20 751
Financial investments – sovereigns and banks 5 200 000 2 754 240 9 241 211 – – 12 195 451
Term deposit investments 6 120 173 1 062 131 1 404 658 – – 2 586 962
Available-for-sale financial assets 11 – – – 100 000 – 100 000
Loans and advances to clients – retail personal 7 3 107 374 4 899 080 19 590 007 51 532 936 (677 485) 78 451 912
Loans and advances to clients – corporate other 7 27 018 – – – – 27 018
Other receivables 8 439 240 107 351 29 355 3 478 – 579 424
Net insurance receivable 9 – – 245 204 – – 245 204
Derivative assets 10 – 58 75 – – 133
Current income tax asset – – 107 154 – – 107 154
Undiscounted assets 22 820 953 15 060 078 30 617 664 51 636 414 (677 485) 119 457 623
Adjustments for undiscounted assets (1 012 531) (2 140 774) (8 298 948) (19 930 977) – (31 383 230)
Discounted assets
Provision for doubtful debts 7 (558 587) (282 284) (1 129 994) (3 857 230) – (5 828 095)
Total discounted assets 21 249 835 12 637 020 21 188 722 27 848 207 (677 485) 82 246 298
Undiscounted liabilities
Retail deposits 16 36 074 638 2 463 316 10 065 863 12 634 549 – 61 238 366
Wholesale funding 16 97 009 741 558 1 447 674 4 960 805 – 7 247 046
Trade and other payables 17 1 070 282 468 765 32 931 107 171 234 772 1 913 921
Derivative liability 13 117 4 651 18 718 21 168 – 57 654
Provisions 18 – – – 66 835 – 66 835
Undiscounted Liabilities 37 255 046 3 678 290 11 565 186 17 790 528 234 772 70 523 822
Adjustments for undiscounted liabilities to depositors (28 004) (212 127) (1 161 145) (3 056 991) – (4 458 267)
Total discounted liabilities 37 227 042 3 466 163 10 404 041 14 733 537 234 772 66 065 555
Net liquidity excess /(shortfall)(6) (14 992 680) 11 099 504 17 922 484 29 988 656 (912 257) 43 105 707
Cumulative liquidity excess/(shortfall)(2) (14 992 680) (3 893 176) 14 029 308 44 017 964 43 105 707 43 105 707
(1) The contractual maturity of the financial assets and liabilities of the company are all on demand to one month.(2) Much of the liquidity shortfall in the demand to three month categories results from the investment of excess cash in treasury bills with maturities
in excess of three months. These (financial investments – sovereigns) instruments are highly liquid and can be converted to cash should the need arise. In addition, term deposits may also be liquidated to fund the shortfall.
(3) The definitions of sovereign, banks, corporate and retail are aligned with the Banks’ Act Regulations.(4) The adjustment includes adjustments to loan origination fees, leave pay provision, deferred income and the straight-lining of lease accruals.(5) 100% of financial investments – sovereigns and banks relates to investments in sovereigns.(6) Calculated as undiscounted assets net of loan impairment provision ECL less undiscounted liabilities.

220 | Capitec Bank Holdings Limited
Key performance indicators
Leadership reviews
The Capitec Way
Our business context
Our strategic goals and insights
Leadership teams and governance oversight
29. Financial risk management (continued)
29.6 Liquidity risk (continued)
Maturities of financial assets and financial liabilities – R’000 Note
1 to 2 years
2 to 3 years
3 to 4 years
4 to 5 years
5 to 10 years
More than 10 years Total
2019
Undiscounted assets
Loans and advances to clients – retail personal 7 22 556 967 15 635 163 9 885 115 5 734 241 2 777 246 – 56 588 732
Loans and advances to clients –retail other 7 – – – – – – –
Other receivables 8 14 176 2 061 2 061 2 061 – – 20 359
Financial assets – equity instruments at FVOCI 11 – – – – – 100 000 100 000
Net insurance receivable 9 – – – – –
Derivative assets 10 295 280 – – – – 575
Undiscounted assets 22 571 438 15 637 504 9 887 176 5 736 302 2 777 246 100 000 56 709 666
Adjustments for undiscounted assets (7 759 116) (5 107 711) (3 768 120) (3 061 218) (2 289 923) – (21 986 088)
Discounted assets
Loan impairment provision 7 (2 266 913) (1 407 755) (737 268) (276 541) (52 647) – (4 741 124)
Total discounted assets 12 545 409 9 122 038 5 381 788 2 398 543 434 676 100 000 29 982 454
Undiscounted liabilities
Retail deposits 16 5 463 116 3 674 859 2 892 162 1 992 661 – – 14 022 798
Wholesale funding 16 1 752 081 1 077 257 97 809 52 142 55 374 – 3 034 663
Trade and other payables 17 68 576 31 418 26 656 10 193 4 911 – 141 754
Derivative liability 5 316 – – – – – 5 316
Provisions 18 54 301 30 698 2 002 2 002 2 002 – 91 005
Undiscounted liabilities 7 343 390 4 814 232 3 018 629 2 056 998 62 287 – 17 295 536
Adjustments for undiscounted liabilities to depositors (1 032 030) (734 705) (543 701) (451 504) (4 115) – (2 766 055)
Total discounted liabilities 6 311 360 4 079 527 2 474 928 1 605 494 58 172 – 14 529 481
Net liquidity excess/(shortfall) 12 961 135 9 415 517 6 131 279 3 402 763 2 662 312 100 000 34 673 006
Cumulative liquidity excess/(shortfall) 26 479 019 35 894 536 42 025 815 45 428 578 48 090 890 48 190 890 48 190 890

Integrated Annual Report 2019 | 221
Risk management report
Remuneration report
Social responsibility
About this report
Appendices Annual financial statements
Maturities of financial assets and financial liabilities – R’000 Note
1 to 2 years
2 to 3 years
3 to 4 years
4 to 5 years
5 to 10 years
More than 10 years Total
2018
Undiscounted assets
Loans and advances to clients – retail personal 7 20 914 395 14 705 006 8 971 979 4 938 506 2 003 050 – 51 532 936
Other receivables 8 3 224 – – – 254 – 3 478
Available-for-sale financial assets 11 – – – – – 100 000 100 000
Net insurance receivable 9
Derivative assets 10 – – – – – –
Undiscounted assets 20 917 619 14 705 006 8 971 979 4 938 506 2 003 304 100 000 51 636 414
Adjustments for undiscounted assets (7 430 362) (4 846 618) (3 295 535) (2 827 649) (1 530 813) – (19 930 977)
Discounted assets
Provision for doubtful debts 7 (1 738 024) (1 174 897) (609 904) (234 436) (99 969) – (3 857 230)
Total discounted assets 11 749 233 8 683 491 5 066 540 1 876 421 372 522 100 000 27 848 207
Undiscounted liabilities
Retail deposits 16 4 176 808 2 805 969 3 004 680 2 647 092 – – 12 634 549
Wholesale funding 16 2 554 690 1 702 263 545 249 93 995 64 608 – 4 960 805
Trade and other payables 66 720 23 061 7 293 6 361 3 736 – 107 171
Derivative liability 16 195 4 973 21 168
Provisions 18 43 781 23 054 – – – – 66 835
Undiscounted liabilities 6 858 194 4 559 320 3 557 222 2 747 448 68 344 – 17 790 528
Adjustments for undiscounted liabilities to depositors (1 073 429) (736 590) (663 268) (573 737) (9 966) – (3 056 990)
Total discounted liabilities 5 784 765 3 822 730 2 893 954 2 173 711 58 378 – 14 733 538
Net liquidity excess /(shortfall) 12 321 401 8 970 789 4 804 853 1 956 622 1 834 991 100 000 29 988 656
Cumulative liquidity excess/(shortfall) 26 350 709 35 321 498 40 126 351 42 082 973 43 917 964 44 017 964 44 017 964

222 | Capitec Bank Holdings Limited
Key performance indicators
Leadership reviews
The Capitec Way
Our business context
Our strategic goals and insights
Leadership teams and governance oversight
29. Financial risk management (continued)
29.7 Gains and losses per category of financial assets and financial liabilities At fair value through
profit and loss At amortised cost
R’000 Notes
Deemed held for trading
Designatedat initial
recognitionFinancial
assetsFinancial liabilities Total
2019
Interest income 21 – – 15 501 072 – 15 501 072
Interest expense 21 – – – (4 509 549) (4 509 549)
Loan fee income and net insurance income 21 – – 1 726 447 – 1 726 447
Loan fee expense 21 – – (219 768) – (219 768)
Transaction fee income – – – 8 473 959 8 473 959
Transaction fee expense – – – (2 009 669) (2 009 669)
Dividend income 22 – – – – –
Credit impairment losses 23 – – (4 450 245) – (4 450 245)
2018
Interest income 21 – – 15 474 457 – 15 474 457
Interest expense 21 – – – (4 184 449) (4 184 449)
Loan fee income and net insurance income 21 – – 1 792 852 – 1 792 852
Loan fee expense 21 – – (412 867) – (412 867)
Transaction fee income – – – 6 925 526 6 925 526
Transaction fee expense – – – (1 798 483) (1 798 483)
Dividend income 22 – – – – –
Credit impairment losses 23 – – (5 279 990) – (5 279 990)
29.8 Fair value hierarchy and classification of financial assets and financial liabilities
Valuation processes
Determination on fair values and valuation processes
Fair values are market-based, calculated first with reference to observable inputs available in the market, then less observable and finally unobservable inputs only where observable inputs or less observable inputs are unavailable.
Fair values are calculated consistent with the unit of account used for the measurement of the asset or liability in the statement of financial position and income statement and assume an orderly market on a going concern basis.
The group’s finance department performs the valuations of financial assets and liabilities required for financial reporting purposes. Selecting the most appropriate valuation methods and techniques is an outcome of internal discussion and deliberation between members of the finance team who have modelling and valuation experience. The valuations are reported to the chief financial officer (CFO) and audit committee. Changes in fair values are analysed at each reporting date.
Hierarchy of fair value of financial instruments
The hierarchy is based on the extent to which the inputs to those valuation techniques are observable or unobservable. Observable inputs reflect market data obtained from independent sources and unobservable inputs reflect the group’s assessment of what inputs would likely be from the perspective of the market. The group first considers relevant and observable market inputs where these are available. Unobservable inputs are used in the absence of observable inputs. The group’s policy is to recognise transfers into and transfers out of fair value hierarchy levels as of the date of the event or change in circumstances that caused the transfer. There were no transfers between levels 1, 2 and 3 during the year.

Integrated Annual Report 2019 | 223
Risk management report
Remuneration report
Social responsibility
About this report
Appendices Annual financial statements
The fair value hierarchy is applied to both those assets and liabilities measured at fair value through profit and loss and those measured using amortised cost. The table below summarises the classification of financial assets and financial liabilities and their fair values.
At fair value through other comprehensive
income/Profit and loss At amortised cost
TotalFair
value
Hierarchyof
valuationtechniqueR’000 Note
Financialassets
As hedginginstrument
Financialassets
Financialliabilities
2019Financial assets
Cash, cash equivalents and money market funds 4 – – 29 144 530 – 29 144 530 29 144 530 (2)
Financial investments 5 – – 10 732 394 – 10 732 394 10 732 394 (2)
Financial assets – equity instruments at FVOCI 11 100 000 – – – 100 000 100 000 Level 3
Term deposit investments(3) 6 – – 9 331 297 – 9 331 297 9 331 297 (2)
Net loans and advances 7 – – 44 514 684 – 44 514 684 44 708 093 Level 3
Net insurance receivable 9 – – 236 391 – 236 391 236 391
Other receivables 8 – – 1 418 992 – 1 418 992 1 418 992 (2)
Derivative assets(1) 10 – 479 – – 479 479 Level 2
Financial liabilities
Deposits and bonds 16 – – – 76 443 613 76 443 613 76 770 498 Level 2
– Listed bonds – – – 4 074 427 4 074 427 4 148 126
– Other fixed-term institutional deposits – – – 1 003 901 1 003 901 1 017 918
– Retail funding – – – 71 365 285 71 365 285 71 604 454
Derivative liabilities(1) 41, 42 – 14 704 – – 14 704 14 704 Level 2
Trade and other payables 17 – – – 2 202 631 2 202 631 2 202 631 (2)
2018Financial assets
Cash, cash equivalents and money market funds 4 – – 25 090 728 – 25 090 728 25 090 728 (2)
Held-to-maturity investments 5 – – 11 780 934 – 11 780 934 11 780 934 (2)
Available for sale investment 11 100 000 – – – 100 000 100 000 Level 3
Term deposit investments 6 – – 2 528 331 – 2 528 331 2 528 331 (2)
Net loans and advances 7 – – 41 814 395 – 41 814 395 44 147 508 Level 3
Other receivables 8 – – 579 424 – 579 424 579 424 (2)
Net insurance receivable 9 – – 245 204 – 245 204 245 204
Derivative assets(1) 10 – 129 – – 129 129 Level 2
Financial liabilities
Deposits and bonds 16 – – – 64 030 224 64 030 224 64 499 536 Level 2
– Listed bonds – – – 4 667 033 4 667 033 4 807 323
– Other fixed-term institutional deposits – – – 1 538 693 1 538 693 1 574 236
– Retail funding – – – 57 824 498 57 824 498 58 117 977
Derivative liabilities(1) 41, 42 – 54 576 – – 54 576 54 576 Level 2
Other liabilities 17 – – – 1 913 921 1 913 921 1 913 921 (2)
(1) Cash flow hedges.(2) The fair value of these assets and liabilities closely approximates their carrying amount due to their short-term or on-demand repayment terms.(3) Term deposit investments are short term.

224 | Capitec Bank Holdings Limited
Key performance indicators
Leadership reviews
The Capitec Way
Our business context
Our strategic goals and insights
Leadership teams and governance oversight
29. Financial risk management (continued)
29.9 Fair value calculation methods, inputs and techniques
Fair values of assets and liabilities reported in this note were market-based to reflect the perspective of a market participant.
Loans and advances to clients
The expected present value technique was applied, discounting probability weighted cash flows at a discount rate that ensures that no day-one fair value gain or loss arises on new loans. This considers that loans are granted at market-related rates at the time of the initiation. In the prior year an adjusted WACC rate was used.
The level 3 fair value disclosed for loans and advances required the use of judgement by management in determining what a market-based valuation would be. An income approach was used, which calculated an expected present value in terms of a discount rate for a hypothetical market participant applied to the valuation cash flows. In summary, this approach calculates a discount rate which reflects the cost to the market participant plus that participant’s required rate of return on investment.
The cash flows used were probability weighted and were generated by the same model that was used to generate the impairments on loans and advances. The key aspects involving the application of estimation of these cash flows are set out in note 3.2.3.
Derivative assets and liabilities
Derivatives, both assets and liabilities, were valued using the income approach. Derivatives comprise interest rate swaps, cross currency interest rate swaps and forward foreign exchange contracts (FECs). Interest rate swaps were fair valued on a discounted basis using forward interest rates and foreign currency rates extracted from observable yield and foreign currency market curves. FECs were valued using applicable forward rates.
Deposits and bonds
Deposits and bonds comprise liabilities with specified terms for future repayment as well as retail deposits with a call feature which allows them to be withdrawn on demand. The fair value of the retail call deposits closely approximates their carrying amount due to their demand nature. The fair values for instruments with specified future repayment terms were calculated as described below.
Listed subordinated and senior bonds
A market approach was used. Calculations used the all-in closing bond prices provided by the Johannesburg Stock Exchange’s Interest Rate and Currency (JSE IRC) market. The pricing method used by the JSE IRC links the bond at issue, to a liquid government bond (a companion bond). The companion bond is chosen so as to best fit the characteristics of the Capitec issue, with the time to maturity being the most important factor. Spread information is obtained from market participants and is used to adjust the price subsequent to issue. Very small and very large trades are excluded due to the inherent discounts associated with large trades as well as the premium often charged for odd-lot trades.
Unlisted wholesale funding
These comprised unlisted bonds, unlisted fixed-term negotiable instruments and other unlisted fixed-term wholesale instruments. The income approach was used. Fair values were calculated by discounting the contractual cash flows using publicly quoted closing swap curve rates from a large bank market-maker with a risk premium adjustment to account for non-performance risk. The market rate on the curve was determined with reference to the remaining maturity of the liability.
Retail fixed-term deposits
An income approach was used. Fair values were calculated by discounting the contractual cash flows using publicly quoted, closing Capitec fixed-term deposit rates. The relevant rate used was that which matched the remaining maturity of the fixed deposit.

Integrated Annual Report 2019 | 225
Risk management report
Remuneration report
Social responsibility
About this report
Appendices Annual financial statements
GROUP COMPANY
R’000 2019 2018 2019 2018
30. Retirement benefitsThe group contributed on behalf of all employees who elected to be members of the provident fund. The provident fund, a defined-contribution fund, is administered independently of the group and is subject to the Pension Funds Act, Act 24 of 1956. The amount contributed is included in salaries and bonus cost as per note 24. 227 894 194 272 –
Since 1 July 2001 it is compulsory for all new appointments to be members of the provident fund. The group will continue to contribute to the fund on behalf of all members. The group has no exposure in respect of any post-retirement benefits payable.
GROUP COMPANY
R’000 2019 2018 2019 2018
31. Related-party transactionsSubsidiaries
Dividends
Ordinary dividend received – – 2 015 556 1 631 808
Preference dividend received – – 8 785 12 023
Capitec Bank Limited – – 2 024 341 1 643 831
Management fees received – Capitec Bank Limited – – 2 201 3 704
Interest in subsidiaries are disclosed in note 12.
Loans due (from):
Capitec Bank Limited(1) – – (13 461) (14 751)
Keymatrix Proprietary Limited – – (1) (1)
Donations
Community Keepers(6) – – – 2 000
Parties with significant shareholding
Income statement charge
Interest paid 8 645 6 555 – –
Broker’s fees 248 230 – –
Sponsor fees 113 90 113 90
PSG and subsidiaries(2) 9 006 6 875 113 90
Statement of financial position balance
Listed senior bonds 72 238 83 376 – –
Unlisted negotiable instruments 71 285 156 532 – –
PSG and subsidiaries(2) 143 523 239 908 – –

226 | Capitec Bank Holdings Limited
Key performance indicators
Leadership reviews
The Capitec Way
Our business context
Our strategic goals and insights
Leadership teams and governance oversight
GROUP COMPANY
R’000 2019 2018 2019 2018
31. Related-party transactions (continued)
Key management
Key management employees’ remuneration
Salaries and other short-term benefits 47 211 45 013 – –
Post-employment benefits 2 039 2 066 – –
Share-based payments 109 319 56 252 – –
Key management compensation paid by subsidiaries(3) 158 569 103 331 – –
Loans and advances to directors and other key management employees advanced by subsidiaries and included in loans and advances to clients in respect of the share option scheme(4)
Loans outstanding at the beginning of the year 11 774 2 789 – –
Loans advanced during the year 7 787 13 329 – –
Interest charged on loans during the year 764 688 – –
Loan repayments during the year (15 266) (5 032) – –
Loans outstanding at the end of the year 5 059 11 774 – –
Retail deposits from directors and other key management employees(5)
Deposits at the beginning of the year 8 574 11 393 – –
Interest earned during the year 743 488 – –
Deposits/(withdrawals) made during the year 7 922 (3 307) – –
Deposits at the end of the year 17 239 8 574 – –
Directors’ interest in contracts
All directors of Capitec Bank Holdings Limited have given notice that they did not have a material interest in any significant contract with the company or any of its subsidiaries, which could have given rise to a conflict of interest during the year.
(1) The loan is subject to an unlimited cross suretyship.(2) Transactions requiring the purchase of financial instruments on the open market are conducted through PSG Wealth. PSG Capital is the
corporate advisor and sponsor of the group.(3) Key management is considered to be the members of the executive management committee, excluding development members. Key management
compensation excludes directors’ remuneration.(4) No loans were extended to directors. Loans to other key management employees by subsidiaries have fixed repayment terms and bear interest at
the official rate of interest for individuals as determined by the South African Revenue Service (SARS).(5) Savings and deposits are unsecured, carry variable interest rates and are repayable on demand.(6) For the year ended 28 February 2018, a R2 million donation in terms of section 18A was made to Community Keepers, a registered NPO that
provides psychological and social services to learners. Our CFO serves as the chairman of this organisation.

Integrated Annual Report 2019 | 227
Risk management report
Remuneration report
Social responsibility
About this report
Appendices Annual financial statements
Directors’ interest in share capital(1)
During the year the directors held, in aggregate, directly or indirectly, beneficially or non-beneficially, interests in 16 744 772 (2018: 16 847 813) Capitec Bank Holdings Limited shares, equivalent to 14.48%, (2018: 14.57%) of the issued share capital. The individual interests of the directors including those that resigned during the year were as follows:
Number of shares held
Beneficial Non-beneficial Total
Ordinary shares Direct Indirect** Direct Indirect** Shares %
2019
AP du Plessis* 1 000 1 030 000 – – 1 031 000 0.89
MS du Pré le Roux – 606 055 – 12 688 285 13 294 340 11.50
GM Fourie* 29 791 1 005 752 – 7 707 1 043 250 0.90
LA Dlamini – – – – – 0.00
NS Mashiya 748 – – – 748 0.00
JD McKenzie – – – – – 0.00
NS Mjoli-Mncube 75 400 – – – 75 400 0.07
PJ Mouton – 12 540 – – 12 540 0.01
CA Otto 1 064 – – 503 930 504 994 0.44
K Makwane – – – – – 0.00
R Stassen (Chairman) – – – 777 500 777 500 0.67
JP Verster 5 000 – – – 5 000 0.00
DP Meintjes(2) – – – – – 0.00
113 003 2 654 347 – 13 977 422 16 744 772 14.48
2018
AP du Plessis* – 1 030 000 – – 1 030 000 0.89
MS du P le Roux – – – 13 301 311 13 301 311 11.50
GM Fourie* 1 861 1 005 752 – 7 707 1 015 320 0.88
LA Dlamini(3) – – – – – 0.00
NS Mashiya 748 – – – 748 0.00
JD McKenzie – – – – – 0.00
NS Mjoli-Mncube 75 400 – – – 75 400 0.07
PJ Mouton – 12 540 – – 12 540 0.01
CA Otto 1 064 – – 503 930 504 994 0.44
K Makwane(4) – – – – – 0.00
R Stassen (Chairman) – – – 902 500 902 500 0.78
JP Verster 5 000 – – – 5 000 0.00
84 073 2 048 292 – 14 715 448 16 847 813 14.57
* Executive.** Includes shareholding through associates as defined in terms of the JSE Listings Requirements.
(1) No transactions occurred after year-end and before the date of approval of the annual financial statements that can impact any shareholding of any director.
(2) Appointed on 28 November 2018. (3) Appointed on 6 April 2017.(4) Appointed on 6 April 2017.
2019 2018
Preference sharesNumber
of shares %Number
of shares %
R Stassen (non-beneficial) 21 000 2.32 21 000 1.68
21 000 2.32 21 000 1.68

228 | Capitec Bank Holdings Limited
Key performance indicators
Leadership reviews
The Capitec Way
Our business context
Our strategic goals and insights
Leadership teams and governance oversight
31. Related-party transactions (continued)
Directors’ interest in share incentive scheme – options
Openingbalance
(Options exercised)/ Options granted
Closingbalance
Directors Maturity
dateIssue date
Strike price
R
Numberof shareoptions
Numberof shareoptions
Market price
RExercise
date
Number of share options
2019
AP du Plessis 1 Apr 18 11 Apr 12 198.52 5 000 (5 000) 844.00 5 Apr 18 –
(direct beneficial) 10 Apr 13 201.40 4 375 (4 375) 848.01 5 May 18 –
15 Apr 14 196.43 5 937 (5 937) 844.00 5 Apr 18 –
1 Apr 15 371.88 10 937 (10 937) 846.00 26 Apr 18 –
1 Apr 15 371.88 6 427 (6 427) 848.01 5 May 18 –
1 Apr 19 10 Apr 13 201.40 4 375 – – – 4 375
15 Apr 14 196.43 5 937 – – – 5 937
1 Apr 15 371.88 17 363 – – – 17 363
1 Apr 16 473.05 5 605 – – – 5 605
29 Mar 20 1 Apr 17 705.93 3 929 – – – 3 929
1 Apr 20 1 Apr 15 371.88 17 363 – – – 17 363
1 Apr 16 473.05 5 605 – – – 5 605
28 Mar 21 28 Mar 18 881.76 – 3 781 – – 3 781
29 Mar 21 1 Apr 17 705.93 3 929 – – – 3 929
1 Apr 21 1 Apr 16 473.05 5 605 – – – 5 605
28 Mar 22 28 Mar 18 881.76 – 3 780 – – 3 780
29 Mar 22 1 Apr 17 705.93 3 928 – – – 3 928
1 Apr 22 1 Apr 16 473.05 5 605 – – – 5 605
28 Mar 23 28 Mar 18 881.76 – 3 780 – – 3 780
29 Mar 23 1 Apr 17 705.93 3 928 – – – 3 928
28 Mar 24 28 Mar 18 881.76 – 3 780 – – 3 780
115 848 (17 555) 98 293

Integrated Annual Report 2019 | 229
Risk management report
Remuneration report
Social responsibility
About this report
Appendices Annual financial statements
Openingbalance
(Options exercised)/ Options granted
Closingbalance
Directors Maturity
dateIssue date
Strike price
R
Numberof shareoptions
Numberof shareoptions
Market price
RExercise
date
Number of share options
2019
GM Fourie 1 Apr 18 11 Apr 12 198.52 5 000 (5 000) 844.00 5 Apr 18 –
(direct beneficial) 10 Apr 13 201.40 4 375 (4 375) 957.40 24 Jul 18 –
15 Apr 14 196.43 4 583 (4 583) 957.40 24 Jul 18 –
1 Apr 15 371.88 22 872 (22 872) 844.00 5 Apr 18 –
1 Nov 18 1 Nov 13 209.83 6 875 (6 875) 1 079.54 26 Nov 18 –
1 Apr 19 10 Apr 13 201.40 4 375 – – – 4 375
15 Apr 14 196.43 4 583 – – – 4 583
1 Apr 15 371.88 22 872 – – – 22 872
1 Apr 16 473.05 9 170 – – – 9 170
1 Nov 19 1 Nov 13 209.83 6 875 – – – 6 875
29 Mar 20 1 Apr 17 705.93 6 377 – – – 6 377
1 Apr 20 1 Apr 15 371.88 22 871 – – – 22 871
1 Apr 16 473.05 9 169 – – – 9 169
28 Mar 21 28 Mar 18 881.76 – 5 740 – – 5 740
29 Mar 21 1 Apr 17 705.93 6 377 – – – 6 377
1 Apr 21 1 Apr 16 473.05 9 169 – – – 9 169
28 Mar 22 28 Mar 18 881.76 – 5 739 – – 5 739
29 Mar 22 1 Apr 17 705.93 6 377 – – – 6 377
1 Apr 22 1 Apr 16 473.05 9 169 – – – 9 169
28 Mar 23 28 Mar 18 881.76 – 5 739 – – 5 739
29 Mar 23 1 Apr 17 705.93 6 376 – – – 6 376
28 Mar 24 28 Mar 18 881.76 – 5 739 – – 5 739
167 465 (20 748) 146 717
NS Mashiya 1 Nov 18 2 Nov 15 539.88 8 875.00 – – – 8 875.00
(direct beneficial) 1 Apr 19 1 Apr 16 473.05 1 948.00 – – – 1 948.00
1 Nov 19 2 Nov 15 539.88 8 875.00 – – – 8 875.00
29 Mar 20 1 Apr 17 705.93 1 354.00 – – – 1 354.00
1 Apr 20 1 Apr 16 473.05 1 948.00 – – – 1 948.00
1 Nov 20 2 Nov 15 539.88 8 875.00 – – – 8 875.00
28 Mar 21 28 Mar 18 881.76 – 1 188.00 – – 1 188.00
29 Mar 21 1 Apr 17 705.93 1 354.00 – – – 1 354.00
1 Apr 21 1 Apr 16 473.05 1 948.00 – – – 1 948.00
28 Mar 22 28 Mar 18 881.76 – 1 187.00 – – 1 187.00
29 Mar 22 1 Apr 17 705.93 1 353.00 – – – 1 353.00
1 Apr 22 1 Apr 16 473.05 1 947.00 – – – 1 947.00
28 Mar 23 28 Mar 18 881.76 – 1 187.00 – – 1 187.00
29 Mar 23 1 Apr 17 705.93 1 353.00 – – – 1 353.00
28 Mar 24 28 Mar 18 881.76 – 1 187.00 – – 1 187.00
39 830 4 749 44 579

230 | Capitec Bank Holdings Limited
Key performance indicators
Leadership reviews
The Capitec Way
Our business context
Our strategic goals and insights
Leadership teams and governance oversight
31. Related-party transactions (continued)
Openingbalance
(Options exercised)/ Options granted
Closingbalance
Directors Maturity
dateIssue date
Strike price
R
Numberof shareoptions
Numberof shareoptions
Market price
RExercise
date
Number of share options
R Stassen 1 Apr 18 11 Apr 12 198.52 12 500 (12 500) 862.83 29 Mar 18 –
(direct beneficial)
12 500 (12 500) –
Total 335 643 (46 054) 289 589
Directors’ interest in share incentive scheme – share appreciation rights (SARs)Openingbalance
(SARs exercised)/SARs granted
Closingbalance
Directors Maturity
dateIssue date
SARexercise
priceR
Number of SARs
Number of SARs
Marketprice
RExercise
dateNumber of SARs
2019
AP du Plessis 1 Apr 18 11 Apr 12 198.52 5 000 (5 000) 874.00 25 Apr 18 –
(direct beneficial) 10 Apr 13 201.40 4 375 (4 375) 874.00 25 Apr 18 –
15 Apr 14 0.01 2 016 (2 016) 874.00 25 Apr 18 –
1 Apr 15 0.01 5 904 (5 904) 874.00 25 Apr 18 –
1 Apr 19 10 Apr 13 201.40 4 375 – – – 4 375
15 Apr 14 0.01 2 017 – – – 2 017
1 Apr 15 0.01 5 903 – – – 5 903
1 Apr 16 473.05 5 605 – – – 5 605
29 Mar 20 1 Apr 17 705.93 3 929 – – – 3 929
1 Apr 20 1 Apr 15 0.01 5 903 – – – 5 903
1 Apr 16 473.05 5 605 – – – 5 605
28 Mar 21 28 Mar 18 881.76 – 3 781 – – 3 781
29 Mar 21 1 Apr 17 705.93 3 929 – – – 3 929
1 Apr 21 1 Apr 16 473.05 5 605 – – – 5 605
28 Mar 22 28 Mar 18 881.76 – 3 780 – – 3 780
29 Mar 22 1 Apr 17 705.93 3 928 – – – 3 928
1 Apr 22 1 Apr 16 473.05 5 605 – – – 5 605
28 Mar 23 28 Mar 18 881.76 – 3 780 – – 3 780
29 Mar 23 1 Apr 17 705.93 3 928 – – – 3 928
28 Mar 24 28 Mar 18 881.76 – 3 780 – – 3 780
73 627 (2 174) 71 453

Integrated Annual Report 2019 | 231
Risk management report
Remuneration report
Social responsibility
About this report
Appendices Annual financial statements
Openingbalance
(SARs exercised)/SARs granted
Closingbalance
Directors Maturity
dateIssue date
SARexercise
priceR
Number of SARs
Number of SARs
Marketprice
RExercise
dateNumber of SARs
2019
GM Fourie 1 Apr 18 11 Apr 12 198.52 5 000 (5 000) 874.00 15 May 18 –
(direct beneficial) 10 Apr 13 201.40 4 375 (4 375) 874.00 15 May 18 –
15 Apr 14 0.01 1 556 (1 556) 874.00 15 May 18 –
1 Apr 15 0.01 7 777 (7 777) 874.00 15 May 18 –
1 Nov 18 1 Nov 13 209.83 6 875 (6 875) 1 090.00 23 Nov 18 –
1 Apr 19 10 Apr 13 201.40 4 375 – – – 4 375
15 Apr 14 0.01 1 557 – – – 1 557
01 Apr 15 0.01 7 776 – – – 7 776
1 Apr 16 473.05 9 170 – – – 9 170
1 Nov 19 1 Nov 13 209.83 6 875 – – – 6 875
29 Mar 20 1 Apr 17 705.93 6 377 – – – 6 377
1 Apr 20 1 Apr 15 0.01 7 776 – – – 7 776
1 Apr 16 473.05 9 169 – – – 9 169
28 Mar 21 28 Mar 18 881.76 – 5 740 – – 5 740
29 Mar 21 1 Apr 17 705.93 6 377 – – – 6 377
1 Apr 21 1 Apr 16 473.05 9 169 – – – 9 169
28 Mar 22 28 Mar 18 881.76 – 5 739 – – 5 739
29 Mar 22 1 Apr 17 705.93 6 377 – – – 6 377
1 Apr 22 1 Apr 16 473.05 9 169 – – – 9 169
28 Mar 23 28 Mar 18 881.76 – 5 739 – – 5 739
29 Mar 23 1 Apr 17 705.93 6 376 – – – 6 376
28 Mar 24 28 Mar 18 881.76 – 5 739 – – 5 739
116 126 (2 626) 113 500
NS Mashiya 1 Nov 18 2 Nov 15 0.01 3 000 – – – 3 000
(direct beneficial) 1 Apr 19 1 Apr 16 473.05 1 948 – – – 1 948
1 Nov 19 2 Nov 15 0.01 3 000 – – – 3 000
29 Mar 20 1 Apr 17 705.93 1 354 – – – 1 354
1 Apr 20 1 Apr 16 473.05 1 948 – – – 1 948
1 Nov 20 2 Nov 15 0.01 3 000 – – – 3 000
28 Mar 21 28 Mar 18 881.76 – 1 188 – – 1 188
29 Mar 21 1 Apr 17 705.93 1 354 – – – 1 354
1 Apr 21 1 Apr 16 473.05 1 948 – – – 1 948
28 Mar 22 28 Mar 18 881.76 – 1 187 – – 1 187
29 Mar 22 1 Apr 17 705.93 1 353 – – – 1 353
1 Apr 22 1 Apr 16 473.05 1 947 – – – 1 947
28 Mar 23 28 Mar 18 881.76 – 1 187 – – 1 187
29 Mar 23 1 Apr 17 705.93 1 353 – – – 1 353
28 Mar 24 28 Mar 18 881.76 – 1 187 – – 1 187
22 205 4 749 26 954
R Stassen 1 Apr 18 11 Apr 12 198.52 12 500 (12 500) 900.00 28 Mar 18 –
(direct beneficial)
12 500 (12 500) –
Total 224 458 (12 551) 211 907

232 | Capitec Bank Holdings Limited
Key performance indicators
Leadership reviews
The Capitec Way
Our business context
Our strategic goals and insights
Leadership teams and governance oversight
31. Related-party transactions (continued)Directors’ remuneration(1)
The total share option expense relating to directors amounted to R11 466 369 (2018: R20 687 552) and share appreciation rights expense amounted to R82 105 694 (2018: R43 965 653). This includes the movement on all tranches.
R’000 SalariesFringe
benefits Bonuses Fees Total
Fair value of options and rights
granted during the
year on reporting
date
2019
Executive(1)
AP du Plessis 9 106 74 3 647 – 12 827 3 805
GM Fourie 11 646 30 4 651 – 16 327 5 777
NS Mashiya 4 314 44 1 718 – 6 076 1 195
Non-executive
MS du P le Roux 325 325 –
LA Dlamini 660 660 –
K Makwane 445 445 –
DP Meintjes(2) 84 84 –
JD McKenzie 1 165 1 165 –
NS Mjoli-Mncube 325 325 –
PJ Mouton 685 685 –
CA Otto 685 685 –
R Stassen (Chairman) 1 390 1 390 –
JP Verster 795 795 –
25 066 148 10 016 6 559 41 789 10 777
2018
Executive(1)
AP du Plessis 8 170 77 3 118 – 11 365 1 983
GM Fourie 10 625 329 4 049 – 15 003 3 219
NS Mashiya 4 001 41 1 523 – 5 565 683
Non-executive
MS du P le Roux – – – 300 300 –
LA Dlamini(3) – – – 325 325 –
K Makwane(4) – – – 271 271 –
JD McKenzie – – – 670 670 –
NS Mjoli-Mncube – – – 360 360 –
PJ Mouton – – – 480 480 –
CA Otto – – – 670 670 –
R Stassen (Chairman) – – – 1 300 1 300 –
JP Verster – – – 610 610 –
22 796 447 8 690 4 986 36 919 5 885
(1) The executive directors are the prescribed officers of the company.(2) Appointed on 28 November 2018.(3) Appointed on 6 April 2017.(4) Appointed on 6 April 2017.

Integrated Annual Report 2019 | 233
Risk management report
Remuneration report
Social responsibility
About this report
Appendices Annual financial statements
GROUP COMPANY
R’000 2019 2018 2019 2018
32. Cash flow from operationsNet profit before tax and equity accounted earnings 7 074 865 6 152 715 2 024 341 1 643 831
Deduct interest income (15 501 072) (15 474 457) (225) (215)
Add back interest expenses 4 509 549 4 184 449 – –
Add back interest received 15 255 526 15 335 553 225 215
Deduct interest paid (4 518 607) (4 194 240) – –
Adjusted for non-cash items
Movement in provision for credit impairments 3 649 162 (102 282) – –
Bad debts written off 1 268 257 6 662 691 – –
ECL – non-loan book 3 016 – – –
Depreciation 437 078 420 272 – –
Amortisation 196 381 139 878 – –
Loss on disposal of assets 9 616 2 940 – –
Share-based employee costs – options 31 950 36 709 – –
Movements in assets and liabilities
Loans and advances(1)(3) (8 459 084) (9 164 538) – –
Other receivables (920 699) 149 652 1 743 1 990
Net insurance receivables(3) 8 812 10 156 – –
Derivatives (16 404) 46 127 (3 210) –
Retail deposits and other wholesale funding(2) 13 041 447 9 067 744 – –
Trade and other payables 216 383 431 423 (227) 3 848
Movements in provisions 24 170 (14 189) – –
Share-based employee costs – share appreciation rights 73 077 (16 758) – –
Cash flow from operations 16 383 423 13 673 845 2 022 647 1 649 669
(1) Movement in loans and advances to clients (8 459 084) (9 164 538)
Gross loans advances opening balance 47 642 490 45 135 357
Gross loans and advances closing balance (54 879 145) (47 642 490)
Movement in accrued interest 45 828 5 286
Bad debts written off (1 268 257) (6 662 691)
(2) Retail deposits and wholesale funding 13 041 447 9 067 744
Movement in retail deposits 13 531 990 9 769 871
Movement in other wholesale funding and unlisted negotiable instruments (490 543) (702 127)
(3) In the movements in assets and liabilities reconciliation of the comparatives, third-party cell captive costs of R563 million was shown as a cash outflow of net insurance receivables and cash inflow of loans and advances. As these are cash flows of the cell captive as opposed to the group, the comparatives have been netted in the current year.

234 | Capitec Bank Holdings Limited
Key performance indicators
Leadership reviews
The Capitec Way
Our business context
Our strategic goals and insights
Leadership teams and governance oversight
GROUP COMPANY
R’000 2019 2018 2019 2018
33. Income taxes paidBalance at the beginning of the year (107 154) 30 341 – –
Changes on initial application of IFRS 9 taken to equity (see note 2.19) 518 474 –
Income statement charge 1 781 419 1 684 534 – –
Movement in deferred tax 435 432 (68 936) – –
Tax effect on settlement of share options taken to equity (101 098) (11 648) – –
Balance at the end of the year 286 046 107 154 – –
Income tax paid 2 813 119 1 741 445 – –
34. Dividends paidBalance at the beginning of the year 8 258 9 652 8 258 9 652
Dividend declared during the year:
Ordinary dividend 1 821 125 1 531 483 1 821 125 1 532 058
Preference dividend 8 785 12 023 8 785 12 023
Balance at the end of the year (7 509) (8 258) (7 509) (8 258)
Dividends paid 1 830 659 1 544 900 1 830 659 1 545 475
35. Realised loss on settlement of employee share options less participants’ contributionsNil (2018: Nil) ordinary shares issued – – – –
Shares acquired (215 199) (224 918) – –
Fair value of shares utilised to settle share options(1)(2) (215 199) (224 918) – –
Proceeds on settlement of options(1)(2) 63 254 73 787 – –
(151 945) (151 131) – –
(1) Refer to note 38.(2) In the current year, the cash inflow from participants to settle employee share options was disclosed separately from the cash outflow for shares
acquired to settle employee share options.

Integrated Annual Report 2019 | 235
Risk management report
Remuneration report
Social responsibility
About this report
Appendices Annual financial statements
GROUP COMPANY
R’000 2019 2018 2019 2018
36. Commitments and contingent liabilitiesProperty operating lease commitments(1)
The future aggregate minimum lease payments under non-cancellable leases are as follows:
Within 1 year 508 383 468 968 – –
From 1 to 5 years 1 254 205 1 292 109 – –
After 5 years 157 654 269 015 – –
Total future cash flows 1 920 242 2 030 092 – –
Straight-lining accrued (147 418) (135 151) – –
Future expenses 1 772 824 1 894 941 – –
Sub-lease payments:Future minimum lease payments expected to be received in relation to non-cancellable sub-leases of operating leases 3 162 4 395 – –
(1) The group leases various branches under non-cancellable operating leases expiring within 1 to 11 years. The leases have varying terms, escalation clauses and renewal rights. On renewal, the terms of the leases are renegotiated. Excess space is sublet to third parties also under non-cancellable operating leases.
Capital commitments – approved by the board
Contracted for
Property and equipment 572 348 147 649 – –
Intangible assets 116 017 15 777 – –
Not contracted for
Property and equipment 973 314 896 644 – –
Intangible assets 439 616 242 522 – –
2 101 295 1 302 592 – –
37. Borrowing powersIn terms of the memorandum of incorporation of Capitec Bank Holdings Limited, the directors may at their discretion raise or borrow money for the purpose of the business of the company without limitation.
These borrowing powers are subject to the limitations of the Banks Act and section 45(3)(a)(ii) of the Companies Act. A special resolution was passed at the annual general meeting on 26 May 2017 authorising the board to approve that the company provides any financial assistance that it deems fit to any related or inter-related company to the company, on the terms and conditions and for the amounts that the board may determine.
The increase in borrowings from the previous year is for the purposes of funding the general banking business, including future expansion of the loan book and capital expenditure.

236 | Capitec Bank Holdings Limited
Key performance indicators
Leadership reviews
The Capitec Way
Our business context
Our strategic goals and insights
Leadership teams and governance oversight
38. Share incentive schemeThe share incentive scheme is authorised and adopted by the shareholders of Capitec Bank Holdings Limited (CBHL). The trustees act in terms of the powers bestowed on them by the trust deed and receive instructions from time to time from the boards of CBHL and the group. The group provides the finance required from time to time by the trustees to perform their duties. Service costs of options issued to employees of subsidiaries of CBHL are financed by the relevant subsidiary.
The group allows its employees to purchase shares in CBHL up to a value not exceeding 20% (2018: 20%) of their monthly salary.
The purchase price includes a subsidy of 20% (2018: 20%) and the transaction costs are borne by the company.
The shares are held by the trustees on behalf of the participants for as long as required to save the holding expenses of a broker account for participants.
The group offers share options in CBHL to members of management who are able to make significant contributions to the achievement of the group’s objectives. Options are conditional on the employee completing the vesting period applicable to each group of options issued to that employee.
The share incentive scheme prescribes that options, with durations ranging from two to six years, should be allocated at the market value, determined as the weighted average price per share over a period of 30 trading days on the JSE prior to the date of allocation.
2019 2018
Weightedaverage
share price R Number Number
Options issued to employees of Capitec Bank Limited
Balance at the beginning of the year 385.61 777 342 962 709
Options granted 881.76 99 085 96 188
Options cancelled and/or lapsed – – –
Options exercised 266.98 (236 926) (281 555)
Balance at the end of the year 506.44 639 501 777 342
SARs issued to employees of Capitec Bank Limited
Balance at the beginning of the year 319.95 518 652 602 547
SARs granted 881.76 99 085 96 188
SARs cancelled and/or lapsed – – –
SARs exercised 134.73 (146 952) (180 083)
Balance at the end of the year 496.18 470 785 518 652

Integrated Annual Report 2019 | 237
Risk management report
Remuneration report
Social responsibility
About this report
Appendices Annual financial statements
2019 2018
Analysis of outstanding share options by year of maturity
Weighted average
strike priceR Number
Weighted average
strike priceR Number
Financial year
2017/2018 – – – –
2018/2019 482.31 10 750 276.32 247 676
2019/2020 324.78 232 954 324.78 232 954
2020/2021 459.69 152 860 459.69 152 860
2021/2022 661.94 84 687 571.02 59 910
2022/2023 661.93 84 673 571.02 59 902
2023/2024 795.16 48 809 705.93 24 040
2024/2025 881.76 24 768 – –
506.44 639 501 385.61 777 342
Number 2019 2018
Shares available from previous period – –
Shares purchased/issued during the year 236 926 281 555
Shares utilised for settlement of options (236 926) (281 555)
Shares available for settlement of options – –
Settled in shares (236 926) (281 555)
Options exercised (236 926) (281 555)
2019 2018
Analysis of outstanding SARs by year of maturity
Weighted average
strike priceR Number
Weighted average
strike priceR Number
Financial year
2017/2018 – – 166.64 1 875
2018/2019 0.01 3 000 131.04 148 077
2019/2020 199.66 133 353 199.66 133 353
2020/2021 373.93 91 495 373.93 91 495
2021/2022 661.94 84 687 571.02 59 910
2022/2023 661.93 84 673 571.02 59 902
2023/2024 795.16 48 809 705.93 24 040
2024/2025 881.76 24 768 – –
496.18 470 785 319.95 518 652

238 | Capitec Bank Holdings Limited
Key performance indicators
Leadership reviews
The Capitec Way
Our business context
Our strategic goals and insights
Leadership teams and governance oversight
39. Share option expenseData utilised in the valuation of options granted
The table below provides detail regarding the data used in the valuation of the share options to which IFRS 2 has been applied. A Black-Scholes option pricing model was used to value the options.
Year granted
Strikeprice
R
Shareprice on
issue dateR
Volatilityused in
valuation%
Dividendyield
%Year
maturing(1)
Risk-freerate
%
Numberof options
out-standing
Fair valueon issue/repricing
dateignoring vesting
conditionsR’000
Expectedvesting
pro-portion(2)
%
Valuetaking into
accountexpected
vestingproportion
R’000
2013/2014 201.40 217.50 32.1 3.0 2019/2020 5.8 37 500 2 653 100.0 2 653
209.83 213.50 32.1 3.0 2018/2019 5.8 1 875 126 100.0 126
213.50 32.1 3.0 2019/2020 7.7 8 750 635 100.0 635
2014/2015 196.43 206.50 31.5 3.3 2019/2020 7.7 29 891 1 936 100.0 1 936
253.82 288.32 31.2 2.5 2019/2020 6.8 28 000 2 848 100.0 2 848
2015/2016 539.88 598.04 31.3 1.2 2018/2019 6.8 8 875 1 703 100.0 1 703
598.04 31.3 1.2 2019/2020 7.5 8 875 1 950 100.0 1 950
598.04 31.3 1.2 2020/2021 7.7 8 875 2 162 100.0 2 162
371.88 535.00 27.3 1.7 2019/2020 6.9 84 071 19 456 100.0 19 456
535.00 27.3 1.7 2020/2021 7.1 84 070 20 574 100.0 20 574
2016/2017 473.05 573.08 36.1 2.3 2019/2020 7.5 33 264 6 820 100.0 6 820
573.08 36.1 2.3 2020/2021 7.7 33 260 7 507 100.0 7 507
573.08 36.1 2.3 2021/2022 7.8 33 257 8 066 100.0 8 066
573.08 36.1 2.3 2022/2023 7.9 33 253 8 531 100.0 8 531
576.29 555.60 36.2 2.1 2019/2020 7.9 2 603 399 100.0 399
555.60 36.2 2.1 2020/2021 8.1 2 603 466 100.0 466
555.60 36.2 2.1 2021/2022 8.2 2 603 521 100.0 521
555.60 36.2 2.1 2022/2023 8.3 2 603 569 100.0 569
2017/2018 705.93 761.37 24.2 1.1 2020/2021 7.3 24 052 5 053 100.0 5 053
761.37 24.2 1.1 2021/2022 7.3 24 050 5 834 100.0 5 834
761.37 24.2 1.1 2022/2023 7.4 24 046 6 555 100.0 6 555
761.37 24.2 1.1 2023/2024 7.5 24 040 7 216 100.0 7 216
2018/2019 881.76 862.83 31.9 1.7 2021/2022 6.9 24 777 5 464 100.0 5 464
862.83 31.9 1.7 2022/2023 6.9 24 771 6 354 100.0 6 354
862.83 31.9 1.7 2023/2024 7.0 24 769 7 138 100.0 7 138
862.83 31.9 1.7 2024/2025 7.1 24 768 7 835 100.0 7 835
Grand total 639 501 138 371 100.0 138 371
(1) Executive staff turnover of 0% p.a. (2018:0%) was used to estimate the likelihood of vesting conditions realising. This is re-estimated in terms of IFRS 2 on an annual basis.
(2) The remuneration committee approved changes to the performance conditions relating to share options granted in 2017/2018. These performance conditions are that the HEPS growth must exceed the Consumer Price Index (CPI) plus the percentage growth in GDP plus 4%, and the attained ROE must out perform the average ROE of the 4 traditional banks in South Africa. Each performance condition carries a weighting of 50%, and is measured over a cumulative three year performance period. The assumption that both of the above performance conditions would be met was used to estimate the realisation of these vesting conditions . This is re-estimated in terms of IFRS 2 on an annual basis.

Integrated Annual Report 2019 | 239
Risk management report
Remuneration report
Social responsibility
About this report
Appendices Annual financial statements
40. Share appreciation rightsData utilised in the valuation of SARs grantedThe table below provides detail regarding the data used in the valuation of the SARs to which IFRS 2 has been applied. SARs are expected to vest and are re-estimated on an annual basis(1).
Year granted
Strike price
R(2)
Yearmaturing(3)
Risk-free rate
%
Numberof SARs
outstandingFair value
R’000
Portionof termexpired
%
Expectedvesting
proportion(2)
%
Liability atyear-end
R’000
2013/2014 201.40 2019/2020 7.1 37 500 41 421 98.5 100.0 40 815
– 2019/2020 7.3 8 750 9 581 88.8 100.0 8 505
2014/2015 0.01 2019/2020 7.1 10 154 13 248 98.2 100.0 13 014
– 2019/2020 7.3 9 500 12 303 86.5 100.0 10 644
2015/2016 0.01 2018/2019 7.1 3 000 3 918 100.0 100.0 3 918
– 2019/2020 7.1 28 582 37 292 97.8 100.0 36 476
– 2019/2020 7.3 3 000 3 885 83.2 100.0 3 231
– 2020/2021 7.6 28 580 36 819 78.2 100.0 28 798
– 2020/2021 7.5 3 000 3 836 66.5 100.0 2 550
2016/2017 473.05 2019/2020 7.1 33 264 27 760 97.1 100.0 26 949
– 2020/2021 7.6 33 260 28 322 72.8 100.0 20 606
– 2021/2022 7.5 33 257 28 776 58.2 100.0 16 752
– 2022/2023 7.5 33 253 29 203 48.5 100.0 14 168
576.29 2019/2020 7.3 2 603 1 920 89.1 100.0 1 711
– 2020/2021 7.6 2 603 1 982 66.8 100.0 1 324
– 2021/2022 7.6 2 603 2 037 53.5 100.0 1 089
– 2022/2023 7.5 2 603 2 085 44.5 100.0 929
2017/2018 705.93 2020/2021 7.6 24 052 15 312 63.9 100.0 9 778
– 2021/2022 7.5 24 050 16 045 47.9 100.0 7 681
– 2022/2023 7.5 24 046 16 753 38.3 100.0 6 414
– 2023/2024 7.5 24 040 17 346 31.9 100.0 5 534
2018/2019 881.76 2021/2022 7.5 24 777 13 024 30.7 100.0 4 005
– 2022/2023 7.5 24 771 14 103 23.1 100.0 3 253
– 2023/2024 7.5 24 769 15 002 18.5 100.0 2 769
– 2024/2025 7.6 24 768 15 871 15.4 100.0 2 440
Grand total 470 785 407 845 67.0 100.0 273 353
Note 17
(1) All rights were valued using the Black-Scholes model and the following variables:Dividend yield 1.3%Volatility(5) 25.2%Ex dividend share price 1 295.13
(2) Executive staff turnover of 0% p.a. (2018:0%) was used to estimated likelihood of vesting conditions realising. This is re-estimate in terms of IFRS 2 on an annual basis.
(3) As from the 2016 financial year:SARs are granted at a strike price equal to the 30 day weighted average share price up to and including the day before the resolution granting the respective SARs was passed.There is a fixed ratio between the number of SARs and share options granted.
(4) The remuneration committee approved changes to the performance conditions relating to share appreciation rights granted in 2017/2018. These performance conditions are the HEPS growth must exceed the Consumer Price Index (CPI) plus the percentage growth in GDP plus 4%, and the attained ROE must out perform the average ROE of the 4 traditional banks in South Africa. Each performance condition carries a weighting of 50%, and is measured over a cumulative three year performance period.
(5) The expected price volatility is based on the historic 12 month volatility, adjusted for any expected changes to future volatility due to publicly available information.

240 | Capitec Bank Holdings Limited
Key performance indicators
Leadership reviews
The Capitec Way
Our business context
Our strategic goals and insights
Leadership teams and governance oversight
41. Derivative financial instruments: economic hedges
R’000
Notional Fair values
Foreign ZAR Assets Liabilities
2019
Forward foreign exchange contracts – USD – – – –
Forward foreign exchange contracts – EUR – – – –
Total – – –
2018
Forward foreign exchange contracts – USD 1 921 35 461 – 12 820
Forward foreign exchange contracts – EUR 7 000 109 030 – 3 210
Total 144 491 – 16 030
Forward foreign exchange contracts represent commitments to purchase foreign currency, including undelivered spot transactions and were entered into to match corresponding expected future transactions.
42. Derivative financial instruments: cash flow hedges Notional Fair values
R’000 USD ZAR Assets Liabilities
2019
Interest rate swaps – 3 322 000 (479) 14 704
Net – 3 322 000 (479) 14 704
2018
Interest rate swaps – 3 766 000 (129) 38 546
Net – 3 766 000 (129) 38 546
R’000Demand
to 1 month1 to
3 months3 months to 1 year
More than 1 year Grand total
2019
Discounted swap cash flows 271 2 508 7 134 4 312 14 225
Net 271 2 508 7 134 4 312 14 225
2018
Discounted swap cash flows 296 4 532 14 728 18 861 38 417
Net 296 4 532 14 728 18 861 38 417

Integrated Annual Report 2019 | 241
Risk management report
Remuneration report
Social responsibility
About this report
Appendices Annual financial statements
Gains and losses recognised in other comprehensive income (note 20) on swap contracts will be continuously released to the income statement in line with the interest expense and foreign currency movement on the underlying hedged items.
The forecast cash flows presented above show how the cash flow hedging reserve will be released to the income statement over time. The swaps have quarterly reset and settlement dates. The forecast cash flows were based on contracted interest and ruling exchange rates. The hedged items comprise variable rate bonds and negotiable instruments detailed in note 16. To ensure hedge effectiveness, the variable rate cash flows on the hedged items are matched with variable rate interest rate swap cash flows (hedging instruments) by entering into swaps where amounts, interest rates and maturities of the swaps exactly match the hedged items.
At 28 February 2019, the swap fixed interest rates were between 7.030% and 8.510% (2018: 6.590% and 8.510%) and the floating rates were based on forecast 3-month JIBAR rates at 28 February 2019.
The fair value adjustment transferred to the income statement amounted to R19 million (2018: R80 million) and is credited to interest expense. In 2018 and 2019 there were no transactions for which cash flow hedge accounting had to be discontinued due to highly probable cash flow no longer expected to occur.
43. Events past the date of the statement of financial positionIn November 2018, Capitec Bank Limited was announced as the winning bidder for the 100% acquisition of Mercantile Bank Holdings Limited. The deal was signed in January 2019 subject to regulatory approval. All regulatory applications, to both the Prudential Authority and Competition Commission, were filed in the 2019 financial year. In terms of the Share Sale and Purchase Agreement, Capitec Bank Limited has paid a deposit of R110 million to the seller and instructed a bank guarantee to be issued to the seller to the value of R3.09 billion, secured by term deposits included in note 6. It is expected that the Regulators will provide their feedback within the first half of the 2020 financial year.

242 | Capitec Bank Holdings Limited
Key performance indicators
Leadership reviews
The Capitec Way
Our business context
Our strategic goals and insights
Leadership teams and governance oversight
Shares heldNumber
Shareholding%
Shareholders holding more than 5% of the company’s ordinary shares
2019
Shareholder
PSG Financial Services Limited 35 484 898 30.69
Limietberg Sekuriteit (Pty) Ltd 8 547 063 7.39
Government Employee Pension Fund 7 563 462 6.54
Shares heldNumber
Shareholding%
Black economic empowerment shareholding2019
Shareholder
Coral Lagoon 194 Proprietary Limited 1 354 435 1.17
Lebashe Investment Group (Pty) Ltd (Petratouch) 5 284 735 4.57
K2017134938(SOUTH AFRICA)(PTY)LTD 3 125 067 2.70
CB Employee Holdings (Pty) Ltd 235 763 0.20
NS Mjoli-Mncube (director) 75 400 0.07
NST Motjuwadi (executive officer) 18 613 0.02
NS Mashiya (director) 748 0.00
10 094 761 8.73
Shares heldNumber
Shareholding%
Shareholding by executive management(1)
2019
Shareholder
JE Carstens 38 332 0.03
W de Bruyn 107 984 0.09
HAJ Lourens 504 739 0.43
NST Motjuwadi 18 613 0.02
A Olivier 132 737 0.11
L Venter 521 250 0.45
F Viviers 4 541 0.00
1 328 196 1.13
(1) Executive directors’ shareholdings are presented in the related parties note.
Statutory information

Integrated Annual Report 2019 | 243
Risk management report
Remuneration report
Social responsibility
About this report
Appendices Annual financial statements
Analysis of shareholders holding ordinary shares – 2019Number
shareholders%
of totalNumber
shares% of
interest
1 – 1 000 11 484 86.97 1 602 715 1.39
1 001 – 10 000 1 280 9.69 4 116 716 3.56
10 001 – 100 000 336 2.54 10 264 413 8.88
100 001 and over 105 0.80 99 643 147 86.17
13 205 100.00 115 626 991 100.00
Shareholder spread
Public shareholders 13 177 99.79 62 893 279 54.40
Holdings less than 5% 13 176 99.78 55 329 817 47.85
Holdings of 5% and more 1 0.01 7 563 462 6.54
Non-public shareholders excluding directors and their associates 3 0.02 35 988 940 31.12
Holdings of 5% or less 2 0.02 504 042 0.44
Trustees of the Capitec Bank Holdings Share Trust 1 0.01 268 279 0.23
CB Employee Holdings (Pty) Ltd 1 0.01 235 763 0.20
Holdings of 5% or more 1 0.01 35 484 898 30.69
PSG Financial Services Limited 1 0.01 35 484 898 30.69
Directors (refer to pages 74 to 77 for detail) 25 0.19 16 744 772 14.48
Directors of company or any subsidiaries 6 0.05 113 003 0.10
Associates of directors of company or any of its subsidiaries 19 0.14 16 631 769 14.38
13 205 100.00 115 626 991 100.00
Analysis of shareholders holding non-redeemable, non-cumulative, non-participating preference shares – 2019
Numbershareholders
% of total
Number shares
% of interest
1 – 1 000 552 74.90 113 179 12.52
1 001 – 10 000 169 22.93 521 242 57.66
10 001 – 100 000 16 2.17 269 628 29.82
100 001 and over – – – –
737 100.00 904 049 100.00
Shareholder spread
Public shareholders 736 99.86 883 049 97.68
Holdings less than 5% 736 99.86 883 049 97.68
There are no public shareholders that hold 5% or more – – – –
Non-public shareholders excluding directors and their associates – – – –
There are no non-public shareholders excluding directors and/or their associates – – – –
Directors (refer to pages 74 to 77 for detail) 1 0.14 21 000 2.32
None of the directors hold preference shares – – – –
Associates of directors of company or any of its subsidiaries 1 0.14 21 000 2.32
737 100.00 904 049 100.00

244 | Capitec Bank Holdings Limited
Key performance indicators
Leadership reviews
The Capitec Way
Our business context
Our strategic goals and insights
Leadership teams and governance oversight
Shareholders’ calendar Administration and addressesFinancial year-end28 February 2019
Capitec Bank Holdings Limited
Registration number1999/025903/06
Profit announcement27 March 2019 Auditor
PricewaterhouseCoopers Inc.
Integrated annual reportApril 2019 Directors
R Stassen (Chairman)
Annual general meeting31 May 2019
GM Fourie (Chief executive officer)*
AP du Plessis (Chief financial officer)*
NS Mashiya (Chief risk officer)*
Interim reportSeptember 2019
MS du Pré le Roux
LA Dlamini (Ms)
K Makwane
JSE code DP Meintjes (appointed 28 November 2018)
CPI JD McKenzie
NS Mjoli-Mncube (Ms)
ISIN PJ Mouton
ZAE 000035861 CA Otto
JP Verster
Final dividend number 30 will be paid on 23 April 2019. * Executive
Salient dates for the dividend payment were: Last day to trade cum dividendMonday, 15 April 2019
SecretaryYM Mouton (Ms)
Registered address1 Quantum Street, Techno Park, Stellenbosch 7600
Postal addressPO Box 12451, Die Boord, Stellenbosch 7613
Websitewww.capitecbank.co.za
Record dateThursday, 18 April 2019
Statutory information

CA
PIT
EC
BA
NK
HO
LDIN
GS
LIMIT
ED
INT
EG
RA
TE
D A
NN
UA
L RE
PO
RT
2019
Join the Capitec family and follow us
Each platform has a different purpose, so find the one that fits yourpersonality and become part of the conversation.
capitecbank.co.za
Capitec Bank Capitec BankCapitec Bank SA CapitecBank Capitec Bank