University of Gondar - IJCRT
70
University of Gondar Faculty of Natural and Computational Sciences Department of Chemistry Postgraduate Program “Studies on Assessment of physicochemical and the concentration of selected metals in drinking water in Gondar Town” By Abera Haile Adello A thesis submitted to the Department of Chemistry, University of Gondar for the partial fulfillment and requirements of Masters Degree in Applied Chemistry May, 2012 Gondar, Ethiopia
-
Upload
khangminh22 -
Category
Documents
-
view
3 -
download
0
Transcript of University of Gondar - IJCRT
University of Gondar
Faculty of Natural and Computational Sciences
Department of Chemistry
Postgraduate Program
“Studies on Assessment of physicochemical and the
concentration of selected metals in drinking water in
Gondar Town”
By
Abera Haile Adello
A thesis submitted to the Department of Chemistry, University
of Gondar for the partial fulfillment and requirements of
Masters Degree in Applied Chemistry
May, 2012
Gondar, Ethiopia


i
Acknowledgement
It is my First and foremost extended sincere thank to the Almighty God keeping all my families
and me safe throughout my educational journey.
I convey my deepest thanks to my major advisor Dr. Alemayehu Abebaw for giving me
constructive pieces of advice and guidance starting from the proposal writing to the completion of
this thesis work. I thank him for his genuine and energetic encouragement, suggestion, insight,
guidance and professional expertise to complete this work.
I also convey my deepest thanks to Gondar city water supply and sanitation staffs and Angered
water treatment servants for their energetic, material, and chemical reagent supports and their
kindness in giving technical and instrumental supports throughout the analysis.
I wish to give my deepest thanks to Dashen Brewery S.C quality assurance servants for their
willingness to support instruments and chemical reagents during the analysis time.
I convey my heartily thanks to Mr. Mekuriaw Alemayehu for his willingness advice, moral and
informational supports and his kindness, his well knowledge of the Environmental chemistry
subject matter and well and clear discussions that enforce me to do my thesis on this area.
Finally I want to give thank for Gondar University chemistry department staffs for their
willingness of supporting different materials and their powerful advice.
ii
Table of content
Contents page no,
Acknowledgement ........................................................................................................................... i
Table of content .............................................................................................................................. ii
List of tables ................................................................................................................................... iv
List of figures .................................................................................................................................. v
LIST OF ACRONYMS AND ABBREVIATIONS ...................................................................... vi
Abstract ........................................................................................................................................ viii
1. INTRODUCTION ................................................................................................................... 1
1.1. Back ground ..................................................................................................................... 1
1.2. Factor influencing water quality ...................................................................................... 3
1.3. Physicochemical parameters ............................................................................................ 3
1.4. Study of Selected metals in water .................................................................................... 5
1.5. Drinking water standards ................................................................................................. 9
1.6. Statement of problems .................................................................................................... 10
1.7. Scope of the study .......................................................................................................... 11
1.7. General objective ............................................................................................................... 12
1.7.1. Specific objectives.......................................................................................................... 12
2. MATERIALS AND METHODS .......................................................................................... 13
2.1. Description of Study Area .............................................................................................. 13
2.2. Collection of Samples .................................................................................................... 15
2.3. Determination of Physicochemical Parameters.............................................................. 15
2.5. Reagents and Standard Solution ..................................................................................... 20
2.6. Instrumental Calibration Procedure ............................................................................... 20
2.7. Recovery Test ................................................................................................................. 21
iii
2.8. Method Detection Limit ................................................................................................. 22
2.9. Statistical Analysis ......................................................................................................... 23
3. RESULTS .............................................................................................................................. 24
3.1. Physicochemical Variables of Water ............................................................................. 24
3.2. Heavy Metals Concentration in Water ........................................................................... 26
4. Discussion .............................................................................................................................. 28
4.1. Physicochemical quality of water .................................................................................. 28
4.2. Selected trace and heavy metals ..................................................................................... 38
5. Conclusion and recommendation .............................................................................................. 46
5.1. Conclusion .......................................................................................................................... 46
5.2. Recommendation ............................................................................................................ 46
6. Reference ............................................................................................................................... 47
APPEDIX 1: The Regration carves of metal elements such as Ni, Mn, Cu, Pb, Cr, Zn and Fe. .. 53
APPEDIX 2: Optimization procedure of sample and the method detection analysis................... 56
Appendix 3:- Different chemical reagents used in Wagtech Photometer for determination of
chemical parameters in the water sample. .................................................................................... 58
Appendix4:- Table of drinking water guide line value of drinking water .................................... 59

iv
List of tables Table: 2.1. Instrumental conditions for the flame analysis of BUCK SCIENTIFIC AAS 29
Table: 2.2. Standard solution for metals analysis and correlation values 20
Table: 2.3.Theinstrumental detection limit and method detection limits. 23
Table: 3.1a. The Average (± SD) value of some physicochemical properties such as temperature,
PH, turbidity, conductivity, TDS, TSS and total solids in Gondar Town drinking water at the
five sampling sites in three months 24
Table: 3.1b. The average (± SD) value of some physicochemical properties in drinking water at
the five sampling sites in June Month 25
Table: 3.2a. Concentration of dissolved metals in Gondar drinking water at the three month
for five sampling sites (mg/L) From AAS reading 26
Table: 3.2b: The comparative study for the concentration of Copper, Iron and Manganese
and Aluminum, Calcium and magnesium metals dissolved in water were determine by
using the PALINETEST 8000 PHOTOMETER 27
Table: 4.2. Shows the WHO hardness fact sheet level and degree of hardness of water 31
v
List of figures
Figure 3.1: Location of Gondar Town, Ethiopia 14 Figure 2.2. The contours around the Angereb damp 14
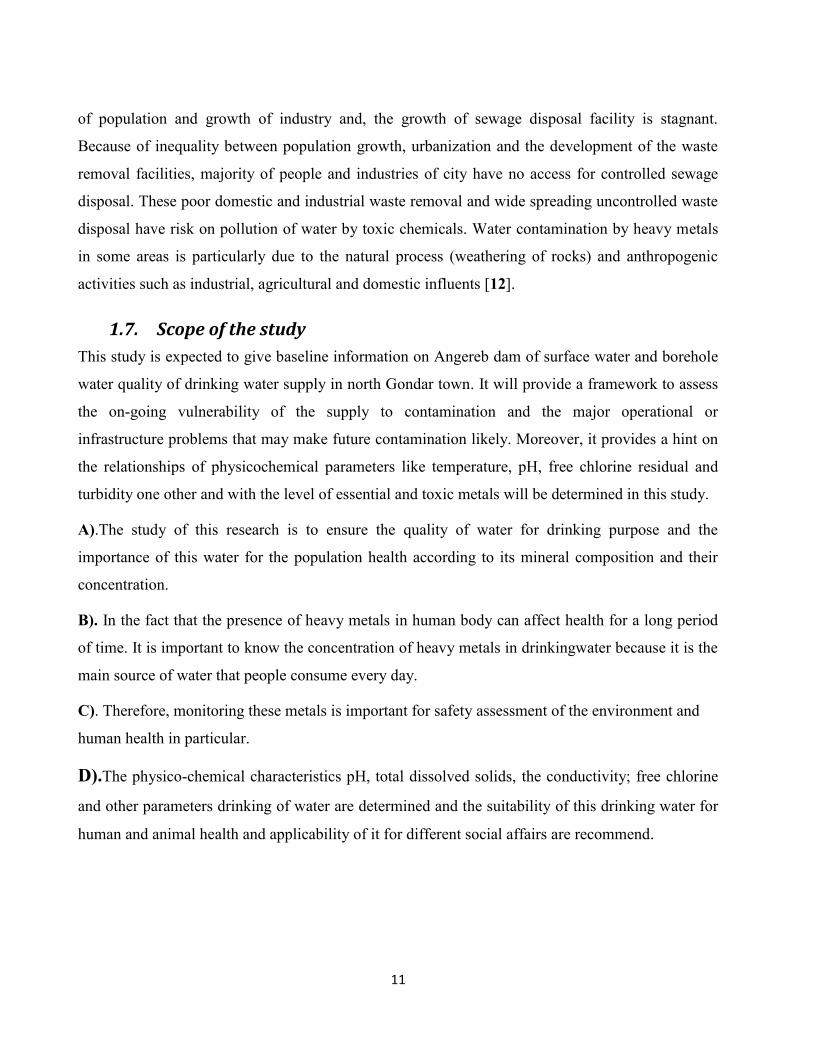
Figure 2.3: shows the sample sites such as raw water (A), borehole waters (B) and
BFT water (C) of study 15
Figure: 2.4. The recovery value of seven trace metals in the water samples 22
Figure; 4.1: This graph Represents the physicochemical parameters such as PH,
Temperature, Turbidity, conductivity, total solid, total dissolved solid and total Suspended
solids in the analysed water sample and their average value 31
Figure: 4.2. Graphs which represents the concentration of Nitrate, Nitrite, Ammonia
and ammonium ion in analyzed water 33
Figure: 4.3. Graphs which represents the concentration of total alkalinity, total hardiness,
Mg hardiness and calcium hardiness in the drinking water of North Gondar town 34
Figure: 4.4. Graphs which represents the concentration of Sulphate, Phosphate, Chloride,
Free chlorine and Silica in drinking water of North Gondar Town water 36
Figure: 4.5. Graph which represents the concentration of Al, Ca, and Mn in drinking
water of North Gondar Town 39
4.6. Graphs which represent the concentration of trace metals such as Cu, Fe, Ni, Zn in the
drinking water of North Gondar town 41
Figure 4.6. Graphs which shows the concentration of Cr, Pb and Mn in the drinking water
of North Gondar Town 43
Figure: 4.7. Graph represents the concentration of metal elements such as Copper, Iron,
Manganese, Calcium, Aluminum and Magnesium for the comparative studies of metal
\concentration determination in photometer 45
vi
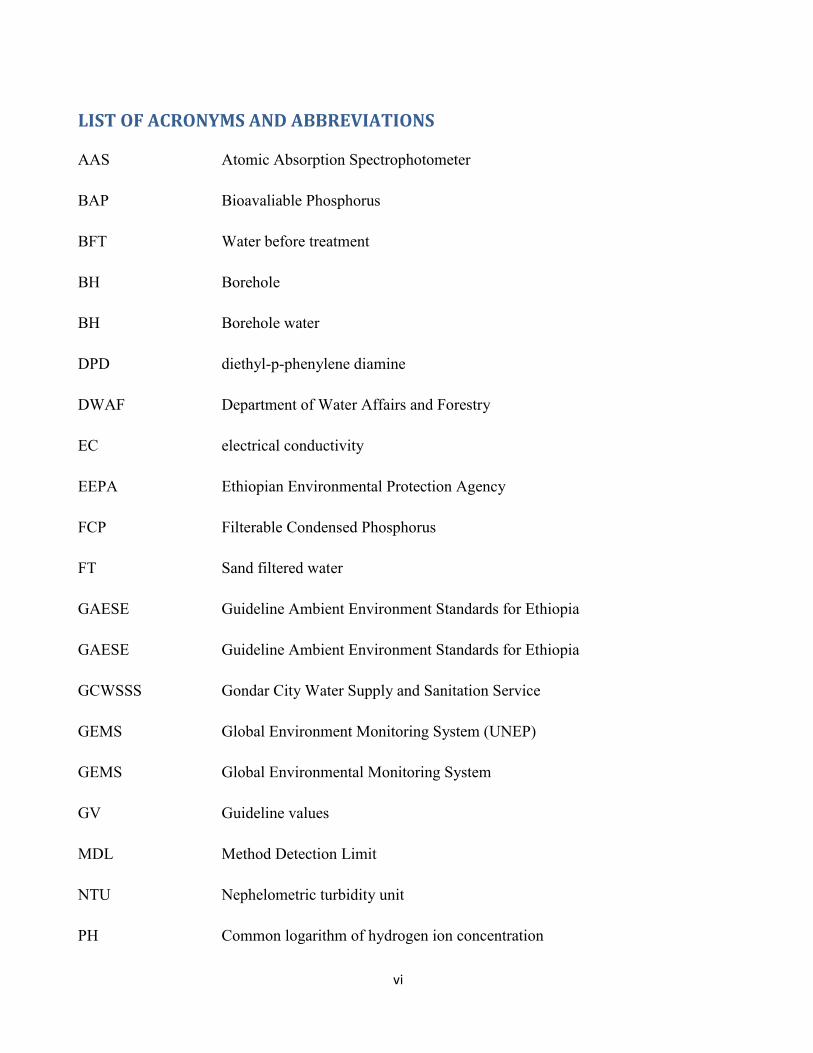
LIST OF ACRONYMS AND ABBREVIATIONS
AAS Atomic Absorption Spectrophotometer
BAP Bioavaliable Phosphorus
BFT Water before treatment
BH Borehole
BH Borehole water
DPD diethyl-p-phenylene diamine
DWAF Department of Water Affairs and Forestry
EC electrical conductivity
EEPA Ethiopian Environmental Protection Agency
FCP Filterable Condensed Phosphorus
FT Sand filtered water
GAESE Guideline Ambient Environment Standards for Ethiopia
GAESE Guideline Ambient Environment Standards for Ethiopia
GCWSSS Gondar City Water Supply and Sanitation Service
GEMS Global Environment Monitoring System (UNEP)
GEMS Global Environmental Monitoring System
GV Guideline values
MDL Method Detection Limit
NTU Nephelometric turbidity unit
PH Common logarithm of hydrogen ion concentration
vii
RADWQ Rapid Assessment of Drinking water Quality
SD Standard Deviation
UN United Nations
UNEP United Nations Environment Programme
UNESCO United Nations Educational, Scientific and Cultural Organization
UNICEF United Nations Children’s Fund
USA United State of America
USEPA US Environmental Protection Agency
WHO World Health Organization

viii
Abstract
Drinking Water quality deterioration in most towns of the country due to various anthropogenic
activities and poor sanitation make the community to depend on unsafe and poor water
consumption, these expose the community for health and other water quality associated risks. The
primary purpose of the study was to assess the significance of the physicochemical parameters and
dissolved metal constituents of drinking water in North Gondar city may have on public health and
quality of this water.
The result obtained revealed that the physicochemical parameters show that all of the
physicochemical parameters such as pH, temperature, electrical conductivity, total alkalinity,
turbidity, TDS, TSS, total solid, nitrate, nitrite, phosphate,, silica, chloride, ammonia, sulphate, free
chlorine and total hardness were analyzed for three months in drinking water of North Gondar
city. All the physiochemical parameters are within the permissible limits of both WHO and
Ethiopian. But the hardness of the water sample is rather moderate hard water than soft. The
concentration of the selected dissolved metal elopements’ such as Cu, Mn, Ni, Pb, Zn, Fe, Cr, Al,
Ca, and Mg were analyzed using Atomic Absorption Spectrophotometer for (Cu, Mn, Ni, Pb, Zn,
Fe, and Cr) and PALINETEST photometer for (Cu, Mn, Fe, Al, Ca, and Mg) for three months.
According to the result of determination concentration of the all metals have been below the
permissive limit of internal and national or Ethiopian standards and in the permissible range of
WHO guidelines.
Key words; drinking water, physicochemical parameters, dissolved met
1
1. INTRODUCTION
1.1. Back ground
Water is basic component of life, needed for living organisms and an essential resource for
sustainability of live on the earth. Human beings do not survive without water next to air for a few
minutes even they may be surviving a few days without meal. This is because of that about, 60 % of
the human body is water and also about 83 % of our blood is water, which helps to digest food,
transport waste and control body temperature and humans must replace 2.4 liters of water every day
through drinking and from foods [1]. About 70% of the earth’s surface is water, and 3% of this is
fresh water. About 97% of earth’s water supply is in the marine; is unfit for human consumption
and other uses because of its salt content. Of the remaining; 3%, 2% is locked in polar ice caps and
only 1% is available as fresh water. Ground water and surface waters are mainly used by man for
drinking and other purpose. Ground water consists dissolved minerals from the soil layer where as
surface water contain organic and inorganic maters which fed algae and bacteria population.
The surface water resource continue to the contaminated with runoff, water from the agricultural
field, and sewage from the cities and rural areas. Millions of people all over the world particular in
developing countries are losing their lives every year from water born disease [2].
In Ethiopia, the dominant source of drinking water used to supply major urban and rural
communities is from wells and springs. Although there are no systematic and comprehensive water
quality assessment programs in the country, there are increasing indications of water contamination
problems in some parts of the country and the major causes of this contamination could be soil
erosion; domestic waste from urban and rural areas and industrial wastes [3].
Drinking water is water whose quality must ensure the perfect health of the end user. Taken from
the natural environment, it must undergo treatments that will render it apt for human consumption
and safe and clean drinking water and sanitation is a human right essential to the full enjoyment of
life and all other human rights [4].
The constant supply of water is needed to replenish the fluid that through the normal physiological
activities such as respiration, perspiration, urination and other day to day activities [5].Water is one
of the most important compound to the ecosystem whereas the quality of water is of upper most
2
importance compared to quantity in any water supply planning and especially for drinking purposes
purity is equally important. The quality of drinking water has been an important requirement for all
human beings regardless of part of world they are living in and the social class they belong to all
human races in our planet need to have clean water for a number of reasons particularly drinking
purpose [6].
The chemical, physical and bacterial characteristics of water determine its usefulness for municipal,
commercial, industrial, agricultural, and domestic water supplies [8]. Since, better quality of water
described by its physical, chemical and biological characteristics. Safe drinking water is human
bright as much a bright as clear air, so an adequate supply of safe drinking water is prerequisite for
health life of a country [9].
People consume fresh water for different purposes such as drinking, cooking food, irrigating crop,
and different agricultural activities. Fresh water bodies are finite essential for agriculture, industry,
human existence and sustainable socio-economic development country is unachievable without
easily obtainable water of sufficient quantity and acceptable quality [10].
As the matter of fact that lack of adequate supply of potable water is critical challenge in most
developing countries. As earth’s population continuous to increase rapidly the growing of human
needs for fresh water,( such as drinking, cooking, washing, bathing, irrigating crop, receiving
sewages and agricultural runoff, recreation and industrial process ) is also increases. These growing
demands for water along with poor water resource management and monitoring pollution level
contribute water quality problem in and around the growing city [11]. The main water pollution
causes in growing countries, particularly in Ethiopia context, are industrial activities, domestic
wastes and agricultural activities. Such like activities may make pollution of rivers, or any water
bodies around the country. The pressure of increasing population, growth of industries,
urbanization, energy intensive life style, loss of forest cover, lack of environmental awareness, lack
of implementation of environmental rules and regulations and environment improvement plans,
untreated effluent discharge from industries and municipalities, use of non-biodegradable
pesticides/fungicides/ herbicides/insecticides, use of chemical fertilizers instead of organic manures,
etc are causing water pollution. The pollutants from industrial discharge and sewage besides finding
their way to surface water reservoirs and rivers are also percolating into ground to pollute
groundwater sources [12], my affect the quality of water supplied.
3
1.2. Factor influencing water quality
The quality of any body of surface or ground water is a function of either or both natural influences
and human activities. Without human influence, water quality would be determined by the
weathering of bedrock minerals, by the atmospheric process of evapotranspiration and the
deposition of dust and salts by wind, by the natural leaching of organic matter and nutrients from
soil, by hydrological factors that leads to runoff, and by biological process within the aquatic
environment that can alter the physical and chemical composition of water.
In developing countries, several disease outbreaks are associated with the use of untreated surface
water, contaminated well water, treatment plant deficiencies or not proper treatments and
contaminated distribution systems [13, 14].
The quality of drinking water may be controlled through a combination of protection of water
sources, control of treatment processes and management of the distribution and handling of the
water. Guidelines must be appropriate for national, regional and local a circumstance, which
requires adaptation to environmental, social, economic and cultural circumstances and priority
setting by [15].
Water quality is defined in terms of the chemical, physical and biological properties of water that
determine its fitness for a specific use. The water quality of rivers and lakes changes with the
seasons and geographic areas, even when there is no pollution present. Water quality guidelines
provide basic scientific information about water quality parameters and ecologically relevant
toxicological threshold values to protect specific water uses [16].
Various workers in world have carried out extensive studies on water quality on physicochemical
characteristics and heavy or trace metal concentration.
1.3. Physicochemical parameters
Assessing the physico chemical parameter of drinking water is important for determining the
quality of drinking water for the public health. The physicochemical parameters of water sample is
analyzed and measured in terms of turbidity, temperature, pH, residual chlorine, nitrates and others
[17].
Many researchers have been investigating the physicochemical quality of water in the world.

4
The study about the physicochemical quality of water in Legos Nigeria was conducted and its
applicability for drinking purpose was determined [19] and the studies aboutconcerning on seasonal
change in physicochemical parameters in drinking water such as temperature, PH, TDS, total
alkalinity free chloride and dissolved minerals their effects on water quality was detected in
industrial are of in Khed (LOTE)[19].
The physico-chemical parameters, Temperature, pH, electrical conductivity, CO2 content, total
dissolved solids, hardness, dissolved oxygen, Ca2+, Mg2+, Cl-, nitrate, phosphate and Sulphate and
selected heavy metal ions of Huluka and Alaltu Rivers of Ambo, Ethiopia have been determined
[20]. The result of study shows that all most all the physico- chemical and nutrient parameters and
measured metal ions were increased trend from the upper stream to downstream and the water
quality of river was deteriorated. This is due to the human pressure associated with domestic,
municipal sewage waste water and agricultural activities.
The study about examining the quality of water in Ife–North Local Government of Osun State
Nigeria by determining the physico–chemical parameters of and the content of dissolved trace
metals was conducted. The results obtained for the physical parameters agreed with the limits set by
both national and international bodies for drinking and domestic water with few exceptions [21].
The studies about evaluating the quality of Lake Edku water and regional and seasonal variations of
some physico-chemical parameters (nutrient salts, total nitrogen, total phosphorous and silicate, in
addition to pH, and total alkalinity in Alexandria, Egypt was determined[22].
The study about physical and major chemical parameters of Malir River (Within Karachi) Pakistan
was conducted[24]. The result of study reported that all the parameters were found within the range
of the observed values of stream and river, except total dissolved solid, total alkalinity, sodium,
manganese, Lead and chromium. However among all the chemical constituents, quantities of total
iron, manganese, lead, chromium and PH were also found beyond the standard value of these factor
give n by WHO for drinking water.
The study about physico-chemical variables (temperatures, pH, TDS, and conductivity) and some
selected trace metals (Cd, Cu, Co, Ni, Pb, and Zn) analysis of the water and surface sediments from
river Big Akaki and Little Akaki were conducted with a view of assessing the quality of the river
water as well as identifying the potential contaminated areas was stated[23].The result of this study
5
shows that the levels of dissolved trace metals in these rivers were found to be below the detections
limit of the method except for Zn and indeed Ni and Co in some sampling sites of the rivers and
levels of dissolved metals in both rivers are below the South Africa guidelines fixed for irrigational,
domestic and livestock watering purposes.
The assessment of physico-chemical and microbiological quality of drinking water from sources to
house hold in selected communities of Akaki-kaliti sub city, Addis Ababa City Administration were
conducted[24].
Determining correlation of physicochemical parameters and bacteriological quality of drinking
water was studied [25]. The result of this study conclude that distributing water without treatment
and uncontrolled physicochemical parameters led to lower free chlorine distribution and contribute
to occurrence of high population bacteria in water. Study about investigated the physico-chemical
characteristics of drinking waters collected from tap, well and sachet in Sokoto metropolis in North
Western Nigeria was studied [26]. This investigation shows that the concentration of
physicochemical parameters fall under the permissible limits of WHO guidelines for water quality
except conductivity of all water samples greater than the permissible limits of water quality
standard guidelines.
The study about investigating the physicochemical water quality of Ona River and well water
samples [30]., and results that the highest value of physico-chemical parameters (compared with
wells) was obtained in Ona River, but the results obtained fell within the maximum allowable limit
set by World Health Organization for drinking water except for water from Ona river.
1.4. Study of Selected metals in water
The study of heavy metals contamination in water sample has been done by many researchers. It
involves a few types of water like water from the river, sea, tap water, lake, dam and others. Most
of the results have shown that heavy metals exist in these samples of water but the concentrations of
their contamination are different and some of the results do not detect the existence of heavy metals
in water samples. The study about the determination of concentration of heavy metals in tap water
samples was studied. The result of the study indicate that metal ion concentrations values in tap
water at Shah Alam which is the main city in Selangor was exceed the recent proposed criteria for

6
water quality and exceed safety baseline levels of the World, European, American Chemical
Standards [27].
Over the past two decades, the term “heavy metals” have been used increasingly in various
publications and legislation related to chemical hazards and the safe use of chemicals. It is often
used as a group of name for metals and metalloids that have been associated with contamination
and potential toxicity and ecotoxicity. Usually the term heavy metals used inconsistently to replace
the name of trace metals [28].
Heavy metals in water refers to the heavy, dense, metallic elements that occur in trace levels, but
are very toxic and tend to accumulate, hence are commonly referred to as trace metals. The major
anthropogenic sources of heavy metals are industrial wastes from mining sites, manufacturing and
metal finishing plants, and domestic waste water and run off from roads. Many of these trace metals
are highly toxic to humans, such as Hg, Pb, Cd, Ni, As, and Sn. Their presence in surface and
underground water at above background concentrations is undesirable [29].
Trace metals may be present in natural groundwater or surface water. The sources of these trace
metals are associated with either natural processes or man's activities. Two important natural
processes contributing trace metals to natural water are chemical weathering and soft leaching.
Decaying vegetation can also affect the concentration of trace metals in water. Many plants are
known to concentrate various elements selectively. As a result, trace metals may become available
during the decay of the plants. Thus, the penetration and movement of rainwater through sod may
pick up these available trace metals and affect the groundwater resource. Likewise, runoff resulting
from rainfall may transport trace metals to surface-water. Mining and manufacturing are other
important sources of trace metals in natural water [30].
Large populations are repeatedly exposed to potentially toxic contaminants in the drinking water in
minute amounts over many months or years, or over whole lifetimes. The sources of inorganic ions
in groundwater, surface water, water treatment chemicals, and from the storage and distribution
system are considered along with the health effects resulting from the total intake from food, air,
and water[31].
7
Adequate water resources for future generations are not only a regional issue but also a global
concern. Our country’s fresh water wealth is under threat due to variety of natural and human
influences [32].
The study on physicochemical water quality and heavy metal concentration in sediment at selected
sites of Sungai Kelantan was carried out. The Result of water quality analysis (physico-chemical)
indicated that Sungai Kelantan is characterized by excellent water quality and comparable to
pristine ecosystems such as the National Park and Kenyir Lake and the river is free from the
pollution [33].
The study of heavy metal pollution load index and distribution of heavy metals (Nickel, lead,
cobalt, zinc, iron, copper and cadmium) have been reported in the surface sediments from Haldi
and Rupnarayan tributaries of Hugli estuary in West Bengal was stated. Trace metal pollution
occurs in aquatic environments, especially in rivers and oceans, due to anthropogenic activities.
Industrial effluent, urban run-off, atmospheric deposition as well as upstream run-off are absorbed
into deposits and incorporated into the surface sediments were major sources of pollutants [34].
The studied on Heavy metal analysis and interim recommended limits for botanical dietary
supplements was carried out and recommended that manufacturers of orally consumed botanical-
containing dietary supplements establish specifications under good manufacturing practice for
specific maximum quantitative limits of inorganic arsenic, cadmium, lead, and methyl
mercury[35]The study about determination ofsome heavy metals (Cd, Cr, Cu, Fe, Ni and Pb) in
water, sediment and some tissues of Cyprinus carpio from Avsar Dam Lake, which is an important
water source for irrigation and drinking in Turkey. From this study, the result shows that the
average values of Iron in water samples were higher than the respective reference values for fresh
water. Results for levels in water were compared with national and international water quality
guidelines, as well as literature data reported for the lakes [36].
The studies about ascertaining water quality for human consumption, major and minor ions were
evaluated in the drinking water supplied to the city of Yozgat and its surrounding villages in Turkey
and reports that The concentrations of investigated parameters in the drinking water samples from
Yozgat were within the permissible limits of the World Health Organization drinking water quality
guidelines and the Water Pollution Control Regulation of the Turkish authorities [37].
8
The studies that the evaluation of level of heavy metals in the drinking water from the Tokat-Black
Sea Region of Turkey and The values this study found the present work for the heavy metal
contents of the drinking water samples of Tokat, Turkey were below the maximum tolerable limits
set by the World Health Organization (WHO) and the Water Pollution Control Regulation of the
Turkish authorities [38].
The studies about determine the content of cadmium (II) and lead(II) in drinking spring and well
waters from rural part of south Serbia, as in a tap water.The result of the study indicates that water
samples in rural parts of municipality of Leskovac show that the quality of natural well’s and
spring’s water are at high quality level concerning heavy metals, Pb and Cd [39].
The result of this investigation indicate that Total concentrations of heavy metals, Pb, Cd, Cu and
Zn, were below maximally allowed concentrations in accordance with EPA and WHO, with
concentrations of lead in the upper maximally allowed limit.
The study of determining the seasonal water quality variations of the major springs of the Yarmouk
Basin of North Jordan. The result of this study indicates that analyzed heavy metals in some water
samples exceeded the Jordanian. Overall, the results showed that the water springs of the Yarmouk
Basin in North Jordan are contaminated with heavy metals that might affect human health as well as
the health of the ecosystem [40].
The study about the determination of heavy metal pollutants of the Alaro river within the Oluyole
industrial area in Ibadan Southwestern Nigeria. The researcher concludes that As long as water is
polluted, it will not only affect water-dwelling organisms, but also terrestrial organisms that feed on
aquatic organisms. The animals who in turn feed on these terrestrial animals will also be affected.
Thus, pollution can cause effects even to animals and humans that are not directly dependent on the
specific water area. These effects include decreased source of food as well as magnified substance
level higher up in the nutrition chain [41].
The studies on the heavy metals in drinking water and their impacts on human health in Egypt in
Cairo area was carried out and the researcher concludes that the contents of metallic contents in the
cave waters is higher than what is expected and exceed baseline levels of the World, European,
American Chemical standards and the Egyptian Chemical Standard of Ministry of Health [42].

9
The studies on evaluating the heavy metals contamination of copper, zinc, manganese, iron,
chromium, nickel, lead and cadmium, and to assess the environmental quality of the coastal area
from Mahajanga town in Madagascar and reported that the high level of metals from soil erosion in
costal sediment threaten marine organisms. The researchers conclude that the sources of the metals
in the sedimentary coastline were caused either seaport activities or non- treated sewages from
different source [43].
1.5. Drinking water standards
The purpose of drinking water standards is to ensure protection from acute poisoning and from
long-term, or "chronic," effects. A drinking water quality guideline value represents the
concentrations of a constituent that those not result in any significant health risk to the consumer
over a lifetime. The amount by which and for how long, any guideline value can be exceeded
without endangering human health depends on the specific substance involve. The quality of the
earth’s water is vital to our existence. The supply of clean water on the earth is finite, and it is being
threatened by water pollution. Water pollution is a serious problem today, in spite of our efforts to
control it [44]. The international organizations, e.g. World Health Organization (WHO) have major
functions to propose regulations, guidelines, and recommendations in order to realize human right
to have access to an adequate of safe drinking water independently of their stage of development
and their social and economic conditions [45].
The primary purpose of the Guidelines for Drinking-water Quality is the protection of public health.
Water is essential to sustain life, and a satisfactory (adequate, safe and accessible) supply must be
available to all. Improving access to safe drinking-water can result in tangible benefits to health.
Every effort should be made to achieve a drinking-water quality as safe as practicable. Safe
drinking-water, as defined by the Guidelines, does not represent any significant risk to health over a
lifetime of consumption, including different sensitivities that may occur between life stages. Those
at greatest risk of waterborne disease are infants and young children, people who are debilitated or
living under unsanitary conditions and the elderly. Safe drinking-water is suitable for all usual
domestic purposes, including personal hygiene. The Guidelines are intended to support the
development and implementation of risk management strategies that will ensure the safety of
drinking-water supplies through the control of hazardous constituents of water. These strategies
may include national or regional standards developed from the scientific basis provided in the
10
Guidelines. The Guidelines describe reasonable minimum requirements of safe practice to protect
the health of consumers and/or derive numerical “guideline values” for constituents of water or
indicators of water quality [46].
The government of Ethiopia has mandated the Ethiopian Environmental protection Authority (EPA)
to set such standards and Guideline Ambient Environment Standards for Ethiopia (GAESE)
represents the guideline standards with respect to the ambient environment. In practice, standards
can be set from either first principles or based on the existing national or international guidelines.
Driving such standards from first principle requires classification, and prioritization of pollutants,
derivation of pollutant exposure processes and their ecological effects [47].
There are many standard guidelines for drinking water in the world. Among these standards
Ethiopia accept the drinking water guidelines of the International Health Organization (WHO),
guidelines for drinking water quality. In table 2.1 below the international and national standards for
drinking water qualities of physicochemical and concentration of dissolved metal elements are
given including Ethiopian drinking water quality standards.
1.6. Statement of problems
Lack of access to safe and clean water is locked in the heart of the poverty. Even though the issue of
water is observed as a general problem for both the urban and the rural population, women bear the
greatest burden because of their social gender roles including collecting water for their households.
Because of their task of water provision at the households, women and children suffer from disease,
have limited participation in education, and both income generating activities and engagement in
cultural and political issues are often compromised[48].
The health and wellbeing of population is directly affected by the coverage of water supply.Gondar
is one example of town where the rate of urbanization, the rate of population growth the availability
of waste removal facility is unbalanced. The impact of human population on surface and
groundwater is increasing with the development of industries and the growth of population size in
and around the North Gondar [49].
The fast growth of the city, in terms of, population number; the rate of urban expansion is
demanded huge increase in the extraction of resources and release of huge volume of wastes to the
environment of the city. In contrast to the high rate of expansion of urbanization, high rate growth
11
of population and growth of industry and, the growth of sewage disposal facility is stagnant.
Because of inequality between population growth, urbanization and the development of the waste
removal facilities, majority of people and industries of city have no access for controlled sewage
disposal. These poor domestic and industrial waste removal and wide spreading uncontrolled waste
disposal have risk on pollution of water by toxic chemicals. Water contamination by heavy metals
in some areas is particularly due to the natural process (weathering of rocks) and anthropogenic
activities such as industrial, agricultural and domestic influents [12].
1.7. Scope of the study
This study is expected to give baseline information on Angereb dam of surface water and borehole
water quality of drinking water supply in north Gondar town. It will provide a framework to assess
the on-going vulnerability of the supply to contamination and the major operational or
infrastructure problems that may make future contamination likely. Moreover, it provides a hint on
the relationships of physicochemical parameters like temperature, pH, free chlorine residual and
turbidity one other and with the level of essential and toxic metals will be determined in this study.
A).The study of this research is to ensure the quality of water for drinking purpose and the
importance of this water for the population health according to its mineral composition and their
concentration.
B). In the fact that the presence of heavy metals in human body can affect health for a long period
of time. It is important to know the concentration of heavy metals in drinkingwater because it is the
main source of water that people consume every day.
C). Therefore, monitoring these metals is important for safety assessment of the environment and
human health in particular.
D).The physico-chemical characteristics pH, total dissolved solids, the conductivity; free chlorine
and other parameters drinking of water are determined and the suitability of this drinking water for
human and animal health and applicability of it for different social affairs are recommend.
12
1.7. General objective
➢ The main objective of this study is to undergo the assessment of major physicochemical
parameters and level or concentration of selected metals on drinking water of north Gondar
town, and to compare the values with the national and international organization (WHO)
recommended drinking water standards.
1.7.1. Specific objectives
✓ To assess physicochemical water quality parameters like temperature, conductivity, total
dissolved solids, turbidity, water hardness, total alkalinity, concentration ofsulphate, nitrate,
phosphate and ammonia in the drinking water sample in North Gondar Town.
✓ To determine trace metals (Zn, Cu, Ni, and Fe) contents of the water sample.
✓ To determine concentration of Mg, Ca and Al in water sample.
✓ To investigate the concentration of toxic heavy metals (Cr, Pb, and Mn) from the drinking
water sample of Angereb dam and borehole water.
✓ To compare the concentration of physicochemical parameters and selected metals with
national and international recommended drinking water standards.
13
2. MATERIALS AND METHODS
2.1. Description of Study Area
Gondar is well known historical city in Ethiopia which located in 760Km North of Addis Ababa.
Gondar town is located in the northwestern part of Ethiopia and its varied landscape, dominantly
covered with ragged hills and plateau formations, imparts variable temperatures largely favoring a
wide range of illnesses. Gondar is an old town, which is not properly planned, zoned, and has no
sufficient sanitation facilities. The geographic location of Gondar extends from 13°9’57’’ to
13°19’58’’ north latitude and from 37°54’48’’ to 38°24’43’’ east longitudewith an elevation of
2133 m3 above the sea level. The temperature varies from 120C to 300C and annual rainfall around
1200 mm [51].
The study was implemented in Gondar city which is one of the growing cities in north Ethiopia.
Gondar is well known historical city in Ethiopia which located in 760Km North of Addis Ababa.
Now a day Gondar is fast growing Ethiopian country in different infrastructures such as Hotel
industry, transportation and different activities. The study was implemented in Gondar city which is
one of the growing cities in north Ethiopia.
Angereb Dam is 420 m long and 33.5m high with a total base width of about 159.25m at the
maximum section and crest width of 6.5m. It is built in compacted earth and stone fragments and
the outer most portion of the upstream body of the dam is built in dumped rock and gravel which is
further protected by a layer of dumped riprap. However, after the construction of the dam it was
observed that a significant amount of silt is being accumulated within the dam and also caused in an
increase of turbidity of raw water which resulted in high chemical consumption in the treatment
processes. Most of the wells drilled in the surroundings of Gondar are abandoned following the
implementation of Angereb Dam and treatment plant because of their lower yields. However, the
eight boreholes found in Angereb Valley are relatively in good condition and they are one of the
main water sources for the city and they are recently under rehabilitation works[52].

14
Figure 3.1: Location of Gondar Town, Ethiopia
Figure 2.2. the contours around the Angereb damp Source: From GCWSSS
15
Figure 2.3: shows the sample sites such as raw water (A), borehole waters (B) and BFT water (C) of study. (Source: Abera H.)
2.2. Collection of Samples
The three replicated water samples were collected from five different points of same station using
polyethylene sampling bottle which is previously washed by HNO3 and deionized water during the
sampling. These water sample collection was from five different sites which were level as
The raw water from the surface water was collected poly ethylene bottle leveled as A, water from
the underground (Borehole) source will be collected in polyethylene bottle which is leveled as B,
water from the center or mixing point of underground and surface water will be collected in
polyethylene bottle leveled as C, water sample at the sand filter will be collected in polyethylene
bottle leveled as D. the water sample after sand filter or filtrated water will be collected in
polyethylene bottle leveled as E for the identification of water sample.
The water samples were filtered through Watch man 541 filter paper immediately after the samples
have been transported to the laboratory. The filtered samples were acidified with HNO3 and were
kept at 4 0C prior to analysis.
2.3. Determination of Physicochemical Parameters
Physicochemical analysis: The water sample collected was analyzed for turbidity, PH, total
alkalinity, total dissolved solid, electrical conductivity, total hardness, free chlorine, nitrate ion,
silicate and other parameters which are explained later on.
B A C

16
The following physicochemical variables of water were determined in situ at the five sampling sites
using the instruments indicated in parenthesis; temperature, pH and conductivity were determined
by using (HORIBA, Ltd. Water Checker, Model U-10, (MFG. 2008) PH meter at the sampling site
in Angereb water treatment laboratory.
The concentration of total alkalinity, total hardness, magnesium and calcium hardness, nitrate,
nitrite, sulphate, phosphate, ammonia, chloride, free chlorine and silica were measured by using
PLAINETEST PHOTOMETER 8000. The reagents and photo programs used for determination of
these chemical parameters are represented in appendix 3.
➢ Alkalinity: the alkalinity of water was determined by Alkaphot testing method. Alkaphot
test is based on colorimetric method and uses single tabled reagent. The color produced in
the test indicative of alkalinity of water and measured by using photometer.
➢ Aluminium: the concentration of aluminium in the sample was determined by Colorimetric
(Eriochrome Cyanine R method). In this method Al reacted with Eriochrome Cyanine R and
develops red pink colored complex in acidic condition. The intensity of color developed is
directly proportional to concentration of Al in given sample.
➢ Ammonia: the concentration of ammonia present in water sample was based on an
indophenols method. In this method, in the presence of chlorine, ammonia reacted with
alkaline salcylate and produce green blue indophenols. The intensity of color produced was
proportional to the concentration of ammonia concentration and was measured by using
photometer.
➢ Chloride: the concentration of chloride was determined base on tablet reagent system
containing silver nitrate. The measurement was carried out under acidic and oxidizing
condition to eliminate interface from any reducing substances or complexing agents. The
concentration of chloride present in the sample was determined depending on degree of
turbidity due to the insoluble silver chloride.
➢ Free Chlorine: the determination of free chlorine was carried out by DPD method. The free
chlorine present in the sample react with DPD in buffered solution and develop pink color.
The intensity of developed color is directly proportional to the concentration of free chlorine
present
17
➢ Copper: determination of copper preset in sample was carried out by coppercol method. In
this method copper salts were reduced to cuprous form by reducing reagents and react with
2,2-Biquinoline-4-dicarboxylic salt and form purple colored complex for free copper
measurement and decomplexing reagent was used to measure total copper present.
➢ Total Hardness: hardness of water was measured by using unique colorimetric method.
Under the controlled condition of measurement calcium ions and magnesium ions were
reacted with hardicol reagent and develop purple colored solution. The intensity of light
transmitted is directly proportional to amount of hardness.
➢ Magnesium and Magnesium hardness were assessed by using magnecol method. In this
method magnesium was reacted with yellow colored organic reagent and produce orange
colored complex. The concentration of magnesium and its hardness was measured by using
intensity of developed color in different photo programs which indicated in appendix 3.
➢ Manganese: since manganese occurs in water in various valency states, previously Mn in
lower valency state oxidized to permanganate by oxidizing reagent. Then the permanganate
reacted with leucomalachite green and develops intense turquoise colored complex. Then
the intensity of color produced is measured to determine the concentration of Mn present in
sample.
➢ Nitrate and Nitrite: both nitrate and nitrite determined by using nitratest method. In this
method nitrate was reduced in to nitrite in the presence of nitratest powder (zinc-base
powder). The nitrite reacted with sulphanic acid in the presence of N-(-naphyl)-ethyldiamine
reagent and develops reddish color. The concentration of both nitrate and nitrate were
measured by using transmitted light intensity in selected photo programs which is presented
in appendix 3.
➢ Phosphate: the concentration of phosphate present in the water samples were .determined
based on Vanado molabdate method. In this method, phosphate present in sample reacted
with ammonium molabdate in the presence of ammonium vanadate reagent and produce
yellow colored compound (phosphovanadomolabdate) and the intensity of developed color
measured at selected light wave length as indicated in appendix 3.
➢ Silica:the concentration of silica pressed in samples was also determined by using
colorimetric method. In this method ammonium molabdate reacted with silica under acidic
condition and produce molabdic acid. This molabidic acid was reduced in to blue colored
18
complex in the presence of reducing agent. The intensity of color in the test is proportional
to silica concentration and measured by photometer.
➢ Sulphate: the concentration of sulphate present in water samples were determined by
turbidity method. In this method sulphate present in the sample reacted with sulphate turb
reagent and form insoluble barium sulphate. Light absorbance of the BaSO4 suspension is
measured by a photometer and sulphate concentration is determined by comparison of the
reading with a standard curve
Total dissolved solids, suspended solid (SS) and total solid of the water were determined by
gravimetric method in the laboratory.
Determination of total sold (TS) and TDS in the water sample will be determined by using
gravimetric method. This will be done by using evaporating dish which will dried in oven at the
temperature of 103 -105 0c, and weighting of evaporating dish.
Ts (mg/L) = 𝑊2−𝑊1
𝑉𝑜𝑓 𝑠𝑎𝑚𝑝𝑙𝑒 mg X 1ooo (1)
Where W2= weight of residue + evaporating dish
W1= weight of dry evaporating dish
Vsample= ml of water sample used for measurements
Total dissolved solid (TDS) gm/L = 𝑊2−𝑤1
𝑉𝑜𝑓 𝑠𝑎𝑚𝑝𝑙𝑒mg/L X 1000 (2)
Where: W2= weight of residue + evaporating dish
W1= weight of dry evaporating dish
Vsample= ml of filtrated water used for measurements
Suspended solid was determined by subtracting amount of TDS from amount of total solid.
2.4. Analysis of trace and heavy Metals
The analysis of selected trace and heavy metals were carried out by using BUCK SCIENTIFIC
MODEL 210VGP, atomic absorption spectrometer equipped with deuterium arc back ground.

19
Concentration of Cu, Pb, Ni, Cr, Cd, Mn, Fe and Zn were determined in water sample. The analyses
of metals in water samples were carried out by BUCK SCIENTIFIC FLAME ATOMIC
ABSORPTION SPECTROPHOTOMETR 210VGP.
The Buck 210VGP atomic absorption spectrophotometer is designed to measure the concentration
of elemental metal in solution. It improves integrated measurements on absorbance or emission
intensity as well as sample concentration compression to standard solution. For major analysis of
commonly available Welder’s grad acetylene required fuel for use with the model 210VGP and
most common oxidant air which can be obtained from accomplished air cylinder.
In order to develop an optimum procedure for the analysis of water samples, different digestion
methods were tasted and the procedures that produce clear, consumed minimal reagent volumes,
and required shorter digestion time was selected from the different alternatives. The optimum
procedure for digestion of water sample was done by using 100 ml of water, 12 ml of HNO3, and 4
ml of HClO4 at 3000c for 2:30 hours. The different alternatives procedures tasted are given in
appendix (2).
Metals such as Pb, Ni, Cr and Zn were demined only using Atomic Absorption Spectrometric
method and metals Such as Ca, Mg and Al were determined only using Wagtech photometer.
Whereas metals such as Cu, Mn, and Fe were determined using both AAS analysis and Photometric
analysis
Table: 2.1. Instrumental conditions for the flame analysis of BUCK SCIENTIFIC AAS
Elements Wavelength in nm Slit width Current
of lump
Detection
Limit
Lump Oxid/fuel
Copper 324.8nm 0.7A0 1.5mA 0.005 HCL Air-C2H2
Cadmium 228.9nm 0.7A0 2.0mA 0.01 HCL Air-C2H2
Chromium 357.9 nm 0.7A0 2.0mA 0.04 HCL Air-C2H2
Iron 248.3 nm 0.7A0 7.0mA 0.05 HCL Air-C2H2
Lead 217.0 nm 0.2A0 3.0mA 0.04 HCL Air-C2H2
Manganese 279.5 nm 0.7A0 3.0mA 0.03 HCL Air-C2H2
Nickel 231.9 nm 0.2A0 3.0mA 0.05 HCL Air-C2H2

20
Zinc 213.9 nm 0.7A0 2.0mA 0.005 HCL Air-C2H2
2.5. Reagents and Standard Solution
All the chemicals used were of analytical reagent grade. De-ionized water was used for all dilutions
throughout the study. Nitric acid, HNO3 (68% - 70%), and Perchloric acid 70% (HClO4
ALDRICH, A.C.S. REAGENT, Germany), were used for digestion. Working standards were
prepared by diluting concentrated stock solution of 1000 ppm for Cu, Cr, Cd, Mn, Ni, Pb, Fe and
Zn in deionized water. Standard 1000ppm stock solution is prepared from the metal powders or
salts of each metal element of Cu, Cr, Cd, Fe, Ni, Mn, Pb and Zn 1gm of each metal in 1000ml of
de ionized water. The working solution of standard solution each metal was prepared by diluting the
stock solution of each metal in deionized water as needed.
2.6. Instrumental Calibration Procedure
To ensure the accuracy of the instrumental readings and to determine the reliability of the result
obtained it is necessary to perform calibration of instrument. The Calibration curves for each heavy
metal were set to ensure the accuracy of the atomic absorption spectrophotometer and to confirm
that the results of determination were true and reliable. The calibration of the 210VGP Atomic
Absorption Spectrophotometer was made with standard solutions. Four working calibration
standards were prepared by serial dilution of concentrated stock solution of 1000 mg/L for copper,
zinc, nickel, lead, cadmium, manganese, chromium, and iron. These solutions and blank were
aspirated into AAS. A calibration curve of Absorbance Vs concentration was established for each
metal and used for determination of metal concentration in the samples of fish and water. The
concentrations of standard solutions that were used to calibrate the 210VGPAAS give in table blow.
Table: 2.2. Standard solution for metals analysis and correlation values
Metals Standard concentration of
AAS calibration
Correlation value or
(R2) value
Copper 0.1, 0.2, 0.4, 0.8 0.99964
Chromium 0.05, 0.1,0.2, 0.4 0.99757
Iron 0.1, 0.5, 1.0, 5.0 0.99889

21
2.7. Recovery Test
The digestion method and AAS analysis were validated by measuring the recovery of copper, lead,
nickel, chromium, manganese, Iron, and zinc spiked to water samples. The known volume and
concentration of standard solutions were employed on the samples in order to determine recovery.
The intermediate concentration of 10ml volume of each metal element added to spike in water
sample and 250ml of spiked sample was digested. The amount of spiked metals recovered after the
digestion of spiked samples was used to calculate percentage recovery using Burns the formula as
sited in [93].
RECOVERY = 𝐶𝑂𝑁𝐶𝐸𝑇𝑅𝐴𝑇𝑂𝑁𝑂𝐹𝑆𝑃𝐼𝐶𝐾𝑆𝐴𝑀𝑃𝐿𝐸−𝐶𝑂𝐶.𝑂𝐹𝑈𝑁𝑆𝑃𝐼𝐶𝐾𝐸𝐷𝑆𝐴𝑀𝑃𝐿𝐸
𝐶𝑂𝑁𝐶𝐸𝑇𝑅𝐴𝑇𝐼𝑂𝑁𝑂𝐹𝐴𝑁𝐴𝐿𝑌𝑇𝐸𝐴𝐷𝐷𝐸𝐷 X 100% (3)
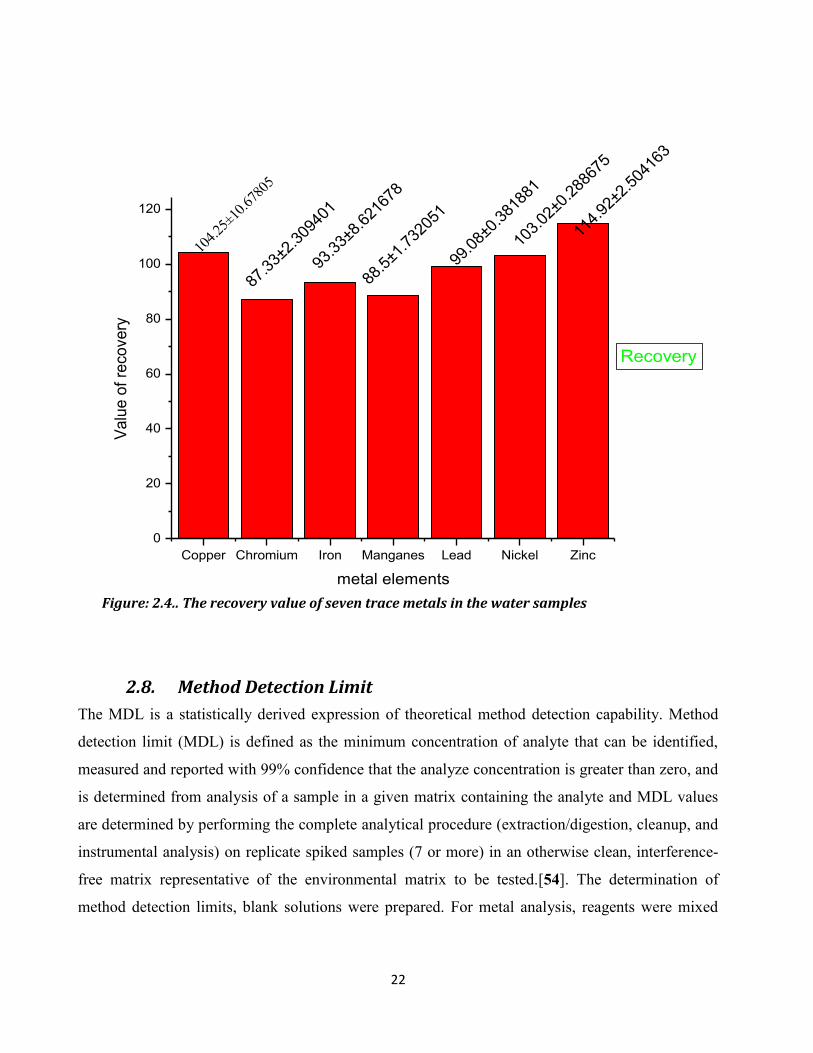
The recovery percentage of spiked water sample obtained shown in figure (4) the results of
percentage recoveries for the studied metal elements in water samples were within the acceptable
range (87.33-114.92%. Therefore, this verifies that the optimized digestion procedure was valid for
water sample analysis.
Lead 0.05, 0.1,0.2, 0.4 0.99800
Manganese 0.03, 0.05, 0.1, 0.2, 0.4 0.99969
Nickel 0.05, 0.1, 0.2, 0.4 0.99917
Zinc 0.1, 0.2, 0.4, 0.8 0.99969
22
2.8. Method Detection Limit
The MDL is a statistically derived expression of theoretical method detection capability. Method
detection limit (MDL) is defined as the minimum concentration of analyte that can be identified,
measured and reported with 99% confidence that the analyze concentration is greater than zero, and
is determined from analysis of a sample in a given matrix containing the analyte and MDL values
are determined by performing the complete analytical procedure (extraction/digestion, cleanup, and
instrumental analysis) on replicate spiked samples (7 or more) in an otherwise clean, interference-
free matrix representative of the environmental matrix to be tested.[54]. The determination of
method detection limits, blank solutions were prepared. For metal analysis, reagents were mixed
Copper Chromium Iron Manganes Lead Nickel Zinc
0
20
40
60
80
100
120
114.
92±2
.504
163
103.
02±0
.288
675
99.0
8±0.
3818
81
88.5
±1.7
3205
1
93.3
3±8.
6216
78
87.
33±2
.309
401
104.
25±10
.678
05
Va
lue
of
reco
ve
ry
metal elements
Recovery
Figure: 2.4.. The recovery value of seven trace metals in the water samples
23
and digested with the optimum procedure, cooled, filtered and diluted. After digestion of seven
blank solutions such metal then seven readings were obtained shown in appendix (2)
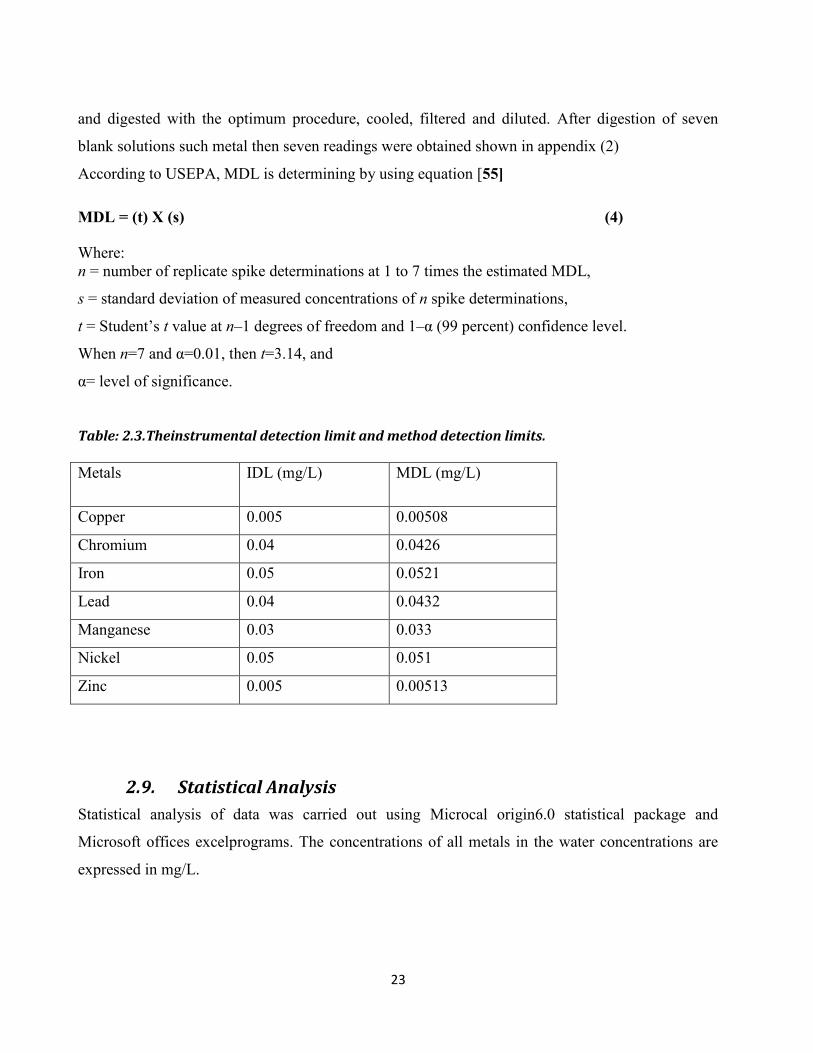
According to USEPA, MDL is determining by using equation [55]
MDL = (t) X (s) (4)
Where:
n = number of replicate spike determinations at 1 to 7 times the estimated MDL,
s = standard deviation of measured concentrations of n spike determinations,
t = Student’s t value at n–1 degrees of freedom and 1–α (99 percent) confidence level.
When n=7 and α=0.01, then t=3.14, and
α= level of significance.
Table: 2.3.Theinstrumental detection limit and method detection limits.
Metals IDL (mg/L) MDL (mg/L)
Copper 0.005 0.00508
Chromium 0.04 0.0426
Iron 0.05 0.0521
Lead 0.04 0.0432
Manganese 0.03 0.033
Nickel 0.05 0.051
Zinc 0.005 0.00513
2.9. Statistical Analysis
Statistical analysis of data was carried out using Microcal origin6.0 statistical package and
Microsoft offices excelprograms. The concentrations of all metals in the water concentrations are
expressed in mg/L.
24
3. RESULTS
The result of obtained from experimental analysis of water sample such as; Raw water from the
dam, Borehole water, Infiltrated or Water at the clarifier, filtrated or Sand filtered water at
treatment and potable or water that distributed from reservoir were give below in the table 3.1a and
3.1b depending on their measurement.
The accessibility of domestic use of potable water needs is influenced by physicochemical
parameters such as pH, electrical conductivity, temperature, solids, and inorganic minerals,
nutrients, mineral concentrations as well as the concentration level of heavy metals.
3.1. Physicochemical Variables of Water
The analytical result of physicochemical parameters in drinking water samples of different sampling
sites in Gondar Town are given in table 3.1a and table 3.1a below.
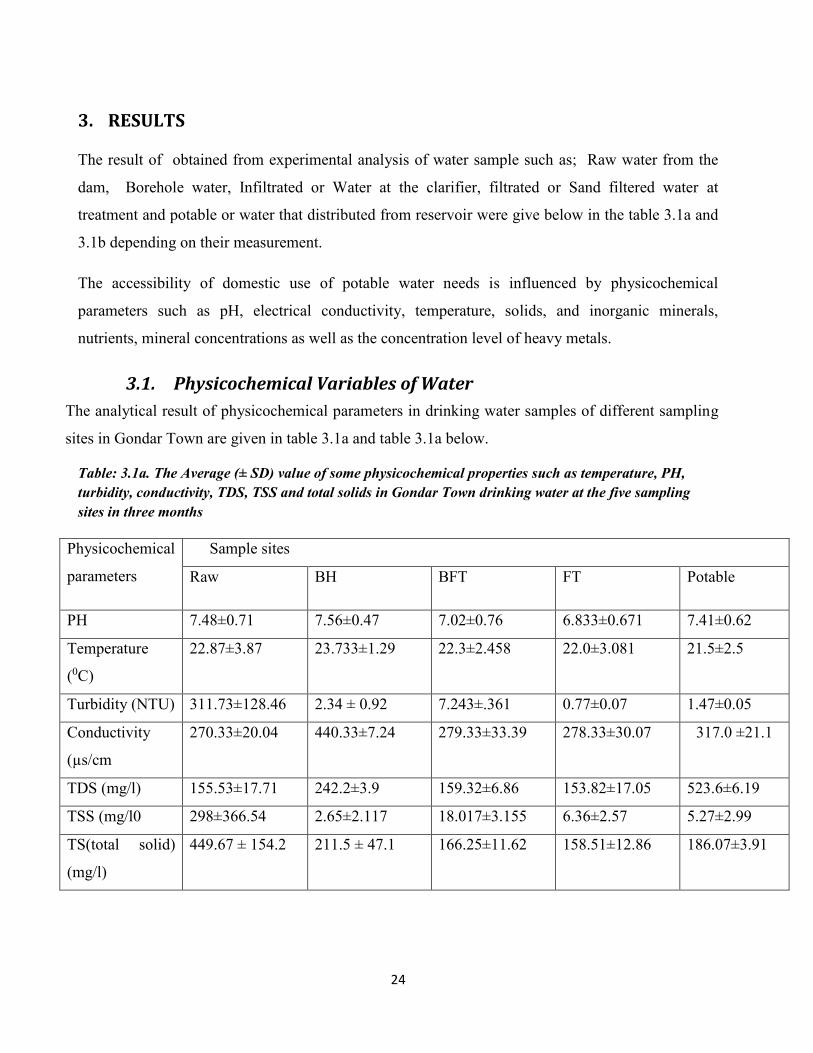
Table: 3.1a. The Average (± SD) value of some physicochemical properties such as temperature, PH,
turbidity, conductivity, TDS, TSS and total solids in Gondar Town drinking water at the five sampling
sites in three months
Physicochemical
parameters
Sample sites
Raw BH BFT FT Potable
PH 7.48±0.71 7.56±0.47 7.02±0.76 6.833±0.671 7.41±0.62
Temperature
(0C)
22.87±3.87 23.733±1.29 22.3±2.458 22.0±3.081 21.5±2.5
Turbidity (NTU) 311.73±128.46 2.34 ± 0.92 7.243±.361 0.77±0.07 1.47±0.05
Conductivity
(µs/cm
270.33±20.04 440.33±7.24 279.33±33.39 278.33±30.07 317.0 ±21.1
TDS (mg/l) 155.53±17.71 242.2±3.9 159.32±6.86 153.82±17.05 523.6±6.19
TSS (mg/l0 298±366.54 2.65±2.117 18.017±3.155 6.36±2.57 5.27±2.99
TS(total solid)
(mg/l)
449.67 ± 154.2 211.5 ± 47.1
166.25±11.62 158.51±12.86 186.07±3.91
25
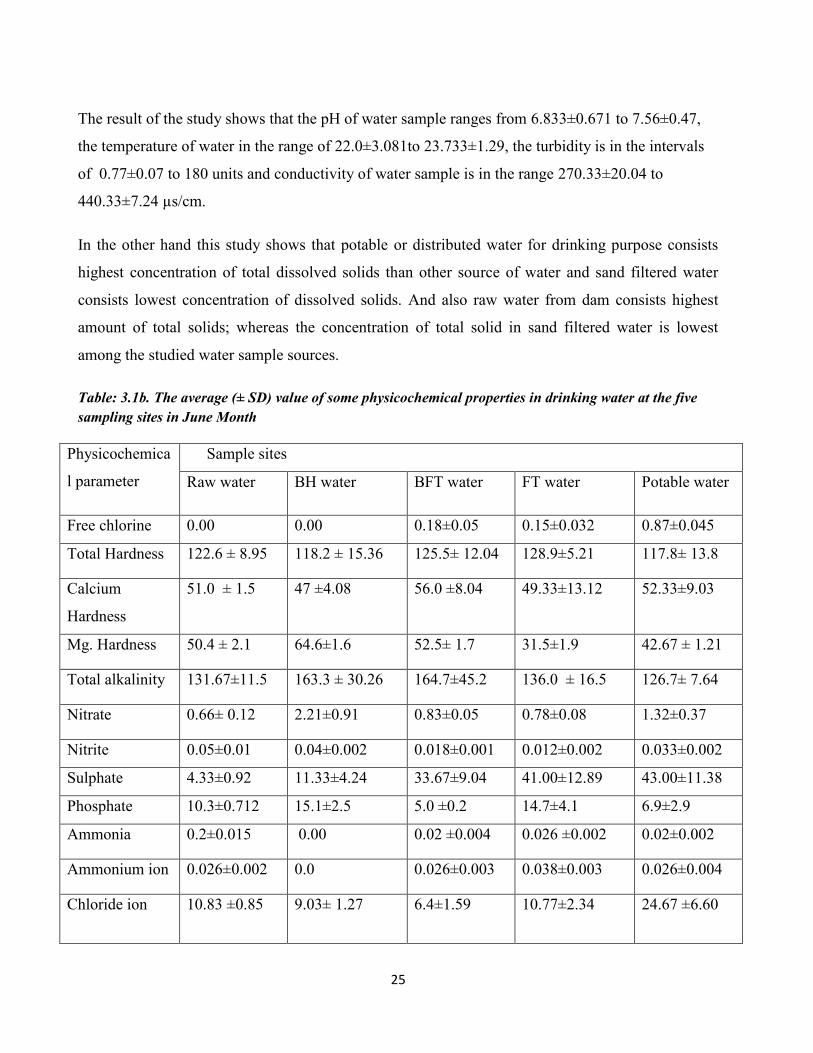
The result of the study shows that the pH of water sample ranges from 6.833±0.671 to 7.56±0.47,
the temperature of water in the range of 22.0±3.081to 23.733±1.29, the turbidity is in the intervals
of 0.77±0.07 to 180 units and conductivity of water sample is in the range 270.33±20.04 to
440.33±7.24 µs/cm.
In the other hand this study shows that potable or distributed water for drinking purpose consists
highest concentration of total dissolved solids than other source of water and sand filtered water
consists lowest concentration of dissolved solids. And also raw water from dam consists highest
amount of total solids; whereas the concentration of total solid in sand filtered water is lowest
among the studied water sample sources.
Table: 3.1b. The average (± SD) value of some physicochemical properties in drinking water at the five
sampling sites in June Month
Physicochemica
l parameter
Sample sites
Raw water BH water BFT water FT water Potable water
Free chlorine 0.00 0.00 0.18±0.05 0.15±0.032 0.87±0.045
Total Hardness 122.6 ± 8.95 118.2 ± 15.36 125.5± 12.04 128.9±5.21 117.8± 13.8
Calcium
Hardness
51.0 ± 1.5 47 ±4.08 56.0 ±8.04 49.33±13.12 52.33±9.03
Mg. Hardness 50.4 ± 2.1 64.6±1.6 52.5± 1.7 31.5±1.9 42.67 ± 1.21
Total alkalinity 131.67±11.5 163.3 ± 30.26 164.7±45.2 136.0 ± 16.5 126.7± 7.64
Nitrate 0.66± 0.12 2.21±0.91 0.83±0.05 0.78±0.08 1.32±0.37
Nitrite 0.05±0.01 0.04±0.002 0.018±0.001 0.012±0.002 0.033±0.002
Sulphate 4.33±0.92 11.33±4.24 33.67±9.04 41.00±12.89 43.00±11.38
Phosphate 10.3±0.712 15.1±2.5 5.0 ±0.2 14.7±4.1 6.9±2.9
Ammonia 0.2±0.015 0.00 0.02 ±0.004 0.026 ±0.002 0.02±0.002
Ammonium ion 0.026±0.002 0.0 0.026±0.003 0.038±0.003 0.026±0.004
Chloride ion 10.83 ±0.85 9.03± 1.27 6.4±1.59 10.77±2.34 24.67 ±6.60
26
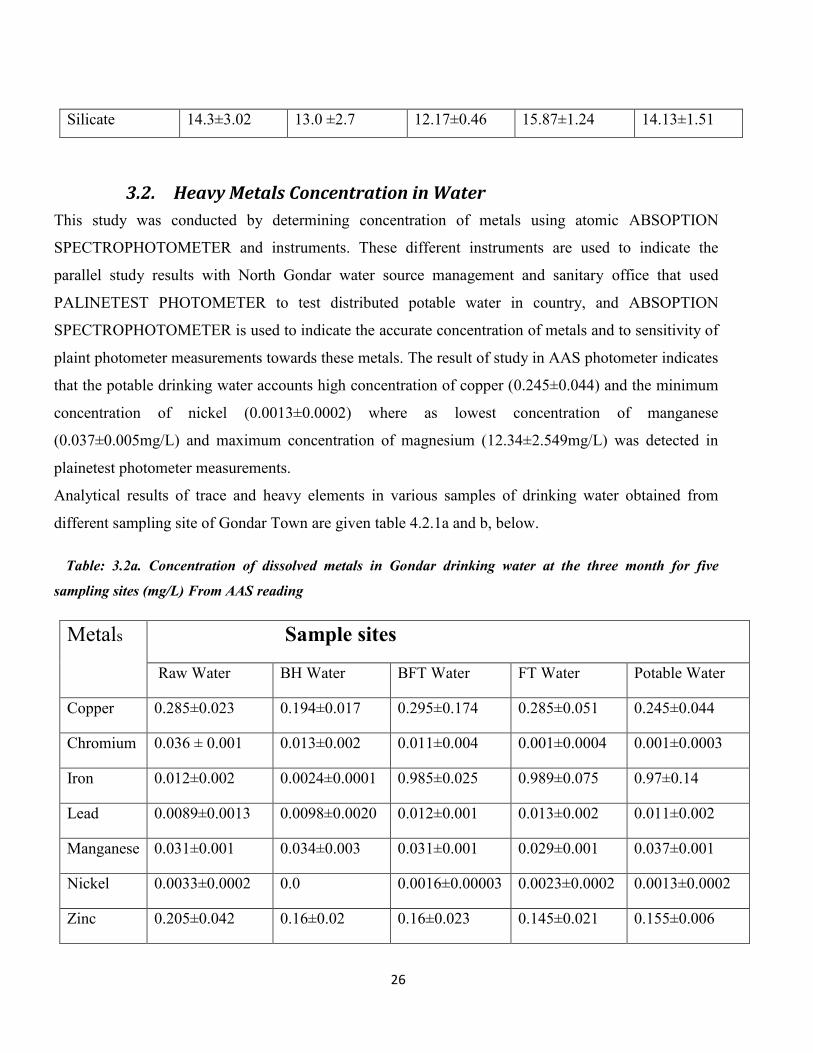
Silicate 14.3±3.02 13.0 ±2.7 12.17±0.46 15.87±1.24 14.13±1.51
3.2. Heavy Metals Concentration in Water
This study was conducted by determining concentration of metals using atomic ABSOPTION
SPECTROPHOTOMETER and instruments. These different instruments are used to indicate the
parallel study results with North Gondar water source management and sanitary office that used
PALINETEST PHOTOMETER to test distributed potable water in country, and ABSOPTION
SPECTROPHOTOMETER is used to indicate the accurate concentration of metals and to sensitivity of
plaint photometer measurements towards these metals. The result of study in AAS photometer indicates
that the potable drinking water accounts high concentration of copper (0.245±0.044) and the minimum
concentration of nickel (0.0013±0.0002) where as lowest concentration of manganese
(0.037±0.005mg/L) and maximum concentration of magnesium (12.34±2.549mg/L) was detected in
plainetest photometer measurements.
Analytical results of trace and heavy elements in various samples of drinking water obtained from
different sampling site of Gondar Town are given table 4.2.1a and b, below.
Table: 3.2a. Concentration of dissolved metals in Gondar drinking water at the three month for five
sampling sites (mg/L) From AAS reading
Metals Sample sites
Raw Water BH Water BFT Water FT Water Potable Water
Copper 0.285±0.023 0.194±0.017 0.295±0.174 0.285±0.051 0.245±0.044
Chromium 0.036 ± 0.001 0.013±0.002 0.011±0.004 0.001±0.0004 0.001±0.0003
Iron 0.012±0.002 0.0024±0.0001 0.985±0.025 0.989±0.075 0.97±0.14
Lead 0.0089±0.0013 0.0098±0.0020 0.012±0.001 0.013±0.002 0.011±0.002
Manganese 0.031±0.001 0.034±0.003 0.031±0.001 0.029±0.001 0.037±0.001
Nickel 0.0033±0.0002 0.0 0.0016±0.00003 0.0023±0.0002 0.0013±0.0002
Zinc 0.205±0.042 0.16±0.02 0.16±0.023 0.145±0.021 0.155±0.006

27
Table: 3.2b: The comparative study for the concentration of Copper, Iron and Manganese and
Aluminum, Calcium and magnesium metals dissolved in water were determine by using the
PALINETEST 8000 PHOTOMETER.
Metal
Elements
Sample Sites
Raw Water BH Water BFT Water FT water Potable Water
Copper 1.3±0.4 0.6±0.3 1.31±0.8 1.26±0.58 1.103±0.298
Iron 0.4±0.05 0.09±0.01 0.73±0.10 0.69±0.04 0.59±0.04
Manganese 0.027±0.006 0.013±0.002 0.036±0.012 0.02±0.006 0.037±0.005
Calcium 20.7±0.3 22.9±1.9 20.58±4.63 20.1±6.3 20.93±4.42
Aluminum 0.044±0.011 0.001 0.048±0.006 0.057±0.003 0.065±0.003
Magnesium 14.74±3.397 15.67±3.552 17.63±2.4097 14.38±4.582 12.34±2.549

28
4. Discussion
4.1. Physicochemical quality of water
PH: International Standards for Drinking-water suggested that pH less than 6.5 or greater than 9.2
would markedly impair the potability of the water. No health-based guideline value is proposed for
pH. Although pH usually has no direct impact on consumers, it is one of the most important
operational water quality parameters, the optimum pH required often being in the range 6.5–9.5
[56].
The pH of the Raw, Bore Hole, BFT, clarified and potable water samples are 7.48±0.7,7.56±0.47,
7.02±0.76, 6.83±0.67 and 7.41±0.62 respectively. The optimum value of pH according to Ethiopian
standard is 6.5 to 8.5. The result of pH of obtained from analytical data indicates that the PH of
water sample falls between the range of both international and national standards of drinking water.
TURBIDITY: The most turbid water is good condition for different pathogens propagation and
great chance for water born disease. This is because contaminants like virus and bacterias can
become attached to the suspended solid and are protected by these solids from disinfection by
chlorination. Turbidity is important because it affects both the acceptability of water toConsumers,
and the selection and efficiency of treatment processes, particularly the efficiency of disinfection
with chlorine since it exerts a chlorine demand and protects microorganisms and may also stimulate
the growth of bacteria. It is recommended that, for water to be disinfected, the turbidity should be
consistently less than 5 NTU by WHO, [5, 57].
According to the results obtained in this study, the turbidity Raw, Borehole, BFT, sand filtrated and
potable water samples are 32.34±0.92, 11.73±38,7.24±2.36,0.77±0.05, 1.47±0 .65 respectively.
From this study, it was observed that Borehole, and filtrated water samples exhibited a higher
quality of drinking water. But raw water and BFT water sample exhibited lower quality which is
unsatisfactory compared to the national and international water quality standards.
TDS: The potability of water with a TDS level of less than 600 mg/litre is generally considered
to be good; drinking-water becomes significantly and increasingly not potable at TDS levels greater
than about 1000 mg/litre. The presence of high levels of TDS may also be objectionable to
consumers, owing to excessive scaling in water pipes, heaters, boilers and household appliances.
29
Concentrations of TDS in water vary considerably in different geological regions owing to
differences in the solubility of minerals. Reliable data on possible health effects associated with the
ingestion of TDS in drinking-water are not available, and no health-based guideline value is
proposed. However, the presence of high levels of TDS in drinking-water may be objectionable to
consumers. A recent conceptual model links higher bulk conductivities at hydrocarbon impacted
sites to higher total dissolved solids (TDS) resulting from enhanced mineral weathering due to acids
produced during biodegradation. In this study, we evaluated the above model by investigating the
vertical distribution of bulk conductivity. The TDS values displayed by the conductivity/TDS meter
are calculated from the specific conductance of ground water and can be approximated by the
following equation [57, 58].
The result obtained from the analysis indicates that the total dissolved solids in each water sample
are acceptable according to the international drinking water standards.
Total solid: The total solid of water sample was the amount of residual solids that incorporates
dissolved solid and suspend solid in water. The international drinking water standards gives the
Permissible value of total solid in drinking water is 500mg/l and the excess value of total solid in
drinking water is 1500mg/l respectively [59].
The result obtained from the analysis of all water samples in table: 4a, indicate the total solid in this
water sample is below the permissible limit value of WHO standards. This indicates that all sources
of water of different simple sites are good for dirking purpose. But the total solid of raw water is
high enough and the value nearly closest with permissible values of drinking water. This is due to
that the upper stream of water holds maximum amount of suspended solids from the surrounding of
city in summer months
Temperature: Many aquatic organisms are sensitive to changes in water temperature. Temperature
is an important water quality parameter and is relatively easy to measure. There is no any
permissibility level in provisional values WHO guidelines of temperature for drinking water, but
the Canadian drinking water standard indicates that temperature of drinking water is less than
15℃.The investigation of temperature demonstrated that the average temperature of raw, borehole,
BFT, filtrated, and potable water samples were measured to be22.87±3.87, 23.73±1.29, 22.30±2.46,
30
22.00±3.10, and 21.50±2.48 respectively. The result of analysis indicates that all of the water
sample temperature was below the room temperature.
Conductivity: Specific conductance yields a measure of water’s capacity to convey an electric
current. This property related to the total concentration of the ionized substances in water and the
temperature at which the measurement is made the nature of the various dissolved substances, their
actual and relative concentrations, and the ionic strength of the water sample vitally affects the
specific conductance. Conductivity, the ability of water to carry an electric charge, is a proxy
indicator of dissolved solids and is therefore an indicator of the taste/salinity of the water (a
conductivity of 1400 μS/cm is equivalent to 1000 μg/L total dissolved solids). Although there is
little direct health risk associated with this parameter, high values are associated with poor taste and
hence customer dissatisfaction and complaints. If conductivity changes over time, or if conductivity
values are high, this can indicate that the water is contaminated [60].
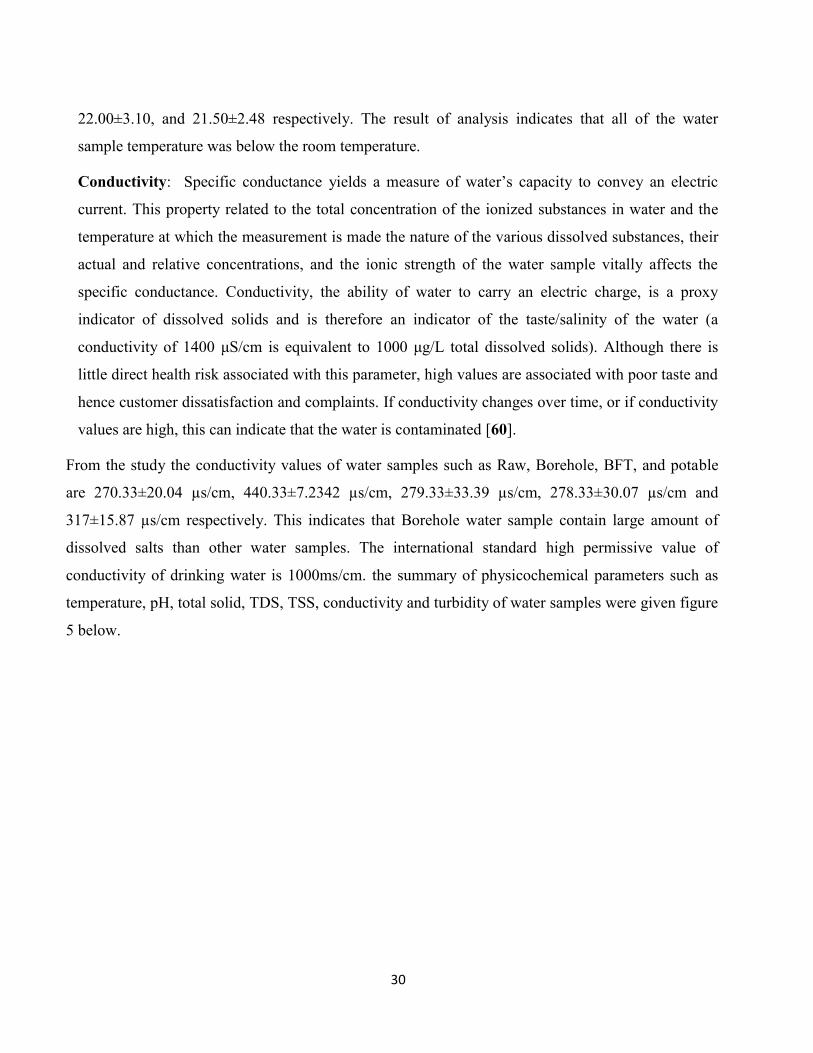
From the study the conductivity values of water samples such as Raw, Borehole, BFT, and potable
are 270.33±20.04 µs/cm, 440.33±7.2342 µs/cm, 279.33±33.39 µs/cm, 278.33±30.07 µs/cm and
317±15.87 µs/cm respectively. This indicates that Borehole water sample contain large amount of
dissolved salts than other water samples. The international standard high permissive value of
conductivity of drinking water is 1000ms/cm. the summary of physicochemical parameters such as
temperature, pH, total solid, TDS, TSS, conductivity and turbidity of water samples were given figure
5 below.
31
Figure; 4.1: This graph Represents the physicochemical parameters such as PH, Temperature,
Turbidity, conductivity, total solid, total dissolved solid and total Suspended solids in the analysed water
sample and their average value
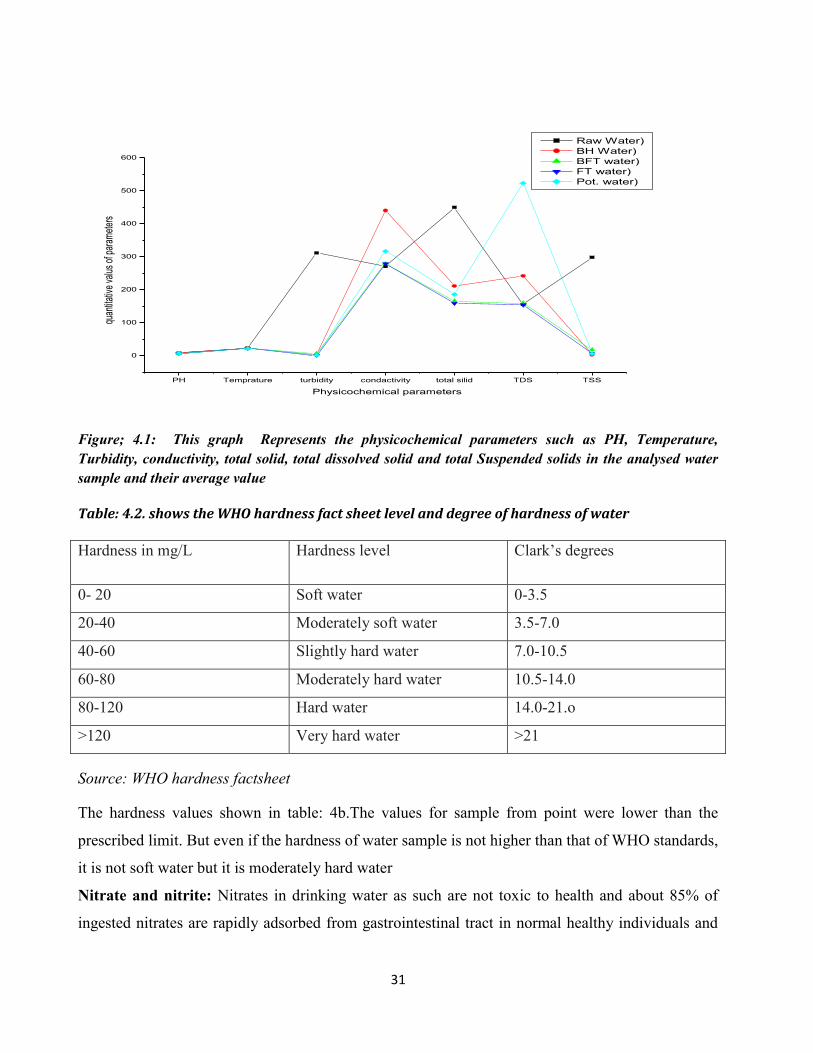
Table: 4.2. shows the WHO hardness fact sheet level and degree of hardness of water
Hardness in mg/L Hardness level Clark’s degrees
0- 20 Soft water 0-3.5
20-40 Moderately soft water 3.5-7.0
40-60 Slightly hard water 7.0-10.5
60-80 Moderately hard water 10.5-14.0
80-120 Hard water 14.0-21.o
>120 Very hard water >21
Source: WHO hardness factsheet
The hardness values shown in table: 4b.The values for sample from point were lower than the
prescribed limit. But even if the hardness of water sample is not higher than that of WHO standards,
it is not soft water but it is moderately hard water
Nitrate and nitrite: Nitrates in drinking water as such are not toxic to health and about 85% of
ingested nitrates are rapidly adsorbed from gastrointestinal tract in normal healthy individuals and
PH Temprature turbidity condactivity total silid TDS TSS
0
100
200
300
400
500
600
quan
titat
ive
valu
s of
par
amet
ers
Physicochemical parameters
Raw Water)
BH Water)
BFT water)
FT water)
Pot. water)
32
adsorbed nitrates are excreted by the kidneys. But, if the nitrates are converted into nitrites which
occur commonly, then toxic effects are encountered and may cause potential health hazards. Nitrate
is one of the most ubiquitous chemical constituents/contaminants of water bodies worldwide as it is
derived from human activities, particularly from the disposal of human and animal wastes and the
use of nitrogenous fertilizers in agriculture [61].
Nitrates occur naturally in many water-supplies and may also find access to them directly or
indirectly through, for example, the discharge of raw sewage, purified sewage effluent, or barn-yard
drainage. The danger of nitrates to human health is limited to some infants under one year of age.
The maximum permissible concentration of nitrate in drinking water is 50mg/l according to both
WHO and Ethiopian standards [62].
The average concentration of nitrate and nitrite in all water samples were raw water, (0.626±0.2),
BH water, (2.21±0.91 mg/L), BFT water, (0.83±0.05 mg/L), FB water, (0.78±0.008 mg/L) and
potable water (1.32±0.37 mg/L)and raw (0.05±0.001), BH water (0.04±0.002), BFT water
(0.018±0.001), FT water (0.012±0.002) and potable water (0.033±0.002) respectively. This result
indicate that all water sours are not polluted by nitrogen contain domestic wastes.
According to fig. 6, the concentration of nitrate and nitrite obtained from laboratory analysis, BH
water contain maximum amount of nitrate and raw water contain minimum amount of nitrate. The
concentration of both nitrate and nitrite in all sampling sites are below the permissible limits of
WHO Gvs.
Ammonia/Ammonium: From the results obtained from the laboratory analysis, the average value
of ammonia/ammonium for the five sample sites namely raw, BH, BFT, Ft and potable water were
below WHO and draft Ethiopian drinking water allowable concentration of 1.5mg/l and 3mg/l
respectively. According to fig. 6, the result of ammonia/ammonium concentration obtained from
laboratory analysis, BH water is under the instrumental detection limit and the concentration of
ammonia maximum at FT water.

33
Figure: 4.2. Graphs which represents the concentration of Nitrate, Nitrite, Ammonia and ammonium ion
in analyzed water
Total alkalinity:Alkalinity of water is its capacity to neutralize a strong acid and it is normally due
to the presence of bicarbonate, carbonate and hydroxide compound of calcium, sodium and
potassium [62].
Total alkalinity values for all the investigated samples were found to be less in samples Raw,BH,
BFT, FT and potable than the value prescribed by WHO.
Total hardness: Hardness is the property of water which prevents the lather formation with soap
and increases the boiling points of water. Hardness of water mainly depends upon the amount of
calcium or magnesium salts or both. International Standards stated that the maximum permissible
level of hardness in drinking-water was 500mg/l [63]. The hardness values shown in table: 4b.The
values for sample from point were lower than the prescribed limit. But even if the hardness of water
sample is not higher than that of WHO standards, it is not soft water but it is moderately hard water.
Nitrate Nitrite Ammonia Ammonium
0.0
0.5
1.0
1.5
2.0
2.5
Conce
ntr
atio
n o
f par
amet
ers
Chemical parameters
Raw water BH water BFT water FT water potablewater
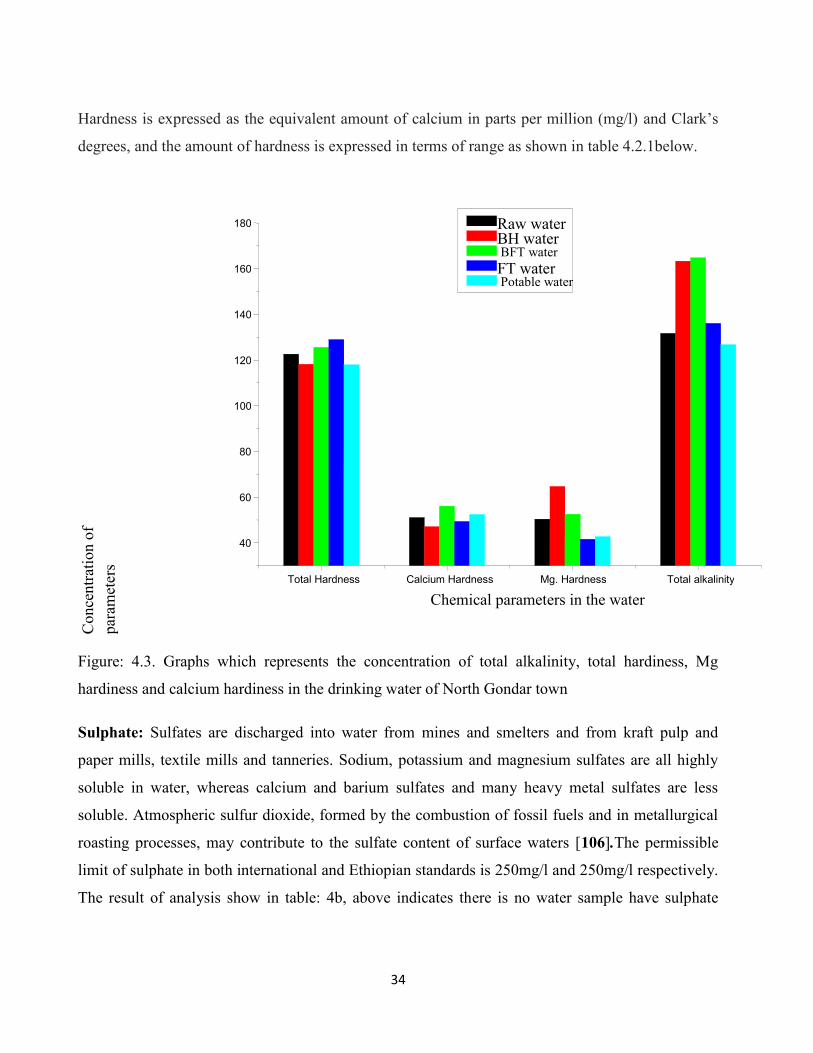
34
Hardness is expressed as the equivalent amount of calcium in parts per million (mg/l) and Clark’s
degrees, and the amount of hardness is expressed in terms of range as shown in table 4.2.1below.
Figure: 4.3. Graphs which represents the concentration of total alkalinity, total hardiness, Mg
hardiness and calcium hardiness in the drinking water of North Gondar town
Sulphate: Sulfates are discharged into water from mines and smelters and from kraft pulp and
paper mills, textile mills and tanneries. Sodium, potassium and magnesium sulfates are all highly
soluble in water, whereas calcium and barium sulfates and many heavy metal sulfates are less
soluble. Atmospheric sulfur dioxide, formed by the combustion of fossil fuels and in metallurgical
roasting processes, may contribute to the sulfate content of surface waters [106].The permissible
limit of sulphate in both international and Ethiopian standards is 250mg/l and 250mg/l respectively.
The result of analysis show in table: 4b, above indicates there is no water sample have sulphate
Total Hardness Calcium Hardness Mg. Hardness Total alkalinity
40
60
80
100
120
140
160
180
Conce
ntr
atio
n o
f
par
amet
ers
Chemical parameters in the water
Raw water BH water BFT water FT water Potable water
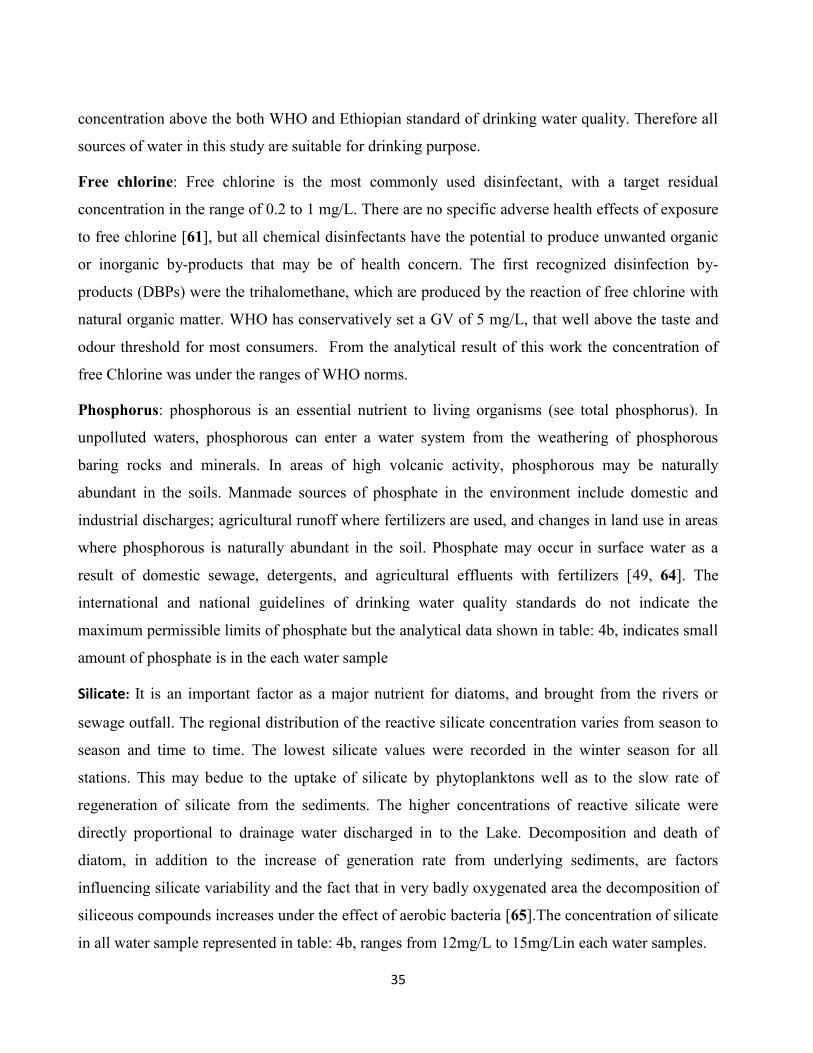
35
concentration above the both WHO and Ethiopian standard of drinking water quality. Therefore all
sources of water in this study are suitable for drinking purpose.
Free chlorine: Free chlorine is the most commonly used disinfectant, with a target residual
concentration in the range of 0.2 to 1 mg/L. There are no specific adverse health effects of exposure
to free chlorine [61], but all chemical disinfectants have the potential to produce unwanted organic
or inorganic by-products that may be of health concern. The first recognized disinfection by-
products (DBPs) were the trihalomethane, which are produced by the reaction of free chlorine with
natural organic matter. WHO has conservatively set a GV of 5 mg/L, that well above the taste and
odour threshold for most consumers. From the analytical result of this work the concentration of
free Chlorine was under the ranges of WHO norms.
Phosphorus: phosphorous is an essential nutrient to living organisms (see total phosphorus). In
unpolluted waters, phosphorous can enter a water system from the weathering of phosphorous
baring rocks and minerals. In areas of high volcanic activity, phosphorous may be naturally
abundant in the soils. Manmade sources of phosphate in the environment include domestic and
industrial discharges; agricultural runoff where fertilizers are used, and changes in land use in areas
where phosphorous is naturally abundant in the soil. Phosphate may occur in surface water as a
result of domestic sewage, detergents, and agricultural effluents with fertilizers [49, 64]. The
international and national guidelines of drinking water quality standards do not indicate the
maximum permissible limits of phosphate but the analytical data shown in table: 4b, indicates small
amount of phosphate is in the each water sample
Silicate: It is an important factor as a major nutrient for diatoms, and brought from the rivers or
sewage outfall. The regional distribution of the reactive silicate concentration varies from season to
season and time to time. The lowest silicate values were recorded in the winter season for all
stations. This may bedue to the uptake of silicate by phytoplanktons well as to the slow rate of
regeneration of silicate from the sediments. The higher concentrations of reactive silicate were
directly proportional to drainage water discharged in to the Lake. Decomposition and death of
diatom, in addition to the increase of generation rate from underlying sediments, are factors
influencing silicate variability and the fact that in very badly oxygenated area the decomposition of
siliceous compounds increases under the effect of aerobic bacteria [65].The concentration of silicate
in all water sample represented in table: 4b, ranges from 12mg/L to 15mg/Lin each water samples.
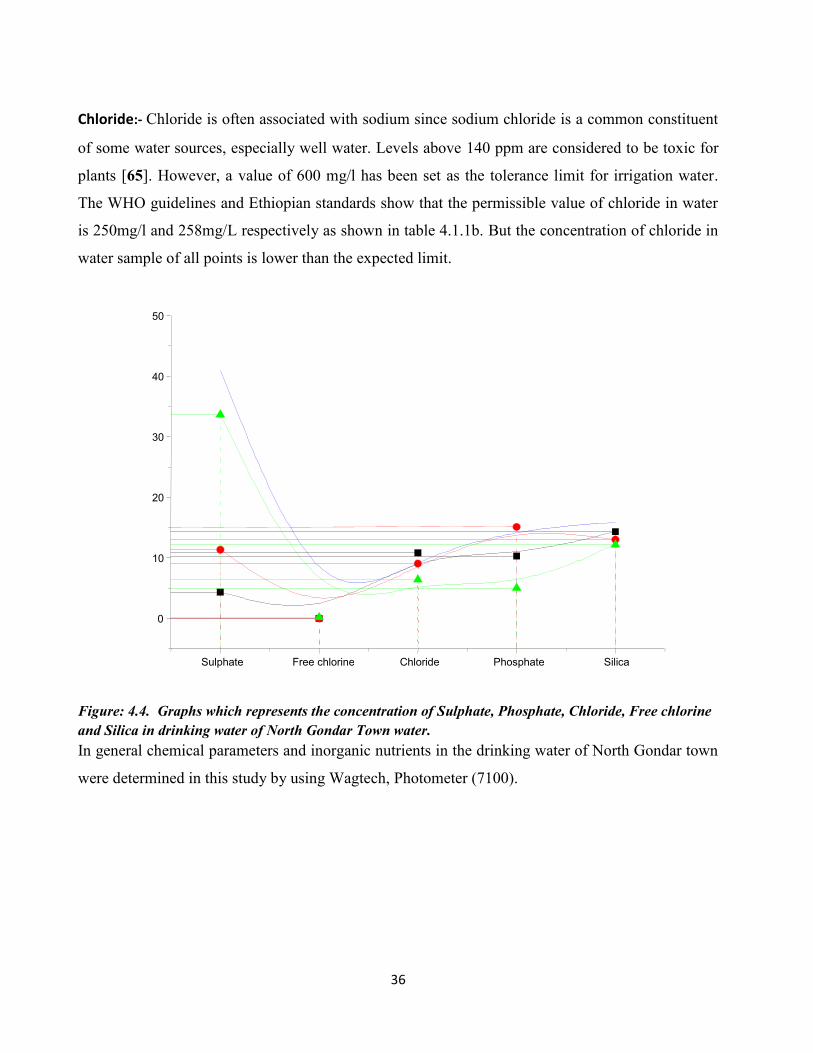
36
Chloride:- Chloride is often associated with sodium since sodium chloride is a common constituent
of some water sources, especially well water. Levels above 140 ppm are considered to be toxic for
plants [65]. However, a value of 600 mg/l has been set as the tolerance limit for irrigation water.
The WHO guidelines and Ethiopian standards show that the permissible value of chloride in water
is 250mg/l and 258mg/L respectively as shown in table 4.1.1b. But the concentration of chloride in
water sample of all points is lower than the expected limit.
Figure: 4.4. Graphs which represents the concentration of Sulphate, Phosphate, Chloride, Free chlorine
and Silica in drinking water of North Gondar Town water.
In general chemical parameters and inorganic nutrients in the drinking water of North Gondar town
were determined in this study by using Wagtech, Photometer (7100).
Sulphate Free chlorine Chloride Phosphate Silica
0
10
20
30
40
50
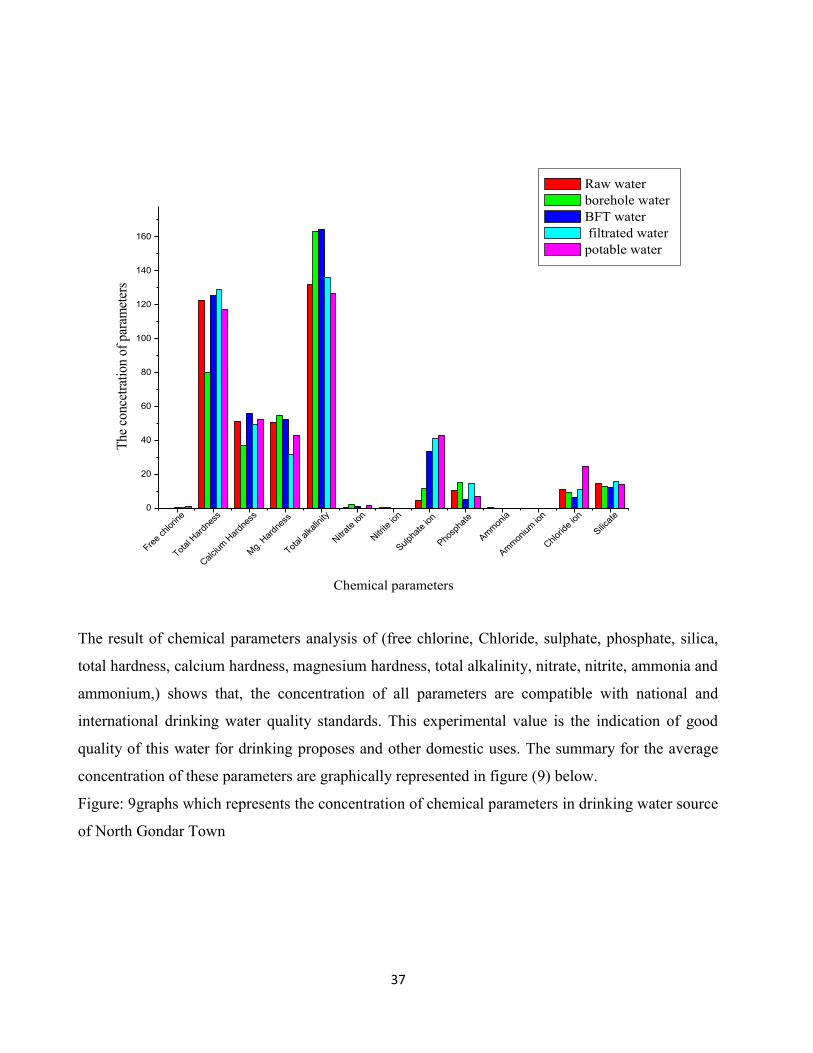
37
The result of chemical parameters analysis of (free chlorine, Chloride, sulphate, phosphate, silica,
total hardness, calcium hardness, magnesium hardness, total alkalinity, nitrate, nitrite, ammonia and
ammonium,) shows that, the concentration of all parameters are compatible with national and
international drinking water quality standards. This experimental value is the indication of good
quality of this water for drinking proposes and other domestic uses. The summary for the average
concentration of these parameters are graphically represented in figure (9) below.
Figure: 9graphs which represents the concentration of chemical parameters in drinking water source
of North Gondar Town
Free
chlo
rine
Total
Har
dnes
s
Cal
cium
Har
dnes
s
Mg.
Har
dnes
s
Total
alkal
inity
Nitr
ate
ion
Nitr
ite io
n
Sulph
ate
ion
Phosp
hate
Amm
onia
Amm
oniu
m io
n
Chl
orid
e io
n
Silicat
e0
20
40
60
80
100
120
140
160
The
conce
trat
ion o
f par
amet
ers
Chemical parameters
Raw water
borehole water
BFT water
filtrated water
potable water
38
4.2. Selected trace and heavy metals
Aluminum: Coagulation is suitable for removal of certain heavy metals and low-solubility organic
chemicals, such as certain Organochlorine pesticides. For other organic chemicals, coagulation is
generally ineffective, except where the chemical is bound to humic material or adsorbed onto
particulate. Chemical coagulation-based treatment is the most common approach for treatment of
surface waters and is almost always based on the following unit processes. Chemical coagulants,
usually salts of aluminum or iron, are dosed to the raw water under controlled conditions to form a
solid flocculent metal hydroxide WHO. Aluminum is widely used in raw water treatment by adding
the aluminum Sulphate (alum) in coagulation and flocculation processes to ensure safe drinking
water for human consumption by minimizing the levels of organic matter, microorganism, colour
and turbidity. The concentration of aluminum in natural waters can vary significantly depending on
various physicochemical and mineralogical factors and the Aluminum levels in drinking-water vary
according to the levels found in the source water and whether aluminum coagulants are used during
water treatment. There for aluminum concentration of 0.2 mg/L in drinking-water provided a
compromise between the practical use of aluminum salts in water treatment and discoloration of
distributed water [66]
In this study, the average concentration ±SD in the water sample of Raw, BH, BFT, FT and potable
water were 0.044±0.037, 0.001±0.0, 0.048±0.065, 0.057±0.063 and 0.065±0.065 respectively.
The results lower than the national and international permissible limit of Guide line Values for
drinking water standard.
Calcium and Magnesium:-Both calcium and magnesium are essential to human health. Inadequate
intake of either nutrient can impair health. Over 99% of total body calcium is found in bones and
teeth, where it functions as a key structural element. The remaining body calcium functions in
metabolism, serving as a signal for vital physiological processes, including vascular contraction,
blood clotting, muscle contraction and nerve transmission.
Inadequate intakes of calcium have been associated with increased risks of osteoporosis,
nephrolithiasis (kidney stones), colorectal cancer, hypertension and stroke, coronary artery disease,
insulin resistance and obesity. Magnesium is the fourth most abundant cation in the body and the
second most abundant cation in intracellular fluid. Low magnesium levels are associated with

39
endothelial dysfunction, increased vascular reactions, elevated circulating levels of reactive protein
and decreased insulin sensitivity. Low magnesium status has been implicated in hypertension,
coronary heart disease, diabetes mellitus and metabolic syndrome. Individuals vary considerably in
their needs for and consumption of these elements. While the concentrations of calcium and
magnesium in drinking-water vary markedly from one supply to another, mineral-rich drinking-
waters may provide substantial contributions to total intakes of these nutrients in some populations
or population subgroups [66].The result of study in table (4.2.1b) shows, concentration of calcium
and magnesium ranges from 20.10± 0.63 to 22.90±1.87 and 12.34± 2.55 to 17.63±7.41 of calcium
and magnesium respectively. This result is lower than GVs of WHO, 75mg/L of calcium and
150mg/L of magnesium for drinking water qualities.
Figure: 4.5. Graph which represents the concentration of Al, Ca, and Mn in drinking water of North
Gondar Town
Copper: Copper is both an essential nutrient and a drinking-water contaminant. Commercially, it is
used to make pipes, valves and fittings and is present in alloys and coatings. Copper sulfate penta
Aluminum Calcium Magnesium
0
5
10
15
20
25
Conce
ntr
atio
n o
f tr
ace
met
als
(Photo
met
er)
Trace metal elements in the water
Rawwater BH water BFTwater FTwater Potablewater
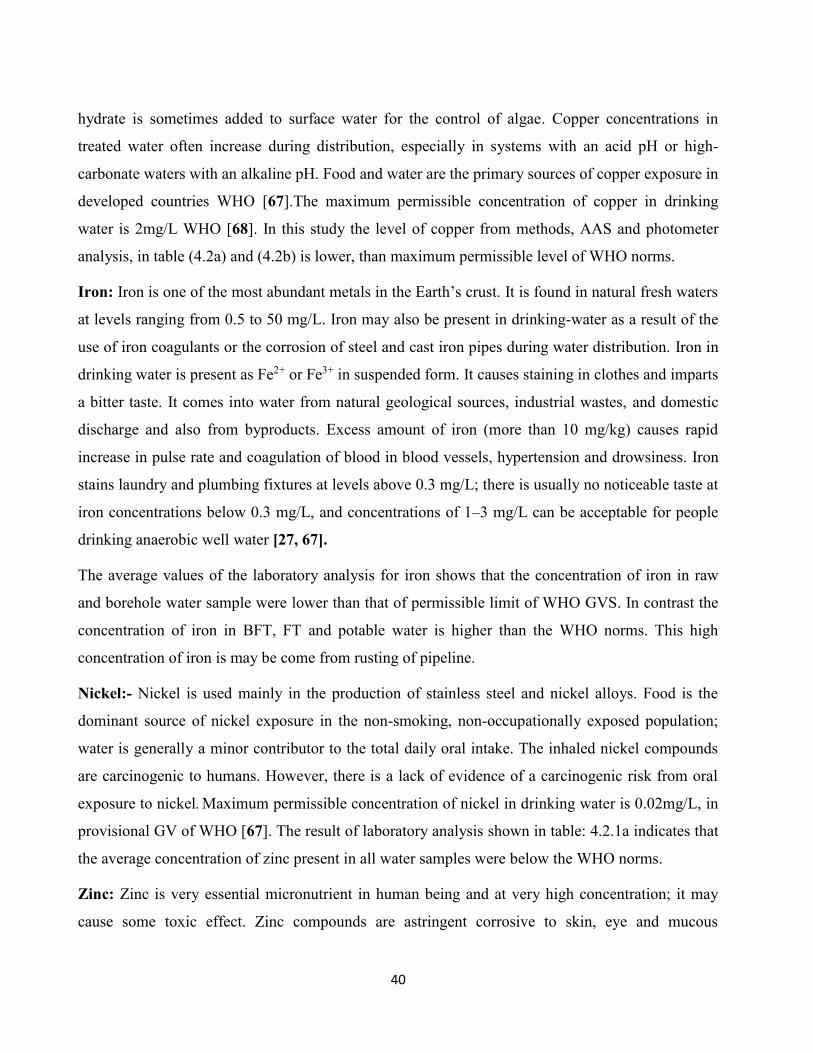
40
hydrate is sometimes added to surface water for the control of algae. Copper concentrations in
treated water often increase during distribution, especially in systems with an acid pH or high-
carbonate waters with an alkaline pH. Food and water are the primary sources of copper exposure in
developed countries WHO [67].The maximum permissible concentration of copper in drinking
water is 2mg/L WHO [68]. In this study the level of copper from methods, AAS and photometer
analysis, in table (4.2a) and (4.2b) is lower, than maximum permissible level of WHO norms.
Iron: Iron is one of the most abundant metals in the Earth’s crust. It is found in natural fresh waters
at levels ranging from 0.5 to 50 mg/L. Iron may also be present in drinking-water as a result of the
use of iron coagulants or the corrosion of steel and cast iron pipes during water distribution. Iron in
drinking water is present as Fe2+ or Fe3+ in suspended form. It causes staining in clothes and imparts
a bitter taste. It comes into water from natural geological sources, industrial wastes, and domestic
discharge and also from byproducts. Excess amount of iron (more than 10 mg/kg) causes rapid
increase in pulse rate and coagulation of blood in blood vessels, hypertension and drowsiness. Iron
stains laundry and plumbing fixtures at levels above 0.3 mg/L; there is usually no noticeable taste at
iron concentrations below 0.3 mg/L, and concentrations of 1–3 mg/L can be acceptable for people
drinking anaerobic well water [27, 67].
The average values of the laboratory analysis for iron shows that the concentration of iron in raw
and borehole water sample were lower than that of permissible limit of WHO GVS. In contrast the
concentration of iron in BFT, FT and potable water is higher than the WHO norms. This high
concentration of iron is may be come from rusting of pipeline.
Nickel:- Nickel is used mainly in the production of stainless steel and nickel alloys. Food is the
dominant source of nickel exposure in the non-smoking, non-occupationally exposed population;
water is generally a minor contributor to the total daily oral intake. The inhaled nickel compounds
are carcinogenic to humans. However, there is a lack of evidence of a carcinogenic risk from oral
exposure to nickel. Maximum permissible concentration of nickel in drinking water is 0.02mg/L, in
provisional GV of WHO [67]. The result of laboratory analysis shown in table: 4.2.1a indicates that
the average concentration of zinc present in all water samples were below the WHO norms.
Zinc: Zinc is very essential micronutrient in human being and at very high concentration; it may
cause some toxic effect. Zinc compounds are astringent corrosive to skin, eye and mucous
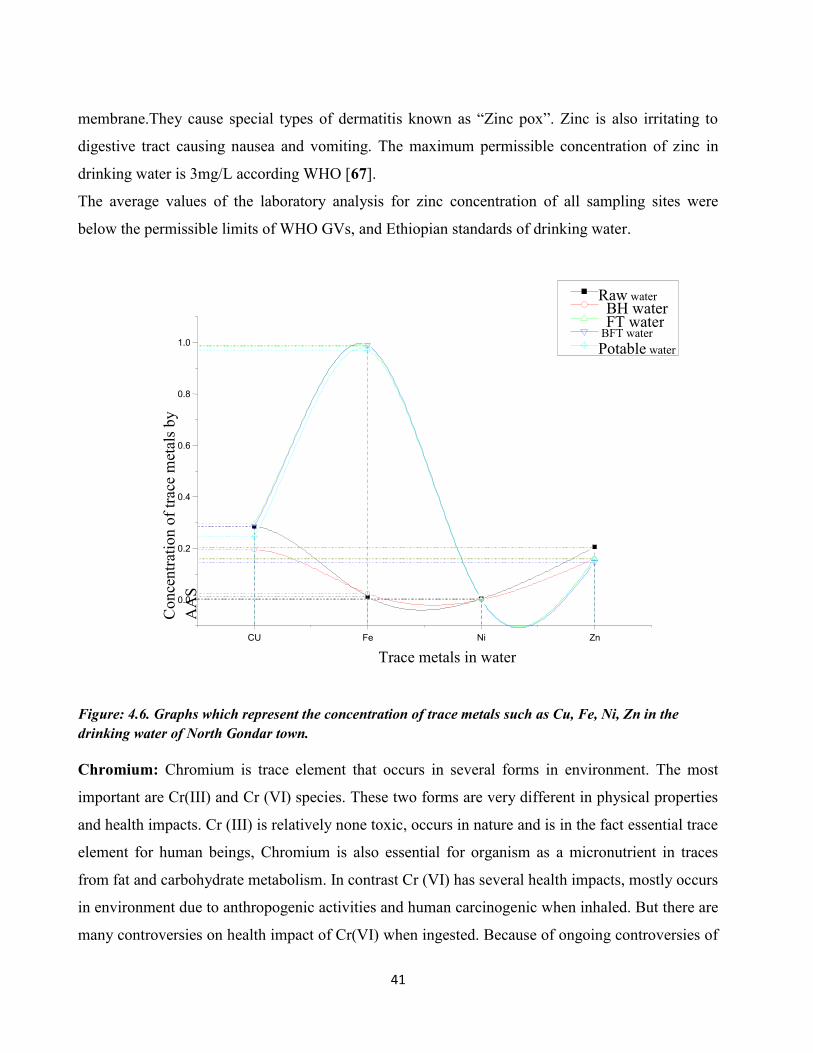
41
membrane.They cause special types of dermatitis known as “Zinc pox”. Zinc is also irritating to
digestive tract causing nausea and vomiting. The maximum permissible concentration of zinc in
drinking water is 3mg/L according WHO [67].
The average values of the laboratory analysis for zinc concentration of all sampling sites were
below the permissible limits of WHO GVs, and Ethiopian standards of drinking water.
Figure: 4.6. Graphs which represent the concentration of trace metals such as Cu, Fe, Ni, Zn in the
drinking water of North Gondar town.
Chromium: Chromium is trace element that occurs in several forms in environment. The most
important are Cr(III) and Cr (VI) species. These two forms are very different in physical properties
and health impacts. Cr (III) is relatively none toxic, occurs in nature and is in the fact essential trace
element for human beings, Chromium is also essential for organism as a micronutrient in traces
from fat and carbohydrate metabolism. In contrast Cr (VI) has several health impacts, mostly occurs
in environment due to anthropogenic activities and human carcinogenic when inhaled. But there are
many controversies on health impact of Cr(VI) when ingested. Because of ongoing controversies of
CU Fe Ni Zn
0.0
0.2
0.4
0.6
0.8
1.0
Conce
ntr
atio
n o
f tr
ace
met
als
by
AA
S
Trace metals in water
Raw water BH water FT water BFT water Potable water
42
Cr (VI) in drinking water, WHO has kept provisional GV at 0.05mg/L for total chromium [67].The
result of study shows that the average concentrations of total chromium in these water samples were
ranged from 0.01mg/L to 0.036mg/L. This result shows that the concentration of Cr in all sampling
sites is below the WHO norms and there is no chromium contaminant in this water source.
Lead:- Lead is rarely present in tap water as a result of its dissolution from natural sources; rather,
its presence is primarily from household plumbing systems containing lead in pipes, solder, fittings
or the service connections to homes. The amount of lead dissolved from the plumbing system
depends on several factors, including pH, temperature, and water hardness and standing time of the
water, with soft, acidic water being the most plumb solvent. Toxic level of lead in human body is
500 ppm beyond which it causes anemia, brain damage and vomiting. The maximum permissible
concentration of lead in drinking water is 0.1mg/L WHO [67].
The result of study shows that the concentration of lead in five sampling sites, raw, BH, BFT, FT
and potable water samples were 0.0089±0.0013, 0.0098±0.0020, 0.012±0.001, 0.013±0.002,
0.011±0.002 respectively. This indicates that the lead concentration in raw and BH water samples
are below the permissible limit GVs of WHO. In contrast the concentration of lead in BFT, FT and
potable water samples exceed the WHO norms.
Manganese: Manganese is naturally occurring in many surface water and groundwater sources,
particularly in anaerobic or low oxidation conditions, and this is the most important source for
drinking water. The exposure in high level of manganese can lead to adverse neurological effect.
Because of possible health risks, WHO has set maximum permissible concentration GVs in
drinking water is 0.4mg/L [67].
The result of the analysis shown in table: 4.2.1a and 4.2.1b, indicates that the concentration of
manganese in all water samples range from, 0.029mg/L of sand filtered water to 0.o37 mg/L of
potable water according to AAS measurement and from 0.013 mg/L of borehole water to
0.037mg/L of potable water in photometer result respectively. This result showed that the
concentration of Mn in all water samples were below WHO and Ethiopian norms.
43
Figure 4.6. Graphs which shows the concentration of Cr, Pb and Mn in the drinking water of North
Gondar Town
In general the levels of selected metals such as Cu, Cr, Fe, NI, Mn, Ca, Mg, Zn, Pb and Al from
drinking water samples were determined by using AAS and Photometer analytical method. The
result in table 3.2a and 3.2b showed that all of the selected metals were present in all the water
samples. The concentration of selected metals showed in table 3.2a and 3.2b were lower than
permissible limits of WHO GVs, except Iron and lead. Iron and lead were present in all the water
samples, and their concentration in raw and BH water samples were lower than permissible limits
of WHO GVs. In contrast their concentration in BFT, FT and potable water samples exceeds the
WHO GVs. In potable water sample concentration of Lead exceeds the WHO GVs by ±0.001mg/L
deviation.
The summary of these selected metals concentration in the entire water samples analyzed by both
methods (Atomic Absorption Spectro photometric and Wagtech Photometric methods)were
graphically represented in figure (13a) and (13b) below.
Cr Pb Mn 0.005
0.010
0.015
0.020
0.025
0.030
0.035
0.040
Conce
ntr
atio
n o
f
Hea
vym
etal
s
Heavy metals in the water
Raw water BH water BFT water FT water Potable water
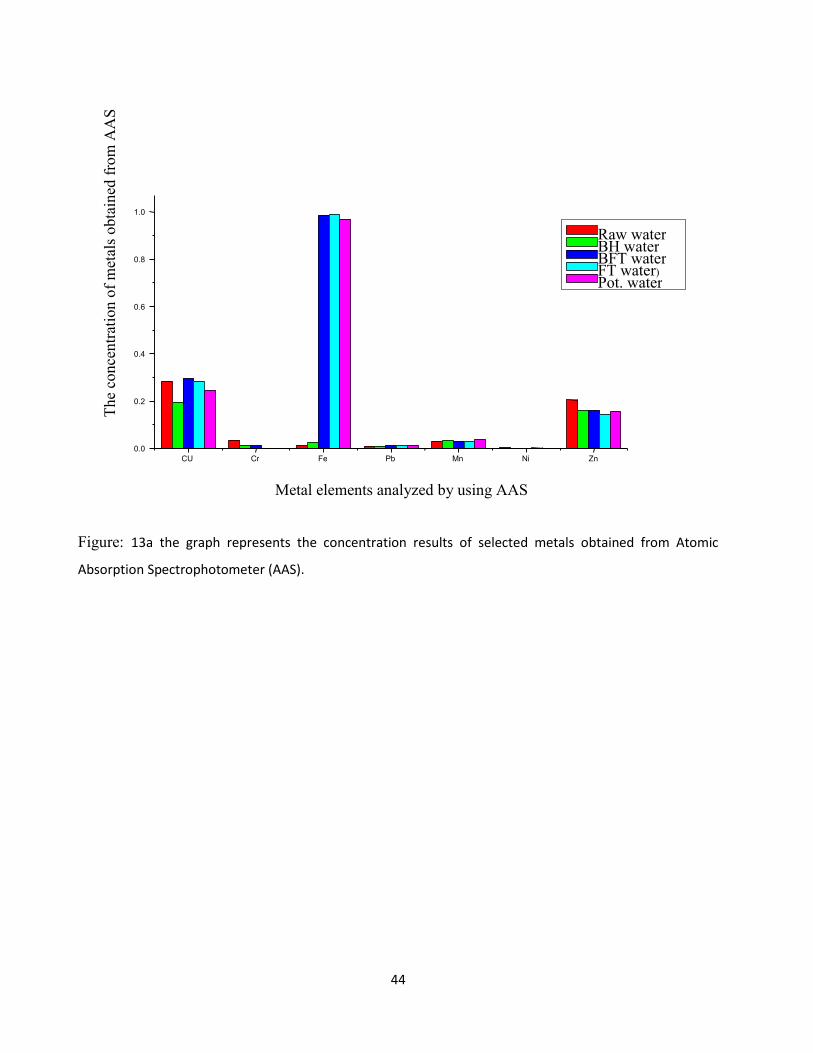
44
Figure: 13a the graph represents the concentration results of selected metals obtained from Atomic
Absorption Spectrophotometer (AAS).
CU Cr Fe Pb Mn Ni Zn 0.0
0.2
0.4
0.6
0.8
1.0
The
con
centr
atio
n o
f m
etal
s obta
ined
fro
m A
AS
Metal elements analyzed by using AAS
Raw water BH water BFT water FT water) Pot. water

45
Figure: 4.7. Graph represents the concentration of metal elements such as Copper, Iron, Manganese,
Calcium, Aluminum and Magnesium for the comparative studies of metal concentration determination in
photometer.
CU
FE
Mn
Ca
Al
Mg
0 5 10 15 20
The concentration of metal elements obtained from Photometer
Met
al e
lem
ents
an
alyse
d b
y u
sing p
alin
etes
t photo
met
er 8
000
Raw water) BH water BFT water FT water) Potable water
46
5. Conclusion and recommendation
5.1. Conclusion
The current study revealed that the quality statuses of drinking water in the city of North Gondar
highly related with the physicochemical and selected dissolved metal concentration and their health
impacts. The researcher concludes that the physicochemical constituents of all water samples were
acceptable according to national and international WHO GVS. Hardness of water sample ranges
from 118.16 mg/L of BH water to 128.9 mg/L of FT water sample as shown in the table 4.1.1b.
This result showed that all the water samples were hard except BH water which is moderately hard
according to WHO hardness fact sheet. This hardness of water has adverse effect on boilers,
cooking equipments and boundaries.
The concentration of selected metals present in all the water samples were fall under the permissible
limits of WHO guide line values..
5.2. Recommendation
The researcher recommends that, to ensure general quality and purity of this water for drinking and
domestic uses, the bacteriological water quality, dissolved organic chemicals, heavy metals
adsorbed in sediments of water and pesticide assessment needs further investigations.
Determination of trace metals in the water is imperative as the water is used for drinking Purposes
by the residents. The concentrations of dissolved trace metals in all water samples were found to be
below the maximum permissible limit of WHO for domestic and drinking purposes, but the
concentration of lead and iron in BFT, FT and potable water source deviates with WHO GVs.
Therefore, it is recommended that further studies are required to locate the exact source of this
metals and concerned body to check out the present condition of pipelines.
The study was carried out within three months; this makes lack of compressiviness, there for it is
recommended that further studies are required in different season of the year including other
parameters.
The hardness of water has adverse effect on the laundries and boilers. Therefore, it is recommended
further studies are required to minimize and to point out the source of hardness causing chemicals.

47
6. Reference
1. .Nur Raihan B. A. R. (2008). Investigation of water hardness, heavy metals and total
coliform bacterial in water coolers at various location in Uitm Shah Alam, 8, 12
2. Satyajit R. and Sukalyan D. (2012). Assessment of water quality around mine sites. National
institute of technology Rourkela, 11,13
3. Gebrekidan M. and Samuel Z., (2005). Concentration of Heavy Metals in Drinking Water
from Urban Areas of the Tigray Region, Northern Ethiopia, 2, 12,and 16.
4. United Nation Children Fund (UNICEF) and World Health Organization (WHO) (2011).
Drinking water equity, safety and sustainability, 10, 12
5. Shalom N. C., Obinna C. N., Adetayo Y. O., Vivienne N. E.(2011). Assessment of water
quality in Canaanland, Ota, southwest Nigeria, 4, 7
7. Samuel O., august (2009). Determination of heavy metals in water bodies in the Tarkwa and
Obuasi mining areas, 4, 9.
8. Yadav R. N., Dagar N. K., Yadav R, and Gupta P., (2011). Assessment of Ground Water
Quality of Adjoining Area of the Bhiwari industrial area (Alwar), Rajasthan. research
journal of Pharmaceutical, Biological and Chemical Sciences; Volume 2, 263, 264.
9. Tatawat R. K. Singh Chandel C. P. (2006). Quality of ground water of Jaipur city, Rajasthan
(India) and its suitability for domestic and irrigation purpose, department of chemistry,
university of Rajasthan Jaipur, (Rajasthan) India, 80-87.
10. Manjare S. A., Vhanalakar S.A., and Muley D.V. (2009). Analysis of water quality using
physico-chemical parameters tamdalge tank in Kolhapur district, Maharashtra. Department
of zoology, Shivaji university, Kolhapur- 416 004, (M.S.), India, 114, 115.
11. Adane S., (2006). Water quality and phytoplankton dynamics in Legedadi reservoirs (Addis
Abeba).
12. Satyajit R. and Sukalyan D. (2012). Assessment of water quality around mine sites. National
institute of technology Rourkela, 11, 13
13. Priju c. P. And Narayana, A. C, Int. J. Environ. Res., 1(4): 280-289, autumn (2007) “heavy and
trace metals in Vembanad lake sediments”.
14. United Nations Environment Programme, Global Environment Monitoring System (GEMS)
(2008). Water quality for ecosystem and human health, 2nd ed. 37, 52.
48
15. MNB M. Obi C. L. and Thompson P. (2008). Improving Disinfection Efficiency in small
Drinking Water Treatment Plants, 20, 21.
16. Hedi Karim C., Fouad S., Jean-Luc B., Radhia S., J., Olivier F., Esteban R. and Saâdi A.
(2010). Transfer and accumulation of lead, zinc, cadmium and copper in plants growing in
abandoned mining-district area, 4, 8, and 12.
17. Magnuss V. (2009). Chemical composition and assessment of drinking water quality: Latvia
case study; Skład Chemiczny I Ocena Jakości wody Pitnej. Łotwa - Studium Przypadku;
Vol. 16, No. 3., 11, 13.
18. Ekpo, K. E., Asia, I. O., Amayo, K. O. and Jegede, D. A. (2008). Determination of lead,
cadmium and mercury in surrounding water and organs of some species of fish from Ikpoba
river in Benin city, Nigeria, 2, 3 and 4.
19. Lawson E.O. (2011). Physico-Chemical Parameters and Heavy Metal Contents of Water from
the Mangrove Swamps of Lagos Lagoon, Lagos, Nigeria, Advances in Biological Research
5 (1),8,10,13.
20. Shaikh A. M., Mandre P. N., (2009). Seasonal Study Of Physico-Chemical Parameters Of
Drinking Water In Khed ( Lote ) Industrial Area
21. Prabu P. C., Wondimu L., and Tesso M. (2011). Assessment of Water Quality of Huluka and
Alaltu Rivers of Ambo, Ethiopia, 2,4, and 8.
22. OluyemiE. A., Adekunle A. S., Adenuga A. A. and. MakindeW. O (2010). Physico-chemical
properties and heavy metal content of water sources in Ife North Local Government Area of
Osun State, Nigeria, 2, 6, and 7.
23. Okbah M. A., and Gohary S. El. El.,(2002). Physical and Chemical Characteristics of Lake
Edku Water, Egypt, 36, 37.
24. Belachew T. (2006). Physico-Chemical Characteristics and Pollution Levels of Trace Metals in
the Little Akaki and Big Akaki Rivers, 15,17.
25. Mengestayhu B., (2007). Assessment of Physico-chemical and Microbiological Quality of
Drinking Water at Sources and House hold in Selected Communities of Akaki-kaliti sub
city, Addis Ababa City Administration, 4, 24,and 36.
49
26. Akoteyon, I. S., Mbata, U.A. and Olalude, G.A., (2011). Investigation of Heavy Metal
Contamination in Groundwater around Landfill Site in Typical Sub-Urban Settlement in
Alimosho, Lagos-Nigeria, 145, 156.
27. Raji, M I O; Ibrahim, Y K E; Ehinmidu, J O, (2010). Physico-chemical characteristics and
Heavy metal levels in Drinking Water sources in Sokoto metropolis in North-western
Nigeria. ([email protected]) accessed 16/6/2012, 2, 4 and 12
28. Nor Hasbiyana A. W. (2008). The determination of heavy metals in tap water by using atomic
absorption spectroscopy (AAS), 11, 12.
29. Siti Farizwana M. R., Mazrura S., Zurahanim Fasha A. and Ahmad R. (2010). Determination
of Aluminum and Physicochemical Parameters in the Palm Oil Estates Water Supply at Johor,
Malaysia. Journal of Environmental and Public Health, 26, 32.
30. Elinge, C. M., Itodo, A.U, Peni I.J., Birnin Yauri U.A., Mbongo A,N (2011). Assessment of
heavy metals concentrations in bore-hole waters in Aliero community of Kebbi State
31. MandourR. A. and AzabY. A. (2011). Toxic Levels of Some Heavy Metals in Drinking
Groundwater in Dakahlyia Governorate, Egypt, 112, 113.
32. Yoshinori I., Shouta M., NakayamaM., Kaampwe M., Kennedy Ch., Hiroki T., Naoharu M.
and Mayumi I. (2010). Heavy metal contamination of soil and sediment in Zambia
33. SinghA.K., Bhagowati S., Das T.K., Yubbe D., Rahman B., Nath M., Obing P., Singh W. S.
K., Renthlei C. Z., Pachuau L. and Thakur R.(2006). Assessment of arsenic, fluoride, iron,
nitrate and heavy metals in drinking water of northeastern India. North Eastern Regional
Institute of Water and Land Management, Tezpur, Assam, India.
34. Ahmad A. K., Mushrifah I., and Mohamad Sh. O. (2009). Water Quality and Heavy Metal
Concentrations in Sediment of Sungai Kelantan, Kelantan, Malaysia: A Baseline Study.
(Kualiti Air dan Kepekatan Logam Berat di dalam Sediment Sungai Kelantan, Kelantan,
Malaysia: Kajian Nilai Dasar),
35. Bhupander K., Sanjay K., Meenu M., Dev P., Singh1 S. K., Sharma C. S and Mukherjee D. P.
(2011). An assessment of heavy metals in sediments from two tributaries of lower stretch of
Hugli estuary in West Bengal
36. The American Herbal Products Association (AHPA), January, 2009. Heavy Metal Analysis
and Interim Recommended Limits for Botanical Dietary Supplements. White paper, 21, 23.

50
37. Öztürk M., ÖzözenG., MinareciO., and Minareci E. (2009). Determination of Heavy Metals in
Fish, Water and Sediments of Avsar Dam Lake in Turkey, 6, 12.
38. Soylak M., Armagan Aydin F., SaracogluS., Elci L., Dogan M., (2002). Chemical Analysis of
Drinking Water Samples from Yozgat, Turkey, 11, 14.
39. Tuzen M., Soylak M., (2006). Evaluation of Metal Levels of Drinking Waters from the Tokat-
Black Sea Region of Turkey, 9, 10.
40. Slavka S., Dragana Cb. I., Jelena M., (2006). Determination of Pb and Cd in water by
potentiometric stripping analysis (PSA), 2, 8.
41. Awni T. Batayneh (2010). Heavy metals in water springs of the Yarmouk Basin, North Jordan
and their potentiality in health risk assessment.
42. Adedeji O. B., Adeyemo O.K. and Oyedele M.O., (2011). Heavy Metals in Snail and Water
Samples from Alaro River in Oluyole Industrial Area of Ibadan Southwestern Nigeria, 4, 6.
43. Hanaa, M., Salem, Eweida, A., Eweida and Azza F. (2000). Heavy Metals In Drinking Water
And Their Environmental Impact On Human Health
44. Ravelonandro, P., Hervé R. A., Mong Y., Rajaonarivony M., Ravonizafy Ch. and Nirilalaina
R. (2009). Assessment of heavy metals concentrations. In coastal sediments in north-western
cities of Madagascar. http://www.academicjournals.org/AJEST. accessed in 9/2/2012, 12,14
45. Fielding M., Ferrimond M., (1999). Disinfection By-products in Drinking Water: Current
Issues.P 34-35
46. World Health Organization (WHO)(2006). Guidelines for drinking-water quality [electronic
resource]: incorporating first addendum. Vol. 1, Recommendations. – 3rd edition.
47. Ministry of water resources Ethiopian water Technology center (2008). Butajira – Ziway areas
development study of water quality. Federal democratic republic of Ethiopia
48. Temesgen N. (2009). Assessment of the physico-chemical parameters of selected rivers in the
city of Addis Ababa. 25, 32 and 43
49. Mwegoha W.J.S. and Kihampa C., (2010). Heavy metal contamination in agricultural soils and
water in Dares Salaam city, Tanzania, 23, 36.
50. Mengesha A., Mamo W., Baye G. (2004). A survey of bacteriological quality of drinking water
in North Gondar, 12, 13.
51. Ubalua A.O., Chijioke U. C. and Ezeronye O.U. (2007). Determination and Assessment of
Heavy Metal Content In Fish and Shellfish in Aba River, Abia State, Nigeria, 3, 7.
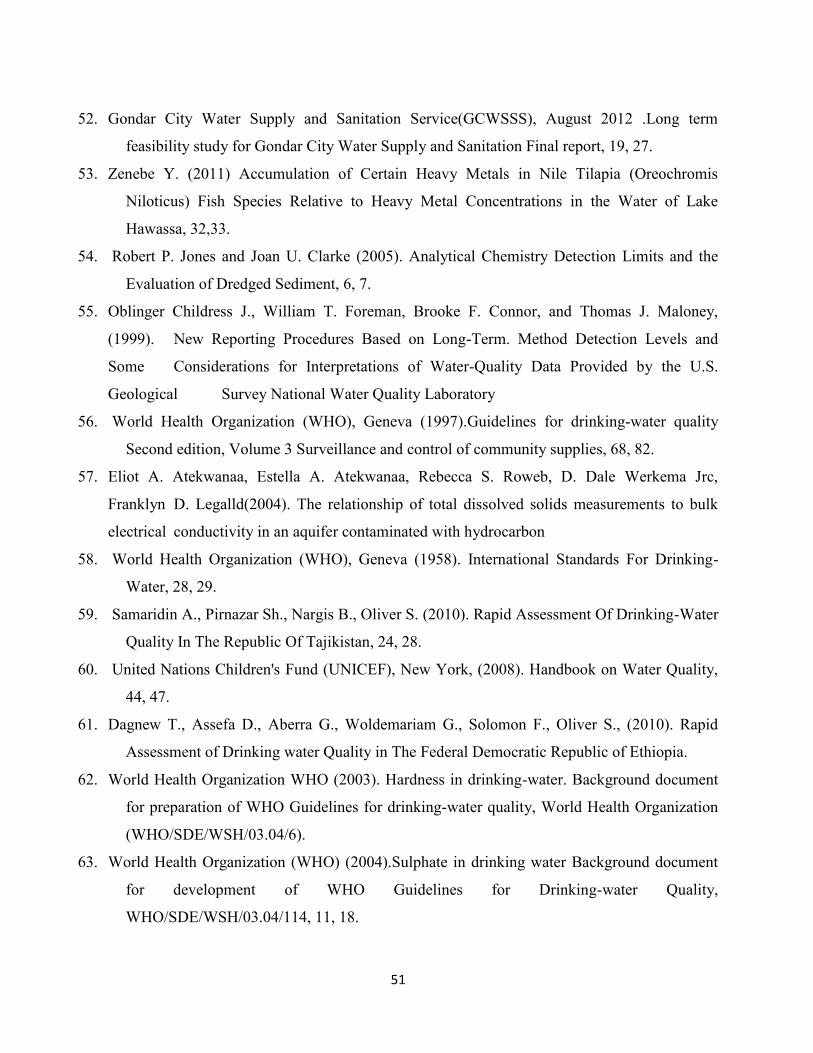
51
52. Gondar City Water Supply and Sanitation Service(GCWSSS), August 2012 .Long term
feasibility study for Gondar City Water Supply and Sanitation Final report, 19, 27.
53. Zenebe Y. (2011) Accumulation of Certain Heavy Metals in Nile Tilapia (Oreochromis
Niloticus) Fish Species Relative to Heavy Metal Concentrations in the Water of Lake
Hawassa, 32,33.
54. Robert P. Jones and Joan U. Clarke (2005). Analytical Chemistry Detection Limits and the
Evaluation of Dredged Sediment, 6, 7.
55. Oblinger Childress J., William T. Foreman, Brooke F. Connor, and Thomas J. Maloney,
(1999). New Reporting Procedures Based on Long-Term. Method Detection Levels and
Some Considerations for Interpretations of Water-Quality Data Provided by the U.S.
Geological Survey National Water Quality Laboratory
56. World Health Organization (WHO), Geneva (1997).Guidelines for drinking-water quality
Second edition, Volume 3 Surveillance and control of community supplies, 68, 82.
57. Eliot A. Atekwanaa, Estella A. Atekwanaa, Rebecca S. Roweb, D. Dale Werkema Jrc,
Franklyn D. Legalld(2004). The relationship of total dissolved solids measurements to bulk
electrical conductivity in an aquifer contaminated with hydrocarbon
58. World Health Organization (WHO), Geneva (1958). International Standards For Drinking-
Water, 28, 29.
59. Samaridin A., Pirnazar Sh., Nargis B., Oliver S. (2010). Rapid Assessment Of Drinking-Water
Quality In The Republic Of Tajikistan, 24, 28.
60. United Nations Children's Fund (UNICEF), New York, (2008). Handbook on Water Quality,
44, 47.
61. Dagnew T., Assefa D., Aberra G., Woldemariam G., Solomon F., Oliver S., (2010). Rapid
Assessment of Drinking water Quality in The Federal Democratic Republic of Ethiopia.
62. World Health Organization WHO (2003). Hardness in drinking-water. Background document
for preparation of WHO Guidelines for drinking-water quality, World Health Organization
(WHO/SDE/WSH/03.04/6).
63. World Health Organization (WHO) (2004).Sulphate in drinking water Background document
for development of WHO Guidelines for Drinking-water Quality,
WHO/SDE/WSH/03.04/114, 11, 18.
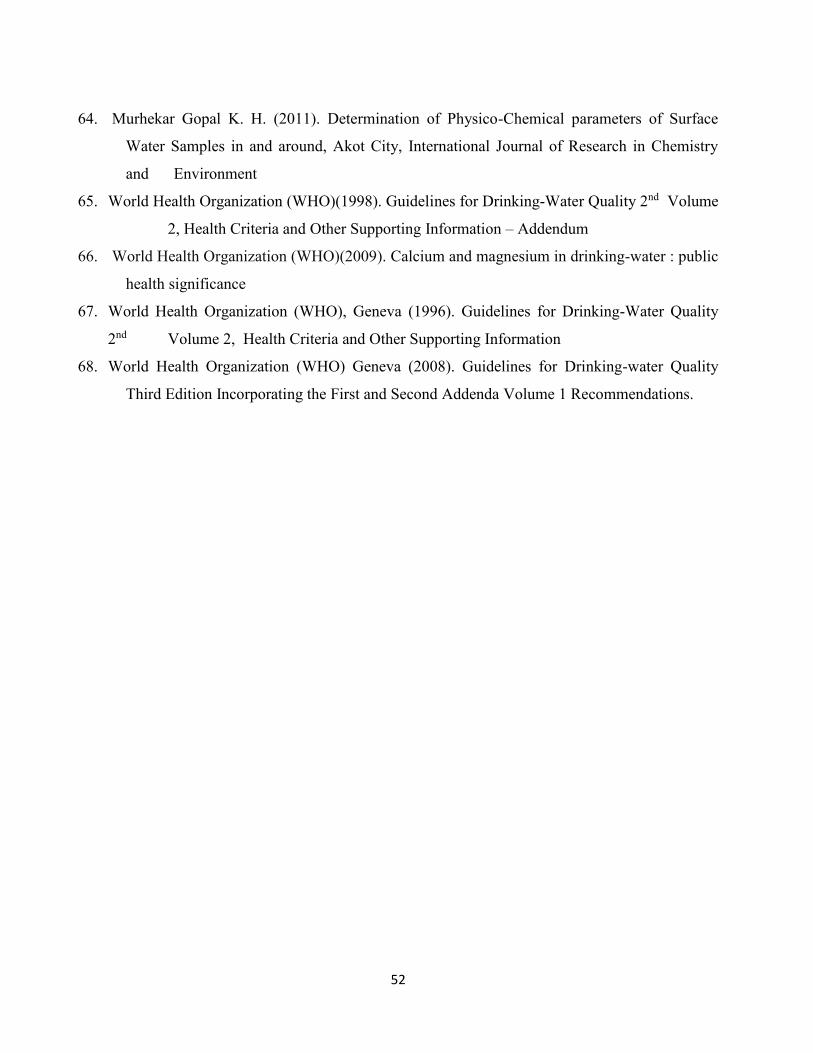
52
64. Murhekar Gopal K. H. (2011). Determination of Physico-Chemical parameters of Surface
Water Samples in and around, Akot City, International Journal of Research in Chemistry
and Environment
65. World Health Organization (WHO)(1998). Guidelines for Drinking-Water Quality 2nd Volume
2, Health Criteria and Other Supporting Information – Addendum
66. World Health Organization (WHO)(2009). Calcium and magnesium in drinking-water : public
health significance
67. World Health Organization (WHO), Geneva (1996). Guidelines for Drinking-Water Quality
2nd Volume 2, Health Criteria and Other Supporting Information
68. World Health Organization (WHO) Geneva (2008). Guidelines for Drinking-water Quality
Third Edition Incorporating the First and Second Addenda Volume 1 Recommendations.
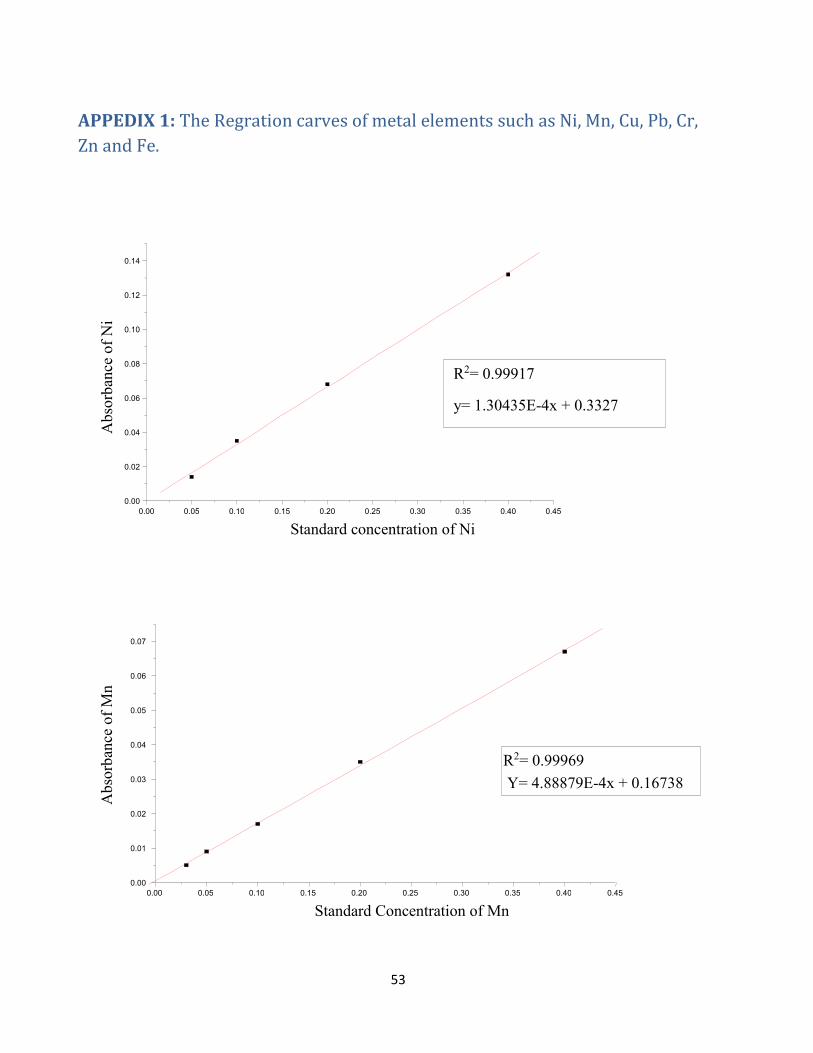
53
APPEDIX 1: The Regration carves of metal elements such as Ni, Mn, Cu, Pb, Cr,
Zn and Fe.
0.00 0.05 0.10 0.15 0.20 0.25 0.30 0.35 0.40 0.45 0.00
0.01
0.02
0.03
0.04
0.05
0.06
0.07
Abso
rban
ce o
f M
n
Standard Concentration of Mn
R2= 0.99969 Y= 4.88879E-4x + 0.16738
0.00 0.05 0.10 0.15 0.20 0.25 0.30 0.35 0.40 0.45 0.00
0.02
0.04
0.06
0.08
0.10
0.12
0.14
Abso
rban
ce o
f N
i
Standard concentration of Ni
R2= 0.99917
y= 1.30435E-4x + 0.3327

54
0.0 0.1 0.2 0.3 0.4 0.5 0.6 0.7 0.8 0.9
0.00
0.02
0.04
0.06
0.08
0.10
0.12
Abso
rban
ce o
f P
b
Standard Concentration of Pb
R2= 0.99889 y= 1.6667E-4x + 0.1414
0.0 0.1 0.2 0.3 0.4 0.5 0.6 0.7 0.8 0.9 0.00
0.02
0.04
0.06
0.08
0.10
Abso
rban
ce o
f C
u
Standard concentration of Cu
R2= 0.99964
y= 4.34783E-4x + 0.12017
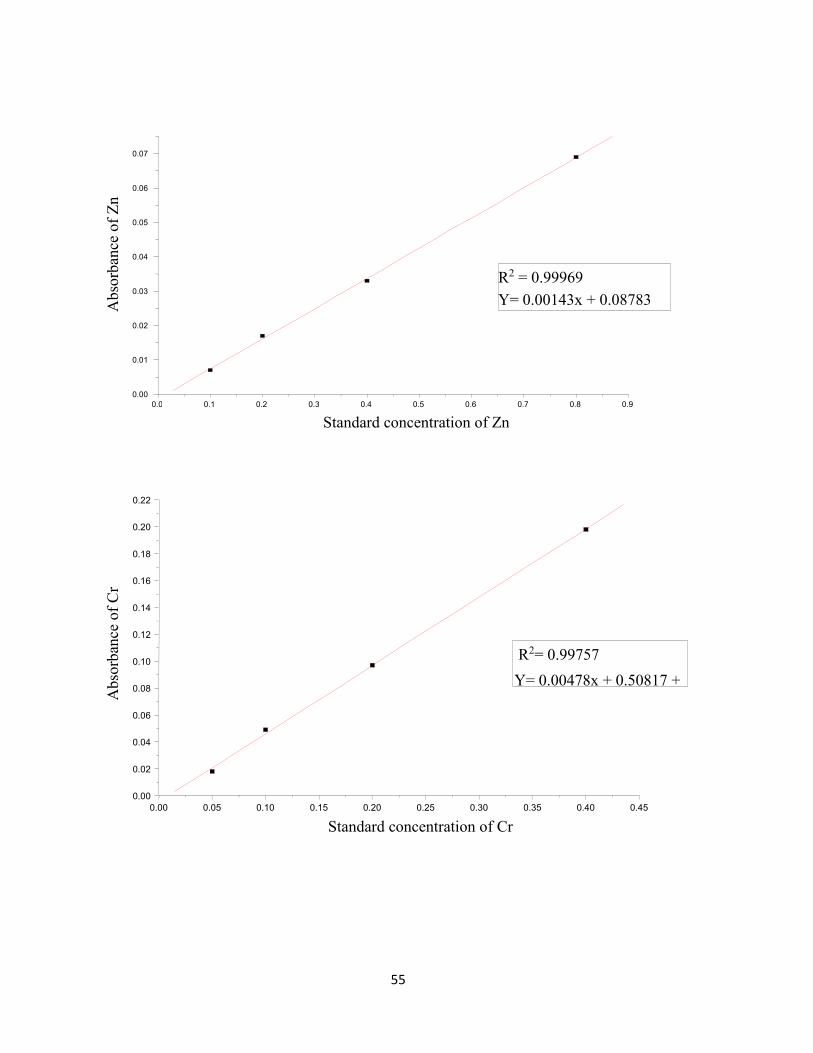
55
0.00 0.05 0.10 0.15 0.20 0.25 0.30 0.35 0.40 0.45 0.00
0.02
0.04
0.06
0.08
0.10
0.12
0.14
0.16
0.18
0.20
0.22
Abso
rban
ce o
f C
r
Standard concentration of Cr
R2= 0.99757 Y= 0.00478x + 0.50817 +
0.0 0.1 0.2 0.3 0.4 0.5 0.6 0.7 0.8 0.9 0.00
0.01
0.02
0.03
0.04
0.05
0.06
0.07
Abso
rban
ce o
f Z
n
Standard concentration of Zn
R2 = 0.99969 Y= 0.00143x + 0.08783
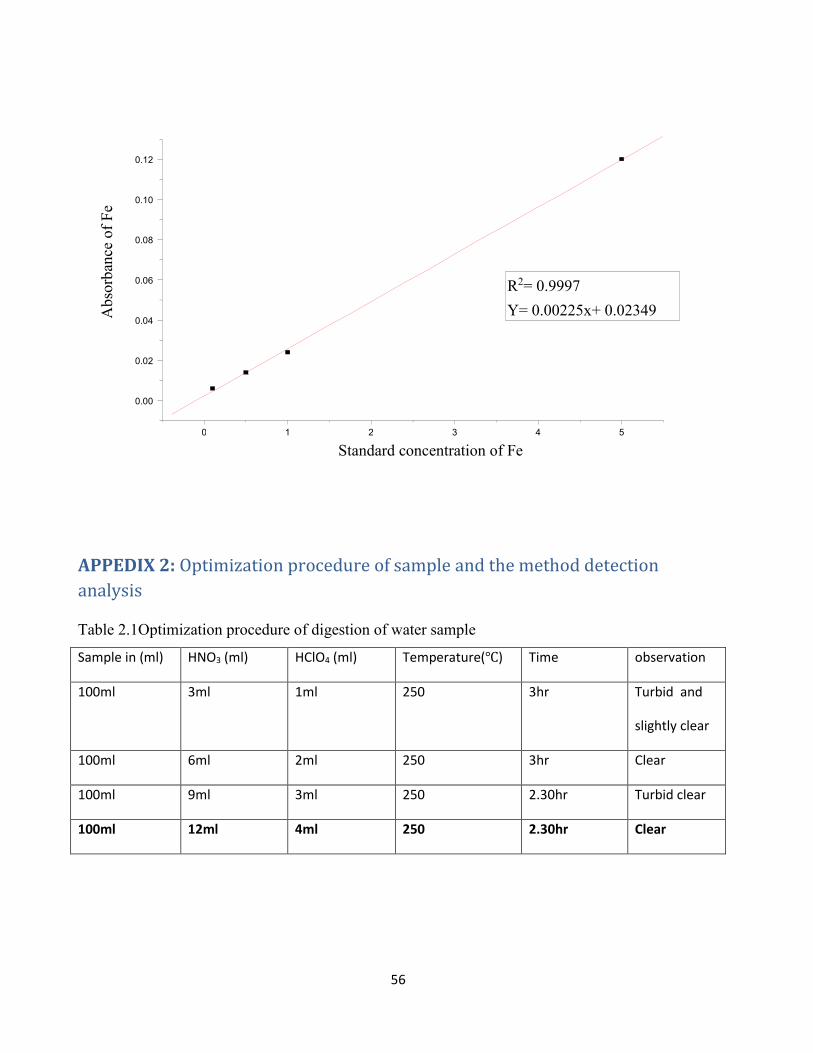
56
APPEDIX 2: Optimization procedure of sample and the method detection
analysis
Table 2.1Optimization procedure of digestion of water sample
Sample in (ml) HNO3 (ml) HClO4 (ml) Temperature(℃) Time observation
100ml 3ml 1ml 250 3hr Turbid and
slightly clear
100ml 6ml 2ml 250 3hr Clear
100ml 9ml 3ml 250 2.30hr Turbid clear
100ml 12ml 4ml 250 2.30hr Clear
0 1 2 3 4 5
0.00
0.02
0.04
0.06
0.08
0.10
0.12
Abso
rban
ce o
f F
e
Standard concentration of Fe
R2= 0.9997 Y= 0.00225x+ 0.02349
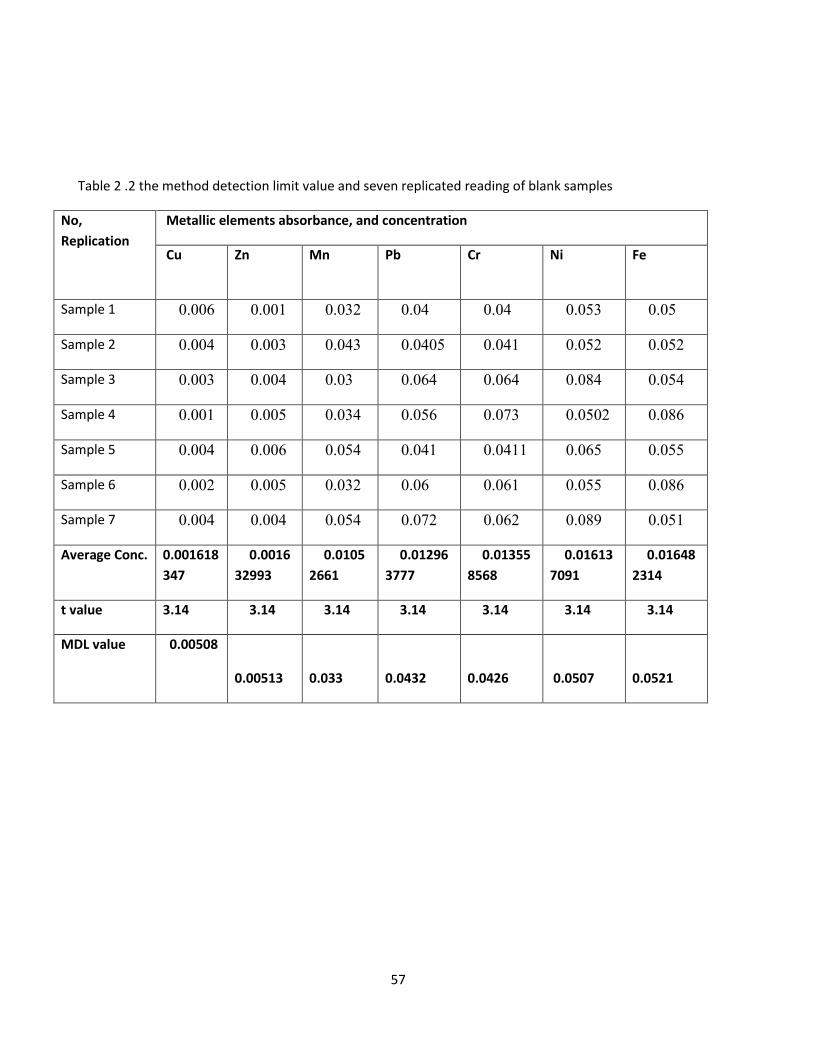
57
Table 2 .2 the method detection limit value and seven replicated reading of blank samples
No,
Replication
Metallic elements absorbance, and concentration
Cu Zn Mn Pb Cr Ni Fe
Sample 1 0.006 0.001 0.032 0.04 0.04 0.053 0.05
Sample 2 0.004 0.003 0.043 0.0405 0.041 0.052 0.052
Sample 3 0.003 0.004 0.03 0.064 0.064 0.084 0.054
Sample 4 0.001 0.005 0.034 0.056 0.073 0.0502 0.086
Sample 5 0.004 0.006 0.054 0.041 0.0411 0.065 0.055
Sample 6 0.002 0.005 0.032 0.06 0.061 0.055 0.086
Sample 7 0.004 0.004 0.054 0.072 0.062 0.089 0.051
Average Conc. 0.001618
347
0.0016
32993
0.0105
2661
0.01296
3777
0.01355
8568
0.01613
7091
0.01648
2314
t value 3.14 3.14 3.14 3.14 3.14 3.14 3.14
MDL value 0.00508
0.00513
0.033
0.0432
0.0426
0.0507
0.0521
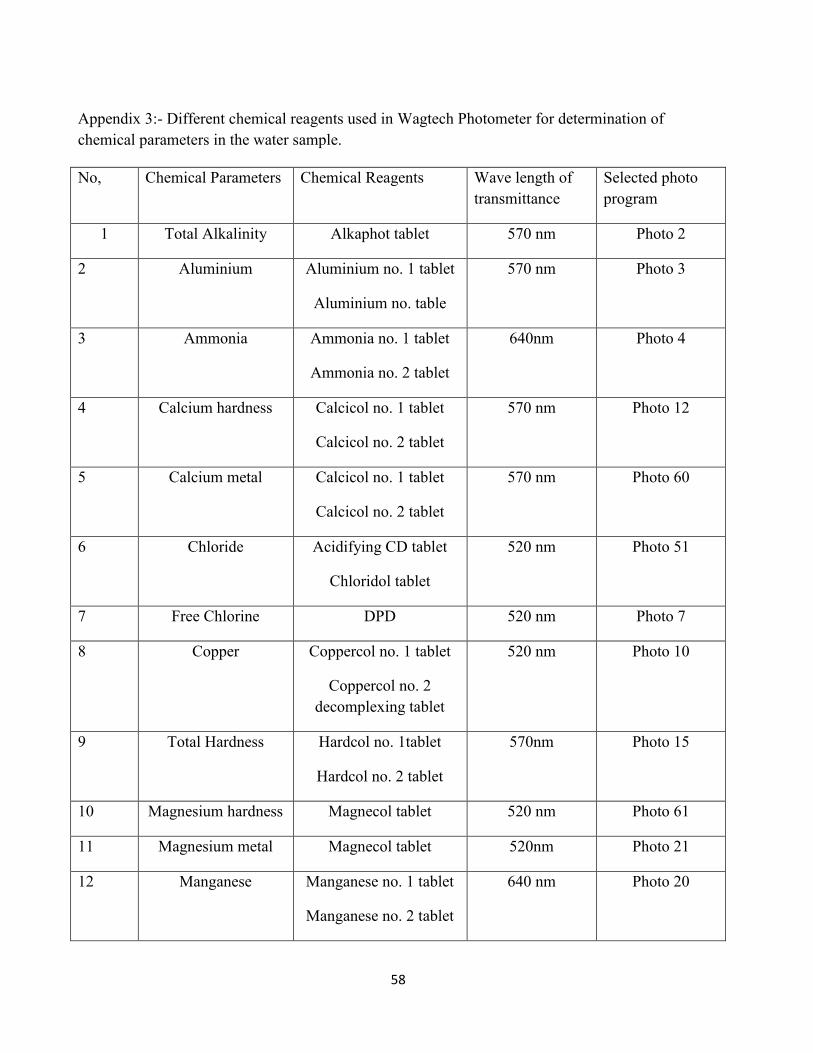
58
Appendix 3:- Different chemical reagents used in Wagtech Photometer for determination of
chemical parameters in the water sample.
No, Chemical Parameters Chemical Reagents Wave length of
transmittance
Selected photo
program
1 Total Alkalinity Alkaphot tablet 570 nm Photo 2
2 Aluminium Aluminium no. 1 tablet
Aluminium no. table
570 nm Photo 3
3 Ammonia Ammonia no. 1 tablet
Ammonia no. 2 tablet
640nm Photo 4
4 Calcium hardness Calcicol no. 1 tablet
Calcicol no. 2 tablet
570 nm Photo 12
5 Calcium metal Calcicol no. 1 tablet
Calcicol no. 2 tablet
570 nm Photo 60
6 Chloride Acidifying CD tablet
Chloridol tablet
520 nm Photo 51
7 Free Chlorine DPD 520 nm Photo 7
8 Copper Coppercol no. 1 tablet
Coppercol no. 2
decomplexing tablet
520 nm Photo 10
9 Total Hardness Hardcol no. 1tablet
Hardcol no. 2 tablet
570nm Photo 15
10 Magnesium hardness Magnecol tablet 520 nm Photo 61
11 Magnesium metal Magnecol tablet 520nm Photo 21
12 Manganese Manganese no. 1 tablet
Manganese no. 2 tablet
640 nm Photo 20

59
12 Nitrate Nitratest powder
Nitratest tablet
Nitricol tablet
570 nm Photo 23 for N
Photo 63 for
nitrate
14 Nitrite Nitricol tablet 520 nm Photo 24 for N
Photo 64 for
nitrite
15 Phosphate Phosphate HR tablet 490 nm Photo 29
16 Silica Silica no. 1 tablet
Silica no. 2 tablet
Silica PR tablet
640 nm Photo 31
17 Sulphate Sulphate Turb table 520 nm Photo 32
Source: Palintest®, Palintest USA and Palintest Australia are registered trademarks of Palintest
Ltd.
All of the chemical parameters stated in this appendix were measured by using reagents stated in
this table and the procedure for measurement was derived from Photometer 8000 System for Water,
Analysis manual.
Appendix4:- Table of drinking water guide line value of drinking water
1 Standards for Physicochemical parameters
Parameters EPA standards WHO standards UN standards USA standards Canada
standards
Temperature (℃) --- --- ------ ------ 15℃
EC. (μS/cm) 1000 1000 ------- ------- --------
pH 6-9 6.5-8.5 6.5-8.5 6.5-8.56 6.5-8.5
TDS(mg/l) ------- 1000 ------- 500 500
TSS(mg/l) ----- ------- ------- ------ -------
TS (mg/l) ------- 500-1500
------ ------ ------
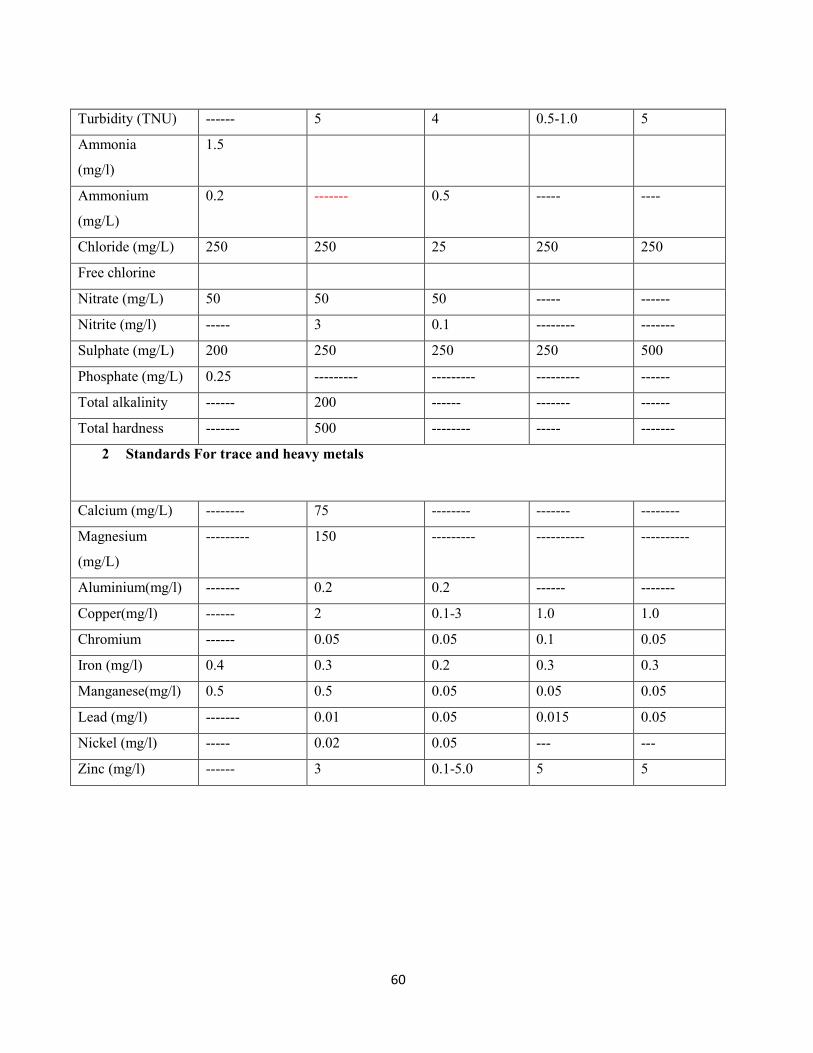
60
Turbidity (TNU) ------ 5 4 0.5-1.0 5
Ammonia
(mg/l)
1.5
Ammonium
(mg/L)
0.2 ------- 0.5 ----- ----
Chloride (mg/L) 250 250 25 250 250
Free chlorine
Nitrate (mg/L) 50 50 50 ----- ------
Nitrite (mg/l) ----- 3 0.1 -------- -------
Sulphate (mg/L) 200 250 250 250 500
Phosphate (mg/L) 0.25 --------- --------- --------- ------
Total alkalinity ------ 200 ------ ------- ------
Total hardness ------- 500 -------- ----- -------
2 Standards For trace and heavy metals
Calcium (mg/L) -------- 75 -------- ------- --------
Magnesium
(mg/L)
--------- 150 --------- ---------- ----------
Aluminium(mg/l) ------- 0.2 0.2 ------ -------
Copper(mg/l) ------ 2 0.1-3 1.0 1.0
Chromium ------ 0.05 0.05 0.1 0.05
Iron (mg/l) 0.4 0.3 0.2 0.3 0.3
Manganese(mg/l) 0.5 0.5 0.05 0.05 0.05
Lead (mg/l) ------- 0.01 0.05 0.015 0.05
Nickel (mg/l) ----- 0.02 0.05 --- ---
Zinc (mg/l) ------ 3 0.1-5.0 5 5