The natural selection: behavior analysis as a natural science
Upload
khangminh22Category
view
0download
0
UNIVERSITY OF GONDAR
COLLEGE OF NATURAL AND COMPUTATIONAL SCIENCES
DEPARTMENT OF BIOTECHNOLOGY
ASSOCIATION OF ANGIOTENSIN CONVERTING ENZYME GENE POLYMORPHISMS
WITH RISK OF DIABETIC 2 AND ITS COMPLICATION AMONG PATIENTS VISITING
BAHIRDAR FELEGEHIWOT REFERRAL HOSPITAL NORTH WEST, ETHIOPIA.
MSc. Thesis
By
Tadele Tamiru
Advisor: Dr. Nega Berhane
CO-ADVISOR: Mr. Wagaw Sendeku
SUBMITTED TO THE DEPARTMENT OF BIOTECHNOLOGY, COLLEGE OF NATURAL
AND COMPUTATIONAL SCIENCES, UNIVERSITY OF GONDAR FOR PARTIAL
FULFILLMENT OF THE REQUIREMENTS FOR THE DEGREE OF MASTER OF
SCIENCE IN BIOTECHNOLOGY.
May, 2017
Gondar, Ethiopia
ii
ASSOCIATION OF ANGIOTENSIN CONVERTING ENZYME GENE POLYMORPHISM,
RISK OF DIABETIC 2 AND ITS COMPLICATION AMONG PATIENTS VISITING
BAHIRDAR FELEGEHIWOT REFERRAL HOSPITAL
A Thesis submitted to University of Gondar, College of Natural and Computational Science,
Department of Biotechnology, in Partial Fulfillment of the Requirements for the Degree of
Master of Science in Biotechnology.
By
Tadele Tamiru
April, 2017
Gondar, Ethiopia

i
ACKNOWLEDGMENTS
First and foremost I praise the Almighty God; the most powerful and creator of all things for his
innumerable favors up on me throughout all my life time. My greatest appreciation and deep
gratitude extend to my brother Mr. Tesfaye Tamiru for everything in my life next to God.
I am highly indebted to my advisors Dr. Nega Berhane and co-advisor Mr. Wagaw Sendeku for
their unreserved advice, suggestions, comments and follow up from the preparation to the
production of this manuscript.
I would like to acknowledge Bahirdar Felegehiwot Referral Hospital laboratory workers who
help me in the data collection process.
In addition, I would like to express my deep appreciation to Dr. Deepack Kumar Vermma for
import of primers from India. I would also thanks M/r. Wondemu Assefa, in Metema Hospital
for his unreserved support of chemicals those were a vital work of the study. Moreover, I would
like thank for clinical chemistry laboratory workers, college of medicine and health science,
University of Gondar for analysis of biochemical tests.
I would like to express my sincere gratitude to Mr. Workie Anley, in Department of Plant
Science, and Mr. Gashaw, in statistics department, University of Gondar for their support and
cooperation in data analysis techniques.
I would like to thank Mr. Belete Biadgo for this help in provides direction how to write the
manuscript and valuable comment after the write-up.
I would also like to acknowledge University of Gondar, Department of Biotechnology for
supporting me all the necessary laboratory equipment’s and chemicals used in this study.
Finally yet importantly, I would also like to thank those relatives and friends not mentioned here,
yet lent their hand to me by any means during my study.

ii
LIST OF ABBREVIATIONS
ACE Angiotensin-Converting Enzyme
AGT Angiotensinogen
BMI Body Mass Index
CKD Chronic Kidney Disease
DM Diabetes Mellitus
DN Diabetic Nephropathy
DNA Deoxyribose Nuclic Acid
DR Diabetic Retinopathy
DNR Diabetic Non-Retinopathy
eGFR Estimated Glomerular Filtration rate
ESRD End Stage Renal Disease
GFR Glomerular Filtration Rate
HDL High-Density Lipoprotein
IDF International Diabetic Federation
I/D Insertion/ Deletion
IDDM Insulin Dependent Diabetes Mellitus
LDL Low-Density Lipoprotein
NIDDM Non -Insulin Dependent Diabetes Mellitus
RAS Renin Angiotensin System
RAAS Renin Angiotensin Aldosterone System
RBS Random Blood Sugar
RPM Revolution Per Minute
PCR Polymerase Chain Reaction
T1DM Type 1 Diabetes Mellitus
T2DM Type 2 Diabetes Mellitus
TAE Trice Acetate Ethylene Diamine Tetra Acetic Acid
TC Total Cholesterol
TG Triglycerol
iii
TABLE OF CONTENTS
ACKNOWLEDGMENTS ............................................................................................................... i
LIST OF ABBREVIATIONS ......................................................................................................... ii
TABLE OF CONTENTS ............................................................................................................... iii
LIST OF TABLES ......................................................................................................................... vi
LIST OF FIGURES ...................................................................................................................... vii
APPENDIX .................................................................................................................................. viii
ABSTRACT ..................................................................................................................................... ix
1. INTRODUCTION ................................................................................................................... 1
1.1 Statement of the Problem ..................................................................................................... 4
1.2 Significance of the Study ..................................................................................................... 5
2. OBJECTIVES .......................................................................................................................... 6
2.1 General Objective ................................................................................................................ 6
2.2 Specific Objectives .............................................................................................................. 6
3. LITERATURE REVIEW ........................................................................................................ 7
3.1 Epidemiology of Type II Diabetes ....................................................................................... 7
3.2 Insulin and its Resistance in Type 2 Diabetes ..................................................................... 8
3.3 Complications of Type 2 Diabetes and Diabetic Hypertension ........................................... 9
3.3.1 Diabetic Nephropathy ............................................................................................... 9
3.3.2 Diabetic Retinopathy .............................................................................................. 10
3.3.3 Diabetic with Hypertensive ..................................................................................... 11
3.4 Risk Factors for type 2 diabetes and its complications ...................................................... 11
3.4.1 Non-genetic Risk Factors ........................................................................................ 12
3.4.2 Genetic Risk Factors ............................................................................................... 16

iv
4. MATERIAL AND METHODS ............................................................................................. 24
4.1 Study Area ......................................................................................................................... 24
4.2 Study Design and Period .................................................................................................... 24
4.3 Population .......................................................................................................................... 24
4.4 Inclusion and Exclusion Criteria ........................................................................................ 24
4.5 Variables ............................................................................................................................ 25
4.6 Sample Size and Sampling Technique ............................................................................... 25
4.7 Data Collection, Clinical Measurements and Laboratory Method .................................... 25
4.7.1 Questionnaire .......................................................................................................... 25
4.7.2 Anthropometric Measurements ............................................................................... 25
4.7.3 Sample Collection ................................................................................................... 26
4.7.4 Laboratory Methods ................................................................................................ 26
4.8 Statistical Analysis ............................................................................................................. 29
4.9 Ethical Consideration ......................................................................................................... 29
5. RESULTS .............................................................................................................................. 30
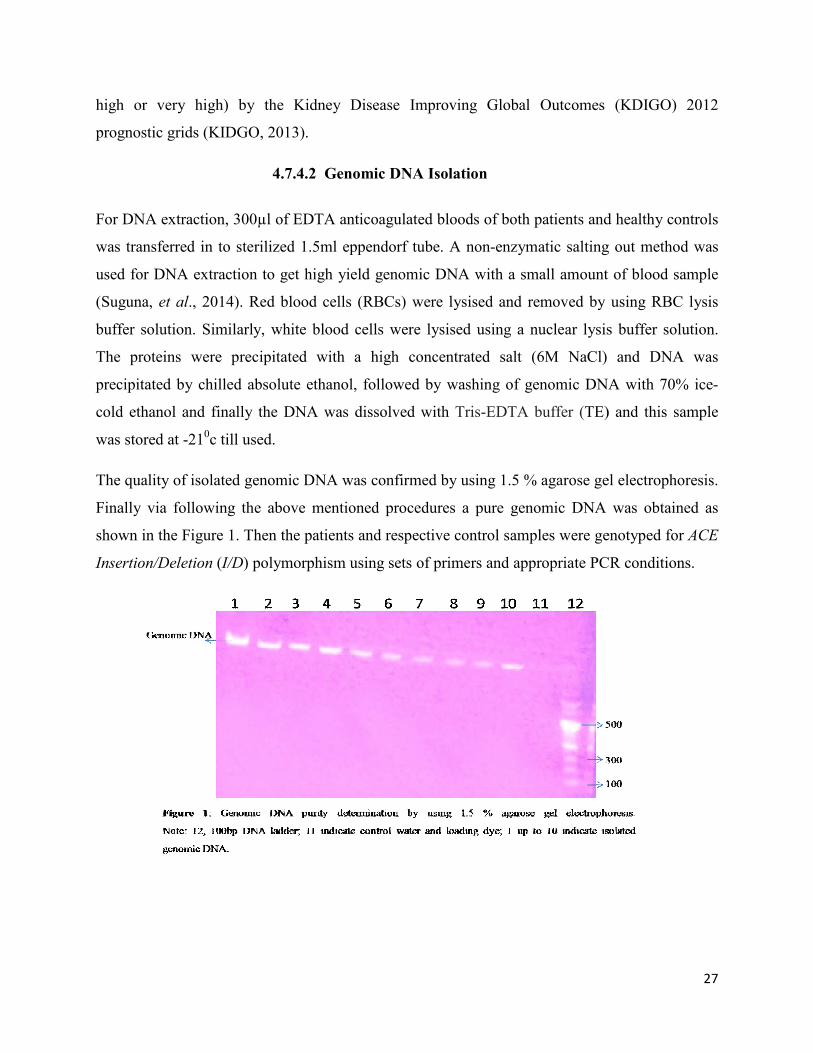
5.1 Demographic, Clinical and Biochemical Characteristics between T2DM and Control. .. 30
5.2 Demographic, Clinical and Biochemical Characteristics between Diabetic Complications
and Diabetic Hypertension. ....................................................................................................... 31
5.3 ACE Genotype distribution in T2DM Patients and Healthy Control ................................. 32
5.4 Association of ACE I/D Genotype with Clinical and Biochemical Characteristics of
T2DM and Healthy Controls. .................................................................................................... 33
5.5 ACE Genotype Distribution in T2DM, Diabetic Complications and Diabetes with
Hypertension. ............................................................................................................................ 34
5.6 One way ANOVA of ACE Genotype Distribution to the Associated Risk Factors among
T2DM and Diabetic Complication ............................................................................................ 35
6. DISCUSSION ........................................................................................................................ 40

v
7. CONCLUSION ..................................................................................................................... 46
8. LIMITATIONS OF THE STUDY ........................................................................................ 47
9. RECOMMENDATIONS....................................................................................................... 48
10. REFERENCES .................................................................................................................. 49
APPENDIX ................................................................................................................................... 67

vi
LIST OF TABLES
TABLE 1: DEMOGRAPHIC, CLINICAL AND BIOCHEMICAL CHARACTERISTICS OF T2DM PATIENTS
AND HEALTHY CONTROL IN FELEGEHIWOT REFERRAL HOSPITAL, NORTHWEST ETHIOPIA. .... 30
TABLE 2: COMPARISON X±S OF DEMOGRAPHIC, CLINICAL AND BIOCHEMICAL VARIABLES BETWEEN
T2DM AND ITS COMPLICATIONS. ............................................................................................ 31
TABLE 3: DISTRIBUTION OF ACE GENOTYPES AND ALLELE FREQUENCIES BETWEEN T2DM AND
HEALTHY CONTROL PARTICIPANTS. ....................................................................................... 32
TABLE 4: ONE-WAY ANOVA ANALYSIS OF CLINICAL AND BIOCHEMICAL CHARACTERISTICS
ACCORDING TO ACE GENOTYPE IN T2DM AND HEALTHY CONTROL. ...................................... 33
TABLE 5: FREQUENCY OF ACE I/D GENOTYPE AND ALLELE POLYMORPHISM AMONG T2DM AND
DIABETIC COMPLICATION. ....................................................................................................... 34
TABLE 6: COMPANIED ONE- WAY ANOVA DISTRIBUTIONS OF ACE I/D GENOTYPE AND CLINICAL
CHARACTERISTICS AMONG T2DM, DR, DN AND DIABETIC WITH HYPERTENSION. ................. 35
TABLE 7: ONE- WAY ANOVA ACE GENOTYPE DISTRIBUTION AND CLINICAL CHARACTERISTICS IN
COMPARISON TO T2DM TO ITS COMPLICATIONS. .................................................................... 36

vii
LIST OF FIGURES
FIGURE 1. GENOMIC DNA PURITY DETERMINATION BY USING 1.5 % AGAROSE GEL
ELECTROPHORESIS. ................................................................................................................. 27
FIGURE 2: DETECTION OF ACE I/D GENOTYPE ON 2% AGAROSE GEL ELECTROPHORESIS WITH
2% ETHIDIUM BROMIDE VISUALIZED UNDER UV LIGHT.………………….…………………38
FIGURE 3: DETECTION OF ACE I/D GENOTYPE ON 2% AGAROSE GEL ELECTROPHORESIS HAVING
DIABETIC HYPERTENSION PATIENTS ........................................................................................ 38
FIGURE 4: CHI-SQUARE ACE I/D GENOTYPE DISTRIBUTION BETWEEN T2DM AND CONTROL ...... 38
FIGURE 5: CHI-SQUARE ACE I/D GENOTYPE DISTRIBUTION BETWEEN T2DM AND DIABETIC
COMPLICATIONS...................................................................................................................... 39
viii
APPENDIX
APPENDIX 1 CONSENT FORM .......................................................................................................... 67
APPENDIX 2 QUESTIONNAIRE FOR ASSOCIATED RISK FACTORS FOR ALL DIABETES PATIENTS ........ 67
APPENDIX 3 P VALUE OF CLINICAL CHARACTERISTICS BETWEEN T2DM AND CONTROL ............. 69
APPENDIX 4 P VALUE OF CLINICAL CHARACTERISTICS BETWEEN T2DM AND CONTROL ............. 70
APPENDIX 5 CHI-SQUARE ACE GENOTYPE DISTRIBUTION BETWEEN TYPE 2 DIABETIC AND
CONTROL. ............................................................................................................................... 71
APPENDIX 6 CHI-SQUARE ACE GENOTYPE P VALUE BETWEEN T2DM AND CONTROL .................. 72
APPENDIX 7 CHI-SQUARE ACE GENOTYPE DISTRIBUTION AMONG TYPE 2 DIABETIC
COMPLICATIONS. .................................................................................................................... 73
APPENDIX 8 CHI-SQUARE ACE GENOTYPE P VALUE BETWEEN T2DM AND CONTROL. ................ 74
APPENDIX 9 MULTIVARIATE LOGISTIC REGRESSION OF GENOTYPES AMONG TYPE 2 DIABETES AND
CONTROL. ............................................................................................................................... 74
APPENDIX 10 LOGISTIC REGRESSION OF I/D ALLELE AMONG TYPE 2 DIABETES AND CONTROL. ..... 74
APPENDIX 11: ONLINE CALCULATING FORMULA OF EGFR BY USING CKD-EPI EQUATION. .......... 75

ix
ABSTRACT
Type 2 diabetes affect large population and able to develop micro and macrovascular complicati
ons. There are many non- genetic and genetic factors or both are associated for the occurrence of
type 2 diabetes mellitus (T2DM) and diabetic complications. Genes of the renin angiotensin syst
em angiotensin converting enzyme insertion/deletion gene polymorphism has been associated wi
th the risk of type 2 diabetes and its complications. The aim of the present study was to
investigate the association of angiotensin converting enzyme gene polymorphism, risk of type 2
diabetes and its complications. A total of 222 subjects (111 T2DM and 111 healthy controls)
were collected from Bahir Dar Felegehiwot referral hospital and Bahir Dar town, respectively by
using non-probability purposive sampling techniques. Patients with T2DM were selected using
non probability purposive sampling technique. Minidray fully automated analyzer was used for
biochemical tests such as glucose, total cholesterol, triglycerol, urea and creatinine to assess the
associated risk factors. The ACE I/D genotypes were identified by Polymerase chain reaction
(PCR) using appropriate primers and PCR reaction conditions. The present study revealed that
the frequency of DD genotype and D allele were higher in type 2 diabetes mellitus compared to
healthy controls (DD, 64.2% Vs 35.6% P < 0 .001) and ( D, 79.3% Vs 59.9% P < 0.001). DD
genotype showed three fold increase risk towards T2DM as compared to II Genotype (OR:
2.984, CI: 1.332 - 6.689, P < 0.02). The D allele carriers had five times high risk of getting
diabetic as compared to I allele. (OR, D 2.178; CI: 1.168 – 3.232 P < 0.001 Vs I OR, 0.459; CI:
0.309 – 0.681 P < 0.001). To determine whether ACE gene polymorphism was associated with
diabetic complication, patients with type 2 diabetes were divided into diabetic hypertension,
diabetic retinopathy and diabetic nephropathy. The frequency of ACE DD genotype and D allele
in patients with diabetic hypertension were significantly higher than T2DM patients (41.6% and
60.4% Vs 19.5% and 37.8% P < 0.01). The frequency of ACE DD genotype and D allele in
patients with diabetic retinopathy were also higher than T2DM patients (28.6% and 44.1% Vs
19.5% and 37.8%). The frequency of ACE genotype in patients with diabetic nephropathy did
not show significant association. This might be due to small sample size that lack statistical
power. This study indicated that the frequency of ACE DD genotype and D allele were markedly
higher in patients with type 2 diabetes. This genotype and allele were significantly associated
with diabetic hypertension and diabetic retinopathy patients.
Keywords: ACE gene polymorphism; diabetes complications; diabetic hypertension; diabetic
retinopathy; diabetic nephropathy
1
1. INTRODUCTION
Diabetes is a rising global health burden, which is a multifactorial, heterogeneous group of
metabolic disorder with the common feature characterized by a deficiency or failure in
maintaining normal glucose homeostasis; this is due to defective insulin secretion, resistance
insulin action or due to a combination of both (Karuna et al., 2013).
Diabetes mellitus is a serious condition with potentially stressful complications that affects all
age groups worldwide (Guariguata et al., 2013). The American Diabetes Association (ADA)
divides diabetes mellitus into four categories (Kleinberger & Pollin, 2015). Type 2 diabetes
mellitus (T2DM) is the second category and most diabetes is sorted in this category, a
heterogeneous group of disorders caused by some combination of insulin resistance and
impairment of insulin secretion (Kleinberger & Pollin, 2015). Insulin resistance is a condition in
which the body’s muscle, fat and liver cells does not use insulin effectively leads to high
concentration of glucose in the circulation and occurred when the body can no longer produce
enough insulin to compensate for the impaired ability to use insulin ( Kaku, 2010; Skarfors et
al., 1991 and Colditz et al., 1990).
According to reports by International diabetic federation (IDF), in 2013 approximately 382
million people had diabetes globally and the IDF has estimated this number will rise to 592
million by 2035 (Guariguata et al., 2013). Among those type 2 diabetes, accounts about 350
million people worldwide and estimated 10 percent of the world’s adult population (nearly 600
million people) will suffer from the disease by 2035 (Colagiuri et al., 2015). However, the
largest increase of population with diabetes occur in sub-Saharan Africa, with a projected growth
of 19.8 million in 2013 to 41.5 million by 2035 (Guariguata et al., 2013). Among this, over 90%
are type 2 diabetes in Sub-Saharan Africa (Hall et al., 2011). This is due to a rapid uncontrolled
urbanization, lifestyle changes towards western diets, reduced quality of food, late diagnosis,
inadequate screening and diagnostic resources, poor control of blood sugar level, inadequate
treatment at an early stage and smoking in sub-Saharan Africa (Kengne et al., 2013; Mbanya et
al., 2010 and Vivian et al., 2010). Since 1985 Ethiopia has been a member of IDF and the IDF
estimated the number of diabetic among adults (20-79 years) in 2010 was 2.5% and the number

2
is expected to rise in to 3.5% by the year 2030 (Shaw et al., 2010 ). Currently diabetes is a
serious challenge in Ethiopia ( Worku, 2010; Abera, 2000 and kasper and Lester, 1988).
Individuals who are unaware of diabetics disorder (Chronic hyperglycemia of diabetes) are at
very high risk of chronic complications (Mbanya et al., 2010). The complication may be
macrovascular or microvascular origin and risk for diabetic hypertension. Macrovascular such as
cardiovascular disease (CVD), coronary heart disease, peripheral vascular disease and
cerebrovascular disease and microvascular complications such as, affecting the eyes cause of
blindness (diabetic retinopathy), end stage renal disease (ESRD or diabetic nephropathy),
diabetic foot and nerves (diabetic neuropathy (Tesfaye & Gill, 2011; Al-Khawlani et al., 2010
and Michael, 2008). The macro and microvascular complication of diabetes mellitus is also
common in Ethiopia ( Gebrekirstos et al., 2015 and Tesfaye et al., 2015).
It is typically a multifactorial disease, there are many factors associated in the occurrence T2DM
and the progress of its complication. Risk factors such as obesity (Body mass index (BMI)), over
eating, stress as well as aging, dyslipidemia, hypertension, smoking, physical inactivity, dietary
patterns, family history, and specific genes are the most frequently known risk factors for T2DM
(Lyssenko et al., 2008; Valdes et al., 2007 and Holt, 2004). However, the genetic factors (genetic
origins) of T2DM and its complication are not obviously understood because the genetics of
T2DM is polygenic and multifactorial origins as a result of the interaction between the
environment and multiple genes ( Vivian et al., 2010 and Strojek et al., 1997).
At present many candidate genes have been associated with T2DM (Lyssenko et al., 2007).
However, genes that are encoding for the renin-angiotensin system (RAS) are the main genetic
risk factors for T2DM and the progress of its complications (Giacchetti et al.,2005 and Jacobsen
et al., 2003 ). Among genes involved in the RAS, Angiotensin converting enzyme (ACE) gene
encoding is a key enzyme. This gene is located at chromosome 17q23 consisting of 26 exons, 25
introns and it spans 21 kb (Erdos, 1990). The polymorphism of ACE gene due to the insertion (I)
or deletion (D) of a 287 bp Alu repeat sequence near the 3′ end of intron 16 leads to three
genotypes DD, II and ID ( Skipworth et al., 2011; Rivera et al., 2004 and Rigat et al., 1990).
The main function of this gene is the conversion of Angiotensin I to vasoactive, natriuretic
octapeptide angiotensin II in liver (Erdos, 1990) and inactivates a vasodilator peptide bradykinin
(Kuoppala et al., 2000). Alleles of ACE gene polymorphism are present in both healthy
3
individuals and T2DM patients with different frequencies and DD genotype individuals are at
risk of T2DM and its complications (Jeffers et al., 1997). This implies that, imbalances in RAS
functions are related to insulin resistance and susceptible to T2DM. The present state of
knowledge about ACE gene polymorphism in T2DM and its complication have a doubt because
there were some studies in the literature that described a null association between the etiologies
of T2DM and its complication with ACE gene polymorphism (Skipworth et al., 2011and
Jacobsen et al., 2003). However, most of the reported literature has indicated that ACE gene
polymorphism is associated with T2DM and its complication in different populations ( Hussein
et al., 2015; Nikzamir et al., 2006; Yang et al., 2006 and Yoshida et al., 1996 ).
4
1.1 Statement of the Problem
Diabetes is a rising global health problem both in developed and developing continents,
especially in Africa, sub-Saharan Africa due to late diagnosis, inadequate screening and lack of
diagnostic resources, poor control of blood sugar, and inadequate treatment at an early stage of
the disease ( Guariguata et al., 2013, Kengne et al., 2013 and Sleire 2011). In Ethiopia,
undiagnosed cases (late diagnosis) is highest proportion (82.6%) among the rural population and
63% among the urban population and family history of diabetes is highly associated with
diabetes mellitus (Abebe et al., 2014). This indicates that proper awareness of the public about
the disease early diagnosis is not a practice as a result new cases already have diabetes with
hypertension and other complication at the time of diagnosis ( Seifu et al., 2015 and Abebe et
al., 2014). Genetic polymorphism could be indicators for risk of T2DM and can serve as a
marker so that may help for protecting the disease with better treatment out come and early
diagnosis even before the onset of the disease. The role of ACE gene polymorphism in the
pathogenesis of type 2 diabetes and its impact on the progress of diabetic complication has been
investigated by different studies. However, there were no reported data of ACE gene
polymorphism on the risk of T2DM and diabetic complications among the Ethiopian population.
Therefore, the aim of this study was to investigate the association of risk factors, ACE gene
polymorphism in patients with type 2 diabetes and its complications in the Ethiopian population,
Bahir Dar Felegehiwot Referral Hospital.
5
1.2 Significance of the Study
Type 2 diabetes is a complex disorder resulting from an interaction between multiple genes and
environmental factors. As a result, this study was conducted on both socio- demographic risk
factors and one of the associate genes (ACE). It is important to look for the gene association in
the Ethiopian population and compare it with previous studies on the same issue other than
Ethiopian population. This will help scientists and physicians to rationalize research priorities
regarding T2DM and its complication serve as a marker for early diagnosis of the disease and to
order better therapeutic drugs that help to reduce the occurrences of diabetic complications. In
addition, the result of this study would be used as a source of information to the community and
health care professionals. Policymakers also get ideas about gene polymorphisms to develop
policies and strategies for evidence-based approaches to a better treatment individual medicine
for type 2 diabetes and its complications.
6
2. OBJECTIVES
2.1 General Objective
The general objective of this study was to assess the association of angiotensin converting
enzyme gene polymorphism wit risk of diabetes 2 and its complication among patients visiting
Bahir Dar Felegehiwot referral hospital.
2.2 Specific Objectives
The specific objectives of this study were
To compare the frequency of ACE gene polymorphism in type 2 diabetes mellitus
patients and healthy controls
To evaluate the frequency of ACE gene polymorphism in patients with type 2
diabetes without complications and diabetic complications
To determine the correlation of ACE gene polymorphism to risk of diabetic type 2
and degree of complications

7
3. LITERATURE REVIEW
3.1 Epidemiology of Type II Diabetes
Type 2 diabetes is mostly characterized due to insulin resistance and beta cell dysfunction (Kahn,
2003). Insulin resistance is a condition in which cells do not respond to the normal action of
insulin secreted from the pancreatic β-cells. Consequently, cellular uptake of glucose does not
occur and blood glucose level become elevated (Kahn, 2003).
Type 2 diabetes is also called non-insulin-dependent diabetes (NIDDM), the most common type
of diabetes mellitus worldwide and it is a challenge both in the developed and developing
countries (Colagiuri et al., 2015; Mbanya et al., 2010 and Dahiru et al., 2008). The other report
by King et al., (1998) indicated that the number of T2DM in 2000 was estimated approximately
150 million individuals with the disease and this number is expected to double by 2025 (King et
al., 1998). Similar report also indicated that T2DM represents 90% of the overall burden of
diabetes worldwide with approximately 150 million cases (Diamond, 2003). Diabetic forum on
2015 indicate that, T2DM affects about 350 million people worldwide and if the tendency
continues, an expected 10 percent of the world’s adult population (nearly 600 million people)
will suffer from the disease by 2035 (Colagiuri et al., 2015).
The prevalence of T2DM in Africa was mostly lower than 1%, except in South Africa (0·6–
3·6%) and Coted’Ivoire (5·7%) between the 1960s and early 1980s (McLarty et al., 1990).
However, this disorder is currently the most common sub-Saharan Africa, which is reported by
Colagiuri et al (2015) and Hall et al (2011), over 90% of T2DM are in Sub-Saharan Africa
having population prevalence ranged from 1% in rural Uganda to 12% in urban Kenya (
Colagiuri et al., 2015 and Hall et al., 2011).
Type 2 diabetes is also common in Ethiopia (Worku, 2010 and Abera, 2000). According to the
2011 report of the International Diabetes Federation (IDF), the figure of adults living with
diabetes in Ethiopia was 3.5% (Whiting et al., 2011). Among those, Mekelle Ayder referral
hospital, reported that, most of the patients, 216/263 (82%), had T2DM while 47/263 (18%) of
them suffered from type I diabetes (T1DM), which indicates T2DM is common in Ethiopia
(Ambachew et al., 2015). The new report from 2011-2014 at Dilla referral hospital also reveal
8
that T2DM were highly predominated diseases across the year than T1DM (Alemu, 2015). The
other study by Worku et al (2010) in the southwest Ethiopia of Jimma university specialized
hospital indicate that, the larger proportion of 189 (62.0%) patients had T2DM and most of them
are acute complications (Worku et al., 2010). However, the study by Brown et al (1998) in the
northern Ethiopia, university of Gondar teaching referral hospital reveal that , T1DM are more
common than T2DM which accounts 40% of the town and 75% of rural patients (Brown et al.,
1998). On the other hand, the study in another time in the northern Ethiopia, university of
Gondar teaching referral hospital reveal that T2DM account 71% urban areas and 23% in the
rural areas (Alemu & Watkins, 2004). T2DM is the fourth or fifth leading cause of death in most
developed countries and the growing evidence indicate that, it has reached epidemic proportions
in many developing counties like Ethiopia (Amos et al., 1997).
3.2 Insulin and its Resistance in Type 2 Diabetes
The pancreas islets of langerhans consist of insulin-releasing beta cells, glucagon-releasing
alpha-cells, somatostatin-producing delta-cells, and pancreatic polypeptide-producing cells
(Elayat et al., 1995). Of these, insulin attempts to maintain normoglycaemia through a constant
supply of glucose between meals and conversion of the excess glucose to glycogen
(glycogenesis) in the liver and muscles (Taylor and Agius 1988). Glucagon has the reveres
action of insulin it converts liver glycogen to glucose (glycogenolysis) and muscle tissue
glycogen into pyruvic acid or lactic acid in anaerobic conditions, which later changed to glucose
in the liver (Taylor and Agius, 1988).
The insulin receptor (IR) is a heterotetramer consisting of two α and two β subunits those are
linked by disulphide bonds (White and Kahn, 1994 and White et al., 1988). β subunit has a
hydrophobic transmembrane region, and an intracellular domain which has several tyrosine
residues, a tyrosine kinase and an ATP-binding site (White et al., 1988). Insulin binding to the α
subunits activates β subunit tyrosine protein kinase and brings phosphorylation of tyrosine
residues and activation of the β subunit kinase leads to transmission of the insulin signal,
perhaps by initiating a phosphorylation/dephosphorylation cascade (White et al., 1988 and
Denton et al., 1981). The alteration in the insulin-receptor tyrosine kinase activity induced by
cyclic AMP-dependent protein kinase phosphorylation of serine residue of the receptor sites (β

9
subunit), and this could faithfully underlie catecholamine-induced insulin resistance (Tanti et al.,
1987). During the situation of extreme insulin resistance and T2DM, the process of signal
transmission from the insulin receptor, a subunit insulin-binding site to activate the kinase
appears to be defective at one or more sites (Caro et al., 1986). This leads to amino acid
substitution in the ATP-binding region or the tyrosine kinase region and diminishes insulin
action (Ellis et al., 1986). This impaired insulin secretion through a dysfunction of pancreatic β-
cell and impair insulin action through insulin resistance are the main pathologic defect of type 2
diabetes (Holt, 2004).
3.3 Complications of Type 2 Diabetes and Diabetic Hypertension
The complications of T2DM are macro and microvascular origin. Macrovascular such as
cardiovascular disease (CVD), coronary heart disease, peripheral vascular disease and
cerebrovascular disease and microvascular complications such as, affecting the eyes cause of
blindness (diabetic retinopathy), end stage renal disease (ESRD or diabetic nephropathy),
diabetic foot and nerves (diabetic neuropathy (Tesfaye & Gill, 2011; Al-Khawlani et al., 2010
and Michael, 2008). Among those complications, microvascular complication is frequently
occurred in T2DM. As a result, this study has paid great attention for diabetic nephropathy,
diabetic retinopathy and diabetes with hypertension.
3.3.1 Diabetic Nephropathy
Diabetic nephropathy (DN) is a common and severe complication that leading the cause of
chronic kidney disease in patients with T2DM and in a lesser proportion of subjects with T1DM
(Wang et al., 2008). However, the survival rate of T2DM patients with renal failure is much
worse than that of patients with renal failure resulting from T1DM or other causes (Mogensen,
2003). In addition, T2DM occurs more frequently at a younger age and these individuals live
longer with diabetes which expected to develop diabetic renal disease and ESRD due to a late
complication (after 15 to 25 yr) (Mogensen, 2003).
Diabetic nephropathy is characterized by macro albuminuria >300 mg in a 24-hour urine or
macro albuminuria and abnormal renal function as represented by an abnormality in serum
10
creatinine and serum urea and evidenced a decline in glomerular filtration rate (GFR) (Fontela et
al., 2014 and Shlomo et al., 2011). The progression of diabetes mellitus to DN monitored by
serum urea and creatinine level, those are simple biomarkers available for nephropathy
individuals and are higher in the diabetics especially in the case of DN (Bamanikar et al., 2016).
Males had elevated urea and creatinine levels compared to females, also age and period on
treatment are associated with impairment of renal function in both sexes (Mafuratidze et al.,
2014). The other study also indicates that age and plasma creatinine had a positive correlation
(Amartey et al., 2015).
T2DM is characterized by hyperfiltration in the early stages but GFR values has decreasing when
duration of diabetes increased with a mean GFR 103.508 ± 33.369 ml/min which indicates the
progress of diabetic nephropathy (Agarwal et al., 2005). Similar study also indicated that longer
duration of diabetes and lower diastolic blood pressure are associated with reduced estimated
glomerular filtration rate (eGFR) among 2368 subjects with T2DM had 12% of eGFR
<60ml/min/1.73m2 (Wall et al., 2010). Glomerular filtration rates below 60 mL/min/1.73m²
represents a decrease of approximately 50% in normal renal function and leads to complications
of chronic kidney disease (CKD) (Fontela et al., 2014). The other report can classify renal failure
in to different stages based on eGFR as Normal or high >90, mildly decreased 60-89, mildly to
moderately reduced 45-59, moderately to severely declined 30-44, severely decreased 15-29 and
Kidney failure <15 (KDIGO, 2013).
3.3.2 Diabetic Retinopathy
Diabetic retinopathy (DR) is a leading cause of visual impairment among diabetic patients. Some
new diagnosis patients with T2DM have DR, which indicates there is a need for early screening
of all type 2 DM patients (Jammal et al., 2013). Among 10 individuals, one of them has at risk
for DR (Hu et al., 2015). Age at diagnosis, high total cholesterol, high low-density lipoprotein,
triglycerides, microalbuminuria, elevated blood pressure, the use of anti-hypertensive drugs,
cigarette smoking and duration of hypertension are associated risk factor for the development of
DR (Hussain et al., 2013; Shammari et al., 2005 and Ohn et al., 1993). However, the study in
China indicates that among the above risk factors only diabetic duration is the risk for the
occurrence of DR (Hu et al., 2015).

11
Diabetes is one of the risk factor for retinopathy and other serious diseases in the Bangladesh
population (Islam et al., 2015). The study in the northern part of Ethiopia, diabetic clinic at
Mekelle Hospital indicate that among 105 diabetic patients 21% of them had diabetic retinopathy
(Gill et al., 2008). The other review reports in Gondar University referral hospital indicated that
the prevalence of DR among Ethiopian diabetics has been estimated to be approximately 25%
(Nigatu, 2012).
3.3.3 Diabetic with Hypertensive
Hypertension is not classified as micro or macrovascular complication rather it is a risk factor for
diabetes mellitus patients (Reaven, 1988). Cellular insulin resistance is responsible for the
development of hypertension through alteration substrate supply or energy needs of the cell and
the resultant changes in substrate/energy requirements sensitize, either directly or by altering ion
fluxes into the cell, the vascular smooth muscle response to amines such as nor epinephrine and
Angiotensin II (DeFronzo & Ferrannini, 1991). The other study also recommended that,
microvascular dysfunction may affect both peripheral vascular resistance that leads to
hypertension (Serne et al., 1999) and insulin-mediated glucose disposal that leads to insulin
resistance (Clark et al., 2003; Serné et al., 2001and Serne et al., 1999).
Individual who had a systolic blood pressure of 140mmHg and/or diastolic blood pressure of 90
mmHg considered to have hypertension. The studies reveal that systolic and diastolic blood
pressure were risk factors for type 2 diabetes and diabetic complications (Unnikrishnan et al.,
2007).
3.4 Risk Factors for type 2 diabetes and its complications
There are many risk factors for T2DM and it’s progression towards diabetic complications.
Those risk factors can be non-genetic or genetic etiology or either of both (Kasper et al., 2004).
Among the non-genetic or either of both risk factors most of the studies showed that, the
association of type 2 diabetic patients and its complication with advancing age and duration of
diabetes, obesity, poor glycemic control, smoking, gender, lipids, hypertension, proteinuria,
serum creatinine, eGFR, urea, higher BMI (Viswanathan et al., 2012; Haque et al., 2010 and
Iranparvar et al., 2006 ).
12
Many of the studies show that, there are many genes associated for the occurrence of T2DM and
the progress of diabetic complications. Among the genetic risk factors, researcher addresses by
family studies, and other genes such as genes in the rennin Angiotensin system, genes associated
to dyslipidemia, hypertension and oxidative stress are confirmed as a genetic risk factors
contribute for the occurrence of T2DM and the development diabetic complications both in
T2DM and T1DM (Al-rubeaan et al., 2014; Giacchetti et al., 2005 and White et al., 1998).
3.4.1 Non-genetic Risk Factors
3.4.1.1 Smoking
Numerous prospective studies has been reported that current smokers are having a risk factor for
developing of T2DM ( Hur et al., 2007; Sairenchi et al., 2004 and Hu et al., 2001). The other
studies reveal that, the association between smoking and T2DM has stronger among heavy
smokers (more than 20 cigarettes/day ) compared with light smokers ( Willi et al., 2007 and
Patja et al., 2005). In addition, the follow-up study found that an increased risk of type 2 diabetes
is occur in the first 2-3 years after smoking termination (Yeh et al.,2010 and Sairenchi et
al.,2004).
In diabetes mellitus, numerous prospective studies found that cigarette smoking is able to
increases the risk of microvascular and macrovascular complications such as in diabetic
retinopathy smoking raises the risk of changes in the blood vessels inside the eye that can cause
blindness in those patients over the age of 65 (Thornton et al., 2005). Cigarette smoking has its
own effects on lipid profile such as triglyceride, cholesterol and low-density lipoprotein (LDL)
levels are high in smoker individuals but high-density lipoprotein is lower in smokers than in
non-smokers (Craig et al., 1989).
3.4.1.2 Age and Sex
Age and sex are globally identified risk factors for diabetes mellitus (Ebenezer et al., 2003).
Individual who have an older age (>45) are having a chance to develop hyperglycemia and it is
more critical in women than men (Veghari et al., 2010). The other similar report in Libya also
indicate that, subjects having ≥50 years of age had nearly double risk of complications than those
with <50 years of age (Roaeid and Kadiki. 2011). The report in Nigeria indicates that age was
13
associated with T2DM in both sexes (Ekpenyong et al., 2012). However, the recent study in
Batticaloa district, Sri Lanka indicate that age above 50 years have more chance to develop
diabetes than other age groups but not correlated with gender (Prasanth et al., 2015). The other
study reported that, male genders are more prevalent in the high-risk group for T2DM (Marinho
et al., 2013). The study in Bangladesh indicate that sex is not associated with T2DM, however
individuals in the middle (31-50 years) and older age group (>50 years) are exposed to the
occurrence of T2DM (Al Sharmin and Munima, 2016).
Diabetes tends to increase with increasing age (high in 40-59 years) has triple risks of
developing T2DM than younger ages (Whiting et al., 2011). The other report also supporting
these idea, diabetes tends to increase with increasing age (high in 41-60 years) and tend to
decrease in >60 years for both men and women (Ruhembe et al., 2014). Increasing in age is
associated with higher risk of T2DM without difference regarding to gender (Bhalerao et al.,
2014). Most of subjects with diabetes are age between 40 and 59 years and the mean age did not
differ according to gender (Sagna et al., 2014).
Many studies have a conflict in the association or non-association between gender and diabetic
complications. To solve this conflict some of the studies reveal that, gender has no any impact on
progression of renal disease or survival (Hall et al., 2011 and Mogensen, 2003). However, other
studies showed that males having an independent risk factor or have strong association with
diabetic nephropathy and the risk of developing diabetic nephropathy is 20 times higher
compared to female (Ahmad et al., 2014; Al-rubeaan et al., 2014 and Abdulhakeem et al., 2012).
This implies that male is having an increased risk for diabetic and renal disease than females.
The other study in diabetic retinopathy also shows that male genders are high risk for the
development of diabetic retinopathy (Hussain et al., 2013). However, the other report reveals
that female genders are at high risk for the development of diabetic retinopathy (Ohn et al.,
1993).
3.4.1.3 Duration of Diabetics
Diabetes duration mean that the survival of patient long time with diabetics. Such cases were
studied by different researchers and some of the studies reveal that, patients with duration of
diabetes of 7-14 and ≥14 years had nearly twofold and threefold increase in complications than

14
patients with duration of <7 years (Roaeid and Kadiki, 2011). Patients that have been diagnosed
for the disease for more than 10 years having complications are higher than diagnosis of the
disease for less than 10 years (Cortez et al., 2015). These imply that longer diabetes duration is
the cause for the development of micro or macrovascular diabetic complication.
In microvascular complication, diabetic nephropathy (diabetes duration of 15 years) (Al-rubeaan
et al., 2014 and Kasper et al., 2004). The other study also reveal that diabetic nephropathy is
associated with a longer diabetic duration (Mafuratidze et al., 2014 and Unnikrishnan et al.,
2007). Diabetic retinopathy increased with the duration of diabetes mellitus (5-10 yr: 5.2- fold; >
10 yr: 10-fold) (Kim et al., 2011). Diabetic duration is also associated with retinopathy (EL-
Shazly et al., 2011 and Correa et al., 2003). With the mean duration of diabetes mellitus in all
patients (13.35 ± 8.17 years) diabetic retinopathy is highest in women (11.91 ± 7.92 years) than
in men (14.42 ± 8.20 years) (El-Babb et al., 2012).
3.4.1.4 Body Mass Index
Obesity and T2DM are worldwide public health problem in the 21st century that increase the
prevalence of diabetes parallels that of obesity. Obesity is excess storage of fat in the body that
leads to the development of cardiovascular morbidity, insulin resistance by muscle cells and
resistance to the cellular actions of insulin which results the occurrence of T2DM and (Hribal et
al., 2002). This an impaired ability of insulin inhibits glucose output from the liver and promote
glucose uptake in fat and muscle cell is due to adipose tissue releases increased amounts of
glycerol, hormones, non-esterified fatty acids, pro-inflammatory cytokines and other factors
associated to the development of insulin resistance (Hribal et al., 2002 and Saltiel and Kahn,
2001).
Many studies have reported that increased BMI is a strong risk factor for T2DM (Almdal et al.,
2008 and Knowler et al., 1991). This occurs both in men ( Almdal et al., 2008 and Knowler et
al.,1991) and women ( Colditz et al., 1990). Genes responsible for obesity and insulin resistance
interact with environmental factors such as increased fat/ calorie intake and decreased physical
activity resulting in the development of obesity and insulin resistance followed ultimately by the
development of T2DM ( Kahn et al.,2006 and O'Rahilly et al.,2006). Those obese individuals
having elevated plasma levels of free fatty acids are known to cause muscle insulin resistance
15
(Yaturu, 2011). People with severe obesity are at greater risk of T2DM than obese people with a
lower BMI calculated as the weight in kilograms divided by the height in meters squared (
Gatineau et al., 2014 and Iranparvar et al., 2006). BMI is long-term predictors of renal function
in men than in women anthropometric and metabolic parameters are less predictive eGFR (Nagel
et al., 2013).
3.4.1.5 Dyslipidemia
Resistance to insulin has a direct link to the changes in lipid profiles in NIDDM, by developing
a number of alterations in lipid metabolism and lipoprotein composition that make more
pathogenic in patients with T2DM and usually it is associated with higher concentrations of
Triglycerol (TG) and lower concentrations of high- density lipoprotein (HDL) (Schaefer et al.,
2009). The mechanisms of circulating free fatty acids (FFA) for insulin-mediated effects on
microvascular function are not completely understood. The elevated FFA induces an increase in
reactive oxygen species production (Lu et al., 1998). This leads to cause vascular endothelial
dysfunction indirectly via increased release of the vasoconstrictor substance (Piatti et al., 1996).
Type 2 diabetes is one of the free radical diseases increases diabetic complications with
increased lipid peroxides (Kumawat et al., 2012). Increased oxygen free radicals result in the
lipid peroxidation of cellular lipids leads to macrovascular and microvascular complications in
T2DM (Barathmanikanth et al., 2010). The main features of type 2 diabetic patients have plasma
lipid alterations of Hypertriglyceridemia with decreased HDL (Miller et al., 2011). The presence
of High plasma triglycerides and low plasma HDL cholesterol levels are an indicator of
prediabetic state for individuals who had insulin resistance syndrome ( Fabbrini et al., 2010 and
Mitsuyoshi et al., 2009).
Hypercholesterolemia is higher in T2DM and it is also a common risk factor for the complication
of progressive DN, DR , contributes to high cardiovascular morbidity and mortality of chronic
kidney disease (CKD) patients and diabetic hypertension (Bakris, 2011 and Moorehead et al.,
2005 ). Hypercholesterolemia characterized by high TG > 150 mg/dL and HDL > 40 mg/dL in
men and cholesterol levels > 50 mg/dL and a predominance of small dense low-density
lipoprotein (LDL) >100 mg/dL ( Bakris, 2011 and Moorehead et al., 2005 ).

16
3.4.2 Genetic Risk Factors
Many of the studies have described that, genetic components play an important role in the
pathogenesis of T2DM ( Harrison et al., 2013 and Amini & Janghorbani, 2007). Some of the
studies reported that individuals who have a family history have an increased risk of developing
T2DM and the risk increases when both parents are affected ( Amini & Janghorbani, 2007 and
Bjornholt et al., 2000). Specially, monozygotic or twin individuals are highly affected with
T2DM compared to dizygotic individuals (Medici et al., 1999).
The prevalence of diabetes varies among different ethnic groups and this variation across the
different ethnic groups share a similar environment, which supports the idea of genetic factors
contribute to the predisposing of disease (Elbein, 2006). Genetic factors predispose to the
development of T2DM by reducing insulin sensitivity and insulin secretion (Gerich, 2007 and
Elbein, 2006). The study by Lyssenko et al (2007) identifying 11 genetic variants (TCF7L2,
PPARG, FTO, KCNJ11, NOTCH2, WFS1, CDKAL1, IGF2BP2, SLC30A8, JAZF1, and
HHEX) and all are associated with the risk of T2DM due to impaired beta-cell function but
those genes are not associated with clinical risk factors ( Lyssenko et al., 2007). However,
among the 11 genes, ACE gene was not included in the study. And the gene transcription factors
7-like 2 (TCF7L2) is the highest risk of type 2 diabetes which results impairment of insulin
secretion (Lyssenko et al., 2007).
These days there are many genes associated for the occurrence T2DM and progress of diabetic
complications. such as genes in the Renin-Angiotensin aldosterone system (RAAS), Endothelial
nitric oxide synthesis (ENOS) (Neugebauer & Baba, 2000), Glucose metabolism (Ricci et al.,
2006), Cytoskeleton genes (Barry et al., 2009), Inflammation (Ahluwalia et al., 2009) , Growth
factors, Oxidative stress (Yamagishi & Matsui, 2010), and lipid metabolism (Wu, 2014).
However, this study focuses ACE gene polymorphism in RAAS, because this gene and other
genes in the RAAS such as angiotensinogen and angiotensin II type 1 receptor gene plays a
vital role in regulating glucose metabolism and blood pressure, electrolyte and fluid homeostasis
those leads to pathogenesis of DM and facilitate the progress of diabetic complications (Zhou
and Schulman, 2009).

17
3.4.2.1 Gene polymorphisms in the Renin-Angiotensin-Aldosterone System
Genes involved in this system are the major concern of this paper because genes of the Renin-
Angiotensin-Aldosterone System (RAAS) have many important roles than the above genes which is
reported by many of the researcher, some of its role includes in glucose metabolism, and the
regulation of blood pressure (Al-rubeaan et al., 2014), electrolytes and fluid homeostasisd
(Ohshigel.,et al. 2010). The RAAS genes consist of renin (Liu et al., 2013), angiotensinogen
(AGT) (Fogarty et al., 1996), angiotensin-1 converting enzyme (ACE) (Haque1 et al., 2010);
Angiotensin converting enzyme 2 (ACE2), Angiotensin II type 1 receptor (AT1R) (Wysocki et al.,
2006) and Angiotensin II type 2 receptor (AT2R) (Bindom et al., 2010) all of these genes or
genetic loci responsible for excess Ang II production or availability are potential candidates for
development of diabetic complications. Because Angiotensin II (Ang II) is a powerful
vasoconstrictor and increase in intraglomerular pressure results in proteinuria and
glomerulosclerosis (Ha et al., 2015). Among those genes, this study will be focus on Angiotensin
converting enzyme (ACE) gene insertion/deletion polymorphism because most of the studies
were reported of this gene was highly associated with T2DM, diabetic with hypertension,
diabetic retinopathy and diabetic nephropathy.
3.4.2.1.1 Angiotensin Converting Enzyme
In the 1950s Skeggs and colleagues, discovered an enzyme that converts ANG I to ANG II
(named as hypertension I and hypertension II) (Leonard et al., 1956). Called “converting
enzyme“. After a number of years later recognized an enzyme in human blood, called kininase II,
which was able to degrade bradykinin (Kuoppala et al., 2000). Converting enzyme and kininase
II is later shown to be the same enzyme ( Dorer et al., 1974) and today the enzyme is referred to
as Angiotensin-converting enzyme.
ACE gene is located at chromosome 17q23 and spans approximately 21kb DNA, consists of 26
exons and 25 introns (Erdos, 1990). The amino acid domain of the ACE coded by exon 1 to exon
12, while the carboxyl domain coded by exon 13 to exon 26. The gene encodes 2 isoforms of
ACE. The somatic form (sACE) a glycoprotein composed of a single large polypeptide chain
expressed in somatic tissue of vascular endothelial cells at the brush border of renal proximal
convoluted tubule, epididymal duct epithelia and the jejunal villus (Sibony et al., 1993). The

18
other is testicular form (testis ACE, germinal ACE), expressed uniquely in germinal cells with a
precise stage-specific pattern, starting in round spermatids and finishing in spermatozoa (Sibony
et al., 1993).
Angiotensin is produced by the action of renin on angiotensinogen to form inactive decapeptide
Angiotensin I and its subsequent conversion to the biologically active octapeptide (Angiotensin
II) by Angiotensin -converting enzyme which is mediated via the Angiotensin type 1 receptor
(Carey & Siragy, 2003). Angiotensin converting enzyme (ACE) is a zinc metallopeptidase
membrane-bound enzyme widely distributed in several types of cells including vascular
endothelial cells, various absorptive epithelial cells, neurons, macrophages, T-lymphocyte and
other mononuclear cells, male germinal cells, and is also present in a circulating form in
biological fluids such as plasma, amniotic fluid, seminal fluids (Joyce-tan et al., 2016 and Erdos,
1990).
In plasma and on the surface of endothelial cells, it converts the inactive decapeptide Angiotensin
I into the vasopressor- and aldosterone-stimulating octapeptide Angiotensin II (Leonard et al.,
1956). It also inactivates bradykinin (BK) (Kuoppala et al., 2000), a vasodilator nonapeptide
involved in the control of vascular tone and implicated in inflammatory responses and finally the
enzyme is involved in the metabolism of several other biologically active peptides because of its
broad enzyme specificity and wide distribution in the body (Erdos, 1990).
Angiotensin I converting enzyme (ACE) gene is one of the most enormously studied genes and
the main part of this paper. Because it has the key role in the rennin-Angiotensin system (RAS)
and its physiological application in different parts of the body (Moynahan et al., 2001). The
polymorphism of this gene was first explained by Rigat and his coworkers, typically refers as the
insertion (I) or deletion (D) of an Alu repetitive sequence of 287-bp in intron 16 of the gene ,
found in three forms: D/D and I/I homozygote and I/D heterozygote (Rigat et al., 1990). Alu
ACE I/D polymorphisms are also suitable markers for studying genetic variation in human
populations (Skipworth et al., 2011and Yoshida et al., 1996).
19
3.4.2.1.2 Gender and ACE gene polymorphism
Glucose utilization is higher in women with the DD genotype than in women with the II
genotype, homozygous D allele women of the ACE gene are more insulin sensitive, whereas
homozygous I allele women of the ACE gene have greater insulin resistance and potential risk
for T2DM (Kaleemullah et al., 2011). A higher insulin level is an indirect indicator for insulin
résistance, subjects with I allele are more insulin-resistance than non I allele individuals (Chiu &
McCarthy, 1997). Study in south Indian population revealed that, the DD genotype is associated
with the female population where as individual with I allele (homozygous II and heterozygous
ID) in unaffected males which act as a protective role in male population (Nagamani et al.,
2015). However, the other study conducted in China indicated that male subjects with DD
genotype had higher serum ACE activity than female subjects with DD genotype (Zhang et al.,
2014)
3.4.2.1.3 Metabolic syndrome and ACE gene polymorphism
Metabolic syndrome is a collective effect of genetics and certain environmental factors which
results glucose intolerance, hypertension, abdominal obesity and dyslipidemia (Reaven,1988)
Study in china related to association of the ACE I/D polymorphism with metabolic syndrome in
patients with T2DM have a higher prevalence of dyslipidemia, albuminuria, serum uric acid and
serum triglyceride levels it provides genetic information of the renin-Angiotensin system
involved in the pathophysiology of metabolic derangement (Lee & Tsai, 2002).
Study in USA about glucose metabolism notify that, fasting glucose and insulin are similar
among genotypes of ACE gene, but 2-hour glucose levels were higher in DD genotype which
has lower insulin sensitivity than in ID and II genotype subjects (Bonnet et al., 2008). The other
study by Ali-Bahara et al., (2014) reported that a decrease in DD genotype of ACE and increases
in ID and II genotypes are associated with changes in fasting blood sugar, triglyceride, total
cholesterol and blood pressure (Ali-Bahar et al., 2014). However, the other study conducted in
Iranians T2DM patients indicated that metabolic syndrome is not associated with ACE gene
polymorphism (Nikzamir et al., 2008).

20
3.4.2.1.4 ACE Insertion/Deletion and Susceptibility to Diabetes Mellitus
There are may candidate genes associated to the ourrence of T2DM such as glucokinase (GCK),
insulin receptor substrate-1 (IRS-1), potassium inwardly rectifying channel subfamily J member
11 (KCNJ11), peroxisome proliferator-activated receptor gamma, hepatocyte nuclear factor- 1A
(HNF1A) and hepatocyte nuclear factor-4A (HNF4A) (Singh, 2011). However, genetic variants
in the RAAS are highly associated with metabolic syndrome, especially hypertension, T2DM and
diabetic complications (Al-Rubeaan et al., 2013). Activation of the RAAS and enhanced
production of Ang II has an inhibitory effect on insulin signal transduction pathway of insulin
IRS-1 phosphorylation and reduce glucose uptake through GLUT4 that result for insulin
resistance (Zhou and Schulman, 2009). Additionally, Ang II increases reactive oxygen species
which leads to damaging the pancreatic β-cells and causes impair insulin secretion from the
pancreas through vasoconstriction and reduction in islet blood flow. All these effects lead to the
development of DM (Zhou and Schulman, 2009) and activation of RAAS leads to the
development of hypertension, macrovascular and microvascular complication in patients with
diabetes mellitus (Hsueh and Wyne, 2011).
The role of ACE I/D polymorphism in the pathogenesis of diabetes mellitus and its complications
were reported in various populations. Angiotensin II (AngII) has been confirmed in the
pathogenesis of T2DM by inhibiting the secretion of insulin or producing of insulin resistance,
promoting the generation of inflammation and fibrosis (Yusuf et al., 2001 and Danser et al.,
1995). The DD genotype of the ACE gene is mostly associated in the pathogenesis of T2DM and
individuals having DD genotype are highly susceptibility to T2DM (Yang et al., 2006 and Ergen
et al., 2004 ). The study in Egypt also indicated ACE gene I/D polymorphism are associated with
T2DM patients and the D allele is high risk for T2DM (Zarouk et al., 2009). However, a meta-
analysis study indicated that there was no association between ACE gene polymorphism and
T2DM in Chinese population (Zhou et al., 2012). Similarly, other studies reported that ACE gene
polymorphism (I/D) cannot be considered as a risk factor for T2DM in the Lebanese population
(Chmaisse et al., 2009), in Japan (Ichikawa et al., 2014). Moreover, the relationship between
ACE gene polymorphism in T2DM, diabetic complications and diabetic hypertension in the
diabetic population has not any reported data in the Ethiopian population.

21
3.4.2.1.5 ACE gene Polymorphism in Patients with Diabetic Nephropathy
ACE is a component of the renin–Angiotensin system and catalyses the conversion of the
inactive precursor decapeptide Angiotensin I to active octapeptide Angiotensin II. Angiotensin II
leads to the release of catecholamines from the adrenal medulla and prejunctional nerve, induces
vasoconstriction, sodium retention and renal hemodynamic changes that result in intraglomerular
hypertension and causes glomerulosclerosis (Hsueh and Wyne., 2011 and Leehey et al., 2000).
In T2DM, patients there are conflict regarding the association between the ACE genotype and
diabetic nephropathy (Schmidt et al., 1995 and Fujisawa et al., 1995). The homozygous DD
genotype is an independent risk factor and has a high prognostic value for the onset and
progression of diabetic nephropathy in T2DM. The study in India showed that haplotypes,
deletion allele D and DD genotype of the ACE gene are associated with greater risk of diabetic
nephropathy than the haplotypes insertion(I) allele ( Haque et al., 2010 and Naresh et al., 2009).
However study in Turkish (Mustafa et al., 2001), Switzerland (Walder et al., 1998), and
Germany (Schmidt et al., 1995) were revealed that, type 2 diabetic patients of ACE I/D
polymorphism genome distribution and allele frequencies (DD, ID, II and D and I ) doesn’t seem
to be associated with diabetic nephropathy.
Studies in Iran shows that, the frequency of DD genotypes and D alleles are increased in DN
patients than the normal individuals (30.6% vs 14.3%) (Nikzamir et al., 2006). The other follow-
up study in Iraq reported that, the genotype and allele frequencies of ACE gene polymorphism of
the homozygous DD genotype are at high risk of DN which is two folds than wild type II and the
minor allele frequency D allele is higher in DN than the normal individuals (Hussein et al.,
2015). In addition to this during their follow-up studies, they also concluded that, the frequency
of DD genotype was not differing between DN patients and patients without nephropathy (30.6%
vs. 20%) (Hussein et al., 2015). In contrast, the l/D polymorphism (DD, ID and II) of ACE
genotype has not associated in patients with and without nephropathy with the duration of
diabetes ≥20 years Arfa et al., 2008 and (Schmidt et al., 1995). Also the other study in Japanese
reveal that the ACE gene polymorphism is associated with myocardial infarction, but not with
nephropathy patients of NIDDM (Fujisawa et al., 1995).
The ACE DD genotype polymorphism is associated with more rapid decline GFR which
increases mortality rate in type 2 diabetic patients with established renal disease, and the D allele
22
has also a co- dominant effect on the development of diabetic nephropathy but not associated
with non-diabetic nephropathy ( Zarouk et al., 2009 and Fava et al., 2001 ).
3.4.2.1.6 ACE Gene Polymorphism in Patients with Diabetic Hypertensive
The product of ACE (Angiotensin II) induces vasoconstriction through inactivation of the
vasodilator peptide bradykinin, theses leads to the occurrence hypertension (Hsueh and Wyne,
2011 and Leehey et al., 2000). The association between ACE I/D polymorphism and
hypertension is controversial. Some of the studies have proposed that the DD genotypes are
increase numbers of critical hypertension in the diabetic population (Pasquale et al., 2005 and
O’Donnell et al., 1998) and D allele with hypertension in a south Indian population (Anbazhagan
et al., 2009) and in a south China population (Jiang et al., 2009). Others have not established as
a significant relationship between ACE DD genotype and D allele among hypertensive
individuals (Tascilar et al., 2009 and Chuang et al., 1997). The study in Iranian patients with the
frequency of DD genotype (27 cases in T2DM with hypertension Vs 11 cases in T2DM without
hypertension P < 0.026) indicates that DD genotype individuals are independently associated
with hypertension in the diabetic population (Nakhjavani et al., 2007).
ACE gene DD genotype and D allele is a risk factor for hypertension and higher lipid levels but
is not a risk factor for diabetes in elderly population than those in patients with II genotype
without association of their blood glucose level (Zhou et al., 2013). However, the other study
indicate that I allele 63% and I/D genotype 37% in patients and 48% I allele and 52% I/D
genotype for healthy controls of ACE gene which indicates I allele and I/D genotype is
associated with T2DM and hypertension (Panjaliya et al., 2013 ).
3.4.2.1.7 ACE Gene Polymorphism in Patients with Diabetic Retinopathy
Genetic factors are contributed in the developmental role of diabetic retinopathy (Abhary et al.,
2009). A number of gene polymorphism studies on the components of retinal RAS such as Ang I,
Ang II, renin, ACE, AT-1 and AT-2 leads to increase levels of prorenin, rennin and angiotensin II
are associated with proliferative DR and diabetic macular edema telling the connection of RAS
in pathogenesis of diabetic retinopathy (Lu et al., 2012; Noma, 2009; and Nagai N, 2005).
However, the biological mechanism through which the ACE I/D polymorphism related to an increased
23
risk of proliferative diabetic retinopathy is unclear. It is reported that Ang II participates in the progress of
retinopathy through inducing the synthesis of growth factors in the vascular endothelial and connective
tissue (Wilkinson-Berka, 2006).
A meta-analysis study includes 2,224 Chinese patients showed reasonable evidence of an association
between the ACE I/D polymorphism and proliferative diabetic retinopathy (PDR) (Lu et al., 2012). The
study in Pakistan also shows that the ACE genotype I/D is associated with PDR (p = 0.009) and
its sub-clinical class non-proliferative diabetic retinopathy (NPDR) (p = 0.006) (Saleem et al.,
2015). The other study in Turkey revealed that ACE DD genotype is an independent risk factor
for retinal vein occlusion (second most common retinal vascular disease after diabetic
retinopathy in the elderly and it leads to serious visual loss and blindness) (Kutluturk et al.,
2014).
Numerous studies have addressed the molecular epidemiology of ACE I/D polymorphism among
DR (Thomas et al., 2003 and Marre et al., 1994). A recent study in china indicated that ACE
gene polymorphism have no difference between DR males and females compared to respective
controls other than used for a risk factor and prognostic marker for DR and T2DM (Khan et al.,
2015). Treatment with blockage of the RAS provides beneficial effects in the provisions of
delaying the development and progression of diabetes and DR (Sjolie et al., 2008).
24
4. MATERIAL AND METHODS
4.1 Study Area
This study was conducted in Bahir Dar Felegehiwot Referral Hospital. Bahir Dar town is located
in the Amhara region, Northwest of Ethiopia served by Felegehiwot Referral Hospital, a tertiary
referral hospital serving over 7 million people from the surrounding area including Debretabor
hospital, Woreta hospital, Dangla hospital, Durbetie hospital, Merayi hospital, Adiet hospital,
Enjibara hospital, Gemjabet hospital, Burie hospital, Chagni hospital, Pawi hospital and Mota
hospital. For this study, samples were collected from the diabetic clinic of Bahir Dar Felegehiwot
Referral Hospital. The biochemical analysis of the study was done in Gondar University Referral
Hospital, clinical diagnostic laboratory. However, the molecular part of the experimental analysis
was conducted in Gondar University Atse Tewodros Campus, College of Natural and
Computational Sciences, Department of Biotechnology.
4.2 Study Design and Period
A case control comparative study was carried out from January – October, 2016 in Bahir Dar
Felegehiwot Referral Hospital.
4.3 Population
During the study period, all patients who were diagnosed by physicians according to the WHO
criteria for diabetes mellitus and healthy control subjects were the source population. Whereas
T2DM without complication, type 2 diabetic hypertension, diabetic retinopathy and diabetic
nephropathy patients who were diagnosed by physicians were the study population.
4.4 Inclusion and Exclusion Criteria
Patients diagnosed by physicians having type 2 diabetes, diabetic hypertension, diabetic
retinopathies, diabetic nephropathies and all age groups were recruited in the study. Patients
were diagnosed with T1DM, patients suffering from acute and chronic infection, malignancies,
congestive heart failure, HIV, urinary tract infection and acute febrile illness were excluded from
25
this study. Healthy controls having hypertension at the time of data collection and healthy
controls having hyperglycemia during biochemical analysis were excluded in the study and
replaced by other healthy individuals.
4.5 Variables
The dependent variables in these studies were age, sex, duration of diabetics and status of
diabetes. Whereas the independent variables include serum creatinine, glucose level, cholesterol,
triglycerol, blood urea, ACE gene I/D polymorphism, and obesity.
4.6 Sample Size and Sampling Technique
A total of 222 subjects (111 T2DM and 111 healthy controls) were selected by non probability
purposive sampling technique. Among 111 T2DM, 35 had T2DM without complications, 35 had
diabetic hypertension, 30 had diabetic retinopathy and 11 had diabetic nephropathy. Among
T2DM, 55 were men and 56 were women and healthy control groups consisted, 55 men and 56
women.
4.7 Data Collection, Clinical Measurements and Laboratory Method
4.7.1 Questionnaire
The socio- demographic characteristics and clinical parameters of both patients and healthy
control subjects such as smoking, gender, age, duration of diabetes, diabetic complications and
family history were taken through semi-structured questioner.
4.7.2 Anthropometric Measurements
Body weight was measured using a portable digital scale while height was measured using a
portable stadiometer. Body mass index (BMI) was calculated as weight in kilograms divided by
the square of height in meters and participants were categorized as underweight < 18.5, healthy
(BMI 18.5 - 25 kg/m2), overweight (BMI 25.0–29.9 kg/m2) or obese (BMI ≥ 30 kg/m2)
(Ferguson et al., 2011). Blood pressure was recorded in the sitting position after 5 min of rest by
using a digital device and systolic and diastolic blood pressures were calculated from mean value
26
after three readings. Patients were considered as hypertension, if mean systolic blood pressure
(SBP) ≥ 140mmHg and mean diastolic blood pressure (DBP) ≥90mmHg Or if they used
antihypertensive medication.
4.7.3 Sample Collection
Five milliliters of blood sample were collected from the vein of all subjects of an overnight
fasting patients and healthy controls by laboratory personnel. From 5ml blood sample, 3ml was
kept in plain tube without anticoagulants for biochemical tests. The remaining 2ml of the blood
was kept in Ethylene Diamine Tetra Acetic Acid (EDTA) tube for isolation of DNA and stored at
-21ºC.
4.7.4 Laboratory Methods
4.7.4.1 Biochemical Analysis
A non –anticoagulated blood (3ml in plain tube) sample was centrifuged at 8000 rpm for 10
minutes, the sera were aspirated and transferred in to sterilized eppendorf tube and stored at –20
0C until processing. Each test was subjected for an enzymatic analysis of Glucose, total
cholesterol, triglycerides, urea, and creatinine by Mindary fully automated analyzer in the
clinical chemistry diagnostic laboratory of college of medicine and health sciences. Fasting
blood glucose (FBG) level was used to assess the glycemic control. For a non diabetic
individuals (healthy control group), when FBG was > 110 mg/dl, the glycemic control was
considered as unsatisfactory; when FBG ≤ 110 mg/dl the glycemic control was considered as
satisfactory (American College of Endocrinology, 2002). However, in the case of diabetic
patients when FBG >130mg/dl, the glycemic control was considered poor glycemic control.
When FBG <130mg/dl, the glycemic control was considered good glycemic control (Kassahun
et al., 2016). If total cholesterol > 200 mg/dl and triglycerides > 150 mg/dl, were taken as
abnormal (NCEP 2001). If serum creatinine > 1 mg/dl, it was taken as abnormal result (Colagiuri
et al., 2015). Estimated glomerular filtration rate (eGFR) was calculated online by using the
Chronic Kidney Disease Epidemiology Program equation (CKD-EPI) and individuals having
eGFR < 60 ml/min/1.73m2 were considered as having a chronic kidney disease (Levey et al.,
2009). Moreover, based on eGFR, individuals were classified as risk categories (low, moderate,
high or very high) by the Kidney Disease Improving Global Outcomes (KDIGO) 2012
prognostic grids (KIDGO, 2013).
4.7.4.2
For DNA extraction, 300µl of EDTA anticoagulated blood
was transferred in to sterilized 1.5ml eppendorf
used for DNA extraction to get
(Suguna, et al., 2014). Red blood cells (RBCs) were lysised and removed by using RBC lysis
buffer solution. Similarly, white blood cells were lysised using a nuclear lysis buffer solution.
The proteins were precipitated with a high concentrated salt (6M NaCl) and DNA was
precipitated by chilled absolute ethanol, followed by washing of genomic DNA with 70% ice
cold ethanol and finally the DNA was dissolved with
was stored at -210c till used.
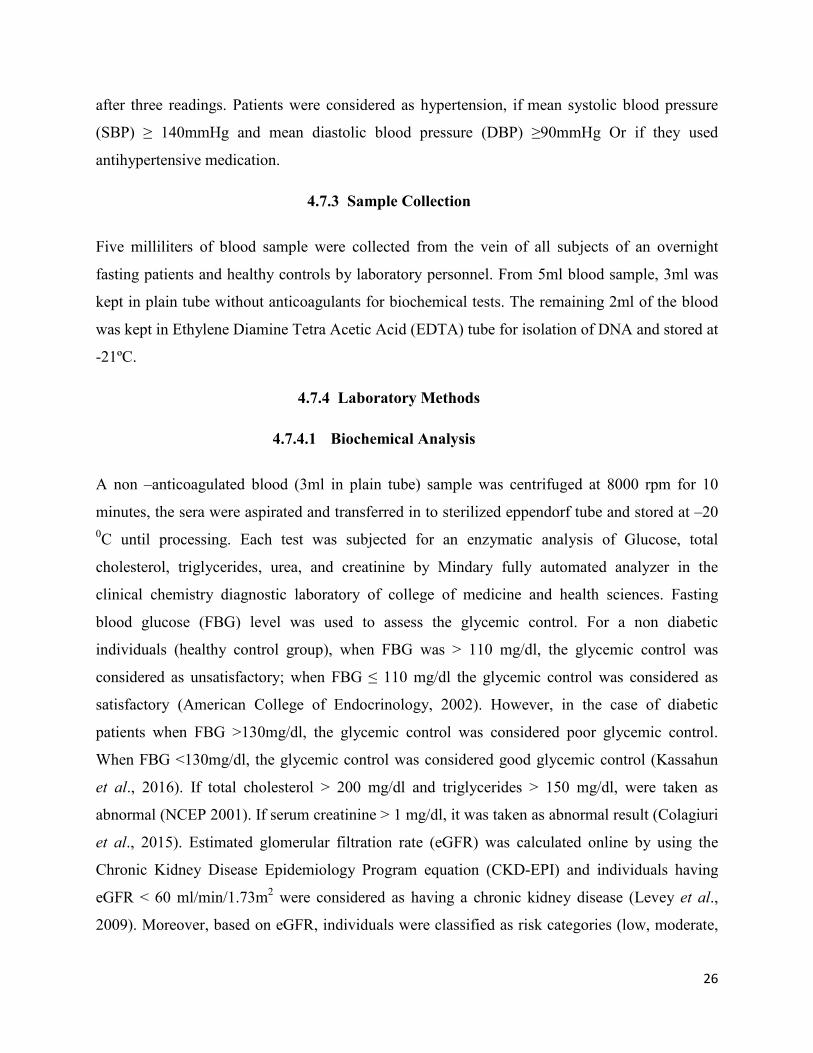
The quality of isolated genomic DNA was confirmed by using 1.5 % aga
Finally via following the above mentioned
shown in the Figure 1. Then the patients and respective control samples were genotyped for
Insertion/Deletion (I/D) polymorphism using sets of primers and appropriate PCR conditions.
the Kidney Disease Improving Global Outcomes (KDIGO) 2012
prognostic grids (KIDGO, 2013).
4.7.4.2 Genomic DNA Isolation
300µl of EDTA anticoagulated bloods of both patients and
transferred in to sterilized 1.5ml eppendorf tube. A non-enzymatic salting out method was
high yield genomic DNA with a small amount of blood sample
., 2014). Red blood cells (RBCs) were lysised and removed by using RBC lysis
ite blood cells were lysised using a nuclear lysis buffer solution.
The proteins were precipitated with a high concentrated salt (6M NaCl) and DNA was
by chilled absolute ethanol, followed by washing of genomic DNA with 70% ice
d finally the DNA was dissolved with Tris-EDTA buffer (TE) and
The quality of isolated genomic DNA was confirmed by using 1.5 % agarose gel electrophoresis.
above mentioned procedures a pure genomic DNA was obtained as
Then the patients and respective control samples were genotyped for
) polymorphism using sets of primers and appropriate PCR conditions.
27
the Kidney Disease Improving Global Outcomes (KDIGO) 2012
patients and healthy controls
enzymatic salting out method was
high yield genomic DNA with a small amount of blood sample
., 2014). Red blood cells (RBCs) were lysised and removed by using RBC lysis
ite blood cells were lysised using a nuclear lysis buffer solution.
The proteins were precipitated with a high concentrated salt (6M NaCl) and DNA was
by chilled absolute ethanol, followed by washing of genomic DNA with 70% ice-
TE) and this sample
rose gel electrophoresis.
enomic DNA was obtained as
Then the patients and respective control samples were genotyped for ACE
) polymorphism using sets of primers and appropriate PCR conditions.

28
4.7.4.3 Polymerase Chain Reaction (PCR)
The Insertion/Deletion (I/D) alleles of ACE gene polymorphisms were identified by TC 412 PCR
amplification of using specific primers. A final volume (25 µl) of PCR reaction mixture were
prepared using 6pmol of forward and reverse primers (forward primer 5′-
CTGGAGACCACTCCCATCCTTTCT-3′ and reverse primer
5′GATGTGGCCATCACATTCGTCAGAT-3′) (Patel et al. 2011 and Rigat et al.1992), 5 mM of
MgCl2, 0.5 mM of each dNTP, 0.75 U of hot start Taq polymerase, 3 µl of template DNA and
water were used.
PCR amplification was set with an initial denaturation at 95°C for two minutes. Hot start Taq
polymerase was kept for 15 minutes at 95°C to activate the enzyme. Then, the DNA was
amplified for 30 cycles. The cycle steps were denaturation at 94°C for 30 seconds, annealing at
62°C for 30 seconds and extension at 72°C for 45 seconds followed by a final extension at 72°C
for nine minutes. Finally the PCR product was held at 40c until it was analyzed by agarose gel
electrophoresis.
4.7.4.4 Agarose Gel Electrophoresis
PCR amplified products of ACE I/D genotypes were electrophoretically separated for 50min at
50 V on a 2% agarose gel. To stain and visualize DNA upon UV transillumination in gel, 3 µl of
2% Ethidium Bromide was also added. The PCR amplified products (12µl) mixed with 3 µl
loading dye then loaded into wells of agarose gel. Electrophoresis was carried out in 1X trice
acetate EDTA (TAE) buffer and the gel was visualized by UV transilluminator.
After electrophoresis, band sizes of 190bp (Deletion) and 490bp (Insertion) polymorphisms
fragments were obtained and image was captured with the help of a smart phone camera and
digital camera. Therefore, there were three genotypes after electrophoresis: A 490bp band
(genotype II), a 190bp band (genotype DD) and both 490bp and 190bp band (ID genotype). The
genotypes were calculated to determine the association of ACE (I/D) gene polymorphisms in
patients with T2DM, DR, DN, diabetic with hypertension and with other clinical and socio-
demographic characteristics.

29
4.8 Statistical Analysis
Data were analyzed by using SPSS version 20. Quantitative data were presented as mean and
standard deviation (x ± s). To compare continuous variables between T2DM group and healthy
control groups, T2DM and T2DM complication, t-test for independent samples was used.
Distribution of the genotype and allele frequencies in T2DM and healthy control groups, T2DM
and T2DM with complications were compared using chi-square test. The risk associations of DD
genotype and D allele with T2DM were assessed by the odd ratio at 95% confidence interval
(CI). Relationships between the ACE genotypes and clinical variables were compared with one-
way analysis of variance (ANOVA).
4.9 Ethical Consideration
The study protocol was approved by the college of natural and computational sciences ethical
committee of the University of Gondar on its meeting held on 11/08/08 ethical clearance. To take
care and keep confidentiality of participants result, written informed consent was obtained from
all study participants before collecting of blood sample.

30
5. RESULTS
5.1 Demographic, Clinical and Biochemical Characteristics between T2DM and
Healthy Controls.
The demographic parameter of study subjects is given in Table 1. There was no statistically
significant variation between cases and controls in respect to age and sex. Among cases, 55 were
men and 56 were women, (P 0.789), their mean age was 54.6±12.2 years. The control group
consisted, 55 men and 56 women their mean age was 54.0±14.4 years, (P 0.811). The clinical
characteristics systolic blood pressure (SBP), diastolic blood pressure (DBP), glucose, total
cholesterol, triglycerol and urea have shown a significant difference (P < 0.001), BMI (P < 0.05)
and creatinine (P < 0.02) higher in T2DM than control group. However, eGFR was not
significantly differed between the two groups (P 0.052).
Table 1: Demographic, Clinical and biochemical characteristics of T2DM patients and healthy controls
Variables T2DM Control P value
Subject (n) 111 111 ------
Gender (M/F) 55/56 55/56 0.789
Age (yr) 54.7±12.3 54.3±14.4 0.811
BMI(kg/m2) 24.9±4.4 23.6±5.4 0.049
SBP(mmHg) 133.7±19.5 121.2±6.9 0.000
DBP(mmHg) 82.6±13.6 76.4±5.5 0.000
Glucose(mg/dl) 206.3 ±72.3 78.2 ±15.6 0.000
TC(mg/dl) 194.81±47.6 130.4 ±48.9 0.000
TG(mg/dl) 177.5 ±135.3 99.6 ±56.7 0.000
Creatinine(mg/dl) 0.7 ±0.2 0.6 ±0.1 0.010
Urea(mg/dl) 22.2 ±8.3 18.8± 4.6 0.000
eGFR 118.4 ±27.1 124.7 ±20.2 0.052
Data expressed as means ± SDP<0.05 were considered as significant and P> 0.05 (not significant) Note: BMI: Body mass index.
SBP: Systolic blood pressure. DBP: Diastolic blood Pressure. TC: Total cholesterol, TG: Triglycerol, eGFR: Estimated
glomerular filtration rate.
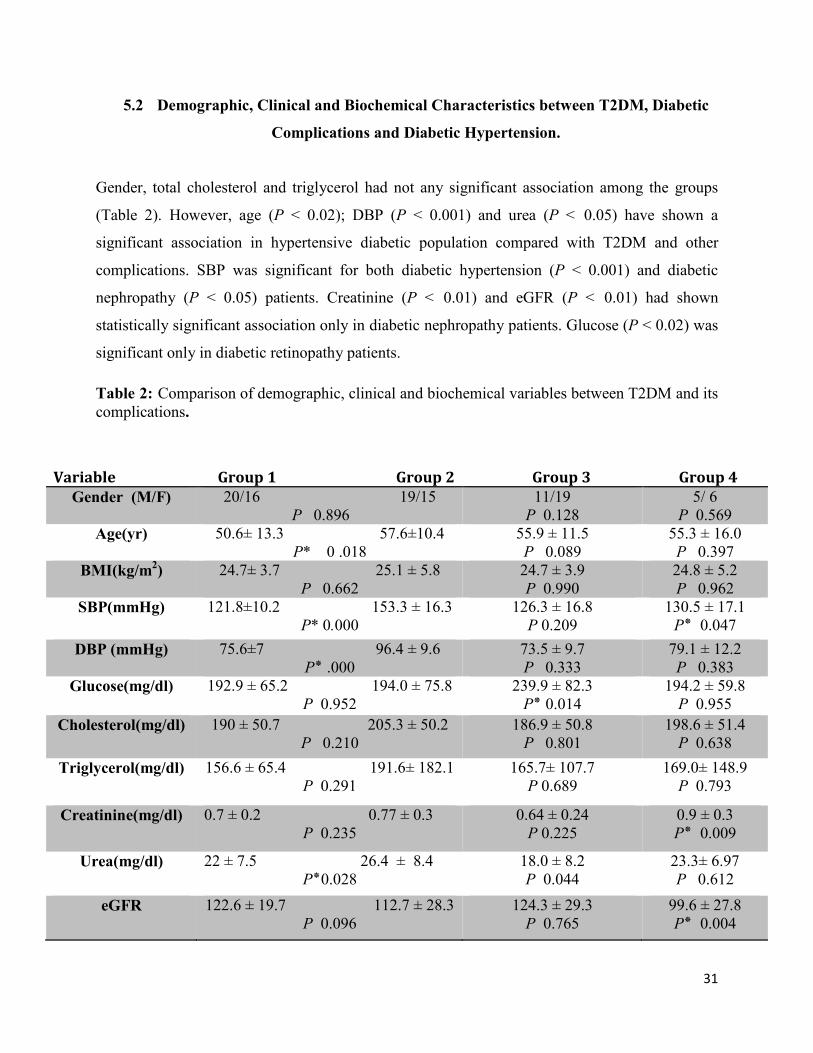
31
5.2 Demographic, Clinical and Biochemical Characteristics between T2DM, Diabetic
Complications and Diabetic Hypertension.
Gender, total cholesterol and triglycerol had not any significant association among the groups
(Table 2). However, age (P < 0.02); DBP (P < 0.001) and urea (P < 0.05) have shown a
significant association in hypertensive diabetic population compared with T2DM and other
complications. SBP was significant for both diabetic hypertension (P < 0.001) and diabetic
nephropathy (P < 0.05) patients. Creatinine (P < 0.01) and eGFR (P < 0.01) had shown
statistically significant association only in diabetic nephropathy patients. Glucose (P < 0.02) was
significant only in diabetic retinopathy patients.
Table 2: Comparison of demographic, clinical and biochemical variables between T2DM and its complications.
Variable Group 1 Group 2 Group 3 Group 4
Gender (M/F) 20/16 19/15 P 0.896
11/19 P 0.128
5/ 6 P 0.569
Age(yr) 50.6± 13.3 57.6±10.4 P* 0 .018
55.9 ± 11.5 P 0.089
55.3 ± 16.0 P 0.397
BMI(kg/m2) 24.7± 3.7 25.1 ± 5.8 P 0.662
24.7 ± 3.9 P 0.990
24.8 ± 5.2 P 0.962
SBP(mmHg) 121.8±10.2 153.3 ± 16.3 P* 0.000
126.3 ± 16.8 P 0.209
130.5 ± 17.1 P0.047 ٭
DBP (mmHg) 75.6±7 96.4 ± 9.6 P000. ٭
73.5 ± 9.7 P 0.333
79.1 ± 12.2 P 0.383
Glucose(mg/dl) 192.9 ± 65.2 194.0 ± 75.8 P 0.952
239.9 ± 82.3 P0.014 ٭
194.2 ± 59.8 P 0.955
Cholesterol(mg/dl) 190 ± 50.7 205.3 ± 50.2 P 0.210
186.9 ± 50.8 P 0.801
198.6 ± 51.4 P 0.638
Triglycerol(mg/dl) 156.6 ± 65.4 191.6± 182.1 P 0.291
165.7± 107.7 P 0.689
169.0± 148.9 P 0.793
Creatinine(mg/dl) 0.7 ± 0.2 0.77 ± 0.3 P 0.235
0.64 ± 0.24 P 0.225
0.9 ± 0.3 P0.009 ٭
Urea(mg/dl) 22 ± 7.5 26.4 ± 8.4 P0.028٭
18.0 ± 8.2 P 0.044
23.3± 6.97 P 0.612
eGFR 122.6 ± 19.7 112.7 ± 28.3 P 0.096
124.3 ± 29.3 P 0.765
99.6 ± 27.8 P0.004 ٭
32
Data expressed as means ± SD, P<0.05 were considered as significant and P> 0.05 (not significant). Note: Group 1 , type 2
diabetes; group 2, type 2 diabetes with hypertension; group 3, type 2 diabetes with retinopathy and group 4, type 2 diabetes with
nephropathy. Group 1, was compared with group 2, 3 and 4.
5.3 ACE Genotype distribution in T2DM Patients and Healthy Controls
The ACE genotypes frequency distribution in patients with type 2 diabetes and healthy control is
given in table 3. The ACE DD genotype and D allele were more frequent in diabetic patients
(64.2% and 79.3 %) as compared to controls (35.6% and 59.9%). The frequency of homozygous
DD genotype in type 2 diabetic patients was twofold higher than healthy control group (OR,
2.984: CI 1.332 – 6.689). D allele was five times than I allele in diabetic patients (OR, D 2.178;
CI: 1.168 – 3.232 P < 0.001) compared to healthy controls (I OR, 0.459; CI: 0.309 – 0.681 P <
0.001). However, ACE genotype I/D and II were less frequent in T2DM patients (31.4% and
37.5%) in comparison to healthy controls (69.0% and 62.5 %).
Table 3: Distribution of ACE genotypes and allele frequencies between T2DM and Healthy
Control participants.
P < 0.001 (statistically significant)
Genotype T2DM Control OR OR 95% CI P
DD 77 (64.2%) 42 (35.6%) 2.984 1.332 - 6.689
0.008
ID 22 (31.4%) 49 (69.0%) 0.7641 0.318 - 0.834
0.547
II 12 (37.5%) 20 (62.5 %)
P-value .000 X2 21.290a
Allele frequencies
D 176 (79.3 %) 133(59.9%) 2.178 1.468 - 3.232 0.000
I 46 (20.7 %) 89 (40%) 0.459 0.309 - 0.681 0.000
P-value 0.000 X2 22.562a

33
5.4 Association of ACE I/D Genotype with Clinical and Biochemical Characteristics of
T2DM and Healthy Controls.
The ACE DD genotype was highly associated with the clinical variables than I/D and II
genotypes. SBP (131.5±18.9 VS 123.2±8.3 and 121.3±10.7), glucose (168.2±86.8 Vs 110.5±61.9
and 114.7±75.6), total cholesterol (179.2±56.8 Vs 141.2±57.1 and 145.0±42.7), triglycerol
(167.5±136.3 Vs 102.4±51.8 and 109.3±53.9) and urea (22.7±7.6 Vs 17.9±5.1 and 17.8±4.3) had
P < 0.001, DBP (81.9±12.4 Vs 77.4±6.5 and 75.2±9.6) (P < 0.01) and BMI (24.9±4.4 Vs
24.2±5.8 and 22.0±4.3) (P < 0.02) respectively (Table 4).
Table 4: One-way ANOVA analysis of clinical and biochemical characteristics according to ACE genotype in T2DM and healthy controls.
Data expressed as means ± SD, P<0.05 were considered as significant and P> 0.05 (not significant) Note: SBP, systolic blood
pressure; DBP, diastolic blood pressure; Glu, glucose, TC, total cholesterol; TG, Triglycerol; CRT, creatinine; eGFR, estimated
glomerular filtration rate; BMI, body mass index.
Genotype
result
Age SBP DBP Glu TC TG CRT Urea eGFR BMI
DD 54.9±12.8
131.5±18.9
81.9±12.4
168.2±86.8
179.2±56.8
167.5±136.3
.697±.24
22.7±7.6
120.2±27.8
24.9±4.4
ID 54.6±14.2
123.2±8.3
77.4±6.5
110.5±61.9
141.2±57.1
102.4±51.8
.644±.2
17.9±5.1
122.9±18.4
24.2±5.8
II 52.3±13.9
121.3±10.7
75.2±9.6
114.7±75.6
145.0±42.7
109.3±53.9
.699±.18
17.8±4.3
123.6±19.5
22.0±4.3
p-value .610 .000 .001 .000 .000 .000 .257 .000 .663 .014

34
5.5 ACE Genotype Distribution in T2DM, Diabetic Complications and Diabetes with
Hypertension.
As shown in Table 5, the frequency distribution of ACE genotypes and alleles among T2DM and
its complications were indicated. The frequency of ACE DD genotype (41.6%, 28.6%, 19.5%,
and 10.4%, P < 0.01) and D allele (60.4%, 44.1%, and 37.8% and 18.0%, P < 0.001) was more
frequent in T2DM patients with hypertensive and diabetic retinopathy complication than T2DM
without complication and diabetic nephropathy patients respectively.
Table 5:Frequency of ACE I/D genotype and allele polymorphism T2DM and diabetic complications.
P< 0.05 (Statistically significant)
Genotype T2DM without
complication
Diabetic
hypertension
Diabetic
Retinopathy
Diabetic with Nephropathy
DD 15 (19.5.0%) 32 (41.6%) 22 (28.6%)
8(10.4%)
ID 12 (54.5%) 3 (13.6 %) 5 (22.7%) 2(9.3%)
II 7 (58.3%) 0(.0%) 3 (25.0%) 1(8.3%)
P-value 0.002 X2- 20.713a
D allele 42 (37.8%) 67(60.4%)
49 (44.1%) 20 (18.0%)
I allele 26 (23.4%) 3 (2.7%) 14 (12.6%) 4 (3.6 %)
p-value 0.000 X2 34.892a

35
5.6 One way ANOVA of ACE Genotype Distribution to the Associated Risk Factors
among T2DM and Diabetic Complications
The companied one way ANOVA of clinical characteristics of T2DM and its complication with
respect to ACE genotype indicated in Table 6. There had no any significance difference in
glucose, diabetic duration, BMI, triglycerol, creatinine and eGFR among type 2 diabetes and its
complications. Whereas age (56.6±11.2, P < 0.04), SBP (138.4±21.2, P < 0.01), DBP (84.2 ±
14.0, P < 0.01), total cholesterol (203.7±45.3, P < 0.01), urea (24.5 ± 8.5, P < 0.001) were
significance different among the groups.
Table 6: Companied one- way ANOVA distributions of ACE I/D genotype and clinical
characteristics among T2DM, DR, DN and diabetic with hypertension.
Data expressed as means ± SD, P<0.05 were considered as significant and P> 0.05 (not significant) Note: SBP, systolic blood
pressure. DBP, diastolic blood pressure. eGFR estimated glomerular filtration rate.
Genotyp
e result
Age
BP
DBP
Glucose
Total cholestrol
Triglycerol
Creatinine
Urea
eGFR
BMI
Duration of diabetes
DD 56.6±11.2
138.4±21.2
84.2 ± 14.0
215.3±71.5
203.7±45.3
186.1±149.2
0.74 ± 0.26
24.5 ± 8.5
115.2 ± 27.1
24.7± 4.9
8.1 ± 4.7
ID 52.9±12.5
125.0±12.2
79.1±12.1
178.2±60.5
186.0 ± 55.8
144.9 ± 51.8
0.72± 0.23
17.8 ± 6.8
116.6 ± 19.5
25.3 ± 3.7
8.5 ± 4.3
II 47.3±17.0
121.0 ±9.8
72.3±5.8
193.9 ±108.1
148.8 ± 53.5
123.4 ±63.2
0.69 ± 0.26
16.9 ± 6.4
133.7±32.3
25.5 ± 4.3
6.8 ± 3.6
p-value 0 .037 0.001 .008 0.105 0.001 0.171 0.842 0.000 0.081 0.777 0.596

36
Table 7: Shows ACE genotype distribution regarding to clinical variables with a comparison of
T2DM to its complications. eGFR, creatinine, triglycerol, body mass index, and gender did not
show statistically significance variation between T2DM and its complication respect to ACE
genotype (P > 0.05). Age has shown statistically significant association in patients having
diabetic hypertension DD genotype (56.8 ± 11.0, P < 0.05). Similarly, systolic and diastolic
blood pressure indicated statistically significant association in diabetic hypertension of DD
genotype (P < 0.001 and P < 0.01) respectively. Urea was significant in all complication and had
highest x±s was recorded among DD genotype (26.6 ± 8, P <0.01), (22.4 ± 8.6 P < 0.02), (25.6 ±
7.3 P < 0.01) in diabetic with hypertension, retinopathy and nephropathy. There was no
statistically significant association between glucose level and ACE I/D genotypes among diabetic
hypertension individuals. However, DD genotype individuals among diabetic retinopathy (P <
0.02) and nephropathy (P < 0.05) showed statistically significant variations to the level of
glucose. Total cholesterol level indicated statistically significant association in diabetic
retinopathy patients DD genotype (DD 200.6 ± 42.6, ID 184.3 ± 53.3, II 147.8 ± 56, P < 0.01).
Table 7: One- way ANOVA ACE genotype distribution and clinical characteristics in
comparison to T2DM to its complications.
Variable
T2DM Vs Diabetic Hypertension
T2DM Vs Diabetic Retinopathy
T2DM Vs Diabetic Nephropathy
Sex (F/M) 15/20 P 0.147
16/19 P 0 .178
6/ 5 P 0.064
Age DD ( 56.8 ± 11.0) ID ( 49.1 ± 11.7) II ( 49.2 ± 17.3) P 0.049
DD (55.2 ± 11.2) ID (51.9 ± 12.9) II (49.1 ± 16.6) P 0.329
DD (55.2 ± 12.2) ID (50.3 ± 13.7) II (47.1 ± 17.9) P 0.277
BMI DD (24.8 ± 5.2) ID (26.2 ± 4.2) II (24.6 ± 3.9) P 0.593
DD (24.5 ± 3.7 ) ID(24.7 ± 3.7) II (25.8 ± 4.4) P 0.647
DD (24.9 ± 4.4) ID (25.0 ± 3.9) II (24.4 ± 3.7) P 0.940
Systolic DD ( 144.4 ± 20.3) ID ( 126.3 ± 14.3) II ( 118.4 ± 10.2) P* 0 .000
DD (125.7 ± 16.4) ID(122.9 ± 8.5) II (119.7 ± 9.2) P 0.428
DD (125.9 ± 14.7) ID (123.2 ± 8.9) II (120.2 ± 11.0) P 0 .508

37
Data expressed as means ± SD, P<0.05 were considered as significant and P> 0.05 (not significant) Note: T2DM, type 2 diabetes
mellitus. BMI, body mass index. eGFR, estimated glomerular filtration rate.T2DM was compared with T2DM with hypertension,
retinopathy and nephropathy.
Diastolic DD ( 89.3 ± 13.2) ID ( 83.7 ± 11.3) II ( 70.9 ± 6.2 ) P0.001 ٭
DD (74.5 ± 9.2) ID (76.8 ± 7.5) II (71.6 ± 5.5) P 0.270
DD (76.7 ± 9.4) ID (78.6 ± 7.4) II (72.0 ± 6.6) P 0.177
Glucose DD ( 202.6 ± 73.7) ID (189.8 ± 61.3) II ( 139.9± 35.2 ) P 0.061
DD (237.8 ± 66.2) ID (180.2 ± 57.5) II (184.6 ± 108.2) P* 0.012
DD (214.4 ± 58.9) ID (177.8 ± 60.1) II (157.2 ± 61.6) P* 0.038
Cholesterol DD ( 206.15 47.532 ) ID ( 183.00 62.761 ) II ( 166.50 35.765 ) P 0.065
DD (200.6 ± 42.6) ID (184.3 ± 53.3) II (147.8 ± 56) P* 0.008
DD (201.9 ± 53.0) ID (187.4 ± 54.8) II (165.7 ± 33.5) P 0 .195
Triglycerol DD ( 185.8 ± 161.1 ) ID ( 155.7 ± 58.2 ) II ( 137.3 ± 62.9 ) P 0.557
DD(179.2 ± 100.5) ID (145.9 ± 49.3) II (120.6 ± 65.3) P 0.101
DD(172.0 ± 115.8) ID (150.6 ± 50.9) II (139.4 ± 59.2) P 0.609
Creatinine DD (0 .7 ± 0.3 ) ID ( 0.71 ± 0.2 ) II ( 0.8 ± 0.16 ) P 0.762
DD (0.7 ± 0.3) ID (0.7 ± 0.2) II (0.8 ± 0.8) P 0.869
DD (0.7 ± 0.2) ID (0.8 ± 0.2) II (0.8 ±0.2) P 0.856
Urea DD ( 26.6 ± 8 ) ID ( 19.1 ± 7.6 ) II ( 18.5 ±5.1 ) P0.001٭
DD (22.4 ± 8.6) ID (17.2 ± 5.8) II (16.3 ± 6.2) P* 0.018
DD (25.6 ± 7.3) ID (18.4 ± 6.2) II (19.1± 5.0) P* 0.004
eGFR DD ( 115.8 ± 27.5 ) ID ( 119.8 ± 15.9 ) II ( 122.1 ± 19.7 ) P 0.729
DD (122.2 ± 25.3) ID (118.312 ± 11) II (133.4 ± 33.9) P 0.271
DD (114.3 ± 27.4) ID (115.6 ± 20.1) II (123.8 ± 19.1) P 0.593
Diabetic duration
DD (7.6 ± 4.5) ID (7.07 ± 3.8) II (7.3 ± 3.5) P 0.909
DD (7.5 ± 4.7) ID (8.9 ± 4.3) II (7.5 ± 3.2) P 0.506
DD (6.7 ± 3.9) ID (8.4 ± 3.7) II (6.6 ± 3.9) P 0 .376

38
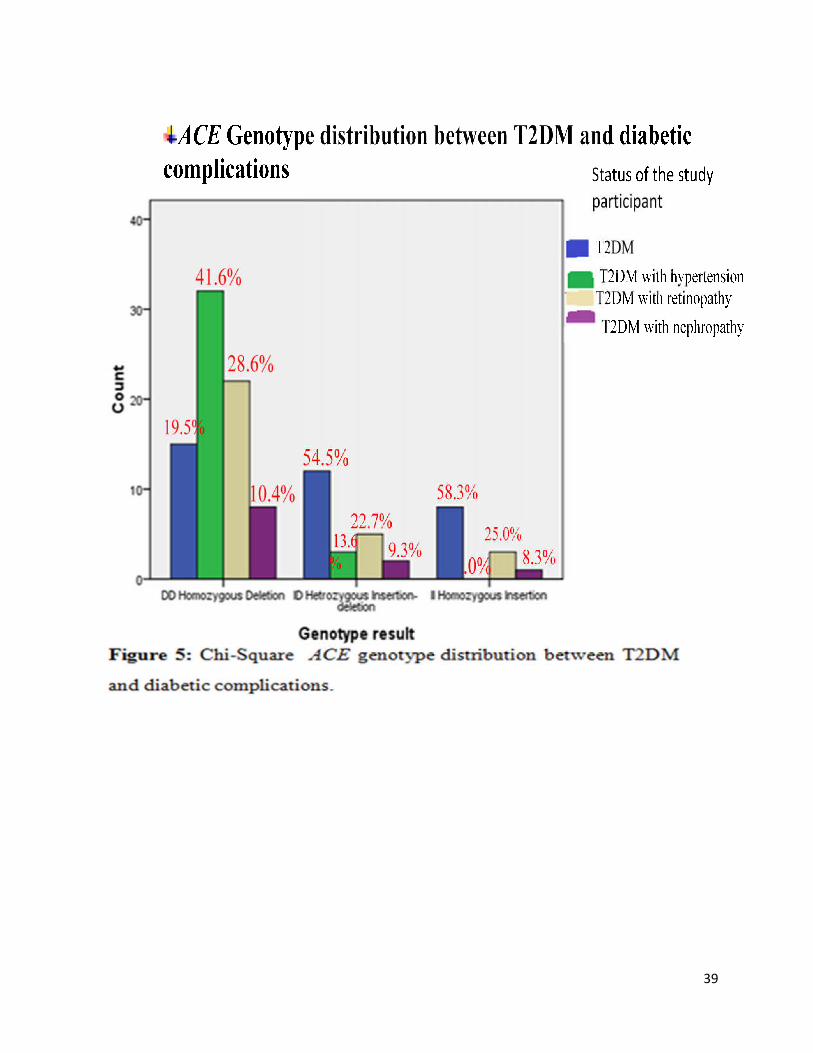
39
40
6. DISCUSSION
Type 2 diabetes mellitus is a metabolic disorder of chronic disease that leads to the development
of micro and macrovascular complications such as DR, DN, diabetic neuropathy and
cardiovascular disease (Tesfaye & Gill, 2011; Al-Khawlani et al., 2010 and Michael, 2008).
Hypertension is the most common risk factor of diabetes mellitus. Genetic or non-genetic factors
are able to predispose to diabetes and facilitate the progress of diabetic complications, as
reported by different authors (Vivian et al., 2010; Holt, 2004 and Strojek et al., 1997). The non-
genetic risk factors such as BMI, age (oldest age), life style, smoking, dyslipidemia, and
environmental factors are the most common risk factors for T2DM, diabetic complications and
diabetic hypertentions (Viswanathan et al., 2012; Bakris, 2011; Roaeid and Kadiki. 2011; Haque
et al., 2010 and Hribal et al., 2002). There are many candidate genetic variants associated to the
occurrence of T2DM (Singh, 2011). However, genes of the RAAS such as renin,
angiotensinogen (AGT), angiotensin-1 converting enzyme (ACE), angiotensin converting enzyme
2 (ACE2), aldosterone synthase (CYP11B2), angiotensin II type 1(AT1R) and type 2 (AT2R)
receptors all of these genes or genetic loci responsible for excess Ang II production and Ang II
has the most common physiological effect on T2DM, diabetic complication and diabetic
hypertension (Hsueh and Wyne, 2011 and Zhou and Schulman, 2009).
The ACE I/D polymorphism has a potential link to diabetes and able to assist the progross of
diabetes to microvascular complications, macrovascular complications and hypertention (Saleem
et al., 2015; Zhou et al., 2013 and Schmidt et al., 1995). However, the ACE gene polymorphism
and risk of T2DM has conflicting reports. In this study, ACE gene polymorphism and associated
risk factors in patients with T2DM, diabetic complication and diabetic hypertension with a
healthy control group were studied. It was found that the frequency of DD genotype as well as D
allele has shown statistically significant increase in diabetic patients in comparison to healthy
control groups (64.2% and 79.3% Vs 35.6 and 59.9% P < 0.001) respectively as shown in Table
3 and Figure 4. DD genotype carriers have shown more than twofold increased risk of
developing T2DM as compared to II genotype carriers (OR: 2.984, CI: 1.332 - 6.689, P < 0.02).
D allele was five times higher than I allele associated to diabetic patients than healthy controls
(OR, D 2.178; CI: 1.168 – 3.232 P < 0.001 Vs I OR, 0.459; CI: 0.309 – 0.681 P < 0.001). This
finding is in agreement with some other studies, which indicated DD genotype is associated with

41
high increased risk of T2DM and D allele has high relative risk towards developing type 2
diabetes mellitus (Ali-Bahar et al., 2014; Zarouk et al., 2009; Nikzamir et al., 2008; Yang et al.,
2006; Stephens et al., 2005; Ergen et al., 2004 and Hsieh et al., 2000) and while others reported
that there was no association between ACE DD genotype and T2DM (Choudhry et al., 2012;
Chmaisse et al., 2009 and Degirmenci et al., 2005). The risk factors such as mean SBP, DBP,
total cholesterol (TC), triglycerol (TG), fasting blood glucose (FBG), creatinine and urea (P <
0.001), and BMI (P < 0.05) has shown statistically significant difference in cases as compared to
healthy control groups (Table 1). This is similarity with other studies where SBP, DBP, TC, TG,
FBG level, creatinine and urea contents showed statistically significant association to T2DM
patients than healthy control study groups (Nikzamir et al., 2008; Yang et al., 2006 and Ergen et
al., 2004). The study in Brazil is also similar with the current study indicated that FBG,
dyslipidemia (TC and TG) are highly prevalence in T2DM patients (Carolino et al., 2008).
Whenever the genotype distribution and these clinical parameters were compared, there were
statistically significant association between the DD genotype holders and the amount of SBP,
TC, TG and urea (P < 0.001), DBP (P < 0.01), and BMI (P < 0.02) among T2DM patients
compared to healthy control groups having the same genotype holders (Table 4). This is disagree
with some other reports by Choudhry et al., (2012); Degirmenci et al., (2005) and Hsieh et al.,
(2000) indicated that clinical characteristic of T2DM patients such as age, BMI, SBP, DBP,
hemoglobin A1C (HbA1C), TC, TG, HDL cholesterol levels, duration of diabetes, FBG and
random blood sugar (RBS) level according to ACE I/D genotypes are no significance difference
(Choudhry et al., 2012; Degirmenci et al., 2005 and Hsieh et al., 2000). Similarly the study in
USA showed that BMI, waist, fat-free mass, and physical activity did not differ by ACE
genotype (Bonnet et al., 2008). On the other hand, in this study some of the clinical variables
such as age, FBG, creatinine and eGFR did not showed statistically significant association
towards ACE genotype holders between study case groups and healthy controls (Table 4). This is
harmony with the study in USA, age and fasting glucose are not associated with ACE gene
polymorphism, but 2-h glucose levels are higher in DD than ID and II subjects of T2DM (Bonnet
et al., 2008). Cigarette smoking is a risk factor for T2DM, diabetic complications and DD
genotype are greater risk (Sairenchi et al.,2004). However, in this study there were no any cases
that are smoking cigarettes.
42
Whenever the associations of ACE gene polymorphism with type 2 diabetic hypertension
patients were evaluated, in this study there were existed statistically significant association
between DD genotype and type 2 diabetic hypertension patients (41.6% Vs 19.5%) Table 5 and
Figure 5. This is in agreement with the previous study conducted in a south Indian population
(Anbazhagan et al., 2009), in south china population (Jiang et al., 2009), in Malaysian
population (Ramachandran et al., 2008) and in Iranian population (Nakhjavani et al., 2007)
which have indicated the existence of statistically significant association between the DD
genotype and D allele among diabetic hypertension patients whereas others did not found a
positive correlation between the DD genotype of ACE gene polymorphism and diabetic
hypertension patients (Tascilar et al., 2009 and Chuang et al., 1997). Another study conducted
on Turkish population also indicated no significant association between ACE gene
polymorphism and hypertension (Gunes et al., 2004). This variation is may be due to ethnic
factors (Saab et al., 2007) and environmental background (Ono et al., 2003). Among the
clinical/biochemical risk factors, including SBP (P < 0.001), DBP (P < 0.01), age and urea (P <
0.05) were significantly associated in diabetic hypertension patients compared with T2DM
patients. This is in agreement with other reports found that age and SBP is high in the affected
population (Alsafar et al., 2015 and Roaeid and Kadiki, 2011). The other risk factors including
BMI, TC, TG, creatinine, FBG and duration of diabetes were no significance association in
diabetic hypertension compared with T2DM. This is in agreement with the studies by
Ramachandran et al., (2008) and Nakhjavani et al., (2007) indicated that BMI, TC, TG, LDL,
HDL and FBG level are no significance difference between type 2 diabetic hypertension and
T2DM (Ramachandran et al., 2008 and Nakhjavani et al., 2007). The other report also indicated
that BMI and TC are no significance variation between diabetic hypertension and non diabetic
hypertension group (Mengesha, 2007). On the other hand, the present finding is dissimilar with
other reports found that TG, creatinine and duration of diabetes are associated with type 2
diabetic hypertension compared to non hypertension T2DM (Mengesha, 2007 and Nakhjavani et
al., 2007). When comparing the association of risk factors and ACE gene polymorphism; DD
genotypes of diabetic hypertension patients were highly affected by SBP, DBP and age
compared with T2DM patients. This result is in agreement with other study, which showed
diabetic patients >50 years of age have had double risk of developing diabetic complication than
younger counter parts < 50) (Roaeid and Kadiki, 2011). While other risk factors in the present

43
study such as BMI, TC, TG, FBG, creatinine and urea regarding to ACE gene polymorphism did
not show significance variation between diabetic hypertension and T2DM. This is dissimilar
with the report of Zhou et al. (2013) found that TG level is higher in the ID and DD genotype
than II genotype carriers, but level of FBG is similar with the present finding indicated that FBG
level had no different on ACE gene polymorphism between type 2 diabetic and diabetic
hypertension (Zhou et al. 2013).
Regarding to diabetic retinopathy, Angiotensin II gene has been reported to play a role in the
progress of retinopathy by stimulation of growth factors such as vascular endothelial growth
factor, platelet-derived growth factor and connective tissue growth factor (Wilkinson-Berka.,
2006). In the present study, the frequency of DD genotype was high in diabetic retinopathy
patients when computed against T2DM patients without complications (28.6% Vs 19.5%) as
shown in Table 5 and Figure 5. This result is in complete harmony with other similar studies
conducted elsewhere like in Turkey, where DD genotype was an independent risk factor in DR
patients (Kutluturk et al., 2014), and in Chaina, a Meta analysis study; DD genotypes increase
the risk of developing DR (Lu et al., 2012 ). While the other report in china indicated that ACE
gene polymorphism has no difference in diabetic retinopathy patients (Khan et al., 2015). On the
other hand the recent report in Pakistan opposed the present study and indicated that ID genotype
individuals are at risk for DR (Saleem et al., 2015). Whenever in the present study the role of
two genotypes (ID and II) of ACE gene polymorphism were analyzed towards risk of DR among
T2DM patients, they did not show significant association. The clinical/biochemical
characteristics glucose (P < 0.014) and urea (P < 0.004) were associated in DR patients as
compared to T2DM shown in Table 2. This result is dissimilar with reports from China; fasting
plasma glucose has no significant difference between DR and diabetic non retinopathy groups
(DNR), but blood urea nitrogen is associated with DR than in DNR group (Meng et al., 2015).
Other clinical/biochemical characteristics such as gender, age, BMI, SBP, DBP, creatinine,
eGFR, total cholesterol and triglycerol did not show statistically significant association in DR
patients as compared to T2DM shown in Table 2. This is harmony with the report of Meng et al.,
(2015) showed that age, BMI and triglycerol no statistically significant differences between the
DR and DNR groups (Meng et al., 2015). However, the other studies shown a significant
association of BMI, SBP, triglycerides cholesterol, total cholesterol and duration of diabetes in
patients with DR (Meng et al., 2015; Rani et al., 2009 and Al-Shammari et al., 2005). When the

44
genotype distribution and these clinical parameters were compared, there were statistically
significant association between the DD genotype holders and the amount of glucose, total
cholesterol and urea in DR patients compared with DNR patients with the same genotype
holders. This is in agreement with other report; high total cholesterol is associated risk factor for
the development of DR (Hussain et al., 2013). While, the other parameters did not show
statistically significant association towards DD genotype holders between DR and T2DM
patients Table 7.
In diabetic nephropathy, Sample size was not enough in patients having DN, to assess the
association of clinical characteristics and ACE gene polymorphism with the severity of
nephropathy in the current study. This is not surprise, because, similarly the report in the
northern part of Ethiopia, diabetic clinic at Mekelle Hospital indicated that among 105 diabetic
patients only 2% of them had diabetic nephropathy (Gill et al., 2008). However, within the
existing sample size of the current study, the risk factors including SBP (P < 0.05), creatinine (P
< 0.01) and eGFR (P < 0.01) were associated with DN patients. This result is harmony with
other reports showed that high blood pressure (BP) associated with DN is known to worsen renal
function, that initiate and accelerate DN When a patient develops persistent proteinuria and
elevated arterial BP, kidney function starts to decline as a result of decreased eGFR among
progressors with elevated SBP compared to non progressors (Viswanathan et al., 2012). Serum
creatinine is a risk factor among progressors DN compared to non-progressors of T2DM which
leads to the occurrence of DN (Viswanathan et al., 2012). Similarly another study revealed that
elevated BP, SBP but not DBP was a risk factor for the development of diabetic nephropathy
(Kasper et al., 2004). The other studies also indicated that SBP, creatinine and eGFR are
associated with the development of diabetic nephropathy (Fontela et al., 2014, Shlomo et al.,
2011 and Degirmenci et al., 2005). However, these risk factors did not associated with ACE gene
polymorphism in DN patients. On the other hand, risk factors such as glucose and urea has
statistically significant association with DD genotype of DN patients (DD: 214.4 ± 58.9, ID:
177.8 ± 60.1 and II: 157.2 ± 61.6 P < 0.05) and (DD: 25.6 ± 7.3, ID: 18.4 ± 6.2 and II 19.1± 5.0
P < 0.01) respectively. This is similar with the study in Austria; poor glycemic control is
associated with ACE-D allele, a major risk factor for the development of diabetic nephropathy
(Barnas et al., 1997). The other study also indicated that fasting glucose, post-prandial glucose
levels and serum urea are higher in progressors of diabetic kidney complication compared to

45
non-progressors of T2DM patients (Viswanathan et al., 2012). On the other hand, blood glucose
has no direct effect upon kidney disease but has an indirect effect through serum creatinine
(Ahmad et al., 2014). The other risk factors such as age, TC and TG were not associated with
DN either independently as a risk factor or associated with ACE gene polymorphism. This is
harmony with other studies age, serum total cholesterol and LDL cholesterol are not associated
with diabetic nephropathy ( Shen et al., 2008). However, TG is an independent risk factor for
diabetic nephropathy ( Shen et al., 2008).
46
7. CONCLUSION
In conclusion, the present study indicated that ACE gene of DD genotype and D allele have been
associated with high risk of diabetes and diabetic complications in diabetes patients (OR:DD
2.984, CI: 1.332 - 6.689, P < 0.02 and D 2.178; CI: 1.168 – 3.232 P < 0.001 Vs I, 0.459; CI:
0.309 – 0.681 P < 0.00). Moreover, this genotype and allele was associated with some of the
clinical Parameters such as age, SBP, DBP, glucose, total cholesterol and urea. Type 2 diabetes
mellitus patients having DD genotype have had high relative risk of getting diabetic
complication as compared to ID and II genotype holders. The frequency of DD genotype was
high in diabetic hypertension and diabetic retinopathy patients than T2DM without complication
and diabetic nephropathy. The genotype (ID and II) and I allele in the healthy control group were
high as compared to the cases. Similarly, ID and II genotype in the study subjects (cases) had
less risk of developing diabetic complications as compared to cases with the DD genotype.
Some of the associated risk factors, DD genotype and both risk factors and DD genotype were
associated to T2DM and its complications, which indicates the need for doing a similar study
with a larger sample size to unravel the independent associated risk factors and ACE gene
between T2DM and diabetic complication.

47
8. LIMITATIONS OF THE STUDY
This study has some limitations:
Sample size was not enough in patients having diabetic nephropathy, to assess the relation of
clinical characteristics and ACE gene polymorphism with the severity of nephropathy. The assay
for LDL and HDL could not done, those tests could have given a better estimate of lipoproteins.
The tests were used only one primer for the detection ACE genotype I/D, it is better to use a
second primer after electrophoresis to increase the specificity of DD genotyping.
48
9. RECOMMENDATIONS
Based on the present result of this study the following recommendations are forwarded
Early diagnosis is very much essential for better treatment out come and avoid
complications, thus it is advisable to the general population to conduct periodic diabetic
test. Because during sample collection from healthy control groups, 5 individuals had
hypertension and 9 individuals had hyperglycemia
To use DD genotype as a marker for risk of Diabetic similar studies on the same and
different population are warranted with large sample size.
However, depending on the present finding all diabetes patients are best treated with ACE
inhibitor drugs to prevent the progress of diabetes individuals for further diabetic
complication.

49
10. REFERENCES
Abdulhakeem HA., Syed GAR. and Dawood AZA. 2012. Prevalence and Risk Factors of
Diabetic Nephropathy in Omani Type 2 Diabetics in Al-Dakhiliyah Region. Oman
Medical Journal., 27(3): 212–216.
Abebe SM, Berhane Y , Worku A and Assefa A. 2014. Diabetes mellitus in North West Ethiopia:
a community based study. BMC Public Health., 14(97): 3-6.
Abera E. 2000. Patterns of chronic complications of diabetc patients in Menilik II Hospital,
Ethiopia. Ethiopian. Journal of Health Dev., 1: 114–115.
Abhary S., Hewitt AW., Burdon KP. and Craig JE. 2009. A systematic meta-analysis of genetic
association studies for diabetic retinopathy. Diabetes.,58: 2137–2147.
Agarwal AK., Singla S., Garg U., Yadav R., Miglani S. and Jain AK. 2005. Glomerular
Filtration Rate and Total Kidney Volume in Cases of Recent Onset Type-2 Diabetes
Mellitus. JIACM., 6 (4): 286-288.
Ahluwalia TS., Khullar M., Ahuja M., Kohli HS., Bhansali A., Mohan V., Venkatesan R., Rai
TS., Sud K. and Signal PK. 2009. Common variants of inflammatory cytokine genes are
associated with risk of nephropathy in type 2 diabetes among Asian Indians. PloS one,
4(4): 2–4.
Ahmad W., Halim. and Zalila Ali. 2014. Exposure and Factors Influencing the Progression of
Diabetic Nephropathy AmongstType II Diabetes Mellitus Patients in Seremban, Negeri
Sembilan\n. Journal of Dental and Medical Sciences (IOSR-JDMS)., 13(2): 66–68.
Alemu F. 2015. Diabetes and Metabolism Prevalence of Diabetes Mellitus Disease and its
Association with Level of Education Among Adult Patients Attending at Dilla Referral
Hospital, Diabetes & Metabolism., 6(4): 4.
Alemu S. and Watkins P. 2004. Access to diabetes care in northern Ethiopia. Diabetics Voice.,
49(1):PP.8.
Ali-Bahar H., Mard-Soltani M., Bidoki SK. and Afzalzadeh R. 2014. Association of the
Genotypes of Angiotensin Converting Enzyme with the Type 2 Diabetes Mellitus
inKhuzestan Province, Iran. MBD, 1 (2): 99-100.
Al-Khawlani A., Atef ZA. and Al-Ansi1 A. 2010. Macrovascular complications and their
associated risk factors in type 2 diabetic patients in Sana ’ a city , Yemen. Eastern
Mediterranean Health Journal., 16(8):853–856.
Almdal T., Scharling H., Jensen JS., Vestergaard H. 2008. Higher prevalence of risk factors for
type 2 diabetes mellitus and subsequent higher incidence in men. Eur J Intern Med.,
19(1):40-5.
Al-rubeaan K., Yousef AM., Subhani SN., Ahmad NA., Al-Sharqawi AH., Al-Mutlaq HM.,
David SK.and Alnaqueb D. 2014. Diabetic Nephropathy and Its Risk Factors in a Society
with a Type 2 Diabetes Epidemic :A Saudi National Diabetes Registry-Based Study.

50
PLoSone., 9(2):3–8.
Al-Rubeaan K., Siddiqui K., Saeb ATM., Nazir N., Al-Naqeb D. and Al-Qasim S. 2013. ACE
I/D and MTHFR C677T polymorphisms are significantly associated with type 2 diabetes
in Arab ethnicity: a meta-analysis. Gene., 520(2):166–177.
Alsafar H., Hassoun A., Almazrouei S., Kamal W., Almaini M., Odama U, and Rais N. 2015.
Association of Angiotensin Converting Enzyme Insertion-Deletion Polymorphism with
Hypertension in Emiratis with Type 2 Diabetes Mellitus and Its Interaction with
Obesity Status. Disease Markers.,3.
Al-Sharmin A. and Munima H. 2016. Susceptible Factors of Type-2 Diabetes in a Population
of Bangladesh. Universal Journal of Public Health., 4 (1): 40-42.
Al-Shammari FKH., Al-Meraghi O., Al-Otaibi NAS. 2005. The Prevalence of Diabetic
Retinopathy and associated Risk Factors in Type 2 Diabetes Mellitus in Al-Naeem area
(Kuwait). Middle East Journal of Family Medicine., 3 (2)
Amartry NAA., Nsiah K. and Mensah FO. 2015. Plasma Levels of Uric Acid, Urea and
Creatinine in Diabetics Who Visit the Clinical Analysis Laboratory (CAn-Lab) at Kwame
Nkrumah University of Science and Technology, Kumasi, Ghana. Clinical and
Diagnostic Research., 9 (2):6-7.
Ambachew YKS., Tesfaye R., Tesfahun L., Amare H., Mehari A. and G/her G. 2015. Prevalence
of diabetes mellitus among patients visiting medical outpatient department of Ayder
referral hospital , Mekelle , Ethiopia : A three years pooled. International Journal of
Pharma Sciences and Research., 6(2): 435–439.
American College of Endocrinology Consensus Statement on Guidelines for Glycemic Control.
Endocrine Practice 2002., 8: 31-32. Available at:
https://www.aace.com/sites/default/files/d ccwhitepaper.pdf
Amini M. and Janghorbani M. 2007. Diabetes and Impaired Glucose Regulation in First-Degree
Relatives of Patients with Type 2 Diabetes in Isfahan , Iran : Prevalence and Risk Factors.
Rev Diabet Stud., 4:169–176.
Amos AF., McCarty DJ. and Zimmet P. 1997. The rising global burden of diabetes and its
complications: estimates and projections to the year 2010. Diabetic Medicine., 14: S7–8.
Anbazhagan K., Sampathkumar K., Ramakrishnan M., Gomathi P., Gomathi S. and Selvam GS.
2009. Analysis of polymorphism in renin Angiotensin system and other related genes in
south Indian chronic kidney disease patients. Clinica Chimica Acta., 406: 108-12.
Bakris GL. 2011. Recognition, Pathogenesis, and Treatment of Different Stages of Nephropathy
in Patients With Type 2 Diabetes Mellitus. Mayo Clinic Proceedings., 86(5): 444–452.
Bamanikar SA., Bamanikar AA. and Arora A. 2016. Study of Serum urea and Creatinine in
Diabetic and nondiabetic patients in a tertiary teaching hospital. JMR., 2(1): 12-15.

51
Barathmanikanth S., Kalishwaralal K., Sriram M., Ram KPS., Yong H., Eom S. and Gurunathan
S. 2010. Anti-oxidant effect of gold nanoparticles restrains hyperglycemic conditions in
diabetic mice. Journal of Nanobiotechnology., 8(16):8.
Barnas U., Schmidt A., Illievich A., Kiener HP., Rabensteiner D., Kaider A., Prager R.,
Abrahamian H., Irsigler K. and Mayer G. 1997. Evaluation of risk factors for the development
of nephropathy in patients with IDDM: insertion/deletion angiotensin converting
enzyme gene polymorphism, hypertension and metabolic control. Diabetologia., 40: 330.
Barry IF., Pamela JH., Meredith A., Bostrom ME., Comeau J., Anthony JB., Jeffrey BK., Cheryl
AW., George WN. and Donald WB. 2009. Non-muscle myosin heavy chain 9 gene
MYH9 associations in African Americans with clinically diagnosed type 2 diabetes
mellitus-associated ESRD. Nephrol Dial Transplant., 24: 3367–3369.
Bhalerao SD., Somannavar M., Vernekar SS., Ravishankar R. and Goudar SS. 2014. Risk factors
for type 2 diabetes mellitus in rural population of north karnataka: a community-based
cross sectional study. Int. J. Pharm. Med. & Bio. Sc., 3(1): 5-8.
Bindom SM., Hmid-Boulares HA., Xia H. and Lazartigues E. 2010. Angiotensin I – Converting
Enzyme Type 2 (ACE2) Gene Therapy Improves Glycemic Control in Diabetic Mice.
Diabetes., 59: 2542-2545.
Bjornholt JV., Erikssen G., Liestol K., Jervell J. and Thaulow EEJ. 2000. Type 2 diabetes and
maternal family history: an impact beyond slow glucose removal rate and fasting
hyperglycemia in low-risk individuals? Results from 22.5 years of follow-up of healthy
nondiabetic men. Diabetes Care., 23(9): 1255–9.
Bonnet F., Patel S., Laville M., Balkau B., Favuzzi A., Monti LD., Lalic N. and Walker M. 2008.
Influence of the ACE gene insertion/deletion polymorphism on insulin sensitivity and
impaired glucose tolerance in healthy subjects. Diabetes Care., 31(4), pp.791–792.
Brown V., Alemu S. and Watkins P. 1998. Diabetes in Ethiopia: overcoming the problems of
care delivery. Journal of Diabetes Nursing., 2(1):29.
Carey RM. and Siragy HM. 2003. Newly Recognized Components of the Renin-Angiotensin
System : Potential Roles in Cardiovascular and Renal Regulation. Endocrine Reviews.,
24(3): 261–271.
Caro JF., Ittoop O., Pories WJ., Meelheim D., Flickinger EG., Thomas F., Jenquin M., Silverman
JF., Khazanie PG. and Sinha MK. 1986. Studies on the Mechanism of Insulin Resistance
in the Liver from Humans with Noninsulin-dependent Diabetes. J. Clin.Invest., 78: 249-
258.
Carolino IDR., Molena-Fernandes CA., Tasca RS., Marcon SS. and Cuman RKN. 2008. Risk
factors in patients with type 2 diabetes mellitus. Rev Latino-am Enfermagem., 16(2):238-
44.

52
Chiu KC. and McCarthy JE. 1997. The insertion allele at the angiotensin I-converting enzyme
gene locus is associated with insulin resistance. Metabolism: clinical and experimental.,
46(4): 396.
Chmaisse HN., Jammal M., Fakhoury H. and Fakhoury R. 2009. A Study on the Association
between Angiotensin-I Converting Enzyme I/D Dimorphism and Type-2 Diabetes
Mellitus. Saudi J Kidney Dis Transpl., 20(6):1042-1043.
Choudhry N, Nagra SA, Shafi T, Mujtaba G, Abiodullah M. and Rashid N. 2012. Lack of
association of insertion/deletion polymorphism in angiotensin converting enzyme gene
with nephropathy in type 2 diabetic patients in Punjabi population of Pakistan. African
Journal of Biotechnology., 11(6):1487-1488.
Chuang LM., Chiu KC. and Chiang FT. 1997. Insertion/deletion polymorphism of the
angiotensin I-converting enzyme gene in patients with hypertension, non-insulin
dependent diabetes mellitus, and coronary heart disease in Taiwan. Metabolism., 46:
1211–1214.
Clark MG., Wallis MG., Barrett EJ., Vincent MA., Richards SM., Clerk LH. and Rattigan S.
2003. Blood flow and muscle metabolism: a focus on insulin action. Am J Physiol
Endocrinol, 284(93):E241–E250.
Colditz GA., Willett WC., Stampfer MJ., Manson JE., Hennekens CH., Arky RA. and Speizer
FE. 1990. Weight as a risk factor for clinical diabetes in women. Am J Epidemiol, 132(3):
501-13.
Colagiuri S, Kent J, Kainu VS, Sutherland S and Vuik S. 2015. Rising to the challenge
preventing and managing type 2 diabetes. Report of the WISH Diabetes Forum., PP. 06-
28.
Corrêa ZMS., Freitas AM. and Marcon IM. 2003. Risk factors related to the severity of diabetic
retinopathy. Arq. Bras. Oftalmol., 66: 741.
Cortez DN., Reis IA., Souza DAS., Macedo MML. and Torres HC.2015. Complications and the
time of diagnosis of diabetes mellitus in primary care. Acta Paul Enferm., 28(3):250-5.
Craig WY., Palomaki GE. and Haddow JE. 1989. Cigarette smoking and serum lipid and
lipoprotein concentrations: an analysis of published data. BMJ., 298: 784–8.
Dahiru T., Jibo A., Hassan AA. and Mande AT. 2008. Prevalence of diabetes in a semi-urban
community in northern Nigeria. Nig J Med., 17 (4): 414-416.
Danser AH., Schalekamp MA., Bax WA., van den Brink AM., Saxena PR., Riegger GA. and
Schunkert H. 1995. Angiotensin-converting enzyme in the human heart. Effect of the
insertion/deletion polymorphism. Circulation., 92:1387-8.
DeFronzo RA. and Ferrannini E. 1991. Insulin Resistance A Multifaceted Syndrome Responsible
53
for NIDDM, Obesity, Hypertension, Dyslipidemia, and Atherosclerotic Cardiovascular
Disease. Diabetes care., 14(3):173–194.
Degirmenci I., Kebapci N., Basaran A., Efe B., Gunes HV., Akalin A., Kurt H., Urhan M. and
Demirustu C. 2005. Frequency of angiotensin-converting enzyme gene polymorphism in
Turkish type 2 diabetic patients. Int J Clin Pract., 59(10) : 1139–1141.
Denton RM., Brownsey RW. and Belsham GJ. 1981. Evidence for phosphorylation and
activation of acetyl coa carboxylase by a membrane-associated cyclic amp-independent
protein kinase. Diabetologia., 21: 347-356.
Diamond J. 2003. The double puzzle of diabetes. Nature., 423: 599-602.
Dorer FE, Kahn JR, Lentz KE, Levine M. and Skeggs LT.1974. Hydrolysis of bradykinin by
angiotensin-converting enzyme. Circ Res., 34(6):824-7
Ebenezer AN., Osaretin JO., Anele EI., Aaron O. and Seye B. 2003. Type 2 diabetes in adult
Nigerians: a study of its prevalence and risk factors in Port Harcourt, Nigeria. Diabetes
Res Clin Pract., 62:177-185.
Ekpenyong CE., Akpan UP., Ibu JO. and Nyebuk DE. 2012. Gender and age specific prevalence
and associated risk factors of type 2 diabetes mellitus in uyo metropolis, south eastern
Nigeria. Diabetologia Croatica., 41(1) 21-23.
Elayat AA., el-Naggar MM. and Tahir M. 1995. An immunocytochemical and morphometric
study of the rat pancreatic islets. J. Anat., 186:629-637.
El-Babb MF., Shawky N., Al-Sisi A. and Mohamed Akhtar. 2012. Retinopathy and risk factors
in diabetic patients from Al-Madinah Al-Munawarah in the Kingdom of Saudi Arabia.
Clinical Ophthalmology., 6: 271-272.
Elbein SKD. and SC. 2006. The genetic basis of type 2 diabetes. Cellscience., 2(4):2–14.
Ellis L., Clauser E., Morgan DO., Edery M., Roth RA. and Rutter WJ. 1986. Replacement of
insulin receptor tyrosine residues 1162 and 1163 compromises insulin-stimulated kinase
activity and uptake of 2-deoxyglucose. Cell., 45(5):721-32
El-Shazly LHM., Ahmad NS. and Fatma ES. 2011. Risk Factors Association with Diabetic
Retinopathy and Maculopathy in Egyptian Type 2 Diabetics. Med. J. Cairo Univ.,
79(2):3-4.
Erdos EG. 1990. Angiotensin I Converting Enzyme and the Changes in Our Concepts Through
the Years. Hypertension., 16(4):363–368.
Ergen HA., Hatemi H., Agachan A., Camlica H. and Isbir T. 2004. Angiotensin-I converting
enzyme gene polymorphism in Turkish type 2 diabetic patients. Experimental and
Molecular Medicine., 36(4): 347-348.

54
Fabbrini E., Sullivan S. and Klein S. 2010. Obesity and nonalcoholic fatty liver
disease:biochemical, metabolic, and clinical implications. Hepatology., 51(2): 679–89.
Fava S., Azzopardi J., Ellard S. and Hattersley AT. 2001. ACE Gene Polymorphism as a
Prognostic Indicator in Patients With Type 2.Pathophysiology/ Complications.,
24(12):117–2118.
Ferguson TS., Tulloch-Reid MK., Younger-Coleman NO., Wright-Pascoe RA., Boyne MS.,
Soyibo AK. and Wilks RJ. 2011. Prevalence of Chronic Kidney Disease among Patients
Attending a Specialist Diabetes Clinic in Jamaica. Tropical Medicine Research Institute.,
p. 21.
Fogarty DG, Harron JC, Hughes AE, Nevin NC, Doherty CC and Maxwell AP et al., 1996. A
Molecular Variant of Angiotensinogen Is Associated With Diabetic Nephropathy in IDDM.
Diabetes. 45: 1205–1207.
Fontela PC., Winkelmann ER., Ott JR. and Ugger DP. 2014. Estimated glomerular filtration rate
in patients with type 2 diabetes mellitus. Rev Assoc Med BRAs., 60 (6):531-537.
Fujisawa T., Ikegami H., Shen GQ., Yamato E., Takekawa K., Nakagawa Y., Hamada Y., Ueda
H., Rakugi H. and Higaki J. 1995. Angiotensin I-Converting Enzyme Gene Polymorphism
Is Associated With Myocardial Infarction, but Not With Retinopathy or Nephropathy, in
NIDDM. Diabetes Care., 18: 1994–1996.
Gatineau M., Hancock C., Holman N., Oldridge LCA. and EL. 2014. Adult obesity and type 2
diabetes. Public Health England., pp.5.
Gebrekirstos K., Gebrekiros S. and Fantahun A. 2015. Diabetes & Metabolism Prevalence and
Factors Associated With Diabetic Foot Ulcer among Adult Patients in Ayder Referral
Hospital Diabetic Clinic Mekelle , North. J Diabetes Metab., 6(8):2.
Gerich JE. 2007. The Genetic Basis of Type 2 Diabetes Mellitus : Impaired Insulin Secretion
versus Impaired Insulin Sensitivity. Journal ofClinical Investigation., 17(8): 491–503
Giacchetti G., Sechi LA., Rilli S. and Carey RM. 2005. The renin–angiotensin–aldosterone
system, glucose metabolism and diabetes. Trends in Endocrinology and Metabolism., 16
(30):120-126.
Gill G., Gebrekidan A., English P., Wile D. and Tesfaye S. 2008. Diabetic complications and
glycemic control in remote North Africa. Q J Med., 101:796.
Guariguata L., Whiting DR., Hambleton I., Beagley J., Linnenkamp U. and Shaw JE. 2013.
Global estimates of diabetes prevalence for 2013 and projections for 2035. Diabetes
Research and Clinical Practice., 103(2):139–143.
Gunes HV., Ata N., Degirmenci I., Basaran A., Timuralp B., Dikmen M., Ustuner C, and
Kudaiberdieva G. 2004. Frequency of angiotensin-converting enzyme gene
polymorphism in Turkish hypertensive patients. IJCP; 58 (9): 838–843
Ha, T. Hye-Young Park , Su-Bin Seong and Hee Yul Ahn., 2015. Angiotensin II induces
endoplasmic reticulum stress in podocyte , which would be further augmented by PI3-

55
kinase inhibition. Clinical Hypertension. 21(13):5–6.
Hall V., Thomsen RW., Henriksen O. and Lohse N. 2011. Diabetes in Sub Saharan Africa 1999-
2011 : Epidemiology and public health implications . a systematic review. BMC Public
Health, 11(564): 1.
Haque SF., Ahmad M., Khan AU. and Gupta V. 2010. ACE Insertion/Deletion gene
polymorphism and genomic sequence in Diabetic nephropathy. IntJDiabetes & Metab.,
8:114–115.
Harrison TA., Hindorff LA., Kim H., Wines RC., Bowen DJ. and McGrath BB. 2013. Genetic
Screening for the Risk of Type 2 Diabetes. Am J Prev Med, 24(2):155–9.
Holt GI. 2004. Diagnosis, epidemiology and pathogenesis of diabetes mellitus an update for
Psychiatrists. Br.J.Psychiatry., 184:s55- s63.
Hribal ML., Oriente F. and Accili D. 2002. Mouse models of insulin resistance. Am.J.Physiol.
Endocrinol. Metab., 282(5):E977-81 doi: 10.1152/ajpendo.00561.20.
Hsieh MC., Lin SR., Hsieh TJ., Hsu CH., Chen HC., Shin SJ. and Tasi JH. 2000. Increase
frequency of angiotensin converting enzyme DD genotype in patients with type 2 iabetes
in Taiwan. Nephrol Dial Transplant., 15:1009-1012.
Hsueh WA. and Wyne K. 2011. Renin-Angiotensin-Aldosterone System in Diabetes and
Hypertension. journal of clinical hypertension 13(4).
Hu FB., Manson JE., Stampfer MJ., Colditz G., Liu S., Solomon CG. and Willett WC. 2001.
Diet, lifestyle, and the risk of type 2 diabetes mellitus in women. N Engl J Med.,
345(11):790-7.
Hu Y., Teng W., LiL U., Chen K., Liu L., Hua R., Chen J., Zhou Y. and Chen L. 2015.
Prevalence and Risk Factors of Diabetes and Diabetic Retinopathy in Liaoning Province,
China: A Population-Based Cross-Sectional Study. PLoSONE., 10(3): 5-8.
Hur NW., Kim HC., Nam CM., Jee SH., Lee HC. and Suh I. 2007. Smoking cessation and risk of
type 2 diabetes mellitus: Korea medical insurance corporation study.
Eur.J.Cardiovasc.Prev Rehabil., 14(2):244-9.
Hussein MAM., Al-janabi LM. and Algenabi AHA. 2015. Angiotensin Converting Enzyme
(ACE) Gene Polymorphism And The Risk Of Diabetic Nephropathy In Type 2 Diabetes.
Journal of Dental and Medical Sciences., 14(2):62–67.
Hussain S., Qamar MR., Iqbal MA., Ahmad A. and Ehsan U. 2013. Risk factors of retinopathy in
type 2 diabetes mellitus at a tertiary care hospital, Bahawalpur Pakistan. Pak.J.Med.Sci.,
29(2):537-538.
Ichikawa M., Konoshita T., Nakaya T., Yamamoto K., Yamada M., Sato S., Imagawa M.,
Makino Y., Fujii M., Zenimaru Y., Arakawa K., Suzuki J., Ishizuka T. and Nakamura
H. 2014. Genetic variant of the renin-angiotensin system and prevalence of type 2
56
diabetes mellitus: a modest but significant effect of aldosterone synthase. Acta Diabetol,
51: 597.
International Diabetes Federation. 2011. IDF Diabetes Atlas., 5th ed.
Iranparvar AM., Aminisani N., Bashardoost B., Shamshirgaran SM., Khodamoradzadeh M.,
Shokrabadi M. and Olomi B. 2006. Prevalence and Risk Factors of Microalbuminuria in
Type 2 Diabetic Patients in a Diabetic Clinic of Ardabil-Iran. Int J Endocrinol Metab.,
4:10–11.
Islam SMS., Niessen LW., Seissler J., Ferrari U., Biswas T., Islam A. and Lechner A. 2015.
Diabetes knowledge and glycemic control among patients with type 2 diabetes in
Bangladesh. SpringerPlus., 4(284):4.
Jacobsen P., Tarnow L., Carstensen B., Hovind P., Poirier O. and Parving HH. 2003. Genetic
Variation in the Renin-Angiotensin System and Progression of Diabetic Nephropathy.
Journal of the American Society of Nephrology.,14:2844–2847
Jammal H., Khader Y., Alkhatib S., Abujibara M., Alomari M. and Ajlouni. 2013. Diabetic
retinopathy in patients newly diagnosed with type 2 diabetes mellitus in jourdan:
prevalence and associated risk factors. Journal of diabetes., 5: 174-176.
Jeffers BW., Raymond OE., Muy VR. and Robert WS. 1997. Angiotensin-converting enzyme
gene polymorphism in non-insulin dependent diabetes mellitus and its relationship with
diabetic nephropathy. Kidney International., 52: 474–475.
Jiang X., Sheng H., Li J., Xun P., Cheng Y., Huang J., Xiao H. and Zhan Y. 2009. Association
between reninangiotensin system gene polymorphism and essential hypertension: A
community-based study. J Hum Hypertens., 23: 176-81.
Joyce-tan SM., Zain SM., Abdul Sattar MZ. and Abdullah NA. 2016. Renin-Angiotensin System
Gene Variants and Type 2 Diabetes Mellitus : Influence of Angiotensinogen. Journal of
Diabetes Research., pp.2–5.
Kahn SE. 2003. The relative contributions of insulin resistance and beta-cell dysfunction to the
pathophysiology of type 2 diabetes. Diabetologia.,46:3–19.
Kahn SE., Hull RL. and Utzschneider KM. 2006. Mechanisms linking obesity to insulin
resistance and type 2 diabetes. Nature., 444(7121):840-6.
Khan SU., Qayyum A. and Hussain SS. 2015. Prognostic Significance of ACE and PAI-1 Genes
Polymorphisms with Diabetic Retinopathy and Diabetic Non-Retinopathy in Type 2
Diabetes. Acta Medica International., 2(2):45-47.
Kaku K. 2010. Pathophysiology of type 2 diabetes and its treatment policy. JMAJ, 53(1):41 -46.
Kaleemullah M., Khan NP. and Mohammed IMS. 2011. ACE I/D gene polymorphism in
diabetic nephropathy: Clinical implications. Journal of M e d ical & Allied Sciences.,
1(1):42–45.

57
Karuna Sree P., Haritha Yadav K C. and Venkat Rao Y. 2013. Pharmacogenomics in Diabetes
Mellitus: Pathway to Personalized medicine. Heli.,1: 1.
Kassahun T., Eshetie T. and Gesesew H. 2016. Factors associated with glycemic control among
adult patients with type 2 diabetes mellitus: a cross-sectional survey in Ethiopia. BMC
Res Notes., 9(78):2.
Kasper R., Per K. Christensen. and Peter H. Progression of nephropathy in type 2 diabetic
patients. 2004;66:1596–605.
kasper KH. and Lester FT. 1988. Macrovascular disease in middle-aged diabetic patients in
Addis Ababa , Ethiopia. Springer-Verlag., 31:363.
Kengne AP., Sobngwi E. and Mbanya J. 2013. New insights on diabetes mellitus and obesity in
Africa – Part 1 : prevalence , pathogenesis and comorbidities. Global burden of
cardiovasc ular disease., 99:979–983.
KDIGO: 2013. Improving Global Outcomes (KDIGO) 2012 Clinical practice guidelines for the
evaluation and management of chronic kidney disease. Kidney International
Supplements, 3: 1-150.
Kim J., Kwon H., Yong-Moon P Y., Lee J., Kim M., Yoon K., Lee W., Cha B. and Son H. 2011.
Prevalence and Associated Factors of Diabetic Retinopathy in Rural Korea: The Chungju
Metabolic Disease Cohort Study. JKMS., 26(8): 1070.
King H., Aubert RE. and Herman WH. 1998. Global burden of diabetes, 1995–2025: prevalence,
numerical estimates, and projections, Diabetes Care., 21: 1414–31.
Kleinberger JW. and Pollin TI. 2015. Personalized medicine in diabetes mellitus: Current
opportunities and future prospects. Annals of the New York Academy of Sciences.,
1346(1):45–46.
Knowler WC., Pettitt DJ., Saad MF., Charles MA., Nelson RG., Howard BV., Bogardus C. and
Bennett PH.1991. Obesity in the Pima Indians: its magnitude and relationship with
diabetes. A J Clin Nutr, 53:S1543-S51.
Kumawat M., Singh I., Singh N., Singh V. and Kharb S. 2012. Lipid peroxidation and lipid
profie in type II diabetes mellitus. Webmed Central Biochemistry., 3(3):WMC003147.
Kuoppala A., Lindstedt KA., Saarinen J., Kovanen PT. and Kokkonen JO. 2000. Inactivation of
bradykinin by angiotensin-converting enzyme and by carboxypeptidase N in human
plasma. Am J Physiol Heart Circ Physiol., 278:1071–1074.
Kutluturk I., Karagoz A., Bezgin T., Oduncu V., Elveran A., Doğan C., Elbay A., Kirma C. and
Özertürk Y. 2014. Relationship between angiotensin I-converting enzyme
insertion/deletion gene polymorphism and retinal vein occlusion. Thrombosis Journal,
12(17): 4-5.
Leehey DJ., Singh AK., Alavi N. and Singh R. 2000. Role of angiotensin II in diabetic

58
nephropathy. Kidney Int, 58 (77): S93–S98.
Lee YJ. and Tsai JCR. 2002. ACE gene insertion/deletion polymorphism associated with 1998
World Health Organization definition of metabolic syndrome in Chinese type 2 diabetic
patients. Diabetes care., 25:1003–1005.
Leonard T., Skeggs JR., Joseph R., Kahn A., Norman P. and Shumw AY. 1956. the preparation
and function of the hypertensinconverting enzyme. J Exp Med., 295–299.
Levey AS., Stevens LA., Schmid CH., Zhang YL., Castro AF. and Feldman HI. 2009. A new equation to estimate glomerular filtration rate. Anns Int Med.,150: 604–12.
Liu C., Shau WY., Chang CH., Wu CS. and Lai MS. 2013. Pneumonia Risk and Use of Angiotensin-Converting Enzyme Inhibitors and Angiotensin II Receptor Blockers. J Epidemiol., 23(17):344–350.
Lu G, Greene E., Nagai T. and Egan B. 1998. Reactive oxygen species are critical in the oleic
acid-mediated mitogenic signaling pathway in vascular smooth muscle cells.
Hypertension., 32(6): 1003–1010.
Lu Y., Ge Y. and Hu Q. 2012 Association between angiotensin-converting enzyme gene
polymorphism and diabetic retinopathy in the Chinese population. J.Renin.Angiotensin
Aldosterone Syst., 13:.290–293.
Lyssenko V., Jonsson A., Almgren P., Pulizzi N., Isomaa B., Tuomi T., Berglund G., Altshuler
D., Nilsson P. and Groop L. 2008. Clinical risk factors, DNA variants, and the
development of type 2 diabetes. N Engl J Med., 359(21): 2220-32.
Lyssenko V., Lupi R., Marchetti P., Del Guerra S., Orho-Melander M., Almgren P., Sjögren M.,
Ling C., Eriksson KF., Lethagen AL., Mancarella R., Berglund G., Tuomi T., Nilsson P.,
Del Prato S. and Groop L. 2007. Mechanisms by which common variants in the TCF7L2
gene increase risk of type 2 diabetes. The Journal ofClinical Investigation. 117(8):2155–
2163.
Mafuratidze E., Chako K., Phillipo H. and Zhou DT. 2014. Over 27% of Type II Diabetic
Patients Studied at Parirenyatwa Diabetic Clinic in Zimbabwe Have Evidence of
Impaired Renal Function. IJSTR., 3(3): 16.
Marinho NBP., Vasconcelos HCA., Alencar AMPG., Almeida PC. and Damasceno MMC. 2013.
Risk for type 2 diabetes mellitus and associated factors. Acta Paul Enferm., 26(6):572.
Marre M., Bernadet P., Gallois Y., Savagner F., Guyene TT., Hallab M., Cambien F., Passa P.
and Alhenc-Gelas F. 1994. Relationships between angiotensin I converting enzyme gene
polymorphism, plasma levels, and diabetic retinal and renal complications. Diabetes.,
43:384–388.
Mengesha AY.2007. Hypertension and related risk factors in type 2 diabetes mellitus (DM)
patients in Gaborone City Council (GCC) clinics, Gaborone, Botswana. African Health
Sciences., 7(1): 245
Mbanya JCN., Motala AA., Sobngwi E., Assah FK. and Enora ST. 2010. Diabetes in sub-
59
Saharan Africa. Lancet., 375: 2254-2266.
McLarty DG., Pollitt C. and Swai ABM. 1990. Diabetes in Africa. Diabet Med., 7: 670–84.
Medici F., Hawa M., Ianari A., Pyke DA. and Leslie RD. 1999. Concordance rate for Type II
diabetes mellitus in monozygotic twins : actuarial analysis. Diabetologia., 42(2):146–
150.
Meng N., Zhang Y., MA J., Li H., Zhou F. and Qu Y. 2015. Association of polymorphisms of
angiotensin I converting enzyme 2 with retinopathy in type 2 diabetes mellitus among
Chinese individuals. Eye., 29: 268.
Michael JF. 2008. Microvascular and Macrovascular Complications of Diabetes. CliniCal
Diabetes., 26(2):77–82.
Miller M., Stone NJ., Ballantyne C., Bittner V., Criqui MH., Ginsberg HN., Goldberg AC.,
Howard WJ., Jacobson MS., Kris-Etherton PM., Lennie TA., Levi M., Mazzone T. and
Pennathur S. 2011. Triglycerides and cardiovascular disease: A scientifi statement from
the American Heart Association.Circulation., 123: 2292–333.
Mitsuyoshi H., Yasui K., Harano Y., Endo M., Tsuji K., Minami M., Itoh Y., Okanoue T. and
Yoshikawa T. 2009. Analysis of hepatic genes involved in the metabolism of fatty acids
and iron in nonalcoholic fatty liver disease. Hepatology Research., 39(4):366–73.
Mogensen CE. 2003. Microalbuminuria and hypertension with focus on type 1 and type 2
diabetes . Journal of Internal Medicine., 254:45–66.
Moorehead JF., Chan MK. and El-Nahas MVZ.2005. Dyslipidemia and the progression of renal
disease in chronic renal failure patients. International Society of Nephrology., 68:87–93.
Moynahan ME. and Cui TY. 2001. Homology-directed DNA Repair , Mitomycin-C Resistance ,
and Chromosome Stability Is Restored with Correction of a Brca1 Mutation. Am Assoc
CANCER Res., 6:4843–7.
Mustafa Araz., Necat Y., Kivanc VO. and Yalcin KASA. 2001. Angiotensin-converting enzyme
gene polymorphism and microvascular complications in Turkish type 2 diabetic patients.
Diabetes research and clinical practice., 54(2):97 –98.
Nagai N., Noda K., Urano T., Kubota Y., Shinoda H., Koto T., Shinoda K., Inoue M., Shiomi T.,
Ikeda E., Tsubota K., Suda T., Oike Y. and Ishida S.2005. Selective suppression of
pathologic, but not physiologic, retinal neovascularization by blocking the angiotensin II
type 1 receptor. Invest Ophthalmol Vis Sci., 46(3):1078-84.
Nagamani S. 2015. DD genotype associated with the female Chronic Kidney Disease patients of
Tamilnadu population. Egyptian Journal of Medical Human Genetics., 16(1):30–31.
Nagel G., Zitt E., Peter R., Pompella A., Concin H. and Lhotta K.2013. Body mass index and
metabolic factors predict glomerular filtration rate and albuminuria over 20 years in a
high-risk population. BMC Nephrology., 14(177):5.
60
Nakhjavani M., Esfahanian F., Jahanshahi A., Esteghamati A., Nikzamir AR., Rashidi A. and
Zahraei M. 2007. The relationship between the insertion/deletion polymorphism of the
ACE gene and hypertension in Iranian patients with type 2 diabetes. Nephrol Dial
Transplant., 22: 2551–2552.
Naresh VVS., Reddy ALK., Sivaramakrishna G., Sharma PVGK., Vardhan RV. and Kumar VS.
Angiotensin converting enzyme gene polymorphism in type II diabetics with nephropathy.
2010;145–8.
National Cholesterol Education Program, Expert Panel on detection and treatment of high blood
cholesterol in adults, Executive summary of the third report of the National cholesterol
education (NCEP), Expert Panel on detection and treatment of high blood cholesterol in
adults(ATP 111). 2001. JAMA., 285: 2486-2497.
Neugebauer S. and Baba T. 2000. Brief Genetics Report. DIABETES., 49:2–5.
Nigatu T. 2012. Epidemiology, complications and management of diabetes in Ethiopia: A
systematic review. Journal of Diabetes., 4:178
Nikzamir AR., Golmohammadi T. and Nakhjavani M. 2006. Angiotensin Converting Enzyme
Gene Polymorphism in Iranian Patients with Type 2 Diabetes. Iran.J.Immunol., 3(1):23–
29.
Nikzamir A., Nakhjavani M., Esteghamati A. and Rashidi A. 2008. Correlates of ACE activity in
macroalbuminuric type 2 diabetic patients treated with chronic ACE inhibition. Nephrol
Dial Transplant, 23(12):1274–1277.
Nikzamir AR., Nakhjavani M., Golmohammadi T. and Dibai L. 2008. Angiotensin Converting
Enzyme Gene Polymorphism with metabolic syndrome in Iranian Patients with Type 2
Diabetes mellitus. Arch Iranian Med., 11(1):3.
Noma H., Funatsu H., Mimura T., Harino S. and Hori S. 2009. Vitreous levels of interleukin-6
and vascular endothelial growth factor in macular edema with central retinal vein
occlusion. Ophthalmology., 116(1):87-93.
O’Donnell CJ., Lindpaintner K. and Larson MG.1998. Evidence for association and genetic
linkage of the angiotensin converting enzyme locus with hypertension and blood pressure
in men but not women in the Framingham Heart Study. Circulation, 97: 1766–1772.
Ohn MS., Mcleod BK., Tim D., Smith W., Michael KB. and Rosenthal AR. 1993. The
prevalence of diabetic retinopathy and maculopathy and their risk factors in the non-
insulin-treated diabetic patients of an english town. Eye., 7, PP 161.
Ohshige T., Tanaka Y., Araki S., Babazono T., Toyoda M., Umezono T., Watada H., Suzuki D.,
Iwamoto Y., Kawamori R., Nakamura Y. and Maeda S. 2010. A Single Nucleotide
Polymorphism in KCNQ1 Is Associated With Susceptibility to Diabetic Nephropathy in
Japanese Subjects With Type 2 Diabetes METHODS. Pathophysiology/Complications.,

61
33(4):843.
Ono K., Mannami T., Baba S., Yasui N., Ogihara T, and Iwai N. 2003. Lack of association
between angiotensin II type 1 receptor gene polymorphisms and hypertension in
Japanese. Hypertension Research., 26: 131–134.
O'Rahilly S. and Farooqi IS. 2006. Genetics of obesity. Philos TransRSocLondBBiolSci,
361(1471):1095-105.
Panjaliya RK., Sethi S., Sharma M., Sharma R., Kumar P. and Gupta S. 2013. Medical Genetics
and Genomics., 5(1): 2 – 3.
Pasquale P., Cannizzaro S., Scalzo S., Maringhini G., Pipitone F., Fasullo S., Giubilato A., Ganci
F., Vitale G., Sarullo FM. and Paterna S.2005. Cardiovascular effects of I/D angiotensin-
converting enzyme gene polymorphism in healthy subjects: Findings after follow-up of
six years. Acta Cardiol, 60: 427–435.
Patel HV., Kalia K. and Mannari J. 2011. Angiotensin converting enzyme (ACE) gene
polymorphism increases the susceptibility of diabetic nephropathy in Western Indian
Type 2 diabetic patients. Int J Diab Dev Ctries, 31:3–5.
Patja K., Jousilahti P., Hu G., Valle T., Qiao Q. and Tuomilehto J. 2005. Effects of smoking,
obesity and physical activity on the risk of type 2 diabetes in middle-aged Finnish men
and women. J Intern Med., 258(4):356-62.
Piatti PM., Monti LD., Conti M., Baruffaldi L., Galli L., Phan CV., Guazzini B., Pontiroli AE.
and Pozza G.1996. Hypertriglyceridemia and hyperinsulinemia are potent inducers of
endothelin-1 release in humans. Diabetes., 45(3):316–321.
Prasanth A., Mahendran T. and SujirthaN. 2015. Prevalence of Type-2 Diabetes and Associated
Risk Factors in Batticaloa District, Sri Lanka. IJIRSET., 4(9):8060-8062.
Ramachandran V., Ismail P., Stanslas J., Shamsudin N., Moin S, and Jas RM. 2008. Association
of insertion/deletion polymorphism of angiotensin-converting enzyme gene with essential
hypertension and type 2 diabetes mellitus in Malaysian subjects. RAAS;9(4):210-12.
Rani PK., Raman R., Chandrakantan A., Pal SS., Perumal GM. and Sharma T. 2009. Risk factor
for diabetic retinopathy for self reported rural population with diabetes.Post grad Med.,
55(2): 93-95.
Reaven GM. Banting lecture.1988. Role of insulin resistance in human disease. Dabetes.,37:
1505-1607.
Ricci C., Iacobini C., Oddi G., Amadio L., Menini S., Rastaldi MP., Frasheri A., Pricci F. and
Pugliese F. 2006. Role of TGF-beta/GLUT1 axis in susceptibility vs resistance to diabetic
glomerulopathy in the Milan rat model. Nephrol Dial Transplant., 21(6):1517–1521.
Rigat B., Hubert C., Corvol P. and Soubrier F. 1992. PCR detectrion of the insertion/deletion
polymorphism of the human angiotensin converting enzyme gene (DCP1) (dipeptidyl
carboxypeptidase 1). ucleic Acids Research., 20(6):1433.

62
Rigat B., Hubert C., Alhenc-Gelas F., Cambien F., Corvol P. and Soubrier F. 1990. An Insertion
/ Deletion Polymorphism in the Angiotensin I-converting Enzyme Gene Accounting for
Half the Variance of Serum Enzyme Levels. The American Society for Clinical
Investigation., 86:1344–1345.
Rivera MA., Wolfarth B., Bray MS., Hagberg JM., Pérusse L., Rauramaa R., Roth SM.,
Rankinen T. and Bouchard C. 2004. The Human Gene Map for Performance and 2004
Update. Genetics., 37(6):881–903.
Roaeid RB. and Kadiki OA. 2011. Prevalence of long-term complications among Type 2 diabetic
patients in Benghazi, Libya. Journal of Diabetology., 3(5):2-3.
Ruhembe CC., Moshat CE. and Nyaruhucha CNM. 2014. Prevalence and awareness of type 2
diabetes mellitus among adult population in Mwanza city, Tanzania. Tanzania Journal of
Health Research., 16(2):4-6.
Saab YB., Gard PR, and Overall AD. 2007. The geographic distribution of the ACE II genotype:
a novel finding. Genetics Research Journal., 89: 259-267.
Sagna Y., Tieno H., Guira O., Yanogo DAR., Benon LE., Zida S., Nikiema P., Kabore PR.,
Tonde AP., Traore R., Ouedraogo DD. and Drabo YJ. 2014. Prevalence and associated
risk factors of diabetes and impaired fasting glucose in urban population; a study from
Burkina Faso. Journal of Diabetology., 2(4): 5
Sairenchi T., Iso H., Nishimura A., Hosoda T., Irie F., Saito Y., Murakami A. and Fukutomi H.
2004. Cigarette smoking and risk of type 2 diabetes mellitus among middle-aged and
elderly Japanese men and women. Am J Epidemiol., 160(2):158-62.
Saleem S., Azam A., Maqsood SI., Muslim I., Bashir S., Fazal N., Riaz M., Ali SHB., Niazi
MK., Ishaq M., Waheed N.K, Qamar R. and Azam M. 2015. Role of ACE and PAI-1
Polymorphisms in the Development and Progression of Diabetic Retinopathy. PLoS
ONE., 10(12):4.
Saltiel AR. and Kahn CR. 2001. Insulin signalling and the regulation of glucose and lipid
metabolism. Nature., 414:799–806.01.
Schaefer EJ., Gleason JA. and Dansinger ML. 2009. Dietary fructose and glucose differentially
affect lipid and glucose homeostasis. Journal of Nutrition., 139(6):1257S–62S.
Schmidt S1., Schöne N. and Ritz E. 1995. Association of ACE gene polymorphism and diabetic
nephropathy ? Kidney International, 47:1176–1181.
Seifu W, Woldemichael K and Tsehaineh B. 2015. Prevalence and Risk Factors For Diabetes
Mellitus and Impaired Fasting Glucose among Adults Aged 15-64 Years in Gilgel Gibe
Field Research Center, Southwest Ethiopia, 2013:Through a Who Step Wise Approach.
MOJ Public Health 2(4): 00035. DOI: 10.15406/mojph.2015.02.00035
Serné EH., Gans RO., Ter Maaten JC., Ter Wee PM., Donker AJ. and Stehouwer CD. 2001.
Capillary recruitment is impaired in essential hypertension and relates to insulin’s

63
metabolic and vascular actions. Cardiovascular Research., 49(1):161–168.
Serné EH., Stehouwer CD., Maaten JC., Ter Wee PM., Rauwerda JA., Donker AJ. and Gans RO.
1999. Microvascular Function Relates to Insulin Sensitivity and Blood Pressure in
Normal Subjects. American Heart Association., pp.896–903.
Shammari FK., Al-Meraghi O., Nasif A. and Al-Otaibi S. 2005. The prevalence of diabetic
retinopathy and associated risk factors in type 2 diabetes mellitus in al-naeem area
(kuwait). Middle East Journal of Family Medicine., 3(2):3.
Shaw JE., Sicree RA. and Zimmet PZ. 2010. and Clinical Practice Global estimates of the
prevalence of diabetes for 2010 and 2030. diabetes researchand clinical practice.,
87(2010):7
Shen F., Chen C, Su S. and Liu R. 2008. the prevalence and risk factors of diabetic nephropathy
in taiwanese type 2 diabetes—a hospital–based study. Acta Nephrologica., 23(2):91-92.
Shlomo M., Polonsky KS., Larsen PR. and Kronenberg HM. 2011. Diabetes Mellitus. Willams
textbook of endocrinology, 12th Ed. Philadelphia: Elsevier/Saunders., p. 1371-1435
Skarfors ET., Selinus KI. and Lithell HO. 1991. Risk factors for developing non-insulin
dependent diabetes: a 10 year follow up of men in Uppsala. BMJ., 303(6805):755-60.
Skipworth JR., Puthucheary Z., Rawal J., Loosemore M., Van Someren K. and Montgomery
HE. 2011. The ACE gene and human performance : 12 Years on The ACE Gene and
Human Performance 12 Years On. Sports Med, 41(6):435.
Sibony M., Gasc JM., Soubrier F., Alhenc-Gelas F. and Corvol P. 1993. Gene Expression and
Tissue Localization of the Two Isoforms of Angiotensin I Converting Enzyme.
Hypertension., 21(6):829–833.
Singh. 2011. The genetics of type 2 diabetes mellitus : A review. Journal of Scientific Research.,
55 : 35-48
Sjolie AK., Klein R., Porta M., Orchard T., Fuller J. and Parving HH.2008. Effect of candesartan
on progression and regression of retinopathy in type 2 diabetes (DIRECT-Protect 2): a
randomised placebo-controlled trial. Lancet, 372: 1385–1393.
Sleire L. 2011. DIABETES : A neglected disease in sub-saharan africa,Medical Student Thesis.
University of Oslo., p.17.
Stephens JW., Dhamrait SS., Cooper JA., Acharya J., Miller GJ., J Hurel SJ. and Humphries SE.
2005. The D allele of the ACE I/D common gene variant is associated with Type 2
diabetes mellitus in Caucasian subjects. Molecular Genetics and Metabolism 84: 85–86
Strojek K., Grzeszczak W., Morawin E., Adamski M., Lacka B., Rudzki H., Schmidt S., Keller
C. and Ritz E. 1997. Nephropathy of type II diabetes: evidence for hereditary factors?
International Society of Nephrology., 51(5):1602–1607.
Suguna S., Nandal DH., Kamble S., Bharatha A. and Kunkulol R. 2014. Genomic DNA
isolation from human whole blood samples by non enzymatic salting out method. Int J
Pharm Sci., 6(6): 1-2.

64
Tanti JF., Gremeaux T., Rochet N. and Obberghen EV.1987. Effect of cyclic AMIP-dependent
protein kinase on insulin receptor. Biochem. J., 245:19-26
Tascilar N., Dursun A., Ankarali H., Mungan G., Ekem S. and Baris S. 2009. Angiotensin-
converting enzyme insertion/deletion polymorphism has no effect on the risk of
atherosclerotic stroke or hypertension. J Neurol Sci., 285: 137-41.
Taylor R. and Agius L. The biochemistry of diabetes, review article.1988. Biochem. J., 250: 625-
640
Tesfaye DJ., Tessema F. and Taha M. 2015. Coexistence of Chronic Complications among
Diabetic Patients at Nigist Eleni Mohammed Memorial Hospital , Hossana , South
Ethiopia. Open Access Library Journal., 2(e1218):17.
Tesfaye S. and Gill G. 2011. Review Article Chronic diabetic complications in Africa. African
Journal of Diabetes Medicine., 19(1):1–6.
Thomas GN., Critchley JA., Tomlinson B., Yeung VT., Lam D., Cockram CS. and Chan JCN.
2003. Renin-angiotensin system gene polymorphisms and retinopathy in chinese patients
with type 2 diabetes. Diabetes Care., 26: 1643–1644.
Thornton J., Edwards R., Mitchell P., Harrison RA., Buchan I. and Kelly SP. “Smoking and age-
related macular degeneration: a review of association.” Eye., 2005;19(9):935-44.
Unnikrishnan RI., Rema M., Pradeepa R., Deepa M., Shanthirani CS., Deepa R. and Mohan V.
2007. Prevalence and Risk Factors of Diabetic Nephropathy in an Urban South Indian.
Epidemiology/ Health Services Research., 30(8):2020–2023.
Valdes S., Botas P., Delgado E., Alvarez F. and Cadorniga FD. 2007. Population-based
incidence of type 2 diabetes in northern Spain: the Asturias Study. Diabetes Care.,
30(9):2258-63.
Veghari G., Sedaghat M., Joshaghani H., Hoseini SA., Niknezad F., Angizeh A., Tazik E. and
Moharloei P. 2010. Association between socio-demographic factors and diabetes mellitus
in the north of Iran: A population-based study. International Journal of Diabetes
Mellitus., 2:155–156.
Viswanathan V., Tilak P. and Kumpatla S. 2012. Risk factors associated with the development
of overt nephropathy in type 2 diabetes patients : A 12 years observational study. Indian J
Med Res., 13649–50.
Vivian CT., Maiyoh GK. and Ha CE. 2010. Type 2 diabetes mellitus and obesity in sub-
Saharan Africa Type 2 diabetes mellitus and obesity in sub-Saharan Africa. Diabetes
Metab Res Rev., 26(6):433-45. doi: 10.1002/dmrr.1106.
Walder B., Sawicki PT., Spanaus K-S., Weinreich T. and Widmer U. 1998. Genetic
heterogeneity in the renin-angiotensin system and the risk of diabetic nephropathy:
Association with the angiotensinogen gene, but not with the ACE gene. Journal of
Clinical and Basic Cardiology., 1(1):56.

65
Wall BM., Hardison RM., Molitch ME., Marroquin OC., McGill JB. and August PA. 2010. High
Prevalence and Diversity of Kidney Dysfunction in Patients with Type 2 Diabetes
Mellitus and Coronary Artery Disease: The BARI 2D Baseline Data. Am J Med Sci.,
339(5): 2-6.
Wang S., Mitu GM. and Hirschberg R. 2008. Osmotic polyuria: An overlooked mechanism in
diabetic nephropathy. Nephrology Dialysis Transplantation., 23(7), p.1.
White MF and Kahn CR. 1994. The insulin signaling system. J. Biological Chemistry., 269:1–4.
White MF., Shoelson SE., Keutmann H. and Kahn CR. 1988. A cascade of tyrosine
autophosphorylation in the β-subunit activates the phosphotransferase of the insulin
receptor. Journal of Biological Chemistry., 263(6):2972–2980.
Whiting DR., Guariguata L., Weil C. and Shaw J. 2011. IDF diabetes atlas: global estimates of
the prevalence of diabetes for 2011 and 2030. Diabetes Res Clin Pract., 94(3):311 –321.
Wilkinson-Berka JL. 2006. Angiotensin and diabetic retinopathy. Int J Biochem Cell Biol., 38:
752–765.
Willi C., Bodenmann P., Ghali WA., Faris PD. and Cornuz J. 2007. Active smoking and the risk
of type 2 diabetes: a systematic review and met-analysis. JAMA., 298(22):2654-64.
Worku D., Hamza L. and Woldemichael K. 2010. patterns of diabetic complications at jimma
university specialized hospital, southwest ethiopia. Ethiop J Health Sci., 20(2):36–38.
Wu Y. 2014. Apo E Gene Polymorphism Affects Development of Type 2 DiabeticNephropathy
in Asian Populations, Especially in East Asians: An Updated Meta-Analysis. Medical
Science Monitor., 20:1596–1603.
Wysocki J., Ye M., Soler MJ., Gurley SB., Xiao HD., Bernstein KE., Coffman TM., Chen S. and
Batlle D. 2006. ACE and ACE2 Activity in Diabetic Mice. Diabetes, 55:2134–2135.
Yamagishi S. and Matsui T. 2010. Advanced glycation end products, oxidative stress and
diabetic nephropathy. Oxidative Medicine and Cellular Longevity., 2:101–108.
Yang M., Qiu C., Xu Q. and Xiang H. 2006. Association of Angiotensin Converting Enzyme
Gene I/D Polymorphism With Type 2 Diabetes Mellitus. Biomedical and Environmental
Sciences,19:323-327.
Yaturu S. 2011. Obesity and type 2 diabetes. Journal of Diabetes Mellitus,1(4):79.
Yeh HC., Duncan BB., Schmidt MIs., Wang NY. and Brancati FL. 2010. Smoking, smoking
cessation, and risk for type 2 diabetes mellitus. Ann Intern Med., 152(1):10-7.
Yoshida H., Kuriyama S., Atsumi Y., Tomonari H., Mitarai T., Hamaguchi A., Kubo H.,
Kawaguchi Y., Kon V., Matsuoka K., Ichikawa I. and Sakai O. 1996. Angiotensin I
converting enzyme gene polymorphism in non-insulin dependent diabetes mellitus.
Kidney international., 50(2):659–661.
66
Yusuf S., Gerstein H., Hoogwerf B., Pogue J., Bosch J., Wolffenbuttel BH. and Zinman B. 2001.
Ramipril and the development of diabetes. JAMA., 286:1882-5
Zarouk WA., Hussein IR., Abdel Rehiem HA., Raslan HM., Emara NA., Rasheed MA. and
Wassefe M. 2009. Angiotensin Converting Enzyme I/D Polymorphism in Egyptian
Patients with Type 2 Diabetes Mellitus. Med. J.Cairo Univ., 77(1):309-310
Zhang YF., Cheng Q., Tang NLS., Tanya TW., Chu TTW., Tomlinson B., Liu F. and Kwok
TCY. 2014. Gender difference of serum angiotensinconverting enzyme (ACE) activity in
DD genotype of ACE insertion/deletion polymorphism in elderly Chinese. Jraas.,15(4)
:549.
Zhou D., Ruiter R., Zhang J., Zhou M., Liu H. and Liu W. 2012. Angiotensin converting enzyme
I/D polymorphism is not associated with type 2 diabetes in a Chinese population. J Renin
Angiotensin Aldosterone Syst., 13:372-8.
Zhou MS. and Schulman IH. 2009. Prevention of diabetes in hypertensive patients: Results and
implications from the VALUE trial. Vasc Health Risk Manag.,5:361-8.
Zhou YF., Yan H., Hou XP., Miao JL., Zhang J., Yin QX., Li JJ., Zhang XY., Li YY. and Luo
HL. 2013. Association study of angiotensin converting enzyme gene polymorphism with
elderly diabetic hypertension and lipids levels. Lipids in Health and Disease., 12(187): 2-
4.

67
APPENDIX
Appendix 1 Consent form
I, the undersigned (full name) -----------------------------------------------------------------who is
living at --------------Zone, wereda-------------- kebele ---------- and urban/rural ----------------------
willingly agree to provide 5ml of my blood sample for the principal investigator of this project.
The investigator should ethically bind and use this blood sample only for the said research and
will completely be responsible if they don’t keep the result and status of the sample confidential.
Name and signature of the participant date
------------------------------------------------------- -------------------
Appendix 2 Questionnaire for associated risk factors for all diabetes patients
Demographic information
Question Response
1 Sex (record male/ female as observed) Male , female
2 How old are you? Years ---------------
Behavioral measurements
6 Do you smoke any tobacco product? Such as cigarettes,
cigars or pipes?
Yes
No
7 Do you currently smoke tobacco daily? This question is
only for current smoker of tobacco product.
Age( years)-------
8
How old were you first started smoking daily?
Age(years)-------------
9 On average, how many cigarettes per day do you use? -------------------
10 Did someone smoke in closed areas in your work
place?(in the building, in a work area or a specific office)
Yes No
11 In question 10 if the answer is Yes asked as how many
days did someone smoke in closed areas in your work
place?
Number of days -----
Don’t know
Work in a closed
68
History of diabetes
1 How old are you? (you age 1st diagnosis) When you ever
been told by a doctor or other health worker that you have
raised blood sugar or diabetes?
Age (years)--------
2 Are (were) any family member suffering from DM
disease?
Yes
No
3 Are (were) you suffering from other disease? Like kidney,
retinopathy, hypertension and neuropathy.
Yes
No
4 Does the doctor told you; other disease are due to
diabetic?
Yes
No
5 How old are you?(you age 1st diagnosis with other
disease)
Age(year)----------
6 Are (were) any family member suffering from other
disease? Like kidney, retinopathy, hypertension and
neuropathy
Yes
No
Physical measurement
1 Height (in cm) In centimeter ---------------
2 Weight (in kg) In kilogram-------------------
3
Blood pressure-record three heart rate readings
SBP/ DBP (mmHg)
1.-----------2.-------- 3.-------
Average-------------beats per
minute

69
Appendix 3 P value of clinical characteristics between T2DM and Control
Group Statistics
Status of the
study
participants N Mean Std. Deviation Std. Error Mean
Gender T2DM 111 .50 .502 .048
Controls 111 .48 .502 .048
systolic T2DM 111 133.66 19.504 1.851
Controls 111 121.26 6.891 .654
diastolic T2DM 111 82.61 13.571 1.288
Controls 111 76.44 5.452 .517
BMI3 T2DM 111 24.915 4.3862 .4163
Controls 111 23.604 5.4189 .5143
glucose T2DM 111 206.37 72.398 6.872
Controls 111 78.23 15.672 1.488
cholestrol T2DM 111 194.16 47.871 4.544
Controls 111 130.47 48.934 4.645
triglycerol T2DM 111 177.54 135.330 12.845
Controls 111 99.67 56.761 5.387
ceratinine T2DM 111 .720 .2484 .0236
Controls 111 .642 .1899 .0180
Urea T2DM 111 22.23 8.326 .790
Controls 111 18.77 4.600 .437
EGFR T2DM 111 118.411 27.1582 2.5777
Controls 111 124.702 20.2433 1.9214
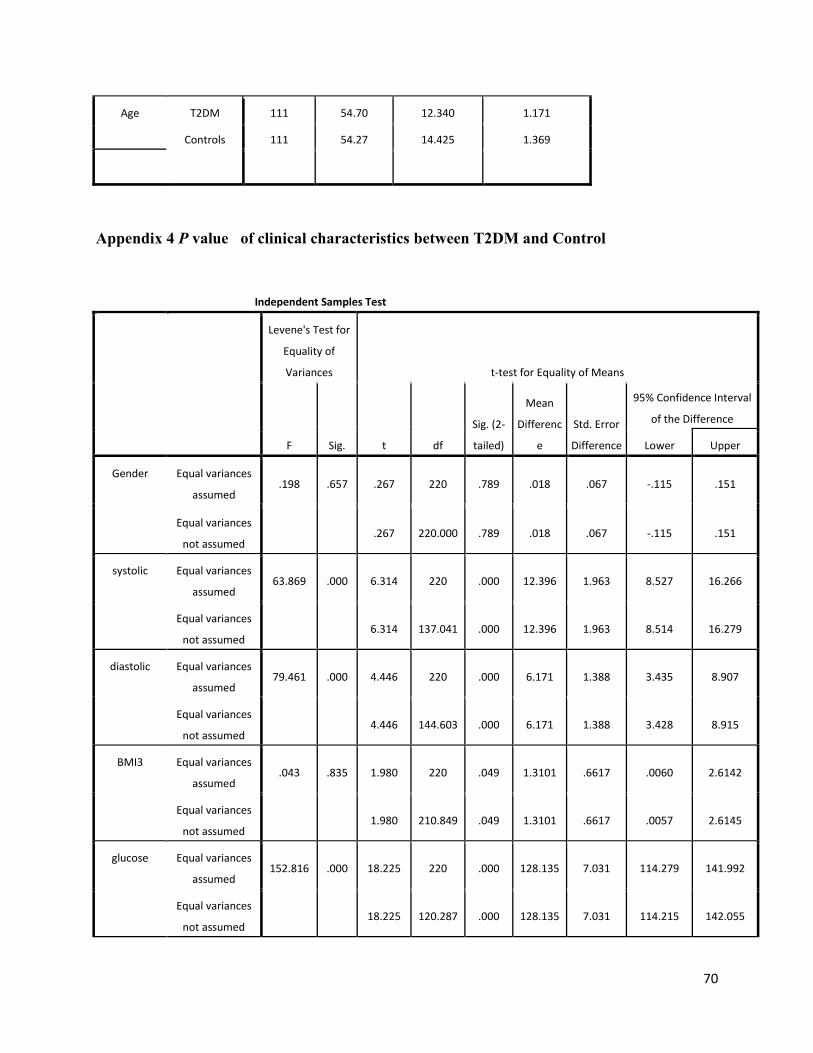
70
Appendix 4 P value of clinical characteristics between T2DM and Control
Age T2DM 111 54.70 12.340 1.171
Controls 111 54.27 14.425 1.369
Independent Samples Test
Levene's Test for
Equality of
Variances t-test for Equality of Means
F Sig. t df
Sig. (2-
tailed)
Mean
Differenc
e
Std. Error
Difference
95% Confidence Interval
of the Difference
Lower Upper
Gender Equal variances
assumed .198 .657 .267 220 .789 .018 .067 -.115 .151
Equal variances
not assumed
.267 220.000 .789 .018 .067 -.115 .151
systolic Equal variances
assumed 63.869 .000 6.314 220 .000 12.396 1.963 8.527 16.266
Equal variances
not assumed
6.314 137.041 .000 12.396 1.963 8.514 16.279
diastolic Equal variances
assumed 79.461 .000 4.446 220 .000 6.171 1.388 3.435 8.907
Equal variances
not assumed
4.446 144.603 .000 6.171 1.388 3.428 8.915
BMI3 Equal variances
assumed .043 .835 1.980 220 .049 1.3101 .6617 .0060 2.6142
Equal variances
not assumed
1.980 210.849 .049 1.3101 .6617 .0057 2.6145
glucose Equal variances
assumed 152.816 .000 18.225 220 .000 128.135 7.031 114.279 141.992
Equal variances
not assumed
18.225 120.287 .000 128.135 7.031 114.215 142.055

71
Appendix 5 Chi-Square ACE genotype distribution between type 2 diabetic and control.
Genotype result * Status of the study participants Crosstabulation
Status of the study participants
Total T2DM Controls
Genotype
result
Homozygous
Deletion
Count 77 43 120
% within Genotype
result 64.2% 35.8% 100.0%
% within Status of the
study participants 69.4% 38.7% 54.1%
cholestrol Equal variances
assumed .000 .983 9.803 220 .000 63.694 6.497 50.888 76.499
Equal variances
not assumed
9.803 219.894 .000 63.694 6.497 50.888 76.499
triglycerol Equal variances
assumed 13.623 .000 5.591 220 .000 77.874 13.929 50.422 105.325
Equal variances
not assumed
5.591 147.540 .000 77.874 13.929 50.348 105.400
ceratinine Equal variances
assumed 1.234 .268 2.610 220 .010 .0775 .0297 .0190 .1360
Equal variances
not assumed
2.610 205.858 .010 .0775 .0297 .0190 .1360
Urea Equal variances
assumed 43.732 .000 3.832 220 .000 3.459 .903 1.680 5.239
Equal variances
not assumed
3.832 171.421 .000 3.459 .903 1.677 5.242
EGFR Equal variances
assumed 3.167 .077 -1.956 220 .052 -6.2902 3.2151 -12.6265 .0460
Equal variances
not assumed
-1.956 203.400 .052 -6.2902 3.2151 -12.6293 .0489
Age Equal variances
assumed 2.604 .108 .240 220 .811 .432 1.802 -3.119 3.983
Equal variances
not assumed
.657 .240 214.851 .811 .432 1.802 -3.119 3.984

72
% of Total 34.7% 19.4% 54.1%
Hetrozygous
Insertion-deletion
Count 22 48 70
% within Genotype
result 31.4% 68.6% 100.0%
% within Status of the
study participants 19.8% 43.2% 31.5%
% of Total 9.9% 21.6% 31.5%
Homozygous
Insertion
Count 12 20 32
% within Genotype
result 37.5% 62.5% 100.0%
% within Status of the
study participants 10.8% 18.0% 14.4%
% of Total 5.4% 9.0% 14.4%
Total
Count 111 111 222
% within Genotype
result 50.0% 50.0% 100.0%
% within Status of the
study participants 100.0% 100.0% 100.0%
% of Total 50.0% 50.0% 100.0%
Appendix 6 Chi-Square ACE genotype P value between T2DM and Control
Chi-Square Tests
Value Df
Asymp. Sig. (2-
sided)
Pearson Chi-Square 21.290a 2 .000
Likelihood Ratio 21.680 2 .000
N of Valid Cases 222
a. 0 cells (.0%) have expected count less than 5. The minimum expected
count is 16.00.

73
Appendix 7 Chi-Square ACE genotype distribution among type 2 diabetic
Complications.
Genotype result * Status of the study participants Crosstabulation
Status of the study participants
Total
T2DM
t2dm with
hypertention
t2dm with
retinopathy
t2dm with
nephropathy
Genotype
result
DD Homozygous
Deletion
Count 15 32 22 8 77
% within
Genotype result 19.5% 41.6% 28.6% 10.4% 100.0%
% within Status of
the study
participants
42.9% 91.4% 73.3% 72.7% 69.4%
% of Total 13.5% 28.8% 19.8% 7.2% 69.4%
ID Hetrozygous
Insertion-deletion
Count 12 3 5 2 22
% within Genotype
result 54.5% 13.6% 22.7% 9.1% 100.0%
% within Status of
the study
participants
34.3% 8.6% 16.7% 18.2% 19.8%
% of Total 10.8% 2.7% 4.5% 1.8% 19.8%
II Homozygous
Insertion
Count 8 0 3 1 12
% within Genotype
result 66.7% .0% 25.0% 8.3% 100.0%
% within Status of
the study
participants
22.9% .0% 10.0% 9.1% 10.8%
% of Total 7.2% .0% 2.7% .9% 10.8%
Total Count 35 35 30 11 111
% within Genotype
result 31.5% 31.5% 27.0% 9.9% 100.0%
% within Status of
the study
participants
100.0% 100.0% 100.0% 100.0% 100.0%
% of Total 31.5% 31.5% 27.0% 9.9% 100.0%

74
Appendix 8 Chi-Square ACE genotype P value between T2DM and Control.
Appendix 9 Multivariate logistic regression of genotypes among type 2 diabetes and control.
Appendix 10 logistic regression of I/D allele among type 2 diabetes and control.
Variables in the Equation
B S.E. Wald df Sig. Exp(B)
95.0% C.I.for EXP(B)
Lower Upper
Step 1a D .778 .201 14.945 1 .000 2.178 1.468 3.232
Constant -1.094 .320 11.689 1 .001 .335
a. Variable(s) entered on step 1: D.
Chi-Square Tests
Value Df
Asymp. Sig. (2-
sided)
Pearson Chi-Square 20.713a 6 .002
Likelihood Ratio 23.636 6 .001
N of Valid Cases 111
a. 5 cells (41.7%) have expected count less than 5. The minimum expected
count is 1.19.
Parameter Estimates
Status of the study
participantsa B Std. Error Wald df Sig. Exp(B)
95% Confidence Interval for Exp(B)
Lower Bound Upper Bound
T2DM Intercept -.511 .365 1.957 1 .162
[genotype=DD] 1.093 .412 7.050 1 .008 2.984 1.332 6.689
[genotype=ID] -.269 .447 .363 1 .547 .764 .318 1.834
[genotype=II] 0b . . 0 . . . .
a. The reference category is: Controls.
b. This parameter is set to zero because it is redundant.

75
B S.E. Wald df Sig. Exp(B)
95.0% C.I.for EXP(B)
Lower Upper
Step 1a I -.778 .201 14.945 1 .000 .459 .309 .681
Constant .463 .180 6.582 1 .010 1.589
a. Variable(s) entered on step 1: I.
Appendix 11: Online calculating formula of eGFR by using CKD-EPI equation.
CKD-EPI equation calculator should be used when Scr reported in mg/dL. This equation is
recommended when eGFR values above 60 mL/min/1.73 m2 are desired.
GFR = 141 × min (Scr /κ, 1)α × max(Scr /κ, 1)-1.209 × 0.993Age × 1.018 [if female] × 1.159 [if
black]
where:
Scr is serum creatinine in mg/dL,
κ is 0.7 for females and 0.9 for males,
α is -0.329 for females and -0.411 for males,
min indicates the minimum of Scr /κ or 1, and
max indicates the maximum of Scr /κ or 1.
The equation does not require weight because the results are reported normalized to 1.73 m2
body surface area, which is an accepted average adult surface area.
Serum creatinine (mg/dL)
Age*
African American Yes No
Gender Male Female
GFR value: mL/ min/1.73 m2**
*This equation should only be used for patients 18 and older.
The National Kidney Disease Epidemiology Program presently recommends reporting estimated
GFR values greater than or equal to 60 mL/min/1.73 m2 simply as "≥60 mL/min/1.73 m2", not
an exact number.
Calculate Clear
Copyright © 2022 FDOKUMEN