Classification of Iranian bottled waters as indicated by manufacturer’s labellings
6
Analytical Methods Classification of Iranian bottled waters as indicated by manufacturer’s labellings K. Yekdeli Kermanshahi a , R. Tabaraki a, * , H. Karimi b , M. Nikorazm c , S. Abbasi c a Chemometrics Lab, Department of Chemistry, Faculty of Science, Ilam University, Ilam, Iran b Faculty of Agriculture, Ilam University, Ilam, Iran c Department of Chemistry, Faculty of Science, Ilam University, Ilam, Iran article info Article history: Received 31 December 2008 Received in revised form 24 June 2009 Accepted 29 November 2009 Keywords: Bottled water Cluster analysis Principal component analysis Chemometrics abstract Water is the most important substance in our daily lives and contains minerals which play an important role in our nutrition. In this study, the chemical composition of Iranian bottled water brands were inves- tigated by correlation analysis, principal component analysis and hierarchical cluster analysis. For this purpose, the chemical composition reported on the label of 73 Iranian bottled waters was used as data set. It was found out that only 26 brands had eight important parameters such as calcium, magnesium, potassium, sodium, chloride, sulphate, bicarbonate and fluoride and 20 brands had acceptable charge bal- ance error. Results showed that Iranian bottled waters can be divided into 11 classes. Most of them were Ca–Mg–HCO 3 type. The relationships among selected variables were also examined by Piper diagram. The best brands were introduced for common customers and kidney stone patients. The chemical content of Iranian bottled water brands was also compared with some world standards. It was observed that only one of the brands had fluoride in excess compare to that of standard values. Ó 2009 Elsevier Ltd. All rights reserved. 1. Introduction The world market of bottled water has grown quickly and is considered as a global billion dollar business (Güler, 2007a, 2007b; Ikem, Odueyungbo, Egiebor, & Nyavor, 2002; Versari, Parpi- nello, & Galassi, 2002). In the countries such as the United Arab Emirates, nearly 90% of the population drinks bottled mineral water (Nsanze, Babarinde, & Al Kohaly, 1999). The dramatic increase in the consumption of bottled water worldwide has been attributed to the consumers’ concern over increasing water pollution and their objection to offensive tastes and odours such as chlorine from municipal water supplies and bacterial contamination (Saleh, Ewane, Jones, & Wilson, 2001). An- other reason is a common belief that mineral waters have benefi- cial medicinal and therapeutic effects (Warburton, Dodds, Burke, Johnston, & Laffey, 1992). Apart from the use of bottled water as drinking water, it has found wide usage in infant formula prepara- tion, reconstituting other foods, also for cleaning contact lenses, skin care and filling humidifiers. The ideal bottled water should be rich in magnesium and cal- cium and have low sodium content (Garzon & Eisenberg, 1998). Epidemiologic and clinical studies suggest that magnesium may reduce the frequency of sudden death, sodium contributes to the occurrence of hypertension, and calcium may help prevent osteo- porosis (Garzon & Eisenberg, 1998). This will help individuals to achieve the recommended daily allowances of these minerals. Be- cause wide variations exist in the mineral contents of commer- cially available bottled waters, further information on the characterisation of Iranian bottled water is needed to protect the consumers and to draw guidelines for quality control and the reg- ulation of this industry. Multivariate analysis is widely used for food quality evaluation and differentiation or classification of food samples. Among the dif- ferent multivariate techniques, cluster analysis (CA) and principal component analysis (PCA) are great potential for classification of problems. The purpose of this paper is: (1) to investigate the chemical characteristic of domestic brands of bottled water sold in Iran (2) to classify them by utilising parameters reported on their govern- ment issued production licenses (3) to compare the chemical com- position of water samples with world standards. 2. Materials and methods 2.1. Bottled water database The chemical compositions reported on the label of 73 bottled waters were used as data set for this study. This data was obtained generally by purchasing the bottled waters from different super- markets in the Iranian cities and by telephone or electronic mail to manufacturers. The chemical parameter determinations were carried out and certified by official laboratories of analysis and their accuracy and precision were not questioned in this study. 0308-8146/$ - see front matter Ó 2009 Elsevier Ltd. All rights reserved. doi:10.1016/j.foodchem.2009.11.067 * Corresponding author. Tel./fax: +98 841 2227022. E-mail address: [email protected] (R. Tabaraki). Food Chemistry 120 (2010) 1218–1223 Contents lists available at ScienceDirect Food Chemistry journal homepage: www.elsevier.com/locate/foodchem
Transcript of Classification of Iranian bottled waters as indicated by manufacturer’s labellings

Food Chemistry 120 (2010) 1218–1223
Contents lists available at ScienceDirect
Food Chemistry
journal homepage: www.elsevier .com/locate / foodchem
Analytical Methods
Classification of Iranian bottled waters as indicated by manufacturer’s labellings
K. Yekdeli Kermanshahi a, R. Tabaraki a,*, H. Karimi b, M. Nikorazm c, S. Abbasi c
a Chemometrics Lab, Department of Chemistry, Faculty of Science, Ilam University, Ilam, Iranb Faculty of Agriculture, Ilam University, Ilam, Iranc Department of Chemistry, Faculty of Science, Ilam University, Ilam, Iran
a r t i c l e i n f o a b s t r a c t
Article history:Received 31 December 2008Received in revised form 24 June 2009Accepted 29 November 2009
Keywords:Bottled waterCluster analysisPrincipal component analysisChemometrics
0308-8146/$ - see front matter � 2009 Elsevier Ltd. Adoi:10.1016/j.foodchem.2009.11.067
* Corresponding author. Tel./fax: +98 841 2227022E-mail address: [email protected] (R. Tabar
Water is the most important substance in our daily lives and contains minerals which play an importantrole in our nutrition. In this study, the chemical composition of Iranian bottled water brands were inves-tigated by correlation analysis, principal component analysis and hierarchical cluster analysis. For thispurpose, the chemical composition reported on the label of 73 Iranian bottled waters was used as dataset. It was found out that only 26 brands had eight important parameters such as calcium, magnesium,potassium, sodium, chloride, sulphate, bicarbonate and fluoride and 20 brands had acceptable charge bal-ance error. Results showed that Iranian bottled waters can be divided into 11 classes. Most of them wereCa–Mg–HCO3 type. The relationships among selected variables were also examined by Piper diagram. Thebest brands were introduced for common customers and kidney stone patients. The chemical content ofIranian bottled water brands was also compared with some world standards. It was observed that onlyone of the brands had fluoride in excess compare to that of standard values.
� 2009 Elsevier Ltd. All rights reserved.
1. Introduction
The world market of bottled water has grown quickly and isconsidered as a global billion dollar business (Güler, 2007a,2007b; Ikem, Odueyungbo, Egiebor, & Nyavor, 2002; Versari, Parpi-nello, & Galassi, 2002). In the countries such as the United ArabEmirates, nearly 90% of the population drinks bottled mineralwater (Nsanze, Babarinde, & Al Kohaly, 1999).
The dramatic increase in the consumption of bottled waterworldwide has been attributed to the consumers’ concern overincreasing water pollution and their objection to offensive tastesand odours such as chlorine from municipal water supplies andbacterial contamination (Saleh, Ewane, Jones, & Wilson, 2001). An-other reason is a common belief that mineral waters have benefi-cial medicinal and therapeutic effects (Warburton, Dodds, Burke,Johnston, & Laffey, 1992). Apart from the use of bottled water asdrinking water, it has found wide usage in infant formula prepara-tion, reconstituting other foods, also for cleaning contact lenses,skin care and filling humidifiers.
The ideal bottled water should be rich in magnesium and cal-cium and have low sodium content (Garzon & Eisenberg, 1998).Epidemiologic and clinical studies suggest that magnesium mayreduce the frequency of sudden death, sodium contributes to theoccurrence of hypertension, and calcium may help prevent osteo-porosis (Garzon & Eisenberg, 1998). This will help individuals to
ll rights reserved.
.aki).
achieve the recommended daily allowances of these minerals. Be-cause wide variations exist in the mineral contents of commer-cially available bottled waters, further information on thecharacterisation of Iranian bottled water is needed to protect theconsumers and to draw guidelines for quality control and the reg-ulation of this industry.
Multivariate analysis is widely used for food quality evaluationand differentiation or classification of food samples. Among the dif-ferent multivariate techniques, cluster analysis (CA) and principalcomponent analysis (PCA) are great potential for classification ofproblems.
The purpose of this paper is: (1) to investigate the chemicalcharacteristic of domestic brands of bottled water sold in Iran (2)to classify them by utilising parameters reported on their govern-ment issued production licenses (3) to compare the chemical com-position of water samples with world standards.
2. Materials and methods
2.1. Bottled water database
The chemical compositions reported on the label of 73 bottledwaters were used as data set for this study. This data was obtainedgenerally by purchasing the bottled waters from different super-markets in the Iranian cities and by telephone or electronic mailto manufacturers. The chemical parameter determinations werecarried out and certified by official laboratories of analysis andtheir accuracy and precision were not questioned in this study.
K. Yekdeli Kermanshahi et al. / Food Chemistry 120 (2010) 1218–1223 1219
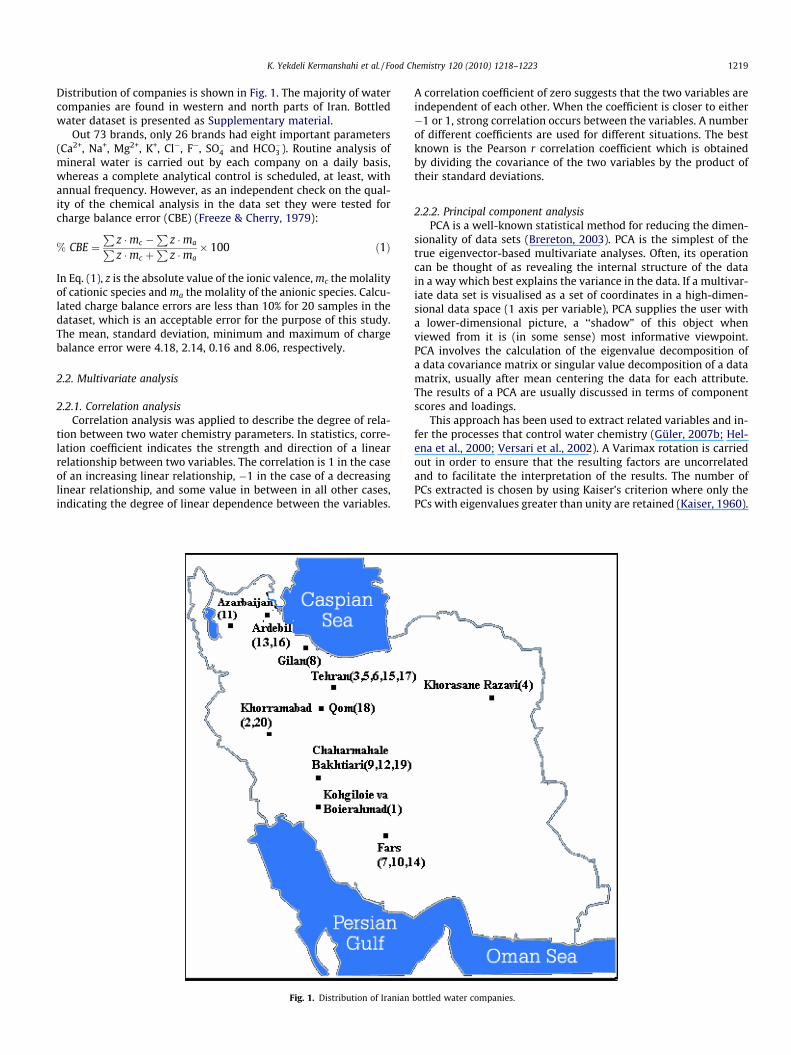
Distribution of companies is shown in Fig. 1. The majority of watercompanies are found in western and north parts of Iran. Bottledwater dataset is presented as Supplementary material.
Out 73 brands, only 26 brands had eight important parameters(Ca2+, Na+, Mg2+, K+, Cl�, F�, SO�4 and HCO�3 ). Routine analysis ofmineral water is carried out by each company on a daily basis,whereas a complete analytical control is scheduled, at least, withannual frequency. However, as an independent check on the qual-ity of the chemical analysis in the data set they were tested forcharge balance error (CBE) (Freeze & Cherry, 1979):
% CBE ¼P
z �mc �P
z �maPz �mc þ
Pz �ma
� 100 ð1Þ
In Eq. (1), z is the absolute value of the ionic valence, mc the molalityof cationic species and ma the molality of the anionic species. Calcu-lated charge balance errors are less than 10% for 20 samples in thedataset, which is an acceptable error for the purpose of this study.The mean, standard deviation, minimum and maximum of chargebalance error were 4.18, 2.14, 0.16 and 8.06, respectively.
2.2. Multivariate analysis
2.2.1. Correlation analysisCorrelation analysis was applied to describe the degree of rela-
tion between two water chemistry parameters. In statistics, corre-lation coefficient indicates the strength and direction of a linearrelationship between two variables. The correlation is 1 in the caseof an increasing linear relationship, �1 in the case of a decreasinglinear relationship, and some value in between in all other cases,indicating the degree of linear dependence between the variables.
Fig. 1. Distribution of Iranian
A correlation coefficient of zero suggests that the two variables areindependent of each other. When the coefficient is closer to either�1 or 1, strong correlation occurs between the variables. A numberof different coefficients are used for different situations. The bestknown is the Pearson r correlation coefficient which is obtainedby dividing the covariance of the two variables by the product oftheir standard deviations.
2.2.2. Principal component analysisPCA is a well-known statistical method for reducing the dimen-
sionality of data sets (Brereton, 2003). PCA is the simplest of thetrue eigenvector-based multivariate analyses. Often, its operationcan be thought of as revealing the internal structure of the datain a way which best explains the variance in the data. If a multivar-iate data set is visualised as a set of coordinates in a high-dimen-sional data space (1 axis per variable), PCA supplies the user witha lower-dimensional picture, a ‘‘shadow” of this object whenviewed from it is (in some sense) most informative viewpoint.PCA involves the calculation of the eigenvalue decomposition ofa data covariance matrix or singular value decomposition of a datamatrix, usually after mean centering the data for each attribute.The results of a PCA are usually discussed in terms of componentscores and loadings.
This approach has been used to extract related variables and in-fer the processes that control water chemistry (Güler, 2007b; Hel-ena et al., 2000; Versari et al., 2002). A Varimax rotation is carriedout in order to ensure that the resulting factors are uncorrelatedand to facilitate the interpretation of the results. The number ofPCs extracted is chosen by using Kaiser’s criterion where only thePCs with eigenvalues greater than unity are retained (Kaiser, 1960).
bottled water companies.

Table 1Chemical composition of major constituents reported on the label of 73 Iranian bottled waters.
Parameter Mineral water (53brands) Drinking water (20 brands)
na Mean ± SD Minimum–maximum na Mean ± SD Minimum–maximum
Calcium (mg L�1) 52 50 ± 33 8–248 20 33 ± 8 3.2–85.4Magnesium (mg L�1) 52 12 ± 7 1.40–26.70 20 12 ± 8 5–35Sodium (mg L�1) 47 8 ± 1 0.1–48 16 17 ± 16 2–48Potassium (mg L�1) 48 1 ± 2 0.1–7 16 1 ± 0.8 0.4–3Chloride (mg L�1) 45 12 ± 13 0.0001–60 19 36 ± 43 7–170Sulphate (mg L�1) 45 27 ± 40 0.33–195 19 37 ± 30 3.16–100Bicarbonate (mg L�1) 31 179 ± 99 0.44–585 8 106 ± 56 22.5–197.27Fluoride (mg L�1) 38 0.4 ± 0.5 0.04–2.9 9 0.4 ± 0.3 0.1–0.85Iron (mg L�1) 8 0.04 ± 0.07 0.01–0.18 – – –Nitrate (mg L�1) 28 5 ± 4 0.1–19 10 8 ± 5 2–17Phosphate (mg L�1) 6 0.1 ± 0.1 0.01–0.31 – – –pH 39 7.4 ± 0.2 7–7.96 14 7.4 ± 0.3 7–8.03
a Number of sample.
1220 K. Yekdeli Kermanshahi et al. / Food Chemistry 120 (2010) 1218–1223
2.2.3. Hierarchical cluster analysisClustering is known as the classification of objects into different
groups, or more precisely, the partitioning of a data set into subsets(clusters), so that the data in each subset (ideally) share some com-mon trait – often proximity according to some defined distancemeasure. Data clustering is a common technique for statistical dataanalysis, which is used in many fields, including machine learning,data mining, pattern recognition, image analysis and bioinformat-ics (Beebe, Pell, & Seasholtz, 1998; Brereton, 2003).
Hierarchical cluster analysis (HCA) is an unsupervised tech-nique that examines the interpoint distances between all of thesamples and represents that information in the form of a twodimensional plot called a dendrogram (Brereton, 2003). Thesedendrograms present the data from high dimensional row spacesin a form that facilitates the use of human pattern recognition abil-ities (Brereton, 2003).
In order to generate the dendrogram, HCA methods form clus-ters of samples based on their nearness in row space. Initially everysample is considered as a cluster and join closest clusters together.This process is repeated until only one cluster remains. Variation ofHCA use different approaches to measure distances between clus-ters (e.g., single, Euclidean and Mahalanobis distance). The linkagerules iteratively link nearby points (similar samples) by using thesimilarity (distance) matrix (Beebe et al., 1998; Brereton, 2003).The initial cluster is formed by linkage of the two samples withthe greatest similarity. Ward’s method is distinct from all othermethods because it uses an analysis of variance (ANOVA) approachto evaluate the distances between clusters and forms smaller dis-tinct clusters than those formed by other methods (Ward, 1963).The Euclidian distance was selected as the similarity measurement,which is straight line distance between two points in c-dimen-sional space defined by c number of variables.
2.3. Software
Statistics and chemometrics data analysis was performed bymeans of the MATLAB 7.1. MathWorks Inc. (2005) and MINITAB14. Minitab Inc. (2003) softwares.
3. Results and discussion
3.1. Chemical characteristics of bottled waters
The mean, standard deviation, minimum and maximum valuesof the 12 chemical parameters of 73 bottled water brands weredetermined and presented in Table 1. For most elements the differ-ence between the lowest and the highest concentration was one tothree orders of magnitude. These large variations can be attributed
to the different geological origins of the waters. The chemical com-position of natural waters is controlled by many factors such aschemistry of atmospheric precipitation, mineralogy of the rocksencountered along the underground flow path, residence time ofthe groundwater in the aquifer, climate and topography of the area(Güler, Thyne, McCray, & Turner, 2002).
To get an insight into natural diversity in the composition ofmineral waters, the type of water is defined by all ionic constitu-ents that contribute at least 20% meq to the total anionic or cat-ionic composition of water, where total equivalents of cationsand anions were recorded as 100% (Table 2). 11 different watertypes were identified. The most frequently observed type is Ca–Mg–HCO3. However, there are no two drinking water brands thatwere classified in the same water type. The type of water doesnot give detailed information about the composition of a watersample.
Different graphical and statistical techniques have been devel-oped to describe the concentration or relative abundance of majorand minor constituents and the pattern of variability in differentwater samples. These techniques are Collins bar diagram, pie dia-gram, Stiff pattern diagram, Schoeller plot, Piper diagram, hierar-chical cluster analysis, principal component analysis (Güler et al.,2002). One of the most common graphical approaches to describethe abundance or relative abundance of ions in individual watersamples is Piper diagram (Piper, 1944). To construct the Piper dia-gram, the relative abundance of cations with the % meq L�1 ofNa + K, Ca and Mg is first plotted on the cation triangle. The relativeabundance of Cl, SO4, and HCO3 + CO3 is then plotted on the aniontriangle. The two data point on the cation and anion triangles arethen combined into the quadrilateral field that shows the overallchemical property of the water sample. Piper diagram of the 20 Ira-nian bottled waters was shown in Fig. 2. Most of the brands are cal-cium, magnesium and bicarbonate type waters. As shown inTable 2, all of the water classes had calcium and eight classeshad bicarbonate. Multivariate pattern recognition methods wereutilised to discriminate between separate groups (types or clus-ters) of water samples.
3.2. Multivariate analysis
Multivariate pattern recognition methods were utilised to sortbottled water brands into groups or clusters. Associations amongvariables can be demonstrated statistically by correlation analysis.In correlation analysis, Pearson r correlation coefficients are calcu-lated for all possible pairs of variables. The results were shown thathigh significant correlation coefficient exist between Ca and HCO3
(r = 0.907) and Na and SO4 (r = 0.730).

Table 2Classification of the 20 bottled water brands based on total hardness.
Brand Water type Total hardness Water quality based on total hardness
1 Aqua prime Ca–HCO3 115 Hard2 Bisheh Ca–Cl–HCO3 232 Very hard3 Polur Ca–Mg–HCO3 111 Hard4 Dasani Ca–Mg–Na–Cl 203 Very hard5 Damavand Ca–Mg–Cl–SO4 204 Very hard6 Surperize Ca–Na–Cl–SO4 68 Moderately hard7 Sepidan Ca–HCO3 154 Very hard8 Siva sar Ca–Mg–HCO3 115 Hard9 Saman Ca–Mg–HCO3 142 Hard
10 Sheshpeer Ca–K–HCO3 146 Hard11 Kandowan Ca–Mg–Na–HCO3 114 Hard12 Kooh rang Ca–Mg–HCO3 240 Very hard13 Mah rooz Ca–Mg–HCO3 189 Very hard14 Margoon Ca–Mg–HCO3 170 Very hard15 Mabda Ca–Na–SO4–HCO3 68 Moderately hard16 Vata Ca–Mg–Na–SO4–HCO3 34 Soft17 Pure life Ca–Mg–HCO3 106 Hard18 Persab Ca–SO4–HCO3 238 Very hard19 Dimeh Ca–HCO3 162 Very hard20 Gahar Ca–Mg–HCO3 141 Hard
Bold names are drinking water brands.
Fig. 2. Piper diagram of the 20 Iranian bottled water.
K. Yekdeli Kermanshahi et al. / Food Chemistry 120 (2010) 1218–1223 1221
PCA technique was used to reduce the number of dimensionspresent in the data matrix (reducing eight variables to three PCsin this study). Also this technique was used to select the most dis-criminating parameters, and to investigate the overall variation ofdata. Rotation of principal components was carried out using theVarimax normalised method and only factors with eigenvalues
greater than one were taken into consideration (Kaiser criterion).Varimax normalised procedure for eigenvector rotation resultedin three principal components (PC1, PC2 and PC3), which explained81.5% of the total variance. The result of the PCA analysis of bottledwater brands was shown in Fig. 3. The PC1, PC2 and PC3 contain45.3%, 23.3% and 12.8% of total variance, respectively. As Fig. 3

Fig. 3. Score plot: (a) PC1 vs. PC2 and (b) PC1 vs. PC3 of Iranian bottled waters.
Fig. 4. Hierarchical dendrogram from the HCA for the 20 bottled water brands.
1222 K. Yekdeli Kermanshahi et al. / Food Chemistry 120 (2010) 1218–1223
shows, one of the mineral water (brand 6) and one drinking water(brand 4) are clearly different from the others.
Hierarchical cluster analysis (HCA) was used for searching thenatural grouping among bottled waters from different sources.The bottled water brands were classified according to their majorion composition. The data were standardised (z-scores) and theEuclidean distance was used as similarity measurement. The
Ward’s method was used to obtain hierarchical associations. Theresult of the HCA is presented as a dendrogram (Fig. 4). The result-ing dendrogram had four major groups based on a similarity ofeight parameters. The first group is composed of brand 6 (mineral)and brand 4 (drinking). The second group is comprised three min-eral waters and one drinking water. The third and forth groups arecomposed of the remaining brands.
3.3. Health implications of bottled water consumption
Recommended dietary allowance has proposed a minimum dai-ly required intake for magnesium (350 mg) and calcium (800 mg).For sodium, a maximum intake of 2400 mg has been recommended(Heany, Gallagher, & Johnston, 1982; Whitney, Corinne, & Sharon,1991). Because the estimated minimum daily requirement of so-dium for an adult (500 mg per day) is easily achieved in most diets,no minimum recommended intake of sodium has been set (Whit-ney et al., 1991). A highly significant relationship has been ob-served between average blood pressure and sodium intake inmany populations around the world (McCarron, Holly, & Morris,1982).
Due to differences in absorbance, magnesium bioavailabilitymay be greater from water than from food sources (Eisenberg,1992; Jones, Manalo, & Flink, 1967). Cardiovascular disease ratesmay be inversely related to water hardness. Rates of cardiovascularmortality and sudden death are 10–30% greater in soft water areas(low in magnesium or calcium) than in hard areas (high in magne-sium or calcium) (Anderson & LeRiche, 1971; Anderson, LeRiche, &MacKay, 1969).
Naturally bioavailability calcium is found almost exclusively inmilk, milk products, water and few vegetables such as parsley,broccoli and kale (Whitney et al., 1991). Nutritional surveys indi-cate that the calcium intake in many populations is below the dailyrecommendation (Whitney et al., 1991). The bioavailability of cal-cium in water is believed to be at least as high as that of milk andmilk products (Couzy, Kastenmayer, & Vigo, 1995; Heany & Dowell,1994). Therefore, selecting bottled water with high calcium con-tent may help to achieve the daily recommended intake. On theother hand, ingesting too much calcium may lead to the formationof kidney stones (Coe, Parks, & Asplin, 1992). As low calcium diet(400–600 mg daily) has been suggested as a preventive treatmentfor patients with a history of kidney stone formation might benefitfrom avoiding bottled waters with high calcium content.
Drinking water that is high in magnesium and calcium and lowin sodium will help individuals achieve the recommended dailyallowances of these minerals (Garzon & Eisenberg, 1998). Asshown in Table 2, the water classes that have Ca and Mg and havenot Na are the best. Therefore, Mahrooz, Sivasar, Polur, Koohrang,Saman, Margoon, Gahar and Damavand (mineral water brands)and Purelife (drinking water brand) are the best bottled waters.
Since calcium carbonate is one of the more common causes ofhardness, total hardness is usually reported in terms of calciumcarbonate concentration (mg L�1 as CaCO3). Total hardness ofwater samples was calculated by Eq. (2) (Crittenden, Rhodes Trus-sell, Hand, Howe, & Tchobanoglous, 2005) and listed in Table 2.Waters are typically classified as soft (0–50 mg L�1 as CaCO3),moderately hard (50–100 mg L�1 as CaCO3), hard (100–150 mg L�1
as CaCO3) and very hard (above 150 mg L�1 as CaCO3) (Crittendenet al., 2005).
Total hardness ¼ 2:5½Ca� þ 4:1½Mg� ð2Þ
where [Ca] is calcium concentration (mg L�1).The soft water is the best for kidney patients, since selected
brand is Vata (mineral water).A review of the current regulations was made and compared to
several standards around the world including European Economic

K. Yekdeli Kermanshahi et al. / Food Chemistry 120 (2010) 1218–1223 1223
Community (EEC), World Health Organisation (WHO), US Environ-mental Protection Agency (EPA), International Bottled Water Asso-ciation (IBWA) and US Food and Drug Administration (FDA) (Güler,2007a). Results showed that all Iranian brands contain calcium,magnesium, potassium, sodium, chloride, sulphate and bicarbon-ate below the maximum allowable level. Only one of the brands(Surprize with 2.9 mg L�1 fluoride) was exceeded from the stan-dards. The maximum concentration allowed for fluoride are EEC(1.5 mg L�1), WHO (1.5 mg L�1), EPA (2 mg L�1), IBWA (1.7 mg L�1)and FDA (2.4 mg L�1).
4. Conclusion
The quality of water for human consumption has always beenand still is one of the most serious challenges. In this study, 73 Ira-nian bottled water brands were characterised by descriptive statis-tical measures (mean, minimum and maximum). There is a largevariation in the water composition of different brands. Twenty-six brands of Iranian bottled waters had eight major ions data;therefore it is important to establish norms to regulate the qualityand labelling of bottled waters. Twenty out of 26 brands hadacceptable charge balance error, thus data of these 20 brands weresubjected to different pattern recognition methods such as correla-tion analysis, PCA and HCA. Eleven different water types wereidentified in which the most frequently observed type were Ca–Mg–HCO3. Based on PCA results, one mineral water (brand 6)and one drinking water (brand 4), are completely separated fromthe others. On the basis of connecting distances between parame-ters, four clusters were distinguished. HCA confirmed the results ofPCA. The best brands were introduced for common customers andkidney stone patients. The chemical content of Iranian bottledwater brands was also compared with some world standards.
Appendix A. Supplementary material
Supplementary data associated with this article can be found, inthe online version, at doi:10.1016/j.foodchem.2009.11.067.
References
Anderson, T. W., & LeRiche, W. H. (1971). Sudden death and ischemic heart diseasein Ontario and its correlation with water hardness and other factors. CanadianMedical Association Journal, 105, 155–160.
Anderson, T. W., LeRiche, W. H., & MacKay, J. S. (1969). Sudden death and ischemicheart disease: Correlation with hardness of local water supply. New EnglandJournal of Medicine, 280, 805–807.
Beebe, K. R., Pell, R. J., & Seasholtz, M. B. (1998). Chemometrics: A practical guide. NewYork: John Wiley.
Brereton, R. G. (2003). Chemometrics: Data analysis for the laboratory and chemicalplant. Chichester: Springer.
Coe, F. L., Parks, J. H., & Asplin, J. R. (1992). The pathogenesis and treatment ofkidney stones. New England Journal of Medicine, 327, 1141–1152.
Couzy, F., Kastenmayer, P., & Vigo, M. (1995). Calcium bioavailability from a calciumand sulfate rich mineral water, compared with milk, in young adult women.American Journal of Clinical Nutrition, 62, 1239–1244.
Crittenden, J. C., Rhodes Trussell, R., Hand, D. W., Howe, K. J., & Tchobanoglous, G.(2005). Water treatment: Principles and design (2nd ed.). John Wiley.
Eisenberg, M. J. (1992). Magnesium deficiency and sudden death. American HeartJournal, 124, 544–549.
Freeze, R. A., & Cherry, J. A. (1979). Groundwater. Englewood Cliffs, NJ: Printice-Hall.Garzon, P., & Eisenberg, M. J. (1998). Variation in the mineral content of
commercially available bottled waters: Implications for health and disease.The American Journal of Medicine, 105, 125–130.
Güler, C. (2007a). Evaluation of maximum contaminant levels in Turkish bottleddrinking waters utilizing parameters reported on manufacturer’s labeling andgovernment-issued production licences. Journal of Food Composition andAnalysis, 20(3–4), 262–272.
Güler, C. (2007b). Characterization of Turkish bottled waters using patternrecognition methods. Chemometrics and Intelligent Laboratory Systems, 86,86–94.
Güler, C., Thyne, G. D., McCray, J. E., & Turner, A. K. (2002). Evaluation of graphicaland multivariate statistical methods for classification of water chemistry data.Hydrogeology Journal, 10(4), 455–474.
Heany, R. P., & Dowell, M. S. (1994). Absorbability of the calcium in a high-calciummineral water. Osteoporos International, 4, 323–324.
Heany, R. P., Gallagher, J. C., & Johnston, C. C. (1982). Calcium nutrition and bonehealth in the elderly. American Journal of Clinical Nutrition, 36, 986–1013.
Helena, B., Pardo, R., Vega, M., Barrado, E., Fernandez, J. M., & Fernandez, L. (2000).Temporal evolution of ground water composition in an alluvial aquifer(Pisuerga River, Spain) by principal component analysis. Water Research, 34,807–816.
Ikem, A., Odueyungbo, S., Egiebor, N. O., & Nyavor, K. (2002). Chemical quality ofbottled waters from three cities in eastern Alabama. The Science of the TotalEnvironment, 285, 165–175.
Jones, J. E., Manalo, R., & Flink, E. B. (1967). Magnesium requirements in adults.American Journal of Clinical Nutrition, 20, 632–635.
Kaiser, H. F. (1960). The application of electronic computers to factor analysis.Educational and Psychological Measurement, 20, 141–151.
MATLAB 7.1. MathWorks Inc. (2005).McCarron, D. A., Holly, H. J., & Morris, C. D. (1982). Human nutrition and blood
pressure regulation: An integrated approach. Hypertention, 4, 2–13.MINITAB 14. Minitab Inc. (2003).Nsanze, H., Babarinde, Z., & Al Kohaly, H. (1999). Microbiological quality of bottled
drinking water in the UAE and the effect of storage at different temperatures.Environment International, 25, 53–57.
Piper, A. M. (1944). A graphic procedure in the geochemical interpretation of wateranalyses. Transactions of the American Geophysical Union, 25, 914–923.
Saleh, M. A., Ewane, E., Jones, J., & Wilson, B. L. (2001). Chemical evaluation ofcommercial bottled drinking water from Egypt. Journal of Food Composition andAnalysis, 14, 127–152.
Versari, A., Parpinello, J. P., & Galassi, S. (2002). Chemometrics survey of Italianbottled mineral waters by means of their labeled physico-chemical andchemical composition. Journal of Food Composition and Analysis, 15, 251–264.
Warburton, D. W., Dodds, K. L., Burke, R., Johnston, M. A., & Laffey, P. J. (1992). Areview of the microbiological quality of bottled water sold in Canada between1981 and 1989. Canadian Journal of Microbiology, 38, 12–19.
Ward, J. H. (1963). Hierarchical grouping to optimize an objective function. Journalof American Statistics Association, 69, 236–244.
Whitney, E. N., Corinne, B. C., & Sharon, R. R. (1991). Understanding normal andclinical nutrition (3rd ed.). St. Paul: West Publishing.