
Classification of intelligence quotient via brainwave sub-band power ratio features and artificial...
10
c o m p u t e r m e t h o d s a n d p r o g r a m s i n b i o m e d i c i n e 1 1 4 ( 2 0 1 4 ) 50–59 j o ur na l ho me pag e: www.intl.elsevierhealth.com/journals/cmpb Classification of intelligence quotient via brainwave sub-band power ratio features and artificial neural network A.H. Jahidin ∗ , M.S.A. Megat Ali, M.N. Taib, N.Md. Tahir, I.M. Yassin, S. Lias Faculty of Electrical Engineering, Universiti Teknologi MARA, 40450 Shah Alam, Selangor, Malaysia a r t i c l e i n f o Article history: Received 6 February 2013 Received in revised form 21 January 2014 Accepted 23 January 2014 Keywords: Intelligence quotient (IQ) EEG Sub-band power ratio Artificial neural network (ANN) White Gaussian noise a b s t r a c t This paper elaborates on the novel intelligence assessment method using the brainwave sub-band power ratio features. The study focuses only on the left hemisphere brainwave in its relaxed state. Distinct intelligence quotient groups have been established earlier from the score of the Raven Progressive Matrices. Sub-band power ratios are calculated from energy spectral density of theta, alpha and beta frequency bands. Synthetic data have been generated to increase dataset from 50 to 120. The features are used as input to the artificial neural network. Subsequently, the brain behaviour model has been developed using an artificial neural network that is trained with optimized learning rate, momentum constant and hidden nodes. Findings indicate that the distinct intelligence quotient groups can be classified from the brainwave sub-band power ratios with 100% training and 88.89% testing accuracies. © 2014 Elsevier Ireland Ltd. All rights reserved. 1. Introduction Cognitive performance, described in terms of intelligence is characterized by information processing capabilities of the brain [1]. The ability differs between individuals [2] and is influenced by time [3] and experiential learning [4]. The under- lying model of intelligence has been established through the neural efficiency theory [5]. The theory states that brighter individuals are less mentally active than people with aver- age intellectual ability [6]. This is achieved through focused use of resting brain and disuse of irrelevant brain area for good task performance [7]. The phenomenon is reflected by lower glucose metabolism in brighter individuals [8]. Although receiving criticism [9], the theory has been reinforced through a variety of studies employing different neurophysiological ∗ Corresponding author. Tel.: +60 12 6194590. E-mail address: [email protected] (A.H. Jahidin). measurement methods and a broad range of cognitive task demands [10]. Mental processing is performed by the frontal cortex. It performs executive functions of the brain which include the ability to regulate emotion, anticipate and plan for the future, make rational decisions and shape behaviour towards attain- ment of motivational goals. The functionality of the frontal cortex can further be divided into the left and right hemi- spheres where different regions exhibits different cognitive ability. The left hemisphere is involved in sequential and logic processes. The right hemisphere however, is specialized for social interactions and emotional capabilities [11]. Psychometric tests have been established to gauge an individual’s ability on various aspects of intelligence. This would include the intelligence quotient (IQ), working mem- ory capacity, non-reasoning tasks, problem solving, learning 0169-2607/$ – see front matter © 2014 Elsevier Ireland Ltd. All rights reserved. http://dx.doi.org/10.1016/j.cmpb.2014.01.016
-
Upload
independent -
Category
Documents
-
view
6 -
download
0
Transcript of Classification of intelligence quotient via brainwave sub-band power ratio features and artificial...

c o m p u t e r m e t h o d s a n d p r o g r a m s i n b i o m e d i c i n e 1 1 4 ( 2 0 1 4 ) 50–59
j o ur na l ho me pag e: www.int l .e lsev ierhea l th .com/ journa ls /cmpb
Classification of intelligence quotient viabrainwave sub-band power ratio features andartificial neural network
A.H. Jahidin ∗, M.S.A. Megat Ali, M.N. Taib, N.Md. Tahir,I.M. Yassin, S. LiasFaculty of Electrical Engineering, Universiti Teknologi MARA, 40450 Shah Alam, Selangor, Malaysia
a r t i c l e i n f o
Article history:
Received 6 February 2013
Received in revised form
21 January 2014
Accepted 23 January 2014
Keywords:
a b s t r a c t
This paper elaborates on the novel intelligence assessment method using the brainwave
sub-band power ratio features. The study focuses only on the left hemisphere brainwave in
its relaxed state. Distinct intelligence quotient groups have been established earlier from
the score of the Raven Progressive Matrices. Sub-band power ratios are calculated from
energy spectral density of theta, alpha and beta frequency bands. Synthetic data have been
generated to increase dataset from 50 to 120. The features are used as input to the artificial
neural network. Subsequently, the brain behaviour model has been developed using an
Intelligence quotient (IQ)
EEG
Sub-band power ratio
Artificial neural network (ANN)
White Gaussian noise
artificial neural network that is trained with optimized learning rate, momentum constant
and hidden nodes. Findings indicate that the distinct intelligence quotient groups can be
classified from the brainwave sub-band power ratios with 100% training and 88.89% testing
accuracies.
© 2014 Elsevier Ireland Ltd. All rights reserved.
Psychometric tests have been established to gauge an
1. Introduction
Cognitive performance, described in terms of intelligence ischaracterized by information processing capabilities of thebrain [1]. The ability differs between individuals [2] and isinfluenced by time [3] and experiential learning [4]. The under-lying model of intelligence has been established through theneural efficiency theory [5]. The theory states that brighterindividuals are less mentally active than people with aver-age intellectual ability [6]. This is achieved through focuseduse of resting brain and disuse of irrelevant brain area forgood task performance [7]. The phenomenon is reflected by
lower glucose metabolism in brighter individuals [8]. Althoughreceiving criticism [9], the theory has been reinforced througha variety of studies employing different neurophysiological∗ Corresponding author. Tel.: +60 12 6194590.E-mail address: [email protected] (A.H. Jahidin).
0169-2607/$ – see front matter © 2014 Elsevier Ireland Ltd. All rights reshttp://dx.doi.org/10.1016/j.cmpb.2014.01.016
measurement methods and a broad range of cognitive taskdemands [10].
Mental processing is performed by the frontal cortex. Itperforms executive functions of the brain which include theability to regulate emotion, anticipate and plan for the future,make rational decisions and shape behaviour towards attain-ment of motivational goals. The functionality of the frontalcortex can further be divided into the left and right hemi-spheres where different regions exhibits different cognitiveability. The left hemisphere is involved in sequential and logicprocesses. The right hemisphere however, is specialized forsocial interactions and emotional capabilities [11].
individual’s ability on various aspects of intelligence. Thiswould include the intelligence quotient (IQ), working mem-ory capacity, non-reasoning tasks, problem solving, learning
erved.
s i n b i o m e d i c i n e 1 1 4 ( 2 0 1 4 ) 50–59 51
[opmmo[cnwu
bachDt
itaerlwf
tmttwcbi[rdA
mtbrhwtwiIm
dWcmbtt
Is dat aset eno ugh to tra in
networ k?
Raw EEG sig nals
Feature extraction (ESD and po wer
ratio)
Pre-process ing and fil ter ing
(Noise removal) Genera te
synthetic data (30 dBSNR White Gaussian noise)
Develop and train ANN classifier
Featur e sel ectio n(Observation of
significant patternand removalof outliers)
Yes
No
c o m p u t e r m e t h o d s a n d p r o g r a m
12], mental rotation [13], and verbal reasoning [14]. Majorityf studies relating intelligence with brain activity have utilizedroblem solving and non-reasoning tasks to stimulate intenseental activity. Brain activities are measured using variouseasurement modalities such as the functional magnetic res-
nance imaging (fMRI), positron emission tomography (PET)5], and the electroencephalogram (EEG) [15]. All the findingsonsistently support the neural efficiency hypothesis [5]. Inon-reasoning tasks, results show that although no reasoningas required, information processing differs between individ-als of varying intelligence [12].
The EEG is a recording of electrical fluctuations of therain, commonly known as brain waves. The signal exhibitsn irregular and continuous oscillating pattern with frequen-ies varying from 0.5 to 100 Hz. The frequency characteristicseavily rely on the intensity of mental activity in the brain.istinct patterns can be observed under varying conditions
hrough the delta, theta, alpha and beta waves [16].Delta wave with very low frequency range 0.4–4 Hz prevails
n deep sleep and is commonly a precursor in comatose condi-ion. The theta waves, however, are present in light sleep andre often associated with emotions and creativity. The signalxhibits a frequency range 4–8 Hz [17]. In relaxed state, thehythmic alpha wave with frequency range 8–12 Hz is preva-ent. In the event of intense mental activity however, the alphaave would be replaced by the beta wave that exhibit higher
requency of between 12 and 30 Hz [16].In the past, characterization of brainwave features has
aken numerous approaches. In relation with mental perfor-ance, several studies have utilized band power to observe
he effects on the alpha and beta waves. It has been observedhat during mental stimulation, a less intelligent individualould demonstrate higher beta with lower alpha power as
ompared to the brighter ones [7,13,15,18–22]. These haveeen confirmed through the power ratio method that looks
nto the theta, alpha and beta sub-band inter-relationships23–25]. In addition, similar studies have also directed to brain-elated disorders such as the attention-deficit/hyperactivityisorder (ADHD) [26–28], chronic fatigue syndrome [29], andlzheimer’s disease [30].
The artificial neural network (ANN) is a machine learningethod that is inspired by the working of biological neurons in
he brain. The technique enables supervised learning throughack-propagation update procedure on the weights of neu-on connections to minimize the output error [31–33]. ANNas established itself in a variety of biomedical applications,hich include disease recognition [34–36], chromosome detec-
ion [37], physiological analysis and modelling [38,39]. Previousorks on modelling of brain behaviour using EEG have looked
nto characterization of epilepsy [40] and vigilance level [38].n addition, application of ANN on EEG has also been imple-
ented for brain–computer interface [41].Conventionally, intelligence assessments are only con-
ucted using established psychometric tests such as theechsler Intelligence Scale and Raven Progressive Matri-
es (RPM). Recent studies in variety of neurophysiological,
any researches were done to correlate intelligence withrain activity [6,13,42–45]. Evaluation of IQ based on scien-ific technique however, is new. Although there are attemptso estimate IQ using ANN, the study focuses on estimating IQ
Fig. 1 – Flow chart of research work.
from different psychometric tools instead of EEG brainwaves[46]. There is still a gap in knowledge connecting completesystematic approach on IQ measurement via intelligent tech-nique and EEG brainwaves. Hence the paper presents anintelligent approach to evaluate IQ from resting EEG. The IQ-brain behaviour model is developed using sub-band powerratio features from the left brain hemisphere in closed eyescondition and ANN. The use of resting EEG in closed eyescondition to classify IQ was based on a previous study whichrevealed that brain activity pertaining to intelligence can bedistinguished in its resting state (tonic), and in the absence ofcognitive demanding task [47–49]. It was also discovered thatpre-task resting conditions reflected state differences withinnon-clinical young adults [50].
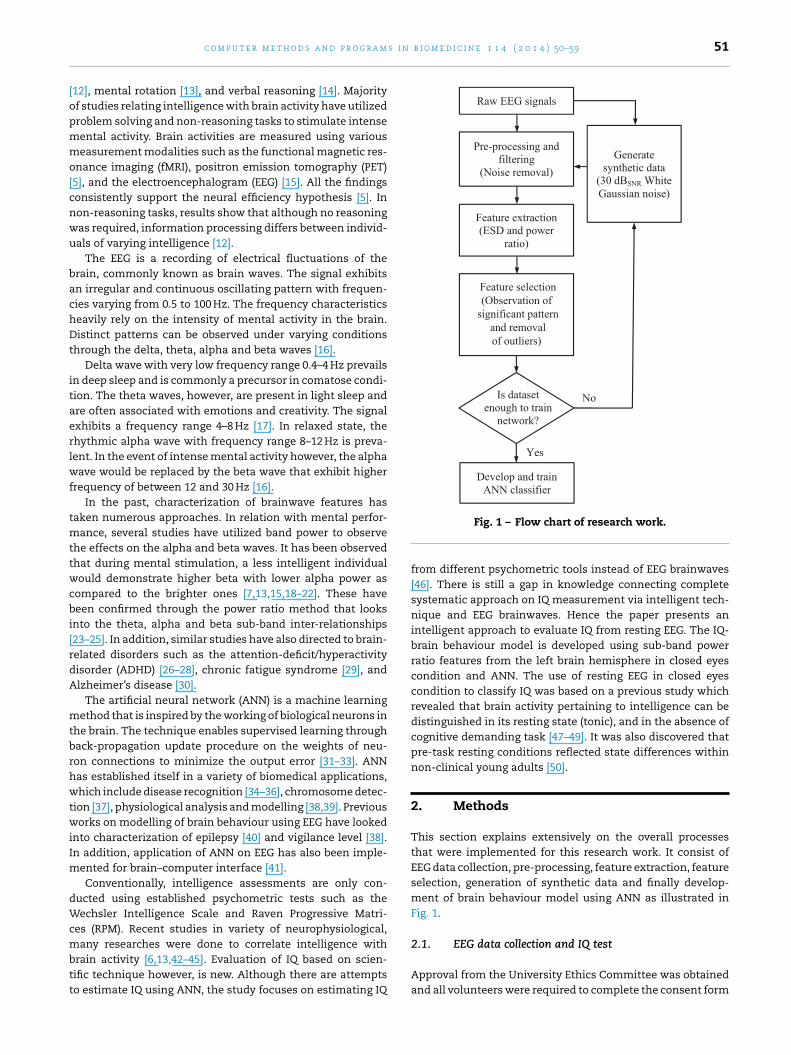
2. Methods
This section explains extensively on the overall processesthat were implemented for this research work. It consist ofEEG data collection, pre-processing, feature extraction, featureselection, generation of synthetic data and finally develop-ment of brain behaviour model using ANN as illustrated inFig. 1.
2.1. EEG data collection and IQ test
Approval from the University Ethics Committee was obtainedand all volunteers were required to complete the consent form

m s i n
52 c o m p u t e r m e t h o d s a n d p r o g r aprior to data collection. A total of 50 healthy and drug-free uni-versity students (mean age/standard deviation (SD) = 23.9/3.5,ranging in age from 20 to 40 years) from various disciplineswere involved in the study. The EEG signals were recordedfrom the left and right side of the prefrontal area in unipolarconfiguration using g-MOBIlab+ from g.tec Guger Technologiesand analyzed offline in MATLAB 2010b. Gold-plated electrodeswere placed at Fp1 (left) and Fp2 (right) side of the foreheadwhich conforms to the International 10/20 EEG standard. Theearlobes linked to Fpz at the centre of the forehead acts asreference montage. The sampling rate was set to 256 Hz. Dur-ing recording, subjects were required to relax in comfortablyseated position with eyes closed for 3 min.
The subjects were then required to answer an RPM-basedIQ test with scores ranging from 0 to 150. The RPM wasdesigned to specifically gauge intelligence in terms of log-ical thinking and non-verbal task performance. The scoresobtained were used to establish IQ groups as a benchmark.Subjects were then grouped into different IQ levels (high,medium and low) based on the mean and SD of the normallydistributed IQ scores.
2.2. Signal pre-processing, feature extraction andfeature selection
It is well established that the left hemisphere is involved insequential and logic processes. Hence, the study focuses onthe features extracted from the left hemispheric brainwavethat will be the input to the brain behaviour model. In orderto obtain an artefact-free EEG, all data were pre-processedoffline. Any signal component exceeding a range of +100 �Vto −100 �V are considered as noise and thus rejected. TheEEG signals were filtered using bandpass Hamming filter withcutoff frequencies at 0.5 Hz and 30 Hz. The signals were thendivided into the delta (0.5–4 Hz), theta (4–8 Hz), alpha (8–13 Hz)and beta (13–30 Hz) [51]. This can be done by applying FastFourier Transform (FFT) algorithm to obtain its discrete Fouriertransform (DFT) prior to the extraction of features [52–60].Thus, a similar successful method which has been practicedby many other researchers in filtering of EEG signals wasadopted in this work. The term of FFT is widely used insteadof DFT. The FFT algorithm that computes the DFT of vector X
can be mathematically expressed as in Eq. (1).
X(k) =N∑
n=1
x(n) exp
(−j
2�(k − 1)(n − 1)N
), 1 ≤ k ≤ N, (1)
where X(k) is the discrete Fourier coefficient, x(n) representsthe input signal in the time domain, N is the length of inputvector x(n), n is the sampling instances in time domain and k
is the sampling instances in frequency domain.The estimation of non-parametric power spectral density
(PSD) curve for the respective sub-band was then calculatedby implementing FFT. It is capable of capturing the frequencycontent of a stochastic process and can be calculated using
Welch method to estimate the power spectrum of a timesequence [51,61].The signals were divided into 50% overlapping epochs, withlength of 1024 and window size of 256. The processing method
b i o m e d i c i n e 1 1 4 ( 2 0 1 4 ) 50–59
involved implementation of Hamming windowing function.Finally, the energy spectral density (ESD), which refers tothe energy distribution specific to each frequency band wasobtained by computing the area of the PSD curve. Box plotsof ESD feature were used to further analyze the significantpatterns among IQ groups for every sub-band.
The study further looks into the inter-relationship betweenthe sub-band components using the power ratio technique.Theta, alpha and beta ratio can each be represented by Eqs.(2)–(4). Delta sub-band was not considered as a feature becauseit is highly correlated with deep sleep, not intelligence.
Theta ratio = �
+ �(2)
Alpha ratio = ˛
+ ˇ(3)
Beta ratio = ˇ
+ ˇ(4)
where � is theta ESD sub-band, is alpha ESD sub-band and ˇ
is beta ESD sub-band. Similarly to ESD, the power ratio featurefor each sub-band is analyzed for any significant patterns.
2.3. Synthetic EEG signals
This section explains on the technique applied to generatesynthetic signals from the original EEG. This is necessary toenhance the training dataset that will increase classificationaccuracy [62,63]. EEG is a stochastic in nature. Thus, a ran-dom white Gaussian noise can be implemented to generatesynthetic signal. The signal-to-noise ratio (SNR) needs to becarefully selected to obtain a synthetic version that is sim-ilar to the original ones. If the value of SNR is too low, thenoise content will modify the characteristics of the originalsignal [64]. Hence, this will lead to misclassification by theANN classifier [65]. For these reasons, 30 dBSNR was selected.
Noise array, Vnoise, was generated from multiplicationbetween random white Gaussian noise, Wnoise, and the noisevoltage, Vattn, where Vattn is the attenuated voltage from SNRdB
relationship. Formerly, the noise voltage was derived from theinput of SNRdB [66]. At 30 dB, the noise power, Pnoise, was calcu-lated via Pnoise = Psignal/SNR, where Psignal is the averaged powerfor the raw EEG signal. Vattn was computed through the squareroot of Pnoise. The synthetic EEG, Vsynt, was then obtained byadding the generated noise, Vnoise, to original EEG, VEEG. Therelationship can be expressed by Eqs. (5) and (6).
Vnoise = Wnoise × Vattn (5)
Vsynt = VEEG + Vnoise (6)
2.4. Brain behaviour model using ANN
The brain behaviour model was developed using ANN. The
network comprises of an input layer, a single hidden layer andan output layer. The sub-band power ratios were used as inputto the neural network structure. Meanwhile, the network out-put corresponds to the IQ index values. Tangent sigmoid and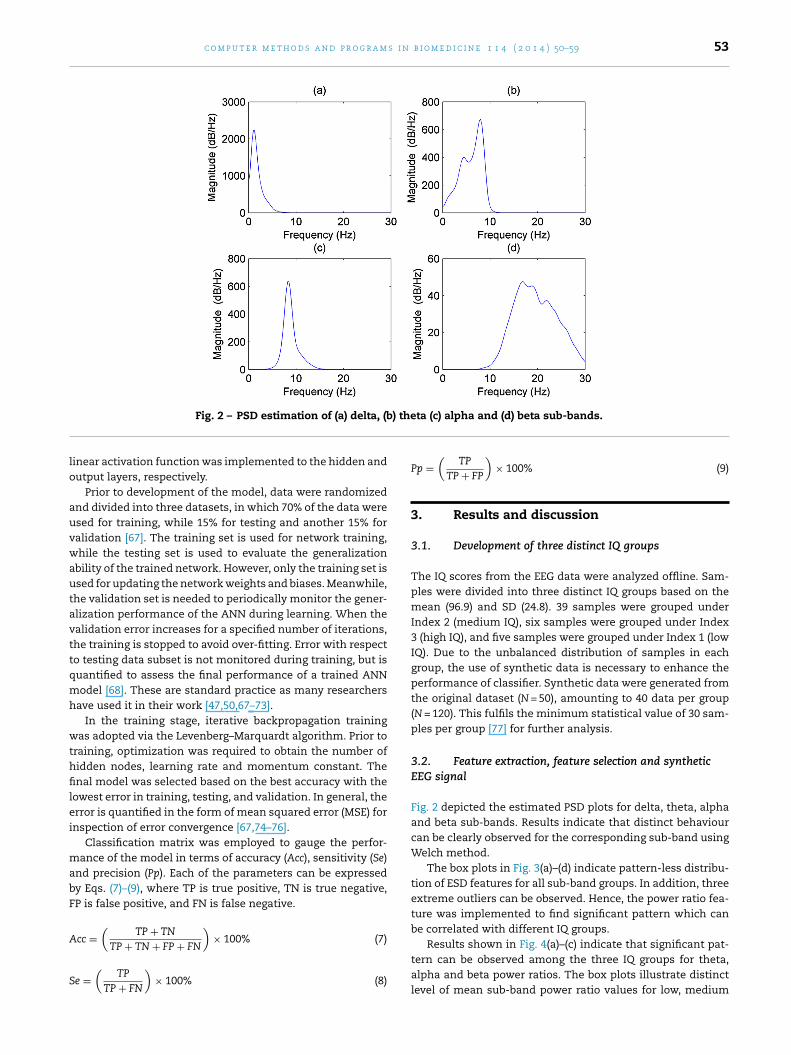
c o m p u t e r m e t h o d s a n d p r o g r a m s i n b i o m e d i c i n e 1 1 4 ( 2 0 1 4 ) 50–59 53
) the
lo
auvwautavttqmh
wthfilei
mabF
A
S
Fig. 2 – PSD estimation of (a) delta, (b
inear activation function was implemented to the hidden andutput layers, respectively.
Prior to development of the model, data were randomizednd divided into three datasets, in which 70% of the data weresed for training, while 15% for testing and another 15% foralidation [67]. The training set is used for network training,hile the testing set is used to evaluate the generalization
bility of the trained network. However, only the training set issed for updating the network weights and biases. Meanwhile,he validation set is needed to periodically monitor the gener-lization performance of the ANN during learning. When thealidation error increases for a specified number of iterations,he training is stopped to avoid over-fitting. Error with respecto testing data subset is not monitored during training, but isuantified to assess the final performance of a trained ANNodel [68]. These are standard practice as many researchers
ave used it in their work [47,50,67–73].In the training stage, iterative backpropagation training
as adopted via the Levenberg–Marquardt algorithm. Prior toraining, optimization was required to obtain the number ofidden nodes, learning rate and momentum constant. Thenal model was selected based on the best accuracy with the
owest error in training, testing, and validation. In general, therror is quantified in the form of mean squared error (MSE) fornspection of error convergence [67,74–76].
Classification matrix was employed to gauge the perfor-ance of the model in terms of accuracy (Acc), sensitivity (Se)
nd precision (Pp). Each of the parameters can be expressedy Eqs. (7)–(9), where TP is true positive, TN is true negative,P is false positive, and FN is false negative.
cc =(
TP + TN)
× 100% (7)
TP + TN + FP + FNe =(
TP
TP + FN
)× 100% (8)
ta (c) alpha and (d) beta sub-bands.
Pp =(
TP
TP + FP
)× 100% (9)
3. Results and discussion
3.1. Development of three distinct IQ groups
The IQ scores from the EEG data were analyzed offline. Sam-ples were divided into three distinct IQ groups based on themean (96.9) and SD (24.8). 39 samples were grouped underIndex 2 (medium IQ), six samples were grouped under Index3 (high IQ), and five samples were grouped under Index 1 (lowIQ). Due to the unbalanced distribution of samples in eachgroup, the use of synthetic data is necessary to enhance theperformance of classifier. Synthetic data were generated fromthe original dataset (N = 50), amounting to 40 data per group(N = 120). This fulfils the minimum statistical value of 30 sam-ples per group [77] for further analysis.
3.2. Feature extraction, feature selection and syntheticEEG signal
Fig. 2 depicted the estimated PSD plots for delta, theta, alphaand beta sub-bands. Results indicate that distinct behaviourcan be clearly observed for the corresponding sub-band usingWelch method.
The box plots in Fig. 3(a)–(d) indicate pattern-less distribu-tion of ESD features for all sub-band groups. In addition, threeextreme outliers can be observed. Hence, the power ratio fea-ture was implemented to find significant pattern which canbe correlated with different IQ groups.
Results shown in Fig. 4(a)–(c) indicate that significant pat-tern can be observed among the three IQ groups for theta,alpha and beta power ratios. The box plots illustrate distinctlevel of mean sub-band power ratio values for low, medium

54 c o m p u t e r m e t h o d s a n d p r o g r a m s i n b i o m e d i c i n e 1 1 4 ( 2 0 1 4 ) 50–59
lphas rel
Fig. 3 – Box plots of ESD for sub-band (a) delta, (b) theta, (c) agroups. The study focuses on the left brain hemisphere in it
and high IQ groups respectively. The mean for low IQ group ishigher compared to medium IQ group for sub-band theta ratio,followed by high IQ group. Similar pattern can be observedin the sub-band beta ratio. Contrariwise low IQ group dis-plays the lowest mean for sub-band alpha ratio, followedby the medium IQ group. The high IQ group exhibits thehighest mean sub-band alpha ratio. Hence, implementationof power ratio technique can indirectly overcome the pres-ence of extreme outliers from the ESD features. The observedpower ratios were then used as inputs to the ANN classifier.To increase the classification accuracy, the two outliers were
removed and the original dataset were enhanced with syn-thetic data.The two outliers that were removed are still less than 10%of the original dataset [78]. By removing them, it will not affect
and (d) beta with respect to low, medium and high IQaxed state, N = 50 samples.
robustness of the ANN classifier [78–80]. Moreover, in order toobtain optimal results, the errors should be independent andnormally distributed, which is not the case when the trainingdata contain the outliers [74,78,81]. The outliers can be main-tained if this work implements any robust backpropagationalgorithm [81–84].
Fig. 5(a) shows the random array of white Gaussian noise,Wnoise which was added to the original EEG. Meanwhile,Fig. 5(b) displays the probability density function (PDF) of whiteGaussian noise which is normally distributed with maximumpeak at zero value and decays away from zero. Subsequently,
Fig. 6(a) and (b) illustrate the original EEG signal, VEEG and itssynthetic signal, Vsynt. For a clear view, these signals were plot-ted for 1000 sampling instances. However, the histogram wasplotted using full signal range.
c o m p u t e r m e t h o d s a n d p r o g r a m s i n b i o m e d i c i n e 1 1 4 ( 2 0 1 4 ) 50–59 55
Fig. 4 – Box plots of (a) theta, (b) alpha and (c) beta power ratio with respect to low, medium and high IQ groups, N = 50samples.
Fig. 5 – (a) Generated random array of white Gaussian noise and (b) its histogram.

56 c o m p u t e r m e t h o d s a n d p r o g r a m s i n b i o m e d i c i n e 1 1 4 ( 2 0 1 4 ) 50–59
Fig. 6 – (a) Original EEG and (b) its synthetic signal with 30 dBSNR white Gaussian noise.
Fig. 7 – Box plots of (a) theta, (b) alpha and (c) beta power ratios with respect to low, medium and high IQ groups afterremoved of outliers and enhancement with synthetic data (40 data in each IQ group, N = 120).

c o m p u t e r m e t h o d s a n d p r o g r a m s i n
Table 1 – Parameters of final network.
Parameters Value
Input nodes 3Hidden nodes 7Output node 1Learning rate 0.6Momentum rate 0.8Error goal 0Epochs 1000
Table 2 – Classification accuracy and mean squared errorin training, testing and validation of final networkmodel.
Training Testing Validation
Acc (%) 100 88.89 100MSE 0.01 0.05 0.02
Table 3 – Performance matrix parameters which areprecision and sensitivity in training, testing andvalidation for three IQ groups.
IQ group Training Testing Validation
Pp (%) Se (%) Pp (%) Se (%) Pp (%) Se (%)
1 100 100 83.3 100 100 100
too
3
Lmimant7i
tTahaEst
4
TrIn
r
2 100 100 100 60 100 1003 100 100 88.9 100 100 100
Results show that similar pattern in the power ratio dis-ribution can be observed from the box plots. The additionf synthetic data has improved on the distribution and areutliers-free, as shown in Fig. 7.
.3. Brain behaviour model
earning rate was optimized by setting a constant value ofomentum at 50% and 5 hidden nodes. Learning rate was var-
ed from 0 to 1 with step size of 0.1. In order to optimize theomentum constant, number of hidden nodes was set to 5
nd optimized learning rate at 0.6. Next, the number of hiddenodes was optimized by setting the learning rate and momen-
um constant to optimized values of 0.6 and 0.8, respectively. hidden nodes were selected because it yields better accuracyn training.
Based on the training results, the ANN architecture andraining parameters is finalized in Table 1. Subsequently,able 2 tabulates the summary of classification performancend error of final model with the optimized parameters. Itas been discovered that final network gives the best trainingccuracy of 100%, testing at 88.89%, and validation at 100%.rror is minimal for training, testing and validation. The sen-itivity and precision of the final network corresponding tohree IQ groups are as summarized in Table 3.
. Conclusion
he critical findings of this work revealed that sub-band power
atio features from the left hemisphere can be correlated withQ. Hence, it can be applied as a form of feature to recog-ize the IQ groups. Alpha ratio is higher in high IQ groupb i o m e d i c i n e 1 1 4 ( 2 0 1 4 ) 50–59 57
compared to the low IQ group. In contrast for theta and betasub-bands, the ratio is low in high IQ group but higher in lowIQ group. The results confirm the neural efficiency theory thatstates brighter individuals are less mentally active than theless intelligent people.
Experimental results also revealed that sub-band powerratio from the left hemisphere can be classified using ANNwith 100% training accuracy and 88.89% testing accuracy.Results also indicate that analysis on the left hemisphere fromthe frontal region is adequate for IQ recognition.
As a conclusion, results show good classification perfor-mance with optimized network parameters in the ANN. In thefuture, comparison with other modelling techniques can beconsidered by employing different structure of neural networksuch as support vector machine (SVM), radial basis function(RBF) or incorporating fuzzy reasoning technique with neuralnetwork. In addition, further work using power ratio featureand ANN model may include cross-disciplinary study whichcan correlate IQ with other cognitive-related measures suchas brain asymmetry, learning style and emotion.
Acknowledgements
Authors would like to express gratitude to the Ministry ofHigher Education, Malaysia for the financial support throughthe MyPhD scholarship and the Fundamental Research GrantScheme (600-RMI/FRGS 5/3 (72/2012)). Our gratitude extendsalso to the reviewers for valuable comments and constructivecriticism.
e f e r e n c e s
[1] R.H. Grabner, A.C. Neubauer, E. Stern, Superior performanceand neural efficiency: the impact of intelligence andexpertise, Brain Research Bulletin 69 (2006) 422–439.
[2] A.C. Neubauer, R.H. Grabner, H.H. Freudenthaler, J.F.Beckmann, J. Guthke, Intelligence and individual differencesin becoming neutrally efficient, Acta Psychologica 116 (2004)55–74.
[3] O. Must, J. te Nijenhuis, A. Must, A.E.M. van Vianen,Comparability of IQ scores over time, Intelligence 37 (2009)25–33.
[4] S.B. Kaufman, C.G. DeYoung, J.R. Gray, J. Brown, N.Mackintosh, Associative learning predicts intelligence aboveand beyond working memory and processing speed,Intelligence 37 (2009) 374–382.
[5] A.C. Neubauer, A. Fink, Intelligence and neural efficiency,Neuroscience & Biobehavioral Reviews 33 (2009) 1004–1023.
[6] A.C. Neubauer, A. Fink, Intelligence and neural efficiency:measures of brain activation versus measures of functionalconnectivity in the brain, Intelligence 37 (2009) 223–229.
[7] A. Fink, R.H. Grabner, M. Benedek, G. Reishofer, V.Hauswirth, M. Fally, C. Neuper, F. Ebner, A.C. Neubauer, Thecreative brain: investigation of brain activity during creativeproblem solving by means of EEG and fMRI, Human BrainMapping 30 (2009) 734–748.
[8] R.J. Haier, Neuro-intelligence, neuro-metrics and the nextphase of brain imaging studies, Intelligence 37 (2009)
121–123.[9] D.L. Robinson, A test of the hendrickson postulate thatreduced EEG response variance causes increased aepcontour length: implications for the ‘neural transmission

m s i n
58 c o m p u t e r m e t h o d s a n d p r o g r aerrors’ theory of intelligence, Personality and IndividualDifferences 22 (1997) 173–182.
[10] U. Fidelman, Neural transmission-errors, cerebralarousability and hemisphericity: some relations withintelligence and personality, Kybernetes 28 (1999) 695–725.
[11] L.J. van der Knaap, I.J.M. van der Ham, How does the corpuscallosum mediate interhemispheric transfer? A review,Behavioural Brain Research 223 (2011) 211–221.
[12] N. Jausovec, K. Jausovec, Differences in induced brainactivity during the performance of learning andworking-memory tasks related to intelligence, Brain andCognition 54 (2004) 65–74.
[13] I. Riecansky, S. Katina, Induced EEG alpha oscillations arerelated to mental rotation ability: the evidence for neuralefficiency and serial processing, Neuroscience Letters 482(2010) 133–136.
[14] A.F. Primrose, M. Fuller, M. Littledyke, Verbal reasoning testscores and their stability over time, Educational Research 42(2000) 167–174.
[15] S. Micheloyannis, E. Pachou, C.J. Stam, M. Vourkas, S.Erimaki, V. Tsirka, Using graph theoretical analysis of multichannel EEG to evaluate the neural efficiency hypothesis,Neuroscience Letters 402 (2006) 273–277.
[16] J.W. Clark Jr., Medical Instrumentation: Application andDesign, Wiley, New York, 2010.
[17] T.L. Huang, C. Charyton, A comprehensive review of thepsychological effects of brainwave entrainment, AlternativeTherapies in Health and Medicine 14 (2008) 38–50.
[18] R. Grabner, A. Fink, A. Stipacek, C. Neuper, A. Neubauer,Intelligence and working memory systems: evidence ofneural efficiency in alpha band ERD, Cognitive BrainResearch 20 (2004) 212–225.
[19] N. Jausovec, Differences in cognitive processes betweengifted, intelligent, creative, and average individuals whilesolving complex problems: an EEG study, Intelligence 28(2000) 213–237.
[20] R. Thatcher, D. North, C. Biver, EEG and intelligence:relations between EEG coherence, EEG phase delay andpower, Clinical Neurophysiology 116 (2005) 2129–2141.
[21] M. Doppelmayr, W. Klimesch, W. Stadler, D. Pöllhuber, C.Heine, EEG alpha power and intelligence, Intelligence 30(2002) 289–302.
[22] T. Harmony, T. Fernández, J. Silva, J. Bernal, L. Díaz-Comas,A. Reyes, E. Marosi, M. Rodríguez, EEG delta activity: anindicator of attention to internal processing duringperformance of mental tasks, International Journal ofPsychophysiology 24 (1996) 161–171.
[23] A.T. Pope, E.H. Bogart, D.S. Bartolome, Biocybernetic systemevaluates indices of operator engagement in automatedtask, Biological Psychology 40 (1995) 187–195.
[24] O.M. Bazanova, Alpha EEG activity depends on theindividual dominant rhythm frequency, Journal ofNeurotherapy 16 (2012) 270–284.
[25] T. Egner, J.H. Gruzelier, The temporal dynamics ofelectroencephalographic responses to alpha/thetaneurofeedback training in healthy subjects, Journal ofNeurotherapy 8 (2004) 43–57.
[26] A.R. Clarke, R.J. Barry, EEG activity in subtypes ofattention-deficit/hyperactivity disorder, Journal ofNeurotherapy 8 (2005) 43–62.
[27] M.M. Lansbergen, M. Arns, M. van Dongen-Boomsma, D.Spronk, J.K. Buitelaar, The increase in theta/beta ratio onresting-state EEG in boys with attention-deficit/hyperactivitydisorder is mediated by slow alpha peak frequency, Progressin Neuro-Psychopharmacology and Biological Psychiatry 35
(2011) 47–52.[28] S.M. Bresnahan, R.J. Barry, A.R. Clarke, S.J. Johnstone,Quantitative EEG analysis in dexamphetamine-responsive
b i o m e d i c i n e 1 1 4 ( 2 0 1 4 ) 50–59
adults with attention-deficit/hyperactivity disorder,Psychiatry Research 141 (2006) 151–159.
[29] K.M. Billiot, T.H. Budzynski, F. Andrasik, E.E.G Patterns,Chronic fatigue syndrome, Journal of Neurotherapy 2 (1997)20–30.
[30] A.A. Fingelkurts, Short-term EEG spectral pattern as a singleevent in EEG phenomenology, Open Neuroimaging Journal 4(2010) 130.
[31] A.E. Zadeh, A. Khazaee, V. Ranaee, Classification of theelectrocardiogram signals using supervised classifiers andefficient features, Computer Methods and Programs inBiomedicine 99 (2010) 179–194.
[32] F. Ibrahim, M.N. Taib, W.A.B.W. Abas, C.C. Guan, S. Sulaiman,A novel dengue fever (DF) and dengue haemorrhagic fever(DHF) analysis using artificial neural network (ANN),Computer Methods and Programs in Biomedicine 79 (2005)273–281.
[33] M.F. Talu, M. Gül, N. Alpaslan, B. Yigitcan, Calculation ofmelatonin and resveratrol effects on steatosis hepatis usingsoft computing methods, Computer Methods and Programsin Biomedicine 111 (2013) 498–506.
[34] R. Alizadehsani, J. Habibi, M.J. Hosseini, H. Mashayekhi, R.Boghrati, A. Ghandeharioun, B. Bahadorian, Z.A. Sani, A datamining approach for diagnosis of coronary artery disease,Computer Methods and Programs in Biomedicine 111 (2013)52–61.
[35] J. Kuruvilla, K. Gunavathi, Lung cancer classification usingneural networks for CT images, Computer Methods andPrograms in Biomedicine 113 (2014) 202–209.
[36] J.L.M. Amaral, A.J. Lopes, J.M. Jansen, A.C.D. Faria, P.L. Melo,Machine learning algorithms and forced oscillationmeasurements applied to the automatic identification ofchronic obstructive pulmonary disease, Computer Methodsand Programs in Biomedicine 105 (2012) 183–193.
[37] E. Poletti, E. Grisan, A. Ruggeri, A modular framework for theautomatic classification of chromosomes in Q-band images,Computer Methods and Programs in Biomedicine 105 (2012)120–130.
[38] M. Duta, C. Alford, S. Wilson, L. Tarassenko, Neural networkanalysis of the mastoid EEG for the assessment of vigilance,International Journal of Human-Computer Interaction 17(2004) 171–195.
[39] J. Fernandez de Canete, S. Gonzalez-Perez, J.C. Ramos-Diaz,Artificial neural networks for closed loop control of in silicoand ad hoc type 1 diabetes, Computer Methods andPrograms in Biomedicine 106 (2012) 55–66.
[40] A. Subasi, E. Ercelebi, Classification of EEG signals usingneural network and logistic regression, Computer Methodsand Programs in Biomedicine 78 (2005) 87–99.
[41] M. Aberg, J. Wessberg, Evolutionary optimization ofclassifiers and features for single-trial EEG discrimination,BioMedical Engineering OnLine 6 (2007) 32.
[42] N. Jausovec, Differences in EEG alpha activity related togiftedness, Intelligence 23 (1996) 159–173.
[43] A. Gevins, M.E. Smith, Neurophysiological measures ofworking memory and individual differences in cognitiveability and cognitive style, Cerebral Cortex 10 (2000) 829–839.
[44] I.J. Deary, L. Penke, W. Johnson, The neuroscience of humanintelligence differences, Nature Reviews Neuroscience 11(2010) 201–211.
[45] B. Staudt, A.C. Neubauer, Achievement, underachievementand cortical activation: a comparative EEG study ofadolescents of average and above-average intelligence, HighAbility Studies 17 (2006) 3–16.
[46] A.G. Di Nuovo, S.D. Nuovo, S. Buono, Intelligent quotient
estimation of mental retarded people from differentpsychometric instruments using artificial neural networks,Artificial Intelligence in Medicine 54 (2012) 135–145.
s i n
Transactions on Neural Networks 11 (2000) 1067–1077.
c o m p u t e r m e t h o d s a n d p r o g r a m
[47] N. Langer, A. Pedroni, L.R.R. Gianotti, J. Hänggi, D. Knoch, L.Jäncke, Functional brain network efficiency predictsintelligence, Human Brain Mapping 33 (2012) 1393–1406.
[48] L. Wang, M. Song, T. Jiang, Y. Zhang, C. Yu, Regionalhomogeneity of the resting-state brain activity correlateswith individual intelligence, Neuroscience Letters 488 (2011)275–278.
[49] T.W. Lee, Y.T. Wu, Y.W.Y. Yu, H.C. Wu, T.J. Chen, A smarterbrain is associated with stronger neural interaction inhealthy young females: a resting EEG coherence study,Intelligence 40 (2011) 38–48.
[50] E. Angelakis, J.F. Lubar, S. Stathopoulou,Electroencephalographic peak alpha frequency correlates ofcognitive traits, Neuroscience Letters 371 (2004) 60–63.
[51] B. Hosseinifard, M.H. Moradi, R. Rostami, Classifyingdepression patients and normal subjects using machinelearning techniques and nonlinear features from EEG signal,Computer Methods and Programs in Biomedicine 109 (2013)339–345.
[52] G. Bettus, F. Wendling, M. Guye, L. Valton, J. Régis, P. Chauvel,F. Bartolomei, Enhanced EEG functional connectivity inmesial temporal lobe epilepsy, Epilepsy Research 81 (2008)58–68.
[53] D. Abásolo, R. Hornero, C. Gómez, M. García, M. López,Analysis of EEG background activity in Alzheimer’s diseasepatients with Lempel–Ziv complexity and central tendencymeasure, Medical Engineering & Physics 28 (2006) 315–322.
[54] F. Howells, V. Ives-Deliperi, N. Horn, D. Stein, Mindfulnessbased cognitive therapy improves frontal control in bipolardisorder: a pilot EEG study, BMC Psychiatry 12 (2012) 15.
[55] J. Kaminski, A. Brzezicka, A. Wróbel, Short-term memorycapacity (7 ± 2) predicted by theta to gamma cycle lengthratio, Neurobiology of Learning and Memory 95 (2011) 19–23.
[56] A.J. Tomarken, R.J. Davidson, R.E. Wheeler, L. Kinney,Psychometric properties of resting anterior EEG asymmetry:temporal stability and internal consistency,Psychophysiology 29 (1992) 576–592.
[57] I.H. Gotlib, EEG alpha asymmetry, depression, and cognitivefunctioning, Cognition & Emotion 12 (1998) 449–478.
[58] K. Polat, S. Günes, Classification of epileptiform EEG using ahybrid system based on decision tree classifier and fastFourier transform, Applied Mathematics and Computation187 (2007) 1017–1026.
[59] J.A. Cannon, P.A. Krokhmal, R.V. Lenth, R. Murphey, Analgorithm for online detection of temporal changes inoperator cognitive state using real-time psychophysiologicaldata, Biomedical Signal Processing and Control 5 (2010)229–236.
[60] U. Rajendra Acharya, S. Vinitha Sree, G. Swapna, R.J. Martis,J.S. Suri, Automated EEG analysis of epilepsy: a review,Knowledge-Based Systems 45 (2013) 147–165.
[61] P. Welch, The use of fast Fourier transform for theestimation of power spectra: a method based on timeaveraging over short, modified periodograms, IEEETransactions on Audio and Electroacoustics 15 (1967) 70–73.
[62] F. Lotte, Generating artificial EEG signals to reduce BCIcalibration time, in: 5th International Brain-ComputerInterface Workshop, 2011, pp. 176–179.
[63] H. Hoessler, C. Wöhler, F. Lindner, U. Kreßel, Classifiertraining based on synthetically generated samples, in:Proceedings of the 5th International Conference onComputer Vision Systems (ICCV), 2007.
[64] M.J. Roberts, Signals and Systems, McGraw-Hill, New York,2004.
[65] H. Azami, K. Mohammadi, B. Bozorgtabar, An improved
signal segmentation using moving average andSavitzky–Golay filter, Journal of Signal and InformationProcessing 3 (2012) 39–44.b i o m e d i c i n e 1 1 4 ( 2 0 1 4 ) 50–59 59
[66] L. Sevgi, Synthetic radar-signal environment: computergeneration of signal, noise and clutter, IEEE Antennas andPropagation Magazine 49 (2007) 192–198.
[67] A. Kupusinac, E. Stokic, R. Doroslovacki, Predicting body fatpercentage based on gender, age and BMI by using artificialneural networks, Computer Methods and Programs inBiomedicine 13 (2013) 610–619.
[68] J. Farifteh, F. Van der Meer, C. Atzberger, E.J.M. Carranza,Quantitative analysis of salt-affected soil reflectancespectra: a comparison of two adaptive methods (PLSR andANN), Remote Sensing of Environment 110 (2007) 59–78.
[69] C.W. Anderson, E.A. Stolz, S. Shamsunder, Multivariateautoregressive models for classification of spontaneouselectroencephalographic signals during mental tasks, IEEETransactions on Biomedical Engineering 45 (1998) 277–286.
[70] J.T. Wei, Z. Zhang, S.D. Barnhill, K.R. Madyastha, H. Zhang,J.E. Oesterling, Understanding artificial neural networks andexploring their potential applications for the practicingurologist, Urology 52 (1998) 161–172.
[71] B.O. Peters, G. Pfurtscheller, H. Flyvbjerg, Automaticdifferentiation of multichannel EEG signals, IEEETransactions on Biomedical Engineering 48 (2001) 111–116.
[72] G. Chanel, C. Rebetez, M. Bétrancourt, T. Pun, Emotionassessment from physiological signals for adaptation ofgame difficulty, IEEE Transactions on Systems, Man andCybernetics, Part A: Systems and Humans 41 (2011)1052–1063.
[73] N. Jausovec, K. Jausovec, Differences in resting EEG relatedto ability, Brain Topography 12 (2000) 229–240.
[74] H.R. Maier, G.C. Dandy, Neural networks for the predictionand forecasting of water resources variables: a review ofmodelling issues and applications, Environmental Modelling& Software 15 (2000) 101–124.
[75] B.M. Wilamowski, Neural network architectures andlearning algorithms, IEEE Industrial Electronics Magazine 3(2009) 56–63.
[76] O. Faust, U.R. Acharya, J. Ma, L.C. Min, T. Tamura,Compressed sampling for heart rate monitoring, ComputerMethods and Programs in Biomedicine 108 (2012) 1191–1198.
[77] A. Field, Discovering Statistics Using SPSS, SAGEPublications, Singapore, 2009.
[78] K. Bovis, S. Singh, J. Fieldsend, C. Pinder, Identification ofmasses in digital mammograms with MLP and RBF nets, in:Neural Networks, 2000. Proceedings of the IEEE-INNS-ENNSInternational Joint Conference on IJCNN 2000, 2000, pp.342–347.
[79] S.-Q. Shi, W.L. Maner, L.B. Mackay, R.E. Garfield,Identification of term and preterm labor in rats usingartificial neural networks on uterine electromyographysignals, American Journal of Obstetrics and Gynecology 198(2008), 235.e231–235.e234.
[80] C. Alexakis, H. Nyongesa, R. Saatchi, N. Harris, C. Davies, C.Emery, R. Ireland, S. Heller, Feature extraction andclassification of electrocardiogram (ECG) signals related tohypoglycaemia, Computers in Cardiology 30 (2003) 537–540(IEEE, 2003).
[81] D.S. Chen, R.C. Jain, A robust backpropagation learningalgorithm for function approximation, IEEE Transactions onNeural Networks 5 (1994) 467–479.
[82] K. Liano, Robust error measure for supervised neuralnetwork learning with outliers, IEEE Transactions on NeuralNetworks 7 (1996) 246–250.
[83] C.-C. Chuang, S.-F. Su, C.-C. Hsiao, The annealing robustbackpropagation (ARBP) learning algorithm, IEEE
[84] L. Huang, B.-L. Zhang, Q. Huang, Robust interval regressionanalysis using neural networks, Fuzzy Sets and Systems 97(1998) 337–347.