Classification Models for Early Identification of Persons at Risk for Dementia in Primary Care: An...
11
Fax +41 61 306 12 34 E-Mail [email protected] www.karger.com Original Research Article Dement Geriatr Cogn Disord 2009;28:567–577 DOI: 10.1159/000261501 Classification Models for Early Identification of Persons at Risk for Dementia in Primary Care: An Evaluation in a Sample Aged 80 Years and Older Tessa N. van den Kommer a Daniel E. Bontempo c Hannie C. Comijs a Scott M. Hofer c Miranda G. Dik b Andrea M. Piccinin c Cees Jonker a Dorly J.H. Deeg a Boo Johansson d a Longitudinal Aging Study Amsterdam and the EMGO Institute for Health and Care Research, VU University Medical Center, and b Department of Nursing Home Medicine and the EMGO Institute for Health and Care Research, VU University Medical Center, Amsterdam, The Netherlands; c Oregon State University, Human Development and Family Sciences, Corvallis, Oreg., USA; d Department of Psychology, University of Gothenburg, Gothenburg, Sweden Introduction Early identification of persons at risk for dementia is an increasingly important issue, although currently no curative measures are available. However, management of modifiable risk factors may delay the onset and lower dementia risk [1, 2]. Early pharmacological treatment of persons at high risk could result in delay of cognitive de- cline, preservation of functional independence and pre- vention of behavioral problems [3–5]. Furthermore, iden- tification of persons at high risk may promote timely rec- ognition of dementia which may enable caregivers and patients to cope with problems associated with disease progression. Early person-tailored psychosocial inter- ventions may promote adaptation to the disease, help maintain well-being [6], reduce caregiver strain and delay institutionalization [7, 8]. Many have stressed the key position of the general practitioner in detecting and diagnosing dementia as well as the accompanying difficulties [9–11]. In primary care there is a need for a more proactive approach to case find- ing in which prediction models with multiple indicators are used to identify persons at the highest risk for demen- tia [12] . Classification models, also called decision tree Key Words Incident dementia Dementia, early identification Classification models Abstract Aim: To evaluate previously developed classification models to make implementation in primary care possible and aid early identification of persons at risk for dementia. Methods: Data were drawn from the OCTO-Twin study. At baseline, 521 persons 680 years of age were nondemented, and for 387 a blood sample was available. Predictors of dementia were collected and analyzed in initially nondemented persons us- ing generalized estimating equations and Cox survival anal- yses. Results: In the basic model using predictors already known or easily obtained (basic set), the mean 2-year predic- tive value increased from 6.9 to 28.8% in persons with mem- ory complaints and an MMSE score ^25. In the extended model, using both the basic set and an extended set of pre- dictors requiring further assessment, the 8-year predictive value increased from 15.0 to 45.8% in persons with low cho- lesterol and an MMSE score ^24. Conclusion: Both models can contribute to an improved early identification of persons at risk for dementia in primary care. Copyright © 2010 S. Karger AG, Basel Accepted: November 16, 2009 Published online: January 6, 2010 Tessa N. van den Kommer VU University Medical Center, LASA, EMGO Institute for Health and Care Research Van der Boechorststraat 7 NL–1081 BT Amsterdam (The Netherlands) Tel. +31 204 449 337, Fax +31 204 446 775, E-Mail tn.vandenkommer @ vumc.nl © 2010 S. Karger AG, Basel Accessible online at: www.karger.com/dem
Transcript of Classification Models for Early Identification of Persons at Risk for Dementia in Primary Care: An...
Fax +41 61 306 12 34E-Mail [email protected]
Original Research Article
Dement Geriatr Cogn Disord 2009;28:567–577 DOI: 10.1159/000261501
Classification Models for Early Identification of
Persons at Risk for Dementia in Primary Care:
An Evaluation in a Sample Aged 80 Years and Older
Tessa N. van den Kommer a Daniel E. Bontempo c Hannie C. Comijs a Scott M. Hofer c Miranda G. Dik b Andrea M. Piccinin c Cees Jonker a Dorly J.H. Deeg a Boo Johansson d
a Longitudinal Aging Study Amsterdam and the EMGO Institute for Health and Care Research, VU University Medical Center, and b Department of Nursing Home Medicine and the EMGO Institute for Health and Care Research, VU University Medical Center, Amsterdam , The Netherlands; c Oregon State University, Human Development and Family Sciences, Corvallis, Oreg. , USA; d Department of Psychology, University of Gothenburg, Gothenburg , Sweden
Introduction
Early identification of persons at risk for dementia is an increasingly important issue, although currently no curative measures are available. However, management of modifiable risk factors may delay the onset and lower dementia risk [1, 2] . Early pharmacological treatment of persons at high risk could result in delay of cognitive de-cline, preservation of functional independence and pre-vention of behavioral problems [3–5] . Furthermore, iden-tification of persons at high risk may promote timely rec-ognition of dementia which may enable caregivers and patients to cope with problems associated with disease progression. Early person-tailored psychosocial inter-ventions may promote adaptation to the disease, help maintain well-being [6] , reduce caregiver strain and delay institutionalization [7, 8] .
Many have stressed the key position of the general practitioner in detecting and diagnosing dementia as well as the accompanying difficulties [9–11] . In primary care there is a need for a more proactive approach to case find-ing in which prediction models with multiple indicators are used to identify persons at the highest risk for demen-tia [12] . Classification models, also called decision tree
Key Words
Incident dementia � Dementia, early identification � Classification models
Abstract
Aim: To evaluate previously developed classification models to make implementation in primary care possible and aid early identification of persons at risk for dementia. Methods: Data were drawn from the OCTO-Twin study. At baseline, 521 persons 6 80 years of age were nondemented, and for 387 a blood sample was available. Predictors of dementia were collected and analyzed in initially nondemented persons us-ing generalized estimating equations and Cox survival anal-yses. Results: In the basic model using predictors already known or easily obtained (basic set), the mean 2-year predic-tive value increased from 6.9 to 28.8% in persons with mem-ory complaints and an MMSE score ̂ 25. In the extended model, using both the basic set and an extended set of pre-dictors requiring further assessment, the 8-year predictive value increased from 15.0 to 45.8% in persons with low cho-lesterol and an MMSE score ̂ 24. Conclusion: Both models can contribute to an improved early identification of persons at risk for dementia in primary care.
Copyright © 2010 S. Karger AG, Basel
Accepted: November 16, 2009 Published online: January 6, 2010
Tessa N. van den Kommer VU University Medical Center, LASA, EMGO Institute for Health and Care Research Van der Boechorststraat 7 NL–1081 BT Amsterdam (The Netherlands) Tel. +31 204 449 337, Fax +31 204 446 775, E-Mail tn.vandenkommer @ vumc.nl
© 2010 S. Karger AG, Basel
Accessible online at:www.karger.com/dem
van den Kommer et al. Dement Geriatr Cogn Disord 2009;28:567–577 568
methods and classification and regression tree methodol-ogy [13–15] , yield a clinical tool that addresses this need.
Two classification models for potential use in prima-ry care were previously developed for the identification of persons at risk for developing persistent cognitivedecline. It was shown that persons over 75, with mem-ory complaints, low education and an MMSE score ̂ 24, as well as persons over 75, with low cholesterol ( ! 5.0 mmol/l) and an MMSE score ̂ 24 were at the highest risk of developing persistent cognitive decline, resulting in a substantial increase in predictive value from 4.0 to 43.5 and 30.0%, respectively [16] . The aim of the present study is to construct these models in another independent lon-gitudinal population-based study in which a formal de-mentia diagnosis is present in order to test whether con-gruent classification models would develop. Consequent-ly, this would make implementation in primary care possible and contribute to case finding of persons at risk for developing dementia in a cost-effective way. The OCTO-Twin Study (Origins of Variance in the Old-Old: Octogenarian Twins) was selected for this purpose through the Integrative Analysis of Longitudinal Studies of Aging research network.
Methods
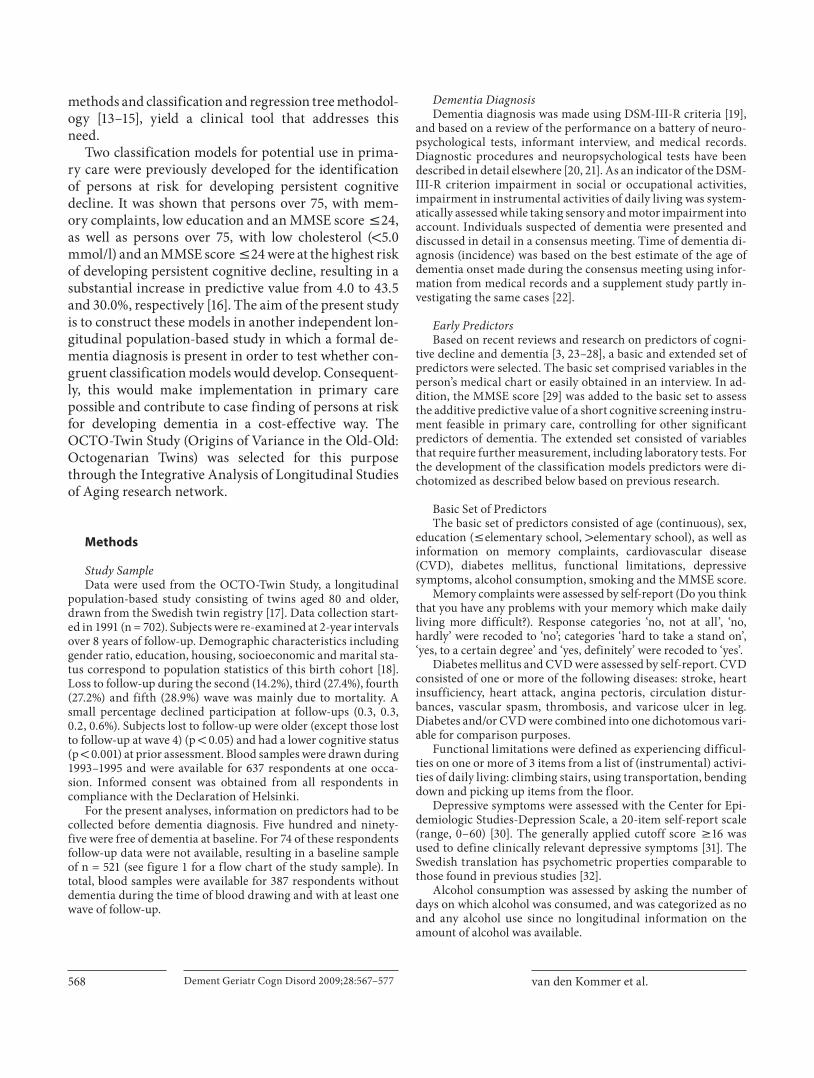
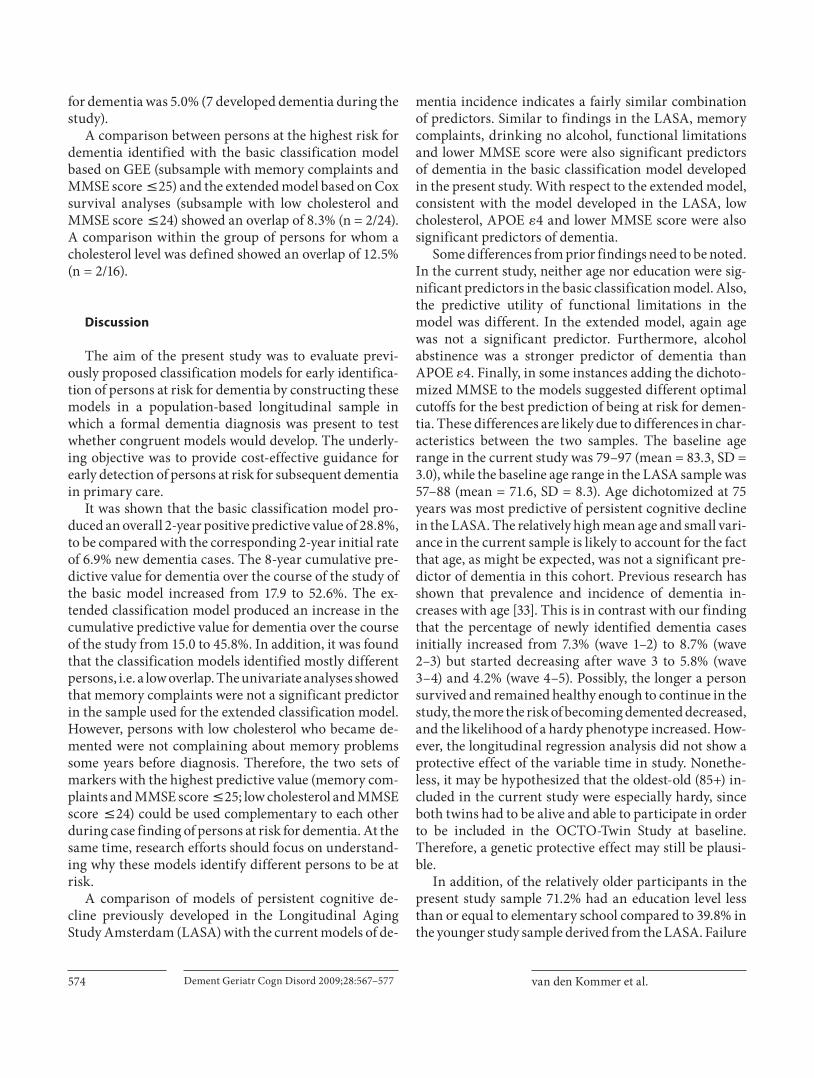
Study Sample Data were used from the OCTO-Twin Study, a longitudinal
population-based study consisting of twins aged 80 and older, drawn from the Swedish twin registry [17] . Data collection start-ed in 1991 (n = 702). Subjects were re-examined at 2-year intervals over 8 years of follow-up. Demographic characteristics including gender ratio, education, housing, socioeconomic and marital sta-tus correspond to population statistics of this birth cohort [18] . Loss to follow-up during the second (14.2%), third (27.4%), fourth (27.2%) and fifth (28.9%) wave was mainly due to mortality. A small percentage declined participation at follow-ups (0.3, 0.3, 0.2, 0.6%). Subjects lost to follow-up were older (except those lost to follow-up at wave 4) (p ! 0.05) and had a lower cognitive status (p ! 0.001) at prior assessment. Blood samples were drawn during 1993–1995 and were available for 637 respondents at one occa-sion. Informed consent was obtained from all respondents in compliance with the Declaration of Helsinki.
For the present analyses, information on predictors had to be collected before dementia diagnosis. Five hundred and ninety-five were free of dementia at baseline. For 74 of these respondents follow-up data were not available, resulting in a baseline sample of n = 521 (see figure 1 for a flow chart of the study sample). In total, blood samples were available for 387 respondents without dementia during the time of blood drawing and with at least one wave of follow-up.
Dementia Diagnosis Dementia diagnosis was made using DSM-III-R criteria [19] ,
and based on a review of the performance on a battery of neuro-psychological tests, informant interview, and medical records. Diagnostic procedures and neuropsychological tests have been described in detail elsewhere [20, 21] . As an indicator of the DSM-III-R criterion impairment in social or occupational activities, impairment in instrumental activities of daily living was system-atically assessed while taking sensory and motor impairment into account. Individuals suspected of dementia were presented and discussed in detail in a consensus meeting. Time of dementia di-agnosis (incidence) was based on the best estimate of the age of dementia onset made during the consensus meeting using infor-mation from medical records and a supplement study partly in-vestigating the same cases [22] .
Early Predictors Based on recent reviews and research on predictors of cogni-
tive decline and dementia [3, 23–28] , a basic and extended set of predictors were selected. The basic set comprised variables in the person’s medical chart or easily obtained in an interview. In ad-dition, the MMSE score [29] was added to the basic set to assess the additive predictive value of a short cognitive screening instru-ment feasible in primary care, controlling for other significant predictors of dementia. The extended set consisted of variables that require further measurement, including laboratory tests. For the development of the classification models predictors were di-chotomized as described below based on previous research.
Basic Set of Predictors The basic set of predictors consisted of age (continuous), sex,
education ( ̂ elementary school, 1 elementary school), as well as information on memory complaints, cardiovascular disease (CVD), diabetes mellitus, functional limitations, depressive symptoms, alcohol consumption, smoking and the MMSE score.
Memory complaints were assessed by self-report (Do you think that you have any problems with your memory which make daily living more difficult?). Response categories ‘no, not at all’, ‘no, hardly’ were recoded to ‘no’; categories ‘hard to take a stand on’, ‘yes, to a certain degree’ and ‘yes, definitely’ were recoded to ‘yes’.
Diabetes mellitus and CVD were assessed by self-report. CVD consisted of one or more of the following diseases: stroke, heart insufficiency, heart attack, angina pectoris, circulation distur-bances, vascular spasm, thrombosis, and varicose ulcer in leg. Diabetes and/or CVD were combined into one dichotomous vari-able for comparison purposes.
Functional limitations were defined as experiencing difficul-ties on one or more of 3 items from a list of (instrumental) activi-ties of daily living: climbing stairs, using transportation, bending down and picking up items from the floor.
Depressive symptoms were assessed with the Center for Epi-demiologic Studies-Depression Scale, a 20-item self-report scale (range, 0–60) [30] . The generally applied cutoff score 6 16 was used to define clinically relevant depressive symptoms [31] . The Swedish translation has psychometric properties comparable to those found in previous studies [32] .
Alcohol consumption was assessed by asking the number of days on which alcohol was consumed, and was categorized as no and any alcohol use since no longitudinal information on the amount of alcohol was available.
Early Identification of Persons at Risk for Dementia
Dement Geriatr Cogn Disord 2009;28:567–577 569
In order to detect the optimal cutoff, MMSE scores were di-chotomized using 3 standard cutoffs ( ̂ 24, 25 and 26).
Extended Set of Predictors The extended set of predictors consisted of hypertension, body
mass index (BMI), total homocysteine (tHcy), vitamin B 12 , total cholesterol, high-density lipoprotein (HDL) cholesterol, and apo-lipoprotein E (APOE) genotype.
Hypertension was determined by high systolic blood pressure ( 6 160 mm Hg) and/or the use of antihypertensive medication.
BMI was calculated as: weight (kg)/[height (m)] 2 . Both high ( 1 25) and low BMI ( ! 21) were included as predictors [25, 26] .
tHcy was analyzed by fluorescence polarization immunoassay using an IMX instrument (Abbott). The highest quartile values ( 6 19.95 � mol/l) were considered high tHcy.
Analysis of vitamin B 12 was done by time-resolved fluoroim-munoassay using an Autodelfia instrument (Wallace). Low vita-min B 12 was defined by the lower quartile values ( ̂ 181 pmol/l).
Total and HDL cholesterol were analyzed using routine meth-ods with an AXON analyzer (Bayer). Both high and low choles-terol were included in the analyses, defined by the upper ( 6 7.4
mmol/l) and lower ( ̂ 5.6 mmol/l) quartile values, respectively. Low HDL cholesterol levels were defined by the lower quartile values ( ̂ 1.20 mmol/l).
APOE genotyping was performed by examining single nucle-otide polymorphisms (SNP000002328). The distribution of APOE genotypes was in Hardy-Weinberg equilibrium. APOE status was classified as � 4 carriers in persons with genotypes � 2/4 (2.4%), � 3/4 (26.5%) and � 4/4 (1.7%), and as � 4 noncarriers in persons with genotypes � 2/2 (1.1%), � 2/3 (14.8%) and � 3/3 (53.4%).
Data Analysis Basic Classification Model (Basic Set of Predictors) Predictors were lagged one occasion relative to dementia out-
come. At each occasion, dementia outcome (yes/no) was predicted using data on predictors collected in the prior wave. Hence, pre-dictors collected at baseline in the nondemented study sample were used to predict dementia outcome at wave 2, predictors from wave 2 collected in the remaining nondemented sample were used to predict dementia outcome at wave 3 and so forth. The odds ra-tio (OR) was computed for each of the predictors using univariate logistic longitudinal regression analyses based on generalized es-
No dementia(n = 595)
No dementia(n = 337)
Incident dementia(n = 15)
Dementia casesexcluded(n = 107)
No dementia(n = 181)
n = 113 due to deathn = 1 due to refusal
n = 77 due to death n = 55 due to deathn = 1 due to refusal
Wave 1 (1991)
Lost to follow-upLost to follow-up Lost to follow-up
Wave 2 (1993) Wave 3 (1995) Wave 4 (1997) Wave 5 (1999)
No dementia(n = 483)
Incident dementia(n = 38)
Incident dementia(n = 32)
No dementia(n = 245)
Incident dementia(n = 8)
Total sample(n = 702)
n = 72 due to deathn = 2 due to refusal
Lost to follow-up
Baseline sample(n = 521)
Fig. 1. Flow chart of the study sample.
van den Kommer et al. Dement Geriatr Cogn Disord 2009;28:567–577 570
timating equations (GEE). To predict dementia incidence, longi-tudinal logistic regression analyses based on GEE (method enter, exchangeable correlation structure) used the lagged predictors from the wave prior to dementia outcome. Predictors were added to the model dichotomized as previously described. To examine the predictive value of age, continuous baseline age was added to the model. Years in study was added as a time variable. First, the strongest predictor of incident dementia was identified within the initially nondemented sample. Second, the sample was split into two subsamples based on the dichotomization of that particular predictor. This procedure was repeated in both subsamples until no more significant predictors were found, after which the di-chotomized MMSE was added to the model. Since the use of the MMSE requires an additional action in clinical practice, the MMSE was added to the model only after no other significant predictors of dementia could be identified. The identification of the strongest predictor was based on the OR with a 95% confi-dence interval (CI) (p ! 0.05). The remaining subsample size had to be sufficient for analysis ( 6 50). Finally, the positive predictive value of each of the identified predictors (measured one wave be-fore diagnosis) was computed, which was derived from 4 intervals (wave 1–2, wave 2–3, and so forth) and thus represents the mean percentage of persons who were identified with dementia each 2 years during the course of the study.
To test sensitivity, data were analyzed with Cox survival anal-yses using predictors from the nondemented study sample at wave 1 to predict any subsequent dementia (wave 2–5). Survival time was defined as (continuous) time to event. In persons who were not diagnosed with dementia during the study, time to event was equal to time in study. The same procedure described above, split-ting into subsamples after each step, was used to develop the clas-sification model. A predictor was selected based on the relative risk (RR).
Extended Classification Model (All Predictors) Since longitudinal blood data were not available, analyses
were not based on GEE. Instead, only Cox survival analyses were used to predict dementia incidence during the study using both the basic and extended sets of wave 1 predictors (or closest wave to blood sampling in nondemented respondents). Survival time was defined as (continuous) time to dementia diagnosis (since blood drawing procedure). In persons who were not diagnosed with dementia during the study, time to event was equal to time in study (since blood drawing procedure). The RR was comput-ed for each of the predictors using univariate Cox survival anal-yses. For the development of the extended classification model, the same procedure was used as described for the basic model. The predictive value of each of the identified predictors mea-sured at baseline was computed, which represents the total per-centage of persons who were identified with dementia during the study.
Results
Basic Classification Model Within the study sample, 93 respondents developed
dementia during the study (wave 2–5, 8 years), resulting in 17.9% (93/521) new dementia cases over 8 years of fol-low-up. The longitudinal analysis revealed an overall 2-year rate of 6.9% new dementia cases derived from 4 in-tervals (wave 1–2, wave 2–3, and so forth). The latter rate provides the reference against which the positive predic-tive values for dementia derived from GEE were evalu-ated.
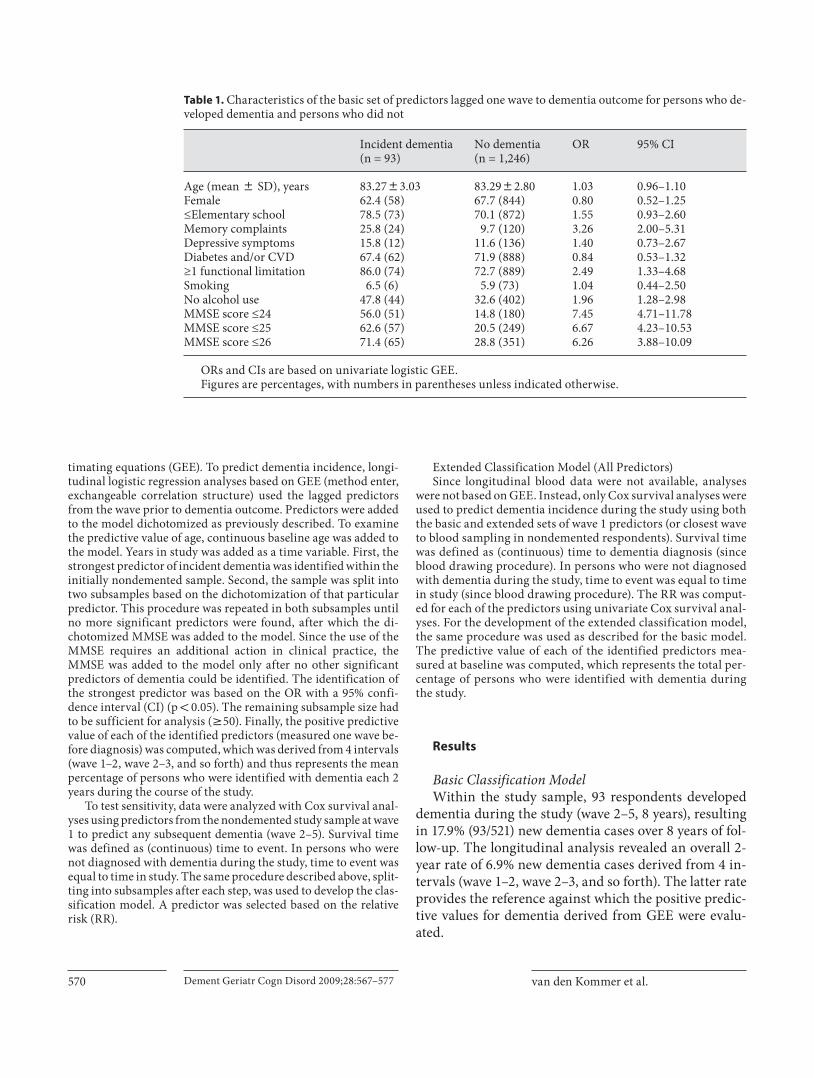
Table 1. Characteristics of the basic set of predictors lagged one wave to dementia outcome for persons who de-veloped dementia and persons who did not
Incident dementia(n = 93)
No dementia(n = 1,246)
OR 95% CI
Age (mean 8 SD), years 83.2783.03 83.2982.80 1.03 0.96–1.10Female 62.4 (58) 67.7 (844) 0.80 0.52–1.25≤Elementary school 78.5 (73) 70.1 (872) 1.55 0.93–2.60Memory complaints 25.8 (24) 9.7 (120) 3.26 2.00–5.31Depressive symptoms 15.8 (12) 11.6 (136) 1.40 0.73–2.67Diabetes and/or CVD 67.4 (62) 71.9 (888) 0.84 0.53–1.32≥1 functional limitation 86.0 (74) 72.7 (889) 2.49 1.33–4.68Smoking 6.5 (6) 5.9 (73) 1.04 0.44–2.50No alcohol use 47.8 (44) 32.6 (402) 1.96 1.28–2.98MMSE score ≤24 56.0 (51) 14.8 (180) 7.45 4.71–11.78MMSE score ≤25 62.6 (57) 20.5 (249) 6.67 4.23–10.53MMSE score ≤26 71.4 (65) 28.8 (351) 6.26 3.88–10.09
ORs and CIs are based on univariate logistic GEE.Figures are percentages, with numbers in parentheses unless indicated otherwise.
Early Identification of Persons at Risk for Dementia
Dement Geriatr Cogn Disord 2009;28:567–577 571
Table 1 shows the characteristics and OR of the basic set of predictors measured in nondemented respondents one wave prior to dementia outcome, separately for per-sons who developed dementia during the study and those who did not.
The results show that persons with memory com-plaints were over three times more likely to receive a de-mentia diagnosis after one wave of follow-up. In addition,
functional limitations, drinking no alcohol and lower MMSE score 2 years prior to diagnosis were significant predictors of dementia. With respect to the different cut-offs for the MMSE, the results show the highest OR for an MMSE score ̂ 24. Persons who received a dementia diagnosis during the study had a mean MMSE score of 23.76 (SD = 3.80) one wave prior to diagnosis, and per-sons who were not diagnosed with dementia had a mean
Alcoholconsumption
n = 1,3396.9%
na = 14416.7%
OR = 3.26
na =1,1805.8%
OR = 0.31
ne =2301.3%
OR = 0.23
nd = 2896.2%
OR = 0.30
nb = 899.0%
OR = 0.21
Memorycomplaints
nb = 5228.8%
OR = 4.67
nc = 3879.0%
OR = 2.32
nd = 8918.0%
OR = 3.28
nc =7894.2%
OR = 0.43
nf = 4691.7%
OR = 0.05
ne = 5514.9%
OR = 4.44
nf = 7724.7%
OR = 18.40
Functionallimitations
YesNo
NoYes
MMSE>24 ≤24
MMSE>24 ≤24
MMSE>25 ≤25
YesNo
Fig. 2. Basic classification model using the basic set of predictors one wave prior to diagnosis for the ascertainment of the risk of developing dementia using GEE. n a = Missing data on memory complaints, GEE was based on n = 1,324; n b = missing data on the MMSE score, GEE was based on n = 141; n c = missing data on al-cohol consumption, GEE was based on n = 1,176; n d = missing
data on the MMSE score, GEE was based on n = 378; n e = missing data on functional limitations, GEE was based on n = 781; n f = missing data on the MMSE score, GEE was based on n = 546; n = the number of persons who satisfied the set criterion; % = the per-centage of subjects who were diagnosed with dementia during the study.
van den Kommer et al. Dement Geriatr Cogn Disord 2009;28:567–577 572
MMSE score of 27.20 (SD = 3.10) one wave prior to out-come.
Figure 2 shows the classification tree using the basic set of predictors one wave prior to diagnosis. Memory complaints were the strongest predictor of dementia(OR = 3.26; 95% CI = 2.00–5.31). In the subsample ofpersons with memory complaints, an MMSE score ̂ 25 (OR = 4.67; 95% CI = 1.70–12.85) resulted in an overall percentage of 28.8 classified with dementia 2 years later. In the subsample without memory complaints, drinking no alcohol (OR = 2.32; 95% CI = 1.43–3.78) and an MMSE score ̂ 24 (OR = 3.28; 95% CI = 1.54–7.02) resulted in a predictive value of 18.0%. In the subsample of persons consuming alcohol, having functional limitations was the strongest predictor of dementia diagnosis 2 years lat-er (OR = 4.44; 95% CI = 1.32–14.94). In this subsample, an MMSE score ̂ 24 (OR = 18.40; 95% CI = 7.57–44.75) resulted in a predictive value of 24.7%. The number of persons who developed dementia within the subsample without functional limitations was only 3 (positive pre-dictive value of 1.3%).
Sensitivity analyses using Cox survival analyses to predict dementia incidence during the study (wave 2–5) using wave 1 predictors resulted in similar classification trees and a maximum increase from the initial 8-year rate of 17.9% newly identified dementia cases to a total posi-tive predictive value for dementia of 52.6% (data not shown).
Extended Classification Model During the course of the study, 58 (of 387 in the total
study sample) were diagnosed with dementia resulting in an initial percentage of 15.0% newly identified dementia cases. This rate provides the reference against which the computed positive predictive values for dementia were evaluated.
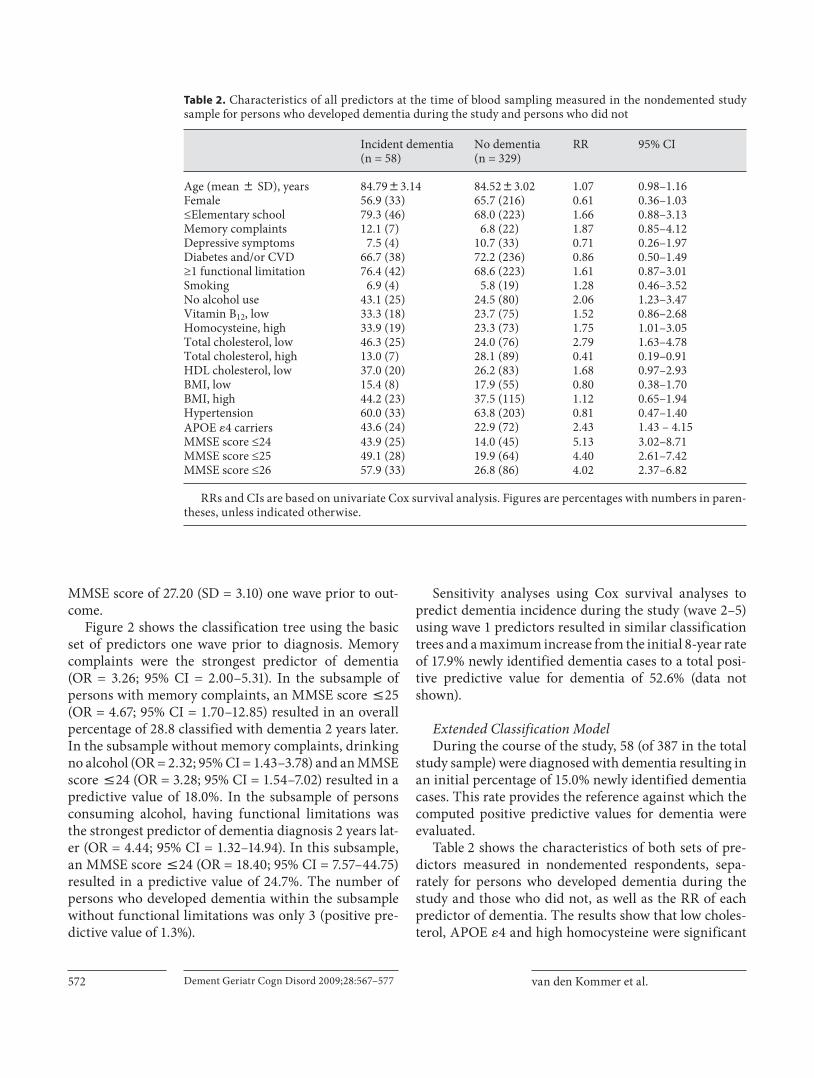
Table 2 shows the characteristics of both sets of pre-dictors measured in nondemented respondents, sepa-rately for persons who developed dementia during the study and those who did not, as well as the RR of each predictor of dementia. The results show that low choles-terol, APOE � 4 and high homocysteine were significant
Table 2. Characteristics of all predictors at the time of blood sampling measured in the nondemented study sample for persons who developed dementia during the study and persons who did not
Incident dementia(n = 58)
No dementia(n = 329)
RR 95% CI
Age (mean 8 SD), years 84.7983.14 84.5283.02 1.07 0.98–1.16Female 56.9 (33) 65.7 (216) 0.61 0.36–1.03≤Elementary school 79.3 (46) 68.0 (223) 1.66 0.88–3.13Memory complaints 12.1 (7) 6.8 (22) 1.87 0.85–4.12Depressive symptoms 7.5 (4) 10.7 (33) 0.71 0.26–1.97Diabetes and/or CVD 66.7 (38) 72.2 (236) 0.86 0.50–1.49≥1 functional limitation 76.4 (42) 68.6 (223) 1.61 0.87–3.01Smoking 6.9 (4) 5.8 (19) 1.28 0.46–3.52No alcohol use 43.1 (25) 24.5 (80) 2.06 1.23–3.47Vitamin B12, low 33.3 (18) 23.7 (75) 1.52 0.86–2.68Homocysteine, high 33.9 (19) 23.3 (73) 1.75 1.01–3.05Total cholesterol, low 46.3 (25) 24.0 (76) 2.79 1.63–4.78Total cholesterol, high 13.0 (7) 28.1 (89) 0.41 0.19–0.91HDL cholesterol, low 37.0 (20) 26.2 (83) 1.68 0.97–2.93BMI, low 15.4 (8) 17.9 (55) 0.80 0.38–1.70BMI, high 44.2 (23) 37.5 (115) 1.12 0.65–1.94Hypertension 60.0 (33) 63.8 (203) 0.81 0.47–1.40APOE �4 carriers 43.6 (24) 22.9 (72) 2.43 1.43 – 4.15MMSE score ≤24 43.9 (25) 14.0 (45) 5.13 3.02–8.71MMSE score ≤25 49.1 (28) 19.9 (64) 4.40 2.61–7.42MMSE score ≤26 57.9 (33) 26.8 (86) 4.02 2.37–6.82
RRs and CIs are based on univariate Cox survival analysis. Figures are percentages with numbers in paren-theses, unless indicated otherwise.
Early Identification of Persons at Risk for Dementia
Dement Geriatr Cogn Disord 2009;28:567–577 573
predictors of dementia, while high cholesterol reduced the risk of becoming demented during the study. In ad-dition, drinking no alcohol and lower MMSE score were significant predictors of dementia. With respect to the different cutoffs used for dichotomization of the MMSE, again the highest RR was found for the cutoff score ̂ 24 in the total nondemented study sample. Persons who were diagnosed with dementia during the study had a mean MMSE score of 24.93 (SD = 3.77). The mean MMSE score of persons who did not develop dementia during the study was 27.42 (SD = 2.87).
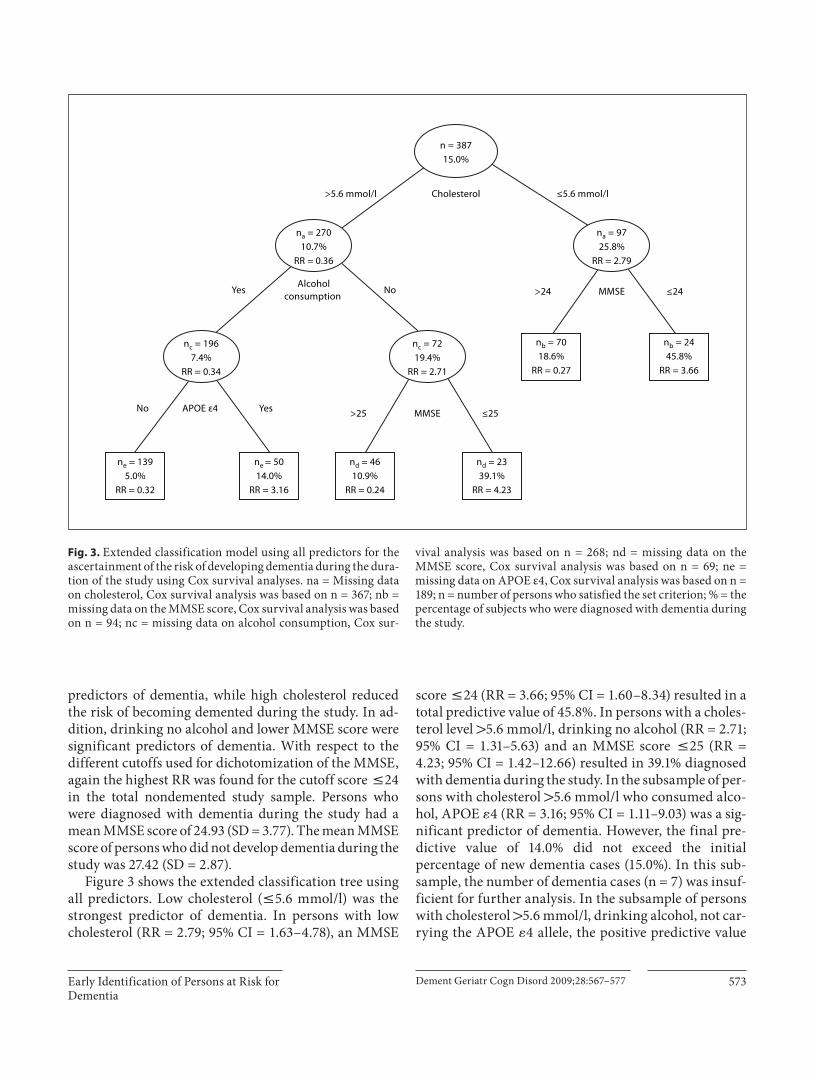
Figure 3 shows the extended classification tree using all predictors. Low cholesterol ( ̂ 5.6 mmol/l) was the strongest predictor of dementia. In persons with low cholesterol (RR = 2.79; 95% CI = 1.63–4.78), an MMSE
score ̂ 24 (RR = 3.66; 95% CI = 1.60–8.34) resulted in a total predictive value of 45.8%. In persons with a choles-terol level 1 5.6 mmol/l, drinking no alcohol (RR = 2.71; 95% CI = 1.31–5.63) and an MMSE score ̂ 25 (RR = 4.23; 95% CI = 1.42–12.66) resulted in 39.1% diagnosed with dementia during the study. In the subsample of per-sons with cholesterol 1 5.6 mmol/l who consumed alco-hol, APOE � 4 (RR = 3.16; 95% CI = 1.11–9.03) was a sig-nificant predictor of dementia. However, the final pre-dictive value of 14.0% did not exceed the initial percentage of new dementia cases (15.0%). In this sub-sample, the number of dementia cases (n = 7) was insuf-ficient for further analysis. In the subsample of persons with cholesterol 1 5.6 mmol/l, drinking alcohol, not car-rying the APOE � 4 allele, the positive predictive value
Alcoholconsumption
n = 38715.0%
na = 9725.8%
RR = 2.79
na = 27010.7%
RR = 0.36
ne = 1395.0%
RR = 0.32
nd = 4610.9%
RR = 0.24
nb = 7018.6%
RR = 0.27
Cholesterol ≤5.6 mmol/l>5.6 mmol/l
nb = 2445.8%
RR = 3.66
nc = 7219.4%
RR = 2.71
nd = 2339.1%
RR = 4.23
nc = 1967.4%
RR = 0.34
APOE ε4 No Yes
Yes No
ne = 5014.0%
RR = 3.16
MMSE>24 ≤24
MMSE>25 ≤25
Fig. 3. Extended classification model using all predictors for the ascertainment of the risk of developing de mentia during the dura-tion of the study using Cox survival analyses. na = Missing data on cholesterol, Cox survival analysis was based on n = 367; nb = missing data on the MMSE score, Cox survival analysis was based on n = 94; nc = missing data on alcohol consumption, Cox sur-
vival analysis was based on n = 268; nd = missing data on the MMSE score, Cox survival analysis was based on n = 69; ne = missing data on APOE ε4, Cox survival analysis was based on n = 189; n = number of persons who satisfied the set criterion; % = the percentage of subjects who were diagnosed with dementia during the study.
van den Kommer et al. Dement Geriatr Cogn Disord 2009;28:567–577 574
for dementia was 5.0% (7 developed dementia during the study).
A comparison between persons at the highest risk for dementia identified with the basic classification model based on GEE (subsample with memory complaints and MMSE score ̂ 25) and the extended model based on Cox survival analyses (subsample with low cholesterol and MMSE score ̂ 24) showed an overlap of 8.3% (n = 2/24). A comparison within the group of persons for whom a cholesterol level was defined showed an overlap of 12.5% (n = 2/16).
Discussion
The aim of the present study was to evaluate previ-ously proposed classification models for early identifica-tion of persons at risk for dementia by constructing these models in a population-based longitudinal sample in which a formal dementia diagnosis was present to test whether congruent models would develop. The underly-ing objective was to provide cost-effective guidance for early detection of persons at risk for subsequent dementia in primary care.
It was shown that the basic classification model pro-duced an overall 2-year positive predictive value of 28.8%, to be compared with the corresponding 2-year initial rate of 6.9% new dementia cases. The 8-year cumulative pre-dictive value for dementia over the course of the study of the basic model increased from 17.9 to 52.6%. The ex-tended classification model produced an increase in the cumulative predictive value for dementia over the course of the study from 15.0 to 45.8%. In addition, it was found that the classification models identified mostly different persons, i.e. a low overlap. The univariate analyses showed that memory complaints were not a significant predictor in the sample used for the extended classification model. However, persons with low cholesterol who became de-mented were not complaining about memory problems some years before diagnosis. Therefore, the two sets of markers with the highest predictive value (memory com-plaints and MMSE score ̂ 25; low cholesterol and MMSE score ̂ 24) could be used complementary to each other during case finding of persons at risk for dementia. At the same time, research efforts should focus on understand-ing why these models identify different persons to be at risk.
A comparison of models of persistent cognitive de-cline previously developed in the Longitudinal Aging Study Amsterdam (LASA) with the current models of de-
mentia incidence indicates a fairly similar combination of predictors. Similar to findings in the LASA, memory complaints, drinking no alcohol, functional limitations and lower MMSE score were also significant predictors of dementia in the basic classification model developed in the present study. With respect to the extended model, consistent with the model developed in the LASA, low cholesterol, APOE � 4 and lower MMSE score were also significant predictors of dementia.
Some differences from prior findings need to be noted. In the current study, neither age nor education were sig-nificant predictors in the basic classification model. Also, the predictive utility of functional limitations in the model was different. In the extended model, again age was not a significant predictor. Furthermore, alcohol abstinence was a stronger predictor of dementia than APOE � 4. Finally, in some instances adding the dichoto-mized MMSE to the models suggested different optimal cutoffs for the best prediction of being at risk for demen-tia. These differences are likely due to differences in char-acteristics between the two samples. The baseline age range in the current study was 79–97 (mean = 83.3, SD = 3.0), while the baseline age range in the LASA sample was 57–88 (mean = 71.6, SD = 8.3). Age dichotomized at 75 years was most predictive of persistent cognitive decline in the LASA. The relatively high mean age and small vari-ance in the current sample is likely to account for the fact that age, as might be expected, was not a significant pre-dictor of dementia in this cohort. Previous research has shown that prevalence and incidence of dementia in-creases with age [33] . This is in contrast with our finding that the percentage of newly identified dementia cases initially increased from 7.3% (wave 1–2) to 8.7% (wave 2–3) but started decreasing after wave 3 to 5.8% (wave 3–4) and 4.2% (wave 4–5). Possibly, the longer a person survived and remained healthy enough to continue in the study, the more the risk of becoming demented decreased, and the likelihood of a hardy phenotype increased. How-ever, the longitudinal regression analysis did not show a protective effect of the variable time in study. Nonethe-less, it may be hypothesized that the oldest-old (85+) in-cluded in the current study were especially hardy, since both twins had to be alive and able to participate in order to be included in the OCTO-Twin Study at baseline. Therefore, a genetic protective effect may still be plausi-ble.
In addition, of the relatively older participants in the present study sample 71.2% had an education level less than or equal to elementary school compared to 39.8% in the younger study sample derived from the LASA. Failure
Early Identification of Persons at Risk for Dementia
Dement Geriatr Cogn Disord 2009;28:567–577 575
to replicate low education as a significant risk factor is likely due to the restricted range of education in current Swedish older cohorts, and especially in those older than 80 [21] . In the early 20th century, only 6 years of educa-tion was mandatory in Sweden and the vast majority of the population stopped school thereafter [34] .
In the present study, having functional limitations was a significant risk factor of dementia in alcohol-consum-ing persons without memory complaints, while in the model developed in the LASA it was a significant predic-tor only for persons 75 years and younger. The fact that functional limitations were not a significant risk factorin alcohol-consuming persons over 75 without memory complaints is likely due to power; only 13 persons devel-oped persistent cognitive decline in that subsample.
In the extended model, no alcohol consumption was a stronger predictor of dementia than APOE � 4. The re-sults from a study by Sando et al. [35] show that the risk of APOE � 4 is weaker with increasing age. They showed that the frequency of the APOE � 4 allele decreased in pa-tients with Alzheimer’s disease onset after the age of 80 [35] . In addition, alcohol abstinence may be a strong marker for frailty in this older sample [36] . A study by Hajat et al. [37] showed that nondrinkers were less likely to have a sociable lifestyle and more likely to have a poor general health perception, difficulty with everyday ac-tivities and suffer from cognitive impairment compared to drinkers. Further research into potential benefits of light alcohol consumption is needed.
Some limitations of the present study need to be ad-dressed. As expected, mortality rate in this old cohort of persons aged 80 years and older was relatively high com-pared to younger cohorts. For comparison, mortality rate in subjects aged 80 years and older participating in the LASA was around 30%, therefore similar to the OCTO-Twin Study. Mortality may have led to an underestima-tion of the strength of memory complaints, functional limitations and the MMSE score as significant predictors of future dementia, since these predictors were associated with loss to follow-up. Furthermore, for the purpose of the present study, we have combined diabetes and CVD into one dichotomous variable. However, some compo-nents of this cardiovascular risk factor such as circulation disturbances may be less predictive of dementia risk com-pared to other components such as stroke. This may have diluted the impact of this predictor for subsequent de-mentia. A limitation with respect to the evaluation of the extended classification model was that blood was drawn on only one occasion. Therefore, in contrast with the ba-sic model, we were only able to use predictors measured
in the nondemented study sample during the wave of (or closest to) blood collection to predict incident dementia during the study. This resulted in a lower power to detect significant predictors. However, the sensitivity analyses of the basic model revealed similar results, which makes it less likely that we have missed predictors using Cox re-gression instead of GEE. Also, low-density lipoprotein cholesterol and C-reactive protein were not available within the OCTO-Twin data set. Furthermore, although we have based our selection of the basic and extended sets of predictors of dementia on recent reviews and research and feasibility in primary care, we may have missed po-tential predictors of dementia risk during the initialselection process for our previous study. One potential predictor we had not included in our previous study is hy-potension [38, 39] . Post hoc analyses showed that hypo-tension, defined as systolic blood pressure below 120 mm Hg or diastolic blood pressure below 70 mm Hg, was not a significant predictor of subsequent dementia risk in the current study. Finally, a potential limitation of the cur-rent study is that generalizability of the results to a group of non-Caucasian elderly is not known due to the highly homogeneous ethnic and cultural background of the par-ticipants in the OCTO-Twin Study.
Strengths of the present study are the presence of a formal dementia diagnosis based on DSM-III-R criteria and the fact that we could increase power by focusing on predicting dementia incidence during the total study pe-riod. Furthermore, two methods of analyses were used for the development of the basic classification tree. Both methods revealed the same set of variables predictive of a higher risk of developing dementia over the course of the study. Finally, given our previous finding that age ( 1 75 years) was by far the strongest predictor of future persistent cognitive decline, a strength of the current study is that we evaluated both models in a sample al-ready at a higher risk for dementia, i.e. in participants 80 years and older.
In conclusion, both classification models developed in the present study, in which a formal dementia diagnosis was available, led to a substantial increase of the predic-tive value for dementia. In the basic model using predic-tors easily enquired by the general practitioner, the initial 2-year percentage of new dementia cases increased from 6.9 to 28.8% while the 8-year cumulative predictive value increased from 17.9 to 52.6%. In the extended classifica-tion model including markers determined in the blood, the predictive value increased from 15.0 to 45.8%. Final-ly, the sets of markers with the highest predictive value in each model largely identified different persons and thus
van den Kommer et al. Dement Geriatr Cogn Disord 2009;28:567–577 576
References
1 Haan MN, Wallace R: Can dementia be pre-vented? Brain aging in a population-based context. Annu Rev Public Health 2004; 25: 1–24.
2 Alagiakrishnan K, McCracken P, Feldman H: Treating vascular risk factors and main-taining vascular health: is this the way to-wards successful cognitive ageing and pre-venting cognitive decline? Postgrad Med J 2006; 82: 101–105.
3 Gauthier S, Reisberg B, Zaudig M, Petersen RC, Ritchie K, Broich K, Belleville S, Brodaty H, Bennett D, Chertkow HJ, Cummings JL, De Leon M, Feldman H, Ganguli M, Hampel H, Scheltens P, Tierney MC, Whitehouse P, Winblad B: Mild cognitive impairment. Lan-cet 2006; 367: 1262–1270.
4 Gauthier S, Loft H, Cummings J: Improve-ment in behavioural symptoms in patients with moderate to severe Alzheimer’s disease by memantine: a pooled data analysis. Int J Geriatr Psychiatry 2008; 23: 537–545.
5 Gauthier SG: Alzheimer’s disease: the bene-fits of early treatment. Eur J Neurol 2005; 12(suppl 3):11–16.
6 Sørensen LV, Waldorff FB, Waldemar G: Early counselling and support for patients with mild Alzheimer’s disease and their caregivers: a qualitative study on outcome. Aging Ment Health 2008; 12: 444–450.
7 Spijker A, Vernooij-Dassen M, Vasse E, Ad-ang W, Wollersheim H, Grol R, Verheij F: Ef-fectiveness of nonpharmacological interven-tions in delaying the institutionalization of patients with dementia: a meta-analysis. J Am Geriatr Soc 2008; 56: 1116–1128.
8 Mittelman MS, Haley WE, Clay OJ, Roth DL: Improving caregiver well-being delays nurs-ing home placement of patients with Alz-heimer disease. Neurology 2006; 67: 1592–1599.
9 Bamford C, Eccles M, Steen N, Robinson L: Can primary care record review facilitate earlier diagnosis of dementia? Fam Pract 2007; 24: 108–116.
10 Valcour VG, Masaki KH, Curb JD, Blanch-ette PL: The detection of dementia in the pri-mary care setting. Arch Intern Med 2000; 160: 2964–2968.
11 Vernooij-Dassen MJ, Moniz-Cook ED, Woods RT, De Lepeleire J, Leuschner A, Zanetti O, De Rotrou J, Kenny G, Franco M, Peters V, Iliffe S: Factors affecting timely rec-ognition and diagnosis of dementia across Europe: from awareness to stigma. Int J Geri-atr Psychiatry 2005; 20: 377–386.
12 Bäckman L: Memory and cognition in pre-clinical dementia: what we know and what we do not know. Can J Psychiatry 2008; 53: 354–360.
13 Allore H, Tinetti ME, Araujo KLB, Hardy S, Peduzzi P: A case study found that a regres-sion tree outperformed multiple linear re-gression in predicting the relationship be-tween impairments and social and productive activities scores. J Clin Epidemiol 2005; 58: 154–161.
14 Breiman L, Friedman JH, Olshen RA, Stone CJ: Classification and Regression Trees. Bel-mont, Wadsworth International Group, 1984.
15 Lemon SC, Roy J, Clark MA, Friedmann PD, Radowski W: Classification and regression tree analysis in public health: methodologi-cal review and comparison with logistic re-gression. Ann Behav Med 2003; 26: 172–181.
16 Van den Kommer TN, Comijs HC, Dik MG, Jonker C, Deeg DJH: Development of clas-sification models for early identification of persons at risk for persistent cognitive de-cline. J Neurol 2008; 255: 1486–1494.
17 McClearn GE, Johansson B, Berg S, Pedersen NL, Ahern F, Petrill SA, Plomin R: Substan-tial genetic influence on cognitive abilities in twins 80 or more years old. Science 1997; 276: 1560–1563.
18 Simmons SF, Johansson B, Zarit SH, Ljungquist B, Plomin R, McClearn GE: Se-lection bias in samples of older twins? A comparison between octogenarian twins and singletons in Sweden. J Aging Health 1997; 9: 553–567.
19 American Psychiatric Association: Diagnos-tic and Statistical Manual of Mental Disor-ders, ed 3 revised. Washington, American Psychiatric Association, 1987.
20 Johansson B, Zarit SH: Dementia and cogni-tive impairment in the oldest old: a compar-ison of two rating methods. Int Psychogeri-atr 1991; 3: 29–38.
21 Johansson B, Zarit SH: Prevalence and inci-dence of dementia in the oldest-old: a longi-tudinal study of a population-based sample of 84–90-year-olds in Sweden. Int J Geriatr Psychiatry 1995; 10: 359–366.
22 Gatz M, Fratiglioni L, Johansson B, Berg S, Mortimer JA, Reynolds CA, Fiske A, Peder-sen NL: Complete ascertainment of demen-tia in the Swedish Twin Registry: the HAR-MONY study. Neurobiol Aging 2005; 26: 439–447.
23 Ownby RL, Crocco E, Acevedo A, John V, Loewenstein D: Depression and risk for Alz-heimer disease: systematic review, meta-analysis, and metaregression analysis. Arch Gen Psychiatry 2006; 63: 530–538.
24 Panza F, D’Introno A, Colacicco AM, Capur-so C, Pichichero G, Capurso SA, Capurso A, Sofrizzi V: Lipid metabolism in cognitive de-cline and dementia. Brain Res Rev 2006; 51: 275–292.
25 Razay G, Vreugdenhil A, Wilcock G: Obesi-ty, abdominal obesity and Alzheimer dis-ease. Dement Geriatr Cogn Disord 2006; 22: 173–176.
26 Román GC: Vascular dementia prevention: a risk factor analysis. Cerebrovasc Dis 2005; 20(suppl 2):91–100.
27 Stampfer MJ: Cardiovascular disease and Alzheimer’s disease: common links. J Intern Med 2006; 260: 211–223.
28 Van der Flier WM, Scheltens P: Epidemiol-ogy and risk factors of dementia. J Neurol Neurosurg Psychiatry 2005; 76(suppl 5):v2–v7.
29 Folstein MF, Folstein SE, McHugh PR: Mini-Mental State. A practical method for grading cognitive state of patients for the clinician. J Psychiatr Res 1975; 12: 189–198.
30 Radloff LS: The CES-D scale: a self-report depression scale for research in the general population. Appl Psychol Meas 1977; 1: 385–401.
may be used complementary in primary care to further maximize early detection of persons at risk for dementia in a feasible and cost-effective way. Practical use of the models will be investigated in primary practice by imple-mentation of a short and simple questionnaire (decision tree) for identification of persons at high risk for future dementia, based on findings of the present study as well as the classification models developed in the LASA [16] .
Acknowledgements
This research was facilitated by the IALSA research network (NIH/NIA 1R01AG026453) and Fonds NutsOhra (project 080T-033). The OCTO-Twin Study was supported by a grant from the National Institute on Aging (NIA: AG 008861). We would like to acknowledge Lesa Hoffman for her help with managing the OCTO-Twin data.
Early Identification of Persons at Risk for Dementia
Dement Geriatr Cogn Disord 2009;28:567–577 577
31 Lewinsohn PM, Seeley JR, Roberts RE, Allen NB: Center for Epidemiologic Studies De-pression scale (CES-D) as a screening instru-ment for depression among community-re-siding older adults. Psychol Aging 1997; 12: 277–287.
32 Gatz M, Johansson B, Pedersen N, Berg S, Reynolds C: A cross-national self-report measure of depressive symptomatology. Int Psychogeriatr 1993; 5: 147–156.
33 Fratiglioni L, Launer LJ, Andersen K, Bre-teler MMB, Copeland JRM, Dartigues JF, Lobo A, Martinez-Lage J, Soininen H, Hof-man A: Incidence of dementia and major subtypes in Europe: a collaborative study of population-based cohorts. Neurologic Dis-eases in the Elderly Research Group. Neurol-ogy 2000; 54(suppl 5):S10–S15.
34 Gatz M, Svedberg P, Pedersen NL, Mortimer JA, Berg S, Johansson B: Education and the risk of Alzheimer’s disease: findings from the study of dementia in Swedish twins. J Gerontol B Psychol Sci Soc Sci 2001; 56:P292–P300. Erratum in: J Gerontol B Psy-chol Sci Soc Sci 2004; 59:P34.
35 Sando SB, Melquist S, Cannon A, Hutton ML, Sletvold O, Saltvedt I, White LR, Lyder-sen S, Aasly JO: APOE epsilon 4 lowers age at onset and is a high risk factor for Alzheimer’s disease: a case control study from central Norway. BMC Neurol 2008; 8: 9.
36 Woo J, Goggins W, Sham A, Ho SC: Social determinants of frailty. Gerontology 2005; 51: 402–408.
37 Hajat S, Haines A, Bulpitt C, Fletcher A: Pat-terns and determinants of alcohol consump-tion in people aged 75 years and older: results from the MRC trial of assessment and man-agement of older people in the community. Age Ageing 2004; 33: 170–177.
38 Moretti R, Torre P, Antonello RM, Mangan-aro D, Vilotti C, Pizzolato G: Risk factors for vascular dementia: hypotension as a key point. Vasc Health Risk Manag 2008; 4: 395–402.
39 Yap PLK, Niti M, Yap KB, Ng TP: Orthostat-ic hypotension, hypotension and cognitive status: early comorbid markers of primary dementia? Dem Ger Cog Disord 2008; 26: 239–246.