City Profile of the Construction Sector in Bhubaneswar - EU-REI
62
-
Upload
khangminh22 -
Category
Documents
-
view
2 -
download
0
Transcript of City Profile of the Construction Sector in Bhubaneswar - EU-REI


Resource Flows in Indian Cities City Profile of the Construction Sector in Bhubaneswar
June 2020

Published by European Union’s Resource Efficiency Initiative (EU-REI) Deutsche Gesellschaft für Internationale Zusammenarbeit (GIZ) GmbH B - 5/1, Safdarjung Enclave New Delhi 110029 T: 011-49495353 url : eu-rei.com
Authors Development Alternatives Pankaj Khanna, Dr Ria Sinha, Isha Sen, Gitika Goswami
EU-REI Dr Dieter Mutz, Dr Rachna Arora, Dr Reva Prakash, Pranav Sinha
Advisors Dr Dieter Mutz, Dr Rachna Arora, Zeenat Niazi, Martina Prox
Research Partner Development Alternatives ifu Hamburg
Disclaimer
This production is produced under the European Union – Resource Efficiency Initiative contracted by the European Union Delegation to India. The content for this publication does not reflect the official position of the European Union. Responsibility for the information and views expressed therein lies entirely with the authors.
The data and information used for preparing this report have been sourced from secondary sources including state government departments and officials, published sources of Government of India, interviews and consultations done by the consultants. While due care has been taken to ensure authenticity of the data and other information used, any inadvertent wrong data or information used is regretted. We are not liable to any legal or penal responsibilities arising from this and from the use of this report by anyone.
© European Union 2020

CONTENTSExecutive Summary
Chapter 1 Introduction 01Overview of Urban Development 02Zoning 03Bhubaneswar Cuttack Urban Complex – Vision 2030 04Administrative and Regulatory Framework 05Slum Settlements 06Affordable Housing 07Industrial Waste in Odisha 08 Construction and Demolition waste 09
Chapter 2 Study Methodology 15Material Flow Analysis and Life Cycle Assessment 15Methodology 16Sources of Data Collection 18
Chapter 3. Findings and Analysis 19Housing Trends - Bhubaneswar 19Built form characteristics 20Material usage and building practice 21MFA Findings 23Carbon Footprint 27Transportation 29End of Life Phase 30 Key Aspects for Resource Efficiency 32
Chapter 4. Priority Areas for Policy Action 35Sustainable Concrete 35Cement 35Aggregates 36Construction and Demolition waste 36Industrial Waste Utilization 37 Ground Granulated Blast Furnace Lag (GGBFS) 39 Red Mud 39Prefabricated Construction 39Baseline and Systematic Data Availability 40
References 41
Annexures 43Annex 1: Description of Umberto MFA Model- lifecycle stages 43Annex 2: Materials description and CO2 emission factors 44Annex 3: Transportation distance of materials 51

LIST OF TABLESTable 1: Demographic profile- Bhubaneswar 1
Table 2: Estimated dwelling unit requirement – BDPA 2030; Source: Perspective Plan Vision 2030 for BCUC, 2010 10
Table 3: Industrial wastes generated in Odisha 12
Table 4: Material flow analysis and lifecycle analysis methodology framework 17
Table 5: Snapshot of data on construction permits issued by BMC 17
Table 6: Primary data collected from Bhubaneswar 18
Table 7: Typical material specification and usage in construction sector in Bhubaneswar 22
Table 8: Material consumption factors for high rise construction; Based on quantities gathered for Imperia project from NBCC 23
Table 9: BOQ of residential projects used in the study 23
Table 10: Material consumption in residential construction in Bhubaneswar 26
Table 11: Material consumption in residential construction in Bhubaneswar 28
Table 12: Estimated quantum of C&D waste generated from 2020 to 2025 37
Table 13: Major industrial hubs in the Bhubaneswar-Cuttack region 38
Table 14: Industrial waste generated per annum in various districts of Odisha 38
Table 15: Umberto stages as shown in the above Model 43
Table 16: Process description in each stage in Umberto 44
Table 17: Transportation distance of raw materials 51

LIST OF FIGURESFigure 1: Population growth of Bhubaneswar 02
Figure 2: Bhubaneswar jurisdiction map 03
Figure 3: Comprehensive development plan for BDPA 2030 04
Figure 4: Bhubaneswar Cuttack Urban Complex Final Proposal for CDP-BDPA 07
Figure 5: Recognized slum settlements in Bhubaneswar 09
Figure 6: Major industries in Bhubaneswar 12
Figure 7: High rise residential construction in Bhubaneswar 20
Figure 8: Distribution of floors in 2179 residential housing projects in Bhubaneswar from 2015 to 2018 21
Figure 9: Quantum of raw materials consumed according to building types 24
Figure 10: Prefabricated construction – EWS housing in Chandrashekharpur 25
Figure 11: Material flow for 2179 buildings in Bhubaneswar from 2015 to 2018 27
Figure 12: CO2 footprint of materials for 2179 residential projects in Bhubneshwar 28
Figure 13: Transportation of materials for 2179 projects in Bhubaneshwar (BUA 1.6 million m2) Kilometres 30
Figure 14: Carbon footprint of end-of-life phase for 2179 residential buildings in Bhubaneswar - BUA 1.6 Million m2, Kilotonne CO2 30
Figure 15: Umberto model of material flow in Bhubaneswar from 2015 to 2018 31
Figure 16: Sankey diagram - material flow for housing in Bhubaneswar for residential projects BUA 1.7 Million sq.m 32

LIST OF ABBREVIATIONSAAC Autoclaved Aerated ConcreteACP Aluminium Composite PanelsBDA Bhubaneswar Development AuthorityBDPA Bhubaneswar Development Planning AreaBMC Bhubaneswar Municipal CorporationBOQ Bill of QuantitiesBRTS Bus Rapid Transit SystemBUA Built-up AreaC&D Construction and DemolitionIT Information TechnologyCSIR-IMMT Council of Scientific & Industrial Research- Institute of Minerals and
Materials TechnologyDA Development AlternativesDBM Demolished Brick MasonryEU-REI European Union - Resource Efficiency InitiativeEWS Economically Weaker SectionFSI Floor Space IndexGHG Green House GasGIZ Deutsche Gesellschaft für Internationale ZusammenarbeitGSB Granular Sub BaseGVW Gross Vehicle WeightGWP Global Warming PotentialHIG High-income GroupIPCC Intergovernmental Panel on Climate ChangeKT KilotonLC3 Limestone Calcined Clay CementLCA Lifecycle AnalysisLIG Low-income Housing GroupMFA Material Flow AnalysisMFCA Material Flow Cost AccountingMoEFCC Ministry of Environment, Forest and Climate ChangeMSMEs Micro, Small, Medium EnterprisesMSW Municipal Solid WasteMT Metric-tonNALCO National Aluminium Company Ltd.NBCC National Buildings Construction CorporationOPC Ordinary Portland CementOUHM Odisha Urban Housing MissionPPC Portland Pozzolana CementPPP Public-Private PartnershipRFA Recycled Fine AggregateRAY Rajiv Awas YojnaRAH Residential Affordable HousingRCA Recycled Coarse AggregateRMC Ready Mix Concrete

9BHUBANESWAR CITY REPORT
EXECUTIVE SUMMARYThis city report is the result of a research-based study on Material Flow Analysis of the construction sector in Bhubaneswar, with a focus on the housing sector. The study is part of the European Union’s Resource Efficiency Initiative (EU-REI) for India and aims to support India in the implementation of the United Nations Global Sustainable Consumption and Production (SCP) agenda by way of adapting international standards and best practices on resource efficiency and fostering the sustainable use of resources. The report encapsulates the findings of Material Flow Analysis (MFA) of the housing sector in Bhubaneswar and its environmental footprint (CO2 emissions- equivalent) and identifies the measures that can be undertaken to enhance resource efficiency and utilisation of secondary raw materials towards a circular economy.
Resource Efficiency (RE) is recognized today as an important path towards achieving sustainable development. Given its objective of creating greater value with less input and utilising the secondary raw materials thereby minimising environmental impact, RE has important implications for continued resource availability for enterprise and industry, for the conservation of limited virgin resources, and also social benefits such as job creation including in the recycling sector. Construction sector is one of the biggest consumers of virgin abiotic resources - such as soil, limestone and iron, and therefore offers significant opportunities for enhancing resource efficiency with the potential for replacing virgin resources with secondary waste-based resources.
Bhubaneswar is a rapidly growing city today and fast emerging as a hub of technical education, IT, and Healthcare. Demand for affordable housing especially for rehabilitating the large slum population of the city drive the construction sector in the city. Based on data of construction permits collected from municipal authorities and predominant construction specifications in Bhubaneswar, MFA of the housing sector was carried out using Umberto LCA+ software. MFA generates a scenario of the quantum scale of consumption of key materials – cement, aggregates, bricks, steel and aluminium. Ready Mix Concrete, river sand, cement, masonry and Construction and Demolition (C&D) waste- are the key levers for enhancing resource efficiency of the sector. Concrete as a material- being the largest consumer of virgin resources – has significant potential in reducing the overall environmental footprint of construction sector. The strong industrial base of Odisha is a distinction, and also an important source for significant volumes of industrial wastes generated every year. The positive development of fly-ash utilization in the city needs to be strengthened and replicated with other industrial wastes, notably from the Iron & Steel and Aluminium industry.
The findings of the study point towards the need for specific policy action to enable incorporation of secondary resources in the sector, and also addresses issues of sustainability of concrete use and its constituents - cement and aggregate – in the context of the city’s housing activity and priorities. A data-driven approach with robust methodologies anchored at the city administration level for estimating and utilizing secondary resources from industries and demolition activities, part replacement of natural aggregates such as river sand with secondary resources and a more informed approach towards new developments such as prefabricated concrete are some of the key areas which will benefit from policy action.

10 RESOURCE FLOWS IN INDIAN CITIES
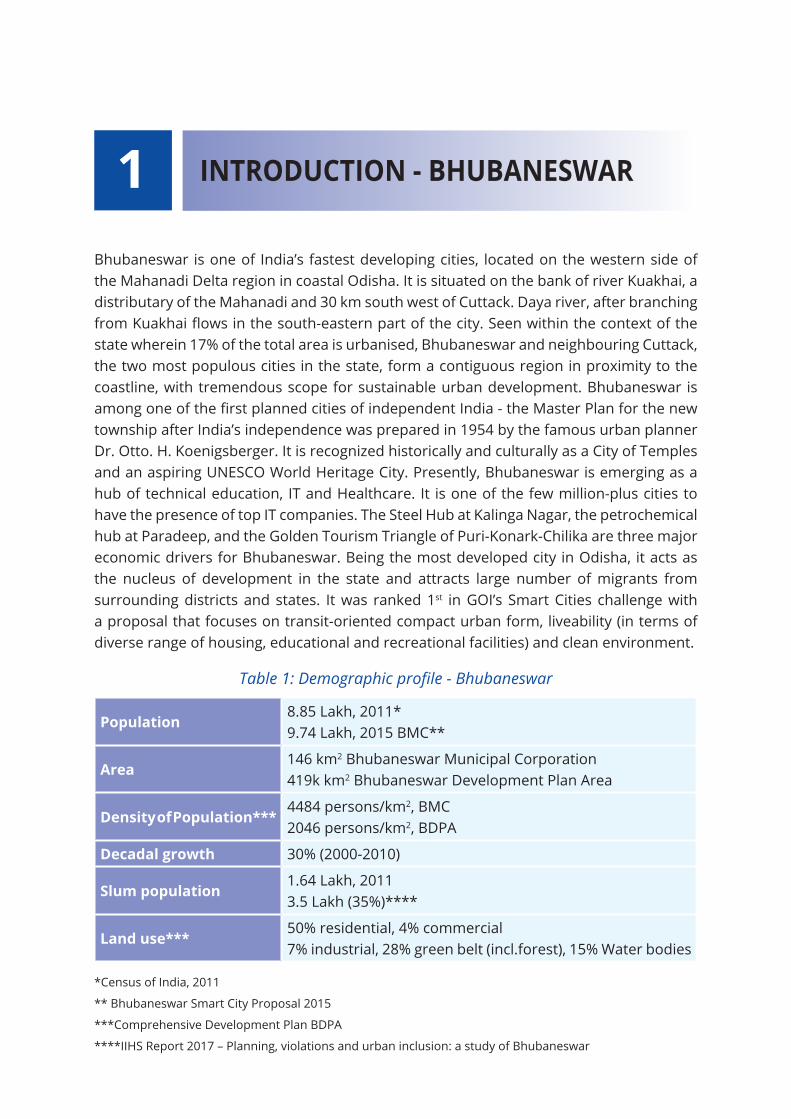
Bhubaneswar is one of India’s fastest developing cities, located on the western side of the Mahanadi Delta region in coastal Odisha. It is situated on the bank of river Kuakhai, a distributary of the Mahanadi and 30 km south west of Cuttack. Daya river, after branching from Kuakhai flows in the south-eastern part of the city. Seen within the context of the state wherein 17% of the total area is urbanised, Bhubaneswar and neighbouring Cuttack, the two most populous cities in the state, form a contiguous region in proximity to the coastline, with tremendous scope for sustainable urban development. Bhubaneswar is among one of the first planned cities of independent India - the Master Plan for the new township after India’s independence was prepared in 1954 by the famous urban planner Dr. Otto. H. Koenigsberger. It is recognized historically and culturally as a City of Temples and an aspiring UNESCO World Heritage City. Presently, Bhubaneswar is emerging as a hub of technical education, IT and Healthcare. It is one of the few million-plus cities to have the presence of top IT companies. The Steel Hub at Kalinga Nagar, the petrochemical hub at Paradeep, and the Golden Tourism Triangle of Puri-Konark-Chilika are three major economic drivers for Bhubaneswar. Being the most developed city in Odisha, it acts as the nucleus of development in the state and attracts large number of migrants from surrounding districts and states. It was ranked 1st in GOI’s Smart Cities challenge with a proposal that focuses on transit-oriented compact urban form, liveability (in terms of diverse range of housing, educational and recreational facilities) and clean environment.
Table 1: Demographic profile - Bhubaneswar
Population8.85 Lakh, 2011*9.74 Lakh, 2015 BMC**
Area146 km2 Bhubaneswar Municipal Corporation419k km2 Bhubaneswar Development Plan Area
Density of Population***4484 persons/km2, BMC2046 persons/km2, BDPA
Decadal growth 30% (2000-2010)
Slum population1.64 Lakh, 20113.5 Lakh (35%)****
Land use***50% residential, 4% commercial7% industrial, 28% green belt (incl.forest), 15% Water bodies
*Census of India, 2011
** Bhubaneswar Smart City Proposal 2015
***Comprehensive Development Plan BDPA
****IIHS Report 2017 – Planning, violations and urban inclusion: a study of Bhubaneswar
1 INTRODUCTION - BHUBANESWAR

2 RESOURCE FLOWS IN INDIAN CITIES
As per the urbanization trends of 2001 Census, Odisha is the 5th least urbanized state in India with about 15% urban population. However, Odisha’s urban population during 1991-2001 grew by double the rate of its population growth. This is reflected in the enormous urban decadal growth of about 28% in Bhubaneswar (as compared to 32.6% for India during the same period)1. The decadal population growth rate of Bhubaneswar was 29% in 2000-2010. While a part of this growth can be seen as natural growth, the main reason for such growth was a high rate of migration during the 1981-1991 decade. Accession of new adjoining areas into the municipal boundary also spurred development as the city underwent expansion several times over the last 6 decades from 26sq.km in 1951 to the current BMC area of 146 sq.km. From the point of view of future urban development, the Bhubaneswar-Cuttack Urban Complex (BCUC) as an integrated urban region is a central feature of the 2030 vision for development in the region. One of the most urgent urban development issues in Bhubaneswar is the 35% slum population in the city which makes the affordable housing for the urban poor a most pressing need and a priority of the city administration.
Figure 1: Population growth of Bhubaneswar
Source: IIHS (Indian Institute of Human Settlements) Analysis, 2015
OVERVIEW OF URBAN DEVELOPMENTOtto Königsberger drafted the first master plan for Bhubaneswar in 1954 based on the concept of self-sustaining neighbourhoods. The city then comprised of 6 units, and apart from the one unit marked for administrative purposes, the other units were planned as residential beighbourhoods with emphasis on horizontal rather than on vertical growth.
1 Jena, D. P. (2018). Urban Growth and Climate Change- A Study in the Context of. IOSR Journal Of Humanities And Social Science 23(4), 49-55. http://www.iosrjournals.org/iosr-jhss/papers/Vol.%2023%20Issue4/Version-1/H2304014955.pdf

3BHUBANESWAR CITY REPORT
Due to the absence of economy in allotting land for different uses, the development spread over large areas, with large areas – 5 (out of 6) land units covering almost 25% of the land- being allocated to residential quarters and the accent being on horizontal rather than vertical growth. In the intervening period since then, much of the institutions and administrative spaces that are currently present in the city developed. After 1976 it was followed by a concentrated phase of organized housing enabled by institutional finance through the Bhubaneswar Development Authority (BDA) set up in 1983. Many Housing Board Colonies and market complexes were constructed in this phase, including the first multi-storied apartments at Chandrasekharpur. Most housing schemes in the organized sector were subsidized in terms of cost of roads, open space and infrastructure. The same quality of environment was not possible in the adjoining private areas due to high cost of infrastructure charged to individual developers.
Figure 2: Bhubaneswar jurisdiction map
Source : BDA website https://www.bda.gov.in/bda/about-bda
Today, the city which was planned originally for 40,000 people on 20 sq.km land accommodates more than 9 lakhs people within a development area of 233 sq.km. The present Bhubaneswar has grown in 7 different directions extending from the core temple town- covering Chandrasekharpur, Kalinga Vihar, Old Town, areas adjacent to Daya West Canal (the tributary of river Kuakhai), surrounding villages and two municipalities of Khorda and Jatani in the south-southwest. Due to the presence of reserve forests in the north-western part and flood plains in the eastern part, the growth is more pronounced in the north (upto Chandra Sekharpur) and beyond Daya west canal in the south. The growth of the city continued to be guided by the original master plan (1954) which, over

4 RESOURCE FLOWS IN INDIAN CITIES
the years, has revealed gaps in environmental considerations for a city which is today a tourism centre and a hub for trade and commerce. The growth of Bhubaneswar over the last few decades is characterized by unplanned development as reflected in the mixed, incompatible and inadequate land-use in many parts of the city and its attendant problem of traffic congestion. Open spaces-parks and recreational areas which were given due consideration in the master plan are inadequate today, given the population of the city. Most private real estate housing Developments are unable to meet required provisions for open spaces. Against the required open space of 850 Hectares given the population, the existing facility of Parks is about 154 hectares2. Currently, there is momentum in the city in the form of improving urban quality of life under the SMART City initiative (See Box 1)
Figure 3: Comprehensive Development Plan for BDPA 2030
Source: BDA website
2 Mohapatra, B. (2014). Assessment of place based community management of urban neighbourhood open space an integrated approach (dissertation). Retrieved from http://shodhganga.inflibnet.ac.in:8080/jspui/handle/10603/22973

5BHUBANESWAR CITY REPORT
ZONINGAs per BDA mapping (2010), the land-use in Bhubaneswar was 50% residential, 3.6% commercial, 6.23% industrial, 4% administrative, 11% institutional (and utilities), 29% Parks/open space/ vacant agricultural land and 19% for river and water bodies. As per the Comprehensive Development Plan (CDP) of the BDPA3 (2010), quantum of activity distribution in the various zones has led to the creation of Hubs which are delineated as per the proposed land uses in different zones. These include the Residential and Administrative hub in Bhubaneswar New Town in central part of BDPA, Knowledge/Institutional hub in Chandrasekarpur in north BDPA, Commercial hub in south and north BDPA, Industrial/Textile hub in the eastern and south-western part and Logistics in South BDPA (Jatani).
The Odisha government has recently announced a 30 per cent reduction in the base 'The Floor Area Ratio' (FAR)4 allowances in Bhubaneswar have been tighter which is one of the reasons for its predominant low-rise (G+1 or G+2) building landscape. The revised CDP (2010) allows for higher FAR of 2 for apartment buildings and group housing, with a provision of additional FAR upto 0.25 for dwelling units meant exclusively for EWS/LIG. However, the government announced in 2016, a reduction from the earlier 1.75-2.75 (depending on the region) to 1.2 in conjunction with TDR (Transferable Development Right)5 as a route of compensation for land acquired by the government. While the move is aimed at generating revenue through selling TDR, the move is widely believed by the real estate lobby to result in increased housing price because of the additional investment made in purchasing TDR. Alternatively, this may spur more horizontal growth by making high-rise construction more expensive for developers.
Box 1: Bhubaneswar - SMART City
Bhubaneswar was the first city to be selected for developments under the Smart City Mission in 2013. Under the Special Purpose Vehicle (SPV) Bhubaneswar Smart City Ltd, a number of proposals have been developed for Area Based Development, with the Bhubaneswar Town Centre District (BTCD) being a focal point. The anticipated cost of the smart city projects is INR 4537 Crores (USD 60 Crores) out of which nearly 50% is slated to be through PPP. Key projects6 in the SMART city menu are integrated infrastructure improvement (water-energy-sewerage over 4sq.km); in-situ slum re-development to provide 6000 houses for the EWS (under the Housing for All programme); a 200-bedded rental housing scheme, Railway station multi-modal hub, 30 Acres of lake-zone redevelopment, streetscape development over 6km and multi-level cark park.
3 BDPA refers to the Bhubaneswar urban agglomeration area consisting of BMC, Khorda municipality and Jatani municipality and surrounding villages
4 Floor Area Ratio is a ratio of total built-up area divided by the land plot area. If the FAR is 1 then the built-up area is equal to the area of the plot.
5 Transferable Development Right (TDR) is a voluntary, incentive- based program that allows landowners to sell development rights from their land to a developer or other interested party who then can use these rights to increase the density of development at another designated location.
6 Limited, B. S. (n.d.). Know Bhubaneswar. Retrieved from Bhubaneswar Smart : https://www.smartcitybhubaneswar.gov.in/

6 RESOURCE FLOWS IN INDIAN CITIES
IT-enabled services such as intelligent traffic control, and information portal for residents (Bhubaneswar One) which integrates geo-spatial data from public and private organizations, are the focus of Pan-city transformations.
The key project in this space is the Intelligent City Operation and Management Centre (ICOMC) which will also serve as the BMC Headquarters. This is planned as hub of pan-city IT-enabled smart solutions to increase transparency, accessibility and efficiency of municipal functions and public services and as a data analytics centre connected to city-wide functions. This initiative aimed at digital transformation has the potential to address the lack of data pertaining to urban development and construction activities which is the basis for designing interventions for resource efficiency and circularity at the city level.
BHUBANESWAR CUTTACK URBAN COMPLEX – VISION 2030An integrated development of the Bhubaneswar urban region along with neighbouring urban centres is a key vision for the future development of the region. Cuttack’s economy is also growing along with the rise in purchasing power, expansion of IT sector and investment in industrial and tourism sectors. Similar positive trends are reflected in neighbouring towns of Khorda, Jatani and Choudwar. The Bhubaneswar Cuttack Urban Complex (BCUC) with a 2030 vision developed by IIT Kharagpur covers these towns which is estimated to have a population of 42 Lakhs by 2030. BDPA constitutes around 58% of the BCUC area and extends over 419.10 km2 out of the 722 km2 of the BCUC area. According to the CDP-BDPA (2010) prepared by IIT-Kharagpur, the estimated population of the BDPA in 2030 will be 30 Lakh (3 Million). About 72% of the BCUC population will be residing in BDPA and 62% of the future housing requirement of the BCUC will be in BDPA – this translates into 7 Lakh and 4.32 Lakh dwelling units for BCUC and BDPA respectively.

7BHUBANESWAR CITY REPORT
Figure 4: Bhubaneswar Cuttack Urban Complex
At the core of this Vision 2030 is to boost economic growth and develop infrastructure. The main components of this vision are mass transport infrastructure, social infrastructure – particularly healthcare and vocational training and cultural heritage linked tourism.
Housing is a critical part of this vision in terms of availability and affordability. This is to be supplemented with a building material manufacturing and logistics hub in the hinterland area. It is planned to develop 35000 low income houses to rehabilitate slum dwellers and additional 1.4 Lakh housing units for low-income population by creating special Housing zones. This is to be supported by land-use regulations such as increasing FAR to average 1.5-2 in many planning zones.
ADMINISTRATIVE AND REGULATORY FRAMEWORKThe city administration is the responsibility of the Bhubaneswar Municipal Corporation (BMC) which administers 67 wards over an area of 146 sq.km. The jurisdiction of the larger Bhubaneswar Urban Area of 419 sq.km is under the Bhubaneswar Development Authority (BDA) which is responsible for the preparation and implementation of Interim, Zonal and Comprehensive Development plans, including all the city planning functions, development controls and building permits. The town planning department advises the Government of Odisha on matters pertaining to urban planning and the General Administration (GA)
8 RESOURCE FLOWS IN INDIAN CITIES
department is responsible for the government land management in Bhubaneswar. The current Perspective Plan-2030 for the Bhubaneswar Cuttack Urban Complex (BCUC) was prepared by the Department of Architecture and Regional Planning, IIT Kharagpur, in 2006. The Comprehensive Development Plan for the Bhubaneswar Development Planning Area (BDPA) was formulated within the framework of the Perspective Plan in 2010.
SLUM SETTLEMENTSOne of the most prominent challenges for affordable housing are slum settlements in Bhubaneswar. As per census YEAR, there are 436 recognised slum settlements in Bhubaneswar (identified by the BMC) of which 320 (73%) are unauthorized. According to a JNNURM report (2012), 30% population (more than 3 Lakh persons) of Bhubaneswar lives in slums but occupies 2% of the city’s land. According to Government of Odisha, it will require Rs.1680 crore to cover all families under RAY for Bhubaneswar. Most slums are found in clusters in the northern, southern and western parts of the city. The central part of Bhubaneswar consists of scattered and much smaller slums. Surveys of slum settlements reveal that there are about 25% kuccha houses, 69 % percent semi pucca houses and 12 % percent pucca houses. The average built-up area of the house being 97 sq.ft, about 80% houses had one living room, while the remaining had 2 rooms. The average number of persons per living room for the entire sample was as high as 3.35 persons. While majority of the settlements are single storeyed, some towards the outer edge of the city were 2 or 3 storied.
This encourages Development Authorities and Housing Boards to take up only upmarket housing projects. It leads to exclusion of those very families who are meant to be addressed by the Housing Policy i.e. EWS and LIG households. This social exclusion from Government-sponsored and private sector housing programmes has led to before mushrooming of informal settlements (slums). Informal settlements exposes socially disadvantaged groups to insecurity of tenure, evictions and poor socio-economic services such as health, sanitation etc. It further drags and traps these families in a cycle of poverty. For example, within the jurisdiction of Bhubaneswar Municipal Corporation, more than 40% of population is staying in slums as on date and further growing at exponential rates with the day by day increase in shortage of EWS & LIG houses.

9BHUBANESWAR CITY REPORT
Figure 5: Recognized slum settlements in Bhubaneswar
Source: IIHS Analysis 2017
AFFORDABLE HOUSINGThe housing demand in the BDPA is estimated at 4.5 Lakh in 2030, out of which about 37% will be for EWS/LIG category7. An estimate by the Technical Group on Urban Housing Shortage (2012-17) states that approximately 3,60,000 affordable dwelling units would have to be added in the Bhubaneswar - Cuttack region, exclusively, to accommodate the growth during the next ten years in these areas. Till 2015, most of the upcoming developments in Bhubaneswar and Cuttack region were HIG housing with some MIG housing. Developers refrained from developing EWS/LIG housing and instead focused on the premium (HIG) bracket. No EWS/LIG houses were constructed in the 2005-15 period. The resultant stock was mid-sized apartments in the range of 1,200 sq.ft. to luxurious apartments of 2,500 sq.ft. area and above. Government agencies such as Bhubaneswar Development Authority, Cuttack Development Authority and Odisha State Housing Board (OSHB) were not able to address issues of mass housing.
7 Final Proposal – Comprehensive Development Plan BDPA 2030, Chapter 4 Housing and Slums- IIT Kharagpur http://www.cdacuttack.nic.in/Final_CDP_Report.pdf

10 RESOURCE FLOWS IN INDIAN CITIES
Table 2: Estimated dwelling unit requirement – BDPA 2030
Income Groups
Income range
Distribution pattern 2006
(%)
Estimated distribution
pattern 2030 (%)
Estimated dwelling units requirement
2030
HIG Above 12500 17.11 20 110,000
MIG 5000-12500 45.38 45 175000
LIG 2500-4999 23 20 90,000
EWS Below 2500 14.5 15 65000
Source: Perspective Plan Vision 2030 for BCUC, 2010
To address this big gap in availability of housing for the urban poor, the Housing for All Policy has directed focus on different forms of affordable housing - Slum Rehabilitation and Re-development Housing (SRRH) for existing informal settlements (Slums), In-situ Slum Upgradation Housing (ISUH) and Rental Housing (RH). An initial target of one Lakh dwelling units for EWS and LIG households has been set till 2022. Out of total developed land, 60% has been earmarked for EWS, LIG, MIG and LMIG housing (15% each). 100 Acres of land has been made available for affordable housing in Bhubaneswar. The involvement of private sector in delivery of affordable housing is a critical area and Floor Space Index (FSI)-related incentives are offered to private builders for the same.
Box 2: Slum redevelopment
Shanti Nagar Awas Yojana is an example of in-situ slum redevelopment being undertaken in the Bhubaneswar Town Centre district or the ‘Smart’ district in the heart of the city. As part of the FULL FORM OF HFA initiatives, the project is being implemented in the PPP mode in a 10 Acre area out of which 1300 EWS houses will be developed over 6.5 Acres, with the remaining 3.5 Acres left to the developer for high end housing/ commercial development. 5% of the EWS housing area will be allocated to social infrastructure, such as shopping area, community centre and Anganwadi.

11BHUBANESWAR CITY REPORT
INDUSTRIAL WASTE IN ODISHAOdisha’s rich mineral reserves – 28% iron ore, 24% coal, 59% Bauxite and 98% chromite- makes it a major hub for manufacturing industries in India. Almost 2500 industries in large, medium and small scale are operating in the state. The Talcher-Angul area, about 140 km from Bhubaneswar, with its thermal power plants, aluminium industry, coal washeries and mines is one of the most industrially active zones in the state. The continuous process of excavation of ores generates massive quantities of waste, bulk of which is mining over-burden. Further, the production process for principal industrial outputs like Iron & Steel, aluminium and fertilizers generate industrial solid waste in large quantities. In terms of quantity, the main industrial wastes are Fly ash (thermal power plants), Red Mud (from Aluminium refineries which produce Alumina), Blast furnace Slag (from Iron and Steel plants) and Gypsum (fertilizer industry). These wastes not only require acres of land for disposal but also cause environmental pollution due to their chemical composition. There is a growing concern over waste management in Odisha and disposal/utilization of vast quantities of industrial waste is a priority area.
Red mud, industrial waste from the Aluminium industry, is generated in massive quantities to the tune of 9 Million tonnes in India. Out of this, almost half of this waste is generated in Odisha. As part of efforts to boost secondary resource recovery sector in the country, The Ministry of Mines of Government of India has strengthened focus on effective utilization of Red mud in India through sectoral linkages between the Aluminium industry and other government institutions like MoEFCC, Odisha State Pollution Control Board, Ministry of Road Transport and Highways and BIS.
Figure 6: Major industries in Bhubaneswar
Source: IMMT Bhubaneswar

12 RESOURCE FLOWS IN INDIAN CITIES
Institute of Minerals and Materials Technology (IMMT), a CSIR institution in Bhubaneswar, has the mandate to empower industries through research in optimized and sustainable utilization of mineral resources and zero-waste process know how. IMMT has also developed technology packages in utilization of industrial waste such as fly ash, red mud and phosphor-gypsum in production of building materials. Fly ash utilization for construction sector is a long-standing and important part of research at IMMT, focusing on more efficient use of fly ash and high volume fly ash, different qualities of fly ash and in improving the quality of fly ash bricks. Together with other research institutions such as IIT Kharagpur, IMMT is currently developing a technology package for manufacturing of wall tiles using fly ash as alternative to glazed wall tiles, which it is not feasible to produce at scale due to limited availability of raw material (high plasticity clay). The institute has developed technology processes for manufacture of industrial waste-based bricks which introduce chemical activators/ binders which catalyse reactions leading to high durability of bricks and economy in production. Testing of bricks made using Fly ash (upto 80%), Iron tailings (50-70%) and Red Mud (50-70%) indicates wet compressive strengths of 75-140 kg/cm2 which satisfies the criteria for class 7.5 bricks as per Bureau of Indian Standards (BIS)8. Another area pertaining to secondary resources is value-recovery from industrial wastes such as Fly ash (calcium silicate for ceiling boards and quartz for glass) and Red Mud (Aluminium, Titanium). A more aggressive policy support for replication of technology packages developed at IMMT in commercial production of building materials is an important part of strategy directed at resource efficiency.
Table 3: Industrial wastes generated in Odisha
Industrial belts Wastes generated
Rourkela BF & LD Slag
Joda/Barbil Iron tailings & mine overburden
Angul/Talcher Fly ash/bottom ash
Kalinga nagar BF slag
Paradeep Phospho gypsum
Sukinda Chromite tailings/serpentine/doonite
Kalahandi Red mud/khondalite
Khurda stone mining Crusher dust
Balasore Fly ash/toxic effluents
8 Dr.S D Muduli, Dr.N K Kali, Prof.S Basu (2018). Utilization of mining and industrial solid waste as a resource in manufacture of building bricks. Institute of Minerals and Materials Technology (IMMT)

13BHUBANESWAR CITY REPORT
Box 2: Fly ash utilization in Odisha
Fly ash generated by thermal power plants and sponge iron units is one of the biggest pollutants in the state. In terms of secondary resource recovery for construction sector, Fly ash is one of the biggest industrial waste which is being utilized in Bhubaneswar through production and use of fly ash bricks. As per a study by the Development Alternatives (2012) on the brick sector, in Odisha 70,000 acres of land is being used for storage and disposal of pond ash. Fly ash is also freely available in the state. The use of industrial wastes like fly ash, dolochar etc, in brick production can potentially save over 4.6 million tonnes of CO2 eq. per year. In YEAR the State Pollution Control Board of Odisha issued advisory to make fly ash utilization in construction activities mandatory in all public-private partnership projects. With continuing focus on setting up new industries, thermal power generation will increase substantially which will further increase fly ash generation manifold. Currently, Odisha utilise about 80% fly ash generated in the state. Almost half of this fly ash is utilise in the construction sector consisting of 13% for brick making, 5% for cement manufacturing, 22% for dyke raising and 5% for road making9.
CONSTRUCTION AND DEMOLITION WASTEThere is currently no initiative in the city to utilise C&D waste, although there is a plan to set up a C&D plant in Bhubaneswar in the near future. As estimated by BMC - on an average, Bhubaneswar produces around 200 metric tonnes of C&D waste daily which is disposed in the dumping yard at Patia (Khorda district) and Kargil road10. While there are penalties imposed on the dumping of C&D waste, the BMC has hiked the penalty fees from Rs. 3000 to Rs. 650011. In addition to the C&D waste, the city generates about 500 tonnes/day of municipal solid waste within the Bhubaneswar Municipality Corporation (BMC) area.
9 Behera, D. D. K. (2019, January 3). Flyash Utlilisation in Odisha. Retrieved March 30 , 2020 , from http://flyash2019.missionenergy.org/presentations/OPCB.pdf
10 BMC to recycle C&D waste. (2016, November 2). Retrieved March 30, 2020, from https://pragativadi.com/bmc-recycle-cd-waste/
11 Balasubramanian, H. (2016, June 16). Govt Regulations Around Construction, Demolition Waste Gets Tighter. Retrieved March 30, 2020, from https://www.proptiger.com/guide/post/govt-regulations-around-construction-demolition-waste-gets-tighter

14 RESOURCE FLOWS IN INDIAN CITIES

15BHUBANESWAR CITY REPORT
MATERIAL FLOW ANALYSIS AND LIFE CYCLE ASSESSMENTMaterial Flow Analysis (MFA) is a tool to quantify the flow and stock of materials within complex systems in order to provide a basis for material flow management and to identify de-materialisation strategies aimed at resource efficiency. MFA is widely used in industrial ecology for understanding and controlling pathways for material use and industrial processes, creating closed loop industrial practices, dematerialising industrial output, rationalising patterns of energy use- ultimately balancing inputs and output to natural ecosystem capacity. Conceptually, MFA is a key component Life Cycle Assessment (LCA) which has become integral today to address the challenges of Resource Efficiency and Circularity. LCA is essentially an assessment of environmental repercussions associated with various stages of a product’s life. Buildings, with their life cycle from extraction of virgin resource for building materials to the ultimate demolition and disposal in landfills, are the ‘product’ in the LCA of construction sector.
The analysis in the study is based on data about quantum of construction projects in the cities, typical material consumption rates of construction items and potential sources of secondary materials available for utilisation in the cities. In order to understand the environmental implications of construction sector, a software – Umberto LCA+12 was used to analyse the data through MFA and LCA. While MFA delineates the quantum (tonnage) of material flow across the life cycle of a building, LCA makes known the Carbon footprint (CO2 equivalent) of buildings, along with other global environmental indicators.
System Boundary for MFA
The MFA undertaken in the study is qualified by certain boundaries. The materials considered for analysis are those mineral based materials which are extracted from abiotic resources and which constitute the bulk of materials (more than 90%) consumed by the sector. These include Cement, sand, stone aggregates, clay bricks, reinforcement steel, structural steel, Aluminium, Glass and Steel. Fly ash has also been considered because it has become an important raw material for masonry blocks in India. The physical boundaries are defined by the development plan areas of urban agglomerations of Bhubaneswar, as defined by their respective municipal authorities. The sectoral boundary consists of
12 Umberto® is a software developed by ifu-Hamburg (www.ifu.com) which is used for modelling and assessment of all types of material and energy flow systems, in order to identify improvement potentials, conduct scenario analysis or develop models for alternative processes. It is one of the popular tools available worldwide to undertake LCA with integrated cost analysis and MFA. CO2-equivalent emissions (calculated as per IPCC 2013 - climate change, GWP 100a assessment method) and tonnage of material to assess quantum of material flow. Umberto LCA+ is integrated with the ecoinvent database (version 3.6) which is a comprehensive data set of over 17,000 Lifecycle inventory (LCI) datasets in various areas, such as energy, transport, construction, waste treatment, etc.
2 STUDY METHODOLOGY

16 RESOURCE FLOWS IN INDIAN CITIES
residential buildings in the two cities. The timeframe selected for (residential) building projects is 2015 - 18 for Bhubaneswar – this corresponds to the data of construction permits issued by the respective municipal authorities. The LCA considers environmental footprint (CO2 emissions equivalent) from resource extraction till C&D waste processing. C&D waste processing.
METHODOLOGYKeeping in mind the objective of analysing the material flow in construction sector in Bhubaneswar and its environmental footprint, the starting point in the process was to get a perspective on the scale of construction activities in the city. The Bhubaneswar Development Authority (BDA) was contacted for this to access record of construction permits issued by them. These records for 2015 -18 timeframe are the basis on which the scale of construction and distribution of the typologies of buildings was understood. The next step was to calculate coefficients of selected items of construction in terms of quantity per m2 of the built-up area. These were calculated from the coefficients of material consumption (quantity per unit weight/volume) established in consultation with the engineering team of NBCC and architectural practices in Bhubaneswar. For EWS/LIG housing, sample BOQs available for the said housing (with similar built-up areas and building height) in Gujarat were referred and adapted to account for different building materials such as Fly ash bricks which are much more prevalent in Bhubaneswar than in Gujrat. The construction items accounted for were Concrete (foundation and superstructure), Masonry (foundation and superstructure), Doors and Windows and Flooring. The material intensity was further converted to its constituent materials for production and construction. For construction stage, CPWD 2018 specifications were referred. For production stage, DA’s research and experience in material production and existing research on Embodied energy in building materials was referred. Transportation distances for material production and flow into Bhubaneswar was arrived at in consultation with building professionals in the city. Finally, the data, as explained above was fed in MFA software Umberto – for calculating the material flow (mass) into the city and environmental footprint in terms of CO2 equivalent emissions comprising of material production, transportation and building construction. The framework for MFA and LCA is illustrated in table 4.

17BHUBANESWAR CITY REPORT
Table 4: Material flow analysis and lifecycle analysis methodology framework
Data source
Bhubaneswar Development
Based on distribution of building typologies in the BMC data
Consultation with building professionals in the city, NBCC andBOQ of EWS housing
Construction: CPWD specifications for concrete,
RCC, masonry, flooring, door-windows
Production: DA research and project data
Consultation with building professionals in
Bhubaneswar, NBCC
TYPOLOGY & BUILT UP AREA DISTRIBUTION
Project BOQ
Quantities of Construction Materials KG
Transportation from source
TONNE-KM
CONSTRUCTION ITEMQUANTITIES
2 PER M OF BUILT UP AREA
LCA TOOLUMBERTO
CO2
FOOTPRINTTON
RECORD OF CONSTRUCTION PERMITS
UPTO 4 FLOORS
15 m
5-8FLOORS
25 m
MORE THAN 8 FLOORS
UPTO 70 mT1 T2 T3
+
Table 5: Snapshot of data on construction permits issued by BMC
*The blue rectangle highlights data entry on No. of Floors, Total built-up area, Use of project (residential, industrial, commercial, mixed)

18 RESOURCE FLOWS IN INDIAN CITIES
SOURCES OF DATA COLLECTIONThe primary data for the study has been sourced essentially from records of municipal authorities and project information available with building professionals (see Table 3). Secondary data is sourced from reliable/peer reviewed resources - chiefly research based papers/reports from leading organizations (such as GIZ, DA, Adelphi) and government bodies (NITI Aayog, MoEFCC)
Table 6: Primary data collected from Bhubaneswar
Stakeholder Type of Data
BMC- Member Secretary, Deputy Commissioner & Additional Commissioner, Senior Municipal Planner, Chief Engineer, Superintendent Engineer and Assistant Engineer
Records of construction permits – residential and commercial 2015-2018
BDA- Assistant Town Planner, Planning Member
Overview of affordbale housing in Bhubaneswar, BOQ of typical EWS/LIG project
National Building Construction Corporation Ltd. (NBCC), Secretary
Coefficients of material consumption and technical specifications
OUHM- Mission Director Housing permits for LIG, EWS
Directorate of Economics and Statistics- Deputy Director
Residential and Commercial Permits, type of building accrued from BDA and BMC
Swachh Bharat Mission-Ex-officio Additional Secretary & Mission Director Housing and Urban Development Official, Project Management Official
Feedback on the overall project and additional comments

This section presents key findings from the study in Bhubaneswar, based primarily on construction permits data from BMC and the Material Flow Analysis carried out using Umberto LCA+.
HOUSING TRENDS - BHUBANESWAROverall, middle income and high-income housing has been the largest segment of residential stock in Bhubaneswar until 2015. From the point of view of floor area per household in the BDPA, this translates to more than 800 sq.ft of built-up area which accounts for more than 50% of the total stock, out of which almost half is more than 1200 sq.ft. Since more than a decade, this segment has seen significant growth, owing significantly to the growth in IT and ITES sector. Dwelling units of less than 500 sq.ft area constitute not more than 20% of the existing stock. Looking ahead, the MIG housing - cost INR 40-60 Lakh and 1400-1500 sq.ft BUA- will continue to be the largest chunk, followed by HIG Affordable housing – cost more than INR 60 Lakh and 1500-1800 sq.ft BUA. However, in the next decade, the EWS/LIG category- cost under INR 10-12 Lakh and 300-700 sq.ft BUA- will see the highest growth as part of the Housing-for-All initiatives and the redevelopment of slum settlements which is a priority area for the state government and city administration. High rise construction is slowly increasing its footprint in Odisha. Almost all affordable housing projects developed by BDA and OSHB are multi-storied construction. Private developers are also opting for high rise construction of upto G+15 for commercial and residential projects. NBCC is building Imperia, what is being called the new residential and commercial landmark of Bhubaneswar.
3 FINDINGS AND ANALYSIS

20 RESOURCE FLOWS IN INDIAN CITIES
Figure 7: High rise residential construction in Bhubaneswar
Source: OSHB website
Seen above are some contemporary high-rise projects residential projects-
1,2 - Imperia is a flagship project of the NBCC in the city, comprising of two commercial towers and two high rise residential apartment buildings (Stilt+13 and Stilt+17), typically catering to the middle income group – 3 BHK and 2BHK apartments of 2150 sq.ft and 1700 sq.ft BUA respectively.
Dumduma Phase VI of the Odisha State Housing Board providing 126 HIG flats of 1450 sq.ft BUA
4 – Ariana project of TATA Housing- these are IGBC certified premium apartments
BUILT FORM CHARACTERISTICSAs a result of the original planning of the new capital in the 1950s, Bhubaneswar still has a predominantly low-density development in most parts of the city. Most areas lying in the BDPA have a low density of housing, ranging from 5 to 25 dwelling units per acre. Higher density is observed mainly in Bhubaneswar New Town (BMC Zone No.17) in the heart of the city. Looking at residential sector over the last 40-50 years, almost three fourth of the total built form in the BDPA was not more than double storeyed and about 5% of the total was multi-storied apartment buildings, the bulk of which are present in the BMC area.
Comparing this with the existing and upcoming construction as per construction permits issued by BMC between 2015 and 2018, it is observed that the majority of buildings still remain in the ‘less than 15m’ category which is classified as non-high rise in the context of Bhubaneswar. 96% of the total buildings are not more than 3-storeyed, out of which 1/4th are double storeyed. Only 4% of the buildings are 5-storeyed. However, as per discussion

21BHUBANESWAR CITY REPORT
with BMC officials, the actual number of high-rise buildings reflected in the data is likely to be on the lower side because of incompleteness of data. Looking 20-30 years ahead, easily about 10% of the total built stock will be high-rise buildings, 25-45 m high. This is also in keeping with the CDP which recommends a more compact form of development which is more favourable from infrastructure cost and land value point s of view.
It is also observed from a total of 2,225 permits issued by BMC (2015-18) that 98% buildings constructed are for residential usage, 1% for commercial usage and 0.2% for mixed residential and commercial usage – denoting multi-storeyed buildings with the ground and first floor used as retail space. The remaining 0.4% mostly includes industrial and institutional buildings.
Figure 8: Distribution of floors in 2179 residential housing projects in Bhubaneswar from 2015 to 2018
MATERIAL USAGE AND BUILDING PRACTICEOdisha has been traditionally a region of low-rise construction with burnt clay bricks being the predominant material in use. The use of clay brick has been served by two major coal fields – Talcher and Ib valley. Coal from the Talcher coal fields has been the primary fuel for firing bricks in the cluster of kilns in Jajpur-Kendrapara-Cuttack-Khorda region. These are also the supply nodes of bricks to Bhubaneswar. One of the major positive changes over the last decade in material use has been adoption of fly ash bricks in the same region due to abundant availability of fly ash. Due to aggressive regulations by the Odisha SPCB, fly ash bricks are being adopted in all major government projects along with the directive to all generating industries to transport fly ash free of cost within 300 km radius for government projects and within 100 km for other projects. Another material which is becoming popular in the Bhubaneswar region is the AAC block for which fly ash is the primary constituent raw material together with cement, lime, gypsum and aluminum powder. Private AAC block manufacturers are operating within 50 km radius of

22 RESOURCE FLOWS IN INDIAN CITIES
the city in Khorda. The predominant structural material in construction is RCC, specifically in buildings which are higher than double-storeyed.
Following are typical material specifications and usage in residential construction sector in Bhubaneswar. The usage distribution is indicative and has been fixed as per discussion with building professionals in the city.
Table 7: Typical material specification in construction sector in Bhubaneswar
Foundation, plinth, structural frame (columns, beams, slabs, sills and lintels)
M25 grade concrete
Batching plant and transit mixer are increasingly being adopted for M25 and above grade concrete work
Base Concrete of 1:3:6 mix
Superstructure masonry
Fly ash brick masonry in cement mortar 1:6, brick strength not less than 75kg/cm2 – usage in 50-60% of construction
Autoclaved Aerated Concrete (AAC) block masonry in cement mortar 1:6, block size 625mmx200mmx200mm, block strength not less than 40kg/cm2 – usage in 10-15% of construction
Burnt clay brick min cement mortar 1:6 – this usage is slowly declining, but it is still 25-40%
External masonry 200mm in AAC block, 250mm for others
Internal masonry 100mm in AAC block, 125mm for others
Finish – external, internal
Cement-sand plaster 1:6 – 15mm external and 12mm internal
Flooring Vitrified tiles 8 -10mm thick in cement mortar – most common in EWS, LIG, MIG housing
Cement concrete flooring in some projects
Polished stone flooring in High income projects
Door 30mm thick solid core flush doors in wooden/uPVC frames (HIG housing) and galvanized pressed steel frames (EWS/LIG)
Window Single glazed windows in Steel frames (EWS, LIG and some MIG projects
Single glazed windows in Aluminium (predominantly) and uPVC(emerging) frames in MIG and HIG housing
Emerging trend of high-rise buildings G+8 or G+9, in which the use of AAC blocks is becoming more common, which will constitute the biggest chunk of housing to be developed in next 20 years. Fly ash bricks have a huge presence in Bhubaneswar due to

23BHUBANESWAR CITY REPORT
economical availability of fly ash, and recast concrete construction is likely to be preferred for affordable housing.
Table 8: Material consumption factors for high rise construction; Based on quantities gathered for Imperia project from NBCC
MaterialTotal quantity required
in the projectQuantity per m2 of
built up area
Concrete 1750 m3 0.48 m3
Steel 295 MT 82 kg
AAC Masonry 825 m3 0.23 m3
Fly ash masonry 65 m3 0.018 m3
Glass 400 m2 0.11 m2
MFA FINDINGSMaterial consumption in residential buildings
Material flow has been estimated in Mass of building material which is consumed by four main items of construction – Concrete and RCC in foundation and super-structure, Masonry in foundation and superstructure, Flooring, Plastering and Door-window. These five construction items are responsible for the bulk of the mineral based building materials which are needed in construction. The material consumption is first understood at the level of a single residential building in each of the three categories identified for the study – up to 3 storeyed, 4-8 storeyed and more than 8 storeyed. Following is the break-up of the built-up areas attributed to each category as per data of construction permits accessed from BMC
Table 9: BOQ of residential projects used in the study
Type of constructionTotal Built up area as per construction permits 2015-18; 2179 buildings- total BUA 16.65 Lakh m2
Low-rise construction, G+3 14.16 Lakh m2
Mid-rise construction, G+5-G+8 1.7 Lakh m2
High rise constructionMore than G+8
83287 m2
The quantum of material flow and consumption is dominated by Sand, being a material, which is consumed in concrete, masonry, flooring and plastering. This is followed by coarse aggregate and cement. Sand, Coarse Aggregate and Cement constitute
24 RESOURCE FLOWS IN INDIAN CITIES
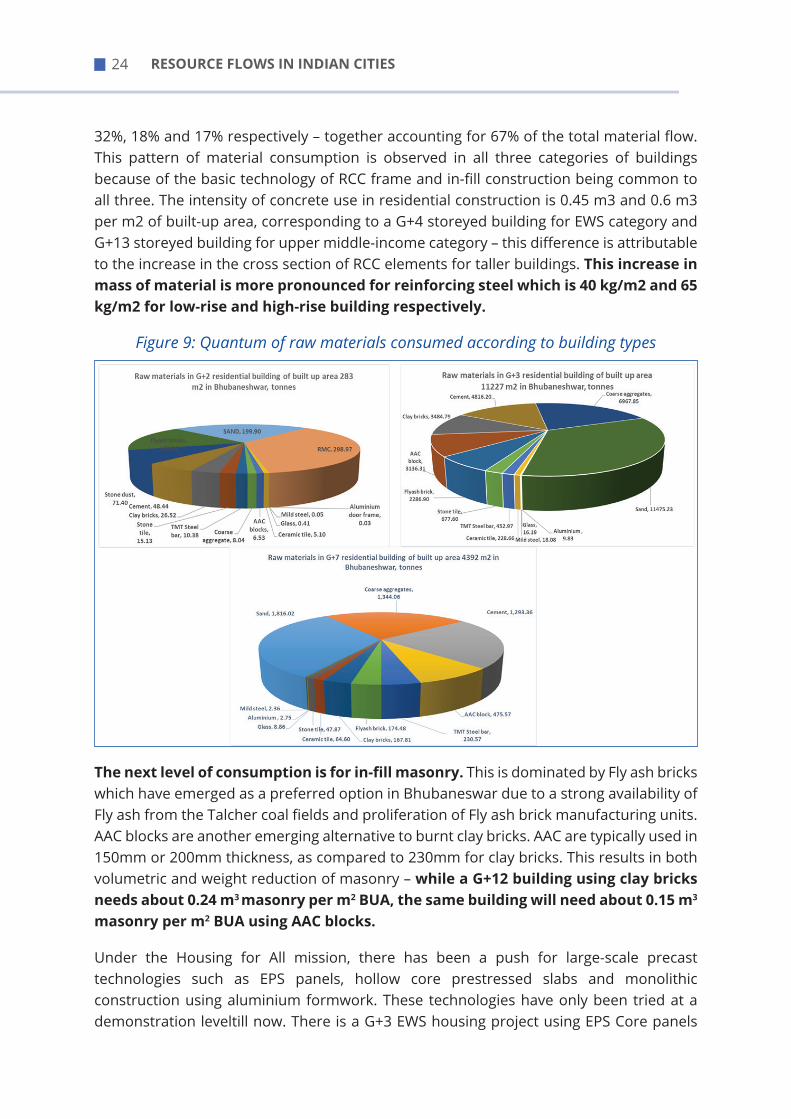
32%, 18% and 17% respectively – together accounting for 67% of the total material flow. This pattern of material consumption is observed in all three categories of buildings because of the basic technology of RCC frame and in-fill construction being common to all three. The intensity of concrete use in residential construction is 0.45 m3 and 0.6 m3 per m2 of built-up area, corresponding to a G+4 storeyed building for EWS category and G+13 storeyed building for upper middle-income category – this difference is attributable to the increase in the cross section of RCC elements for taller buildings. This increase in mass of material is more pronounced for reinforcing steel which is 40 kg/m2 and 65 kg/m2 for low-rise and high-rise building respectively.
Figure 9: Quantum of raw materials consumed according to building types
The next level of consumption is for in-fill masonry. This is dominated by Fly ash bricks which have emerged as a preferred option in Bhubaneswar due to a strong availability of Fly ash from the Talcher coal fields and proliferation of Fly ash brick manufacturing units. AAC blocks are another emerging alternative to burnt clay bricks. AAC are typically used in 150mm or 200mm thickness, as compared to 230mm for clay bricks. This results in both volumetric and weight reduction of masonry – while a G+12 building using clay bricks needs about 0.24 m3 masonry per m2 BUA, the same building will need about 0.15 m3
masonry per m2 BUA using AAC blocks.
Under the Housing for All mission, there has been a push for large-scale precast technologies such as EPS panels, hollow core prestressed slabs and monolithic construction using aluminium formwork. These technologies have only been tried at a demonstration leveltill now. There is a G+3 EWS housing project using EPS Core panels

25BHUBANESWAR CITY REPORT
in Bhubaneswar which is supported by BMTPC in which 32 EWS houses of 34 m2 BUA have been constructed in a total covered area of 1095m2. It is highly probable that precast technologies will be further promoted for EWS/LIG category affordable housing. These technologies are feasible only for low-rise construction, typically not more than 15 metres high. The material consumption pattern in this type of construction differs drastically from conventional RCC frame construction in that the bulk volume of 250mm thick masonry is replaced by 180mm thick EPS panels- including plaster on both sides. The concrete intensity in monolithic construction is 60-70% higher than conventional RCC frames.
Figure 10: Prefabricated construction – EWS housing in Chandrashekharpur
Source: Building Material & Technology Promotion Council (BMTPC)
32 housing units were constructed in G+3 buildings using EPS Core Panels technology. Expanded Polystyrene Core (EPS) Panel System is a factory produced panel system for the construction of low rise buildings upto G+3 and as filler walls in high rise RCC and steel frame buildings. In this technology, a core of undulated polystyrene is covered with interconnected zinc coated welded wire mesh on both sides and finished with shotcrete at construction site to produce structural walls and horizontal elements and cladding elements
Reinforcement steel (TMT steel) is another high-energy material to influence the environmental impact of construction sector. The intensity of reinforcement steel varies from 40-45 kg for low-rise RCC frame construction up to 20 metres to 65 -70 kg per m2 of built-up area for high rise construction up to 50 metres. Steel consumption in Monolithic RCC construction for 15 m high buildings is 60 -70 kg per which is comparable to 50 metre

26 RESOURCE FLOWS IN INDIAN CITIES
high buildings with conventional RCC frames.
c) Flooring accounts for about 5% of the total material flow Ceramic tiles/vitrified tiles are the most common material in residential buildings at 1.2-1.3 m2 per m2 built-up area. Stone flooring, most commonly kota stone, is used in select areas like kitchen and in common areas like staircase and accounts for about 65% of the quantum flow of flooring material. IPS floor is mainly limited to EWS/LIG housing and is accounted for in cement and sand material flow.
Table 10: Material consumption in residential construction in Bhubaneswar
Material
Material quantities in Kilotonnes (KT) consumed for 2179 residential buildings in Bhubaneshwar, BUA 1.6 Million sq.m
Upto 4 storeyed
5-8 storeyed
More than 8 storeyed
Total Flow,
Kilotonne
Average material
intensity – Kg/m2
Aluminium 0.14 0.06 0.001 0.20 0.12
Mild steel 0.256 0.11 0.001 0.37 0.22
Glass 2.25 0.1 0.005 2.36 1.41
Ceramic tile 28.137 1.36 0.03 29.53 17.73
AAC blocks 35.983 3.18 0.03 39.19 23.53
Coarse aggregate
44.32 8.47 0.03 52.82 31.71
TMT Steel bar 57.215 2.69 0.12 60.03 36.03
Stone tile 83.382 4.02 0.03 87.43 52.49
Clay bricks 146.18 12.93 0.12 159.23 95.59
Cement 267.017 15.93 0.12 283.07 169.93
Fly ash bricks 787.122 69.65 0.69 857.46 514.76
SAND 1101.816 70.1 0.58 1172.50 703.88
RMC 1647.963 63.05 1.79 1712.80 1028.24
TOTAL 4457.0 2.68 tonne/m2

27BHUBANESWAR CITY REPORT
Figure 11: Material flow for 2179 buildings in Bhubaneswar from 2015 to 2018
2.9 T/m2 built-up area
In terms of quantum of materials, every m2 of built-up residential space consumes about 2.9 tonne of materials. This corresponds to RCC frame + infill wall type of construction and a distribution of 50%, 40%, 8% and 2% built up area to up to G+4, G+7, G+12 and G+21 type buildings, as reflected by the construction permits data. In comparison, studies reveal that load bearing G+2 construction consumes 3-3.5 tonnes/m2. The material use is by concrete (RMC) which accounts for 36% consumption. Fly ash bricks, account for 17% of the material mass, which would have been closer to 25% if clay bricks were used. Cement, sand and coarse aggregates, which are used in concrete, mortar and plaster, constitute 17%, 32% and 21% of material mass, accounting for almost 70% of the total quantum of material use.
CARBON FOOTPRINTBased on material consumption and flow through the city, a carbon footprint of the residential construction sector was estimated using the Umberto software. The carbon footprint accounts for the emissions from production of materials and transportation of materials from production source to construction site. Emissions at the construction stage have not been considered in carbon footprint. These include emissions from electricity consumed by on-site operations like welding, concrete vibration and material trolley. Studies indicate that, given the technology level, in India, construction phase energy varies from 2-4% of the total energy. Considering the type of building technologies (as indicated in the previous section), the carbon footprint is estimated to be 0.94 tonne of CO2 equivalent (break-up given in Table 11 below)

28 RESOURCE FLOWS IN INDIAN CITIES
Table 11: Material consumption in residential construction in Bhubaneswar
CO2 Footprint for 1.6 Million m2 built up space, tonne CO2 eq.
kg CO2 per m2
Material Production Transportation
Mild steel 0.56 0.003 0.34
Coarse aggregate 0.13 0.88 0.60
Clay bricks 0.68 0.87 0.93
Glass 2.92 0.01 1.76
AAC blocks 3.92 0.41 2.51
Sand 3.57 3.23 4.08
Ceramic Tile 20.68 0.55 12.75
Aluminium door frame 38.37 0.007 23.04
Stone tile 95.17 2.44 58.60
TMT Steel bar 138.68 1.68 84.26
Cement 210.72 6.52 130.41
Fly ash bricks 400.33 8.83 245.63
Ready Mix concrete 603.95 18.81 373.86
TOTAL, Kilotonne CO2 eq.
1519.7 44.21 0.94 tonneCO2/ m2
Figure 12: CO2 footprint of materials for 2179 residential projects in Bhubneshwar

29BHUBANESWAR CITY REPORT
The CO2 emissions are dominated by use of concrete in construction, followed by fly ash bricks – accounting for 40% and 26% respectively of the total emissions. On a raw material level, cement alone accounts for 42% of the total emissions – this is primarily due to its use in concrete and mortar. The trend of higher number/% of RCC frame buildings which consume 15-20% more cement on a per m2 basis, also contributes to the overall increase in cement use. Sand, which constitutes 33% of the flow of primary materials, accounts for less than 2% of the total emissions. This is because of the almost exclusive use of river sand in construction which consumes only transportation energy. However, it is critical to note here that such a large scale use of river sand has severe ecological impacts such as changing of river course (Mahanadi, Daya river) and a high likelihood of embankment cave-in which can threaten life of inhabitants in villages along the river bank.
TRANSPORTATIONTransportation in the construction lifecycle is estimated to contribute to a negligible 3.34% of CO2 Eq. emissions. The assessment constitutes a cumulative figure of emissions from transportation of raw materials to the secondary material production site, to the site of construction and the transportation of demolished building components to either landfill, C&D processing plant or to the market for reuse.
Distance of each material transported in the lifecycle has been collected from primary source in the city. Following distances were considered for computation of total transportation distances for raw materials based on the primary stakeholder consultations:
1. Cement- there a few major cement plants which supply to Bhubaneswar- the bulk is sourced from plants in Tangi-Chowdwar in Cuttack district. Other big source is Rajgangpur in Sundargarh. Generally, the transportation distance is 200-300 km from the cement plant to the Rail head and from there to the distributor in Bhubaneswar.
2. Sand is transported over 30-40 km from rivers Daya, Mahanadi and Kuakhai, which is a distributary of Mahanadi.
3. Coarse aggregates are sourced from 50-100 kms. A major source is the stone crushing plant in Chandikhol in Jajpur district which is 75 km form Bhubaneswar.
4. Fly ash bricks are sourced from within a 50 km radius from Bhubaneswar. The nearest source of Fly ash in the state is NTPC Angul, 150 km from Bhubaneswar.
5. Steel is sourced from various steel plants – Jindal plant in Angul 150 km away, RINL plant in Visakahapatnam 350 km away, SAIL plant in Rourkela 350 km away and TATA plant in Jamshedpur 350 km away. Average distance of transportation of steel is 250 km.
Total transportation distance of 2179 projects in Bhubaneswar from 2015 to 2019 have been illustrated below.

30 RESOURCE FLOWS IN INDIAN CITIES
Figure 13: Transportation of materials for 2179 projects in Bhubaneshwar (BUA 1.6 million m2) Kilometres
END OF LIFE PHASEThe end of life (post demolition) phase of buildings has been assessed with respect to three outcomes – depositing demolition debris in landfill sites, salvage material for re-use and processing C&D waste for conversion into aggregates for recycling. The resultant CO2 emissions are from fuel (diesel) used in transport, demolition and fuel used during demolition and electricity used at the C&D plant in pre-crushing and processing stages. Data for transport above fuel consumption has been collected from the C&D plant operating agency in Bhubaneswar. The end of life phase accounts for about 0.018 Tonne CO2 emissions per m2 of demolished area. Transport and C&D processing each accounting for half of this footprint.
Figure 14: Carbon footprint of end-of-life phase for 2179 residential buildings in Bhubaneswar - BUA 1.6 Million m2, Kilotonne CO2

31 RESOURCE FLOWS IN INDIAN CITIES
Figure 15: Umberto model of material flow in Bhubaneswar from 2015 to 2018

32 RESOURCE FLOWS IN INDIAN CITIES
KEY ASPECTS FOR RESOURCE EFFICIENCYThe figure below shows the flow of construction material across the life cycle of residential buildings in Bhubaneswar. With respect to the main findings stated above, there are 5 key aspects of the material flow which are critical for resource efficiency improvements. These are given below, in order of priority.
Figure 16: Sankey diagram - material flow for housing in Bhubaneswar for residential projects BUA 1.7 Million sq.m
1. Concrete (Structural frame)
Considering processed materials, concrete has the highest material flow (tonnage) and carbon emissions among building materials. This will continue to be adopted on a large scale to meet the large gap in affordable housing in the city. To increase overall efficiency of concrete production, RMC, which is in the early stages of being adopted in Bhubaneswar, needs to be adopted on a bigger scale for residential construction. This increases the potential of integrating various secondary materials such as high volume flyash, recycled aggregates, GGBS into concrete production. Improvements on this front are also possible with greater efficiency in the structural design of buildings, supported by regulations to allow a greater share of low-rise buildings in residential construction to reduce the ‘concrete’ faction of construction.

33BHUBANESWAR CITY REPORT
2. Cement
Cement alone contributes more than 40% to CO2 emissions, largely through its use in concrete, followed by cement mortar. This makes cement a critical material for improving resource efficiency and carbon emissions of construction.
3. Masonry (wall enclosure)
Masonry, which accounts for the third biggest quantum of material use, is witnessing a steady decline of conventional clay bricks in favour of concrete-based alternatives. This creates a space for increased use of secondary material-based masonry alternatives.
4. Sand
Accounting for the biggest quantum of material use, sand is potentially a major environmental stress point for construction in the long term, considering river sand to be the predominant material. This co-insides with the maximum potential of post-demolition resource in the form of recycled fine aggregate from demolished concrete and masonry.
5. C&D waste processing
Currently, the C&D processing has negligible impact on the overall material flow for construction. This is an area which needs to grow substantially in scale, and equally, in its scope from its current scope of non-structural items. Even though C&D waste utilisation will not make a big impact on CO2 emissions, but its potential in replacing virgin resources needs to be realistically established.
34 RESOURCE FLOWS IN INDIAN CITIES

The study highlights some issues for the construction sector which needs policy to enable positive action. Although the analysis focuses on CO2 emissions (Global Warming Potential) to represent environmental impact, there are also critical implications about rate of exploitation of mineral resources for production of primary building materials. The following are key areas for policy action for resource efficiency of construction sector.
SUSTAINABLE CONCRETEConcrete dominates both the material flow (quantum) and CO2 emissions of the construction sector. Addressing the sustainability of concrete is one of the key strategies for enhancing environmental performance and resource efficiency of the construction sector. Although the most effective way to achieve this is by addressing the raw materials of concrete, the project specifics in terms of building typology and its structural design also influence the volume of concrete used in the construction. The three ingredients of concrete – cement, sand and coarse aggregate – each offer possibilities for enhancing sustainability of concrete. While alternative to partly replace cement are more significant for CO2 emission reduction, alternative aggregates will reduce the ecological burden of concrete resulting from indiscriminate mining. Provisions for compliance for requisite quality of concrete, including RMC, made using fly ash and slag have been duly covered in the BIS and National Building Code of India13. A series of Indian Standards has also been formulated on various precast concrete products such as solid and hollow concrete blocks, light weight concrete blocks, autoclaved aerated concrete blocks, preformed foam concrete blocks, partial prefabricated concrete flooring and roofing units, concrete pipes, etc, all permitting use of fly ash and slag.
CEMENTCement is the top contributing primary material to overall CO2 emissions from construction. Although normally, it is 8-10% by weight of concrete, it is responsible for almost 90% of CO2 emissions attributable to concrete. The most effective way to reduce cement related emissions is to replace with a cleaner alternative which needs a reduced quantity of clinker in manufacturing. capitalising on the widespread use of fly
13 Aggregates from other than natural sources, including iron slag aggregate, steel slag aggregate, copper slag aggregate, bottom ash from thermal power plant, and aggregate derived from construction and demolition waste, have been included in the IS 456 : 2000 Code of practice for plain and reinforced concrete (4th revision), through cross reference to IS 383:2016 Specification for coarse and fine aggregate for concrete (third revision). The Indian Standard on concrete mix design (IS 10262) has also been upgraded to include guidance and examples of designing concrete mixes using fly ash and slag.
4 PRIORITY AREAS FOR POLICY ACTION

36 RESOURCE FLOWS IN INDIAN CITIES
ash in Odisha and Bhubaneswar, the adoption of Portland Pozzolana Cement (PPC) needs to be mainstreamed. The replacement of OPC with PPC reduces the cement-based CO2 emissions by more than 30%, besides reducing the high environmental impact of global air pollutants and reduced forest cover on account of mining limestone.
50% replacement of OPC with PPC in Ready Mix Concrete leads to 16-21% saving in CO2 emissions. The corresponding replacement with Portland Slag Cement for RMC saves 12-15% CO2 emissions. This can be further increased to about 26-30% reduction in CO2 emissions with the use of LC3 cement.
AGGREGATESCoarse and Fine aggregates account for more than 50% of the material flow, out of which 32% is attributable to sand. However, the CO2 emissions from aggregates account for 2% of the total emissions. The reason for this is the low-energy input for extraction of aggregates. Sand is currently almost exclusively mined from the rivers- Mahanadi, Kuakhai and Daya. CO2 emissions from sand are due to the transportation which is not more than 30km. Aggregates are sourced from stone crushing units within a 50 km radius. While the CO2 emissions from aggregates are negligible, the critical issue, particularly for sand, is of ecological damage and long-term availability. With the impending supply of affordable housing and continuing concrete-based infrastructure in the city, river sand will need substantial replacement with alternatives in the form of manufactured sand and recycled aggregates from demolition activities which will expand in the city in the coming years. The draft guidelines (Sand Mining Management Guidelines) of MoEFCC emphasize the use of Manufactured Sand14 (m-Sand), slag from steel industry, fly ash and overburnt bricks and tiles from the brick and tile industry as alternatives to natural sand.
CONSTRUCTION AND DEMOLITION WASTEIn India, numerous research studies have been carried out on properties of concrete made using recycled aggregates. The results of these studies15 indicate that ‘higher the % of RCA replacing virgin aggregate, the lower is the workability and compressive strength – the reduction in strength is more prominent in mixes with more than 30% replacement. It is possible to develop 30-60 Mpa (28 days) strength concrete with 80mm slump with 100% replacement by RCA to suit structural applications. In a similar study on recycled fine aggregate (RFA), it was observed that for a M30 design mix, satisfactory results were obtained with RFA replacement less than 50%. Studies conducted on utilisation of demolished brick masonry (DBM) waste as coarse and fine aggregates show that part replacement of natural sand with DBM upto 50% produced satisfactory concrete (28 day strength more than 20 Mpa) and mortar (28 day
14 M-Sand is produced by crushing hard granite stone to a stipulated size of 150 microns.. As per IS-383, the chemical characteristics, bulk density and strength of M-sand are similar to the river sand, and same type of applications can be served using M-sand.
15 Jagadish, K. S. (Ed.). (2019). Sustainable Building Technology. I K INTERNATIONAL PUBLISHING HOUSE PVT LTD.

37BHUBANESWAR CITY REPORT
strength more than 6Mpa) for structural use.
Although there is no initiative yet in Bhubaneswar to start productively utilising C&D waste, there is an intent by the city administration to install a C&D processing facility in the near future. Considering that almost 30% of the city’s population lives in slums, rehabilitation of slums and construction of EWS houses for the same is going to be a priority at least for the next 5 years. In addition, there will be a move to redevelop existing residential buildings which are close to 50 years old. Both slum upgradation and redevelopment will generate C&D wastes. A rough estimation has been made to understand the scale of C&D waste – particularly concrete and masonry waste which will be generated from these two segments. It has been assumed that of the total building stock available for redevelopment, 15% will be demolished over the next 5 years (Table 12).
Table 12: Estimated quantum of C&D waste generated from 2020 to 2025
Masonry waste Concrete waste
Slum upgradation 4 Lakh tonnes 2 Lakh tonnes
Slum Redevelopment 18 Lakh tonnes 32 Lakh tonnes
Recycled aggregates do not lead to savings in CO2 emissions because of the additional carbon footprint resulting from transportation of demolition waste and energy, primarily electricity consumed in processing waste into aggregates. As a result, each tonne of recycled aggregate is responsible for about 17 kg CO2. This is comparable to about 15kg CO2 which is emitted by stone crushing units to produce a tonne of coarse aggregate and stone dust.
Steel has one of the highest potential of re-use in various industries. Secondary steel production – essentially steel produced from scrap steel or sponge iron – accounts for 50% of India’s steel production. The Steel Scrap Recycling Policy (2019) has been formulated by the Ministry of Steel to guide the path to self sufficiency in meeting the 70 Million tonnes demand for scrap steel by 2030 which is 35-40% of the total anticipated steel demand. The Policy envisages a hub and spoke model in which 4 collection and dismantling centres will cater to 1 scrap processing centre. Currently, there is no specific data on proportion of C&D waste-derived steel consumed by the construction sector.
INDUSTRIAL WASTE UTILISATIONUtilisation of industrial waste in construction sector as secondary raw materials has a massive potential in Odisha. There is increasing recognition by the government to minimize the environmental damage caused by disposal of industrial wastes, many of which are hazardous to ecology. There have been several studies, both by academic institutions such as IITs and CSIR research institutes such as the IMMT in Bhubaneswar which indicate that industrial wastes can be incorporated into construction sector through production of

38 RESOURCE FLOWS IN INDIAN CITIES
bricks/blocks for masonry, use of recycled aggregates in concrete, road construction, etc. Following are some of the major industrial hubs which are also the source of secondary resources with possible utilisation in the Bhubaneswar-Cuttack urban agglomeration.
Table 13: Major industrial hubs in the Bhubaneswar-Cuttack region
Region IndustryDistance from Bhubaneswar
Industrial waste
KalinaganagarIron and Steel – TATA Steel
100 kmBlast Furnace Slag, Mine tailings
Talcher-Anugul - Jindal, NALCO
Thermal power, aluminium, coal – JINDAL, ANLCO
140 km Fly ash, Red Mud
Hirakud Sambalpur Aluminium 300 km Red Mud
Rajgangpuriron and steel, sponge iron, cement, secondary steel
225 kmDolochar, Foundry sand, blast furnace slag, waste limestone
ChoudwarFerro Alloy, thermal power, cement
40 km Fly ash, foundry sand
Barbil Iron, sponge iron 275 kmDolochar, Foundry sand, blast furnace slag
LanjigarhAluminium refinery - Vedanta
430 km Red mud
PadadipFertilizer – IFFCO, Paradip Phosphates
110 km Waste gypsum
Based on annual production data of various industries in Odisha, the following are major wastes generated –
Table 14: Industrial waste generated per annum in various districts of Odisha
Industry Industrial waste generated per year
Thermal power plants Fly ash - 32 Million tonnes
Iron and Steel Iron tailings- 50 Million tonnesBlast furnace slag 9.2 Million tonnes
Aluminium Red mud - 4.5 Million tonnes
Fertiliser Phospho-gypsum 2.8 Million tonnes
Fly ash - Fly ash is already being utilised productively in Odisha on a massive scale. However, there is a big potential to make its utilisation more effective in the construction sector. The

39BHUBANESWAR CITY REPORT
increase in fly ash in brick making from its current 12% to 20% has the potential to make available 70 Million bricks per year which can be used to construct 5.5 Lakh m2 of built space – this translates into 15000 affordable houses (with an average area of 35m2) every year and an 8% reduction in overall CO2 emissions resulting from residential sector. This can further be made more effective by utilisation of fly ash in concrete mix, given the tight quality control which is possible through batching plants and RMC which is increasingly being adopted for construction projects
Ground Granulated Blast Furnace lag (GGBFS)
GGBFS can be utilised as recycled aggregate in concrete production. Research16 has indicted that the use of BFS as full replacement for coarse aggregate in concrete production caused decrease in its density though the values were still within the normal concrete range. If used, this also could result in reduced self–weight of concrete structural elements. Out of the total 9.2 million tonnes of slag generated per year, it has been assumed that 25% is utilised as recycled aggregate in concrete. Considering a 50% replacement of coarse aggregate in a M25 concrete mix with GGBFS, 2.4 million m3 of concrete can be produced – this concrete can be used in construction of about 5 Million m2 of built space – this translates into 1.2 Lakh affordable homes (EWS/LIG category) or about 55000 MIG category houses.
Red mud
Red mud has been used as a substitute for ordinary clay for producing bricks. Several attempts have been made to recycle red mud not only to avoid environmental pollution, but also to use it in developing polymer composites, wood substitute products, bricks, ceramic glazes such as porcelain, sanitary ware glazes.
Rice Husk Ash (RHA) is also available in Odisha in massive quantities. One of the most promising applications of RHA is in the manufacture of light-weight concrete. Research in this application could prove to be of direct benefit to the manufacture of light-weight concrete blocks which are gaining popularity in Bhubaneswar.
PREFABRICATED CONSTRUCTIONPrefabricated construction is at an early stage in India, where it has been demonstrated in a few mass housing projects, with the single objective of speedy construction. This has mostly been through large pre-fab concrete elements. For instance, EPS wall panels have been used in EWS housing in Bhubaneswar. However, the demonstration projects have not yet resulted in a favourable response from the market. Also, their acceptance by the prospective house owners has been weak because of unfamiliarity and poor thermal performance of the wall enclosure. There is need for a more balanced and innovative
16 Mujedu, K. O., Lamidi, I. A., Familusi, A. undefined, & Olatunji, A. undefined. (2018). Utilization of Blast Furnace Slag as Coarse Aggregate in Concrete Production. The International Journal of Engineering and Sciences, 7(11), 50–57. doi: 10.9790/1813-0711025057

40 RESOURCE FLOWS IN INDIAN CITIES
approach towards pre-fab building elements which increase resource efficiency of construction. There are proven technologies in small scale pre-casting of concrete, primarily for roof construction which reduce steel consumption by 15-20%.
For instance, the use of precast plank and joists or precast ferrocement roofing elements results in reducing the steel consumption by 10-12% per m2 of roof constructed. Using precast concrete roofing elements in 1 Lakh affordable houses (considering average area of 40 m2) will save 6.5 Million tonnes of steel resulting in CO2 emission reduction of 18.2 Million tonnes.
BASELINE AND SYSTEMATIC DATA AVAILABILITYAvailability of reliable data is the first requirement for developing a macro picture of implications of urban development. For the purpose of resource efficiency in construction sector, data pertaining to consumption of material resources is key. This creates a baseline against which systematic improvements can be planned. The structure for this assessment can be developed as part of the drive to improve the data analytics related to urban services as part of the SMART City mission. A critical area which will benefit from more reliable data is that of C&D waste management and utilisation. The redevelopment of existing built spaces will generate massive amounts of demolition waste along with transportation of waste across the city. This generation of waste and its parallel utilisation in on-going construction needs to be synched through co-ordination of data available with BMC/BDA (in the form of redevelopment permits) and the supply end infrastructure of C&D waste plants.

Department of Architecture and Regional Planning, Indian Institute of Technology Kharagpur. (2011). Final Proposal: Comprehensive Development Plan for Cuttack Development Plan Area (CDPA). Housing and Urban Development Department, Government of Orissa.
Jena, D. P. (2018). Urban Growth and Climate Change- A Study in the Context of. IOSR Journal Of Humanities And Social Science 23(4), 49-55.
Limited, B. S. (n.d.). Know Bhubaneswar. Retrieved from Bhubaneswar Smart : https://www.smartcitybhubaneswar.gov.in/
Mohapatra, B. (2014). Assessment of place based community management of urban neighbourhood open space an integrated approach (dissertation). Retrieved from http://shodhganga.inflibnet.ac.in:8080/jspui/handle/10603/22973
Behera, D. D. K. (2019, January 3). Flyash Utlilisation in Odisha. Retrieved March 30, 2020, from http://flyash2019.missionenergy.org/presentations/OPCB.pdf
BMC to recycle C&D waste. (2016, November 2). Retrieved March 30, 2020, from https://pragativadi.com/bmc-recycle-cd-waste/
Balasubramanian, H. (2016, June 16). Govt Regulations Around Construction, Demolition Waste Gets Tighter. Retrieved March 30, 2020, from https://www.proptiger.com/guide/post/govt-regulations-around-construction-demolition-waste-gets-tighter
Jagadish, K. S. (Ed.). (2019). Sustainable Building Technology. IK International Publishing House Pvt Ltd.
REFERENCES

42 RESOURCE FLOWS IN INDIAN CITIES

Mujedu, K. O., Lamidi, I. A., Familusi, A. undefined, & Olatunji, A. undefined. (2018). Utilization of Blast Furnace Slag as Coarse Aggregate in Concrete Production. The International Journal of Engineering and Sciences, 7(11), 50–57. doi: 10.9790/1813-0711025057
ANNEX 1: DESCRIPTION OF UMBERTO MFA MODEL- LIFECYCLE STAGES
Table 15: Different stage of Umberto to MFA model
Stage Description of stage
1. Production of primary materials
Production technologies for Cement, Sand, Aggregates, Steel, Aluminium, Stone dust, Stone tile, Glass, Mild steel and Ceramic tiles
2. Transportation of primary materials to material production site
Transportation from production source to material production facility. Mode of transport considered in the model is a freight lorry of EURO 4 emission standard having load greater than 32 metric tonne.
3. Production of secondary building materials
Production technologies for Ready mix concrete, Clay brick, AAC block, and Fly ash brick
4. Transportation of all construction materials to construction site
Transportation from secondary production and primary production site to construction site
5. Onsite construction Construction of RCC structure foundation and superstructure, monolithic structure, masonry, flooring, door/window work
6. End of life stage Stage involves post demolition process where materials are divided into three chains of C&D processing, transportation to Reuse market and disposal to Landfill
ANNEXURES

44 RESOURCE FLOWS IN INDIAN CITIES
ANNEX 2: MATERIALS DESCRIPTION AND CO2 EMISSION FACTORS
Table 16: Process description in each stage in Umberto
S No.
Material CO2 emission factors used in the Umberto model, kgCO2 Eq/ kg
Source and description
1. Coarse aggregate / Gravel
0.2 ecoinvent v3.6 database value: 0.2 kg CO2 per kg coarse aggregate manufacturedecoinvent v3.6 database process description: Market for17 gravel, crushed [IN]18 Includes emissions from stone crushing operation and the transportation of aggregates from crushing plants to construction site within a radius of 100 km. Rock crushing [RoW] 19 Data corresponding to a specific type of crusher (Nordberg HP 400 SX) with a capacity of 454 tonnes/hour has been considered for stone crushing.
2. Sand (fine aggregate)
0.01 Includes emissions from mining of natural sand from riverbed deposits and its transportation to construction site within a radius of 50 km from the quarry.ecoinvent v3.6 database value: 0.01 kg CO2 per kg sand processedecoinvent v3.6 database process description: Sand quarry operation, extraction from river bed [IN]
17 “Market for” represents collection of all activities of the product till a reference point in a specified geography https://www.ecoinvent.org/support/faqs/methodology-of-ecoinvent-3/what-is-a-market-and-how-is-it-created.html
18 [IN] represents ecoinvent data is specific to Indian geography19 [ROW] or Rest of the World represents activities of the product as an average of all valid countries in the world
https://www.ecoinvent.org/support/faqs/methodology-of-ecoinvent-3/what-do-the-shortcuts-such-as-ch-rer-row-and-glo-mean.html

45BHUBANESWAR CITY REPORT
Sand extraction and processing, as well as equipment maintenance. Machinery is taken into account within the dataset “diesel, burned in building machine”, as all machinery runs on diesel. Administration buildings and the quarry’s end of life are not taken into account.
3. Lime (quicklime)
0.29 ecoinvent v3.6 database value: 0.29 kg CO2 per kg quicklime processedecoinvent v3.6 database process description: Market for quicklime, in pieces, loose [RoW]This product is generally considered to be used at the production site. Therefore, the market does not contain any transport.
4. Stone (flooring)
0.98 ecoinvent v3.6 database value: 0.98 kg CO2 per kg stone tile manufacturedecoinvent v3.6 database process description: Natural stone plate production, polished [RoW]The stone tile polishing is assumed to be done using a polishing machine and very fine grinding medium. No losses are taken into account as no data are available. The dust emissions are estimated based on the losses (0.05 mm abrasion around the granite plate with geometry of 0.5 * 0.5 * 0.03 m and a weight of 2750 kg/m3).
5. Steel – TMT reinforcement bar
2.17 ecoinvent v3.6 database value: 2.17 kg CO2 per kg reinforced steel bar manufacturedecoinvent v3.6 database process description: Reinforcing steel production [RoW]This dataset used in ecoinvent database represents Average of World and European production mix. This is assumed to correspond to the consumption mix in Europe

46 RESOURCE FLOWS IN INDIAN CITIES
6. Steel – MS Structural Steel (door frames)
1.95 ecoinvent v3.6 database value: 1.95 kg CO2 per kg mild steel manufacturedecoinvent v3.6 database process description: Steel production, low-alloyed, hot rolled [RoW]This dataset represents Average of World and European production mix. This is assumed to correspond to the consumption mix in Europe
7. Ready Mix Concrete
0.11 Cement, Sand and aggregate are mixed in a proportion based on the grade of Ready-mix concrete required for construction ecoinvent v3.6 database value: 0.11 kg CO2 per kg concrete manufacturedecoinvent v3.6 database process description:market for concrete, normal [IN]This dataset represents a generic market activity, for the unknown concrete type for production of 1 kg of concrete in Indian geography
8. Clay brick 0.32 Manufactured using 94% Clay, and around 3% sand and husk as a source of fuel, it includes emissions from extraction of clay, burning of husk and transportation of these sources to the clay brick production site. ecoinvent v3.6 database value: 0.32 kg CO2 per kg clay brick producedecoinvent v3.6 database process description: Clay brick production [RoW]This dataset represents the production of 1 kg of brick. Data was obtained from literature values (average data from 12 Swiss brick plants) that were corrected and updated for some flows.

47BHUBANESWAR CITY REPORT
9. Fly ash brick 0.66 Fly ash brick is manufactured during the Fly ash brick production process. It constitutes of 6% Quicklime, 40% Fly ash, 4% Cement and 50% Stone dust.ecoinvent v3.6 database value: 0.66 CO2 per kg fly ash brick producedecoinvent v3.6 database process descriptionmarket for flyash brick [IN]Pulverised fuel ash-lime bricks are obtained from materials consisting of pulverised fuel ash in major quantity, lime and an accelerator acting as a catalyst. Pulverised fuel ash-lime bricks are generally manufactured by intergrading blending various raw materials
are then moulded into bricks and subjected to curing cycles at different temperatures and pressures. These bricks are suitable for use in masonry construction just like common burnt clay bricks. This dataset is specific to India
10. AAC (Aerated Autoclaved Concrete) block
0.45 AAC block is produced in this self-defined process. Contains 68% Fly ash, 23% Lime, 3% Gypsum, and 6% Cement.ecoinvent v3.6 database value: 0.45 CO2 per kg AAC block producedecoinvent v3.6 database process descriptionmarket for autoclaved aerated concrete block [IN]AAC is fire and pest resistant, and is economically and environmentally superior to the more traditional structural building materials such as concrete, wood, brick and stone. The production emissions of AAC block are based on production in India.
11. Glass 1.2 ecoinvent v3.6 database value: 1.2 CO2 per kg coated flat glass manufacturedecoinvent v3.6 database process descriptionmarket for flat glass, coated [RoW]This dataset represents the production of 1 kg of coated flat glass used commonly in windows and doors. This data is considered to be a global average.

48 RESOURCE FLOWS IN INDIAN CITIES
12. Aluminium (extruded section)
26 India Construction Materials Database of Embodied Energy and Global Warming Potential – Methodology report 2017International Finance Corporation (IFC) World Bank GroupAluminium window frame is manufactured from aluminium extruded profiles which are formed, stamped and cut to the required lengths. Each meter of aluminium window frame is considered to have a mass of 2 kg.According to a report by BALCO, 21.6 kg CO2
emissions per kg aluminium20 manufactured are emitted
13 Cement 0.65 ecoinvent v3.6 database value: 0.78 kg CO2 per kg cement manufactured. ecoinvent v3.6 database process description: market for cement, unspecified [IN]This market represents the market for cement, unspecified. Unspecified cement type has been considered in the model due to variation in the cement manufactured across the Indian geography. Average emission factor in India is 0.85 kg CO2/ kg cement21. 0.65 kg CO2/ kg is considered in the model since many cement plants are using energy efficient methods and technologies for less emission intensive cement manufacturing. It is estimated that many cement industries will follow the low carbon pathway based on the current trend.
20 BALCO. (2010). Energy and Environmental Challenges in Aluminum Industry: A review. EPD Congress, 893-906. http://www.balcoindia.com/about-us/doc/publications/Energy-%20Environmental.pdf
21 cBalance.(2013, December).Carbon emissions in the cement sector in India. Retrieved April 1 2020 from http://cbalance.in/2013/12/carbon-emissions-in-the-cement-sector-in-india/#.XqeoEmgzbIX

49BHUBANESWAR CITY REPORT
Fuel (Production, Transportation by Road)
1. Electricity 0.71 ecoinvent v3.6 database value: 0.71 kg CO2 per kg cement manufactured. ecoinvent v3.6 database process description: Market for electricity, medium voltage [IN-Eastern grid]This dataset in ecoinvent database describes the electricity available on the medium voltage level in India - Eastern grid. This is done by showing the transmission of 1kWh electricity at medium voltage.
2. Diesel 0.49 Diesel heavy weight freight lorries for transportation of raw materials to construction site and of recovered materials post demolition to C&D processing site have been considered here. ecoinvent v3.6 database value: 0.49 kg CO2 per kg diesel. ecoinvent v3.6 database process descriptionmarket for diesel [IN]Inventory for regional market of refined petroleum product, encompassing the distribution to the final consumer (household, road vehicle, power plant, etc.) including all necessary transports have been considered in the dataset specific to Indian geography.For transportation of raw materials to secondary production and construction site, ecoinvent dataset of service of 1 tonne-km freight transport in a lorry of the size class >32 metric tonnes gross vehicle weight (GVW) and Euro IV emissions class is taken. The transport datasets refer to the entire transport life cycle i.e. to the construction, operation, maintenance and end of life of vehicle and road infrastructures. Average load factor of this lorry class is 15.96 tonnes and a GVW of 29.96 tonnes

50 RESOURCE FLOWS IN INDIAN CITIES
Transportation of demolished materials to the C&D processing plant is carried out using a smaller freight lorry. The dataset used in ecoinvent for this activity represents the service of 1tkm freight transport in a lorry of the size class 3.5-7.5 metric tonnes gross vehicle weight (GVW) and Euro IV emissions class. Average load factor of this lorry class is 0.98 tonnes and a GVW of 4.98 tonnes.
3. Coal 0.017 kgCO2/KWh
Electricity from thermal power plants have been considered in this model. Emissions from coal (0.017 kgCO2/KWh for 1MW electricity generated )22 have been included in the emissions from electricity generation.
22 Ministry of Power, Government of India, Central Electricity Authority. (2014). CO2 Baseline database for the Indian Power Sector. http://cea.nic.in/reports/others/thermal/tpece/cdm_co2/user_guide_ver10.pdf

51BHUBANESWAR CITY REPORT
ANNEX 3: TRANSPORTATION3 DISTANCE OF MATERIALS
Table 17: Transportation distance of raw materials
Transportation distance of raw materials considered in the Umberto model
Raw Material Transport Distance (km)
From manufacturing facility to construction site
Data Source
Cement 250 Consultation with local stakeholders in Bhubaneswar
TMT steel bar 300
Mild steel 100
Sand 5
Aggregate 50
Clay 5
Stone dust 50
Glass 30
Ceramic tile 200
C&D waste 20
Fly ash 50
Quicklime 100
Gypsum 30
Lime 40
Clay brick 60
Fly ash brick 50
AAC block 50

52 RESOURCE FLOWS IN INDIAN CITIES
European Union’s Resource Efficiency Initiative for India (EU-REI)
B 5/1 Safdarjung Enclave, New Delhi 110 029, INDIA T: +91 1149495353 E: [email protected] E: [email protected] I: www.eu-rei.com