City of Pleasanton - Comprehensive Water Rate Study
163
FINAL REPORT City of Pleasanton Comprehensive Water Rate Study May 2015
-
Upload
khangminh22 -
Category
Documents
-
view
0 -
download
0
Transcript of City of Pleasanton - Comprehensive Water Rate Study
FINAL REPORT
City of Pleasanton Comprehensive
Water Rate Study May 2015
i Table of Contents i City of Pleasanton – Comprehensive Water Rate Study
Executive Summary Introduction .................................................................................................................. 1 Overview of the Rate Study Process .............................................................................. 1 Potable Water Rate Study .............................................................................................. 2 Key Potable Water Rate Study Results ................................................................. 2 Summary of the Potable Water Revenue Requirement Analysis .......................... 3 Summary of the Potable Water Cost of Service Analysis ...................................... 7 Summary of the Present and Proposed Potable Water Rate Designs ................... 7 Summary of the Proposed Potable Water Drought Rates .................................... 9 Recycled Water Rate Study .......................................................................................... 11 Key Recycled Water Rate Study Results ............................................................. 11 Summary of the Recycled Water Revenue Requirement Analysis ...................... 12 Summary of the Present and Proposed Recycled Water Rate Designs ............... 13 Water Rate Study Recommendations .......................................................................... 14 Summary of the Water Rate Study............................................................................... 15
1 Introduction and Overview 1.1 Introduction ...................................................................................................... 16 1.2 Goals and Objectives ......................................................................................... 16 1.3 Overview of the Rate Study Process .................................................................. 17 1.4 Organization of the Study .................................................................................. 17 1.5 Summary ........................................................................................................... 17
2 Overview of the Water Rate Setting Principles 2.1 Introduction ...................................................................................................... 18 2.2 Generally Accepted Rate Setting Principles ........................................................ 18 2.3 Types of Utilities ................................................................................................ 18 2.4 Determining the Revenue Requirement ............................................................ 19 2.4.1 Public Utilities .......................................................................................... 19 2.4.2 Private Utilities ........................................................................................ 20 2.5 Analyzing Cost of Service ................................................................................... 20 2.6 Designing Water Rates ...................................................................................... 21 2.7 Economic Theory and Rate Setting .................................................................... 21 2.8 Summary ........................................................................................................... 21
Table of Contents
ii Table of Contents ii City of Pleasanton – Comprehensive Water Rate Study
3 Development of the Potable Water Rate Study 3.1 Introduction ...................................................................................................... 22 3.2 Development of the Potable Water Revenue Requirement ............................... 22
3.2.1 Determining the Revenue Requirement ............................................... 22 3.2.2 Establishing a Time Frame and Approach ............................................. 22 3.2.3 Projecting Rate and Other Miscellaneous Revenues ............................. 23 3.2.4 Projecting Operation and Maintenance Expenses ................................. 24 3.2.5 Projecting Capital Funding Needs and Transfer Payments .................... 25 3.2.6 Projection of Debt Service .................................................................... 28 3.2.7 Change in Working Capital .................................................................... 28 3.2.8 Summary of the Potable Water Revenue Requirements ....................... 28 3.2.9 Rate Adjustments / Rate Transition ...................................................... 30 3.2.10 Consultant’s Conclusions ...................................................................... 31
3.3 Development of the Potable Water Cost of Service Analysis .............................. 31 3.3.1 Objectives of a Cost of Service Study .................................................... 31 3.3.2 Determining the Customer Classes of Service ....................................... 32 3.3.3 General Cost of Service Procedures ...................................................... 32 3.3.4 Summary of the Cost of Service Analysis .............................................. 35 3.3.5 Consultant’s Conclusions and Recommendations ................................. 35
3.4 Development of the Potable Water Rate Design ................................................ 36 3.4.1 Rate Design Criteria and Considerations ............................................... 36 3.4.2 Development of Cost-Based Potable Water Rates ................................ 37 3.4.3 Summary of the Prior Recommendations ............................................. 38 3.4.4 Review of the City’s Present and Proposed Single-Family Potable
Water Rates.......................................................................................... 39 3.4.5 Review of the City’s Present and Proposed Multi-family and
Commercial Potable Water Rates ......................................................... 41 3.4.6 Review of the City’s Present and Proposed Irrigation Potable Water
Rates .................................................................................................... 42 3.4.7 Development of Potable Water Drought Rates ..................................... 43
3.5 Potable Water Rate Study Recommendations ................................................... 46 3.6 Summary of the Potable Water Rate Study ........................................................ 47
iii Table of Contents iii City of Pleasanton – Comprehensive Water Rate Study
4 Development of the Recycled Water Rate Study 4.1 Introduction ...................................................................................................... 48 4.2 Development of the Recycled Water Revenue Requirement ............................. 48
4.2.1 Determining the Revenue Requirement ............................................... 48 4.2.2 Establishing a Time Frame and Approach ............................................. 48 4.2.3 Projecting Rate and Other Miscellaneous Revenues ............................. 49 4.2.4 Projecting Operation and Maintenance Expenses ................................. 50 4.2.5 Projecting Capital Funding Needs and Transfer Payments .................... 50 4.2.6 Projection of Debt Service .................................................................... 50 4.2.7 Summary of the Recycled Water Revenue Requirements ..................... 51 4.2.8 Consultant’s Conclusions ...................................................................... 52
4.3 Development of the Recycled Water Rate Design .............................................. 52 4.3.1 Development of Recycled Water Rates ................................................. 52 4.3.2 Review of the City’s Present and Proposed Recycled Water Rates ........ 52
4.4 Recycled Water Rate Study Recommendations ................................................. 53 4.5 Summary of the Recycled Water Rate Study ...................................................... 53
Technical Appendix A – Potable Water Analyses Technical Appendix B – Recycled Water Analyses Technical Appendix C – Tier Pricing Analysis Technical Appendix D – Drought Rate Analysis
Executive Summary 1 City of Pleasanton – Comprehensive Water Rate Study
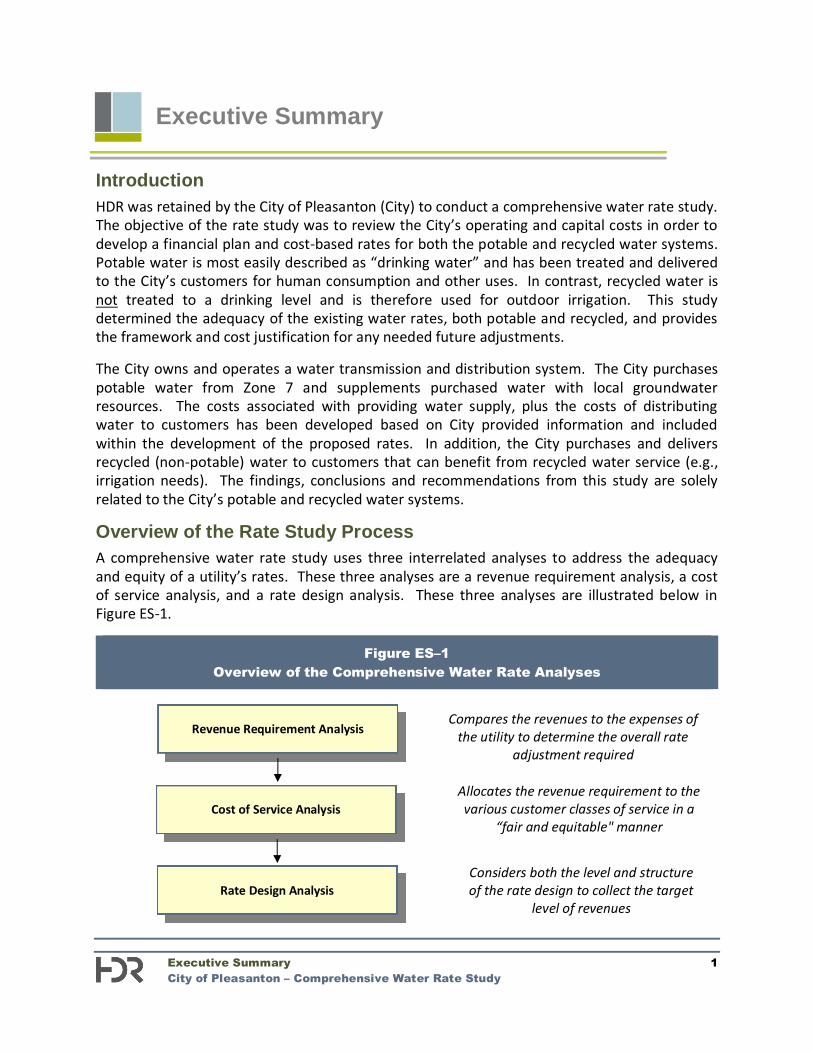
Introduction HDR was retained by the City of Pleasanton (City) to conduct a comprehensive water rate study. The objective of the rate study was to review the City’s operating and capital costs in order to develop a financial plan and cost-based rates for both the potable and recycled water systems. Potable water is most easily described as “drinking water” and has been treated and delivered to the City’s customers for human consumption and other uses. In contrast, recycled water is not treated to a drinking level and is therefore used for outdoor irrigation. This study determined the adequacy of the existing water rates, both potable and recycled, and provides the framework and cost justification for any needed future adjustments. The City owns and operates a water transmission and distribution system. The City purchases potable water from Zone 7 and supplements purchased water with local groundwater resources. The costs associated with providing water supply, plus the costs of distributing water to customers has been developed based on City provided information and included within the development of the proposed rates. In addition, the City purchases and delivers recycled (non-potable) water to customers that can benefit from recycled water service (e.g., irrigation needs). The findings, conclusions and recommendations from this study are solely related to the City’s potable and recycled water systems. Overview of the Rate Study Process A comprehensive water rate study uses three interrelated analyses to address the adequacy and equity of a utility’s rates. These three analyses are a revenue requirement analysis, a cost of service analysis, and a rate design analysis. These three analyses are illustrated below in Figure ES-1.
Figure ES–1 Overview of the Comprehensive Water Rate Analyses
Revenue Requirement Analysis
Cost of Service Analysis
Rate Design Analysis
Compares the revenues to the expenses of the utility to determine the overall rate
adjustment required
Allocates the revenue requirement to the various customer classes of service in a
“fair and equitable" manner
Considers both the level and structure of the rate design to collect the target
level of revenues
Executive Summary
Executive Summary 2 City of Pleasanton – Comprehensive Water Rate Study
The above framework for reviewing and evaluating the City’s water system rates was utilized in the development of this study. Potable Water Rate Study The water rate study technical analysis was developed separately for the potable and recycled water systems. The potable water system technical analysis was developed based on the operating and capital costs necessary to provide potable water to the City’s customers. Key Potable Water Rate Study Results The potable water technical analysis resulted in the following findings, conclusions, and recommendations.
A revenue requirement analysis was developed for FY 2016 through FY 2020. The FY 2015 budget was used as the starting point of the analysis. Preliminary FY 2016
and 2017 budgeted information for O&M expenses were also included within the analysis.
Operation and maintenance expenses are projected to increase at inflationary levels with no assumed changes to levels of service or anticipated extraordinary expenses.
The current drought has impacted customer consumption levels, which in turn has reduced overall revenues for the potable water system.
The prudent level of funding renewal and replacements through rates is one of the primary drivers behind the results and the recommendations for the proposed rate adjustments.
The potable water system has no outstanding long-term debt. Under the proposed financial plan, no long-term debt will be issued to fund necessary capital improvements.
Annual rate adjustments over the FY 2016 – FY 2020 time period are needed to support the capital improvement plan and renewal and replacement funding levels. The FY 2016 adjustment of 5.5% is proposed to be effective on October 1, 2015. Annual inflationary adjustments of 2.5% are proposed on January 1, of each subsequent year starting January 1, 2016.
A cost of service analysis was developed to review the equity of the existing rates. The results of the cost of service analysis indicated minor cost differences between the
various customer classes of service. However, for a number of reasons (i.e., drought impacts), it is recommended that no adjustments to the cost/rate relationships between the classes of service be made at this time.
The study has proposed rates for the FY 2016 – FY 2020 time period. For a single-family residential customer, the average bi-monthly adjustment is estimated to be approximately $8.40 at the end of the five year period with expected inflationary based rate adjustments.
Local distribution costs are proposed to increase by inflationary measures over the 5-year period, and at this time have been estimated at 2.5% for rate example purposes.
Executive Summary 3 City of Pleasanton – Comprehensive Water Rate Study
“The proper and adequate funding of capital projects is
important to help minimize rates over time. A general financial
guideline states that, at a minimum, a utility should fund an amount equal to or greater than
annual depreciation expense through rates.”
The primary adjustment to water rates for FY 2016 is to reflect the current cost of Zone 7 purchased water.
The Zone 7 rate will adjust as a pass-through wholesale rate when adopted by Zone 7. At this time no further Zone 7 wholesale rate adjustments have been included in the study.
An analysis of the allocation of costs to the City’s residential water rate tiers has been completed to reflect recent legal decisions.
Drought rates, by drought stage, were developed for the City to encourage efficient use and maintain sufficient revenues during mandatory conservation efforts.
The drought rates can be implemented by the City Council as drought stages are declared.
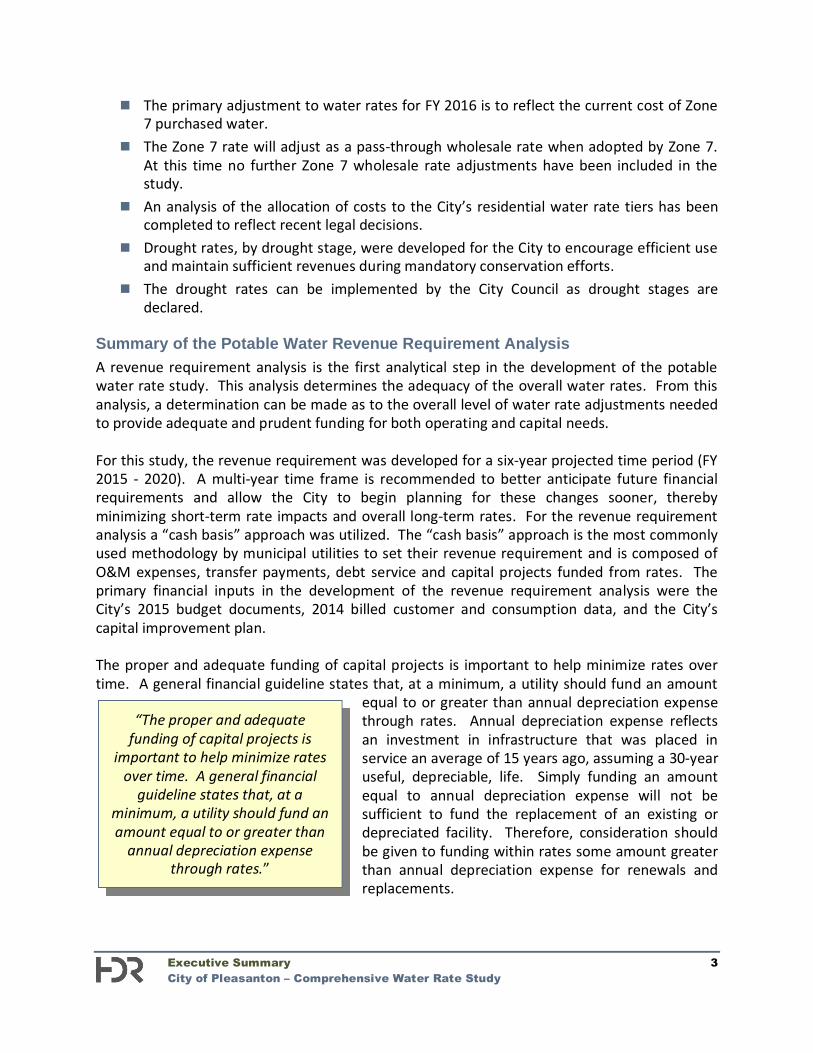
Summary of the Potable Water Revenue Requirement Analysis A revenue requirement analysis is the first analytical step in the development of the potable water rate study. This analysis determines the adequacy of the overall water rates. From this analysis, a determination can be made as to the overall level of water rate adjustments needed to provide adequate and prudent funding for both operating and capital needs. For this study, the revenue requirement was developed for a six-year projected time period (FY 2015 - 2020). A multi-year time frame is recommended to better anticipate future financial requirements and allow the City to begin planning for these changes sooner, thereby minimizing short-term rate impacts and overall long-term rates. For the revenue requirement analysis a “cash basis” approach was utilized. The “cash basis” approach is the most commonly used methodology by municipal utilities to set their revenue requirement and is composed of O&M expenses, transfer payments, debt service and capital projects funded from rates. The primary financial inputs in the development of the revenue requirement analysis were the City’s 2015 budget documents, 2014 billed customer and consumption data, and the City’s capital improvement plan. The proper and adequate funding of capital projects is important to help minimize rates over time. A general financial guideline states that, at a minimum, a utility should fund an amount
equal to or greater than annual depreciation expense through rates. Annual depreciation expense reflects an investment in infrastructure that was placed in service an average of 15 years ago, assuming a 30-year useful, depreciable, life. Simply funding an amount equal to annual depreciation expense will not be sufficient to fund the replacement of an existing or depreciated facility. Therefore, consideration should be given to funding within rates some amount greater than annual depreciation expense for renewals and replacements.
Executive Summary 4 City of Pleasanton – Comprehensive Water Rate Study
For purposes of reviewing the capital project funding, City has segregated their capital plan into two components:
Potable Water Replacement Fund Potable Water Expansion Fund
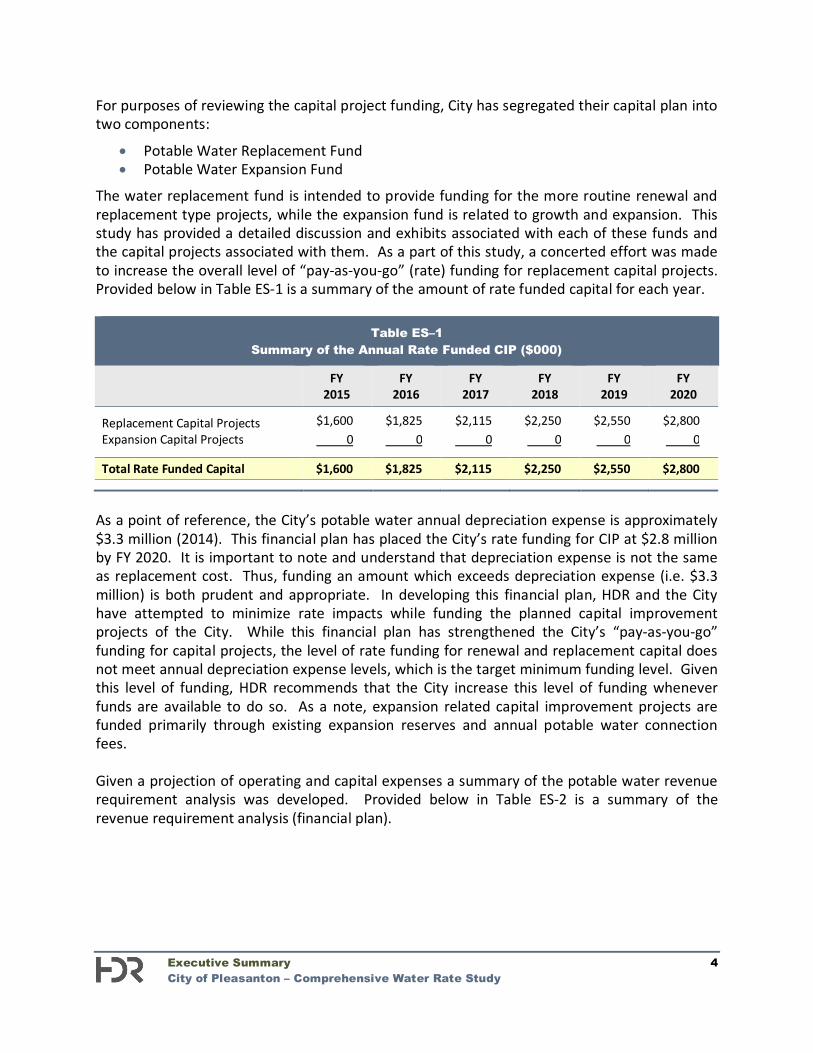
The water replacement fund is intended to provide funding for the more routine renewal and replacement type projects, while the expansion fund is related to growth and expansion. This study has provided a detailed discussion and exhibits associated with each of these funds and the capital projects associated with them. As a part of this study, a concerted effort was made to increase the overall level of “pay-as-you-go” (rate) funding for replacement capital projects. Provided below in Table ES-1 is a summary of the amount of rate funded capital for each year.
Table ES–1 Summary of the Annual Rate Funded CIP ($000)
FY 2015
FY 2016
FY 2017
FY 2018
FY 2019
FY 2020
Replacement Capital Projects $1,600 $1,825 $2,115 $2,250 $2,550 $2,800 Expansion Capital Projects 0 0 0 0 0 0
Total Rate Funded Capital $1,600 $1,825 $2,115 $2,250 $2,550 $2,800
As a point of reference, the City’s potable water annual depreciation expense is approximately $3.3 million (2014). This financial plan has placed the City’s rate funding for CIP at $2.8 million by FY 2020. It is important to note and understand that depreciation expense is not the same as replacement cost. Thus, funding an amount which exceeds depreciation expense (i.e. $3.3 million) is both prudent and appropriate. In developing this financial plan, HDR and the City have attempted to minimize rate impacts while funding the planned capital improvement projects of the City. While this financial plan has strengthened the City’s “pay-as-you-go” funding for capital projects, the level of rate funding for renewal and replacement capital does not meet annual depreciation expense levels, which is the target minimum funding level. Given this level of funding, HDR recommends that the City increase this level of funding whenever funds are available to do so. As a note, expansion related capital improvement projects are funded primarily through existing expansion reserves and annual potable water connection fees. Given a projection of operating and capital expenses a summary of the potable water revenue requirement analysis was developed. Provided below in Table ES-2 is a summary of the revenue requirement analysis (financial plan).
Executive Summary 5 City of Pleasanton – Comprehensive Water Rate Study
Table ES–2 Summary of the Potable Water Revenue Requirement Analysis ($000)
FY 2015
FY 2016
FY 2017
FY 2018
FY 2019
FY 2020
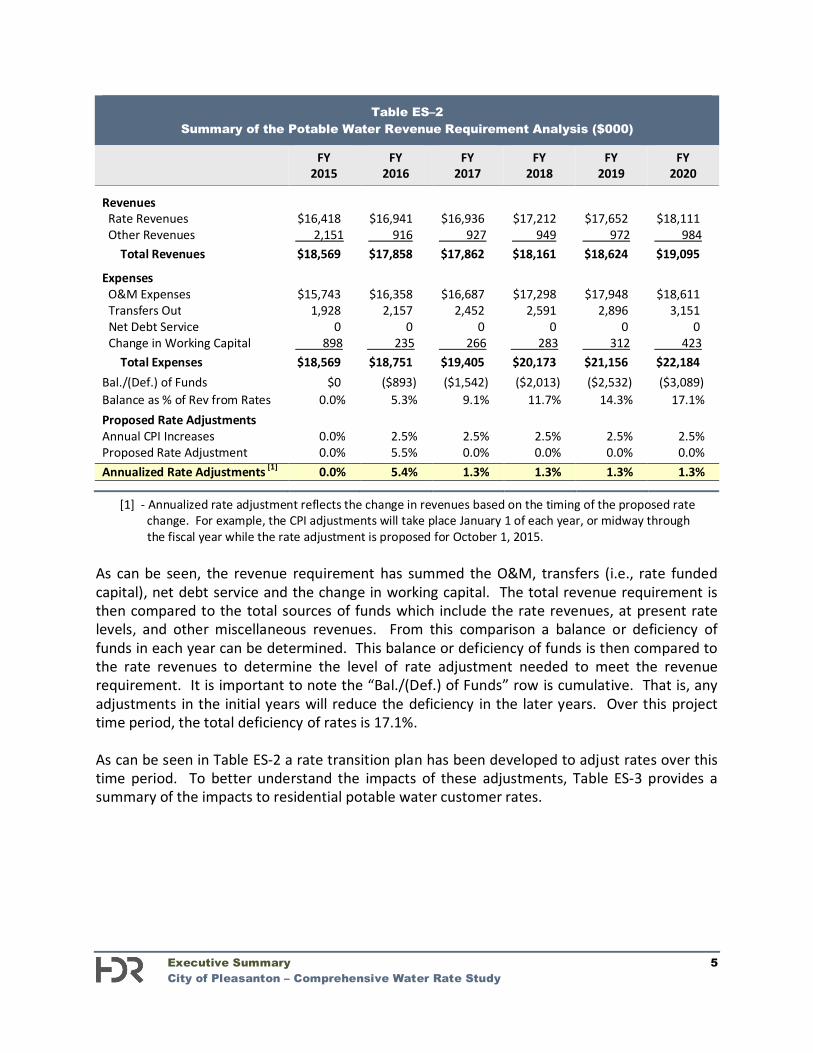
Revenues Rate Revenues $16,418 $16,941 $16,936 $17,212 $17,652 $18,111 Other Revenues 2,151 916 927 949 972 984 Total Revenues $18,569 $17,858 $17,862 $18,161 $18,624 $19,095
Expenses O&M Expenses $15,743 $16,358 $16,687 $17,298 $17,948 $18,611 Transfers Out 1,928 2,157 2,452 2,591 2,896 3,151 Net Debt Service 0 0 0 0 0 0 Change in Working Capital 898 235 266 283 312 423 Total Expenses $18,569 $18,751 $19,405 $20,173 $21,156 $22,184 Bal./(Def.) of Funds $0 ($893) ($1,542) ($2,013) ($2,532) ($3,089) Balance as % of Rev from Rates 0.0% 5.3% 9.1% 11.7% 14.3% 17.1% Proposed Rate Adjustments Annual CPI Increases 0.0% 2.5% 2.5% 2.5% 2.5% 2.5% Proposed Rate Adjustment 0.0% 5.5% 0.0% 0.0% 0.0% 0.0% Annualized Rate Adjustments [1] 0.0% 5.4% 1.3% 1.3% 1.3% 1.3%
[1] - Annualized rate adjustment reflects the change in revenues based on the timing of the proposed rate change. For example, the CPI adjustments will take place January 1 of each year, or midway through the fiscal year while the rate adjustment is proposed for October 1, 2015.
As can be seen, the revenue requirement has summed the O&M, transfers (i.e., rate funded capital), net debt service and the change in working capital. The total revenue requirement is then compared to the total sources of funds which include the rate revenues, at present rate levels, and other miscellaneous revenues. From this comparison a balance or deficiency of funds in each year can be determined. This balance or deficiency of funds is then compared to the rate revenues to determine the level of rate adjustment needed to meet the revenue requirement. It is important to note the “Bal./(Def.) of Funds” row is cumulative. That is, any adjustments in the initial years will reduce the deficiency in the later years. Over this project time period, the total deficiency of rates is 17.1%. As can be seen in Table ES-2 a rate transition plan has been developed to adjust rates over this time period. To better understand the impacts of these adjustments, Table ES-3 provides a summary of the impacts to residential potable water customer rates.
Executive Summary 6 City of Pleasanton – Comprehensive Water Rate Study
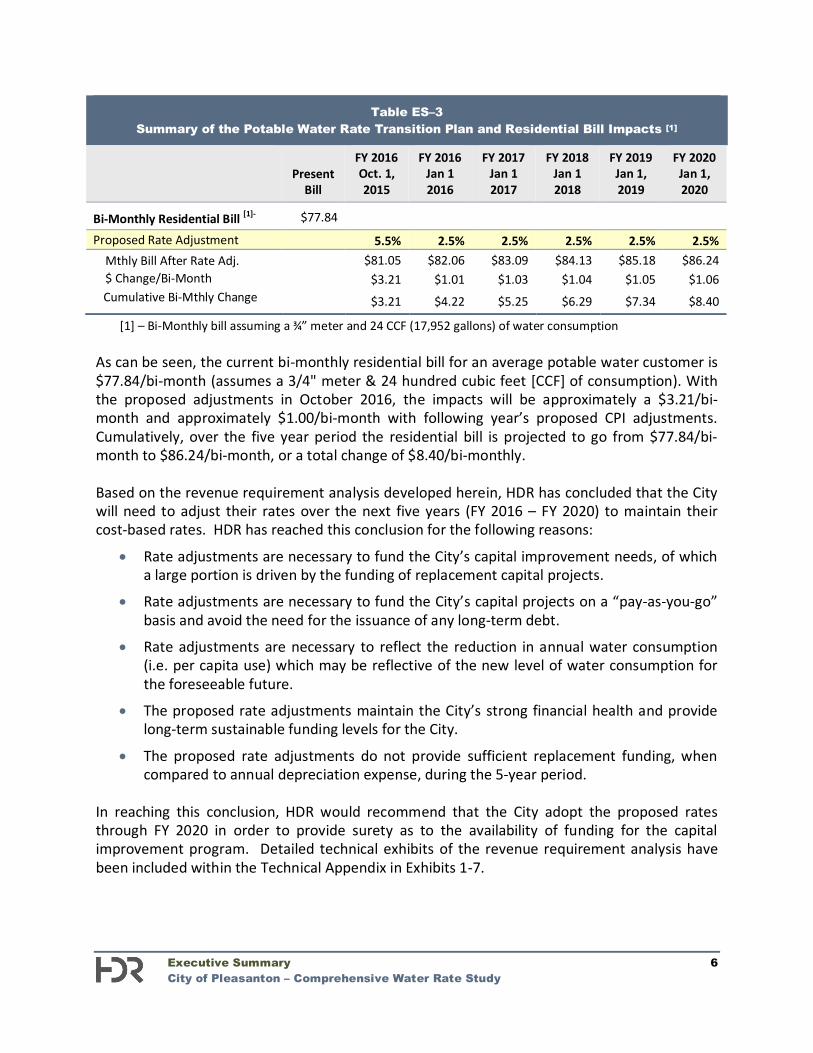
Table ES–3 Summary of the Potable Water Rate Transition Plan and Residential Bill Impacts [1]
Present
Bill
FY 2016 Oct. 1, 2015
FY 2016 Jan 1 2016
FY 2017 Jan 1 2017
FY 2018 Jan 1 2018
FY 2019 Jan 1, 2019
FY 2020 Jan 1, 2020
Bi-Monthly Residential Bill [1]- $77.84
Proposed Rate Adjustment 5.5% 2.5% 2.5% 2.5% 2.5% 2.5% Mthly Bill After Rate Adj. $81.05 $82.06 $83.09 $84.13 $85.18 $86.24 $ Change/Bi-Month $3.21 $1.01 $1.03 $1.04 $1.05 $1.06 Cumulative Bi-Mthly Change $3.21 $4.22 $5.25 $6.29 $7.34 $8.40
[1] – Bi-Monthly bill assuming a ¾” meter and 24 CCF (17,952 gallons) of water consumption As can be seen, the current bi-monthly residential bill for an average potable water customer is $77.84/bi-month (assumes a 3/4" meter & 24 hundred cubic feet [CCF] of consumption). With the proposed adjustments in October 2016, the impacts will be approximately a $3.21/bi-month and approximately $1.00/bi-month with following year’s proposed CPI adjustments. Cumulatively, over the five year period the residential bill is projected to go from $77.84/bi-month to $86.24/bi-month, or a total change of $8.40/bi-monthly. Based on the revenue requirement analysis developed herein, HDR has concluded that the City will need to adjust their rates over the next five years (FY 2016 – FY 2020) to maintain their cost-based rates. HDR has reached this conclusion for the following reasons:
Rate adjustments are necessary to fund the City’s capital improvement needs, of which a large portion is driven by the funding of replacement capital projects.
Rate adjustments are necessary to fund the City’s capital projects on a “pay-as-you-go” basis and avoid the need for the issuance of any long-term debt.
Rate adjustments are necessary to reflect the reduction in annual water consumption (i.e. per capita use) which may be reflective of the new level of water consumption for the foreseeable future.
The proposed rate adjustments maintain the City’s strong financial health and provide long-term sustainable funding levels for the City.
The proposed rate adjustments do not provide sufficient replacement funding, when compared to annual depreciation expense, during the 5-year period.
In reaching this conclusion, HDR would recommend that the City adopt the proposed rates through FY 2020 in order to provide surety as to the availability of funding for the capital improvement program. Detailed technical exhibits of the revenue requirement analysis have been included within the Technical Appendix in Exhibits 1-7.
Executive Summary 7 City of Pleasanton – Comprehensive Water Rate Study
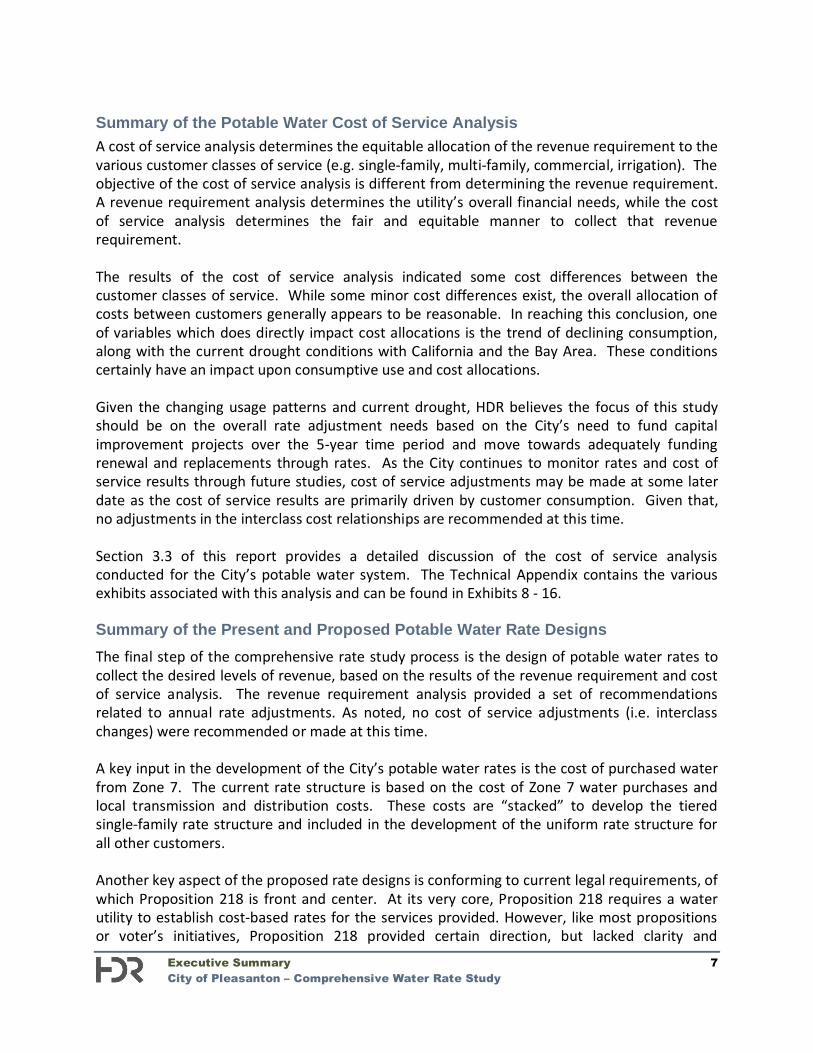
Summary of the Potable Water Cost of Service Analysis A cost of service analysis determines the equitable allocation of the revenue requirement to the various customer classes of service (e.g. single-family, multi-family, commercial, irrigation). The objective of the cost of service analysis is different from determining the revenue requirement. A revenue requirement analysis determines the utility’s overall financial needs, while the cost of service analysis determines the fair and equitable manner to collect that revenue requirement. The results of the cost of service analysis indicated some cost differences between the customer classes of service. While some minor cost differences exist, the overall allocation of costs between customers generally appears to be reasonable. In reaching this conclusion, one of variables which does directly impact cost allocations is the trend of declining consumption, along with the current drought conditions with California and the Bay Area. These conditions certainly have an impact upon consumptive use and cost allocations. Given the changing usage patterns and current drought, HDR believes the focus of this study should be on the overall rate adjustment needs based on the City’s need to fund capital improvement projects over the 5-year time period and move towards adequately funding renewal and replacements through rates. As the City continues to monitor rates and cost of service results through future studies, cost of service adjustments may be made at some later date as the cost of service results are primarily driven by customer consumption. Given that, no adjustments in the interclass cost relationships are recommended at this time. Section 3.3 of this report provides a detailed discussion of the cost of service analysis conducted for the City’s potable water system. The Technical Appendix contains the various exhibits associated with this analysis and can be found in Exhibits 8 - 16. Summary of the Present and Proposed Potable Water Rate Designs The final step of the comprehensive rate study process is the design of potable water rates to collect the desired levels of revenue, based on the results of the revenue requirement and cost of service analysis. The revenue requirement analysis provided a set of recommendations related to annual rate adjustments. As noted, no cost of service adjustments (i.e. interclass changes) were recommended or made at this time. A key input in the development of the City’s potable water rates is the cost of purchased water from Zone 7. The current rate structure is based on the cost of Zone 7 water purchases and local transmission and distribution costs. These costs are “stacked” to develop the tiered single-family rate structure and included in the development of the uniform rate structure for all other customers. Another key aspect of the proposed rate designs is conforming to current legal requirements, of which Proposition 218 is front and center. At its very core, Proposition 218 requires a water utility to establish cost-based rates for the services provided. However, like most propositions or voter’s initiatives, Proposition 218 provided certain direction, but lacked clarity and
Executive Summary 8 City of Pleasanton – Comprehensive Water Rate Study
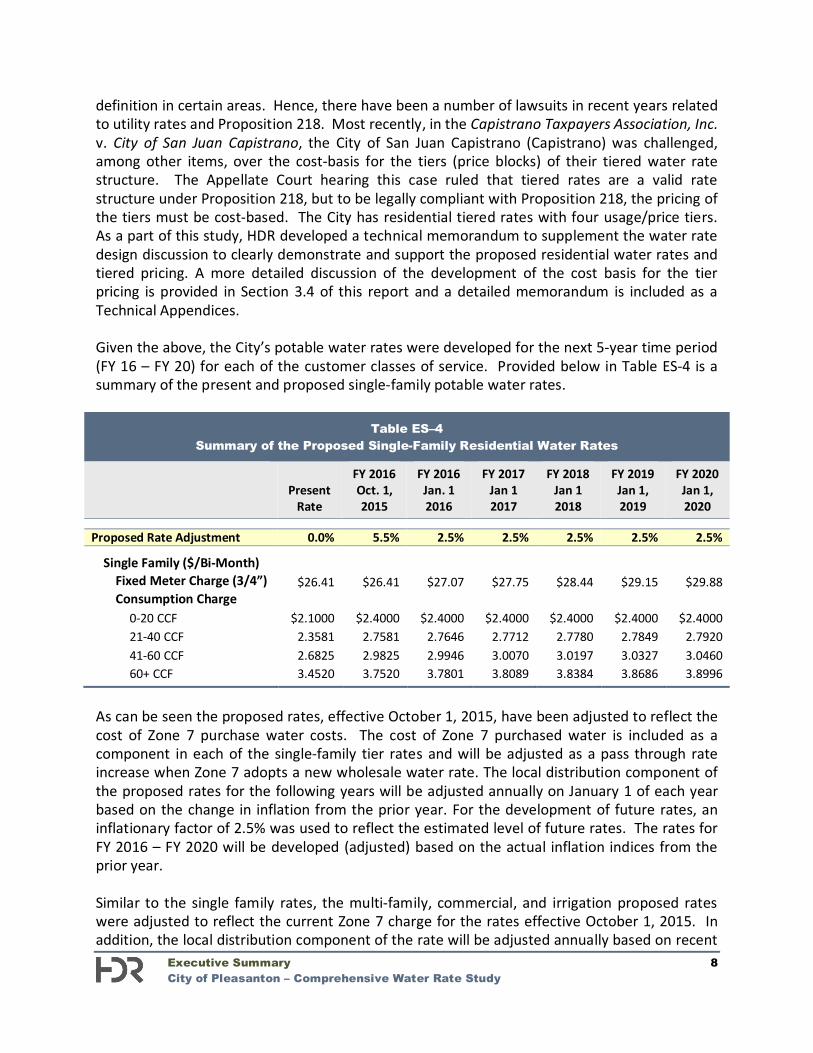
definition in certain areas. Hence, there have been a number of lawsuits in recent years related to utility rates and Proposition 218. Most recently, in the Capistrano Taxpayers Association, Inc. v. City of San Juan Capistrano, the City of San Juan Capistrano (Capistrano) was challenged, among other items, over the cost-basis for the tiers (price blocks) of their tiered water rate structure. The Appellate Court hearing this case ruled that tiered rates are a valid rate structure under Proposition 218, but to be legally compliant with Proposition 218, the pricing of the tiers must be cost-based. The City has residential tiered rates with four usage/price tiers. As a part of this study, HDR developed a technical memorandum to supplement the water rate design discussion to clearly demonstrate and support the proposed residential water rates and tiered pricing. A more detailed discussion of the development of the cost basis for the tier pricing is provided in Section 3.4 of this report and a detailed memorandum is included as a Technical Appendices. Given the above, the City’s potable water rates were developed for the next 5-year time period (FY 16 – FY 20) for each of the customer classes of service. Provided below in Table ES-4 is a summary of the present and proposed single-family potable water rates.
Table ES–4 Summary of the Proposed Single-Family Residential Water Rates
Present
Rate
FY 2016 Oct. 1, 2015
FY 2016 Jan. 1 2016
FY 2017 Jan 1 2017
FY 2018 Jan 1 2018
FY 2019 Jan 1, 2019
FY 2020 Jan 1, 2020
Proposed Rate Adjustment 0.0% 5.5% 2.5% 2.5% 2.5% 2.5% 2.5%
Single Family ($/Bi-Month) Fixed Meter Charge (3/4”) $26.41 $26.41 $27.07 $27.75 $28.44 $29.15 $29.88 Consumption Charge
0-20 CCF $2.1000 $2.4000 $2.4000 $2.4000 $2.4000 $2.4000 $2.4000 21-40 CCF 2.3581 2.7581 2.7646 2.7712 2.7780 2.7849 2.7920 41-60 CCF 2.6825 2.9825 2.9946 3.0070 3.0197 3.0327 3.0460 60+ CCF 3.4520 3.7520 3.7801 3.8089 3.8384 3.8686 3.8996
As can be seen the proposed rates, effective October 1, 2015, have been adjusted to reflect the cost of Zone 7 purchase water costs. The cost of Zone 7 purchased water is included as a component in each of the single-family tier rates and will be adjusted as a pass through rate increase when Zone 7 adopts a new wholesale water rate. The local distribution component of the proposed rates for the following years will be adjusted annually on January 1 of each year based on the change in inflation from the prior year. For the development of future rates, an inflationary factor of 2.5% was used to reflect the estimated level of future rates. The rates for FY 2016 – FY 2020 will be developed (adjusted) based on the actual inflation indices from the prior year. Similar to the single family rates, the multi-family, commercial, and irrigation proposed rates were adjusted to reflect the current Zone 7 charge for the rates effective October 1, 2015. In addition, the local distribution component of the rate will be adjusted annually based on recent
Executive Summary 9 City of Pleasanton – Comprehensive Water Rate Study
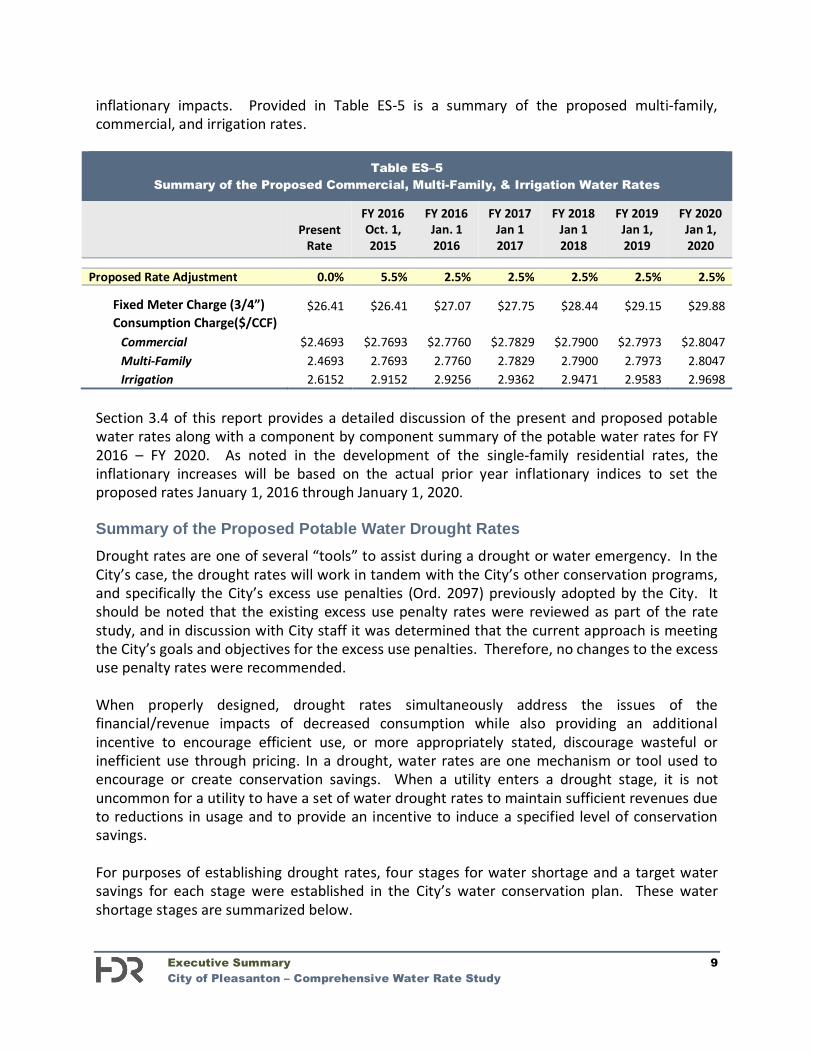
inflationary impacts. Provided in Table ES-5 is a summary of the proposed multi-family, commercial, and irrigation rates.
Table ES–5 Summary of the Proposed Commercial, Multi-Family, & Irrigation Water Rates
Present
Rate
FY 2016 Oct. 1, 2015
FY 2016 Jan. 1 2016
FY 2017 Jan 1 2017
FY 2018 Jan 1 2018
FY 2019 Jan 1, 2019
FY 2020 Jan 1, 2020
Proposed Rate Adjustment 0.0% 5.5% 2.5% 2.5% 2.5% 2.5% 2.5%
Fixed Meter Charge (3/4”) $26.41 $26.41 $27.07 $27.75 $28.44 $29.15 $29.88 Consumption Charge($/CCF)
Commercial $2.4693 $2.7693 $2.7760 $2.7829 $2.7900 $2.7973 $2.8047 Multi-Family 2.4693 2.7693 2.7760 2.7829 2.7900 2.7973 2.8047 Irrigation 2.6152 2.9152 2.9256 2.9362 2.9471 2.9583 2.9698
Section 3.4 of this report provides a detailed discussion of the present and proposed potable water rates along with a component by component summary of the potable water rates for FY 2016 – FY 2020. As noted in the development of the single-family residential rates, the inflationary increases will be based on the actual prior year inflationary indices to set the proposed rates January 1, 2016 through January 1, 2020. Summary of the Proposed Potable Water Drought Rates Drought rates are one of several “tools” to assist during a drought or water emergency. In the City’s case, the drought rates will work in tandem with the City’s other conservation programs, and specifically the City’s excess use penalties (Ord. 2097) previously adopted by the City. It should be noted that the existing excess use penalty rates were reviewed as part of the rate study, and in discussion with City staff it was determined that the current approach is meeting the City’s goals and objectives for the excess use penalties. Therefore, no changes to the excess use penalty rates were recommended. When properly designed, drought rates simultaneously address the issues of the financial/revenue impacts of decreased consumption while also providing an additional incentive to encourage efficient use, or more appropriately stated, discourage wasteful or inefficient use through pricing. In a drought, water rates are one mechanism or tool used to encourage or create conservation savings. When a utility enters a drought stage, it is not uncommon for a utility to have a set of water drought rates to maintain sufficient revenues due to reductions in usage and to provide an incentive to induce a specified level of conservation savings. For purposes of establishing drought rates, four stages for water shortage and a target water savings for each stage were established in the City’s water conservation plan. These water shortage stages are summarized below.
Executive Summary 10 City of Pleasanton – Comprehensive Water Rate Study
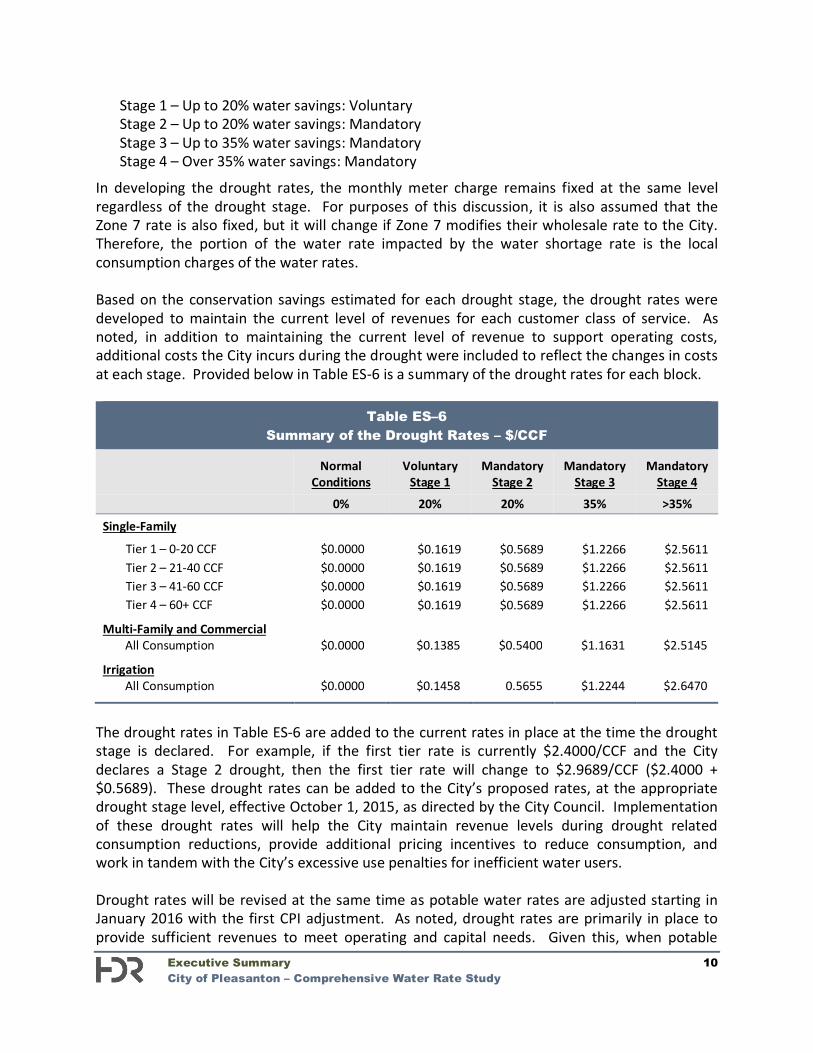
Stage 1 – Up to 20% water savings: Voluntary Stage 2 – Up to 20% water savings: Mandatory Stage 3 – Up to 35% water savings: Mandatory Stage 4 – Over 35% water savings: Mandatory
In developing the drought rates, the monthly meter charge remains fixed at the same level regardless of the drought stage. For purposes of this discussion, it is also assumed that the Zone 7 rate is also fixed, but it will change if Zone 7 modifies their wholesale rate to the City. Therefore, the portion of the water rate impacted by the water shortage rate is the local consumption charges of the water rates. Based on the conservation savings estimated for each drought stage, the drought rates were developed to maintain the current level of revenues for each customer class of service. As noted, in addition to maintaining the current level of revenue to support operating costs, additional costs the City incurs during the drought were included to reflect the changes in costs at each stage. Provided below in Table ES-6 is a summary of the drought rates for each block.
Table ES–6 Summary of the Drought Rates – $/CCF
Normal Conditions
Voluntary Stage 1
Mandatory Stage 2
Mandatory Stage 3
Mandatory Stage 4
0% 20% 20% 35% >35%
Single-Family
Tier 1 – 0-20 CCF $0.0000 $0.1619 $0.5689 $1.2266 $2.5611 Tier 2 – 21-40 CCF $0.0000 $0.1619 $0.5689 $1.2266 $2.5611 Tier 3 – 41-60 CCF $0.0000 $0.1619 $0.5689 $1.2266 $2.5611 Tier 4 – 60+ CCF $0.0000 $0.1619 $0.5689 $1.2266 $2.5611
Multi-Family and Commercial All Consumption $0.0000 $0.1385 $0.5400 $1.1631 $2.5145
Irrigation All Consumption $0.0000 $0.1458 0.5655 $1.2244 $2.6470
The drought rates in Table ES-6 are added to the current rates in place at the time the drought stage is declared. For example, if the first tier rate is currently $2.4000/CCF and the City declares a Stage 2 drought, then the first tier rate will change to $2.9689/CCF ($2.4000 + $0.5689). These drought rates can be added to the City’s proposed rates, at the appropriate drought stage level, effective October 1, 2015, as directed by the City Council. Implementation of these drought rates will help the City maintain revenue levels during drought related consumption reductions, provide additional pricing incentives to reduce consumption, and work in tandem with the City’s excessive use penalties for inefficient water users. Drought rates will be revised at the same time as potable water rates are adjusted starting in January 2016 with the first CPI adjustment. As noted, drought rates are primarily in place to provide sufficient revenues to meet operating and capital needs. Given this, when potable
Executive Summary 11 City of Pleasanton – Comprehensive Water Rate Study
water rates are increased the level of revenues will increase. Subsequently, drought rates will need to be reviewed and updated based on the relationship to the current rates and revenue needs. This includes any CPI adjustments to the local distribution charges as well as the Zone 7 wholesale water rates. In this way the enactment of the drought rates will provide the same level of revenues prior to drought rates and resulting water conservation impacts. A more detailed discussion of the potable water drought rates is provided in Section 3.4.7 of this report. In addition, HDR developed a technical memorandum to supplement the development of the potable water drought rates to clearly demonstrate and support the pricing of the drought rates. This technical memorandum is attached within the technical appendix to this report. Recycled Water Rate Study The City is in the process of expanding its current recycled water system with the addition of new pipelines, storage, and future capital improvements to provide recycled water to areas of the City. The recycled water system technical analysis was developed based on the operating and capital costs necessary to provide recycled water where available. Key Recycled Water Rate Study Results The recycled water technical analysis resulted in the following findings, conclusions, and recommendations.
A revenue requirement analysis was developed for FY 2016 through FY 2020. The FY 2015 budget was used as the starting point of the analysis. Operation and maintenance expenses were projected based on FY 2016 and FY 2017
budget estimates along with future estimated inflationary levels. The City purchases recycled water supply from Dublin San Ramon Services District and
the City of Livermore. Purchased recycled water projections were based on City provided estimates of
customers converting to recycled water in the near future. The analysis includes annual debt service payments starting in FY 2017 which funds
Phase 1A and 1B of the recycled water system. The analysis begins to fund a renewal and replacement fund over the 5-year period to
establish a renewal and replacement fund. A recycled water connection fee was calculated and is provided under a separate cover
to the City. The current recycled water rate structure is based on 90% of the potable water
irrigation rate. The proposed recycled water rate maintains the 90% relationship to the potable
irrigation rate.
Executive Summary 12 City of Pleasanton – Comprehensive Water Rate Study
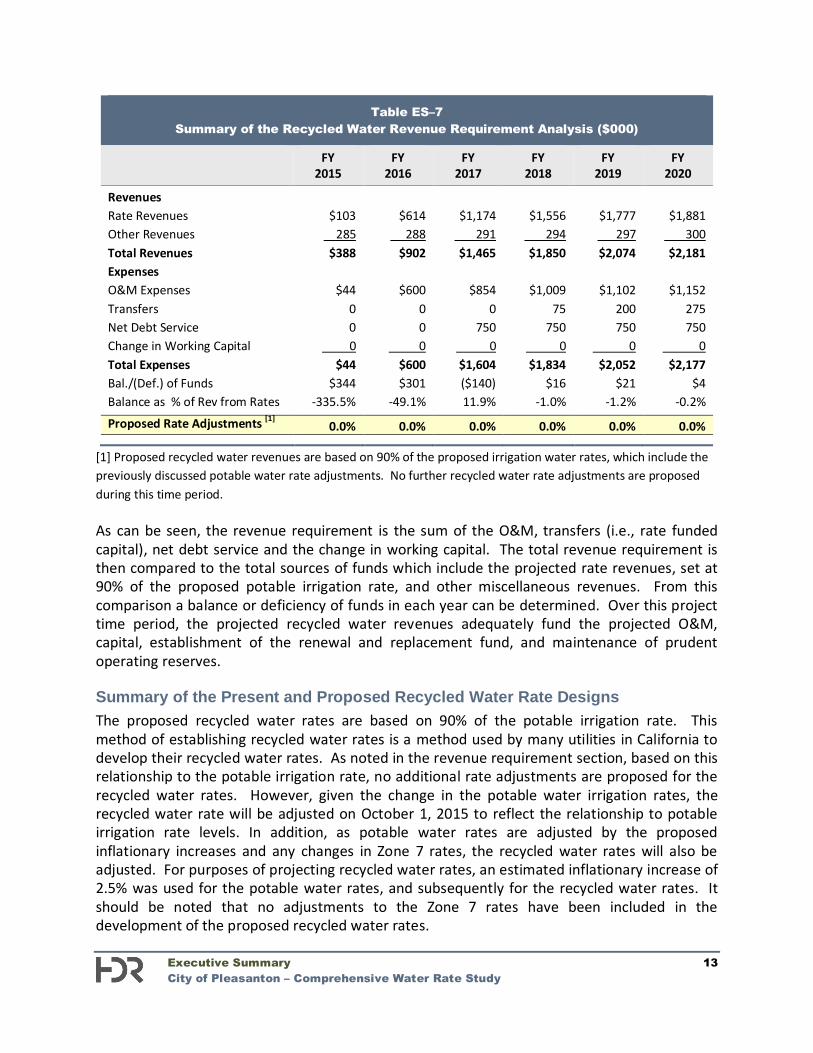
Summary of the Recycled Water Revenue Requirement Analysis Similar to the potable water analysis, a revenue requirement analysis was developed for the recycled water system to determine the adequacy of recycled water rates. The analysis is used to determine if the level of current recycled water rates adequately supports recycled water operations and capital needs. The projection of revenues for the recycled water analysis was based on the expected conversion of existing potable irrigation customers to the recycled water system when it becomes available. It should also be noted that the projected revenues assume maintaining the recycled water rate relationship equal to 90% of the potable irrigation rate. The City provided the anticipated recycled water sales to new customers over the 5-year period which was used to project annual recycled water revenues and recycled water purchases from Dublin San Ramon Services District and the City of Livermore. The recycled water revenue requirement was developed for the six-year projected time period of FY 2015 – FY 2020. The revenue requirement analysis was established using a “cash basis” approach. This is the same methodology and time period used in the development of the potable water revenue requirement. The cash basis approach is composed of O&M expenses, transfer payments, debt service, and capital projects funded from rates. The primary financial inputs in the development of the revenue requirement were the City’s projected recycled water budget for FY 2016 and FY 2017, projected recycled water customer billing data, and the recycled water capital improvement plan. The City is in the early stages of establishing a recycled water system. As a result, the development of a renewal and replacement fund to finance future capital improvements and maintain the existing system is critical to the financial stability of the recycled water program. The City’s current capital improvement plan includes Phases 1A and 1B, which are funded through a low interest loan from the State of California. This results in an annual debt service payment starting in FY 2017 of approximately $750,000. When recycled water revenues are sufficient, the City will begin to establish a transfer to the recycled water renewal and replacement fund. It is expected this will occur starting in FY 2018 and ramp up as sales and revenue levels permit. The same general financial guideline used in the potable water analysis for the funding of renewal and replacements also applies to the recycled water utility. That is, at a minimum, a utility should fund an amount equal to or greater than annual depreciation expense through rates. As noted, as revenues are available the City should increase the level of rate funded capital to maintain the recycled water system. In the future some consideration should be given to funding, within recycled water rates, some amount greater than annual depreciation expense for purposes of funding replacement cost. Given the projection of operating and capital expenses, a summary of the recycled water revenue requirement analysis was developed. Provided below in Table ES-7 is a summary of the revenue requirement analysis (financial plan).
Executive Summary 13 City of Pleasanton – Comprehensive Water Rate Study
Table ES–7 Summary of the Recycled Water Revenue Requirement Analysis ($000)
FY 2015
FY 2016
FY 2017
FY 2018
FY 2019
FY 2020
Revenues Rate Revenues $103 $614 $1,174 $1,556 $1,777 $1,881 Other Revenues 285 288 291 294 297 300 Total Revenues $388 $902 $1,465 $1,850 $2,074 $2,181 Expenses O&M Expenses $44 $600 $854 $1,009 $1,102 $1,152 Transfers 0 0 0 75 200 275 Net Debt Service 0 0 750 750 750 750 Change in Working Capital 0 0 0 0 0 0 Total Expenses $44 $600 $1,604 $1,834 $2,052 $2,177 Bal./(Def.) of Funds $344 $301 ($140) $16 $21 $4 Balance as % of Rev from Rates -335.5% -49.1% 11.9% -1.0% -1.2% -0.2%
Proposed Rate Adjustments [1] 0.0% 0.0% 0.0% 0.0% 0.0% 0.0%
[1] Proposed recycled water revenues are based on 90% of the proposed irrigation water rates, which include the previously discussed potable water rate adjustments. No further recycled water rate adjustments are proposed during this time period. As can be seen, the revenue requirement is the sum of the O&M, transfers (i.e., rate funded capital), net debt service and the change in working capital. The total revenue requirement is then compared to the total sources of funds which include the projected rate revenues, set at 90% of the proposed potable irrigation rate, and other miscellaneous revenues. From this comparison a balance or deficiency of funds in each year can be determined. Over this project time period, the projected recycled water revenues adequately fund the projected O&M, capital, establishment of the renewal and replacement fund, and maintenance of prudent operating reserves. Summary of the Present and Proposed Recycled Water Rate Designs The proposed recycled water rates are based on 90% of the potable irrigation rate. This method of establishing recycled water rates is a method used by many utilities in California to develop their recycled water rates. As noted in the revenue requirement section, based on this relationship to the potable irrigation rate, no additional rate adjustments are proposed for the recycled water rates. However, given the change in the potable water irrigation rates, the recycled water rate will be adjusted on October 1, 2015 to reflect the relationship to potable irrigation rate levels. In addition, as potable water rates are adjusted by the proposed inflationary increases and any changes in Zone 7 rates, the recycled water rates will also be adjusted. For purposes of projecting recycled water rates, an estimated inflationary increase of 2.5% was used for the potable water rates, and subsequently for the recycled water rates. It should be noted that no adjustments to the Zone 7 rates have been included in the development of the proposed recycled water rates.
Executive Summary 14 City of Pleasanton – Comprehensive Water Rate Study
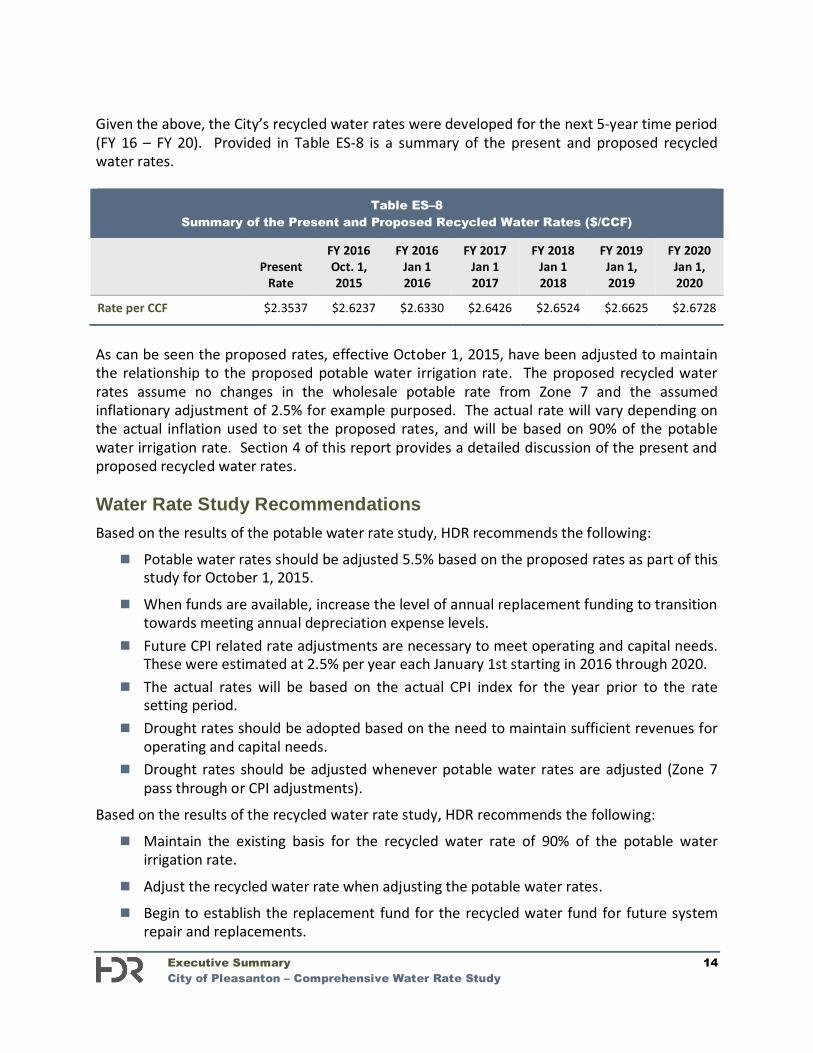
Given the above, the City’s recycled water rates were developed for the next 5-year time period (FY 16 – FY 20). Provided in Table ES-8 is a summary of the present and proposed recycled water rates.
Table ES–8 Summary of the Present and Proposed Recycled Water Rates ($/CCF)
Present
Rate
FY 2016 Oct. 1, 2015
FY 2016 Jan 1 2016
FY 2017 Jan 1 2017
FY 2018 Jan 1 2018
FY 2019 Jan 1, 2019
FY 2020 Jan 1, 2020
Rate per CCF $2.3537 $2.6237 $2.6330 $2.6426 $2.6524 $2.6625 $2.6728
As can be seen the proposed rates, effective October 1, 2015, have been adjusted to maintain the relationship to the proposed potable water irrigation rate. The proposed recycled water rates assume no changes in the wholesale potable rate from Zone 7 and the assumed inflationary adjustment of 2.5% for example purposed. The actual rate will vary depending on the actual inflation used to set the proposed rates, and will be based on 90% of the potable water irrigation rate. Section 4 of this report provides a detailed discussion of the present and proposed recycled water rates. Water Rate Study Recommendations Based on the results of the potable water rate study, HDR recommends the following:
Potable water rates should be adjusted 5.5% based on the proposed rates as part of this study for October 1, 2015.
When funds are available, increase the level of annual replacement funding to transition towards meeting annual depreciation expense levels.
Future CPI related rate adjustments are necessary to meet operating and capital needs. These were estimated at 2.5% per year each January 1st starting in 2016 through 2020.
The actual rates will be based on the actual CPI index for the year prior to the rate setting period.
Drought rates should be adopted based on the need to maintain sufficient revenues for operating and capital needs.
Drought rates should be adjusted whenever potable water rates are adjusted (Zone 7 pass through or CPI adjustments).
Based on the results of the recycled water rate study, HDR recommends the following:
Maintain the existing basis for the recycled water rate of 90% of the potable water irrigation rate.
Adjust the recycled water rate when adjusting the potable water rates.
Begin to establish the replacement fund for the recycled water fund for future system repair and replacements.
Executive Summary 15 City of Pleasanton – Comprehensive Water Rate Study
Summary of the Water Rate Study This completes the overview of the development of the comprehensive potable and recycled water rate study for the City. The focus of this study has been the prudent and adequate funding of the utility, particularly as it relates to the needed capital improvement projects and prudent annual funding of renewal and replacement needs. The proposed rate adjustments maintain a fiscally healthy potable and recycled water system. A full and complete discussion of the development of the potable and recycled water rate study can be found in following sections of this report.
Introduction and Overview 16 City of Pleasanton – Comprehensive Water Rate Study
1.1 Introduction HDR Engineering, Inc. (HDR) was retained by the City of Pleasanton (City) to conduct a comprehensive water rate study. The objective of the rate study was to review the City’s potable and recycled water operating and capital costs in order to develop a financial plan and cost-based rates. The financial plan is designed to meet the City’s operation and maintenance (O&M) needs and the capital improvement program for the potable and recycled water systems. This study determined the adequacy of the existing water rates and provides the framework for any needed future adjustments. The City owns and operates a potable and recycled water distribution system. The City purchases potable water from Zone 7, supplemented with ground water, and purchases recycled water from Dublin San Ramon Services District and the City of Livermore. Each system was analyzed on a stand-alone basis to determine if rates are adequately funding each system’s operating and capital needs. 1.2 Goals and Objectives The City had a number of key objectives in developing the water rate study. These key objectives were as follows:
Develop the study in a manner that is consistent with the principles and methodologies established by the American Water Works Association (AWWA), M1 Manual, Principles of Water Rates, Fees, and Charges.
In financial planning and establishing the City’s rates, review and utilize best industry practices, while recognizing and acknowledging the specific and unique characteristics of the City’s systems.
Review the City’s rates utilizing “generally accepted” rate making methodologies to determine adequacy and equity of the utility rates.
Meet the City’s financial planning criteria, particularly as it relates to adequate funding of capital infrastructure and maintenance of adequate and prudent reserve levels.
Develop a final proposed financial plan which adequately supports the utility’s funding requirements, while attempting to minimize overall impacts to rates.
Provide rates which meet the legal requirements of Proposition 218 and recent legal decisions related to Proposition 218.
These key objectives provided a framework for policy decisions in the analysis that follows.
1. Introduction and Overview
Introduction and Overview 17 City of Pleasanton – Comprehensive Water Rate Study
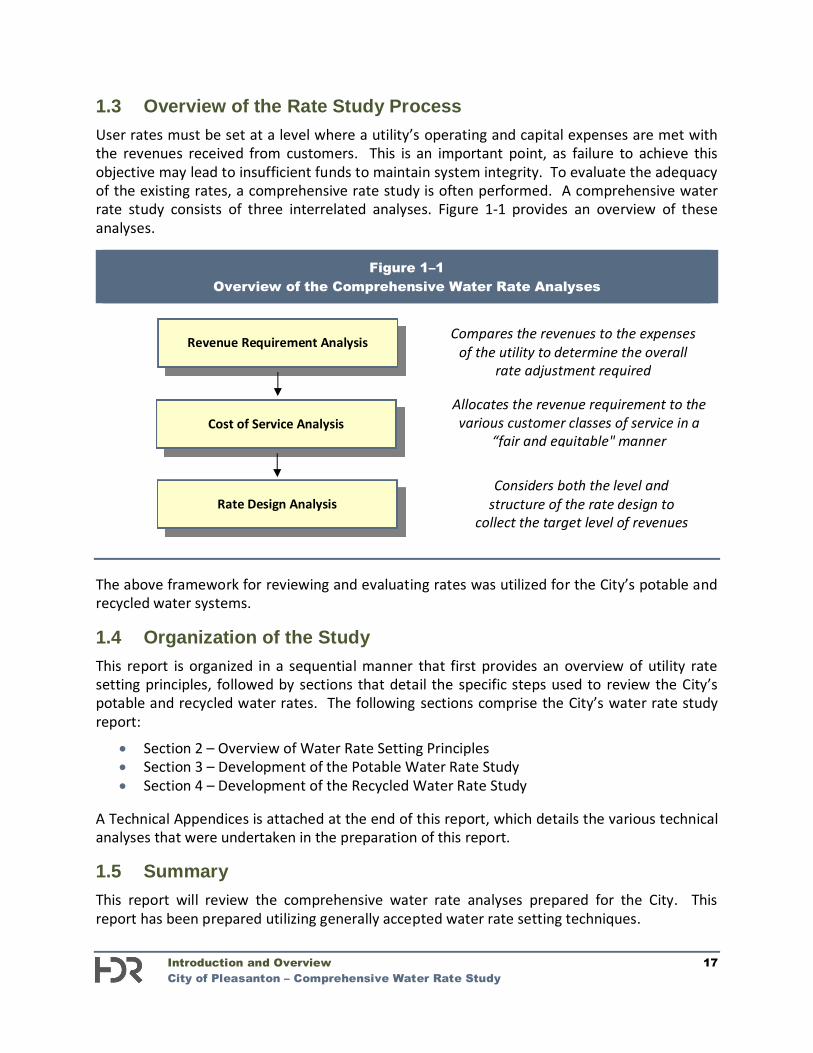
1.3 Overview of the Rate Study Process User rates must be set at a level where a utility’s operating and capital expenses are met with the revenues received from customers. This is an important point, as failure to achieve this objective may lead to insufficient funds to maintain system integrity. To evaluate the adequacy of the existing rates, a comprehensive rate study is often performed. A comprehensive water rate study consists of three interrelated analyses. Figure 1-1 provides an overview of these analyses.
Figure 1–1 Overview of the Comprehensive Water Rate Analyses
The above framework for reviewing and evaluating rates was utilized for the City’s potable and recycled water systems. 1.4 Organization of the Study This report is organized in a sequential manner that first provides an overview of utility rate setting principles, followed by sections that detail the specific steps used to review the City’s potable and recycled water rates. The following sections comprise the City’s water rate study report:
Section 2 – Overview of Water Rate Setting Principles Section 3 – Development of the Potable Water Rate Study Section 4 – Development of the Recycled Water Rate Study
A Technical Appendices is attached at the end of this report, which details the various technical analyses that were undertaken in the preparation of this report. 1.5 Summary This report will review the comprehensive water rate analyses prepared for the City. This report has been prepared utilizing generally accepted water rate setting techniques.
Revenue Requirement Analysis
Cost of Service Analysis
Rate Design Analysis
Compares the revenues to the expenses of the utility to determine the overall
rate adjustment required
Allocates the revenue requirement to the various customer classes of service in a
“fair and equitable" manner
Considers both the level and structure of the rate design to
collect the target level of revenues
Overview of Water Rate Setting Principles 18 City of Pleasanton – Comprehensive Water Rate Study
2.1 Introduction This section of the report provides background information about the water rate setting process, including descriptions of generally accepted principles, types of utilities, methods of determining a revenue requirement, the cost of service analysis, and rate design. This information is useful for gaining a better understanding of the details presented in Sections 3 and 4 of this report. 2.2 Generally Accepted Rate Setting Principles As a practical matter, all utilities should consider setting their rates around some generally accepted or global principles and guidelines. Utility rates should be:
Cost-based, equitable, and set at a level that meets the utility’s full revenue requirement.
Easy to understand and administer. Designed to conform to “generally accepted” rate setting techniques. Stable in their ability to provide adequate revenues for meeting the utility’s financial,
operating, and regulatory requirements. Established at a level that is stable from year-to-year from a customer’s perspective.
2.3 Types of Utilities Utilities are generally divided into two types:
Public utilities are usually owned by a City, county, or special district, and are theoretically operated at zero profit. A public utility is locally owned since its customers are also its owners. Public utilities are capitalized or financed by issuing debt and soliciting funds from customers through direct capital contributions or user rates. Public or municipal utilities are typically exempt from state and federal income taxes. A publicly elected City Council or Board of Commissioners usually regulates public utilities.
Private utilities are “for profit” enterprises and are owned by a private company and/or shareholders. The shareholders are, in essence, the owners of the private utility. Therefore, the owners of a private utility may not be customers or local citizens, but rather numerous individuals or shareholders spread across the United States. A private utility is capitalized by issuing stock to the general public. Private utilities are taxable entities. Given their “for-profit” status, their rates and operations are generally regulated by a state public utility commission or other regulatory body.
As a point of reference, the City is a public (municipal) utility and the analysis has been based on the methodology generally utilized by a public utility.
2. Overview of Water Rate Setting Principles
Overview of Water Rate Setting Principles 19 City of Pleasanton – Comprehensive Water Rate Study
2.4 Determining the Revenue Requirement Because public and private utilities have very different administrative and financial characteristics their methods differ for determining revenue requirements and setting rates. 2.4.1 Public Utilities Most public utilities use the “cash basis” approach for establishing their revenue requirement and setting rates. This approach conforms to most public utility budgetary requirements and the calculation is easy to understand. A public utility totals its cash expenditures for a period of time to determine required revenues. The revenue requirement for a public utility is usually comprised of the following costs or expenses:
Total Operating Expenses: This includes a utility’s operation and maintenance (O&M) expenses, plus any applicable taxes or transfer payments. Operation and maintenance expenses include the materials, electricity, labor, supplies, etc. needed to keep the utility functioning.
Total Capital Expenses: Capital expenses are calculated by adding debt service payments (principal and interest) to capital improvements financed with rate revenues. In lieu of including capital improvements financed with rate revenues, a utility sometimes includes depreciation expense to stabilize the annual revenue requirement.
Under the “cash basis” approach, the sum of the total operating expenses plus the total capital expenses equals the utility’s revenue requirement during any selected period of time (historical or projected). Note that the two portions of the capital expense component (debt service and capital improvements financed from rates) are necessary under the cash basis approach because utilities generally cannot finance all their capital facilities with long-term debt. At the same time, it is often difficult to pay for capital expenditures on a “pay-as-you-go” basis given that some major capital projects may have significant rate impacts upon a utility, even when financed with long-term debt. Many utilities have found that some combination of pay-as-you-go funding and long-term financing will often lead to minimization of rates over time. Public utilities typically use the “cash basis”1 approach to establish their revenue requirements. An exception occurs if a public utility provides service to a wholesale or contract customer. In this situation, a public utility could use the “utility basis” approach (see Table 2-1) to earn a fair return on its investment.
1 “Cash basis” as used in the context of rate setting is not the same as the terminology used for accounting purposes and recognition of revenues and expenses. As used for rate setting, “cash basis” simply refers to the specific cost components to be included within the revenue requirement analysis.
Overview of Water Rate Setting Principles 20 City of Pleasanton – Comprehensive Water Rate Study
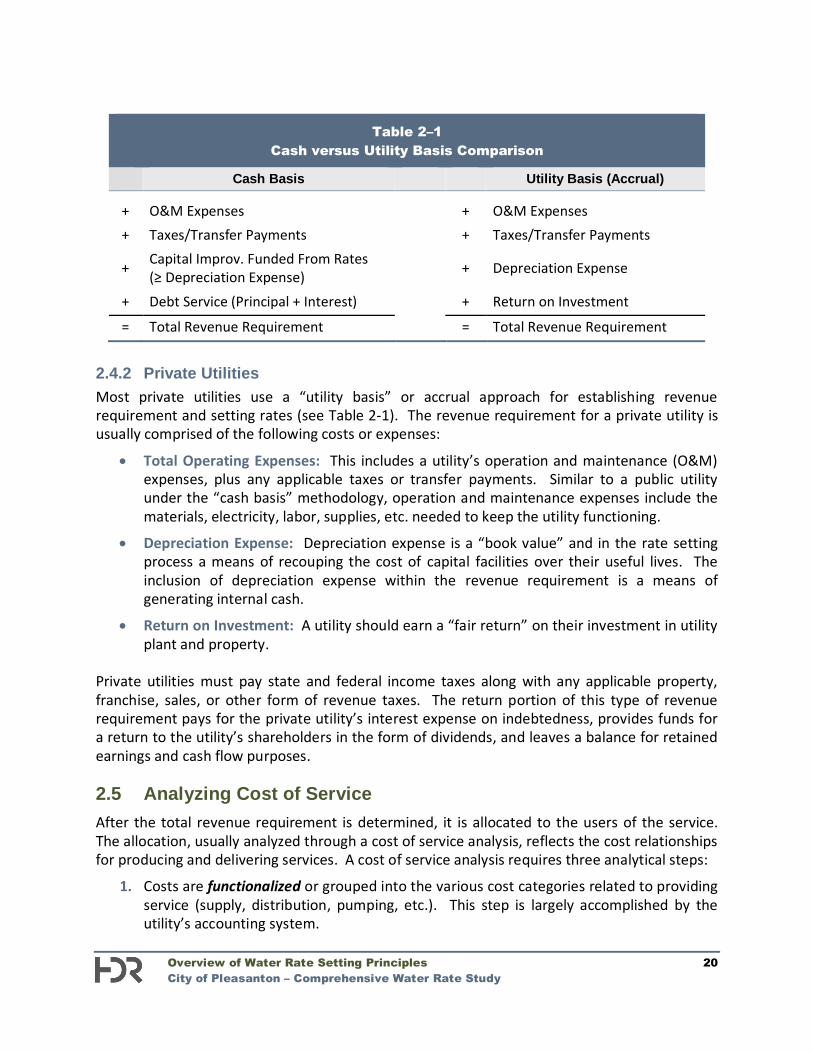
Table 2–1 Cash versus Utility Basis Comparison
Cash Basis Utility Basis (Accrual) + O&M Expenses + O&M Expenses + Taxes/Transfer Payments + Taxes/Transfer Payments
+ Capital Improv. Funded From Rates ( Depreciation Expense) + Depreciation Expense
+ Debt Service (Principal + Interest) + Return on Investment
= Total Revenue Requirement = Total Revenue Requirement
2.4.2 Private Utilities Most private utilities use a “utility basis” or accrual approach for establishing revenue requirement and setting rates (see Table 2-1). The revenue requirement for a private utility is usually comprised of the following costs or expenses:
Total Operating Expenses: This includes a utility’s operation and maintenance (O&M) expenses, plus any applicable taxes or transfer payments. Similar to a public utility under the “cash basis” methodology, operation and maintenance expenses include the materials, electricity, labor, supplies, etc. needed to keep the utility functioning.
Depreciation Expense: Depreciation expense is a “book value” and in the rate setting process a means of recouping the cost of capital facilities over their useful lives. The inclusion of depreciation expense within the revenue requirement is a means of generating internal cash.
Return on Investment: A utility should earn a “fair return” on their investment in utility plant and property.
Private utilities must pay state and federal income taxes along with any applicable property, franchise, sales, or other form of revenue taxes. The return portion of this type of revenue requirement pays for the private utility’s interest expense on indebtedness, provides funds for a return to the utility’s shareholders in the form of dividends, and leaves a balance for retained earnings and cash flow purposes. 2.5 Analyzing Cost of Service After the total revenue requirement is determined, it is allocated to the users of the service. The allocation, usually analyzed through a cost of service analysis, reflects the cost relationships for producing and delivering services. A cost of service analysis requires three analytical steps:
1. Costs are functionalized or grouped into the various cost categories related to providing service (supply, distribution, pumping, etc.). This step is largely accomplished by the utility’s accounting system.
Overview of Water Rate Setting Principles 21 City of Pleasanton – Comprehensive Water Rate Study
“Economic theory suggests that the price of a commodity must
roughly equal its cost if equity among
customers is to be maintained.”
2. The functionalized costs are then classified to specific cost components. Classification refers to the arrangement of the functionalized data into cost components. For example, a water utility’s costs are typically classified as average day, peak day, or customer-related.
3. Once the costs are classified into components, they are proportionally allocated to the customer classes of service (residential, non-residential, irrigation, etc.). The allocation is based on each customer class’ relative contribution to the cost component. For example, customer-related costs are allocated to each class of service based on the total number of customers in that class of service. Once costs are allocated, the revenues from each customer class of service required to achieve cost-based rates can be determined.
2.6 Designing Water Rates Rates that meet the utility’s objectives are designed based on both the revenue requirement and the cost of service analysis. This approach results in rates that are strictly cost-based and does not consider other non-cost based goals and objectives (conservation, economic development, ability to pay, revenue stability, etc.). In designed final proposed rates, factors such as ability to pay, continuity of past rate philosophy, economic development, ease of administration, and customer understanding may typically be taken into consideration2. 2.7 Economic Theory and Rate Setting One of the major justifications for a comprehensive rate study is founded in economic theory. Economic theory suggests that the price of a commodity must roughly equal its cost if equity among customers is to be maintained. This statement’s implications on utility rate designs are significant. For example, a water utility usually incurs capacity-related costs to meet summer lawn watering needs. It follows that the customers who create excessive peak demands on the system and create the need for upsizing of the distribution system should pay for those over-sized facilities in proportion to their contribution to total peaking requirements. When costing and pricing techniques are refined, consumers have a more accurate understanding of what the commodity costs to produce and deliver. This price-equals-cost concept provides the basis for the subsequent analysis and comments. 2.8 Summary This section of the report has provided a brief introduction to the general principles, techniques, and economic theory used to set water rates. These principles and techniques will become the basis for the City’s comprehensive water rate study. 2 The recent Capistrano decision has limited a water utility’s ability to establish tiered rates for purposes of encouraging water conservation. The Capistrano decision determined that the pricing of the tiers must have a cost-basis and cannot simply be punitive to encourage efficient use.
Development of the Potable Water Rate Study 22 City of Pleasanton – Comprehensive Water Rate Study
3.1 Introduction This section describes the development of the potable water rate study. Potable water is most easily described as “drinking water” and has been treated and delivered to the City’s customers for human consumption and other uses. In contrast to potable water, non-potable or recycled water is not treated to a level suitable for human consumption and is therefore used for outdoor irrigation. This portion of the report will focus on the costs related to the City’s potable water system. The potable water rate study includes the development of the revenue requirement, cost of service, and rate design analyses. Each of these analyses is discussed in more detail, including the specific steps to develop the City’s cost-based and equitable potable water rates. 3.2 Development of the Potable Water Revenue Requirement The revenue requirement analysis is the first analytical step in the comprehensive rate study process. This analysis determines the adequacy of the overall potable water rates. From this analysis, a determination can be made as to the overall level of rate adjustments needed to provide adequate and prudent funding for both operating and capital needs of the potable water system. 3.2.1 Determining the Revenue Requirement In developing the City’s potable water revenue requirement, the utility, as an enterprise fund, must financially “stand on its own” and be properly funded. As a result, the revenue requirement analysis, as developed herein, assumes the full and proper funding needed to operate and maintain the City’s potable water system on a financially sound and prudent basis. Provided below is a more detailed discussion of the development of the revenue requirement analysis for the City. 3.2.2 Establishing a Time Frame and Approach The first step in calculating the revenue requirement for the City’s potable water utility was to establish a time frame for the revenue requirement analysis. For this study, the revenue requirement was developed for a six-year projected time period (FY 2015 – FY 2020). This six year time frame was composed of Budget FY 2015 and the five projected years of FY 2016 – FY 2020. Reviewing a multi-year time period is recommended since it attempts to identify any major expenses that may be on the horizon. By anticipating future financial requirements, the City can begin planning for these changes sooner, thereby minimizing short-term rate impacts and overall long-term rates. The second step in determining the revenue requirement was to decide on the basis of accumulating costs. In this particular case, for the revenue requirement analysis a “cash basis” approach was utilized. The “cash basis” approach is the most commonly used methodology by
3. Development of the Potable Water Rate Study
Development of the Potable Water Rate Study 23 City of Pleasanton – Comprehensive Water Rate Study
“ . . . the State of California has recently implemented
additional required conservation savings for
2015 which will impact the level of consumption and
resulting consumption based revenues.”
municipal utilities to set their revenue requirement. This is also the methodology that the City has historically used to establish their potable water revenue requirements. Table 3-1 provides a summary of the “cash basis” approach and cost components used to develop the City’s potable water revenue requirement.
Table 3–1 Overview of the City’s “Cash Basis” Revenue Requirements
+ Water Operation and Maintenance Expenses
+ Transfers to R&R Fund (Rate Funded Capital) + Debt Service (P + I) – Existing and Future ± Change in Working Capital . = Total Potable Water Revenue Requirement
Miscellaneous Revenues . = Net Revenue Requirement (Balance Required from Potable Rates)
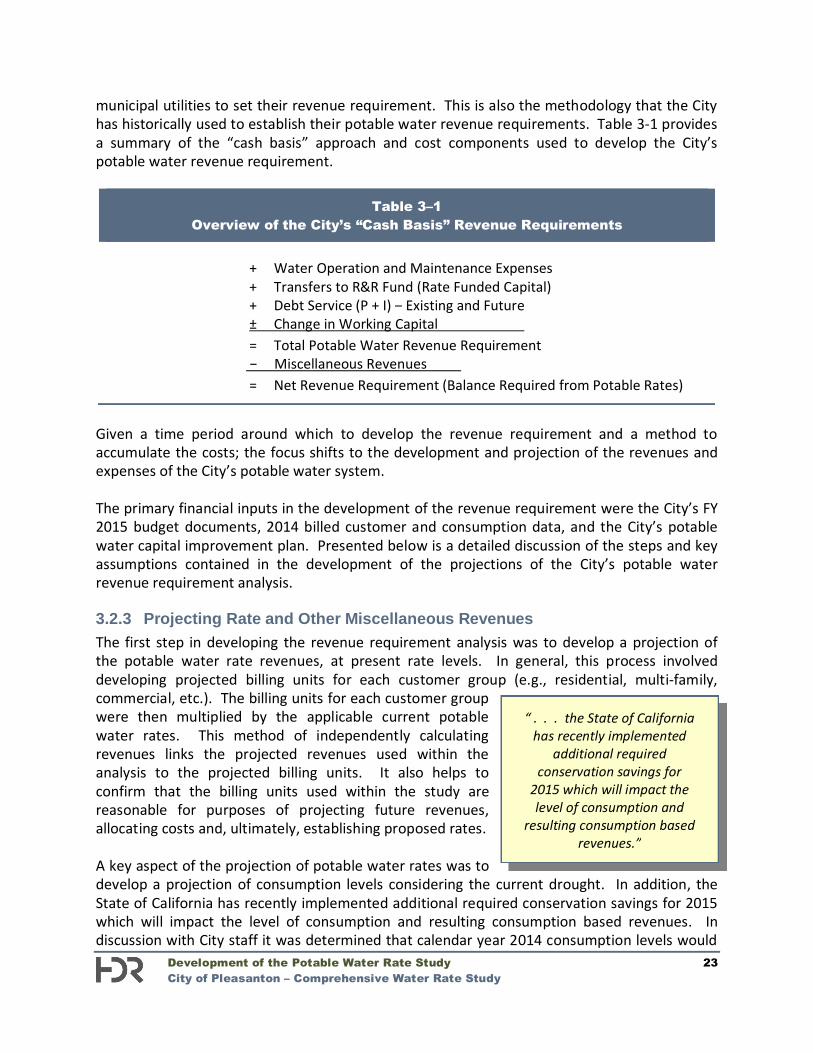
Given a time period around which to develop the revenue requirement and a method to accumulate the costs; the focus shifts to the development and projection of the revenues and expenses of the City’s potable water system. The primary financial inputs in the development of the revenue requirement were the City’s FY 2015 budget documents, 2014 billed customer and consumption data, and the City’s potable water capital improvement plan. Presented below is a detailed discussion of the steps and key assumptions contained in the development of the projections of the City’s potable water revenue requirement analysis. 3.2.3 Projecting Rate and Other Miscellaneous Revenues The first step in developing the revenue requirement analysis was to develop a projection of the potable water rate revenues, at present rate levels. In general, this process involved developing projected billing units for each customer group (e.g., residential, multi-family, commercial, etc.). The billing units for each customer group were then multiplied by the applicable current potable water rates. This method of independently calculating revenues links the projected revenues used within the analysis to the projected billing units. It also helps to confirm that the billing units used within the study are reasonable for purposes of projecting future revenues, allocating costs and, ultimately, establishing proposed rates. A key aspect of the projection of potable water rates was to develop a projection of consumption levels considering the current drought. In addition, the State of California has recently implemented additional required conservation savings for 2015 which will impact the level of consumption and resulting consumption based revenues. In discussion with City staff it was determined that calendar year 2014 consumption levels would
Development of the Potable Water Rate Study 24 City of Pleasanton – Comprehensive Water Rate Study
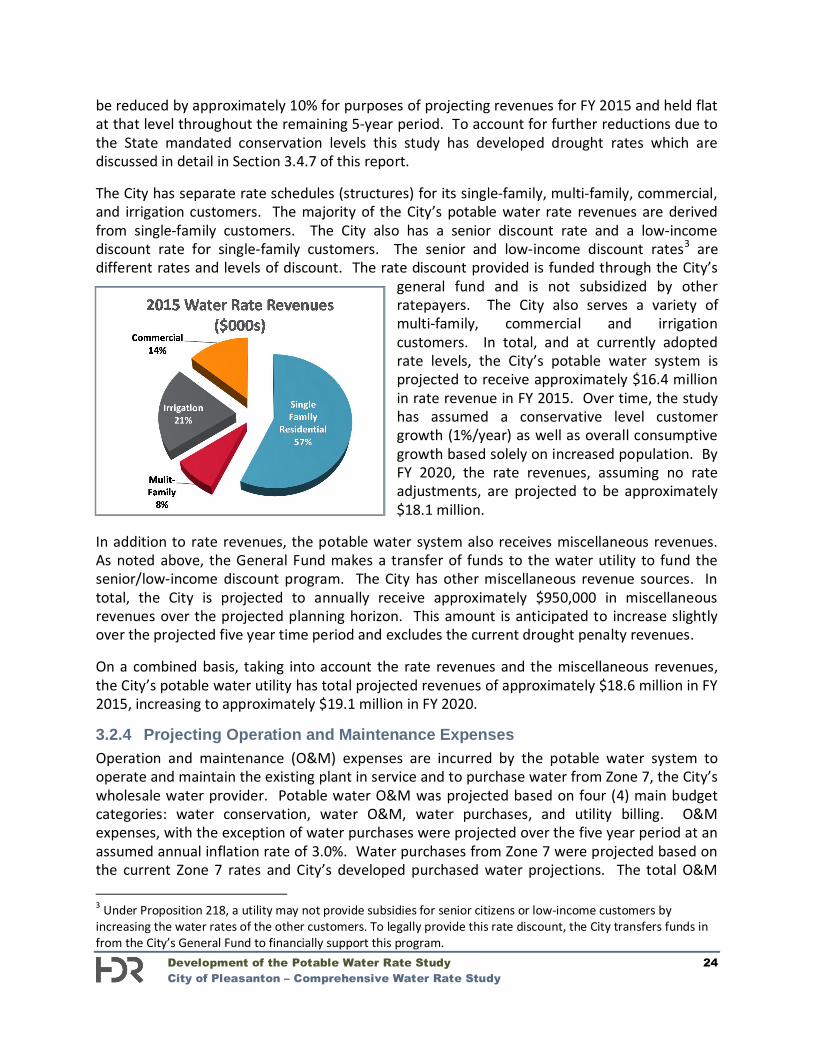
be reduced by approximately 10% for purposes of projecting revenues for FY 2015 and held flat at that level throughout the remaining 5-year period. To account for further reductions due to the State mandated conservation levels this study has developed drought rates which are discussed in detail in Section 3.4.7 of this report. The City has separate rate schedules (structures) for its single-family, multi-family, commercial, and irrigation customers. The majority of the City’s potable water rate revenues are derived from single-family customers. The City also has a senior discount rate and a low-income discount rate for single-family customers. The senior and low-income discount rates3 are different rates and levels of discount. The rate discount provided is funded through the City’s
general fund and is not subsidized by other ratepayers. The City also serves a variety of multi-family, commercial and irrigation customers. In total, and at currently adopted rate levels, the City’s potable water system is projected to receive approximately $16.4 million in rate revenue in FY 2015. Over time, the study has assumed a conservative level customer growth (1%/year) as well as overall consumptive growth based solely on increased population. By FY 2020, the rate revenues, assuming no rate adjustments, are projected to be approximately $18.1 million.
In addition to rate revenues, the potable water system also receives miscellaneous revenues. As noted above, the General Fund makes a transfer of funds to the water utility to fund the senior/low-income discount program. The City has other miscellaneous revenue sources. In total, the City is projected to annually receive approximately $950,000 in miscellaneous revenues over the projected planning horizon. This amount is anticipated to increase slightly over the projected five year time period and excludes the current drought penalty revenues. On a combined basis, taking into account the rate revenues and the miscellaneous revenues, the City’s potable water utility has total projected revenues of approximately $18.6 million in FY 2015, increasing to approximately $19.1 million in FY 2020. 3.2.4 Projecting Operation and Maintenance Expenses Operation and maintenance (O&M) expenses are incurred by the potable water system to operate and maintain the existing plant in service and to purchase water from Zone 7, the City’s wholesale water provider. Potable water O&M was projected based on four (4) main budget categories: water conservation, water O&M, water purchases, and utility billing. O&M expenses, with the exception of water purchases were projected over the five year period at an assumed annual inflation rate of 3.0%. Water purchases from Zone 7 were projected based on the current Zone 7 rates and City’s developed purchased water projections. The total O&M 3 Under Proposition 218, a utility may not provide subsidies for senior citizens or low-income customers by increasing the water rates of the other customers. To legally provide this rate discount, the City transfers funds in from the City’s General Fund to financially support this program.
Development of the Potable Water Rate Study 25 City of Pleasanton – Comprehensive Water Rate Study
expenses for the potable water system are approximately $15.7 million based on the FY 2015 budget. O&M expenses comprise approximately 85% of the total expenses incurred by the City. The cost of water from Zone 7 accounts for roughly half of the total costs associated with the City’s water utility. Over the five year planning horizon, the total O&M expenses are projected to increase to approximately $18.6 million by FY 2020 based on assumed inflationary impacts and increases in Zone 7 water purchases. It should be noted that the analysis used the current Zone 7 rate ($2.40) and does not include any future wholesale potable water rate increases from Zone 7. Any wholesale water rate increase from Zone 7 will be passed through to the City’s customers when adopted by Zone 7. 3.2.5 Projecting Capital Funding Needs and Transfer Payments A key component in the development of the water revenue requirement was properly and adequately funding capital improvement needs. One of the major issues facing many utilities across the U.S. is the amount of deferred capital projects and the funding pressure from growth/expansion-related improvements. The proper and adequate funding of capital projects is an important issue for all water utilities and is not just a local issue/concern of the City. In general, there are three types of capital projects that a utility may need to fund. These include the following types:
Renewal and replacement projects Growth/capacity expansion projects Regulatory-related projects
A renewal and replacement project is essentially maintaining the existing system that is in place today. As the existing plant becomes worn out, obsolete, etc. the utility should be making continuous investments to maintain the integrity of the facilities. In contrast to this, a utility may make capital investments to expand the capacity of facilities to accommodate future capacity needs (customers). Finally, certain projects may be a function of a regulatory requirement in which the Federal or State government mandates the need for an improvement to the system to meet a regulatory standard. Understanding these different types of capital projects is important because it may help to explain why costs are increasing and the cost drivers for any needed rate adjustment. In addition, and more importantly, the way in which projects are funded may vary by the type of capital project. For example, renewal and replacement projects may be paid for via rates and funded on a “pay-as-you-go basis”. In contrast to this, growth or capacity expansion projects may be funded via the collection of development or water connection fees (i.e. growth-related charges) in which new development pays a proportional and equitable share of the cost of their connection (impact). Finally, regulatory projects may be funded by a variety of different means, which may include rates, long-term debt, grants, etc. While the above discussion appears to neatly divide capital projects into three clearly defined categories, the reality of working with specific capital projects may be more complex. For example, a pump may be replaced, but while being replaced, it is up-sized to accommodate greater capacity. There are many projects that share these “joint” characteristics. At the same time, projects may not be “replacement” related, but rather “improvement” related.
Development of the Potable Water Rate Study 26 City of Pleasanton – Comprehensive Water Rate Study
For purposes of reviewing the capital project funding, City has segregated their capital plan into two components:
Water Replacement Fund Water Expansion Fund
Each of these types of capital projects (funds) are discussed in more detail below.
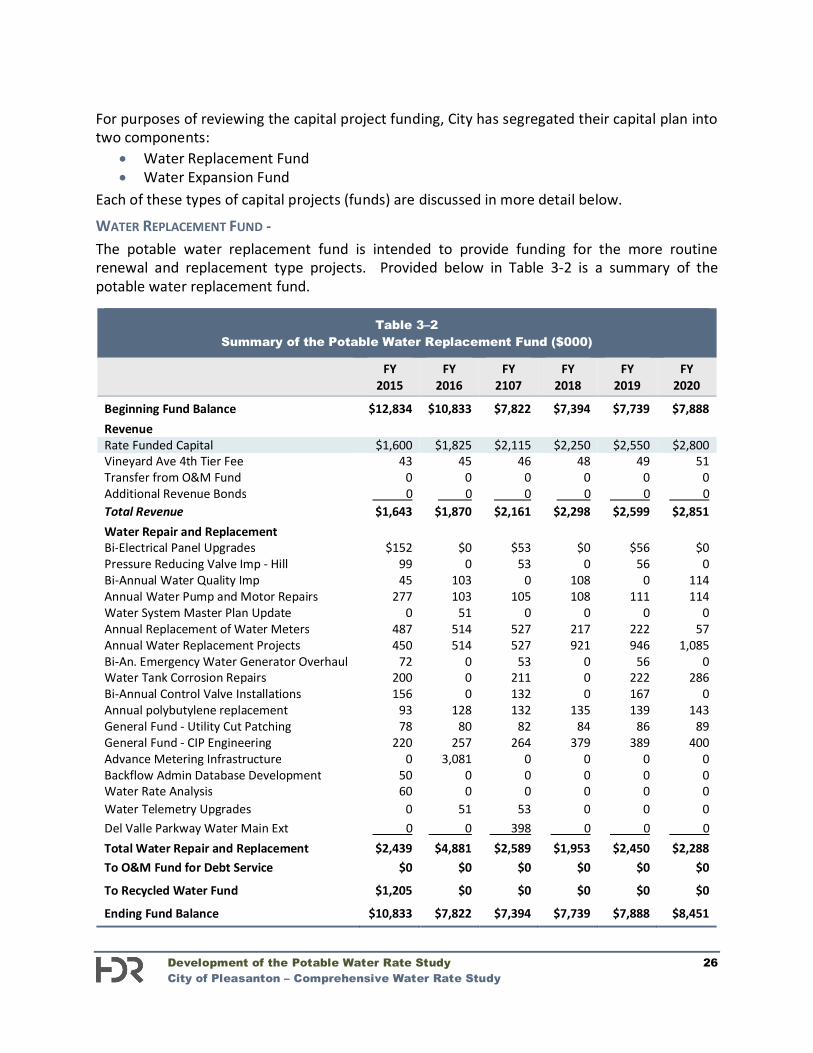
WATER REPLACEMENT FUND - The potable water replacement fund is intended to provide funding for the more routine renewal and replacement type projects. Provided below in Table 3-2 is a summary of the potable water replacement fund.
Table 3–2 Summary of the Potable Water Replacement Fund ($000)
FY 2015
FY 2016
FY 2107
FY 2018
FY 2019
FY 2020
Beginning Fund Balance $12,834 $10,833 $7,822 $7,394 $7,739 $7,888 Revenue Rate Funded Capital $1,600 $1,825 $2,115 $2,250 $2,550 $2,800 Vineyard Ave 4th Tier Fee 43 45 46 48 49 51 Transfer from O&M Fund 0 0 0 0 0 0 Additional Revenue Bonds 0 0 0 0 0 0 Total Revenue $1,643 $1,870 $2,161 $2,298 $2,599 $2,851 Water Repair and Replacement Bi-Electrical Panel Upgrades $152 $0 $53 $0 $56 $0 Pressure Reducing Valve Imp - Hill 99 0 53 0 56 0 Bi-Annual Water Quality Imp 45 103 0 108 0 114 Annual Water Pump and Motor Repairs 277 103 105 108 111 114 Water System Master Plan Update 0 51 0 0 0 0 Annual Replacement of Water Meters 487 514 527 217 222 57 Annual Water Replacement Projects 450 514 527 921 946 1,085 Bi-An. Emergency Water Generator Overhaul 72 0 53 0 56 0 Water Tank Corrosion Repairs 200 0 211 0 222 286 Bi-Annual Control Valve Installations 156 0 132 0 167 0 Annual polybutylene replacement 93 128 132 135 139 143 General Fund - Utility Cut Patching 78 80 82 84 86 89 General Fund - CIP Engineering 220 257 264 379 389 400 Advance Metering Infrastructure 0 3,081 0 0 0 0 Backflow Admin Database Development 50 0 0 0 0 0 Water Rate Analysis 60 0 0 0 0 0 Water Telemetry Upgrades 0 51 53 0 0 0 Del Valle Parkway Water Main Ext 0 0 398 0 0 0 Total Water Repair and Replacement $2,439 $4,881 $2,589 $1,953 $2,450 $2,288 To O&M Fund for Debt Service $0 $0 $0 $0 $0 $0
To Recycled Water Fund $1,205 $0 $0 $0 $0 $0
Ending Fund Balance $10,833 $7,822 $7,394 $7,739 $7,888 $8,451
Development of the Potable Water Rate Study 27 City of Pleasanton – Comprehensive Water Rate Study
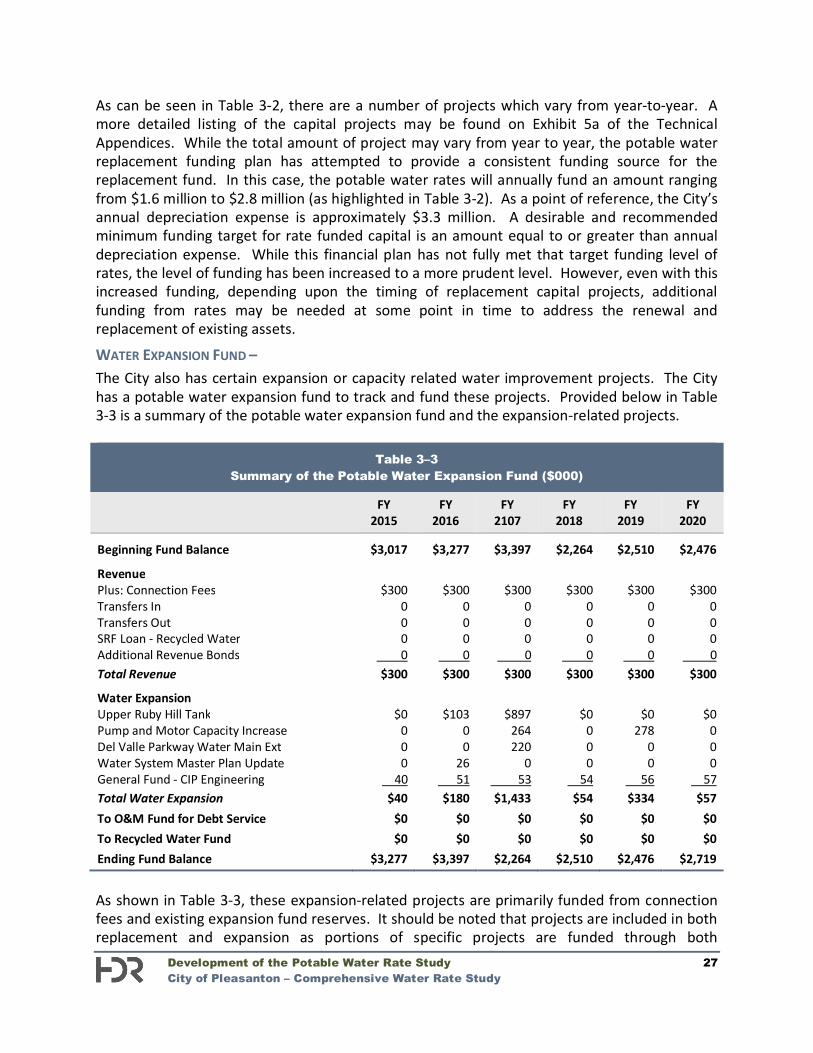
As can be seen in Table 3-2, there are a number of projects which vary from year-to-year. A more detailed listing of the capital projects may be found on Exhibit 5a of the Technical Appendices. While the total amount of project may vary from year to year, the potable water replacement funding plan has attempted to provide a consistent funding source for the replacement fund. In this case, the potable water rates will annually fund an amount ranging from $1.6 million to $2.8 million (as highlighted in Table 3-2). As a point of reference, the City’s annual depreciation expense is approximately $3.3 million. A desirable and recommended minimum funding target for rate funded capital is an amount equal to or greater than annual depreciation expense. While this financial plan has not fully met that target funding level of rates, the level of funding has been increased to a more prudent level. However, even with this increased funding, depending upon the timing of replacement capital projects, additional funding from rates may be needed at some point in time to address the renewal and replacement of existing assets.
WATER EXPANSION FUND – The City also has certain expansion or capacity related water improvement projects. The City has a potable water expansion fund to track and fund these projects. Provided below in Table 3-3 is a summary of the potable water expansion fund and the expansion-related projects.
Table 3–3 Summary of the Potable Water Expansion Fund ($000)
FY 2015
FY 2016
FY 2107
FY 2018
FY 2019
FY 2020
Beginning Fund Balance $3,017 $3,277 $3,397 $2,264 $2,510 $2,476
Revenue Plus: Connection Fees $300 $300 $300 $300 $300 $300 Transfers In 0 0 0 0 0 0 Transfers Out 0 0 0 0 0 0 SRF Loan - Recycled Water 0 0 0 0 0 0 Additional Revenue Bonds 0 0 0 0 0 0 Total Revenue $300 $300 $300 $300 $300 $300
Water Expansion Upper Ruby Hill Tank $0 $103 $897 $0 $0 $0 Pump and Motor Capacity Increase 0 0 264 0 278 0 Del Valle Parkway Water Main Ext 0 0 220 0 0 0 Water System Master Plan Update 0 26 0 0 0 0 General Fund - CIP Engineering 40 51 53 54 56 57 Total Water Expansion $40 $180 $1,433 $54 $334 $57 To O&M Fund for Debt Service $0 $0 $0 $0 $0 $0 To Recycled Water Fund $0 $0 $0 $0 $0 $0 Ending Fund Balance $3,277 $3,397 $2,264 $2,510 $2,476 $2,719
As shown in Table 3-3, these expansion-related projects are primarily funded from connection fees and existing expansion fund reserves. It should be noted that projects are included in both replacement and expansion as portions of specific projects are funded through both
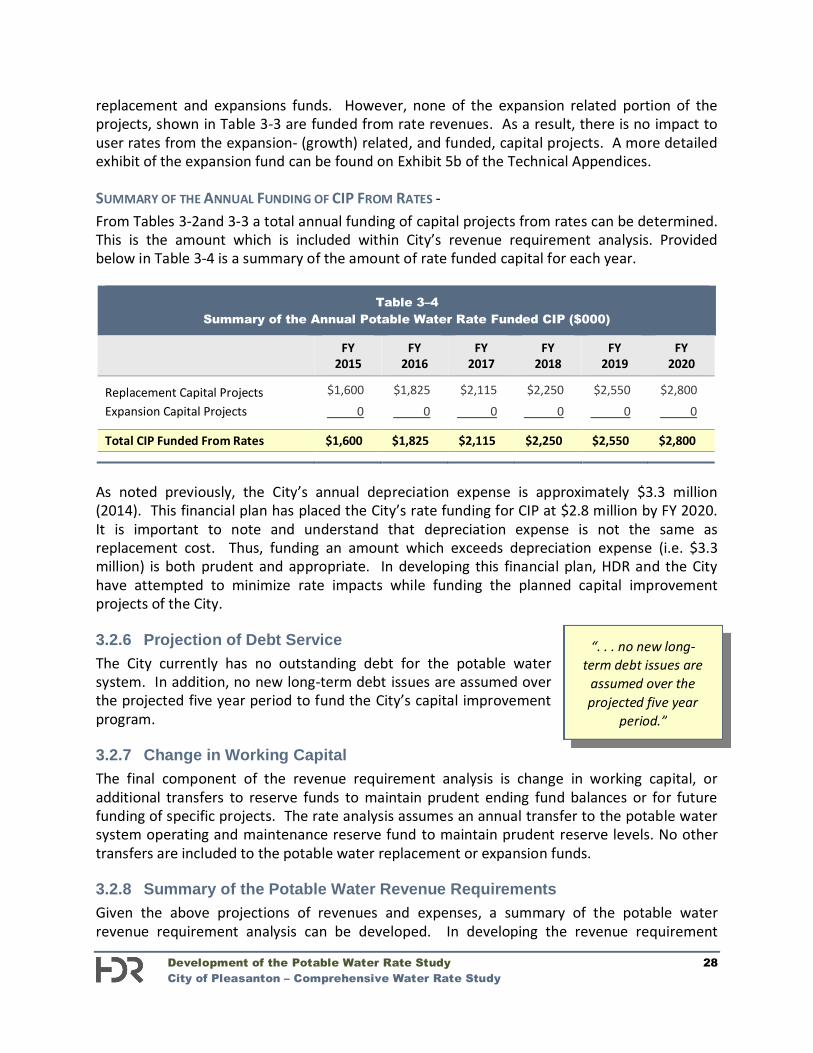
Development of the Potable Water Rate Study 28 City of Pleasanton – Comprehensive Water Rate Study
“. . . no new long-term debt issues are
assumed over the projected five year
period.”
replacement and expansions funds. However, none of the expansion related portion of the projects, shown in Table 3-3 are funded from rate revenues. As a result, there is no impact to user rates from the expansion- (growth) related, and funded, capital projects. A more detailed exhibit of the expansion fund can be found on Exhibit 5b of the Technical Appendices. SUMMARY OF THE ANNUAL FUNDING OF CIP FROM RATES - From Tables 3-2and 3-3 a total annual funding of capital projects from rates can be determined. This is the amount which is included within City’s revenue requirement analysis. Provided below in Table 3-4 is a summary of the amount of rate funded capital for each year.
Table 3–4 Summary of the Annual Potable Water Rate Funded CIP ($000)
FY 2015
FY 2016
FY 2017
FY 2018
FY 2019
FY 2020
Replacement Capital Projects $1,600 $1,825 $2,115 $2,250 $2,550 $2,800
Expansion Capital Projects 0 0 0 0 0 0
Total CIP Funded From Rates $1,600 $1,825 $2,115 $2,250 $2,550 $2,800
As noted previously, the City’s annual depreciation expense is approximately $3.3 million (2014). This financial plan has placed the City’s rate funding for CIP at $2.8 million by FY 2020. It is important to note and understand that depreciation expense is not the same as replacement cost. Thus, funding an amount which exceeds depreciation expense (i.e. $3.3 million) is both prudent and appropriate. In developing this financial plan, HDR and the City have attempted to minimize rate impacts while funding the planned capital improvement projects of the City. 3.2.6 Projection of Debt Service The City currently has no outstanding debt for the potable water system. In addition, no new long-term debt issues are assumed over the projected five year period to fund the City’s capital improvement program. 3.2.7 Change in Working Capital The final component of the revenue requirement analysis is change in working capital, or additional transfers to reserve funds to maintain prudent ending fund balances or for future funding of specific projects. The rate analysis assumes an annual transfer to the potable water system operating and maintenance reserve fund to maintain prudent reserve levels. No other transfers are included to the potable water replacement or expansion funds. 3.2.8 Summary of the Potable Water Revenue Requirements Given the above projections of revenues and expenses, a summary of the potable water revenue requirement analysis can be developed. In developing the revenue requirement
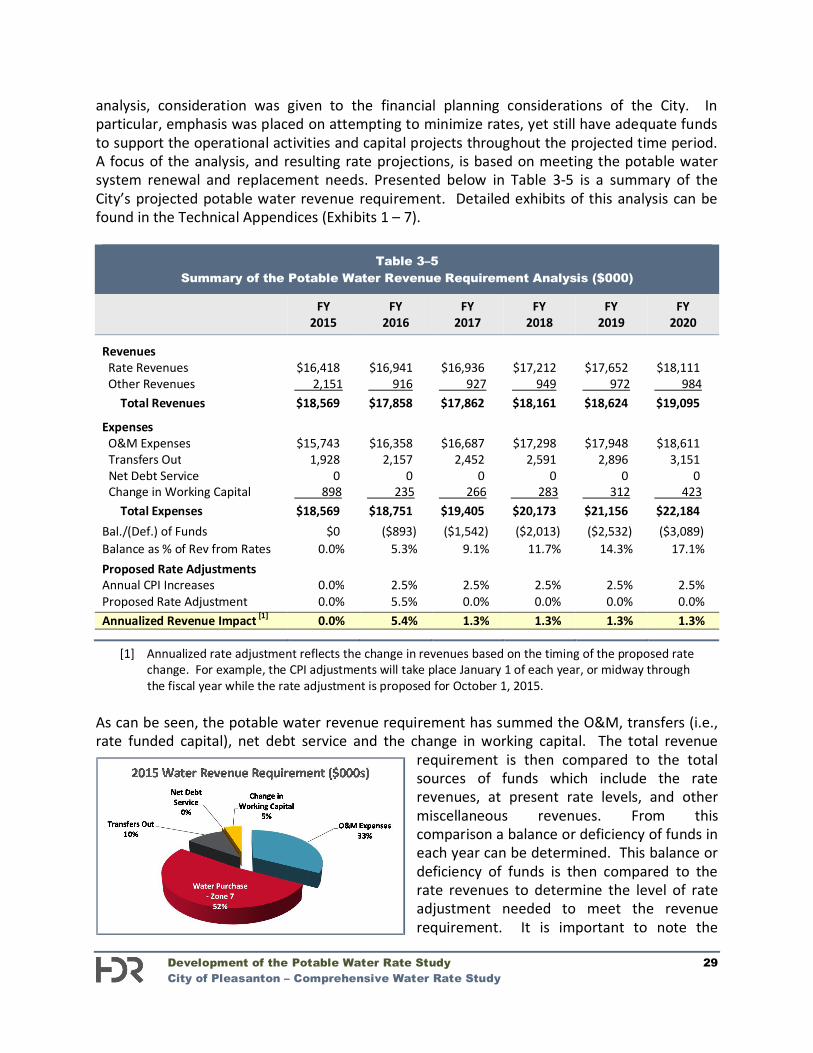
Development of the Potable Water Rate Study 29 City of Pleasanton – Comprehensive Water Rate Study
analysis, consideration was given to the financial planning considerations of the City. In particular, emphasis was placed on attempting to minimize rates, yet still have adequate funds to support the operational activities and capital projects throughout the projected time period. A focus of the analysis, and resulting rate projections, is based on meeting the potable water system renewal and replacement needs. Presented below in Table 3-5 is a summary of the City’s projected potable water revenue requirement. Detailed exhibits of this analysis can be found in the Technical Appendices (Exhibits 1 – 7).
Table 3–5 Summary of the Potable Water Revenue Requirement Analysis ($000)
FY 2015
FY 2016
FY 2017
FY 2018
FY 2019
FY 2020
Revenues Rate Revenues $16,418 $16,941 $16,936 $17,212 $17,652 $18,111 Other Revenues 2,151 916 927 949 972 984 Total Revenues $18,569 $17,858 $17,862 $18,161 $18,624 $19,095
Expenses O&M Expenses $15,743 $16,358 $16,687 $17,298 $17,948 $18,611 Transfers Out 1,928 2,157 2,452 2,591 2,896 3,151 Net Debt Service 0 0 0 0 0 0 Change in Working Capital 898 235 266 283 312 423 Total Expenses $18,569 $18,751 $19,405 $20,173 $21,156 $22,184 Bal./(Def.) of Funds $0 ($893) ($1,542) ($2,013) ($2,532) ($3,089) Balance as % of Rev from Rates 0.0% 5.3% 9.1% 11.7% 14.3% 17.1% Proposed Rate Adjustments Annual CPI Increases 0.0% 2.5% 2.5% 2.5% 2.5% 2.5% Proposed Rate Adjustment 0.0% 5.5% 0.0% 0.0% 0.0% 0.0% Annualized Revenue Impact [1] 0.0% 5.4% 1.3% 1.3% 1.3% 1.3%
[1] Annualized rate adjustment reflects the change in revenues based on the timing of the proposed rate change. For example, the CPI adjustments will take place January 1 of each year, or midway through the fiscal year while the rate adjustment is proposed for October 1, 2015.
As can be seen, the potable water revenue requirement has summed the O&M, transfers (i.e., rate funded capital), net debt service and the change in working capital. The total revenue
requirement is then compared to the total sources of funds which include the rate revenues, at present rate levels, and other miscellaneous revenues. From this comparison a balance or deficiency of funds in each year can be determined. This balance or deficiency of funds is then compared to the rate revenues to determine the level of rate adjustment needed to meet the revenue requirement. It is important to note the
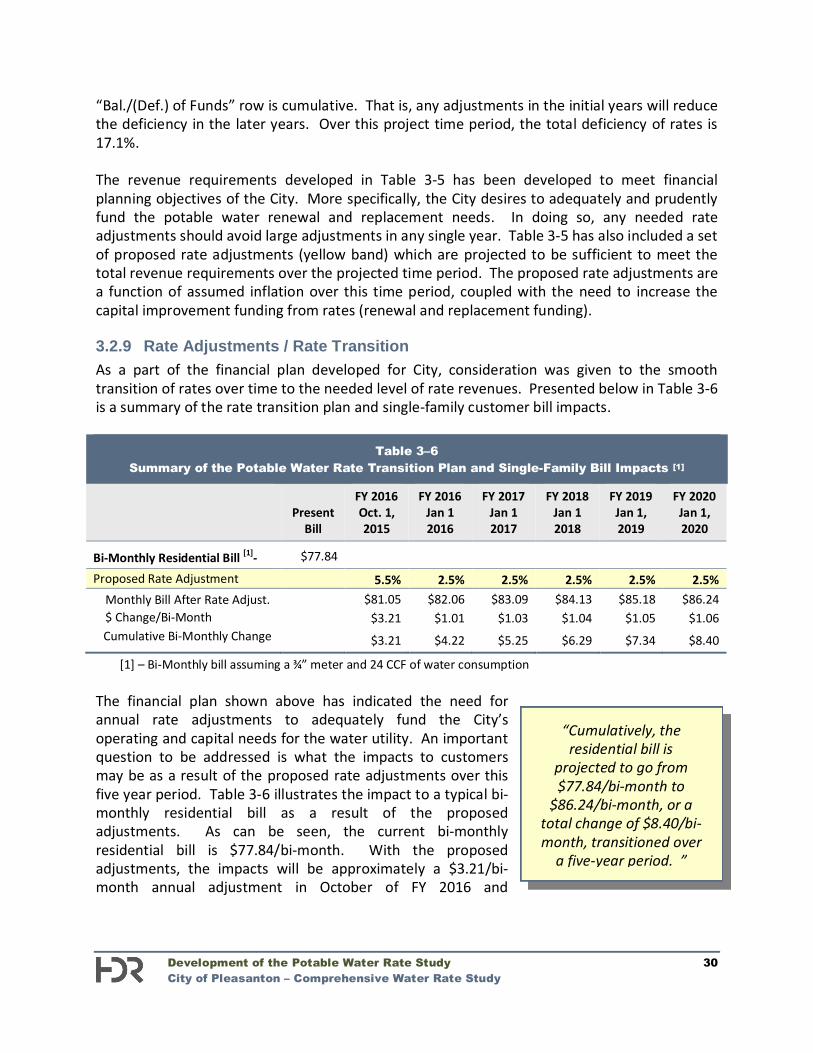
Development of the Potable Water Rate Study 30 City of Pleasanton – Comprehensive Water Rate Study
“Cumulatively, the residential bill is
projected to go from $77.84/bi-month to
$86.24/bi-month, or a total change of $8.40/bi-month, transitioned over
a five-year period. ”
“Bal./(Def.) of Funds” row is cumulative. That is, any adjustments in the initial years will reduce the deficiency in the later years. Over this project time period, the total deficiency of rates is 17.1%. The revenue requirements developed in Table 3-5 has been developed to meet financial planning objectives of the City. More specifically, the City desires to adequately and prudently fund the potable water renewal and replacement needs. In doing so, any needed rate adjustments should avoid large adjustments in any single year. Table 3-5 has also included a set of proposed rate adjustments (yellow band) which are projected to be sufficient to meet the total revenue requirements over the projected time period. The proposed rate adjustments are a function of assumed inflation over this time period, coupled with the need to increase the capital improvement funding from rates (renewal and replacement funding). 3.2.9 Rate Adjustments / Rate Transition As a part of the financial plan developed for City, consideration was given to the smooth transition of rates over time to the needed level of rate revenues. Presented below in Table 3-6 is a summary of the rate transition plan and single-family customer bill impacts.
Table 3–6 Summary of the Potable Water Rate Transition Plan and Single-Family Bill Impacts [1]
Present
Bill
FY 2016 Oct. 1, 2015
FY 2016 Jan 1 2016
FY 2017 Jan 1 2017
FY 2018 Jan 1 2018
FY 2019 Jan 1, 2019
FY 2020 Jan 1, 2020
Bi-Monthly Residential Bill [1]- $77.84
Proposed Rate Adjustment 5.5% 2.5% 2.5% 2.5% 2.5% 2.5% Monthly Bill After Rate Adjust. $81.05 $82.06 $83.09 $84.13 $85.18 $86.24 $ Change/Bi-Month $3.21 $1.01 $1.03 $1.04 $1.05 $1.06 Cumulative Bi-Monthly Change $3.21 $4.22 $5.25 $6.29 $7.34 $8.40
[1] – Bi-Monthly bill assuming a ¾” meter and 24 CCF of water consumption The financial plan shown above has indicated the need for annual rate adjustments to adequately fund the City’s operating and capital needs for the water utility. An important question to be addressed is what the impacts to customers may be as a result of the proposed rate adjustments over this five year period. Table 3-6 illustrates the impact to a typical bi-monthly residential bill as a result of the proposed adjustments. As can be seen, the current bi-monthly residential bill is $77.84/bi-month. With the proposed adjustments, the impacts will be approximately a $3.21/bi-month annual adjustment in October of FY 2016 and
Development of the Potable Water Rate Study 31 City of Pleasanton – Comprehensive Water Rate Study
approximately $1.00/bi-month with following year’s proposed adjustments. Cumulatively, over the five year period the residential bill is projected to go from $77.84/bi-month to $86.24/bi-month, or a total change of $8.40/bi-monthly, transitioned over a five-year period. 3.2.10 Consultant’s Conclusions Based on the revenue requirement analysis developed herein, HDR has concluded that the City will need to adjust their potable water rates over the next five years (FY 2016 – FY 2020). HDR has reached this conclusion for the following reasons:
Rate adjustments are necessary to increase the rate funding the City’s capital improvement needs, of which a large portion is driven by the need to adequately fund renewal and replacement projects.
Rates adjustments reflect the declining consumption due to overall per capita reductions due to low flow appurtenances as well as impacts of the drought.
Rate adjustments are necessary to fund the City’s replacement capital projects on a “pay-as-you-go” basis and avoid the need for the issuance of any long-term debt.
The proposed rate adjustments maintain the City’s strong financial health and provide long-term sustainable funding levels for the City.
In reaching this conclusion, HDR would recommend that the City adopt the proposed rates through FY 2020 in order to provide surety as to the availability of funding for the capital improvement program. 3.3 Development of the Potable Water Cost of Service Analysis In the previous section, the revenue requirement analysis focused on the total sources and application of funds required to adequately fund the City’s potable water system. This section will provide an overview of the potable water cost of service analysis developed for the City. A cost of service analysis is concerned with the equitable allocation of the total revenue requirement between the various customer classes of service (e.g., residential and commercial). The previously developed potable water revenue requirement was utilized in the development of the cost of service analysis. 3.3.1 Objectives of a Cost of Service Study There are two primary objectives in conducting a water cost of service analysis:
Allocate the City’s potable water revenue requirement among the customer classes of service, and
Derive average unit costs for subsequent rate designs
The objectives of the cost of service analysis are different from determining a revenue requirement. As noted in the previous section, a revenue requirement analysis determines the utility’s overall financial needs, while the cost of service analysis determines the fair and equitable manner to collect the revenue requirement.
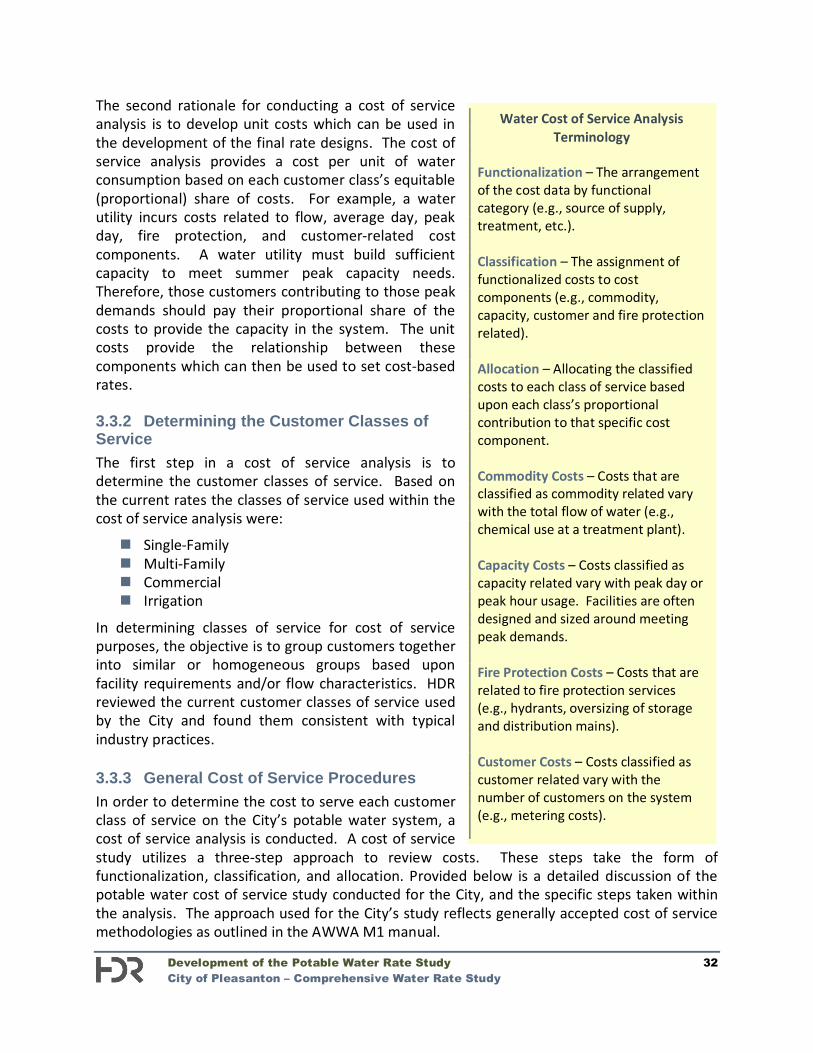
Development of the Potable Water Rate Study 32 City of Pleasanton – Comprehensive Water Rate Study
Water Cost of Service Analysis Terminology
Functionalization – The arrangement of the cost data by functional category (e.g., source of supply, treatment, etc.). Classification – The assignment of functionalized costs to cost components (e.g., commodity, capacity, customer and fire protection related). Allocation – Allocating the classified costs to each class of service based upon each class’s proportional contribution to that specific cost component. Commodity Costs – Costs that are classified as commodity related vary with the total flow of water (e.g., chemical use at a treatment plant). Capacity Costs – Costs classified as capacity related vary with peak day or peak hour usage. Facilities are often designed and sized around meeting peak demands. Fire Protection Costs – Costs that are related to fire protection services (e.g., hydrants, oversizing of storage and distribution mains). Customer Costs – Costs classified as customer related vary with the number of customers on the system (e.g., metering costs).
The second rationale for conducting a cost of service analysis is to develop unit costs which can be used in the development of the final rate designs. The cost of service analysis provides a cost per unit of water consumption based on each customer class’s equitable (proportional) share of costs. For example, a water utility incurs costs related to flow, average day, peak day, fire protection, and customer-related cost components. A water utility must build sufficient capacity to meet summer peak capacity needs. Therefore, those customers contributing to those peak demands should pay their proportional share of the costs to provide the capacity in the system. The unit costs provide the relationship between these components which can then be used to set cost-based rates. 3.3.2 Determining the Customer Classes of Service The first step in a cost of service analysis is to determine the customer classes of service. Based on the current rates the classes of service used within the cost of service analysis were:
Single-Family Multi-Family Commercial Irrigation
In determining classes of service for cost of service purposes, the objective is to group customers together into similar or homogeneous groups based upon facility requirements and/or flow characteristics. HDR reviewed the current customer classes of service used by the City and found them consistent with typical industry practices. 3.3.3 General Cost of Service Procedures In order to determine the cost to serve each customer class of service on the City’s potable water system, a cost of service analysis is conducted. A cost of service study utilizes a three-step approach to review costs. These steps take the form of functionalization, classification, and allocation. Provided below is a detailed discussion of the potable water cost of service study conducted for the City, and the specific steps taken within the analysis. The approach used for the City’s study reflects generally accepted cost of service methodologies as outlined in the AWWA M1 manual.
Development of the Potable Water Rate Study 33 City of Pleasanton – Comprehensive Water Rate Study
Functionalization of Costs The first analytical step in the cost of service process is called functionalization. Functionalization is the arrangement of expenses and asset (plant) data by major operating functions (e.g., transmission, storage, distribution). Within this study, there was a limited amount of functionalization of the cost data since it was largely accomplished within the City’s system of accounts. Classification of Costs The second analytical task performed in a water cost of service study is the classification of the costs. Classification examines why the expenses were incurred or what type of need is being met. The following cost classifiers were used to develop the potable water cost of service analysis:
Commodity Related Costs: Commodity costs are those costs which tend to vary with the total quantity of water consumed by a customer. Commodity costs are those incurred under average load (demand) conditions and are generally specified for a period of time such as a month or year. Chemicals or utilities (electricity) are examples of commodity-related cost as these costs tend to vary based upon the total flow of water.
Capacity Related Costs: Capacity costs are those which vary with peak demand, or the maximum rates of flow to customers. System capacity is required when there are large demands for water placed upon the system (e.g., summer lawn watering). For water utilities, capacity related costs are generally related to the sizing of facilities needed to meet a customer’s maximum water demand at any point in time. For example, portions of distribution storage reservoirs and mains (pipes) must be adequately sized for this particular type of requirement.
Customer Related Costs: Customer costs are those cost which vary with the number of customers on the water system. They do not vary with system output or consumption levels. These costs are also sometimes referred to as readiness to serve or availability costs. Customer costs may also sometimes be further classified as either actual or weighted. Actual customer costs vary proportionally, from customer to customer, with the addition or deletion of a customer regardless of the size of the customer. An example of an actual customer cost is postage for mailing bills. This cost does not vary from customer to customer, regardless of the size or consumption characteristics of the customer. In contrast, a weighted customer cost reflects a disproportionate cost, from customer to customer, with the addition or deletion of a customer. Examples of weighted customer costs are items such as meter maintenance expenses, where a large industrial customer requires a significantly more expensive meter than a typical residential customer.
Fire Protection Related Costs: Fire protection costs are those costs related to the public fire protection functions. Usually, such costs are those related to public fire hydrants and the over-sizing of mains and distribution storage reservoirs for fire protection purposes
Revenue Related Costs: Some costs associated with the utility may vary with the amount of revenue received by the utility. An example of a revenue related cost would be a utility tax which is based on gross utility revenue.
Development of the Potable Water Rate Study 34 City of Pleasanton – Comprehensive Water Rate Study
Development of Allocation Factors Once the classification process is complete, and the customer groups have been defined, the various classified costs were allocated to each customer group. The City’s potable water classified costs were allocated to the various customer groups using the following allocation factors.
Commodity Allocation Factor: As noted earlier, commodity-related costs vary with the total flow of water. Therefore, the commodity allocation factor was based on the projected total metered consumption plus losses for each class of service for the projected test period. As noted, the consumption reflects the impacts of the current drought, which can impact the results of the cost of service as it does not reflect ‘normal’ or typical consumption levels or patterns of use.
Capacity Allocation Factor: The capacity allocation factor was developed based on the assumed contribution to peak day use of each class. Peak day use by customer class of service was estimated using assumed peaking factors for each customer group. In this particular case, the peaking factor was defined as the relationship between peak day contribution and average day use and determined for each customer group based on a review of the average month to peak month usage. Given an estimated peaking factor, the peak day contribution for each class of service was developed. Similar to the commodity allocation factor the peaking data reflects the impacts of the drought and therefore will impact the results of the cost of service analysis as customers respond differently to the conservation goals and programs.
Customer Allocation Factor: Customer costs vary with the number of customers on the system. Two basic types of customer allocation factors were identified – actual and weighted. The allocation factors for actual customers were based on the projection of the number of customers developed within the revenue requirement. The weighted customer allocation factors is also broken down further into two factors which attempt to reflect the disproportionate costs associated with serving different types of customers. The first weighted customer factor is for customer service and accounting. This weighted customer allocation factor takes into account the fact that it may take more time to read a meter and process a bill for various customers. The second weighted customer allocation factor is for meters and services. This factor attempts to reflect the different costs associated with providing larger sized meters. For example, there is a significant cost difference associated with replacing a 3/4” meter compared to a six-inch meter. This cost difference is reflected within the allocation factor.
Public Fire Protection Allocation Factor: The development of the allocation factor for public fire protection expenses involved an analysis of each class of service and their fire flow requirements. The analysis took into account the gallon per minute fire flow requirements in the event of a fire, along with the duration of the required flow. The fire flow rates used within the allocation factor were based on industry standards and similar experiences with other water cost of service studies. The minimum fire flow requirements are then multiplied by the number of customers in each class of service, and the assumed duration of the fire, to determine the class’ prorated fire flow requirements.
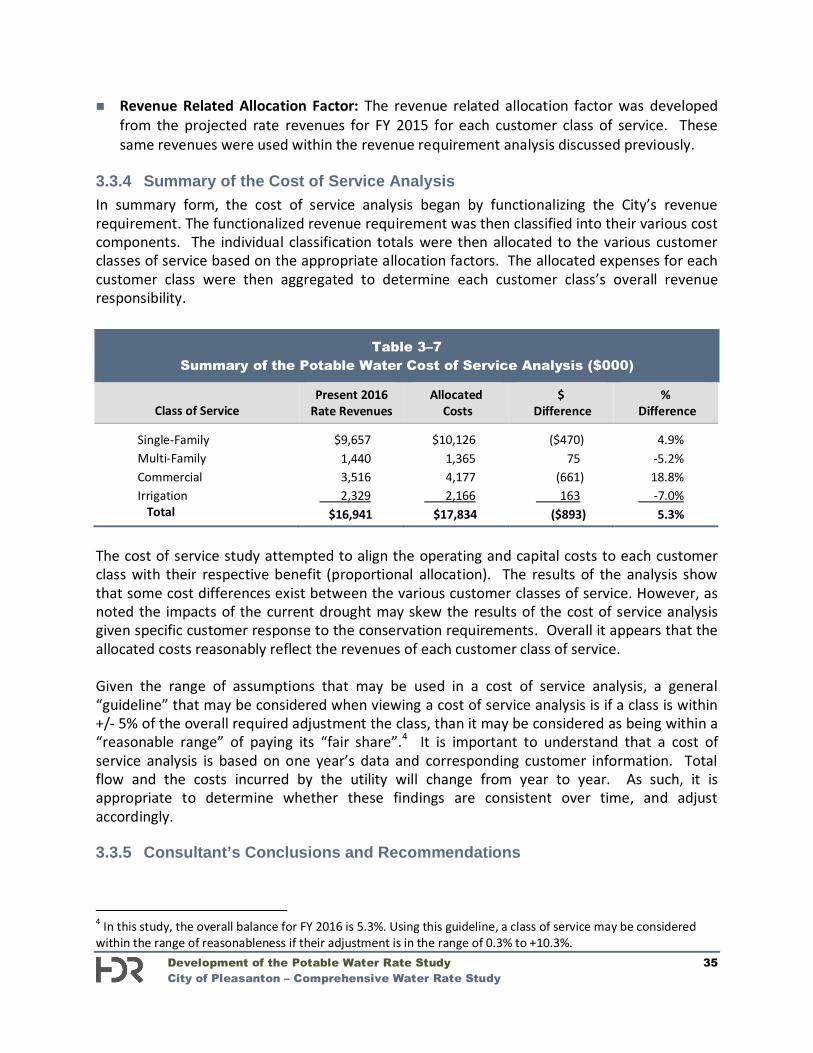
Development of the Potable Water Rate Study 35 City of Pleasanton – Comprehensive Water Rate Study
Revenue Related Allocation Factor: The revenue related allocation factor was developed from the projected rate revenues for FY 2015 for each customer class of service. These same revenues were used within the revenue requirement analysis discussed previously.
3.3.4 Summary of the Cost of Service Analysis In summary form, the cost of service analysis began by functionalizing the City’s revenue requirement. The functionalized revenue requirement was then classified into their various cost components. The individual classification totals were then allocated to the various customer classes of service based on the appropriate allocation factors. The allocated expenses for each customer class were then aggregated to determine each customer class’s overall revenue responsibility.
Table 3–7 Summary of the Potable Water Cost of Service Analysis ($000)
Class of Service Present 2016
Rate Revenues Allocated
Costs $
Difference %
Difference
Single-Family $9,657 $10,126 ($470) 4.9% Multi-Family 1,440 1,365 75 -5.2% Commercial 3,516 4,177 (661) 18.8% Irrigation 2,329 2,166 163 -7.0%
Total $16,941 $17,834 ($893) 5.3%
The cost of service study attempted to align the operating and capital costs to each customer class with their respective benefit (proportional allocation). The results of the analysis show that some cost differences exist between the various customer classes of service. However, as noted the impacts of the current drought may skew the results of the cost of service analysis given specific customer response to the conservation requirements. Overall it appears that the allocated costs reasonably reflect the revenues of each customer class of service. Given the range of assumptions that may be used in a cost of service analysis, a general “guideline” that may be considered when viewing a cost of service analysis is if a class is within +/- 5% of the overall required adjustment the class, than it may be considered as being within a “reasonable range” of paying its “fair share”.4 It is important to understand that a cost of service analysis is based on one year’s data and corresponding customer information. Total flow and the costs incurred by the utility will change from year to year. As such, it is appropriate to determine whether these findings are consistent over time, and adjust accordingly. 3.3.5 Consultant’s Conclusions and Recommendations
4 In this study, the overall balance for FY 2016 is 5.3%. Using this guideline, a class of service may be considered within the range of reasonableness if their adjustment is in the range of 0.3% to +10.3%.
Development of the Potable Water Rate Study 36 City of Pleasanton – Comprehensive Water Rate Study
While some cost differences exist, the overall allocation of costs between customers appears to be reasonable. In reaching this conclusion, one of variables which may impact cost allocations is the trend of declining per capita consumption for residential customers, along with the current drought conditions within California and specifically the Bay Area. These conditions certainly have an impact upon consumptive use and cost allocations. Given the changing usage patterns and current drought, HDR believes the focus of this study should be on the overall rate adjustment needs based on the City’s need to fund capital improvement projects over the next five year period. As the City continues to monitor rates and cost of service results through future studies, cost of service adjustments may be made since the results are significantly driven by consumptive use and usage demands. Given the current drought conditions, the consumptive use and usage demands during this time period may not be reflective of normal water conditions. Given that, HDR concluded that no adjustments in the cost relationships between the customer classes of service should be recommended at this time. As a result, the overall proposed revenue/rate adjustments will be applied equally across all customer classes of service. 3.4 Development of the Potable Water Rate Design The final step of the City’s comprehensive potable water rate study is the design of rates to collect the desired levels of revenues, based on the results of the prior analyses. In reviewing City’s rates, consideration is given to the level of the rates and the structure of the rates. 3.4.1 Rate Design Criteria and Considerations Prudent rate administration dictates that several criteria must be considered when setting utility rates. Some of these rate design criteria are listed below:
Rates which are easy to understand from the customer’s perspective Rates which are easy for the utility to administer Consideration of the customer’s ability to pay Continuity, over time, of the rate making philosophy Policy considerations (encourage efficient use, economic development, etc.) Provide revenue stability from month to month and year to year Promote efficient allocation of the resource Equitable and non-discriminatory (cost-based) Legally Defendable
Many contemporary rate economists and regulatory agencies recognize that equitable and cost-based rates should be of paramount importance and provide the primary guidance to utilities on rate structure and policy. It is important that the City provide its customers with a proper price signal as to what their consumption and peaking (demand) requirements are costing. This goal may be approached through rate level and structure. When developing the proposed rate designs, all the above listed criteria were taken into consideration. However, it should be noted that it is difficult, if
Development of the Potable Water Rate Study 37 City of Pleasanton – Comprehensive Water Rate Study
not impossible, to design a rate that meets all the goals and objectives listed above. For example, it may be difficult to design a rate that takes into consideration the customer’s ability to pay, and one which is cost-based. In designing rates, there are always trade-offs between these various goals and objectives. 3.4.2 Development of Cost-Based Potable Water Rates As mentioned, developing cost-based and equitable rates is of paramount importance in developing proposed water rates. While always a key consideration in developing rates, meeting the legal requirements, and documenting the steps taken to meet the requirements, has been in the forefront with the recent legal challenges in the State of California on water rates. Given this, the development of the City’s proposed potable water rates have been developed to meet the legal requirements of Proposition 218 (Prop. 218). A key component of Prop. 218 is the development of rates which reflect the cost of providing service and are proportionally allocated between the various customer classes of service. HDR would point out that there is no single methodology for equitably assigning costs to the various customer groups. The American Water Works Association M1 Manual clearly delineates various methodologies which may be used to establish cost-based rates. Unfortunately, Proposition 218 is not prescriptive. It simply requires the adoption of “cost-based” rates and does not provide a clear definition or methodology for establishing cost-based rates. Given that, HDR developed the City’s proposed potable water rates based on generally accepted rate setting methodologies to meet the requirements of Proposition 218 and recent legal decisions to provide an administrative record of the steps taken to establish the City’s potable water rates. HDR is of the opinion that the proposed rates meet the industry definition of “cost-based” rates, along with the spirit (intent) and legal requirements of Proposition 218. HDR reaches this conclusion based upon the following:
The revenues derived from the potable water rates do not exceed the funds required to provide the property related service (i.e. potable water service). The proposed rates are designed to collect the overall revenue requirements of the City.
The revenues derived from water rates shall not be used for any purpose other than that for which the fee or charge is imposed. The revenues derived from the City’s potable water rates are used exclusively to operate and maintain the City’s water system.
The amount of a fee or charge imposed upon a parcel or person as an incident of property ownership shall not exceed the proportional costs of the service attributable to the parcel. This study has focused almost exclusively on the issue of proportional assignment of costs to customer classes of service. The proposed rates have appropriately grouped customers into customer classes of service (single-family, multi-family, commercial, and irrigation) that reflect the varying consumption patterns and system requirements of each customer class of service. The grouping of customers and rates into these classes of service creates the equity and fairness expected under Proposition 218 by having differing rates by customer classes of service which reflect both the level of revenue to be collected by the utility, but also the manner in which these costs are incurred and equitably assigned to customer classes of service based upon their proportional impacts.
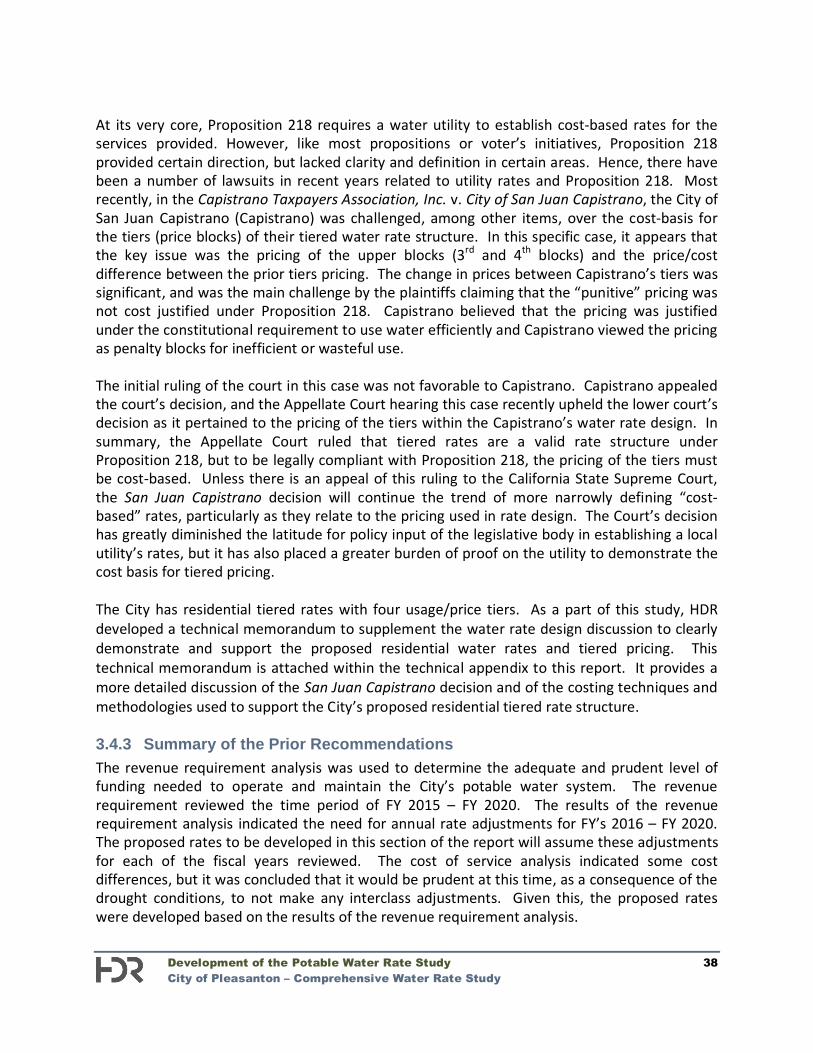
Development of the Potable Water Rate Study 38 City of Pleasanton – Comprehensive Water Rate Study
At its very core, Proposition 218 requires a water utility to establish cost-based rates for the services provided. However, like most propositions or voter’s initiatives, Proposition 218 provided certain direction, but lacked clarity and definition in certain areas. Hence, there have been a number of lawsuits in recent years related to utility rates and Proposition 218. Most recently, in the Capistrano Taxpayers Association, Inc. v. City of San Juan Capistrano, the City of San Juan Capistrano (Capistrano) was challenged, among other items, over the cost-basis for the tiers (price blocks) of their tiered water rate structure. In this specific case, it appears that the key issue was the pricing of the upper blocks (3rd and 4th blocks) and the price/cost difference between the prior tiers pricing. The change in prices between Capistrano’s tiers was significant, and was the main challenge by the plaintiffs claiming that the “punitive” pricing was not cost justified under Proposition 218. Capistrano believed that the pricing was justified under the constitutional requirement to use water efficiently and Capistrano viewed the pricing as penalty blocks for inefficient or wasteful use. The initial ruling of the court in this case was not favorable to Capistrano. Capistrano appealed the court’s decision, and the Appellate Court hearing this case recently upheld the lower court’s decision as it pertained to the pricing of the tiers within the Capistrano’s water rate design. In summary, the Appellate Court ruled that tiered rates are a valid rate structure under Proposition 218, but to be legally compliant with Proposition 218, the pricing of the tiers must be cost-based. Unless there is an appeal of this ruling to the California State Supreme Court, the San Juan Capistrano decision will continue the trend of more narrowly defining “cost-based” rates, particularly as they relate to the pricing used in rate design. The Court’s decision has greatly diminished the latitude for policy input of the legislative body in establishing a local utility’s rates, but it has also placed a greater burden of proof on the utility to demonstrate the cost basis for tiered pricing. The City has residential tiered rates with four usage/price tiers. As a part of this study, HDR developed a technical memorandum to supplement the water rate design discussion to clearly demonstrate and support the proposed residential water rates and tiered pricing. This technical memorandum is attached within the technical appendix to this report. It provides a more detailed discussion of the San Juan Capistrano decision and of the costing techniques and methodologies used to support the City’s proposed residential tiered rate structure. 3.4.3 Summary of the Prior Recommendations The revenue requirement analysis was used to determine the adequate and prudent level of funding needed to operate and maintain the City’s potable water system. The revenue requirement reviewed the time period of FY 2015 – FY 2020. The results of the revenue requirement analysis indicated the need for annual rate adjustments for FY’s 2016 – FY 2020. The proposed rates to be developed in this section of the report will assume these adjustments for each of the fiscal years reviewed. The cost of service analysis indicated some cost differences, but it was concluded that it would be prudent at this time, as a consequence of the drought conditions, to not make any interclass adjustments. Given this, the proposed rates were developed based on the results of the revenue requirement analysis.
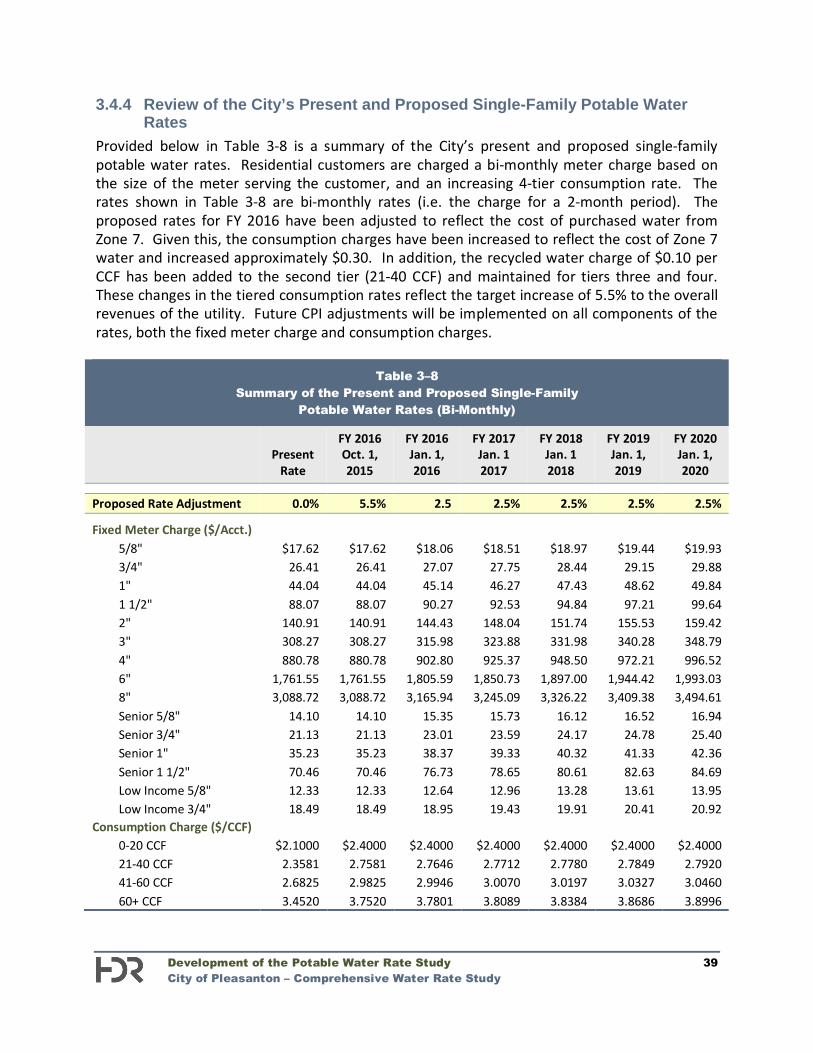
Development of the Potable Water Rate Study 39 City of Pleasanton – Comprehensive Water Rate Study
3.4.4 Review of the City’s Present and Proposed Single-Family Potable Water Rates
Provided below in Table 3-8 is a summary of the City’s present and proposed single-family potable water rates. Residential customers are charged a bi-monthly meter charge based on the size of the meter serving the customer, and an increasing 4-tier consumption rate. The rates shown in Table 3-8 are bi-monthly rates (i.e. the charge for a 2-month period). The proposed rates for FY 2016 have been adjusted to reflect the cost of purchased water from Zone 7. Given this, the consumption charges have been increased to reflect the cost of Zone 7 water and increased approximately $0.30. In addition, the recycled water charge of $0.10 per CCF has been added to the second tier (21-40 CCF) and maintained for tiers three and four. These changes in the tiered consumption rates reflect the target increase of 5.5% to the overall revenues of the utility. Future CPI adjustments will be implemented on all components of the rates, both the fixed meter charge and consumption charges.
Table 3–8 Summary of the Present and Proposed Single-Family
Potable Water Rates (Bi-Monthly)
Present
Rate
FY 2016 Oct. 1, 2015
FY 2016 Jan. 1, 2016
FY 2017 Jan. 1 2017
FY 2018 Jan. 1 2018
FY 2019 Jan. 1, 2019
FY 2020 Jan. 1, 2020
Proposed Rate Adjustment 0.0% 5.5% 2.5 2.5% 2.5% 2.5% 2.5%
Fixed Meter Charge ($/Acct.) 5/8" $17.62 $17.62 $18.06 $18.51 $18.97 $19.44 $19.93 3/4" 26.41 26.41 27.07 27.75 28.44 29.15 29.88 1" 44.04 44.04 45.14 46.27 47.43 48.62 49.84 1 1/2" 88.07 88.07 90.27 92.53 94.84 97.21 99.64 2" 140.91 140.91 144.43 148.04 151.74 155.53 159.42 3" 308.27 308.27 315.98 323.88 331.98 340.28 348.79 4" 880.78 880.78 902.80 925.37 948.50 972.21 996.52 6" 1,761.55 1,761.55 1,805.59 1,850.73 1,897.00 1,944.42 1,993.03 8" 3,088.72 3,088.72 3,165.94 3,245.09 3,326.22 3,409.38 3,494.61 Senior 5/8" 14.10 14.10 15.35 15.73 16.12 16.52 16.94 Senior 3/4" 21.13 21.13 23.01 23.59 24.17 24.78 25.40 Senior 1" 35.23 35.23 38.37 39.33 40.32 41.33 42.36 Senior 1 1/2" 70.46 70.46 76.73 78.65 80.61 82.63 84.69 Low Income 5/8" 12.33 12.33 12.64 12.96 13.28 13.61 13.95 Low Income 3/4" 18.49 18.49 18.95 19.43 19.91 20.41 20.92
Consumption Charge ($/CCF) 0-20 CCF $2.1000 $2.4000 $2.4000 $2.4000 $2.4000 $2.4000 $2.4000 21-40 CCF 2.3581 2.7581 2.7646 2.7712 2.7780 2.7849 2.7920 41-60 CCF 2.6825 2.9825 2.9946 3.0070 3.0197 3.0327 3.0460 60+ CCF 3.4520 3.7520 3.7801 3.8089 3.8384 3.8686 3.8996
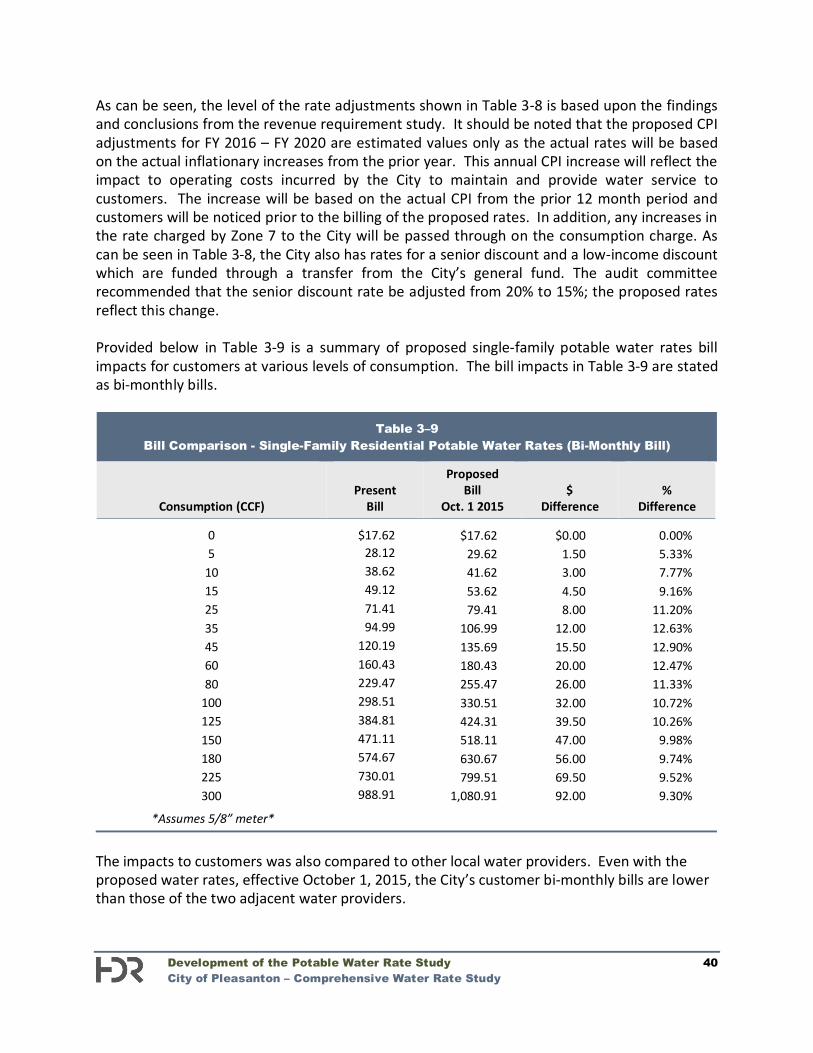
Development of the Potable Water Rate Study 40 City of Pleasanton – Comprehensive Water Rate Study
As can be seen, the level of the rate adjustments shown in Table 3-8 is based upon the findings and conclusions from the revenue requirement study. It should be noted that the proposed CPI adjustments for FY 2016 – FY 2020 are estimated values only as the actual rates will be based on the actual inflationary increases from the prior year. This annual CPI increase will reflect the impact to operating costs incurred by the City to maintain and provide water service to customers. The increase will be based on the actual CPI from the prior 12 month period and customers will be noticed prior to the billing of the proposed rates. In addition, any increases in the rate charged by Zone 7 to the City will be passed through on the consumption charge. As can be seen in Table 3-8, the City also has rates for a senior discount and a low-income discount which are funded through a transfer from the City’s general fund. The audit committee recommended that the senior discount rate be adjusted from 20% to 15%; the proposed rates reflect this change. Provided below in Table 3-9 is a summary of proposed single-family potable water rates bill impacts for customers at various levels of consumption. The bill impacts in Table 3-9 are stated as bi-monthly bills.
Table 3–9 Bill Comparison - Single-Family Residential Potable Water Rates (Bi-Monthly Bill)
Consumption (CCF)
Present
Bill
Proposed Bill
Oct. 1 2015
$
Difference
%
Difference
0 $17.62 $17.62 $0.00 0.00% 5 28.12 29.62 1.50 5.33%
10 38.62 41.62 3.00 7.77% 15 49.12 53.62 4.50 9.16% 25 71.41 79.41 8.00 11.20% 35 94.99 106.99 12.00 12.63% 45 120.19 135.69 15.50 12.90% 60 160.43 180.43 20.00 12.47% 80 229.47 255.47 26.00 11.33%
100 298.51 330.51 32.00 10.72% 125 384.81 424.31 39.50 10.26% 150 471.11 518.11 47.00 9.98% 180 574.67 630.67 56.00 9.74% 225 730.01 799.51 69.50 9.52% 300 988.91 1,080.91 92.00 9.30%
*Assumes 5/8” meter*
The impacts to customers was also compared to other local water providers. Even with the proposed water rates, effective October 1, 2015, the City’s customer bi-monthly bills are lower than those of the two adjacent water providers.
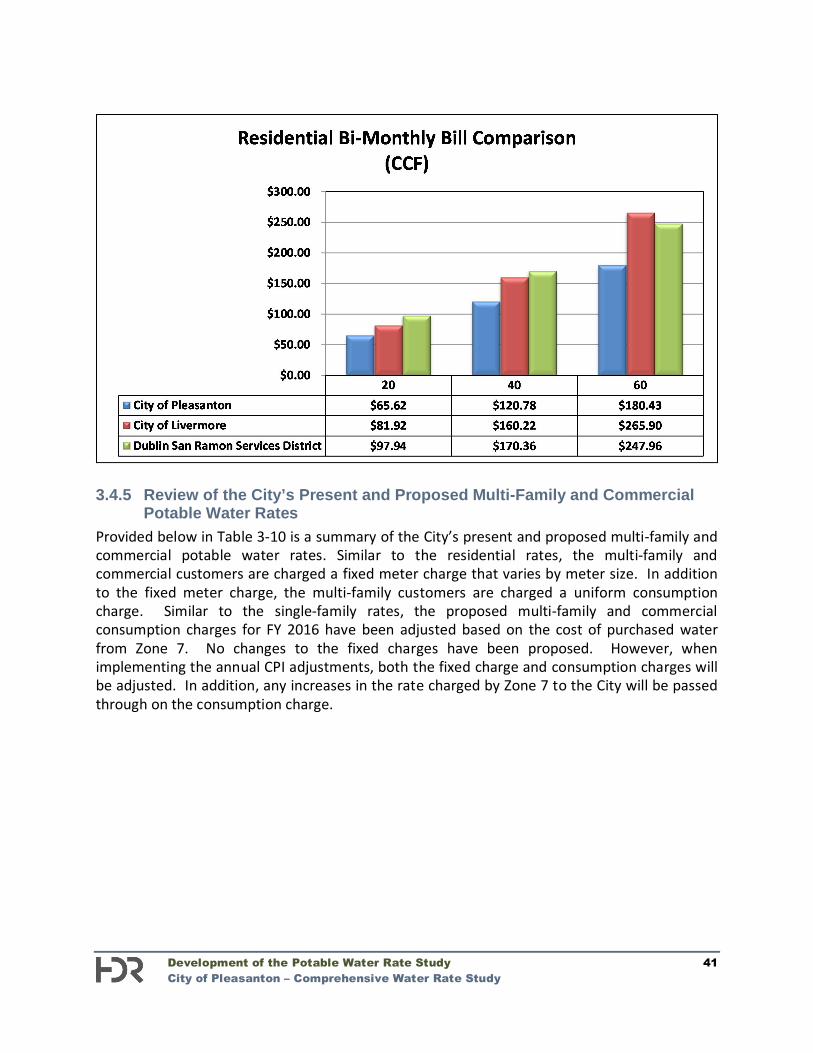
Development of the Potable Water Rate Study 41 City of Pleasanton – Comprehensive Water Rate Study
3.4.5 Review of the City’s Present and Proposed Multi-Family and Commercial
Potable Water Rates Provided below in Table 3-10 is a summary of the City’s present and proposed multi-family and commercial potable water rates. Similar to the residential rates, the multi-family and commercial customers are charged a fixed meter charge that varies by meter size. In addition to the fixed meter charge, the multi-family customers are charged a uniform consumption charge. Similar to the single-family rates, the proposed multi-family and commercial consumption charges for FY 2016 have been adjusted based on the cost of purchased water from Zone 7. No changes to the fixed charges have been proposed. However, when implementing the annual CPI adjustments, both the fixed charge and consumption charges will be adjusted. In addition, any increases in the rate charged by Zone 7 to the City will be passed through on the consumption charge.
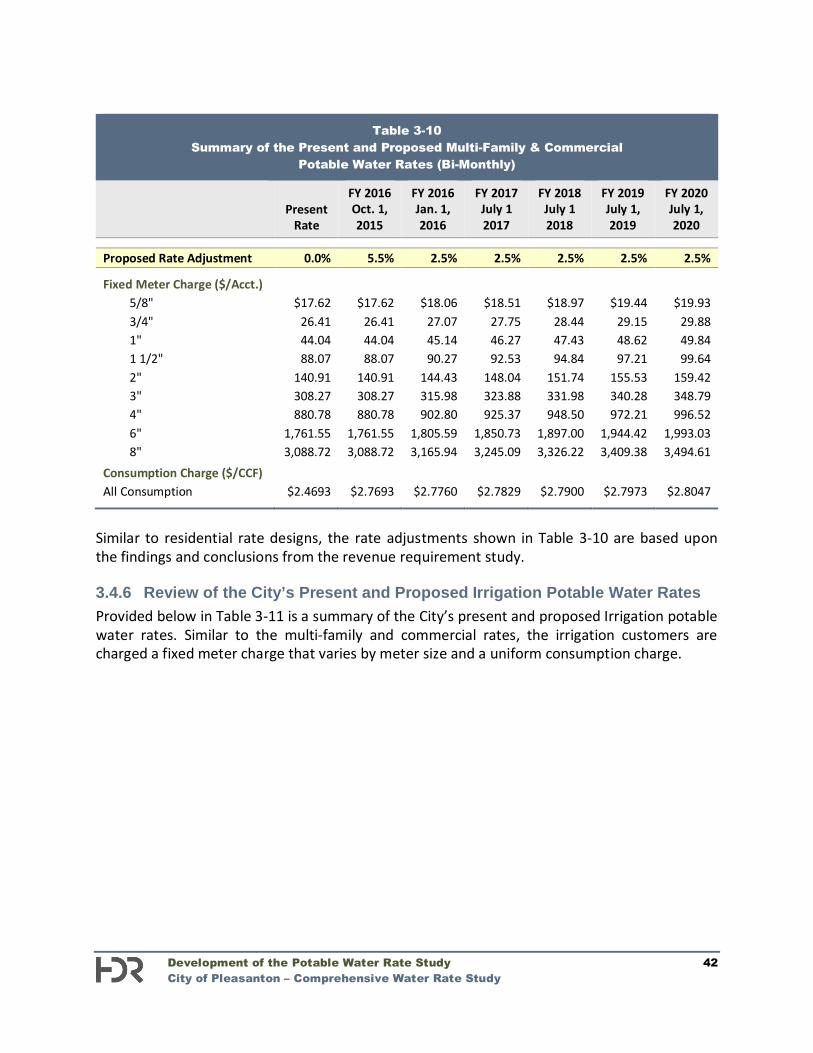
Development of the Potable Water Rate Study 42 City of Pleasanton – Comprehensive Water Rate Study
Table 3-10
Summary of the Present and Proposed Multi-Family & Commercial Potable Water Rates (Bi-Monthly)
Present
Rate
FY 2016 Oct. 1, 2015
FY 2016 Jan. 1, 2016
FY 2017 July 1 2017
FY 2018 July 1 2018
FY 2019 July 1, 2019
FY 2020 July 1, 2020
Proposed Rate Adjustment 0.0% 5.5% 2.5% 2.5% 2.5% 2.5% 2.5%
Fixed Meter Charge ($/Acct.) 5/8" $17.62 $17.62 $18.06 $18.51 $18.97 $19.44 $19.93 3/4" 26.41 26.41 27.07 27.75 28.44 29.15 29.88 1" 44.04 44.04 45.14 46.27 47.43 48.62 49.84 1 1/2" 88.07 88.07 90.27 92.53 94.84 97.21 99.64 2" 140.91 140.91 144.43 148.04 151.74 155.53 159.42 3" 308.27 308.27 315.98 323.88 331.98 340.28 348.79 4" 880.78 880.78 902.80 925.37 948.50 972.21 996.52 6" 1,761.55 1,761.55 1,805.59 1,850.73 1,897.00 1,944.42 1,993.03 8" 3,088.72 3,088.72 3,165.94 3,245.09 3,326.22 3,409.38 3,494.61
Consumption Charge ($/CCF) All Consumption $2.4693 $2.7693 $2.7760 $2.7829 $2.7900 $2.7973 $2.8047
Similar to residential rate designs, the rate adjustments shown in Table 3-10 are based upon the findings and conclusions from the revenue requirement study. 3.4.6 Review of the City’s Present and Proposed Irrigation Potable Water Rates Provided below in Table 3-11 is a summary of the City’s present and proposed Irrigation potable water rates. Similar to the multi-family and commercial rates, the irrigation customers are charged a fixed meter charge that varies by meter size and a uniform consumption charge.
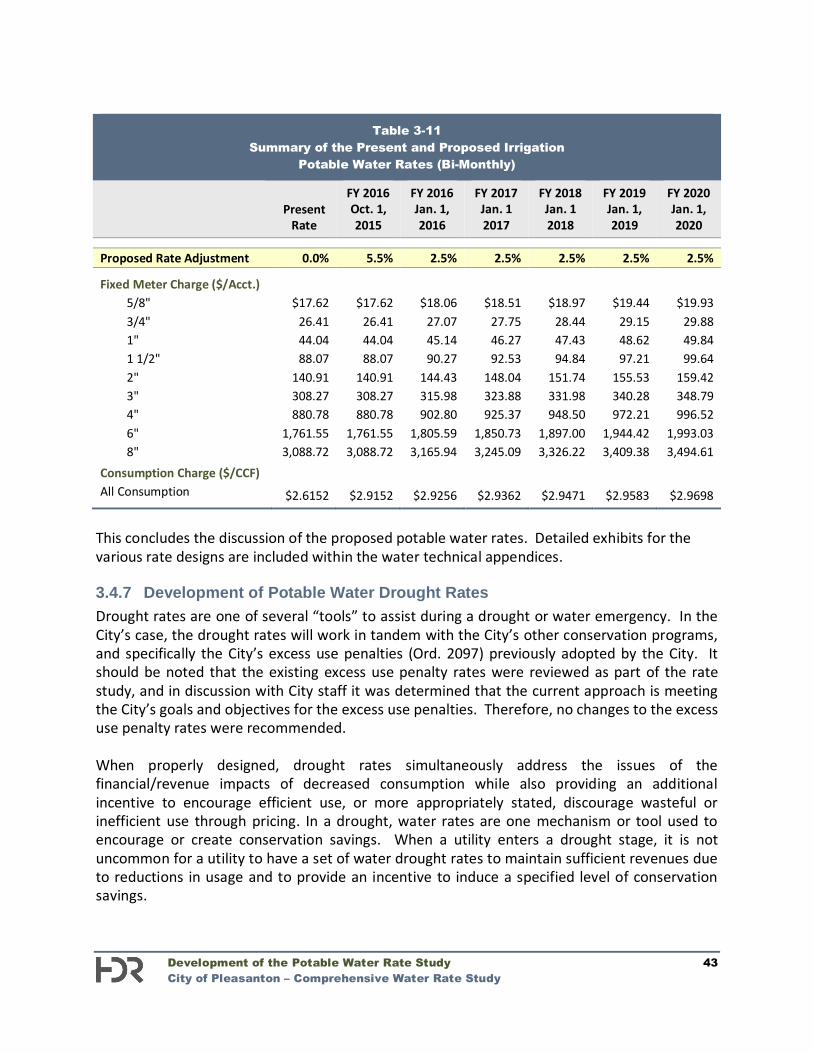
Development of the Potable Water Rate Study 43 City of Pleasanton – Comprehensive Water Rate Study
Table 3-11
Summary of the Present and Proposed Irrigation Potable Water Rates (Bi-Monthly)
Present
Rate
FY 2016 Oct. 1, 2015
FY 2016 Jan. 1, 2016
FY 2017 Jan. 1 2017
FY 2018 Jan. 1 2018
FY 2019 Jan. 1, 2019
FY 2020 Jan. 1, 2020
Proposed Rate Adjustment 0.0% 5.5% 2.5% 2.5% 2.5% 2.5% 2.5%
Fixed Meter Charge ($/Acct.) 5/8" $17.62 $17.62 $18.06 $18.51 $18.97 $19.44 $19.93 3/4" 26.41 26.41 27.07 27.75 28.44 29.15 29.88 1" 44.04 44.04 45.14 46.27 47.43 48.62 49.84 1 1/2" 88.07 88.07 90.27 92.53 94.84 97.21 99.64 2" 140.91 140.91 144.43 148.04 151.74 155.53 159.42 3" 308.27 308.27 315.98 323.88 331.98 340.28 348.79 4" 880.78 880.78 902.80 925.37 948.50 972.21 996.52 6" 1,761.55 1,761.55 1,805.59 1,850.73 1,897.00 1,944.42 1,993.03 8" 3,088.72 3,088.72 3,165.94 3,245.09 3,326.22 3,409.38 3,494.61
Consumption Charge ($/CCF) All Consumption $2.6152 $2.9152 $2.9256 $2.9362 $2.9471 $2.9583 $2.9698
This concludes the discussion of the proposed potable water rates. Detailed exhibits for the various rate designs are included within the water technical appendices. 3.4.7 Development of Potable Water Drought Rates Drought rates are one of several “tools” to assist during a drought or water emergency. In the City’s case, the drought rates will work in tandem with the City’s other conservation programs, and specifically the City’s excess use penalties (Ord. 2097) previously adopted by the City. It should be noted that the existing excess use penalty rates were reviewed as part of the rate study, and in discussion with City staff it was determined that the current approach is meeting the City’s goals and objectives for the excess use penalties. Therefore, no changes to the excess use penalty rates were recommended. When properly designed, drought rates simultaneously address the issues of the financial/revenue impacts of decreased consumption while also providing an additional incentive to encourage efficient use, or more appropriately stated, discourage wasteful or inefficient use through pricing. In a drought, water rates are one mechanism or tool used to encourage or create conservation savings. When a utility enters a drought stage, it is not uncommon for a utility to have a set of water drought rates to maintain sufficient revenues due to reductions in usage and to provide an incentive to induce a specified level of conservation savings.
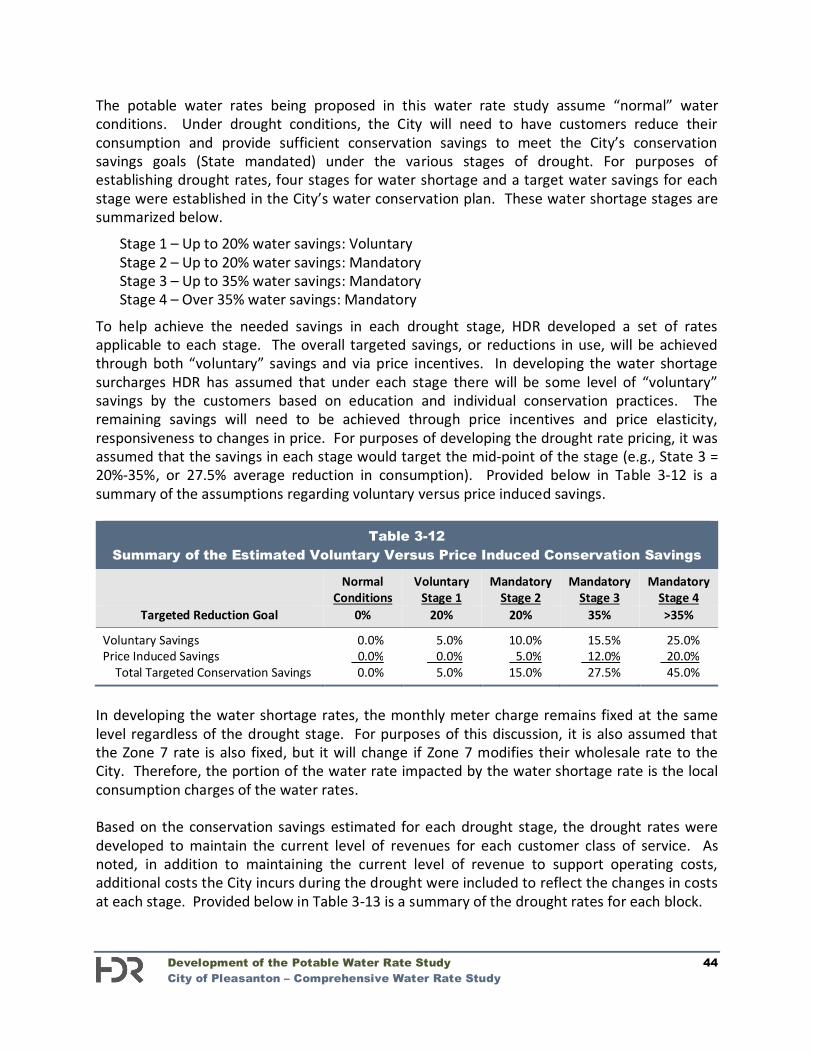
Development of the Potable Water Rate Study 44 City of Pleasanton – Comprehensive Water Rate Study
The potable water rates being proposed in this water rate study assume “normal” water conditions. Under drought conditions, the City will need to have customers reduce their consumption and provide sufficient conservation savings to meet the City’s conservation savings goals (State mandated) under the various stages of drought. For purposes of establishing drought rates, four stages for water shortage and a target water savings for each stage were established in the City’s water conservation plan. These water shortage stages are summarized below.
Stage 1 – Up to 20% water savings: Voluntary Stage 2 – Up to 20% water savings: Mandatory Stage 3 – Up to 35% water savings: Mandatory Stage 4 – Over 35% water savings: Mandatory
To help achieve the needed savings in each drought stage, HDR developed a set of rates applicable to each stage. The overall targeted savings, or reductions in use, will be achieved through both “voluntary” savings and via price incentives. In developing the water shortage surcharges HDR has assumed that under each stage there will be some level of “voluntary” savings by the customers based on education and individual conservation practices. The remaining savings will need to be achieved through price incentives and price elasticity, responsiveness to changes in price. For purposes of developing the drought rate pricing, it was assumed that the savings in each stage would target the mid-point of the stage (e.g., State 3 = 20%-35%, or 27.5% average reduction in consumption). Provided below in Table 3-12 is a summary of the assumptions regarding voluntary versus price induced savings.
Table 3-12 Summary of the Estimated Voluntary Versus Price Induced Conservation Savings
Normal Conditions
Voluntary Stage 1
Mandatory Stage 2
Mandatory Stage 3
Mandatory Stage 4
Targeted Reduction Goal 0% 20% 20% 35% >35%
Voluntary Savings 0.0% 5.0% 10.0% 15.5% 25.0% Price Induced Savings 0.0% 0.0% 5.0% 12.0% 20.0% Total Targeted Conservation Savings 0.0% 5.0% 15.0% 27.5% 45.0%
In developing the water shortage rates, the monthly meter charge remains fixed at the same level regardless of the drought stage. For purposes of this discussion, it is also assumed that the Zone 7 rate is also fixed, but it will change if Zone 7 modifies their wholesale rate to the City. Therefore, the portion of the water rate impacted by the water shortage rate is the local consumption charges of the water rates. Based on the conservation savings estimated for each drought stage, the drought rates were developed to maintain the current level of revenues for each customer class of service. As noted, in addition to maintaining the current level of revenue to support operating costs, additional costs the City incurs during the drought were included to reflect the changes in costs at each stage. Provided below in Table 3-13 is a summary of the drought rates for each block.
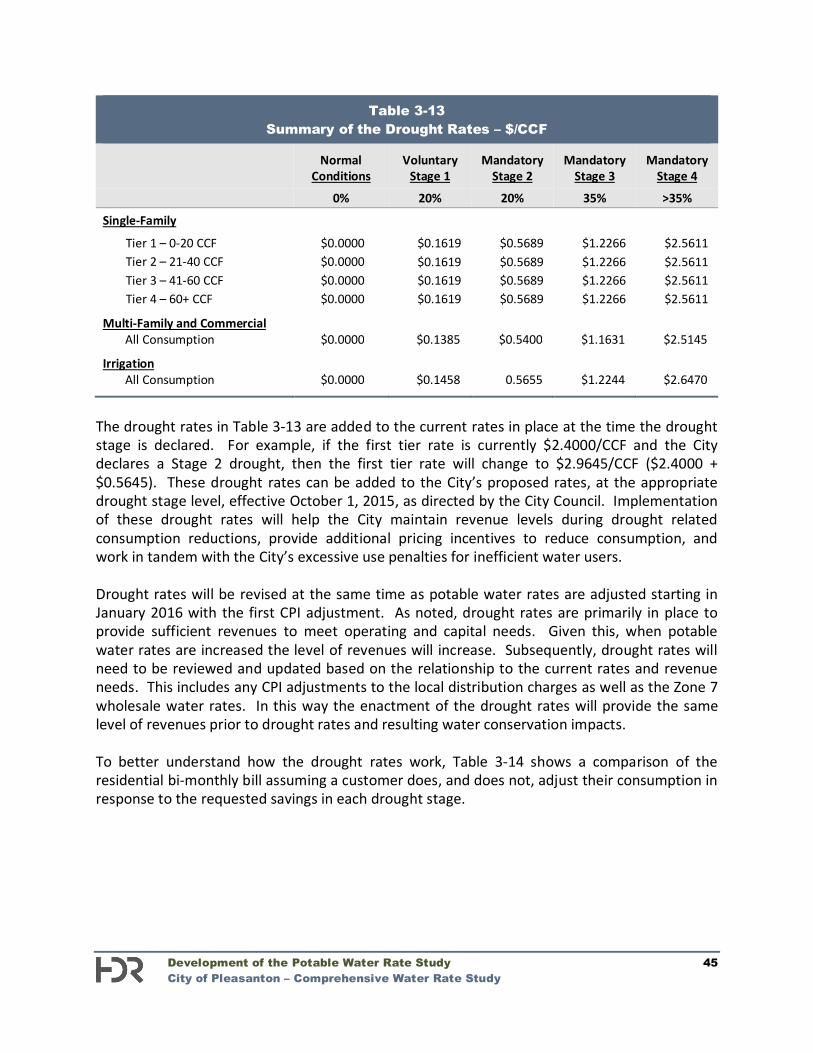
Development of the Potable Water Rate Study 45 City of Pleasanton – Comprehensive Water Rate Study
Table 3-13 Summary of the Drought Rates – $/CCF
Normal Conditions
Voluntary Stage 1
Mandatory Stage 2
Mandatory Stage 3
Mandatory Stage 4
0% 20% 20% 35% >35%
Single-Family
Tier 1 – 0-20 CCF $0.0000 $0.1619 $0.5689 $1.2266 $2.5611 Tier 2 – 21-40 CCF $0.0000 $0.1619 $0.5689 $1.2266 $2.5611 Tier 3 – 41-60 CCF $0.0000 $0.1619 $0.5689 $1.2266 $2.5611 Tier 4 – 60+ CCF $0.0000 $0.1619 $0.5689 $1.2266 $2.5611
Multi-Family and Commercial All Consumption $0.0000 $0.1385 $0.5400 $1.1631 $2.5145
Irrigation All Consumption $0.0000 $0.1458 0.5655 $1.2244 $2.6470
The drought rates in Table 3-13 are added to the current rates in place at the time the drought stage is declared. For example, if the first tier rate is currently $2.4000/CCF and the City declares a Stage 2 drought, then the first tier rate will change to $2.9645/CCF ($2.4000 + $0.5645). These drought rates can be added to the City’s proposed rates, at the appropriate drought stage level, effective October 1, 2015, as directed by the City Council. Implementation of these drought rates will help the City maintain revenue levels during drought related consumption reductions, provide additional pricing incentives to reduce consumption, and work in tandem with the City’s excessive use penalties for inefficient water users. Drought rates will be revised at the same time as potable water rates are adjusted starting in January 2016 with the first CPI adjustment. As noted, drought rates are primarily in place to provide sufficient revenues to meet operating and capital needs. Given this, when potable water rates are increased the level of revenues will increase. Subsequently, drought rates will need to be reviewed and updated based on the relationship to the current rates and revenue needs. This includes any CPI adjustments to the local distribution charges as well as the Zone 7 wholesale water rates. In this way the enactment of the drought rates will provide the same level of revenues prior to drought rates and resulting water conservation impacts. To better understand how the drought rates work, Table 3-14 shows a comparison of the residential bi-monthly bill assuming a customer does, and does not, adjust their consumption in response to the requested savings in each drought stage.
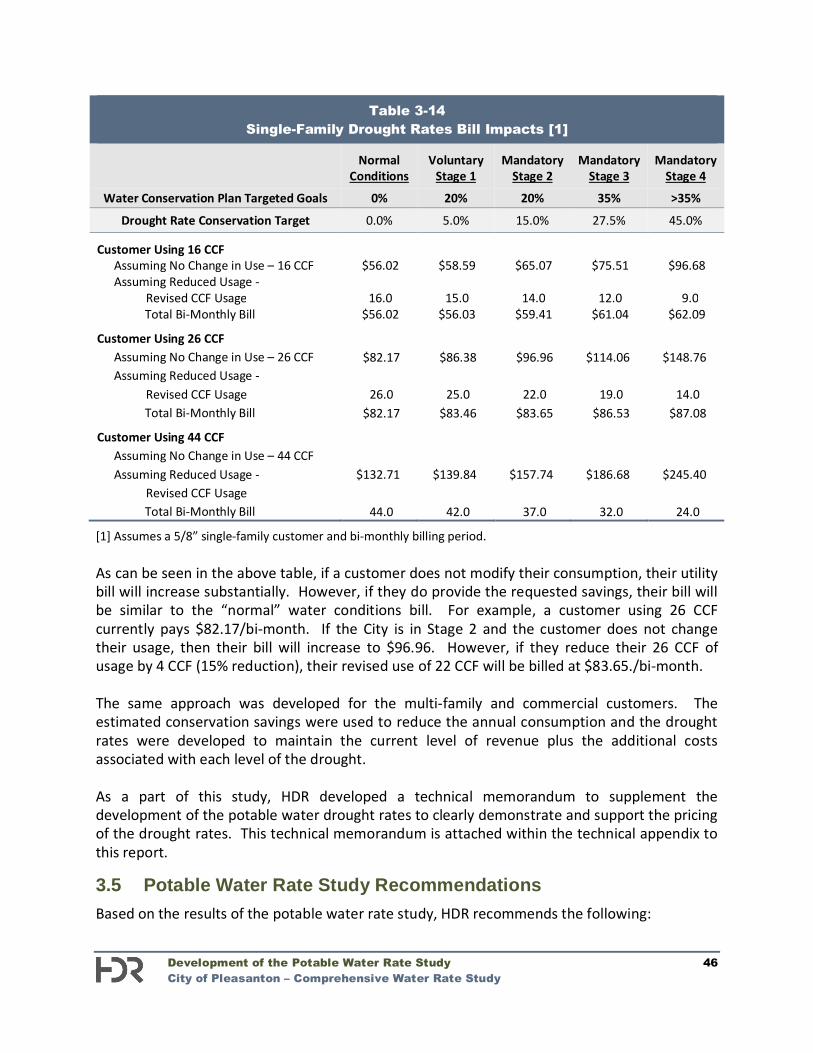
Development of the Potable Water Rate Study 46 City of Pleasanton – Comprehensive Water Rate Study
Table 3-14 Single-Family Drought Rates Bill Impacts [1]
Normal Conditions
Voluntary Stage 1
Mandatory Stage 2
Mandatory Stage 3
Mandatory Stage 4
Water Conservation Plan Targeted Goals 0% 20% 20% 35% >35%
Drought Rate Conservation Target 0.0% 5.0% 15.0% 27.5% 45.0%
Customer Using 16 CCF Assuming No Change in Use – 16 CCF $56.02 $58.59 $65.07 $75.51 $96.68 Assuming Reduced Usage - Revised CCF Usage 16.0 15.0 14.0 12.0 9.0 Total Bi-Monthly Bill $56.02 $56.03 $59.41 $61.04 $62.09
Customer Using 26 CCF Assuming No Change in Use – 26 CCF $82.17 $86.38 $96.96 $114.06 $148.76 Assuming Reduced Usage - Revised CCF Usage 26.0 25.0 22.0 19.0 14.0 Total Bi-Monthly Bill $82.17 $83.46 $83.65 $86.53 $87.08
Customer Using 44 CCF Assuming No Change in Use – 44 CCF Assuming Reduced Usage - $132.71 $139.84 $157.74 $186.68 $245.40 Revised CCF Usage Total Bi-Monthly Bill 44.0 42.0 37.0 32.0 24.0
[1] Assumes a 5/8” single-family customer and bi-monthly billing period. As can be seen in the above table, if a customer does not modify their consumption, their utility bill will increase substantially. However, if they do provide the requested savings, their bill will be similar to the “normal” water conditions bill. For example, a customer using 26 CCF currently pays $82.17/bi-month. If the City is in Stage 2 and the customer does not change their usage, then their bill will increase to $96.96. However, if they reduce their 26 CCF of usage by 4 CCF (15% reduction), their revised use of 22 CCF will be billed at $83.65./bi-month. The same approach was developed for the multi-family and commercial customers. The estimated conservation savings were used to reduce the annual consumption and the drought rates were developed to maintain the current level of revenue plus the additional costs associated with each level of the drought. As a part of this study, HDR developed a technical memorandum to supplement the development of the potable water drought rates to clearly demonstrate and support the pricing of the drought rates. This technical memorandum is attached within the technical appendix to this report. 3.5 Potable Water Rate Study Recommendations Based on the results of the potable water rate study, HDR recommends the following:
Development of the Potable Water Rate Study 47 City of Pleasanton – Comprehensive Water Rate Study
Potable water rates should be adjusted 5.5% based on the proposed rates as part of this study for October 1, 2015.
When funds are available, increase the level of annual replacement funding to transition towards meeting annual depreciation expense levels.
Future CPI related rate adjustments are necessary to meet operating and capital needs. These were estimated at 2.5% per year each January 1st starting in 2016 through 2020.
The actual rates will be based on the actual CPI index for the year prior to the rate setting period.
Drought rates should be adopted based on the need to maintain sufficient revenues for operating and capital needs.
Drought rates should be adjusted whenever potable water rates are adjusted (Zone 7 pass through or CPI adjustments).
3.6 Summary of the Potable Water Rate Study This completes the analysis for the City’s potable water system. This study has provided a comprehensive review and development of proposed potable water rates, and potable water drought rates, for the City. Adoption of the proposed potable water rates and drought rates will allow the City to meet their current and projected potable water system financial obligations and capital improvement needs for the time period reviewed.
Development of the Recycled Water Rate Study 48 City of Pleasanton – Comprehensive Water Rate Study
4.1 Introduction In addition to potable water service, the City also purchases and supplies customers with recycled water for outdoor irrigation needs. The City is in the process of expanding and providing recycled water service to additional customers within the City’s water system service area. This section of the report describes the development of the recycled water rate study. The recycled water rate study includes the development of the revenue requirement and rate design analyses. Each of these analyses is discussed in more detail, including the specific steps to develop the City’s cost-based recycled water rates. 4.2 Development of the Recycled Water Revenue Requirement The revenue requirement analysis is the first analytical step in the rate study process. This analysis determines the adequacy of the overall recycled water rates. From this analysis, a determination can be made as to the overall revenue needs to provide adequate and prudent funding for both operating and capital needs of the recycled water system. 4.2.1 Determining the Revenue Requirement In developing the City’s recycled water system revenue requirement, the utility, must financially “stand on its own” and be properly funded. As a result, the revenue requirement analysis, as developed herein, assumes the full and proper funding needed to operate and maintain the City’s recycled water system on a financially sound and prudent basis. Provided below is a more detailed discussion of the development of the revenue requirement analysis for the City’s recycled water system. 4.2.2 Establishing a Time Frame and Approach The first step in calculating the revenue requirement for the City’s recycled water system was to establish a time frame for the revenue requirement analysis. For this study, similar to the potable water rate study, the revenue requirement analysis was developed for a six-year projected time period (FY 2015 – FY 2020). This six year time frame was composed of Budget FY 2015 and the five projected years of FY 2016 – FY 2020. By anticipating future financial requirements, the City can begin planning for these changes sooner, thereby minimizing short-term rate impacts and overall long-term rates. The second step in determining the revenue requirement was to decide on the basis of accumulating costs. In this particular case, for the revenue requirement analysis a “cash basis” approach was utilized. The “cash basis” approach is the most commonly used methodology by municipal utilities to set their revenue requirement. This is also the methodology that the City has historically used to establish their utility revenue requirements for its potable water rates.
4. Development of the Recycled Water Rate Study
Development of the Recycled Water Rate Study 49 City of Pleasanton – Comprehensive Water Rate Study
Given a time period around which to develop the revenue requirement and a method to accumulate the costs; the focus shifts to the development and projection of the revenues and expenses of the City’s recycled water system. The primary financial inputs in the development of the revenue requirement were the City’s FY 2015 budget documents, historical and projected recycled water consumption data, and the City’s recycled water capital improvement plan. Presented below is a detailed discussion of the steps and key assumptions contained in the development of the projections of the City’s recycled water system revenue requirement analysis. 4.2.3 Projecting Rate and Other Miscellaneous Revenues The first step in developing the recycled water revenue requirement was to develop a projection of the recycled water rate revenues, at present rate levels. In general, this process involved developing projected billing units for recycled water sales. The billing units were then multiplied by the applicable current recycled water rate to determine the current and proposed level of recycled water revenues. A key aspect of the projection of recycled water revenues was to develop a projection of consumption levels given the expansion of the recycled water system and new customers connecting to the system. The analysis was based on the projection of potable water consumption data transitioning to recycled water service over the next several years. The City provided estimates of the number of customers and consumption that was used to develop the level of proposed consumption over the time period reviewed and used to establish the level of proposed revenues. The City has charged recycled water customers a consumption charge established equal to 90% of the potable water irrigation rate. This rate relationship was maintained over the time period reviewed to determine if it adequately funded recycled water system costs. Based on the projection of recycled water consumption and the changes to the potable irrigation rate, the City’s recycled water system is projected to receive approximately $103,000 in rate revenue in FY 2015. Given the transition of potable water customers to the recycled water system, the proposed rate revenues in FY 2020 are projected to be approximately $1.9 million. In addition to rate revenues, the recycled water system also receives miscellaneous revenues. As noted in the potable water system revenue requirement, potable water rates transfer approximately $285,000 per year to the recycled water system to fund a portion of the overall recycled water system program costs. As noted, this transfer reflects customers being able to use potable water resources as the recycled water produced and distributed “frees up” additional potable water supply. On a combined basis, taking into account the rate revenues and the miscellaneous revenues, the City potable water utility has total projected revenues of approximately $388,000 in FY 2015, increasing to approximately $2.2 million in FY 2020.

Development of the Recycled Water Rate Study 50 City of Pleasanton – Comprehensive Water Rate Study
4.2.4 Projecting Operation and Maintenance Expenses As the City begins to expand the recycled water system additional operation and maintenance (O&M) expenses will be incurred to operate and maintain the existing plant in service and to purchase recycled water. The recycled water O&M was based on the FY 2015 and FY 2016 estimated budget. O&M costs are projected to be approximately $368,000 in FY 2016 increasing to approximately $449,000 in FY 2020 based on estimated inflation. The City also incurs costs to purchase recycled water from the Dublin San Ramon Services District and the City of Livermore. Projections of purchased recycled water were based on current rates and projected based on the increase in recycled water demands. In total, purchased recycled water supply costs are approximately $233,000 in FY 2016 increasing to approximately $703,000 in FY 2020, based on projected demands. The total operation and maintenance expenses for the recycled water system are approximately $600,000 for FY 2016, based on the FY 2015 budget. Over the five year planning horizon, the total O&M expenses are projected to increase to approximately $1.2 million by FY 2020 based on additional O&M needs to maintain the expanded recycled water system and increase in purchased recycled water costs, as a result of increased demands. 4.2.5 Projecting Capital Funding Needs and Transfer Payments At this time, the recycled water system does not have an established renewal and replacement (R&R) fund or expansion fund. As part of this study, the analysis reviewed the ability to establish a renewal and replacement fund for the recycled water system as rate revenues were available to support it. Table 4-1 is a summary of the amount of rate funded capital for each year.
Table 4-1 Summary of the Annual Recycled Water System
Renewal and Replacement Funding ($000)
FY 2015
FY 2016
FY 2017
FY 2018
FY 2019
FY 2020
Renewal and Replacement Funding $0 $0 $0 $75 $200 $275
As can be seen, the projections of recycled water revenues, based on 90% of the potable irrigation rate, allow for the City to slowly begin to develop a transfer of funds to the renewal and replacement fund for the recycled water system over the time period reviewed. The City should increase this level of funding when revenues are available to support future replacement of the recycled water system. As the recycled water system matures and expands, the development of an expansion fund will also be necessary to include the revenues received from recycled water connection fees. . 4.2.6 Projection of Debt Service The City has recently incurred long-term debt to fund the improvements necessary to provide recycled water system service to additional customers. The annual debt service payment is
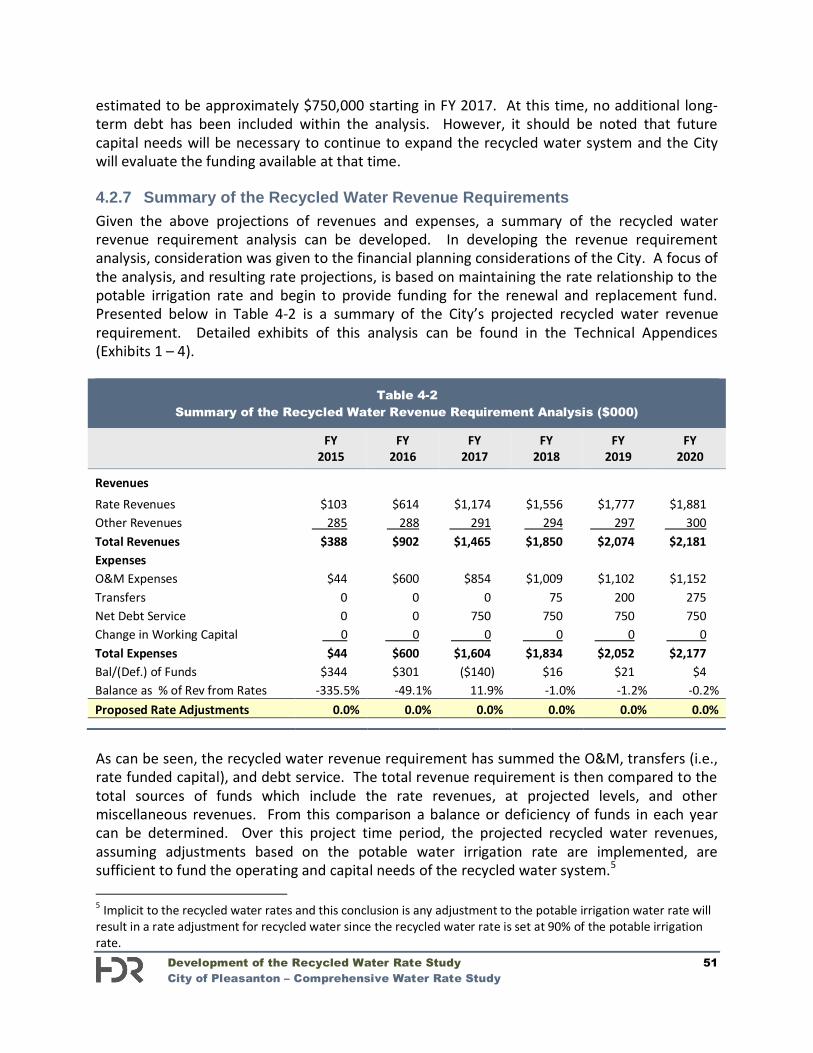
Development of the Recycled Water Rate Study 51 City of Pleasanton – Comprehensive Water Rate Study
estimated to be approximately $750,000 starting in FY 2017. At this time, no additional long-term debt has been included within the analysis. However, it should be noted that future capital needs will be necessary to continue to expand the recycled water system and the City will evaluate the funding available at that time. 4.2.7 Summary of the Recycled Water Revenue Requirements Given the above projections of revenues and expenses, a summary of the recycled water revenue requirement analysis can be developed. In developing the revenue requirement analysis, consideration was given to the financial planning considerations of the City. A focus of the analysis, and resulting rate projections, is based on maintaining the rate relationship to the potable irrigation rate and begin to provide funding for the renewal and replacement fund. Presented below in Table 4-2 is a summary of the City’s projected recycled water revenue requirement. Detailed exhibits of this analysis can be found in the Technical Appendices (Exhibits 1 – 4).
Table 4-2 Summary of the Recycled Water Revenue Requirement Analysis ($000)
FY 2015
FY 2016
FY 2017
FY 2018
FY 2019
FY 2020
Revenues Rate Revenues $103 $614 $1,174 $1,556 $1,777 $1,881 Other Revenues 285 288 291 294 297 300 Total Revenues $388 $902 $1,465 $1,850 $2,074 $2,181 Expenses O&M Expenses $44 $600 $854 $1,009 $1,102 $1,152 Transfers 0 0 0 75 200 275 Net Debt Service 0 0 750 750 750 750 Change in Working Capital 0 0 0 0 0 0 Total Expenses $44 $600 $1,604 $1,834 $2,052 $2,177 Bal/(Def.) of Funds $344 $301 ($140) $16 $21 $4 Balance as % of Rev from Rates -335.5% -49.1% 11.9% -1.0% -1.2% -0.2% Proposed Rate Adjustments 0.0% 0.0% 0.0% 0.0% 0.0% 0.0% As can be seen, the recycled water revenue requirement has summed the O&M, transfers (i.e., rate funded capital), and debt service. The total revenue requirement is then compared to the total sources of funds which include the rate revenues, at projected levels, and other miscellaneous revenues. From this comparison a balance or deficiency of funds in each year can be determined. Over this project time period, the projected recycled water revenues, assuming adjustments based on the potable water irrigation rate are implemented, are sufficient to fund the operating and capital needs of the recycled water system.5 5 Implicit to the recycled water rates and this conclusion is any adjustment to the potable irrigation water rate will result in a rate adjustment for recycled water since the recycled water rate is set at 90% of the potable irrigation rate.
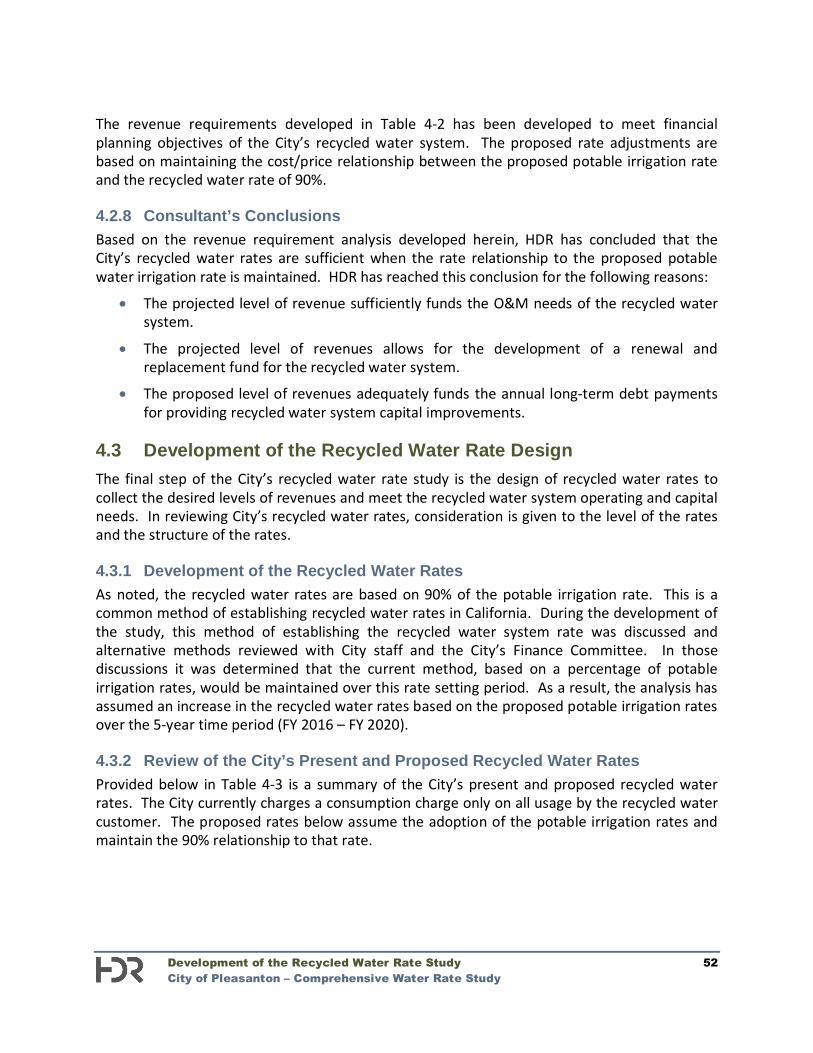
Development of the Recycled Water Rate Study 52 City of Pleasanton – Comprehensive Water Rate Study
The revenue requirements developed in Table 4-2 has been developed to meet financial planning objectives of the City’s recycled water system. The proposed rate adjustments are based on maintaining the cost/price relationship between the proposed potable irrigation rate and the recycled water rate of 90%. 4.2.8 Consultant’s Conclusions Based on the revenue requirement analysis developed herein, HDR has concluded that the City’s recycled water rates are sufficient when the rate relationship to the proposed potable water irrigation rate is maintained. HDR has reached this conclusion for the following reasons:
The projected level of revenue sufficiently funds the O&M needs of the recycled water system.
The projected level of revenues allows for the development of a renewal and replacement fund for the recycled water system.
The proposed level of revenues adequately funds the annual long-term debt payments for providing recycled water system capital improvements.
4.3 Development of the Recycled Water Rate Design The final step of the City’s recycled water rate study is the design of recycled water rates to collect the desired levels of revenues and meet the recycled water system operating and capital needs. In reviewing City’s recycled water rates, consideration is given to the level of the rates and the structure of the rates. 4.3.1 Development of the Recycled Water Rates As noted, the recycled water rates are based on 90% of the potable irrigation rate. This is a common method of establishing recycled water rates in California. During the development of the study, this method of establishing the recycled water system rate was discussed and alternative methods reviewed with City staff and the City’s Finance Committee. In those discussions it was determined that the current method, based on a percentage of potable irrigation rates, would be maintained over this rate setting period. As a result, the analysis has assumed an increase in the recycled water rates based on the proposed potable irrigation rates over the 5-year time period (FY 2016 – FY 2020). 4.3.2 Review of the City’s Present and Proposed Recycled Water Rates Provided below in Table 4-3 is a summary of the City’s present and proposed recycled water rates. The City currently charges a consumption charge only on all usage by the recycled water customer. The proposed rates below assume the adoption of the potable irrigation rates and maintain the 90% relationship to that rate.
Development of the Recycled Water Rate Study 53 City of Pleasanton – Comprehensive Water Rate Study
Table 4-3
Summary of the Present and Proposed Recycled Water Rates
Present
Rate
FY 2016 Oct. 1, 2015
FY 2016 Jan. 1, 2016
FY 2017 Jan. 1 2017
FY 2018 Jan. 1 2018
FY 2019 Jan. 1, 2019
FY 2020 Jan. 1, 2020
Consumption Charge ($/CCF) All Usage $2.3537 $2.6237 $2.6330 $2.6426 $2.6524 $2.6625 $2.6728
As can be seen, the level of the rate adjustments shown in Table 4-3 is based upon the relationship to the potable irrigation rate. As noted in the revenue requirement analysis the resulting level of revenues result in sufficiently funding the operating and capital needs of the recycled water system. As noted in the potable water rate designs, the proposed adjustments for FY 2016 – FY 2020 are estimated values only as the actual rates will be based on the actual inflationary increases from the prior year in the potable irrigation rate. 4.4 Recycled Water Rate Study Recommendations Based on the results of the recycled water rate study, HDR recommends the following:
Maintain the existing basis for the recycled water rate of 90% of the potable water irrigation rate.
Adjust the recycled water rate when adjusting the potable water rates.
Begin to establish the replacement fund for the recycled water fund for future system repair and replacements.
4.5 Summary of the Recycled Water Rate Study This completes the analysis for the City’s recycled water system. This study has provided a comprehensive review and development of proposed recycled water rates for the City. Adoption of the proposed recycled water rates will allow the City to meet their current and projected recycled water system financial obligations and capital improvement needs for the time period reviewed.
Technical Appendix A – Potable Water Analysis
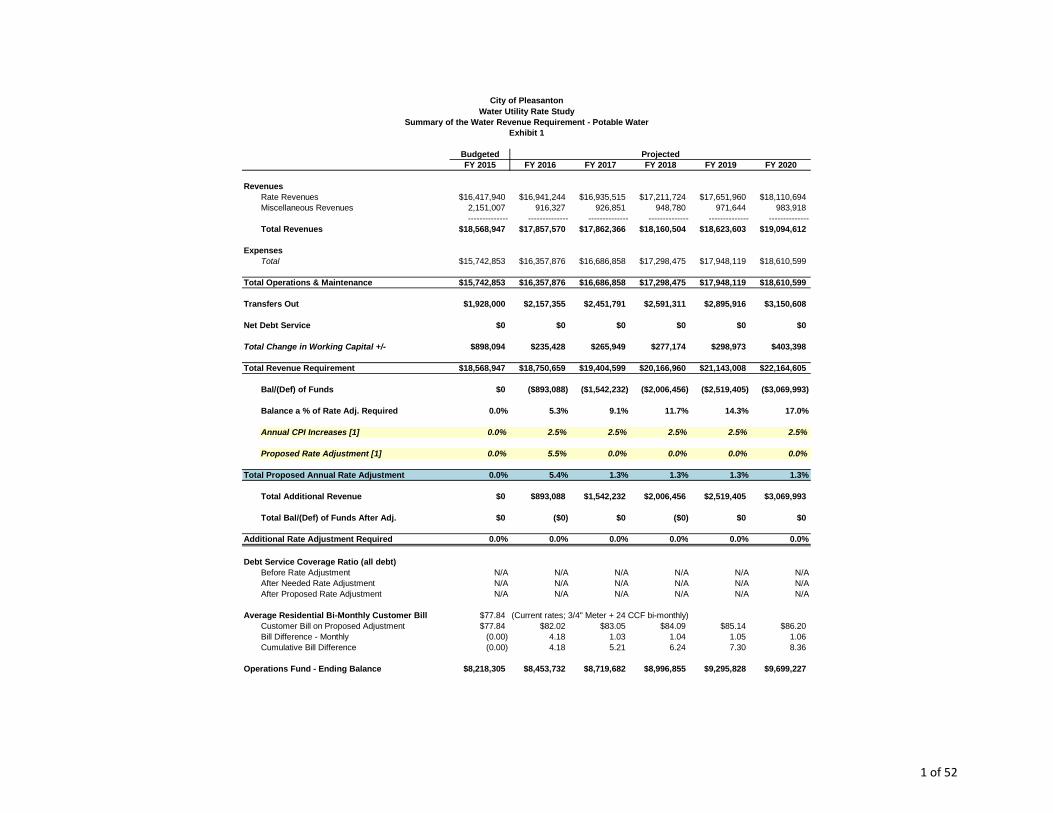
BudgetedFY 2015 FY 2016 FY 2017 FY 2018 FY 2019 FY 2020
RevenuesRate Revenues $16,417,940 $16,941,244 $16,935,515 $17,211,724 $17,651,960 $18,110,694Miscellaneous Revenues 2,151,007 916,327 926,851 948,780 971,644 983,918
-------------- -------------- -------------- -------------- -------------- --------------Total Revenues $18,568,947 $17,857,570 $17,862,366 $18,160,504 $18,623,603 $19,094,612
ExpensesTotal $15,742,853 $16,357,876 $16,686,858 $17,298,475 $17,948,119 $18,610,599
Total Operations & Maintenance $15,742,853 $16,357,876 $16,686,858 $17,298,475 $17,948,119 $18,610,599
Transfers Out $1,928,000 $2,157,355 $2,451,791 $2,591,311 $2,895,916 $3,150,608
Net Debt Service $0 $0 $0 $0 $0 $0
Total Change in Working Capital +/- $898,094 $235,428 $265,949 $277,174 $298,973 $403,398
Total Revenue Requirement $18,568,947 $18,750,659 $19,404,599 $20,166,960 $21,143,008 $22,164,605
Bal/(Def) of Funds $0 ($893,088) ($1,542,232) ($2,006,456) ($2,519,405) ($3,069,993)
Balance a % of Rate Adj. Required 0.0% 5.3% 9.1% 11.7% 14.3% 17.0%
Annual CPI Increases [1] 0.0% 2.5% 2.5% 2.5% 2.5% 2.5%
Proposed Rate Adjustment [1] 0.0% 5.5% 0.0% 0.0% 0.0% 0.0%
Total Proposed Annual Rate Adjustment 0.0% 5.4% 1.3% 1.3% 1.3% 1.3%
Total Additional Revenue $0 $893,088 $1,542,232 $2,006,456 $2,519,405 $3,069,993
Total Bal/(Def) of Funds After Adj. $0 ($0) $0 ($0) $0 $0
Additional Rate Adjustment Required 0.0% 0.0% 0.0% 0.0% 0.0% 0.0%
Debt Service Coverage Ratio (all debt)Before Rate Adjustment N/A N/A N/A N/A N/A N/AAfter Needed Rate Adjustment N/A N/A N/A N/A N/A N/AAfter Proposed Rate Adjustment N/A N/A N/A N/A N/A N/A
Average Residential Bi-Monthly Customer Bill $77.84 (Current rates; 3/4" Meter + 24 CCF bi-monthly)Customer Bill on Proposed Adjustment $77.84 $82.02 $83.05 $84.09 $85.14 $86.20Bill Difference - Monthly (0.00) 4.18 1.03 1.04 1.05 1.06Cumulative Bill Difference (0.00) 4.18 5.21 6.24 7.30 8.36
Operations Fund - Ending Balance $8,218,305 $8,453,732 $8,719,682 $8,996,855 $9,295,828 $9,699,227
Projected
Exhibit 1Summary of the Water Revenue Requirement - Potable Water
Water Utility Rate StudyCity of Pleasanton
1 of 52
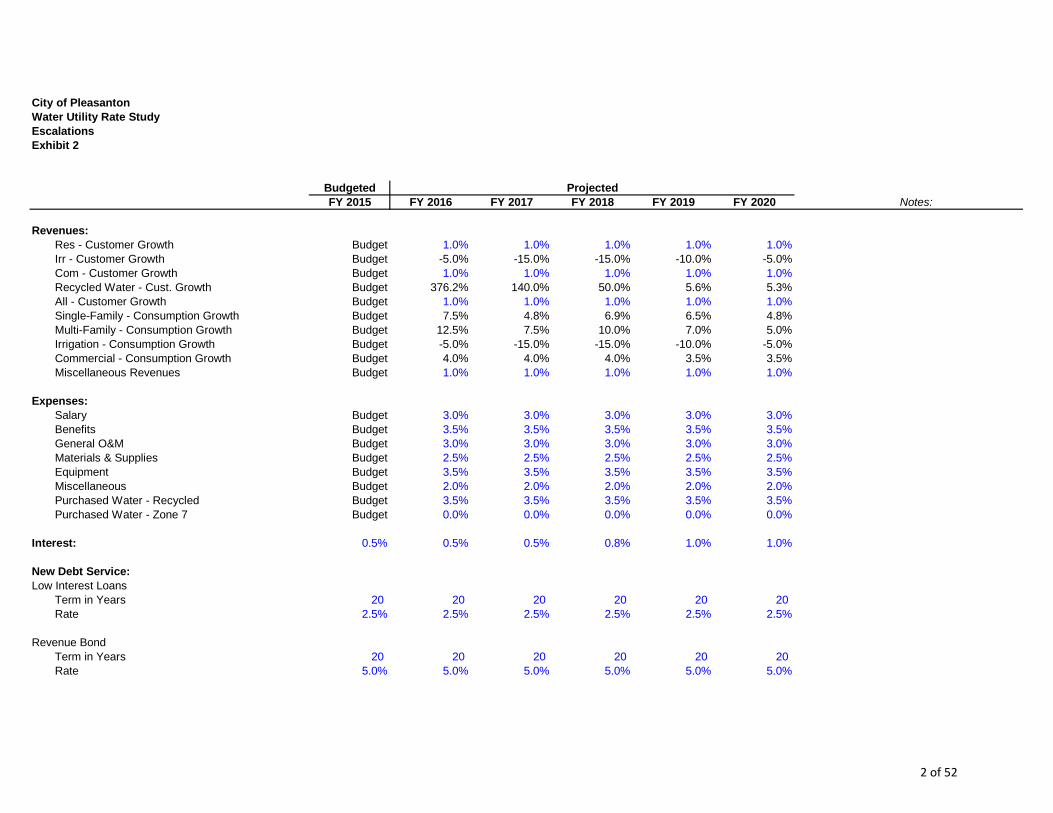
City of PleasantonWater Utility Rate StudyEscalationsExhibit 2
BudgetedFY 2015 FY 2016 FY 2017 FY 2018 FY 2019 FY 2020 Notes:
Revenues:Res - Customer Growth Budget 1.0% 1.0% 1.0% 1.0% 1.0%Irr - Customer Growth Budget -5.0% -15.0% -15.0% -10.0% -5.0%Com - Customer Growth Budget 1.0% 1.0% 1.0% 1.0% 1.0%Recycled Water - Cust. Growth Budget 376.2% 140.0% 50.0% 5.6% 5.3%All - Customer Growth Budget 1.0% 1.0% 1.0% 1.0% 1.0%Single-Family - Consumption Growth Budget 7.5% 4.8% 6.9% 6.5% 4.8%Multi-Family - Consumption Growth Budget 12.5% 7.5% 10.0% 7.0% 5.0%Irrigation - Consumption Growth Budget -5.0% -15.0% -15.0% -10.0% -5.0%Commercial - Consumption Growth Budget 4.0% 4.0% 4.0% 3.5% 3.5%Miscellaneous Revenues Budget 1.0% 1.0% 1.0% 1.0% 1.0%
Expenses:Salary Budget 3.0% 3.0% 3.0% 3.0% 3.0%Benefits Budget 3.5% 3.5% 3.5% 3.5% 3.5%General O&M Budget 3.0% 3.0% 3.0% 3.0% 3.0%Materials & Supplies Budget 2.5% 2.5% 2.5% 2.5% 2.5%Equipment Budget 3.5% 3.5% 3.5% 3.5% 3.5%Miscellaneous Budget 2.0% 2.0% 2.0% 2.0% 2.0%Purchased Water - Recycled Budget 3.5% 3.5% 3.5% 3.5% 3.5%Purchased Water - Zone 7 Budget 0.0% 0.0% 0.0% 0.0% 0.0%
Interest: 0.5% 0.5% 0.5% 0.8% 1.0% 1.0%
New Debt Service:Low Interest Loans
Term in Years 20 20 20 20 20 20Rate 2.5% 2.5% 2.5% 2.5% 2.5% 2.5%
Revenue BondTerm in Years 20 20 20 20 20 20Rate 5.0% 5.0% 5.0% 5.0% 5.0% 5.0%
Projected
2 of 52
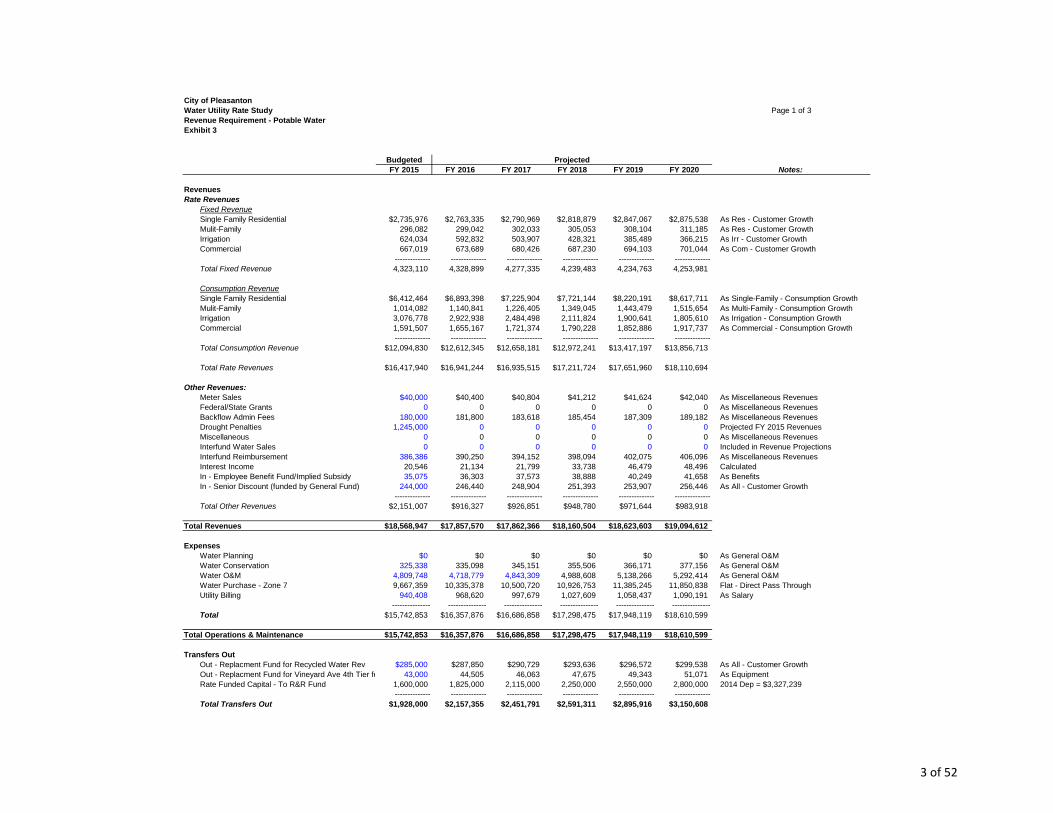
City of PleasantonWater Utility Rate Study Page 1 of 3Revenue Requirement - Potable WaterExhibit 3
BudgetedFY 2015 FY 2016 FY 2017 FY 2018 FY 2019 FY 2020 Notes:
RevenuesRate Revenues
Fixed RevenueSingle Family Residential $2,735,976 $2,763,335 $2,790,969 $2,818,879 $2,847,067 $2,875,538 As Res - Customer GrowthMulit-Family 296,082 299,042 302,033 305,053 308,104 311,185 As Res - Customer GrowthIrrigation 624,034 592,832 503,907 428,321 385,489 366,215 As Irr - Customer GrowthCommercial 667,019 673,689 680,426 687,230 694,103 701,044 As Com - Customer Growth
-------------- -------------- -------------- -------------- -------------- --------------Total Fixed Revenue 4,323,110 4,328,899 4,277,335 4,239,483 4,234,763 4,253,981
Consumption RevenueSingle Family Residential $6,412,464 $6,893,398 $7,225,904 $7,721,144 $8,220,191 $8,617,711 As Single-Family - Consumption GrowthMulit-Family 1,014,082 1,140,841 1,226,405 1,349,045 1,443,479 1,515,654 As Multi-Family - Consumption GrowthIrrigation 3,076,778 2,922,938 2,484,498 2,111,824 1,900,641 1,805,610 As Irrigation - Consumption GrowthCommercial 1,591,507 1,655,167 1,721,374 1,790,228 1,852,886 1,917,737 As Commercial - Consumption Growth
-------------- -------------- -------------- -------------- -------------- --------------Total Consumption Revenue $12,094,830 $12,612,345 $12,658,181 $12,972,241 $13,417,197 $13,856,713
Total Rate Revenues $16,417,940 $16,941,244 $16,935,515 $17,211,724 $17,651,960 $18,110,694
Other Revenues:Meter Sales $40,000 $40,400 $40,804 $41,212 $41,624 $42,040 As Miscellaneous RevenuesFederal/State Grants 0 0 0 0 0 0 As Miscellaneous RevenuesBackflow Admin Fees 180,000 181,800 183,618 185,454 187,309 189,182 As Miscellaneous RevenuesDrought Penalties 1,245,000 0 0 0 0 0 Projected FY 2015 RevenuesMiscellaneous 0 0 0 0 0 0 As Miscellaneous RevenuesInterfund Water Sales 0 0 0 0 0 0 Included in Revenue ProjectionsInterfund Reimbursement 386,386 390,250 394,152 398,094 402,075 406,096 As Miscellaneous RevenuesInterest Income 20,546 21,134 21,799 33,738 46,479 48,496 CalculatedIn - Employee Benefit Fund/Implied Subsidy 35,075 36,303 37,573 38,888 40,249 41,658 As BenefitsIn - Senior Discount (funded by General Fund) 244,000 246,440 248,904 251,393 253,907 256,446 As All - Customer Growth
-------------- -------------- -------------- -------------- -------------- --------------Total Other Revenues $2,151,007 $916,327 $926,851 $948,780 $971,644 $983,918
Total Revenues $18,568,947 $17,857,570 $17,862,366 $18,160,504 $18,623,603 $19,094,612
ExpensesWater Planning $0 $0 $0 $0 $0 $0 As General O&MWater Conservation 325,338 335,098 345,151 355,506 366,171 377,156 As General O&MWater O&M 4,809,748 4,718,779 4,843,309 4,988,608 5,138,266 5,292,414 As General O&MWater Purchase - Zone 7 9,667,359 10,335,378 10,500,720 10,926,753 11,385,245 11,850,838 Flat - Direct Pass ThroughUtility Billing 940,408 968,620 997,679 1,027,609 1,058,437 1,090,191 As Salary
--------------- --------------- --------------- --------------- --------------- ---------------Total $15,742,853 $16,357,876 $16,686,858 $17,298,475 $17,948,119 $18,610,599
Total Operations & Maintenance $15,742,853 $16,357,876 $16,686,858 $17,298,475 $17,948,119 $18,610,599
Transfers OutOut - Replacment Fund for Recycled Water Rev $285,000 $287,850 $290,729 $293,636 $296,572 $299,538 As All - Customer GrowthOut - Replacment Fund for Vineyard Ave 4th Tier fee 43,000 44,505 46,063 47,675 49,343 51,071 As EquipmentRate Funded Capital - To R&R Fund 1,600,000 1,825,000 2,115,000 2,250,000 2,550,000 2,800,000 2014 Dep = $3,327,239
-------------- -------------- -------------- -------------- -------------- --------------Total Transfers Out $1,928,000 $2,157,355 $2,451,791 $2,591,311 $2,895,916 $3,150,608
Projected
3 of 52
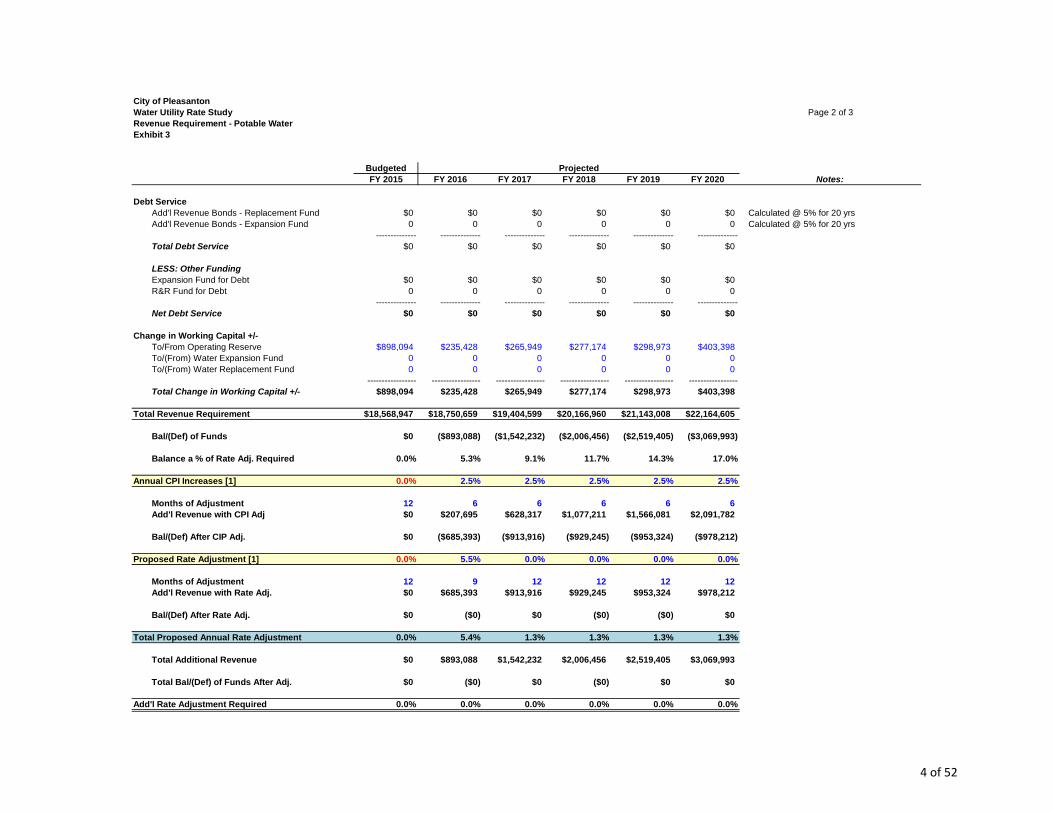
City of PleasantonWater Utility Rate Study Page 2 of 3Revenue Requirement - Potable WaterExhibit 3
BudgetedFY 2015 FY 2016 FY 2017 FY 2018 FY 2019 FY 2020 Notes:
Projected
Debt ServiceAdd'l Revenue Bonds - Replacement Fund $0 $0 $0 $0 $0 $0 Calculated @ 5% for 20 yrsAdd'l Revenue Bonds - Expansion Fund 0 0 0 0 0 0 Calculated @ 5% for 20 yrs
-------------- -------------- -------------- -------------- -------------- --------------Total Debt Service $0 $0 $0 $0 $0 $0
LESS: Other FundingExpansion Fund for Debt $0 $0 $0 $0 $0 $0R&R Fund for Debt 0 0 0 0 0 0
-------------- -------------- -------------- -------------- -------------- --------------Net Debt Service $0 $0 $0 $0 $0 $0
Change in Working Capital +/-To/From Operating Reserve $898,094 $235,428 $265,949 $277,174 $298,973 $403,398To/(From) Water Expansion Fund 0 0 0 0 0 0To/(From) Water Replacement Fund 0 0 0 0 0 0
----------------- ----------------- ----------------- ----------------- ----------------- -----------------Total Change in Working Capital +/- $898,094 $235,428 $265,949 $277,174 $298,973 $403,398
Total Revenue Requirement $18,568,947 $18,750,659 $19,404,599 $20,166,960 $21,143,008 $22,164,605
Bal/(Def) of Funds $0 ($893,088) ($1,542,232) ($2,006,456) ($2,519,405) ($3,069,993)
Balance a % of Rate Adj. Required 0.0% 5.3% 9.1% 11.7% 14.3% 17.0%
Annual CPI Increases [1] 0.0% 2.5% 2.5% 2.5% 2.5% 2.5%
Months of Adjustment 12 6 6 6 6 6Add'l Revenue with CPI Adj $0 $207,695 $628,317 $1,077,211 $1,566,081 $2,091,782
Bal/(Def) After CIP Adj. $0 ($685,393) ($913,916) ($929,245) ($953,324) ($978,212)
Proposed Rate Adjustment [1] 0.0% 5.5% 0.0% 0.0% 0.0% 0.0%
Months of Adjustment 12 9 12 12 12 12Add'l Revenue with Rate Adj. $0 $685,393 $913,916 $929,245 $953,324 $978,212
Bal/(Def) After Rate Adj. $0 ($0) $0 ($0) ($0) $0
Total Proposed Annual Rate Adjustment 0.0% 5.4% 1.3% 1.3% 1.3% 1.3%
Total Additional Revenue $0 $893,088 $1,542,232 $2,006,456 $2,519,405 $3,069,993
Total Bal/(Def) of Funds After Adj. $0 ($0) $0 ($0) $0 $0
Add'l Rate Adjustment Required 0.0% 0.0% 0.0% 0.0% 0.0% 0.0%
4 of 52
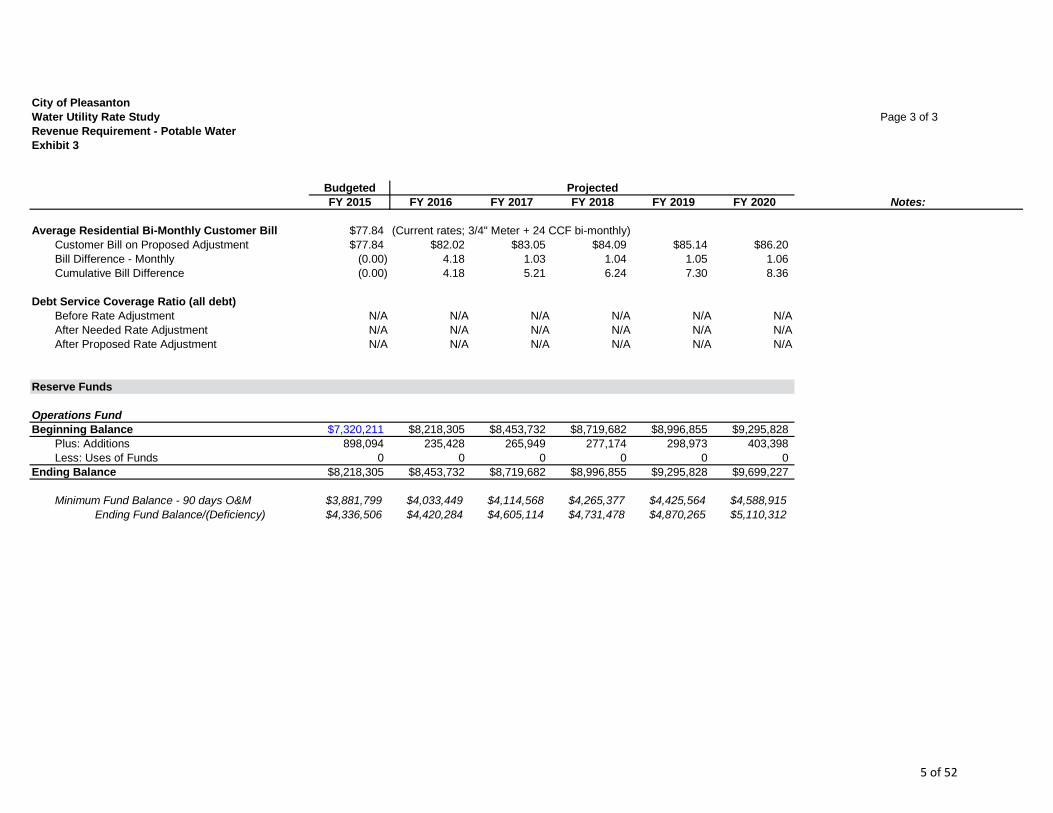
City of PleasantonWater Utility Rate Study Page 3 of 3Revenue Requirement - Potable WaterExhibit 3
BudgetedFY 2015 FY 2016 FY 2017 FY 2018 FY 2019 FY 2020 Notes:
Projected
Average Residential Bi-Monthly Customer Bill $77.84 (Current rates; 3/4" Meter + 24 CCF bi-monthly)Customer Bill on Proposed Adjustment $77.84 $82.02 $83.05 $84.09 $85.14 $86.20Bill Difference - Monthly (0.00) 4.18 1.03 1.04 1.05 1.06Cumulative Bill Difference (0.00) 4.18 5.21 6.24 7.30 8.36
Debt Service Coverage Ratio (all debt)Before Rate Adjustment N/A N/A N/A N/A N/A N/AAfter Needed Rate Adjustment N/A N/A N/A N/A N/A N/AAfter Proposed Rate Adjustment N/A N/A N/A N/A N/A N/A
Reserve Funds
Operations FundBeginning Balance $7,320,211 $8,218,305 $8,453,732 $8,719,682 $8,996,855 $9,295,828
Plus: Additions 898,094 235,428 265,949 277,174 298,973 403,398Less: Uses of Funds 0 0 0 0 0 0
Ending Balance $8,218,305 $8,453,732 $8,719,682 $8,996,855 $9,295,828 $9,699,227
Minimum Fund Balance - 90 days O&M $3,881,799 $4,033,449 $4,114,568 $4,265,377 $4,425,564 $4,588,915Ending Fund Balance/(Deficiency) $4,336,506 $4,420,284 $4,605,114 $4,731,478 $4,870,265 $5,110,312
5 of 52
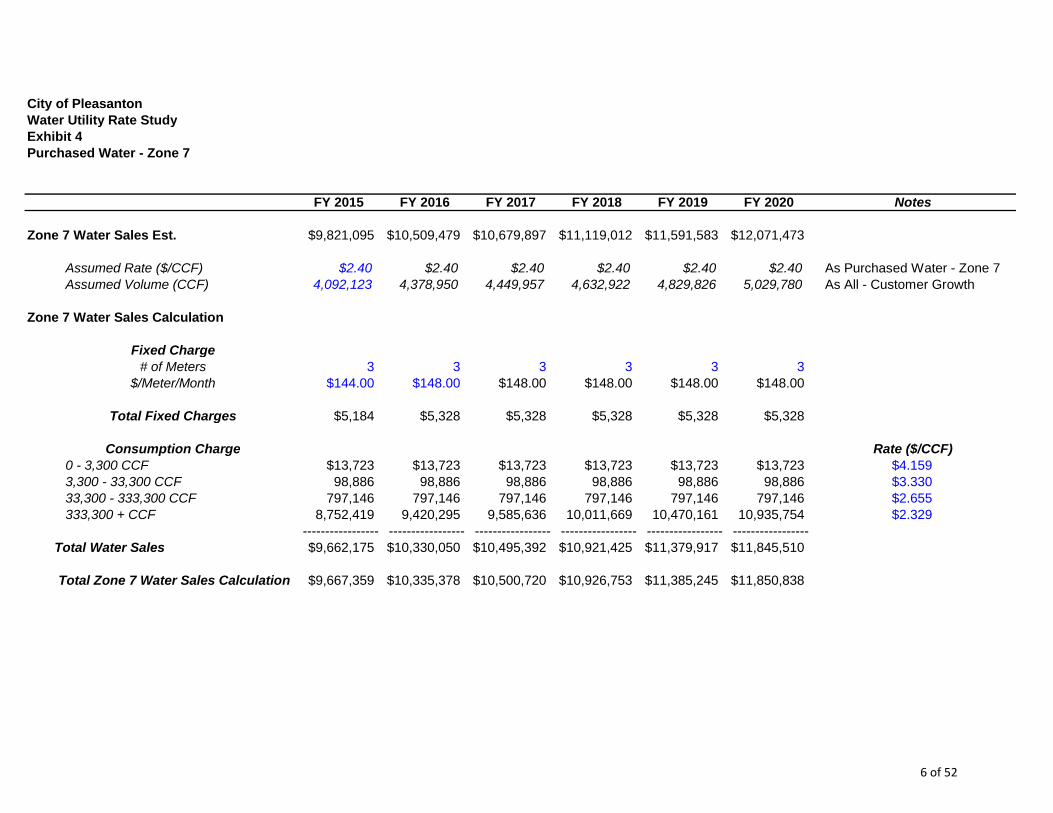
City of PleasantonWater Utility Rate StudyExhibit 4Purchased Water - Zone 7
FY 2015 FY 2016 FY 2017 FY 2018 FY 2019 FY 2020 Notes
Zone 7 Water Sales Est. $9,821,095 $10,509,479 $10,679,897 $11,119,012 $11,591,583 $12,071,473
Assumed Rate ($/CCF) $2.40 $2.40 $2.40 $2.40 $2.40 $2.40 As Purchased Water - Zone 7Assumed Volume (CCF) 4,092,123 4,378,950 4,449,957 4,632,922 4,829,826 5,029,780 As All - Customer Growth
4,277,883 4,378,950 4,449,957 4,632,922 4,829,826 5,029,780Zone 7 Water Sales Calculation
Fixed Charge# of Meters 3 3 3 3 3 3
$/Meter/Month $144.00 $148.00 $148.00 $148.00 $148.00 $148.00
Total Fixed Charges $5,184 $5,328 $5,328 $5,328 $5,328 $5,328
Consumption Charge Rate ($/CCF)0 - 3,300 CCF $13,723 $13,723 $13,723 $13,723 $13,723 $13,723 $4.1593,300 - 33,300 CCF 98,886 98,886 98,886 98,886 98,886 98,886 $3.33033,300 - 333,300 CCF 797,146 797,146 797,146 797,146 797,146 797,146 $2.655333,300 + CCF 8,752,419 9,420,295 9,585,636 10,011,669 10,470,161 10,935,754 $2.329
----------------- ----------------- ----------------- ----------------- ----------------- -----------------Total Water Sales $9,662,175 $10,330,050 $10,495,392 $10,921,425 $11,379,917 $11,845,510
Total Zone 7 Water Sales Calculation $9,667,359 $10,335,378 $10,500,720 $10,926,753 $11,385,245 $11,850,838
6 of 52
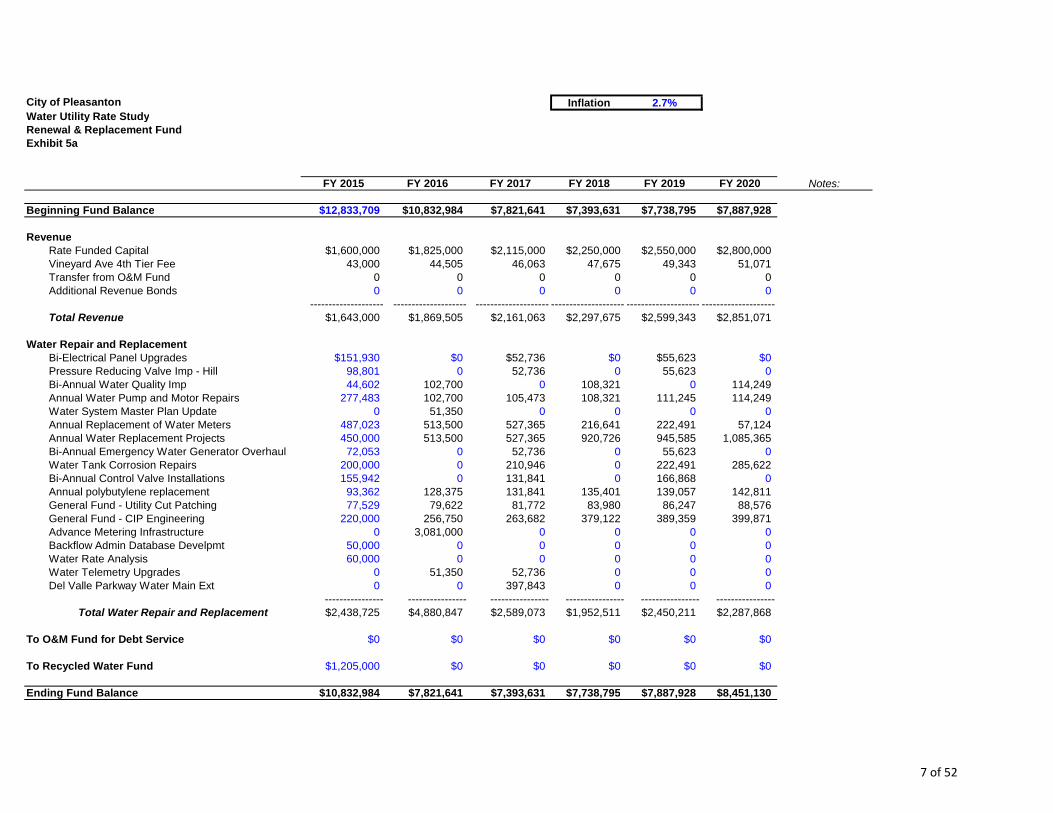
City of Pleasanton Inflation 2.7%Water Utility Rate StudyRenewal & Replacement FundExhibit 5a
FY 2015 FY 2016 FY 2017 FY 2018 FY 2019 FY 2020 Notes:
Beginning Fund Balance $12,833,709 $10,832,984 $7,821,641 $7,393,631 $7,738,795 $7,887,928
RevenueRate Funded Capital $1,600,000 $1,825,000 $2,115,000 $2,250,000 $2,550,000 $2,800,000Vineyard Ave 4th Tier Fee 43,000 44,505 46,063 47,675 49,343 51,071Transfer from O&M Fund 0 0 0 0 0 0Additional Revenue Bonds 0 0 0 0 0 0
-------------------- -------------------- -------------------- -------------------- -------------------- --------------------Total Revenue $1,643,000 $1,869,505 $2,161,063 $2,297,675 $2,599,343 $2,851,071
Water Repair and ReplacementBi-Electrical Panel Upgrades $151,930 $0 $52,736 $0 $55,623 $0Pressure Reducing Valve Imp - Hill 98,801 0 52,736 0 55,623 0Bi-Annual Water Quality Imp 44,602 102,700 0 108,321 0 114,249Annual Water Pump and Motor Repairs 277,483 102,700 105,473 108,321 111,245 114,249Water System Master Plan Update 0 51,350 0 0 0 0Annual Replacement of Water Meters 487,023 513,500 527,365 216,641 222,491 57,124Annual Water Replacement Projects 450,000 513,500 527,365 920,726 945,585 1,085,365Bi-Annual Emergency Water Generator Overhaul 72,053 0 52,736 0 55,623 0Water Tank Corrosion Repairs 200,000 0 210,946 0 222,491 285,622Bi-Annual Control Valve Installations 155,942 0 131,841 0 166,868 0Annual polybutylene replacement 93,362 128,375 131,841 135,401 139,057 142,811General Fund - Utility Cut Patching 77,529 79,622 81,772 83,980 86,247 88,576General Fund - CIP Engineering 220,000 256,750 263,682 379,122 389,359 399,871Advance Metering Infrastructure 0 3,081,000 0 0 0 0Backflow Admin Database Develpmt 50,000 0 0 0 0 0Water Rate Analysis 60,000 0 0 0 0 0Water Telemetry Upgrades 0 51,350 52,736 0 0 0Del Valle Parkway Water Main Ext 0 0 397,843 0 0 0
---------------- ---------------- ---------------- ---------------- ---------------- ----------------Total Water Repair and Replacement $2,438,725 $4,880,847 $2,589,073 $1,952,511 $2,450,211 $2,287,868
To O&M Fund for Debt Service $0 $0 $0 $0 $0 $0
To Recycled Water Fund $1,205,000 $0 $0 $0 $0 $0
Ending Fund Balance $10,832,984 $7,821,641 $7,393,631 $7,738,795 $7,887,928 $8,451,130
7 of 52
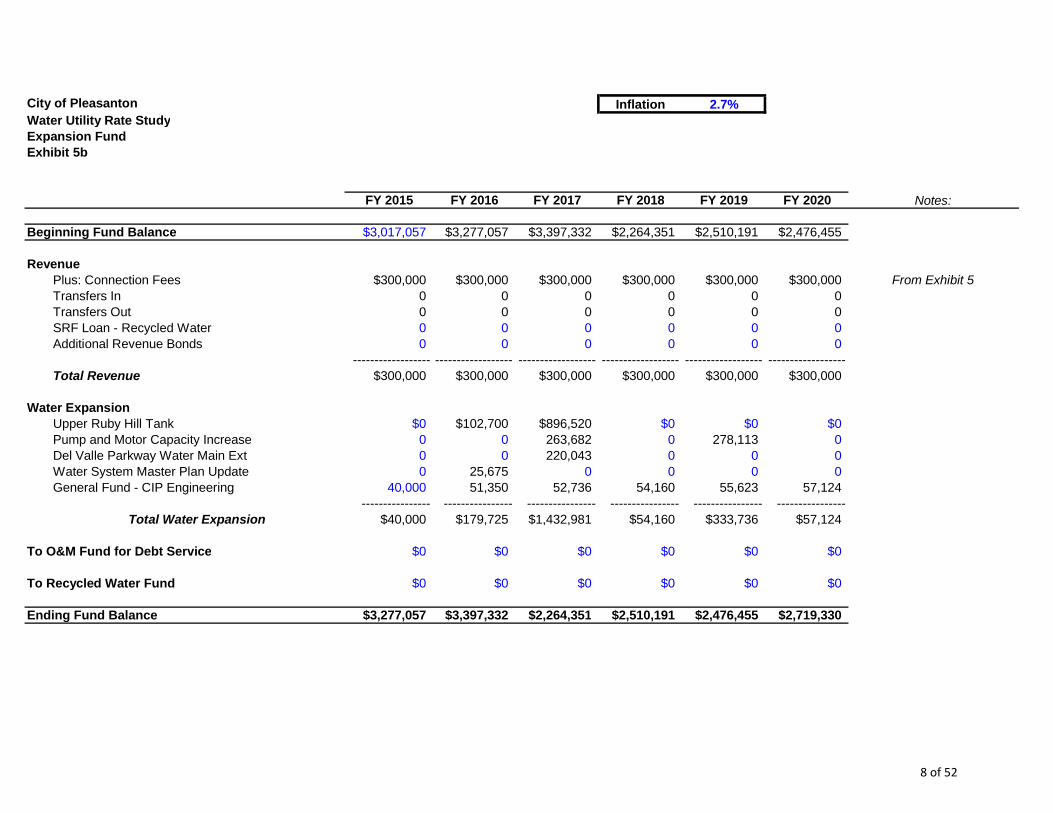
City of Pleasanton Inflation 2.7%Water Utility Rate StudyExpansion FundExhibit 5b
FY 2015 FY 2016 FY 2017 FY 2018 FY 2019 FY 2020 Notes:
Beginning Fund Balance $3,017,057 $3,277,057 $3,397,332 $2,264,351 $2,510,191 $2,476,455
RevenuePlus: Connection Fees $300,000 $300,000 $300,000 $300,000 $300,000 $300,000 From Exhibit 5Transfers In 0 0 0 0 0 0Transfers Out 0 0 0 0 0 0SRF Loan - Recycled Water 0 0 0 0 0 0Additional Revenue Bonds 0 0 0 0 0 0
------------------ ------------------ ------------------ ------------------ ------------------ ------------------Total Revenue $300,000 $300,000 $300,000 $300,000 $300,000 $300,000
Water ExpansionUpper Ruby Hill Tank $0 $102,700 $896,520 $0 $0 $0Pump and Motor Capacity Increase 0 0 263,682 0 278,113 0Del Valle Parkway Water Main Ext 0 0 220,043 0 0 0Water System Master Plan Update 0 25,675 0 0 0 0General Fund - CIP Engineering 40,000 51,350 52,736 54,160 55,623 57,124
---------------- ---------------- ---------------- ---------------- ---------------- ----------------Total Water Expansion $40,000 $179,725 $1,432,981 $54,160 $333,736 $57,124
To O&M Fund for Debt Service $0 $0 $0 $0 $0 $0
To Recycled Water Fund $0 $0 $0 $0 $0 $0
Ending Fund Balance $3,277,057 $3,397,332 $2,264,351 $2,510,191 $2,476,455 $2,719,330
8 of 52
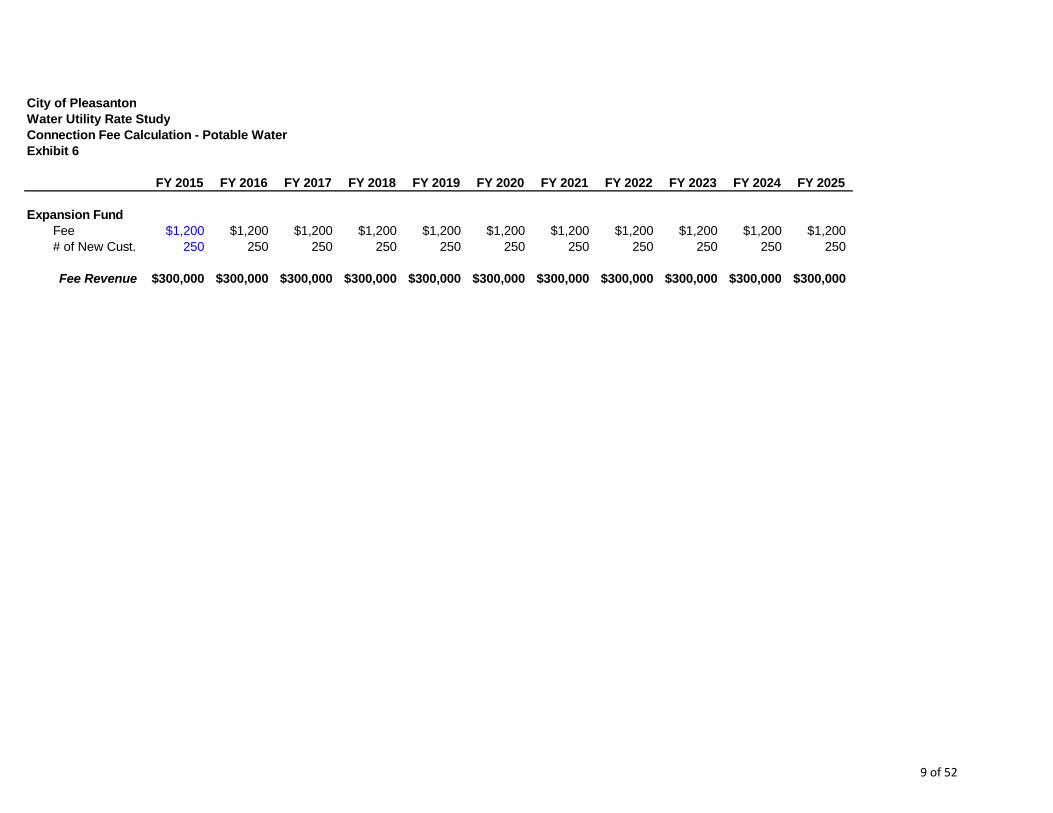
City of PleasantonWater Utility Rate StudyConnection Fee Calculation - Potable WaterExhibit 6
FY 2015 FY 2016 FY 2017 FY 2018 FY 2019 FY 2020 FY 2021 FY 2022 FY 2023 FY 2024 FY 2025
Expansion FundFee $1,200 $1,200 $1,200 $1,200 $1,200 $1,200 $1,200 $1,200 $1,200 $1,200 $1,200# of New Cust. 250 250 250 250 250 250 250 250 250 250 250
Fee Revenue $300,000 $300,000 $300,000 $300,000 $300,000 $300,000 $300,000 $300,000 $300,000 $300,000 $300,000
9 of 52
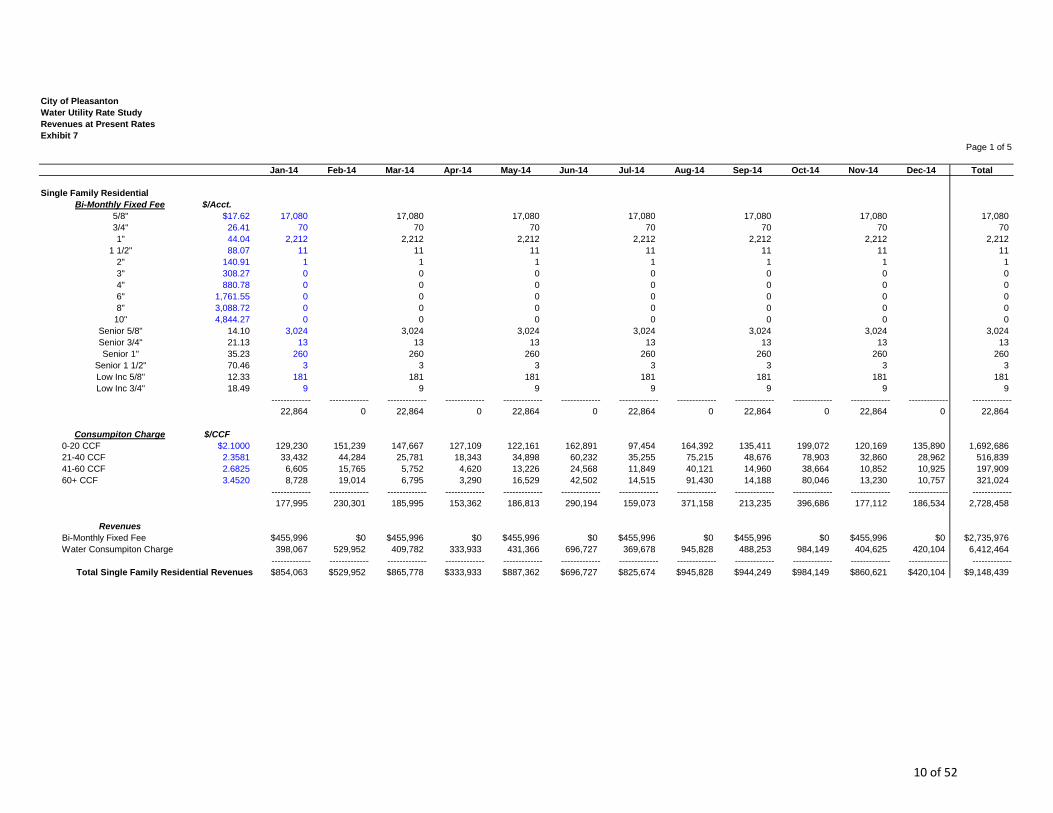
City of PleasantonWater Utility Rate StudyRevenues at Present RatesExhibit 7
Page 1 of 5
Jan-14 Feb-14 Mar-14 Apr-14 May-14 Jun-14 Jul-14 Aug-14 Sep-14 Oct-14 Nov-14 Dec-14 Total
Single Family ResidentialBi-Monthly Fixed Fee $/Acct.
5/8" $17.62 17,080 17,080 17,080 17,080 17,080 17,080 17,0803/4" 26.41 70 70 70 70 70 70 701" 44.04 2,212 2,212 2,212 2,212 2,212 2,212 2,212
1 1/2" 88.07 11 11 11 11 11 11 112" 140.91 1 1 1 1 1 1 13" 308.27 0 0 0 0 0 0 04" 880.78 0 0 0 0 0 0 06" 1,761.55 0 0 0 0 0 0 08" 3,088.72 0 0 0 0 0 0 0
10" 4,844.27 0 0 0 0 0 0 0Senior 5/8" 14.10 3,024 3,024 3,024 3,024 3,024 3,024 3,024Senior 3/4" 21.13 13 13 13 13 13 13 13Senior 1" 35.23 260 260 260 260 260 260 260
Senior 1 1/2" 70.46 3 3 3 3 3 3 3Low Inc 5/8" 12.33 181 181 181 181 181 181 181Low Inc 3/4" 18.49 9 9 9 9 9 9 9
------------- ------------- ------------- ------------- ------------- ------------- ------------- ------------- ------------- ------------- ------------- ------------- -------------22,864 0 22,864 0 22,864 0 22,864 0 22,864 0 22,864 0 22,864
Consumpiton Charge $/CCF0-20 CCF $2.1000 129,230 151,239 147,667 127,109 122,161 162,891 97,454 164,392 135,411 199,072 120,169 135,890 1,692,68621-40 CCF 2.3581 33,432 44,284 25,781 18,343 34,898 60,232 35,255 75,215 48,676 78,903 32,860 28,962 516,83941-60 CCF 2.6825 6,605 15,765 5,752 4,620 13,226 24,568 11,849 40,121 14,960 38,664 10,852 10,925 197,90960+ CCF 3.4520 8,728 19,014 6,795 3,290 16,529 42,502 14,515 91,430 14,188 80,046 13,230 10,757 321,024
------------- ------------- ------------- ------------- ------------- ------------- ------------- ------------- ------------- ------------- ------------- ------------- -------------177,995 230,301 185,995 153,362 186,813 290,194 159,073 371,158 213,235 396,686 177,112 186,534 2,728,458
RevenuesBi-Monthly Fixed Fee $455,996 $0 $455,996 $0 $455,996 $0 $455,996 $0 $455,996 $0 $455,996 $0 $2,735,976Water Consumpiton Charge 398,067 529,952 409,782 333,933 431,366 696,727 369,678 945,828 488,253 984,149 404,625 420,104 6,412,464
------------- ------------- ------------- ------------- ------------- ------------- ------------- ------------- ------------- ------------- ------------- ------------- -------------Total Single Family Residential Revenues $854,063 $529,952 $865,778 $333,933 $887,362 $696,727 $825,674 $945,828 $944,249 $984,149 $860,621 $420,104 $9,148,439
10 of 52
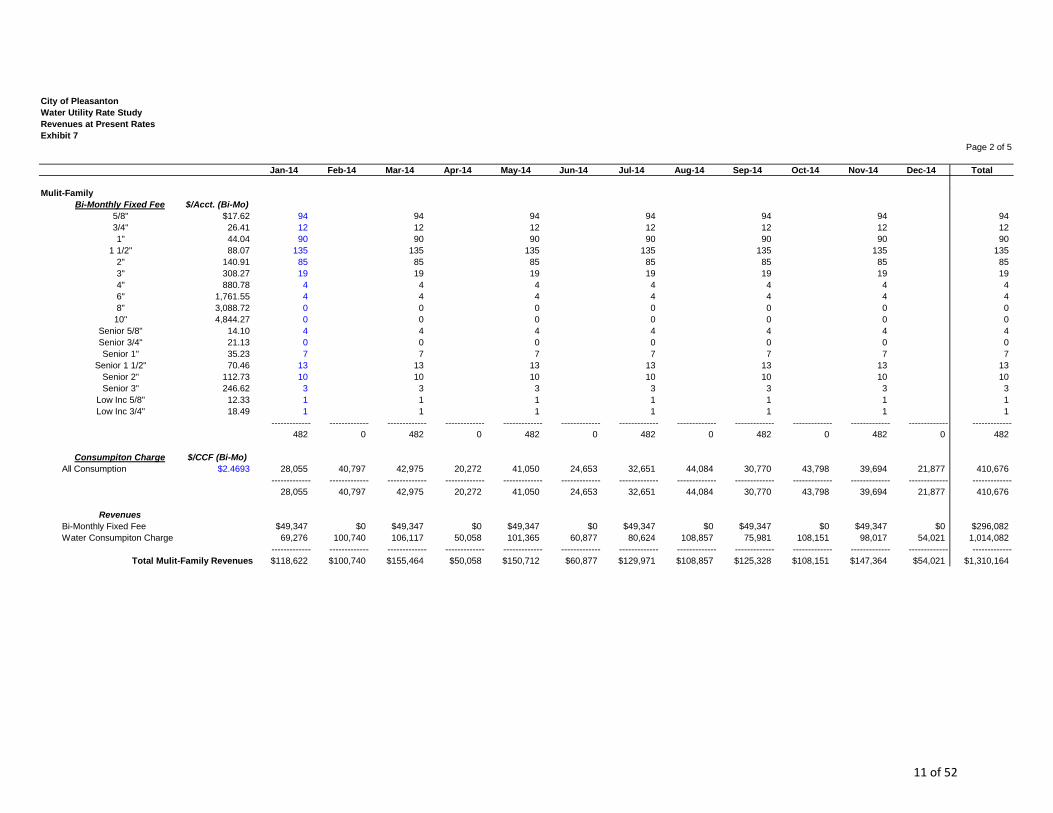
City of PleasantonWater Utility Rate StudyRevenues at Present RatesExhibit 7
Page 2 of 5
Jan-14 Feb-14 Mar-14 Apr-14 May-14 Jun-14 Jul-14 Aug-14 Sep-14 Oct-14 Nov-14 Dec-14 Total
Mulit-FamilyBi-Monthly Fixed Fee $/Acct. (Bi-Mo)
5/8" $17.62 94 94 94 94 94 94 943/4" 26.41 12 12 12 12 12 12 121" 44.04 90 90 90 90 90 90 90
1 1/2" 88.07 135 135 135 135 135 135 1352" 140.91 85 85 85 85 85 85 853" 308.27 19 19 19 19 19 19 194" 880.78 4 4 4 4 4 4 46" 1,761.55 4 4 4 4 4 4 48" 3,088.72 0 0 0 0 0 0 0
10" 4,844.27 0 0 0 0 0 0 0Senior 5/8" 14.10 4 4 4 4 4 4 4Senior 3/4" 21.13 0 0 0 0 0 0 0Senior 1" 35.23 7 7 7 7 7 7 7
Senior 1 1/2" 70.46 13 13 13 13 13 13 13Senior 2" 112.73 10 10 10 10 10 10 10Senior 3" 246.62 3 3 3 3 3 3 3
Low Inc 5/8" 12.33 1 1 1 1 1 1 1Low Inc 3/4" 18.49 1 1 1 1 1 1 1
------------- ------------- ------------- ------------- ------------- ------------- ------------- ------------- ------------- ------------- ------------- ------------- -------------482 0 482 0 482 0 482 0 482 0 482 0 482
Consumpiton Charge $/CCF (Bi-Mo)All Consumption $2.4693 28,055 40,797 42,975 20,272 41,050 24,653 32,651 44,084 30,770 43,798 39,694 21,877 410,676
------------- ------------- ------------- ------------- ------------- ------------- ------------- ------------- ------------- ------------- ------------- ------------- -------------28,055 40,797 42,975 20,272 41,050 24,653 32,651 44,084 30,770 43,798 39,694 21,877 410,676
RevenuesBi-Monthly Fixed Fee $49,347 $0 $49,347 $0 $49,347 $0 $49,347 $0 $49,347 $0 $49,347 $0 $296,082Water Consumpiton Charge 69,276 100,740 106,117 50,058 101,365 60,877 80,624 108,857 75,981 108,151 98,017 54,021 1,014,082
------------- ------------- ------------- ------------- ------------- ------------- ------------- ------------- ------------- ------------- ------------- ------------- -------------Total Mulit-Family Revenues $118,622 $100,740 $155,464 $50,058 $150,712 $60,877 $129,971 $108,857 $125,328 $108,151 $147,364 $54,021 $1,310,164
11 of 52

City of PleasantonWater Utility Rate StudyRevenues at Present RatesExhibit 7
Page 3 of 5
Jan-14 Feb-14 Mar-14 Apr-14 May-14 Jun-14 Jul-14 Aug-14 Sep-14 Oct-14 Nov-14 Dec-14 Total
IrrigationBi-Monthly Fixed Fee $/Acct.
5/8" $17.62 148 148 148 148 148 148 1483/4" 26.41 62 62 62 62 62 62 621" 44.04 225 225 225 225 225 225 225
1 1/2" 88.07 303 303 303 303 303 303 3032" 140.91 217 217 217 217 217 217 2173" 308.27 20 20 20 20 20 20 204" 880.78 15 15 15 15 15 15 156" 1,761.55 2 2 2 2 2 2 28" 3,088.72 0 0 0 0 0 0 0
10" 4,844.27 2 2 2 2 2 2 2------------- ------------- ------------- ------------- ------------- ------------- ------------- ------------- ------------- ------------- ------------- ------------- -------------
994 0 994 0 994 0 994 0 994 0 994 0 994
Consumpiton Charge $/CCFAll Consumption $2.6152 78,654 34,784 61,632 19,966 106,798 62,757 171,310 137,747 199,193 122,004 145,909 35,745 1,176,498
--------- --------- --------- --------- --------- --------- --------- --------- --------- --------- --------- --------- ---------78,654 34,784 61,632 19,966 106,798 62,757 171,310 137,747 199,193 122,004 145,909 35,745 1,176,498
RevenuesBi-Monthly Fixed Fee $104,006 $0 $104,006 $0 $104,006 $0 $104,006 $0 $104,006 $0 $104,006 $0 $624,034Consumpiton Charge 205,695 90,968 161,180 52,214 279,299 164,121 448,009 360,237 520,930 319,065 381,580 93,479 3,076,778
--------- --------- --------- --------- --------- --------- --------- --------- --------- --------- --------- --------- ---------Total Irrigation Revenues $309,701 $90,968 $265,186 $52,214 $383,305 $164,121 $552,015 $360,237 $624,935 $319,065 $485,586 $93,479 $3,700,812
12 of 52
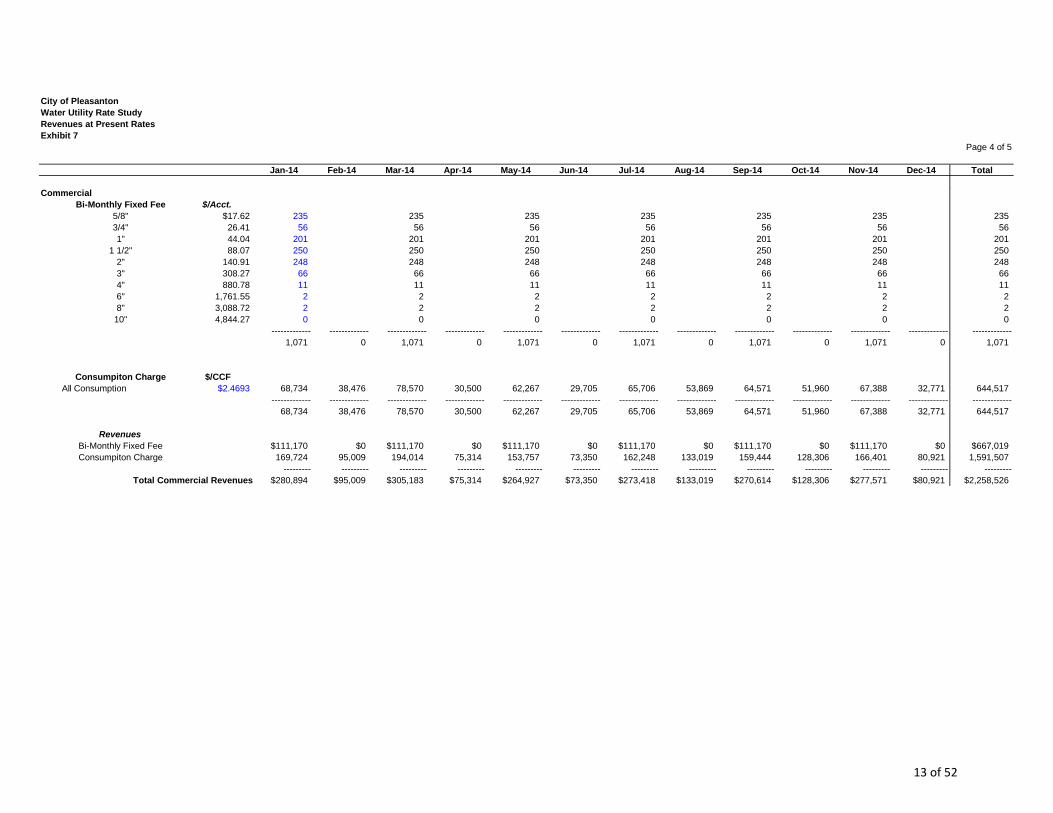
City of PleasantonWater Utility Rate StudyRevenues at Present RatesExhibit 7
Page 4 of 5
Jan-14 Feb-14 Mar-14 Apr-14 May-14 Jun-14 Jul-14 Aug-14 Sep-14 Oct-14 Nov-14 Dec-14 Total
CommercialBi-Monthly Fixed Fee $/Acct.
5/8" $17.62 235 235 235 235 235 235 2353/4" 26.41 56 56 56 56 56 56 561" 44.04 201 201 201 201 201 201 201
1 1/2" 88.07 250 250 250 250 250 250 2502" 140.91 248 248 248 248 248 248 2483" 308.27 66 66 66 66 66 66 664" 880.78 11 11 11 11 11 11 116" 1,761.55 2 2 2 2 2 2 28" 3,088.72 2 2 2 2 2 2 2
10" 4,844.27 0 0 0 0 0 0 0------------- ------------- ------------- ------------- ------------- ------------- ------------- ------------- ------------- ------------- ------------- ------------- -------------
1,071 0 1,071 0 1,071 0 1,071 0 1,071 0 1,071 0 1,071
Consumpiton Charge $/CCFAll Consumption $2.4693 68,734 38,476 78,570 30,500 62,267 29,705 65,706 53,869 64,571 51,960 67,388 32,771 644,517
------------- ------------- ------------- ------------- ------------- ------------- ------------- ------------- ------------- ------------- ------------- ------------- -------------68,734 38,476 78,570 30,500 62,267 29,705 65,706 53,869 64,571 51,960 67,388 32,771 644,517
RevenuesBi-Monthly Fixed Fee $111,170 $0 $111,170 $0 $111,170 $0 $111,170 $0 $111,170 $0 $111,170 $0 $667,019Consumpiton Charge 169,724 95,009 194,014 75,314 153,757 73,350 162,248 133,019 159,444 128,306 166,401 80,921 1,591,507
--------- --------- --------- --------- --------- --------- --------- --------- --------- --------- --------- --------- ---------Total Commercial Revenues $280,894 $95,009 $305,183 $75,314 $264,927 $73,350 $273,418 $133,019 $270,614 $128,306 $277,571 $80,921 $2,258,526
13 of 52
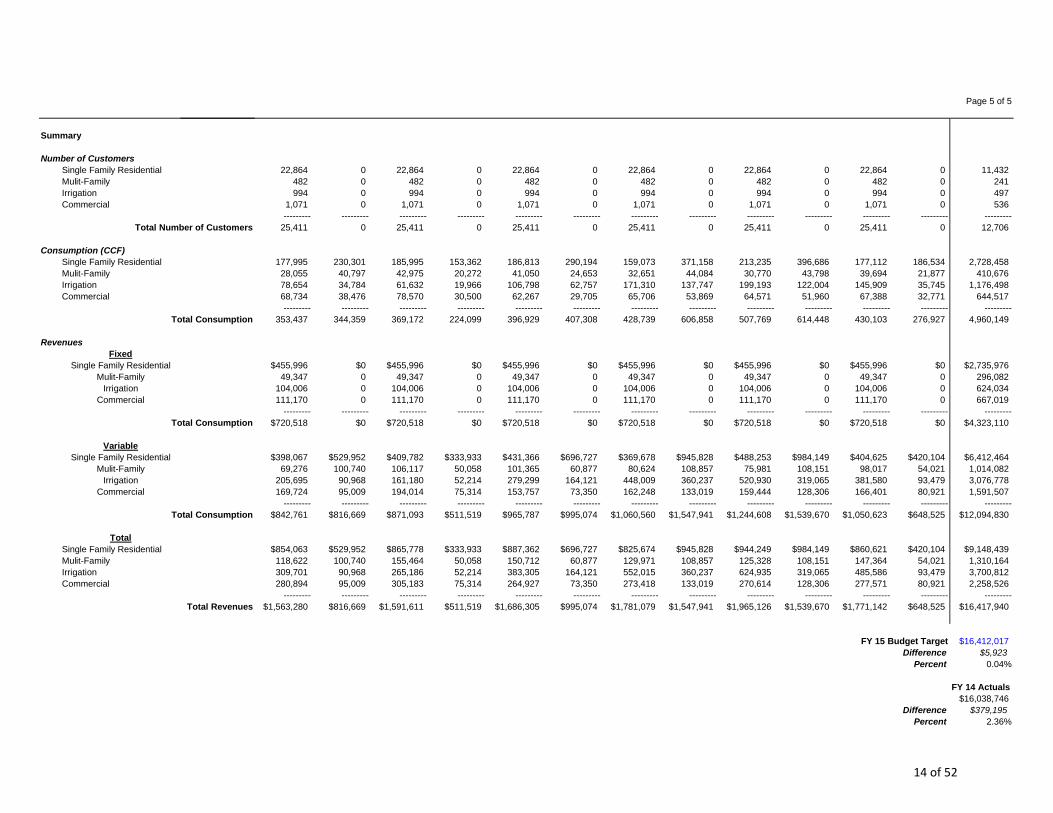
Page 5 of 5
Summary
Number of CustomersSingle Family Residential 22,864 0 22,864 0 22,864 0 22,864 0 22,864 0 22,864 0 11,432Mulit-Family 482 0 482 0 482 0 482 0 482 0 482 0 241Irrigation 994 0 994 0 994 0 994 0 994 0 994 0 497Commercial 1,071 0 1,071 0 1,071 0 1,071 0 1,071 0 1,071 0 536
--------- --------- --------- --------- --------- --------- --------- --------- --------- --------- --------- --------- ---------Total Number of Customers 25,411 0 25,411 0 25,411 0 25,411 0 25,411 0 25,411 0 12,706
Consumption (CCF)
Single Family Residential 177,995 230,301 185,995 153,362 186,813 290,194 159,073 371,158 213,235 396,686 177,112 186,534 2,728,458Mulit-Family 28,055 40,797 42,975 20,272 41,050 24,653 32,651 44,084 30,770 43,798 39,694 21,877 410,676Irrigation 78,654 34,784 61,632 19,966 106,798 62,757 171,310 137,747 199,193 122,004 145,909 35,745 1,176,498Commercial 68,734 38,476 78,570 30,500 62,267 29,705 65,706 53,869 64,571 51,960 67,388 32,771 644,517
--------- --------- --------- --------- --------- --------- --------- --------- --------- --------- --------- --------- ---------Total Consumption 353,437 344,359 369,172 224,099 396,929 407,308 428,739 606,858 507,769 614,448 430,103 276,927 4,960,149
RevenuesFixed
Single Family Residential $455,996 $0 $455,996 $0 $455,996 $0 $455,996 $0 $455,996 $0 $455,996 $0 $2,735,976Mulit-Family 49,347 0 49,347 0 49,347 0 49,347 0 49,347 0 49,347 0 296,082
Irrigation 104,006 0 104,006 0 104,006 0 104,006 0 104,006 0 104,006 0 624,034Commercial 111,170 0 111,170 0 111,170 0 111,170 0 111,170 0 111,170 0 667,019
--------- --------- --------- --------- --------- --------- --------- --------- --------- --------- --------- --------- ---------Total Consumption $720,518 $0 $720,518 $0 $720,518 $0 $720,518 $0 $720,518 $0 $720,518 $0 $4,323,110
VariableSingle Family Residential $398,067 $529,952 $409,782 $333,933 $431,366 $696,727 $369,678 $945,828 $488,253 $984,149 $404,625 $420,104 $6,412,464
Mulit-Family 69,276 100,740 106,117 50,058 101,365 60,877 80,624 108,857 75,981 108,151 98,017 54,021 1,014,082Irrigation 205,695 90,968 161,180 52,214 279,299 164,121 448,009 360,237 520,930 319,065 381,580 93,479 3,076,778
Commercial 169,724 95,009 194,014 75,314 153,757 73,350 162,248 133,019 159,444 128,306 166,401 80,921 1,591,507--------- --------- --------- --------- --------- --------- --------- --------- --------- --------- --------- --------- ---------
Total Consumption $842,761 $816,669 $871,093 $511,519 $965,787 $995,074 $1,060,560 $1,547,941 $1,244,608 $1,539,670 $1,050,623 $648,525 $12,094,830
TotalSingle Family Residential $854,063 $529,952 $865,778 $333,933 $887,362 $696,727 $825,674 $945,828 $944,249 $984,149 $860,621 $420,104 $9,148,439Mulit-Family 118,622 100,740 155,464 50,058 150,712 60,877 129,971 108,857 125,328 108,151 147,364 54,021 1,310,164Irrigation 309,701 90,968 265,186 52,214 383,305 164,121 552,015 360,237 624,935 319,065 485,586 93,479 3,700,812Commercial 280,894 95,009 305,183 75,314 264,927 73,350 273,418 133,019 270,614 128,306 277,571 80,921 2,258,526
--------- --------- --------- --------- --------- --------- --------- --------- --------- --------- --------- --------- ---------Total Revenues $1,563,280 $816,669 $1,591,611 $511,519 $1,686,305 $995,074 $1,781,079 $1,547,941 $1,965,126 $1,539,670 $1,771,142 $648,525 $16,417,940
FY 15 Budget Target $16,412,017Difference $5,923
Percent 0.04%
FY 14 Actuals$16,038,746
Difference $379,195Percent 2.36%
14 of 52
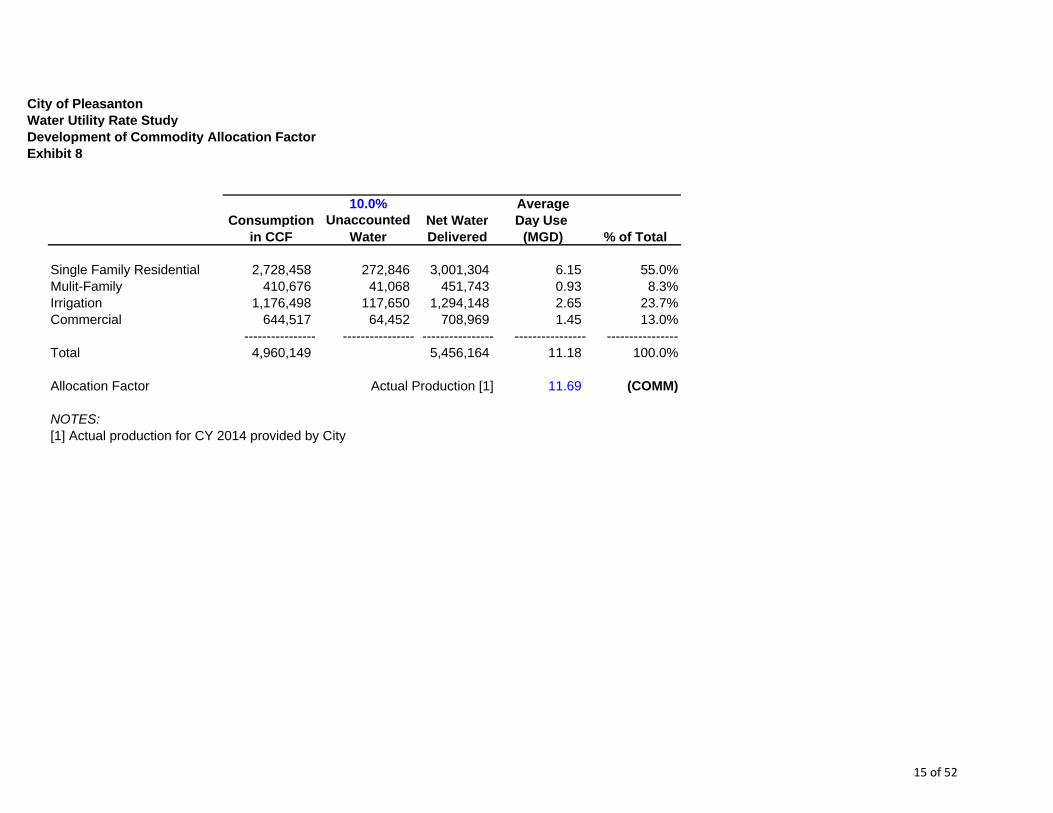
City of PleasantonWater Utility Rate StudyDevelopment of Commodity Allocation FactorExhibit 8
10.0% AverageConsumption Unaccounted Net Water Day Use
in CCF Water Delivered (MGD) % of Total
Single Family Residential 2,728,458 272,846 3,001,304 6.15 55.0%Mulit-Family 410,676 41,068 451,743 0.93 8.3%Irrigation 1,176,498 117,650 1,294,148 2.65 23.7%Commercial 644,517 64,452 708,969 1.45 13.0%
---------------- ---------------- ---------------- ---------------- ----------------Total 4,960,149 5,456,164 11.18 100.0%
Allocation Factor Actual Production [1] 11.69 (COMM)
NOTES:[1] Actual production for CY 2014 provided by City
15 of 52
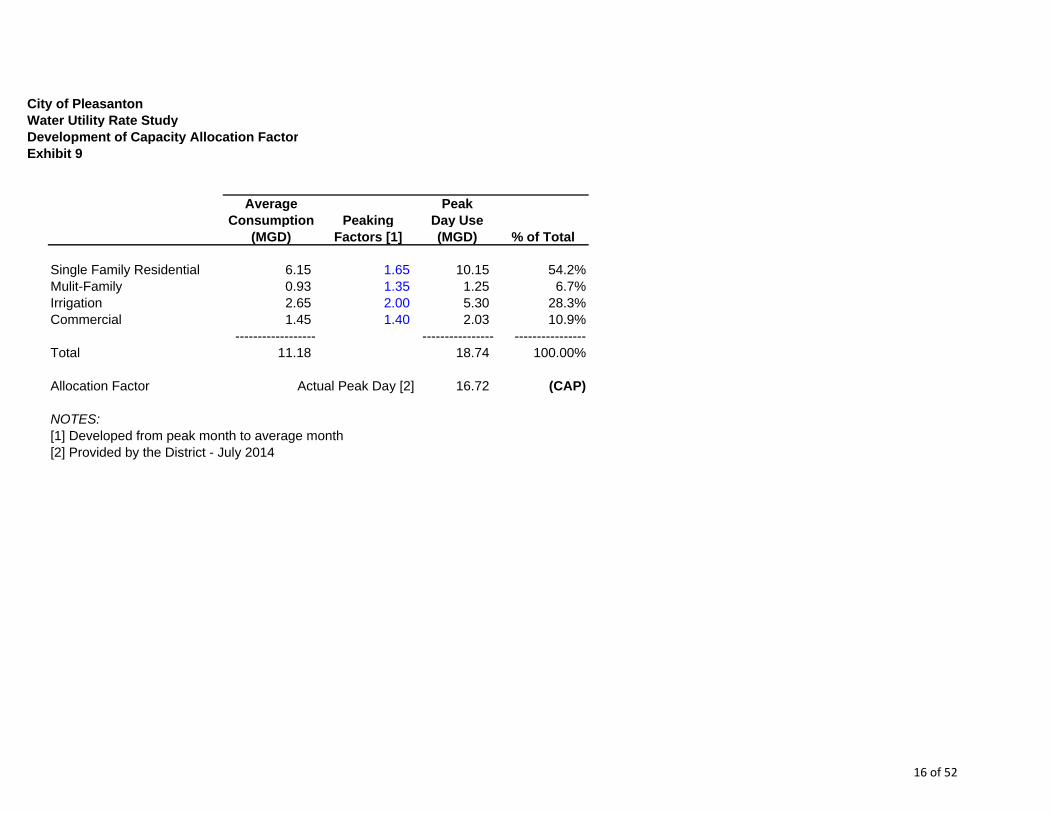
City of PleasantonWater Utility Rate StudyDevelopment of Capacity Allocation FactorExhibit 9
Average PeakConsumption Peaking Day Use
(MGD) Factors [1] (MGD) % of Total
Single Family Residential 6.15 1.65 10.15 54.2%Mulit-Family 0.93 1.35 1.25 6.7%Irrigation 2.65 2.00 5.30 28.3%Commercial 1.45 1.40 2.03 10.9%
------------------ ---------------- ----------------Total 11.18 18.74 100.00%
Allocation Factor Actual Peak Day [2] 16.72 (CAP)
NOTES:[1] Developed from peak month to average month[2] Provided by the District - July 2014
16 of 52
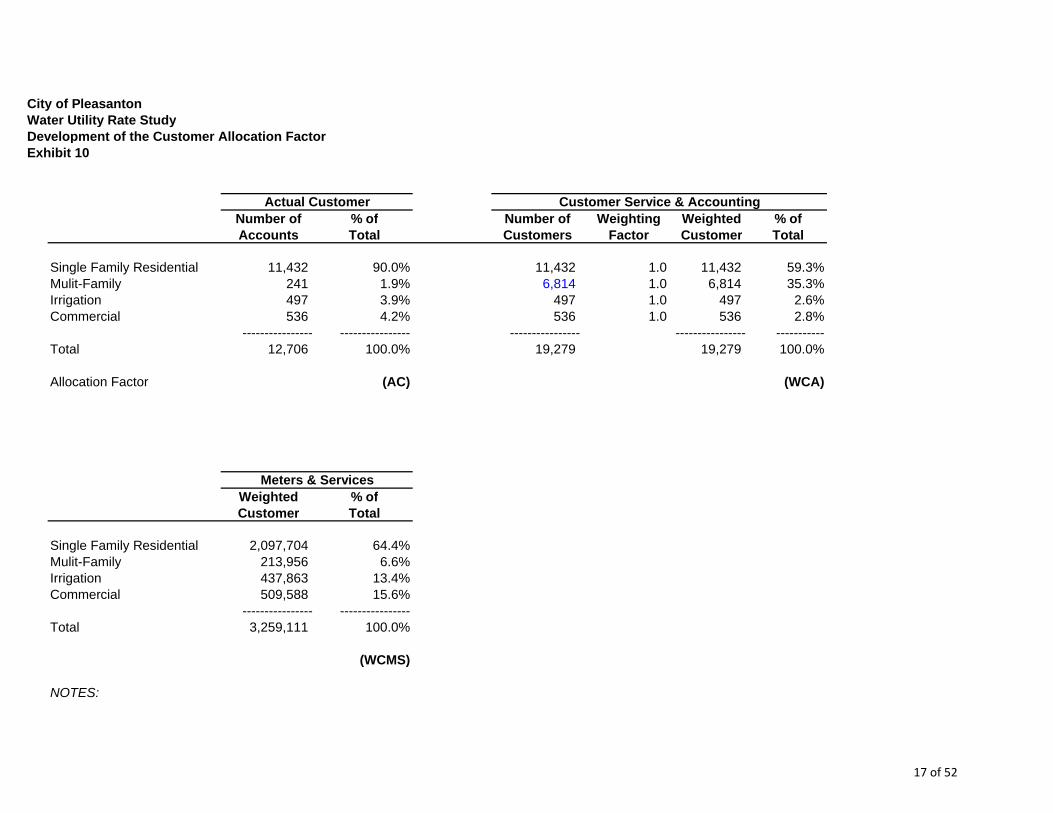
City of PleasantonWater Utility Rate StudyDevelopment of the Customer Allocation FactorExhibit 10
Number of % of Number of Weighting Weighted % ofAccounts Total Customers Factor Customer Total
Single Family Residential 11,432 90.0% 11,432 1.0 11,432 59.3%Mulit-Family 241 1.9% 6,814 1.0 6,814 35.3%Irrigation 497 3.9% 497 1.0 497 2.6%Commercial 536 4.2% 536 1.0 536 2.8%
---------------- ---------------- ---------------- ---------------- -----------Total 12,706 100.0% 19,279 19,279 100.0%
Allocation Factor (AC) (WCA)
Weighted % ofCustomer Total
Single Family Residential 2,097,704 64.4%Mulit-Family 213,956 6.6%Irrigation 437,863 13.4%Commercial 509,588 15.6%
---------------- ----------------Total 3,259,111 100.0%
(WCMS)
NOTES:
Customer Service & AccountingActual Customer
Meters & Services
17 of 52
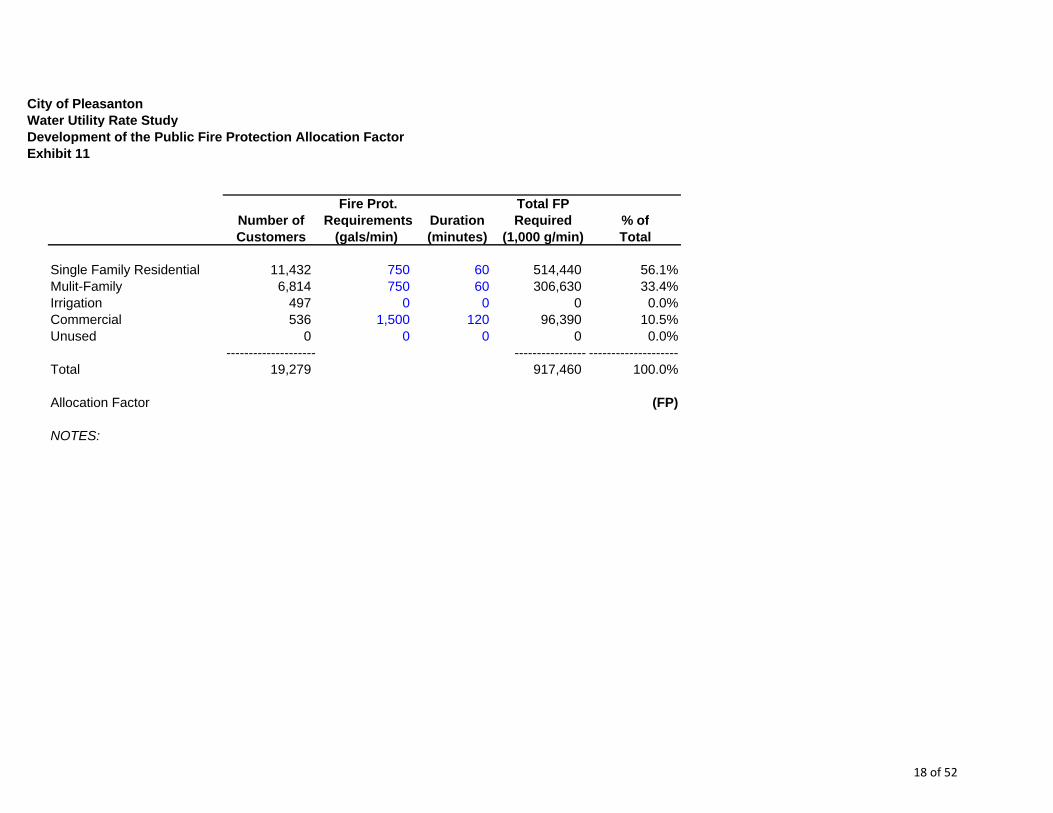
City of PleasantonWater Utility Rate StudyDevelopment of the Public Fire Protection Allocation FactorExhibit 11
Fire Prot. Total FPNumber of Requirements Duration Required % ofCustomers (gals/min) (minutes) (1,000 g/min) Total
Single Family Residential 11,432 750 60 514,440 56.1%Mulit-Family 6,814 750 60 306,630 33.4%Irrigation 497 0 0 0 0.0%Commercial 536 1,500 120 96,390 10.5%Unused 0 0 0 0 0.0%
-------------------- ---------------- --------------------Total 19,279 917,460 100.0%
Allocation Factor (FP)
NOTES:
18 of 52
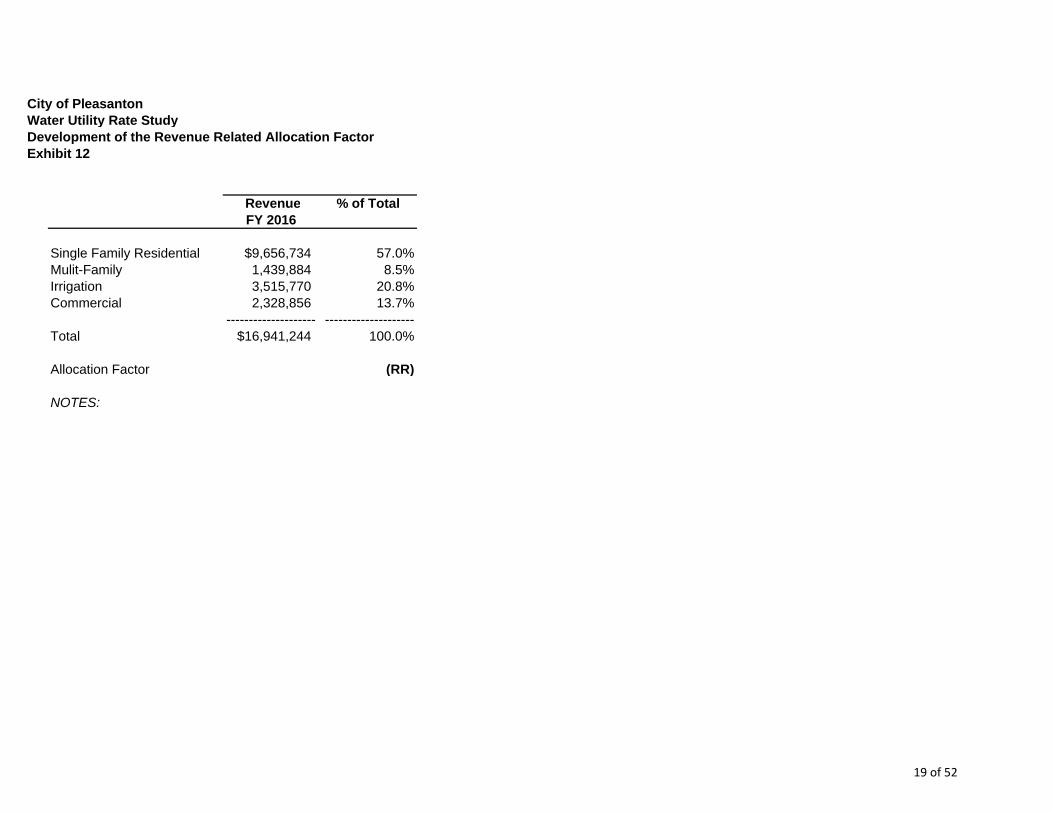
City of PleasantonWater Utility Rate StudyDevelopment of the Revenue Related Allocation FactorExhibit 12
Revenue % of TotalFY 2016
Single Family Residential $9,656,734 57.0%Mulit-Family 1,439,884 8.5%Irrigation 3,515,770 20.8%Commercial 2,328,856 13.7%
-------------------- --------------------Total $16,941,244 100.0%
Allocation Factor (RR)
NOTES:
19 of 52
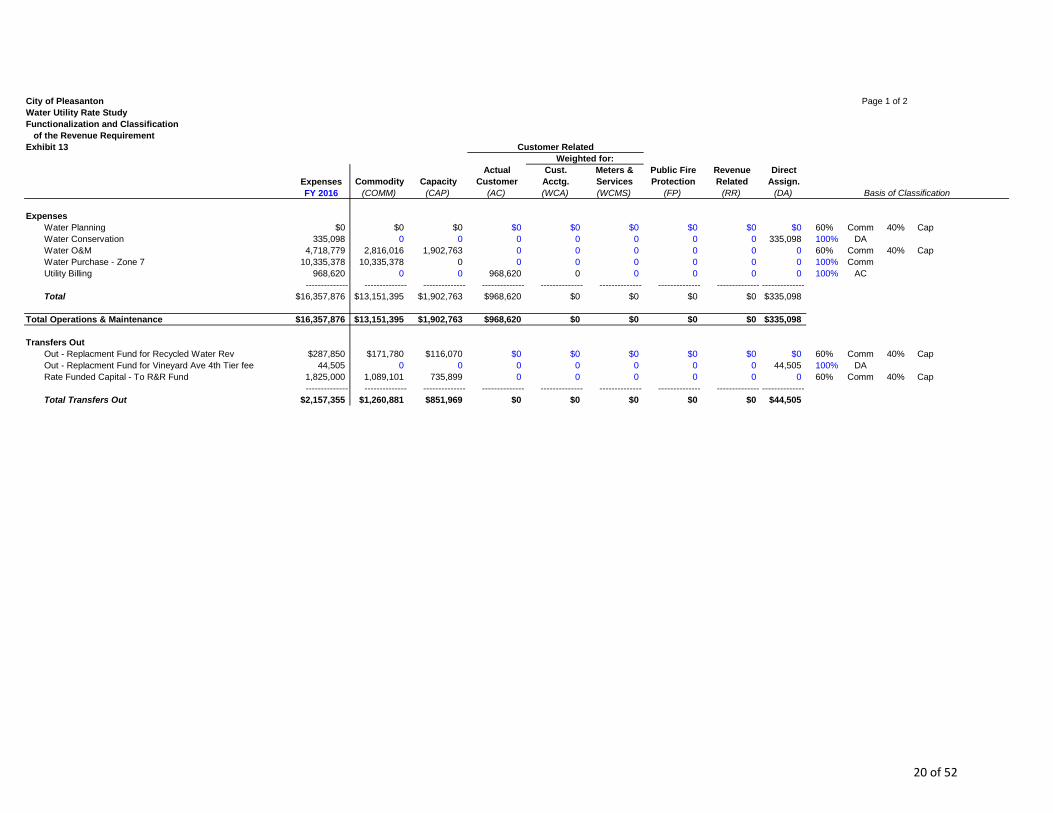
City of Pleasanton Page 1 of 2Water Utility Rate StudyFunctionalization and Classification of the Revenue RequirementExhibit 13
Actual Cust. Meters & Public Fire Revenue DirectExpenses Commodity Capacity Customer Acctg. Services Protection Related Assign.FY 2016 (COMM) (CAP) (AC) (WCA) (WCMS) (FP) (RR) (DA)
ExpensesWater Planning $0 $0 $0 $0 $0 $0 $0 $0 $0 60% Comm 40% CapWater Conservation 335,098 0 0 0 0 0 0 0 335,098 100% DAWater O&M 4,718,779 2,816,016 1,902,763 0 0 0 0 0 0 60% Comm 40% CapWater Purchase - Zone 7 10,335,378 10,335,378 0 0 0 0 0 0 0 100% CommUtility Billing 968,620 0 0 968,620 0 0 0 0 0 100% AC
-------------- -------------- -------------- -------------- -------------- -------------- -------------- -------------- --------------Total $16,357,876 $13,151,395 $1,902,763 $968,620 $0 $0 $0 $0 $335,098
Total Operations & Maintenance $16,357,876 $13,151,395 $1,902,763 $968,620 $0 $0 $0 $0 $335,098
Transfers OutOut - Replacment Fund for Recycled Water Rev $287,850 $171,780 $116,070 $0 $0 $0 $0 $0 $0 60% Comm 40% CapOut - Replacment Fund for Vineyard Ave 4th Tier fee 44,505 0 0 0 0 0 0 0 44,505 100% DARate Funded Capital - To R&R Fund 1,825,000 1,089,101 735,899 0 0 0 0 0 0 60% Comm 40% Cap
-------------- -------------- -------------- -------------- -------------- -------------- -------------- -------------- --------------Total Transfers Out $2,157,355 $1,260,881 $851,969 $0 $0 $0 $0 $0 $44,505
Basis of Classification
Customer RelatedWeighted for:
20 of 52
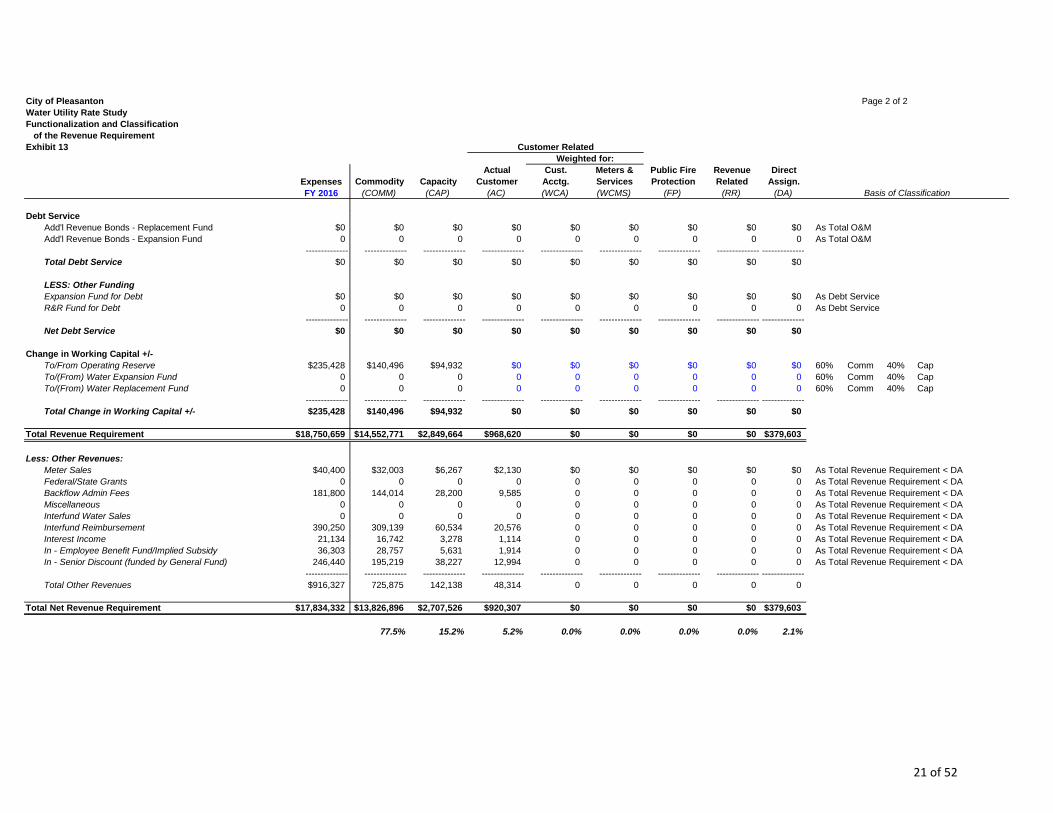
City of Pleasanton Page 2 of 2Water Utility Rate StudyFunctionalization and Classification of the Revenue RequirementExhibit 13
Actual Cust. Meters & Public Fire Revenue DirectExpenses Commodity Capacity Customer Acctg. Services Protection Related Assign.FY 2016 (COMM) (CAP) (AC) (WCA) (WCMS) (FP) (RR) (DA) Basis of Classification
Customer RelatedWeighted for:
Debt ServiceAdd'l Revenue Bonds - Replacement Fund $0 $0 $0 $0 $0 $0 $0 $0 $0 As Total O&MAdd'l Revenue Bonds - Expansion Fund 0 0 0 0 0 0 0 0 0 As Total O&M
-------------- -------------- -------------- -------------- -------------- -------------- -------------- -------------- --------------Total Debt Service $0 $0 $0 $0 $0 $0 $0 $0 $0
LESS: Other FundingExpansion Fund for Debt $0 $0 $0 $0 $0 $0 $0 $0 $0 As Debt ServiceR&R Fund for Debt 0 0 0 0 0 0 0 0 0 As Debt Service
-------------- -------------- -------------- -------------- -------------- -------------- -------------- -------------- --------------Net Debt Service $0 $0 $0 $0 $0 $0 $0 $0 $0
Change in Working Capital +/-To/From Operating Reserve $235,428 $140,496 $94,932 $0 $0 $0 $0 $0 $0 60% Comm 40% CapTo/(From) Water Expansion Fund 0 0 0 0 0 0 0 0 0 60% Comm 40% CapTo/(From) Water Replacement Fund 0 0 0 0 0 0 0 0 0 60% Comm 40% Cap
-------------- -------------- -------------- -------------- -------------- -------------- -------------- -------------- --------------Total Change in Working Capital +/- $235,428 $140,496 $94,932 $0 $0 $0 $0 $0 $0
Total Revenue Requirement $18,750,659 $14,552,771 $2,849,664 $968,620 $0 $0 $0 $0 $379,603
Less: Other Revenues:Meter Sales $40,400 $32,003 $6,267 $2,130 $0 $0 $0 $0 $0 As Total Revenue Requirement < DAFederal/State Grants 0 0 0 0 0 0 0 0 0 As Total Revenue Requirement < DABackflow Admin Fees 181,800 144,014 28,200 9,585 0 0 0 0 0 As Total Revenue Requirement < DAMiscellaneous 0 0 0 0 0 0 0 0 0 As Total Revenue Requirement < DAInterfund Water Sales 0 0 0 0 0 0 0 0 0 As Total Revenue Requirement < DAInterfund Reimbursement 390,250 309,139 60,534 20,576 0 0 0 0 0 As Total Revenue Requirement < DAInterest Income 21,134 16,742 3,278 1,114 0 0 0 0 0 As Total Revenue Requirement < DAIn - Employee Benefit Fund/Implied Subsidy 36,303 28,757 5,631 1,914 0 0 0 0 0 As Total Revenue Requirement < DAIn - Senior Discount (funded by General Fund) 246,440 195,219 38,227 12,994 0 0 0 0 0 As Total Revenue Requirement < DA
-------------- -------------- -------------- -------------- -------------- -------------- -------------- -------------- --------------Total Other Revenues $916,327 725,875 142,138 48,314 0 0 0 0 0
Total Net Revenue Requirement $17,834,332 $13,826,896 $2,707,526 $920,307 $0 $0 $0 $0 $379,603
77.5% 15.2% 5.2% 0.0% 0.0% 0.0% 0.0% 2.1%
21 of 52
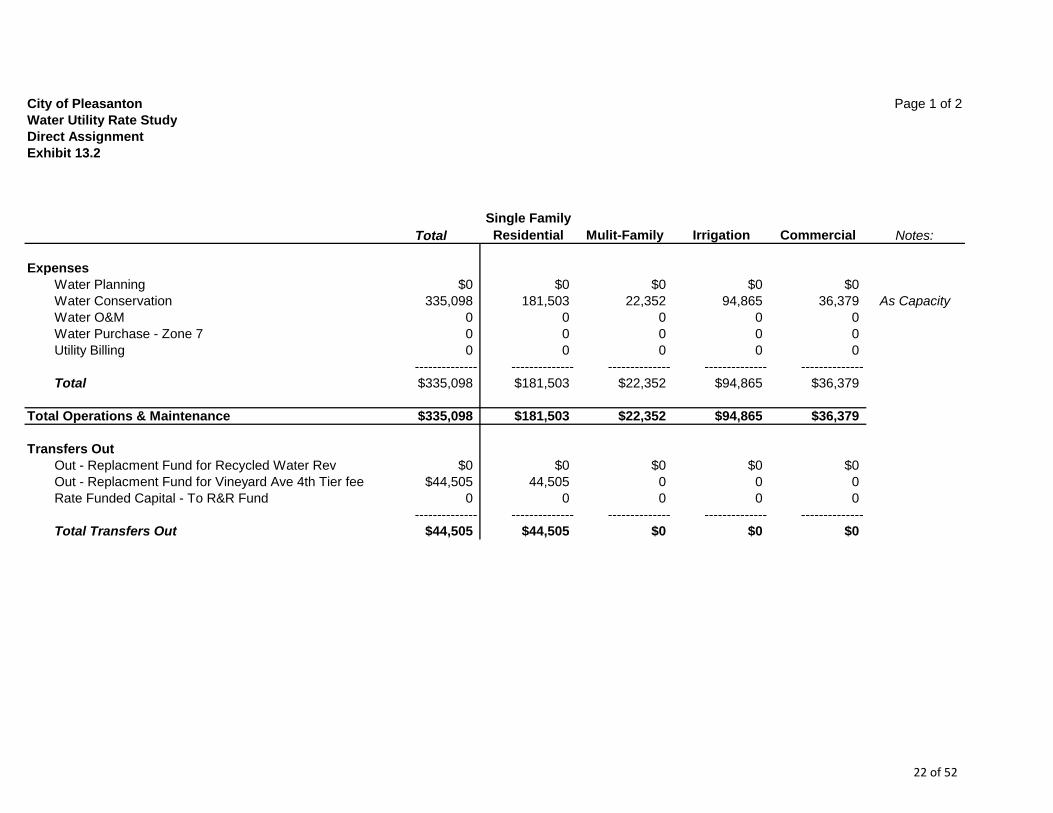
City of Pleasanton Page 1 of 2Water Utility Rate StudyDirect AssignmentExhibit 13.2
Total Notes:
ExpensesWater Planning $0 $0 $0 $0 $0Water Conservation 335,098 181,503 22,352 94,865 36,379 As CapacityWater O&M 0 0 0 0 0Water Purchase - Zone 7 0 0 0 0 0Utility Billing 0 0 0 0 0
-------------- -------------- -------------- -------------- --------------Total $335,098 $181,503 $22,352 $94,865 $36,379
Total Operations & Maintenance $335,098 $181,503 $22,352 $94,865 $36,379
Transfers OutOut - Replacment Fund for Recycled Water Rev $0 $0 $0 $0 $0Out - Replacment Fund for Vineyard Ave 4th Tier fee $44,505 44,505 0 0 0Rate Funded Capital - To R&R Fund 0 0 0 0 0
-------------- -------------- -------------- -------------- --------------Total Transfers Out $44,505 $44,505 $0 $0 $0
CommercialIrrigationMulit-FamilySingle Family Residential
22 of 52
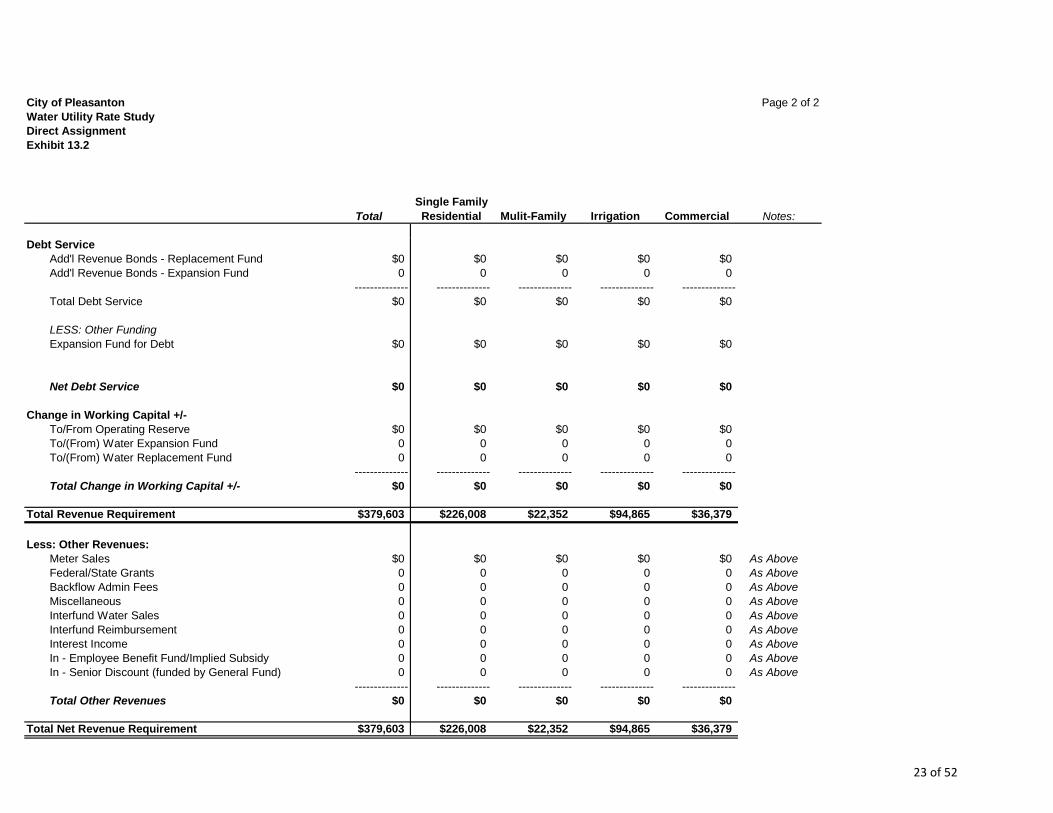
City of Pleasanton Page 2 of 2Water Utility Rate StudyDirect AssignmentExhibit 13.2
Total Notes:CommercialIrrigationMulit-FamilySingle Family Residential
Debt ServiceAdd'l Revenue Bonds - Replacement Fund $0 $0 $0 $0 $0Add'l Revenue Bonds - Expansion Fund 0 0 0 0 0
-------------- -------------- -------------- -------------- --------------Total Debt Service $0 $0 $0 $0 $0
LESS: Other FundingExpansion Fund for Debt $0 $0 $0 $0 $0
Net Debt Service $0 $0 $0 $0 $0
Change in Working Capital +/-To/From Operating Reserve $0 $0 $0 $0 $0To/(From) Water Expansion Fund 0 0 0 0 0To/(From) Water Replacement Fund 0 0 0 0 0
-------------- -------------- -------------- -------------- --------------Total Change in Working Capital +/- $0 $0 $0 $0 $0
Total Revenue Requirement $379,603 $226,008 $22,352 $94,865 $36,379
Less: Other Revenues:Meter Sales $0 $0 $0 $0 $0 As AboveFederal/State Grants 0 0 0 0 0 As AboveBackflow Admin Fees 0 0 0 0 0 As AboveMiscellaneous 0 0 0 0 0 As AboveInterfund Water Sales 0 0 0 0 0 As AboveInterfund Reimbursement 0 0 0 0 0 As AboveInterest Income 0 0 0 0 0 As AboveIn - Employee Benefit Fund/Implied Subsidy 0 0 0 0 0 As AboveIn - Senior Discount (funded by General Fund) 0 0 0 0 0 As Above
-------------- -------------- -------------- -------------- --------------Total Other Revenues $0 $0 $0 $0 $0
Total Net Revenue Requirement $379,603 $226,008 $22,352 $94,865 $36,379
23 of 52
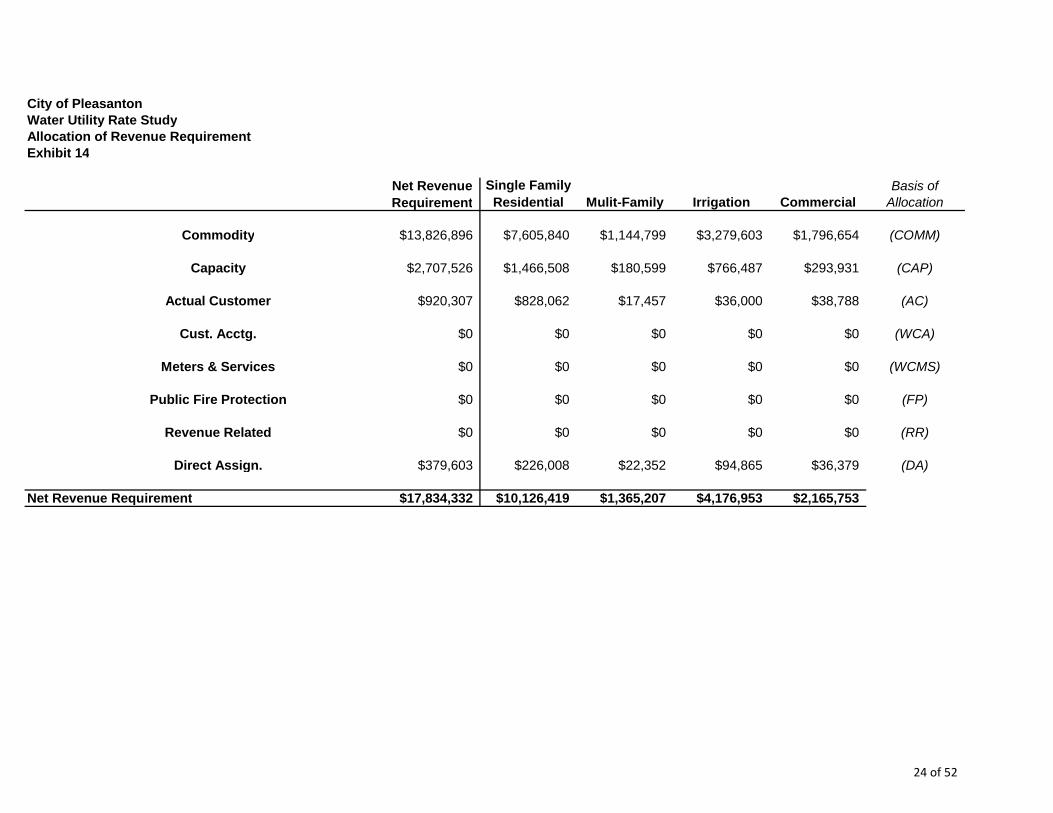
City of PleasantonWater Utility Rate StudyAllocation of Revenue RequirementExhibit 14
Net Revenue Basis ofRequirement Allocation
Commodity $13,826,896 $7,605,840 $1,144,799 $3,279,603 $1,796,654 (COMM)
Capacity $2,707,526 $1,466,508 $180,599 $766,487 $293,931 (CAP)
Actual Customer $920,307 $828,062 $17,457 $36,000 $38,788 (AC)
Cust. Acctg. $0 $0 $0 $0 $0 (WCA)
Meters & Services $0 $0 $0 $0 $0 (WCMS)
Public Fire Protection $0 $0 $0 $0 $0 (FP)
Revenue Related $0 $0 $0 $0 $0 (RR)
Direct Assign. $379,603 $226,008 $22,352 $94,865 $36,379 (DA)
Net Revenue Requirement $17,834,332 $10,126,419 $1,365,207 $4,176,953 $2,165,753
CommercialIrrigationMulit-FamilySingle Family Residential
24 of 52
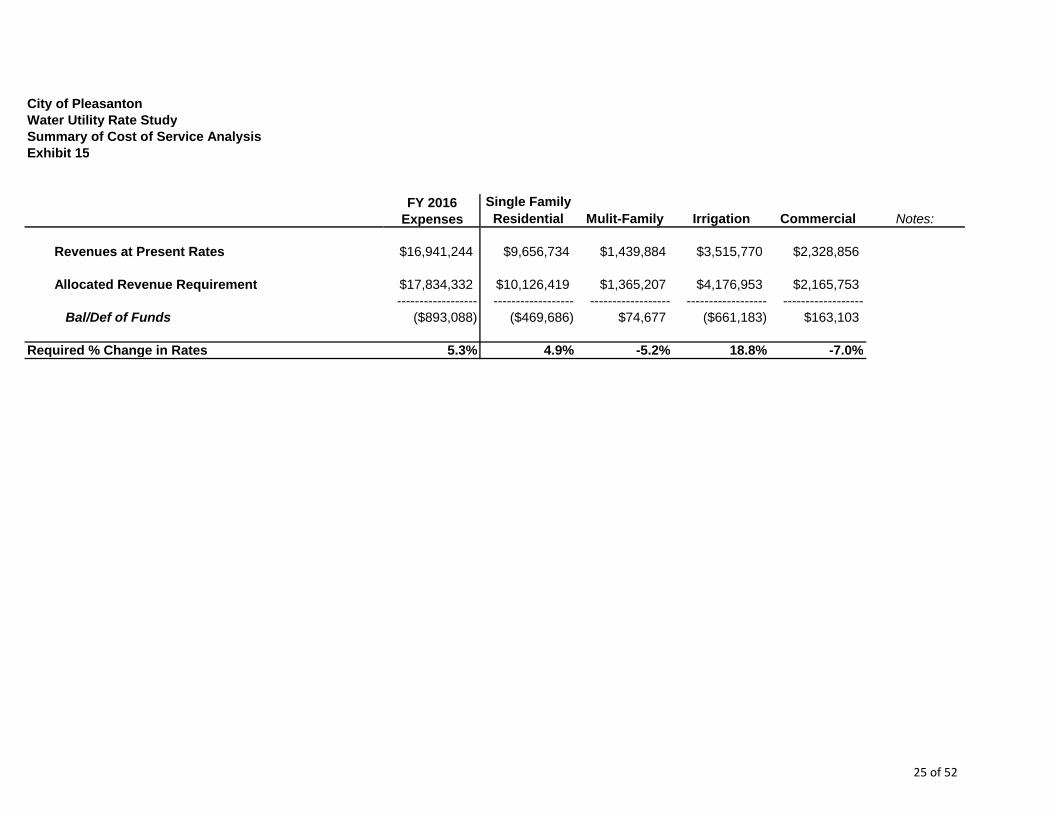
City of PleasantonWater Utility Rate StudySummary of Cost of Service AnalysisExhibit 15
FY 2016Expenses Notes:
Revenues at Present Rates $16,941,244 $9,656,734 $1,439,884 $3,515,770 $2,328,856
Allocated Revenue Requirement $17,834,332 $10,126,419 $1,365,207 $4,176,953 $2,165,753------------------ ------------------ ------------------ ------------------ ------------------
Bal/Def of Funds ($893,088) ($469,686) $74,677 ($661,183) $163,103
Required % Change in Rates 5.3% 4.9% -5.2% 18.8% -7.0%
Single Family Residential IrrigationMulit-Family Commercial
25 of 52
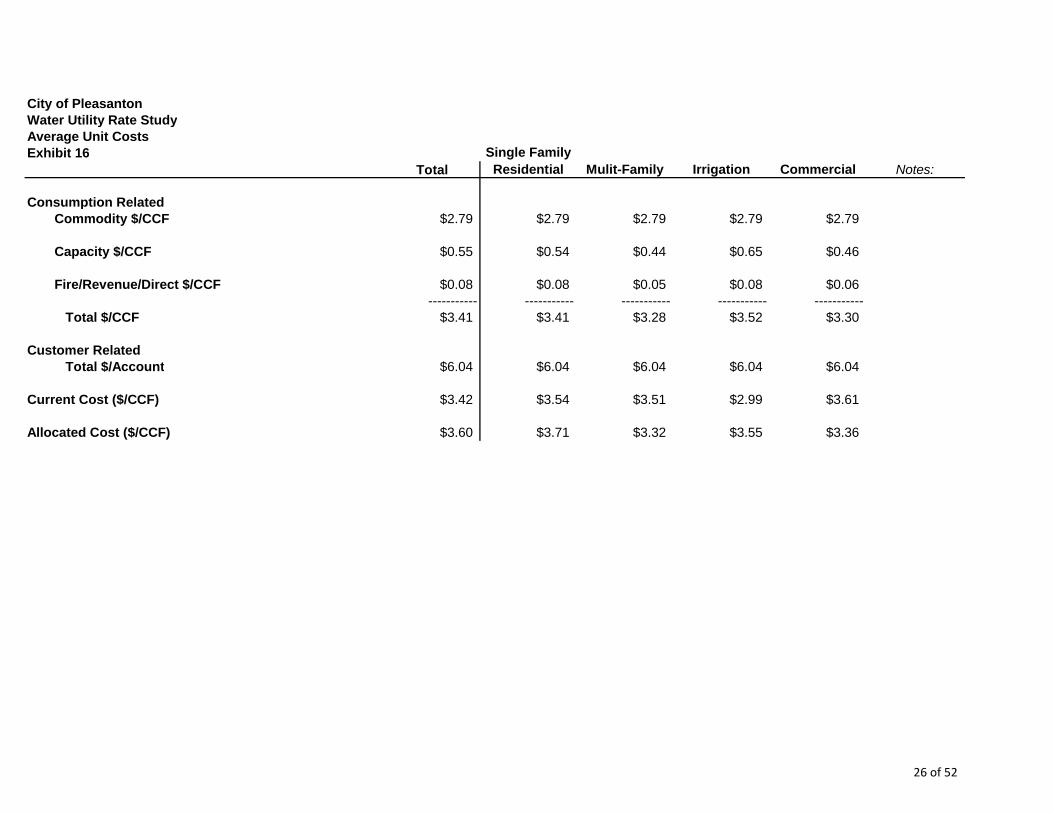
City of PleasantonWater Utility Rate StudyAverage Unit CostsExhibit 16
Total Notes:
Consumption RelatedCommodity $/CCF $2.79 $2.79 $2.79 $2.79 $2.79
Capacity $/CCF $0.55 $0.54 $0.44 $0.65 $0.46
Fire/Revenue/Direct $/CCF $0.08 $0.08 $0.05 $0.08 $0.06----------- ----------- ----------- ----------- -----------
Total $/CCF $3.41 $3.41 $3.28 $3.52 $3.30
Customer RelatedTotal $/Account $6.04 $6.04 $6.04 $6.04 $6.04
Current Cost ($/CCF) $3.42 $3.54 $3.51 $2.99 $3.61
Allocated Cost ($/CCF) $3.60 $3.71 $3.32 $3.55 $3.36
Single Family Residential CommercialIrrigationMulit-Family
26 of 52
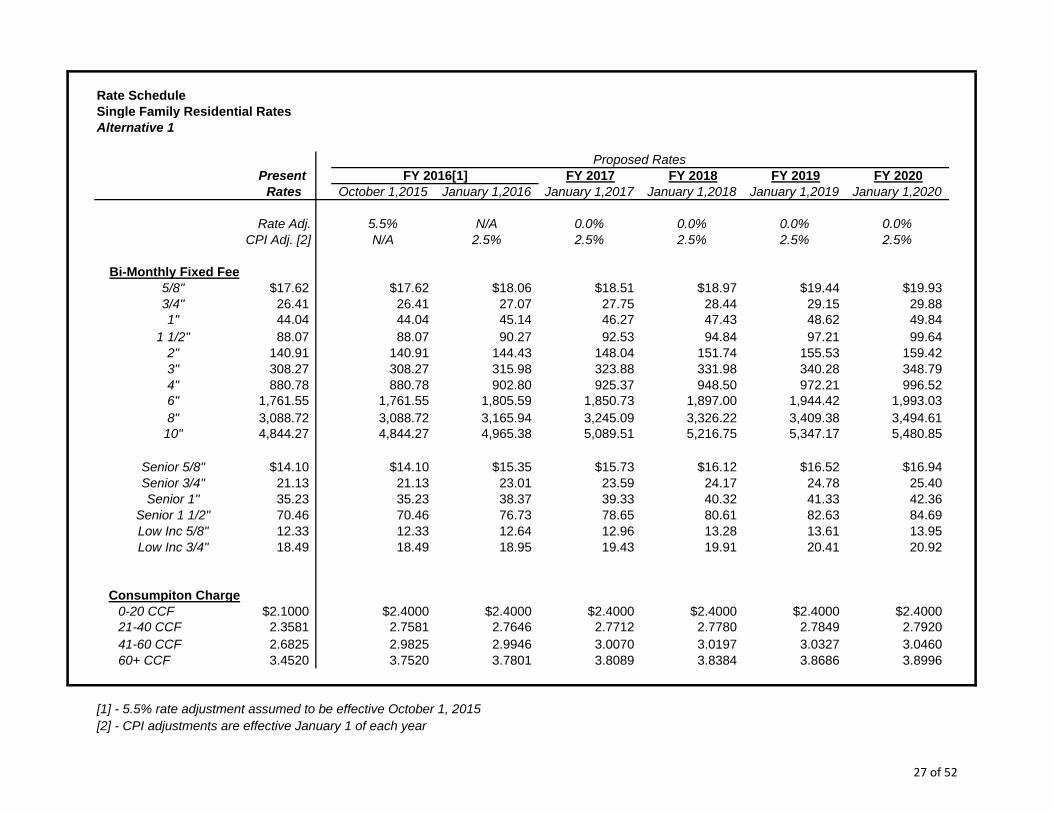
Rate ScheduleSingle Family Residential RatesAlternative 1
Present FY 2017 FY 2018 FY 2019 FY 2020Rates October 1,2015 January 1,2016 January 1,2017 January 1,2018 January 1,2019 January 1,2020
Rate Adj. 5.5% N/A 0.0% 0.0% 0.0% 0.0%CPI Adj. [2] N/A 2.5% 2.5% 2.5% 2.5% 2.5%
Bi-Monthly Fixed Fee5/8" $17.62 $17.62 $18.06 $18.51 $18.97 $19.44 $19.933/4" 26.41 26.41 27.07 27.75 28.44 29.15 29.881" 44.04 44.04 45.14 46.27 47.43 48.62 49.84
1 1/2" 88.07 88.07 90.27 92.53 94.84 97.21 99.642" 140.91 140.91 144.43 148.04 151.74 155.53 159.423" 308.27 308.27 315.98 323.88 331.98 340.28 348.794" 880.78 880.78 902.80 925.37 948.50 972.21 996.526" 1,761.55 1,761.55 1,805.59 1,850.73 1,897.00 1,944.42 1,993.038" 3,088.72 3,088.72 3,165.94 3,245.09 3,326.22 3,409.38 3,494.6110" 4,844.27 4,844.27 4,965.38 5,089.51 5,216.75 5,347.17 5,480.85
Senior 5/8" $14.10 $14.10 $15.35 $15.73 $16.12 $16.52 $16.94Senior 3/4" 21.13 21.13 23.01 23.59 24.17 24.78 25.40Senior 1" 35.23 35.23 38.37 39.33 40.32 41.33 42.36
Senior 1 1/2" 70.46 70.46 76.73 78.65 80.61 82.63 84.69Low Inc 5/8" 12.33 12.33 12.64 12.96 13.28 13.61 13.95Low Inc 3/4" 18.49 18.49 18.95 19.43 19.91 20.41 20.92
Consumpiton Charge0-20 CCF $2.1000 $2.4000 $2.4000 $2.4000 $2.4000 $2.4000 $2.400021-40 CCF 2.3581 2.7581 2.7646 2.7712 2.7780 2.7849 2.792041-60 CCF 2.6825 2.9825 2.9946 3.0070 3.0197 3.0327 3.046060+ CCF 3.4520 3.7520 3.7801 3.8089 3.8384 3.8686 3.8996
[1] - 5.5% rate adjustment assumed to be effective October 1, 2015[2] - CPI adjustments are effective January 1 of each year
Proposed RatesFY 2016[1]
27 of 52
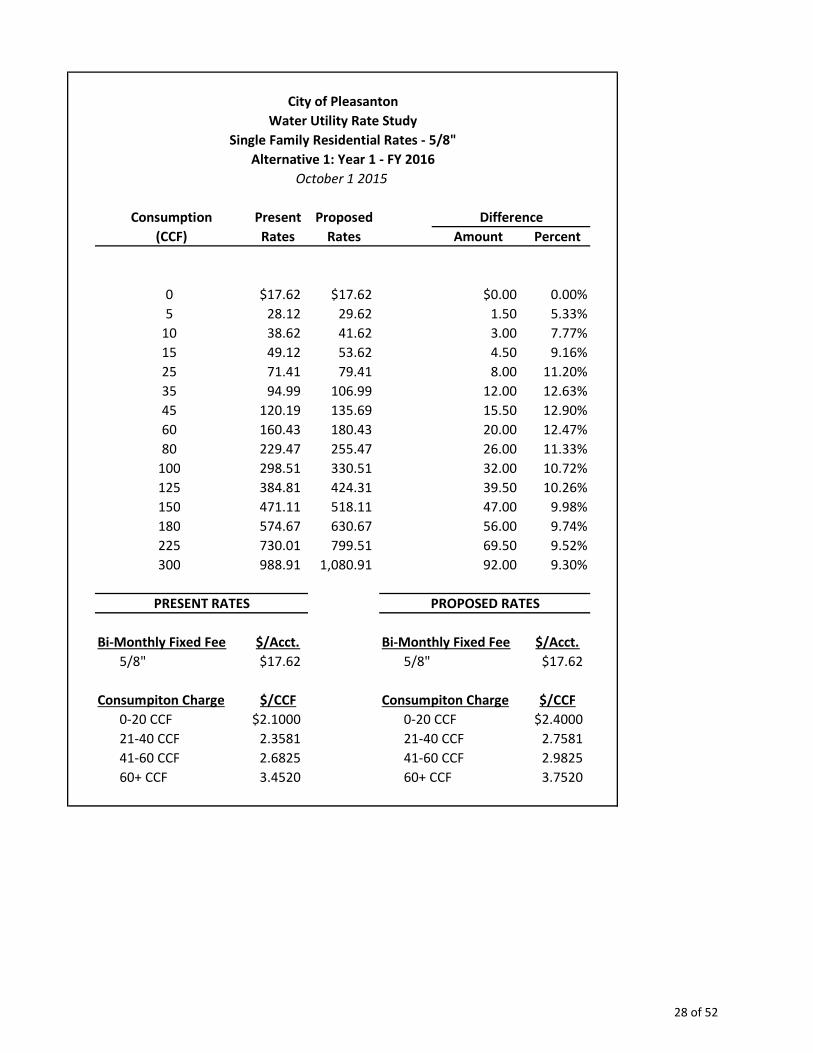
Consumption Present Proposed(CCF) Rates Rates Amount Percent
0 $17.62 $17.62 $0.00 0.00%5 28.12 29.62 1.50 5.33%
10 38.62 41.62 3.00 7.77%15 49.12 53.62 4.50 9.16%25 71.41 79.41 8.00 11.20%35 94.99 106.99 12.00 12.63%45 120.19 135.69 15.50 12.90%60 160.43 180.43 20.00 12.47%80 229.47 255.47 26.00 11.33%
100 298.51 330.51 32.00 10.72%125 384.81 424.31 39.50 10.26%150 471.11 518.11 47.00 9.98%180 574.67 630.67 56.00 9.74%225 730.01 799.51 69.50 9.52%300 988.91 1,080.91 92.00 9.30%
Bi-Monthly Fixed Fee $/Acct. Bi-Monthly Fixed Fee $/Acct.5/8" $17.62 5/8" $17.62
Consumpiton Charge $/CCF Consumpiton Charge $/CCF0-20 CCF $2.1000 0-20 CCF $2.400021-40 CCF 2.3581 21-40 CCF 2.758141-60 CCF 2.6825 41-60 CCF 2.982560+ CCF 3.4520 60+ CCF 3.7520
Water Utility Rate StudySingle Family Residential Rates - 5/8"
Alternative 1: Year 1 - FY 2016
Difference
City of Pleasanton
PRESENT RATES PROPOSED RATES
October 1 2015
28 of 52
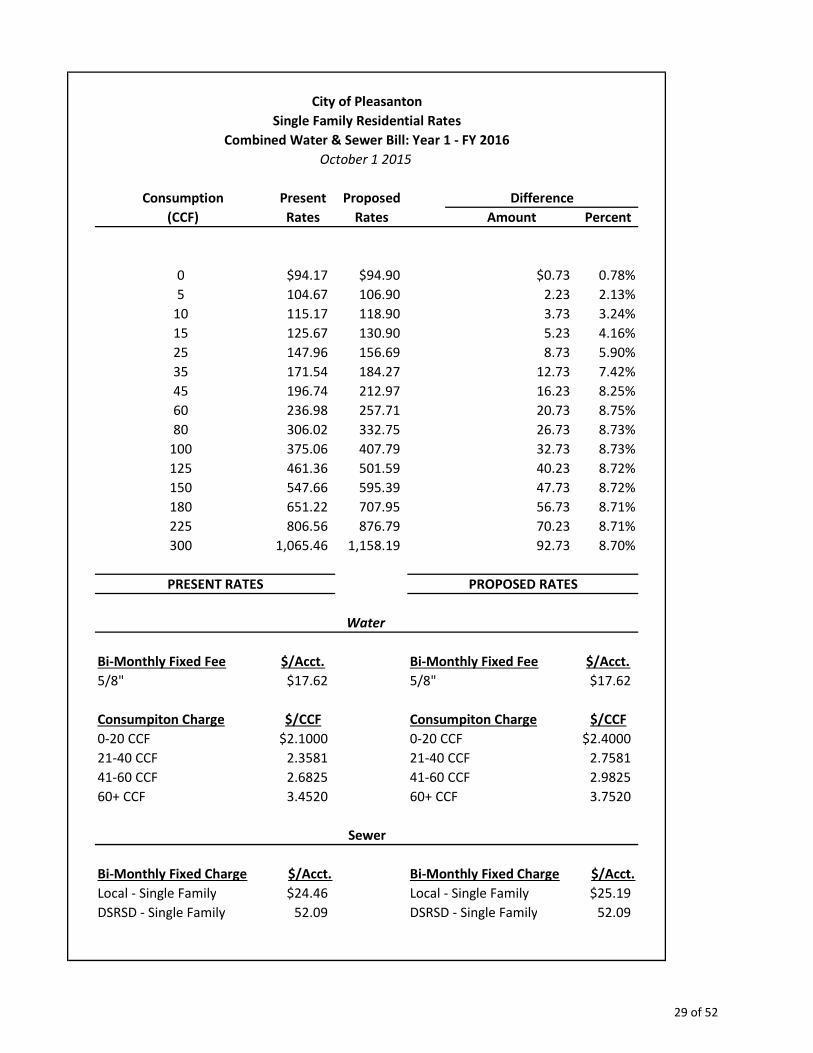
Consumption Present Proposed(CCF) Rates Rates Amount Percent
0 $94.17 $94.90 $0.73 0.78%5 104.67 106.90 2.23 2.13%
10 115.17 118.90 3.73 3.24%15 125.67 130.90 5.23 4.16%25 147.96 156.69 8.73 5.90%35 171.54 184.27 12.73 7.42%45 196.74 212.97 16.23 8.25%60 236.98 257.71 20.73 8.75%80 306.02 332.75 26.73 8.73%
100 375.06 407.79 32.73 8.73%125 461.36 501.59 40.23 8.72%150 547.66 595.39 47.73 8.72%180 651.22 707.95 56.73 8.71%225 806.56 876.79 70.23 8.71%300 1,065.46 1,158.19 92.73 8.70%
Bi-Monthly Fixed Fee $/Acct. Bi-Monthly Fixed Fee $/Acct.5/8" $17.62 5/8" $17.62
Consumpiton Charge $/CCF Consumpiton Charge $/CCF0-20 CCF $2.1000 0-20 CCF $2.400021-40 CCF 2.3581 21-40 CCF 2.758141-60 CCF 2.6825 41-60 CCF 2.982560+ CCF 3.4520 60+ CCF 3.7520
Bi-Monthly Fixed Charge $/Acct. Bi-Monthly Fixed Charge $/Acct.Local - Single Family $24.46 Local - Single Family $25.19DSRSD - Single Family 52.09 DSRSD - Single Family 52.09
Sewer
PROPOSED RATESPRESENT RATES
October 1 2015
Water
City of PleasantonSingle Family Residential Rates
Combined Water & Sewer Bill: Year 1 - FY 2016
Difference
29 of 52

Consumption Present Proposed(CCF) Rates Rates Amount Percent
0 $17.62 $18.06 $0.44 2.50%5 29.62 30.06 0.44 1.49%
10 41.62 42.06 0.44 1.06%15 53.62 54.06 0.44 0.82%25 79.41 79.88 0.47 0.60%35 106.99 107.53 0.54 0.50%45 135.69 136.33 0.63 0.46%60 180.43 181.24 0.81 0.45%80 255.47 256.85 1.37 0.54%
100 330.51 332.45 1.94 0.59%125 424.31 426.95 2.64 0.62%150 518.11 521.45 3.34 0.64%180 630.67 634.86 4.18 0.66%225 799.51 804.96 5.45 0.68%300 1,080.91 1,088.47 7.56 0.70%
Bi-Monthly Fixed Fee $/Acct. Bi-Monthly Fixed Fee $/Acct.5/8" $17.62 5/8" $18.06
Consumpiton Charge $/CCF Consumpiton Charge $/CCF0-20 CCF $2.4000 0-20 CCF $2.400021-40 CCF 2.7581 21-40 CCF 2.764641-60 CCF 2.9825 41-60 CCF 2.994660+ CCF 3.7520 60+ CCF 3.7801
PRESENT RATES PROPOSED RATES
January 1 2016
Difference
City of Pleasanton
Alternative 1: Year 1 - FY 2016Single Family Residential Rates - 5/8"
Water Utility Rate Study
30 of 52

Consumption Present Proposed(CCF) Rates Rates Amount Percent
0 $18.06 $18.51 $0.45 2.49%5 30.06 30.51 0.45 1.50%
10 42.06 42.51 0.45 1.07%15 54.06 54.51 0.45 0.83%25 79.88 80.37 0.48 0.60%35 107.53 108.08 0.55 0.51%45 136.33 136.97 0.64 0.47%60 181.24 182.07 0.83 0.46%80 256.85 258.25 1.41 0.55%
100 332.45 334.43 1.98 0.60%125 426.95 429.65 2.70 0.63%150 521.45 524.88 3.42 0.66%180 634.86 639.14 4.29 0.68%225 804.96 810.54 5.58 0.69%300 1,088.47 1,096.21 7.74 0.71%
Bi-Monthly Fixed Fee $/Acct. Bi-Monthly Fixed Fee $/Acct.5/8" $18.06 5/8" $18.51
Consumpiton Charge $/CCF Consumpiton Charge $/CCF0-20 CCF $2.4000 0-20 CCF $2.400021-40 CCF 2.7646 21-40 CCF 2.771241-60 CCF 2.9946 41-60 CCF 3.007060+ CCF 3.7801 60+ CCF 3.8089
City of PleasantonWater Utility Rate Study
Single Family Residential Rates - 5/8"Alternative 1: Year 2 - FY 2017
January 1 2017
Difference
PROPOSED RATESPRESENT RATES
31 of 52
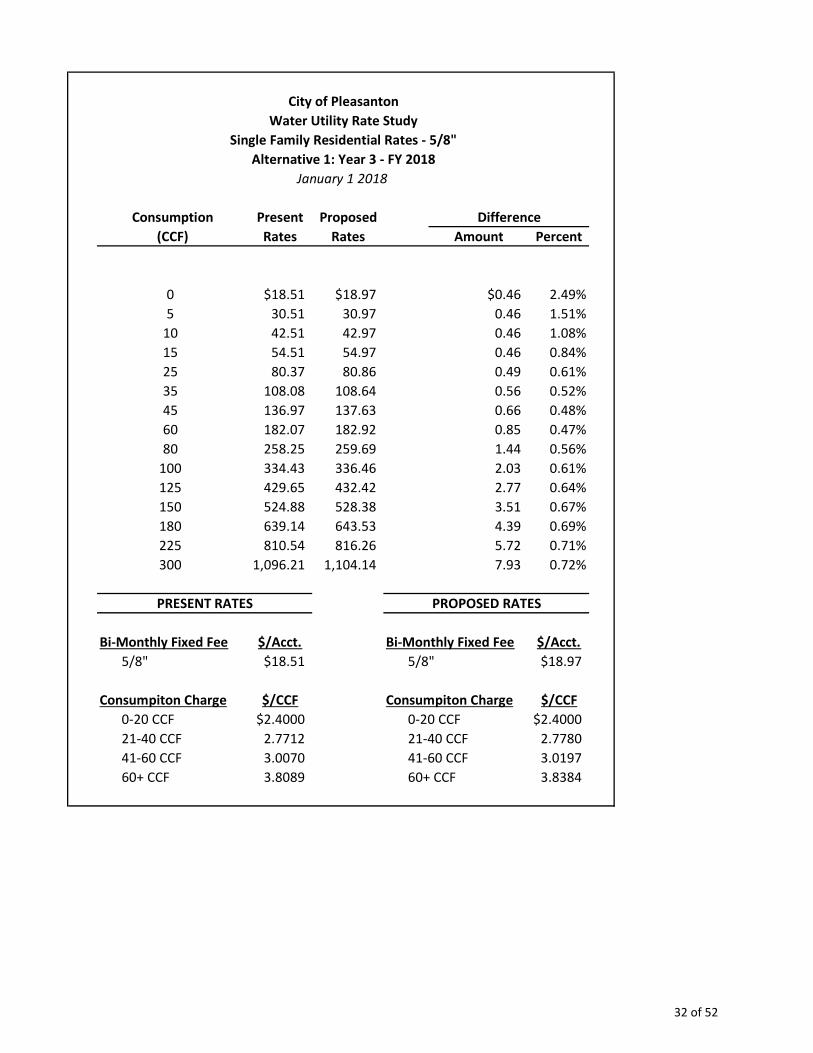
Consumption Present Proposed(CCF) Rates Rates Amount Percent
0 $18.51 $18.97 $0.46 2.49%5 30.51 30.97 0.46 1.51%
10 42.51 42.97 0.46 1.08%15 54.51 54.97 0.46 0.84%25 80.37 80.86 0.49 0.61%35 108.08 108.64 0.56 0.52%45 136.97 137.63 0.66 0.48%60 182.07 182.92 0.85 0.47%80 258.25 259.69 1.44 0.56%
100 334.43 336.46 2.03 0.61%125 429.65 432.42 2.77 0.64%150 524.88 528.38 3.51 0.67%180 639.14 643.53 4.39 0.69%225 810.54 816.26 5.72 0.71%300 1,096.21 1,104.14 7.93 0.72%
Bi-Monthly Fixed Fee $/Acct. Bi-Monthly Fixed Fee $/Acct.5/8" $18.51 5/8" $18.97
Consumpiton Charge $/CCF Consumpiton Charge $/CCF0-20 CCF $2.4000 0-20 CCF $2.400021-40 CCF 2.7712 21-40 CCF 2.778041-60 CCF 3.0070 41-60 CCF 3.019760+ CCF 3.8089 60+ CCF 3.8384
City of Pleasanton
PRESENT RATES PROPOSED RATES
January 1 2018
Difference
Water Utility Rate StudySingle Family Residential Rates - 5/8"
Alternative 1: Year 3 - FY 2018
32 of 52

Consumption Present Proposed(CCF) Rates Rates Amount Percent
0 $18.97 $19.44 $0.47 2.48%5 30.97 31.44 0.47 1.52%
10 42.97 43.44 0.47 1.09%15 54.97 55.44 0.47 0.86%25 80.86 81.36 0.50 0.62%35 108.64 109.21 0.57 0.53%45 137.63 138.30 0.67 0.49%60 182.92 183.79 0.87 0.47%80 259.69 261.16 1.47 0.57%
100 336.46 338.54 2.08 0.62%125 432.42 435.25 2.83 0.65%150 528.38 531.97 3.59 0.68%180 643.53 648.02 4.49 0.70%225 816.26 822.11 5.85 0.72%300 1,104.14 1,112.26 8.12 0.74%
Bi-Monthly Fixed Fee $/Acct. Bi-Monthly Fixed Fee $/Acct.5/8" $18.97 5/8" $19.44
Consumpiton Charge $/CCF Consumpiton Charge $/CCF0-20 CCF $2.4000 0-20 CCF $2.400021-40 CCF 2.7780 21-40 CCF 2.784941-60 CCF 3.0197 41-60 CCF 3.032760+ CCF 3.8384 60+ CCF 3.8686
Water Utility Rate StudySingle Family Residential Rates - 5/8"
Alternative 1: Year 4 - FY 2019
PROPOSED RATESPRESENT RATES
January 1 2019
Difference
City of Pleasanton
33 of 52

Consumption Present Proposed(CCF) Rates Rates Amount Percent
0 $19.44 $19.93 $0.49 2.52%5 31.44 31.93 0.49 1.56%
10 43.44 43.93 0.49 1.13%15 55.44 55.93 0.49 0.88%25 81.36 81.89 0.53 0.65%35 109.21 109.81 0.60 0.55%45 138.30 139.00 0.70 0.51%60 183.79 184.69 0.90 0.49%80 261.16 262.68 1.52 0.58%
100 338.54 340.67 2.14 0.63%125 435.25 438.16 2.91 0.67%150 531.97 535.65 3.69 0.69%180 648.02 652.64 4.62 0.71%225 822.11 828.12 6.01 0.73%300 1,112.26 1,120.59 8.34 0.75%
Bi-Monthly Fixed Fee $/Acct. Bi-Monthly Fixed Fee $/Acct.5/8" $19.44 5/8" $19.93
Consumpiton Charge $/CCF Consumpiton Charge $/CCF0-20 CCF $2.4000 0-20 CCF $2.400021-40 CCF 2.7849 21-40 CCF 2.792041-60 CCF 3.0327 41-60 CCF 3.046060+ CCF 3.8686 60+ CCF 3.8996
Water Utility Rate StudySingle Family Residential Rates - 5/8"
Alternative 1: Year 5 - FY 2020
City of Pleasanton
PROPOSED RATESPRESENT RATES
January 1 2020
Difference
34 of 52
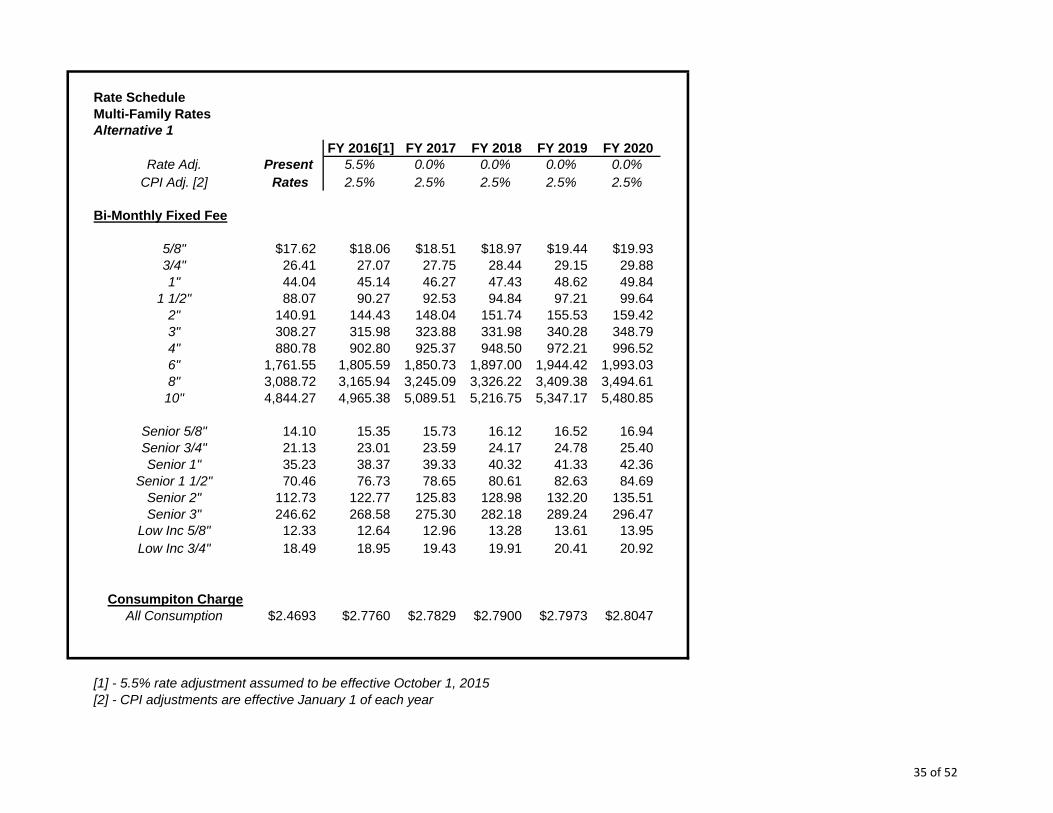
Rate ScheduleMulti-Family RatesAlternative 1
FY 2016[1] FY 2017 FY 2018 FY 2019 FY 2020Rate Adj. Present 5.5% 0.0% 0.0% 0.0% 0.0%
CPI Adj. [2] Rates 2.5% 2.5% 2.5% 2.5% 2.5%
Bi-Monthly Fixed Fee
5/8" $17.62 $18.06 $18.51 $18.97 $19.44 $19.933/4" 26.41 27.07 27.75 28.44 29.15 29.881" 44.04 45.14 46.27 47.43 48.62 49.84
1 1/2" 88.07 90.27 92.53 94.84 97.21 99.642" 140.91 144.43 148.04 151.74 155.53 159.423" 308.27 315.98 323.88 331.98 340.28 348.794" 880.78 902.80 925.37 948.50 972.21 996.526" 1,761.55 1,805.59 1,850.73 1,897.00 1,944.42 1,993.038" 3,088.72 3,165.94 3,245.09 3,326.22 3,409.38 3,494.6110" 4,844.27 4,965.38 5,089.51 5,216.75 5,347.17 5,480.85
Senior 5/8" 14.10 15.35 15.73 16.12 16.52 16.94Senior 3/4" 21.13 23.01 23.59 24.17 24.78 25.40Senior 1" 35.23 38.37 39.33 40.32 41.33 42.36
Senior 1 1/2" 70.46 76.73 78.65 80.61 82.63 84.69Senior 2" 112.73 122.77 125.83 128.98 132.20 135.51Senior 3" 246.62 268.58 275.30 282.18 289.24 296.47
Low Inc 5/8" 12.33 12.64 12.96 13.28 13.61 13.95Low Inc 3/4" 18.49 18.95 19.43 19.91 20.41 20.92
Consumpiton ChargeAll Consumption $2.4693 $2.7760 $2.7829 $2.7900 $2.7973 $2.8047
[1] - 5.5% rate adjustment assumed to be effective October 1, 2015[2] - CPI adjustments are effective January 1 of each year
35 of 52
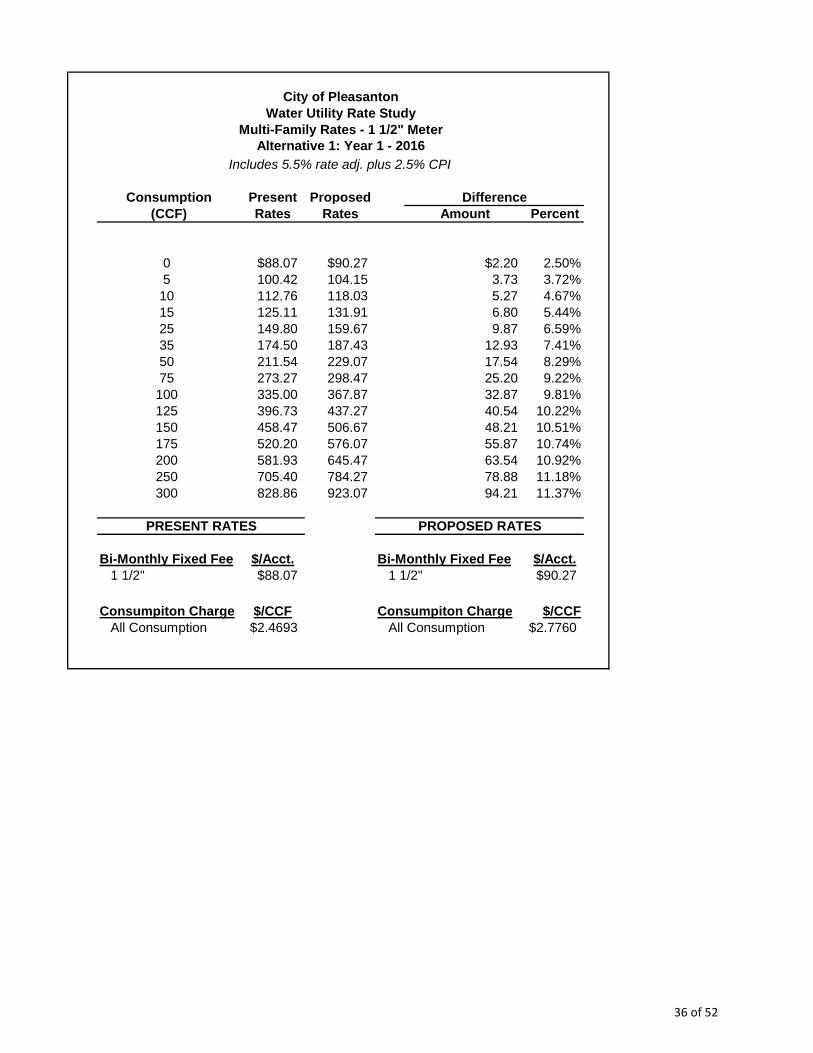
Consumption Present Proposed(CCF) Rates Rates Amount Percent
0 $88.07 $90.27 $2.20 2.50%5 100.42 104.15 3.73 3.72%10 112.76 118.03 5.27 4.67%15 125.11 131.91 6.80 5.44%25 149.80 159.67 9.87 6.59%35 174.50 187.43 12.93 7.41%50 211.54 229.07 17.54 8.29%75 273.27 298.47 25.20 9.22%100 335.00 367.87 32.87 9.81%125 396.73 437.27 40.54 10.22%150 458.47 506.67 48.21 10.51%175 520.20 576.07 55.87 10.74%200 581.93 645.47 63.54 10.92%250 705.40 784.27 78.88 11.18%300 828.86 923.07 94.21 11.37%
Bi-Monthly Fixed Fee $/Acct. Bi-Monthly Fixed Fee $/Acct.1 1/2" $88.07 1 1/2" $90.27
Consumpiton Charge $/CCF Consumpiton Charge $/CCFAll Consumption $2.4693 All Consumption $2.7760
Water Utility Rate StudyCity of Pleasanton
Multi-Family Rates - 1 1/2" MeterAlternative 1: Year 1 - 2016
Includes 5.5% rate adj. plus 2.5% CPI
Difference
PROPOSED RATESPRESENT RATES
36 of 52

Consumption Present Proposed(CCF) Rates Rates Amount Percent
0 $90.27 $92.53 $2.26 2.50%5 104.15 106.44 2.29 2.20%10 118.03 120.36 2.33 1.97%15 131.91 134.27 2.36 1.79%25 159.67 162.10 2.43 1.52%35 187.43 189.93 2.50 1.33%50 229.07 231.68 2.61 1.14%75 298.47 301.25 2.78 0.93%100 367.87 370.82 2.95 0.80%125 437.27 440.39 3.12 0.71%150 506.67 509.97 3.30 0.65%175 576.07 579.54 3.47 0.60%200 645.47 649.11 3.64 0.56%250 784.27 788.26 3.98 0.51%300 923.07 927.40 4.33 0.47%
Bi-Monthly Fixed Fee $/Acct. Bi-Monthly Fixed Fee $/Acct.1 1/2" $90.27 1 1/2" $92.53
Consumpiton Charge $/CCF Consumpiton Charge $/CCFAll Consumption $2.7760 All Consumption $2.7829
City of PleasantonWater Utility Rate Study
Multi-Family Rates - 1 1/2" MeterAlternative 1: Year 2 - 2017
Includes 2.5% CPI Adj
Difference
PROPOSED RATESPRESENT RATES
37 of 52

Consumption Present Proposed(CCF) Rates Rates Amount Percent
0 $92.53 $94.84 $2.31 2.50%5 106.44 108.79 2.35 2.20%10 120.36 122.74 2.38 1.98%15 134.27 136.69 2.42 1.80%25 162.10 164.59 2.49 1.53%35 189.93 192.49 2.56 1.35%50 231.68 234.34 2.66 1.15%75 301.25 304.09 2.84 0.94%100 370.82 373.84 3.02 0.81%125 440.39 443.59 3.20 0.73%150 509.97 513.34 3.38 0.66%175 579.54 583.09 3.55 0.61%200 649.11 652.84 3.73 0.57%250 788.26 792.34 4.09 0.52%300 927.40 931.84 4.44 0.48%
Bi-Monthly Fixed Fee $/Acct. Bi-Monthly Fixed Fee $/Acct.1 1/2" $92.53 1 1/2" $94.84
Consumpiton Charge $/CCF Consumpiton Charge $/CCFAll Consumption $2.7829 All Consumption $2.7900
Multi-Family Rates - 1 1/2" MeterAlternative 1: Year 3 - 2018
Water Utility Rate StudyCity of Pleasanton
PROPOSED RATESPRESENT RATES
Includes 2.5% CPI Adj
Difference
38 of 52

Consumption Present Proposed(CCF) Rates Rates Amount Percent
0 $94.84 $97.21 $2.37 2.50%5 108.79 111.20 2.41 2.21%10 122.74 125.18 2.44 1.99%15 136.69 139.17 2.48 1.81%25 164.59 167.14 2.55 1.55%35 192.49 195.12 2.63 1.36%50 234.34 237.08 2.74 1.17%75 304.09 307.01 2.92 0.96%100 373.84 376.94 3.10 0.83%125 443.59 446.87 3.28 0.74%150 513.34 516.81 3.46 0.67%175 583.09 586.74 3.65 0.63%200 652.84 656.67 3.83 0.59%250 792.34 796.54 4.19 0.53%300 931.84 936.40 4.56 0.49%
Bi-Monthly Fixed Fee $/Acct. Bi-Monthly Fixed Fee $/Acct.1 1/2" $94.84 1 1/2" $97.21
Consumpiton Charge $/CCF Consumpiton Charge $/CCFAll Consumption $2.7900 All Consumption $2.7973
City of PleasantonWater Utility Rate Study
Multi-Family Rates - 1 1/2" MeterAlternative 1: Year 4 - 2019
PROPOSED RATESPRESENT RATES
Includes 2.5% CPI Adj
Difference
39 of 52

Consumption Present Proposed(CCF) Rates Rates Amount Percent
0 $97.21 $99.64 $2.43 2.50%5 111.20 113.66 2.47 2.22%10 125.18 127.69 2.50 2.00%15 139.17 141.71 2.54 1.83%25 167.14 169.76 2.61 1.56%35 195.12 197.80 2.69 1.38%50 237.08 239.88 2.80 1.18%75 307.01 309.99 2.99 0.97%100 376.94 380.11 3.17 0.84%125 446.87 450.23 3.36 0.75%150 516.81 520.35 3.54 0.68%175 586.74 590.46 3.73 0.63%200 656.67 660.58 3.91 0.60%250 796.54 800.82 4.28 0.54%300 936.40 941.05 4.65 0.50%
Bi-Monthly Fixed Fee $/Acct. Bi-Monthly Fixed Fee $/Acct.1 1/2" $97.21 1 1/2" $99.64
Consumpiton Charge $/CCF Consumpiton Charge $/CCFAll Consumption $2.7973 All Consumption $2.8047
Multi-Family Rates - 1 1/2" MeterAlternative 1: Year 5 - 2020
Water Utility Rate StudyCity of Pleasanton
PROPOSED RATESPRESENT RATES
Includes 2.5% CPI Adj
Difference
40 of 52
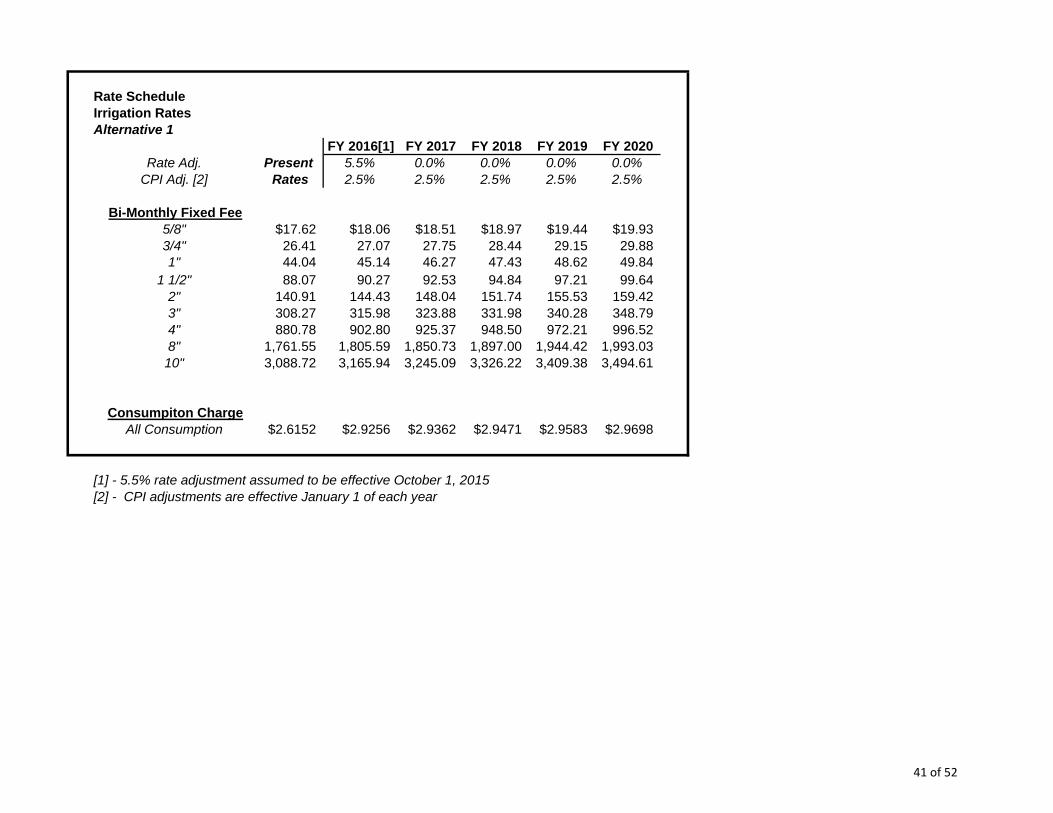
Rate ScheduleIrrigation RatesAlternative 1
FY 2016[1] FY 2017 FY 2018 FY 2019 FY 2020Rate Adj. Present 5.5% 0.0% 0.0% 0.0% 0.0%
CPI Adj. [2] Rates 2.5% 2.5% 2.5% 2.5% 2.5%
Bi-Monthly Fixed Fee5/8" $17.62 $18.06 $18.51 $18.97 $19.44 $19.933/4" 26.41 27.07 27.75 28.44 29.15 29.881" 44.04 45.14 46.27 47.43 48.62 49.84
1 1/2" 88.07 90.27 92.53 94.84 97.21 99.642" 140.91 144.43 148.04 151.74 155.53 159.423" 308.27 315.98 323.88 331.98 340.28 348.794" 880.78 902.80 925.37 948.50 972.21 996.528" 1,761.55 1,805.59 1,850.73 1,897.00 1,944.42 1,993.0310" 3,088.72 3,165.94 3,245.09 3,326.22 3,409.38 3,494.61
Consumpiton ChargeAll Consumption $2.6152 $2.9256 $2.9362 $2.9471 $2.9583 $2.9698
[1] - 5.5% rate adjustment assumed to be effective October 1, 2015[2] - CPI adjustments are effective January 1 of each year
41 of 52

Meter Consumption Present ProposedSize (CCF) Rates Rates Amount Percent
1 1/2" 0 $88.07 $90.27 $2.20 2.50%10 114.22 119.53 $5.30 4.64%20 140.37 148.78 $8.41 5.99%35 179.60 192.67 $13.06 7.27%50 218.83 236.55 $17.72 8.10%70 271.13 295.06 $23.93 8.83%90 323.44 353.57 $30.14 9.32%110 375.74 412.09 $36.34 9.67%135 441.12 485.23 $44.10 10.00%170 532.65 587.62 $54.97 10.32%205 624.19 690.02 $65.83 10.55%250 741.87 821.67 $79.80 10.76%300 872.63 967.95 $95.32 10.92%350 1,003.39 1,114.23 $110.84 11.05%500 1,395.67 1,553.07 $157.40 11.28%
Bi-Monthly Fixed Fee $/Acct. Bi-Monthly Fixed Fee $/Acct.1 1/2" $88.07 1 1/2" $90.27
Consumpiton Charge $/CCF Consumpiton Charge $/CCFAll Consumption $2.6152 All Consumption $2.9256
Irrigation Rates - 1 1/2" MeterWater Utility Rate Study
City of Pleasanton
Alternative 1: Year 1 - 2016Includes 5.5% rate adj. plus 2.5% CPI
Difference
PRESENT RATES PROPOSED RATES
42 of 52
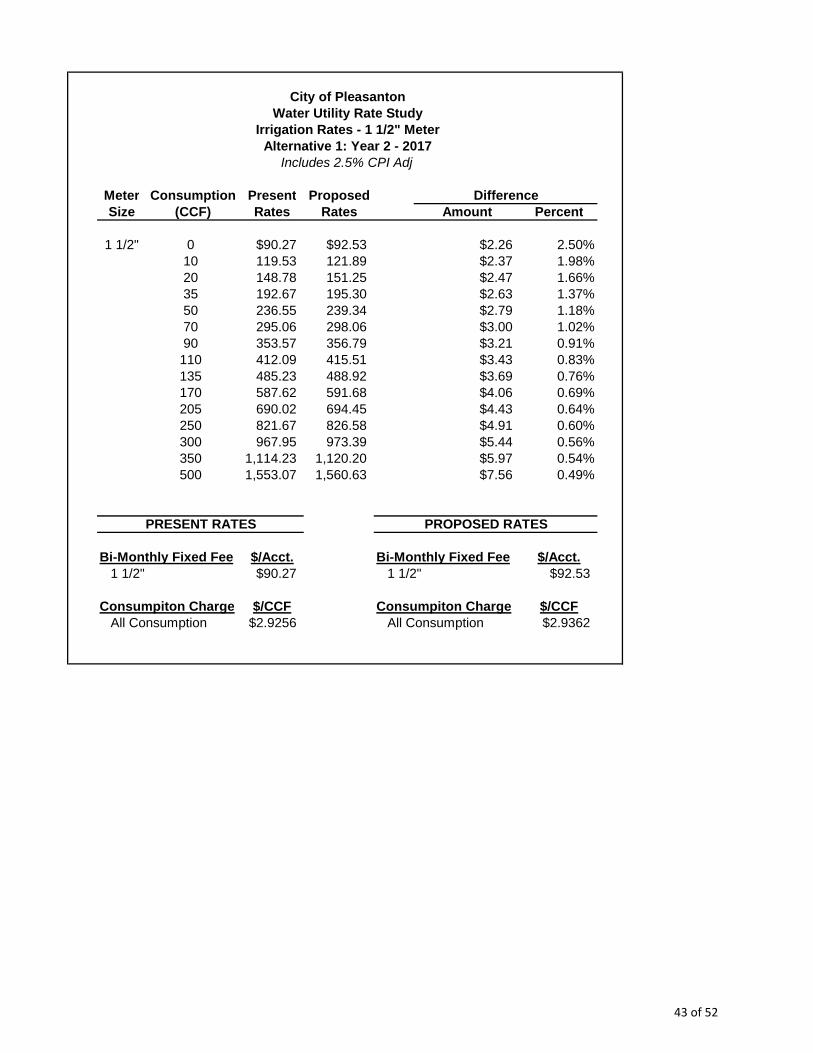
Meter Consumption Present ProposedSize (CCF) Rates Rates Amount Percent
1 1/2" 0 $90.27 $92.53 $2.26 2.50%10 119.53 121.89 $2.37 1.98%20 148.78 151.25 $2.47 1.66%35 192.67 195.30 $2.63 1.37%50 236.55 239.34 $2.79 1.18%70 295.06 298.06 $3.00 1.02%90 353.57 356.79 $3.21 0.91%110 412.09 415.51 $3.43 0.83%135 485.23 488.92 $3.69 0.76%170 587.62 591.68 $4.06 0.69%205 690.02 694.45 $4.43 0.64%250 821.67 826.58 $4.91 0.60%300 967.95 973.39 $5.44 0.56%350 1,114.23 1,120.20 $5.97 0.54%500 1,553.07 1,560.63 $7.56 0.49%
Bi-Monthly Fixed Fee $/Acct. Bi-Monthly Fixed Fee $/Acct.1 1/2" $90.27 1 1/2" $92.53
Consumpiton Charge $/CCF Consumpiton Charge $/CCFAll Consumption $2.9256 All Consumption $2.9362
Includes 2.5% CPI Adj
Difference
PROPOSED RATESPRESENT RATES
City of PleasantonWater Utility Rate Study
Irrigation Rates - 1 1/2" MeterAlternative 1: Year 2 - 2017
43 of 52

Meter Consumption Present ProposedSize (CCF) Rates Rates Amount Percent
1 1/2" 0 $92.53 $94.84 $2.31 2.50%10 121.89 124.31 $2.42 1.98%20 151.25 153.78 $2.53 1.67%35 195.30 197.99 $2.69 1.38%50 239.34 242.20 $2.85 1.19%70 298.06 301.14 $3.07 1.03%90 356.79 360.08 $3.29 0.92%110 415.51 419.02 $3.51 0.84%135 488.92 492.70 $3.78 0.77%170 591.68 595.85 $4.16 0.70%205 694.45 699.00 $4.54 0.65%250 826.58 831.62 $5.04 0.61%300 973.39 978.97 $5.58 0.57%350 1,120.20 1,126.33 $6.12 0.55%500 1,560.63 1,568.39 $7.76 0.50%
Bi-Monthly Fixed Fee $/Acct. Bi-Monthly Fixed Fee $/Acct.1 1/2" $92.53 1 1/2" $94.84
Consumpiton Charge $/CCF Consumpiton Charge $/CCFAll Consumption $2.9362 All Consumption $2.9471
City of PleasantonWater Utility Rate Study
Includes 2.5% CPI Adj
Difference
PROPOSED RATES
Irrigation Rates - 1 1/2" MeterAlternative 1: Year 3 - 2018
PRESENT RATES
44 of 52

Meter Consumption Present ProposedSize (CCF) Rates Rates Amount Percent
1 1/2" 0 $94.84 $97.21 $2.37 2.50%10 124.31 126.79 $2.48 2.00%20 153.78 156.38 $2.59 1.69%35 197.99 200.75 $2.76 1.40%50 242.20 245.13 $2.93 1.21%70 301.14 304.29 $3.15 1.05%90 360.08 363.46 $3.38 0.94%110 419.02 422.62 $3.60 0.86%135 492.70 496.58 $3.88 0.79%170 595.85 600.12 $4.27 0.72%205 699.00 703.66 $4.67 0.67%250 831.62 836.79 $5.17 0.62%300 978.97 984.70 $5.73 0.59%350 1,126.33 1,132.62 $6.29 0.56%500 1,568.39 1,576.36 $7.97 0.51%
Bi-Monthly Fixed Fee $/Acct. Bi-Monthly Fixed Fee $/Acct.1 1/2" $94.84 1 1/2" $97.21
Consumpiton Charge $/CCF Consumpiton Charge $/CCFAll Consumption $2.9471 All Consumption $2.9583
City of PleasantonWater Utility Rate Study
Irrigation Rates - 1 1/2" MeterAlternative 1: Year 4 - 2019
PROPOSED RATESPRESENT RATES
Includes 2.5% CPI Adj
Difference
45 of 52

Meter Consumption Present ProposedSize (CCF) Rates Rates Amount Percent
1 1/2" 0 $97.21 $99.64 $2.43 2.50%10 126.79 129.34 $2.54 2.01%20 156.38 159.04 $2.66 1.70%35 200.75 203.58 $2.83 1.41%50 245.13 248.13 $3.01 1.23%70 304.29 307.53 $3.24 1.06%90 363.46 366.92 $3.46 0.95%110 422.62 426.32 $3.69 0.87%135 496.58 500.56 $3.98 0.80%170 600.12 604.51 $4.38 0.73%205 703.66 708.45 $4.79 0.68%250 836.79 842.09 $5.30 0.63%300 984.70 990.58 $5.88 0.60%350 1,132.62 1,139.07 $6.45 0.57%500 1,576.36 1,584.54 $8.18 0.52%
Bi-Monthly Fixed Fee $/Acct. Bi-Monthly Fixed Fee $/Acct.1 1/2" $97.21 1 1/2" $99.64
Consumpiton Charge $/CCF Consumpiton Charge $/CCFAll Consumption $2.9583 All Consumption $2.9698
Water Utility Rate StudyIrrigation Rates - 1 1/2" Meter
Alternative 1: Year 5 - 2020
City of Pleasanton
PROPOSED RATESPRESENT RATES
Includes 2.5% CPI Adj
Difference
46 of 52
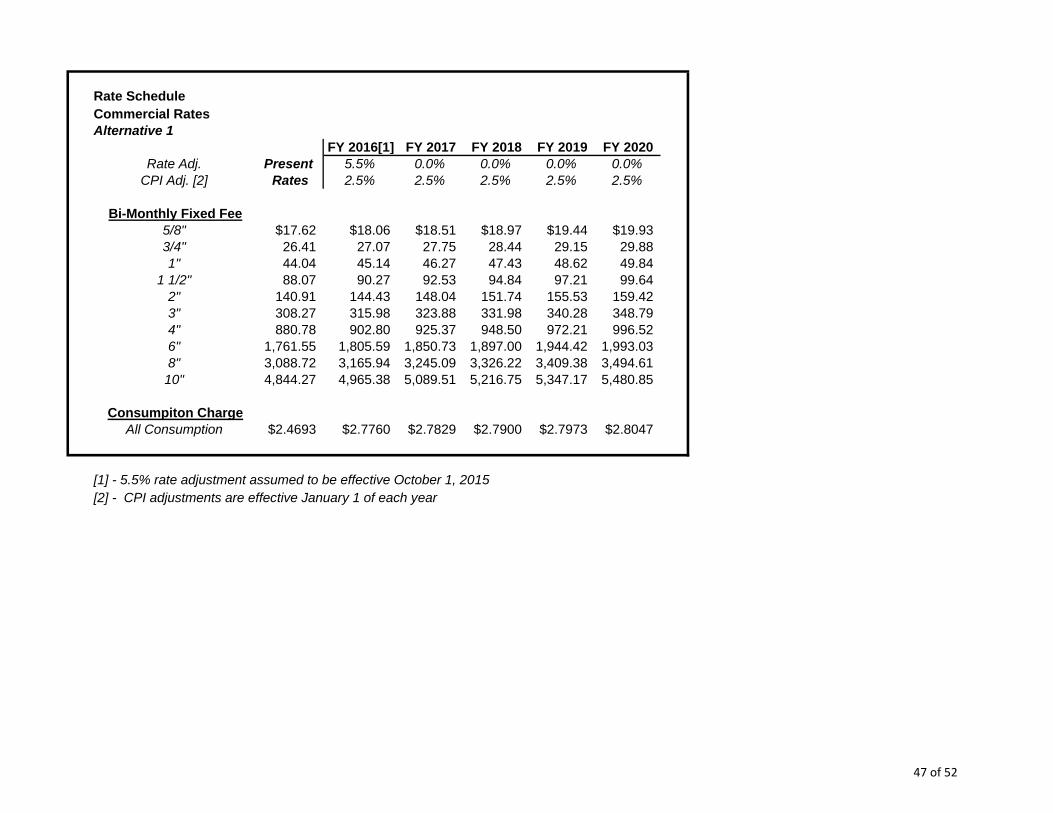
Rate ScheduleCommercial RatesAlternative 1
FY 2016[1] FY 2017 FY 2018 FY 2019 FY 2020Rate Adj. Present 5.5% 0.0% 0.0% 0.0% 0.0%
CPI Adj. [2] Rates 2.5% 2.5% 2.5% 2.5% 2.5%
Bi-Monthly Fixed Fee5/8" $17.62 $18.06 $18.51 $18.97 $19.44 $19.933/4" 26.41 27.07 27.75 28.44 29.15 29.881" 44.04 45.14 46.27 47.43 48.62 49.84
1 1/2" 88.07 90.27 92.53 94.84 97.21 99.642" 140.91 144.43 148.04 151.74 155.53 159.423" 308.27 315.98 323.88 331.98 340.28 348.794" 880.78 902.80 925.37 948.50 972.21 996.526" 1,761.55 1,805.59 1,850.73 1,897.00 1,944.42 1,993.038" 3,088.72 3,165.94 3,245.09 3,326.22 3,409.38 3,494.6110" 4,844.27 4,965.38 5,089.51 5,216.75 5,347.17 5,480.85
Consumpiton ChargeAll Consumption $2.4693 $2.7760 $2.7829 $2.7900 $2.7973 $2.8047
[1] - 5.5% rate adjustment assumed to be effective October 1, 2015[2] - CPI adjustments are effective January 1 of each year
47 of 52

Consumption Present Proposed(CCF) Rates Rates Amount Percent
0 $44.04 $45.14 $1.10 2.50%10 68.73 72.90 4.17 6.06%20 93.43 100.66 7.23 7.74%35 130.47 142.30 11.83 9.07%50 167.51 183.94 16.44 9.81%70 216.89 239.46 22.57 10.41%90 266.28 294.98 28.70 10.78%110 315.66 350.50 34.84 11.04%135 377.40 419.90 42.50 11.26%170 463.82 517.06 53.24 11.48%205 550.25 614.22 63.97 11.63%250 661.37 739.14 77.78 11.76%300 784.83 877.94 93.11 11.86%350 908.30 1,016.74 108.45 11.94%500 1,278.69 1,433.14 154.45 12.08%
Bi-Monthly Fixed Fee $/Acct. Bi-Monthly Fixed Fee $/Acct.1" $44.04 1" $45.14
Consumpiton Charge $/CCF Consumpiton Charge $/CCFAll Consumption $2.4693 All Consumption $2.7760
City of PleasantonWater Utility Rate Study
Commercial Rates - 1" MeterAlternative 1: Year 1 - 2016
Includes 5.5% rate adj. plus 2.5% CPI
Difference
PRESENT RATES PROPOSED RATES
48 of 52

Consumption Present Proposed(CCF) Rates Rates Amount Percent
0 $45.14 $46.27 $1.13 2.50%10 72.90 74.10 1.20 1.64%20 100.66 101.93 1.27 1.26%35 142.30 143.67 1.37 0.96%50 183.94 185.42 1.48 0.80%70 239.46 241.07 1.61 0.67%90 294.98 296.73 1.75 0.59%110 350.50 352.39 1.89 0.54%135 419.90 421.96 2.06 0.49%170 517.06 519.36 2.30 0.45%205 614.22 616.76 2.54 0.41%250 739.14 742.00 2.85 0.39%300 877.94 881.14 3.20 0.36%350 1,016.74 1,020.29 3.54 0.35%500 1,433.14 1,437.72 4.58 0.32%
Bi-Monthly Fixed Fee $/Acct. Bi-Monthly Fixed Fee $/Acct.1" $45.14 1" $46.27
Consumpiton Charge $/CCF Consumpiton Charge $/CCFAll Consumption $2.7760 All Consumption $2.7829
Commercial Rates - 1" MeterAlternative 1: Year 2 - 2017
PROPOSED RATESPRESENT RATES
Includes 2.5% CPI Adj
Difference
City of PleasantonWater Utility Rate Study
49 of 52

Consumption Present Proposed(CCF) Rates Rates Amount Percent
0 $46.27 $47.43 $1.16 2.51%10 74.10 75.33 1.23 1.66%20 101.93 103.23 1.30 1.28%35 143.67 145.08 1.41 0.98%50 185.42 186.93 1.51 0.82%70 241.07 242.73 1.66 0.69%90 296.73 298.53 1.80 0.61%110 352.39 354.33 1.94 0.55%135 421.96 424.08 2.12 0.50%170 519.36 521.73 2.37 0.46%205 616.76 619.38 2.62 0.42%250 742.00 744.93 2.93 0.40%300 881.14 884.43 3.29 0.37%350 1,020.29 1,023.93 3.64 0.36%500 1,437.72 1,442.43 4.71 0.33%
Bi-Monthly Fixed Fee $/Acct. Bi-Monthly Fixed Fee $/Acct.1" $46.27 1" $47.43
Consumpiton Charge $/CCF Consumpiton Charge $/CCFAll Consumption $2.7829 All Consumption $2.7900
PROPOSED RATESPRESENT RATES
Includes 2.5% CPI Adj
Difference
Commercial Rates - 1" MeterAlternative 1: Year 3 - 2018
City of PleasantonWater Utility Rate Study
50 of 52

Consumption Present Proposed(CCF) Rates Rates Amount Percent
0 $47.43 $48.62 $1.19 2.51%10 75.33 76.59 1.26 1.68%20 103.23 104.57 1.34 1.29%35 145.08 146.53 1.45 1.00%50 186.93 188.49 1.56 0.83%70 242.73 244.43 1.70 0.70%90 298.53 300.38 1.85 0.62%110 354.33 356.32 1.99 0.56%135 424.08 426.26 2.18 0.51%170 521.73 524.16 2.43 0.47%205 619.38 622.07 2.69 0.43%250 744.93 747.95 3.01 0.40%300 884.43 887.81 3.38 0.38%350 1,023.93 1,027.68 3.75 0.37%500 1,442.43 1,447.27 4.84 0.34%
Bi-Monthly Fixed Fee $/Acct. Bi-Monthly Fixed Fee $/Acct.1" $47.43 1" $48.62
Consumpiton Charge $/CCF Consumpiton Charge $/CCFAll Consumption $2.7900 All Consumption $2.7973
Commercial Rates - 1" MeterAlternative 1: Year 4 - 2019
PROPOSED RATESPRESENT RATES
City of PleasantonWater Utility Rate Study
Includes 2.5% CPI Adj
Difference
51 of 52

Consumption Present Proposed(CCF) Rates Rates Amount Percent
0 $48.62 $49.84 $1.22 2.51%10 76.59 77.89 1.29 1.69%20 104.57 105.93 1.37 1.31%35 146.53 148.00 1.48 1.01%50 188.49 190.08 1.59 0.84%70 244.43 246.17 1.74 0.71%90 300.38 302.26 1.89 0.63%110 356.32 358.36 2.03 0.57%135 426.26 428.47 2.22 0.52%170 524.16 526.64 2.48 0.47%205 622.07 624.80 2.74 0.44%250 747.95 751.02 3.07 0.41%300 887.81 891.25 3.44 0.39%350 1,027.68 1,031.49 3.81 0.37%500 1,447.27 1,452.19 4.92 0.34%
Bi-Monthly Fixed Fee $/Acct. Bi-Monthly Fixed Fee $/Acct.1" $48.62 1" $49.84
Consumpiton Charge $/CCF Consumpiton Charge $/CCFAll Consumption $2.7973 All Consumption $2.8047
Water Utility Rate StudyCommercial Rates - 1" MeterAlternative 1: Year 5 - 2020
City of Pleasanton
PROPOSED RATESPRESENT RATES
Difference
Includes 2.5% CPI Adj
52 of 52

Technical Appendix B – Recycled Water Analysis
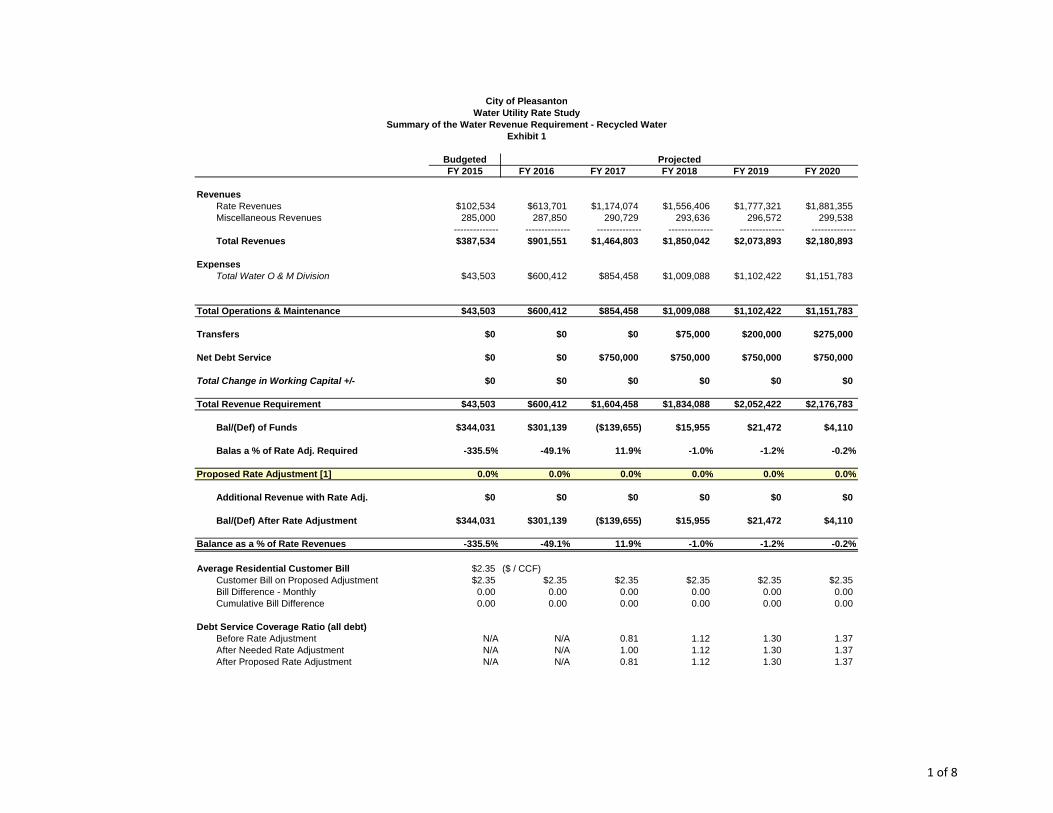
BudgetedFY 2015 FY 2016 FY 2017 FY 2018 FY 2019 FY 2020
RevenuesRate Revenues $102,534 $613,701 $1,174,074 $1,556,406 $1,777,321 $1,881,355Miscellaneous Revenues 285,000 287,850 290,729 293,636 296,572 299,538
-------------- -------------- -------------- -------------- -------------- --------------Total Revenues $387,534 $901,551 $1,464,803 $1,850,042 $2,073,893 $2,180,893
ExpensesTotal Water O & M Division $43,503 $600,412 $854,458 $1,009,088 $1,102,422 $1,151,783
Total Operations & Maintenance $43,503 $600,412 $854,458 $1,009,088 $1,102,422 $1,151,783
Transfers $0 $0 $0 $75,000 $200,000 $275,000
Net Debt Service $0 $0 $750,000 $750,000 $750,000 $750,000
Total Change in Working Capital +/- $0 $0 $0 $0 $0 $0
Total Revenue Requirement $43,503 $600,412 $1,604,458 $1,834,088 $2,052,422 $2,176,783
Bal/(Def) of Funds $344,031 $301,139 ($139,655) $15,955 $21,472 $4,110
Balas a % of Rate Adj. Required -335.5% -49.1% 11.9% -1.0% -1.2% -0.2%
Proposed Rate Adjustment [1] 0.0% 0.0% 0.0% 0.0% 0.0% 0.0%
Additional Revenue with Rate Adj. $0 $0 $0 $0 $0 $0
Bal/(Def) After Rate Adjustment $344,031 $301,139 ($139,655) $15,955 $21,472 $4,110
Balance as a % of Rate Revenues -335.5% -49.1% 11.9% -1.0% -1.2% -0.2%
Average Residential Customer Bill $2.35 ($ / CCF)Customer Bill on Proposed Adjustment $2.35 $2.35 $2.35 $2.35 $2.35 $2.35Bill Difference - Monthly 0.00 0.00 0.00 0.00 0.00 0.00Cumulative Bill Difference 0.00 0.00 0.00 0.00 0.00 0.00
Debt Service Coverage Ratio (all debt)Before Rate Adjustment N/A N/A 0.81 1.12 1.30 1.37After Needed Rate Adjustment N/A N/A 1.00 1.12 1.30 1.37After Proposed Rate Adjustment N/A N/A 0.81 1.12 1.30 1.37
Projected
City of PleasantonWater Utility Rate Study
Summary of the Water Revenue Requirement - Recycled WaterExhibit 1
1 of 8

City of PleasantonWater Utility Rate StudyEscalationsExhibit 2
BudgetedFY 2015 FY 2016 FY 2017 FY 2018 FY 2019 FY 2020 Notes:
Revenues:Res - Customer Growth Budget 1.0% 1.0% 1.0% 1.0% 1.0%Irr - Customer Growth Budget -5.0% -15.0% -15.0% -10.0% -5.0%Com - Customer Growth Budget 1.0% 1.0% 1.0% 1.0% 1.0%Recycled Water - Cust. Growth Budget 376.2% 140.0% 50.0% 5.6% 5.3%All - Customer Growth Budget 1.0% 1.0% 1.0% 1.0% 1.0%Single-Family - Consumption Growth Budget 7.5% 4.8% 6.9% 6.5% 4.8%Multi-Family - Consumption Growth Budget 12.5% 7.5% 10.0% 7.0% 5.0%Irrigation - Consumption Growth Budget -5.0% -15.0% -15.0% -10.0% -5.0%Commercial - Consumption Growth Budget 4.0% 4.0% 4.0% 3.5% 3.5%Miscellaneous Revenues Budget 1.0% 1.0% 1.0% 1.0% 1.0%
Expenses:Salary Budget 3.0% 3.0% 3.0% 3.0% 3.0%Benefits Budget 3.5% 3.5% 3.5% 3.5% 3.5%General O&M Budget 3.0% 3.0% 3.0% 3.0% 3.0%Materials & Supplies Budget 2.5% 2.5% 2.5% 2.5% 2.5%Equipment Budget 3.5% 3.5% 3.5% 3.5% 3.5%Miscellaneous Budget 2.0% 2.0% 2.0% 2.0% 2.0%Purchased Water - Recycled Budget 3.5% 3.5% 3.5% 3.5% 3.5%Purchased Water - Zone 7 Budget 0.0% 0.0% 0.0% 0.0% 0.0%
Interest: 0.5% 0.5% 0.5% 0.8% 1.0% 1.0%
New Debt Service:Low Interest Loans
Term in Years 20 20 20 20 20 20Rate 2.5% 2.5% 2.5% 2.5% 2.5% 2.5%
Revenue BondTerm in Years 20 20 20 20 20 20Rate 5.0% 5.0% 5.0% 5.0% 5.0% 5.0%
Projected
2 of 8
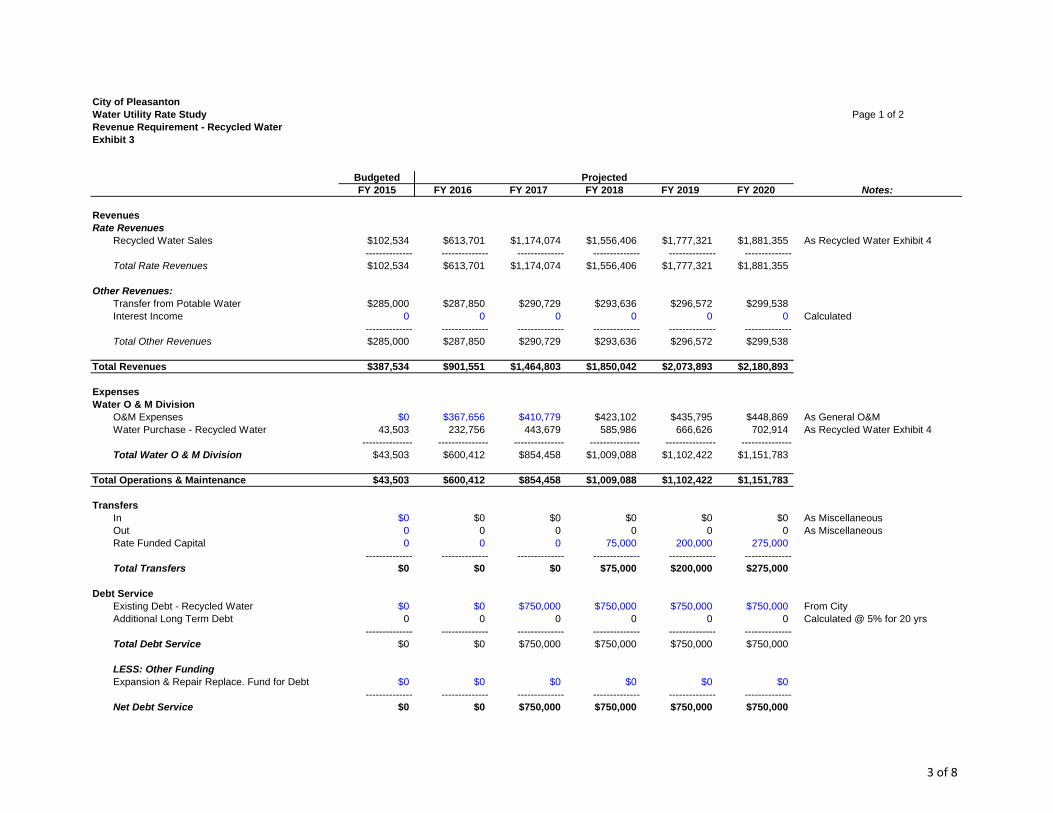
City of PleasantonWater Utility Rate Study Page 1 of 2Revenue Requirement - Recycled WaterExhibit 3
BudgetedFY 2015 FY 2016 FY 2017 FY 2018 FY 2019 FY 2020 Notes:
RevenuesRate Revenues
Recycled Water Sales $102,534 $613,701 $1,174,074 $1,556,406 $1,777,321 $1,881,355 As Recycled Water Exhibit 4-------------- -------------- -------------- -------------- -------------- --------------
Total Rate Revenues $102,534 $613,701 $1,174,074 $1,556,406 $1,777,321 $1,881,355
Other Revenues:Transfer from Potable Water $285,000 $287,850 $290,729 $293,636 $296,572 $299,538Interest Income 0 0 0 0 0 0 Calculated
-------------- -------------- -------------- -------------- -------------- --------------Total Other Revenues $285,000 $287,850 $290,729 $293,636 $296,572 $299,538
Total Revenues $387,534 $901,551 $1,464,803 $1,850,042 $2,073,893 $2,180,893
ExpensesWater O & M Division
O&M Expenses $0 $367,656 $410,779 $423,102 $435,795 $448,869 As General O&MWater Purchase - Recycled Water 43,503 232,756 443,679 585,986 666,626 702,914 As Recycled Water Exhibit 4
--------------- --------------- --------------- --------------- --------------- ---------------Total Water O & M Division $43,503 $600,412 $854,458 $1,009,088 $1,102,422 $1,151,783
Total Operations & Maintenance $43,503 $600,412 $854,458 $1,009,088 $1,102,422 $1,151,783
TransfersIn $0 $0 $0 $0 $0 $0 As MiscellaneousOut 0 0 0 0 0 0 As MiscellaneousRate Funded Capital 0 0 0 75,000 200,000 275,000
-------------- -------------- -------------- -------------- -------------- --------------Total Transfers $0 $0 $0 $75,000 $200,000 $275,000
Debt ServiceExisting Debt - Recycled Water $0 $0 $750,000 $750,000 $750,000 $750,000 From CityAdditional Long Term Debt 0 0 0 0 0 0 Calculated @ 5% for 20 yrs
-------------- -------------- -------------- -------------- -------------- --------------Total Debt Service $0 $0 $750,000 $750,000 $750,000 $750,000
LESS: Other FundingExpansion & Repair Replace. Fund for Debt $0 $0 $0 $0 $0 $0
-------------- -------------- -------------- -------------- -------------- --------------Net Debt Service $0 $0 $750,000 $750,000 $750,000 $750,000
Projected
3 of 8
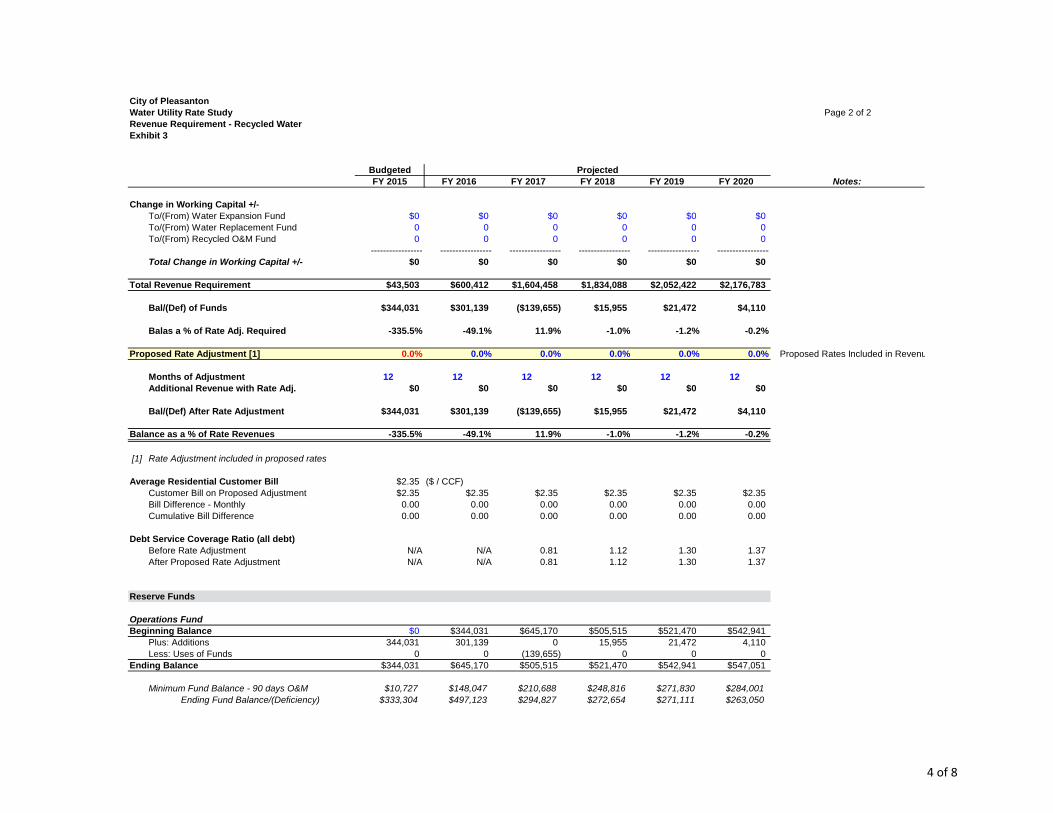
City of PleasantonWater Utility Rate Study Page 2 of 2Revenue Requirement - Recycled WaterExhibit 3
BudgetedFY 2015 FY 2016 FY 2017 FY 2018 FY 2019 FY 2020 Notes:
Projected
Change in Working Capital +/-To/(From) Water Expansion Fund $0 $0 $0 $0 $0 $0To/(From) Water Replacement Fund 0 0 0 0 0 0To/(From) Recycled O&M Fund 0 0 0 0 0 0
----------------- ----------------- ----------------- ----------------- ----------------- -----------------Total Change in Working Capital +/- $0 $0 $0 $0 $0 $0
Total Revenue Requirement $43,503 $600,412 $1,604,458 $1,834,088 $2,052,422 $2,176,783
Bal/(Def) of Funds $344,031 $301,139 ($139,655) $15,955 $21,472 $4,110
Balas a % of Rate Adj. Required -335.5% -49.1% 11.9% -1.0% -1.2% -0.2%
Proposed Rate Adjustment [1] 0.0% 0.0% 0.0% 0.0% 0.0% 0.0% Proposed Rates Included in Revenue Projections
Months of Adjustment 12 12 12 12 12 12Additional Revenue with Rate Adj. $0 $0 $0 $0 $0 $0
Bal/(Def) After Rate Adjustment $344,031 $301,139 ($139,655) $15,955 $21,472 $4,110
Balance as a % of Rate Revenues -335.5% -49.1% 11.9% -1.0% -1.2% -0.2%
[1] Rate Adjustment included in proposed rates
Average Residential Customer Bill $2.35 ($ / CCF)Customer Bill on Proposed Adjustment $2.35 $2.35 $2.35 $2.35 $2.35 $2.35Bill Difference - Monthly 0.00 0.00 0.00 0.00 0.00 0.00Cumulative Bill Difference 0.00 0.00 0.00 0.00 0.00 0.00
Debt Service Coverage Ratio (all debt)Before Rate Adjustment N/A N/A 0.81 1.12 1.30 1.37After Proposed Rate Adjustment N/A N/A 0.81 1.12 1.30 1.37
Reserve Funds
Operations FundBeginning Balance $0 $344,031 $645,170 $505,515 $521,470 $542,941
Plus: Additions 344,031 301,139 0 15,955 21,472 4,110Less: Uses of Funds 0 0 (139,655) 0 0 0
Ending Balance $344,031 $645,170 $505,515 $521,470 $542,941 $547,051
Minimum Fund Balance - 90 days O&M $10,727 $148,047 $210,688 $248,816 $271,830 $284,001Ending Fund Balance/(Deficiency) $333,304 $497,123 $294,827 $272,654 $271,111 $263,050
4 of 8
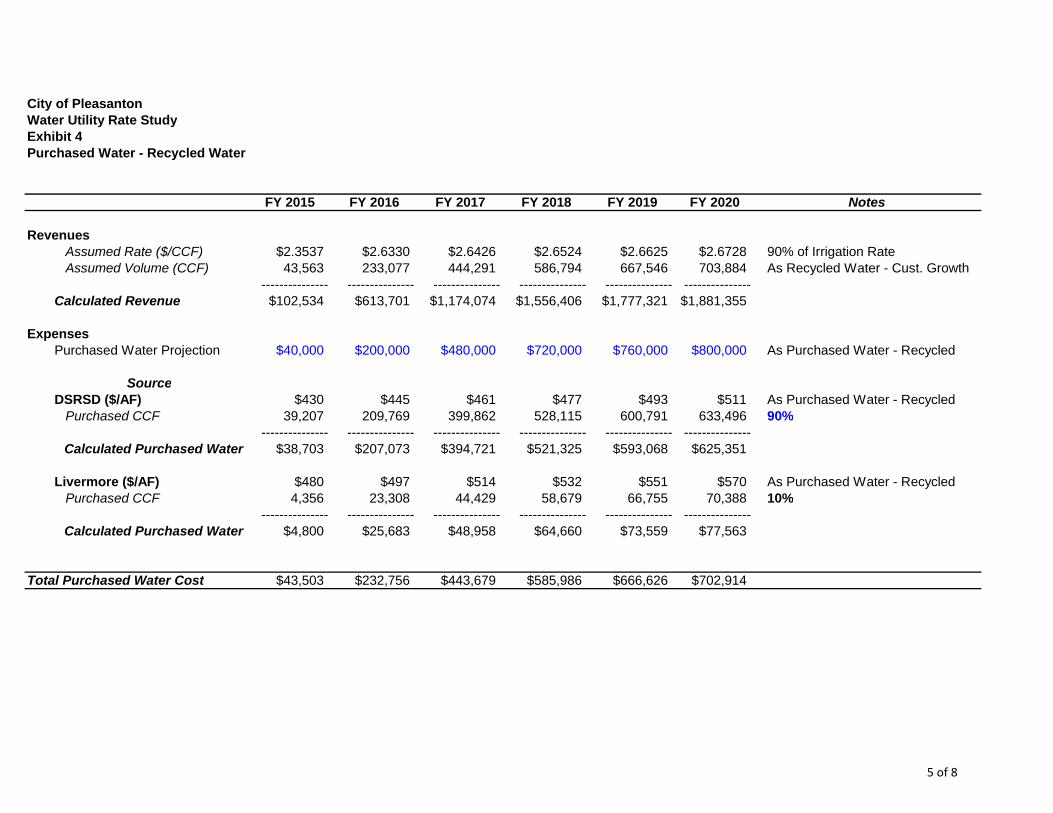
City of PleasantonWater Utility Rate StudyExhibit 4Purchased Water - Recycled Water
FY 2015 FY 2016 FY 2017 FY 2018 FY 2019 FY 2020 Notes
RevenuesAssumed Rate ($/CCF) $2.3537 $2.6330 $2.6426 $2.6524 $2.6625 $2.6728 90% of Irrigation RateAssumed Volume (CCF) 43,563 233,077 444,291 586,794 667,546 703,884 As Recycled Water - Cust. Growth
--------------- --------------- --------------- --------------- --------------- ---------------Calculated Revenue $102,534 $613,701 $1,174,074 $1,556,406 $1,777,321 $1,881,355
ExpensesPurchased Water Projection $40,000 $200,000 $480,000 $720,000 $760,000 $800,000 As Purchased Water - Recycled
SourceDSRSD ($/AF) $430 $445 $461 $477 $493 $511 As Purchased Water - Recycled
Purchased CCF 39,207 209,769 399,862 528,115 600,791 633,496 90%--------------- --------------- --------------- --------------- --------------- ---------------
Calculated Purchased Water $38,703 $207,073 $394,721 $521,325 $593,068 $625,351
Livermore ($/AF) $480 $497 $514 $532 $551 $570 As Purchased Water - RecycledPurchased CCF 4,356 23,308 44,429 58,679 66,755 70,388 10%
--------------- --------------- --------------- --------------- --------------- ---------------Calculated Purchased Water $4,800 $25,683 $48,958 $64,660 $73,559 $77,563
Total Purchased Water Cost $43,503 $232,756 $443,679 $585,986 $666,626 $702,914
5 of 8
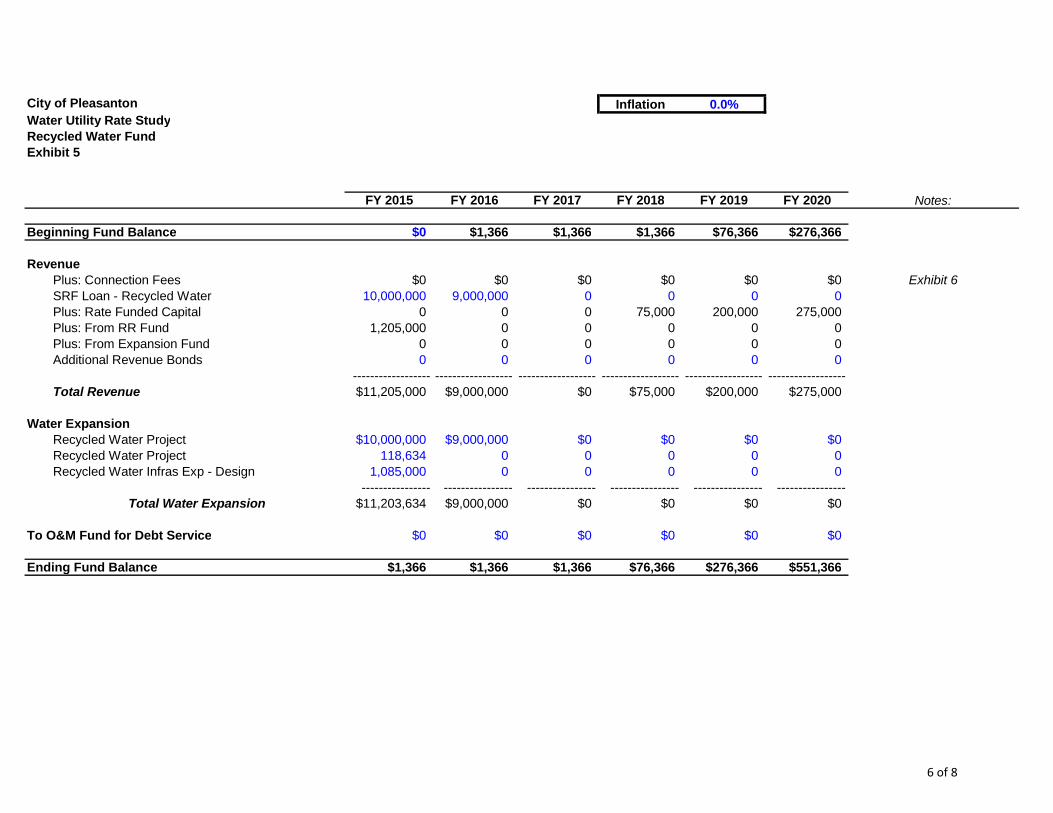
City of Pleasanton Inflation 0.0%Water Utility Rate StudyRecycled Water FundExhibit 5
FY 2015 FY 2016 FY 2017 FY 2018 FY 2019 FY 2020 Notes:
Beginning Fund Balance $0 $1,366 $1,366 $1,366 $76,366 $276,366
RevenuePlus: Connection Fees $0 $0 $0 $0 $0 $0 Exhibit 6SRF Loan - Recycled Water 10,000,000 9,000,000 0 0 0 0Plus: Rate Funded Capital 0 0 0 75,000 200,000 275,000Plus: From RR Fund 1,205,000 0 0 0 0 0Plus: From Expansion Fund 0 0 0 0 0 0Additional Revenue Bonds 0 0 0 0 0 0
------------------ ------------------ ------------------ ------------------ ------------------ ------------------Total Revenue $11,205,000 $9,000,000 $0 $75,000 $200,000 $275,000
Water ExpansionRecycled Water Project $10,000,000 $9,000,000 $0 $0 $0 $0Recycled Water Project 118,634 0 0 0 0 0Recycled Water Infras Exp - Design 1,085,000 0 0 0 0 0
---------------- ---------------- ---------------- ---------------- ---------------- ----------------Total Water Expansion $11,203,634 $9,000,000 $0 $0 $0 $0
To O&M Fund for Debt Service $0 $0 $0 $0 $0 $0
Ending Fund Balance $1,366 $1,366 $1,366 $76,366 $276,366 $551,366
6 of 8
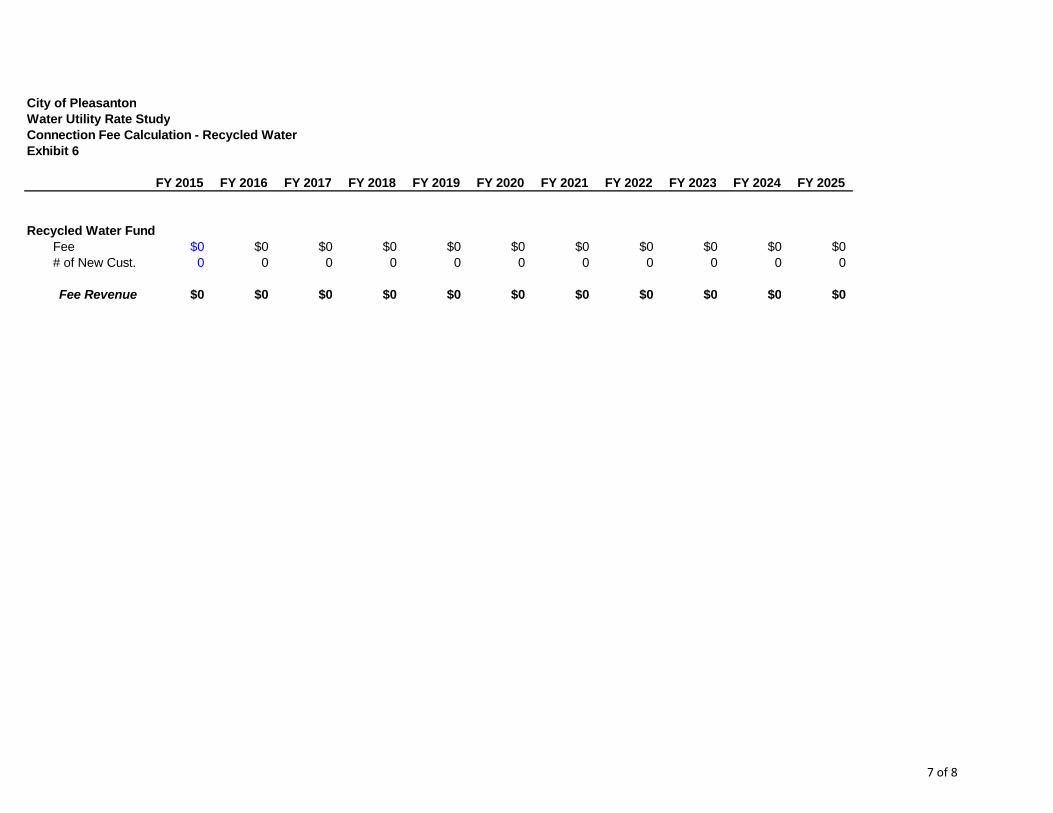
City of PleasantonWater Utility Rate StudyConnection Fee Calculation - Recycled WaterExhibit 6
FY 2015 FY 2016 FY 2017 FY 2018 FY 2019 FY 2020 FY 2021 FY 2022 FY 2023 FY 2024 FY 2025
Recycled Water FundFee $0 $0 $0 $0 $0 $0 $0 $0 $0 $0 $0# of New Cust. 0 0 0 0 0 0 0 0 0 0 0
Fee Revenue $0 $0 $0 $0 $0 $0 $0 $0 $0 $0 $0
7 of 8
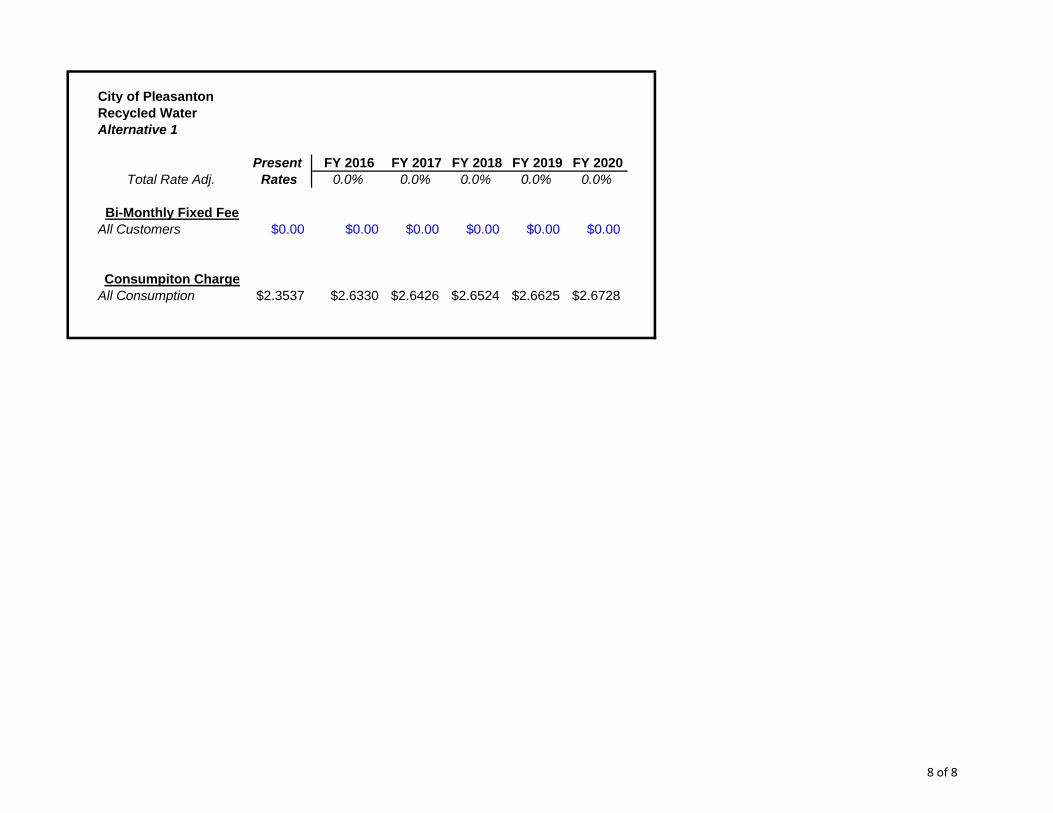
City of PleasantonRecycled WaterAlternative 1
Present FY 2016 FY 2017 FY 2018 FY 2019 FY 2020Total Rate Adj. Rates 0.0% 0.0% 0.0% 0.0% 0.0%
Bi-Monthly Fixed FeeAll Customers $0.00 $0.00 $0.00 $0.00 $0.00 $0.00
Consumpiton ChargeAll Consumption $2.3537 $2.6330 $2.6426 $2.6524 $2.6625 $2.6728
8 of 8

Technical Appendix C – Tier Pricing Analysis
City of Pleasanton 1 Development of Tier Pricing - 2015 Water Rate Study
Technical Memorandum – Cost Basis for Tiered Pricing
Introduction HDR Engineering, Inc. (HDR) was retained by the City of Pleasanton (City) to develop a water, sewer, and recycled water rate study. During the development of the study, the Capistrano Taxpayers Association, Inc. v. City of San Juan Capistrano decision was rendered by the Appellate Court, which determined that a cost basis must be established for each of the pricing tiers of a tiered or increasing block rate structure. This decision has implications for all California utilities designing and implementing rates. California has always recognized the importance and value of water supply. Efficient water use, and discouragement of inefficient or wasteful use, has been at the heart of many water utility conservation programs. In particular, one of the important conservation tools used by water utilities is conservation pricing and conservation-oriented rate structures to encourage efficient use through price signals. It is a well recognized economic principle that as the price of a commodity increases the demand for the commodity will go down. By creating water rate structures which increase in per unit price as consumption becomes less efficient, the high use or inefficient water user is provided with a “price signal” to be more efficient in their usage. In Capistrano, the issue of penalty or punitive pricing for inefficient or wasteful users was a point of contention. In short, the Capistrano decision determined among other things that, in order to be compliant with Proposition 218, there must be a cost-basis for each of the pricing tiers. Given that, the purpose of this technical memorandum is to briefly review the Capistrano decision and discuss the cost basis for the City’s tiered pricing water rate structure.
San Juan Capistrano and Proposition 218 It has always been important for a utility to have cost-based rates that are fair, equitable, and defendable. The basis for establishing water rates that are fair, equitable, and defendable has traditionally been cost of service principles and methodologies.1 At the same time, the courts have historically recognized that municipal entities can take into account policy objectives other than strictly cost of service when establishing rates (e.g., conservation, efficient use, ability to pay, etc.). In most parts of the U.S., that policy latitude in establishing utility rates remains intact. In contrast to above discussion regarding policy latitude, the State of California has certain well established legal constraints regarding utility ratemaking, of which Proposition 218 is at the forefront. At its very core, Proposition 218 requires a water utility to establish cost-based rates for the services provided. However, like most propositions or voter’s initiatives, Proposition 218 provided certain direction, but lacked clarity and definition in certain areas. Hence, there have been a number of lawsuits in recent years related to utility rates and Proposition 218. In the Capistrano Taxpayers Association, Inc. v. City of San Juan Capistrano, the City of San Juan Capistrano (Capistrano) was challenged, among other items, over the cost-basis for the tiers (price blocks) of their tiered water rate
1 Generally-accepted cost of service principles and methodologies are best defined and discussed within the American Water Works Association M-1 Manual, Principles of Water Rates, Fees and Charges.
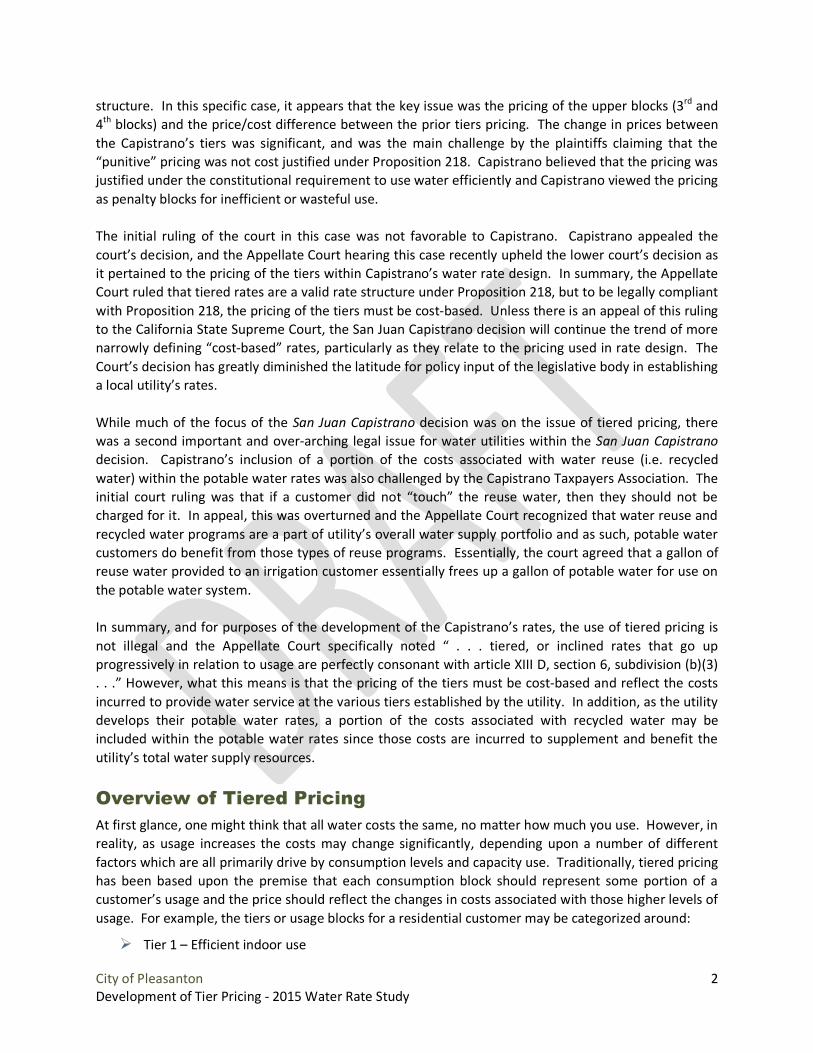
City of Pleasanton 2 Development of Tier Pricing - 2015 Water Rate Study
structure. In this specific case, it appears that the key issue was the pricing of the upper blocks (3rd and 4th blocks) and the price/cost difference between the prior tiers pricing. The change in prices between the Capistrano’s tiers was significant, and was the main challenge by the plaintiffs claiming that the “punitive” pricing was not cost justified under Proposition 218. Capistrano believed that the pricing was justified under the constitutional requirement to use water efficiently and Capistrano viewed the pricing as penalty blocks for inefficient or wasteful use. The initial ruling of the court in this case was not favorable to Capistrano. Capistrano appealed the court’s decision, and the Appellate Court hearing this case recently upheld the lower court’s decision as it pertained to the pricing of the tiers within Capistrano’s water rate design. In summary, the Appellate Court ruled that tiered rates are a valid rate structure under Proposition 218, but to be legally compliant with Proposition 218, the pricing of the tiers must be cost-based. Unless there is an appeal of this ruling to the California State Supreme Court, the San Juan Capistrano decision will continue the trend of more narrowly defining “cost-based” rates, particularly as they relate to the pricing used in rate design. The Court’s decision has greatly diminished the latitude for policy input of the legislative body in establishing a local utility’s rates. While much of the focus of the San Juan Capistrano decision was on the issue of tiered pricing, there was a second important and over-arching legal issue for water utilities within the San Juan Capistrano decision. Capistrano’s inclusion of a portion of the costs associated with water reuse (i.e. recycled water) within the potable water rates was also challenged by the Capistrano Taxpayers Association. The initial court ruling was that if a customer did not “touch” the reuse water, then they should not be charged for it. In appeal, this was overturned and the Appellate Court recognized that water reuse and recycled water programs are a part of utility’s overall water supply portfolio and as such, potable water customers do benefit from those types of reuse programs. Essentially, the court agreed that a gallon of reuse water provided to an irrigation customer essentially frees up a gallon of potable water for use on the potable water system. In summary, and for purposes of the development of the Capistrano’s rates, the use of tiered pricing is not illegal and the Appellate Court specifically noted “ . . . tiered, or inclined rates that go up progressively in relation to usage are perfectly consonant with article XIII D, section 6, subdivision (b)(3) . . .” However, what this means is that the pricing of the tiers must be cost-based and reflect the costs incurred to provide water service at the various tiers established by the utility. In addition, as the utility develops their potable water rates, a portion of the costs associated with recycled water may be included within the potable water rates since those costs are incurred to supplement and benefit the utility’s total water supply resources.
Overview of Tiered Pricing At first glance, one might think that all water costs the same, no matter how much you use. However, in reality, as usage increases the costs may change significantly, depending upon a number of different factors which are all primarily drive by consumption levels and capacity use. Traditionally, tiered pricing has been based upon the premise that each consumption block should represent some portion of a customer’s usage and the price should reflect the changes in costs associated with those higher levels of usage. For example, the tiers or usage blocks for a residential customer may be categorized around:
Tier 1 – Efficient indoor use
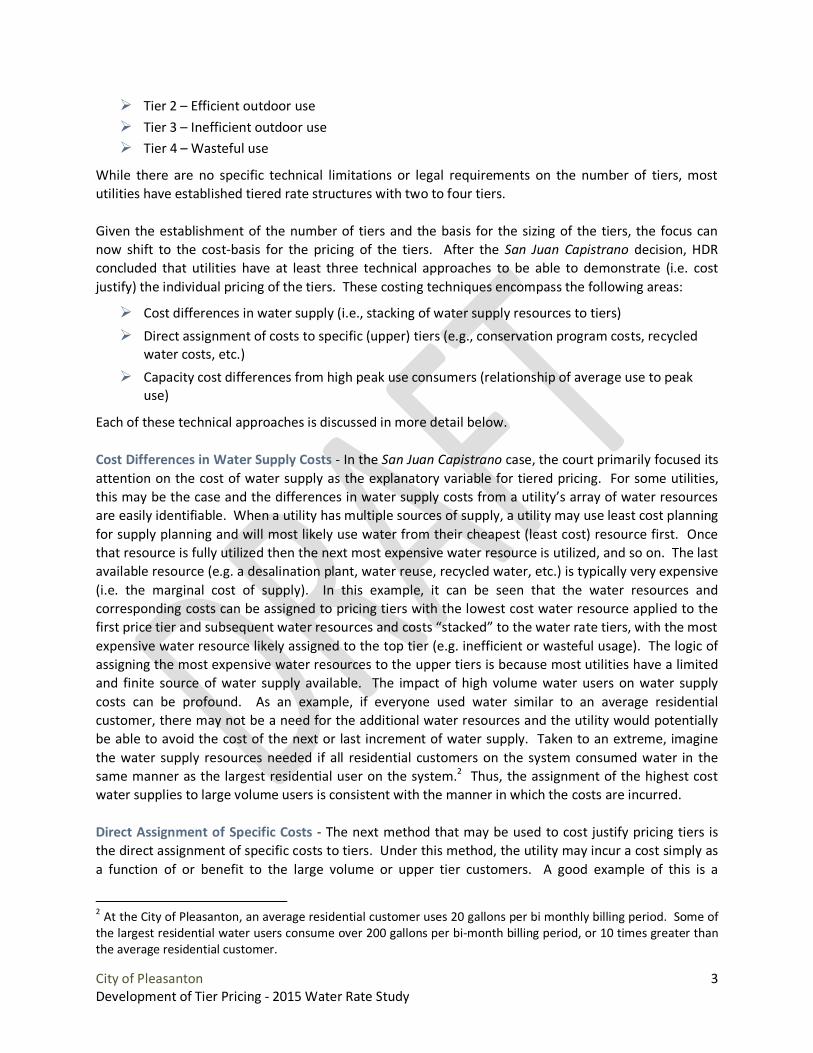
City of Pleasanton 3 Development of Tier Pricing - 2015 Water Rate Study
Tier 2 – Efficient outdoor use Tier 3 – Inefficient outdoor use Tier 4 – Wasteful use
While there are no specific technical limitations or legal requirements on the number of tiers, most utilities have established tiered rate structures with two to four tiers. Given the establishment of the number of tiers and the basis for the sizing of the tiers, the focus can now shift to the cost-basis for the pricing of the tiers. After the San Juan Capistrano decision, HDR concluded that utilities have at least three technical approaches to be able to demonstrate (i.e. cost justify) the individual pricing of the tiers. These costing techniques encompass the following areas:
Cost differences in water supply (i.e., stacking of water supply resources to tiers) Direct assignment of costs to specific (upper) tiers (e.g., conservation program costs, recycled
water costs, etc.) Capacity cost differences from high peak use consumers (relationship of average use to peak
use)
Each of these technical approaches is discussed in more detail below. Cost Differences in Water Supply Costs - In the San Juan Capistrano case, the court primarily focused its attention on the cost of water supply as the explanatory variable for tiered pricing. For some utilities, this may be the case and the differences in water supply costs from a utility’s array of water resources are easily identifiable. When a utility has multiple sources of supply, a utility may use least cost planning for supply planning and will most likely use water from their cheapest (least cost) resource first. Once that resource is fully utilized then the next most expensive water resource is utilized, and so on. The last available resource (e.g. a desalination plant, water reuse, recycled water, etc.) is typically very expensive (i.e. the marginal cost of supply). In this example, it can be seen that the water resources and corresponding costs can be assigned to pricing tiers with the lowest cost water resource applied to the first price tier and subsequent water resources and costs “stacked” to the water rate tiers, with the most expensive water resource likely assigned to the top tier (e.g. inefficient or wasteful usage). The logic of assigning the most expensive water resources to the upper tiers is because most utilities have a limited and finite source of water supply available. The impact of high volume water users on water supply costs can be profound. As an example, if everyone used water similar to an average residential customer, there may not be a need for the additional water resources and the utility would potentially be able to avoid the cost of the next or last increment of water supply. Taken to an extreme, imagine the water supply resources needed if all residential customers on the system consumed water in the same manner as the largest residential user on the system.2 Thus, the assignment of the highest cost water supplies to large volume users is consistent with the manner in which the costs are incurred. Direct Assignment of Specific Costs - The next method that may be used to cost justify pricing tiers is the direct assignment of specific costs to tiers. Under this method, the utility may incur a cost simply as a function of or benefit to the large volume or upper tier customers. A good example of this is a
2 At the City of Pleasanton, an average residential customer uses 20 gallons per bi monthly billing period. Some of the largest residential water users consume over 200 gallons per bi-month billing period, or 10 times greater than the average residential customer.
City of Pleasanton 4 Development of Tier Pricing - 2015 Water Rate Study
conservation program that targets outdoor use or a turf buy-back program. Clearly, this program is targeting the usage associated with the high volume upper tiers and, given that, the costs associated with this type of conservation program should be assigned to the upper tiers (i.e. those being targeted). This seems reasonably justified since little or no outdoor use is typically incurred in first block (indoor) usage. Capacity Cost Differences From High Peak Use Customers – The final area in which costs may vary by tier is related to meeting peak use demands on a system. As customers use water, the delivery of the water is a function of the volume of water being delivered, but also the rate of flow. The rate of flow translates into the concept of capacity and the sizing of facilities needed to meet peak use demands at any point in time. To better understand the distinction between volume and capacity use, imagine a 100,000 gallon tank that needs to be filled with water. Using a garden hose to fill the tank would certainly provide the 100,000 gallons of water to fill the tank, but due to a lack of capacity, the rate of flow is very low and it would take a long time to fill the tank (approximately 83 hours at a flow (capacity) rate of 20 gallons per minute). Now, if you want to fill the tank quickly with water, you could use a fire hose with a flow (capacity) rate of 1,000 gallons per minute and fill it in approximately 1.6 hours. That difference is the time required to fill tank is related to capacity. Capacity is an important concept for water utilities since utilities must incur the cost to construct facilities to meet these high customer demands on the system. The capital investment needed to size and meet higher levels of water demands is greater than that of a system with lower (flatter) demand. The large peak demands placed on the system by large volume users requires additional oversizing of facilities to meet their peak demand requirements. A basic cost of service principle is “those who create the cost should pay the cost.” In this case, the customers creating the large peak demand (i.e. upper tier customers) should pay the costs associated with the oversizing of facilities needed to meet their extraordinary high demands. Simply stated, the costs associated with high volume users is not solely a function of the volume of water, but rather, the sizing of facilities needed to meet their excessive peak use requirements. Similar to the issue noted on water supply, if all residential customers used water in the same volumes and capacity demand patterns3 of the largest residential users on the City’s system, the distribution (i.e. capacity-related) costs of the system would be significantly greater. That is, the distribution system would need to be over-sized more than it is today.
Development of the City’s Residential Tiered Pricing A traditional cost of service methodology equitably allocates a utility’s costs to specific customer classes of service (e.g. residential, commercial, etc.), but not to distinct usage tiers. Traditionally, rates were developed and proposed which met the allocated costs to the particular customer class of service, but then incorporated other policy considerations other than strictly cost of service (e.g. revenue stability, conservation, etc.) The San Juan Capistrano case, however, ruled that costs must be established for the price tiers, which implies that the cost of service will need to allocate costs to not only customer classes but also to each consumption tier, or alternatively, an analysis be used to demonstrate the cost-basis for the pricing of the tiers. This portion of the technical memorandum describes the process which HDR used to develop the cost basis for the City of Pleasanton’s residential tiered pricing. 3 Capacity demand patterns refers to the fact that low use residential customer’s summer peak use is relatively low compared to the average day or average hour residential demand. In contrast to this, a high volume customer’s peak day or peak hour demand is many times greater than the average residential customer’s demands.
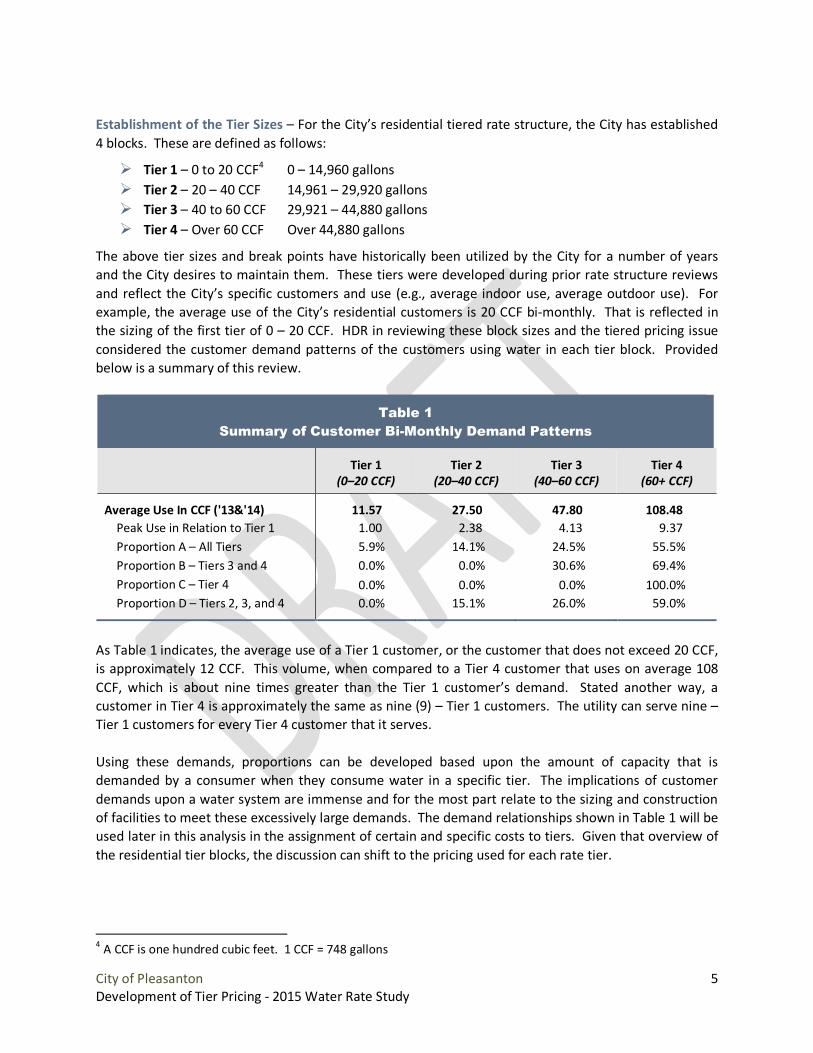
City of Pleasanton 5 Development of Tier Pricing - 2015 Water Rate Study
Establishment of the Tier Sizes – For the City’s residential tiered rate structure, the City has established 4 blocks. These are defined as follows:
Tier 1 – 0 to 20 CCF4 0 – 14,960 gallons Tier 2 – 20 – 40 CCF 14,961 – 29,920 gallons Tier 3 – 40 to 60 CCF 29,921 – 44,880 gallons Tier 4 – Over 60 CCF Over 44,880 gallons
The above tier sizes and break points have historically been utilized by the City for a number of years and the City desires to maintain them. These tiers were developed during prior rate structure reviews and reflect the City’s specific customers and use (e.g., average indoor use, average outdoor use). For example, the average use of the City’s residential customers is 20 CCF bi-monthly. That is reflected in the sizing of the first tier of 0 – 20 CCF. HDR in reviewing these block sizes and the tiered pricing issue considered the customer demand patterns of the customers using water in each tier block. Provided below is a summary of this review.
Table 1 Summary of Customer Bi-Monthly Demand Patterns
Tier 1
(0–20 CCF) Tier 2
(20–40 CCF) Tier 3
(40–60 CCF) Tier 4
(60+ CCF)
Average Use In CCF ('13&'14) 11.57 27.50 47.80 108.48 Peak Use in Relation to Tier 1 1.00 2.38 4.13 9.37 Proportion A – All Tiers 5.9% 14.1% 24.5% 55.5% Proportion B – Tiers 3 and 4 0.0% 0.0% 30.6% 69.4% Proportion C – Tier 4 0.0% 0.0% 0.0% 100.0% Proportion D – Tiers 2, 3, and 4 0.0% 15.1% 26.0% 59.0%
As Table 1 indicates, the average use of a Tier 1 customer, or the customer that does not exceed 20 CCF, is approximately 12 CCF. This volume, when compared to a Tier 4 customer that uses on average 108 CCF, which is about nine times greater than the Tier 1 customer’s demand. Stated another way, a customer in Tier 4 is approximately the same as nine (9) – Tier 1 customers. The utility can serve nine – Tier 1 customers for every Tier 4 customer that it serves. Using these demands, proportions can be developed based upon the amount of capacity that is demanded by a consumer when they consume water in a specific tier. The implications of customer demands upon a water system are immense and for the most part relate to the sizing and construction of facilities to meet these excessively large demands. The demand relationships shown in Table 1 will be used later in this analysis in the assignment of certain and specific costs to tiers. Given that overview of the residential tier blocks, the discussion can shift to the pricing used for each rate tier.
4 A CCF is one hundred cubic feet. 1 CCF = 748 gallons
City of Pleasanton 6 Development of Tier Pricing - 2015 Water Rate Study
Pricing of the City’s Water Rate Tiers - As discussed previously, there are at least three techniques or approaches that may be used to demonstrate (i.e. cost justify) the individual pricing of the City’s tiered rates. These techniques or approaches were:
Cost differences in the City’s water supply (i.e., stacking of water supply resources to tiers) Direct assignment of costs to specific (upper) tiers (e.g., conservation program costs, etc.) Capacity cost differences from high peak use consumers (relationship of average use to peak
use)
Each of these technical approaches, as they relate to the City’s analysis and development of tiered rates are discussed in more detail below.
– The City purchases their potable water supply from Cost Differences in the City’s Water Supply CostsZone 7. The cost of the water supply is $2.40/CCF and the cost does not vary based upon lower or higher volumes of water consumed. There does not appear to be any cost justification for assigning a higher or lower cost of water supply to the various tiers. At the same time, the City has established a rate philosophy of having the price of the first tier reflect the cost of water from Zone 7. Given that, the first tier is established at $2.40/CCF. Direct Assignment of the City’s Specific Costs – In the City’s analysis, there were two costs which appeared to benefit specific tiers and, as such, they were directly assigned to tiers. The two specific costs in the City’s rate study which were directly assigned were:
Conservation Program Costs Vineyard Avenue Capacity Improvements (Enhancements)
The water conservation program costs were assigned to Tiers 2, 3 and 4 in the approximate proportions of water demand characteristics on the City’s system (See Table 1). Approximately 20% of the capacity demand profile is related to Tier 2, another 20% of the capacity demand profile is related to Tier 3, and the balance or 60% of the conservation program costs were assigned to Tier 4. The residential share of the conservation program costs are $181,503. Of this amount, $36,301 was assigned to Tier 2, another $36,301 was assigned to Tier 3 and the balance, or $108,902 was assigned to Tier 4. This assignment of costs seems appropriate and equitable given that conservation programs benefit all customers (all tiers), but are primarily focused on the most inefficient or wasteful customers. Conservation program costs were not assigned to Tier 1 since that tier is strictly related strictly water supply (Zone 7) costs. The final direct assignment cost for the City was the transfer of costs for the Vineyard Avenue capacity improvements. This was a transfer payment of $44,505 which was assigned entirely to Tier 4. These improvements were necessary to provide service to customers based on the demands they placed on the system and provide additional system capacity. As a result, the costs associated providing additional capacity is allocated to the highest or 4th tier. Capacity Cost Differences from the City’s High Peak Use Consumers – The final type of cost incurred by the City that may reflect cost differences by price tiers is capacity related costs. As noted in the prior discussion, as capacity use increases, there is an impact to infrastructure. At the same time, not all capacity costs are related to, or a function of the sizing of infrastructure. To better understand the City’s capacity costs and the assignment of certain capacity-related costs to the various pricing tiers, the focus of the analysis shifted to the cost of service analysis conducted by HDR.
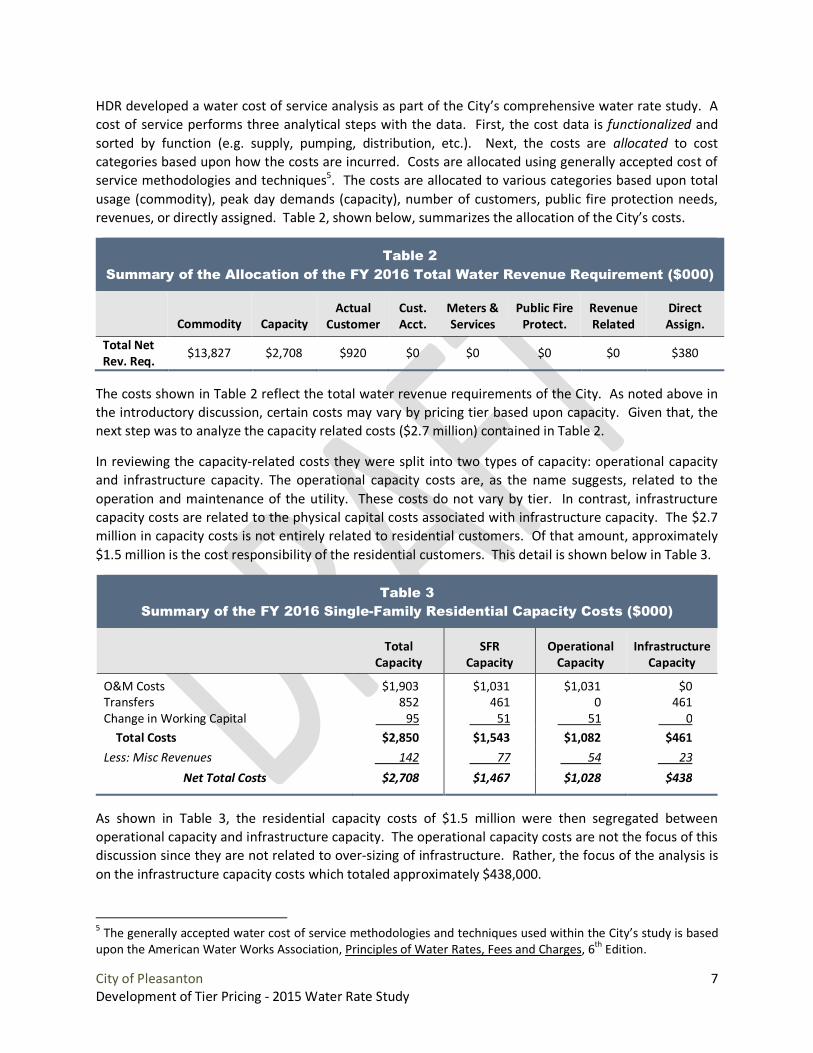
City of Pleasanton 7 Development of Tier Pricing - 2015 Water Rate Study
HDR developed a water cost of service analysis as part of the City’s comprehensive water rate study. A cost of service performs three analytical steps with the data. First, the cost data is functionalized and sorted by function (e.g. supply, pumping, distribution, etc.). Next, the costs are allocated to cost categories based upon how the costs are incurred. Costs are allocated using generally accepted cost of service methodologies and techniques5. The costs are allocated to various categories based upon total usage (commodity), peak day demands (capacity), number of customers, public fire protection needs, revenues, or directly assigned. Table 2, shown below, summarizes the allocation of the City’s costs.
Table 2 Summary of the Allocation of the FY 2016 Total Water Revenue Requirement ($000)
Commodity Capacity Actual
Customer Cust. Acct.
Meters & Services
Public Fire Protect.
Revenue Related
Direct Assign.
Total Net Rev. Req. $13,827 $2,708 $920 $0 $0 $0 $0 $380
The costs shown in Table 2 reflect the total water revenue requirements of the City. As noted above in the introductory discussion, certain costs may vary by pricing tier based upon capacity. Given that, the next step was to analyze the capacity related costs ($2.7 million) contained in Table 2. In reviewing the capacity-related costs they were split into two types of capacity: operational capacity and infrastructure capacity. The operational capacity costs are, as the name suggests, related to the operation and maintenance of the utility. These costs do not vary by tier. In contrast, infrastructure capacity costs are related to the physical capital costs associated with infrastructure capacity. The $2.7 million in capacity costs is not entirely related to residential customers. Of that amount, approximately $1.5 million is the cost responsibility of the residential customers. This detail is shown below in Table 3.
Table 3 Summary of the FY 2016 Single-Family Residential Capacity Costs ($000)
Total
Capacity SFR
Capacity Operational
Capacity Infrastructure
Capacity
O&M Costs $1,903 $1,031 $1,031 $0 Transfers 852 461 0 461 Change in Working Capital 95 51 51 0 Total Costs $2,850 $1,543 $1,082 $461 Less: Misc Revenues 142 77 54 23
Net Total Costs $2,708 $1,467 $1,028 $438
As shown in Table 3, the residential capacity costs of $1.5 million were then segregated between operational capacity and infrastructure capacity. The operational capacity costs are not the focus of this discussion since they are not related to over-sizing of infrastructure. Rather, the focus of the analysis is on the infrastructure capacity costs which totaled approximately $438,000.
5 The generally accepted water cost of service methodologies and techniques used within the City’s study is based upon the American Water Works Association, Principles of Water Rates, Fees and Charges, 6th Edition.
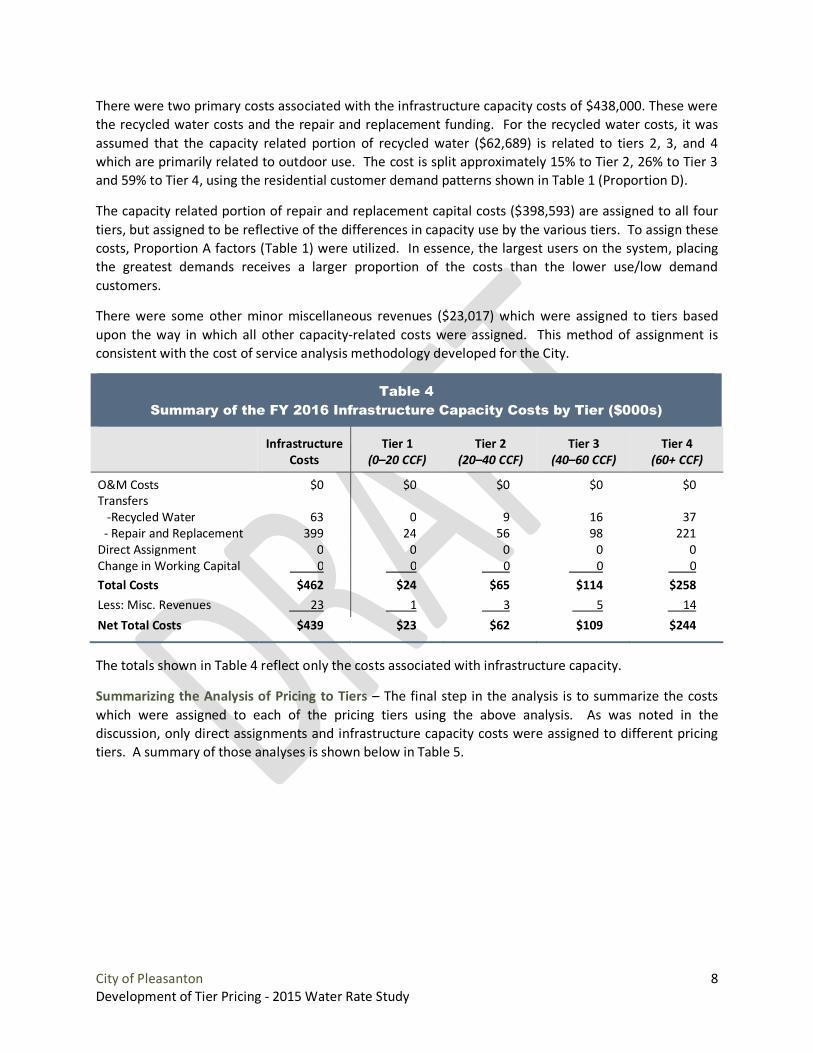
City of Pleasanton 8 Development of Tier Pricing - 2015 Water Rate Study
There were two primary costs associated with the infrastructure capacity costs of $438,000. These were the recycled water costs and the repair and replacement funding. For the recycled water costs, it was assumed that the capacity related portion of recycled water ($62,689) is related to tiers 2, 3, and 4 which are primarily related to outdoor use. The cost is split approximately 15% to Tier 2, 26% to Tier 3 and 59% to Tier 4, using the residential customer demand patterns shown in Table 1 (Proportion D). The capacity related portion of repair and replacement capital costs ($398,593) are assigned to all four tiers, but assigned to be reflective of the differences in capacity use by the various tiers. To assign these costs, Proportion A factors (Table 1) were utilized. In essence, the largest users on the system, placing the greatest demands receives a larger proportion of the costs than the lower use/low demand customers. There were some other minor miscellaneous revenues ($23,017) which were assigned to tiers based upon the way in which all other capacity-related costs were assigned. This method of assignment is consistent with the cost of service analysis methodology developed for the City.
Table 4 Summary of the FY 2016 Infrastructure Capacity Costs by Tier ($000s)
Infrastructure
Costs Tier 1
(0–20 CCF) Tier 2
(20–40 CCF) Tier 3
(40–60 CCF) Tier 4
(60+ CCF)
O&M Costs $0 $0 $0 $0 $0 Transfers -Recycled Water 63 0 9 16 37 - Repair and Replacement 399 24 56 98 221 Direct Assignment 0 0 0 0 0 Change in Working Capital 0 0 0 0 0 Total Costs $462 $24 $65 $114 $258 Less: Misc. Revenues 23 1 3 5 14 Net Total Costs $439 $23 $62 $109 $244
The totals shown in Table 4 reflect only the costs associated with infrastructure capacity. Summarizing the Analysis of Pricing to Tiers – The final step in the analysis is to summarize the costs which were assigned to each of the pricing tiers using the above analysis. As was noted in the discussion, only direct assignments and infrastructure capacity costs were assigned to different pricing tiers. A summary of those analyses is shown below in Table 5.
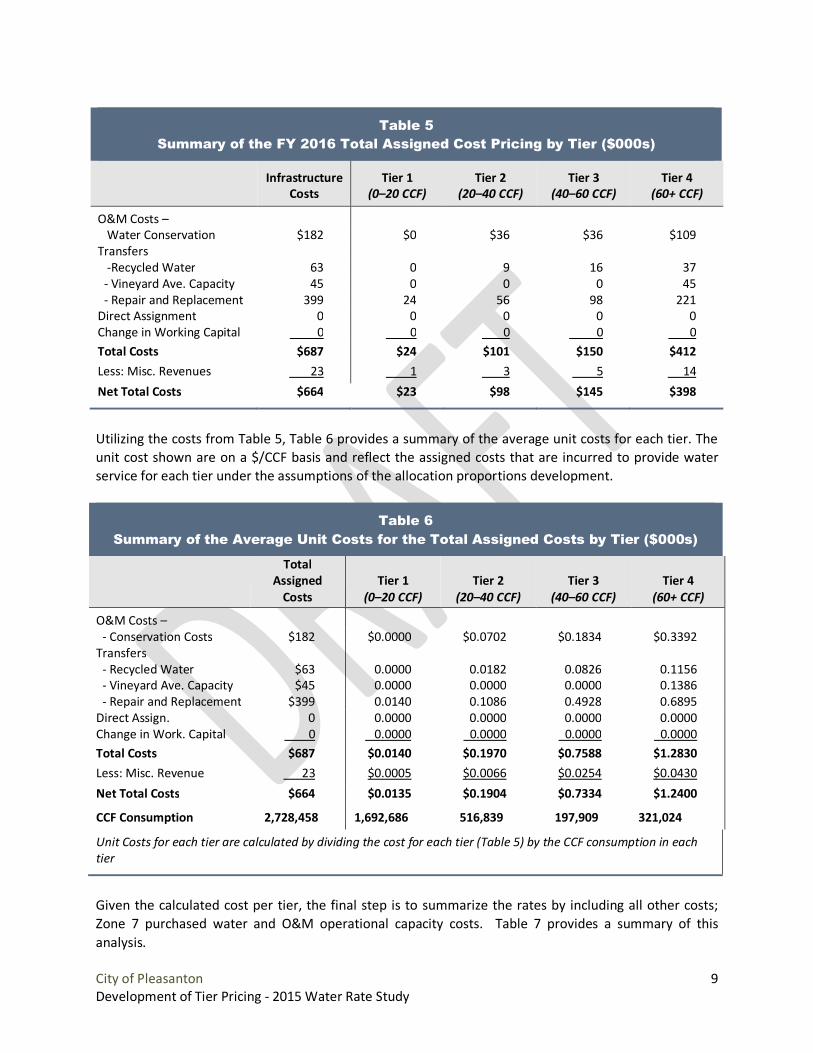
City of Pleasanton 9 Development of Tier Pricing - 2015 Water Rate Study
Table 5 Summary of the FY 2016 Total Assigned Cost Pricing by Tier ($000s)
Infrastructure
Costs Tier 1
(0–20 CCF) Tier 2
(20–40 CCF) Tier 3
(40–60 CCF) Tier 4
(60+ CCF)
O&M Costs – Water Conservation $182 $0 $36 $36 $109 Transfers -Recycled Water 63 0 9 16 37 - Vineyard Ave. Capacity 45 0 0 0 45 - Repair and Replacement 399 24 56 98 221 Direct Assignment 0 0 0 0 0 Change in Working Capital 0 0 0 0 0 Total Costs $687 $24 $101 $150 $412 Less: Misc. Revenues 23 1 3 5 14 Net Total Costs $664 $23 $98 $145 $398
Utilizing the costs from Table 5, Table 6 provides a summary of the average unit costs for each tier. The unit cost shown are on a $/CCF basis and reflect the assigned costs that are incurred to provide water service for each tier under the assumptions of the allocation proportions development.
Table 6 Summary of the Average Unit Costs for the Total Assigned Costs by Tier ($000s)
Total Assigned
Costs Tier 1
(0–20 CCF) Tier 2
(20–40 CCF) Tier 3
(40–60 CCF) Tier 4
(60+ CCF)
O&M Costs – - Conservation Costs $182 $0.0000 $0.0702 $0.1834 $0.3392 Transfers - Recycled Water $63 0.0000 0.0182 0.0826 0.1156 - Vineyard Ave. Capacity $45 0.0000 0.0000 0.0000 0.1386 - Repair and Replacement $399 0.0140 0.1086 0.4928 0.6895 Direct Assign. 0 0.0000 0.0000 0.0000 0.0000 Change in Work. Capital 0 0.0000 0.0000 0.0000 0.0000 Total Costs $687 $0.0140 $0.1970 $0.7588 $1.2830 Less: Misc. Revenue 23 $0.0005 $0.0066 $0.0254 $0.0430 Net Total Costs $664 $0.0135 $0.1904 $0.7334 $1.2400
CCF Consumption 2,728,458 1,692,686 516,839 197,909 321,024
Unit Costs for each tier are calculated by dividing the cost for each tier (Table 5) by the CCF consumption in each tier
Given the calculated cost per tier, the final step is to summarize the rates by including all other costs; Zone 7 purchased water and O&M operational capacity costs. Table 7 provides a summary of this analysis.
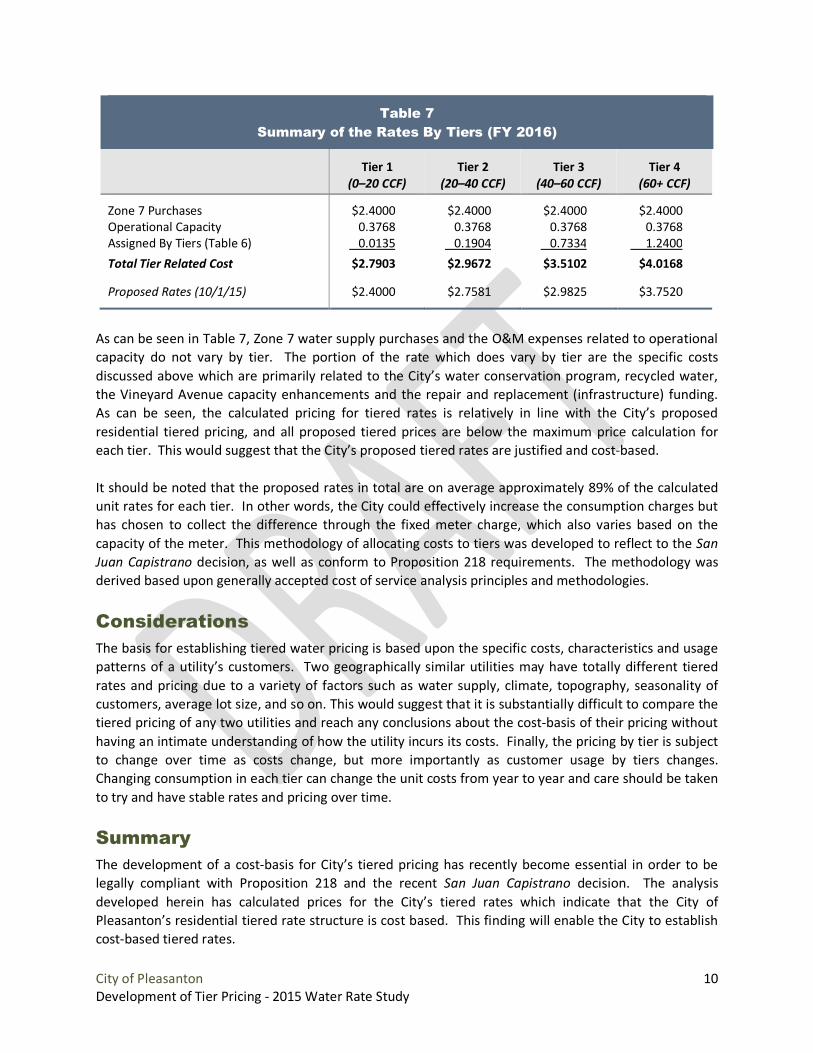
City of Pleasanton 10 Development of Tier Pricing - 2015 Water Rate Study
Table 7 Summary of the Rates By Tiers (FY 2016)
Tier 1
(0–20 CCF) Tier 2
(20–40 CCF) Tier 3
(40–60 CCF) Tier 4
(60+ CCF)
Zone 7 Purchases $2.4000 $2.4000 $2.4000 $2.4000 Operational Capacity 0.3768 0.3768 0.3768 0.3768 Assigned By Tiers (Table 6) 0.0135 0.1904 0.7334 1.2400 Total Tier Related Cost $2.7903 $2.9672 $3.5102 $4.0168
Proposed Rates (10/1/15) $2.4000 $2.7581 $2.9825 $3.7520
As can be seen in Table 7, Zone 7 water supply purchases and the O&M expenses related to operational capacity do not vary by tier. The portion of the rate which does vary by tier are the specific costs discussed above which are primarily related to the City’s water conservation program, recycled water, the Vineyard Avenue capacity enhancements and the repair and replacement (infrastructure) funding. As can be seen, the calculated pricing for tiered rates is relatively in line with the City’s proposed residential tiered pricing, and all proposed tiered prices are below the maximum price calculation for each tier. This would suggest that the City’s proposed tiered rates are justified and cost-based. It should be noted that the proposed rates in total are on average approximately 89% of the calculated unit rates for each tier. In other words, the City could effectively increase the consumption charges but has chosen to collect the difference through the fixed meter charge, which also varies based on the capacity of the meter. This methodology of allocating costs to tiers was developed to reflect to the San Juan Capistrano decision, as well as conform to Proposition 218 requirements. The methodology was derived based upon generally accepted cost of service analysis principles and methodologies.
Considerations The basis for establishing tiered water pricing is based upon the specific costs, characteristics and usage patterns of a utility’s customers. Two geographically similar utilities may have totally different tiered rates and pricing due to a variety of factors such as water supply, climate, topography, seasonality of customers, average lot size, and so on. This would suggest that it is substantially difficult to compare the tiered pricing of any two utilities and reach any conclusions about the cost-basis of their pricing without having an intimate understanding of how the utility incurs its costs. Finally, the pricing by tier is subject to change over time as costs change, but more importantly as customer usage by tiers changes. Changing consumption in each tier can change the unit costs from year to year and care should be taken to try and have stable rates and pricing over time.
Summary The development of a cost-basis for City’s tiered pricing has recently become essential in order to be legally compliant with Proposition 218 and the recent San Juan Capistrano decision. The analysis developed herein has calculated prices for the City’s tiered rates which indicate that the City of Pleasanton’s residential tiered rate structure is cost based. This finding will enable the City to establish cost-based tiered rates.
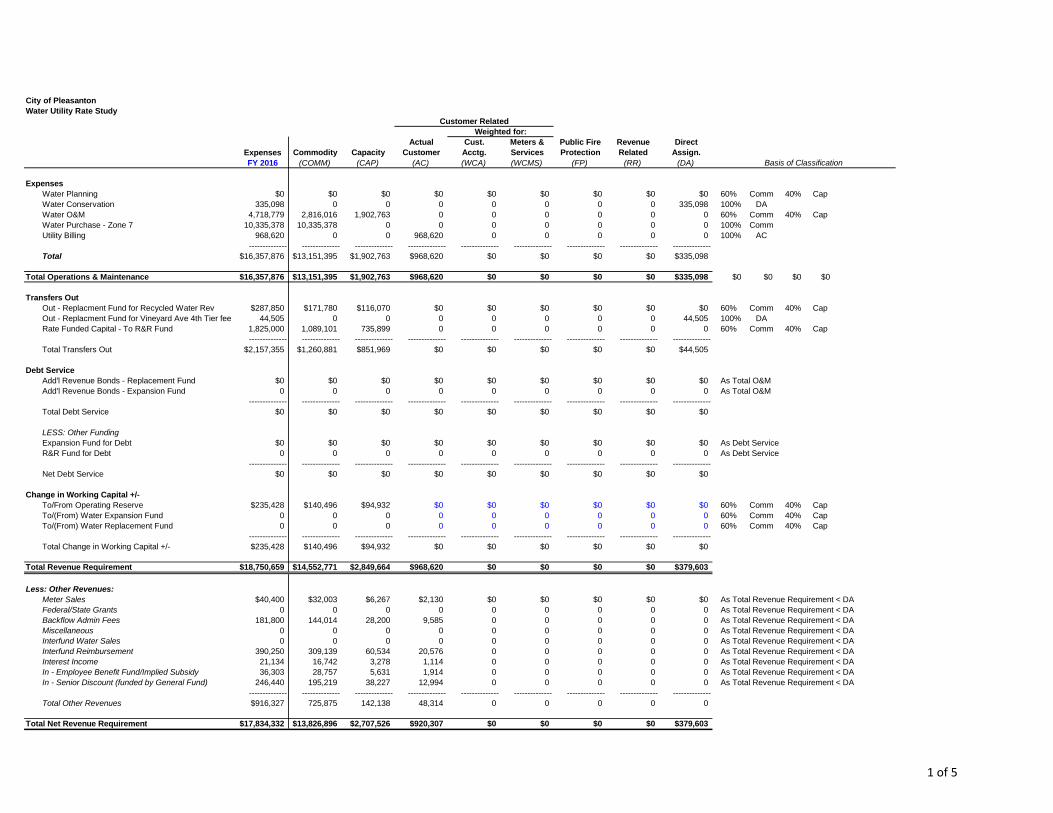
City of PleasantonWater Utility Rate Study
Actual Cust. Meters & Public Fire Revenue DirectExpenses Commodity Capacity Customer Acctg. Services Protection Related Assign.FY 2016 (COMM) (CAP) (AC) (WCA) (WCMS) (FP) (RR) (DA)
ExpensesWater Planning $0 $0 $0 $0 $0 $0 $0 $0 $0 60% Comm 40% CapWater Conservation 335,098 0 0 0 0 0 0 0 335,098 100% DAWater O&M 4,718,779 2,816,016 1,902,763 0 0 0 0 0 0 60% Comm 40% CapWater Purchase - Zone 7 10,335,378 10,335,378 0 0 0 0 0 0 0 100% CommUtility Billing 968,620 0 0 968,620 0 0 0 0 0 100% AC
-------------- -------------- -------------- -------------- -------------- -------------- -------------- -------------- --------------Total $16,357,876 $13,151,395 $1,902,763 $968,620 $0 $0 $0 $0 $335,098
Total Operations & Maintenance $16,357,876 $13,151,395 $1,902,763 $968,620 $0 $0 $0 $0 $335,098 $0 $0 $0 $0
Transfers OutOut - Replacment Fund for Recycled Water Rev $287,850 $171,780 $116,070 $0 $0 $0 $0 $0 $0 60% Comm 40% CapOut - Replacment Fund for Vineyard Ave 4th Tier fee 44,505 0 0 0 0 0 0 0 44,505 100% DARate Funded Capital - To R&R Fund 1,825,000 1,089,101 735,899 0 0 0 0 0 0 60% Comm 40% Cap
-------------- -------------- -------------- -------------- -------------- -------------- -------------- -------------- --------------Total Transfers Out $2,157,355 $1,260,881 $851,969 $0 $0 $0 $0 $0 $44,505
Debt ServiceAdd'l Revenue Bonds - Replacement Fund $0 $0 $0 $0 $0 $0 $0 $0 $0 As Total O&MAdd'l Revenue Bonds - Expansion Fund 0 0 0 0 0 0 0 0 0 As Total O&M
-------------- -------------- -------------- -------------- -------------- -------------- -------------- -------------- --------------Total Debt Service $0 $0 $0 $0 $0 $0 $0 $0 $0
LESS: Other FundingExpansion Fund for Debt $0 $0 $0 $0 $0 $0 $0 $0 $0 As Debt ServiceR&R Fund for Debt 0 0 0 0 0 0 0 0 0 As Debt Service
-------------- -------------- -------------- -------------- -------------- -------------- -------------- -------------- --------------Net Debt Service $0 $0 $0 $0 $0 $0 $0 $0 $0
Change in Working Capital +/-To/From Operating Reserve $235,428 $140,496 $94,932 $0 $0 $0 $0 $0 $0 60% Comm 40% CapTo/(From) Water Expansion Fund 0 0 0 0 0 0 0 0 0 60% Comm 40% CapTo/(From) Water Replacement Fund 0 0 0 0 0 0 0 0 0 60% Comm 40% Cap
-------------- -------------- -------------- -------------- -------------- -------------- -------------- -------------- --------------Total Change in Working Capital +/- $235,428 $140,496 $94,932 $0 $0 $0 $0 $0 $0
Total Revenue Requirement $18,750,659 $14,552,771 $2,849,664 $968,620 $0 $0 $0 $0 $379,603
Less: Other Revenues:Meter Sales $40,400 $32,003 $6,267 $2,130 $0 $0 $0 $0 $0 As Total Revenue Requirement < DAFederal/State Grants 0 0 0 0 0 0 0 0 0 As Total Revenue Requirement < DABackflow Admin Fees 181,800 144,014 28,200 9,585 0 0 0 0 0 As Total Revenue Requirement < DAMiscellaneous 0 0 0 0 0 0 0 0 0 As Total Revenue Requirement < DAInterfund Water Sales 0 0 0 0 0 0 0 0 0 As Total Revenue Requirement < DAInterfund Reimbursement 390,250 309,139 60,534 20,576 0 0 0 0 0 As Total Revenue Requirement < DAInterest Income 21,134 16,742 3,278 1,114 0 0 0 0 0 As Total Revenue Requirement < DAIn - Employee Benefit Fund/Implied Subsidy 36,303 28,757 5,631 1,914 0 0 0 0 0 As Total Revenue Requirement < DAIn - Senior Discount (funded by General Fund) 246,440 195,219 38,227 12,994 0 0 0 0 0 As Total Revenue Requirement < DA
-------------- -------------- -------------- -------------- -------------- -------------- -------------- -------------- --------------Total Other Revenues $916,327 725,875 142,138 48,314 0 0 0 0 0
Total Net Revenue Requirement $17,834,332 $13,826,896 $2,707,526 $920,307 $0 $0 $0 $0 $379,603
Basis of Classification
Customer RelatedWeighted for:
1 of 5
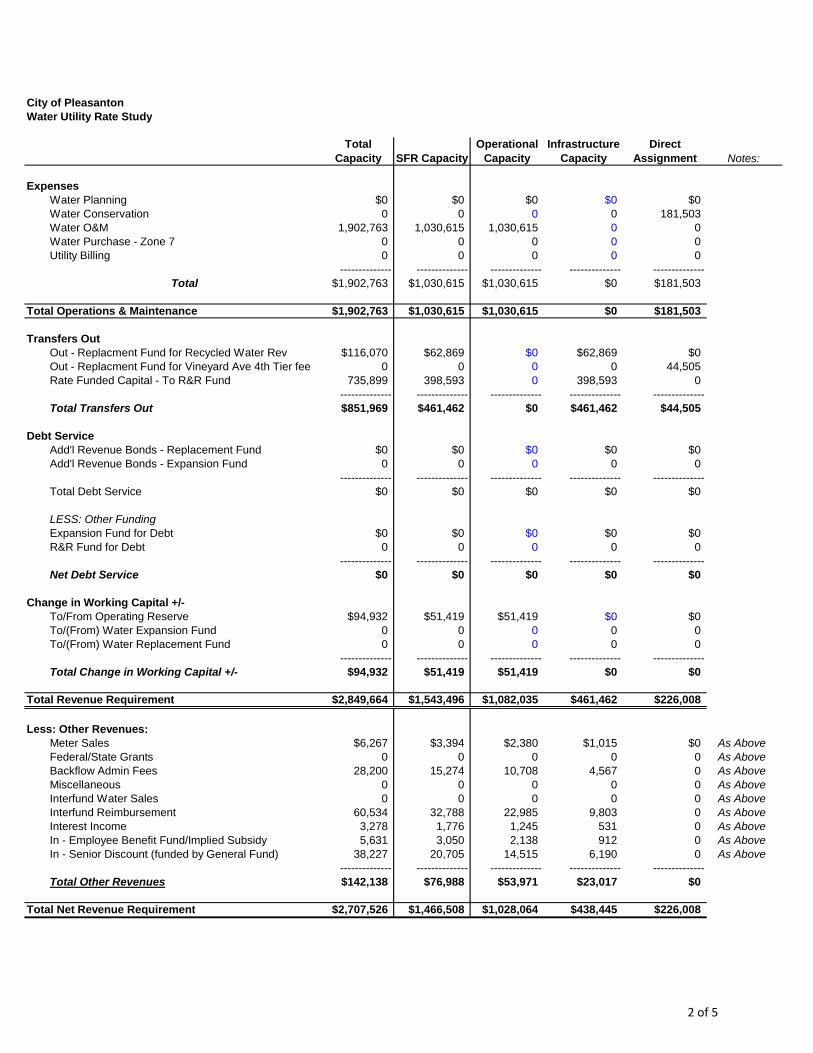
City of PleasantonWater Utility Rate Study
Notes:
ExpensesWater Planning $0 $0 $0 $0 $0Water Conservation 0 0 0 0 181,503Water O&M 1,902,763 1,030,615 1,030,615 0 0Water Purchase - Zone 7 0 0 0 0 0Utility Billing 0 0 0 0 0
-------------- -------------- -------------- -------------- --------------Total $1,902,763 $1,030,615 $1,030,615 $0 $181,503
Total Operations & Maintenance $1,902,763 $1,030,615 $1,030,615 $0 $181,503
Transfers OutOut - Replacment Fund for Recycled Water Rev $116,070 $62,869 $0 $62,869 $0Out - Replacment Fund for Vineyard Ave 4th Tier fee 0 0 0 0 44,505Rate Funded Capital - To R&R Fund 735,899 398,593 0 398,593 0
-------------- -------------- -------------- -------------- --------------Total Transfers Out $851,969 $461,462 $0 $461,462 $44,505
Debt ServiceAdd'l Revenue Bonds - Replacement Fund $0 $0 $0 $0 $0Add'l Revenue Bonds - Expansion Fund 0 0 0 0 0
-------------- -------------- -------------- -------------- --------------Total Debt Service $0 $0 $0 $0 $0
LESS: Other FundingExpansion Fund for Debt $0 $0 $0 $0 $0R&R Fund for Debt 0 0 0 0 0
-------------- -------------- -------------- -------------- --------------Net Debt Service $0 $0 $0 $0 $0
Change in Working Capital +/-To/From Operating Reserve $94,932 $51,419 $51,419 $0 $0To/(From) Water Expansion Fund 0 0 0 0 0To/(From) Water Replacement Fund 0 0 0 0 0
-------------- -------------- -------------- -------------- --------------Total Change in Working Capital +/- $94,932 $51,419 $51,419 $0 $0
Total Revenue Requirement $2,849,664 $1,543,496 $1,082,035 $461,462 $226,008
Less: Other Revenues:Meter Sales $6,267 $3,394 $2,380 $1,015 $0 As AboveFederal/State Grants 0 0 0 0 0 As AboveBackflow Admin Fees 28,200 15,274 10,708 4,567 0 As AboveMiscellaneous 0 0 0 0 0 As AboveInterfund Water Sales 0 0 0 0 0 As AboveInterfund Reimbursement 60,534 32,788 22,985 9,803 0 As AboveInterest Income 3,278 1,776 1,245 531 0 As AboveIn - Employee Benefit Fund/Implied Subsidy 5,631 3,050 2,138 912 0 As AboveIn - Senior Discount (funded by General Fund) 38,227 20,705 14,515 6,190 0 As Above
-------------- -------------- -------------- -------------- --------------Total Other Revenues $142,138 $76,988 $53,971 $23,017 $0
Total Net Revenue Requirement $2,707,526 $1,466,508 $1,028,064 $438,445 $226,008
Direct Assignment
Operational Capacity
Infrastructure Capacity
Total Capacity SFR Capacity
2 of 5
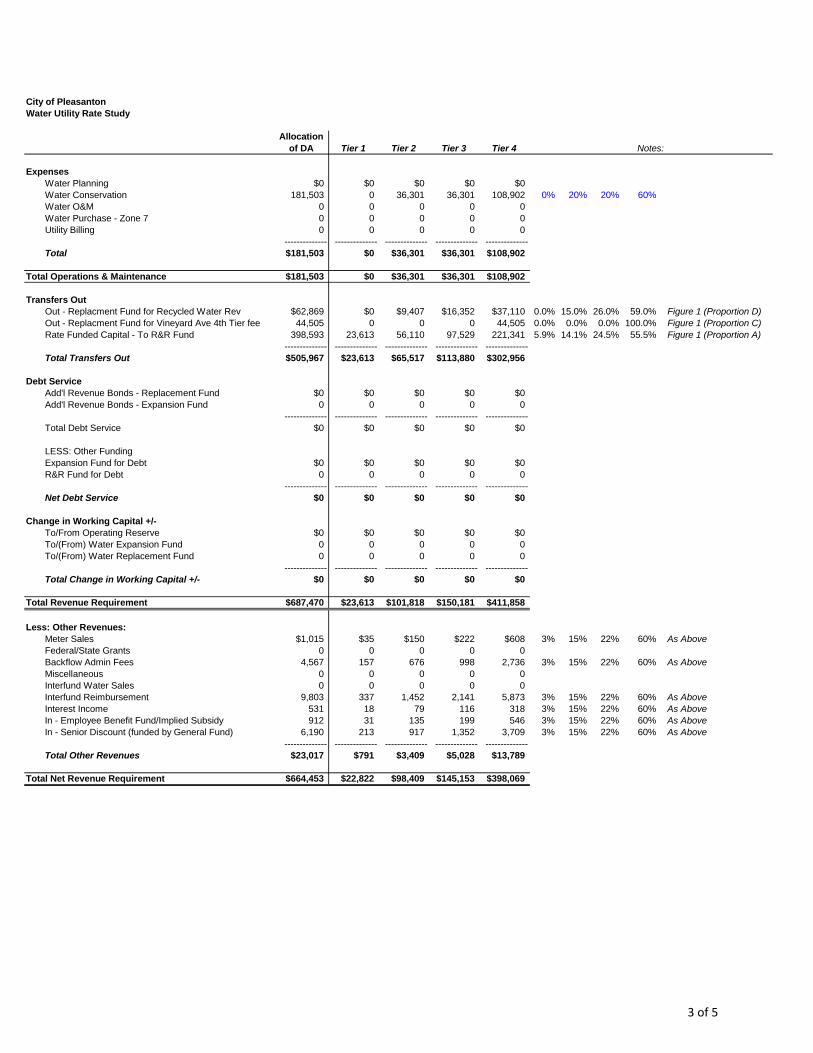
City of PleasantonWater Utility Rate Study
Tier 1 Tier 2 Tier 3 Tier 4
ExpensesWater Planning $0 $0 $0 $0 $0Water Conservation 181,503 0 36,301 36,301 108,902 0% 20% 20% 60%Water O&M 0 0 0 0 0Water Purchase - Zone 7 0 0 0 0 0Utility Billing 0 0 0 0 0
-------------- -------------- -------------- -------------- --------------Total $181,503 $0 $36,301 $36,301 $108,902
Total Operations & Maintenance $181,503 $0 $36,301 $36,301 $108,902
Transfers OutOut - Replacment Fund for Recycled Water Rev $62,869 $0 $9,407 $16,352 $37,110 0.0% 15.0% 26.0% 59.0% Figure 1 (Proportion D)Out - Replacment Fund for Vineyard Ave 4th Tier fee 44,505 0 0 0 44,505 0.0% 0.0% 0.0% 100.0% Figure 1 (Proportion C)Rate Funded Capital - To R&R Fund 398,593 23,613 56,110 97,529 221,341 5.9% 14.1% 24.5% 55.5% Figure 1 (Proportion A)
-------------- -------------- -------------- -------------- --------------Total Transfers Out $505,967 $23,613 $65,517 $113,880 $302,956
Debt ServiceAdd'l Revenue Bonds - Replacement Fund $0 $0 $0 $0 $0Add'l Revenue Bonds - Expansion Fund 0 0 0 0 0
-------------- -------------- -------------- -------------- --------------Total Debt Service $0 $0 $0 $0 $0
LESS: Other FundingExpansion Fund for Debt $0 $0 $0 $0 $0R&R Fund for Debt 0 0 0 0 0
-------------- -------------- -------------- -------------- --------------Net Debt Service $0 $0 $0 $0 $0
Change in Working Capital +/-To/From Operating Reserve $0 $0 $0 $0 $0To/(From) Water Expansion Fund 0 0 0 0 0To/(From) Water Replacement Fund 0 0 0 0 0
-------------- -------------- -------------- -------------- --------------Total Change in Working Capital +/- $0 $0 $0 $0 $0
Total Revenue Requirement $687,470 $23,613 $101,818 $150,181 $411,858
Less: Other Revenues:Meter Sales $1,015 $35 $150 $222 $608 3% 15% 22% 60% As AboveFederal/State Grants 0 0 0 0 0Backflow Admin Fees 4,567 157 676 998 2,736 3% 15% 22% 60% As AboveMiscellaneous 0 0 0 0 0Interfund Water Sales 0 0 0 0 0Interfund Reimbursement 9,803 337 1,452 2,141 5,873 3% 15% 22% 60% As AboveInterest Income 531 18 79 116 318 3% 15% 22% 60% As AboveIn - Employee Benefit Fund/Implied Subsidy 912 31 135 199 546 3% 15% 22% 60% As AboveIn - Senior Discount (funded by General Fund) 6,190 213 917 1,352 3,709 3% 15% 22% 60% As Above
-------------- -------------- -------------- -------------- --------------Total Other Revenues $23,017 $791 $3,409 $5,028 $13,789
Total Net Revenue Requirement $664,453 $22,822 $98,409 $145,153 $398,069
Allocation of DA Notes:
3 of 5
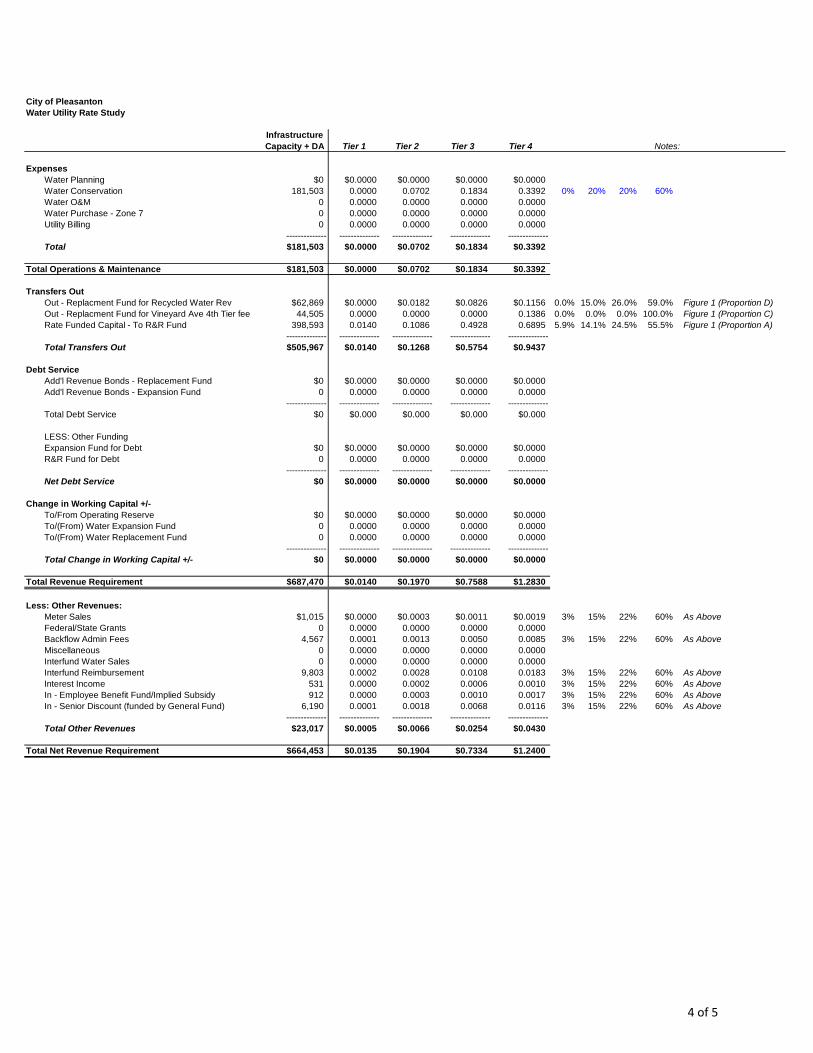
City of PleasantonWater Utility Rate Study
Tier 1 Tier 2 Tier 3 Tier 4
ExpensesWater Planning $0 $0.0000 $0.0000 $0.0000 $0.0000Water Conservation 181,503 0.0000 0.0702 0.1834 0.3392 0% 20% 20% 60%Water O&M 0 0.0000 0.0000 0.0000 0.0000Water Purchase - Zone 7 0 0.0000 0.0000 0.0000 0.0000Utility Billing 0 0.0000 0.0000 0.0000 0.0000
-------------- -------------- -------------- -------------- --------------Total $181,503 $0.0000 $0.0702 $0.1834 $0.3392
Total Operations & Maintenance $181,503 $0.0000 $0.0702 $0.1834 $0.3392
Transfers OutOut - Replacment Fund for Recycled Water Rev $62,869 $0.0000 $0.0182 $0.0826 $0.1156 0.0% 15.0% 26.0% 59.0% Figure 1 (Proportion D)Out - Replacment Fund for Vineyard Ave 4th Tier fee 44,505 0.0000 0.0000 0.0000 0.1386 0.0% 0.0% 0.0% 100.0% Figure 1 (Proportion C)Rate Funded Capital - To R&R Fund 398,593 0.0140 0.1086 0.4928 0.6895 5.9% 14.1% 24.5% 55.5% Figure 1 (Proportion A)
-------------- -------------- -------------- -------------- --------------Total Transfers Out $505,967 $0.0140 $0.1268 $0.5754 $0.9437
Debt ServiceAdd'l Revenue Bonds - Replacement Fund $0 $0.0000 $0.0000 $0.0000 $0.0000Add'l Revenue Bonds - Expansion Fund 0 0.0000 0.0000 0.0000 0.0000
-------------- -------------- -------------- -------------- --------------Total Debt Service $0 $0.000 $0.000 $0.000 $0.000
LESS: Other FundingExpansion Fund for Debt $0 $0.0000 $0.0000 $0.0000 $0.0000R&R Fund for Debt 0 0.0000 0.0000 0.0000 0.0000
-------------- -------------- -------------- -------------- --------------Net Debt Service $0 $0.0000 $0.0000 $0.0000 $0.0000
Change in Working Capital +/-To/From Operating Reserve $0 $0.0000 $0.0000 $0.0000 $0.0000To/(From) Water Expansion Fund 0 0.0000 0.0000 0.0000 0.0000To/(From) Water Replacement Fund 0 0.0000 0.0000 0.0000 0.0000
-------------- -------------- -------------- -------------- --------------Total Change in Working Capital +/- $0 $0.0000 $0.0000 $0.0000 $0.0000
Total Revenue Requirement $687,470 $0.0140 $0.1970 $0.7588 $1.2830
Less: Other Revenues:Meter Sales $1,015 $0.0000 $0.0003 $0.0011 $0.0019 3% 15% 22% 60% As AboveFederal/State Grants 0 0.0000 0.0000 0.0000 0.0000Backflow Admin Fees 4,567 0.0001 0.0013 0.0050 0.0085 3% 15% 22% 60% As AboveMiscellaneous 0 0.0000 0.0000 0.0000 0.0000Interfund Water Sales 0 0.0000 0.0000 0.0000 0.0000Interfund Reimbursement 9,803 0.0002 0.0028 0.0108 0.0183 3% 15% 22% 60% As AboveInterest Income 531 0.0000 0.0002 0.0006 0.0010 3% 15% 22% 60% As AboveIn - Employee Benefit Fund/Implied Subsidy 912 0.0000 0.0003 0.0010 0.0017 3% 15% 22% 60% As AboveIn - Senior Discount (funded by General Fund) 6,190 0.0001 0.0018 0.0068 0.0116 3% 15% 22% 60% As Above
-------------- -------------- -------------- -------------- --------------Total Other Revenues $23,017 $0.0005 $0.0066 $0.0254 $0.0430
Total Net Revenue Requirement $664,453 $0.0135 $0.1904 $0.7334 $1.2400
Notes:Infrastructure Capacity + DA
4 of 5
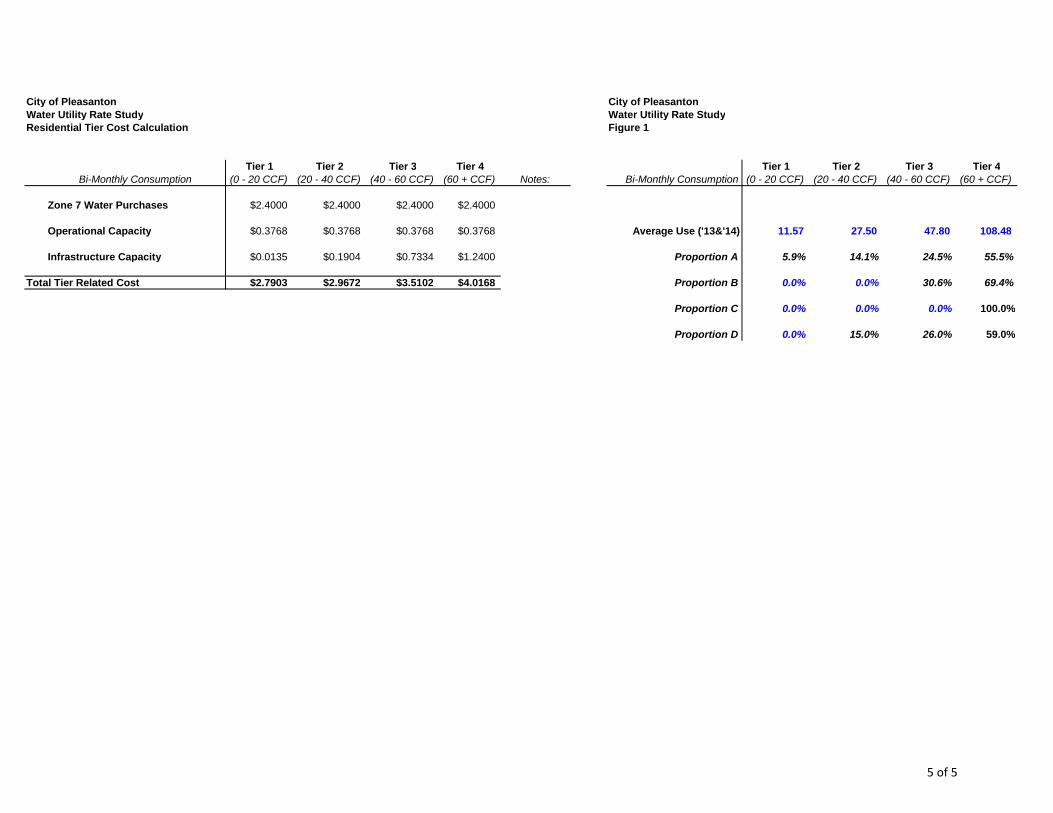
City of Pleasanton City of PleasantonWater Utility Rate Study Water Utility Rate StudyResidential Tier Cost Calculation Figure 1
Tier 1 Tier 2 Tier 3 Tier 4 Tier 1 Tier 2 Tier 3 Tier 4Bi-Monthly Consumption (0 - 20 CCF) (20 - 40 CCF) (40 - 60 CCF) (60 + CCF) Notes: Bi-Monthly Consumption (0 - 20 CCF) (20 - 40 CCF) (40 - 60 CCF) (60 + CCF)
Zone 7 Water Purchases $2.4000 $2.4000 $2.4000 $2.4000
Operational Capacity $0.3768 $0.3768 $0.3768 $0.3768 Average Use ('13&'14) 11.57 27.50 47.80 108.48
Infrastructure Capacity $0.0135 $0.1904 $0.7334 $1.2400 Proportion A 5.9% 14.1% 24.5% 55.5%
Total Tier Related Cost $2.7903 $2.9672 $3.5102 $4.0168 Proportion B 0.0% 0.0% 30.6% 69.4%
Proportion C 0.0% 0.0% 0.0% 100.0%
Proportion D 0.0% 15.0% 26.0% 59.0%
5 of 5

Technical Appendix D – Drought Rate Analysis
City of Pleasanton 1 Drought Surcharges - 2015 Water Rate Study
Technical Memorandum - Drought Rates
Introduction HDR Engineering, Inc. (HDR) was retained by the City of Pleasanton (City) to develop a water, sewer, and recycled water rate study. As part of the water rate study the City requested the development of drought rates to maintain sufficient revenues during drought periods. Drought rates are an important tool that allows the City to maintain adequate revenues when consumption declines due to voluntary or mandatory conservation due to drought conditions, such as the current drought California is experiencing, or other water shortage emergencies. Overview of Drought Rates A drought, or water shortage emergency, certainly creates operational challenges for the City, but it also creates certain financial/rate challenges. As the City is required to increase water conservation efforts and reduce the amount of consumptive use from their customers, the financial impacts are obvious. Reduced consumptive billings will translate into reduced overall revenue. For example, a simple request for a reduction in 10% consumptive use may translate into nearly a 10% reduction in revenues, depending upon the mix of fixed and variable charges in the rates. Drought or water shortage rates are often adopted in advance of the drought or water emergency. At the point when the City declares a drought (specifying the drought stage) the drought rates can be implemented by the City Council. By reviewing and adopting drought rates in advance of the actual event, the City is being proactive, but more importantly the City is provided with sufficient time to carefully analyze the policy and costing decisions associated with such rates. A water management plan or drought management plan is the foundation for the development of drought rates. This document provides a number of key items of information needed to develop drought rates (triggers for restrictions, phases or stages of restrictions, targeted level of savings, etc.). The City’s water conservation plan provides the necessary information to tie the drought rates to specific conservation savings levels and was used in the development of the proposed drought rates. Drought rates are one of several “tools” to assist during a drought or water emergency. In the City’s case, the drought rates will work in tandem with the City’s other conservation programs, and specifically the City’s excess use penalties (Ord. 2097) previously adopted by the City. It should be noted that the existing excess use penalty rates were reviewed as part of the rate study, and in discussion with City staff it was determined that the current approach is meeting the City’s goals and objectives for the excess use penalties. Therefore, no changes to the excess use penalty rates were recommended.
City of Pleasanton 2 Drought Surcharges - 2015 Water Rate Study
Customer Responsiveness to Price When properly designed, drought rates simultaneously address the issues of the financial/revenue impacts of decreased consumption while also providing an additional incentive to encourage efficient use, or more appropriately stated, discourage wasteful or inefficient use through pricing. In a drought, water rates are one mechanism or tool used to encourage or create conservation savings. When a utility enters a drought stage, it is not uncommon for a utility to have a set of water drought rates to maintain sufficient revenues due to reductions in usage and to provide an incentive to induce a specified level of conservation savings. In essence, a customer makes a decision to consume or not consume an item based upon its price. Economic theory suggests that as the price of a commodity increases there should be a corresponding decrease in consumption of that commodity. That change in consumption, in relation to the change in price, is technically referred to as the “price elasticity” of a commodity. If the demand for commodity is very sensitive to price (i.e., small changes in price create large changes in demand) then this commodity is referred to as being “price elastic.” In contrast, a commodity that is relatively insensitive to price (i.e., large changes in price create small changes in demand) is referred to as being “price inelastic.” For the most part, water is “price inelastic” meaning that even with large changes in price the City will likely not see large changes in consumption. There are a number of reasons for this lack of consumer response to price. One of the key reasons is that that there is no substitute for water; we need it for drinking, food preparation and healthy living. At the same time, the current price of water is low meaning that it has high value to consumers at a very low price. The point to be made from this discussion is that in establishing drought rates, certain portions of consumption are more price elastic than others. As an example, outdoor watering is more discretionary use than the water used for drinking, food preparation and health needs. As an example, water that is more non-discretionary may have a price elasticity of only -0.10, meaning that a 100% increase in price may result in only a 10% decrease in consumption. In contrast to this, outdoor use is far more discretionary and may have a price elasticity of -0.35, meaning that a 100% increase in price may result in a 35% decrease in consumption of that segment of water use. Given this observation, outdoor water use is typically targeted in the earlier drought stages for savings as the demand will decrease more proportionally to a pricing increase then indoor use. However, as the drought progresses into stage 3 and 4, indoor use must also be targeted as conservation goals cannot be met without a reduction there as well. This same philosophy or approach has been used to develop the City drought rates. Development of the Drought Rates The potable water rates being proposed in this water rate study assume “normal” water conditions. The current drought in California extends back several years which means that the current usage characteristics cannot be considered normal use. The historical 2013 and 2014 consumption data used in the rate study was adjusted to reflect current conservation requirements (State mandated conservation) not in place during those time periods. Under drought conditions, the City will need to have customers reduce their consumption and provide
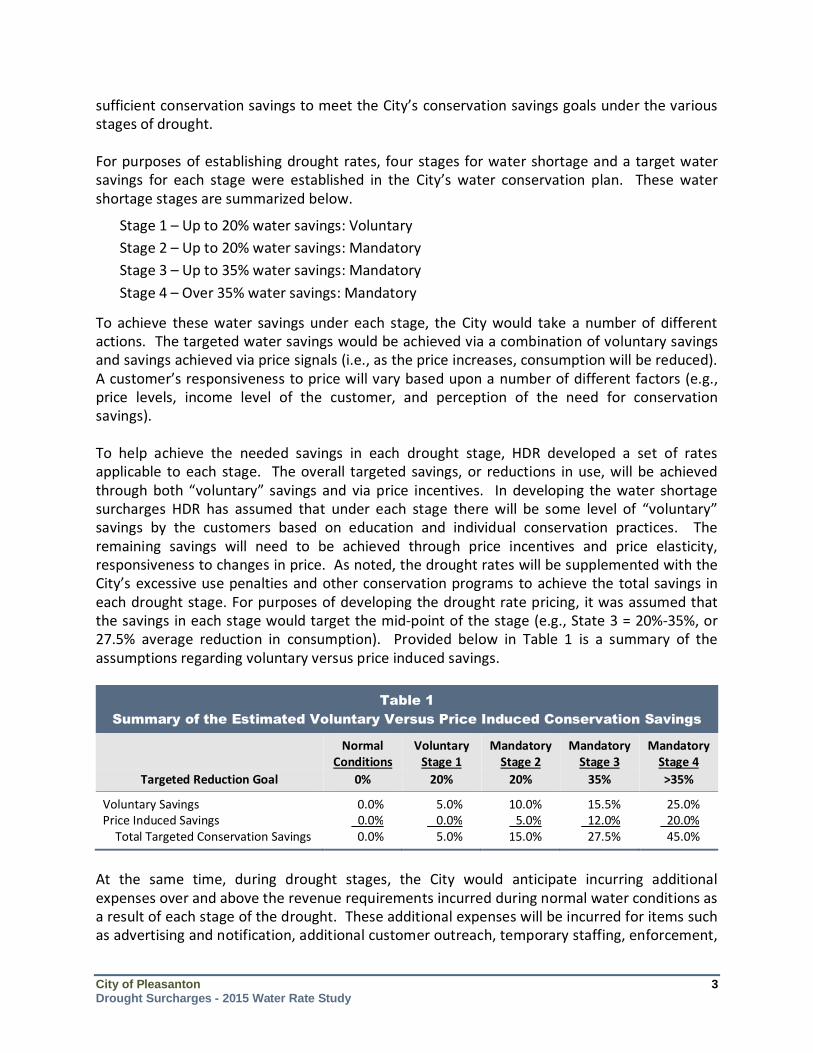
City of Pleasanton 3 Drought Surcharges - 2015 Water Rate Study
sufficient conservation savings to meet the City’s conservation savings goals under the various stages of drought. For purposes of establishing drought rates, four stages for water shortage and a target water savings for each stage were established in the City’s water conservation plan. These water shortage stages are summarized below.
Stage 1 – Up to 20% water savings: Voluntary Stage 2 – Up to 20% water savings: Mandatory Stage 3 – Up to 35% water savings: Mandatory Stage 4 – Over 35% water savings: Mandatory
To achieve these water savings under each stage, the City would take a number of different actions. The targeted water savings would be achieved via a combination of voluntary savings and savings achieved via price signals (i.e., as the price increases, consumption will be reduced). A customer’s responsiveness to price will vary based upon a number of different factors (e.g., price levels, income level of the customer, and perception of the need for conservation savings). To help achieve the needed savings in each drought stage, HDR developed a set of rates applicable to each stage. The overall targeted savings, or reductions in use, will be achieved through both “voluntary” savings and via price incentives. In developing the water shortage surcharges HDR has assumed that under each stage there will be some level of “voluntary” savings by the customers based on education and individual conservation practices. The remaining savings will need to be achieved through price incentives and price elasticity, responsiveness to changes in price. As noted, the drought rates will be supplemented with the City’s excessive use penalties and other conservation programs to achieve the total savings in each drought stage. For purposes of developing the drought rate pricing, it was assumed that the savings in each stage would target the mid-point of the stage (e.g., State 3 = 20%-35%, or 27.5% average reduction in consumption). Provided below in Table 1 is a summary of the assumptions regarding voluntary versus price induced savings.
Table 1 Summary of the Estimated Voluntary Versus Price Induced Conservation Savings
Normal Conditions
Voluntary Stage 1
Mandatory Stage 2
Mandatory Stage 3
Mandatory Stage 4
Targeted Reduction Goal 0% 20% 20% 35% >35%
Voluntary Savings 0.0% 5.0% 10.0% 15.5% 25.0% Price Induced Savings 0.0% 0.0% 5.0% 12.0% 20.0% Total Targeted Conservation Savings 0.0% 5.0% 15.0% 27.5% 45.0%
At the same time, during drought stages, the City would anticipate incurring additional expenses over and above the revenue requirements incurred during normal water conditions as a result of each stage of the drought. These additional expenses will be incurred for items such as advertising and notification, additional customer outreach, temporary staffing, enforcement,
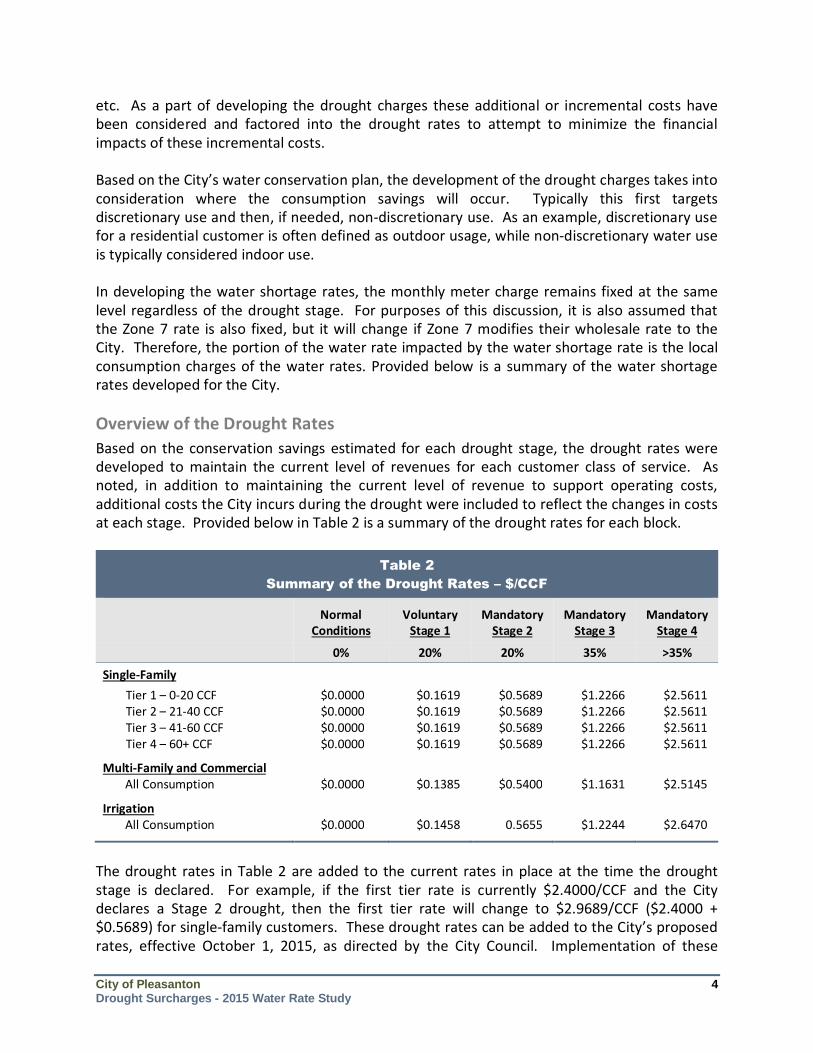
City of Pleasanton 4 Drought Surcharges - 2015 Water Rate Study
etc. As a part of developing the drought charges these additional or incremental costs have been considered and factored into the drought rates to attempt to minimize the financial impacts of these incremental costs. Based on the City’s water conservation plan, the development of the drought charges takes into consideration where the consumption savings will occur. Typically this first targets discretionary use and then, if needed, non-discretionary use. As an example, discretionary use for a residential customer is often defined as outdoor usage, while non-discretionary water use is typically considered indoor use. In developing the water shortage rates, the monthly meter charge remains fixed at the same level regardless of the drought stage. For purposes of this discussion, it is also assumed that the Zone 7 rate is also fixed, but it will change if Zone 7 modifies their wholesale rate to the City. Therefore, the portion of the water rate impacted by the water shortage rate is the local consumption charges of the water rates. Provided below is a summary of the water shortage rates developed for the City. Overview of the Drought Rates Based on the conservation savings estimated for each drought stage, the drought rates were developed to maintain the current level of revenues for each customer class of service. As noted, in addition to maintaining the current level of revenue to support operating costs, additional costs the City incurs during the drought were included to reflect the changes in costs at each stage. Provided below in Table 2 is a summary of the drought rates for each block.
Table 2 Summary of the Drought Rates – $/CCF
Normal Conditions
Voluntary Stage 1
Mandatory Stage 2
Mandatory Stage 3
Mandatory Stage 4
0% 20% 20% 35% >35%
Single-Family Tier 1 – 0-20 CCF $0.0000 $0.1619 $0.5689 $1.2266 $2.5611 Tier 2 – 21-40 CCF $0.0000 $0.1619 $0.5689 $1.2266 $2.5611 Tier 3 – 41-60 CCF $0.0000 $0.1619 $0.5689 $1.2266 $2.5611 Tier 4 – 60+ CCF $0.0000 $0.1619 $0.5689 $1.2266 $2.5611
Multi-Family and Commercial All Consumption $0.0000 $0.1385 $0.5400 $1.1631 $2.5145
Irrigation All Consumption $0.0000 $0.1458 0.5655 $1.2244 $2.6470
The drought rates in Table 2 are added to the current rates in place at the time the drought stage is declared. For example, if the first tier rate is currently $2.4000/CCF and the City declares a Stage 2 drought, then the first tier rate will change to $2.9689/CCF ($2.4000 + $0.5689) for single-family customers. These drought rates can be added to the City’s proposed rates, effective October 1, 2015, as directed by the City Council. Implementation of these
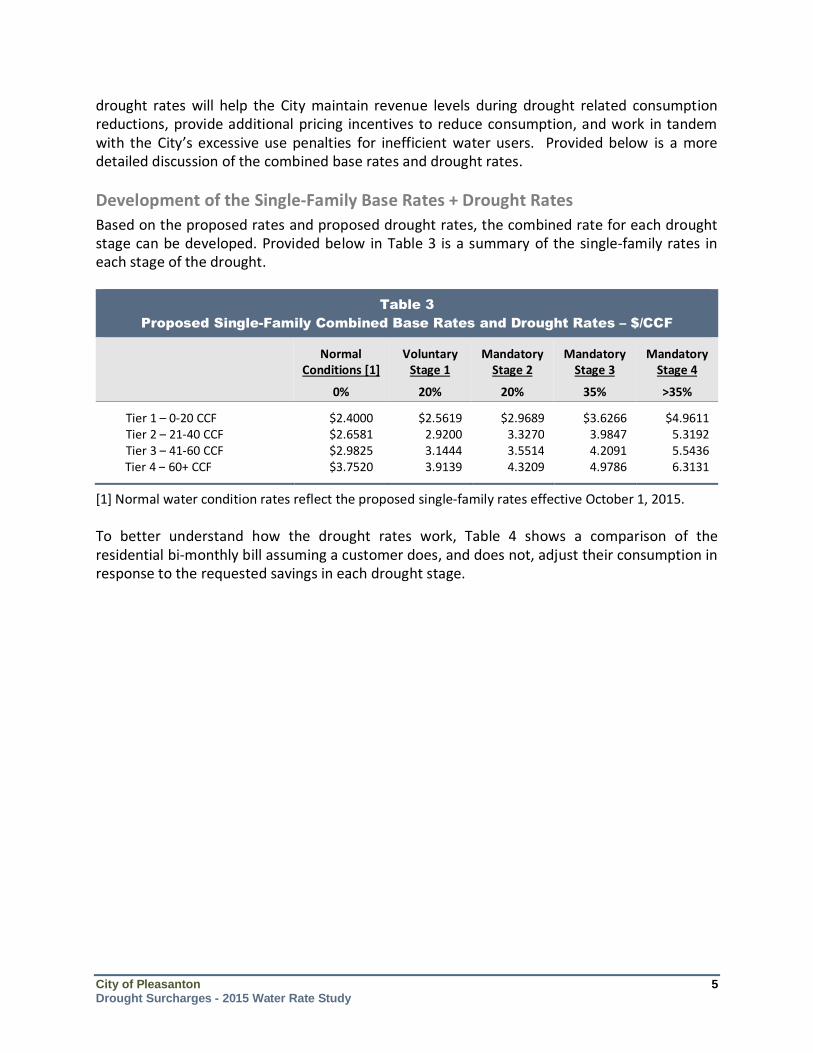
City of Pleasanton 5 Drought Surcharges - 2015 Water Rate Study
drought rates will help the City maintain revenue levels during drought related consumption reductions, provide additional pricing incentives to reduce consumption, and work in tandem with the City’s excessive use penalties for inefficient water users. Provided below is a more detailed discussion of the combined base rates and drought rates. Development of the Single-Family Base Rates + Drought Rates Based on the proposed rates and proposed drought rates, the combined rate for each drought stage can be developed. Provided below in Table 3 is a summary of the single-family rates in each stage of the drought.
Table 3 Proposed Single-Family Combined Base Rates and Drought Rates – $/CCF
Normal Conditions [1]
Voluntary Stage 1
Mandatory Stage 2
Mandatory Stage 3
Mandatory Stage 4
0% 20% 20% 35% >35%
Tier 1 – 0-20 CCF $2.4000 $2.5619 $2.9689 $3.6266 $4.9611 Tier 2 – 21-40 CCF $2.6581 2.9200 3.3270 3.9847 5.3192 Tier 3 – 41-60 CCF $2.9825 3.1444 3.5514 4.2091 5.5436 Tier 4 – 60+ CCF $3.7520 3.9139 4.3209 4.9786 6.3131
[1] Normal water condition rates reflect the proposed single-family rates effective October 1, 2015. To better understand how the drought rates work, Table 4 shows a comparison of the residential bi-monthly bill assuming a customer does, and does not, adjust their consumption in response to the requested savings in each drought stage.
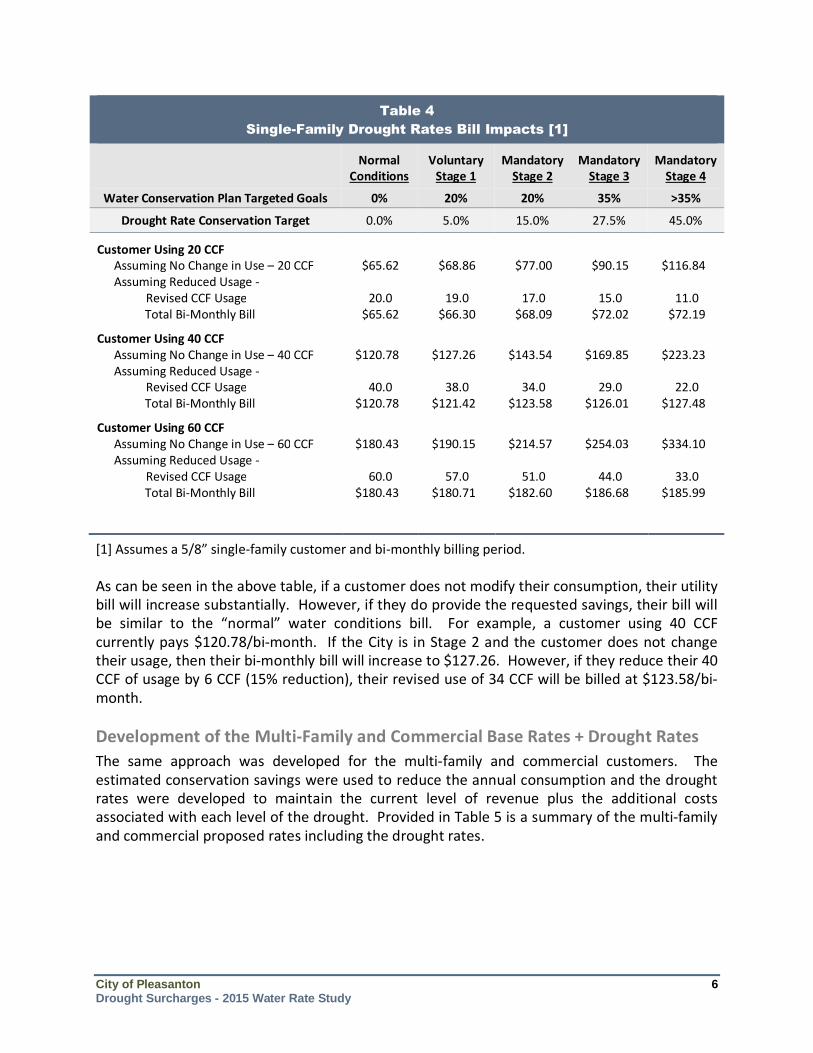
City of Pleasanton 6 Drought Surcharges - 2015 Water Rate Study
Table 4 Single-Family Drought Rates Bill Impacts [1]
Normal Conditions
Voluntary Stage 1
Mandatory Stage 2
Mandatory Stage 3
Mandatory Stage 4
Water Conservation Plan Targeted Goals 0% 20% 20% 35% >35%
Drought Rate Conservation Target 0.0% 5.0% 15.0% 27.5% 45.0%
Customer Using 20 CCF Assuming No Change in Use – 20 CCF $65.62 $68.86 $77.00 $90.15 $116.84 Assuming Reduced Usage - Revised CCF Usage 20.0 19.0 17.0 15.0 11.0 Total Bi-Monthly Bill $65.62 $66.30 $68.09 $72.02 $72.19
Customer Using 40 CCF Assuming No Change in Use – 40 CCF $120.78 $127.26 $143.54 $169.85 $223.23 Assuming Reduced Usage - Revised CCF Usage 40.0 38.0 34.0 29.0 22.0 Total Bi-Monthly Bill $120.78 $121.42 $123.58 $126.01 $127.48
Customer Using 60 CCF Assuming No Change in Use – 60 CCF $180.43 $190.15 $214.57 $254.03 $334.10 Assuming Reduced Usage - Revised CCF Usage 60.0 57.0 51.0 44.0 33.0 Total Bi-Monthly Bill $180.43 $180.71 $182.60 $186.68 $185.99
[1] Assumes a 5/8” single-family customer and bi-monthly billing period. As can be seen in the above table, if a customer does not modify their consumption, their utility bill will increase substantially. However, if they do provide the requested savings, their bill will be similar to the “normal” water conditions bill. For example, a customer using 40 CCF currently pays $120.78/bi-month. If the City is in Stage 2 and the customer does not change their usage, then their bi-monthly bill will increase to $127.26. However, if they reduce their 40 CCF of usage by 6 CCF (15% reduction), their revised use of 34 CCF will be billed at $123.58/bi-month. Development of the Multi-Family and Commercial Base Rates + Drought Rates The same approach was developed for the multi-family and commercial customers. The estimated conservation savings were used to reduce the annual consumption and the drought rates were developed to maintain the current level of revenue plus the additional costs associated with each level of the drought. Provided in Table 5 is a summary of the multi-family and commercial proposed rates including the drought rates.

City of Pleasanton 7 Drought Surcharges - 2015 Water Rate Study
Table 5 Proposed Multi-Family and Commercial Combined Base and Drought Rates – $/CCF
Normal Conditions [1]
Voluntary Stage 1
Mandatory Stage 2
Mandatory Stage 3
Mandatory Stage 4
0% 20% 20% 35% >35%
All Consumption - CCF $2.7693 $2.9078 $3.3093 $3.9324 $5.2838
[1] Normal water condition rates reflect the proposed rates effective October 1, 2015. As can be seen, the current uniform consumption charge has been increased by the drought rate for each stage from Table 2. Development of the Irrigation Base Rates +Drought Rates Similar to the prior drought rates the proposed rates combined with the drought rates for the irrigation customer class was developed.
Table 6 Proposed Irrigation Combined Base Rates and Drought Rates – $/CCF
Normal Conditions [1]
Voluntary Stage 1
Mandatory Stage 2
Mandatory Stage 3
Mandatory Stage 4
0% 20% 20% 35% >35%
All Consumption - CCF $2.9152 $3.0610 $3.4807 $4.1396 $5.5622
[1] Normal water condition rates reflect the proposed rates effective October 1, 2015. As shown in Table 6, the irrigation rates reflect the proposed rates and the drought rates for each stage. It should be noted that irrigation use should be essentially zero in stages 3 and 4 based on the City’s current water conservation plan which limits, or eliminates, outdoor watering. Annual Adjustments to the Drought Rates As noted, the purpose of the drought rates is to maintain sufficient revenues during times of declining consumption. Therefore, as potable water rates are adjusted for CPI each January 1st, or Zone 7 wholesale rates are increased, the drought rates will need to be adjusted to reflect the target revenue needs as the development of the drought rates are based on current potable water rates and revenue levels. The adjustment of the drought rates to reflect the changes in CPI to the local potable water distribution rates, can be passed through based on the percentage basis to reflect the change in the overall revenues. For example, if the CPI adjustment is 2.5% then the drought rates can be increased by 2.5%.
City of Pleasanton 8 Drought Surcharges - 2015 Water Rate Study
A similar approach can be used to update the drought rates based on the adoption of a new wholesale water rate by Zone 7. However, in this case if the Zone 7 rate is increased, it is recommended that the change in the rate be added to the drought rates. For example, if the Zone 7 rate in increased from the current rate of $2.40 to $2.50, then the drought rates can be increased by $0.10 in each stage and for each tier. Updating the drought rates each time the potable water rates are updated will maintain the sufficient revenue levels necessary to fund the operating and capital needs of the potable water utility during times of drought and reduced consumption levels. Summary The development of drought rates is essential to maintaining the financial stability of the City’s water utility. Combining the drought rates and excessive use penalties to inefficient water users, combined with the City’s water conservation plan will provide the City with a method to manage the current, and future, drought impacts on revenue and utility operations.
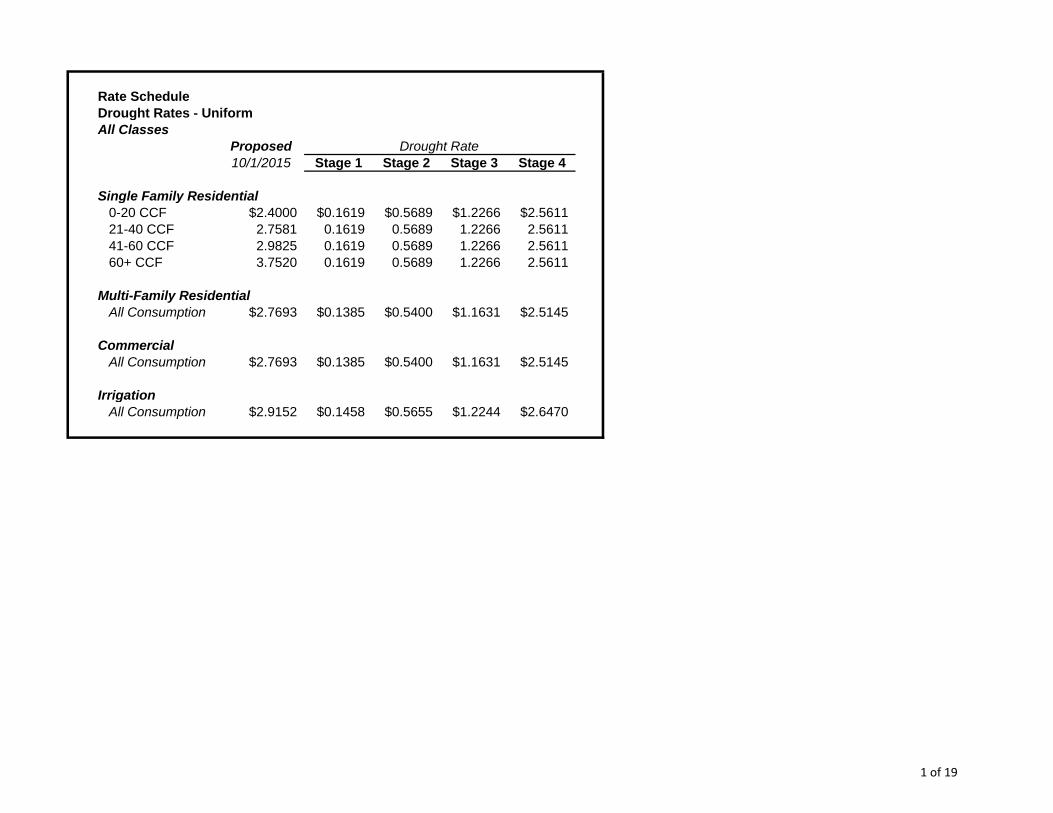
Rate ScheduleDrought Rates - UniformAll Classes
Proposed10/1/2015 Stage 1 Stage 2 Stage 3 Stage 4
Single Family Residential0-20 CCF $2.4000 $0.1619 $0.5689 $1.2266 $2.561121-40 CCF 2.7581 0.1619 0.5689 1.2266 2.561141-60 CCF 2.9825 0.1619 0.5689 1.2266 2.561160+ CCF 3.7520 0.1619 0.5689 1.2266 2.5611
Multi-Family ResidentialAll Consumption $2.7693 $0.1385 $0.5400 $1.1631 $2.5145
CommercialAll Consumption $2.7693 $0.1385 $0.5400 $1.1631 $2.5145
IrrigationAll Consumption $2.9152 $0.1458 $0.5655 $1.2244 $2.6470
Drought Rate
1 of 19

Rate ScheduleTotal Drought Rates - UniformAll Classes
Proposed10/1/2015 Stage 1 Stage 2 Stage 3 Stage 4
Single Family Residential0-20 CCF $2.4000 $2.5619 $2.9689 $3.6266 $4.961121-40 CCF 2.7581 2.9200 3.3270 3.9847 5.319241-60 CCF 2.9825 3.1444 3.5514 4.2091 5.543660+ CCF 3.7520 3.9139 4.3209 4.9786 6.3131
Multi-Family ResidentialAll Consumption $2.7693 $2.9078 $3.3093 $3.9324 $5.2838
CommercialAll Consumption $2.7693 $2.9078 $3.3093 $3.9324 $5.2838
IrrigationAll Consumption $2.9152 $3.0610 $3.4807 $4.1396 $5.5622
Base Rate + Drought Rate
2 of 19
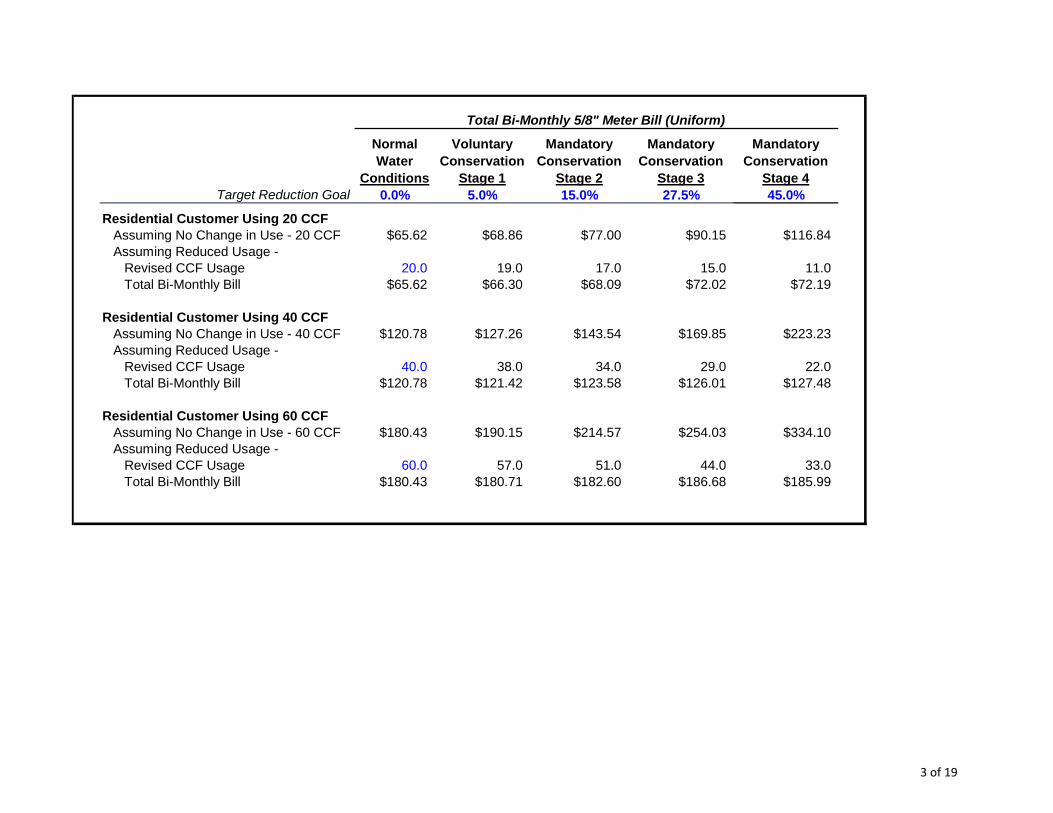
Target Reduction Goal 0.0% 5.0% 15.0% 27.5% 45.0%
Residential Customer Using 20 CCFAssuming No Change in Use - 20 CCF $65.62 $68.86 $77.00 $90.15 $116.84Assuming Reduced Usage -
Revised CCF Usage 20.0 19.0 17.0 15.0 11.0Total Bi-Monthly Bill $65.62 $66.30 $68.09 $72.02 $72.19
Residential Customer Using 40 CCFAssuming No Change in Use - 40 CCF $120.78 $127.26 $143.54 $169.85 $223.23Assuming Reduced Usage -
Revised CCF Usage 40.0 38.0 34.0 29.0 22.0Total Bi-Monthly Bill $120.78 $121.42 $123.58 $126.01 $127.48
Residential Customer Using 60 CCFAssuming No Change in Use - 60 CCF $180.43 $190.15 $214.57 $254.03 $334.10Assuming Reduced Usage -
Revised CCF Usage 60.0 57.0 51.0 44.0 33.0Total Bi-Monthly Bill $180.43 $180.71 $182.60 $186.68 $185.99
Mandatory Conservation
Stage 4
Total Bi-Monthly 5/8" Meter Bill (Uniform)
Normal Water
Conditions
Mandatory Conservation
Stage 2
Mandatory Conservation
Stage 3
Voluntary Conservation
Stage 1
3 of 19

City of Pleasanton
Water Utility Rate Study Page 1 of 4Single Family Residential Drought Rates - Uniform
Step 1 - Determine Total Targeted Stage 1 Savings and Savings Achieved from Voluntary and Price Elasticity Impacts
Estimated Est. Savings% Savings in Total CCF
Stage 1 - Target Conservation (Savings) 20.0% 582,382 CCF - Savings Achieved From Voluntarily (Education, etc.) 5.0% 145,595 CCF - Saving Achieved Via Price Elasticity (Rates) 0.0% 0 CCF
436,786
Step 2 - Estimate the Voluntary and Price Elasticity Impacts (Savings) By Price Block
NormalWater Estimated Estimated After Vol. Targeted Elasticity After Vol. &
Conditions % Savings Savings Savings Savings Savings Rate Impact(CCF) by Block (CCF) (CCF) By Block (CCF) (CCF)
0-20 CCF 1,806,495 5.0% 90,325 1,716,170 0.0% 0 1,716,17021-40 CCF 551,589 5.0% 27,579 524,010 0.0% 0 524,01041-60 CCF 211,216 5.0% 10,561 200,655 0.0% 0 200,65560+ CCF 342,608 5.0% 17,130 325,478 0.0% 0 325,478
------------------ ------------------ ------------------ ------------------ ------------------Total Consumption 2,911,908 145,595 2,766,313 0 2,766,313
Target Savings 145,595 0Difference (CCF) 0 0
Step 3 - Determine the Price (Rate) By Block Needed to Achieve Needed Savings and Meet Revenue Requirement
UsageAfter Vol. & Estimated Estimated TargetedRate Impact % Adjst. Rate Commodity Price Savings Elasticity %
(CCF) to Rates $/CCF Revenue Elasticity [1] % Savings Difference
0-20 CCF 1,716,170 6.7% $2.5619 $4,396,657 0.000 0.0% 0.0% 0.0%21-40 CCF 524,010 21.7% 2.9200 1,530,108 0.000 0.0% 0.0% 0.0%41-60 CCF 200,655 31.0% 3.1444 630,940 0.000 0.0% 0.0% 0.0%60+ CCF 325,478 63.1% 3.9139 1,273,887 0.000 0.0% 0.0% 0.0%
------------------ ------------------- Total 2,766,313 $7,831,591
[1] - Note: Price elasticity is estimated and is a range of Plus: Targeted Additional Stage 1 Costs (Residential Share) $59,133 impacts and will vary based upon the block being
impacted, the price of water and the seasonTarget - Total Revenue $7,831,476$ Difference $116
Stage 1 Drought Conditions
STAGE 1 - REQUIRED TOTAL SAVINGS
Voluntary Savings Impacts Price Elasticity Savings Impact
Check of Elasticity Impacts from Assumed RatesSTAGE 1
4 of 19

City of Pleasanton
Water Utility Rate Study Page 2 of 4Single Family Residential Drought Rates - Uniform
Step 1 - Determine Total Targeted Stage 2 Savings and Savings Achieved from Voluntary and Price Elasticity Impacts
Estimated Est. Savings% Savings in Total CCF
Stage 2 - Target Conservation (Savings) 15.0% 436,786 CCF - Savings Achieved From Voluntarily (Education, etc.) 10.0% 291,191 CCF - Saving Achieved Via Price Elasticity (Rates) 5.0% 145,595 CCF
Step 2 - Estimate the Voluntary and Price Elasticity Impacts (Savings) By Price Block
NormalWater Estimated Estimated After Vol. Targeted Elasticity After Vol. &
Conditions % Savings Savings Savings Savings Savings Rate Impact(CCF) by Block (CCF) (CCF) By Block (CCF) (CCF)
0-20 CCF 1,806,495 5.0% 90,325 1,716,170 4.0% 68,647 1,647,52321-40 CCF 551,589 10.0% 55,159 496,430 6.0% 29,786 466,64441-60 CCF 211,216 20.0% 42,243 168,973 10.0% 16,897 152,07660+ CCF 342,608 30.0% 102,782 239,826 12.5% 29,978 209,847
------------------ ------------------ ------------------ ------------------ ------------------Total Consumption 2,911,908 290,509 2,621,399 145,308 2,476,091
Target Savings 291,191 145,595 Difference (CCF) (682) (287)
Step 3 - Determine the Price (Rate) By Block Needed to Achieve Needed Savings and Meet Revenue Requirement
UsageAfter Vol. & Estimated Estimated TargetedRate Impact % Adjst. Rate Commodity Price Savings Elasticity %
(CCF) to Rates $/CCF Revenue Elasticity [1] % Savings Difference
0-20 CCF 1,647,523 23.7% $2.9689 $4,891,332 -0.150 3.6% 4.0% -0.4%21-40 CCF 466,644 20.6% 3.3270 1,552,526 -0.300 6.2% 6.0% 0.2%41-60 CCF 152,076 19.1% 3.5514 540,081 -0.400 7.6% 10.0% -2.4%60+ CCF 209,847 15.2% 4.3209 906,730 -0.500 7.6% 12.5% -4.9%
------------------ ------------------- Total 2,476,091 $7,890,669
[1] - Note: Price elasticity is estimated and is a range of Plus: Targeted Additional Stage 2 Costs (Residential Share) $118,266 impacts and will vary based upon the block being
impacted, the price of water and the seasonTarget - Total Revenue $7,890,609$ Difference $60
STAGE 2
Stage 2 Drought Conditions
STAGE 2 - REQUIRED TOTAL SAVINGS
Voluntary Savings Impacts Price Elasticity Savings Impact
Check of Elasticity Impacts from Assumed Rates
5 of 19

City of Pleasanton
Water Utility Rate Study Page 3 of 4Single Family Residential Drought Rates - Uniform
Step 1 - Determine Total Targeted Stage 3 Savings and Savings Achieved from Voluntary and Price Elasticity Impacts
Estimated Est. Savings% Savings in Total CCF
Stage 3 - Target Conservation (Savings) 27.5% 800,775 CCF - Savings Achieved From Voluntarily (Education, etc.) 15.5% 451,346 CCF - Saving Achieved Via Price Elasticity (Rates) 12.0% 349,429 CCF
Step 2 - Estimate the Voluntary and Price Elasticity Impacts (Savings) By Price Block
NormalWater Estimated Estimated After Vol. Targeted Elasticity After Vol. &
Conditions % Savings Savings Savings Savings Savings Rate Impact(CCF) by Block (CCF) (CCF) By Block (CCF) (CCF)
0-20 CCF 1,806,495 9.4% 169,811 1,636,684 7.5% 122,751 1,513,93321-40 CCF 551,589 20.0% 110,318 441,271 16.1% 71,045 370,22741-60 CCF 211,216 25.0% 52,804 158,412 35.0% 55,444 102,96860+ CCF 342,608 35.0% 119,913 222,695 45.0% 100,213 122,482
------------------ ------------------ ------------------ ------------------ ------------------Total Consumption 2,911,908 452,845 2,459,063 349,453 2,109,610
72.4%Target Savings 451,346 349,429 Difference (CCF) 1,499 24
Step 3 - Determine the Price (Rate) By Block Needed to Achieve Needed Savings and Meet Revenue Requirement
UsageAfter Vol. & Estimated Estimated TargetedRate Impact % Adjst. Rate Commodity Price Savings Elasticity %
(CCF) to Rates $/CCF Revenue Elasticity [1] % Savings Difference
0-20 CCF 1,513,933 51.1% $3.6266 $5,490,430 -0.150 7.7% 7.5% 0.2%21-40 CCF 370,227 44.5% 3.9847 1,475,242 -0.300 13.3% 16.1% -2.8%41-60 CCF 102,968 41.1% 4.2091 433,402 -0.400 16.5% 35.0% -18.5%60+ CCF 122,482 32.7% 4.9786 609,791 -0.500 16.3% 45.0% -28.7%
------------------ ------------------- Total 2,109,610 $8,008,864
[1] - Note: Price elasticity is estimated and is a range of Plus: Targeted Additional Stage 3 Costs (Residential Share) $236,533 impacts and will vary based upon the block being
impacted, the price of water and the seasonTarget - Total Revenue $8,008,875$ Difference ($11)
Stage 3 Drought Conditions
STAGE 3 - REQUIRED TOTAL SAVINGS
Voluntary Savings Impacts Price Elasticity Savings Impact
Check of Elasticity Impacts from Assumed RatesSTAGE 3
6 of 19
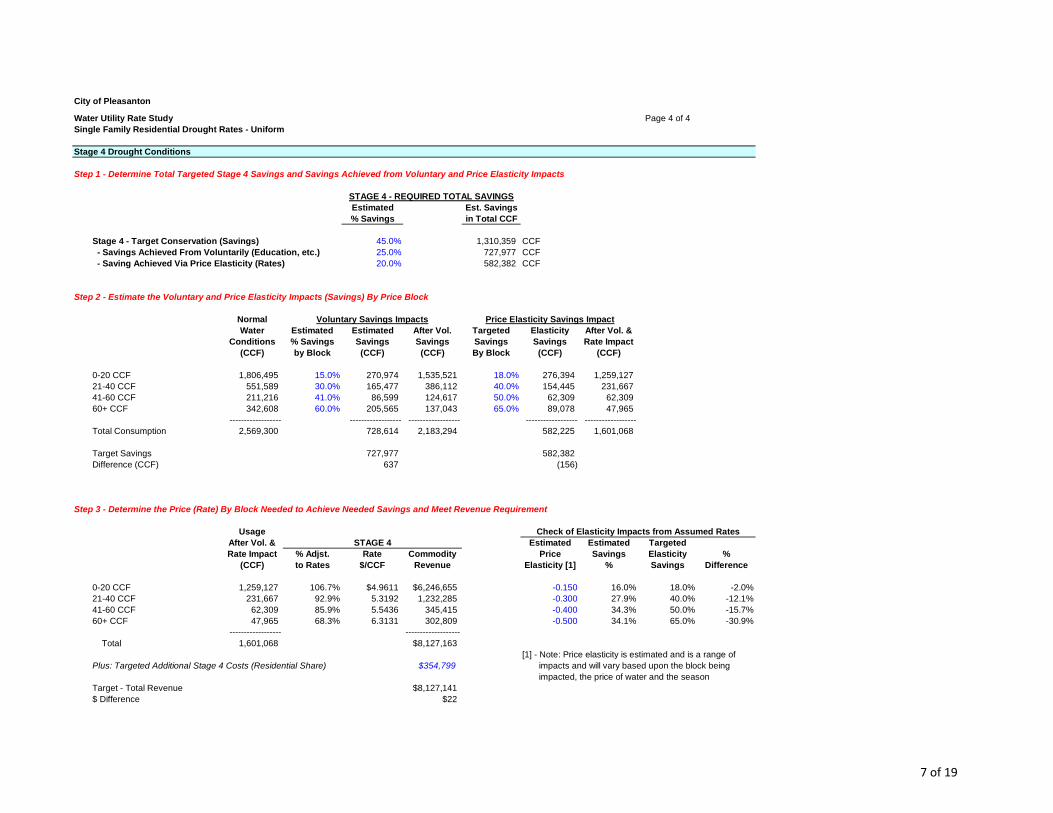
City of Pleasanton
Water Utility Rate Study Page 4 of 4Single Family Residential Drought Rates - Uniform
Step 1 - Determine Total Targeted Stage 4 Savings and Savings Achieved from Voluntary and Price Elasticity Impacts
Estimated Est. Savings% Savings in Total CCF
Stage 4 - Target Conservation (Savings) 45.0% 1,310,359 CCF - Savings Achieved From Voluntarily (Education, etc.) 25.0% 727,977 CCF - Saving Achieved Via Price Elasticity (Rates) 20.0% 582,382 CCF
Step 2 - Estimate the Voluntary and Price Elasticity Impacts (Savings) By Price Block
NormalWater Estimated Estimated After Vol. Targeted Elasticity After Vol. &
Conditions % Savings Savings Savings Savings Savings Rate Impact(CCF) by Block (CCF) (CCF) By Block (CCF) (CCF)
0-20 CCF 1,806,495 15.0% 270,974 1,535,521 18.0% 276,394 1,259,12721-40 CCF 551,589 30.0% 165,477 386,112 40.0% 154,445 231,66741-60 CCF 211,216 41.0% 86,599 124,617 50.0% 62,309 62,30960+ CCF 342,608 60.0% 205,565 137,043 65.0% 89,078 47,965
------------------ ------------------ ------------------ ------------------ ------------------Total Consumption 2,569,300 728,614 2,183,294 582,225 1,601,068
Target Savings 727,977 582,382 Difference (CCF) 637 (156)
Step 3 - Determine the Price (Rate) By Block Needed to Achieve Needed Savings and Meet Revenue Requirement
UsageAfter Vol. & Estimated Estimated TargetedRate Impact % Adjst. Rate Commodity Price Savings Elasticity %
(CCF) to Rates $/CCF Revenue Elasticity [1] % Savings Difference
0-20 CCF 1,259,127 106.7% $4.9611 $6,246,655 -0.150 16.0% 18.0% -2.0%21-40 CCF 231,667 92.9% 5.3192 1,232,285 -0.300 27.9% 40.0% -12.1%41-60 CCF 62,309 85.9% 5.5436 345,415 -0.400 34.3% 50.0% -15.7%60+ CCF 47,965 68.3% 6.3131 302,809 -0.500 34.1% 65.0% -30.9%
------------------ ------------------- Total 1,601,068 $8,127,163
[1] - Note: Price elasticity is estimated and is a range of Plus: Targeted Additional Stage 4 Costs (Residential Share) $354,799 impacts and will vary based upon the block being
impacted, the price of water and the seasonTarget - Total Revenue $8,127,141$ Difference $22
STAGE 4
Stage 4 Drought Conditions
STAGE 4 - REQUIRED TOTAL SAVINGS
Voluntary Savings Impacts Price Elasticity Savings Impact
Check of Elasticity Impacts from Assumed Rates
7 of 19
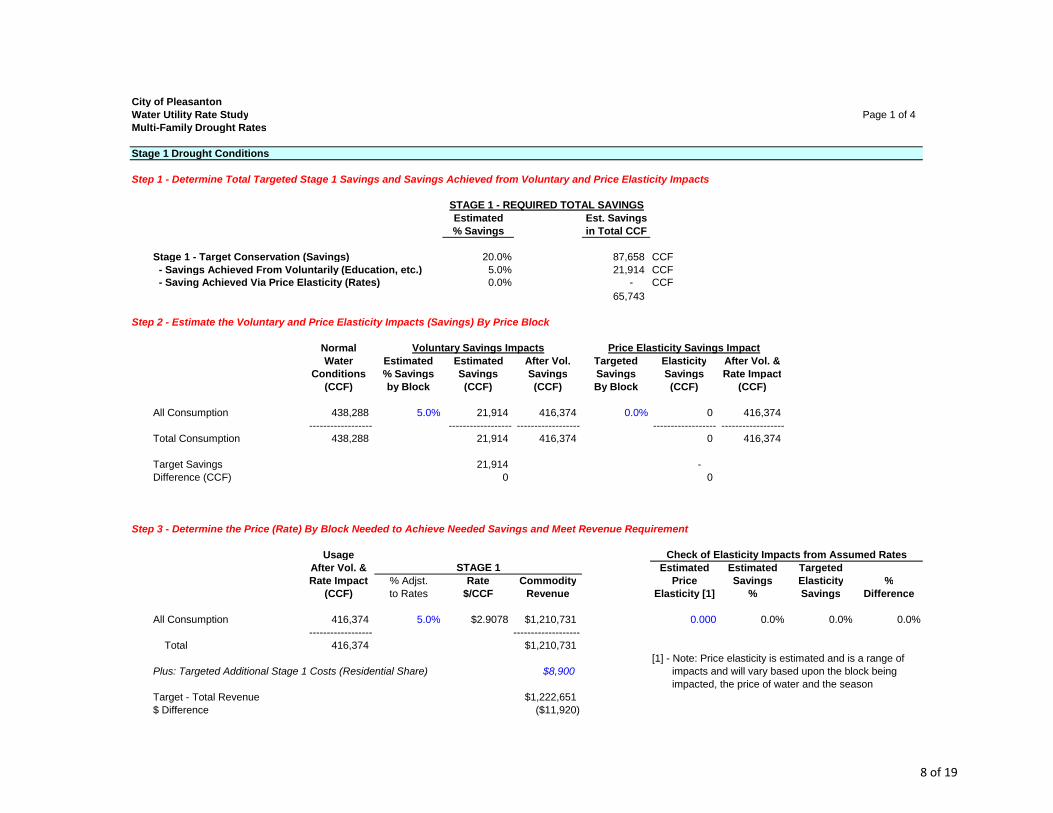
City of PleasantonWater Utility Rate Study Page 1 of 4Multi-Family Drought Rates
Stage 1 Drought Conditions
Step 1 - Determine Total Targeted Stage 1 Savings and Savings Achieved from Voluntary and Price Elasticity Impacts
Estimated Est. Savings% Savings in Total CCF
Stage 1 - Target Conservation (Savings) 20.0% 87,658 CCF - Savings Achieved From Voluntarily (Education, etc.) 5.0% 21,914 CCF - Saving Achieved Via Price Elasticity (Rates) 0.0% - CCF
65,743
Step 2 - Estimate the Voluntary and Price Elasticity Impacts (Savings) By Price Block
NormalWater Estimated Estimated After Vol. Targeted Elasticity After Vol. &
Conditions % Savings Savings Savings Savings Savings Rate Impact(CCF) by Block (CCF) (CCF) By Block (CCF) (CCF)
All Consumption 438,288 5.0% 21,914 416,374 0.0% 0 416,374 ------------------ ------------------ ------------------ ------------------ ------------------
Total Consumption 438,288 21,914 416,374 0 416,374
Target Savings 21,914 - Difference (CCF) 0 0
Step 3 - Determine the Price (Rate) By Block Needed to Achieve Needed Savings and Meet Revenue Requirement
UsageAfter Vol. & Estimated Estimated TargetedRate Impact % Adjst. Rate Commodity Price Savings Elasticity %
(CCF) to Rates $/CCF Revenue Elasticity [1] % Savings Difference
All Consumption 416,374 5.0% $2.9078 $1,210,731 0.000 0.0% 0.0% 0.0% ------------------ -------------------
Total 416,374 $1,210,731[1] - Note: Price elasticity is estimated and is a range of
Plus: Targeted Additional Stage 1 Costs (Residential Share) $8,900 impacts and will vary based upon the block being impacted, the price of water and the season
Target - Total Revenue $1,222,651$ Difference ($11,920)
STAGE 1 - REQUIRED TOTAL SAVINGS
Voluntary Savings Impacts Price Elasticity Savings Impact
Check of Elasticity Impacts from Assumed RatesSTAGE 1
8 of 19

City of PleasantonWater Utility Rate Study Page 2 of 4Multi-Family Drought Rates
Stage 2 Drought Conditions
Step 1 - Determine Total Targeted Stage 2 Savings and Savings Achieved from Voluntary and Price Elasticity Impacts
Estimated Est. Savings% Savings in Total CCF
Stage 2 - Target Conservation (Savings) 15.0% 65,743 CCF - Savings Achieved From Voluntarily (Education, etc.) 10.0% 43,829 CCF - Saving Achieved Via Price Elasticity (Rates) 5.0% 21,914 CCF
Step 2 - Estimate the Voluntary and Price Elasticity Impacts (Savings) By Price Block
NormalWater Estimated Estimated After Vol. Targeted Elasticity After Vol. &
Conditions % Savings Savings Savings Savings Savings Rate Impact(CCF) by Block (CCF) (CCF) By Block (CCF) (CCF)
All Consumption 438,288 10.0% 43,829 394,459 5.6% 22,090 372,369 ------------------ ------------------ ------------------ ------------------ ------------------
Total Consumption 438,288 43,829 394,459 22,090 372,369
Target Savings 43,829 21,914 Difference (CCF) 0 175
Step 3 - Determine the Price (Rate) By Block Needed to Achieve Needed Savings and Meet Revenue Requirement
UsageAfter Vol. & Estimated Estimated TargetedRate Impact % Adjst. Rate Commodity Price Savings Elasticity %
(CCF) to Rates $/CCF Revenue Elasticity [1] % Savings Difference
All Consumption 372,369 19.5% $3.3093 $1,232,282 -0.400 7.8% 5.6% 2.2% ------------------ -------------------
Total 372,369 $1,232,282[1] - Note: Price elasticity is estimated and is a range of
Plus: Targeted Additional Stage 2 Costs (Residential Share) $17,801 impacts and will vary based upon the block being impacted, the price of water and the season
Target - Total Revenue $1,231,552$ Difference $730
STAGE 2
STAGE 2 - REQUIRED TOTAL SAVINGS
Voluntary Savings Impacts Price Elasticity Savings Impact
Check of Elasticity Impacts from Assumed Rates
9 of 19

City of PleasantonWater Utility Rate Study Page 3 of 4Multi-Family Drought Rates
Stage 3 Drought Conditions
Step 1 - Determine Total Targeted Stage 3 Savings and Savings Achieved from Voluntary and Price Elasticity Impacts
Estimated Est. Savings% Savings in Total CCF
Stage 3 - Target Conservation (Savings) 27.5% 120,529 CCF - Savings Achieved From Voluntarily (Education, etc.) 15.5% 67,935 CCF - Saving Achieved Via Price Elasticity (Rates) 12.0% 52,595 CCF
Step 2 - Estimate the Voluntary and Price Elasticity Impacts (Savings) By Price Block
NormalWater Estimated Estimated After Vol. Targeted Elasticity After Vol. &
Conditions % Savings Savings Savings Savings Savings Rate Impact(CCF) by Block (CCF) (CCF) By Block (CCF) (CCF)
All Consumption 438,288 15.5% 67,935 370,353 14.2% 52,590 317,763 ------------------ ------------------ ------------------ ------------------ ------------------
Total Consumption 438,288 67,935 370,353 52,590 317,763
Target Savings 67,935 52,595 Difference (CCF) 0 (4)
Step 3 - Determine the Price (Rate) By Block Needed to Achieve Needed Savings and Meet Revenue Requirement
UsageAfter Vol. & Estimated Estimated TargetedRate Impact % Adjst. Rate Commodity Price Savings Elasticity %
(CCF) to Rates $/CCF Revenue Elasticity [1] % Savings Difference
All Consumption 317,763 42.0% $3.9324 $1,249,572 -0.350 14.7% 14.2% 0.5% ------------------ -------------------
Total 317,763 $1,249,572[1] - Note: Price elasticity is estimated and is a range of
Plus: Targeted Additional Stage 3 Costs (Residential Share) $35,602 impacts and will vary based upon the block being impacted, the price of water and the season
Target - Total Revenue $1,249,353$ Difference $219
STAGE 3 - REQUIRED TOTAL SAVINGS
Voluntary Savings Impacts Price Elasticity Savings Impact
Check of Elasticity Impacts from Assumed RatesSTAGE 3
10 of 19

City of PleasantonWater Utility Rate Study Page 4 of 4Multi-Family Drought Rates
Stage 4 Drought Conditions
Step 1 - Determine Total Targeted Stage 4 Savings and Savings Achieved from Voluntary and Price Elasticity Impacts
Estimated Est. Savings% Savings in Total CCF
Stage 4 - Target Conservation (Savings) 45.0% 197,230 CCF - Savings Achieved From Voluntarily (Education, etc.) 25.0% 109,572 CCF - Saving Achieved Via Price Elasticity (Rates) 20.0% 87,658 CCF
Step 2 - Estimate the Voluntary and Price Elasticity Impacts (Savings) By Price Block
NormalWater Estimated Estimated After Vol. Targeted Elasticity After Vol. &
Conditions % Savings Savings Savings Savings Savings Rate Impact(CCF) by Block (CCF) (CCF) By Block (CCF) (CCF)
All Consumption 438,288 25.0% 109,572 328,716 27.0% 88,753 239,963 ------------------ ------------------ ------------------ ------------------ ------------------
Total Consumption 438,288 109,572 328,716 88,753 239,963
Target Savings 109,572 87,658 Difference (CCF) 0 1,096
Step 3 - Determine the Price (Rate) By Block Needed to Achieve Needed Savings and Meet Revenue Requirement
UsageAfter Vol. & Estimated Estimated TargetedRate Impact % Adjst. Rate Commodity Price Savings Elasticity %
(CCF) to Rates $/CCF Revenue Elasticity [1] % Savings Difference
All Consumption 239,963 90.8% $5.2838 $1,267,915 -0.220 20.0% 27.0% -7.0% ------------------ -------------------
Total 239,963 $1,267,915[1] - Note: Price elasticity is estimated and is a range of
Plus: Targeted Additional Stage 4 Costs (Residential Share) $53,403 impacts and will vary based upon the block being impacted, the price of water and the season
Target - Total Revenue $1,267,154$ Difference $761
Voluntary Savings Impacts Price Elasticity Savings Impact
Check of Elasticity Impacts from Assumed RatesSTAGE 4
STAGE 4 - REQUIRED TOTAL SAVINGS
11 of 19
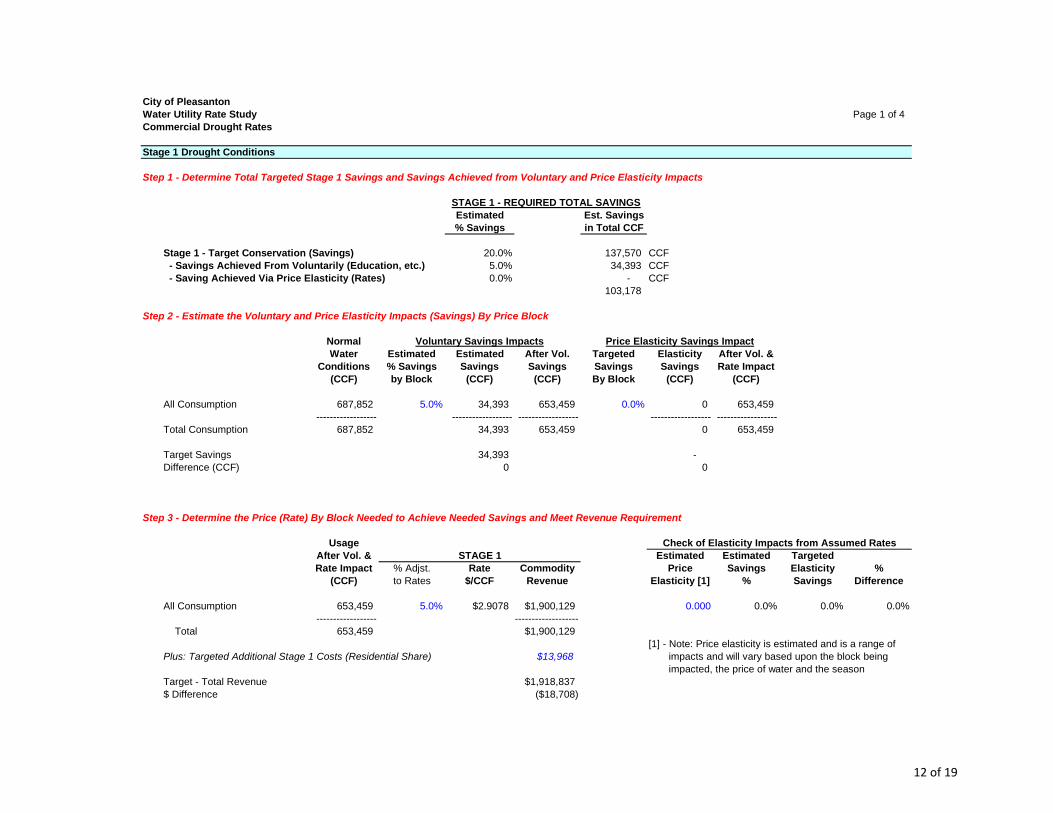
City of PleasantonWater Utility Rate Study Page 1 of 4Commercial Drought Rates
Stage 1 Drought Conditions
Step 1 - Determine Total Targeted Stage 1 Savings and Savings Achieved from Voluntary and Price Elasticity Impacts
Estimated Est. Savings% Savings in Total CCF
Stage 1 - Target Conservation (Savings) 20.0% 137,570 CCF - Savings Achieved From Voluntarily (Education, etc.) 5.0% 34,393 CCF - Saving Achieved Via Price Elasticity (Rates) 0.0% - CCF
103,178
Step 2 - Estimate the Voluntary and Price Elasticity Impacts (Savings) By Price Block
NormalWater Estimated Estimated After Vol. Targeted Elasticity After Vol. &
Conditions % Savings Savings Savings Savings Savings Rate Impact(CCF) by Block (CCF) (CCF) By Block (CCF) (CCF)
All Consumption 687,852 5.0% 34,393 653,459 0.0% 0 653,459 ------------------ ------------------ ------------------ ------------------ ------------------
Total Consumption 687,852 34,393 653,459 0 653,459
Target Savings 34,393 - Difference (CCF) 0 0
Step 3 - Determine the Price (Rate) By Block Needed to Achieve Needed Savings and Meet Revenue Requirement
UsageAfter Vol. & Estimated Estimated TargetedRate Impact % Adjst. Rate Commodity Price Savings Elasticity %
(CCF) to Rates $/CCF Revenue Elasticity [1] % Savings Difference
All Consumption 653,459 5.0% $2.9078 $1,900,129 0.000 0.0% 0.0% 0.0% ------------------ -------------------
Total 653,459 $1,900,129[1] - Note: Price elasticity is estimated and is a range of
Plus: Targeted Additional Stage 1 Costs (Residential Share) $13,968 impacts and will vary based upon the block being impacted, the price of water and the season
Target - Total Revenue $1,918,837$ Difference ($18,708)
STAGE 1 - REQUIRED TOTAL SAVINGS
Voluntary Savings Impacts Price Elasticity Savings Impact
Check of Elasticity Impacts from Assumed RatesSTAGE 1
12 of 19

City of PleasantonWater Utility Rate Study Page 2 of 4Commercial Drought Rates
Stage 2 Drought Conditions
Step 1 - Determine Total Targeted Stage 2 Savings and Savings Achieved from Voluntary and Price Elasticity Impacts
Estimated Est. Savings% Savings in Total CCF
Stage 2 - Target Conservation (Savings) 15.0% 103,178 CCF - Savings Achieved From Voluntarily (Education, etc.) 10.0% 68,785 CCF - Saving Achieved Via Price Elasticity (Rates) 5.0% 34,393 CCF
Step 2 - Estimate the Voluntary and Price Elasticity Impacts (Savings) By Price Block
NormalWater Estimated Estimated After Vol. Targeted Elasticity After Vol. &
Conditions % Savings Savings Savings Savings Savings Rate Impact(CCF) by Block (CCF) (CCF) By Block (CCF) (CCF)
All Consumption 687,852 10.0% 68,785 619,067 5.6% 34,668 584,399 ------------------ ------------------ ------------------ ------------------ ------------------
Total Consumption 687,852 68,785 619,067 34,668 584,399
Target Savings 68,785 34,393 Difference (CCF) 0 275
Step 3 - Determine the Price (Rate) By Block Needed to Achieve Needed Savings and Meet Revenue Requirement
UsageAfter Vol. & Estimated Estimated TargetedRate Impact % Adjst. Rate Commodity Price Savings Elasticity %
(CCF) to Rates $/CCF Revenue Elasticity [1] % Savings Difference
All Consumption 584,399 19.5% $3.3093 $1,933,952 -0.250 4.9% 5.6% -0.7% ------------------ -------------------
Total 584,399 $1,933,952[1] - Note: Price elasticity is estimated and is a range of
Plus: Targeted Additional Stage 2 Costs (Residential Share) $27,937 impacts and will vary based upon the block being impacted, the price of water and the season
Target - Total Revenue $1,932,805$ Difference $1,146
STAGE 2
STAGE 2 - REQUIRED TOTAL SAVINGS
Voluntary Savings Impacts Price Elasticity Savings Impact
Check of Elasticity Impacts from Assumed Rates
13 of 19

City of PleasantonWater Utility Rate Study Page 3 of 4Commercial Drought Rates
Stage 3 Drought Conditions
Step 1 - Determine Total Targeted Stage 3 Savings and Savings Achieved from Voluntary and Price Elasticity Impacts
Estimated Est. Savings% Savings in Total CCF
Stage 3 - Target Conservation (Savings) 27.5% 189,159 CCF - Savings Achieved From Voluntarily (Education, etc.) 15.5% 106,617 CCF - Saving Achieved Via Price Elasticity (Rates) 12.0% 82,542 CCF
Step 2 - Estimate the Voluntary and Price Elasticity Impacts (Savings) By Price Block
NormalWater Estimated Estimated After Vol. Targeted Elasticity After Vol. &
Conditions % Savings Savings Savings Savings Savings Rate Impact(CCF) by Block (CCF) (CCF) By Block (CCF) (CCF)
All Consumption 687,852 15.5% 106,617 581,235 14.2% 82,535 498,700 ------------------ ------------------ ------------------ ------------------ ------------------
Total Consumption 687,852 106,617 581,235 82,535 498,700
Target Savings 106,617 82,542 Difference (CCF) 0 (7)
Step 3 - Determine the Price (Rate) By Block Needed to Achieve Needed Savings and Meet Revenue Requirement
UsageAfter Vol. & Estimated Estimated TargetedRate Impact % Adjst. Rate Commodity Price Savings Elasticity %
(CCF) to Rates $/CCF Revenue Elasticity [1] % Savings Difference
All Consumption 498,700 42.0% $3.9324 $1,961,086 -0.250 10.5% 14.2% -3.7% ------------------ -------------------
Total 498,700 $1,961,086[1] - Note: Price elasticity is estimated and is a range of
Plus: Targeted Additional Stage 3 Costs (Residential Share) $55,874 impacts and will vary based upon the block being impacted, the price of water and the season
Target - Total Revenue $1,960,742$ Difference $344
STAGE 3 - REQUIRED TOTAL SAVINGS
Voluntary Savings Impacts Price Elasticity Savings Impact
Check of Elasticity Impacts from Assumed RatesSTAGE 3
14 of 19
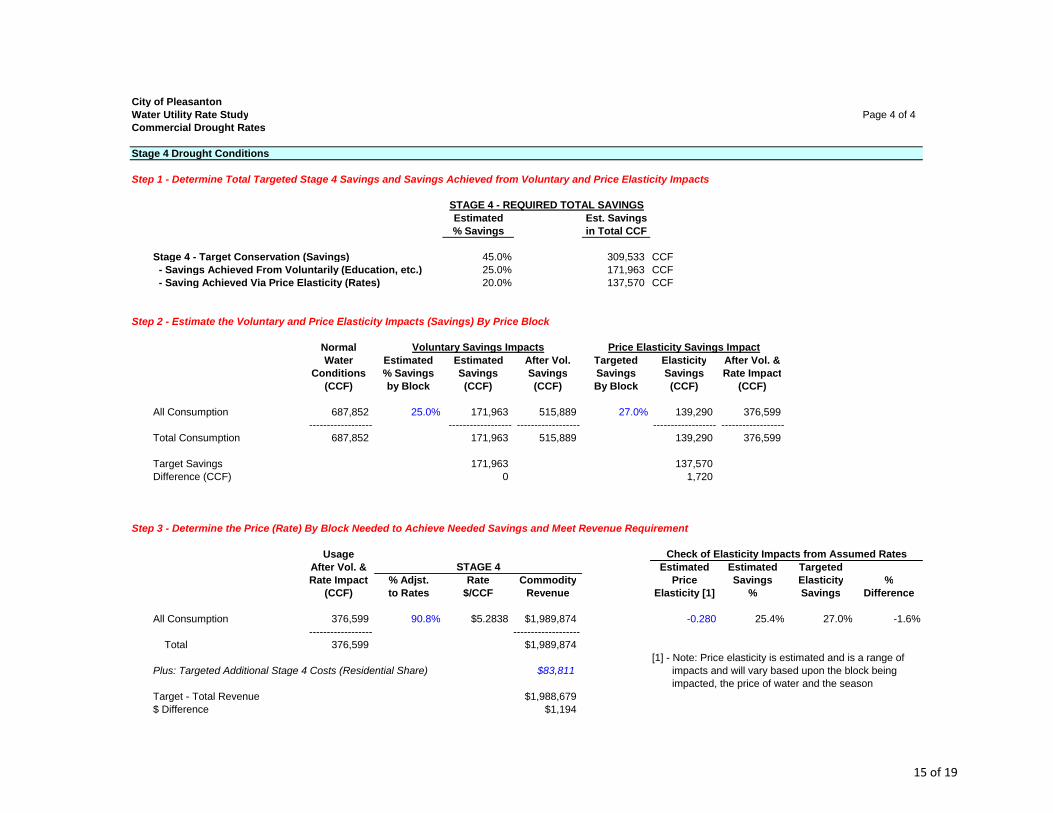
City of PleasantonWater Utility Rate Study Page 4 of 4Commercial Drought Rates
Stage 4 Drought Conditions
Step 1 - Determine Total Targeted Stage 4 Savings and Savings Achieved from Voluntary and Price Elasticity Impacts
Estimated Est. Savings% Savings in Total CCF
Stage 4 - Target Conservation (Savings) 45.0% 309,533 CCF - Savings Achieved From Voluntarily (Education, etc.) 25.0% 171,963 CCF - Saving Achieved Via Price Elasticity (Rates) 20.0% 137,570 CCF
Step 2 - Estimate the Voluntary and Price Elasticity Impacts (Savings) By Price Block
NormalWater Estimated Estimated After Vol. Targeted Elasticity After Vol. &
Conditions % Savings Savings Savings Savings Savings Rate Impact(CCF) by Block (CCF) (CCF) By Block (CCF) (CCF)
All Consumption 687,852 25.0% 171,963 515,889 27.0% 139,290 376,599 ------------------ ------------------ ------------------ ------------------ ------------------
Total Consumption 687,852 171,963 515,889 139,290 376,599
Target Savings 171,963 137,570 Difference (CCF) 0 1,720
Step 3 - Determine the Price (Rate) By Block Needed to Achieve Needed Savings and Meet Revenue Requirement
UsageAfter Vol. & Estimated Estimated TargetedRate Impact % Adjst. Rate Commodity Price Savings Elasticity %
(CCF) to Rates $/CCF Revenue Elasticity [1] % Savings Difference
All Consumption 376,599 90.8% $5.2838 $1,989,874 -0.280 25.4% 27.0% -1.6% ------------------ -------------------
Total 376,599 $1,989,874[1] - Note: Price elasticity is estimated and is a range of
Plus: Targeted Additional Stage 4 Costs (Residential Share) $83,811 impacts and will vary based upon the block being impacted, the price of water and the season
Target - Total Revenue $1,988,679$ Difference $1,194
Voluntary Savings Impacts Price Elasticity Savings Impact
Check of Elasticity Impacts from Assumed RatesSTAGE 4
STAGE 4 - REQUIRED TOTAL SAVINGS
15 of 19

City of PleasantonWater Utility Rate Study Page 1 of 4Irrigation Drought Rates
Stage 1 Drought Conditions
Step 1 - Determine Total Targeted Stage 1 Savings and Savings Achieved from Voluntary and Price Elasticity Impacts
Estimated Est. Savings% Savings in Total CCF
Stage 1 - Target Conservation (Savings) 20.0% 251,120 CCF - Savings Achieved From Voluntarily (Education, etc.) 5.0% 62,780 CCF - Saving Achieved Via Price Elasticity (Rates) 0.0% - CCF
188,340
Step 2 - Estimate the Voluntary and Price Elasticity Impacts (Savings) By Price Block
NormalWater Estimated Estimated After Vol. Targeted Elasticity After Vol. &
Conditions % Savings Savings Savings Savings Savings Rate Impact(CCF) by Block (CCF) (CCF) By Block (CCF) (CCF)
All Consumption 1,255,601 5.0% 62,780 1,192,821 0.0% 0 1,192,821 ------------------ ------------------ ------------------ ------------------ ------------------
Total Consumption 1,255,601 62,780 1,192,821 0 1,192,821
Target Savings 62,780 - Difference (CCF) 0 0
Step 3 - Determine the Price (Rate) By Block Needed to Achieve Needed Savings and Meet Revenue Requirement
UsageAfter Vol. & Estimated Estimated TargetedRate Impact % Adjst. Rate Commodity Price Savings Elasticity %
(CCF) to Rates $/CCF Revenue Elasticity [1] % Savings Difference
All Consumption 1,192,821 5.0% $3.0610 $3,651,225 0.000 0.0% 0.0% 0.0% ------------------ -------------------
Total 1,192,821 $3,651,225[1] - Note: Price elasticity is estimated and is a range of
Plus: Targeted Additional Stage 1 Costs (Residential Share) $25,498 impacts and will vary based upon the block being impacted, the price of water and the season
Target - Total Revenue $3,685,826$ Difference ($34,601)
STAGE 1 - REQUIRED TOTAL SAVINGS
Voluntary Savings Impacts Price Elasticity Savings Impact
Check of Elasticity Impacts from Assumed RatesSTAGE 1
16 of 19
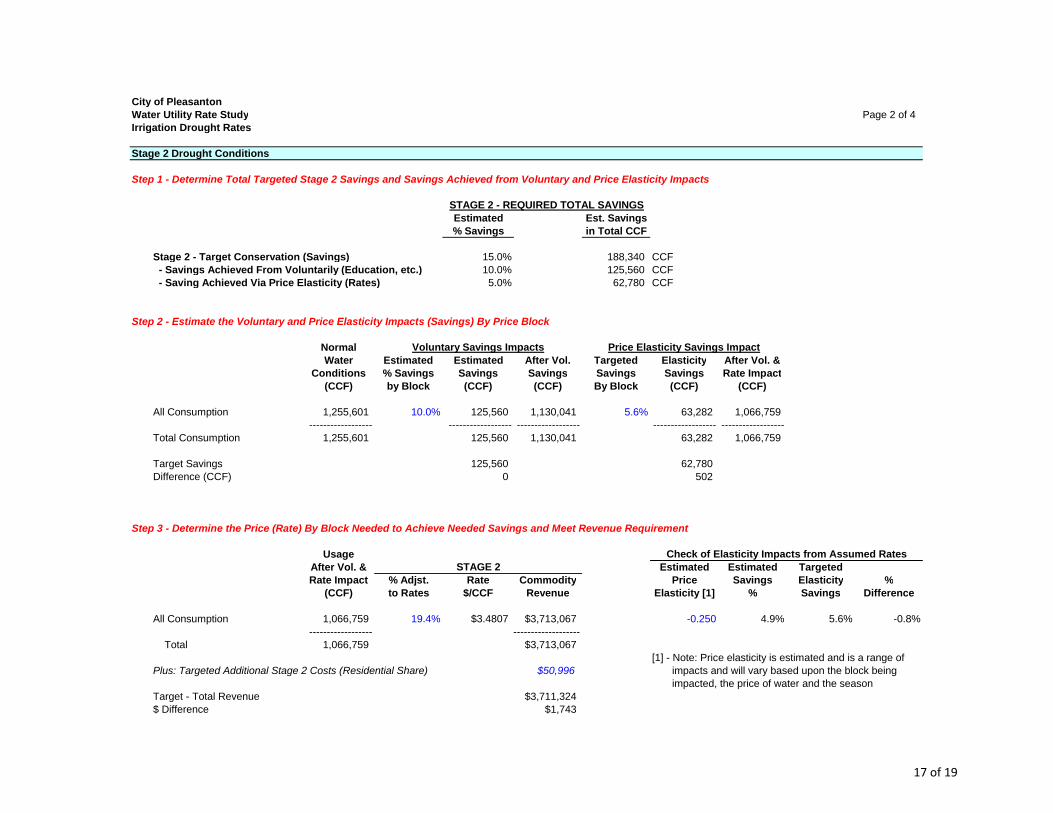
City of PleasantonWater Utility Rate Study Page 2 of 4Irrigation Drought Rates
Stage 2 Drought Conditions
Step 1 - Determine Total Targeted Stage 2 Savings and Savings Achieved from Voluntary and Price Elasticity Impacts
Estimated Est. Savings% Savings in Total CCF
Stage 2 - Target Conservation (Savings) 15.0% 188,340 CCF - Savings Achieved From Voluntarily (Education, etc.) 10.0% 125,560 CCF - Saving Achieved Via Price Elasticity (Rates) 5.0% 62,780 CCF
Step 2 - Estimate the Voluntary and Price Elasticity Impacts (Savings) By Price Block
NormalWater Estimated Estimated After Vol. Targeted Elasticity After Vol. &
Conditions % Savings Savings Savings Savings Savings Rate Impact(CCF) by Block (CCF) (CCF) By Block (CCF) (CCF)
All Consumption 1,255,601 10.0% 125,560 1,130,041 5.6% 63,282 1,066,759 ------------------ ------------------ ------------------ ------------------ ------------------
Total Consumption 1,255,601 125,560 1,130,041 63,282 1,066,759
Target Savings 125,560 62,780 Difference (CCF) 0 502
Step 3 - Determine the Price (Rate) By Block Needed to Achieve Needed Savings and Meet Revenue Requirement
UsageAfter Vol. & Estimated Estimated TargetedRate Impact % Adjst. Rate Commodity Price Savings Elasticity %
(CCF) to Rates $/CCF Revenue Elasticity [1] % Savings Difference
All Consumption 1,066,759 19.4% $3.4807 $3,713,067 -0.250 4.9% 5.6% -0.8% ------------------ -------------------
Total 1,066,759 $3,713,067[1] - Note: Price elasticity is estimated and is a range of
Plus: Targeted Additional Stage 2 Costs (Residential Share) $50,996 impacts and will vary based upon the block being impacted, the price of water and the season
Target - Total Revenue $3,711,324$ Difference $1,743
STAGE 2
STAGE 2 - REQUIRED TOTAL SAVINGS
Voluntary Savings Impacts Price Elasticity Savings Impact
Check of Elasticity Impacts from Assumed Rates
17 of 19

City of PleasantonWater Utility Rate Study Page 3 of 4Irrigation Drought Rates
Stage 3 Drought Conditions
Step 1 - Determine Total Targeted Stage 3 Savings and Savings Achieved from Voluntary and Price Elasticity Impacts
Estimated Est. Savings% Savings in Total CCF
Stage 3 - Target Conservation (Savings) 27.5% 345,290 CCF - Savings Achieved From Voluntarily (Education, etc.) 15.5% 194,618 CCF - Saving Achieved Via Price Elasticity (Rates) 12.0% 150,672 CCF
Step 2 - Estimate the Voluntary and Price Elasticity Impacts (Savings) By Price Block
NormalWater Estimated Estimated After Vol. Targeted Elasticity After Vol. &
Conditions % Savings Savings Savings Savings Savings Rate Impact(CCF) by Block (CCF) (CCF) By Block (CCF) (CCF)
All Consumption 1,255,601 15.5% 194,618 1,060,983 14.2% 150,660 910,323 ------------------ ------------------ ------------------ ------------------ ------------------
Total Consumption 1,255,601 194,618 1,060,983 150,660 910,323
Target Savings 194,618 150,672 Difference (CCF) 0 (13)
Step 3 - Determine the Price (Rate) By Block Needed to Achieve Needed Savings and Meet Revenue Requirement
UsageAfter Vol. & Estimated Estimated TargetedRate Impact % Adjst. Rate Commodity Price Savings Elasticity %
(CCF) to Rates $/CCF Revenue Elasticity [1] % Savings Difference
All Consumption 910,323 42.0% $4.1396 $3,768,374 -0.250 10.5% 14.2% -3.7% ------------------ -------------------
Total 910,323 $3,768,374[1] - Note: Price elasticity is estimated and is a range of
Plus: Targeted Additional Stage 3 Costs (Residential Share) $101,992 impacts and will vary based upon the block being impacted, the price of water and the season
Target - Total Revenue $3,762,320$ Difference $6,054
STAGE 3 - REQUIRED TOTAL SAVINGS
Voluntary Savings Impacts Price Elasticity Savings Impact
Check of Elasticity Impacts from Assumed RatesSTAGE 3
18 of 19
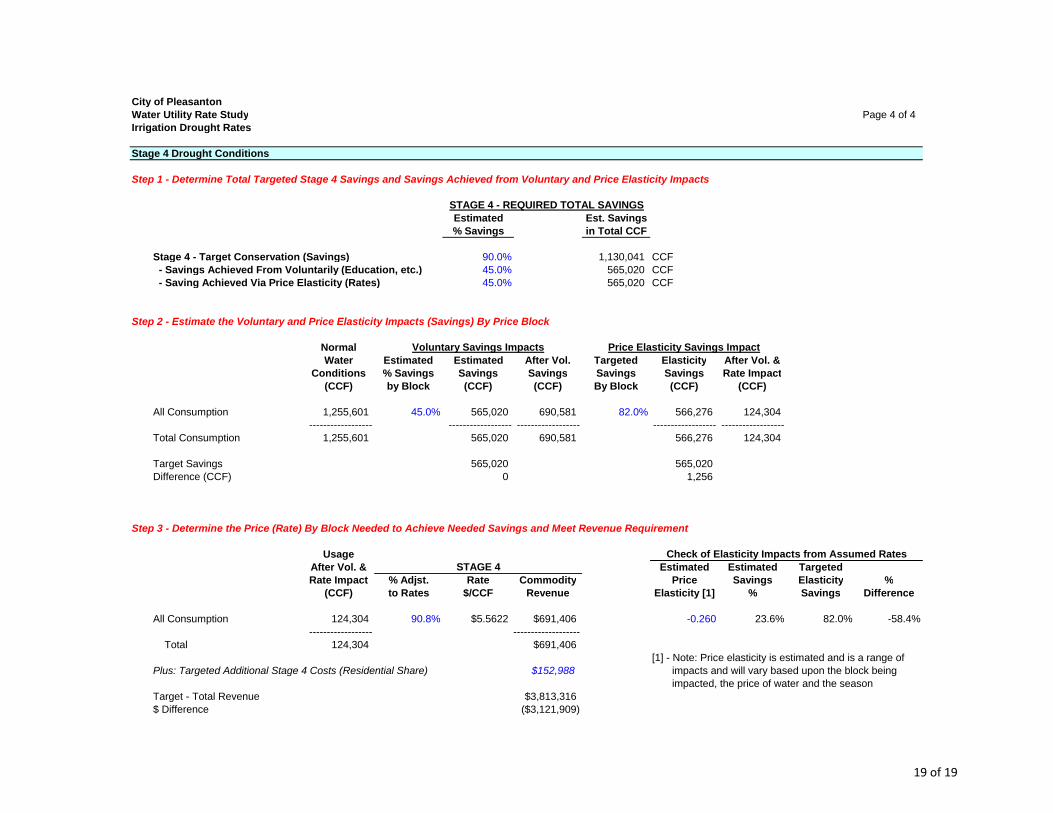
City of PleasantonWater Utility Rate Study Page 4 of 4Irrigation Drought Rates
Stage 4 Drought Conditions
Step 1 - Determine Total Targeted Stage 4 Savings and Savings Achieved from Voluntary and Price Elasticity Impacts
Estimated Est. Savings% Savings in Total CCF
Stage 4 - Target Conservation (Savings) 90.0% 1,130,041 CCF - Savings Achieved From Voluntarily (Education, etc.) 45.0% 565,020 CCF - Saving Achieved Via Price Elasticity (Rates) 45.0% 565,020 CCF
Step 2 - Estimate the Voluntary and Price Elasticity Impacts (Savings) By Price Block
NormalWater Estimated Estimated After Vol. Targeted Elasticity After Vol. &
Conditions % Savings Savings Savings Savings Savings Rate Impact(CCF) by Block (CCF) (CCF) By Block (CCF) (CCF)
All Consumption 1,255,601 45.0% 565,020 690,581 82.0% 566,276 124,304 ------------------ ------------------ ------------------ ------------------ ------------------
Total Consumption 1,255,601 565,020 690,581 566,276 124,304
Target Savings 565,020 565,020 Difference (CCF) 0 1,256
Step 3 - Determine the Price (Rate) By Block Needed to Achieve Needed Savings and Meet Revenue Requirement
UsageAfter Vol. & Estimated Estimated TargetedRate Impact % Adjst. Rate Commodity Price Savings Elasticity %
(CCF) to Rates $/CCF Revenue Elasticity [1] % Savings Difference
All Consumption 124,304 90.8% $5.5622 $691,406 -0.260 23.6% 82.0% -58.4% ------------------ -------------------
Total 124,304 $691,406[1] - Note: Price elasticity is estimated and is a range of
Plus: Targeted Additional Stage 4 Costs (Residential Share) $152,988 impacts and will vary based upon the block being impacted, the price of water and the season
Target - Total Revenue $3,813,316$ Difference ($3,121,909)
Voluntary Savings Impacts Price Elasticity Savings Impact
Check of Elasticity Impacts from Assumed RatesSTAGE 4
STAGE 4 - REQUIRED TOTAL SAVINGS
19 of 19