
cit 212 course title: system analysis and design - National ...
255
NATIONAL OPEN UNIVERSITY OF NIGERIA SCHOOL OF SCIENCE AND TECHNOLOGY COURSE CODE: CIT 212 COURSE TITLE: SYSTEM ANALYSIS AND DESIGN
-
Upload
khangminh22 -
Category
Documents
-
view
2 -
download
0
Transcript of cit 212 course title: system analysis and design - National ...

NATIONAL OPEN UNIVERSITY OF NIGERIA
SCHOOL OF SCIENCE AND TECHNOLOGY
COURSE CODE: CIT 212
COURSE TITLE: SYSTEM ANALYSIS AND DESIGN

CIT 212 COURSE GUIDE
iv
CIT 212 SYSTEM ANALYSIS AND DESIGN Course Adapter Afolorunso, A. A. National Open University of Nigeria Programme Leader Dr. Sunday Reju National Open University of Nigeria Course Co-ordinator Afolorunso, A. A. National Open University of Nigeria NATIONAL OPEN UNIVERSITY OF NIGERIA
COURSE GUIDE

CIT 212 COURSE GUIDE
v
National Open University of Nigeria Headquarters 14/16 Ahmadu Bello Way Victoria Island Lagos Abuja Office No. 5 Dar es Salaam Street Off Aminu Kano Crescent Wuse II, Abuja Nigeria e-mail: [email protected] URL: www.nou.edu.ng Published by National Open University of Nigeria Printed 2008 Reprinted 2009 ISBN: 978-058-305-X All Rights Reserved Printed by:

CIT 212 COURSE GUIDE
vi
CONTENTS PAGE Introduction...................................................................................... 1
What You Will Learn in this Course................................................ 1
Course Aims..................................................................................... 1 Course Objectives............................................................................ 1 Working through this Course........................................................... 2 Course Materials.............................................................................. 2 Study Units .................................................................................... 2 Textbooks and References ............................................................. 3 Assignment File............................................................................... 3 Presentation Schedule...................................................................... 4
Assessment...................................................................................... 4
Tutor Marked Assignment ............................................................. 4 Examination and Grading............................................................... 5 Course Marking Scheme................................................................ 5
Course Overview…………………………………………………. 6
How to Get the Best from this Course ........................................... 6
Facilitators/Tutors and Tutorials ..................................................... 8
Summary ......................................................................................... 9

Introduction CIT 212 – System Analysis and Design is a three [3] credit unit course of twelve units. It deals with analysis, design, development, implementation and maintenance of computer-based information systems. The earlier courses in this programme would have made you familiar with basic computer hardware and software concepts as well as with some of the programming languages. The programming experience acquired is complemented in this course with systems experience. This would enable you to cope with the number of comp[onents in a systems development approach and enmesh you correctly to result in a successful project. The three modules in this course is a run through of the basic stages of a system devt life cycle (SDLC), the stakeholders in system development and the role of each stakeholder. The aim of this course is to equip you with the basic skills of studying and understanding a system as well as lay the foundation of the basic knowledge and tools you need to become a proficient system analyst. By the end of the course, you should be able to confidently study, analyse and design a workable system. This Course Guide gives you a brief overview of the course content, course duration, and course materials. What You Will Learn in this Course The main purpose of this course is to provide the necessary tools analyzing and designing systems. It makes available the steps and tools that will enable you to make proper and accurate decision about systems whenever the need arises. This, we intend to achieve through the following: Course Aims i. Introduce the concepts associated with system development; ii. Provide necessary tools for analyzing, designing, developing and
implementing a system; iii. Expose the relationship between hardware and software when it
comes to developing a system; and iv. Highlight the roles played by various stakeholders in software
development life cycle (SDLC). Course Objectives Certain objectives have been set out to ensure that the course achieves its aims. Apart from the course objectives, every unit of this course has set objectives. In the course of the study, you will need to confirm, at the
CIT 212 SYSTEMS ANALYSIS AND DESIGN
ii
end of each unit, if you have met the objectives set at the beginning of each unit. By the end of this course you should be able to: i. describe the basic elements in system analysis and the role of
system analyst; ii. describe different reasons for developing a new systems projects iii. describe the various systeme analysis and design tools; iv. select a project out of a number of project requests; v. enumerate the role of quality assurance in various stages of a
system development life cycle. vi. explain the characteristics of good documentation and its various
types and the tools needed for documentation. vii. explain the various types and stages of system implementation
and conversion as well as system maintenance.
Working through this Course
In order to have a thorough understanding of the course units, you will need to read and understand the contents, practise the steps by designing a mini system for your department, and be committed to learning and implementing your knowledge. This course is designed to cover approximately sixteen weeks, and it will require your devoted attention. You should do the exercises in the Tutor-Marked Assignments and submit to your tutors. Course Materials These include: 1. Course Guide 2. Study Units 3. Recommended Texts 4. A file for your assignments and for records to monitor your
progress. Study Units There are twelve study units in this course: Module1 Unit 1 Overview of System Analysis and Design Unit 2 Project Selection Unit 3 Feasibility Study

CIT 212 SYSTEMS ANALYSIS AND DESIGN
iii
Unit 4 System Requirement Specifications and Analysis Module 2 Unit 1 Structures System Design Unit 2 Input Design and Control Unit 3 Output Design Unit 4 File and Database Design Module 3 Unit 1 System Development Unit 2 System Control and Quantity Assurance Unit 3 Documentation Unit 4 System Implementation Make use of the course materials, do the exercises to enhance your learning.
Textbooks and References James A. Senn (1986). Analysis & Design of Information System,
Mc-Graw Hill Book Co. Tom De Macro (1979). Structured Analysis and System Specification ,
Prentice Hall. Page Jones Meilir (1980). The Practical Guide to Structured Systems
Design, The Yourdon Press. Edward Yourdon (1979). Managing the Structured Techniques,
Yourdon: Yourdon Press, NCC – Guide to Structured Systems Analysis & Design Method.
Assignments File These are of two types: the self-assessment exercises and the Tutor-Marked Assignments. The self-assessment exercises will enable you monitor your performance by yourself, while the Tutor-Marked Assignment is a supervised assignment. The assignments take a certain percentage of your total score in this course. The Tutor-Marked Assignments will be assessed by your tutor within a specified period. The examination at the end of this course will aim at determining the level of mastery of the subject matter. This course includes twelve Tutor-Marked Assignments and each must be done and submitted accordingly. Your best scores however, will be recorded for you. Be
CIT 212 SYSTEMS ANALYSIS AND DESIGN
iv
sure to send these assignments to your tutor before the deadline to avoid loss of marks.
Presentation Schedule
The Presentation Schedule included in your course materials gives you the important dates for the completion of tutor marked assignments and attending tutorials. Remember, you are required to submit all your assignments by the due date. You should guard against lagging behind in your work.
Assessment
There are two aspects to the assessment of the course. First are the tutor marked assignments; second, is a written examination. In tackling the assignments, you are expected to apply information and knowledge acquired during this course. The assignments must be submitted to your tutor for formal assessment in accordance with the deadlines stated in the Assignment File. The work you submit to your tutor for assessment will count for 30% of your total course mark. At the end of the course, you will need to sit for a final three-hour examination. This will also count for 70% of your total course mark. Tutor-Marked Assignment There are twelve tutor-marked assignments in this course. You need to submit all the assignments. The total marks for the best four (4) assignments will be 30% of your total course mark. Assignment questions for the units in this course are contained in the Assignment File. You should be able to complete your assignments from the information and materials contained in your set textbooks, reading and study units. However, you may wish to use other references to broaden your viewpoint and provide a deeper understanding of the subject. When you have completed each assignment, send it together with form to your tutor. Make sure that each assignment reaches your tutor on or before the deadline given. If, however, you cannot complete your work on time, contact your tutor before the assignment is done to discuss the possibility of an extension.
CIT 212 SYSTEMS ANALYSIS AND DESIGN
v
Examination and Grading The final examination for the course will carry 70% percentage of the total marks available for this course. The examination will cover every aspect of the course, so you are advised to revise all your corrected assignments before the examination. This course endows you with the status of a teacher and that of a learner. This means that you teach yourself and that you learn, as your learning capabilities would allow. It also means that you are in a better position to determine and to ascertain the what, the how, and the when of your language learning. No teacher imposes any method of leaming on you. The course units are similarly designed with the introduction following the table of contents, then a set of objectives and then the dialogue and so on. The objectives guide you as you go through the units to ascertain your knowledge of the required terms and expressions.
Course Marking Scheme
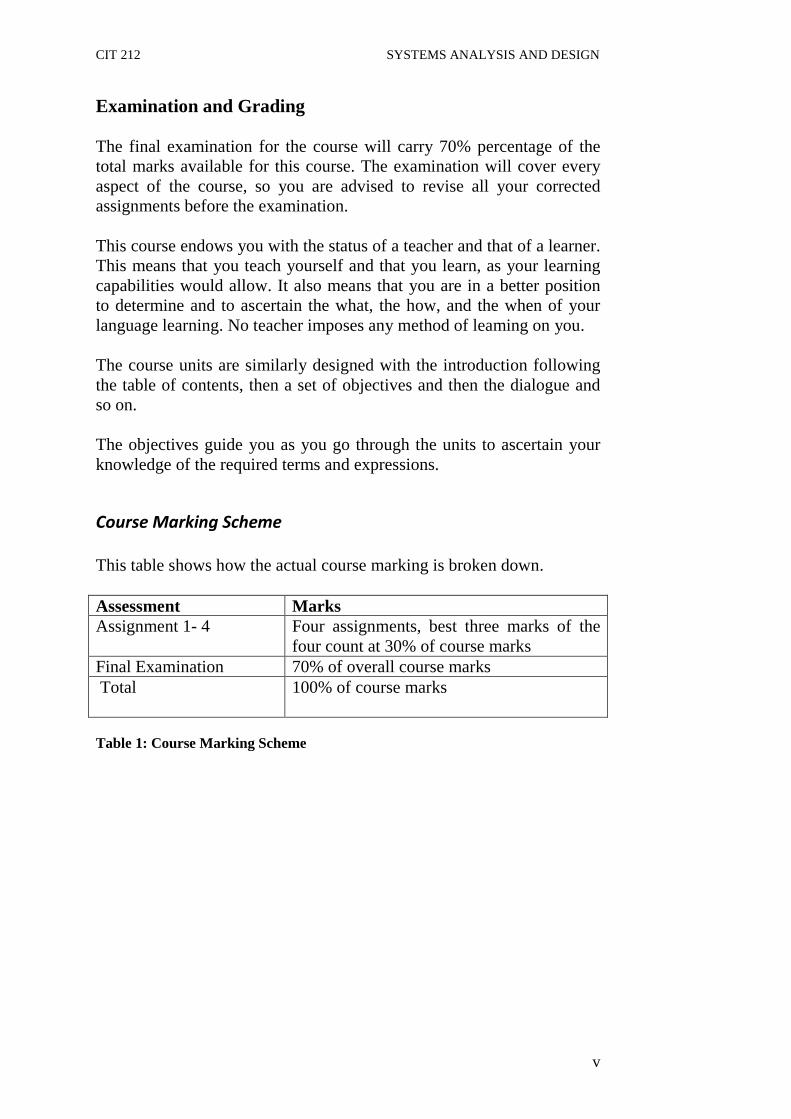
This table shows how the actual course marking is broken down. Assessment Marks Assignment 1- 4 Four assignments, best three marks of the
four count at 30% of course marks Final Examination 70% of overall course marks Total 100% of course marks
Table 1: Course Marking Scheme

CIT 212 SYSTEMS ANALYSIS AND DESIGN
vi
Course Overview Unit Title of Work Weeks
Activity Assessment (End of Unit)
Course Guide Week 1
Module 1
1 Overview of System Analysis and Design
Week 1 Assignment 1
2 Project Selection Week 2 Assignment 2
3 Feasibility Study Week 3 Assignment 3
4 System Requirement Specifications and Analysis
Week 4 - 5 Assignment 4
Module 2
1 Structures System Design Week 6 Assignment 5
2 Input Design and Control Week 7 Assignment 6
3 Output Design Week 8 Assignment 7
4 File and Database Design Week 8 - 9 Assignment 8
Module 3
1 System Development Week 10 Assignment 9
2 System Control and Quantity Assurance
Week 11 - 12 Assignment 10
3 Documentation Week 13 Assignment 11
4 System Implementation Week 14 - 15 Assignment12
Revision Week 16
Examination Week 17
Total 17 weeks
How to Get the Best from this Course
In distance learning the study units replace the university lecturer. This is one of the great advantages of distance learning; you can read and work through specially designed study materials at your own pace, and at a time and place that suit you best. Think of it as reading the lecture instead of listening to a lecturer. In the same way that a lecturer might set you some reading to do, the study units tell you when to read your set books or other material. Just as a lecturer might give you an in-class
CIT 212 SYSTEMS ANALYSIS AND DESIGN
vii
exercise, your study units provide exercises for you to do at appropriate points. Each of the study units follows a common format. The first item is an introduction to the subject matter of the unit and how a particular unit is integrated with the other units and the course as a whole. Next is a set of learning objectives. These objectives enable you know what you should be able to do by the time you have completed the unit. You should use these objectives to guide your study. When you have finished the units you must go back and check whether you have achieved the objectives. If you make a habit of doing this you will significantly improve your chances of passing the course. Remember that your tutor’s job is to assist you. When you need help, don’t hesitate to call and ask your tutor to provide it. 1. Read this Course Guide thoroughly. 2. Organize a study schedule. Refer to the ‘Course Overview’ for
more details. Note the time you are expected to spend on each unit and how the assignments relate to the units. Whatever method you chose to use, you should decide on it and write in your own dates for working on each unit.
3. Once you have created your own study schedule, do everything you can to stick to it. The major reason that students fail is that they lag behind in their course work.
4. Turn to Unit 1 and read the introduction and the objectives for the unit.
5. Assemble the study materials. Information about what you need for a unit is given in the ‘Overview’ at the beginning of each unit. You will almost always need both the study unit you are working on and one of your set of books on your desk at the same time.
6. Work through the unit. The content of the unit itself has been arranged to provide a sequence for you to follow. As you work through the unit you will be instructed to read sections from your set books or other articles. Use the unit to guide your reading.
7. Review the objectives for each study unit to confirm that you have achieved them. If you feel unsure about any of the objectives, review the study material or consult your tutor.
8. When you are confident that you have achieved a unit’s objectives, you can then start on the next unit. Proceed unit by

CIT 212 SYSTEMS ANALYSIS AND DESIGN
viii
unit through the course and try to pace your study so that you keep yourself on schedule.
9. When you have submitted an assignment to your tutor for marking, do not wait for its return before starting on the next unit. Keep to your schedule. When the assignment is returned, pay particular attention to your tutor’s comments, both on the tutor-marked assignment form and also written on the assignment. Consult your tutor as soon as possible if you have any questions or problems.
10. After completing the last unit, review the course and prepare yourself for the final examination. Check that you have achieved the unit objectives (listed at the beginning of each unit) and the course objectives (listed in this Course Guide).
Facilitators/Tutors and Tutorials
There are 15 hours of tutorials provided in support of this course. You will be notified of the dates, times and location of these tutorials, together with the name and phone number of your tutor, as soon as you are allocated a tutorial group.
Your tutor will mark and comment on your assignments, keep a close watch on your progress and on any difficulties you might encounter and provide assistance to you during the course. You must mail or submit your tutor-marked assignments to your tutor well before the due date (at least two working days are required). They will be marked by your tutor and returned to you as soon as possible. Do not hesitate to contact your tutor by telephone, or e-mail if you need help. The following might be circumstances in which you would find help necessary. Contact your tutor if: • you do not understand any part of the study units or the assigned
readings, • you have difficulty with the self-tests or exercises, • you have a question or problem with an assignment, with your
tutor’s comments on an assignment or with the grading of an assignment.
You should try your best to attend the tutorials. This is the only chance to have face to face contact with your tutor and to ask questions which are answered instantly. You can raise any problem encountered in the course of your study. To gain the maximum benefit from course

CIT 212 SYSTEMS ANALYSIS AND DESIGN
ix
tutorials, prepare a question list before attending them. You will learn a lot from participating in discussions actively. Summary System Analysis and Design introduces you to basic techniques and skills you need to analyse a system and then design, develop and implement a new one to meet the needs of users, etc. are intended to be acquired in this course. The content of the course material was planned and written to ensure that you acquire the proper knowledge and skills for the appropriate situations. Real-life situations have been created to enable you identify with and create some of your own. The essence is to get you to acquire the necessary knowledge and competence, and by equipping you with the necessary tools, we hope to have achieved that. I wish you success with the course and hope that you will find it both interesting and useful.

CIT 212 SYSTEMS ANALYSIS AND DESIGN
x
Course Code CIT 212 Course Title Systems Analysis and Design Course Adapter Afolorunso, A. A. National Open University of Nigeria Lagos. Programme Leader Dr. Sunday Reju National Open University of Nigeria Victoria Island, Lagos Course Co-ordinator Afolorunso, A. A. National Open University of Nigeria Victoria Island, Lagos NATIONAL OPEN UNIVERSITY OF NIGERIA

CIT 212 SYSTEMS ANALYSIS AND DESIGN
xi
National Open University of Nigeria Headquarters 14/16 Ahmadu Bello Way Victoria Island Lagos Abuja Office No. 5 Dar es Salaam Street Off Aminu Kano Crescent Wuse II, Abuja Nigeria e-mail: [email protected] URL: www.nou.edu.ng Published by: National Open University of Nigeria 2008 First Printed 2008 ISBN: 978-058-305-X All Rights Reserved
CIT 212 SYSTEMS ANALYSIS AND DESIGN
xii
CONTENTS PAGE Module 1 …………………………………………......... 1 Unit 1 Overview of System Analysis and Design……. 1 - 20 Unit 2 Project Selection ..........................................….. 21 - 37 Unit 3 Feasibility Study ………..…………………….. 38 - 58 Unit 4 System Requirement Specifications and
Analysis………….……………………………. 59 - 93 Module 2 ……………………………………………......... 94 Unit 1 Structures System Design …………..………… 94 - 106 Unit 2 Input Design and Control……………………… 107 - 125 Unit 3 Output Design………………………………….. 126 - 145 Unit 4 File and Database Design ……………………… 146 - 170 Module 3 ……………………………………………........ 171 Unit 1 System Development …………………..…… 171 – 188 Unit 2 System Control and Quantity Assurance…… 189 – 203 Unit 3 Documentation ………………………………... 204 – 216 Unit 4 System Implementation……………………….. 217 – 239
CIT 212 SYSTEMS ANALYSIS AND DESIGN
1
MODULE 1 Unit 1 Overview of System Analysis and Design Unit 2 Project Selection Unit 3 Feasibility Study Unit 4 System Requirement Specifications and Analysis UNIT 1 SYSTEM ANALYSIS CONTENTS 1.0 Introduction 2.0 Objectives 3.0 Main Content
3.1 What is a system? 3.1.1 Systems Study, Systems Analysis and Systems
Approach 3.1.2 Characteristics of a System 3.1.3 Elements of Systems Analysis 3.1.4 Types of Systems
3.2 System Development Life Cycle 3.2.1 Preliminary of System Requirements 3.2.2 Determination of System Requirements 3.2.3 Design of System 3.2.4 Development of software 3.2.5 Systems testing 3.2.6 Implementation, Evaluation and Maintenance 3.3 Software Crisis 3.3.1 From Programmers Point of View 3.3.2 From Users Point of View 3.4 Role of a System Analyst 3.4.1 Who is System Analyst? 3.4.2 What a System Analyst does? 3.4.3 Attributes of an Effective systems Analyst. 4.0 Conclusion 5.0 Summary 6.0 Tutor-Marked Assignment 7.0 References/Further Readings 1.0 INTRODUCTION This unit introduces you to the general concepts of “systems. Also in this unit you learn about the different types of systems and the stages in system development referred to as system development life cycle (SDLC).

CIT 212 SYSTEMS ANALYSIS AND DESIGN
2
2.0 OBJECTIVES After going through this unit, you will be able to: • define systems, systems study, systems analysis and systems
approach, • state the common characteristics in all systems, • describe the basic elements in systems analysis, • classify different types of systems, • explain what is system development and what is system
development life cycle, and • illustrate the role of systems analyst. 3.0 MAIN CONTENT Systems analysis and design refers to the process of examining a business situation with the intent of improving it through better procedures and methods. Systems development can generally be thought of as having two major components: Systems Analysts and Systems Design. Systems design is the process of planning a new system or replace or complement an existing system. But before this planning can be done, we must thoroughly understand the existing system and determine how computers can best be used to make its operation more effective. Systems analysis, then, is the process of gathering and interpreting facts, diagnosing problems and using the information to recommend improvement to the system. In brief, we can say that analysis specified what the system should do. Design states how to accomplish the objectives. 3.1 What is a System? The word “SYSTEM” covers a very broad spectrum of concepts. This is derived from the Greek word systema, which means an organised relationship among the functioning units or components. In our daily life, we come into contact with the transportation system, the communication system, the accounting system, the production system, the economic system and for over three decades, the computer system. Similarly, business systems are the means by which business organisations achieve their pre-determined goals. A business system combines policies, personnel, equipment and computer facilities to co-ordinate the activities of business organisation. Essentially, a business system represents an organised way of achieving the pre-determined objective of an organization.

CIT 212 SYSTEMS ANALYSIS AND DESIGN
3
There are various definitions of the word system, but most of them seem to have a common idea that suggests that a system is an orderly grouping of interdependent components linked together, according to a plan, to achieve a specific goal. The word component may refer to physical parts (engines, wheels of car), managerial steps (planning, organising, controlling) or a subsystem in a multi-level structure. The components may be simple or complex, basic or advanced. They may be a single computer with a keyboard, memory and printer or a series of intelligent terminals linked to a mainframe. In either case, each component is part of the total system and has to do its own share of work for the system to achieve the desired goal. 3.1.1 Systems Study, Systems Analysis and Systems Approach Systems study may be defined as “a study of the operations of a set of connected elements and of the inter-connections between these elements”. It shows clearly that one cannot ignore any part or element of a system without first finding out the effect that elements has on the operation of the system as a whole. We can understand this with the help of system analysis. There is a difference between “systems approach” and “systems analysis” also. The systems approach shows a set of procedure for solving a particular problem. It applies scientific methods to observe, clarify, identify and solve a problem with special care being taken to understand the inter-relatedness between elements and their system characteristics. However, systems analysis is a management technique which helps us in designing a new system or improving an existing system. 3.1.2 Characteristics of a System Based on the definition of a system, it is observed that following characteristics are present in all systems: a) Organisation Organization implies structure and order. It is the arrangement of components that helps to achieve objectives. In the design of a business system, for example, the hierarchical relationship starting with the president on top and leading downward to the blue-collar workers represents the organization structure. Likewise a computer system is designed around an input device, a central processing unit, an output device and one or more storage units. When these units are linked together, they work as a whole system for generating information.

CIT 212 SYSTEMS ANALYSIS AND DESIGN
4
b) Interaction Interaction refers to the procedure in which each component functions with other components of the system. In an organization, for example, purchasing must interact with production, advertising with the sales and payroll with personnel. In a computer system also, the central processing unit must interact with other units to solve a problem. In turn, the main memory holds program, and the data that the arithmetic unit uses for computation. The inter-relationship between these components enables the computer to perform. c) Interdependence Interdependence means that component of the organization or computer system depends on one another. They are coordinated and linked together in a planned way to achieve an objective. d) Integration Integration is concerned with how a system is tied together. It is more than sharing a physical part or locations. It means that parts of the system work together within the system even though each part performs a unique function. Successful integration will typically produce a better result as a whole rather than if each component works independently. e) Central Objective Central objective is the last characteristics of a system. Objectives may be real or stated. Although a stated objective may be the real objective. It is quite common that organization may set one objective and operate to achieve another. The important point is that users must be aware of the central objective well in advance. 3.1.3 Elements of Systems Analysis There are four basic elements in systems analysis. Brief description of each element has been given below: a) Output First of all, we must determine what the objectives or goals are, what do we intend to achieve, what is the purpose of our work; in other words, what is the main aim behind the system. Defining aim is very vital in system work. If we do not know where we want to go, we will not know when we have reached there. We shall be unnecessarily wasting our time and energy in the process. Once we know our aim, we can try

CIT 212 SYSTEMS ANALYSIS AND DESIGN
5
to achieve it in the best possible way. The user department has to define these objectives in terms of their needs. These become the outputs which the systems analyst keeps in mind. b) Inputs Once we know the output, we can easily determine what the inputs should be. Sometimes, it may happen that the required information may not be readily available in the proper form. This may be because the existing forms are not properly designed. Sometimes, it may not be possible to get the required information without the help of top management. If the information is vital to the system, we should make all possible efforts to make it available. Sometimes, it might be too costly to get the desired information. It would be better in such cases to prepare a cost-benefit analysis to convince the management of the necessity for acquiring the information. The essential elements of inputs are: i) Accuracy: If the data is not accurate, the outputs will be wrong. ii) Timeliness: If data is not obtained in time, the entire system falls
into arrears. iii) Proper format: The inputs must be available in proper format. iv) Economy: the data must be produced at the least cost. c) Files As the word implies files are used to store data. Most of the inputs necessary for the system may be historical data, or it may be possible that these are generated from within the system. These are stored in files either in terms of isolated facts or in large volumes. d) Processes Here we come to the details of how the inputs and files are converted into outputs. This involves the programs and the way in which data is processed through the computer. The processing involves a set of logical steps. These steps are required to be instructed to the computer and this is done by a series of instructions called “programs”. 3.1.4 Types of Systems Systems have been classified in different ways. Common classifications are:

CIT 212 SYSTEMS ANALYSIS AND DESIGN
6
i) Physical or abstract systems ii) Open or closed systems iii) Deterministic or probabilistic systems iv) Man-made information systems. (i) Physical or Abstract Systems Physical systems are tangible entities that may be static or dynamic in operation. Abstract systems are conceptual or non-physical entities which may be as straight forward as formulas of relationships among sets of variables or models – the abstract conceptualization of physical situations. (ii) Open or Closed System An open system continually interacts with its environments. It receives inputs from and delivers outputs to outside. An information system belongs to this category, since it must adapt to the changing demands of the user. In contrast, a closed system is isolated from environmental influences. In reality completely closed systems are rare.
(iii) Deterministic or Probabilistic Systems A deterministic system is one in which the occurrence of all events is perfectly predictable. If we get the description of the system state at a particular time, the next state can be easily predicted. An example of such a system is a numerically controlled machine tool. Probabilistic system is one in which the occurrence of events cannot be perfectly predicted. An example of such a system is a warehouse and its contents. (iv) Man-made Information Systems It is generally believed that information reduces uncertainty about a state or event. For example, information that the wind is calm reduces the uncertainty that a trip by boat will be enjoyable. An information system is the basis for interaction between the user and the analyst. It determines the nature of relationship among decision makers. In fact, it may be viewed as a decision centre for personnel at all levels. From this basis, an information system designed may be defined as a set of devices, procedures and operating systems designed around user-based criteria to produce information and communicate it to the user for planning, control and performance. Many practitioners fail to recognize
CIT 212 SYSTEMS ANALYSIS AND DESIGN
7
that a business has several information systems, each is designed for a specific purpose. The major information systems are:
● Formal information systems ● Informal information systems ● Computer-based information systems.
A Formal Information System is based on the organization represented by the organization chart. The chart is a map of positions and their authority relationships, indicated by boxes and connected by straight lines. It is concerned with the pattern of authority, communication and work flow.
An Informal Information System is an employee-based system designed to meet personnel and vocational needs and to help in the solution of work-related problems. It also funnels information upwards through indirect channels. In this way, it is considered to be a useful system because it works within the framework of the business and its stated policies. Third category of information system depends mainly on the computer for handling business applications. Systems analysis develops several different types of information systems to meet a variety of business needs. There is a class of systems known collectively as Computer-based Information Systems. As we have different types of transportation systems such as highways systems, railways systems and airline systems, computer-based information systems are of too many types. They are classified as: ● Transaction Processing Systems (TPS) ● Management Information Systems (MIS) ● Decision Support System (DSS) ● Office Automation Systems (OAS). The figure 1.1 shows the organization chart of computer-based information system (CBIS) and figure 1.2 shows the hierarchical view of CBIS.

CIT 212 SYSTEMS ANALYSIS AND DESIGN
8
Figure 1.1: CBIS in an Organizational Context
Figure 1.2: The Hierarchical View of CBIS
Transaction Processing Systems The most fundamental computer-based system in an organization pertains to the processing of business transactions. A transaction processing system can be defined as a computer-based system that captures, classifies, stores, maintains, updates and retrieves transaction data for record keeping and for input to other types of CBIS. Transaction Processing Systems are aimed at improving the routine business activities on which all organizations depend. A transaction is any event or activity that affects the whole organization. Placing orders, billing customers, hiring of employees and depending cheques are some of the common transactions. The types of transaction that occur vary from organization to organization. But it is true that all organization process transactions as a major part of their daily business activities. The most successful organizations
CIT 212 SYSTEMS ANALYSIS AND DESIGN
9
perform this work of transaction processing in a very systematic way. Transaction processing systems provide speed and accuracy and can be programmed to follow routines without any variance. Management Information System Data processing by computer has been extremely effective because of several reasons. The main reason being that huge amount of data relating to accounts and other transactions can be processed very quickly. Earlier most of the computer applications were concerned with record keeping and the automation of routine clerical processes. However, in recent years, increasing attention has been focussed on computer applications providing information for policy making, management planning and control purposes. MIS are more concerned with management function. MIS can be described as information system that can provide all levels of management with information essential to the running of smooth business. This information must be as relevant, timely, accurate, complete and concise as is economically feasible. Decision Support Systems It is an information system that offers the kind of information that may not be predictable, the kind that business professionals may need only once. These systems do not produce regularly scheduled management reports. Instead, they are designed to respond to a wide range of requests. It is true that all the decisions in an organization are not of a recurring nature. Decision support systems assist managers who must make decisions that are not highly structured, often called unstructured or semi-structured decisions. A decision is considered unstructured if there are no clear procedures for making the decision and if not all the factors to be considered in the decision can be readily identified in advance. Judgement of the manager plays a vital role in decision-making where the problem is not structured. The decision support system supports, but does not replace, judgement of manager. Office Automation Systems Office automation systems are among the newest and most rapidly expanding computer-based information systems. They are being developed with the hopes and expectations that they will increase the efficiency and productivity of office workers, typists, secretaries, administrative assistants, staff professionals, managers and the like. Many organizations have taken the first step toward automating their offices. Often this step involves the use of word processing equipment to facilitate the typing, storing, revising and printing of textual materials.

CIT 212 SYSTEMS ANALYSIS AND DESIGN
10
Another development is a computer-based communications system such as electronic mail which allows people to communicate in an electronic mode through computer terminals. An office automation system can be described as a multi-function, integrated computer-based system that allows many office activities to be performed in an electronic mode. Categories of different information systems with their characteristics have been described briefly in table 1.1: Table 1.1: Categories of Information Systems Category of Characteristics Information System
Transaction Processing System Management Information System Decision Support System Office Automation System
Substitutes computer-based processing for manual procedures. Deals with well structured routine processes. Includes record-keeping applications. Provides input to be used in the managerial decision process. Deals with supporting well structured decision situations. Typical information requirements can be anticipated. Provides information to managers who make judgements about particular situations. Supports decision makers in situations that are not well-structured. It is a multi-function, integrated computer-based system that allows many office activities to be performed in an electronic mode.
SELF-ASSESSMENT EXERCISE 1 i. What is the basic difference between ‘systems approach” and
“systems analysis”? ii. What are the four basic elements in systems analysis? iii. What is a Computer-based Information System? iv. When is a decision considered to be unstructured? 3.2 System Development Life Cycle (SDLC)
System development, a process consisting of the two major steps of systems analysis and design, starts when management or sometimes system development personnel feel that a new system or an

CIT 212 SYSTEMS ANALYSIS AND DESIGN
11
improvement in the existing system is required. The systems development life cycle is classically thought of as the set of activities that analysts, designers and users carry out to develop and implement an information system. The systems development life cycle consists of the following activities: ● Preliminary investigation ● Determination of system requirements ● Design of system ● Development of software ● Systems testing ● Implementation, evaluation and maintenance 3.2.1 Preliminary Investigation A request to take assistance from information systems can be made for many reasons, but in each case someone in the organization initiates the request. When the request is made, the first systems activity, the preliminary investigation begins. This activity has three parts: i) Request clarification ii) Feasibility study iii) Request approval Request Clarification Many requests from employees and users in the organizations are not clearly defined. Therefore, it becomes necessary that project request must be examined and clarified properly before considering systems investigation. Feasibility Study An important outcome of the preliminary investigation is the determination that the system requested is feasible. There are three aspects in the feasibility study portion of the preliminary investigation: (i) Technical Feasibility Can the work for the project be done with current equipment, existing software technology and available personnel? If new technology is needed, what is the likelihood that it can be developed?

CIT 212 SYSTEMS ANALYSIS AND DESIGN
12
(ii) Economic Feasibility Are there sufficient benefits in creating the systems to make the costs acceptable? Or, are the costs of not creating the system so great that it is advisable to undertake the project? (iii) Operational Feasibility Will the system be used if it is developed and implemented? Will there be resistance from users that will undermine the possible application benefits? The feasibility study is carried out by a small group of people who are familiar with information systems techniques, understand the parts of the business or organisation that will be involved or affected by the project, and are skilled in the systems analysis and design process. Request Approval It is not necessary that all requested projects are desirable or feasible. Some organizations receive so many project requests from employees that only a few of them can be pursued. However, those projects that are feasible and desirable should be put into a schedule. In some cases, development can start immediately, although usually systems staff members are busy on other ongoing projects. When such situation arises, management decides which projects are most urgent and schedules them accordingly. After a project request is approved, its costs, priority, completion time, and personnel requirements are estimated and used to determine where to add it to any existing project list. Later on, when the other projects have been completed, the proposed application development can be initiated. A further discussion on preliminary investigation is converted in section 2.5 of unit 2. 3.2.2 Determination of System Requirements At the heart of systems analysis is a detailed understanding of all important facets of the business that are under investigation. The key questions are: ● What is being done? ● How is it being done? ● How frequently does it occur? ● How great is the volume of transactions or decision?

CIT 212 SYSTEMS ANALYSIS AND DESIGN
13
● How well is the task being performed? ● Does problem exist? ● If a problem exists, how serious is it? What is the underlying
cause? To answer the above questions, systems analysis discusses with different category of persons to collect facts about the business process and their opinions of why things happen as they do and their view for changing the existing process. During analysis, data are collected on the available files, decision points and transactions handled by the present system. Some tools are used in analysis like data flow diagrams (DFD), interviews, on-site observations and questionnaires. Detail investigations also require the study of manuals and reports. Once the structured analysis is completed, analyst has a firm understanding of what is to be done? 3.2.3 Design System The design of an information system produces the details that clearly describe how a system will meet the requirements identified during systems analysis. Systems specialities often refer to this stage as logical design, in contrast to the process of developing program software, which is referred to as physical design. Systems analyst begins the design process by identifying reports and other outputs system will produce. Then the specific data on each are pinpointed. The systems design also described the data to be input, calculated or stored. Individual data items and calculation procedures are written in detail. Designers select file structures and storage devices, such as magnetic disk, magnetic tape or even paper files. Procedures they write tell how to process that data and produce the output. The documents containing the design specifications portray the design in many different ways – charts, tables, and special symbols. The detailed design information is passed on to the programming staff for the purpose of software development. Designers are responsible for providing programmers with complete and clearly outlined software specifications. 3.2.4 Development of Software Software developers may install purchased software or they may develop new, custom-designed programs. The choice depends on the cost of each option, the time available to develop software and the availability of programmers. Generally it has been observed that programmers are part of permanent professional staff in a big organization. In smaller organization, without programmers, outside

CIT 212 SYSTEMS ANALYSIS AND DESIGN
14
programming services may be hired or retained on a contractual basis. Programmers are also responsible for documenting the program, providing and explanation of how and why certain procedures are coded in specific ways. Documentation is essential to test the program and carry on maintenance once the application has been installed. 3.2.5 Systems Testing During systems testing, the system is used experimentally to ensure that the software does not fail. In other words, we can say that it will run according to its specifications and in the way users expect. Special test data are input for processing, and the results examined. A limited number of users may be allowed to use the system so that analyst can see whether they try to use it in unforeseen ways. It is desirable to discover any surprises before the organization implements the system and depends on it. 3.2.6 Implementation, Evaluation and Maintenance Implementation is the process of having systems personnel check out and put new equipment into use, train users, install the new application and construct any files of data needed to use it. This phrase is less creative than system design. Depending on the size of the organization that will be involved in using the application and the risk involved in its use, systems developers may choose to test the operation in only one area of the firm with only one or two persons. Sometimes, they will run both old and new system in parallel way to compare the results. In still other situations, system developers stop using the old system one day and start using the new one the next day. Evaluation of the system is performed to identify its strengths and weaknesses. The actual evaluation can occur along any of the following dimensions: (i) Operational Evaluation: Assessment of the manner in which the
system functions, including case of use, response time, overall reliability and level of utilization.
(ii) Organizational Impact: Identification and measurement of
benefits to the organization in such areas as financial concerns, operational efficiency and competitive impact.
(iii) User Manager Assessment: Evaluation of attitudes of senior and
user manager within the organization, as well as end-users.
CIT 212 SYSTEMS ANALYSIS AND DESIGN
15
(iv) Development Performance: Evaluation of the development process in accordance with such yardsticks as overall development time and effort, conformance to budgets and standards and other project management criteria.
Maintenance is necessary to eliminate errors in the working system during its working life and to tune the system to any variations in its working environment. Often small system deficiencies are found as a system is brought into operations and changes are made to remove them. System planners must always plan for resource availability to carry out these maintenance functions. The importance of maintenance is to continue to bring the new system to standards. SELF-ASSESSMENT EXERCISE 2 i. What are activities which complete the system development life
cycle? ii. In preliminary investigation three types of feasibilities are usually
studied. Name them. iii. What are the areas of operational evaluation? iv. Why is maintenance of a system necessary? 3.3 Software Crisis The translation of a familiarity with computer hardware and software into the development of useful commercial or business information systems is not a straight-forward or intuitive task. For the last several decades, tens of thousands of people, usually very intelligent and talented have been involved in the building of computer systems. It is now well-known that the rate at which the hardware has been more and more accessible and at lower and lower prices, has created a matching demand for development of software in a similar scale. But the traditional intuitive and ad-hoc approach fails miserably when the quantities of data involved in information systems exceeds say, 10 MB. This is a typical figure at which systems start crossing the barriers of relatively simple and begin to enter the domain of significant complexity. This has lead to the coining of the phrase “software crisis”, and the search for methods and techniques to be able to cope with the ever expanding demands for software. The present course, which is an attempt to teach the ingredients of a structured systems development methodology, and elsewhere in the programme there is a reference to the techniques of software engineering as well.

CIT 212 SYSTEMS ANALYSIS AND DESIGN
16
It is useful and desirable to have some feel for the kinds of problems which the programmer and the user face and collectively perceive as the software crisis. Software crisis can be broadly classified in the following major areas: 3.3.1 From Programmer’s Point of View The following types of problems may contribute in maximum cases to software crisis: ● Problem of compatibility ● Problem of portability ● Problem of documentation ● Problem in coordination of work of different people where a team
is initialling to develop software. ● Problems that arise during actual run time in the organization.
Some time the errors are not detected during sample run. ● Problem of piracy of software ● Customers normally expand their specifications after program
design and implementation has taken place. ● Problem of maintenance in proper manner. 3.3.2 From User’s Point of View There are many sources of problems that arise out of the user’s end. Some of these are as follows: ● How to choose software from total market availability. ● How to ensure which software is compatible with his hardware
specifications ● The customerised software generally does not meet his total
requirements ● Problem of virus ● Problem of software bugs, which comes to knowledge of
customer after considerable data entry. ● Certain software run only on specific operating system
environment ● The problem of compatibility for user may be because of
different size and density of floppy diskettes. ● Problem in learning all the facilities provided by the software
companies gives only selective information in manual. ● Certain software run and creates files which expand their used
memory spaces and create problem of disk management.

CIT 212 SYSTEMS ANALYSIS AND DESIGN
17
● Software crisis develops when system memory requirement of software is more than the existing requirements and/or availability.
● Problem of different versions of software (user as well as operating system).
● Security problem for protected data in software. 3.4 Role of a Systems Analyst 3.4.1 Who is a Systems Analyst? A systems analyst is a person who conducts a study, identifies activities and objectives and determines a procedure to achieve the objectives. Designing and implementing systems to suit organizational needs are the functions of the systems analyst. He plays a major role in seeing business benefits from computer technology. The analyst is a person with unique skills. He uses these skills to coordinate the efforts of different type of persons in an organization to achieve business goals. 3.4.2 What does a Systems Analyst do? A system analyst carries out the following job: (a) The first and perhaps most difficult task of systems analyst is
problem definition. Business problems are quite difficult to define. It is also true that problems cannot be solved until they are precisely and clearly defined.
(b) Initially a systems analyst does not know how to solve a specific
problem. He must consult with managers, users and other data processing professionals in defining problems and developing solutions. He uses various methods for data gathering to get the correct solution of a problem.
(c) Having gathered the data relating to a problem, the systems
analyst analyses them and thinks of plan to solve it. He may not come up personally with the best way of solving a problem but pulls together other people’s ideas and refines them until a workable solution is achieved.
(d) Systems analysts coordinate the process of developing solutions.
Since many problems have number of solutions, the systems analyst must evaluate the merit of such proposed solution before recommending one to the management.
CIT 212 SYSTEMS ANALYSIS AND DESIGN
18
(e) Systems analysts are often referred to as planners. A key part of the systems analyst’s job is to develop a plan to meet the management objectives.
(f) When the plan has been accepted, systems analyst is responsible
for designing it so that management’s goal could be achieved. Systems design is a time consuming, complex and precise task.
(g) Systems must be thoroughly tested. The systems analyst often
coordinates the testing procedures and helps in deciding whether or not the new system is meeting standards established in the planning phase.
3.4.3 Attributes of an Effective Systems Analyst Systems analyst must have the following attributes: (a) Knowledge of people Since a systems analyst works with others so closely, he or she must understand their needs and what motivates them to develop systems properly. (b) Knowledge of Business functions A systems analyst must know the environment in which he or she works. He must be aware of the peculiarities of management and the users at his installation and realize how they react to systems analyst. A working knowledge of accounting and marketing principles is a must since so many systems are built around these two areas. He must be familiar with his company’s product and services and management’s policies in areas concerning him. (c) Knowledge of Data processing principles Most systems today are computer-based. The systems analyst must be fully aware of the potential and limitations of computers. (d) Ability to communicate As a coordinator, a systems analyst must communicate properly with people of different levels within an organization. Systems analyst must listen carefully to what others say and integrate the thoughts of others into the systems development process.

CIT 212 SYSTEMS ANALYSIS AND DESIGN
19
(e) Flexibility Systems analysts must be flexible in their thinking since they often do not get their own way. Different factions in an organization have conflicting needs and most systems are the result of compromise. The analysts’ goal is to produce the system that will be the best for his organization. This requires an open mind and flexibility in his ideas. (f) An analytical mind It takes an unusual person to see through problems facing an organization and develop solutions that will work. Systems analysts often find themselves with more data than they can cope with. It requires an analytical mind to select pertinent data and concentrate on them in defining problems and forming solutions. (g) Well educated with sharp mind: Systems analysts are called upon to work with people at all levels virtually in every aspect of business. They must know how to work with all of them and gain their confidence. Analysts must have sharp mind to learn quickly how people do their jobs and develop ways for them to do it better. 4.0 CONCLUSION In this unit, you were taken through the general concept of ‘systems’ the types of systems, system development life cycle (SDLC) activities, software crisis and the role of a system analyst in the software/system development. As you learnt in this unit computer-based information systems are classified into four major types: Transaction Processing Systems, (TPS), Management Information Systems (MIS), Decision Support system (DSS), and Office Automation System (OAS). Also, you were taken through the various systems development life cycle (SDLC) activities and the stakeholders in system development. 5.0 SUMMARY Before going to study Systems Analysis and Systems Design, an initial overall idea should be formed by the learner about what is a system, what are the characteristics of a system, what is systems approach, what is systems analysis and what is systems design, what are the different types of a system, etc. This unit provides an overview of systems, the components and activities in the life cycle of a system development, what are the various sources which contribute a software crisis, and in
CIT 212 SYSTEMS ANALYSIS AND DESIGN
20
details a characteristics study of a system analyst’s attributes, its different jobs. After studying this unit, you might feel eager into go in details of systems analysis and design. 6.0 TUTOR MARKED ASSIGNMENT 1. What do you understand by software crisis? 2. Suppose a system memory requirement is more than the available
memory size. Will you call it a software problem although the crisis is with the hardware? Why?
3. Which is in your opinion the most difficult job of a systems analyst?
4. List three important attributes of a system analyst. 7.0 REFERENCES/FURTHER READINGS Analysis & design of information systems – James A Senn, Mc-Graw
Hill Book Co. (1986) Structured Analysis and Systems Specification – Tom De Marco,
Prentice Hall (1979) The Practical Guide to Structured system Design – Page Jones Mellir,
The Yourdon press (1980) Managing the Structured Techniques – Edward Yourdon, Yourdon,
Yourdon Press (1979)

CIT 212 SYSTEMS ANALYSIS AND DESIGN
21
UNIT 2 PROJECT SELECTION CONTENTS 1.0 Introduction 2.0 Objectives 3.0 Main Content
3.1 Why System Projects? 3.2 Sources of Project Requests 3.2.1 Requests from Department Managers
3.2.2 Requests from Senior Executives 3.2.3 Requests from Systems Analysts 3.2.4 Requests from Outside Groups
3.3 Managing Project Review and Selection 3.3.1 Steering Committee 3.3.2 Information Systems Committee 3.3.3 User Group Committee 3.3.4 The Project Request 3.4 Preliminary Investigation 3.4.1 Conducting the Investigation 3.4.2 Testing Project Feasibility 3.4.3 Handling Infeasible Projects 3.5 Problem Classification and Definitions 3.5.1 Defining a Problem 3.5.2 Evaluating the Problem 3.5.3 Sources of Problem/Opportunity 3.5.4 Problem Identification and Definition
4.0 Conclusion 5.0 Summary 6.0 Tutor-Marked Assignment 7.0 References/Further Readings 1.0 INTRODUCTION Systems analysts do not start working on any projects they desire. They receive a lot of requests from the management for starting different projects. When projects are formally requested, the systems analysts, under the management’s direction, conduct a preliminary investigation to analyse the reasons for the request and collect various facts to respond to the request in a systematic way. Some projects are feasible, while others may not be feasible for various reasons.
CIT 212 SYSTEMS ANALYSIS AND DESIGN
22
2.0 OBJECTIVES After going through this unit, you should be able to: ● describe different reasons for developing new systems projects ● state the different sources of project requests ● discuss how to select a project out of a number of project requests ● explain something about the preliminary investigation to see the
feasibility of a project ● discuss problem classification and definitions. 3.0 MAIN CONTENT 3.1 Why System Projects? Systems projects are initiated for different reasons. The most important reasons are: (a) Capability Business activities are influenced by an organization’s ability to process transactions quickly and efficiently. Information systems add capability in three ways: (i) Improved processing speed: The inherent speed with which
computers process data is one reason why organizations seek the development of systems project.
(ii) Increased volume: Provide capacity to process a greater amount
of activity, perhaps to take advantage of new business opportunities.
(iii) Faster retrieval of information: Locating and retrieving
information from storage. The ability in conducting complex searches.
(b) Control (i) Greater accuracy and consistency: Carrying out computing
steps, including arithmetic, correctly and consistency. (ii) Better security: Safeguarding sensitive and important data in a
form that is accessible only to authorised personnel.
CIT 212 SYSTEMS ANALYSIS AND DESIGN
23
(c) Communication (i) Enhanced communication: Speeding the flow of information
and messages between remote locations as well as within offices. This includes the transmission of documents within offices.
(ii) Integration of business areas: Coordinating business activities
taking place in separate areas of an organization, through capture and distribution of information.
(d) Cost (i) Monitor costs: Tracking the costs of labour, goods and overhead
is essential to determine whether a firm is performing in line with expectations – within budget.
(ii) Reduce costs: Using computing capability to process data at a
lower cost than possible with other methods, while maintaining accuracy and performance levels.
(e) Competitiveness (i) Lock in customers: Changing the relationship with and services
provided to customers in such a way that they will not think of changing suppliers
(ii) Lock out competitors: Reducing the chances of entering the
competitors in the same market because of good information systems being used in the organization.
(iii) Improve arrangements with suppliers: Changing the pricing,
service or delivery arrangements, or relationship between suppliers and the organization to benefit the firm.
(iv) New product development: Introducing new products with
characteristics that use or are influenced by information technology.
3.2 Sources of Project Requests There are mainly four primary sources of project requests. The requesters inside the organization are: Department Managers, Senior Executives and Systems Analysts. In addition, government agencies outside the organization may also ask for information systems projects.
CIT 212 SYSTEMS ANALYSIS AND DESIGN
24
3.2.1 Requests from Department Managers Frequently, department managers who deal with day-to-day business activities are looking for assistance within their departments. They are often not satisfied with the amount of time that the staff takes to complete the job. Sometimes, they feel that the staff members are involved in duplication of work also. In this case, the manager will discuss this problem with other administrators regarding their clerical as well as processing work and persuade higher authority to approve the development of a computer-based system for office administration.
3.2.2 Requests from Senior Executives Senior executives like presidents, vice-presidents usually have more information about the organization as compared to department managers. Since these executives manage the entire organization, so naturally they have broader responsibilities. Obviously, systems project requests submitted by them carry more weight and are generally broader in scope also.
3.2.3 Requests from Systems Analysts Sometimes systems analysts find areas where it is possible to develop projects. In such cases, they may prefer either writing systems proposal themselves or encouraging a manager to allow the writing of a proposal on their behalf. For instance, in an organization, an analyst sees that the library information systems takes more time in processing and is inefficient, may prepare a project proposal for a new library information system. By the direction of the analyst who is fully aware about the new technology that improves the existing library information system, the Librarians may initiate the development of information system to the higher authority for approval.
3.2.4 Requests from Outside Groups Developments outside the organization also lead to project requests. For example, government contractors are required to use special cost accounting system with government stipulated features. Generally, it has been observed that new demands from external groups bring about project requests, either for new systems or changes in current ones. Project requests originated from this source are also quite important. SELF-ASSESSMENT EXERCISE i. Name some important reasons for system projects. ii. What are the three ways by which Information systems and
capability are related with each other?

CIT 212 SYSTEMS ANALYSIS AND DESIGN
25
iii. Name some primary sources of project requests. iv. Discuss some causes due to which a Department Manager request
for development of a computer-based system for his office. v. How ‘communication’ is also to be considered to be a reason for
the initiation of system projects?
3.3 Managing Project Review and Selection It is true that a number of requests for systems development are generated in the organization. Someone in the organization must decide which requests to pursue and which to reject. The criteria to accept or reject a request can be decided in a number of ways. One of the suitable methods commonly in use is by committee. Mainly three committees formats are commonly used: (i) Steering Committee (ii) Information Systems Committee (iii) User-Group Committee
3.3.1 Steering Committee This is one of the most common methods of reviewing and selecting projects for development. Such a committee, consisting of key managers from various departments of the organization as well as members of information systems group, is responsible for supervising the review project proposals. This committee receives requests for proposal and evaluates them. The main responsibility of the committee is to take decision, which often requires more information than the proposal provides. It is, therefore, desired to have preliminary investigation to gather more details. The steering committee approach is generally favoured because systems projects are considered as business investments. Decisions are made on the basis of the cost of the project, its benefit to the organization and the feasibility of accomplishing the development within the limits of information systems technology.
3.3.2 Information Systems Committee In some organizations, the responsibility for reviewing project requests is entrusted to a committee of managers and analysts in the information systems department. Under this method, all a requests for service and development are submitted directly to a review commit within the information systems department. This committee approves or disapproves projects and sets priorities, indicating which projects are most important and should receive immediate attention. This method can be used when major equipment decisions are required or when long-

CIT 212 SYSTEMS ANALYSIS AND DESIGN
26
term development commitments are needed to undertake a project, the decision authority is shared with senior executives who decide finally whether a project should proceed or not.
3.3.3 User-Group Committee In some organizations, the responsibility for project decisions is entrusted to the users themselves. Individual department hire own analyst and designers who handle project selection and carry out development. Although the practice of having user committees both choose and development systems does take some of the burden from the systems development group, it can have disadvantages for the users. Some user groups may find themselves with defective or poorly designed systems that require additional time and effort to undo any damage caused by the misinformation that such systems could generate. Although user groups may find the decisions of steering committees and information systems committees disappointing at times, the success rate for users who undertake development job is not very encouraging.
3.3.4 The Project Request The project proposals submitted by the users or the analyst to the project selection committee is a critical element in launching the systems study. There is a general agreement that a project request form should contain the following: ● What is the problem? ● What are the details of the problem? ● How significant is the problem? ● What does user feel is the solution? ● How will the information systems help? ● Who else knows about this and could be contacted? The project selection committee is responsible to review the proposals carefully and finally selects those projects which are most beneficial to the organization. Therefore, a preliminary investigation is often requested to gather details which are asked in the project request forms.
3.4 Preliminary Investigation The first step in the system development life cycle is the preliminary investigation to determine the feasibility of the system. The purpose of the preliminary investigation is to evaluate project requests. It is not a design study nor does it include the collection of details to describe the business system in all respect. Rather, it is the collecting of information that helps committee members to evaluate the merits of the project and

CIT 212 SYSTEMS ANALYSIS AND DESIGN
27
make an informed judgement about the feasibility of the proposed project. Analysts working on the preliminary investigation should accomplish the following objectives: ● clarify and understand the project request. ● determine the size of the project. ● assess costs and benefits of alternative approaches ● determine the technical and operational feasibility of alternative
approaches. ● report the findings to management, with recommendations
outlining the acceptance or rejection of the proposal.
3.4.1 Conducting Investigation The data that the analysts collect during the preliminary investigation are gathered through three primary methods: reviewing organization documents, on-site observations and conducting interviews. Reviewing Organization Documents The analysts conducting the investigation first learn about the organization involved in, or affected by the project. For example, to review an inventory systems proposal means knowing first how the department works and who are the persons directly associated with inventory system. Analysts can get some details by examining organization charts and studying written operating procedures. The procedures clearly define various important steps involved in receiving, managing and dispensing stock. On-site observations Another important technique to collect data is on-site observation. In this method, the analysts observe the activities of the system directly. One purpose of on-site observation is to get as close as possible to the real system being studied. During on-site observation, the analysts can see the office environment, work load of the system and the users, methods of work and the facilities provided by the organization to the users. Conducting Interviews Written documents and the on-site observation technique tell the analysts how the system should operate, but they may not include details to allow a decision to be made about the merits of a systems proposal, nor do they present user views about current operations. Analysts use

CIT 212 SYSTEMS ANALYSIS AND DESIGN
28
interviews to learn these details. Interviews allow analysts to learn more about the nature of the project request and the reason for submitting it. Interview should provide details that further explain the project and show whether assistance is merited economically, operationally and technically. 3.4.2 Testing Project Feasibility Preliminary investigations examine project feasibility, the likelihood that the system will be useful to the organization. Three important tests of feasibility are studied and described below: ● operational feasibility ● technical feasibility ● economic feasibility Operational Feasibility Proposed projects are beneficial only if they can be turned into information systems that will meet the operating requirements of the organization. This test of feasibility asks if the system will work when it is developed and installed. Are there major barriers to implementation? Some of the important questions that are useful to test the operational feasibility of a project are given below: ● Is there sufficient support for the project from the management?
From users? If the resent system is well liked and used to the extent that persons will not be able to see reasons for a change, there may be resistance.
● Are current business methods acceptable to the users? If they are
not, users may welcome a change that will bring about a more operational and useful system.
● Have the users been involved in the planning and development of
the project? If they are involved at the earliest stage of project development, the chances of resistance can be possibly reduced.
● Will the proposed system cause harm? Will it produce poorer
result in any case or area? Will the performance of staff member fall down after implementation?
Issues that appear to be quite minor at the early stage can grow into major problem after implementation. Therefore, it is always advisable to consider operational aspects carefully.
CIT 212 SYSTEMS ANALYSIS AND DESIGN
29
Technical Feasibility There are a number of technical issues which are generally raised during the feasibility stage of the investigation. They are as follows: ● Does the necessary technology exist to do what is suggested (and
can it be acquired)? ● Does the proposed equipment have the technical capacity to hold
the data required to use the new system? ● Can the system be upgraded if developed? ● Are there technical guarantees of accuracy, reliability, ease of
access and data security? Economic Feasibility A system that can be developed technically and that will be used if installed, must still be profitable for the organization. Financial benefits must equal or exceed the costs. The analysts raise various financial and economic questions during the preliminary investigation to estimate the following: ● The cost to conduct a full systems investigation. ● The cost of hardware and software for the class of application
being considered. ● The benefits in the form of reduced costs or fewer costly errors. ● The cost if nothing changes (i.e. the proposed system is not
developed). To be judged feasible, a proposal for the specific project must pass all these tests. Otherwise, it is not considered as a feasible project. 3.4.3 Handling Infeasible Projects It is not necessary that all projects that are submitted for evaluation and review are acceptable. In general, requests that do not pass all the feasibility tests are not pursued further, unless they are modified and re-submitted as new proposals. In some cases, it so happens that a part of a newly developed system is unworkable and the selection committee may decide to combine the workable part of the project with another feasible proposal. In still other cases, preliminary investigations produce enough
CIT 212 SYSTEMS ANALYSIS AND DESIGN
30
new information to suggest that improvements in management and supervision, not the development of information systems, are the actual solutions to reported problems. 3.5 Problem Classifications and Definitions One of the most difficult tasks of system analysis is developing a clear, in-depth understanding of the project being investigated, without which it becomes impossible to specify the requirements for a new project with any accuracy. Several questions should be posed for this. Some of those may be: i) What is the problem? ii) How complex is it? iii) What are its likely causes? iv) Why is it important that the problem be solved? v) What are possible solutions to the problem? vi) What types of benefits can be expected once the problem is
solved? 3.5.1 Defining a Problem It takes considerable skill to determine the true cause of a systems problem. A systems analysts might begin to define the problem by determining if the problem can be classified according to one or more common types of systems problems. With a knowledge of the common types of problems, the analyst can diagnose a problem by examining its characteristics. The following example illustrates this finding. A manager comments, “We need a new budgeting system. Our current one seems to vary in quality from one month to the next. Besides, reports are often late, have errors, and contain misleading information. Why we must spend a fortune simply trying to keep the system up and going”. Careful analysis of this statement suggest a number of different problems, the problem of reliability (the system varies in quality from on month to the next), the problem of accuracy (there are too many errors), the problem of timeliness (reports are often late), the problem of validity (reports contain misleading information), and the problem of economy (the system is costly to keep up and going). Besides the problems of reliability, validity, accuracy, economy and timeliness, the problems of capacity and throughput are also common. Capacity problems occur when a component of a system is not large enough. Two people attempting to do the work of six illustrates a

CIT 212 SYSTEMS ANALYSIS AND DESIGN
31
capacity problem. Throughput problems deal with the efficiency of a components of a system. Six people doing the work of two represent a problem of throughput. Let’s consider each of these seven problems in more details. (a) The Problem of Reliability A system suffers from the problem of reliability when procedures work some but not all of the time, or when use of the same procedure leads to different results. Analysts must work continually to improve the reliability of systems. They strive to do this by running software tests to document that two runs of a computer program lead to identical results, by selecting equipment with low failure rates, and by monitoring processing schedules to ensure that results are on time. With some systems, reliability is essential. Imagine a payroll system that only works some of the time, or for that matter the railway or airlines reservation system. (b) The Problem of Validity Systems that produce invalid results are often most troublesome to users and systems managers. These systems might be highly reliable. They may work all of the time but they draw incorrect conclusions. A report might show that demand is increasing and that additional stock should be ordered for inventory. If these conclusions are wrong and demand is actually decreasing, then the stock is necessary and the whole operation becomes less efficient. Maintaining validity in computer software is a troublesome design problem. The objective in design is to produce a flawless product, one that will always reflect actual events. Validity problems result when the environment changes and these changes are not incorporated into the software. As an example, suppose a measure of consumer satisfaction must be placed in a computer program. If the measure is incorrect, the software will draw incorrect conclusions. (c) The Problem of Accuracy The problem of accuracy is similar to the problems of reliability and validity. A system is inaccurate when processing is error-prone. For example, assume that several people are required to post company expense transactions against departmental budgets numbers. If the posting procedure is complex and the number of transactions large. A fair number of errors may occur (for example, 1 percent of all transactions). Because of inaccuracy, the entire budget system might be viewed as unreliable and often invalid. However, these are systems of

CIT 212 SYSTEMS ANALYSIS AND DESIGN
32
real problem – namely, the problem of accuracy. Routine, transaction-based manual procedures are basically suitable for conversion to computer-based methods of processing because the computer is far more accurate than human beings, provided that software is written properly. (d) The Problem of Economy Besides improving processing accuracy, organizations seek to improve processing economy. A system suffers from the problem of economy when existing methods of transmitting, processing, and storing information are very costly. An organization might discover that the cost of handling the paperwork associated with each purchase order is N25. This cost is determined to be a problem of economy. After the installation of a new method of processing, the cost per purchase is substantially reduced – from N 25 per order to N 8 per order. Projects with clear-cut savings are likely to be considered suitable for conversion to computer-based methods of processing. Much like the problem of accuracy, the problem of economy is relatively easy to identify. The danger with the problem of economy is the naïve assumption-by both users and system managers-that the computer will eliminate the cause of the problem. Budget managers will say that this assumption is not always true; they will report that some project cost far more than they return. Thus, before moving ahead on a project assignment, the analyst must ask. “Is the project worth doing?” A partial answer to this question follows from determining the return on the investment expected from the project. If the return is low, more economical projects should be selected. (e) The Problem of Timeliness The problem of timeliness relates more to the transmission of information than to the processing or storing of it. A system suffers from the problem of timeliness if information is available but cannot be retrieved when and where it is needed. As people become more familiar with information systems and how they functions, they generally realize how much easier it is to process and store information than it is to retrieve it. Organization have committed extensive resources to handle the problem of timeliness in recent years. Fingertip access to information has been the desired objective. The findings to date show that only modest success has been achieved in improving this problem area. Only when retrieval problems are small and well-defined has the overall success rate improved.

CIT 212 SYSTEMS ANALYSIS AND DESIGN
33
(f) The Problem of Capacity The problem of capacity occurs when system component is not large enough. Capacity problems are specially common in organizations that experience peak periods of business. During peak-periods, inadequate processing capacity, transmission capacity, storage capacity, and the like may all exist. Capacity problems are also evident in rapidly growing organizations. With growth, smaller-capacity equipment soon becomes too small; smaller staff groups soon become overworked. In either case, some expansion is needed to handle the increasing volume of business. Many system problems are directed at solving capacity problems. Because it is often difficult to justify the purchase of new equipment or the hiring of new staff, people tend to put off such decisions until the very last moment. Consequently, when the systems group is contacted, the problem of capacity is easy to spot; the difficulty, however, lies in knowing how to handle the problem. For example, an analyst might be forced to suggest a short-term solution to the problem. This is done to gain time toward the formulation of a longer-term solution. For instance, an analyst might recommend: “Let’s hire five part-time employees to help us get through the peak period.” When a short-term approach fails, the analyst may be tempted to implement a quick-fix computer-based solution. Unfortunately, this solution carries with it the associated danger of creating an even more severe system problem in the near future. (g) The Problem of Throughput The problem of throughput may be viewed as the reverse of the problem of capacity. Throughput deals with the efficiency of a system. If system capacity is high and production low, a problem of throughput occurs. Consider the following example. Five programmers are assigned to a fairly straightforward programming assignment consisting of 10,000 lines of computer code. After thirty days of coding, the programming team is evaluated. It is discovered that they have completed 600 usable lines of code. Now, if each programmer worked eight hours a day, a total of 1200 hours would have been expended on the project. Calculated differently, the average production rate for each programmer would be 5 lines of code per hour (6000 lines divided by 1200 hours). These findings might lead the analyst to conclude that there is a problem of throughput. Similar to the problem of capacity, the problem of throughput may be much easier to spot than to treat. When repeated equipment breakdowns lead to low rates of production (and when the equipment has been

CIT 212 SYSTEMS ANALYSIS AND DESIGN
34
purchased and cannot be returned), an organization can badger the vendor into fixing the equipment but can achieve little more short of legal action. Likewise, when groups of people exhibit low rates of production, such as the five-person programming team, the problem becomes even more complicated. Badgering and threats may not work at all. Rather, a manager must be able to determine the root of the problem for any improvement in throughput. 3.5.2 Evaluating the Problem Suppose that a problem has been identified. The next step is problem evaluation, which consists of asking the following questions: Why is it important to solve the problem? What are possible solutions to the problem? What types of benefits can be expected once the problem is solved? There will be times when an analyst will recommend that no project be started to resolve a problem, as the next example demonstrates. Suppose that an analyst discovers that the real problem lies with the supervisor of an area. Because of mistakes made by this man, the throughput rate is 20 percent less than had been expected. However, suppose next that the supervisor is new to the job, is smart enough to realize where mistakes were made, and knows how not to repeat them in the future. Given this situation, the analyst would prepare a solutions table to list possible problem solutions and the expected benefits from each. Sometimes, the best solution is not at all evident. The analyst might recommend that further study is required to determine which of the possible solutions is best. In this section, we have spent considerably more time examining how an analyst identifies a problem compared with how the problem is evaluated. This uneven split also occurs in practice. As a general rule, analysts spend 75 percent of the project-definition phase of analysis defining the problem and 25 percent evaluating and documenting their findings. Note also that we have limited our discussion to seven major types of system problems. Because of this limitation, you might ask, “What about the problems of communication” of group conflict? Of management? Of system security? Are these problems as well? Are these types of problems also evaluated by the analyst?” Although our discussion has been restricted to more technical system problems, individual or group problems also occur in a system environment and require identification and evaluation. Still another limitation is the coverage given to determining the feasibility of taking some action to solve a problem. The concept of feasibility entails the joint questions of “Can something be done? and, if
CIT 212 SYSTEMS ANALYSIS AND DESIGN
35
so, “Should it be done given a particular set of circumstance?” For example, is it possible to climb a mountain when we have at our disposal only a forty-foot rope? If it is, a second question is well advised, namely, “Should we attempt such a climb given the size of our rope?” We will examine the question of project feasibility in more detail in the next unit of this block. A final limitation is the coverage given to tools which the analyst can use to identify and evaluate system problems. These tools are needed when the problems are not self-evident. Organizations face various types of problems during their course of operations and come across opportunities or situations which could be converted into profitable solutions. When ever there is an opportunity and/or problem in the existing system of operations or when a system is being developed for the first time, the organization considers designing a new system for information processing. 3.5.3 Sources of Problem/Opportunity Organizations usually face problems or have opportunity due to the following: ● a new product or plant or branch ● a new market or new process ● failure of an existing system ● inefficiency of an existing system ● structural error in the existing system, etc. Thus a thorough analysis of the situation to be required. Not only the above listed reasons but there exist some organization based reasons too. 3.5.4 Problem Identification and Definition For identify problems/opportunities, we scan the following: ● the performance of the system ● the information being supplied and its form ● the economy of processing ● the control of the information processing ● the efficiency of the existing system ● the security of data and software ● the security of the equipment and personnel, etc.

CIT 212 SYSTEMS ANALYSIS AND DESIGN
36
4.0 CONCLUSION This unit has adequately expose you to the different reasons for developing new systems projects, different sources project requests and most importantly how to select a project out of a number of project requests. As you have learnt in this unit, it is not all requests that lead to a project. A system analyst should be able to determine which request should translate into project based on the outcome of the various kinds of feasibility studies he will have to carry out. 5.0 SUMMARY In this unit, we have discussed first of all the various possible reasons for system projects. You know here what is the necessity of system projects, why system projects are initiated etc. then comes in section 3.2 the various sources who initiate system projects and the reasons for system projects from different angles (in the previous section a general discussion was made; here you study the reasons for system projects which vary form its source to source). Now suppose, project proposals are submitted. How to make a good review of all the projects and how to select or reject proposal? These are discussed in section 3.3. For this purpose some committees (mainly three) are there. Their roles/activities are also discussed. The very first step in the System Development Life Cycle is the preliminary investigation to analyse the feasibility of the system. There are different stages to determine the over feasibility, and you study this in section 3.4. In the section 3.5 various types of problems are pointed out and defined. 6.0 TUTOR-MARKED ASSIGNMENT 1. Name the three committee by which review of projects can be
done. 2. A project request form should contain information to some basic
questionnaire. List some of those. 3. (a) What are the objectives the analysts should accomplish
during preliminary investigation? (b) How the data are gathered? 4. Which are the causes for which organizations usually face
problem (or have opportunity?)

CIT 212 SYSTEMS ANALYSIS AND DESIGN
37
7.0 REFERENCES AND FURTHER READINGS Analysis & design of information systems – James A Senn, Mc-Graw
Hill Book Co. (1986) Structured Analysis and Systems Specification – Tom De Marco,
Prentice Hall (1979) The Practical Guide to Structured system Design – Page Jones Mellir,
The Yourdon press (1980) Managing the Structured Techniques – Edward Yourdon, Yourdon,
Yourdon Press (1979)
CIT 212 SYSTEMS ANALYSIS AND DESIGN
38
UNIT 3 FEASIBILITY STUDY CONTENTS 1.0 Introduction 2.0 Objectives 3.0 Main Content
3.1 Preliminary Study 3.2 Different Types of Feasibility 3.2.1 Technical Feasibility
3.2.2 Operational Feasibility 3.2.3 Economic Feasibility 3.2.4 Social Feasibility 3.2.5 Management Feasibility 3.2.6 Legal Feasibility 3.2.7 Time Feasibility
3.3 Investigative Study 3.3.1 Steps in Feasibility Analysis 3.3.2 Analysis Systems Data 3.3.3 Identifying Design requirements 3.4 Cost/Benefit Analysis 3.4.1 Tangible or Intangible Costs and Benefits 3.4.2 Direct or Indirect Costs and Benefits 3.4.3 Fixed or Variable Costs and Benefits 3.4.4 How to Define Cost-Benefits Analysis? 3.5 Fact Finding 3.5.1 Interviewing 3.5.2 Questionnaires 3.5.3 Observing the Current System 3.5.4 Determination of DFD 3.5.5 New System
4.0 Conclusion 5.0 Summary 6.0 Tutor-Marked Assignment 7.0 References/Further Readings 1.0 INTRODUCTION Once a preliminary area of application has been identified, it may then be subjected to a more rigorous examination in a feasibility study. In the previous unit, we discussed the steps that make up the initial investigation. By the initial investigation, a user has recognized the need, user requirements are determined and the problem has been defined. Apart from this, an initial investigation is launched to study the present system and verify the problem in a systematic way. The next step is to determine exactly what the proposed system is to do by

CIT 212 SYSTEMS ANALYSIS AND DESIGN
39
defining its expected performance. This kind of work will be carried out in the feasibility study. A feasibility study is carried out to select the best system that meets performance requirements. 2.0 OBJECTIVES After going through this unit, you should be able to: ● explains what is known as feasibility, and what feasibility study
is ● list and illustrate different types of feasibility ● discuss the purposes of feasibility study ● describe different steps in feasibility analysis ● explain in details cost/benefit analysis 3.0 MAIN CONTENT 3.1 Preliminary Study Feasibility is the determination of whether or not a project is worth doing. The process followed in making this determination is called a feasibility study. This study determines if a project can and should be taken. Once it has been determined that a project is feasible, the analyst can go ahead and prepare the project specification which finalizes project requirements. Generally, feasibility studies are undertaken within tight time constraints and normally culminate in a written and oral feasibility report. The contents and recommendations of such a study will be used as a sound basis for deciding whether to proceed, postpone or cancel the project. Thus, since the feasibility study may lead to the commitment of large resources, it becomes necessary that it should be conducted competently and that no fundamental errors of judgement are made. 3.2 Different Types of Feasibility In subsection 3.3.1 of unit 1, you have noted that an important outcome of the preliminary investigation is the determination of whether the system requested is feasible or not. That requires the need for a rigorous feasibility study. In the conduct of the feasibility study, the analyst will usually considered seven distinct, but inter-related types of feasibility. They are: (1) Technical feasibility (2) Operational feasibility

CIT 212 SYSTEMS ANALYSIS AND DESIGN
40
(3) Economic feasibility (4) Social feasibility (5) Management feasibility (6) Legal feasibility (7) Time feasibility
3.2.1 Technical Feasibility This is concerned with specifying equipment and software that will successfully satisfy the user requirement. The technical needs of the system may vary considerably, but might include: ● The facility to produce outputs in a given time. ● Response time under certain conditions. ● Ability to process a certain volume of transaction at a particular
speed. ● Facility to communicate data to distant location. In examining technical feasibility, configuration of the system is given more importance than the actual make of hardware. The configuration should give the complete picture about the system’s requirements: How many workstations are required, how these units are interconnected so that they could operate and communicate smoothly. What speeds of input and output should be achieved at particular quality of printing. This can be used as a basis for the tender document against which dealers and manufacturers can later make their equipment bids. Specific hardware and software products can then be evaluated keeping in view the logical needs. At the feasibility stage, it is desirable that two or three different configurations will be pursued that satisfy the key technical requirements but which represent different levels of ambition and cost. Investigation of these technical alternatives can be aided by approaching a range of suppliers for preliminary discussions. Out of all types of feasibility, technical feasibility generally is the most difficult to determine.
3.2.2 Operational Feasibility It is mainly related to human organizational and political aspects. The points to be considered are: ● what changes will be brought with the system? ● what organizational structures are disturbed? ● What new skills will be required? Do the existing staff members
have these skills? If not, can they be trained in due course of time?

CIT 212 SYSTEMS ANALYSIS AND DESIGN
41
Generally project will not be rejected simply because of operational infeasibility but such considerations are likely to critically affect the nature and scope of the eventual recommendations. This feasibility study is carried out by a small group of people who are familiar with information system techniques, who understand the parts of the business that are relevant to the project and are skilled in system analysis and design process. 3.2.3 Economic Feasibility Economic analysis is the most frequently used techniques for evaluating the effectiveness of a proposed system. More commonly known as cost/benefit analysis; the procedure is to determine the benefits and savings that are expected from a proposed system and compare them with costs. If benefits outweigh costs, a decision taken to design and implement the system. Otherwise, further justification or alternative in the proposed system will have to be made if it is to have a chance of being approved. This is an ongoing effort that improves in accuracy at each phase of the system life cycle. 3.2.4 Social Feasibility Social feasibility is a determination of whether a proposed project will be acceptable to the people or not. This determination typically examines the probability of the project being accepted by the group directly affected by the proposed system change. 3.2.5 Management Feasibility It is a determination of whether a proposed project will be acceptable to management. If management does not accept a project or gives a negligible support to it, the analyst will tend to view the project as a non-feasible one. 3.2.6 Legal Feasibility Legal feasibility is a determination of whether a proposed project infringes on known Acts, Statutes, as well as any pending legislation. Although in some instances the project might appear sound, on closer investigation it may be found to infringe on several legal areas.
CIT 212 SYSTEMS ANALYSIS AND DESIGN
42
3.2.7 Time Feasibility Time feasibility is a determination of whether a proposed project can be implemented fully within a stipulated time frame. If a project takes too much time it is likely to be rejected. 3.3 Investigative Study 3.3.1 Steps in Feasibility Analysis Eight steps are involved in the feasibility analysis. They are: (i) Form a project team and appoint a project leader. (ii) Prepare system flowcharts. (iii) Enumerate potential proposed systems. (iv) Define and identify characteristics of proposed system. (v) Determine and evaluate performance and cost effectiveness of
each proposed system. (vi) Weigh system performance and cost data. (vii) Select the best proposed system. (viii) Prepare and report final project directive to management. 3.3.2 Analysis Systems Data After gathering sufficient data to understand how the existing system operates, a proper study on data should be made for evaluating the current operations. Systems analysis is fact finding followed by analysis of the facts. Data analysis is also considered a pre-requisite condition for cost/benefit analysis. System investigation and data gathering lead to an assessment of current findings. Our interest is in determining how efficiently certain steps are performed to achieve intended goals and the cost of making improvements. The details of the system learned by the analyst during the investigation tell what is happening, how it is done, when it is carried out. These details help the analyst to evaluate the current system. System analyst tries to find out the efficiency of certain steps and how they contribute to achieve the intended result. After examining the facts collected about the system, the analyst develops a profile of each application area. The systems profile consists of details describing the operating characteristics of the system, such as frequency of occurrence, volume of work or error rate. The analysis of details collected during the investigation phase indicates that there are serious gaps in control and a bottleneck exists for processing claims.

CIT 212 SYSTEMS ANALYSIS AND DESIGN
43
3.3.3 Identifying Design Requirements From the analysis, design requirements are formulated. The requirements for the new system are those features that must be incorporated to produce the improvements. These requirements are determined by comparing current performance with the objectives for acceptable systems performance. The new system should have the following features: (a) Greater speed of processing (b) Effective procedure to eliminate errors (c) Better accuracy (d) Faster retrieval of information (e) Integration of data (f) Larger capacity of storing data with reduced cost. To achieve these features, several alternatives must be studied evaluated. One alternative may not satisfy all the features. The analyst then selects those that are feasible economically, technically and operationally. The approach may emphasize the introduction of computerized system, replacement of staff, changes in operating procedures, or a combination of several options. The analyst often suggests inputs, process, reporting and control procedures to help the management in decision-making techniques. The procedures may be manual or automated but these will be useful in meeting systems requirements. Management will decide whether to accept and use them. The role of a computer in a design revolves round its capabilities for calculation, storage and retrieval of data, summarizing, sorting, classification and communication of data. The analyst must decide about the speed and storage capacity of a computer required for achieving the design objectives. The analyst does this by matching the computer capabilities with an understanding of the systems requirements. A new system might, for example, call for the automation of invoice handling so that the invoice could be classified and processed as soon as it is received. All these steps can take place by entering the invoice number, purchase order number and vendor identification through a terminal. The computer in turn can be substituted for human processing. These processes could be faster and accounting balances can be incorporated into the procedure. The results of day’s work can be summarized and communicated to supervisors, whether they are sitting in the same building or miles away.

CIT 212 SYSTEMS ANALYSIS AND DESIGN
44
As you know that each approach has its benefits and drawbacks, depending on the particular business situation. Therefore, the analysts selects those alternatives most workable and studies them further and make decision which alternative should be selected/Cost and benefit analysis of each alternative further guides the section process. Therefore, the analyst needs to be familiar with the cost and benefit categories and the evaluation of various methods before a final selection can be made. This is discussed in the next section. SELF-ASSESSMENT EXERCISE i. What do you mean by feasibility? What is feasibility study? ii. What are the seven types of feasibility? iii. What are the technical feasibility concerned with? iv. Name some points which are to e considered in the operational
feasibility. 3.4 Cost/Benefit Analysis Since cost plays quite an important role in deciding the new system, it must be identified and estimated properly. Costs vary by type and consist of various distinct elements. Benefits are also of different type and can be grouped on the basis of advantages provided to the management. The benefits of a project include four types: (i) cost-savings benefits (ii) Cost-avoidance benefits (iii) Improved-service-level benefits (iv) Improved-information benefits. Cost-savings benefits lead to reductions in administrative and operational costs. A reduction in the size of the clerical staff in future to handle an administrative activity is an example of a cost-saving benefit. Cost-avoidance benefits are those which eliminate future administrative and operational costs. No need to hire additional staff in future to handle an administrative activity is an example of a cost-avoidance benefit. Improved-service-level benefits are those where the performance of a system is improved by a new computer-based method. Registering a student in fifteen minutes rather than an hour is an example of a cost-avoidance benefit. Improved-information benefits are where computer-based methods lead to better information for decision-making. For example, a system that
CIT 212 SYSTEMS ANALYSIS AND DESIGN
45
reports the most-improved fifty customers, as measured by an increase in sales is an improved-information. This information makes it easier to provide better service to major customers. Categories of Costs and Benefits The costs associated with the system are expenses, outlays or losses arising from developing and using a system. But the benefits are the advantages received from installing and using this system. Costs and benefits can be classified as follows: (a) Tangible or intangible (b) Fixed or variable (c) Direct or indirect 3.4.1 Tangible or Intangible Costs and Benefits Tangibility refers to the ease with which costs or benefits can be measured. An outlay of cash for any specific item or activity is referred to as a tangible cost. These costs are known and can be estimated quite accurately. Costs that are known to exist but their financial value cannot be exactly measured are referred to as intangible costs. The estimate is only an approximation. It is exact intangible costs. For example, employee movable problems because of installing new system is an intangible cost. How much moral of an employee has been affected cannot be exactly measured in terms of financial values. Benefits are often more difficult to specify exactly than costs. For example, suppliers can easily quote the cost of purchasing a terminal but it is difficult for them to tell specific benefits or financial advantages for using it in a system. Tangible benefits such as completing jobs in fewer hours or producing error free reports are quantifiable. Intangible benefits such as more satisfied customers or an improved corporate image because of using new system are not easily quantified. Both tangible and intangible costs and benefits should be taken into consideration in the evaluation process. If the project is evaluated on a purely intangible basis, benefits exceed costs by a substantial margin, then we will call such project as cost effective. On the other hand, if intangible costs and benefits are included, the total costs (tangible + intangible) exceed the benefits which makes the project an undesirable investment. Hence, it is desirable that systems projects should be evaluated on the basis of intangible benefits alone.

CIT 212 SYSTEMS ANALYSIS AND DESIGN
46
3.4.2 Direct or Indirect Costs and Benefits Direct costs are those which are directly associated with a system. They are applied directly to the operator. For example, the purchase of floppy for N400 - is a direct cost because we can associate the floppy box with money spent. Direct benefits also can be specifically attributable to a given project. For example, a new system that can process 30 per cent more transactions per day is a direct benefit. Indirect costs are not directly associated with a specific activity in the system. They are often referred to as overhead expenses. For example, cost of space to install a system, maintenance of computer centre, heat, light and air-conditioning are all tangible costs, but is difficult to calculate the proportion of each attributable to a specific activity such as a report. Indirect benefits are realized as a by-product of another system. For example, a system that tracks sales calls on customers provides and indirect marketing benefit by giving additional information about competition. In this case, competition information becomes an indirect benefit although its work in terms of money cannot be exactly measured. 3.4.3 Fixed or Variable Costs and Benefits Some costs and benefits remain constant, regardless of how a system is used. Fixed costs are considered as sunk costs. Once encountered, they will not recur. For example, the purchase of equipment for a computer centre is called as fixed cost as it remains constant whether in equipment is being used extensively or not. Similarly, the insurance, purchase of software etc. In contrast, variable costs are incurred on a regular basis. They are generally proportional to work volume and continue as long as the system is in operation. For example, the cost of computer forms vary in proportion to the amount of processing or the length of the reports desired. Fixed benefits also remain constant. By using a new system, if 20 percent of staff members are reduced, we can call it affixed benefit. The benefit of personnel saving may occur every month. Variable benefits, on the other hand, are realized on a regular basis. For example, the library information system that saves two minutes in providing information about a particular book whether it is issued or not, to the borrower compared with the manual system. The amount of time saved varies with the information given to the number of borrowers.
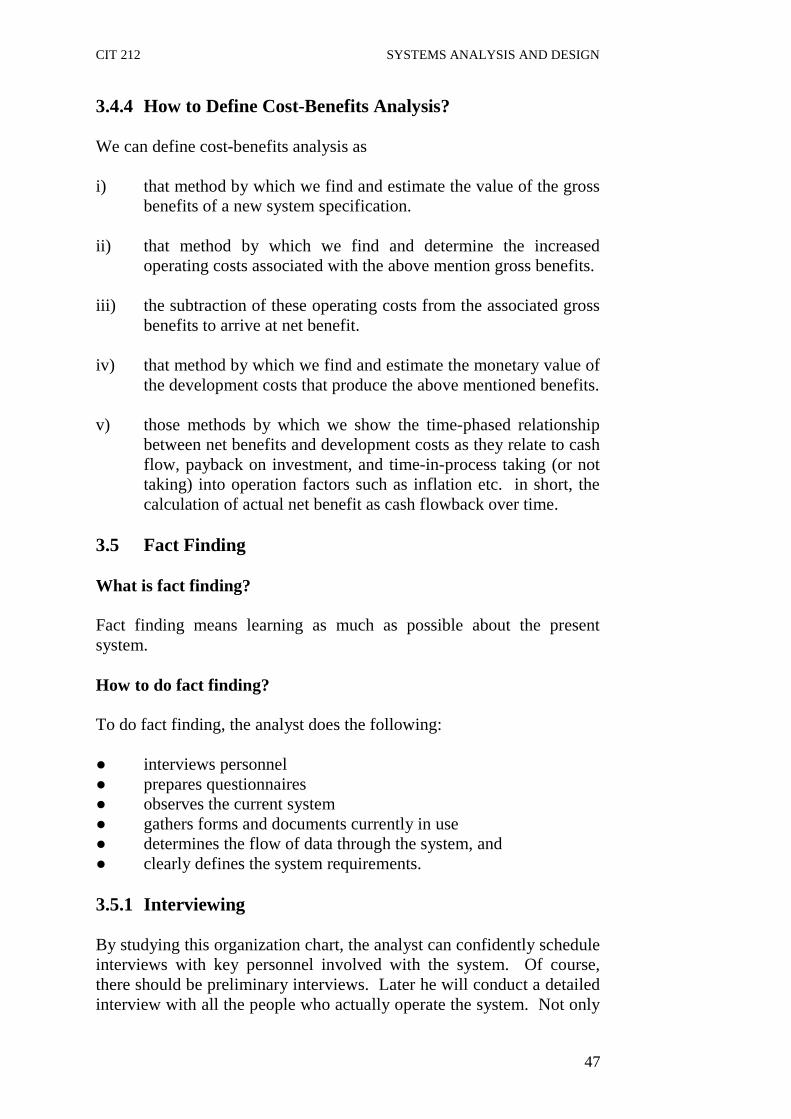
CIT 212 SYSTEMS ANALYSIS AND DESIGN
47
3.4.4 How to Define Cost-Benefits Analysis? We can define cost-benefits analysis as i) that method by which we find and estimate the value of the gross
benefits of a new system specification. ii) that method by which we find and determine the increased
operating costs associated with the above mention gross benefits. iii) the subtraction of these operating costs from the associated gross
benefits to arrive at net benefit. iv) that method by which we find and estimate the monetary value of
the development costs that produce the above mentioned benefits. v) those methods by which we show the time-phased relationship
between net benefits and development costs as they relate to cash flow, payback on investment, and time-in-process taking (or not taking) into operation factors such as inflation etc. in short, the calculation of actual net benefit as cash flowback over time.
3.5 Fact Finding What is fact finding? Fact finding means learning as much as possible about the present system. How to do fact finding? To do fact finding, the analyst does the following: ● interviews personnel ● prepares questionnaires ● observes the current system ● gathers forms and documents currently in use ● determines the flow of data through the system, and ● clearly defines the system requirements. 3.5.1 Interviewing By studying this organization chart, the analyst can confidently schedule interviews with key personnel involved with the system. Of course, there should be preliminary interviews. Later he will conduct a detailed interview with all the people who actually operate the system. Not only

CIT 212 SYSTEMS ANALYSIS AND DESIGN
48
will these people use the newly developed system, but they also may be the ones most afraid of change, especially if they felt the computer might replace them. Like an investigative reporter trying to discover the who, what, when, why and how of a story, the analyst should conduct the interview in such a way that people provide honest descriptions of their jobs. The following questions can help accomplish this goal. ● Who is involved with what you do? ● What do you do? ● Where do you do it? ● When do you do it? ● Why do you do it the way you do? ● How do you do it? ● Do you have suggestions for change? Interviews help gather vital facts about existing problems, such as lack of quality control or sufficient security, but they also allow the analyst to involve people in change, easing them into it. After all, it is the users’ system, not the analyst’s 3.5.2 Questionnaires Questionnaires economically gather data from both large and small groups of people. Properly constructed, they do not take long to complete and statistical results can be quickly tabulated. Development of a questionnaire requires in depth planning, and usually more than one draft is necessary. You may also have occasion to respond to questionnaires, sometimes in newspapers or sometimes from marketing personnel, who do door surveys. Questionnaire design is crucial. Questions should be short, easy to understand, unbiased, non-threatening, and specific. To make sure questions will stimulate needed information, the analysts can test them with one or two outsiders before widespread distribution. Prepaid return envelopes accompanying questionnaires sent to outside help assure prompt response. The analyst should send questionnaires to everyone involved with the system. A questionnaire works particularly well when the analyst must gather data from a larger number of people, when the analyst must ask everyone the same questions, or when facts must be collected from people, such as suppliers, who do not work for the organization.

CIT 212 SYSTEMS ANALYSIS AND DESIGN
49
Questions can follow four formats i) Multiple choice This gives respondents a specific set of potential answers. The format is ideal for computing tabulating. ii) Open ended Respondents must answer the question in their own words. Space is provided under each question for the response. iii) Rating This is similar to multiple choices except that respondents must rate their satisfaction. iv) Rank Rank requires respondents to prioritise their responses from high to low or on a percentage basis. Aware that most people do not spend a lot of time responding to questionnaire, most analysts decide to mix question formats, including follow-up questions, within the original questionnaire to permit elaboration of certain responses. By so organizing a questionnaire, the respondents have an opportunity to express their opinions freely, and yet answer quickly through the use of multi-choice, rating, and ranking questions. When all the questionnaires are returned, the data can be tabulated. If the results of a questionnaire survey are incomplete or confusing, the analyst may want to contact selected outsiders by telephone or in person. This requires tact, of course, and an understanding that the analyst’s own pressing need may not concern outsiders in the least. 3.5.3 Observing the Current System The analyst may want to observe the existing system personally by following transaction, such as in invoices, through it. Direct observation allows the analyst to verify his or her understanding of the system. Instead of getting second-hand impressions about a specific task, the analyst can experience the actual process. However, he or she must remain outside the flow as an observer, so as not to introduce biases or changes in actual procedures. Observing a system requires caution. When people know they are being observed, they usually behave differently, working more efficiently and at higher speeds to impress the analyst.
CIT 212 SYSTEMS ANALYSIS AND DESIGN
50
In some instances, the analyst may find it useful to visit another organization with a computerized system similar to the one under study. Finding a comparable installation may pose a problem, however. Some competitive organizations may not want to share their experiences, others may be too large, or too small for accurate comparisons, and still others may be unwilling to waste employees’ time demonstrating their system. Whenever visiting another organization, an analyst should follow the rules of etiquette: make an appointment, research the organization beforehand, know what he or she wants to see, and write a follow-up thank you letter. Hardware and software vendors can also supply valuable information. Computer sales representatives will gladly share their experiences with potential clients, and software firms will send brochures describing their programs. Although very useful information from such sources should be reviewed carefully because vendors are more interested in promoting their products than in solving your problems. Buying a product from a new business, such as the explosive software industry poses unusual problems. Customers cannot evaluate decades of performance history by the company, and not enjoying the benefits of an objective “customer report” on new products, they often feel at the mercy of fast-talking sales people. Therefore, it is important for people in the market for software to ask some really tough but relevant questions. Any reputable supplier should be able to answer the following 15 questions without back-pedalling. i) Range of Products Can you offer us a complete range of software system designed to work together? Or will we have to piece together a patchwork of systems to fully computerize our organization? ii) Decision Support Systems Are your systems just record keepers, or can they really help us make decision? Can we pull together information from any of our integrated systems in the desired form? iii) In-House Development Can you provide business software for both mainframe and microcomputers? Do you develop this software yourself or do you simply market it for another company?
CIT 212 SYSTEMS ANALYSIS AND DESIGN
51
iv) Online Are your systems truly online? How many of your systems are online? How secure are they? v) Debugging and Testing Will my company have to be the one that discovers the bugs in your brand new system? Just how long have your systems actually been used, and how have they been tested? vi) Updates Will you update your systems as technology advances and regulations change? What are some of your most recent update? Will you keep us current on regulatory change? vii) Flexibility/Adaptability Are your systems really adaptable to our unique needs? Or will we have to change or add to them ourselves to get the features we want? viii) History/Performance How long have you been in business? What are your revenues? What is your record? Where will your company be in five years from now? Can you show me an annual report? ix) Other Customers How many systems has your company installed? How many of these were installed in the past six months? How many of your earlier customers are still using and liking your systems? x) Security Are your systems secured? Do you provide password type protection and to how many levels? What other type of security provisions does your system have? xi) Networking Can you link our executives’ personal computers directly to the mainframe, so they can get their own information? Is that software available right now?

CIT 212 SYSTEMS ANALYSIS AND DESIGN
52
xii) Training Support How will you make sure our own people thoroughly understand your system? Do you have educational centres near us or will we have to travel all the way across the country to find one? Will you be there to help during installation and after? xiii) In-House Specialists How many of your people specialize in software for my industry? How many accountants work for you? Human resource specialists? Manufacturing experts? xiv) Special Features Do your systems have built-in features that make them easier to use? What happens if someone needs help figuring out a feature? Do you have online documentation that is easy to understand? xv) Upgrading As my business changes will your system be flexible enough to change with it? Or will we have to pay a lot to revamp it? Or even regenerate it? 3.5.4 Determination of DFD Armed with interview results, tabulated questionnaires, and experience through personal observations, the analyst is ready to describe the current system in narrative form, with a data-flow diagram (DFD), or with a system flowchart. Since all organizations have an account payable (AP) system let us begin with such an example using a context DFD. A context DFD defines the system under study in a general form, showing:- Inputs to AP: Packing slips, invoices, checking account balances, payment notifications. Output from AP: reports to management, cheque to suppliers.
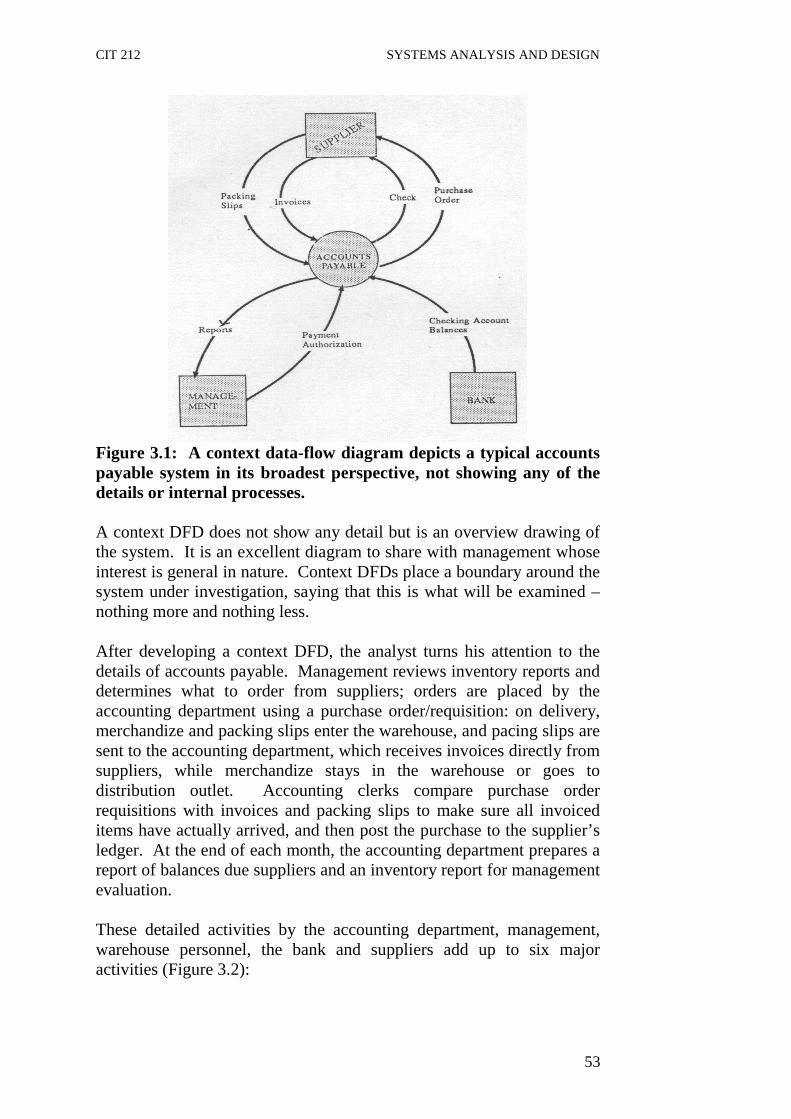
CIT 212 SYSTEMS ANALYSIS AND DESIGN
53
Figure 3.1: A context data-flow diagram depicts a typical accounts payable system in its broadest perspective, not showing any of the details or internal processes. A context DFD does not show any detail but is an overview drawing of the system. It is an excellent diagram to share with management whose interest is general in nature. Context DFDs place a boundary around the system under investigation, saying that this is what will be examined – nothing more and nothing less. After developing a context DFD, the analyst turns his attention to the details of accounts payable. Management reviews inventory reports and determines what to order from suppliers; orders are placed by the accounting department using a purchase order/requisition: on delivery, merchandize and packing slips enter the warehouse, and pacing slips are sent to the accounting department, which receives invoices directly from suppliers, while merchandize stays in the warehouse or goes to distribution outlet. Accounting clerks compare purchase order requisitions with invoices and packing slips to make sure all invoiced items have actually arrived, and then post the purchase to the supplier’s ledger. At the end of each month, the accounting department prepares a report of balances due suppliers and an inventory report for management evaluation. These detailed activities by the accounting department, management, warehouse personnel, the bank and suppliers add up to six major activities (Figure 3.2):
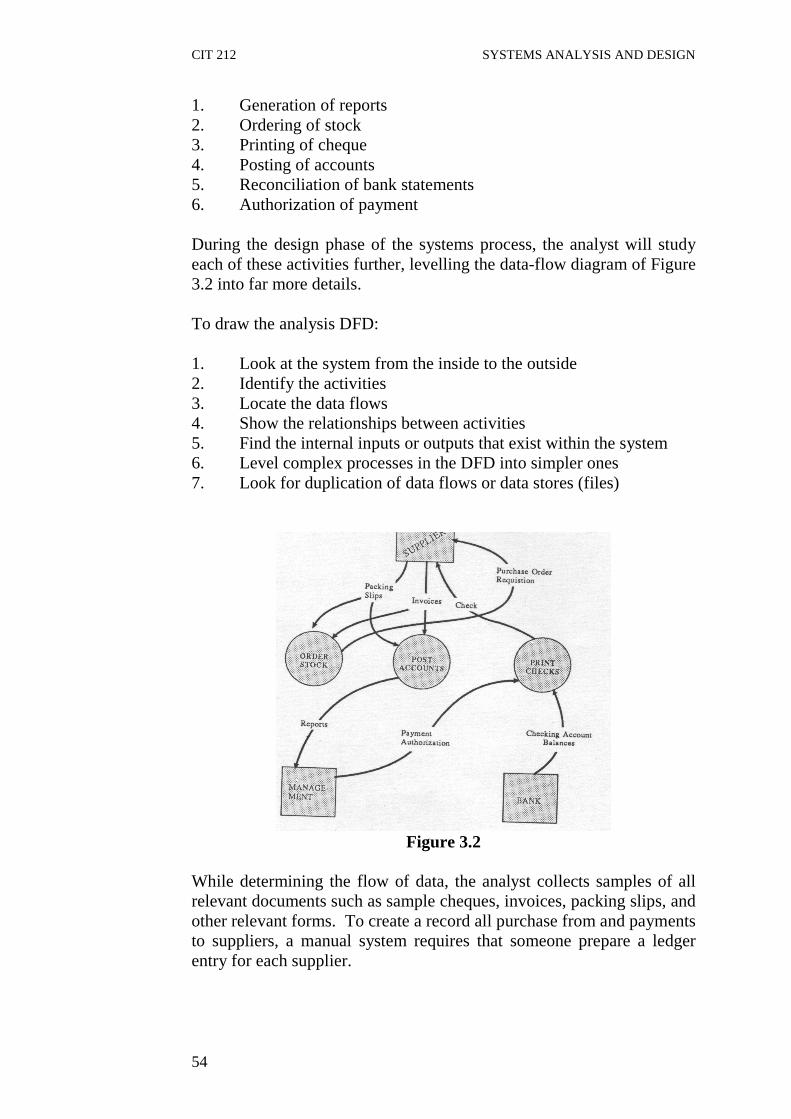
CIT 212 SYSTEMS ANALYSIS AND DESIGN
54
1. Generation of reports 2. Ordering of stock 3. Printing of cheque 4. Posting of accounts 5. Reconciliation of bank statements 6. Authorization of payment During the design phase of the systems process, the analyst will study each of these activities further, levelling the data-flow diagram of Figure 3.2 into far more details. To draw the analysis DFD: 1. Look at the system from the inside to the outside 2. Identify the activities 3. Locate the data flows 4. Show the relationships between activities 5. Find the internal inputs or outputs that exist within the system 6. Level complex processes in the DFD into simpler ones 7. Look for duplication of data flows or data stores (files)
Figure 3.2
While determining the flow of data, the analyst collects samples of all relevant documents such as sample cheques, invoices, packing slips, and other relevant forms. To create a record all purchase from and payments to suppliers, a manual system requires that someone prepare a ledger entry for each supplier.

CIT 212 SYSTEMS ANALYSIS AND DESIGN
55
The assembled documents help an analyst understand what data the new system must collect and process. For example, the company can easily obtain the following data from the invoice itself: 1. Supplier name, address, and telephone number 2. Invoice number 3. Invoice date 4. Invoice 5. Terms of invoice 6. Amount of invoice From the packing slip, it can obtain: 1. Supplier name 2. Shipping date 3. Date goods are received 4. Freight charges 5. Invoice number Packing slips are carbon copies of invoices omitting data such as the money value of the shipment. The warehouse clerk checks the mechandize received against the packing slip to be sure everything is in the carton and notes any discrepancies. Then the packing slip goes to accounting for comparison with invoices to be sure that the company received what it is paying for. The ledger offers two categories of facts – supplier data and purchase/payment history: 1. Supplier name 2. Supplier address 3. Supplier telephone number 4. Date of transaction 5. Description of transaction 6. Amount of invoice or payment 7. Discount 8. Balance due to supplier Each cheque sent to a supplier contains the following data: 1. Invoice number 2. Cheque number 3. Amount of payment 4. Payment date

CIT 212 SYSTEMS ANALYSIS AND DESIGN
56
In addition to these documents, it is useful to have copies of reports prepared by the accounting department. 3.5.5 New System During fact finding, an analyst acts as a researcher, gathering facts, figures, and documents and coming to grips with the entire scope of problem. Now he must decide what can be done, what it will cost, and the benefits expected to be derived from the new system. The first step is to generate a list of alternative solutions to the existing accounts payable problem. Possible solutions range from doing nothing to installing a fully computerized AP system. In such a case there could be four alternatives: i) Do nothing leaving the existing system alone ii) Hire more staff, partially automate the system, but continue with
essentially a manual system iii) Purchase AP software from an outside supplier iv) Design, program, and install a customized AP system When all necessary facts, figures, documents, data-flow diagrams, questionnaire and observations are complete, the analyst can write the final report. The format of the final report, called feasibility study, parallels that of the preliminary reports. It starts with a restatement of the problems and its importance, followed by a list of the study’s objectives, a review of the analyst’s findings, tallies of expected costs and savings, and the analyst’s recommendations. In a large organization, the analyst may use a standardized form for the final report, in smaller organizations, the analyst simply chooses the most logical format. In any case, the analyst distributes the typed, photocopied report to the manager who will decide whether to adopt, modify, or reject the recommended solution. After management has thoroughly considered the feasibility study, it calls a meeting to discuss the study and to choose a course of action. This meeting should take place a few days after the study’s distribution and should be conducted by the manager of the computing services department or whoever requested the analysis. The analyst plays a major role and should be well prepared to answer questions and supply needed information. In fact, the analyst should rehearse the presentation in order to identify and improve upon weak areas.

CIT 212 SYSTEMS ANALYSIS AND DESIGN
57
If the analyst leads the meeting, he or she must exercise control. The following rules are helpful. i) Never read the feasibility study aloud; instead, summarise it,
while trying to lead the audience to support the study’s recommendation.
ii) Use visual aids, such as chalkboards, flipcharts, slides,
photographs, and overhead transparencies iii) If appropriate, demonstrate equipment or software to show how it
will work. Often one key individual must be convinced, and this person will influence the others to follow. If all goes well, the meeting will end with a decision to implement the analyst’s recommendations. After the meeting, management notifies all appropriate staff members of its decision. If management has decided to proceed to the design stage, the notification memo explains the plan briefly and established an overall schedule. Even if management decides to maintain or modify the current system, it should still issue a memo, or people will wonder why the company wasted time with a study that produced no results. After a decision to proceed, analysis ends and design begins. The analyst will organize all the memoranda, questionnaire, interview documents and forms, data-flow diagrams, and reports from both the preliminary and detailed analysis into one file, which becomes the analysis documentation. 4.0 CONCLUSION This unit has taken you fully into the first stage of the system development life cycle which is the preliminary study to have you determine the feasibility of a project (i.e. whether or not a project is worth doing). It has also taken you through the different types of feasibility viz: technical feasibility, operational feasibility, economic, social, legal, etc., the purposes of feasibility study, the different steps in feasibility analysis, and how to undergo cost/benefit analysis. 5.0 SUMMARY The determination of whether or not a project is worth doing is known as feasibility. Once it has been determined that the project is worth doing i.e. the project is feasible, the analyst can go ahead and prepare

CIT 212 SYSTEMS ANALYSIS AND DESIGN
58
the project specification which finalizes project requirements. The process by which we determine whether a project is feasible or not is called feasibility study. There are seven types of feasibility which are discussed in this unit. Different steps involved in the feasibility analysis are listed and an investigative study is made in this unit. 6.0 TUTOR-MARKED ASSIGNMENT 1. Name different types of benefits. 2. Name different types of costs and benefits. 3. Give a good definition of cost-benefit analysis. 7.0 REFERENCES AND FURTHER READINGS Analysis & design of information systems – James A Senn, Mc-Graw
Hill Book Co. (1986) Structured Analysis and Systems Specification – Tom De Marco,
Prentice Hall (1979) The Practical Guide to Structured system Design – Page Jones Mellir,
The Yourdon press (1980) Managing the Structured Techniques – Edward Yourdon, Yourdon,
Yourdon Press (1979)
CIT 212 SYSTEMS ANALYSIS AND DESIGN
59
UNIT 4 SYSTEM REQUIREMENT SPECIFICATIONS AND ANALYSIS
CONTENTS 1.0 Introduction 2.0 Objectives 3.0 Main Content
3.1 Data Flow Diagrams (DFD) 3.1.1 What is DFD? 3.1.2 Charting Tools Used for DFDs
3.2 Data Dictionaries 3.2.1 Why Data Dictionary? 3.2.2 Major Symbols 3.2.3 Four Rules 3.2.4 Data Dictionary Types 3.2.5 The Make Up of Data Dictionaries 3.3 HIPO 3.3.1 Constructing a VTOC 3.3.2 Constructing and IPO 3.4 Decision Tables and Decision Trees 3.4.1 Decision Tables 3.4.2 Decision Trees 3.5 Warnier – Orr Diagrams 3.6 Nassi-Shneidermann Charts 4.0 Conclusion 5.0 Summary 6.0 Tutor-Marked Assignment 7.0 References and Further Readings 1.0 INTRODUCTION This is the last unit of this module. In the previous unit we have discussed various types of feasibilities, and cost/benefit analysis. In this unit we present in some detail, DFD (Data Flow Diagram) and Data Dictionaries, their characteristics, various types and applications. Then we discuss HIPO (Hierarchy plus Input Process Output), and the two forms of its diagrams viz. VTOC and IPO. Decision tables and Decision trees are of wide applications in various fields besides computer science. We discuss here these two important techniques in details with several examples. Finally, we describe Warnier-Orr diagram and Nassi-Shineidermann charts which are important tools in systems analysis and design.
CIT 212 SYSTEMS ANALYSIS AND DESIGN
60
2.0 OBJECTIVES After going through this unit, you should be able to: ● define DFD; ● define Data Dictionary, its standard symbols and rules; ● explain HIPO, its two types of diagrams; ● draw decision table; ● display decision trees; ● illustrate Warnier-Orr diagrams; and ● illustrate Nassi-Shneidermann charts 3.0 MAIN CONTENT 3.1 Data Flow Diagrams (DFD) 3.1.1 What is DFD? Graphical description of a system’s data and how the processes transform the data is known as Data flow Diagram (or DFD). Unlike detail flowcharts, DFDs do not supply detailed descriptions of modules but graphically describe a system’s data and how the data interact with the system. To construct data flow diagrams, we use: (i) arrows, (ii) circles, (iii) open-ended boxes, and (iv) squares An arrow identifies data flow i.e. data in motion. It is a pipeline through which information flows. Like the rectangle in flowcharts, circles stand for a process that converts data/into information. An open-ended box represents a data/store-data at rest, or a temporary repository of data. A square defines a source (originator) or destination of system data. The following seven rules govern construction of data flow diagrams (DFD): 1. Arrows should not cross each other. 2. Squares, circles, and files must bear names.

CIT 212 SYSTEMS ANALYSIS AND DESIGN
61
3. Decomposed data flows must be balanced (all data flows on the decomposed diagram must reflect flows in the original diagram).
4. No two data flow, squares, or circles can have the same name. 5. Draw all data flows around the outside of the diagram. 6. Choose meaningful names for data flows, processes, and data
stores. Use strong verbs followed by nouns. 7. Control information such as record counts, passwords, and
validation requirements are not pertinent to a data-flow diagram. If too many events seem to be occurring at a given point, an analyst can decompose a data conversion (circle). The new data conversions form a parent-child relationship with the original data conversion; the child circle in Figure 4.2 belongs to the parent in figure 4.1.
Figure 3.1

CIT 212 SYSTEMS ANALYSIS AND DESIGN
62
Figure 3.2 Devotees of data-flow diagrams insist that no other analyst’s tool expresses so fully the flow of data. After all, don’t computer people begin with data flow rather than the processing of the data? Another strong advantage is the balancing feature that builds in an error-detection system other tools lack. For example, if a parent data-flow diagram shows three inputs and two outputs, the levelled child diagrams taken together must have three inputs and two outputs. If there is an imbalance between parent and child data-flow diagrams, an error exists in either the parent or child diagram. 3.1.2 Charting Tools Used for DFDs The data flow diagram (DFD) is the core specification in this method. Figure 4.3 shows the very few charting forms that are necessary.
Fig. 3.3 Data Flow Diagram Charting Forms
CIT 212 SYSTEMS ANALYSIS AND DESIGN
63
Shown in Figure 4.3(a) as a square box is the external source or receivers of data. Shown in Figure 4.3(b) is the transform bubble. Two variations of this have been put forth. The circle or real bubble is the better-known and is used by both victor Weinberg and Tom DeMarco. The rectangular bubble shown beneath the circle is the form used by Chris Gane and Trish Sarson. The reason for the rectangular bubble is the perceived need to enter more information than can be contained in the bubble. Tom DeMarco, who is the purist in this group of four writers and educators in the structures method, holds that the data content of the bubble must be just the bare bones of one verb and a noun, since our objective is not to explain the process but to partition into levelled transforms. In fact the rectangular bubble is hard to draw freehand and the template containing this special form is not one you are likely to have around the shop, it must be specially ordered. The line arrow is much more important in this method because it carries the data flow: the data into the transform and the data out of the transform. All lines must be identified by their data. Figure 4.3(c) shows the line arrows. The variations on the use of the line arrow are significant, because again the answer needs that different proponents of this method have perceived. Three different points of view are advanced by the practitioners mentioned above regarding line arrows. 1. When multiple lines go into or leave a transform, Weinberg
offers the ability to use Boolean logic describing symbols to represent AND, INCLUSIVE OR, and EXCLUSIVE OR. This clearly indicates a felt need for decision logic above the base level. DeMarco advises against using Boolean decision logic. Our examples will not use Boolean logic beyond showing examples in Figure 4.3(e), since this seems to the author to represent a consensus view of those who use the DFD approach.
2. DeMarco shows the line arrow as a curved line giving a different
“feeling’ than the straight line and right angles of Weinberg and Gane-Sarson. In the DeMarco approach there is more of a sense of flow - a sense of data in motion. Our examples will use the curved line.
3. Regarding the data flow along the line arrow, this would be a
serious problem, like the problem of expressing the process within the confines of the bubble. The answer here is to take advantage of the fact that the method allows multiple lines in and out of a bubble and to break up the wordy data flow into several briefly named data flows. It is either that or lengthen the line. This concentration on detail of form, worrying about whether to use a circle or a square or a curved or straight line, may read as
CIT 212 SYSTEMS ANALYSIS AND DESIGN
64
petty to the non-chartist. To those who mean to use this method to specify systems it is just as serious a matter as the concern of the professional tennis player with the type of racket to be used in a tournament. What we are trying to do with these forms is to invent solutions to problems as we move from the fluid to the concrete and from the tentative to the certain. We need a method for all seasons, but especially to communication the fluid and the tentative new idea.
The final diagramming element shown in Figure 4.3 (d) is the open rectangular or two parallel lines, which indicates the data store (such as a database, file, Kardex or phone book). Gane and Sarson, unlike the others, show the data store as the two parallel lines joined at one side to make an open rectangle. These are all the charting forms we need to use this methodology. Again, as in the flowcharting forms much can be developed out of a few tools. Essentially a system of any complexity whatever is shown with the bubble, line, data store rectangle, and external box. It can be seen that although some practitioners prefer to use variation in their notation, the broad style is similar. 3.2 Data Dictionaries 3.2.1 Why Data Dictionary? A data dictionary defines each term (called a data element) encountered during the analysis and design of a new system. Data elements can describe files, data flows, or process. For example, suppose you want to print the vendor’s name and address at the bottom of a cheque. The data dictionary might define vendor’s name and address as follows: Vendor name and address = Vendor name + Street + City + State + Pin + Phone + Fax + e-mail The definition becomes a part of the data dictionary that ultimately will list all key terms used to describe various data flows and files.
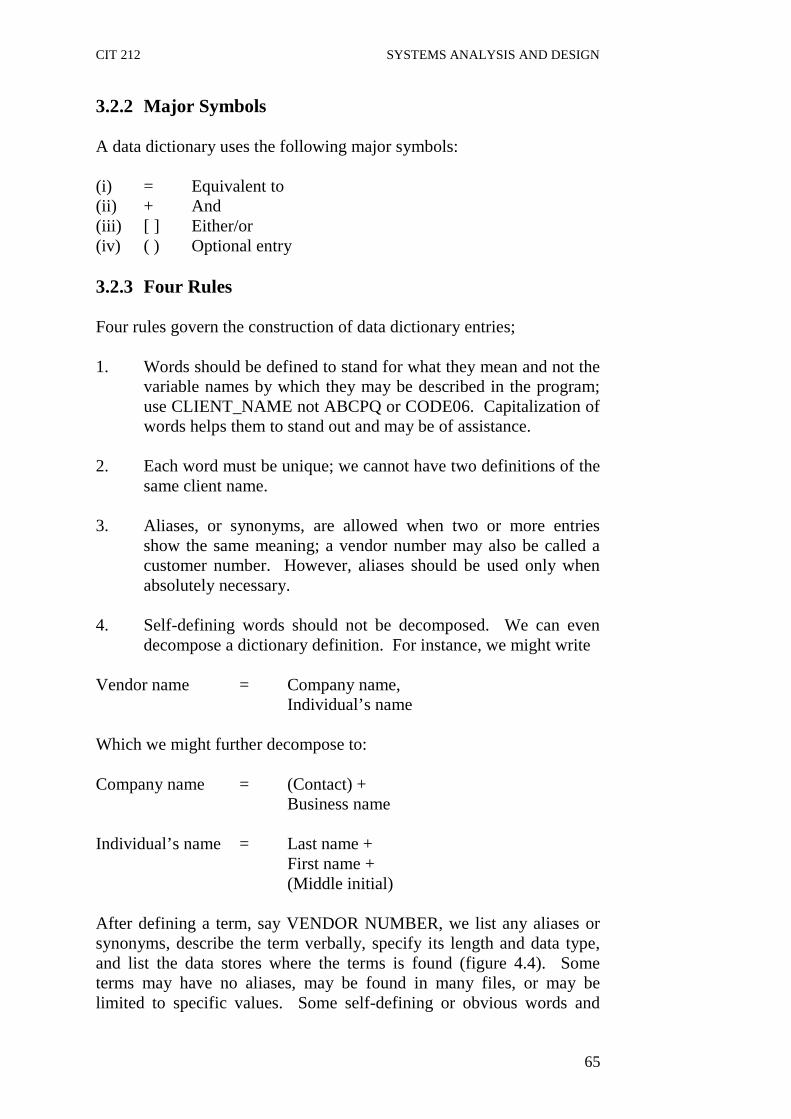
CIT 212 SYSTEMS ANALYSIS AND DESIGN
65
3.2.2 Major Symbols A data dictionary uses the following major symbols: (i) = Equivalent to (ii) + And (iii) [ ] Either/or (iv) ( ) Optional entry 3.2.3 Four Rules Four rules govern the construction of data dictionary entries; 1. Words should be defined to stand for what they mean and not the
variable names by which they may be described in the program; use CLIENT_NAME not ABCPQ or CODE06. Capitalization of words helps them to stand out and may be of assistance.
2. Each word must be unique; we cannot have two definitions of the
same client name. 3. Aliases, or synonyms, are allowed when two or more entries
show the same meaning; a vendor number may also be called a customer number. However, aliases should be used only when absolutely necessary.
4. Self-defining words should not be decomposed. We can even
decompose a dictionary definition. For instance, we might write Vendor name = Company name, Individual’s name Which we might further decompose to: Company name = (Contact) + Business name Individual’s name = Last name + First name + (Middle initial) After defining a term, say VENDOR NUMBER, we list any aliases or synonyms, describe the term verbally, specify its length and data type, and list the data stores where the terms is found (figure 4.4). Some terms may have no aliases, may be found in many files, or may be limited to specific values. Some self-defining or obvious words and
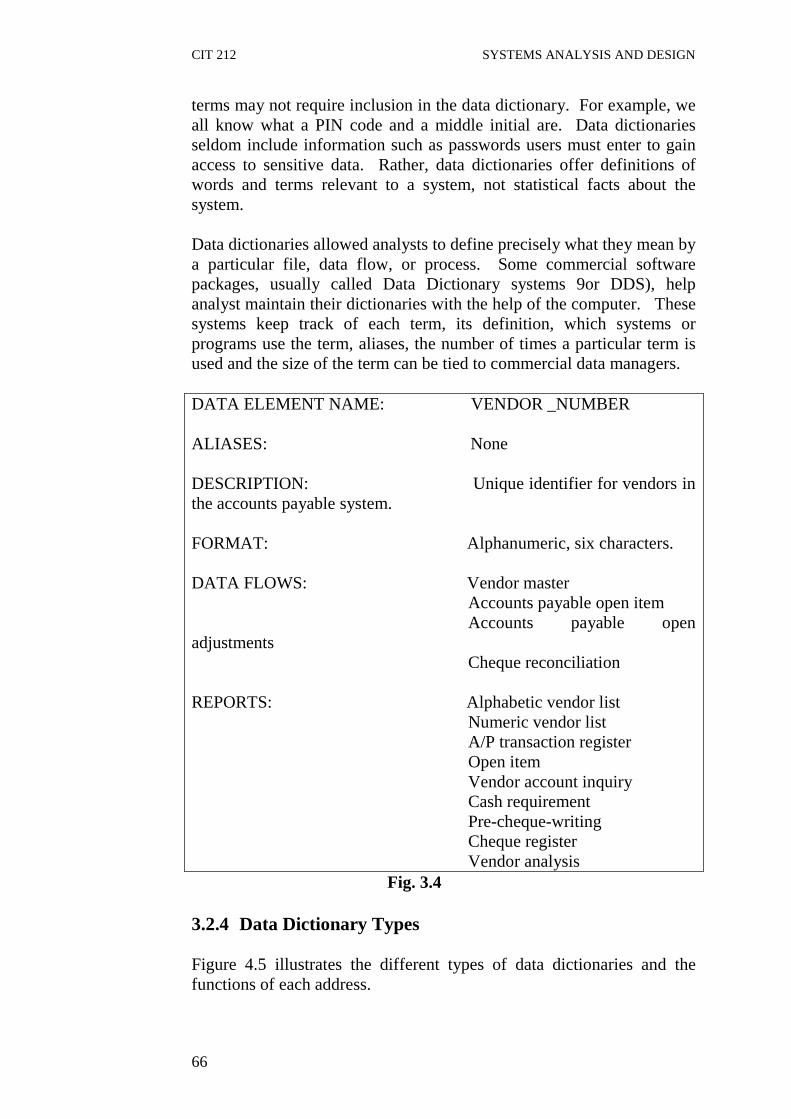
CIT 212 SYSTEMS ANALYSIS AND DESIGN
66
terms may not require inclusion in the data dictionary. For example, we all know what a PIN code and a middle initial are. Data dictionaries seldom include information such as passwords users must enter to gain access to sensitive data. Rather, data dictionaries offer definitions of words and terms relevant to a system, not statistical facts about the system. Data dictionaries allowed analysts to define precisely what they mean by a particular file, data flow, or process. Some commercial software packages, usually called Data Dictionary systems 9or DDS), help analyst maintain their dictionaries with the help of the computer. These systems keep track of each term, its definition, which systems or programs use the term, aliases, the number of times a particular term is used and the size of the term can be tied to commercial data managers. DATA ELEMENT NAME: VENDOR _NUMBER ALIASES: None DESCRIPTION: Unique identifier for vendors in the accounts payable system. FORMAT: Alphanumeric, six characters. DATA FLOWS: Vendor master Accounts payable open item Accounts payable open adjustments Cheque reconciliation REPORTS: Alphabetic vendor list Numeric vendor list A/P transaction register Open item Vendor account inquiry Cash requirement Pre-cheque-writing Cheque register Vendor analysis Fig. 3.4 3.2.4 Data Dictionary Types Figure 4.5 illustrates the different types of data dictionaries and the functions of each address.

CIT 212 SYSTEMS ANALYSIS AND DESIGN
67
Figure 3.5: Data Dictionary Types and Functions
There are two kinds of data dictionaries; (i) Integrated and (ii) Stand-alone. The integrated dictionary is related to one database management system (DBMS). To the extent the organization data is under this DBMS it is global or organization wide. However, very few enterprises have all their data eggs in one basket, so the dictionary documentation (metadata) can be considered as local and fragmented. The stand-alone dictionary is not tied to any DBMS, although it may have special advantages for one DBMS, such as the IBM DB-DC Data Dictionary, which has special features related to the IBM IMS DBMS but is still a stand-alone variety of dictionary.

CIT 212 SYSTEMS ANALYSIS AND DESIGN
68
Data Dictionary Functions Both these types of dictionaries can be identified by functions as either passive, active, or inline. Viewed either way, by type or function, the differences are striking. Passive, active, and in-line dictionaries differ functionally as follows: Passive Data Dictionaries The functionally passive dictionary performs documentation only. This variety of dictionary could be maintained as a manual rather than an automated database. For more than limited documentation use, the automated passive dictionary has clear advantages. From the organizational view the documentation function is the most important dictionary service with the most potential benefits, so the passive dictionary should not be thought of negatively. It has more limited functionally but may perform its critical function of global documentation best of all. Active Data Dictionaries Besides supporting documentation to one degree or another, the active data dictionary supports program and operations development by exporting database definitions and program data storage definitions for languages such as COBOL and Job Control Language (JCL) for execution-time performance. The IBM DB/DC Data Dictionary already mentioned is such a stand-alone, active data dictionary. A dictionary such as this is not an in-line data dictionary as delivered, which is not to say that it could not be put in-line by a determined effort of major proportions. In-line Data Dictionaries An in-line data dictionary is active during program performing such feats as transaction validation and editing. Such dictionary would always have some documentation value, but documentation across the organization about the organization functions and activities and all the organization information data stores is not likely. In-line dictionaries are associated with DBMS products such as Cullinet Software Corporation’s IDMS-R or Cincom System’s TOTAL, to name just two. 3.2.5 The Make Up of Data Dictionaries The minimum data dictionary is shown in figure 4.6.

CIT 212 SYSTEMS ANALYSIS AND DESIGN
69
Fig. 3.6: Minimum Data Dictionary
When we have a database system consisting of databases or files. These files consist of data groups or segments or rerecords. These data groups consist of data items or fields. There is an implicit relationship here, which needs no additional comment. A certain amount of attribute information is always present. In the case of data items we need to know if it is a primary or secondary key or an attribute field, if it has aliases, what are the filed type and field size, to know whether the data item or data group is in test, system test, or production status. We need to know the number of occurrences of this data item on the dictionary. Addressing these last points, a data item (for instance) on the IBM data dictionary may look strange to the uninitiated. It will look like this: T,C,BALANCE-ON-HAND,0 We recognize balance-on hand as an inventory quantity. The T is the status code, which we will say is T because the data-item balance-on-hand is on the test-data database. The C is the subject code, which in this case is the primary programming language COBOL. The 0 is the occurrence number where duplication exists in the common information system. So, in terms of this dictionary, the full description of the data-item consists of the four elements mentioned above. This conversion holds for all subjects defined on the IBM data dictionary. Before discussing the functions of the full-service extended data dictionary we need to review data-dictionary elements. Figure 4.7 shows these elements.
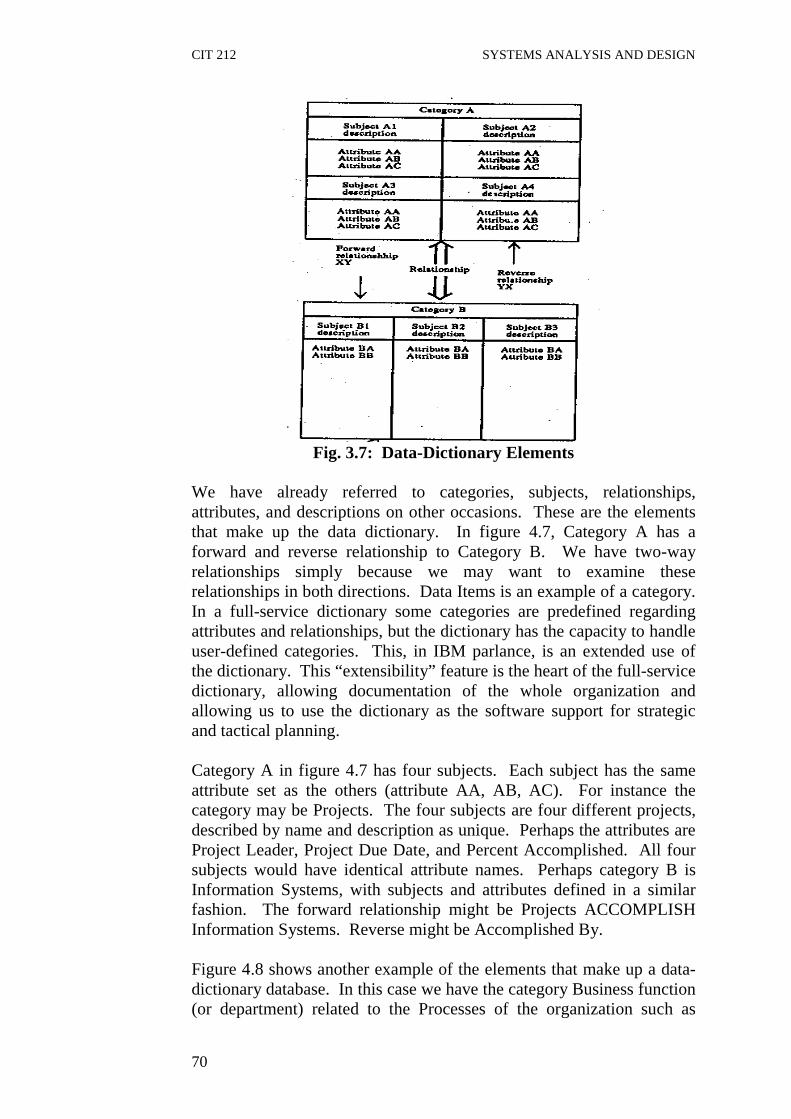
CIT 212 SYSTEMS ANALYSIS AND DESIGN
70
Fig. 3.7: Data-Dictionary Elements
We have already referred to categories, subjects, relationships, attributes, and descriptions on other occasions. These are the elements that make up the data dictionary. In figure 4.7, Category A has a forward and reverse relationship to Category B. We have two-way relationships simply because we may want to examine these relationships in both directions. Data Items is an example of a category. In a full-service dictionary some categories are predefined regarding attributes and relationships, but the dictionary has the capacity to handle user-defined categories. This, in IBM parlance, is an extended use of the dictionary. This “extensibility” feature is the heart of the full-service dictionary, allowing documentation of the whole organization and allowing us to use the dictionary as the software support for strategic and tactical planning. Category A in figure 4.7 has four subjects. Each subject has the same attribute set as the others (attribute AA, AB, AC). For instance the category may be Projects. The four subjects are four different projects, described by name and description as unique. Perhaps the attributes are Project Leader, Project Due Date, and Percent Accomplished. All four subjects would have identical attribute names. Perhaps category B is Information Systems, with subjects and attributes defined in a similar fashion. The forward relationship might be Projects ACCOMPLISH Information Systems. Reverse might be Accomplished By. Figure 4.8 shows another example of the elements that make up a data-dictionary database. In this case we have the category Business function (or department) related to the Processes of the organization such as
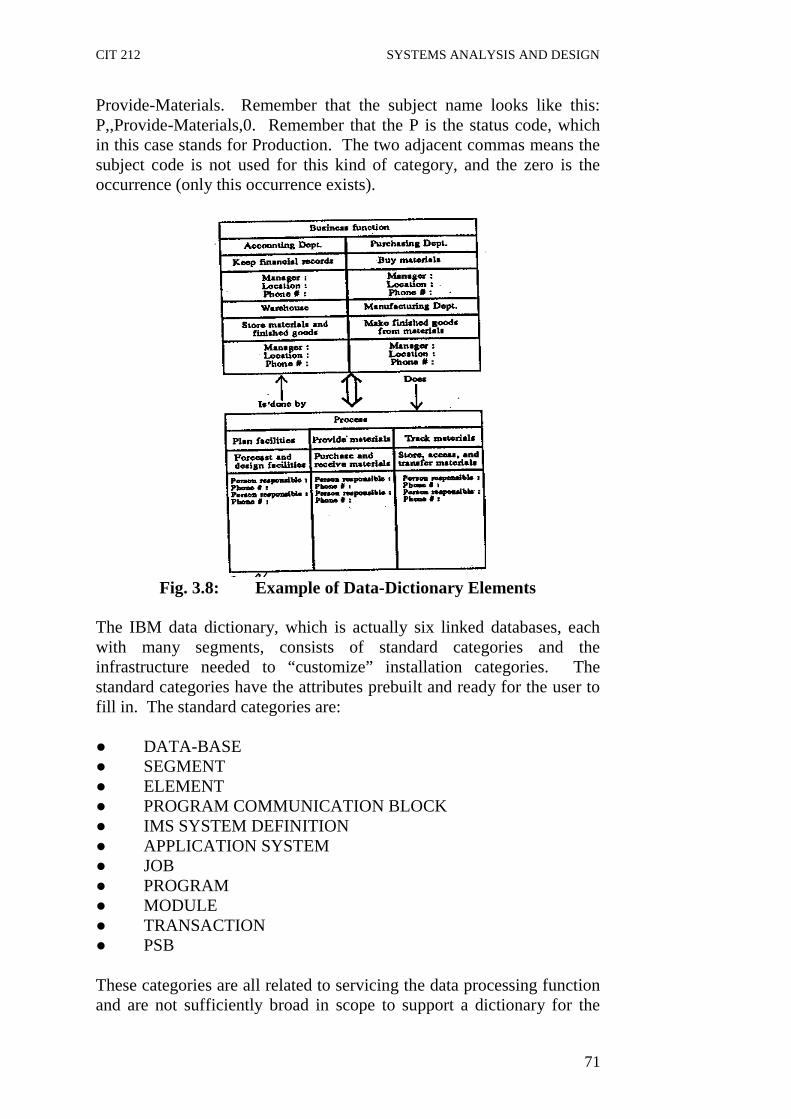
CIT 212 SYSTEMS ANALYSIS AND DESIGN
71
Provide-Materials. Remember that the subject name looks like this: P,,Provide-Materials,0. Remember that the P is the status code, which in this case stands for Production. The two adjacent commas means the subject code is not used for this kind of category, and the zero is the occurrence (only this occurrence exists).
Fig. 3.8: Example of Data-Dictionary Elements
The IBM data dictionary, which is actually six linked databases, each with many segments, consists of standard categories and the infrastructure needed to “customize” installation categories. The standard categories have the attributes prebuilt and ready for the user to fill in. The standard categories are: ● DATA-BASE ● SEGMENT ● ELEMENT ● PROGRAM COMMUNICATION BLOCK ● IMS SYSTEM DEFINITION ● APPLICATION SYSTEM ● JOB ● PROGRAM ● MODULE ● TRANSACTION ● PSB These categories are all related to servicing the data processing function and are not sufficiently broad in scope to support a dictionary for the
CIT 212 SYSTEMS ANALYSIS AND DESIGN
72
entire organization. The strategic plan cannot be documented with just these categories. It is the ability of this data dictionary to allow the creation of other user-defined categories that allows us to consider the dictionary a serious tool for systems analysis and documentation in support of the current and new system applications. 3.3 HIPO HIPO stands for hierarchy plus Input Process Output. It consists of two types of diagrams: (i) Visual Table of Contents (VTOC) (ii) Input Process Output (IPO) Together these diagrams assist in designing programs and their functions. Following the structures approach that begins with generalities and descends to details, VTOC diagram breaks a system or grogram down into increasingly detailed levels. Therefore, the name of the system appears at the top of the VTOC, the names of the major functions within the system lie on the second level and even smaller sub-functions lie on the third and succeeding levels. When used to diagram a program, the VTOC arranges the program modules in order of priority, and it reads from the top down and from left to right. Each module of the program appears as a rectangle which contains a brief description of the module’s purpose (two to four words, beginning with a verb followed by an object i.e. “compute net pay”). The VTOC for the correct assembly of a bicycle might include five major tasks. (i) open the carton, (ii) remove the parts (that is separate them), (iii) group similar parts’ (iv) assemble the wheels (v) finish assembling the bicycle (figure 4.9)

CIT 212 SYSTEMS ANALYSIS AND DESIGN
73
Figure 3.9: VTOC for the modules to assemble a bicycle Compare this diagram with the one in figure 4.10.
Fig. 3.10: Flowchart of Bicycle Assembly
Both indicate hierarchy but the VTOC offers a more complete picture of the overall process. When assembling something, no matter how clear the instructions are, it helps to refer to a picture of the finished product. Within the VTOC, each task must be performed in the order specified, and each task may involve several subtasks. For example, wheel assembly involves the separate subtasks of front-and rear-wheel assembly.
BICYCLE ASSEMBLY
OPEN CONTAINER
SEPARATE PARTS
FINISH ASSEMBLY
WHEEL ASSEMBLY
FRONT WHEEL
REAR WHEEL

CIT 212 SYSTEMS ANALYSIS AND DESIGN
74
An IPO chart defines the inputs, processing, and outputs for each module in the program. Figure 4.11 is an IPO for the “finish assembly” module, inputs for which the frame, front-wheel assembly, rear-wheel assembly, seat, handlebars and chain. The processing requirements are bolting wheel assemblies to the frame, and attaching handlebars, chain, and seat. The output is the completed bicycle. System: Bicycle Assembly Author : Gbeminiyi Afolorunso Module: Finish Assembly Date: 12/02/2004 INPUT PROCESS OUTPUT 1. Frame 1. Bolt front-and rear-wheel 1. Completed 2. Front-wheel assembly assembly to frame bicycle 3. Rear-wheel assembly 2. Attach handlebars 4. Seat 3. Attach chain 5. Chain 4. Attach seat 6. Handlebars Fig. 3.11: Example of an IPO 3.3.1 Constructing a VTOC Now let us learn how a VTOC for the computerization of manual accounts payable system. We first assign all the outputs (reports) to modules as shown in figure 3.12.
Fig. 3.12: VTOC for an accounts payable system begins with
assignment of modules to each output report. We name modules according to their function so the reader can tell exactly the purpose of the module (again using the verb-object format). After naming, we choose a number for the system (1), we give each module a sub or level number, beginning with 1 for the most general or highest level function. Therefore, we would identify the overall system as 1.0, the accounts payable check module as 1.1, the numeric vendor list as 1.2 and so on (Figure 3.13). Such a number system clarifies the relationships between modules, and allows anyone reading it easily to locate detailed IPO charts with corresponding numbers.
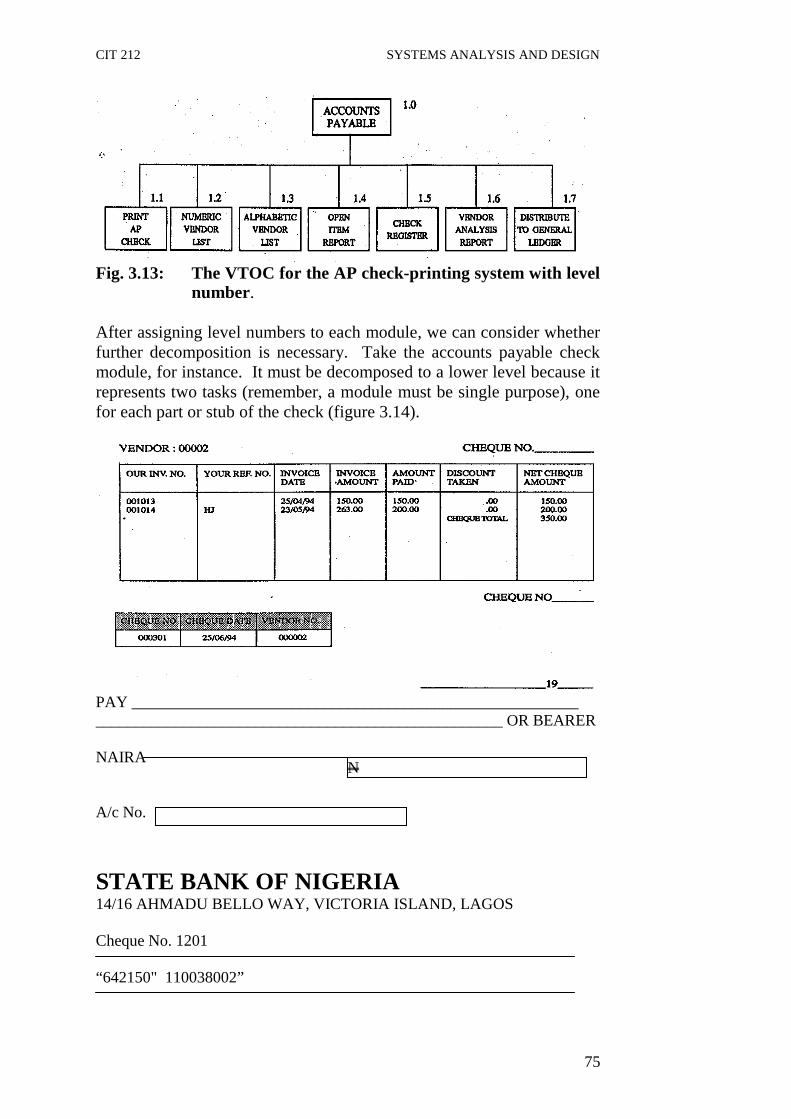
CIT 212 SYSTEMS ANALYSIS AND DESIGN
75
Fig. 3.13: The VTOC for the AP check-printing system with level
number. After assigning level numbers to each module, we can consider whether further decomposition is necessary. Take the accounts payable check module, for instance. It must be decomposed to a lower level because it represents two tasks (remember, a module must be single purpose), one for each part or stub of the check (figure 3.14).
PAY ________________________________________________________ ___________________________________________________ OR BEARER NAIRA A/c No.
STATE BANK OF NIGERIA 14/16 AHMADU BELLO WAY, VICTORIA ISLAND, LAGOS Cheque No. 1201 “642150" 110038002”
N

CIT 212 SYSTEMS ANALYSIS AND DESIGN
76
(a) Two-part cheque sent to vendors.
(b) This VTOC reveals the two component modules within the
PRINT AP CHECK module. Fig. 3.14 The upper stub is the remittance advice, which contains the date, number, discount, balance, and total of each invoice covered by the cheque. The lower stub is the cheque itself, complete with cheque number, payment amount, and vendor name and number. Applying the top-down concept to the cheque module, we can add another level of modules: one for printing the remittance advice and one for printing the cheque itself (figure 3.15). We assign this third level of modules a third set of numbers (1.1.1 and 1.1.2). Decomposition ends when all modules are single purpose, single entry, and single exit.
Fig. 3.15: Module development of the AP cheque system from the
programmer’s perspective As far as the analyst is concerned, decomposition of the accounts payable cheque writing system can end at the third level of modules. However, the programmer who eventually receives the HIPO chart probably would decompose the modules to even lower levels, thus establishing a new series of numbers (figure 4.15). Programmers sometimes call their VTOCs structure charts, hierarchy charts, or tree

CIT 212 SYSTEMS ANALYSIS AND DESIGN
77
charts. When finally programming the accounts payable system, the programmer would begin at the top left, programming each level before moving down and to the right. Thus the programmer first would code “remittance advice” 1.1 followed by “print detail’ (1.1.1) and then “print totals” (1.1.2.). Having coded all of module 1.1, the programmer would tackle module 1.2, beginning with ‘print date line” (1.2.1), moving on to ‘print amount in words” (1.2.1), and finishing with ‘print vendor name address” (1.2.3). Figure 3.15 shows three levels of modules, but complex systems may require many more. Regardless of their number, modules should receive unique and brief names that contain just enough detail for readers to understand their purposes. 3.3.2 Constructing and IPO Let us add the second part of the HIPO diagramming system, the IPO chart. Whereas the VTOC diagram graphically shows an overview of the system, the IPO charts depict program logic, illustrating the steps required to produce desired purposes. SYSTEM: Account Payable Date: 12/02/04 Author : Jegede MODULE : 1.0 Name: AP Cheque DESCRIPTION : Prints the stub-over-cheque sent to suppliers. INPUT PROCESS OUTPUT 1. Vendor master file 2. Invoice file
1. Read Invoice record 2. Match with vendor 3. Total amount 4. Print detail line 5. Print total line 6. Print date line 7. Print vendor name and address
1. Print remittance advice on top stub 2. Print cheque on bottom stub
Fig. 3.16: The IPO chart detail or program logic As figure 3.16 shows, the top of the IPO chart identifies the module with its number, title, a brief description, date, and the analyst’s name. the chart itself is divided into three units: data input (the names of the files used), processing activities that will require programming, and output, which, in the case of our accounts payable system, would be the printed remittance advice (1.1) and the check (1.2). In the body of the chart, we use a narrative form to describe the input, process, and output as a list of activities. It simply lists activities, not necessarily ordering them in the sequence they should occur.

CIT 212 SYSTEMS ANALYSIS AND DESIGN
78
The HIPO system forms valuable system documentation and helps the analyst prepare reports as the system is being designed and developed. These charts offer several advantages. First, they can be drawn or modified rapidly. Second, they allow the analyst graphically to convey the system to non computer people. Third, standard symbols enable some future analyst to grasp the system quickly. Finally, HIPO charts facilitate efficient schedules because they make it easy to estimate the time it will take to program a module, thus, simplifying programming assignments. The VTOC offers the analyst an alternative to the system flowcharts whereas the IPO replaces the program or detail flowchart. 3.4 Decision Tables and Decision Trees Decision tables and trees were developed long before the widespread use of computers. They not only isolate many conditions and possible actions, but they help ensure that nothing has been overlooked. 3.4.1 Decision Tables The decision table is a chart with four sections listing all the logical conditions and actions. In addition the top section permits space for title, date, author, system and comment. The condition stub displays all the necessary tests or conditions. Like the diamond in a flowchart or the IF in pseudo-code, these tests require yes or no answers. The condition stub always appears in the upper left-hand corner of the decision table, with each condition numbered to allow easy identification. Thus condition stub is a list of all the necessary tests in a decision table. In the lower left-hand corner of the decision table we find the action stub where one may note all the process desired in a given module. Actions, like conditions, receive numbers for identification purposes. Thus Action Stub is a list of all the processes involved in a decision table. The upper right corner provides space for the condition entry – all possible permutations of yes and no responses related to the condition stub. The yes or no possibilities are arranged as a vertical column called rules. Rules are numbered 1, 2, 3, and so on. We can determine the number of rules in a decision table by the formula: Number of rules = 2 ^ N = 2N where N represents the number of conditions and means exponentiation. Thus a decision table with four conditions has 16 (2^4 = 2x2x2x2 = 16) rules one with six conditions has 64 rules and eight conditions yield 256 rules.

CIT 212 SYSTEMS ANALYSIS AND DESIGN
79
Thus Condition entry is a list of all the yes/no permutations in a decision table. The lower right corner holds the action entry. X’s or data indicate whether an action should occur as a consequence of the yes/no entries ender condition entry. X’s indicate action; dots indicate no action. Thus Action entry indicates via dot or X whether something should happen in a decision table. Five sections of a decision table:
Title: Date: Author: System: Comments: Condition Stub Condition Entry Action Stub Action Entry
Fig. 3.17 Returning to the assembly of a bicycle, let us assume we must assemble a variety of containers full of parts. Since a bike can have either hand calliper or foot coaster brakes, the decision table must show the two conditions and five actions (figure 3.18). The two conditions necessitate four conditions entries, and the five actions produce 20 possible action entries. When we build the yes or no rules for the condition entry, we must construct all possible patterns of y’s and n’s. An arrangement that guarantees thoroughness is to place two y’s is succession followed by two n’s. In the second row, we place alternating pairs of y’s and n’s. (a) Decision table for bicycle assembly: TITLE: Bicycle Assembly DATE: Author: System: Comments: More than one carton of parts needs to be assembled 1. Last Caron? 2. Hand brakes?
1 2 3 4 y y n n y n y n
1. Open container 2. Stack parts 3. Assemble wheels 4. Finish assembly 5. End of assembly operations
. . x x . . x x . . x x . . x x x x . .
Fig. 3.18: Decision table for bicycle assembly
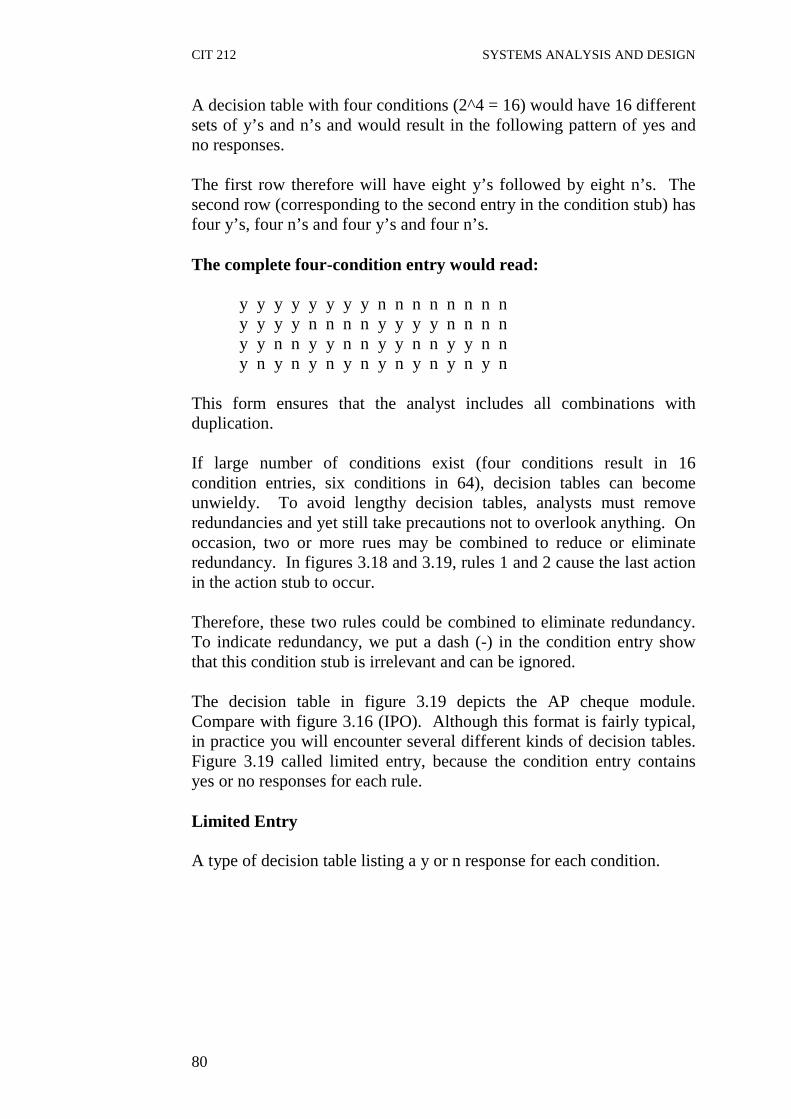
CIT 212 SYSTEMS ANALYSIS AND DESIGN
80
A decision table with four conditions (2^4 = 16) would have 16 different sets of y’s and n’s and would result in the following pattern of yes and no responses. The first row therefore will have eight y’s followed by eight n’s. The second row (corresponding to the second entry in the condition stub) has four y’s, four n’s and four y’s and four n’s. The complete four-condition entry would read: y y y y y y y y n n n n n n n n y y y y n n n n y y y y n n n n y y n n y y n n y y n n y y n n y n y n y n y n y n y n y n y n This form ensures that the analyst includes all combinations with duplication. If large number of conditions exist (four conditions result in 16 condition entries, six conditions in 64), decision tables can become unwieldy. To avoid lengthy decision tables, analysts must remove redundancies and yet still take precautions not to overlook anything. On occasion, two or more rues may be combined to reduce or eliminate redundancy. In figures 3.18 and 3.19, rules 1 and 2 cause the last action in the action stub to occur. Therefore, these two rules could be combined to eliminate redundancy. To indicate redundancy, we put a dash (-) in the condition entry show that this condition stub is irrelevant and can be ignored. The decision table in figure 3.19 depicts the AP cheque module. Compare with figure 3.16 (IPO). Although this format is fairly typical, in practice you will encounter several different kinds of decision tables. Figure 3.19 called limited entry, because the condition entry contains yes or no responses for each rule. Limited Entry A type of decision table listing a y or n response for each condition.
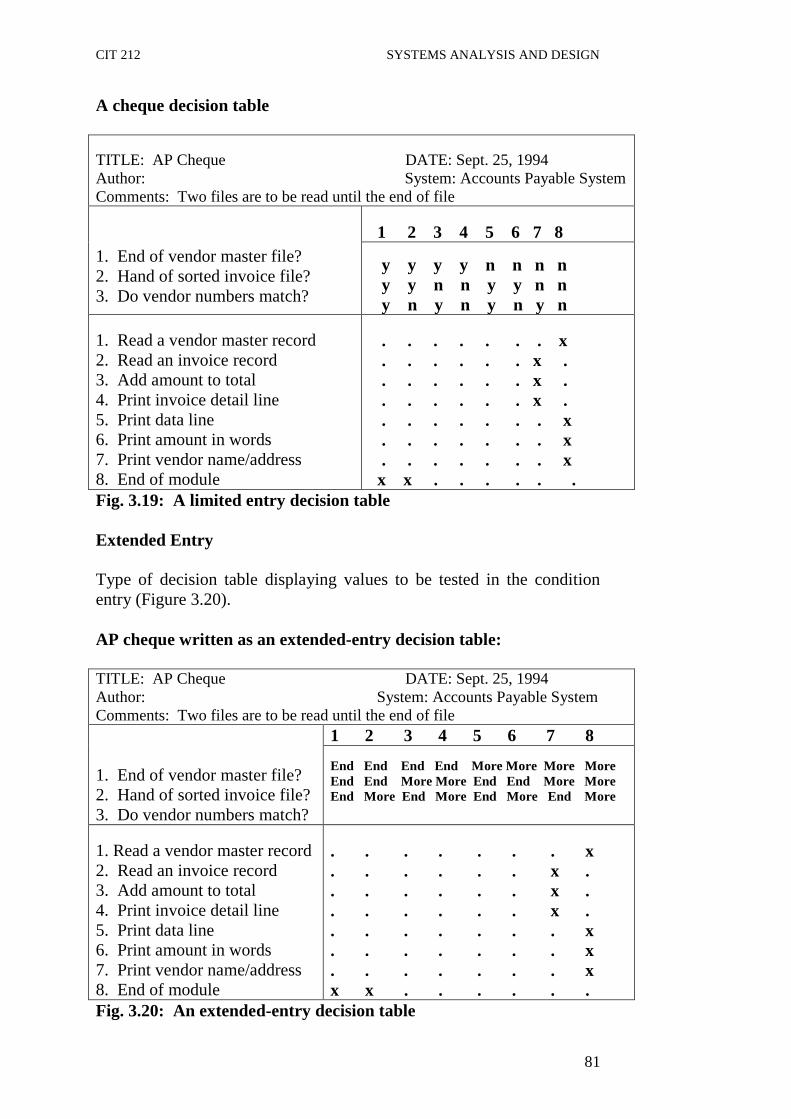
CIT 212 SYSTEMS ANALYSIS AND DESIGN
81
A cheque decision table TITLE: AP Cheque DATE: Sept. 25, 1994 Author: System: Accounts Payable System Comments: Two files are to be read until the end of file 1. End of vendor master file? 2. Hand of sorted invoice file? 3. Do vendor numbers match?
1 2 3 4 5 6 7 8 y y y y n n n n y y n n y y n n y n y n y n y n
1. Read a vendor master record 2. Read an invoice record 3. Add amount to total 4. Print invoice detail line 5. Print data line 6. Print amount in words 7. Print vendor name/address 8. End of module
. . . . . . . x . . . . . . x . . . . . . . x . . . . . . . x . . . . . . . . x . . . . . . . x . . . . . . . x x x . . . . . .
Fig. 3.19: A limited entry decision table Extended Entry Type of decision table displaying values to be tested in the condition entry (Figure 3.20). AP cheque written as an extended-entry decision table: TITLE: AP Cheque DATE: Sept. 25, 1994 Author: System: Accounts Payable System Comments: Two files are to be read until the end of file 1. End of vendor master file? 2. Hand of sorted invoice file? 3. Do vendor numbers match?
1 2 3 4 5 6 7 8 End End End End More More More More End End More More End End More More End More End More End More End More
1. Read a vendor master record 2. Read an invoice record 3. Add amount to total 4. Print invoice detail line 5. Print data line 6. Print amount in words 7. Print vendor name/address 8. End of module
. . . . . . . x
. . . . . . x .
. . . . . . x .
. . . . . . x .
. . . . . . . x
. . . . . . . x
. . . . . . . x x x . . . . . .
Fig. 3.20: An extended-entry decision table
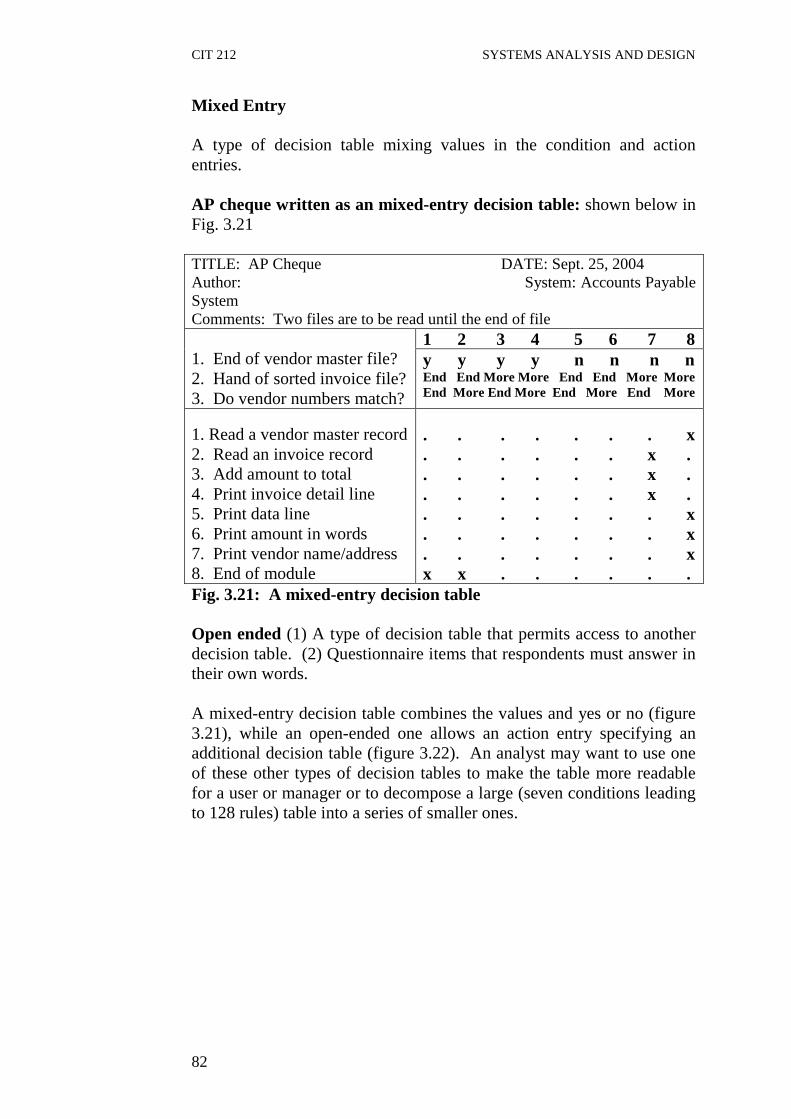
CIT 212 SYSTEMS ANALYSIS AND DESIGN
82
Mixed Entry A type of decision table mixing values in the condition and action entries. AP cheque written as an mixed-entry decision table: shown below in Fig. 3.21 TITLE: AP Cheque DATE: Sept. 25, 2004 Author: System: Accounts Payable System Comments: Two files are to be read until the end of file 1. End of vendor master file? 2. Hand of sorted invoice file? 3. Do vendor numbers match?
1 2 3 4 5 6 7 8 y y y y n n n n End End More More End End More More End More End More End More End More
1. Read a vendor master record 2. Read an invoice record 3. Add amount to total 4. Print invoice detail line 5. Print data line 6. Print amount in words 7. Print vendor name/address 8. End of module
. . . . . . . x
. . . . . . x .
. . . . . . x .
. . . . . . x .
. . . . . . . x
. . . . . . . x
. . . . . . . x x x . . . . . .
Fig. 3.21: A mixed-entry decision table Open ended (1) A type of decision table that permits access to another decision table. (2) Questionnaire items that respondents must answer in their own words. A mixed-entry decision table combines the values and yes or no (figure 3.21), while an open-ended one allows an action entry specifying an additional decision table (figure 3.22). An analyst may want to use one of these other types of decision tables to make the table more readable for a user or manager or to decompose a large (seven conditions leading to 128 rules) table into a series of smaller ones.

CIT 212 SYSTEMS ANALYSIS AND DESIGN
83
AP cheque decision table (Open-ended): TITLE: AP Cheque DATE: Sept. 25, 2004 Author: System: Accounts Payable System Comments: Two files are to be read until the end of file 1. End of vendor master file? 2. Hand of sorted invoice file? 3. Do vendor numbers match?
1 2 3 4 5 6 7 8 y y y y n n n n y y n n y y n n y n y n y n y n
1. Read a vendor master record 2. Read an invoice record 3. Add amount to total 4. Print invoice detail line 5. Print data line 6. Print amount in words 7. Print vendor name/address 8. End of module
. . . . . . . x . . . . . . x . . . . . . . x . . . . . . . x . . . . . . . . x . . . . . . . x . . . . . . . x x x . . . . . .
Fig. 3.22: An open-ended decision table Besides designing screen layout formats and determining screen specifications, the design must develop input controls for interactive dialogue and illustrate the way in which screens and menus are linked together. Three tools which help the design team in doing this are dialogue trees, decisions trees, and picture-frame analysis. With dialogue and decision trees, the team is able to show the flow of control in processing, including the actions users can take to halt or stop an input procedure. With picture-frame analysis, the design team is able to provide a walkthrough of how screens will appear once a design becomes operational. Constructing a Dialogue Tree A dialogue tree maps the static and dynamic messages that take place between the computer and the user. Figure 3.23 shows the design of a tree for a simple file processing menu.

CIT 212 SYSTEMS ANALYSIS AND DESIGN
84
Fig. 3.23: Dialogue Tree showing branches from prompting menus As shown, a dialogue tree has multiple branch points when menus are used, and forks at yes or no points. If we trace the steps shown in figure 3.23, the dialogue tree should lead you to conclude the following: 1. When an initial response of 2 is received, the program branches
to a procedure to DELETE A RECORD from the employee master file.
2. Before a record is deleted, the user is asked to verify that the
employee name is correct. The message reads: EMPLOYEE NAME OK?
3. If the name is correct, the tree forks and asks: SURE YOU
WANT TO DELETE? 4. If the name is incorrect, the tree forks and asks: NAME OK
NOW? 5. If the name is correct (is OK now) and the user responds yes to
the question SURE YOU WANT TO DELETE, the record is removed from the file.
6. If the name is not correct, or if the name is correct but the user
decides not to delete control is shown as “return to start” – namely, a loop back to the start of the tree.
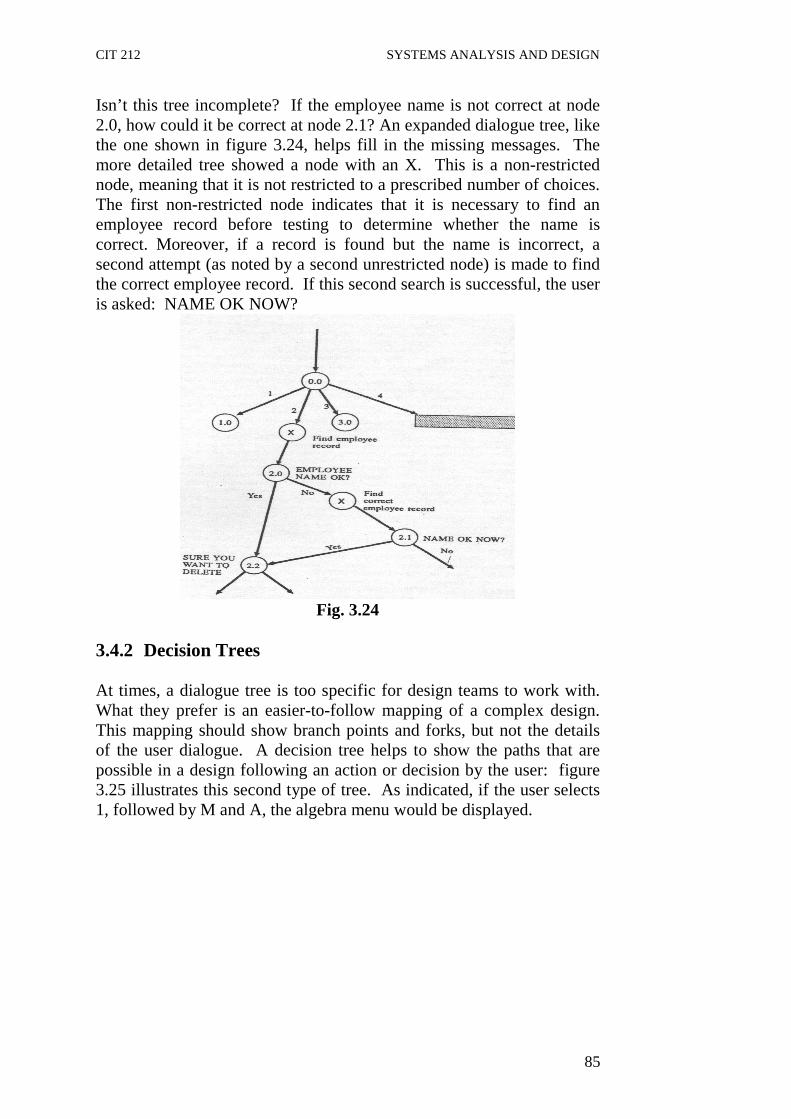
CIT 212 SYSTEMS ANALYSIS AND DESIGN
85
Isn’t this tree incomplete? If the employee name is not correct at node 2.0, how could it be correct at node 2.1? An expanded dialogue tree, like the one shown in figure 3.24, helps fill in the missing messages. The more detailed tree showed a node with an X. This is a non-restricted node, meaning that it is not restricted to a prescribed number of choices. The first non-restricted node indicates that it is necessary to find an employee record before testing to determine whether the name is correct. Moreover, if a record is found but the name is incorrect, a second attempt (as noted by a second unrestricted node) is made to find the correct employee record. If this second search is successful, the user is asked: NAME OK NOW?
Fig. 3.24
3.4.2 Decision Trees At times, a dialogue tree is too specific for design teams to work with. What they prefer is an easier-to-follow mapping of a complex design. This mapping should show branch points and forks, but not the details of the user dialogue. A decision tree helps to show the paths that are possible in a design following an action or decision by the user: figure 3.25 illustrates this second type of tree. As indicated, if the user selects 1, followed by M and A, the algebra menu would be displayed.

CIT 212 SYSTEMS ANALYSIS AND DESIGN
86
Fig. 3.25
What is the value of a tree such as this? It helps the designer visualize how the user will move through the design to reach a desired location. Thus, a decision tree provides an overview of the flow of control to be built into computer programs. Decision trees turn a decision table into a diagram (figure 3.26). This tool is read from left to right, decisions result in a fork, and all branches end with an outcome. Figure 3.26 shows the decision tree for printing the accounts payable check. Trees can be easily read by non-technical users who find tables too complex. Users readily grasp branches, forks, and outcomes.
Add amount to total Same Print detail line Read invoice record Are Vendors Numbers End of file End Module Different
Print date line Record exist Print amount in words Print vendor name/address Read vendor record Fig. 3.26: Decision trees are graphics equivalents of decision tables
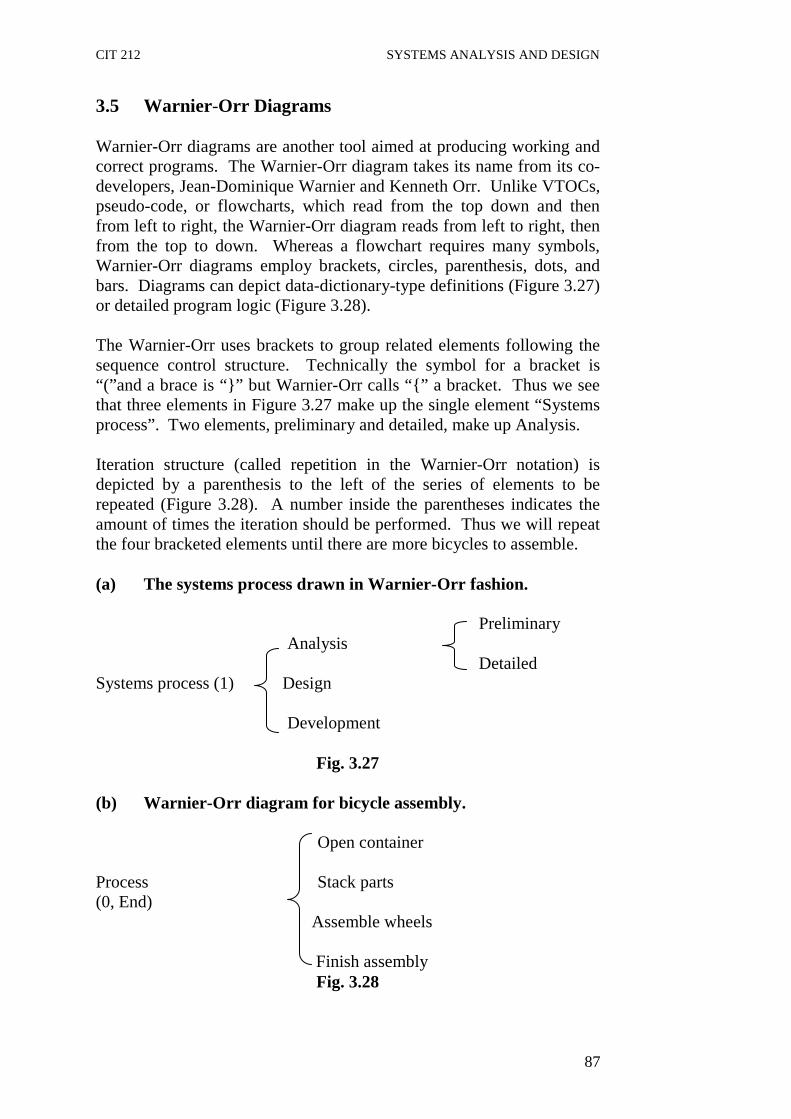
CIT 212 SYSTEMS ANALYSIS AND DESIGN
87
3.5 Warnier-Orr Diagrams Warnier-Orr diagrams are another tool aimed at producing working and correct programs. The Warnier-Orr diagram takes its name from its co-developers, Jean-Dominique Warnier and Kenneth Orr. Unlike VTOCs, pseudo-code, or flowcharts, which read from the top down and then from left to right, the Warnier-Orr diagram reads from left to right, then from the top to down. Whereas a flowchart requires many symbols, Warnier-Orr diagrams employ brackets, circles, parenthesis, dots, and bars. Diagrams can depict data-dictionary-type definitions (Figure 3.27) or detailed program logic (Figure 3.28). The Warnier-Orr uses brackets to group related elements following the sequence control structure. Technically the symbol for a bracket is “(”and a brace is “}” but Warnier-Orr calls “{” a bracket. Thus we see that three elements in Figure 3.27 make up the single element “Systems process”. Two elements, preliminary and detailed, make up Analysis. Iteration structure (called repetition in the Warnier-Orr notation) is depicted by a parenthesis to the left of the series of elements to be repeated (Figure 3.28). A number inside the parentheses indicates the amount of times the iteration should be performed. Thus we will repeat the four bracketed elements until there are more bicycles to assemble. (a) The systems process drawn in Warnier-Orr fashion.
Preliminary Analysis Detailed Systems process (1) Design Development
Fig. 3.27 (b) Warnier-Orr diagram for bicycle assembly. Open container Process Stack parts (0, End) Assemble wheels Finish assembly
Fig. 3.28

CIT 212 SYSTEMS ANALYSIS AND DESIGN
88
(c) Warnier-Orr diagram for the accounts payable stub-over-cheque module. This diagram shows the three control structures of sequence, selection, and repetition.
Begin Real invoice record (1) Initialize totals to zero (1) Read vendor record Discount taken Calculate amount of discount Subtract from amount of invoice Process Print invoice line on stub (0, End) Discount not taken
Print invoice in stub Add amount of invoice to total Read invoice record Print date line on check End (1) Print amount of invoice in words Print vendor name and address
Fig. 3.29 A plus sign enclosed in a circle indicates an alternation or selection structure. A bar separates the decision into true. (above the bar) and false (below the bar) (see Figure 3.29). Four our AP cheque-printing logic, the Warnier-Orr diagram (Figure 3.29) has brackets surrounding the repetitive operations and a decision point inside the process section to determine whether a discount will be taken. This diagram also has beginning and ending logic that our bicycle example does not require. Warnier-Orr diagrams show the beginning, processing, and ending parts of the detailed logic quite explicitly. In keeping with the structured methodology, they have a single entry and a single exist, they support the three control structures, and compared with other tools, they employ few symbols. Disadvantages of the Warnier-Orr system include its left-to-right, top-down construction (the opposite of all other tools which are topdown, left to right) and its focus on processing versus data flow. Introduced by Warnier and later modified by Orr, Warnier-Orr diagrams are thus used to decompose and partition the contents of a data store, much like DFDs are used to decompose the functions of a system.

CIT 212 SYSTEMS ANALYSIS AND DESIGN
89
Figure 3.30 illustrates how Warnier-Orr diagram would be drawn for the employee master file. As before, the employee master file is defined as a set of employee records, thus leading to the equation: Employee_master_file = 1[employee_records]n However, the Warnier-Orr diagram tells us how to define an employee record. We can write (as before): Employee_record = Employee number + employee_name_and_ address + personnel_information + wage_ and_Salary_information + leave_and _pension_history + current_payroll-history Let us suppose next that we want to know which attributes make up the category employee name and address. The Warnier-Orr diagram informs us that Employee_name_and_address = Employee name+ employee_
home_address + employee_ plant_address + telephone _extension_number
Fig. 3.30 Warnier-Orr Diagram Showing Decomposition of the Employee Record {PO_box/apartment -number}
Employee_name Street_address
Employee_number Employee_home_ City_address address Employee_name_ Employee_plant_ State_address and_address address Personnel_ Telephone_extension Pin_code information _number Employee Wage_and_salary_ record information
Leave_and_pension _history
Current_payroll_ information
VTD_payroll_ history (D,Y)

CIT 212 SYSTEMS ANALYSIS AND DESIGN
90
If we wanted to know which attributes make up employee home address, further decomposition would be necessary. The Warnier-Orr diagram tells us that Employee_home_address = ({PO_box_/apartment_number}) + street_address + city_address + state_address + Pin_code where the post office box or the apartment number is optional. A unique feature of Warnier-Orr diagrams is that they show sequences, either or conditions, and repetitions of a process. As illustrated by Figure 3.30, most Warnier-Orr diagram statements imply a sequential order: For example, Employee_name_and_address is equal to the employee_name plus the employee_home-address, plus the employee_plant_address, plus the telephone_extension_number. Finally, repetition of process is indicated. Current_payroll_history is shown as a variable for each employee. The Warnier-Orr diagram continues to be pushed to the right until all right-hand attributes can be defined by their field length or physical storage requirements. City address might be defined as City_address = 2 (character) 12 or as requiring from two to twelve characters. Telephone extension might be defined as Telephone_extension = 4 digits, where an extension always consists of a four-digit number. As this example suggests, there are several good reasons for using Warnier-Orr diagrams to describe the contents of data stores. First Warnier-Orr diagrams are easy to construct, read, and interpret. Second, they permit larger, complex terms to be decomposed into constituent parts. Third, Warnier-Orr diagrams describe the three logical constructs used in programming. Fourth, they can be used to analyse both actions and things. Fifth, they simplify the definition and order of terms to be entered into the data dictionary. The main disadvantage of a Warnier-Orr diagram is that it does not show relationships which exist within and between data stores.

CIT 212 SYSTEMS ANALYSIS AND DESIGN
91
3.6 Nassi-Shneidermann Charts Nassi-Shneidermann (N-S) charts offer an alternative to either pseudo-code or program flowcharts. Named after their authors, N-S charts are much more compact than program flowcharts, include pseudo-code-like statements, and feature sequence, decision, and repetition constructs. Figure 3.31 illustrates an N-S chart designed for processing payroll cheques. Nassi-Shneidermann Chart
Enter cheque-number
Set control sum = 0
Enter cheque total Sequence
Get current payroll record
Until EOF = Yes
Increment controlsum
Write paycheque
Increment cheque-number Repetition
Get next record Controlsum = Yes
Cheque total No.
Print: Cheque total is ok
Print: Warning: Cheque: total in error
Decision
Fig. 3.31 Nassi-Shneidermann charts are also sometimes called the Chapin charts. This system was developed by and named for I. Nassi and B. Shneidermann in the early 1970s and differs markedly from those we have examined thus far. It uses rectangles divided into halves with an angular line for selection, a horizontal rectangle for sequence, and the word DOWHILE for iteration. The bicycle-assembly chart appears in Figure 3.32 and the AP check-printing system with discounting in Figure 3.33. Nassi-Shneidermann charts are winning acceptance in the computer industry because they so simply illustrate complex logic. Perhaps as analysts evaluate the various tools at their disposals, these charts will gain even more followers. As with other structural tools, they are single entry and single exit, and efficiently accommodate modules. However, they are not as useful for conveying system flow as they are for detailing logic development and they are difficult to maintain.

CIT 212 SYSTEMS ANALYSIS AND DESIGN
92
Nassi-Shneidermann chart for bicycle assembly
DOWHILE there are containers
Open container
Stack parts
Assemble wheels
Finish assembly
Fig. 3.32 Nassi-Shneidermann chart for AP Cheque-printing logic
Fig 3.33 4.0 CONCLUSION In this unit, you have learnt the basic tools used in system requirement specification and their various characteristics; how and when they are used. The knowledge of the tools discussed with you in this unit is very vital to success of the job of a system analyst.
Read a record from invoice file
DOWHILE there are containers Initialize totals to zero Read a record from the Vendor master file DOWHILE vendor numbers are the same
Is there a
T
discount
F
Calculate amount of discount Subtract from amount of invoice
Print invoice line on stub
Add amount of invoice to total Read an invoice record
Print date line on cheque Print amount of invoice in words
Print vendor name and address

CIT 212 SYSTEMS ANALYSIS AND DESIGN
93
5.0 SUMMARY After the rigorous study on feasibility of a project, this study on system requirement specification is necessary. For this, you have studied in the unit DFD, Data Dictionary, and their various characteristics. Next in section 3.3 you have studied HIPO with several examples. In section 3.4 you have studied two important techniques, Decision Tables and Decision Trees with some examples. Finally you have seen how to make Warnier-Orr diagrams and construct Nassi-Shneidermann charts 6.0 TUTOR-MARKED ASSIGNMENT 1. What is a DFD? 2. State the seven rules that governs the construction of DFD 3. (a) What is Data Dictionary
(b) What are the rules that govern the construction of data dictionary entries.
(c) Discuss the two types of data dictionary 4. Write short notes on the following
(i) HIPO (ii) VTOC (iii) IPO
7.0 REFERENCES AND FURTHER READINGS Analysis & design of information systems – James A Senn, Mc-Graw
Hill Book Co. (1986) Structured Analysis and Systems Specification – Tom De Marco,
Prentice Hall (1979) The Practical Guide to Structured system Design – Page Jones Mellir,
The Yourdon press (1980) Managing the Structured Techniques – Edward Yourdon, Yourdon,
Yourdon Press (1979) NCC – Guide to Structured Systems Analysis & Design Method.
CIT 212 SYSTEMS ANALYSIS AND DESIGN
94
MODULE 2 Unit 1 Structured System Design Unit 2 Input Designs and Control Unit 3 Output System Design Unit 4 File and Database Design UNIT 1 STRUCTURED SYSTEM DESIGN CONTENTS 1.0 Introduction 2.0 Objectives 3.0 Main Content
3.1 System Design Considerations 3.1.1 Design Objectives 3.1.2 Constraints 3.1.3 Processing Techniques 3.1.4 Operation
3.2 Design Methodologies 3.3 Structured Design
3.3.1 Major System Design Activities 3.3.2 System Interface Specification 3.3.3 Audit Consideration
3.4 Modulation 3.5 Design Process 3.6 System Specifications 3.7 Prototype Design
4.0 Conclusion 5.0 Summary 6.0 Tutor-Marked Assignments 7.0 References/Further Readings 1.0 INTRODUCTION The systems objectives outlined during the feasibility study serve as the basis from which the work of system design is initiated. Much of the activities involved at this stage is of technical nature requiring a certain degree of experience in designing systems, sound knowledge of computer related technology and thorough understanding of computers available in the market and the various facilities provided by the vendors. Nevertheless, a system cannot be designed in isolation without the active involvement of the user. The user has a vital role to play at this stage too. As we know that data collected during feasibility study will be utilized systematically during the system design. It should.
CIT 212 SYSTEMS ANALYSIS AND DESIGN
95
However, be kept in mind that detailed study of the existing system is not necessarily over with the completion of the feasibility study. Depending on the plan of feasibility study, the level of detailed study will vary and the system design stage will also vary in the amount of investigation that still need to be done. This investigation is generally an urgent activity during the system design as the designer needs to study minute’s details in all aspects of the system. Sometimes, but rarely, this investigation may form a separate stage between Feasibility Study and Computer System Design. Designing a new system is a creative process which calls for logical as well as lateral thinking. The logical approach involves systematic moves toward the end-product keeping in mind the capabilities of the personnel and the equipment at each decision-making step. Lateral thought implies encompassing of ideas beyond the usual functions and equipment. This is to ensure that no efforts are being made to fit previous solutions into new situations. 2.0 OBJECTIVES At the conclusion of this unit, you should be able to: ● define the system design considerations ● list out various design methodologies ● know the brief outlines on structured design ● explain modularization, computer system design process and
system specifications ● understand the importance of prototype design 3.0 MAIN CONTENT 3.1 System Design Consideration The system design process is not a step adherence of clear procedures and guidelines. Though, certain clear procedures and guidelines have emerged in recent days, but still much of design work depends on knowledge and experience of the designer. When designer starts working on system design, he will face different type of problems. Many of these will be due to constrains imposed by the user or limitations of the hardware and software available in the market. Sometimes, it is difficult to enumerate the complexity of the problems and solutions therefore since the variety of likely problems is so great and no solutions are exactly similar. However, following considerations should be kept in mind during the system designing phase.

CIT 212 SYSTEMS ANALYSIS AND DESIGN
96
3.1.1 Design Objectives The primary objective of the design, of course, is to deliver the requirements as specified to the feasibility report. In general, the following design objectives should be kept in mind: (a) Practicality The system must be stable and can be opened by people with average intelligence. (b) Efficiency this involves accuracy, timeliness and comprehensiveness of the system output. (c) Cost It is desirable to aim for a system with a minimum cost subject to the condition that it must satisfy all the requirements. (d) Flexibility The system should be modifiable depending on the changing needs of the user. Such modifications should not entail extensive reconstructing or recreation of software. It should also be portable to different computer systems. (e) Security This is very important aspect of the design and should cover areas of hardware reliability, fall back procedures, physical security of data and provision for decision of fraud and abuse. System design involves first logical design and then physical consideration of the system. The logical design describes the structure and characteristics of features, like the outputs, inputs, files, databases and procedures. The physical construction, which follows the logical design, produces actual program software, files and a working system.

CIT 212 SYSTEMS ANALYSIS AND DESIGN
97
3.1.2 Constraints The designer normally will work under the following constraints: Hardware: The existing hardware will obviously
affect the system design. Software: The available software (operating
system, utilities, language etc.) in the market will constrain the design.
Budget: The budget allocated for the project will
affect the scope and depth of design. Time scale: The new system may be required by a
particular time (e.g. the start of a financial year). This may put a constraint on the designer to find the best design.
Interface with other systems: The new system may require some data
from another computerized system or may provide data to another system in which case the files must be compatible in format and the system must operate with a certain processing cycle.
3.1.3 Processing Techniques The processing options available to the designers are: - Batch processing - Real-time processing - Online processing - A combination of all the above. You are already aware of these techniques. It is quite interesting to note, however, that a combination of these is often found to be ideal in traditional data processing applications. This increases through-put of the system as also brings down the response time of online activities. In most of the business applications, 24-hour data is acceptable enough and hence it is possible to update voluminous data after office-hours in batch mode.

CIT 212 SYSTEMS ANALYSIS AND DESIGN
98
3.1.4 Operation Typically, the flow of data through a system has been shown in Figure 3.1. Throughout the design process as described in the next section, the system designer must consider and specify the requirements of each of these operational areas. Figure 3.1: Data Flow 3.2 Design Methodologies The scope of the systems design is guided by the framework for the new system developed during analysis. More clearly defined logical method for developing system that meets user requirements has led to new methodologies that fundamentally attempt to do the following: - improve productivity of analysis and programmers - improve documentation and subsequent maintenance and
enhancement - cut down drastically on cost overruns and delays - improve communication among the user, analyst, designer, and
programmer - standardize the approach to analysis and design - simplify design by segmentation. 3.3 Structures Design Structured design is a data flow based methodology. The approach begins with a system specification that identifies inputs and outputs and describes the functional aspects of the system. The specifications, then are used as a basis for the graphic representation. The next step is the definition of the modules and their relationships to one another in a form called a structure chart, using a data dictionary and other structured tools. Logical design proceeds from the top down. General features, such as reports and inputs are identified first. Then each is studied individually and in more detail. Hence, the structured design partitions a program into small, independent modules. They are arranged in a hierarchy that approximates a model of the business area and is organized in a top-down manner. Thus, structured design is an attempt to minimize the complexity and make a problem manageable by subdividing it into
User Raising Input
Data Preparat
ion
Data Validatio
n
Processi
ng
Output Handling
Action on
Output

CIT 212 SYSTEMS ANALYSIS AND DESIGN
99
smaller segments which is called Modularization or decomposition. In this way, structuring minimizes initiative reasoning and promotes maintainable provable systems. A design is said to be top-down if it consists of a hierarchy of modules, with each module having a single entry and a single exit subroutine. The primary advantages of this design are as follows: - Critical interfaces are tested first. - Early versions of the designs, though incomplete, are useful
enough to resemble the real system. - Structuring the design, parse, provides control and improves
morale. - The procedural characteristics define the order that determines
processing. 3.3.1 Major System Design Activities Several development activities are carried out during structured design. They are database design, implementation planning, system test preparation, system interface specification, and user documentation. (a) Database design This activity with the design of the physical database. A key is to determine how the access paths are to be implemented. (b) Program design In conjunction with database design is a decision on the programming language to be used and he flowcharting, coding and debugging procedure prior to conversion. The operating system limits the programming languages that will run on the system. (c) System and program test preparation Each aspect of the system has a separate test requirement. System testing is done after all programming and testing are completed. The test cases cover every aspect of the proposed system, actual operations, user interface and so on. System and program test requirements become a part of design specifications – a pre-requisite to implementation. In contrast to the system testing is acceptance testing, which puts the system through a procedure design to convince the user that the proposed system will meet the stated requirements. Acceptance testing is technically similar to system testing but politically it is different.

CIT 212 SYSTEMS ANALYSIS AND DESIGN
100
Acceptance testing is conducted in the presence of the user, audit representatives, or the entire staff. 3.3.2 System Interface Specification This phase specifies for the user how information should enter and leave the system. The designer offers the user various options. By the end of the design, formats have to be agreed upon so that machine-machine and human-machine protocols are well defined prior to implementation. Before the system is ready for implementation, user documentation in the form of a operator’s manual must be prepared. The manual provides instructions on how to install and operate the system, how to provide input, how to access, update, or retrieve information, how to display or print output, in what format, and so on. 3.3.3 Audit Consideration A well designed system should have controls to ensure proper and routine auditing. A proposed system’s failure often results from a lack of emphasis on data control. When designing the system, standards of accuracy, consistency, and maintainability must be specified to eliminate errors and control for fraud. A system design introduces new control elements and changes the control procedures. In a manual system, internal control depends on human judgement, personal care, and division of labour. In a computer-based system, the number of persons involved is considerably reduced. A software packages is an effective substitute for human judgement in processing routines and error checks. 3.3.4 Audit Control and Documentation Control An important function of system controls is to provide an audit trail. An audit trail is a routine designed to allow the analyst, user, or auditor to verify a process or an area in the new system. In a manual system, the audit trail includes journals, ledgers, and other documents that the auditor uses to trace transactions through the system. In a computerized system, record content and format frequently make it difficult to trace a transaction completely. The systems analyst must be familiar with basic auditing or work closely with an auditor to ensure an effective audit trail during the design phase. For auditing a system in a proper way, documentation is required. Documentation is the basis for the review of internal controls by internal or independent auditors. It also provides a reference for system maintenance. Analyst takes lot of time in preparing the documentation.
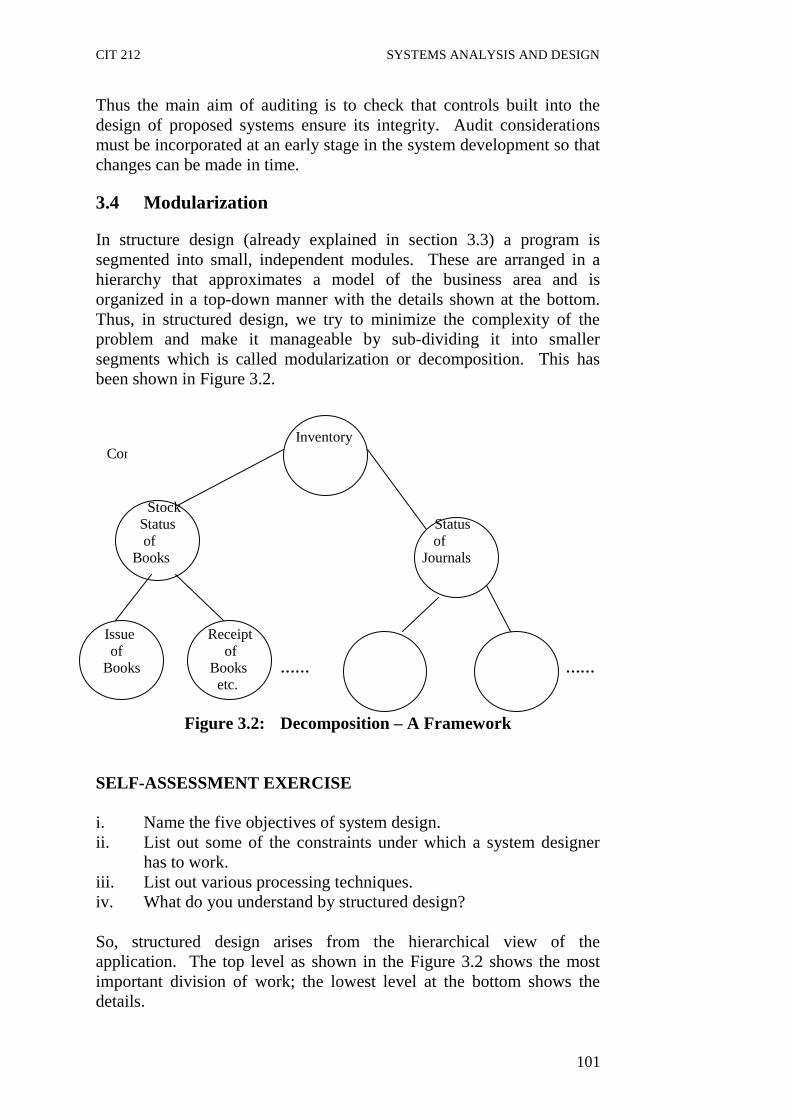
CIT 212 SYSTEMS ANALYSIS AND DESIGN
101
Thus the main aim of auditing is to check that controls built into the design of proposed systems ensure its integrity. Audit considerations must be incorporated at an early stage in the system development so that changes can be made in time.
3.4 Modularization In structure design (already explained in section 3.3) a program is segmented into small, independent modules. These are arranged in a hierarchy that approximates a model of the business area and is organized in a top-down manner with the details shown at the bottom. Thus, in structured design, we try to minimize the complexity of the problem and make it manageable by sub-dividing it into smaller segments which is called modularization or decomposition. This has been shown in Figure 3.2. Inventory Control Stock Status Status of of Books Journals Issue Receipt of of Books Books …… …… etc.
Figure 3.2: Decomposition – A Framework SELF-ASSESSMENT EXERCISE i. Name the five objectives of system design. ii. List out some of the constraints under which a system designer
has to work. iii. List out various processing techniques. iv. What do you understand by structured design? So, structured design arises from the hierarchical view of the application. The top level as shown in the Figure 3.2 shows the most important division of work; the lowest level at the bottom shows the details.

CIT 212 SYSTEMS ANALYSIS AND DESIGN
102
3.5 Design Process The computer system design process is an exercise of specifying “how” the system will work. It is an iterative process which is based on “what” the system will do as shown in the feasibility report. Mainly, following five parts have been included in the system design process: (i) Output design The starting point of the design process is the proper knowledge of system requirements which will normally be converted in terms of output. (ii) Input design Once the output requirements have been finalized, the next step is to find out what data need to be made available to the system to produce the desired outputs. The basic documents in which these data are available need to be identified. If necessary, these documents may have to be revised or new documents may have to be introduced. (iii) File design Once the input data is captured in the system, these may have to be preserved either for a short or long period. These data will generally be sorted in files in a logical manner. The designer will have to devise the techniques of storing and retrieving data from these files. (iv) Procedure design This step involves specifications of how processing will be performed. In this, there are two aspects: - Computer procedure - Non-computer procedure The computer procedure will specify what functions will be carried out on computer, what will be different programs and in what sequence the programs will be run. The non-computer procedures will specify the manual procedures for feeding input data, receiving outputs etc.

CIT 212 SYSTEMS ANALYSIS AND DESIGN
103
(v) Control design The control design indicates necessary procedures which will ensure correctness of processing, accuracy of data, timely output etc. This will ensure that the system is functioning as per plan. Generally, these steps as mentioned above are inter-dependent and some of them may have to be used together and traversed many times until a satisfactory design is prepared. It is just like the situation of “Two-step forward-one step backward” kind. In the Figure 3.3 we have tried to present an ideal situation about the progress of a project. But this situation occurs rarely in day-to-day life. Most of the time progress of a project takes different shape which is shown in Figure 3.4.
Study Design Construction Implementation (Analysis) Figure 3.3: “Ideal” project Progress
Figure 3.4: “Reality” of Project Progress
The system design process is, therefore, an interactive process where decisions made or changed at one step will have a “triple effect” on other steps. For example, if an output report is modified, it may necessitate changes in input design, file design and control design. In designing a system, if one tries to design a perfect system, it is his wrong conception. He may perhaps land up with no system at all. What is to be aimed at is the most satisfactory and operable design of a system and then gradual improvements over time.

CIT 212 SYSTEMS ANALYSIS AND DESIGN
104
3.6 System Specifications The result of the system design process is a document known as “system specifications”. The complete details of design about the proposed system have been included in it. It serves as a blueprint and helps in developing and implementing the new system. This also forms the primary documentation on which the system maintaining persons will fall back upon after the system is in use. Later on, this document is normally divided into different parts for easy reference. Thus we get system manual, user manual, operational manual. Since the system specifications are prepared as a plan, it becomes sometimes necessary to modify it after taking into consideration the practical difficulties or bottlenecks or errors found during later stages of development. System specifications should include all the details necessary to implement the system and to understand the whole working of the system. 3.7 Prototype Design Prototype is a working system that is developed to test ideas and assumption about the new system. Like any computer-based system, it is the first version of an information system – an original model. The prototype is actually a pilot or test model. It is designed to be changed. Information gained through its use is applied to a modified design that may again be used as a prototype to reveal still better design information. The process is repeated as many times as necessary to reveal essential design requirements. In general, prototypes are considered to be most useful under the following conditions. ● No system with the characteristics of the one proposed has yet
been constructed by the developers. ● The essential features of the system are only partially known,
others are not identifiable even through careful analysis of requirements.
● Experience in using the system will significantly add to the list of
requirements the system should meet. ● Alternate versions of the system will evolve through experience
and additional development and refinement of its features. ● The system users will participate in the development process.

CIT 212 SYSTEMS ANALYSIS AND DESIGN
105
The underlying principle of prototype is as listed below: ● Users can point out features they like or dislike and so indicate
shortcomings in an existing and working system more easily than they can describe them in a theoretical or proposed system. Experience and use produce more meaningful comment than analysis of charts and narrative proposals.
● Systems prototyping is an interactive process. It may begin with
only a few functions and be expanded to include others that are identified later. It may also start with what both analyst and user believes is a complete set of functions that may expand or contract through use and experience.
Typically, these are the steps in the prototyping process: ● Identify the user’s known information requirements and features
needed in the system. ● Develop a working prototype ● Use the prototype, noting needed enhancements and changes.
These expand the list of known system requirements. ● Revise the prototype based on information gained through user
experience. ● Repeat these steps as needed to achieve a satisfactory system. At these steps suggest, prototyping is not a trial-and-error development process. Before starting the system design work, user and system analyst sit together and discuss to identify the requirements. These discussions form the basis for the construction of the prototype. System analyst is fully responsible for the development of the working prototype. 4.0 CONCLUSION In this unit, you have been taken through the various parts of the system design process and how to generate the blueprint that helps in developing and implementing the new system. Also you have learnt how to design a prototype, its features and advantages, underlying principles and the basic steps in prototyping process.
CIT 212 SYSTEMS ANALYSIS AND DESIGN
106
5.0 SUMMARY The role of system analyst is considered to be very significant in designing of system. During this stage, he applies his understanding of the procedures and converts them into an efficient system. The design is a solution-translation of requirements into ways of meeting them. The design phase focuses on the detailed implementation of the system recommended in the feasibility study. Emphasis is on translating performance specifications into design specifications. The design phase is a transition from a user-oriented document to a document oriented to the programmers or database personnel. System design is not an exact science like programming where a set of instructions would lead to a desired result. As the subject involves lot of interaction with the users, it has to be flexible and dynamic to meet the changing needs of the usersover a period of time. 6.0 TUTOR-MARKED ASSIGNMENT 1. List out the various parts of system design process. 2. Define “system specification” briefly. 3. What do you know about “Prototype Design”? 7.0 REFERENCES AND FURTHER READINGS Analysis & design of information systems – James A Senn, Mc-Graw
Hill Book Co. (1986) Structured Analysis and Systems Specification – Tom De Marco,
Prentice Hall (1979) The Practical Guide to Structured system Design – Page Jones Mellir,
The Yourdon press (1980) Managing the Structured Techniques – Edward Yourdon, Yourdon,
Yourdon Press (1979)

CIT 212 SYSTEMS ANALYSIS AND DESIGN
107
UNIT 2 INPUT DESIGN AND CONTROL CONTENTS 1.0 Introduction 2.0 Objectives 3.0 Main Content
3.1 Processing Transaction Data 3.1.1 Batch Processing 3.1.2 Online Processing
3.2 Elements of Input Data 3.2.1 Input Data 3.2.2 Source Documents
3.3 Input Media and Devices 3.4 Input Device Guidelines 3.4.1 Controlling Amount of Data 3.4.2 Avoiding Delay 3.4.3 Avoiding Errors in Data 3.4.4 Avoiding Extra Steps 3.4.5 Keeping the Process Simple 3.4.6 Major Concerns regarding Input 3.5 Input Verification and Control 3.5.1 Key Verification 3.5.2 Use of Self-Checking Numbers 3.5.3 Visually Displaying an Identifying Characteristics 3.5.4 Hash Totals 3.5.5 Checking between a Range of Numbers 3.5.6 Reasonableness Test 3.5.7 Verification and Codes 3.5.8 Verification of Data Type 3.5.9 Verification that Certain Combination of Data Exist 3.5.10 Sequence Check 3.6 Data Dictionaries 3.7 How to Layout Terminal Screen 3.7.1 Designing of CRT-Input Display Screen 3.7.2 Basic Rules for CRT-Input Display Screens 3.8 Major Concerns regarding CRT-Input Screen Design 3.8.1 Ease of Use 3.8.2 Improved Processing Speed 3.8.3 Menu Driven Screens 3.8.4 Emphasizing Information on Display Screens 3.8.5 Colour Use in Screen Design 3.8.6 Colour Selection 3.8.7 Editing Through Display Screens 4.0 Conclusion 5.0 Summary
CIT 212 SYSTEMS ANALYSIS AND DESIGN
108
6.0 Tutor-Marked Assignments 7.0 References/Further Readings 1.0 INTRODUCTION Once the analysis and design of the system has been done, it would be necessary to identify the data that are required to be processed to produce the outputs. Input is one of the most expensive phases of the operation of a computerized system and creates sometimes a major problem. Different type of problems with a system can usually be traced back to faulty input design method. Needless to say, therefore, that the input data are the lifeblood of a system and have to be analyzed and designed with utmost care and consideration. Input design features can ensure the reliability of the system and generate correct reports from the accurate data. The input design also determines whether the user can interact efficiently with the system. 2.0 OBJECTIVES After studying this unit, you should be able to understand the following: ● Importance of input design for producing the correct report. ● Criteria for selecting the most appropriate input method and
medium for an application. ● Development of a system for validating input to a computer
application. ● Preparing layout for terminal screens. 3.0 MAIN CONTENT 3.1 Processing Transaction Data Transaction System: The transaction processing system keeps records of routine business activities, follows standard operating procedures, and does not require complex decision-making. These systems also depend on accurate and detailed data and must be able to process large volumes of data in short periods of time. Examples of transaction system are accounting, inventory, sales-order entry, banking and airline reservation systems. All of these applications follow a transaction – processing cycle, which begins by entering the data, continues by processing the data, and concludes by presenting the output. Data can be entered into a computer system in many ways. At a bank, customers can enter their transaction through an automatic teller terminal. At a supermarket, prices may be read by an optical scanning device. At a travel agency, airline

CIT 212 SYSTEMS ANALYSIS AND DESIGN
109
reservations are entered through a terminal. Regardless of the method used, the data must be entered accurately as well as efficiently. Once the data have been entered into a transaction system, it must be processed. Mainly there are two ways of processing the data. One is batch processing and the other method is online processing. 3.1.1 Batch Processing In the batch processing the data are collected for a given period of time, and the resulting “batch” of data is processed as a single job. Batch processing is useful when most of the records in a large database must be processed at the same time. Many organizations also use batch processing methods for billing. Telephone, gas, electric, and cable TV companies, for example, prepare their bills using batch processing. Even Payroll-whether processed weekly, or monthly – is almost handled through batch processing. 3.1.2 Online Processing Although batch processing is still used for some applications, today an increasing number of companies choose online transaction-processing system. Online systems can reduce data-processing costs, offer better customers service, and provide a strategic advantage over competitors. In online systems, data are processed instantly by the CPU. As a result, whenever a user wishes to enter or access data, the request is accommodated within a few seconds. Unlike bath processing, each request is processed individually – there is no waiting while groups of request are batched and processed together. Online systems are thus, preferred when selected records must be processed at any single point of time or when the user and computer system must interact. Because online transaction-processing systems can access data instantly and because many transaction systems must accommodate large volumes of data, larger systems generally include several disk drives with capacities of several billion bytes of data. Tapes and optical storage, if used at all, serve as a backup medium, storing additional copies of the data in the event that those stored on disk are lost or damaged. But an OLTP (ONLINE TRANSACTION PROCESSING) system that brings data within instantaneous reach can also, if it breaks down, brings many of an organization’s activities to a screening halt. Imagine the consequences of the failure in a bank deposit system. Not only would it be difficult, if not impossible, to continue serving customers, but the
CIT 212 SYSTEMS ANALYSIS AND DESIGN
110
cost to the bank for even a few hours of service interruption could be very high. Because many organizations have become so dependent on OLTP systems and because failures can be dramatically disruptive, some firms have chosen to purchase fault-tolerant computer systems. These systems use additional hardware and software to help avoid a system failure. One key ingredient is the use of disk mirroring, a scheme in which the system maintains a mirror image of critical disk data on two physical separated disk drives. Whenever data are entered into the system, they are automatically entered into both devices, in the event of a disk failure, the system will automatically retrieve the data from the working disk. In addition, fault-tolerant computer systems can through hardware and software, circumvent portions of the hardware if the electronic circuitry breaks down. Two other important characteristics of an OLTP are its multi-user and multi-tasking capabilities. A multi-user, OLTP serves many users, each executing a different JOB, at what appears to be the same time. For example, it allows several people to sit at terminal scattered throughout an organization and work on problems that may be totally unrelated to one another. One user may be entering accounts receivables transactions, another may be entering accounts payables; and a third may be producing an inventory report. Each user has the impression that no one else is using the system, thanks to complex online operating system software that keeps the separate uses of the system disentangled. 3.2 Elements of Input Data Inaccurate input data are the most common cause of errors in data processing. Errors entered by data entry operators can be controlled by input design. Input data are collected and organized into groups of similar data. Once identified, appropriate input media are selected for processing. 3.2.1 Input Data The goal of designing input data is to make data entry as easy, logical and error-free as possible. In entering data, operators need to know the following: • The allocated space for each field. • Field sequence, which must match that in the source document. • The format in which data fields are entered; for example, filling
out the date field is required through the edited format mm/dd/yy. When we approach input data design, we design the source documents that capture the data and then select the media used to enter them into the computer. Let us elaborate on each step.

CIT 212 SYSTEMS ANALYSIS AND DESIGN
111
3.2.2 Source Documents Source data are captured initially on original paper or a source document. For example, a cheque written against an account is a source document. When it reaches the bank, it is encoded with special magnetic ink character recognition (MICR) so that it can be processed by a reader that is part of the information system of the bank. Therefore, source documents initiate a processing cycle as soon as they are entered into the system. Source documents may be entered into the system from punch cards, from diskettes, or even directly through the keyboard. A source document may or may not be retained in the proposed system. Thus, each source document may be evaluated in terms of: - its continued use in the proposed system. - the extent of modification for the proposed system & - replacement by an alternative source document. A source document should be logical and easy to understand. Each area in the form should be clearly identified and should specify for the user what to write and where to write it. For example, a field as simple as date of birth may be written in four different ways: - 5 December, 1994 - Dec. 5 1994 - 12/5/94 -` 5/12/94 (European style) Unless it is clear in a source document that two digits are allowed for the month, day, and year (MM/DD/YY), we could expect such combinations of responses. 3.3 Input Media and Devices Source data are input into the system in a variety of ways. The following media and devices are suitable for operation: (a) Punch cards are either 80 or 96 columns wide. Data are arranged
in a sequential and logical order. Operators use a keypunch to copy data from source documents onto cards. This means that the source document and card design must be considered simultaneously.
(b) Key-to-diskette is modelled after the keypunch process. A
diskette replaces the card and stores up to 3250000 characters of data – equivalent to the data stored in 4050 punch cards. Like cards, data on diskettes are stored in sequence and in batches.
CIT 212 SYSTEMS ANALYSIS AND DESIGN
112
The approach to source document and diskette design is similar to that of the punch card. Data must be in sequence and logically cohesive.
(c) MICR translates the special fonts printed in magnetic ink on
checks into direct computer input. (d) Mark-sensing readers automatically convert pencil marks in
predetermined locations on a card to punched holes on the same card.
(e) Optical character recognition (OCR) readers are similar to MICR
readers, except that they recognize pencil, ink or characters by their configuration (shape) rather than their magnetic pattern. They are often used in remote location as free-standing input preparation devices or direct input media to the system.
(f) Optical bar code readers detect combination of marks that
represent data. The most widely known system is the Universal Product Code (UPC), which codes retail items in stores. Automatic tag reading is a major breakthrough in speeding up customer service and eliminating costly data input errors at the point of sale. It is virtually impossible for the sale clerk to enter incorrect merchandize information such as department and class type data. Automatic tag reading is the ideal way to collect unit inventory information fast, accurately and economically.
(g) Cathode ray tube (CRT) screens are used for online data entry.
CRT screen generally display 80 characters simultaneously on a television-like screen. They show as many as 24 lines of data.
In addition to determining record media, the analyst must decide on the method of input and the speed of capturing and entering the data into the system. Processing may be batched (a group of records handled as a unit), online (records processed directly), sequential (Sorted records), or random (unsorted). For example, magnetic tape may be suitable for batch sequential processing, whereas diskettes are ideal for online processing and random inquires. 3.4 Input Device Guidelines The design of input play very significant role in getting the correct output. It covers all phases of input from creation of initial data (original recording) to actual entering that data to the system for processing. The input design is the link that ties the information system into the world of its users. Some features of design may vary depending

CIT 212 SYSTEMS ANALYSIS AND DESIGN
113
on whether the system is batch-oriented or online. Here, we will discuss the various objectives of input design. They focus on: - Controlling amount of input - Avoiding delay - Avoiding errors in data - Avoiding extra steps - Keeping the process simple. Each of the five objectives of input design is briefly discussed below: 3.4.1 Controlling Amount of Data An effective design controls the quantity of data for input for the following reasons: Firstly, data preparation and data entry operations depend on people. Since labour costs are high, the cost or preparing and entering data is also high. It is quite evident, then, that reducing data requirements mean lowering costs through reduced labour expense. Secondly, the input phase of computing can be a slow process and take many times longer than that needed by computers to carry out their tasks. In fact, the computer itself may sit idle until data is prepared and input for processing. By reducing input requirements, the analyst will speed the entire process from data capture to processing to provide results to users. 3.4.2 Avoiding Delay When processing is delayed owing to data preparation or data entry, the cause is called a bottleneck. Avoiding bottlenecks when designing input should always be one of the objectives of the analyst. 3.4.3 Avoiding Errors in Data The third objective deals with errors. In one sense, the rate at which errors occur is dependent on the quantity of data. Since the lower the amount of data that is inputted, the fewer the opportunities for the error to occur. Firstly, the analyst can reduce this number by reducing the volume of data that must be entered for each transaction. Secondly, the analyst can also affect error rates of an operation through design. The manner in which data must be entered can reduce the chance of errors.

CIT 212 SYSTEMS ANALYSIS AND DESIGN
114
Still, a third aspect of error control is the need to detect errors when they do occur. Checks and balances in the data entry programs, called input validation techniques, also detect errors in input. 3.4.4 Avoiding Extra Steps Sometimes the volume of transactions and the amount of data preparation or data entry jobs resulting from them cannot be controlled. For example, in bank cheque processing runs or in large retail sales firms, the number of transactions to process runs into the tens of thousands. When the volume cannot be reduced, the analyst must be sure that the process is efficient. The experienced analyst will also avoid input designs that cause extra steps. The effect of saving a single step when feeding details of cheque into the banking process is multiplied many times over in the course of a working day. So is the addition of a single step. 3.4.5 Keeping the Process Simple Perhaps the best advice to achieve all of the objectives mentioned in the simplest manner possible. The best-designed system fits the people who will use it in the way that is comfortable for them, and at the same time it provides the error control methods management acceptable to the users. In contrast, one will have to work to get users to accept complex or confusing input design, and there is no guarantee he will succeed in installing and running complex system. So it is advisable to avoid complexity when there are simple alternatives. 3.4.6 Major Concerns Regarding Input Important points to be considered here are as follows: - What input is needed? - How and where is the input created? - How should the source documents be designed? - What format should be used for the input records? - What medium should be used for recording the input? We will discuss each of the major input concerns briefly: The Input Needed The input needed for any program is determined by the output desired. The analyst must ask the following questions. What information is
CIT 212 SYSTEMS ANALYSIS AND DESIGN
115
already in the master file or database? What constant data is required that can be entered from some type of control record? What information must be supplied by using some type of transaction file? What data should be stored in and accessed from tables? What information can be calculated by the program? Anytime the use of a transaction file is being considered, or the data is to be entered from a terminal, the analyst must check each filed to determine whether the data is already in a master file or might be included in a table. The analyst must be concerned that all of the data required to produce that output is entered into the program in the most efficient and cost-effective manner.
How and where data is generated
How the data is generated, and where it is generated, has a direct impact on a number of other questions. In a cost-accounting system, much of the data is generated when material is put into production. The analyst should attempt to provide a reliable means of entering data directly into the system from the factory. Data collection devices or special terminals can be used to enter some of the data.
In a retail sales system, a type of scanner device – Bar Code Readers may be used to read price tickets. When charge sales are made, special readers are available that make it possible to use the data stored on the customer’s charge card. Whenever possible, the manual keeping of data should be eliminated. In a retail sales application, the only variable data that a clerk might need to key in on a Point of Sale (POS) Terminal having special key for various item categories is the quantity of a given item that is purchased. For processing of electricity bills, the computer system itself first generate an input sheet containing Home Number-wise table covering from street to street the customer details – Meter No. Reading of Last Cycle, Type of Customer – Domestic/Charitable Society/Govt./Business keeping the single field blank-present meter reading. This input sheet facilitates the Meter Reader to enter single blank entry after verifying corrections in other columns of table.
Railways Reservation System presents an input screen simply on entering the Train code, Travel Class and Date of travel wherein if reservation is asked, the clerk has to enter passenger’s details almost in same way as given by the reservation slip.
In large Tea Gardens of Assam spread over several kilometres, Hand held terminals in Mobile Vans are used to enter leaf Plucker’s code and weight of leaf plucked on daily basis moving from one garden to another and entire data is updated returning back to Computer Centre which
CIT 212 SYSTEMS ANALYSIS AND DESIGN
116
generates weekly payment reports for forced workers and next days schedule for labour deployment in new gardens. Designing the Source Document and the Input Format The format for the input records and the source documents should be determined simultaneously. The source document can be designed as soon as it is determined what data is needed and where and how it is to be entered into the system. The analyst should work with the data entry supervisor. The design of the documents should permit the personnel recording the data to do so as early and as rapidly as possible. Check boxes can be used, which reduce the time needed to fill out documents and minimize recording errors. Take the case of Electricity bills. It has two parts. First is called ‘MAIN’ on which cash/cheque receiving clerk enters the amount received with details including the date and hands over to the customer as a payment made by him. The second is called ‘STUD’ which are bundled together on day end and sent to Computer Centre for data update of payments received from the customers for future accounting for ease in transcribing data into a machine process-able form, the locations for each field with the record should be specified on the documents. Identical design of some document and related Data Entry Input screen facilitates Data Entry Operators to enter data at high speed since locations of data to be read are easily identical. The input record should be designed so that the flow of data on it is the same as on the source document. This decreases the time needed to record data and also reduces errors. The input format must be designed concurrently with the source document. The factors that must be considered are record length, field size, use of codes, and the relationship of the source document to the input record. When a terminal is used to make the changes or to add new customer to the file, a formatted screen should be designed that looks very much like the source document. The operator fills in the blank and these may be used to indicate the number of characters that can be entered in much the same way the form would be filled in manually. The analyst must understand the characteristics of the data entering the system and determine the field size that should be used. For example, if each customer is assigned a number and the firm now has 9,945 customers, the analyst should allow five positions for the filed. If five positions are not reserved for the field, as soon as 54 more records are added, the field will not be large enough to handle the account number.

CIT 212 SYSTEMS ANALYSIS AND DESIGN
117
Filed sizes are usually determined by studying historical data, projecting future needs, and purchasing for growth. Input Method An input method that requires a minimal amount of data conversion should be selected. If punched-card recorders (key-puncher), diskette recorders, key-to-key tape recorders, or terminal are used, the data is usually recorded on a source document and then transferred to the machine-processable medium (cards, diskettes, tape, disk, or directly into a transaction file). In case of process control, however, these media-based program directly control the target machines. 3.5 Input Verification and Control If incorrect data enters the system, it is usually very costly to make the necessary corrections. Also, how expensive would it be to have your operator record a quantity of 100 rather than 10 for a shipment of sports cars? The shipping charges for sending the cars to the customer and then of having them returned would be one of the costs. While the 90 extra cars were in transit, they would not be available to other customers (which could result in a lost of sales) or could be damaged. There are many methods which are commonly used to verify data entering the system as input. Some of them are: 3.5.1 Key Verification A second operator re-keys the data already recorded. This method is used for verifying data recorded in punched cards or on diskettes and magnetic tape. Then two floppies are compared to correct record by record which mismatched during comparison after verifying, from the original documents. This is most effective method used by Computer Service business for data validation. 3.5.2 Use of Self-Checking Numbers The computer can be programmed to reject numbers that have been transposed or have one or more wrong digits. Check digits or self-checking number routines can be effectively used for numbers in a series, such as student roll numbers, account numbers, part numbers, or invoice numbers are popular for such jobs.
CIT 212 SYSTEMS ANALYSIS AND DESIGN
118
3.5.3 Visually Displaying an Identifying Characteristics When using a terminal, a part number is entered. Displayed in the VDT is the description of the part, which is then visually confirmed by the operator. 3.5.4 Hash Totals Sometimes numbers are added to produce a meaningless total called a hash total. For example, totalling is made of the quantity of all items purchased. When the records are entered and processed, the hash total is compared to the original total. If the two totals agree, it is an indication that all quantities were entered correctly and all records were processed. 3.5.5 Checking between a Range of Numbers The numbers on the orders being processed on a given day should fall between, say, 4999 (the last number from the previous day) and 6001 (the next order number that will be on all of the orders processed by the next day). If the order number recorded on the input record does not fall within that range, an error message will be generated. 3.5.6 Reasonableness Test Based upon past history, some input can be checked to see if it is reasonable. For example, because of long-standing company policy, it is unlikely that any employee will have more than 20 hours of overtime. If more than 20 hours of overtime are recorded in an employee’s current transaction record, an error message will be generated as the data is being edited. Similarly in ‘Date of Birth’ field, it is checked that no date is more than 31, month number is more than 12 and the year is not more than the current year or current year minus minimum age prescribed. 3.5.7 Verification and Codes The pay and fringe benefits are calculated for employees based upon their payroll status. Assuming that the valid status code must be either an H (hourly), S (salaried), T (trainee), or a P (part-time), an error message would be generated if the code used was not an H, S, T, or P.
CIT 212 SYSTEMS ANALYSIS AND DESIGN
119
3.5.8 Verification of Data Type Some input fields should contain only numeric data while others should contain only alphabetic data. The fields can be edited to make certain that only the right type of data is recorded in each field.
3.5.9 Verification that Certain Combination of Data Exist For example, all students may be coded with either a W or a V. The V denotes a non-work-study student while the W indicates that the student is on work-study. The only valid account numbers for a work-study student are 2155 and 2156. Any other account number for a W-coded student is invalid.
3.5.10 Sequence Check If the numbers in the source documents are serial and the documents are in order, the input records will also be in numerical sequence. A check can be made by the program to determine whether the records are in either ascending or descending order. SELF-ASSESSMENT EXERCISES i. List the various input devices for feeding the raw data into the
system. ii. Explain briefly the objectives of input design. iii. List out the methods commonly used for input verification and
control.
3.6 Data Dictionaries Data dictionary stores description of data items and structures as well as systems processes. It is intended to be used to understand the system by analyst who retrieves the details and descriptions it stores. He takes the help of data dictionary during system deign, when information about such concerns as data length, alternate names (aliases) and data use in particular processes must be available. The data dictionaries have also validation information in storage to help the analyst in specifying control in system’s acceptance of data. The dictionary also contains definitions of data flows, data stores and processes. Data dictionaries can be developed manually or using automated systems. Automated systems offer the advantage of automatically producing data elements, data structure and process listings. They also perform cross-reference checking and error detection. Automated dictionary systems are becoming the norm in the development of computer information systems. For further study about data dictionary, please consult Unit 4 of Module 1.
CIT 212 SYSTEMS ANALYSIS AND DESIGN
120
3.7 How to Layout Terminal Screen Software is available that make it easy to layout screens. The programmer keys in the required format on the screen, gives the format a name and then stores the format in a file. Whenever the format is to be used as a display in a program, it can be called into the program by using its name. A programmer can also create display screens within a program. 3.7.1 Designing of CRT-Input Display Screen Special considerations are needed for input design in online environments. The analyst must design CRT screens that tell the user what to do and what steps to take next in a way that is brief, yet easy to understand. Menus are often used to present options to users and data fields are marked to show their length while telling the user where to enter the data. Data entry in online systems also includes the ability to edit data. In each of these cases, valid entries must be identified and communicated to programmers so that they develop the software to accept correct entries and reject those that are invalid. 3.7.2 Basic Rules for CRT-Input Display Screens There are a few basic rules that must be followed in displaying information on a screen. The important points to remember are: ● Clear the entire screen between formats. There is usually a “clear
screen” command that can be used. ● Format the output so that it is easy to read. For example, don’t
clutter up the screen with unnecessary information. Always display directions or error messages in the same place on the screen, and leave space between items so that the information is easy to read.
● Prevent scrolling. Unless delays are coded into programs,
information is displayed on a VDT faster than most people can read. One screen of information should be displayed at a time. When the operator is ready, a specified key is depressed and a new screen of information is displayed
● Don’t overuse colour. Often monitors that display information in
colour are used for terminals or for microcomputers. Carefully controlled use of colour can make the information more understandable, uncontrolled use of colour adds confusion.
CIT 212 SYSTEMS ANALYSIS AND DESIGN
121
● Be consistent. For example, all instructions may be displayed at the bottom of the screen.
● Develop and use simple conventions such as having an operator
enter a ‘I’ or ‘Y’ for a positive response to a question or a statement.
● Make certain that all directions are clearly stated. ● Test all screens. Have someone totally unfamiliar with the
program to lead the program and enter the required data without using the help option before same is released commercially.
3.8 Major Concerns Regarding CRT-Input Screen Design Major concerns regarding CRT – input screen designs are as follows: ● Ease of use ● Improved processing speed ● Menu driven screens ● Emphasizing information on display screens ● Colour use in screen design ● Colour selection ● Editing through display screens We will discuss each of them below: 3.8.1 Ease of Use One of the most common approaches in designing easy-to-use CRT screen displays is the fill-in-the-blank approach. The analyst simply formats the initial input display so that all the required data elements are clearly labelled and a space is provided for data entry. The display should be aesthetically designed and all descriptions and error messages should be meaningful in clear statements. In other words, care should be taken to avoid symbols and over abbreviations. 3.8.2 Improved Processing Speed Some of the ways to reduce data entry requirements include: - Designing the screen display so that responses can be abbreviated
example, entering “Y” instead of “Yes” - Designing the screen format so that the order of data entry is
consistent with the business transaction. This feature eliminates unnecessary “tabbing” around the screen.

CIT 212 SYSTEMS ANALYSIS AND DESIGN
122
- Designing the screen format so that data can be changed are “unprotected” and data that cannot be or should not be changed are “protected”.
- Using program function keys, which are available on many of the
sophisticated terminals and can literally trigger a transaction when a single button is pushed.
- Using terminals that have additional application-specific features
(for example, a number pad can be helpful for accounting systems. Point of Sale Terminals in Hotels, Super Bazaars etc.
3.8.3 Menu Driven Screens Since online systems provide several input and processing options to users, a method of showing the options the user can choose from is needed. Menus serve this purpose. A menu is a screen of information displayed on the CRT that shows the user what functions can be performed and how to select them. Menus that provide selections to users in a top-down fashion ensure that systems are easy to use, while making the choice of what to do next should be a simple procedure. The system leads the user through a series of decisions until the correct procedure is selected. For instance, a narrative dialogue to lead someone through the steps in editing sales budget data would probably sound something like this: - You are using the sales system. Which function do you wish to
select? (The user depressed “3” for the EDIT MENU option shown on the main screen.
- You have selected the edit option from the main menu. Which of
these editing options do you wish? (The user depresses “I” for the EDIT BUDGET option shown on the edit menu.
- You have selected the edit budget option from the edit Menus
accomplish the same thing with few words. This is why analysts and users alike prefer them to write instructions or the display of narrative information on the screen. Notice the uncluttered look of the screen, even after all headings and options are displayed. It would be difficult to preserve the easy-to-read displays if the narrative above was shown instead of the menu option.
CIT 212 SYSTEMS ANALYSIS AND DESIGN
123
3.8.4 Emphasizing Information on Display Screens Often the analyst will use features built into hardware and software to call information or messages to the attention of users. For example, error messages or reports of acceptable actions (such as submitting invalid data or asking the system to perform a function now expected by the program) are best displayed by using one of the techniques listed below. Likewise, when the user enters data for processing, the analyst may display a message informing the user the data has been accepted and processing has begun. The methods of emphasis that many systems offer are: - Blinking - Underlining - Increased/reduced light intensity - Inverse video (black letters on light screen) 3.8.5 Colour Use in Screen Design When large amount of information must be presented on a display screen, the analyst may use colour to provide better structure and meaning to the information. Related items can be tied together by colour so the user can spot then more quickly. For instance, a report showing sales, costs, and profits for various regions may be presented using colours to show each type of cost across departments. If properly used in the design, colour will assist the user in understanding information on the screen, determining what steps are valid, and reducing errors. Colour has four primary uses (1) identifying valid operations the user can carry out (2) typing related data together (3) highlighting information about organization performance and (4) communicating messages about system performance. 3.8.6 Colour Selection Colour meaning is lost if they are used improperly or if excessive colour is used. No more than four colours can be quickly recognized by users. The most useful colours are red, green, yellow and blue. Contrasts are most effectively presented through the colour pairs of red and green, yellow and blue, or white and blue. Colour can be effective when there is a reason for its use. However, if the analyst specifies colour only for the sake of colour, the impact of
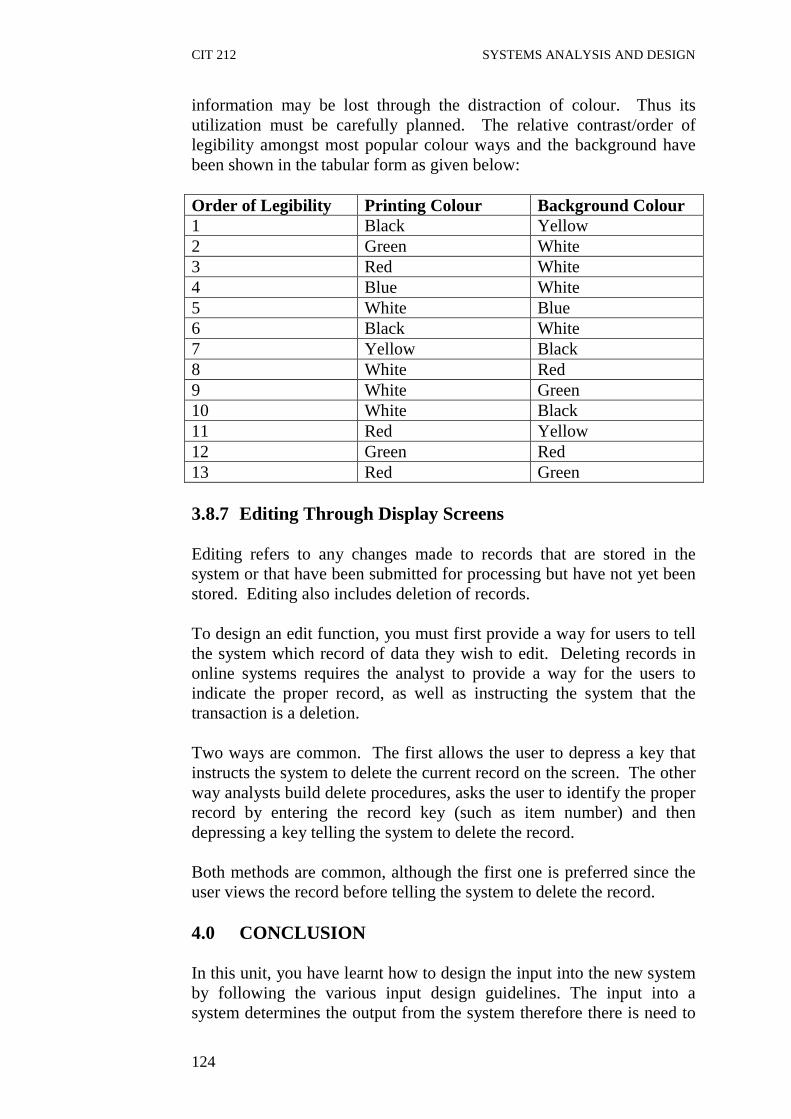
CIT 212 SYSTEMS ANALYSIS AND DESIGN
124
information may be lost through the distraction of colour. Thus its utilization must be carefully planned. The relative contrast/order of legibility amongst most popular colour ways and the background have been shown in the tabular form as given below: Order of Legibility Printing Colour Background Colo ur 1 Black Yellow 2 Green White 3 Red White 4 Blue White 5 White Blue 6 Black White 7 Yellow Black 8 White Red 9 White Green 10 White Black 11 Red Yellow 12 Green Red 13 Red Green 3.8.7 Editing Through Display Screens Editing refers to any changes made to records that are stored in the system or that have been submitted for processing but have not yet been stored. Editing also includes deletion of records. To design an edit function, you must first provide a way for users to tell the system which record of data they wish to edit. Deleting records in online systems requires the analyst to provide a way for the users to indicate the proper record, as well as instructing the system that the transaction is a deletion. Two ways are common. The first allows the user to depress a key that instructs the system to delete the current record on the screen. The other way analysts build delete procedures, asks the user to identify the proper record by entering the record key (such as item number) and then depressing a key telling the system to delete the record. Both methods are common, although the first one is preferred since the user views the record before telling the system to delete the record. 4.0 CONCLUSION In this unit, you have learnt how to design the input into the new system by following the various input design guidelines. The input into a system determines the output from the system therefore there is need to

CIT 212 SYSTEMS ANALYSIS AND DESIGN
125
verify and control the input into the system which is why you have been taken through the various methods of input verification and control. Also you have learnt about data dictionaries and how to design the CRT-input screen since that is the most common means of getting input into the system in a transaction processing system. 5.0 SUMMARY In this unit, we have discussed the responsibilities of analysts for the design of input specifications. Various methods for capturing data and validating its accuracy have also been studied. The overall objectives of input design stress minimizing the quantity of data for input while controlling errors and delay. An effective design will also avoid extra steps in input while ensuring that the entire process is quite simple for users and data entry operators. Data dictionary and input screen design have also been discussed briefly. 6.0 TUTOR-MARKED ASSIGNMENTS 1. What do you understand by ‘Data Dictionary’? 2. Explain briefly major concerns regarding CRT-Input screed
design. 3. What is the importance of colour use in screen design? 7.0 REFERENCES/FURTHER READINGS Analysis & design of information systems – James A Senn, Mc-Graw
Hill Book Co. (1986) Structured Analysis and Systems Specification – Tom De Marco,
Prentice Hall (1979) The Practical Guide to Structured system Design – Page Jones Mellir,
The Yourdon press (1980) Managing the Structured Techniques – Edward Yourdon, Yourdon,
Yourdon Press (1979)
CIT 212 SYSTEMS ANALYSIS AND DESIGN
126
UNIT 3 OUTPUT SYSTEM DESIGN CONTENTS 1.0 Introduction 2.0 Objectives 3.0 Main Content
3.1 Types of Output 3.1.1 Application Output 3.1.2 Operating Output
3.2 Output Devices 3.3 Output Design Consideration 3.4 Design of Output Reports 3.5 Design Screen Output 3.6 Menu Design 3.7 Form Design and Control
3.7.1 Form Design 3.7.2 What is Form? 3.7.3 Classifications of Forms 3.7.4 Factors to be Considered in Form Design 3.7.5 Forms Control
3.8 Computer Graphics 3.8.1 Presentation Graphics 3.8.2 Decision Support Graphics 3.8.3 Graphics Hardware/Software
4.0 Conclusion 5.0 Summary 6.0 Tutor-Marked Assignments 7.0 References/Further Readings 1.0 INTRODUCTION Presenting the data processed by a computer-based information system in an attractive and stable form has become very essential these days. Success and acceptance of a system to some extend depends on good presentation. Therefore, system analyst must know fully how to design output report in an attractive way. Many new output devices are being introduced in the market because of recent development in computer technology. System analyst must be aware of this new technology and try to use these new output devices if possible. Currently, excellent graphic displays are widely available. Speech output systems are also fast emerging. There are three main reasons why outputs from the computer are required. They are:

CIT 212 SYSTEMS ANALYSIS AND DESIGN
127
(i) For communicating to the persons concerned. (ii) For re-input to the computer for being connected with other data
and further processing. (iii) For permanent storage. 2.0 OBJECTIVES After going through this unit, you should be able to: ● identify the devices used to output information from a computer ● enumerate the design consideration ● design a form ● explain the design of screen output ● list role of graphics in output ● enumerate record structure and report layout consideration. 3.0 MAIN CONTENT 3.1 Types of Output Outputs of a system can take different forms. The most common are reports, displays on screen, printed forms etc. The outputs also vary in terms of their contents, type of stationery, frequency and timing etc. Besides, due consideration also need to be given as to who will use the output and for what purpose. All these points must be kept in mind while designing outputs so that the objectives of the system are met in the best possible way. Outputs of a data-processing system can be placed into two categories: ● Application Output ● Operating Output 3.1.1 Application Output These are the outputs desired out of the system to meet its objectives. These are of three types: (i) Output as a basis for decision-making. This type of output is
generally required by management for decision-making purposes. (ii) Output as a requirement to meet a functional objective. Invoices,
Excise Gate Pass, Purchase Orders are the examples of such output.
CIT 212 SYSTEMS ANALYSIS AND DESIGN
128
(iii) Statutory Outputs: All organizations are required to produce a certain amount of reports and forms as required by law. Examples are ‘C’ forms, ‘3A’ and ‘6A’ forms for provident fund, income tax certificates etc.
3.1.2 Operating Output These outputs are mainly generated for use of E.D.P. (electronic data processing) staff and give various indications as to how the system operates. System logs, error messages, status indicators etc. are the examples of such output. These types of output are not concerned for the users. 3.2 Output Devices The most important output devices are printers, video display units (VDUs) computer output microfilm (microfiche). Printers are mainly used in the following situations: ● when large volume of output is required ● when output is to be distributed to various persons inside/outside
the organization ● when batch processing systems are used. Printer is one of the most common output devices. It provides the user with permanent visual records of the data output from the computer. Printers can print on ordinary paper or on specially designed forms such as dispatch notes invoices or packing slips. Printers can print 150-2500 lines per minute, each line consisting of as many as 150 characters. Printers are mainly of two types: Impact printers and non-impact printers. In impact printers, a print head strikes a print ribbon which points a character on paper. Non-impact printers have no mechanical print head. Characters on such printers are printed using either a jet of ink or laser beam. These printers are little bit costlier. For example, laser printers are widely used in Desktop Publishing (DTP) system because of producing excellent quality prints. Impact printers are of two types: line printers in which a whole line is printed at a time and character printer which allow printing of one character at a time. Line printers are quite impact and fast in printing. Generally these printers point in the range of 1000-1200 lines per minute. They are a little bit expensive and mainly used for large volume of printing. Character printers are cheaper but slower in speed (around 80 to 90 characters per minutes). They are generally used for low printing such as in word processing.

CIT 212 SYSTEMS ANALYSIS AND DESIGN
129
Video display units use Cathode Ray Tubes (CRTs) for display purposes. They have keyboard which is used for entering data. Twenty four lines, each 80 characters long, can be displayed on the display unit. VDUs are widely used in online systems to display results and answers to queries. Colour display units can display different colours. The information displayed on a VDU may be plotted on a plotter or recorded on a floppy diskette or video tape recorder. Computer Output Microfilm (COM) is an output that records output from a computer as microscopic images on roll or sheet film. The images stored on COM are the same as the images which would be printed on paper. The COM recording process reduces the size of character 24, 42 or 48 times smaller than would be produced from a printer. The information is then recorded on a sheet film called 16mm, 35mm microfilm or 105mm microfiche. The data to be recorded on the microfilm can be retrieved directly from the computer (online) or from magnetic tape which is produced by the computer (off-line). The data is read into a recorder where, in most of the system, it is displayed internally on a CRT. As data is displayed on CRT, a camera takes a picture of it and keeps it on the film. After this, the film is processed, either in the recorder unit or separately. Then it can be retrieved and viewed by the user. A new type of output unit emerging in the market is an audio output unit. Such an output device can be used to announce a result on a loudspeaker. Currently, the most common audio output gives digits of numbers. Short words are also synthesized by the computer. The pattern of bits corresponding to a word is stored in an audio output buffer storage. With the help of speech synthesizer, it is converted to spoken words. Presently, the speech output of synthesizers does not sound in a natural way. Lots of improvement is expected in this direction. The most common audio unit answers enquiries such as a request for telephone number, balance in one’s saving account number in a particular bank, etc. 3.3 Output Design Consideration Output to be produced usually depends upon the following consideration:

CIT 212 SYSTEMS ANALYSIS AND DESIGN
130
Type of user and purpose: Generally different levels of users will have different requirements from the system. Some want exception reports (e.g. when sales fall below a certain level), some want summary reports (e.g. sales quantity and value for each region) while some want details (e.g. list of invoices for a period). Again statutory reports will normally be as per requirement specified under the law and the designer will not have much flexibility to change the format.
Content: The data that are needed to be included in
the output. These will be related to the purpose of the output.
Format: This refers to the arrangement of data on the
report, size of the paper, titles, headlines, colour of the paper etc.
Frequency and timing: At what frequency (daily, weekly, monthly,
annually, etc.) and when (after annual closing of accounts, after the end of the fiscal year, before the last day of every month etc.
Volume: often sheer volume of the output deters one
from using the output. The sheer bulk of the report may also create problems for handling, filing or printing time.
Sequence: the usefulness of an output very often
depends on the sequence of data printed. A proper sequence will also help distribution of outputs to different users (e.g. pay-slips printed department-wise facilitate easier payments).
Quality: this relates to the content, appearance and
accuracy of the output. Outputs generated for external users should be given special attention in respect of its get-up, quality of paper, etc.
Type of stationery: Reports can be generated on ordinary blank
stationery or generally printed stationery

CIT 212 SYSTEMS ANALYSIS AND DESIGN
131
which is useful when most of the contents of the output (e.g. Invoice, Pay-slips etc.) are constant. This type of stationery has the following advantages.
- Saves computer time. - Attractive appearance convenient to use by the user. However, this stationery will normally be costlier than ordinary stationery. 3.4 Design of Output Reports A report normally has the following structure. ● A report heading which generally appears only on the first page
of the report. ● A page heading and sub-heading are given at the top of each page
of the report. ● A set of records containing some common features may be
grouped together. Such a group is named as control group. Control heading can be named for this group.
Table 1: Illustration of terminology used in defining the
structure of reports NATIONAL OPEN UNIVERSITY OF NIGERIA ROLL LIST OF MIT STUDENTS ROLL LIST OF STUDENTS FOR DIFFERENT COURSES OF SEMESTER 1/2006-7 LIST OF STUDENTS IN PASCAL ROLL NO NAME OF STUDENT 1001 Iyioluwa Adegboye Jegede 1002 Oluwaferanmi Afolorunso 1003 Ifeoluwadola Adegboye 1004 Asepeoluwa Oyetoro 1005 Ayanfeoluwa Jemima 1006 Kunle Balogun 1007 Jari Bilikisu - - -

CIT 212 SYSTEMS ANALYSIS AND DESIGN
132
1049 Jane Kalu 1050 Egila Jumai 1051 Lazarus Oghenetega 1052 Akpa Godson TOTAL NO. OF STUDENTS IN PASCAL = 52 LIST OF STUDENTS IN ‘C’ LANGUAGE ROLL NO NAME OF STUDENT 1070 Mundi Mana 1071 Adamu Faosat 1072 Agbu Lovina 1073 Sanusi Saheed 1074 Oshiorenua Usman 1075 Ogenetega Tiene 1076 Ikpe Carter 1077 Abiola Bashir 1078 Chukwu Emeka 1079 Ukpabi Eni - - 1088 Yemisi Bankole 1089 Habeeb Yishawu TOTAL NUMBER OF STUDENTS IN ‘C’ LANGUAGE = 20 TOTAL NO. OF STUDENTS IN SEMESTER 1/2006-7 = 570 END OF IGNOU ROLL LIST FOR SEMESTER 1/2006-7 Using table 1, we will explain the terminology: (i) The report heading appearing once for the report is NATIONAL OPEN UNIVERSITY OF NIGERIA – ROLL LIST OF MIT STUDENTS (ii) The page heading which will appear on top of each page is: ROLL LIST OF STUDENTS FOR DIFFERENT COURSES OF SEM. 1/2006-7

CIT 212 SYSTEMS ANALYSIS AND DESIGN
133
(iii) The page headings and sub headings are as follows: LIST OF STUDENTS IN PASCAL ROLL NO. NAME OF STUDENT Another control heading and sub headings in the same table are: LIST OF STUDENTS C LANGUAGE ROLL NO. NAME OF STUDENT (iv) In the above table the line 1001 Iyioluwa Adegboye Jegede Appearing below the heading ROLL NO. NAME OF STUDENT is called a detailed line. (v) Abstract of the information at the end of a control group is called
the control footing. In the above table, the following lines TOTAL NO. OF STUDENTS IN PASCAL = 50 TOTAL NO. OF STUDENT IN ‘C’ LANGUAGE = 20 are control footings. We have final control also in the report. The line Total No. of student in semester 1/2006-7 – 570 is called final control footing. (vi) Information written in the end of each page is called page
footing. (vii) Information printed in the end of each report is called report
footing. The report footing in the said report is END OF NOUN ROLL LIST FOR SEMESTER 1/2006-7
CIT 212 SYSTEMS ANALYSIS AND DESIGN
134
Having decided what report groups appear in a report, an analyst decides the layout of the report in a print chart which depicts the no. of columns and line in a report. A sample is shown in Fig. 1. The chart has a number of columns normally equal to that in a printer. The report heading, etc. are entered on the chart by the analyst to examine the way in which the printed output will appear. The most important consideration in designing the print chart is proper form layout for easy readability. The print chart helps in selecting appropriate headings, entering headings, picking control headings, etc. Once a form layout is determined using a print chart, it may be handed over to a programmer who may use an appropriate report generator program. For example, COBOL has a report generation program with its own rules of syntax and semantics. In the print chart, the number of columns reserved for each detail line to be printed by the program, including control footing and report footing, is indicated. One may use a convention used in a language such as COBOL to describe the format of the individual fields. In the Fig. 1. for example, the convention used is 9 for digits, X for characters, B for Blank, Z for digits or leading zeros and $ for currency symbols. The general principles to be used in designing outputs reports are: - The design must be such that it can be read from left to right and
from top to bottom. - The most important item, such as the key field, should be easily
available. - All pages must have a heading and a page number. The date on
which the report was prepared should also be printed. - Too many details should be avoided. - Control footing abstracts information about groups of detail lines
must be effectively used. - Similarly, pager and report footings must be properly defined. Reports are often sent to government agencies such as the tax department periodically. The formats for such reports are specified by government agencies and must be strictly followed. There are situations in which a large number of forms are to be printed, e.g. the marks records of high school examination may have to be printed for 10 candidates. In such a case, the name of the board which conducted the examination, subjects offered etc. can be pre-printed in
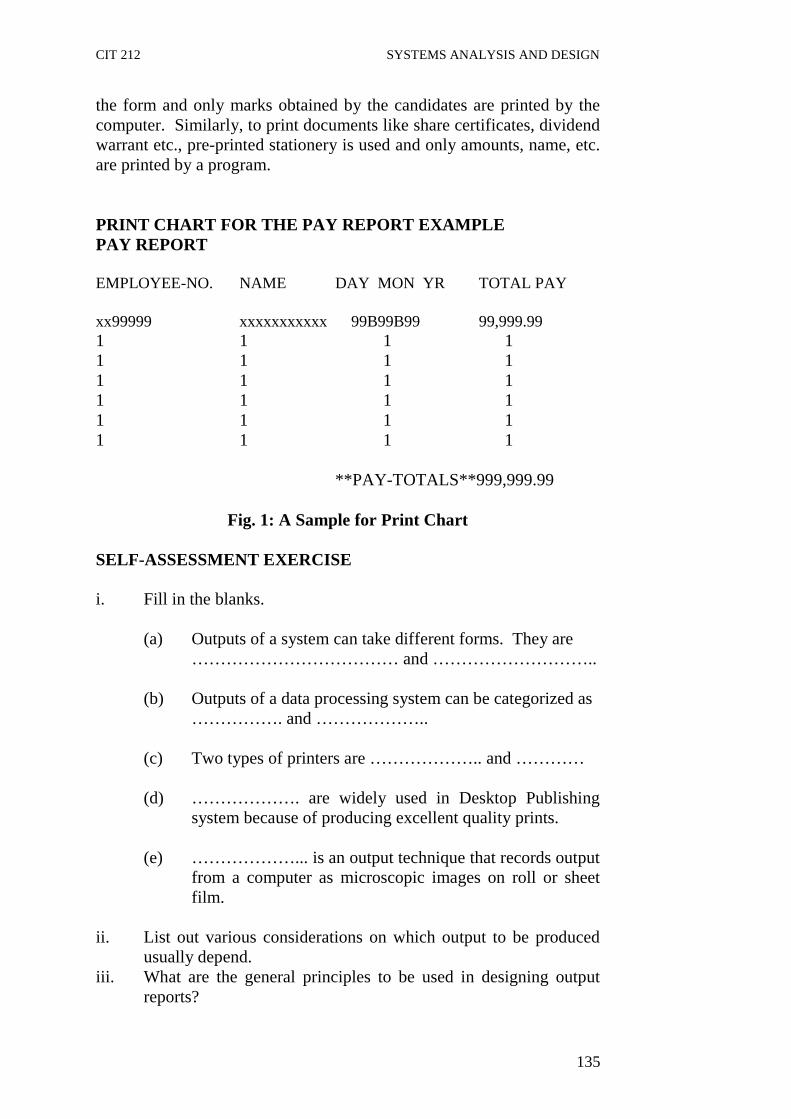
CIT 212 SYSTEMS ANALYSIS AND DESIGN
135
the form and only marks obtained by the candidates are printed by the computer. Similarly, to print documents like share certificates, dividend warrant etc., pre-printed stationery is used and only amounts, name, etc. are printed by a program. PRINT CHART FOR THE PAY REPORT EXAMPLE PAY REPORT EMPLOYEE-NO. NAME DAY MON YR TOTAL PAY xx99999 xxxxxxxxxxx 99B99B99 99,999.99 1 1 1 1 1 1 1 1 1 1 1 1 1 1 1 1 1 1 1 1 1 1 1 1 **PAY-TOTALS**999,999.99
Fig. 1: A Sample for Print Chart SELF-ASSESSMENT EXERCISE i. Fill in the blanks. (a) Outputs of a system can take different forms. They are ……………………………… and ……………………….. (b) Outputs of a data processing system can be categorized as ……………. and ……………….. (c) Two types of printers are ……………….. and ………… (d) ………………. are widely used in Desktop Publishing
system because of producing excellent quality prints. (e) ………………... is an output technique that records output
from a computer as microscopic images on roll or sheet film.
ii. List out various considerations on which output to be produced
usually depend. iii. What are the general principles to be used in designing output
reports?

CIT 212 SYSTEMS ANALYSIS AND DESIGN
136
3.5 Design Screen Output Most of the principles for designing printed outputs as discussed in the previous section are valid for displaying screen output also. However, some differences are there. A video display screen has normally 80 columns and 24 rows. Active involvement of the user is required as it is displayed online. User must be given proper instruction for retrieving the required information. A screen layout for MIT student information system is given below: SCREEN FOR MIT STUDENT INFORMATION NATIONAL OPEN UNIVERSITY OF NIGERIA MIT STUDENT INFORMATION SYSTEM ROLL NO. NAME SUBJECTS TAKEN SEMESTER 1001 Iyioluwa A. Jegede PASCAL I 1060 Chinasa Nasiru SADP II 1230 Chukwu Emeka ORACLE IV 1231 Osita C++ III - - - - PRESS D FOR DETAILS OF A STUDENT PRESS C TO CONTINUE PRESS X TO QUIT As we have seen in a printed report, it has a screen heading and heading for various fields. At the bottom of the screen, instructions are given to help the user in getting the next screen. By following these instructions, he can exit the system also. The system should be in a position to recover if the user presses the wrong key by mistake. For example, in the above case (MIT student information system), if a user presses E by mistake, the system should give a message that a wrong key is pressed and provide the alternatives again to the user. Now we illustrate a screen for detailed information about a particular student.
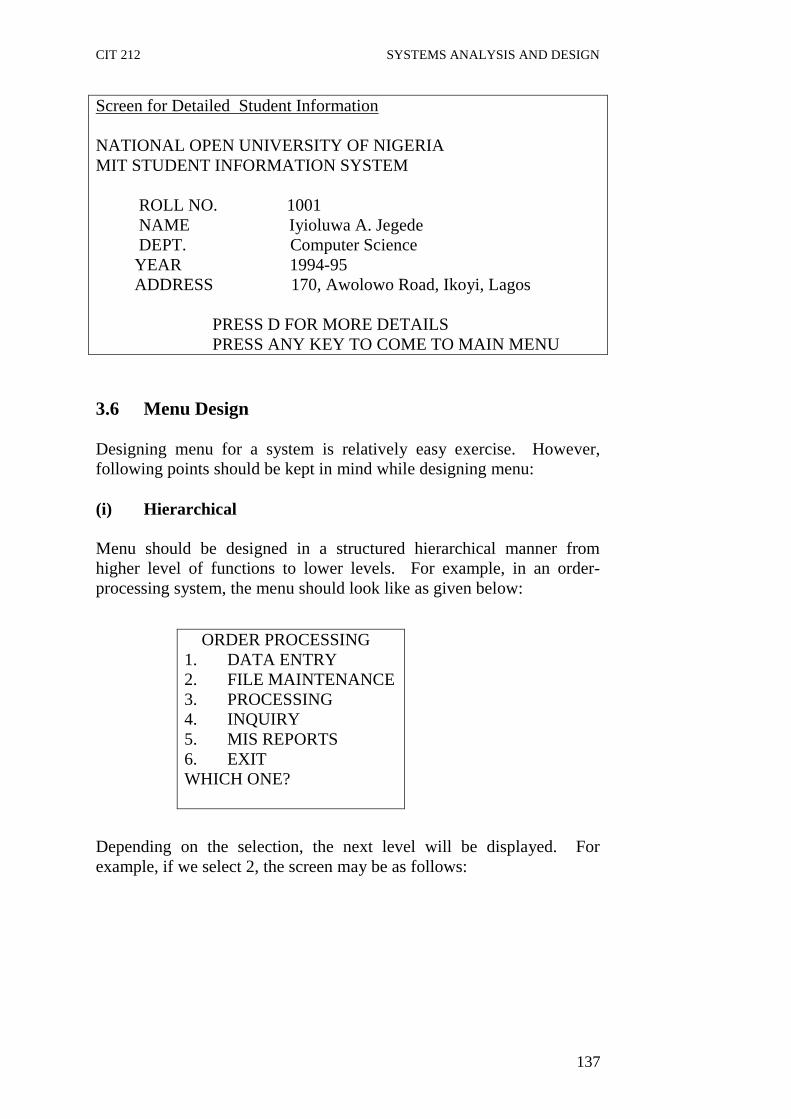
CIT 212 SYSTEMS ANALYSIS AND DESIGN
137
Screen for Detailed Student Information NATIONAL OPEN UNIVERSITY OF NIGERIA MIT STUDENT INFORMATION SYSTEM ROLL NO. 1001 NAME Iyioluwa A. Jegede DEPT. Computer Science YEAR 1994-95 ADDRESS 170, Awolowo Road, Ikoyi, Lagos PRESS D FOR MORE DETAILS PRESS ANY KEY TO COME TO MAIN MENU 3.6 Menu Design Designing menu for a system is relatively easy exercise. However, following points should be kept in mind while designing menu: (i) Hierarchical Menu should be designed in a structured hierarchical manner from higher level of functions to lower levels. For example, in an order-processing system, the menu should look like as given below: Depending on the selection, the next level will be displayed. For example, if we select 2, the screen may be as follows:
ORDER PROCESSING 1. DATA ENTRY 2. FILE MAINTENANCE 3. PROCESSING 4. INQUIRY 5. MIS REPORTS 6. EXIT WHICH ONE?

CIT 212 SYSTEMS ANALYSIS AND DESIGN
138
ORDER PROCESSING (FILE MAINTENANCE) 1. CUSTOMER MASTER 2. PRODUCT MASTER 3. DISCOUNT MASTER 4. EXIT WHICH ONE? Again depending on the selection, the screen for the next level will be displayed. For example, if we select 1, the screen may be as follows: FILE MAINTENANCE (CUSTOMER MASTER) 1. ADD A RECORD 2. MODIFY 3. DELETE 4. EXIT WHICH ONE? Depending on the selection of option, the next level of screen can also be displayed. (ii) Termination When a particular program under the control of a menu is over, the menu screen from which the program was initiated should be displayed again. The principle to be followed is that termination from one level should lead to menu of the next level. However, it is desirable to provide an option in each menu screen to terminate the setting completely or to revert to the highest level screen. This makes the processing faster and operation becomes easier. (iii) Skipping Menu Sometimes it happens that certain functions are restricted to particular individual. In such situations, navigating through levels of menu may be irritating and may affect efficiency of operation. In such cases, it is desirable to provide facilities for jumping to the particular screen directly depending on the user-code.
CIT 212 SYSTEMS ANALYSIS AND DESIGN
139
(iv) Security Control Generally, all the individuals will not be allowed to carry out all the functions. For example, a clerk in the Income Tax Dept. may be allowed only to enter income tax returns. In such cases, menu may be segmented by function to control access to the system function. 3.7 Form Design and Control 3.7.1 Form Design We know that data provide the basis for information system. Without data there is no system, but data must be fed in correct way so that the information produced must be in a format acceptable to the user. In either case, it is still data – the basic element of a printed form. 3.7.2 What is Form? People read from forms, write on forms, and spend many hours in handling forms and filing forms. The data the forms carry come from people, and the informational output of the system goes to people. So the form is a tool with a message, it is the physical carrier of data – of information. It also can constitute authority for action. For example, a purchase order says BUY a customer’s order says SHIP, and a paycheck says PAY TO THE ORDER OF. Each form is a request for action. It provides information for making decisions and improving operations. With this in mind, it is hard to imagine a business operating without using forms. They are the vehicles for most communications and the blueprint for many activities. As important as a printed form is, however, the majority of forms are designed by poorly trained people. People are puzzled by confusing forms; they ask for directions on how to read them and how to fill them out. When a form is poorly designed, it is a poor (and costly) administrative tool. 3.7.3 Classifications of Forms A printed form is generally classified by what it does in the system. There are three primary classifications; action, memory, and report forms. An action form requests the user to do something – get action. (Examples and purchase orders and shop orders). A memory form is a record of historical data that remains in a file, issued for reference, and serves as control on key details. (Examples are inventory records, purchase records, and bond registers.) a report form guides supervisors and other administrators in their activities. It provides data on a project or a job. (Examples are profit and loss statements and sales analysis

CIT 212 SYSTEMS ANALYSIS AND DESIGN
140
reports.) Fig. 2 is a summary of the characteristics and examples of these forms. Class Characteristics Examples Action 1. Orders, instructs, authorizes Application form 2. Achieves results Purchase-order Sales 3. Goes from one place (person) slip Shop order to another Time card Memory 1. Represents historical data Bond register 2. Data generally used for Inventory record references 3. Stationary and remains in Journal sheet one place, usually a file Purchase record 4. Serves as control on Stock ledger certain details Report 1. Summary picture of a project Balance sheet 2. Provides details about a job Operating-statement or details that need attention. Profit and loss statement 3. Used by a manager with Sales analysis Authority to effect change Trail balance 4. Used as a basis for decision-making Fig. 2: Three Classed of Forms – A Summary 3.7.4 Factors to be considered in Form Design Form design plays an important role in data processing. Form must have the appearance of a well conceived and attractive design. Some of the important factors which should be taken care of are given below: (i) Size and shape of the form should be such that it is convenient
for handling, filling, sorting, etc. (ii) Arrange the material in a logical order so that it becomes easy to
fill it up. (iii) The form title must clearly identify its purpose. Columns and
rows should be labelled to avoid confusion.
CIT 212 SYSTEMS ANALYSIS AND DESIGN
141
(iv) Precise content should be recorded. Adequate and compact space should be provided for items to be recorded. Pre-printed entries should be taken care of.
(v) Special features like security and control should be considered. (vi) Introduce emphasis by shading columns, heavy lines, etc. If the
form is to be used for specific clerical operation, for example copying or checking, see that the detail is arranged and spaced to provide maximum help to the operator.
(vii) The form designer should design the form in such a way so as to
cover the specific needs of the purpose for which it is designed. 3.7.5 Forms Control Controlling the number as well as quality of forms in an organization can be a substantial work. Forms have a tendency to multiply and unless they are checked, it can be costly affair in many organizations. To control this type of situation most large organizations establish a formal form control program. The first objective of this form control program is to establish standards. Different department using different form to accomplish the same task is an unnecessary expense. The job of form control specialist is to eliminate redundancies among forms to reduce clerical cost. The forms control specialist also seek to reduce the number of copies of each forms used. Routing one copy of a form through several departments is probably the best way to achieve this. Forms should be titled, numbered and contain the date of the most recent revision. It is quite helpful to have the form numbers organized so that all forms in a given system can easily be located when that system is under study. Normally a form is designed-originally by a systems analyst working with the users. When the original supply of the form is reduced to a re-order level, a forms control specialist is generally responsible for its re-order and possible revision. The form is routed to the users for comment and suggested changes. The form controller coordinates these suggestions and orders the most economical list. For a routine office forms which are not likely to change frequently, a re-order of one year’s supply is normal.

CIT 212 SYSTEMS ANALYSIS AND DESIGN
142
3.8 Computer Graphics When designing an information system, it should be considered carefully about how the output can best be presented. Text output in many cases is O.K. But for many applications it does not look nice to present the user with pages and pages of textual output. It may take hours together to go through such a large output. When it is not desired to present volumes of textual data but only summary of data is required, the data are often best presented in graphical form. Presentation of data in graphics forms was little bit difficult in earlier computer systems. But with the advent of end-user computing, DBMS, electronic spreadsheets, sophisticated graphics software and high-resolutions output devices, the use of graphic has increased tremendously. Presentation of output in graphics formats has the following benefits: ● More effective conversion of data into information. ● Easier recognition of relationships and trends. ● Quick decisions can be taken to make decisions. ● Better presentation of output. ● Ability to focus attention on important issues. ● Capability of presenting ideas in an attractive format that may
readily receive attention. Behind these benefits lies the fact that the mind can absorb information more rapidly from an effective picture than it can from words or numbers. If they are used when appropriate, computer graphics can bridge the gap between computer data and the human mind. To the business professional this means more information in less time. Using the graphics capabilities provided by integrated spreadsheet packages, data can be graded in different ways. But some users need more. For example, it can be helpful to construct graphs from the company’s central databases, to design more customized graphics than those offered by standard packages, and to use graphics for a wider range of applications than merely spreadsheets. And indeed, a host of more sophisticated computer graphics packages is available. Computer graphics software can be divided into two categories, presentation graphics and decision support graphics. We will briefly describe how each is used.
CIT 212 SYSTEMS ANALYSIS AND DESIGN
143
3.8.1 Presentation Graphics Presentation graphics can be used to communicate ideas to those who might be unfamiliar to a situation or who need a simple but highly effective overview of a topic. For example presentation graphics might be used by a sales person to show a customer how several insurance policies compare, by a marketing manager at a long range planning session to show the change in market share between competitive products, or by manufacturing management at a budget session to give an overview of the expected work load in the next quarter. Those who use presentation graphics need a system that can: ● Produce high-quality illustration ● Produce a range of colours ● Allow the user to choose among a variety of print analysis or
“fonts” ● Reduce and enlarge illustrations. ● Produce high quality 35 millimetres slides or transparencies. The data used in presentation graphics may come from different databases in the organization, from non-computer sources in the organization, and from outside sources. Most illustrations are accompanied by explanatory text, and so any graphics system must be capable of mixing text with graphics. A simple example illustrates how a pie chart is constructed. The user first types the title for the chart on the keyboard and then enters the following information for each “slice” of the pie: label, value, whether or not the slice should be “exploded” out of the pie for attention purposes, colour, and design code (texture). Provided with this input, the graphics software does the rest. 3.8.2 Decision Support Graphics The second graphics computer category is decision support graphics or analytical graphics. Here graphics are used as a vehicle for understanding patterns, trends or relationships in data. Because the objective in using decision support graphics is to learn something about data, the demands made on the quality of the graphics, the type of presentation, and the source of data are quite different from the demands made on presentation graphics. First, the quality of the illustration is not nearly so important as its ability to present the information in a way that can support the problem-solving and decision-making process. Second, the colour and special

CIT 212 SYSTEMS ANALYSIS AND DESIGN
144
graphical effects are usually necessary. Third, the data for decision support graphics usually comes from spreadsheets, local databases, or the firm’s central database. If the data are stored centrally, then the graphic system must be able to access the data and use them to produce graphs with a minimum of user involvement. The effective use of graphics offers finely “distilled” information for quick comprehension by decision-makers. The speed of comprehension is not merely a matter of convenience but also of being able to make timely decisions. 3.8.3 Graphics Hardware/Software The hardware used in a graphic system falls into several categories, including graphics terminals, graphics boards, graphics printers, and interface devices. In addition to hardware, a graphics system needs software. It is the software that provides the capability of using different fonts, adjusting the size of the fonts, selecting colours, moving the image from one location on the screen to another, incorporating graphics into the text, and supporting the use of interface devices. A wide variety of software packages is available in the market. Many provide a standard set of line, bar and pie charts; some offer the option of displaying these in three dimensions; and others allow several charts to be graphed on a single plot. 4.0 CONCLUSION After learning about input design and control the next is to learn about the system output design. Therefore, in this unit, you have been taken through the types of output, popular output devices, output design considerations and how to design output reports. Also, the role that a computer graphics play in output design has been discussed with you. 5.0 SUMMARY In this unit, we have discussed the responsibilities of a system analyst for output system design. Different types of output devices have been discussed. Output to be produced usually depends upon many considerations. They have been explained in details. Designing screen output or menu design play quite significant role in business applications. Computer graphics are also very helpful to presenting the output in an effective way.

CIT 212 SYSTEMS ANALYSIS AND DESIGN
145
6.0 TUTOR-MARKED ASSIGNMENTS 1. List out various points to be considered in designing menu. 2. List out three primary classifications of forms. 3. Describe various factors o be considered in Form Design briefly. 4. What do you understand by ‘Form Control’? Explain briefly. 7.0 REFERENCES/FURTHER READINGS Analysis & design of information systems – James A Senn, Mc-Graw
Hill Book Co. (1986) Structured Analysis and Systems Specification – Tom De Marco,
Prentice Hall (1979) The Practical Guide to Structured system Design – Page Jones Mellir,
The Yourdon press (1980) Managing the Structured Techniques – Edward Yourdon, Yourdon,
Yourdon Press (1979)

CIT 212 SYSTEMS ANALYSIS AND DESIGN
146
UNIT 4 INPUT DESIGN AND CONTROL CONTENTS 1.0 Introduction 2.0 Objectives 3.0 Main Content
3.1 Selecting Data Storage Media 3.1.1 File Concepts
3.2 Types of Files 3.2.1 Master 3.2.2 Transaction 3.2.3 Table 3.2.4 Report 3.2.5 Backup 3.2.6 Archival 3.2.7 Dump 3.2.8 Library
3.3 File Organization 3.3.1 Sequential 3.3.2 Random or Direct 3.3.3 Indexed 3.4 File Design 3.5 Database Design 3.5.1 Logical and physical view of Data 3.5.2 Schema 3.5.3 Sub-Schema 3.6 Types of Database 3.6.1 Hierarchical Model 3.6.2 Network Model 3.6.3 Relational Model 3.7 Coding System 3.8 Types of Codes 3.8.1 Classification Code 3.8.2 Function Code 3.8.3 Card Code 3.8.4 Sequence Code 3.8.5 Significant –digit Subset Code 3.8.6 Mnemonic Code 3.8.7 Acronyms 4.0 Conclusion 5.0 Summary 6.0 Tutor-Marked Assignment 7.0 References/Further Readings

CIT 212 SYSTEMS ANALYSIS AND DESIGN
147
1.0 INTRODUCTION After designing the input and output, the designer begins to pay his attention on the work of file designing or how data should be organized around user requirement. How data are organized depends on the data and response requirements that determine hardware configurations. System analyst is responsible for designing the files and selecting their contents, selecting from options available for organizing the data. File organization may be sequential, index sequential, inverted list or random. Each method has its own uses and abuses. An integrated approach to file design is the database. The general theme is to handle information as an integrated whole, with a minimum of redundancy and improved performance. Various software techniques are applied to manipulate, describe and manage data. Irrespective of type of data structure used, the main objectives of database are accuracy and integrity, successful recovery from failure, privacy and security of data. 2.0 OBJECTIVES After going through this unit, you will be in a position to explain and describe: • file concepts and its different type • various methods of selecting data storage medium • file organization • file design • database design • coding system 3.0 MAIN CONTENT 3.1 Selecting Data Storage Media In theory, there is a wide selection of devices and media available for file storage, ranging from punched cards to high speed internal memory. In practice, system analyst is interested in bulk storage devices using magnetic media such as magnetic tape and exchangeable magnetic disk. Magnetic drums and fixed discs are also very helpful but these are generally used for special purpose files. Magnetic card devices, although provide large storage capacity, are slow and not so much reliable. Punched cards and paper tape have become obsolete nowadays and are not considered for bulk storage of data. Magnetic tape units generally used reels holding plastic tape 0.5 inch wide and 2400ft. in length. It has magnetizable coating on one side. For reading or writing

CIT 212 SYSTEMS ANALYSIS AND DESIGN
148
purpose, the tape is transported from one spool to another. It is not possible at all to read from and immediately write on to one reel of tape. Therefore, when we update a file, it becomes necessary to read the existing file from one reel and to create an entirely new version by writing on another reel. When dealing with a master file updated from time to time, the file being read is said to be the brought-forward file and the newly created one is the carried-forward file (because the former has been brought forward from a previous updating process and the latter will be carried forward to a future one). Apart from this, these different versions of master file referred to as ‘generations’ are very helpful for recovery purposes in case the latest versions get corrupted. Three generations (grandfather, father, son) are commonly created and retained before re-using the oldest version. The magnetizable surface of the tape is densely packed with spots of magnetism measured in bits per inch (bpi) along the length of tape. They are arranged in rows across the tape – commonly either seven or nine spots per row – each spot representing a bit. These arrangements are also known as seven or nine track tape. Each row or frame represents as a character or byte. Data is recorded on the tape in terms of blocks and size of the block is specified. 3.1.1 File Concepts Files are the heart of a computer application. Before constructing files, we must understand the basic terms used to describe the file hierarchy. The most commonly used terms are data item, record, file and database. Data Item: A basic or individual element of data is called data item. Each data item is identified by a name and is assigned a value. For example in a payroll system, Employee Name and Employee Identification Number are the data items assigned the values PANKAJ and 1775 respectively. Data item is sometimes referred to as a field. Record: The collection of related data items is called a record. For example, in a payroll system, each employee record may have eight separate fields, which are related to print a cheque, such as Employee Name, Employee Code, Sex, Designation, Basic Pay, HRA, DA, and Deductions. The analyst also determines the length and type of each field while designing the record. For example, layout of an employee record in a payroll system can be as follows:

CIT 212 SYSTEMS ANALYSIS AND DESIGN
149
Name of Data Item Type Length Decimal Name C 20 CODE N 5 SEX C 1 DESIGNATION C 15 BASIC N 8 2 HRA N 6 2 DA N 6 2 DEDUCTION N 6 2 It is necessary to distinguished one specific record from another. System analyst select one data item in the record that is likely to be unique in all the records of a file which is used to identify the record for further processing. This item is called the key field or record key. File File is a collection of related records. Each record in a file is included because it pertains to the same entity. In the payroll system, employee file will contain only employee details records and file inventory or stock records will not be kept in the employee file because these are not related to employee details. Database The highest level in the hierarchy is the database. It is a set of inter-related files for real time processing. It contains the necessary data for problem-solving and can be used for several users who are accessing data concurrently. 3.2 Types of Files There are various types of files in which the records are collected and maintained. They are categorized as: - Master file - Transaction file - Table file - Report file - Back-up file - Archival file - Dump file - Library file
CIT 212 SYSTEMS ANALYSIS AND DESIGN
150
3.2.1 Master Master files are the most important type of file. Most file design activities concentrate here. In a business application, these are considered to be very significant because they contain the essential records for maintenance of the organization’s business. A master file can be further categorized. It may be called a reference master file, in which the records are static or unlikely to change frequently. For example, a product file containing descriptions and codes: a customer file containing name, address and account number are examples of reference files. Alternatively, it may be described as a dynamic master file. In this file, we keep records which are frequently changed (updated) as a result of transactions or order events. These two types of master file may be kept as separate files or may be combined, for example, a sales ledger file containing reference data, such as name, address, account number, together with current transaction and balance for each customer. 3.2.2 Transaction A transaction is a temporary file used for two purposes. First of all, it is used to accumulate data about events as they occur. Secondly, it helps in updating master files to reflect the result of current transactions. The term transaction refers to any business event that affects the organization and about which data is captured. Examples of common transactions in the organization are making purchases, hiring of workers and recording of sales. 3.2.3 Table A special type of master file is included in many systems to meet specific requirements, where data must be referenced repeatedly. Table files are permanent files containing reference data used in processing transaction, updating master file or producing output. As the name implies, these files store data in tabular form. Table files conserve memory space and make the program maintenance easier by storing data in a file, that otherwise would be included in programs or master file records. 3.2.4 Report Report files collected contents of individual output reports or documents produced by the system. They are created by the system where many reports are produced by the system but printer may not be available for all the reports. This situation frequently arise when the computers carry out three functions – input, processing and output simultaneously, rather

CIT 212 SYSTEMS ANALYSIS AND DESIGN
151
than executing each function in sequence. In this case, the computer writes the report contents to a file on a magnetic tape or disk, where it remains until it can be printed. That file is called the report file which contains the unprinted output data. The process of creating it is known as spooling which means that output that cannot be printed when it is produced is spooled into a report file. Then, depending on the availability of printer, the system will be instructed to read the report file and print the output on the printer. 3.2.5 Backup It is a copy of master, transaction or table file that is made to ensure a copy is available if anything happens to the original. 3.2.6 Archival These files are copies made from long term storage of data that may be required at a much later date. Usually, archival files are stored far away from the computer centre so that they cannot be easily retrieved for use. 3.2.7 Dump This is a copy of computer-held data at a particular point of time. This may be a copy of master file to be retained to help recovery in the event of a possible corruption of the master file or it may be part of a program in which error is being traced. 3.2.8 Library Library file generally contains application programs, utility programs and system software packages. 3.3 File Organization A file is organized to ensure that records are available for processing. Before a file is created, the application to which the file will be used must be carefully examined. Clearly, a fundamental consideration in this examination will concern that data to be recorded on the file. But an equally important and less obvious consideration concerns how the data are to be placed on the file. 3.3.1 Sequential It is the simplest method to store and retrieve data from a file. Sequential organization simply means storing and sorting in physical on tape or disk. In a sequential organization a records can be added only at

CIT 212 SYSTEMS ANALYSIS AND DESIGN
152
the end of the file. That is in a sequential file, records are stored one after the other without concern for the actual value of the data in the records. It is not possible to insert a record in the middle of the file without re-writing the file. In a sequential file update, transaction records are in the same sequence as in the master file. Records from both files are matched, one record at a time, resulting in an updated master file. It is a characteristic of sequential files that all records are stored by position; the first one is at the first position, the second one occupies the second position and third is at third and so on. There are no addresses or location assignments in sequential files. To read a sequential file, the system always starts at the beginning of the file. If the record sought is somewhere in the file, the system reads its ways up to it, one record at a time. For example, if a particular record happens to be the fifteenth one in a file, the system starts at the first one and reads ahead one record at a time until the fifteenth one is reached. It cannot jump directly to the fifteenth one in a sequential file without starting from the beginning. Using the key field, in a sequential file the records have been arranged into ascending or descending order according to a key field. This key field may be numeric, alphabetic, or a combination of both, but it must occupy the same place in each record, as it forms the basis for determining the order in which the records will appear on the file. When we start searching for a particular record in a sequential file the system do not use the physical record key. The system assigns the value of the particular record key as a search key. For example, let a sequential file consists of the records of employee number from 1200 to 1250. Then how to locate or retrieve a record for an employee number 1234? Here employee number 1234 is the search key. When searching for the employee number 1234, the program controls all the processing steps that follow. The first record is read and its employee number is compared with a search key. 1200 versus 1234. Since this do not match, the process is repeated. The employee number for the next-record is 1201, and it also continues until the employee number matches the search key. If the file does not contain the employee number 1234, the read and compare process will continue until the end of the file is reached. Sequential files are generally maintained on a magnetic tape, disk or a mass storage system. The advantages and disadvantages of Sequential File organization are compared and given below:
CIT 212 SYSTEMS ANALYSIS AND DESIGN
153
Advantages Disadvantage
Simple to understand this approach. Entire file must be processed even when the activity rate is low.
Locating a record requires only the key Transactions must be stored record and placed in sequence prior to
processing.
Efficient and economical if the activity Timeliness of data in file rate is high deteriorates while batches are
being accumulated.
Relatively inexpensive I/O media devices may be used.
Files may be relative easy to Data redundancy is typically reconstruct since a good measure high since the same data may of built in backup is usually available. be stored in several files
sequenced on different keys. 3.3.2 Random or Direct
For a proposed system, when the sequential files are assumed as a disadvantage, another file organization called Direct organization is used. As with a sequential file, each record in a direct file must contain a key field. However the records used need not appear on the file in key field sequence. In addition any record stored on a direct file can be accessed. The problem, however is to determine how to store the data records so that, given the key field of the desired record, its storage location on the file can be determined. In other words, if the program knows the record key, it can determine the location address of a record and retrieve it independently of any other records in the file.
It would be ideal if the key field could also be the location of the record on the file. This method is known as direct addressing method. This is quite simple method but the requirements of this method often prevent its use. Because of many other factors, this method could not become popular. Hence it is rarely used.
Therefore, before a direct organized file can be created, a formula or method must be devised to convert the key field value for a record to the location on the file. This formula or method is generally called an algorithm. Otherwise called the Hashing addressing. Hashing refers to the process of deriving a storage address from a record key. There are many algorithms to determine the storage location using key field. Some of the algorithms are:
CIT 212 SYSTEMS ANALYSIS AND DESIGN
154
Division by Prime In this procedure, the actual key is divided by any prime number. Here the modular division is used. That is quotient is discarded and the storage location is signified by the remainder. If the key field consists of large number of digits, for instance, 10 digits (e.g. 2345632278) then strip off the first or last 4 digits and then apply the division by prime method. For example, the key field is 2345632278 strips off first 4 digits. Then the new key is 632278. Divide the new key by a prime number. Let it be 41. The quotient is 15421, remainder is 17. Hence 17 is the storage address. Various other common algorithms are also given as below: - Folding - Extraction - Squaring The advantages and disadvantages of direct file organization are as follows: Advantages Disadvantages Immediate access to records for Records in the online file may inquiry and updating purpose is be exposed the risk of a loss of possible. accuracy and a procedure for
special backup and reconstruction is required.
Immediate updating of several files As compared to sequentially as a result of single transaction is organized, this may be less possible. efficient in using the storage
space. Time taken for sorting the transactions Adding and deleting of records can be saved. is more difficult than with
sequential files.
Relatively expensive hardware and software resources are required.
CIT 212 SYSTEMS ANALYSIS AND DESIGN
155
3.3.3 Indexed The third way of accessing records stored in the system is through an index. The basic form of an index includes a record key and the storage address for a record. To find a record, when the storage address is unknown it is necessary to scan the records. However, if an index is used, the search will be faster since it takes less time to search an index than an entire file of data. Indexed file offers the simplicity of sequential file while at the same time offering a capability for direct access. The records must be initially stored on the file in sequential order according to a key field. In addition, as the records are being recorded on the file, one or more indexes are established by the system to associate the key field value(s) with the storage location of the record on the file. These indexes are then used by the system to allow a record to be directly accessed. To find a specific record when the file is stored under an indexed organization, the index is searched first to find the key of the record wanted. When it is found, the corresponding storage address is noted and then the program can access the record directly. This method uses a sequential scan of the index, followed by direct access to the appropriate record. The index helps to speed up the search compared with a sequential file, but it is slower than the direct addressing. The indexed files are generally maintained on magnetic disk or on a mass storage system. The primary differences between direct and indexed organized files are as follows: Records may be accessed from a direct organized file only randomly, whereas records may be accessed sequentially or randomly from an indexed organized files. Direct organized files utilize an algorithm to determine the location of a record, whereas indexed organized files utilize an index to locate a record to be randomly accessed. The advantages and disadvantages of indexed sequential file organization are as follows:

CIT 212 SYSTEMS ANALYSIS AND DESIGN
156
Advantages Disadvantages Permits the efficient and economical Less efficient in the use of use of sequential processing storage space than some other techniques when the activity rate alternatives. is high. Permits quick access to records in a Access to records may be relatively efficient way, this activity slower using indexes than is a small fraction of the total when transform algorithms workload. are Used.
Required expensive hardware and software resources are required.
3.4 File Design The basic factors to be considered in the selection of file media and file organization method are: - the method of processing for updating files - size of file - file inquiry capabilities - activity ratios of records in the file - file volatility and - the response time. Each of these factors is briefly described in the following paragraphs. In batch processing, the sequential method of processing using magnetic tape is employed. This method of updating involves re-creation of the master file every time the file is updated. In order to reduce the set-up time, the updating of the file is done after accumulation of a fairly large batch of transactions. Fig. 1 illustrates the updating procedure.
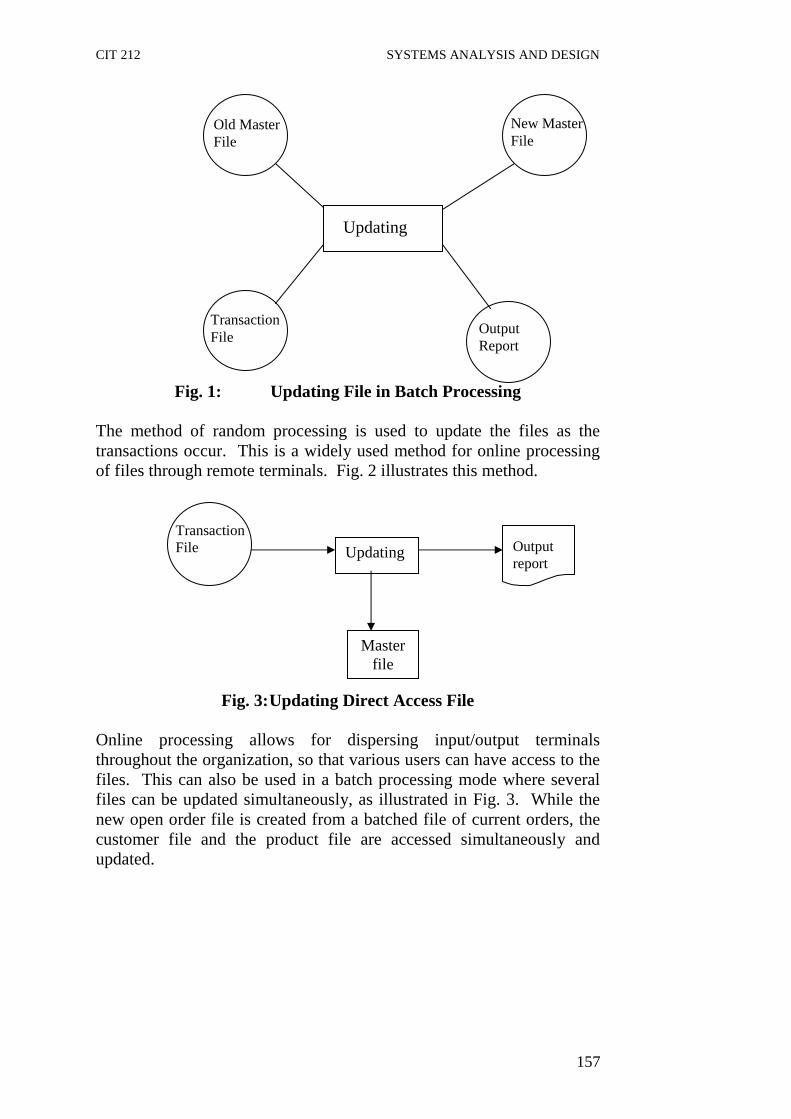
CIT 212 SYSTEMS ANALYSIS AND DESIGN
157
Fig. 1: Updating File in Batch Processing The method of random processing is used to update the files as the transactions occur. This is a widely used method for online processing of files through remote terminals. Fig. 2 illustrates this method.
Fig. 3: Updating Direct Access File Online processing allows for dispersing input/output terminals throughout the organization, so that various users can have access to the files. This can also be used in a batch processing mode where several files can be updated simultaneously, as illustrated in Fig. 3. While the new open order file is created from a batched file of current orders, the customer file and the product file are accessed simultaneously and updated.
Transaction File Output
Report
Updating
Old Master File
New Master File
Updating
Master file
Transaction File Output
report
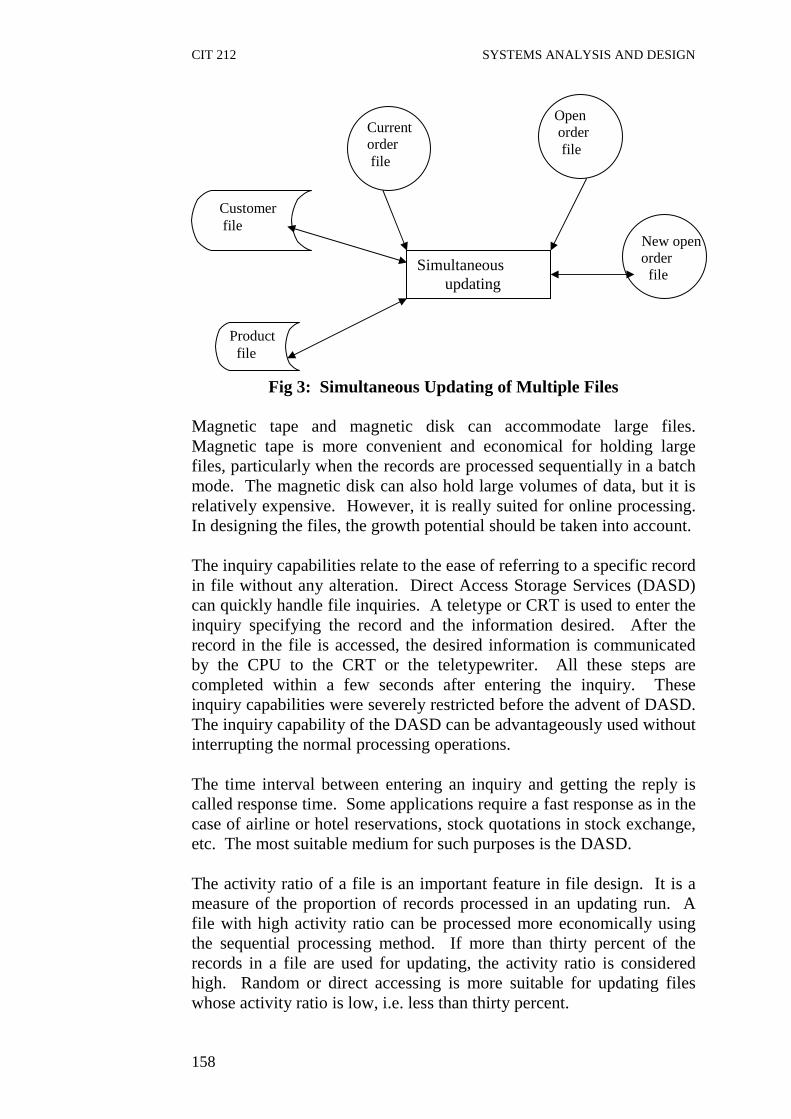
CIT 212 SYSTEMS ANALYSIS AND DESIGN
158
Fig 3: Simultaneous Updating of Multiple Files Magnetic tape and magnetic disk can accommodate large files. Magnetic tape is more convenient and economical for holding large files, particularly when the records are processed sequentially in a batch mode. The magnetic disk can also hold large volumes of data, but it is relatively expensive. However, it is really suited for online processing. In designing the files, the growth potential should be taken into account. The inquiry capabilities relate to the ease of referring to a specific record in file without any alteration. Direct Access Storage Services (DASD) can quickly handle file inquiries. A teletype or CRT is used to enter the inquiry specifying the record and the information desired. After the record in the file is accessed, the desired information is communicated by the CPU to the CRT or the teletypewriter. All these steps are completed within a few seconds after entering the inquiry. These inquiry capabilities were severely restricted before the advent of DASD. The inquiry capability of the DASD can be advantageously used without interrupting the normal processing operations. The time interval between entering an inquiry and getting the reply is called response time. Some applications require a fast response as in the case of airline or hotel reservations, stock quotations in stock exchange, etc. The most suitable medium for such purposes is the DASD. The activity ratio of a file is an important feature in file design. It is a measure of the proportion of records processed in an updating run. A file with high activity ratio can be processed more economically using the sequential processing method. If more than thirty percent of the records in a file are used for updating, the activity ratio is considered high. Random or direct accessing is more suitable for updating files whose activity ratio is low, i.e. less than thirty percent.
Simultaneous updating
Current order file
Open order file
Customer file
Product file
New open order file

CIT 212 SYSTEMS ANALYSIS AND DESIGN
159
Another characteristic of a file is its volatility, which indicates the additions, deletions and changes to the file. When a file is accessed frequently, as in banks, stock exchanges, airlines, etc. in a working period, the file is regarded as highly volatile. Before designing the file, the analyst should consider specific aspects relating to a file. These aspects should be recorded on a work sheet as shown below: File Work Sheet File Name: Analyst: 1. File update: Batch [ ] Direct [ ] 2. File Organization: Sequential [ ] Indexed sequential [ ] Direct [ ] 3. Processing frequency: On demand [ ] Daily [ ] Weekly [ ] Monthly [ ] Any other [ ] 4. Activity ratio: Low [ ] Moderate [ ] High [ ] 5. Direct access: Yes [ ] No [ ] Occasional [ ] 6. Volatility: Low [ ] Moderate [ ] High [ ] 7. Record Characteristics: Type: Fixed [ ] Variable [ ] Blocking Factor 8. File Dynamics: (i) Number of records (ii) Yearly additions (iii) Yearly deletions

CIT 212 SYSTEMS ANALYSIS AND DESIGN
160
(iv) Percent growth 9. File media: Tape [ ] Disk [ ] 10. Sources of data: 11. Type of information required and reported: The above file work sheet should be accompanied by detailed record layouts, which describe in detail the layout of records in the file. SELF-ASSESSMENT EXERCISES i. Explain the file concept briefly. ii. List out various types of files. iii. List out the three methods of organizing a file. iv. List out the basic factors responsible for selecting the appropriate
media and organization methods. 3.5 Database Design As we have discussed that the organization selected for a particular file mainly depends on the nature of the application for which it will be used. Historically, files have been designed based on specific application. Payroll files are created containing all the data pertinent to a company’s payroll system. Similarly, individual files are created for use with the company’s personnel, accounts receivable, inventory, and other systems. If the data contained on these files are not carefully delineated, it is very likely that the same data will appear on several of these files. In other words, these files would contain redundant data. For example, both a company’s personnel file and payroll file could contain the name and address of each employee. This would mean that a simple change of address would have to be processed twice and possibly three or four times, depending on the number of other files on which these data appear. Clearly, it would be more practical to have each employee’s name and address on one file from which it can be accessed by all programs requiring these data. This would reduce the amount of redundant data and minimize the possibility that data contained on a file might be inaccurate because they were never updated. This is but one of the reasons that database technology was developed. A DATABASE can be thought of as a set of logically related files organized to facilitate access by one or more applications programs and to minimize data redundancy. In other words, a database can be defined as a stored collection of data, organized on the basis of relationships in

CIT 212 SYSTEMS ANALYSIS AND DESIGN
161
the data rather than the convenience of storage structures. It is not a replacement for files. Some general objectives in establishing a database are as follows: - Eliminate redundant data as much as possible. - Integrate existing data files. - Share data among all users. - Incorporate changes easily and quickly. - Simplify the use of data files. - Lower the cost of storing and retrieving data. - Improve accuracy and consistency. - Provide data security from unauthorized use. - Exercise central control over standards. In addition to the database itself, a set of programs is necessary to facilitate adding new data as well as modifying and retrieving existing data within a database. This set of programs is referred to as a Database Management System (DBMS). A database system merges data into one pool shared by all systems so that any change automatically affects all relevant systems. The following figures define the difference between the traditional files systems and database management system. Fig. 4 shows the Traditional file systems in which each system is responsible for its own data.
Fig 4: Traditional System
Fig. 5 shows the Database Management Systems in which data is centralized
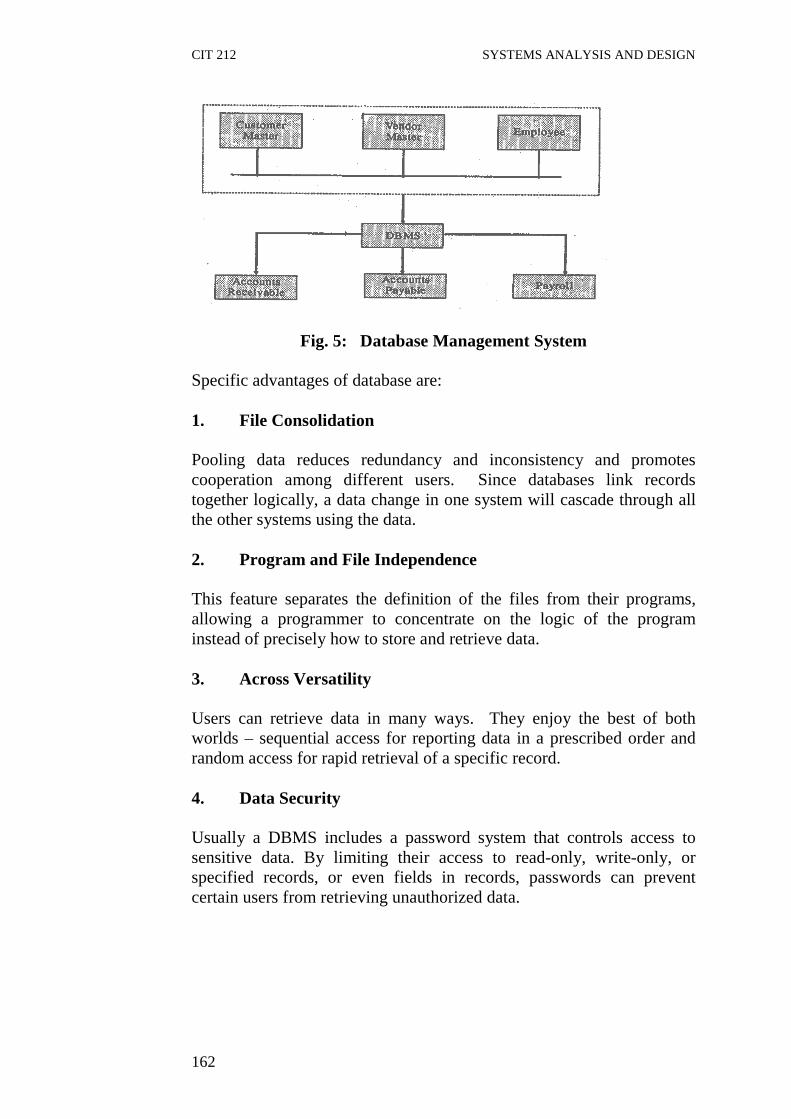
CIT 212 SYSTEMS ANALYSIS AND DESIGN
162
Fig. 5: Database Management System Specific advantages of database are: 1. File Consolidation Pooling data reduces redundancy and inconsistency and promotes cooperation among different users. Since databases link records together logically, a data change in one system will cascade through all the other systems using the data. 2. Program and File Independence This feature separates the definition of the files from their programs, allowing a programmer to concentrate on the logic of the program instead of precisely how to store and retrieve data. 3. Across Versatility Users can retrieve data in many ways. They enjoy the best of both worlds – sequential access for reporting data in a prescribed order and random access for rapid retrieval of a specific record. 4. Data Security Usually a DBMS includes a password system that controls access to sensitive data. By limiting their access to read-only, write-only, or specified records, or even fields in records, passwords can prevent certain users from retrieving unauthorized data.
CIT 212 SYSTEMS ANALYSIS AND DESIGN
163
5. Program Development Programmers must use standard means for data items rather than invent their own from program to program. This allows the programmer to focus on desired function. 6. Program Maintenance Changes and repairs to a system are relatively easy. 7. Special Information Special-purpose report generators can produce reports with minimum effort. 3.5.1 Logical and physical view of Data In database design, several views of data must be considered along with the persons who use them. In addition to data structuring, where relationships are reflected between and within entities, we need to identify the application program’s logical views of data within an overall logical data structure. The logical view is what the data look like, regardless of how they are stored. The physical view is the way data exist in physical storage. It deals with how data are stored, accessed, or related to other data in storage. There are four views of data, out of which three are logical and one is physical. The logical views are the users’ view, the programmer’s view and the overall logical view, called schema. 3.5.2 Schema Once a database system has been designed, it will be possible to identify each type of data item, data aggregate, record and set by a name or code. It will be possible to state which data item types go together to make data aggregate types and record, and identify which record types are members and owners of set types. A coded set of tables describing this information and stored in the computer system on direct access devices is called a SCHEMA. It is a description of the data structure which is separate from the data itself. The schema describes the areas, their identifiers and page sizes, and indicates how these are related to the records and sets. In other systems, a different set of tables is used for this. The schema therefore, is the view of the data, the overall logical data structure which is held by the DBMS. Each time a program requires data, the DBMS will look up in the schema for the details of the

CIT 212 SYSTEMS ANALYSIS AND DESIGN
164
structure of the data requested. For example if the program requires an occurrence of a set, the DBMS will look up in the schema which record types are required, how to find the relevant records given a certain key by the program, and perhaps also which areas the pages containing the relevant data are stored in. 3.5.3 Sub-Schema In the database system, it is not always possible to allow programmers to write the data division of their choice for reasons of security or control. It is more useful to provide the programmer with a standard description of the logical data to be used in a particular application. All references to data within the program will be for this description, which is called a SUBSCHEMA and is similar to the Schema in structure. The DMBS has the job of matching data requests on a subschema and data requests based on the schema. 3.6 Types of Database In conventional file system, groups of bytes constitute a field, one or more fields make a record, and two or more records make a file. In database environment, a group of bytes constitutes a data item or segment, a collection of segments a data entry, and a series of data entries a data set. The complete collection of data sets is the database itself. With traditional processing of files, records are not automatically related, so a programmer must be concerned with record relationships. Often the files are stored and processed by record key, just as we sorted the transaction file. Databases relate data sets in one of three models: hierarchical, network, or relational. 3.6.1 Hierarchical Model In a hierarchical structure, sometimes referred to as a tree structure, the stored data get more and more detailed at one branches further out on the tree. Each segment, or node, may be subdivided into two or more subordinate nodes, which can be further subdivided into two or more additional nodes. However, each node can have only one “parent” from which it emanates. The Fig. 6 shows the hierarchical structure.
Fig 6: Hierarchical Structure
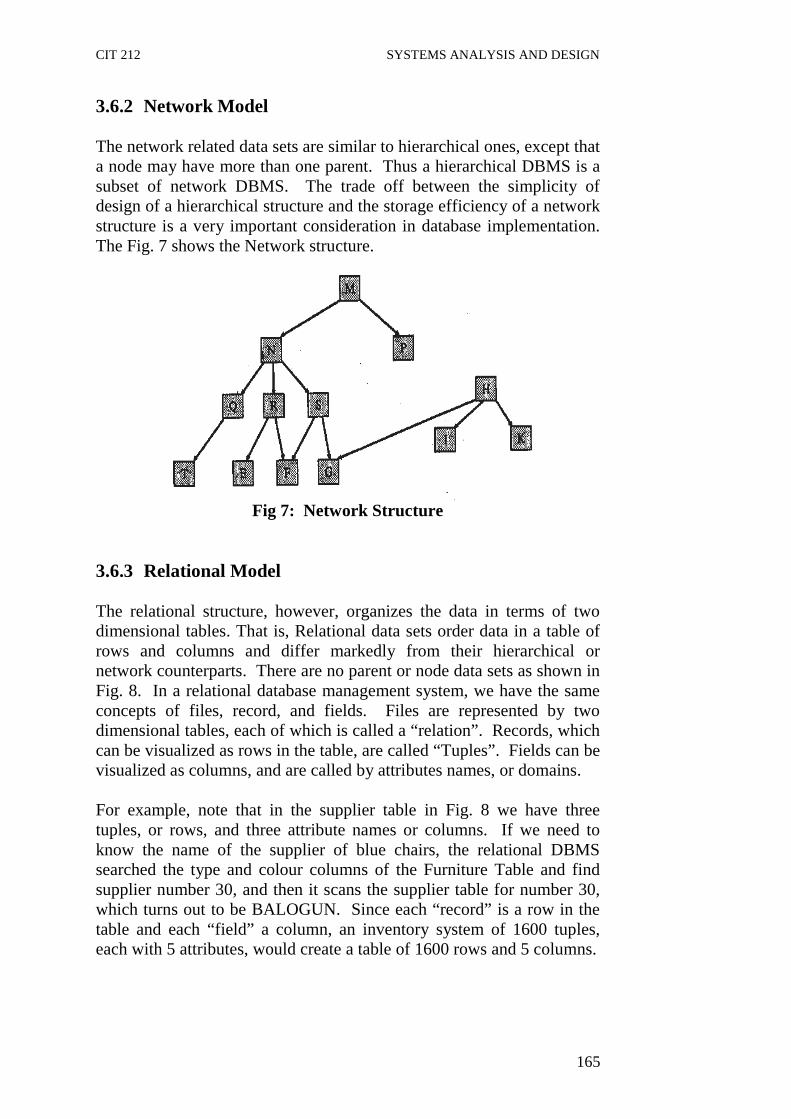
CIT 212 SYSTEMS ANALYSIS AND DESIGN
165
3.6.2 Network Model The network related data sets are similar to hierarchical ones, except that a node may have more than one parent. Thus a hierarchical DBMS is a subset of network DBMS. The trade off between the simplicity of design of a hierarchical structure and the storage efficiency of a network structure is a very important consideration in database implementation. The Fig. 7 shows the Network structure.
Fig 7: Network Structure
3.6.3 Relational Model The relational structure, however, organizes the data in terms of two dimensional tables. That is, Relational data sets order data in a table of rows and columns and differ markedly from their hierarchical or network counterparts. There are no parent or node data sets as shown in Fig. 8. In a relational database management system, we have the same concepts of files, record, and fields. Files are represented by two dimensional tables, each of which is called a “relation”. Records, which can be visualized as rows in the table, are called “Tuples”. Fields can be visualized as columns, and are called by attributes names, or domains. For example, note that in the supplier table in Fig. 8 we have three tuples, or rows, and three attribute names or columns. If we need to know the name of the supplier of blue chairs, the relational DBMS searched the type and colour columns of the Furniture Table and find supplier number 30, and then it scans the supplier table for number 30, which turns out to be BALOGUN. Since each “record” is a row in the table and each “field” a column, an inventory system of 1600 tuples, each with 5 attributes, would create a table of 1600 rows and 5 columns.

CIT 212 SYSTEMS ANALYSIS AND DESIGN
166
FURNITURE Product Number
Type Colour Quantity in stock
Supplier Number
2589 Table White 4 26 2892 Chair Blue 6 30 3471 Chair Light green 20 133 3678 Desk Brown 9 150 3689 Stool Brown 25 159 SUPPLIER Supplier Number Supplier Name Amount of Purchases
this Year 30 BALOGUN 26,035.00 26 ABASS 13,960.00 159 LONGE 75,286.00 Fig. 8: Relational Structure A relational DBMS can perform the following basic operations: - create or delete table - update, insert, or delete rows - add or delete columns - copy data from one table into another - retrieve or query a table, row or column - print, recognize, or read a table, row or column - join or combine table based on a value in a table. Since the relational structure organizes the data in terms of two dimensional tables, they offer great flexibility and a high degree of data security. The relational structure uses relatively little memory or secondary storage. Unfortunately, the process of creating the tables is a rather elaborate procedure. Another disadvantage of this structure is that it generally requires more time to access information than either of the other two structures. This is because much more information must be searched in order to answer queries posed to the systems. In addition, some implementations use a fixed amount of storage for each field, resulting in insufficient storage utilization. In spite of these disadvantages, the relational structure has gained rapid acceptance and is currently the most popular of the three structures. Many experts predict that it will eventually replace the others completely.

CIT 212 SYSTEMS ANALYSIS AND DESIGN
167
3.7 Coding System The information systems are designed with space, time, and cost savings in mind. The coding systems are used to reduce the input, control errors and speed up the entire process. So coding systems are method in which conditions, words, ideas or relationship are expressed by a code. A code is an ordered collection of symbols designed to provide unique identification of an entity or attribute. It may be a brief number, title or symbol. The main purpose of codes is to facilitate the identification and retrieval of items of information from the system.
3.8 Types of Codes There are many possible coding structures. The main types of codes are described below:
3.8.1 Classification Code Classification is best described as the establishment of categories of entities, types and attributes in a way that brings like or similar items together according to pre-determined relationships. A classification is by nature an ordered systematic structure. So the classification code places separate entities like events, people, or objects, into distinct groups called classes. A code is used to identify one class from another. Using this code, the user classifies the event into one of several possible categories and records the code. Classification codes vastly simplify the input process because only a single-digit code is required. The need for writing lengthy descriptions or making judgements is eliminated.
3.8.2 Function Code Function codes state the activities or work to be performed without spelling out all the details in narrative statements. Analysts use this type of code frequently in transaction data to tell the system how to process the data. For example, the design for the processing the codes given like the following to perform certain activities. A - To add record D - To delete record U - To update record E - To edit record Otherwise, 1 - Addition of records 2 - Modification of records 3 - Deletion of records

CIT 212 SYSTEMS ANALYSIS AND DESIGN
168
3.8.3 Card Code Card codes allow the program to distinguish between the types of card and to determine whether the contents of a specific card are correct. These card codes are used in the punched cards only, which is for batch process. 3.8.4 Sequence Code Sequence codes are numbers or letters assigned in series. They tell the order in which events have occurred. This code is simple to use and apply. For example, employee numbers might be assigned consecutively to employees as they are hired. It makes no provision for classifying groups of like items according to specific characteristics. An advantage of the sequence code is that it can cover an unlimited number of items by using the fewer possible code digits. As new items occur they are simply assigned to the next higher unused number in. 3.8.5 Significant –Digit Subset Code A well conceived coding scheme, using sub-codes within larger codes or numbers, can provide a wealth of information to users. Suppose item number will be assigned to the different materials and products a firm stock or sells. One way is to assign numbers in sequence, starting with the first and going through to the last one. Or a prefix can be added to the identification numbers to further describe the type of item. For example: PL - refers the product is Plastic and ST - refers he product is steel The codes can be divided into subsets or subcodes, or characters that are part of the identification number that have special meaning. The subcodes tell the user additional information about the item. For example, in a bank examination, the registration number is assigned to each candidate, which gives much information, Let the assigned number be 11021978 11 - Centre where the examination is to be held 02 - The post number for which the candidate has applied. 1978 - The number assigned to the candidate.
CIT 212 SYSTEMS ANALYSIS AND DESIGN
169
A frequent method of coding is by abbreviation of the name of an entity or attribute. The main ways of doing this are by mnemonic codes and acronyms. 3.8.6 Mnemonic Code Mnemonic code construction is characterized by the use of either letters or numbers, or letters and numbers combination, which describe the items coded, the combinations having been derived from descriptions of the items themselves. Mnemonic codes produce fewer errors than other types of code where the number of items is relatively small and stable. For example, M and F are more reliable than 1 and 2, and Y and N for Yes and No respectively. Another example for combination of letters and numbers is, to describe 16 inch colour television set, a use code is TV-CL-16. Also the unit of measure codes are frequently mnemonic codes. For example, cm – centimetre, m – metre, km – kilometre. 3.8.7 Acronyms The acronym is a particular type of mnemonic representation formed from the first letter or letters of several words. An acronym often becomes a word in itself. For example, MIT - Master of Information Technology RADAR - Radio Detecting and Ranging 4.0 CONCLUSION In this unit, you have been exposed to how to select data storage media, the concepts of files, types of file, file organization, files design, database design, types of database and coding system. All these play significant role in the design and functioning of a processing system. 5.0 SUMMARY In this unit, we have discussed file concept and several categories of data files. These most important methods of file organization have also been explained in a systematic way. Basic factors to be considered in the selection of file media and file organization have been pointed out in this unit. Database design, its various types are also included. Coding design also play significant role in business data processing system. Different types of code have been defined.

CIT 212 SYSTEMS ANALYSIS AND DESIGN
170
6.0 TUTOR-MARKED ASSIGNMENT 1. List out the specific advantages of database. 2. List out various types of database structure. 3. What do you understand by Coding System?. 4. List out various types of code. 7.0 REFERENCES AND FURTHER READINGS Analysis & design of information systems – James A Senn, Mc-Graw
Hill Book Co. (1986) Structured Analysis and Systems Specification – Tom De Marco,
Prentice Hall (1979) The Practical Guide to Structured system Design – Page Jones Mellir,
The Yourdon press (1980) Managing the Structured Techniques – Edward Yourdon, Yourdon,
Yourdon Press (1979)

CIT 212 SYSTEMS ANALYSIS AND DESIGN
171
MODULE 3 Unit 1 System Development Unit 2 System Control and Quality Assurance Unit 3 Documentation Unit 4 System Implementation
UNIT 1 SYSTEM DEVELOPMENT CONTENTS 1.0 Introduction 2.0 Objectives 3.0 Main Content
3.1 Tasks of System Development 3.2 Prototype Installation 3.3 Hardware and Software Selection and Performance
3.3.1 Hardware Selection 3.3.2 Software Selection
3.4 Bench Mark Testing 3.5 Preparing Software Development Cycle
3.5.1 Identifying Program 3.5.2 Program Logic and Flowcharts 3.5.3 Control Structure 3.5.4 Pseudocode
3.6 Software Specification Language Selection Criteria 3.6.1 Volume of Data 3.6.2 Complexity of Processing 3.6.3 Compatibility of other Systems 3.6.4 Types of Input/Output 3.6.5 Development Efforts
4.0 Conclusion 5.0 Summary 6.0 Tutor-Marked Assignments 7.0 References/Further Readings
1.0 INTRODUCTION The fourth phase in the life cycle of a system is the software development. In the development phase, the computer-based business system is developed to conform to the design specification prepared in the preceding phase. This phase involves heavy expenditure because of recruiting additional staff for the purpose of software development, purchase of machine, materials and the use of computer facilities. The principal activities performed during the development phase are: (a) External system development and (b) Internal system implementation

CIT 212 SYSTEMS ANALYSIS AND DESIGN
172
planning, preparation of manuals and personnel in-house training, and equipment acquisition and installation. Software development and performance testing are considered to be the principal activities of internal system development. 2.0 OBJECTIVES After completing this unit, you should be able to: ● understand different tasks of system development ● know the importance of prototype ● find out various factors to be considered prior to system selection ● understand the term ‘benchmark’ ● define the various parameter responsible in considering the
selection of a language
3.0 MAIN CONTENT
3.1 Tasks of System Development Major tasks of system development have been summarized below: (i) Implementation Planning After the initiation of development phase is approved, implementation planning starts. Essential parts of implementation plan are: (a) A plan for testing the computer program components, both as the
integrated assembly of its individual programs and as an element of the overall business system.
(b) A plan for training the personnel associated with the development
of software on the new system. This includes persons who will provide inputs to, receive output from, operate or maintain the new system.
(c) A conversion plan that provides for the conversion of procedures,
programs and files preparatory to actual changeover from the old system to the new one.
(ii) Software development phase Software development phase can work along with the implementation planning efforts. If it is necessary, system flowcharts are expanded to show additional detail for the computer program components. The complete database is developed. Input and output files are identified and computer program logic flowcharts are prepared for each computer program component.
CIT 212 SYSTEMS ANALYSIS AND DESIGN
173
(iii) User Review Reviews are held with the principal user throughout the development phase. A review of test plans, training plans, and conversion plan is quite important because users are directly involved in implementation activities. Users’ concurrence with the implementation plan is extremely important to carry on the software development work in an efficient way. (iv) Equipment acquisition and installation In the design phase, special hardware required to support the system may have identified. If the hardware is not ordered during the design phase, it is proper time to go for it. It is also true that all hardware components are not required at a particular time because the needs vary depending upon the type of software being developed. It is, therefore, necessary that a proper schedule should be prepared for acquisition of hardware components. (v) Coding, debugging and testing of computer program Each of the computer programs that make up the entire system is coded and debugged. This means that each computer program is complied error free and successfully executed using the rest data prepared by the programmer. (vi) System testing System tests are performed to verify that the computer-based business system has met its design objectives. (vii) Reference manual preparation Proper reference manual for the various individuals who will be associated with the new computer-based information system must be prepared. (viii) Personnel training Operating, programming and user personnel are trained using the reference manuals, forms and procedures as training aids. All sorts of training activities must be completed prior to the user acceptance review which occurs at the end of the development phase.
CIT 212 SYSTEMS ANALYSIS AND DESIGN
174
(ix) User acceptance review At the end of development phase, the computer-based system is reviewed by the management of the user organization. Representatives of the information service organizations and other affected organizations take part in this review. Design phase report, development phase report and test reports are some of the important documents which are responsible for the acceptance review. 3.2 Prototype Installation A prototype installation is the process of creating, developing and refining a working model of a final system. It does not contain all the features or perform all the necessary functions of the final system. Rather, it includes large number of elements to enable individuals to use the proposed system to determine what they like and do not like and to identify features to be added or changed. Application prototyping, the process of developing and using the prototype, has the following characteristics. (i) The prototype is a live, working application. (ii) Its main purpose is to test out the assumption made by the
analysts and users about the features of required system. (iii) Prototypes can be quickly created. (iv) They follow an iterative process. (v) They are relatively cheap. Application prototyping has two primary uses. The first one is that it is an effective device for clarifying user requirements. Written specifications are typically created as a vehicle for defining application features and the requirements that must be satisfied. A second use of application prototyping is to verify the feasibility of a system design. Analysis can make experiment using different application characteristics, evaluating user reaction and response. The rationale for application prototyping is a direct outgrowth of the need to design and develop information systems quickly, efficiently and effectively.
CIT 212 SYSTEMS ANALYSIS AND DESIGN
175
Application prototyping is a proven technique that improves the overall effectiveness of the development efforts for the benefit of user, analysts and the organization as a whole. 3.3 Hardware and Software Selection and Performance 3.3.1 Hardware Selection The decision to acquire computer hardware or software must be handled in the same way as any other business decision. The variety of sizes and types of computing resources available puts other burden on the analyst who must select suitable hardware, software or services and advise the top management accordingly. Today, selecting a system is a serious and time-consuming business. The time spent on the selection process is a function of the applications and whether the system is a basic micro-computer or a mainframe. In either case, planning system selection and acquiring experienced help where necessary pay off in the long run. There are various important factors which should be considered prior to system selection. They are: (a) Define system capabilities that make sense for the business. (b) Specify the magnitude of the problem; i.e. clarify whether
selection entails a few peripherals or a major decision concerning the mainframe.
(c) Assess the competence of the in-house staff. (d) Hardware and software should be considered as a package. (e) Develop a time frame for the selection process. (f) Provide user indoctrination. This is crucial, especially for first-
time users. Selling the system to the user staff, provide adequate training and creating an environment conductive to implementation is pre-requisite for system acquisition.
The selection process should be viewed as a project and a project team should be formed with the help of management. The selection process consists of several steps which are discussed below:

CIT 212 SYSTEMS ANALYSIS AND DESIGN
176
1. Requirement analysis The first step in selection is understanding the user’s requirements within the frame work of the organization’s objectives and the environment in which the system is being installed. 2. System specifications System specifications must be clearly defined. These specifications must reflect the actual applications to be handled by the system and include system objectives, flowcharts, input-output requirements, file structure and cost. 3. Request for proposal After the requirement analysis and system specifications have been defined, a request for proposal is prepared and sent to selected vendors for bidding. 4. Evaluation and validation The evaluation phase ranks various vendor proposals and determines the one best suited to the user’s requirements. It looks into items such as price, availability and technical support. System validation ensures that the vendor can, in fact, match his/her claims, especially system performance. 5. Vendor selection This step determines the vendor with the best combination of reputation, reliability, service record, training, delivery time, lease/finance terms. The selected vendors are invited to give a presentation of their system. The system chosen goes through contract negotiations before implementation. 3.3.2 Software Selection Software selection is a critical aspect of system development. There are two ways of acquiring software: custom-made or “off-the-shelf” package. Today, there is great demand for these packages because they are quite cheap. There are other benefits also. (i) A good package can get the system running quickly. (ii) MIS personnel are released for other projects.
CIT 212 SYSTEMS ANALYSIS AND DESIGN
177
(iii) ‘Home-grown’ software can take more time and its cost cannot be predicted.
(iv) Package can be tested before purchasing it. Some drawbacks of software packages are: (i) These packages may not meet user requirements in all respect. (ii) Extensive modifications of a package usually results in loss of the
vendor’s support. It can be observed that price alone cannot determine the quality of software. A systematic review is crucial for selecting the desired software. Prior to selecting the software, the project team set up criteria for selection. The criteria for software selection are: (a) Reliability: gives consistent results without any failure for a
specified time period. (b) Functionality: functions to standards. (c) Capacity: satisfies volume requirements of the user. (d) Flexibility: adapts to the changing needs. (e) Usability: is user-friendly. (f) Security: maintains integrity and prevents unauthorized user. (g) Performance: delivers the results as required. (h) Serviceability: has good documentation and vendor support. (i) Ownership: has right to modify and share use of package. (j) Minimal costs: is justified and affordable for intended
application. SELF-ASSESSMENT EXERCISE i. List out the major tasks of system development. ii. What are the important factors to be considered prior to system
selection? iii. Explain briefly about the criteria for software selection.
CIT 212 SYSTEMS ANALYSIS AND DESIGN
178
3.4 Benchmark Testing The term “benchmark” was derived from the days when the machinist in a factory would use measurements at each bench to determine if the parts he was machining were satisfactory. In the computing field, to compare one system with another, you would run the same set of ‘benchmark” programs, through each system. A benchmark is a sample program specifically designed to evaluate the performance of different computers and their software. This is necessary because computers will not generally use the same instructions, words of memory or machine cycle to solve particular problem. As regards evaluation of software, benchmarking is mainly concerned with validation of vendor’s claims in respect of following points: - minimum hardware configuration needed to operate a package. - time required to execute a program in an ideal environment and
how the performance of own package and that of other programs under execution is affected, when running in a multi-programming mode.
The more elaborate the benchmarking, the more costly is the evaluation. The user’s goals must be kept in mind. Time constraints also limit how thorough the testing process can be. There must be compromise on how much to test while still ensuring that the software (or hardware) meets its functional criteria. Benchmarks can be run in almost all type of systems environment including batch and online jobs streams and with the users linked to the system directly or through telecommunications methods. Common benchmarks test the speed of the central processor, with typical instructions executed in asset of programs, as well as multiple streams of jobs in a multiprogramming environment. The same benchmark run on several different computers will make apparent any speed and performance differences attributable to the central processor. Benchmarks can also be centred around an expected language mix for the programs that will run, a mix of different set of programs and applications having widely varying input and output volumes and requirements. The response time for sending and receiving data from terminals is an additional benchmark for the comparison of systems.
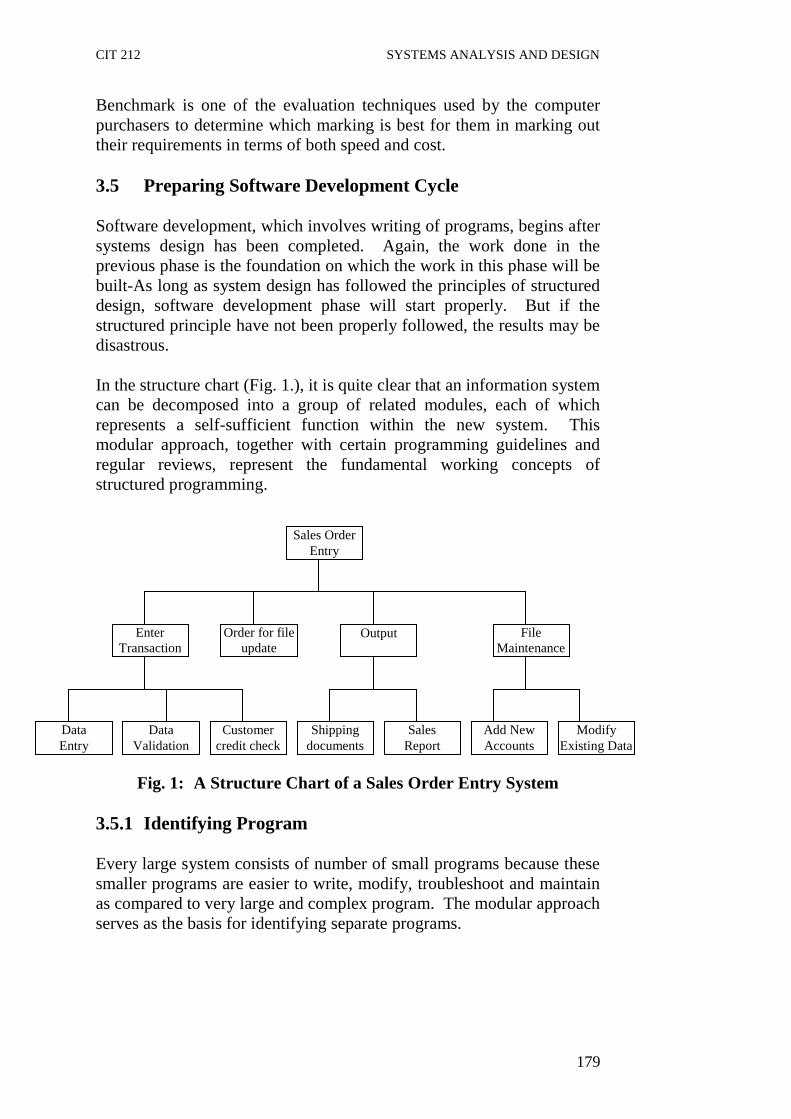
CIT 212 SYSTEMS ANALYSIS AND DESIGN
179
Benchmark is one of the evaluation techniques used by the computer purchasers to determine which marking is best for them in marking out their requirements in terms of both speed and cost. 3.5 Preparing Software Development Cycle Software development, which involves writing of programs, begins after systems design has been completed. Again, the work done in the previous phase is the foundation on which the work in this phase will be built-As long as system design has followed the principles of structured design, software development phase will start properly. But if the structured principle have not been properly followed, the results may be disastrous. In the structure chart (Fig. 1.), it is quite clear that an information system can be decomposed into a group of related modules, each of which represents a self-sufficient function within the new system. This modular approach, together with certain programming guidelines and regular reviews, represent the fundamental working concepts of structured programming.
Fig. 1: A Structure Chart of a Sales Order Entry System 3.5.1 Identifying Program Every large system consists of number of small programs because these smaller programs are easier to write, modify, troubleshoot and maintain as compared to very large and complex program. The modular approach serves as the basis for identifying separate programs.
Sales Order Entry
Enter Transaction
Order for file update
Output
Shipping documents
Add New Accounts
Modify Existing Data
Customer credit check
Data Validation
Data Entry
File Maintenance
Sales Report
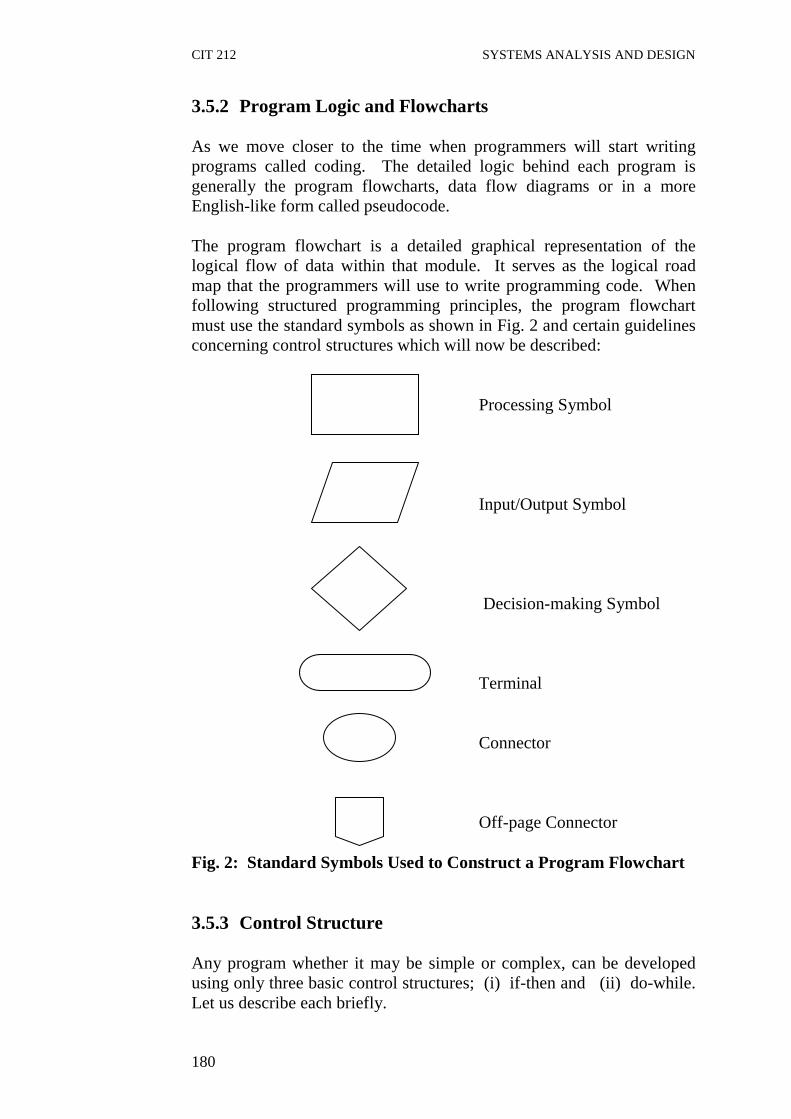
CIT 212 SYSTEMS ANALYSIS AND DESIGN
180
3.5.2 Program Logic and Flowcharts As we move closer to the time when programmers will start writing programs called coding. The detailed logic behind each program is generally the program flowcharts, data flow diagrams or in a more English-like form called pseudocode. The program flowchart is a detailed graphical representation of the logical flow of data within that module. It serves as the logical road map that the programmers will use to write programming code. When following structured programming principles, the program flowchart must use the standard symbols as shown in Fig. 2 and certain guidelines concerning control structures which will now be described: Processing Symbol Input/Output Symbol Decision-making Symbol Terminal Connector Off-page Connector Fig. 2: Standard Symbols Used to Construct a Program Flowchart 3.5.3 Control Structure Any program whether it may be simple or complex, can be developed using only three basic control structures; (i) if-then and (ii) do-while. Let us describe each briefly.

CIT 212 SYSTEMS ANALYSIS AND DESIGN
181
Simple Sequence A simple sequence structure is used when a series of steps must be carried out in linear sequence. These steps begin with the first and end with the last. Fig. 3 shows a simple sequence containing some of the steps necessary to validate employee wage data, one module in a payroll system.
Fig. 3: A Simple Sequence Structure Example
If-then Structure The if-then structure is used to transfer control from one point in a program to another. This transfer is based on meeting out certain condition. Suppose we want to write a program which all employees with more than 10 years of experience are to be listed in a specific report. Fig. 4 shows how the if-then structure can be used to perform this test.
Figure 4: If-then Structure Example

CIT 212 SYSTEMS ANALYSIS AND DESIGN
182
Do-while Structure The do-while structure is used when it becomes necessary to loop through or repeat over and over a sequence of steps. Looping starts at the entrance of the structure and continues while a pre-specified condition still exists. It is important to remember that a do-while structure tests immediately for a pre-specified condition and does not allow any processing between the entry of the do-while structure and this test. Processing within the structure can only be done after the test has been made and in the line that returns to the top of the do-while structure. Therefore, a record must be read before a do-while structure is entered for the first time. Suppose we want to access an employee file, read each record and print its contents. As you can see from fig. 5 a record is read before the do-while structure is entered for the first time. Immediately upon entering, the test for more record is made and if there are more records then the contents of the first record will be printed and another record will be read. This process continues until the last record. At that time, control passes out of the structure and to the next program step.
Fig. 5: A Do-While Structure Example
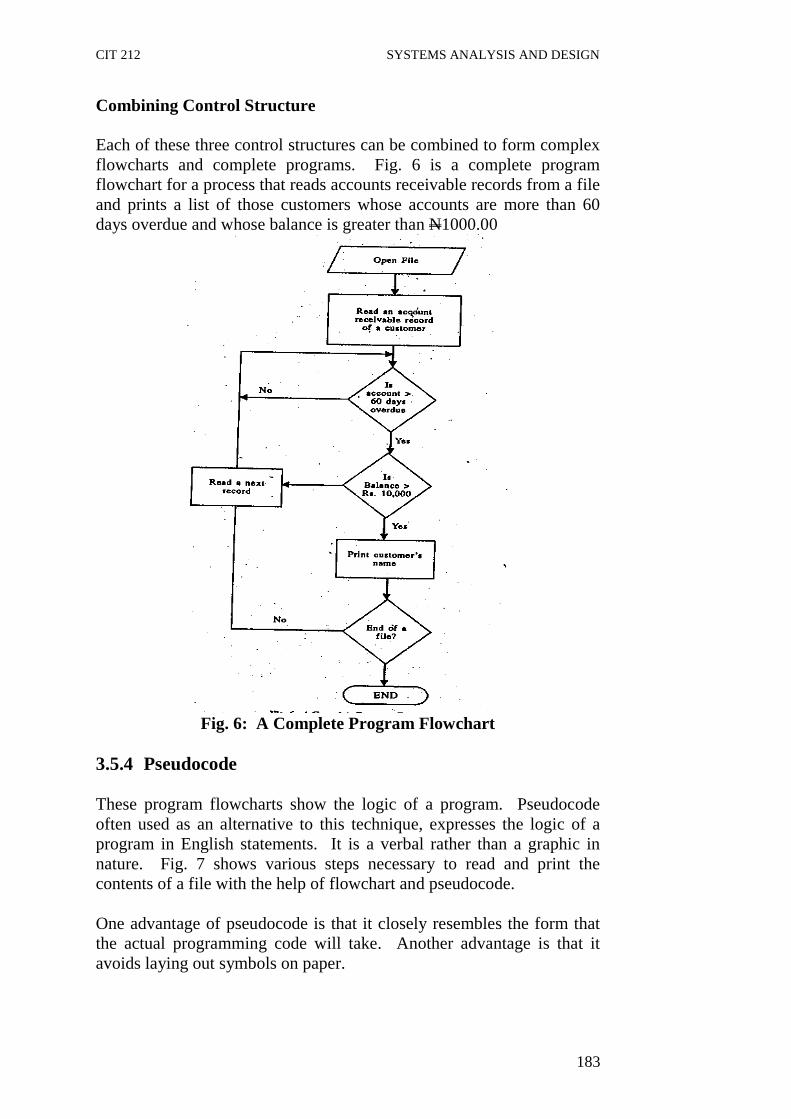
CIT 212 SYSTEMS ANALYSIS AND DESIGN
183
Combining Control Structure Each of these three control structures can be combined to form complex flowcharts and complete programs. Fig. 6 is a complete program flowchart for a process that reads accounts receivable records from a file and prints a list of those customers whose accounts are more than 60 days overdue and whose balance is greater than N1000.00
Fig. 6: A Complete Program Flowchart
3.5.4 Pseudocode These program flowcharts show the logic of a program. Pseudocode often used as an alternative to this technique, expresses the logic of a program in English statements. It is a verbal rather than a graphic in nature. Fig. 7 shows various steps necessary to read and print the contents of a file with the help of flowchart and pseudocode. One advantage of pseudocode is that it closely resembles the form that the actual programming code will take. Another advantage is that it avoids laying out symbols on paper.

CIT 212 SYSTEMS ANALYSIS AND DESIGN
184
Fig. 7: Pseudocode and a Flowchart Equivalent 3.6 Software Specification Language Selection Criteria After the program flowcharts or pseudocode have been completed, a programming language must be chosen. Often that choice will depend on the language in which most of an organization’s other programs are written. This ensures consistency and eases the maintenance problem. Nevertheless, a number of different languages are currently in use, only a few of them need to be considered for the purpose of appreciating the issues involved in choosing a programming language. The languages that are discussed are: FORTRAN, COBOL, BASIC, C and dBASE. FORTRAN (FORmula TRANslation) is a compact language that serves the needs of both the scientist and economists. Main advantage of this language is that it supplies large library of Mathematical and Engineering subroutines being utilized by the programmer in solving different type of problems of numerical and scientific in nature. Handling files containing voluminous data is definitely not a strength of this language. COBOL (COmmon Business Oriented Language) is one of the most popular languages used for large data processing problems. Its main strengths lie in handling files of large size and the ease of understanding and editing the program. COBOL can solve simple arithmetic problems but does not help in solving any complex mathematical problems. BASIC (Beginners’ All-purpose Symbolic Instruction Code) is the most popular conversational programming language. It is simple to understand. Various versions of BASIC have been developed by computer manufacturers for their computers. It is suitable for both
CIT 212 SYSTEMS ANALYSIS AND DESIGN
185
mathematical and business problems. It has been specially designed for use in time-sharing environment but can also be used as a standard programming language in a batch-processing environment. The main problem in BASIC language is that most versions of this language do not support indexed files. C is a quite powerful programming language which is as compact as its name. C can be used where programmer wants to have more control over the hardware because it provides features that would typically be possible with machine/assembly languages only. This language is quite popular among people who are engaged in developing system software like operating systems or other utilities. The disadvantage of this language is that the program is not too easily decipherable and it takes a long time to learn. dBASE is a Fourth Generation Language which is more an application development tool rather than a programming language. It provides features to store and retrieve data. The major advantage of this language is the query and reporting facility which helps in generating the report quickly. It is quite simple and easy to understand. If the volume of data to be processed is very large, the program can become quite slow. Numbers of parameters responsible in considering the selection of a language are: ● volume of a data ● complexity of processing ● compatibility with other systems ● types of input/output ● development efforts. 3.6.1 Volume of Data This covers two aspects: (i) Number of files (ii) Number of records Some languages put a restriction on the number of files that can be accessed at a time. For example, dBASE III + can open ten data files whereas COBOL does not have such restriction. It is also observed that most languages tend to become slower when the file size becomes larger. This slowing down feature due to large number of records is usually found in Fourth-Generation Languages. There is also the
CIT 212 SYSTEMS ANALYSIS AND DESIGN
186
extreme where certain tools are not desirable for a very low volume of data. This is typically true of DBMS based products. 3.6.2 Complexity of Processing Some applications take little bit input, do small calculation and generate output. There are quite simple reporting programs. These programs would not require much computation work. On the other hand, some applications involve plenty of computation, for example analysing data from a drilling rig exploring for oil. These would also benefit from the use of mathematical co-processors. FORTRAN is a language that is desired for such type of applications. Some spreadsheets also help in doing complex computations. In case the application does not involve complex computation but require repetitive computations, a language like COBOL or dBASE would be desirable. 3.6.3 Compatibility of other Systems Any new system cannot exist in isolation but has to co-exist with other systems. Generally we face the problem that some data files may have to be accessed by the old and new systems. If this is not adhered to, the result could be chaotic and may also require additional overheads. It is also possible that the two systems, if in different languages, may not be able to read the same data files e.g. COBOL programs cannot directly read dBASE III file. This compatibility issue has to be kept in mind even when two parts of the system are written in different languages. In such situation, it may not suffice that sharing of data is permitted, and two programs may need to invoke each other. 3.6.4 Types of Input/Output Two issues are involved: (i) Types of Input/Output device (ii) Complexity of Formats While considering the types of input/output devices that are required, the answer is normally yes or no. For example, if a program needs to give output to a plotter, dBASE may not be suitable. Complexity of format is little bit more difficult to decide. Some applications may definitely need graphic output, in which case the options are to use an integrated package like LOTUS 1-2-3 or VP Planner, which has the capability of giving output. There may be some applications which require complex formatted screens or printouts. In

CIT 212 SYSTEMS ANALYSIS AND DESIGN
187
such cases, one method to be explored is “How critical is the format? Can it be modified to make programming efforts simpler?” For example, the user may have asked page number at the bottom of the report whereas the REPORT FORM of dBASE would print the page number on top of the page. Printing the page number at the bottom of the page may mean program writing instead of using the tools available. If the user wants ad hoc queries then a powerful query language like dBASE III would be suitable. 3.6.5 Development Efforts The parameter could sometimes be the decider. The main reasons for different languages taking different amounts of effort for the same task are: (i) features available in the language (ii) learning time A simple example of feature availability is that most versions of BASIC do not support indexed files whereas COBOL supports indexed files. The learning time required to gain proficiency could become a critical factor if software has to be developed in a language that the development taken is not familiar with. It is possible that even a particular language offers many good features but might take enough time to learn. It is very possible that programming language is chosen based on what language the people in the organization are familiar with. 4.0 CONCLUSION This unit has taken you through the intricacies of different tasks involved in system development, the importance and installation of prototype and various factors to be considered prior to system selection. The unit has also exposed you to the term benchmark and its testing, preparation of software development cycle and the criteria (parameters) guiding the selection of software specification language such as volume of data, complexity of processing, compatibility with other system, types of input/output, etc. 5.0 SUMMARY System analyst play very important role in developing information systems that are useful to management and employees in business systems. The system development life cycle, the set of activities that

CIT 212 SYSTEMS ANALYSIS AND DESIGN
188
analysts and designers carry out to develop and implement an information system. Prototyping is an appropriate development strategy when predicting the user’s requirement is not possible. A prototype, a version of an information system having the essential features but not necessarily all details of the user interface or performance efficiency, is developed and put into use. 6.0 TUTOR-MARKED ASSIGNMENTS 1. Describe “Benchmark Testing” briefly. 2. List out various parameters responsible in considering the
selection of suitable language in a big organization. 7.0 REFERENCES AND FURTHER READINGS Analysis & design of information systems – James A Senn, Mc-Graw
Hill Book Co. (1986) Structured Analysis and Systems Specification – Tom De Marco,
Prentice Hall (1979) The Practical Guide to Structured system Design – Page Jones Mellir,
The Yourdon press (1980) Managing the Structured Techniques – Edward Yourdon, Yourdon,
Yourdon Press (1979)

CIT 212 SYSTEMS ANALYSIS AND DESIGN
189
UNIT 2 SYSTEM CONTROL AND QUALITY ASSURANCE
CONTENTS 1.0 Introduction 2.0 Objectives 3.0 Main Content
3.1 Quality Assurance in Software Life cycle 3.1.1 Quality Factors Specifications 3.1.2 Software Requirements Specifications 3.1.3 Software Design Specifications 3.1.4 Software Testing and Implementation 3.1.5 Maintenance and Support
3.2 Levels of Quality Assurance 3.2.1 Testing 3.2.2 Verification and Validation 3.2.3 Certification 3.3 Design Objectives: Reliability and Maintenance 3.3.1 Designing Reliable Systems 3.3.2 Designing Maintainable Systems 3.4 Maintenance Issues 3.5 Maintainable Designs 3.6 Testing Practice and Plans 3.7 Levels of Tests 3.7.1 Unit Testing 3.7.2 System Testing 3.8 Special Systems Tests 3.9 Designing Test Data 3.10 System Control 3.10.1 Objective of System Control 3.10.2 Types of Control 3.11 Audit Trail 4.0 Conclusion 5.0 Summary 6.0 Tutor-Marked Assignment 7.0 References/Further Readings 1.0 INTRODUCTION The amount and complexity of software developed today stagger the imagination. Software development strategies have not come up with the standard and because of this software products do not meet the application objectives. Subsequently control must be developed to ensure a quality product. Basically quality assurance is the review of software products and its related documentation for completeness,
CIT 212 SYSTEMS ANALYSIS AND DESIGN
190
correctness, reliability and maintainability. This unit deals with various issues involved in the quality assurance, testing and system control. 2.0 OBJECTIVES At the end of this unit, you should be able to: ● highlight various issues involved in quality assurance, testing and
system control. ● point out the role of quality assurance in various stages of a
Software Development Life Cycle. ● illustrate the significance of various levels of tests and their
different functions. ● explain the role played by system control in a computer system. 3.0 MAIN CONTENT 3.1 Quality Assurance in Software Life cycle The software life cycle includes various stages of development and each stage has the goal of quality assurance. Steps taken in this regard are summarized below: 3.1.1 Quality Factors Specifications The goal of this stage is to describe various factors mainly responsible for quality of the proposed system. They are as follows: (i) Correctness: The extent to which a program meets system
specifications and user objectives (ii) Reliability: The degree to which the system performs its
intended functions over a time. (iii) Efficiency: Computer resources required by a program to
perform a particular function. (iv) Usability: The efforts required to understand and operate system. (v) Maintainability: The ease with which the program errors are
detected and removed. (vi) Testability: The effort required to test a program to ensure its
correct performance.

CIT 212 SYSTEMS ANALYSIS AND DESIGN
191
(vii) Portability: the ease of transporting a program from one hardware configuration to another.
(viii) Accuracy: The required precision in input, editing,
computations, and output. (ix) Error tolerance: Error detection and correction versus error
avoidance. (x) Expandability: Ease of expanding the existing database. (xi) Access control and audit: Control of access to the system and
the extent to which that access can be audited. (xii) Communicativeness: Usefulness and effectiveness of the inputs
and outputs of the system. 3.1.2 Software Requirements Specifications The quality assurance goal of this stage is to generate the requirements documents that help in providing technical specifications for developing the software. 3.1.3 Software Design Specifications In this stage, the software design document defines the overall architecture of the software that provides the functions and features given in the software requirements document. 3.1.4 Software Testing and Implementation The quality assurance goal of the testing phase is to ensure the completeness and accuracy of the system and minimize the retesting process. In the implementation phase, the goal is to provide a logical order for the creation of the modules and, in turn, the creation of the system. 3.1.5 Maintenance and Support This phase provides the necessary software development for the system to continue to comply with the original specifications. The quality assurance goal is to develop a procedure for correcting errors and enhancing software.
CIT 212 SYSTEMS ANALYSIS AND DESIGN
192
3.2 Levels of Quality Assurance Analysts use three levels of quality assurance: testing, verification with validation and certification. 3.2.1 Testing System testing is quite expensive and time consuming process. The common view of testing held by users is that it is performed to prove that program is error free. But this is quite difficult since the analysts cannot prove that software is free from all sorts of errors. Therefore the most useful and practical approach is with the understanding that testing is the processing of executing a program with the explicit intention of finding errors, that is, making the program fail. A successful test, then, is one that finds an error. 3.2.2 Verification and Validation Like testing, verification is also intended to find errors. It is performed by executing a program in a simulated environment. Validation refers to the process of using software in a live environment to find errors. When commercial systems are developed with the main aim of distributing them to dealers for sales purposes, they first go through verification, sometimes called alpha testing. The feedback from the validation phase generally brings some changes in the software to deal with errors and failures that are uncovered. Then a set of user is selected for putting the system into use on a live basis. These beta test sites use the system in day-to-day activities; they process live transactions and produce normal system output. Validation may continue for several months. During the course of validating the system, failure may occur and the software will be changed. Continued use may bring more failures and the need for still more changes. 3.2.3 Certification The last level of quality assurance is to certify that the software package developed conforms to standards. With a growing demand for purchasing ready-to-use software, importance of certification has increased. A package that is certified goes through a team of computer specialist who test, review and determine how well it meets the user’s requirements and vendor’s claims. Certification is issued only if the package is successful in all the tests. Certification, however, does not mean that is the best package to adopt. It only attests that it will perform what the vendor claims.
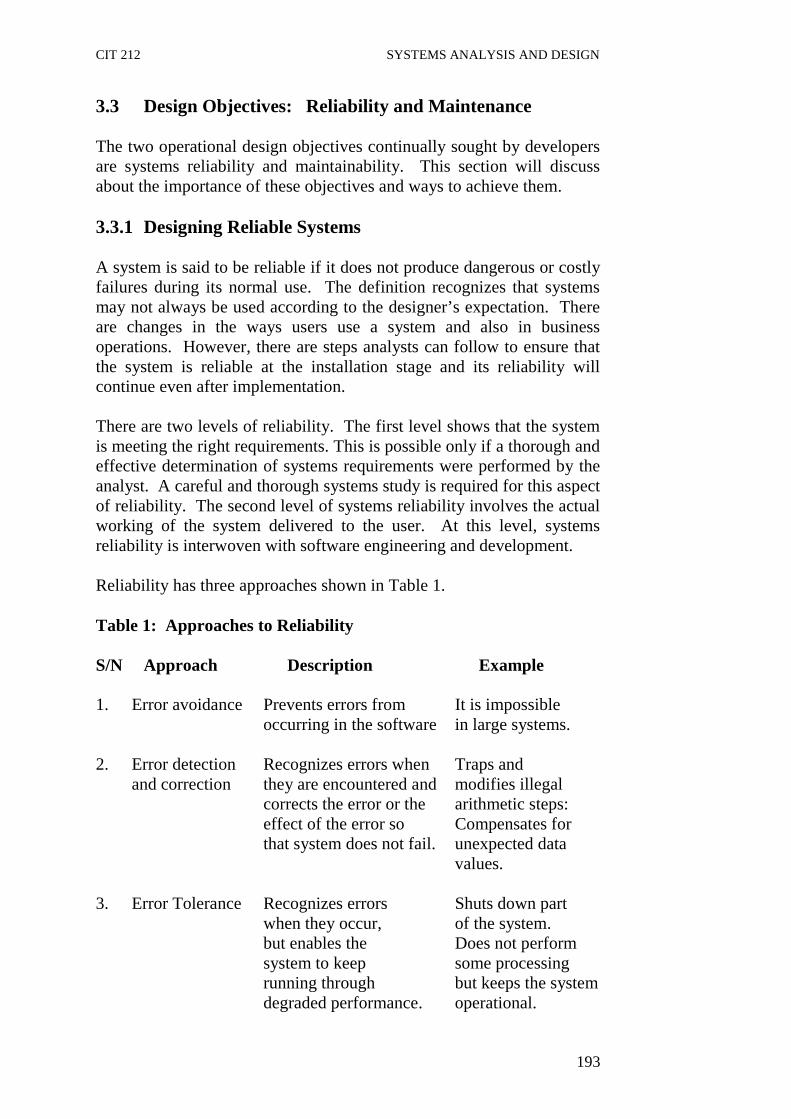
CIT 212 SYSTEMS ANALYSIS AND DESIGN
193
3.3 Design Objectives: Reliability and Maintenance The two operational design objectives continually sought by developers are systems reliability and maintainability. This section will discuss about the importance of these objectives and ways to achieve them. 3.3.1 Designing Reliable Systems A system is said to be reliable if it does not produce dangerous or costly failures during its normal use. The definition recognizes that systems may not always be used according to the designer’s expectation. There are changes in the ways users use a system and also in business operations. However, there are steps analysts can follow to ensure that the system is reliable at the installation stage and its reliability will continue even after implementation. There are two levels of reliability. The first level shows that the system is meeting the right requirements. This is possible only if a thorough and effective determination of systems requirements were performed by the analyst. A careful and thorough systems study is required for this aspect of reliability. The second level of systems reliability involves the actual working of the system delivered to the user. At this level, systems reliability is interwoven with software engineering and development. Reliability has three approaches shown in Table 1. Table 1: Approaches to Reliability S/N Approach Description Example 1. Error avoidance Prevents errors from It is impossible occurring in the software in large systems. 2. Error detection Recognizes errors when Traps and and correction they are encountered and modifies illegal corrects the error or the arithmetic steps: effect of the error so Compensates for that system does not fail. unexpected data
values. 3. Error Tolerance Recognizes errors Shuts down part
when they occur, of the system. but enables the Does not perform
system to keep some processing running through but keeps the system
degraded performance. operational.

CIT 212 SYSTEMS ANALYSIS AND DESIGN
194
3.3.2 Designing Maintainable Systems When the systems are installed, they are normally used for a considerable period. The average life of a system is generally 4 to 6 years, with the oldest application often in use for over 10 years. However, this period of a constant use brings with it the used to continually maintain the system. When system is fully implemented, analysts must take precautions to ensure that the need for maintenance is controlled through design and testing and the ability to perform it is provided through proper design practices. SELF-ASSESSMENT EXERCISE 1 i. List out various factors which are responsible for the quality of a
system. ii. Explain briefly the different levels of quality assurance. iii. Explain briefly the importance of system reliability. 3.4 Maintenance Issues Many studies at the private, University and government level have been conducted to learn about maintenance requirements for information systems. These studies reveal the following facts: (a) From 60 to 90 percent of the overall cost of software during the
life of a system is spent on maintenance. (b) Often maintenance is not done very efficiently. (c) Software demand is growing at a faster rate than supply. Many
programmers are spending more time on systems maintenance than a new software development.
Several studies of maintenance have examined the type of tasks performed under maintenance (Lientz and Swanson, 1980). Table 2 summarizes the broad classes of maintenance found in Information systems environment.

CIT 212 SYSTEMS ANALYSIS AND DESIGN
195
Table 2: Types of System Maintenance Category Activity Relative frequency Corrective Emergency fixes, routine 20%
debugging. Adaptive Accommodation of changes 20%
to data and files and to hardware and system software.
Perfective User enhancement, improved 60% documentation, recording for computational efficiency. 3.5 Maintainable Designs The key to reduce the need for maintenance, while making it possible to do essential tasks more efficiently, are as follows: (a) More accurately defining the user’s requirements during systems
development. (b) Making better systems documentation. (c) Using proper methods of designing processing logic and
communicating it to project team members. (d) Utilising the existing tools and techniques in effective way. (e) Managing the systems engineering processing in a better and
effective way. Now it is clear that design is both a process and a product. The design practices followed for software has a great effect on the maintainability of a system. Good design practices produce a product that can be maintained in a better way. 3.6 Testing Practice and Plans It should be clear in mind that the philosophy behind testing is to find errors. Test cases are devised with this purpose in mind. A test case is a set of data that the system will process as normal input. However, the data are created with the express intent of determining whether the system will process them correctly. For example, test cases for inventory handling should include situations in which the quantities to
CIT 212 SYSTEMS ANALYSIS AND DESIGN
196
be withdrawn from inventory exceed, equal and are less than the actual quantities on hand. Each test case is designed with the intent of finding errors in the way the system will process it. There are two general strategies for testing software: Code testing and Specification testing. In code testing, the analyst develops those cases to execute every instructions and path in a program. Under specification testing, the analyst examines the program specifications and then writes test data to determine how the program operates under specific conditions. Regardless of which strategy the analyst follows, there are preferred practices to ensure that the testing is useful. The levels of tests and types of test data, combined with testing libraries, are important aspects of the actual test process. 3.7 Levels of Tests Systems are not designed as entire systems nor are they tested as single systems. The analyst must perform both unit and system testing. 3.7.1 Unit Testing In unit testing the analyst tests the programs making up a system. For this reason, unit testing is sometimes called program testing. Unit testing gives stress on the modules independently of one another, to find errors. This helps the tester in detecting errors in coding and logic that are contained within that module alone. The errors resulting from the interaction between modules are initially avoided. For example, a hotel information system consists of modules to handle reservations; guest check-in and checkout; restaurant, room service and miscellaneous charges, convention activities, and account receivable billing. For each, it provides the ability to enter, modify or retrieve data and respond to different types of inquiries or print reports. The test cases needed for unit testing should exercise each condition and option. Unit testing can be performed from the bottom up, starting with smallest and lowest-level modules and proceeding one at a time. For each module in bottom-up testing a short program is used to execute the module and provides the needed data, so that the module is asked to perform the way it will when embedded within the larger system. 3.7.2 System Testing The important and essential part of the system development phase, after designing and developing the software is system testing. We cannot say
CIT 212 SYSTEMS ANALYSIS AND DESIGN
197
that every program or system design is perfect and because of lack of communication between the user and the designer, some error is there in the software development. The number and nature of errors in a newly designed system depend on some usual factors like communication between the user and the designer; the programmer’s ability to generate a code that reflects exactly the systems specifications and the time frame for the design. Theoretically, a newly designed system should have all the parts or sub-systems in working order, but in reality, each sub-system works independently. This is the time to gather all the subsystem into one pool and test the whole system to determine whether it meets the user requirements. This is the last chance to detect and correct errors before the system is installed for user acceptance testing. The purpose of system testing is to consider all the likely variations to which it will be subjected and then push the system to its limits. Testing is an important function to the success of the system. System testing makes logical assumption that if all the parts of the system are correct, the goal will be successfully activated. Another reason for system testing is its utility as a user-oriented vehicle before implementation. System testing consists of the following five steps; ● Program testing ● String testing ● System testing ● System documentation ● User acceptance testing Program Testing A program represents the logical elements of a system. For a program to run satisfactorily, it must compile and test data correctly and tie in properly with other programs. It is the responsibility of a programmer to have an error free program. At the time of testing the system, there exist two types of errors that should be checked. These errors are syntax and logic. A syntax error is a program statement that violates one or more rules of the language in which it is written. An improperly defined field dimension or omitted keywords are common syntax errors. These errors are shown through error messages generated by the computer. A logic error, on the other hand, deals with incorrect data fields out of range items, and invalid combinations. Since the logical errors are not detected by compiler, the programmer must examine the output carefully to detect them.
CIT 212 SYSTEMS ANALYSIS AND DESIGN
198
When a program is tested, the actual output is compared with the expected output. When there is a discrepancy, the sequence of the instructions, must be traced to determine the problem. The process is facilitated by breaking the program down into self-contained portions, each of which can be checked at certain key points. String Testing Programs are invariably related to one another and interact in a total system. Each program is tested to see whether it conforms to related programs in the system. Each part of the system is tested against the entire module with both test and live data before the whole system is ready to be tested. System Testing System testing is designed to uncover weaknesses that were not found in earlier tests. This includes forced system failure and validation of total system as it will be implemented by its user in the operational environment. Under this testing, generally we take low volumes of transactions based on live data. This volume is increased until the maximum level for each transaction type is reached. The total system is also tested for recovery and fall back after various major failures to ensure that no data are lost during emergency. All this is done with the old system still in operation. When we see that the proposed system is successful in the test, the old system is discontinued. System Documentation All design and test documentation should be well prepared and kept in the library for future reference. The library is the central location for maintenance of the new system. User Acceptance Testing An acceptance test has the objective of selling the user on the validity and reliability of the system. It verifies that the system’s procedures operate to system specifications and that the integrity of important t data is maintained. Performance of an acceptance test is actually the user’s show. User motivation is very important for the successful performance of the system. After that a comprehensive test report is prepared. This report shows the system’s tolerance, performance range, error rate and accuracy.

CIT 212 SYSTEMS ANALYSIS AND DESIGN
199
3.8 Special Systems Tests There are other six tests which fall under special category. They are described below: (i) Peak Load Test It determines whether the system will handle the volume of activities that occur when the system is at the peak of its processing demand. For example, test the system by activating all terminals at the same time. (ii) Storage Testing It determines the capacity of the system to store transaction data on a disk or in other files. For example, verify documentation statements that the system will store 10,000 records of 400 bytes length on a single flexible disk. (iii) Performance Time Testing It determines the length of time used by the system to process transaction data. This test is conducted prior to implementation to determine how long it takes to get a response to an inquiry, make a copy of a file, or send a transmission and get a response. (vi) Recovery Test This testing determines the ability of user to recover data or re-start system after failure. For example, load backup copy of data and resume processing without data or integrity loss. (v) Procedure Testing It determines the clarity of documentation on operation and use of system by having users do exactly what manuals request. For example, powering down system at the end of week or responding to paper-out light on printer. (vi) Human Factors Testing It determines how users will use the system when processing data or preparing reports.

CIT 212 SYSTEMS ANALYSIS AND DESIGN
200
SELF ASSESSMENT EXERCISE 2 i. What are the different types of system maintenance? Explain
them briefly. ii. Describe briefly about ‘Unit Testing’. iii. What do you know about various special systems tests? Explain
briefly. 3.9 Designing Test Data The proper designing of test data is as important as the test itself. If test data as input are not valid or representation of data to be provided by the user, then the reliability of the output is doubtful. Test data may be live or artificial. The live data is that which is actually extracted from the users’ files. After a system is partially constructed, the programmers or analysts ask the users to key in a set of data from the normal activities. It is difficult to obtain live data in sufficient amount to conduct extensive testing. The artificial test data is created solely for test purposes. Properly created artificial data should provide all combinations of values and formats and make it possible to test all logic and control paths through the program. Unlike live data, which are based towards typical values, artificial data provide extreme values for testing the limits of the proposed system. 3.10 System Control In a computer system, controls essentially mean the extent to which the system is secure against human errors, machine malfunction or deliberate mischief. The amount of control to be applied can vary depending upon the importance, critically and volume of the output. Depending on the nature of the system or the amounts of money at stake, the designer will need to build in different type of controls within system procedures, program and operations. 3.10.1 Objective of System Control Control mechanisms are designed to achieve the following objectives: (a) Accuracy: The system should provide information and reports
which are accurate in all respect. (b) Reliability: The system should continue to function as it is
designed to function. It should not break down due to malfunction of equipments.
CIT 212 SYSTEMS ANALYSIS AND DESIGN
201
(c) Security: Files and programs in the system must be secured against accidental damage or loss. Procedures must be established to restrict access to data by authorized user only.
(d) Efficiency: Efficiency of the system will essentially mean
performing the tasks in the best manner and producing output of highest quality with least efforts.
(e) Audit: System controls should cover the aspect of auditing
procedures. Facilities should be designed so that a transaction can be traced from its creation to its final use. This aspect of control assumes added significant in case of online systems where written documents may not exist for some transactions.
(f) Adherence to organization policies: System controls should not
conflict with organization policies and must promote such policies. For example, by ensuring that payroll is produced accurately and by a specified time, the organization objective of paying all employees in time will be promoted.
It may not always be possible to provide adequate controls in the system to meet the above objectives fully. Sometimes, it may happen that too many controls may adversely affect the performance of the system. On the other hand, lack of adequate control may create chaos and dissatisfaction. It is therefore, a question of trade-off between the control and their objectives and as stated earlier, the decisions will depend on the nature of the system and critically of its functions. 3.10.2 Types of Control Two types of controls which affect the operation of a system are: - External control - Internal control External controls to a system, as the name implies are laws, regulations, procedures and policies outside the scope of the system which affect the operations of the system. Internal controls are basically plans, procedures, guidelines, rules and checks under which the system must function. Mush of these internal controls will be specified as a part of system design, but some of these may be internal controls of the organization – with or without computerization.

CIT 212 SYSTEMS ANALYSIS AND DESIGN
202
3.11 Audit Trail In online systems, unlike batch environments, there may not be copies of input source documents to fall back on if the system fails during processing. It is also possible for online users to sign on to a system, make changes in data already stored in files and sign off again without leaving a visible clue as to what happened. Unless the systems analyst develops an audit trail, no such protection exists in online systems. Audit trail is the path which a transaction traces through a data processing system from source documents to summary reports. In other words, it refers to the facilities or procedures which allow a transaction to be traced through all stages of data processing beginning with its appearance on a source document and ending with its transformation into information on a final output document. The audit trail contains complete details such as reference numbers, dates, names which are recorded in files, ledgers and journals so that trailing of these records to source documents becomes easier. It is generally available in manual accounting system. But in computerized system, it is generally not available unless the system is specially designed to do so. Audit trails are not primarily for the use of auditors. Rather they are quite important tools that are designed to help the management. The auditors use these tools which management had found necessary for internal purposes.
4.0 CONCLUSION In this unit you have learnt the importance of quality assurance in software life cycle and various issues involved in quality assurance, system testing and control. You have also been taken through the various levels of quality assurance, various levels of testing and designing test data. This stage of system control and quality assurance plays a vital role in the implementation stage of system development and tracking of errors.
5.0 SUMMARY It is thus seen that quality assurance, testing and system control play a vital role and each of them contribute to the development of efficient software. Quality assurance has to be implemented at every stage of the software development life cycle. Implementation at each level thus paves way for a better step in the next stage. Both the system testing and the unit testing should be done so as to avoid the occurrence of error
CIT 212 SYSTEMS ANALYSIS AND DESIGN
203
during implementation stage. Using Audit trail all the transactions occurring during a period of time can be tracked. 6.0 TUTOR-MARKED ASSIGNMENT 1. List out the objectives of system control. 2. What is the difference between internal and external control? 3. Explain briefly about ‘Audit Trail’. 7.0 REFERENCES AND FURTHER READINGS Analysis & design of information systems – James A Senn, Mc-Graw
Hill Book Co. (1986) Structured Analysis and Systems Specification – Tom De Marco,
Prentice Hall (1979) The Practical Guide to Structured system Design – Page Jones Mellir,
The Yourdon press (1980) Managing the Structured Techniques – Edward Yourdon, Yourdon,
Yourdon Press (1979)
CIT 212 SYSTEMS ANALYSIS AND DESIGN
204
UNIT 3 DOCUMENTATION CONTENTS 1.0 Introduction 2.0 Objectives 3.0 Main Content 3.1 Characteristics of Good Documentation 3.2 Types of Documentation 3.2.1 Program Documentation 3.2.2 Operations Documentation 3.2.3 User Documentation 3.2.4 Management Documentation 3.2.5 Systems Documentation 3.3 Software Design and Documentation Tools 3.3.1 Structures Flowchart 3.3.2 HIPO Diagram 3.3.3 Warnier/Orr Diagram 3.4 Need for Documentation 3.5 Guide Lines/Format for Preparing Documentation Package 3.6 Elements that Comprise a Documentation Package 4.0 Conclusion 5.0 Summary 6.0 Tutor-Marked Assignment 7.0 References/Further Readings 1.0 INTRODUCTION A system cannot be completely effective unless it is adequately documented. It should be documented as it is being created. That is, at various stages of the system development, status reports should be prepared for those management personnel for whom the system is being designed. Such reports could include flowcharts, decision tables, output forms and other documents thus far developed. It also includes various problems encountered, suggested solutions and resulting schedule revisions. In this way, management remains fully aware of system’s progress so that they can offer criticisms or suggest change while it is still economically and physically possible to make these changes without it being necessary to revise the entire system. These progress reports are excellent basis on which to build additional documentation.

CIT 212 SYSTEMS ANALYSIS AND DESIGN
205
2.0 OBJECTIVES At the end of this unit, you should be able to explain: ● The characteristics of good documentation and its various types ● The tool needed for documentation ● The guideline/format to be followed for preparing good
documentation package. 3.0 MAIN CONTENT 3.1 Characteristics of Good Documentation Documentation is considered to be good if it has the following qualities: (a) Availability: It should be accessible to those for whom it is
intended. (b) Objectivity: It must be clearly defined in a language that is
easily understood. (c) Cross-referable: It should be possible to refer to other documents. (d) Easy to maintain: When the system gets modified, it should be
easy to update the documentation. (e) Completeness: It should contain everything needed, so that those
who have gone through it carefully can understand the system. 3.2 Types of Documentation There are five major types of documentation. They are: (i) Program Documentation (ii) Operation Documentation (iii) User Documentation (iv) Management Documentation (v) Systems Documentation 3.2.1 Program Documentation Many companies discuss about programming documentation but fail to provide it adequately. Before a program is developed, the systems analysts should provide the programmer with the required documentation. The logic in some programs is best described by a flowchart. Sometimes, decision tables are most appropriate for

CIT 212 SYSTEMS ANALYSIS AND DESIGN
206
explaining the logic of a program. Programmers should insist on proper documentation before starting a job. Four items constitute normal documentation required for each program. ● Copying in final form of all input/output documents affecting the
program. ● Statement of standards for coding structures and input/output
layouts. ● Clarification of the program’s interface with other related
programs. ● General flowchart or decision table. The programmer’s responsibility in documentation is to provide information to enable future programmers to make necessary changes. Personnel turnover is normal feature in any business, and turnover is particularly high among programmers. A company can never think that a programmer assigned to a specific program will be available in two years, when some modifications to that program are required. For continuity of information a company must insist on complete and meaningful documentation. Typically a documentation folder is provided for each program which contains all the input/output forms associated with the program, a detailed flowchart or decision table for the program use a set of operator and user instructions. Maintaining this type of documentation is costly and time consuming, for, programmers do not take interest in spending time for this type of work. Routine changes occur frequently in a program and all changes must be covered in the documentation folder. But the very changes which require the updating of existing documentation are the reasons for maintaining accurate documentation. 3.2.2 Operations Documentation A well designed system may run for a long time with little or no assistance from the systems department. This can happen only when the system has been documented in a proper way. For smooth running of the system, the console operator must have complete knowledge about the job. Providing the computer centre with a set of operating instructions will not serve the purpose. The instructions must be in a form readily accessible to the console operator and written in simple and understandable style. A systems analyst must thoroughly discuss all the requirements of new jobs with the operations staff before the job can be properly transferred.
CIT 212 SYSTEMS ANALYSIS AND DESIGN
207
The run book is traditional in computer centres. It is a collection of operator instructions for each program at an installation and typically contains: (i) Narrative, describing the run (ii) Listing of the programmed error conditions (iii) Detailed information for running the job, including: - input/output forms to be used - anticipated problem areas and how to handle them - detailed description of file assignment of each input/output
device - disposition of data files after completing the job - general block diagram of the programming logic - restart procedures The run book generally takes the form of a loose leaf notebook because of the case of substituting sheets as programs change. It should be kept in mind that an operator in a multiprogramming environment must monitor many programs simultaneously. Instructions must be simple and complete enough for executing the job correctly. 3.2.3 User Documentation Systems users require proper documentation to prepare a developing system and to smoothly carry out existing ones. To meet this requirement, each system should have a manual that spells everything the users must know to do their job correctly. Users require two general types of information; complete details to handle each case the system processes, and overall picture of the system so that they can see their role in the total operation of the company. The manual should supply the following information. ● General flowchart of the system ● Assignment of responsibility for specific tasks ● Standards for work flow, including target dates and deadlines for
specific tasks ● Simple input and output documents ● Detail procedures ● Anticipated exceptions and instructions on how to handle them ● Accuracy standards for data in the system The systems department must write a thoroughly detailed narrative of each system, including the proper handling of routine cases, as well as exception handling. A staff member in the user department must have

CIT 212 SYSTEMS ANALYSIS AND DESIGN
208
an authority to consult when faced with a case not handled before. Properly prepared manual which is always available can provide the information needed by user. Supervising staff in user areas must understand the overall picture in each system just as staff members must understand the details of their function. This requires documentation, in the form of charts, graphs and illustrations, so that the supervising staff has a clear grasp of their department’s role in the total system. 3.2.4 Management Documentation The documentation required by corporate management differs quite a lot from that required by users. The systems designer must know the requirements of the management and provide documentation to enable management to perform three functions: (i) Evaluate progress on systems development (ii) Monitor existing systems (iii) Understand the objectives and methods of new and existing
systems Management, in general, is primarily interested in knowing the system’s overall objectives and basic operations. A brief manual highlighting the key steps in each system may be prepared for management. Good managers have an exceptional ability to get to the root of a system and, their experience should enable them to retrieve information from a system’s summary or chart which may not be apparent to the systems analyst. 3.2.5 Systems Documentation Each phase in the systems development cycle is accompanied by appropriate documentation. The systems request, even if it is initially mark verbally, eventually must be written. It is desirable for the client and a systems analyst to work jointly in writing the request since each can contribute knowledge the other does not have. The written system’s request is merely a statement of the user’s problem. In documenting the results of its deliberations, the selection committee must specify the following: (a) The objectives of the impending feasibility study (b) The extent of the authority of the feasibility team (c) The individual or group responsible for completing the study

CIT 212 SYSTEMS ANALYSIS AND DESIGN
209
A feasibility report is probably the most important form of documentation in the system development cycle. It accomplished the following two purposes: (i) It defines the objectives of the proposed system’s change in
reasonable detail after a sufficiently detailed study. (ii) It gives a plan to attain these objectives. The documentation of this plan must be thorough enough so that system designers could produce a complete and effective system. At various points during systems design, the designing team produces the following additional forms of documentation: (i) File Specification: detailed definitions of each file in the
system, best done in graphic form. (ii) Transaction Specification: detailed descriptions of all output
anticipated from the system. (iii) Output Specifications: detailed descriptions of all output
anticipated from the system. Documentation also includes plans to test the system and convert from the old to the new one. The systems analyst must also provide a plan to train the personnel affected by the changes. During the life cycle of the completed system, the system itself must provide documentation of how well it is operating and consequently should be designed to yield data about itself as a normal by-product. SELF ASSESSMENT EXERCISE 1 i Describe the characteristics of a good documentation. ii. List out various types of documentation. iii. What is user documentation? 3.3 Software Design and Documentation Tools Well designed, modular software is more likely to meet the maintenance, reliability and testing requirement. Three specific tools are described below: - Structured flowchart - HIPO diagrams - Warnier/Orr diagrams

CIT 212 SYSTEMS ANALYSIS AND DESIGN
210
3.3.1 Structures Flowchart Structured flowcharts, also called Nassi-Schneiderman charts, are graphic tools that force the designer to structure software in modular as well as top-down form. They provide a proper structure that can be retained by the programmer for developing the application software. The programmer should be expert in using the structured flowcharts. The basic elements used in developing structured flowcharts are: - Process - Decision - Iteration Process Simple processes or steps in a program are shown by a rectangular box, the process symbol. This symbol represents initialization of values, input and output operations and calls to execute other procedures. Decision The decision symbol represents alternative conditions that can occur and that the program must have a manner of handling. The decision symbol may show actions for more than two alternatives at the same time. Iteration The iteration symbol represents looping and repletion of operations while a certain condition exists or until a condition exists. The structured flowcharts use no arrows or continuations on separate pages. Each structure flowchart is shown on a single sheet of paper. When designing a structured flowchart, the systems analyst specifics the logic in a top down fashion. The first consideration in a process is the top element. The second in sequence is next one shown and so forth. Similarly, there is a single exit from the process. 3.3.2 HIPO Diagram It is another tool commonly used for developing systems software. It is an acronym for Hierarchical Input Process Output. This method was originally developed to provide documentation assistance for programmers/analysts.
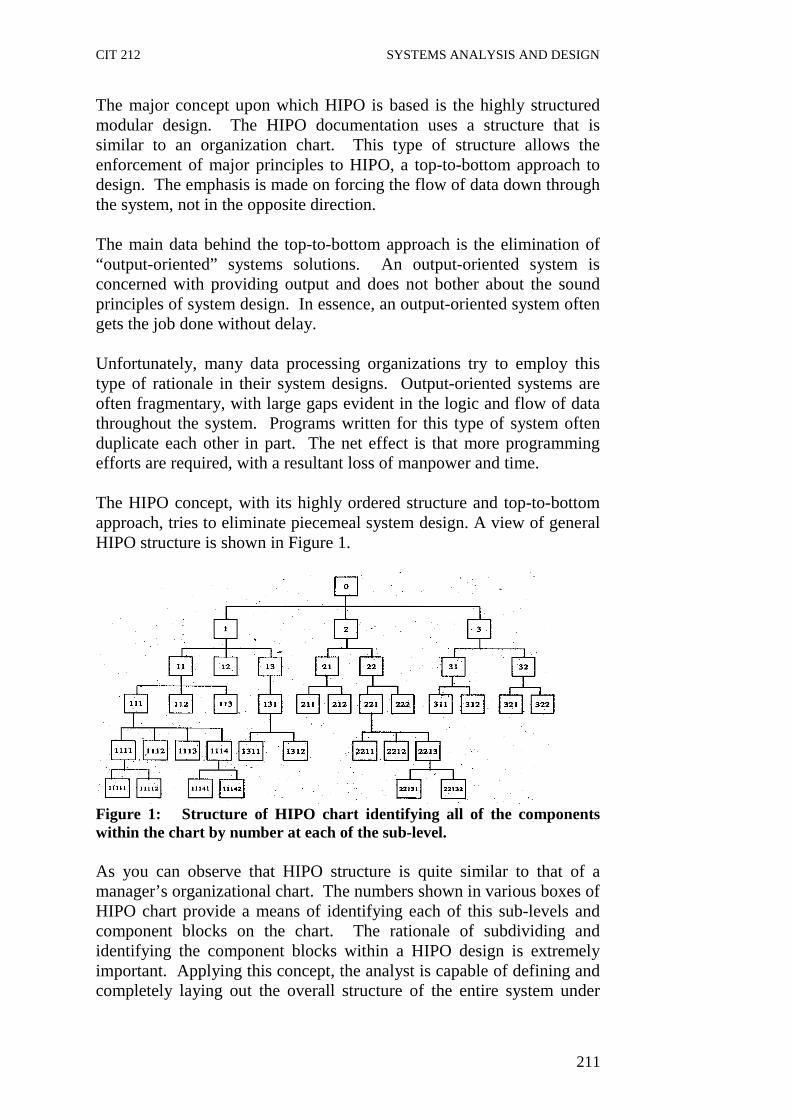
CIT 212 SYSTEMS ANALYSIS AND DESIGN
211
The major concept upon which HIPO is based is the highly structured modular design. The HIPO documentation uses a structure that is similar to an organization chart. This type of structure allows the enforcement of major principles to HIPO, a top-to-bottom approach to design. The emphasis is made on forcing the flow of data down through the system, not in the opposite direction. The main data behind the top-to-bottom approach is the elimination of “output-oriented” systems solutions. An output-oriented system is concerned with providing output and does not bother about the sound principles of system design. In essence, an output-oriented system often gets the job done without delay. Unfortunately, many data processing organizations try to employ this type of rationale in their system designs. Output-oriented systems are often fragmentary, with large gaps evident in the logic and flow of data throughout the system. Programs written for this type of system often duplicate each other in part. The net effect is that more programming efforts are required, with a resultant loss of manpower and time. The HIPO concept, with its highly ordered structure and top-to-bottom approach, tries to eliminate piecemeal system design. A view of general HIPO structure is shown in Figure 1.
Figure 1: Structure of HIPO chart identifying all of the components within the chart by number at each of the sub-level. As you can observe that HIPO structure is quite similar to that of a manager’s organizational chart. The numbers shown in various boxes of HIPO chart provide a means of identifying each of this sub-levels and component blocks on the chart. The rationale of subdividing and identifying the component blocks within a HIPO design is extremely important. Applying this concept, the analyst is capable of defining and completely laying out the overall structure of the entire system under
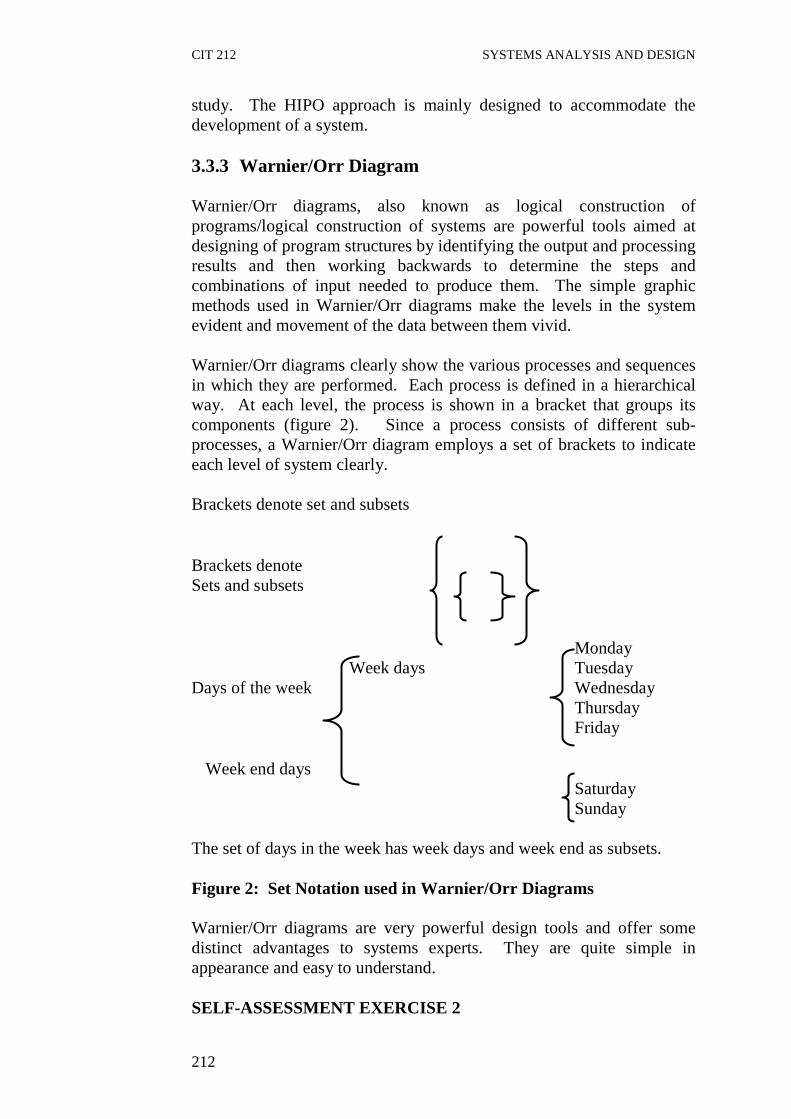
CIT 212 SYSTEMS ANALYSIS AND DESIGN
212
study. The HIPO approach is mainly designed to accommodate the development of a system. 3.3.3 Warnier/Orr Diagram Warnier/Orr diagrams, also known as logical construction of programs/logical construction of systems are powerful tools aimed at designing of program structures by identifying the output and processing results and then working backwards to determine the steps and combinations of input needed to produce them. The simple graphic methods used in Warnier/Orr diagrams make the levels in the system evident and movement of the data between them vivid. Warnier/Orr diagrams clearly show the various processes and sequences in which they are performed. Each process is defined in a hierarchical way. At each level, the process is shown in a bracket that groups its components (figure 2). Since a process consists of different sub-processes, a Warnier/Orr diagram employs a set of brackets to indicate each level of system clearly. Brackets denote set and subsets Brackets denote Sets and subsets Monday Week days Tuesday Days of the week Wednesday Thursday Friday Week end days Saturday Sunday The set of days in the week has week days and week end as subsets. Figure 2: Set Notation used in Warnier/Orr Diagrams Warnier/Orr diagrams are very powerful design tools and offer some distinct advantages to systems experts. They are quite simple in appearance and easy to understand. SELF-ASSESSMENT EXERCISE 2

CIT 212 SYSTEMS ANALYSIS AND DESIGN
213
i. List out various software design and documentation tools. ii. What do you mean by HIPO diagram? Explain briefly. iii. Explain briefly the Warnier/Orr diagram 3.4 Need for Documentation Preparation of documentation is quite important as it depicts what the system is supposed to be and how it should perform its functions. It illustrates both technically and economically how a system would better serve the objectives and goals of the company. Documentation improves overall operation in addition to management and audit control. It also serves the following purposes; (i) Reviews the progress or development of an application software. (ii) Communicates facts about system to users. (iii) Communicates between personnel working on a development
project. (iv) Provides necessary guidelines to allow correction or revision of a
system or its computer programs. (v) Provides operating instruction to users and operating staff. (vi) Assists in the reconstruction of the system in case it is destroyed. (vii) It helps the management to determine if the new design achieves
the objectives of the company within the established constraints and if it is justifiable from a cost standpoint.
(viii) Documentation serves as a focal point from which the analysts’
design can be assessed and as a standard to be utilized as reference once the system is implemented.
3.5 Guide Lines/Format for Preparing Documentation
Package There are, as yet, no universal documentation standards, since systems vary greatly in form, contents and requirements. The format of each documentation package will be based on the following points: (i) Characteristics of system: Some designs require descriptive
while others can be explained with the help of diagrams.

CIT 212 SYSTEMS ANALYSIS AND DESIGN
214
(ii) Management’s attitude towards documentation: The analyst must prepare the documentation package within the limitations established by the management.
(iii) Equipment restraints: A company with large and integrated
computer system having teleprocessing facilities will require more formalised and technical documentation than a company with a more conservative and small computer system.
3.6 Elements that Comprise a Documentation Package A documentation package consists of the following elements: - Cover letter - Table of contents - Narrative - Flowcharts - File specification - Program specification - Cost of the proposed system and of its alternatives - Test brochures (i) Cover Letter The cover letter is a correspondence primarily to management, that describes the benefits of the new design and that generally helps in selling the system. It should be kept in mind that unless the documentation is approved, the new system will never be implemented and the analysts’ work will be of no use. Thus the analyst must try to convince the management that the new design presented is feasible and appropriate to satisfy the objectives of the company. The cover letter should describe the purpose and function of the new system clearly. It should be written in concise language to facilitate executive understanding, without requiring complete familiarity with the intricacies of the system. (ii) Table of Contents The inclusion of a table of contents is an absolute necessity. Pages in the documentation package must be numbered and cross-referenced in this table of contents. (iii) Narrative With the narrative, we begin the detailed formulation of the new system.

CIT 212 SYSTEMS ANALYSIS AND DESIGN
215
(iv) Flowcharts Each sub-system within the analyst’s formal design should be explained with the help of flowchart. (v) File Specification Each file within the formal design must be described with regard to: - Purpose - Programs that will use the file - Volume - Frequency of use - Source from which the file is obtained - Description of fields - Layout and samples (vi) Program Specification At this point, the analyst must segment the new design so that each unit have separate program, assuming that the design is itself approved by the management. (vii) Cost of the Proposed System and of its Alternatives The details of cost must be shown as part of documentation. (viii) Test Brochures The analysts should describe the operations and procedures (including test data) that will be employed to test the new system, once it is approved. 4.0 CONCLUSION Documentation is very vital to system developed and it takes place at every stage of the systems development. Though some of the documentation will need to be updated at the conclusion of the project and from time to time as the system is being reviewed. This unit has taken you through the importance of documentation in system development, its characteristics and the different types of documentation.
CIT 212 SYSTEMS ANALYSIS AND DESIGN
216
Also the various documentation tools and format for preparing documentation package has been discussed. 5.0 SUMMARY The unit stresses the need for effective documentation at all stages of the software development. The various type of documents discussed above are helpful to various personnel in their respective functional areas. It also stresses the need to use various tools for designing and documenting a software package. 6.0 TUTOR-MARKED ASSIGNMENT 1. Why is documentation needed? 2. What are the elements that comprise a documentation package? 7.0 REFERENCES AND FURTHER READINGS Analysis & design of information systems – James A Senn, Mc-Graw
Hill Book Co. (1986) Structured Analysis and Systems Specification – Tom De Marco,
Prentice Hall (1979) The Practical Guide to Structured system Design – Page Jones Mellir,
The Yourdon press (1980) Managing the Structured Techniques – Edward Yourdon, Yourdon,
Yourdon Press (1979)

CIT 212 SYSTEMS ANALYSIS AND DESIGN
217
UNIT 4 SYSTEM IMPLEMENTATION CONTENTS 1.0 Introduction 2.0 Objectives 3.0 Main Content
3.1 Training of Personnel Involved with System 3.1.1 System Operators Training 3.1.2 User Training 3.2 Training Methods 3.2.1 Vendor and In-Service Training 3.2.2 In-House Training 3.3 Conversion Methods 3.3.1 Parallel Systems 3.3.2 Direct Conversion 3.3.3 Pilot System 3.3.4 Phase-in Method 3.4 Conversion and Operation Plans 3.4.1 Site Preparation 3.4.2 File and Data Conversion 3.5 Post-Implementation Review 3.6 Review Plan 3.7 System Maintenance 3.8 Drawing up Computer Contract 3.8.1 Respective Responsibilities of Vendors and Buyers 3.8.2 Documentation 3.8.3 Hardware 3.8.4 Deliver and Acceptance 3.8.5 Right of Use of Equipment from Other Vendors 3.8.6 Warranties 3.8.7 Guarantees 3.8.8 Payments 3.8.9 Bankruptcy 3.9 Hardware Acquisitions 3.9.1 Tender Evaluations 3.9.2 Costing Factor
3.9.3 Equipment Characteristics 3.9.4 Potential for Growth 3.9.5 Vendor Support
3.10 Criteria for Vendor’s Selection 3.10.1 Economic Factors 3.10.2 Hardware Factors 3.10.3 Software Factors 3.10.4 Service Factors 3.10.5 Reputation of Manufacturer
CIT 212 SYSTEMS ANALYSIS AND DESIGN
218
3.11 Acquisition for Proprietary Software Packages 3.11.1 Technical Aspect of Proprietary Software 3.11.2 Approaches to Software Evaluation 3.12 Service Bureaux 3.12.1 Advantages of Using Data Centres 3.12.2 Disadvantages of Using Data Centres 3.13 Financing Use of Computers 3.13.1 Renting 3.13.2 Leasing 3.13.3 Outright Purchase
4.0 Conclusion 5.0 Summary 6.0 Tutor-Marked Assignment 7.0 References/Further Readings 1.0 INTRODUCTION A crucial phase in the system life cycle is the successful implementation of the new system design. Implementation includes all those activities that take place to convert from the old system to the new one. The new system may be completely new, replacing an existing manual or automate system or it may be major modification to an existing system. In either case, proper implementation becomes necessary so that a reliable system based on the requirements of the organization can be provided. Successful implementation may not guarantee improvement in the organization using the new system, but improper installation will prevent it. It has been observed that even the best system cannot show good result if the analysts managing the implementation do not attend to every important details. This is an area where the systems analysts need to work with utmost care. This unit discusses the three aspects of implementation: ● Training personnel ● Conversion procedures ● Post-implementation review In each area, the particular elements of that aspect are discussed, along with the methods of handling each aspect efficiently and effectively.

CIT 212 SYSTEMS ANALYSIS AND DESIGN
219
2.0 OBJECTIVES After completing this unit, you should be able to: ● appreciate the importance of training of personnel involved with
system. ● get familiar with various training methods of conversion and
operation plans. ● explain post implementation review. ● highlight various issues involved in system maintenance and
designing of computer contract. ● get proper understanding about various factors for
hardware/software acquisition and vendor’s selection. ● understand the importance of service bureau and financing use of
computer. 3.0 MAIN CONTENT 3.1 Training of Personnel Involved with System Even well-designed system can succeed or fail because of the way they are operated and used. Therefore, the quality received by the personnel involved with the system in various capacities helps or hinders and may even prevent the successful implementation of management information system. Those who are directly or indirectly related with the system development work must know in detail what their roles will be, how they can make efficient use of the system and what the system will or will not do for them. Both systems operators and users need training. 3.1.1 System Operators Training Running of the system successfully depend on the personnel working in the computer centre. They are responsible for providing the necessary support. Their training must ensure that they are able to handle all possible operations, both routine and extra-ordinary in nature. If the system calls for the installation of new equipment, such as a new computer system, special terminals or different data entry machines, the operators’ training should include such fundamentals as how to turn the equipment on and use it, how to power off and a knowledge of what constitutes normal operation. The operators should also be trained on different type of malfunctioning, how to recognize them and what steps should be taken whenever they arise. As part of their training, operators should be given both a troubleshooting list that identifies possible problems and remedies for them, as well as the names and telephone numbers of individuals to contact when unexpected or unusual problem

CIT 212 SYSTEMS ANALYSIS AND DESIGN
220
arise. Training also involves familiarization with run procedures, which involves working through the sequence of activities needed to use a new system on an ongoing basis. 3.1.2 User Training User may be trained on use of equipment, particularly in the case where, for example, a microcomputer is in use and the individual involved is both operator and user. In such cases, user must be given training on how to operate the system also. Questions that may be trivial to the analyst, such as how to turn on a terminal, how to insert a diskette into a micro-computer, or when it is safe to turn off equipment without danger of data loss, are significant problems to new users who are not familiar with computers. In most of the cases, user training deals with the operation of the system itself, with proper attention given to data handling techniques. It is imperative that users be properly trained in methods of entering transactions, editing data, formulating inquiries, deleting and inserting of records. No training is complete without familiarizing users with simple systems maintenance activities. Weakness in any aspect of training may lead to awkward situations that create user frustration and errors. 3.2 Training Methods Training of operators and users can be organized in several different ways, most important are: (i) Vendor and In-service training (ii) In-house training 3.2.1 Vendor and In-Service Training Often the best source of training on equipment is the vendor who supplies the equipment. Most vendors offer extensive educational programs as part of their services. For example, IBM offers complimentary two or three days short-term courses to purchasers of many of their mini and mainframes. The courses, offered by experienced trainers and sales personnel, cover all aspects of using the equipment, from how to turn it on and off, to the storage and retrieval of data. One session is kept for hands-on training also so that the participants can freely use the system in the presence of the trainers. If special software such as teleprocessing package or database management system is being installed, sending personnel to off-site
CIT 212 SYSTEMS ANALYSIS AND DESIGN
221
short term courses providing in-depth training is preferable to in-service training. These courses, which are generally provided by charging a fee, are presented to personnel from many organizations that are acquiring or using the same system. The benefit of sharing questions, problems and experiences with persons from other companies is substantial. 3.2.2 In-House Training The main advantage of offering in-house training is that instruction can be tailored according to the requirements of the organization. Often the vendors negotiate fees and charges that are more economical so that company can involve more personnel in the training program than is possible when travel is required. However, the disadvantage of distracting telephone calls, business emergencies and other interruptions must be overlooked. The other common approach is to evaluate by taking case study example that contains all sort of frequently encountered situations that system is able to handle. Then the user must use the system to handle the actual situations that is enter data as required, process the data and prepare the desired reports. Although high-quality training is an essential step in systems implementation, yet it is not sufficient by itself. 3.3 Conversion Methods Conversion is the process of changing from the old system to the new one. It must be properly planned and executed. Four methods are common in use. They are: parallel systems, direct conversion, pilot system and systems phase-in. Each method should be considered in the light of the opportunities that it offers and problems that it may create. However, it may be possible that sometimes, we may be forced to apply one method over others, even though other methods may be more beneficial. In general, systems conversion should be accomplished in shortest possible time. Long conversion periods create problems for all persons involved including both analysts and users. 3.3.1 Parallel Systems The most secure method of converting from an old to new system is to run both systems in parallel. Under this approach, users continue to operate the old system in the usual manner but they also start using the new system. This method is the safest one because it ensures that in case of any problems in using the new system, the organization can still fall back to the old system without loss of time and money.
CIT 212 SYSTEMS ANALYSIS AND DESIGN
222
The disadvantages of parallel systems approach are: ● It doubles operating costs ● The new system may not get fair trial. 3.3.2 Direct Conversion This method converts from the old to the new system abruptly, sometimes over a weekend or even overnight. The old system is used until a planned conversion day, when it is replaced by the new system. There are no parallel activities. The organization relies fully on the new system. The main disadvantages of this approach are: no other system to fall back on, if difficulties arise with new system. Secondly, wise and careful planning is required. 3.3.3 Pilot System Pilot system is often preferred in the case of the new system which involves new techniques or some drastic changes in organization performance. In this method, a working version of the system is implemented in one part of the organization, such as a single work area or department. The users in this area are aware that they are piloting a new system and that changes can be made to improve the system. Based on the feedback, changes are made and the system is installed in the remaining departments of the organization, either all at once (direct conversion method) or gradually (phase-in method). This approach provides experience and live test before implementation. 3.3.4 Phase-in Method This method is used when it is not possible to install a new system throughout an organization all at once. The conversion of files, training of personnel or arrival of equipment may force the staging of the implementation over a period of time, ranging from weeks to months. It allows some users to take advantage of the new system early. Also it allows training and installation without unnecessary use of resources. 3.4 Conversion and Operation Plans After the system conversion is completed using any one of the methods mentioned above, the conversion plan starts. In the conversion plan, all the activities that must occur to implement the new system are properly defined and put into operation. It identifies the persons responsible for each activity and includes a time schedule for each activity.
CIT 212 SYSTEMS ANALYSIS AND DESIGN
223
During the pre-implementation stages, when the conversion is being planned, analysts should prepare a list of all tasks, including the following: ● List all files for conversion ● Identify all data required to build new files during conversion ● List all new documents and procedure used during conversion ● Identify all controls to be made during conversion ● Assign responsibility for each task ● Verify conversion schedules. The conversion plan should anticipate problems and methods for controlling them. The missing documents, mixed data formats between current and new files, errors in data translation and situation that were overlooked during systems development are the common problems. The conversion manager must guard against the omission of steps in the conversion. This manager is also responsible for reviewing conversion plans, verifying the delivery of equipment, software and preparing the site. 3.4.1 Site Preparation A major aspect of conversion is the preparation of the systems site. Preparation activities include electrical and air-conditioning preparation, site layout and installation of the equipment. It is the best to have the site preparation completed prior to the arrival of the equipment, since vendors are not in favour of delivering the system if the construction work is going on. If the system is microcomputer, little site preparation work is needed. However, the electric lines should be checked to ensure that they are free of static or power fluctuations. It is desirable to install a “clean” line that is not shared by any other equipment. Static electricity is very harmful for computers. Carpets should be avoided in the computer room. If carpet is necessary, it should be the anti-static type that will not allow static build-up. The site layout should allow sufficient space for moving equipment in and setting it up for normal operation. Vendors will provide clearance requirements for performing service and maintenance and for air circulation. These requirements must be strictly adhered to or warranties can be voided and maintenance discontinue until specifications are met.

CIT 212 SYSTEMS ANALYSIS AND DESIGN
224
3.4.2 File and Data Conversion Data and file preparation consumes a large proportion of conversion time. Not only must the data be converted to a format acceptable in the new system, but analysts must ensure that this is due without loss of detail or accuracy. By using record counts, financial controls and hash totals, analysts are able to detect correct problems quickly, before they get out of control, even if the conversion involves data transmission. 3.5 Post-Implementation Review After the system is implemented and conversion is complete, a review should be conducted to determine whether the system is meeting expectations and where improvements are needed. A post implementation review measures the systems, performance against pre-defined requirements. It determines how well the system continues to meet performance specifications. It also provides information to determine whether major re-design or modification is required. A post-implementation review is an evaluation of a system in terms of the extent to which the system accomplishes stated objectives and actual project costs exceed initial estimates. It is usually a review of major problems that need converting and those that surfaced during the implementation phase. The post-implementation study begins with the review team, which gathers and reviews requests for evaluation. Unexpected change in the system that affects the user or system performance is a primary factor that prompts system review. Once request is filed, the user is asked how well the system is functioning to specifications or how well the measured benefits have been realised. Suggestion regarding changes and improvements are also asked for. SELF-ASSESSMENT EXERCISE i. List out the various training methods for imparting training to
operators and users. ii. List out four methods of system conversion. iii. Explain the importance of post implementation review briefly. 3.6 Review Plan The review team prepares a formal review plan around the objectives of the review, the type of evaluation to be carried out and the time schedule required. An overall plan covers the following areas:

CIT 212 SYSTEMS ANALYSIS AND DESIGN
225
(i) Administration Plan: Review area objectives, operating costs, actual operating performance of data.
(ii) Personnel Requirements plans: review performance objectives
and training performance data. (iii) Hardware Plan: Review of performance specifications (iv) Documentation Review Plan: Review the system development
effort. The review not only assesses how well the current system is designed and implemented, but also is a valuable source of information that can be applied to the next systems projects. The review team prepares a formal review plan around the objectives of the review, the type of evaluation to be carried out and the time schedule required. The review plan covers the following areas: (i) Administrative Plan:the following two activities are reviewed
under this plan: (a) User Objective: This is an extremely critical area since it
may be possible that over a period of time either the system does not meet the initial objectives of the user or the user objectives get changed as a result of changes in the overall objectives of the organization. The results of the evaluation are documented for future reference.
(b) Operating Costs and Benefits: Under the administration plan,
current budget designed to manipulate the costs and savings of the system is closely.
(ii) Personnel Requirement plan: Under this plan, all activities
involving system personnel and staff members associated with the system are evaluated. After the plan is developed, the review group evaluates.
(a) Personnel performance objectives compared with current
performance levels. (b) Training performance through testing, conducting interviews and
other data gathering techniques. (iii) Hardware Plan: the hardware of the new system is also reviewed
including terminals, CRT and communication network. The

CIT 212 SYSTEMS ANALYSIS AND DESIGN
226
main target is a comparison of current performance specifications with design specifications. It also points out necessary modification to be made.
(iv) Documentation Review Plan: The reason for review plan is to
evaluate the accuracy and completeness of the documentation complied to date and to its conformity with documentation standards established earlier.
3.7 System Maintenance The last part of the system development life cycle is system maintenance which is actually the implementation of the post-implementation review plan. When systems are installed, they are generally used for long periods. The average life of a system is 4 to 6 years, with oldest application often in use for over 10 years. However, this period of use brings with it need to continually maintain the system. Programmers/Analyst spends sufficient time for maintaining programs. The study on the maintenance requirement for the information system revealed that (a) 60-90 percent of the overall cost of software during the life of a
system is spent on maintenance. (b) In documented cases, the cost of maintenance, when measured on
the basis of writing each instruction in coding form, is more than 50 times the cost of developing a system.
(c) The software demand is increasing at faster rate than supply.
Many programmers are devoting more time on systems maintenance than on new software development. There is a backlog of new development work.
The maintenance can be classified as corrective, adoptions or perfective. Corrective maintenance means repairing, processing or performance failures or making alterations because of previously ill-defined problems. Adoption maintenance means changing the program functions. Enhancing the performance or modifying the programs according to user’s additional or changing needs are included in perfective maintenance. The greatest amount of maintenance work is for user enhancement and improved documentation of the system for better efficiency. More time and money are spent on perfective than on corrective and adaptive maintenance together.

CIT 212 SYSTEMS ANALYSIS AND DESIGN
227
Maintenance covers a wide range of activities including correcting coding and design errors, updating documentation and test data and upgrading user support. Many activities classified as maintenance actually fall under enhancements. Maintenance means restoring something to its original position. Unlike hardware, software does not wear out; it is corrected. In contrast, enhancement means adding, modifying or re-developing the code to support changes in the specifications. It is to keep with changing user needs and the operational environment. The keys to reduce the need for maintenance while making it possible to carry on with essential tasks more efficiently are as follows: (a) More accurately defining the user’s requirement during systems
development. (b) Preparation of system documentation in a better way. (c) Using more effective ways for designing processing logic and
communicating it to project team members. (d) Making better use of existing tools and techniques. (e) Managing the systems engineering process effectively. An addition factor in the success of the maintenance programmer is the work environment. Maintenance programmers have generally been paid less amount and receive less recognition than other programmers. Little attention has been paid to their training and career plans within the MIS function. Maintenance demands more orientation and training than any other programming activities, especially for entry-level programmers. The environment must recognize the needs of the maintenance programmer for tools, methods and training. 3.8 Drawing up Computer Contract Generally it is observed that vendors have their own standard form of contract which is prepared keeping into mind the interest of the vendor only. But during final discussion with the vendor, it can be negotiated to add, delete or modify certain classes so that terms and conditions of the contract become reasonably equitable for both the sides. The buyer just looks into the following provisions in the contract to safeguard his interest.

CIT 212 SYSTEMS ANALYSIS AND DESIGN
228
3.8.1 Respective Responsibilities of Vendors and Buyers The responsibilities and remedies available to the two sides in the event of non- or faulty performance of the system should be clearly defined in the contract. The remedies include special remedies, damages (actual, consequential and liquidated) and a specific performance. ‘Special remedies’ may be invoked when the vendor fails to give the delivery on time or is found deficient at the time of carrying out acceptance tests. Alternatives to special remedies are claims for actual consequential and liquidated damages. “Actual damages’ compensate a party for the advantages lost in the actual bargain. ‘Consequential damages’ compensate the parties in respect of all foreseeable losses because of breach of contract condition. ‘Specific performance’ clauses are attracted when a system fails the acceptance tests because of memory storage. In this situation, buyer can ask for additional memory at nil or nominal cost within a specified time. 3.8.2 Documentation The customer should have the right to stop payment if proper documentation required for the effective running of the system is not provided by the vendor. 3.8.3 Hardware It is necessary that each component of the contracted hardware is identified and its performance criteria are clearly stated in normal operating condition. 3.8.4 Deliver and Acceptance It should be clearly described about the delivery schedule and the acceptance test/standards to be met by the computer during normal operating conditions throughout a specific period of use. 3.8.5 Right of Use of Equipment from Other Vendors The customer should have liberty to link peripherals from other manufacturers to the CPU. The vendor must have protection from any damage or extra costs resulting there from. 3.8.6 Warranties Warranties should be included in the contract.

CIT 212 SYSTEMS ANALYSIS AND DESIGN
229
3.8.7 Guarantees For assuring reliability of the system, guarantees should encompass the following points: ● minimum hours of usable time per day. ● mean-time-between failures (MTBF). ● maximum time to repair. 3.8.8 Payments It should be clearly explained in the contract whether the rental/lease payments made by the customer are in respect of number of hours actually used per month/shift or they are to make at a flat monthly rate. In lease contracts, provision of buying the equipment at certain stipulated prices should also be kept. The contract should provide the facility to protect the already negotiated prices. Also, if the vendor insists on escalation clauses, the customer should have the right to terminate the contract and recover compensation for costs incurred on preparation. 3.8.9 Bankruptcy The contract should provide explicit protection to the customer in the event of the vendor becoming bankrupt. It is a fact that all the areas of problems and disputes between vendors and customers of computer hardware cannot be covered in the contract. Still, the aforementioned checklists try to cover the problems areas usually encountered. 3.9 Hardware Acquisitions Once a decision has been reached to install an in-house computing device, the next step is to prepare a list of specifications of the proposed system so that suitable vendors would be invited for meeting the specific requirements. The tender specifications are prepared as per norms of approved feasibility report. Main technical parameters of the various units of the required hardware objectives of the project and implementation schedule are also included in the tender specifications. Vendors may also ask to quote separately in respect of ‘leasing’ and ‘buying’ options. In addition to this, the vendors may be required to furnish the details of the

CIT 212 SYSTEMS ANALYSIS AND DESIGN
230
infrastructure which the customer will have to arrange and the likely cost thereof. 3.9.1 Tender Evaluations It is often seen that requirements as indicated by the customer do not match with the offer made by individual vendors where the specification given by the vendors are far below the essential requirements of the customers, such offers may be rejected straightway from the purview of short listing. Marginal shortfalls may be considered on merits. However, in case of additional features in the offers which could be categorized as ‘desirable’. It becomes necessary to assign appropriate weights to such features, in order to bring all the bids on equal footing. The additional features including quantifiable differences are: ● One time costs as well as in the continually running and
maintenance costs. ● Equipment characteristics such as storage capacities, speeds of
various units of computing device. ● In-built spare capacity as well as capability of the system to
support additional peripherals. ● Additional support to be provided by the vendor. 3.9.2 Costing Factor Cost consideration is quite important factor in computer acquisitions. Costs are of two types: (i) One-time costs such as cost of site preparation (space, false
ceilings, special flooring, electrical fittings, air-conditioning etc.) (ii) Continued running and maintenance costs of the entire
installations. 3.9.3 Equipment Characteristics Hardware device which provides higher transfer rates (that is arranged number of bytes passing between various functional units per unit of time), or has large storage capacity or in case of printers, if the printed characters per line are quite high, then such additional characteristics as high mean-time-between failures (MTBF), compatibility with the equipment, peripherals etc. available in the market. 3.9.4 Potential for Growth The following features can be considered in this category:

CIT 212 SYSTEMS ANALYSIS AND DESIGN
231
● Potentiality of the system to grow beyond the currently specified
capacity by adding on certain components, ● Potentiality of growth within a particular family of computer
models, ● Capacity of the system to handle a large variety of peripherals, ● Ability of the system to handle additional workloads after
considering the peak hour loads. 3.9.5 Vendor Support The features to be given weightage under the vendor support include: ● hardware maintenance facilities offered, ● training facilities provided, ● assistance to be provided in software development, ● back-up facilities provided by vendor in case of system failure, ● comparative delivery periods offered by different vendors. 3.10 Criteria for Vendor’s Selection Mandatory requirement is that, if a vendor fails to meet them, he would be screened out without any reason. The desirable characteristics would surely be little bit difficult to evaluate because he may offer several alternatives in lieu of them. The criteria of vendor selection may be listed in descending order by importance as below: 3.10.1 Economic Factors ● Cost comparisons ● Return on investment ● Acquisition method 3.10.2 Hardware Factors ● Hardware performance and its reliability ● Facilities for modularity ● Provision for back up facilities ● Firmness of delivery date ● Compatibility with existing systems 3.10.3 Software Factors ● Performance of software and its price ● Efficiency and reliability of available storage ● Programming languages available
CIT 212 SYSTEMS ANALYSIS AND DESIGN
232
● Availability of well documented package software ● Firmness of delivery date for a promised software ● Ease of use and modification as per user requirements ● Portability and its capacity to interface with the environment. 3.10.4 Service Factors ● Facilities provided by the manufacturer for detecting errors in the
new programs ● Provision of good training facilities ● Assistance in software development and conversion facilities
provided ● Maintenance terms and quality 3.10.5 Reputation of Manufacturer ● Financial stability ● Past history for keeping promises These criteria may have to be further sub-divided particularly for hardware performance and support services. 3.11 Acquisition for Proprietary Software Packages Apart from few cases where software packages are developed by outside agencies as per requirement and at the expenses of the user organization, the proprietary rights in the package remain with the original developer. This means that software package developed by outside agencies can only be licensed for use. The mode of payment for the purpose can be possible in one of the following ways: ● Off-the-Shelf acquisition of programs stored in a floppy or in a
plug-in ROM module. (These modes are quite popular in the case of software to be used on PCs.)
● Acquisition of the right to use a package by means of a monthly/periodical licence fee.
● One-off payment for a fixed period. ● Lump-sum payment in the beginning and periodical service
charges later on. Some computer vendors are also interested in supplying software packages along with the system and thus form an integral part of computer operations. However, they like to charge a nominal fee for the use of such packages just to establish ownership.

CIT 212 SYSTEMS ANALYSIS AND DESIGN
233
3.11.1 Technical Aspect of Proprietary Software While considering the acquisition of a proprietary software package, following technical characteristics must be taken into account: Memory size: Amount of memory required when resident in the
CPU Run time: Some programs may occupy lesser memory but
much larger run times. Adaptability: Ability to mix into a multiprogramming
environment and to utilize the existing resources such as peripherals, operating systems, various utility programs, etc.
File storage: File storage requirements and how efficiently it can
store and retrieve data. Modularity: A package with a high degree of modularity has the
capacity to operate on various machines with different configurations.
Expandability: It emphasizes the sensitivity of a software package
to handle an increased volume of transactions or to integrate with other programs.
Reliability: Significant reliability related aspects also include: ● the extent to which a package can still be used when a particular
module fails, ● types of errors on the part of the user which affect performance of
the packages, ● ease of recovery in case of failure, ● capability of the package to run on different configuration Efficiency: This aspect encompasses capability of the package
under peak load conditions. Efficiency of a package much depends on the language in which it is written and the operating system used.
Ease of: Implementation of an application package refers to
all the Implementation associated activities and vendor support up to the
point where the package satisfies users’ needs and the user can run it independently.

CIT 212 SYSTEMS ANALYSIS AND DESIGN
234
Usability: It refers to the effort required to operate, prepare the input and interpret the output of a program. Additional points to be considered are portability and understandability.
Vendor support: This is critically important in such areas as
documentation, software, modification /enhancement/maintenance and educating the user staff at different level – clerical, technical, operational and managerial.
Security: This refers to the in-built capability of the package
to prevent unauthorized access to software and data and to maintain proper integrity of the system.
3.11.2 Approaches to Software Evaluation For software evaluation, following approaches have been discussed: (a) Benchmarking Benchmark is nothing but a sample program specially designed to evaluate the comparative performance of hardware or software. (b) Experience of other users Vendors generally gives a list of users who are satisfied with their work. But is advisable to seek the opinion independently from the existing users whose configuration and operational environment is closely identical. (c) Report of independent research organization Nowadays many research organizations undertake project of evaluating the proprietary software offered by various software agencies. These evaluations are objective and comprehensive in nature. They publish the report at regular interval. The prospective buyer of a software package can have faith in their evaluation. 3.12 Service Bureaux It has been observed that installing in-house computer is quite a costly affair. Thus a small user faces the problem of justifying such a large amount in the initial stage and recurring expenditure later on. It may also be possible that he may not like to get involved in the setting up and staffing of a computer department until a few applications have shown
CIT 212 SYSTEMS ANALYSIS AND DESIGN
235
results. For such a user, number of consulting and service bureaux exist that provide computer facilities to their clients on a fee basis. This service is available on as-needed basis or on a continuing contract basis. Large numbers of such service bureaux are functioning in our country. Quality of service rendered by these varies widely. Some bureaux are run by companies who have acquired a computer for meeting their own requirements and rent out the spare time. Their rates are low but customer service is negligible. The user has to arrange for his own computer operator and related computer stationery. This type of bureaux is good for persons having knowledge of EDP and is available at a cheaper rate. On the other hand, some service bureaux provide everything such as computer operator, tapes and disks etc. Such bureaux are little bit expensive but they are customer oriented. Alternatively, the user can entrust his entire job to a service bureaux or data centre. The charges of such bureaux vary considerably depending on the responsibilities taken by them and the reputation of the firm. The charges are made up of the fixed cost for systems development work and also variable cost which depends on the volume of the data processed. 3.12.1 Advantages of Using Data Centres The various advantages of using data centres instead of in-house computer facility are given below: (i) The major benefit of using data centre is that they can make use
of computer without spending large initial amount. (ii) It eliminates staff and management problems caused by the
employment of a team of highly paid technical professionals in a rapidly changed field of computer.
(iii) The small organization can utilize the expert knowledge of
experienced and qualified staff of data centre in his data processing job which is not available within organization.
(iv) There is no fear of equipments becoming obsolete. (v) The small organization can get valuable experience of working
on computer before deciding whether or not to install an in-house computer.

CIT 212 SYSTEMS ANALYSIS AND DESIGN
236
3.12.2 Disadvantages of Using Data Centres (i) Using data centre services relinquishes control of vital business
data whereas in-house computer offers the possibility of strict security measure.
(ii) Loss of control over the time taken to process data is suffered by
an organization due to data centre. Off-premise computer processing may be inconvenient.
(iii) In using the data centre, staff members of the organization are not
getting familiarly with working on computers. (iv) Use of data centre makes the organization dependent on a second
party which is not aware of the need of the organization. 3.13 Financing Use of Computers After deciding which computer to acquire, the basic configuration and a general plan for its expansion, a further decision has to be taken as how to finance the use of computers. There are three major approaches for financing the use of computers: renting; leasing or outright purchase. Determining which approach is appropriate depends on the characteristics and plans of the organization at the time the acquisition is made. None of the above approaches have an edge over others. The features of each method of acquisition have been summarized in the following table: Comparison of Computer Systems Financing Options Method of Acquisition Advantages Disadvantages
Renting
Short-term commitment. High level of flexibility. Does not require cash up front.
Most expensive option. Little control of equipment change. All vendors are not in favour of renting.
Leasing
Pre-determined payments for fixed period. Does not require cash up front. Usually better service from vendor than under rental. Little risk of obsolescence
More expensive than purchase. May have limitations on hours or equipment use.
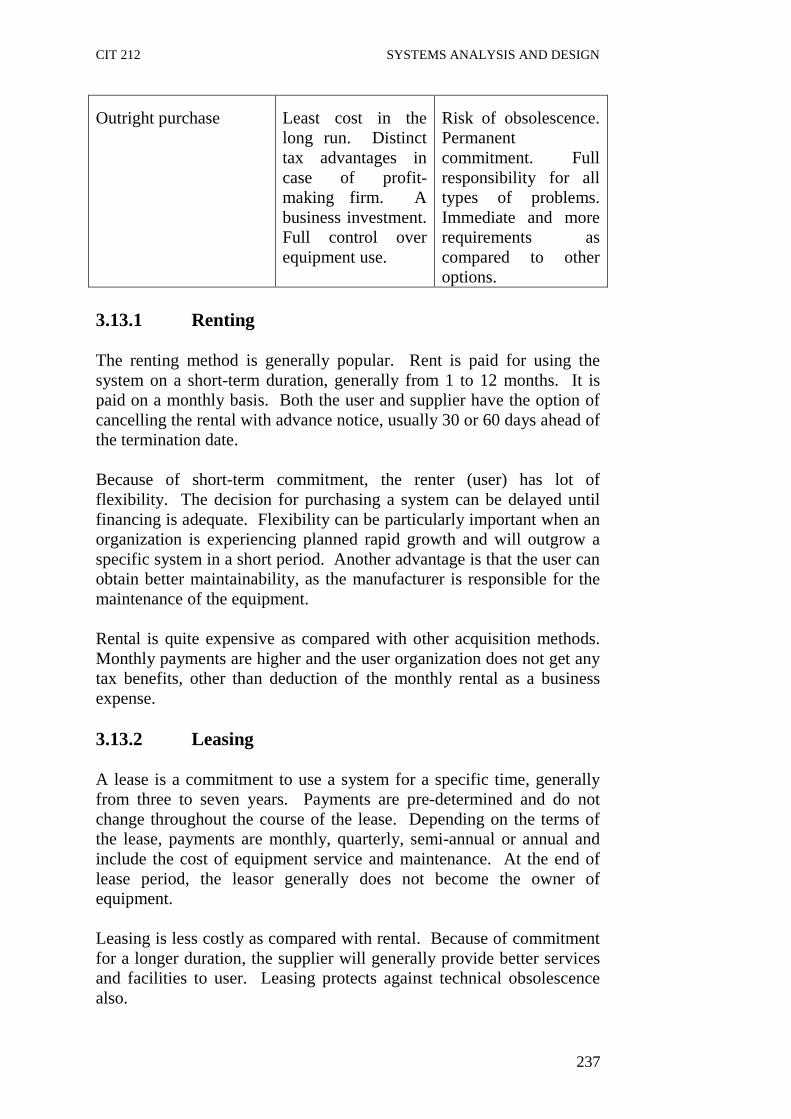
CIT 212 SYSTEMS ANALYSIS AND DESIGN
237
Outright purchase
Least cost in the long run. Distinct tax advantages in case of profit-making firm. A business investment. Full control over equipment use.
Risk of obsolescence. Permanent commitment. Full responsibility for all types of problems. Immediate and more requirements as compared to other options.
3.13.1 Renting The renting method is generally popular. Rent is paid for using the system on a short-term duration, generally from 1 to 12 months. It is paid on a monthly basis. Both the user and supplier have the option of cancelling the rental with advance notice, usually 30 or 60 days ahead of the termination date. Because of short-term commitment, the renter (user) has lot of flexibility. The decision for purchasing a system can be delayed until financing is adequate. Flexibility can be particularly important when an organization is experiencing planned rapid growth and will outgrow a specific system in a short period. Another advantage is that the user can obtain better maintainability, as the manufacturer is responsible for the maintenance of the equipment. Rental is quite expensive as compared with other acquisition methods. Monthly payments are higher and the user organization does not get any tax benefits, other than deduction of the monthly rental as a business expense. 3.13.2 Leasing A lease is a commitment to use a system for a specific time, generally from three to seven years. Payments are pre-determined and do not change throughout the course of the lease. Depending on the terms of the lease, payments are monthly, quarterly, semi-annual or annual and include the cost of equipment service and maintenance. At the end of lease period, the leasor generally does not become the owner of equipment. Leasing is less costly as compared with rental. Because of commitment for a longer duration, the supplier will generally provide better services and facilities to user. Leasing protects against technical obsolescence also.

CIT 212 SYSTEMS ANALYSIS AND DESIGN
238
No capital investment is required to lease a computer system. Leasing offers specific tax benefits. In addition to deducting the cost of the lease as a business expense, tax credits are sometimes available for the investment, which directly lowers the income tax a business pays. 3.13.3 Outright Purchase The ownership of computers through outright purchase is the most common method of computer acquisition and is becoming popular as lease costs rise. In due course of time, the purchase option frequently costs the least, especially in the light of the tax benefits that can sometimes be achieved. Under purchase, the user organization takes little to the equipment. Of course, method for the purchase must be taken from operating funds or borrowed. And, in a sense the user organization is locked into the system it purchases, since changing to a different system is difficult problem. The user organization must arrange its own maintenance, either by engaging his own maintenance staff, of by entering into maintenance contract with the manufacturer. The former method involves stocking of components and all the associated attendant problems. In addition, if the equipment was financed, payment on the loan must be made periodically, the cash outflow still may be lower than with renting or leasing, depending on the terms arranged by the purchaser. In return for the outgoing cash, purchase offers some tax benefits also. 4.0 CONCLUSION System implementation phase of the software development life cycle is the crowning phase of the entire system development project. It can render all the efforts put into the projects in previous phases useless if not properly done. Therefore, this phase has put you through how to properly go about the implementation of the system. This includes training the different categories of personnel that will be involved in the operation of the system, the training methods, methods of conversion from the old system to the new one, post-implementation review, maintaining the system, etc. 5.0 SUMMARY This unit explains the significance of the implementation phase of the software development life cycle. Even though it occurs at the fag end of the life cycle, it can’t be ignored because by doing so, all the efforts that
CIT 212 SYSTEMS ANALYSIS AND DESIGN
239
has been put till the previous phase will become void. Each aspect of implementation i.e. training of personnel, converting the system and reviewing the system after implementation has a significant role to play in the successful implementation of the system. 6.0 TUTOR-MARKED ASSIGNMENT 1. What do you know about system maintenance? 2. What are the criteria for vendor’s selection? 3. List out the different approaches for software evaluation. 7.0 REFERENCES AND FURTHER READINGS Analysis & design of information systems – James A Senn, Mc-Graw
Hill Book Co. (1986) Structured Analysis and Systems Specification – Tom De Marco,
Prentice Hall (1979) The Practical Guide to Structured system Design – Page Jones Mellir,
The Yourdon press (1980) Managing the Structured Techniques – Edward Yourdon, Yourdon,
Yourdon Press (1979)
Accounts Payable