Cisco ASR 5000/ASR 5500 - Mobility Troubleshooting Guide
662
Cisco ASR 5000/ASR 5500 Mobility Troubleshooting Guide Azgar Shaik, Balihar Singh, Dave Damerjian, Dennis Lanov, Guilherme Correia, Jamie Turbyne, Jeff Williams, Manoj Adhikari, Mike Lugo, Muhilan Natarajan, Nebojša Kosanović, Nenad Mićić, Solomon Ayyankulankara Kunjan, Steven Loos, Tomonobu Okada
-
Upload
khangminh22 -
Category
Documents
-
view
1 -
download
0
Transcript of Cisco ASR 5000/ASR 5500 - Mobility Troubleshooting Guide
Cisco ASR 5000/ASR 5500Mobility Troubleshooting GuideAzgar Shaik, Balihar Singh, Dave Damerjian, Dennis Lanov, Guilherme Correia, Jamie Turbyne,Jeff Williams, Manoj Adhikari, Mike Lugo, Muhilan Natarajan, Nebojša Kosanović, Nenad Mićić,Solomon Ayyankulankara Kunjan, Steven Loos, Tomonobu Okada

. . . . . . . . . . . . . . . . . . . . . . . . . . . . . . . . . . . . . . . . . . . . . . . . . . . . . . . . . . . . . . . . . . . . . . . . . . . . . 1
. . . . . . . . . . . . . . . . . . . . . . . . . . . . . . . . . . . . . . . . . . . . . . . . . . . . . . . . . . . . . . . . . . . . . . . . 3
. . . . . . . . . . . . . . . . . . . . . . . . . . . . . . . . . . . . . . . . . . . . . . . . . . . . . . . . . . . . . . . . . . . . . . . . 5
. . . . . . . . . . . . . . . . . . . . . . . . . . . . . . . . . . . . . . . . . . . . . . . . . . . . . . . . . . . . . . . . . . . . . . . . 7
. . . . . . . . . . . . . . . . . . . . . . . . . . . . . . . . . . . . . . . . . . . . . . . . . . . . . . . . . . . . . . . . . . . . . . . . 9
. . . . . . . . . . . . . . . . . . . . . . . . . . . . . . . . . . . . . . . . . . . . . . . . . . . . . . . . . . . . . . . . . . . . . . . . 11
. . . . . . . . . . . . . . . . . . . . . . . . . . . . . . . . . . . . . . . . . . . . . . . . . . . . . . . . . . . . . . . . . . . . . . . . 13
. . . . . . . . . . . . . . . . . . . . . . . . . . . . . . . . . . . . . . . . . . . . . . . . . . . . . . . . . . . . . . . . . . . . . . . . . . . . . 15
. . . . . . . . . . . . . . . . . . . . . . . . . . . . . . . . . . . . . . . . . . . . . . . . . . . . . . . . . . . . . . . . . . . . . . . . 17
. . . . . . . . . . . . . . . . . . . . . . . . . . . . . . . . . . . . . . . . . . . . . . . . . . . . . . . . . . . . . . . . . . . . . . . . . . . . . 21
. . . . . . . . . . . . . . . . . . . . . . . . . . . . . . . . . . . . . . . . . . . . . . . . . . . . . . . . . . . . . . . . . . . . . . . . 23
. . . . . . . . . . . . . . . . . . . . . . . . . . . . . . . . . . . . . . . . . . . . . . . . . . . . . . . . . . . . . . . . . . . . . . . . 31
. . . . . . . . . . . . . . . . . . . . . . . . . . . . . . . . . . . . . . . . . . . . . . . . . . . . . . . . . . . . . . . . . . . . . . . . . . . . . 35
. . . . . . . . . . . . . . . . . . . . . . . . . . . . . . . . . . . . . . . . . . . . . . . . . . . . . . . . . . . . . . . . . . . . . . . . 37
. . . . . . . . . . . . . . . . . . . . . . . . . . . . . . . . . . . . . . . . . . . . . . . . . . . . . . . . . . . . . . . . . . . . . . . . 45
. . . . . . . . . . . . . . . . . . . . . . . . . . . . . . . . . . . . . . . . . . . . . . . . . . . . . . . . . . . . . . . . . . . . . . . . 49
. . . . . . . . . . . . . . . . . . . . . . . . . . . . . . . . . . . . . . . . . . . . . . . . . . . . . . . . . . . . . . . . . . . . . . . . 51
Preface
Authors and Contributions
Authors
Dedications
Acknowledgments
Book Writing Methodology
Who Should Read This Book?
General Troubleshooting
Basic Information for Troubleshooting
Hardware Architecture
ASR 5000
ASR 5500
Software Architecture
ASR 5000/ASR 5500 Boot Sequence
Context
Software Managers of ASR 5000/ASR 5500
Software/Hardware Redundancy
. . . . . . . . . . . . . . . . . . . . . . . . . . . . . . . . . . . . . . . . . . . . . . . . . . . . . . . . . . . . . . . . . . . . . . . . . . . . . 57
. . . . . . . . . . . . . . . . . . . . . . . . . . . . . . . . . . . . . . . . . . . . . . . . . . . . . . . . . . . . . . . . . . . . . . . . 59
. . . . . . . . . . . . . . . . . . . . . . . . . . . . . . . . . . . . . . . . . . . . . . . . . . . . . . . . . . . . . . . . . . . . . . . . 61
. . . . . . . . . . . . . . . . . . . . . . . . . . . . . . . . . . . . . . . . . . . . . . . . . . . . . . . . . . . . . . . . . . . . . . . . 73
. . . . . . . . . . . . . . . . . . . . . . . . . . . . . . . . . . . . . . . . . . . . . . . . . . . . . . . . . . . . . . . . . . . . . . . . 91
. . . . . . . . . . . . . . . . . . . . . . . . . . . . . . . . . . . . . . . . . . . . . . . . . . . . . . . . . . . . . . . . . . . . . . . . 105
. . . . . . . . . . . . . . . . . . . . . . . . . . . . . . . . . . . . . . . . . . . . . . . . . . . . . . . . . . . . . . . . . . . . . . . . 115
. . . . . . . . . . . . . . . . . . . . . . . . . . . . . . . . . . . . . . . . . . . . . . . . . . . . . . . . . . . . . . . . . . . . . . . . 123
. . . . . . . . . . . . . . . . . . . . . . . . . . . . . . . . . . . . . . . . . . . . . . . . . . . . . . . . . . . . . . . . . . . . . . . . . . . . . 125
. . . . . . . . . . . . . . . . . . . . . . . . . . . . . . . . . . . . . . . . . . . . . . . . . . . . . . . . . . . . . . . . . . . . . . . . 127
. . . . . . . . . . . . . . . . . . . . . . . . . . . . . . . . . . . . . . . . . . . . . . . . . . . . . . . . . . . . . . . . . . . . . . . . 139
. . . . . . . . . . . . . . . . . . . . . . . . . . . . . . . . . . . . . . . . . . . . . . . . . . . . . . . . . . . . . . . . . . . . . . . . 145
. . . . . . . . . . . . . . . . . . . . . . . . . . . . . . . . . . . . . . . . . . . . . . . . . . . . . . . . . . . . . . . . . . . . . . . . 155
. . . . . . . . . . . . . . . . . . . . . . . . . . . . . . . . . . . . . . . . . . . . . . . . . . . . . . . . . . . . . . . . . . . . . . . . 165
. . . . . . . . . . . . . . . . . . . . . . . . . . . . . . . . . . . . . . . . . . . . . . . . . . . . . . . . . . . . . . . . . . . . . . . . 167
. . . . . . . . . . . . . . . . . . . . . . . . . . . . . . . . . . . . . . . . . . . . . . . . . . . . . . . . . . . . . . . . . . . . . . . . 177
. . . . . . . . . . . . . . . . . . . . . . . . . . . . . . . . . . . . . . . . . . . . . . . . . . . . . . . . . . . . . . . . . . . . . . . . 189
. . . . . . . . . . . . . . . . . . . . . . . . . . . . . . . . . . . . . . . . . . . . . . . . . . . . . . . . . . . . . . . . . . . . . . . . 195
. . . . . . . . . . . . . . . . . . . . . . . . . . . . . . . . . . . . . . . . . . . . . . . . . . . . . . . . . . . . . . . . . . . . . . . . . . . . . 205
. . . . . . . . . . . . . . . . . . . . . . . . . . . . . . . . . . . . . . . . . . . . . . . . . . . . . . . . . . . . . . . . . . . . . . . . 207
. . . . . . . . . . . . . . . . . . . . . . . . . . . . . . . . . . . . . . . . . . . . . . . . . . . . . . . . . . . . . . . . . . . . . . . . 215
. . . . . . . . . . . . . . . . . . . . . . . . . . . . . . . . . . . . . . . . . . . . . . . . . . . . . . . . . . . . . . . . . . . . . . . . 241
System Verification
System Verification and Troubleshooting Overview
Initial Data Collection
Hardware
Local Ethernet and IP Network
Call Processing
Chassis Fabric
Collecting a Show Support Details
Platform Troubleshooting
CPU/Memory issues
Licensing
HD RAID
Software Crashes
ARP Troubleshooting
Card and Port Troubleshooting
LAG Troubleshooting
Switch Fabric & NPU Troubleshooting
Session Imbalances
CDMA
CDMA Overview
PDSN / FA
HA
. . . . . . . . . . . . . . . . . . . . . . . . . . . . . . . . . . . . . . . . . . . . . . . . . . . . . . . . . . . . . . . . . . . . . . . . . . . . . 251
. . . . . . . . . . . . . . . . . . . . . . . . . . . . . . . . . . . . . . . . . . . . . . . . . . . . . . . . . . . . . . . . . . . . . . . . 253
. . . . . . . . . . . . . . . . . . . . . . . . . . . . . . . . . . . . . . . . . . . . . . . . . . . . . . . . . . . . . . . . . . . . . . . . 263
. . . . . . . . . . . . . . . . . . . . . . . . . . . . . . . . . . . . . . . . . . . . . . . . . . . . . . . . . . . . . . . . . . . . . . . . 301
. . . . . . . . . . . . . . . . . . . . . . . . . . . . . . . . . . . . . . . . . . . . . . . . . . . . . . . . . . . . . . . . . . . . . . . . . . . . . 327
. . . . . . . . . . . . . . . . . . . . . . . . . . . . . . . . . . . . . . . . . . . . . . . . . . . . . . . . . . . . . . . . . . . . . . . . 329
. . . . . . . . . . . . . . . . . . . . . . . . . . . . . . . . . . . . . . . . . . . . . . . . . . . . . . . . . . . . . . . . . . . . . . . . 341
. . . . . . . . . . . . . . . . . . . . . . . . . . . . . . . . . . . . . . . . . . . . . . . . . . . . . . . . . . . . . . . . . . . . . . . . 353
. . . . . . . . . . . . . . . . . . . . . . . . . . . . . . . . . . . . . . . . . . . . . . . . . . . . . . . . . . . . . . . . . . . . . . . . 361
. . . . . . . . . . . . . . . . . . . . . . . . . . . . . . . . . . . . . . . . . . . . . . . . . . . . . . . . . . . . . . . . . . . . . . . . 369
. . . . . . . . . . . . . . . . . . . . . . . . . . . . . . . . . . . . . . . . . . . . . . . . . . . . . . . . . . . . . . . . . . . . . . . . 375
. . . . . . . . . . . . . . . . . . . . . . . . . . . . . . . . . . . . . . . . . . . . . . . . . . . . . . . . . . . . . . . . . . . . . . . . . . . . . 381
. . . . . . . . . . . . . . . . . . . . . . . . . . . . . . . . . . . . . . . . . . . . . . . . . . . . . . . . . . . . . . . . . . . . . . . . 383
. . . . . . . . . . . . . . . . . . . . . . . . . . . . . . . . . . . . . . . . . . . . . . . . . . . . . . . . . . . . . . . . . . . . . . . . 391
. . . . . . . . . . . . . . . . . . . . . . . . . . . . . . . . . . . . . . . . . . . . . . . . . . . . . . . . . . . . . . . . . . . . . . . . 393
. . . . . . . . . . . . . . . . . . . . . . . . . . . . . . . . . . . . . . . . . . . . . . . . . . . . . . . . . . . . . . . . . . . . . . . . 423
. . . . . . . . . . . . . . . . . . . . . . . . . . . . . . . . . . . . . . . . . . . . . . . . . . . . . . . . . . . . . . . . . . . . . . . . . . . . . 427
. . . . . . . . . . . . . . . . . . . . . . . . . . . . . . . . . . . . . . . . . . . . . . . . . . . . . . . . . . . . . . . . . . . . . . . . 429
. . . . . . . . . . . . . . . . . . . . . . . . . . . . . . . . . . . . . . . . . . . . . . . . . . . . . . . . . . . . . . . . . . . . . . . . 431
. . . . . . . . . . . . . . . . . . . . . . . . . . . . . . . . . . . . . . . . . . . . . . . . . . . . . . . . . . . . . . . . . . . . . . . . 441
UMTS
UMTS Overview
Troubleshooting SGSN
Troubleshooting GGSN
LTE
LTE
Troubleshooting MME
Troubleshooting SGW
Troubleshooting PGW
Troubleshooting GTP Path Failure
Handover Troubleshooting
Session Troubleshooting
Overview
Protocol Analyzer Utility
Generic session debugging commands
Session logging
Routing Protocol
Static Routing
OSPF Routing
BGP Routing
. . . . . . . . . . . . . . . . . . . . . . . . . . . . . . . . . . . . . . . . . . . . . . . . . . . . . . . . . . . . . . . . . . . . . . . . . . . . . 451
. . . . . . . . . . . . . . . . . . . . . . . . . . . . . . . . . . . . . . . . . . . . . . . . . . . . . . . . . . . . . . . . . . . . . . . . 453
. . . . . . . . . . . . . . . . . . . . . . . . . . . . . . . . . . . . . . . . . . . . . . . . . . . . . . . . . . . . . . . . . . . . . . . . 455
. . . . . . . . . . . . . . . . . . . . . . . . . . . . . . . . . . . . . . . . . . . . . . . . . . . . . . . . . . . . . . . . . . . . . . . . . . . . . 463
. . . . . . . . . . . . . . . . . . . . . . . . . . . . . . . . . . . . . . . . . . . . . . . . . . . . . . . . . . . . . . . . . . . . . . . . 465
. . . . . . . . . . . . . . . . . . . . . . . . . . . . . . . . . . . . . . . . . . . . . . . . . . . . . . . . . . . . . . . . . . . . . . . . 479
. . . . . . . . . . . . . . . . . . . . . . . . . . . . . . . . . . . . . . . . . . . . . . . . . . . . . . . . . . . . . . . . . . . . . . . . . . . . . 505
. . . . . . . . . . . . . . . . . . . . . . . . . . . . . . . . . . . . . . . . . . . . . . . . . . . . . . . . . . . . . . . . . . . . . . . . 507
. . . . . . . . . . . . . . . . . . . . . . . . . . . . . . . . . . . . . . . . . . . . . . . . . . . . . . . . . . . . . . . . . . . . . . . . 531
. . . . . . . . . . . . . . . . . . . . . . . . . . . . . . . . . . . . . . . . . . . . . . . . . . . . . . . . . . . . . . . . . . . . . . . . 551
. . . . . . . . . . . . . . . . . . . . . . . . . . . . . . . . . . . . . . . . . . . . . . . . . . . . . . . . . . . . . . . . . . . . . . . . 569
. . . . . . . . . . . . . . . . . . . . . . . . . . . . . . . . . . . . . . . . . . . . . . . . . . . . . . . . . . . . . . . . . . . . . . . . . . . . . 579
. . . . . . . . . . . . . . . . . . . . . . . . . . . . . . . . . . . . . . . . . . . . . . . . . . . . . . . . . . . . . . . . . . . . . . . . 581
. . . . . . . . . . . . . . . . . . . . . . . . . . . . . . . . . . . . . . . . . . . . . . . . . . . . . . . . . . . . . . . . . . . . . . . . 591
. . . . . . . . . . . . . . . . . . . . . . . . . . . . . . . . . . . . . . . . . . . . . . . . . . . . . . . . . . . . . . . . . . . . . . . . . . . . . 595
. . . . . . . . . . . . . . . . . . . . . . . . . . . . . . . . . . . . . . . . . . . . . . . . . . . . . . . . . . . . . . . . . . . . . . . . 597
. . . . . . . . . . . . . . . . . . . . . . . . . . . . . . . . . . . . . . . . . . . . . . . . . . . . . . . . . . . . . . . . . . . . . . . . 605
. . . . . . . . . . . . . . . . . . . . . . . . . . . . . . . . . . . . . . . . . . . . . . . . . . . . . . . . . . . . . . . . . . . . . . . . 609
. . . . . . . . . . . . . . . . . . . . . . . . . . . . . . . . . . . . . . . . . . . . . . . . . . . . . . . . . . . . . . . . . . . . . . . . 617
. . . . . . . . . . . . . . . . . . . . . . . . . . . . . . . . . . . . . . . . . . . . . . . . . . . . . . . . . . . . . . . . . . . . . . . . 621
Interchassis Session Recovery
Inter Chassis Session Recovery
ICSR Troubleshooting
Radius
Overview
Troubleshooting Radius Issues
Diameter
Diabase
Policy Control - Gx
Online Charging - Gy
Authentication - S6a
DNS
DNS Client
Proxy DNS
Active Charging Service
Active Charging Service
ACS ruledef Optimization
FW / NAT
X-Header Insertion and Encryption Example
Troubleshooting ACS
. . . . . . . . . . . . . . . . . . . . . . . . . . . . . . . . . . . . . . . . . . . . . . . . . . . . . . . . . . . . . . . . . . . . . . . . . . . . . 629
. . . . . . . . . . . . . . . . . . . . . . . . . . . . . . . . . . . . . . . . . . . . . . . . . . . . . . . . . . . . . . . . . . . . . . . . 631
. . . . . . . . . . . . . . . . . . . . . . . . . . . . . . . . . . . . . . . . . . . . . . . . . . . . . . . . . . . . . . . . . . . . . . . . 639
. . . . . . . . . . . . . . . . . . . . . . . . . . . . . . . . . . . . . . . . . . . . . . . . . . . . . . . . . . . . . . . . . . . . . . . . . . . . . 649
. . . . . . . . . . . . . . . . . . . . . . . . . . . . . . . . . . . . . . . . . . . . . . . . . . . . . . . . . . . . . . . . . . . . . . . . 651
. . . . . . . . . . . . . . . . . . . . . . . . . . . . . . . . . . . . . . . . . . . . . . . . . . . . . . . . . . . . . . . . . . . . . . . . 655
. . . . . . . . . . . . . . . . . . . . . . . . . . . . . . . . . . . . . . . . . . . . . . . . . . . . . . . . . . . . . . . . . . . . . . . . 661
GTPP (CDR's)
GTPP/CDR Overview
GTPP troubleshooting
Bulkstat and KPI
Bulkstats
Troubleshooting Bulkstats
KPIs Overview

Preface


Preface
Authors and Contributions
This book represents the result of an intense collaborative effort between Cisco’s Engineering,Technical Support, Advanced Services employees coming from around the world (Japan, India,Belgium, Canada and USA) to create, in a single week, this collection of methodologies, proce-dures and troubleshooting techniques.


Preface
Authors
This command shows the contributors of this book:
[authors]# show authors
Friday May 8, 16:20 UTC 2015
Azgar Shaik – Cisco Technical Services
Balihar Singh – Cisco Advanced Services
Dave Damerjian – Cisco Technical Services
Dennis Lanov – Cisco Technical Services
Guilherme Correia – Cisco Technical Services
Jamie Turbyne – Cisco Engineering
Jeff Williams – Cisco Technical Services
Manoj Adhikari – Cisco Technical Services
Mike Lugo – Cisco Technical Services
Muhilan Natarajan – Cisco Technical Services
Nebojša Kosanović – Cisco Technical Services
Nenad Mićić – Cisco Engineering
Solomon Ayyankulankara Kunjan – Cisco Technical Services
Steven Loos – Cisco Technical Services
Tomonobu Okada – Cisco Technical Services


Preface
Dedications
This command shows the authors gratitude for support from their loved ones:
[authors]# show dedications
Friday May 8, 16:20 UTC 2015
A big thank you to my wife Chika, my sons Yusei and Soshi. Thanks as well to the team for
giving me this great opportunity - Tomo
I would like to dedicate this effort to my beautiful wife Karen and daughters Paityn and
Katie. Thank you for your patience, support, and love - Mike
Thanks to my father, mother, wife, daughters and brothers that have supported me during all
these years. - Gui
To my wife, son, parents, brother & his family for their continued love, patience, support &
encouragement throughout the years. Thanks to Cisco for this opportunity – Manoj
Dedicated to my parents, my wife Soumya, beautiful sons Allen and Alden. Thanks as well to
Cisco for the opportunity - Solomon
Zahvalio bih se mojoj lijepoj supruzi Tihani, na ljubavi i stalnoj podršci. Zahvalio bih
svojoj obitelji I prijateljima na bezuvjetnoj podršci na svim mojim životnim putevima - Nebojša
Big thanks to my family and colleagues in the Cisco TAC in Brussels for supporting this
intense 1-week onsite book-writing session here in Boxborough – Steven
Dedicated to my Parents Gurdarshan Kaur and Gurdip Singh. But Big thanks to my Wife Mandeep,
daughter and son Gurneet and Lakshveer who supported me a lot. Also thanks to my extended Cisco
Family for the great opportunity - Balihar
Preface
For the original Grand Theft Auto which, many years ago, inspired my interest in networking
and prompted me to set up a LAN that allowed me to play against my friends when the University
network was too slow. I would also like to say ‘thank you’ to all the people in my life, both
personal and professional, that put up with me on a daily basis – Jamie
Dedicated to my family who put up with my not being around for a whole week while creating
this book – Dave
For my wife Lee and daughter Lauren and all my extended family, thanks for your support
throughout the years. Thanks as well to Cisco for the opportunity, it continues to be a fun
ride. – Jeff
To my wife, Suba who is always my constant support and a firm believer in my work, without
which all of this would have been tough to imagine. Certainly to my daughters Vennila and
Meghana, for their own special way of making my every day light and easy, hence make me believe
I can do anything after all! And of course to my parents who would always be proud of me no
matter what. - Muhilan
“For my Mother and Grandmother for their love and support throughout my life.” - Dennis
“To my wife, Arshiya for her love, support and encouragement, my son Arfan for the sweet
moments and my parents for their unconditional love - Azgar
Special thanks to my family and friends for their love and support. Big thanks to my
colleagues, to the Cisco and Starent communities. - Nenad
Preface
Acknowledgments
Special thanks to Cisco’s Shane Herman, Cisco Director of Technical Support and Engineeringteams who supported the realization of this book. We would like to thank you for your continu-ous innovation and the value you provide to the industry.
Special recognition to Cisco’s Technical Services leadership teams for believing in this initiativeand the support provided since the inception of the idea.
In particular we want to express gratitude to the following individuals for their influence andsupport both prior and during the book sprint.
Anand RamCarl HardingDevrim KucukJoe JetteFred CarpenitoJoe FalconeKatsuji DeguchiKen KrzyzewskiMansoor Mohamed OmerMarty MartinezRick HarrisRichard MooreScott PageShane KirbyKetan Kulkarni
Thanks to Book Sprints team: Laia Ros (facilitator), Raewyn Whyte (editor), Henrik van Leeuwen(illustrator), Julien Taquet (book production), Juan Gutierrez (IT support), whose hard workprovided us motivation and allowed us to complete this book with joy.


Preface
Book Writing Methodology
The Book Sprint (www.booksprints.net) methodology was used for writing this book. The BookSprint methodology is an innovative new style of cooperative and collaborative authorship.Book Sprints are strongly facilitated and leverage team-oriented inspiration and motivation torapidly deliver large amounts of well-authored and reviewed content, and incorporate it into acomplete narrative in a short amount of time. By leveraging the input of many experts, thecomplete book was written in a short time period of only five days, however involved hundredsof authoring man hours, and included thousands of experienced engineering hours, allowing forextremely high quality in a very short production time period.

Preface
Who Should Read This Book?
People that should read this book are customers, partners and Cisco employees who need tooperate and/or troubleshoot the Cisco ASR 5000 and ASR 5500 platforms.
It is expected that the reader has prior knowledge, training and experience on these productsand especially, the related technologies. The book focuses on troubleshooting and also coverstheoretical concepts for a better understanding of specific features.
For additional assistance related to configuration and features, please check the Cisco ASR5000 and ASR 5500 Configuration Guides. For assistance with protocol specific issues, consultthe 3GPP or appropriate body for related specifications.


General Troubleshooting

General Troubleshooting
Basic Information for Troubleshooting
Overview
Many complex problems are consequences of changes in the network. It could be a configura-tion change, topology change, traffic pattern change, subscriber behavior changes, signalingstorms or flapping of different components. Any problem can result in some KPI degradationand show an anomaly in single or various components or counters.
Prior to troubleshooting, it is most important to get the broadest possible understanding of theproblem and to try to evaluate all possible changes in the network, platform and design. Thechallenge here is that many production systems are maintained by multiple teams, who may notbe aware of all the changes made by other teams. Complex systems also require particular lev-els of monitoring, and an individual troubleshooter may not have access to all monitoringtools. Even the most complex problems can be resolved by simple questions, if asked at theright time. Mastering the technology is a matter of building up experience and a repertoire ofquestions which bring different angles and dimensions to bear on the problems.
When troubleshooting a network device, it is best to first identify possible KPI degradations andinitial events or symptoms of the problem from a macro perspective. Once a baseline is estab-lished, then zoom in on the details. Rather than leap to a conclusion, which ultimately con-sumes time without resulting in a solution, begin with the data and verifiable facts. Try to iden-tify the preconditions of the issue and clearly define the symptoms.
Initial questions:
• Which product has the problem?
• What service was running in the product? What other products were affected which arenot running the same service?
• What symptom was noted?
• How many nodes were affected by this problem?
• In which location did the problem occur?
• When was the problem first noticed?
• What was the expected behavior?
• Is there a location with a similar setup which did not experience this problem?
General Troubleshooting
• If the problem is no longer seen, how long did the problem persist? What was donethat caused the problem to be resolved?
• What activity was going on in the network during the time the problem was seen? Thisactivity is not necessarily related to the ASR 5x00, but could be related to otheractivities like routing changes, switch replacement, etc.
• Was there a change in network management prior to the incident?
• Has this problem occurred before? If so, what was the history of that occurrence?
• What else was observed?
More detailed questions:
• How many subscribers are affected? Is there any specific type of subscriber affected?
• How many subscribers are not affected? Is there anything specific shared by those whoare not affected?
• What specific KPI degradation was observed? Which values are expected and what aresome previous trends. Is there any other KPI which follows the same trends?
• Confirm if the problem is related to:
Single, some or all services
Specific APN, group of APNs or all APNs
Specific card/port, group or all cards/ports
Specific sessmgr/aaamgr or all sessmgr/aaamgrs
Single or multiple services
Single or multiple vlans/interfaces
Single, multiple or all NPUs. If NPU is not the problem, check the switch fabric
Type of calls, and if so, what is the duration of those calls or any other factorspecific to those calls?
A specific interface - how is the call flow affected and in which phase is it affected?
A specific peer group or all peers - is there anything specific about the peersaffected?
• Anything specific to the affected components or objects?
• Identify any events which occurred around same times when a previous example of thisissue happened. What is common to these events?
• When thinking about symptoms or conditions always confirm: Where was the problemexperienced? Where was it not experienced? What was not experienced? Where?Where not? When? When not?

General Troubleshooting
• What percentage of devices or users are affected? What observations can be madeabout these devices or users?
• Confirm whether this issue is expected behavior and if not, in what ways it isunexpected. What differences are there between the affected and unaffected? What isthe key difference from non-expected behavior?
• What are the examples of working and non-working case scenarios?
• What was the duration of the issue? Is this a recurring or one-time event?
• History of the problem:
Issue trigger?
Configuration/Recent/Network changes?
Change management?
Flapping?
Timeline of events?
Logs?
Patterns?
Differences and delta?
Pre-conditions?
Micro and macro perspectives?
Confirmed and excluded conditions or triggers?
Trends?
• Relevant configuration details:
Working config
Non-working config
Problematic?
Specific details?
• Relevant counters, thresholds, limits, return codes, frequency, timeouts, deltamax/avg/min/deviation?
• Any specific ranges, oscillations, deviations or differences? Trends/Graphs?

General Troubleshooting
Other involved devices:
What is the difference noticed by comparison to other involved devices, both working and non-working?
• Hardware
• Software version
• Configuration changes
• Are these Cisco devices or third party devices?
• Any other unknowns: related info, logs, traces, events or history?
Topology and design details:
• Diagrams or graphs
• Design documents
• Previous stability duration
• Previous versions
• Is this a new setup?
• Is this a production, lab or FOA (First Office Application) environment?
• Are other teams involved?
Reproduction:
• Issue reproduced? If yes, can it be consistently reproduced or is it an intermittentproblem?
• Method used to reproduce the issue?
• Which tools were used to reproduce the issue?
• For how long have reproduction attempts been made?
Workarounds:
• Is it possible?
• What are the disadvantages of implementing the workaround? Any subscriber impact?
• Is it confirmed, tested and validated in the lab?

Hardware Architecture


Hardware Architecture
ASR 5000
Overview
The ASR 5000 is a versatile platform capable of providing multiple services in the Mobilityspace, including SGSN/GGSN/MME/SGW/PGW/HA/FA/PDSN/HSGW amongst others.Multiple services can be combined in a single platform, for example; MME/SGSN services inone single physical platform. The ASR 5000 uses StarOS as its operating system which is a cus-tomized version of Linux that provides a robust and flexible environment.
The Cisco ASR 5000 features a distributed architecture, high-performance capabilities, serviceassurance, and subscriber awareness that ultimately assures high performance. The distributedarchitecture incorporates a blend of high-performance processing, significant memory, andpowerful switch fabric to intelligently and reliably support mobile sessions. Call control andpacket forwarding paths are separated on different control and data switch fabrics, reducingthe number of traffic-flow inefficiencies which diminish latency and accelerate call setup timeand handoffs.
With the distributed architecture, all tasks and services can be allocated across the entire plat-form. This unique approach allows deployment of more efficient mobile networks that can sup-port a greater number of concurrent calls, optimizes resource usage, and delivers enhancedservices, while also providing easy scalability.
The ASR 5000 has no single point of failure: It employs full hardware and software redundancy.ECC single bit errors are also automatically corrected on DRAMs. In the unlikely event of a fail-ure, the ASR 5000 is able to maintain user session and retail billing information, and maximizenetwork availability. Some of the self-healing capabilities of the ASR 5000 include task migra-tion, session recovery, fault containment, state replication, dynamic hardware removal and ad-dition, and geographic redundancy between different chassis.
The ASR 5000 also provides in-line services, which allows for provision of stateful firewall pro-tection, content filtering and enhanced content charging.

Hardware Architecture
ASR 5000 Hardware Configuration
Each ASR 5000 chassis always requires a minimum of two 'redundant' PSC cards (1 x Standbyand 1 x Demux) solely to ensure 'Carrier Grade' reliability in the chassis PLUS however manyadditional 'active' cards are required to handle the live traffic at the node. An ASR 5000 chassismay accommodate a maximum total of 14 PSC cards of which up to 12 will provide the capacityfor handling live traffic - the specific quantity required to be determined by the dimensioningof the solution. A minimum of two 'active' PSC cards is required for a production node.
In addition to 2 x 'redundant' and 2 x 'active' PSC cards, the minimum configuration of an ASR5000 chassis also requires the following items to be provisioned; 2 x System Management Cards(SMC), 2 x Redundancy Crossbar Cards (RCC), 2 x Switch Processor I/Os (SPIO) and two copiesof whichever System Software has been selected (one per SMC).
The required StarOS image should be determined as the result of a joint effort from the Opera-tor's Engineering Department and Cisco Advanced Services, so that the correct image can bedeployed, based on the Operator needs.
The ASR 5000 capacity is defined by these three parameters: throughput, maximum simultane-ous subscribers, and call model. The ASR 5000 capacity limiters are PSC or Task CPU, NPU andPSC or Task Memory. The call model describes what happens in the ASR 5000 system; it in-cludes all events (data, activation, deactivation, handoff, accounting, etc.) that occur simultane-ously. Each event consumes PSC/Task CPU processing time, NPU and memory.
Image - ASR 5000 Front View Cards:
Hardware Architecture
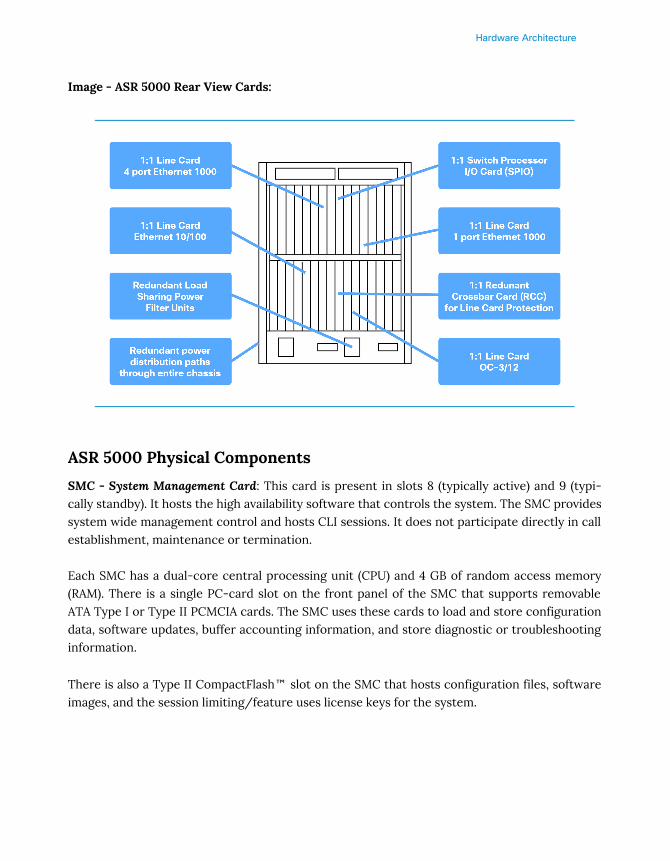
Image - ASR 5000 Rear View Cards:
ASR 5000 Physical Components
SMC - System Management Card: This card is present in slots 8 (typically active) and 9 (typi-cally standby). It hosts the high availability software that controls the system. The SMC providessystem wide management control and hosts CLI sessions. It does not participate directly in callestablishment, maintenance or termination.
Each SMC has a dual-core central processing unit (CPU) and 4 GB of random access memory(RAM). There is a single PC-card slot on the front panel of the SMC that supports removableATA Type I or Type II PCMCIA cards. The SMC uses these cards to load and store configurationdata, software updates, buffer accounting information, and store diagnostic or troubleshootinginformation.
There is also a Type II CompactFlash™ slot on the SMC that hosts configuration files, softwareimages, and the session limiting/feature uses license keys for the system.
Hardware Architecture
The SMC performs the following major functions:
• Non-blocking low latency inter-card communication
• 1:1 or 1:N redundancy for hardware and software resources
• System management control
• Persistent storage via CompactFlash and PCMCIA cards (for field serviceability), and ahard disk drive for greater storage capabilities
• Internal gigabit Ethernet switch fabrics for management and control planecommunication
SPIO - Switch Process IO Card: It is the card that provides connectivity for local and remotemanagement, CO alarming, and Building Integrated Timing Supply (BITS) timing input. SPIOsare installed in chassis slots 24 and 25, behind SMCs. During normal operation, the SPIO in slot24 works with the active SMC in slot 8. The SPIO in slot 25 serves as a redundant component. Inthe event that the SMC in slot 8 fails, the redundant SMC in slot 9 becomes active and workswith the SPIO in slot 24. If the SPIO in slot 24 should fail, the redundant SPIO in slot 25 takesover.
PSC - Packet Services Cards: PSC2 and PSC3. The packet-processing cards provide packet pro-cessing and forwarding capabilities within a system. Each card type supports multiple contexts,which allows an operator to overlap or assign duplicate IP address ranges in different contexts.
Specialized hardware engines support parallel distributed processing for compression, classifi-cation, traffic scheduling, forwarding, packet filtering, and statistics.
The packet-processing cards use control processors to perform packet-processing operations,and a dedicated high-speed network processing unit (NPU). The NPU does the following:
• Provides “Fast-path” processing of frames using hardware classifiers to determine eachpacket’s processing requirements
• Receives and transmits user data frames to and from various physical interfaces
• Performs IP forwarding decisions (both unicast and multicast)
• Provides per interface packet filtering, flow insertion, deletion, and modification
• Manages traffic and traffic engineering
• Modifies, adds, or strips datalink/network layer headers
• Recalculates checksums
• Maintains statistics
Hardware Architecture
• Manages both external line card ports and the internal connections to the data andcontrol fabrics
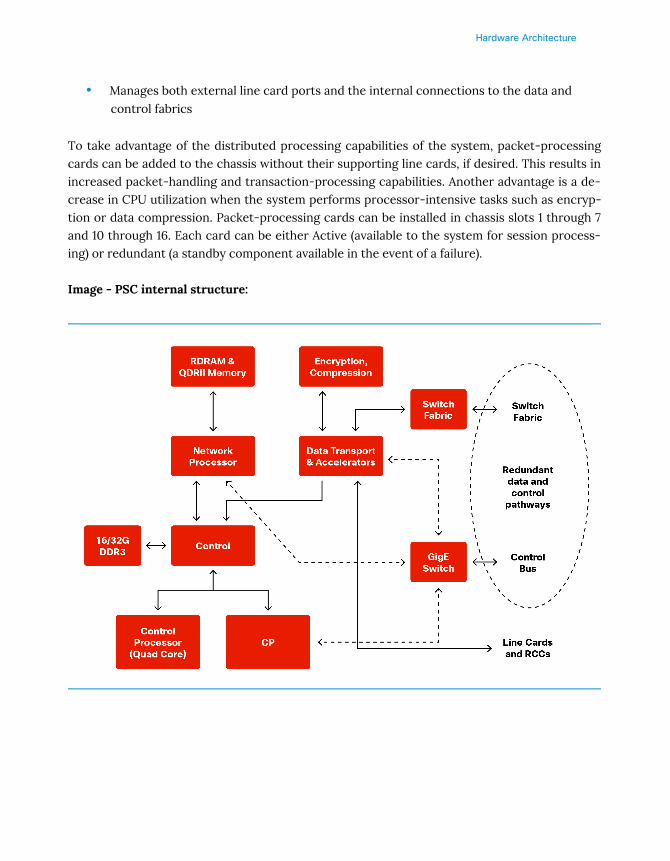
To take advantage of the distributed processing capabilities of the system, packet-processingcards can be added to the chassis without their supporting line cards, if desired. This results inincreased packet-handling and transaction-processing capabilities. Another advantage is a de-crease in CPU utilization when the system performs processor-intensive tasks such as encryp-tion or data compression. Packet-processing cards can be installed in chassis slots 1 through 7and 10 through 16. Each card can be either Active (available to the system for session process-ing) or redundant (a standby component available in the event of a failure).
Image - PSC internal structure:

Hardware Architecture
Packet Services Cards
Packet Services Cards come in 2 versions: PSC2 and PSC3.
The PSC2 uses a fast network processor unit, featuring two quad-core x86 CPUs and 32 GB ofRAM. These processors run a single copy of the operating system. The operating system run-ning on the PSC2 treats the two dual-core processors as a 4-way multi-processor. The PSC2has a dedicated security processor that provides the highest performance for cryptographic ac-celeration of next-generation IP Security (IPSec), Secure Sockets Layer (SSL) and wirelessLAN/WAN security applications with the latest security algorithms.
PSC2s should not be mixed with PSC3s. Due to the different processor speeds and memoryconfigurations, the PSC2 cannot be combined in a chassis with other packet-processing cardtypes. The PSC2 can dynamically adjust the line card connection mode to support switching be-tween XGLCs and non-XGLCs with minimal service interruption.
The PSC3 provides increased aggregate throughput and performance and a higher number ofsubscriber sessions than the PSC2. Specialized hardware engines support parallel distributedprocessing for compression, classification, traffic scheduling, forwarding, packet filtering, andstatistics. The PSC3 features two 6-core CPUs and 64 GB of RAM. These processors run a singlecopy of the operating system. The operating system running on the PSC3 treats the two coreprocessors as a 6-way multi-processor.
PSC3s must not be mixed with PSC2s. Active PSCs are fully redundant with spare PSCs.
Ethernet Line Cards
These provide Ethernet connections to external network elements, typically switches. They areinstalled in slots 17-23, 26-32, 33-39 and 42-48. They provide redundancy and all subscribertraffic is carried on these ports. Ethernet Line Cards are controlled by the PSCs, which providemost of the intelligence. Session control and data packets are forwarded via line card inter-faces.
Fast Ethernet Line Card (FLC2)
The FLC2 is installed directly behind its respective packet-processing card, providing networkconnectivity to the packet data network. Each FLC2 (Ethernet 10/100) has eight RJ-45 inter-faces. Each of these IEEE 802.3-compliant interfaces supports auto-sensing 10/100 Mbps Eth-ernet.
Hardware Architecture
Gigabit Ethernet Line Card (GLC2)
The GLC2 is installed directly behind its respective packet-processing card, providing networkconnectivity to the packet data network. The GLC2 (Ethernet 1000) supports a variety of 1000Mbps optical and copper interfaces based on the type of Small Form-factor Pluggable (SFP)modules installed on the card.
Quad Gigabit Ethernet Line Card (QGLC)
The QGLC is a 4-port Gigabit Ethernet line card that is installed directly behind its associatedpacket-processing card to provide network connectivity to the packet data network. There areseveral different versions of Small Form-factor Pluggable (SFP) modules available for the QGLC.
10 Gigabit Ethernet Line Card (XGLC)
The XGLC supports higher speed connections to packet core equipment, increases effectivethroughput between the ASR 5000 and the packet core network, and reduces the number ofphysical ports needed on the ASR 5000.
The XGLC (10G Ethernet) is a full-height line card, unlike the other line cards, which are halfheight.
The single-port XGLC supports the IEEE 802.3-2005 revision which defines full duplex opera-tion of 10 Gigabit Ethernet. PSC2s or PSC3s are required to achieve maximum sustained rateswith the XGLC.
The XGLC uses a Small Form-factor Pluggable Plus (SFP+) module. The modules support one oftwo media types: 10GBASE-SR (Short Reach) 850nm, 300m over multimode fiber (MMF), or10GBASE-LR (Long Reach) 1310nm, 10km over single mode fiber (SMF).
The supported redundancy schemes for XGLC are L3, Equal Cost Multi Path (ECMP) and 1:1side-by-side redundancy. Side-by-side redundancy allows two XGLC cards installed in neigh-boring slots to act as a redundant pair. Side-by-side pair slots are 17-18, 19-20, 21-22, 23-26, 27-28, 29-30, and 31-32.
Side-by-side redundancy only works with XGLC cards. When configured for non-XGLC cards,the cards are brought offline. If the XGLCs are not configured for side-by-side redundancy,they run independently without redundancy.
Hardware Architecture
RCC - Redundant Crossbar Card: The RCC uses 5 Gbps serial links to ensure connectivity be-tween rear-mounted line cards and every non-SMC frontloaded application card slot in thesystem. This creates a high availability architecture that minimizes data loss and ensures ses-sion integrity. If a packet-processing card were to experience a failure, IP traffic would be redi-rected to and from the LC to the redundant packet-processing card in another slot. Each RCCconnects up to 14 line cards and 14 packet-processing cards for a total of 28 bidirectional linksor 56 serial 2.5 Gbps bidirectional serial paths.
The RCC provides each packet-processing card with a full-duplex 5 Gbps link to 14 (of the max-imum 28) line cards placed in the chassis. This means that each RCC is effectively a 70 Gbpsfull-duplex crossbar fabric, giving the two RCC configuration (for maximum failover protection)a 140 Gbps full-duplex redundancy capability.
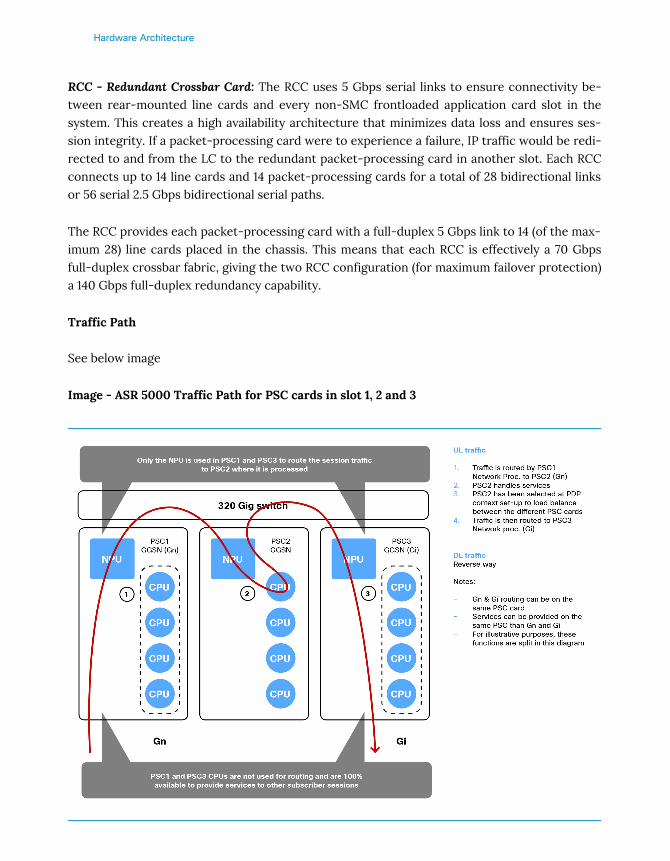
Traffic Path
See below image
Image - ASR 5000 Traffic Path for PSC cards in slot 1, 2 and 3
Hardware Architecture
ASR 5500
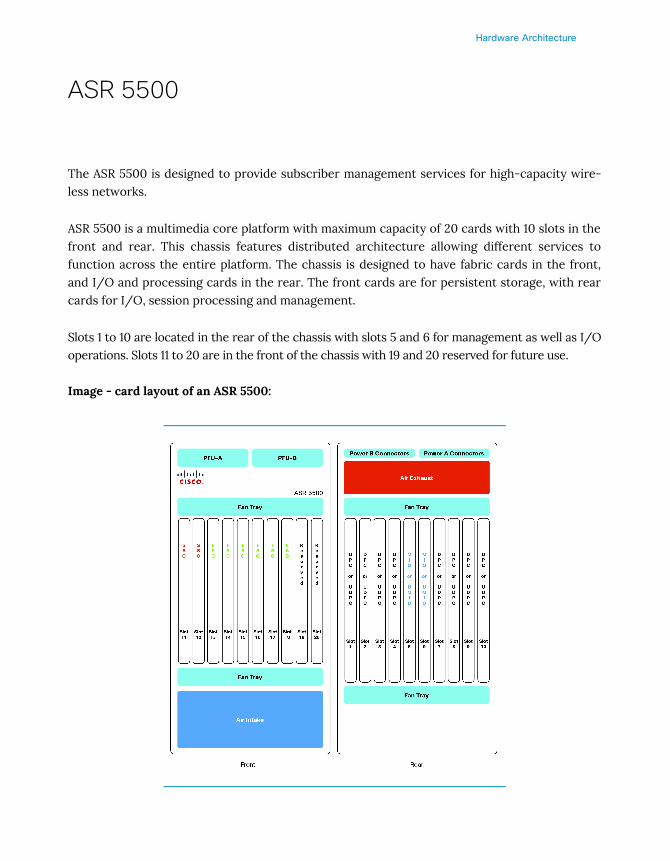
The ASR 5500 is designed to provide subscriber management services for high-capacity wire-less networks.
ASR 5500 is a multimedia core platform with maximum capacity of 20 cards with 10 slots in thefront and rear. This chassis features distributed architecture allowing different services tofunction across the entire platform. The chassis is designed to have fabric cards in the front,and I/O and processing cards in the rear. The front cards are for persistent storage, with rearcards for I/O, session processing and management.
Slots 1 to 10 are located in the rear of the chassis with slots 5 and 6 for management as well as I/Ooperations. Slots 11 to 20 are in the front of the chassis with 19 and 20 reserved for future use.
Image - card layout of an ASR 5500:
Hardware Architecture
In ASR 5500 there are 4 different types of cards, each providing different functionality asexplained below:
Management I/O, Universal Management I/O Cards (MIO/UMIO): There are 2 ManagementI/O cards (MIO) or Universal Management I/O cards (UMIO) in slots 5 & 6. The UMIO card isthe same hardware as MIO, but needs an additional license.
Each MIO/UMIO card has:
• 20 x 10 Gigabit interfaces for external I/O
• Two x 1 Gigabit interfaces dedicated for local context (OAM)
• One CPU subsystem with 96 GB of RAM
• Four x NPU subsystems
• Console connection for CLI Management
• 32 GB SDHC internal flash device
• USB port for flash drive connection
Universal Data Processing Card, Data Processing Card (UDPC / DPC): Data Processing Cards(DPC) and/or Universal Data Processing Cards (UDPC) can be placed in slots 1 to 4 and 7 to 10. AUDPC card is the same hardware as DPC, but needs an additional license. DPC/UPDC cardsmanage subscriber sessions and control traffic.
The DPC/UDPC has two identical CPU subsystems with each containing:
• 96 GB of RAM
• NPU for session data flow offload
• Crypto offload engines located on a daughter card
Fabric and Storage Cards (FSC): There may be up to 6 FSC cards installed in slots 13 to 18 whichare in front of the chassis.
The FSC features:
• Fabric cross-bars providing in aggregate:
120 Gbps full-duplex fabric connection to each MIO/UMIO
60 Gbps full-duplex fabric connection to each DPC/UDPC
Hardware Architecture
• Two 2.5" serial attached SCSI (SAS), 200GB solid state drives (SSDs) with a 6 Gbps SASconnection to each MIO/UMIO.
Every FSC adds to the available fabric bandwidth to each card. Each FSC connects to allMIO/UMIOs or DPC/UDPCs, with a varying number of links depending on the MIO/UMIO orDPC/UDPC slot. Three FSCs provide sufficient bandwidth while the fourth FSC supports re-dundancy.
The ASR 5500 uses an array of solid state drives (SSDs) for short-term persistent storage. TheRAID 05 configuration has each pair of drives on an FSC striped into a RAID 0 array; all the ar-rays are then grouped into a RAID 5 array. Each FSC provides the storage for one quarter of theRAID 5 array. Data is striped across all four FSCs with each FSC providing parity data for theother three FSCs. The array is managed by the master MIO/UMIO.
System Status Cards (SSC): There are two SSC which are in dedicated slots 11 and 12.
The SSC card features:
• Three alarm relays (Form C contacts)
• Audible alarm with front panel Alarm Cutoff (ACO)
• System status LEDs


Software Architecture


Software Architecture
ASR 5000/ASR 5500 Boot Sequence
Overview
With different cards performing different functionalities in ASR 5000/ASR 5500 chassis, it's im-portant to understand the boot process of the chassis.
Image - ASR 5000 Boot Process Flowchart

Software Architecture
1 When power is first applied to the chassis or a reload is performed, the SMC cards in
slot 8 and 9 receive power. Once the system confirms cards are located in slots 8 and 9,
power is applied to the SPIO cards in slots 24 and 25.
2 POST (Power On Self Tests) are performed on each card to ensure the hardware is
operational.
3 If SMC 8 passes all POST tests, it will become the Active SMC card and the SMC card in
slot 9 will become Standby. If there is an issue with SMC 8, then SMC 9 will become the
Active SMC card.
4 The Active SMC will then begin loading the StarOS image designated in the boot stack
file, boot.sys, located on the SMC CompactFlash. The Standby SMC will load its image
from the Active SMC unless the Active SMC fails, and if so, the Standby SMC will then
load its image from its own boot.sys file and will then become the Active SMC.
5 After the Active SMC finishes loading, it will determine which slots are populated with
Application cards by providing power to the slots. If a card is present, power is left on
for that slot. Slots without a card are not powered on.
6 PSCs and Line Cards in the system will perform POST tests as they are powered up.
7 The PSC card will enter into Standby mode after successfully completing POST tests.
8 Line cards will remain in standby mode until the associated PSC cards are made Active.
If using half-height line cards, the Line Card in the upper slot will be made Active and
the Line Card in lower slot will be made standby.
9 The PSC will download its code from the SMC after entering Standby mode.
10 After successfully loading the software image, the system will load the configuration file
specified in the boot stack file. If no software configuration file is found, the system will
enter the Quick Setup Wizard.
Software Architecture
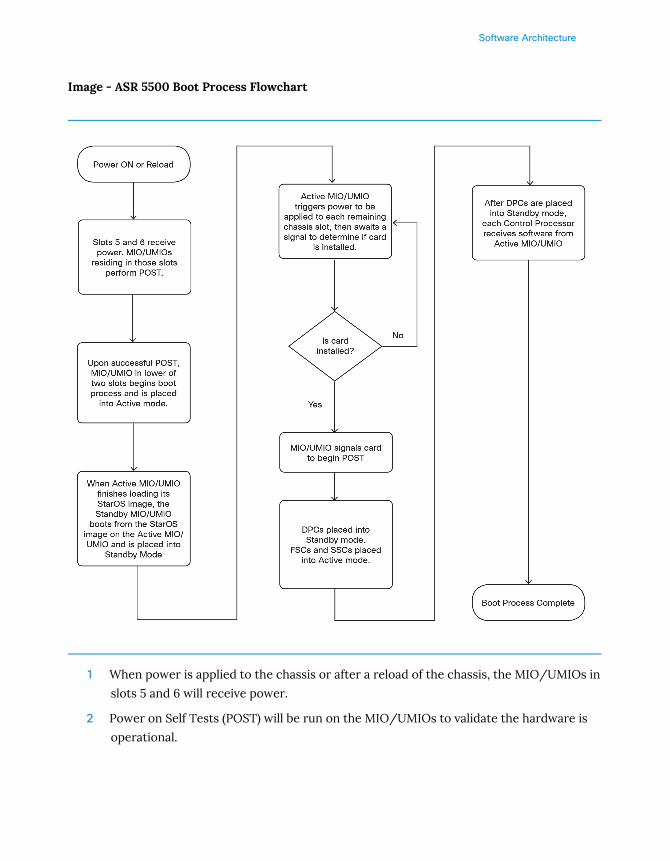
Image - ASR 5500 Boot Process Flowchart
1 When power is applied to the chassis or after a reload of the chassis, the MIO/UMIOs in
slots 5 and 6 will receive power.
2 Power on Self Tests (POST) will be run on the MIO/UMIOs to validate the hardware is
operational.
Software Architecture
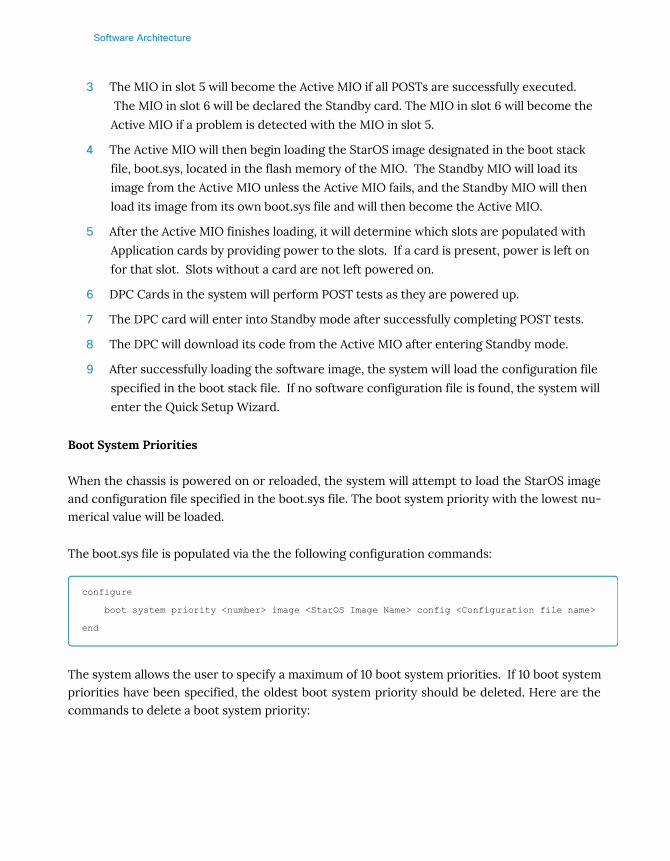
3 The MIO in slot 5 will become the Active MIO if all POSTs are successfully executed.
The MIO in slot 6 will be declared the Standby card. The MIO in slot 6 will become the
Active MIO if a problem is detected with the MIO in slot 5.
4 The Active MIO will then begin loading the StarOS image designated in the boot stack
file, boot.sys, located in the flash memory of the MIO. The Standby MIO will load its
image from the Active MIO unless the Active MIO fails, and the Standby MIO will then
load its image from its own boot.sys file and will then become the Active MIO.
5 After the Active MIO finishes loading, it will determine which slots are populated with
Application cards by providing power to the slots. If a card is present, power is left on
for that slot. Slots without a card are not left powered on.
6 DPC Cards in the system will perform POST tests as they are powered up.
7 The DPC card will enter into Standby mode after successfully completing POST tests.
8 The DPC will download its code from the Active MIO after entering Standby mode.
9 After successfully loading the software image, the system will load the configuration file
specified in the boot stack file. If no software configuration file is found, the system will
enter the Quick Setup Wizard.
Boot System Priorities
When the chassis is powered on or reloaded, the system will attempt to load the StarOS imageand configuration file specified in the boot.sys file. The boot system priority with the lowest nu-merical value will be loaded.
The boot.sys file is populated via the the following configuration commands:
configure
boot system priority <number> image <StarOS Image Name> config <Configuration file name>
end
The system allows the user to specify a maximum of 10 boot system priorities. If 10 boot systempriorities have been specified, the oldest boot system priority should be deleted. Here are thecommands to delete a boot system priority:
Software Architecture
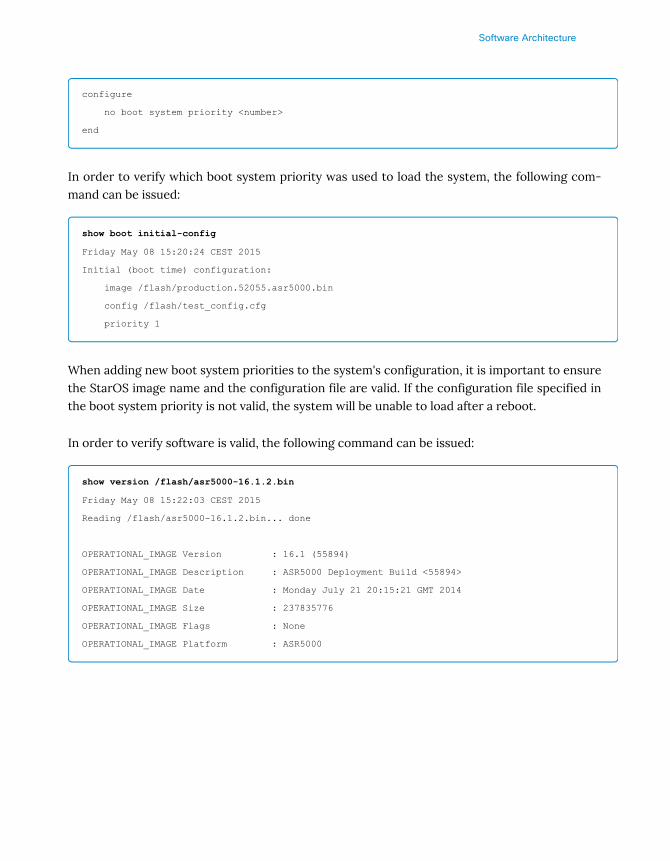
configure
no boot system priority <number>
end
In order to verify which boot system priority was used to load the system, the following com-mand can be issued:
show boot initial-config
Friday May 08 15:20:24 CEST 2015
Initial (boot time) configuration:
image /flash/production.52055.asr5000.bin
config /flash/test_config.cfg
priority 1
When adding new boot system priorities to the system's configuration, it is important to ensurethe StarOS image name and the configuration file are valid. If the configuration file specified inthe boot system priority is not valid, the system will be unable to load after a reboot.
In order to verify software is valid, the following command can be issued:
show version /flash/asr5000-16.1.2.bin
Friday May 08 15:22:03 CEST 2015
Reading /flash/asr5000-16.1.2.bin... done
OPERATIONAL_IMAGE Version : 16.1 (55894)
OPERATIONAL_IMAGE Description : ASR5000 Deployment Build <55894>
OPERATIONAL_IMAGE Date : Monday July 21 20:15:21 GMT 2014
OPERATIONAL_IMAGE Size : 237835776
OPERATIONAL_IMAGE Flags : None
OPERATIONAL_IMAGE Platform : ASR5000
Software Architecture
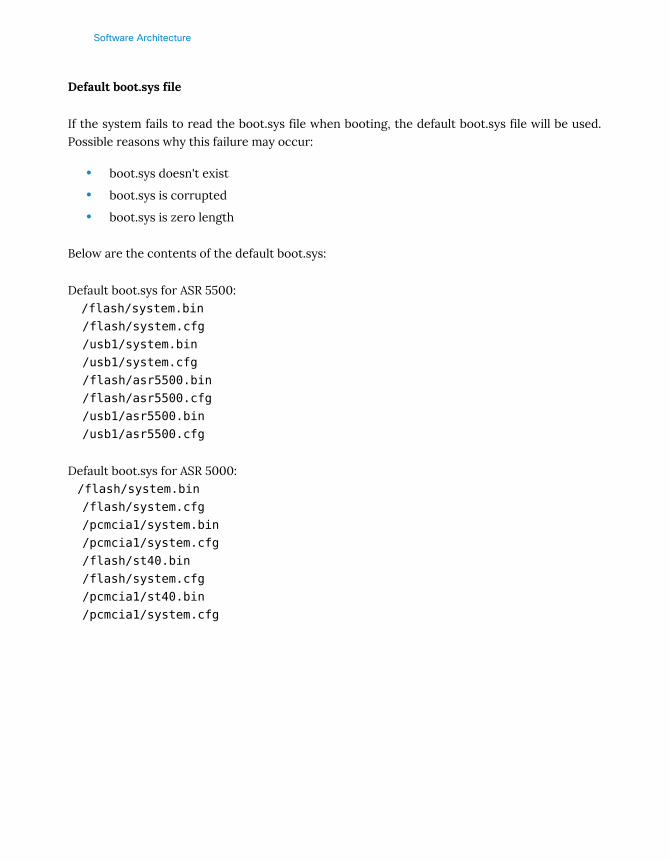
Default boot.sys file
If the system fails to read the boot.sys file when booting, the default boot.sys file will be used.Possible reasons why this failure may occur:
• boot.sys doesn't exist
• boot.sys is corrupted
• boot.sys is zero length
Below are the contents of the default boot.sys:
Default boot.sys for ASR 5500: /flash/system.bin /flash/system.cfg /usb1/system.bin /usb1/system.cfg /flash/asr5500.bin /flash/asr5500.cfg /usb1/asr5500.bin /usb1/asr5500.cfg
Default boot.sys for ASR 5000: /flash/system.bin /flash/system.cfg /pcmcia1/system.bin /pcmcia1/system.cfg /flash/st40.bin /flash/system.cfg /pcmcia1/st40.bin /pcmcia1/system.cfg
Software Architecture
Context
Overview
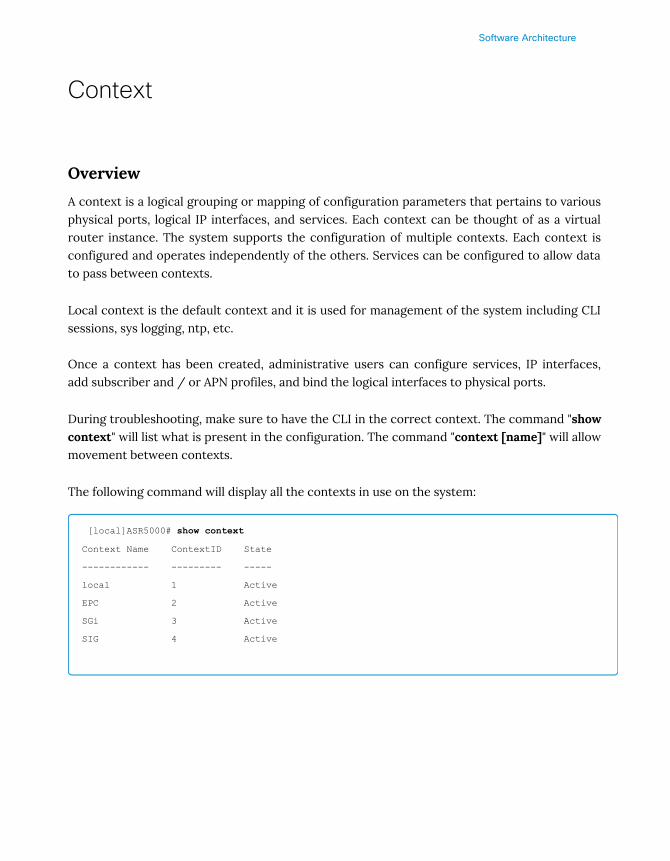
A context is a logical grouping or mapping of configuration parameters that pertains to variousphysical ports, logical IP interfaces, and services. Each context can be thought of as a virtualrouter instance. The system supports the configuration of multiple contexts. Each context isconfigured and operates independently of the others. Services can be configured to allow datato pass between contexts.
Local context is the default context and it is used for management of the system including CLIsessions, sys logging, ntp, etc.
Once a context has been created, administrative users can configure services, IP interfaces,add subscriber and / or APN profiles, and bind the logical interfaces to physical ports.
During troubleshooting, make sure to have the CLI in the correct context. The command "showcontext" will list what is present in the configuration. The command "context [name]" will allowmovement between contexts.
The following command will display all the contexts in use on the system:
[local]ASR5000# show context
Context Name ContextID State
------------ --------- -----
local 1 Active
EPC 2 Active
SGi 3 Active
SIG 4 Active

Software Architecture
What is relevant in this output is the Context ID. Each context is bound to and managed by avpnmgr process with an instance ID that matches the Context ID:
[local]ASR5000# show task resources facility vpnmgr all
task cputime memory files sessions
cpu facility inst used allc used alloc used allc used allc S status
----------------------- --------- ------------- --------- ------------- ------
1/0 vpnmgr 1 0.2% 30% 13.52M 48.10M 24 2000 -- -- - good
1/0 vpnmgr 2 0.2% 100% 11.19M 67.60M 35 2000 -- -- - good
1/0 vpnmgr 3 0.2% 100% 21.61M 71.07M 20 2000 -- -- - good
1/0 vpnmgr 4 0.2% 100% 10.34M 48.10M 20 2000 -- -- - good

Software Architecture
Software Managers of ASR 5000/ASR 5500
Overview
This chapter talks about different processes in ASR 5000/ASR 5500 and their functionalities.
Software Processes
Tasks within the ASR 5000/ASR 5500 chassis have a parent / child relationship that is referredto within a Controller and Manager framework. A controller task will run on an SMC or MIOdepending on the hardware architecture, and is responsible for creating the manager tasks.Manager tasks will run on the PSC or DPC card depending on the hardware architecture in use.
• vpnctrl
VPN Controller creates a vpnmgr for each configured context
Controls IP routing across and within the configured contexts of the chassis
• vpnmgr
One vpnmgr for each configured context
Implements Address Resolution Protocol (ARP)
Installs NPU flows
Maintains IP pool configs and usage for appropriate context(s).
Part of Session Recovery along with SessMgr and AAAMgr.
• sessctrl
Session Controller creates
sessmgr and aaamgr instances
Signaling managers for every service configured, for example:
gtpcmgr
sgtpmgr
imsimgr
egtpinmgr

Software Architecture
• sessmgr
Subscriber processing system that supports multiple subscriber types
Multiple Session Managers per CPU. SessMgr is distributed over multiple CPUs onall active processor cards.
A single Session Manager can service sessions from multiple signaling Demuxmanagers and from multiple contexts.
An instance of the AAAMgr task is created and paired with each SessMgr task aspart of Session Recovery.
• aaamgr
AAAMgr tasks are paired with SessMgr tasks
All AAA protocol operations and functions performed for subscribers. Performs thefunctions of a AAA client to AAA Servers.
Multiple AAA Managers per CPU
AAAMgr is distributed over multiple CPUs on all active processor cards
• diamproxy
1 diamproxy instance per Active DPC or PSC card
Responsible for the processing of Diameter messaging
Sessmgr uses a diamproxy on a different card where aaamgrs initiate requests forS6b/STa/Rf
Sessmgr uses a diamproxy on the same card to initiate requests for Gx and Gy
• gtpcmgr
Created for the GGSN service.
Receives the PDP Context requests for GTP sessions from the SGSN.
Distributes to different sessmgr tasks for load balancing.
Maintains a list of current sessmgr tasks to aid in system recovery.
• imsimgr
Created for the SGSN RAN interface
Receives the attach and activate requests from UEs
Maintains a table of the relationship between PTMSI, IMSI and sessmgr.
• sgtpmgr
Created for the SGSN Gn interface
Receives PDP context from the SGSN service and multiplexes them onto the Gninterface

Software Architecture
Manages Tunnels
GGSN lookups
Other SGSN lookups
• egtpinmgr
Created for the SGW and PGW S5 interface
• gtpumgr
Manages GTP-U flows for user sessions.
• npumgr
Manages the NPU subsystem
Executes on the SMC/MIO and DPC/PSC CPUs
Has local copy of NPU data
• cli
Task is created for each individual user logged into the chassis
Accepts input from the user
show commands
configuration additions or deletions
Tasks can be monitored by using the below commands:
• show task resource
task cputime memory files sessions
cpu facility inst used allc used alloc used allc used allc S status
----------------------- --------- ------------- --------- ------------- ------
1/0 sitmain 10 0.2% 15% 3.12M 8.00M 14 1000 -- -- - good
1/0 sitparent 10 0.1% 20% 2.25M 6.00M 11 500 -- -- - good
1/0 evlogd 0 0.1% 95% 4.45M 25.00M 12 4000 -- -- - good
1/0 drvctrl 0 0.2% 15% 4.26M 10.00M 15 500 -- -- - good
1/0 hatsystem 0 0.1% 10% 2.51M 7.00M 10 500 -- -- - good
1/0 hatcpu 10 0.3% 10% 2.42M 7.00M 11 500 -- -- - good
1/0 rct 0 0.1% 5.0% 2.20M 17.00M 10 500 -- -- - good
1/0 sct 0 0.5% 50% 18.08M 25.00M 15 500 -- -- - good
1/0 rmmgr 10 0.9% 15% 5.29M 12.00M 27 500 -- -- - good
1/0 npumgr 10 0.2% 100% 117.7M 200.0M 21 1000 -- -- - good
1/0 sft 100 0.2% 50% 6.71M 22.00M 18 500 -- -- - good
Software Architecture
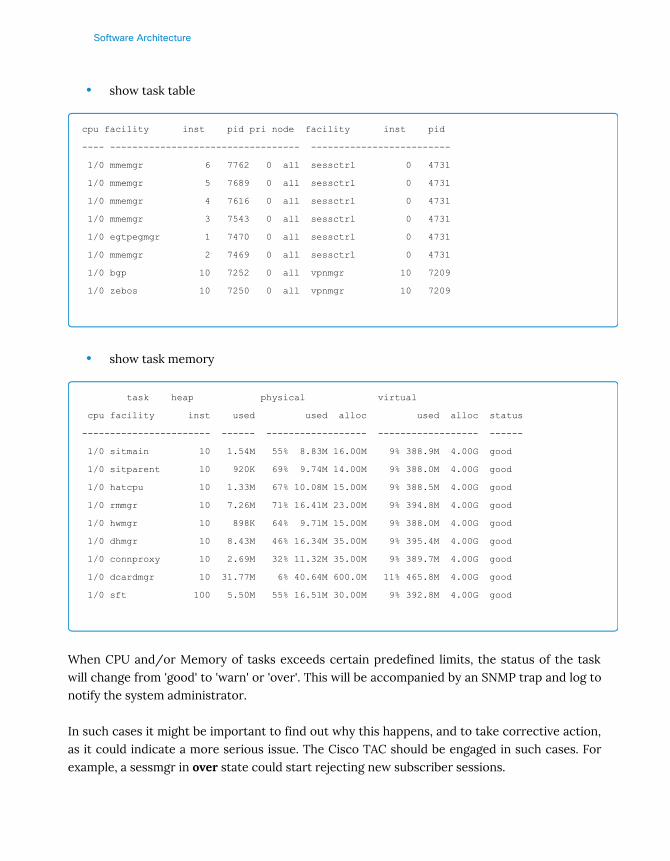
• show task table
cpu facility inst pid pri node facility inst pid
---- ---------------------------------- -------------------------
1/0 mmemgr 6 7762 0 all sessctrl 0 4731
1/0 mmemgr 5 7689 0 all sessctrl 0 4731
1/0 mmemgr 4 7616 0 all sessctrl 0 4731
1/0 mmemgr 3 7543 0 all sessctrl 0 4731
1/0 egtpegmgr 1 7470 0 all sessctrl 0 4731
1/0 mmemgr 2 7469 0 all sessctrl 0 4731
1/0 bgp 10 7252 0 all vpnmgr 10 7209
1/0 zebos 10 7250 0 all vpnmgr 10 7209
• show task memory
task heap physical virtual
cpu facility inst used used alloc used alloc status
----------------------- ------ ------------------ ------------------ ------
1/0 sitmain 10 1.54M 55% 8.83M 16.00M 9% 388.9M 4.00G good
1/0 sitparent 10 920K 69% 9.74M 14.00M 9% 388.0M 4.00G good
1/0 hatcpu 10 1.33M 67% 10.08M 15.00M 9% 388.5M 4.00G good
1/0 rmmgr 10 7.26M 71% 16.41M 23.00M 9% 394.8M 4.00G good
1/0 hwmgr 10 898K 64% 9.71M 15.00M 9% 388.0M 4.00G good
1/0 dhmgr 10 8.43M 46% 16.34M 35.00M 9% 395.4M 4.00G good
1/0 connproxy 10 2.69M 32% 11.32M 35.00M 9% 389.7M 4.00G good
1/0 dcardmgr 10 31.77M 6% 40.64M 600.0M 11% 465.8M 4.00G good
1/0 sft 100 5.50M 55% 16.51M 30.00M 9% 392.8M 4.00G good
When CPU and/or Memory of tasks exceeds certain predefined limits, the status of the taskwill change from 'good' to 'warn' or 'over'. This will be accompanied by an SNMP trap and log tonotify the system administrator.
In such cases it might be important to find out why this happens, and to take corrective action,as it could indicate a more serious issue. The Cisco TAC should be engaged in such cases. Forexample, a sessmgr in over state could start rejecting new subscriber sessions.

Software Architecture
Software/Hardware Redundancy
Overview
This chapter covers both software and hardware redundancy options in ASR 5000/ASR 5500.
The ASR 5000/ASR 5500 is a distributed system with multiple levels of redundancy within eachProcessor and Management card. Full chassis-to-chassis redundancy is also available when In-ter-Chassis Session Recovery (ICSR) is configured. At the software level, there are standbyprocesses available to take over in the event of software task crashes.
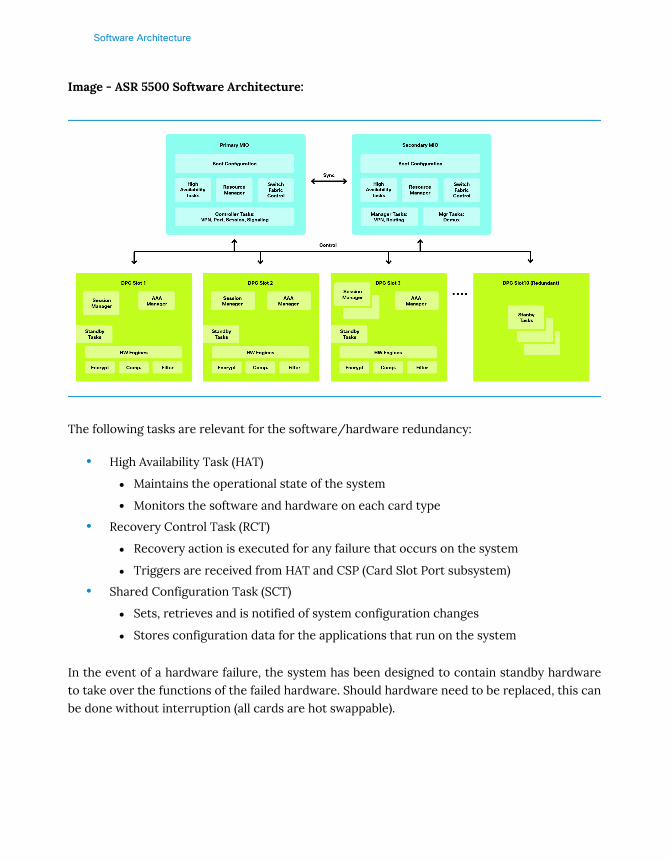
Image - ASR 5000 Software Architecture:
Software Architecture
Image - ASR 5500 Software Architecture:
The following tasks are relevant for the software/hardware redundancy:
• High Availability Task (HAT)
Maintains the operational state of the system
Monitors the software and hardware on each card type
• Recovery Control Task (RCT)
Recovery action is executed for any failure that occurs on the system
Triggers are received from HAT and CSP (Card Slot Port subsystem)
• Shared Configuration Task (SCT)
Sets, retrieves and is notified of system configuration changes
Stores configuration data for the applications that run on the system
In the event of a hardware failure, the system has been designed to contain standby hardwareto take over the functions of the failed hardware. Should hardware need to be replaced, this canbe done without interruption (all cards are hot swappable).
Software Architecture
Hardware Redundancy on card level
SMC card is 1:1 redundant.
PSC cards are 1:N redundant.
Planned card migration is supported where each proclet (process) in the source card is mi-grated gracefully to the target card.
Unplanned card migration (when a card unexpectedly fails), will work differently. All the lostproclets on this card will have to be regenerated by querying processes on other cards. This isexplained in the 'Session Recovery Architecture' section below.
When a single proclet dies, the parent proclet is notified and the parent instantiates the procletagain. Each proclet should have a recovery strategy to get back to its previous state upon recovery.
Session Recovery Architecture:
The session recovery feature provides seamless failover and reconstruction of subscriber sessioninformation in the event of a hardware or software fault within the system. Session recovery pre-vents a fully connected user session from being disconnected from the network and also maintainsthe user's state information. Session recovery is performed by mirroring key software processes(e.g. Session Manager and AAA Manager) within the system. These mirrored processes remain in anidle state (in standby-mode) wherein they perform no processing until they are needed, for exam-ple in the case of a software failure of a session manager task.

Software Architecture
Image - Session Recovery Basics
At boot-up the system spawns new instances of “standby mode” session managers and AAAmanagers for each active Control Processor (CP) being used. Additionally, other key system-level software tasks, such as VPN manager, are started on physically separate Processor Cardsto ensure that a double software fault (e.g. session manager and VPN manager fails at same timeon the same card) cannot occur.
The Processor Card used to host the VPN manager process is in active mode and is reserved bythe operating system for this use when session recovery is enabled. Other demux (signaling)tasks will be running on this Processor Card but there will be no Session manager or AAA man-ager instances on the card running the VPN manager instances. The additional hardware re-sources required for session recovery include a standby SMC in ASR 5000, MIO for ASR5500 and a standby Processor Card (PSC in ASR 5000 or DPC in ASR 5500).
In summary:
• Calls in the ASR 5x00 are handled by work-horse proclets called sessmgrs.
• Each sessmgr is backed by a paired aaamgr. The sessmgr and aaamgr are arranged to bestarted on 2 different processing cards (PSC/DPC) such that card failure scenarios canbe handled.
• Each call is check-pointed periodically from sessmgr to the corresponding aaamgr.
Software Architecture
• To speed up the session recovery, a standby session manager runs in every processingcard (PSC/DPC) and is quickly renamed to the lost sessmgr, after which a new standbysessmgr is created on the processing card.
• Upon unexpected loss of a sessmgr process, the standby sessmgr process retrieves thebacked up information from aaamgr and re-builds its sessions.
• When aaamgr fails, the standby aaamgr queries the sessmgr to re-sync the relevantsubscriber info.
• When demux-mgr fails, it queries all sessmgrs and re-builds its data-base of call-distribution information.
• Nothing is maintained by the sessctrl process. But when the sessctrl processunexpectedly fails, it should ensure that all sessmgr processes are running with theright configuration (as present in SCT process) and it should ensure this reconciliation.
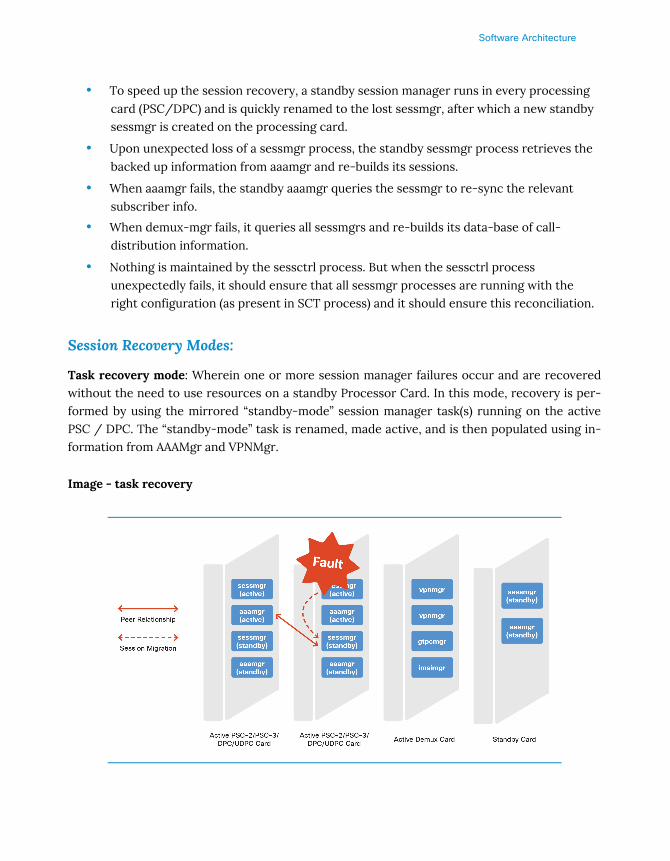
Session Recovery Modes:
Task recovery mode: Wherein one or more session manager failures occur and are recoveredwithout the need to use resources on a standby Processor Card. In this mode, recovery is per-formed by using the mirrored “standby-mode” session manager task(s) running on the activePSC / DPC. The “standby-mode” task is renamed, made active, and is then populated using in-formation from AAAMgr and VPNMgr.
Image - task recovery
Software Architecture
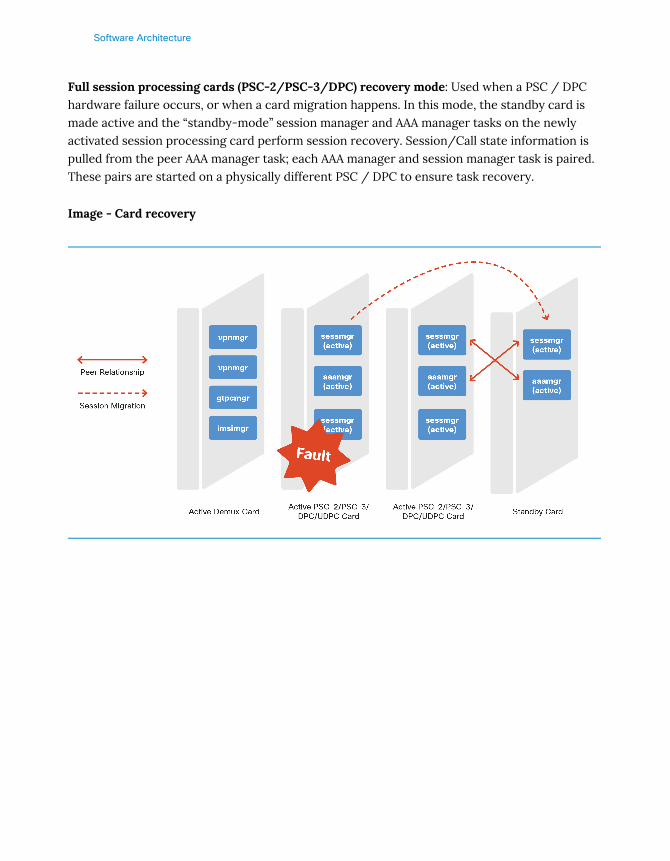
Full session processing cards (PSC-2/PSC-3/DPC) recovery mode: Used when a PSC / DPChardware failure occurs, or when a card migration happens. In this mode, the standby card ismade active and the “standby-mode” session manager and AAA manager tasks on the newlyactivated session processing card perform session recovery. Session/Call state information ispulled from the peer AAA manager task; each AAA manager and session manager task is paired.These pairs are started on a physically different PSC / DPC to ensure task recovery.
Image - Card recovery

Software Architecture
ASR 5000 Simple Packet Flow:
These are the basic steps taken when a new call arrives in the ASR 5000:
1 When a new call arrives, it first connects to the signaling service demux-mgr (step1
above), PGW, HA, GGSN for example. The demux-mgr then chooses a sessmgr to
handle the call and gives it to that session manager (in the picture above, a sessmgr in
card PSC-3).
2 Traffic from the call is sent from the UE to NPU and then on to SessMgr (step 2a above).
SessMgr will act on the traffic if required, and pass it back to NPU on the same PSC
which then sends the traffic through the midplane and out the configured physical
interface and into the network (step 2b above).
3 The response to the traffic arrives from the destination (step 3 above) and is sent back
to NPU and then SessMgr. SessMgr then inspects the traffic (if configured) and then
sends it back to NPU and ultimately out to the network and the UE (step 4 above).


System Verification


System Verification
System Verification and TroubleshootingOverview
Overview
This chapter outlines the commands that can be executed to ensure the ASR 5000/5500 chas-sis is in a healthy state or identify and troubleshoot existing issues. This procedure addressesthe need for a “generic” system verification process of the ASR 5000/5500 chassis.
Here a few things to keep in mind for this section:
• Any subsection in this chapter can be used individually to troubleshoot the area underinvestigation.
• Counters can be cleared in order to help understand which values are currentlyincrementing
• An administrator privilege via CLI is required.
• As a Customer running this procedure, the CLI output can be provided to Cisco in orderto review the health of the system.
Prequisites
The following is needed to perform the activities in the ASR 5000/5500 System Verifica-tion Check and Troubleshooting chapter:
1 ASR 5x00 Chassis with Console or IP connectivity into the chassis.
2 Administrator level Username and Password access to the chassis.
3 Enable timestamps (the CLI command 'timestamps' will enable this).
4 Confirm session is logged.
5 Access to Cisco ASR 5x00 Documentation:
• http://www.cisco.com/c/en/us/support/wireless/asr-5000-series/products-installation-and-configuration-guides-list.html

System Verification
Initial Data Collection
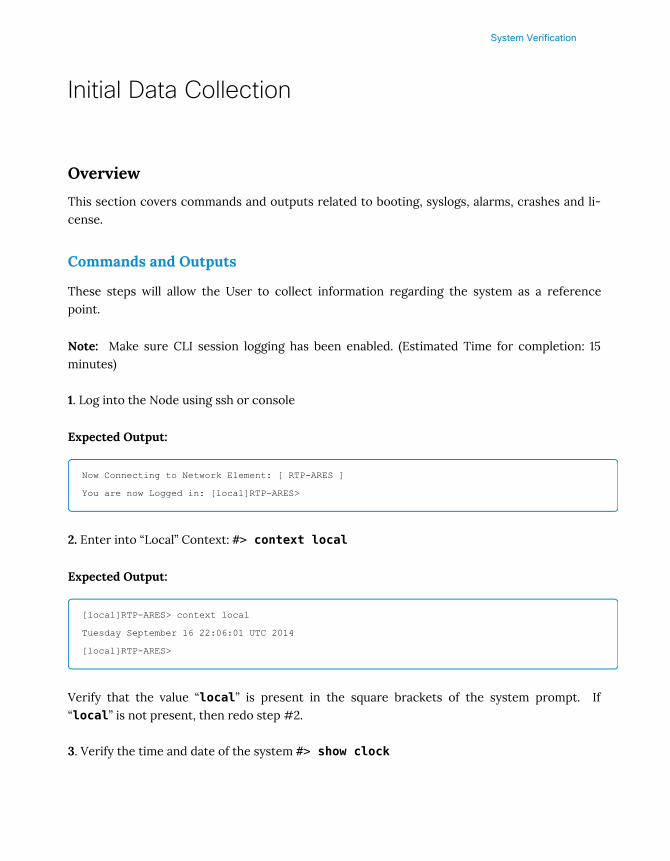
Overview
This section covers commands and outputs related to booting, syslogs, alarms, crashes and li-cense.
Commands and Outputs
These steps will allow the User to collect information regarding the system as a referencepoint.
Note: Make sure CLI session logging has been enabled. (Estimated Time for completion: 15minutes)
1. Log into the Node using ssh or console
Expected Output:
Now Connecting to Network Element: [ RTP-ARES ]
You are now Logged in: [local]RTP-ARES>
2. Enter into “Local” Context: #> context local
Expected Output:
[local]RTP-ARES> context local
Tuesday September 16 22:06:01 UTC 2014
[local]RTP-ARES>
Verify that the value “local” is present in the square brackets of the system prompt. If“local” is not present, then redo step #2.
3. Verify the time and date of the system #> show clock

System Verification
Expected Output:
[local]RTP-ARES> show clock
Tuesday September 16 22:12:28 UTC 2014
Tuesday September 16 22:12:28 UTC 2014
[local]RTP-ARES>
If the clock of the system does not match the expected value, please refer to the ASR 5x00 doc-umentation referenced in the "System Verification and Troubleshooting Overview" chapter.
4. Verify the StarOS version that is currently being run by the chassis: #> show version
[local]RTP-ARES> show version
Wednesday September 17 20:00:36 UTC 2014
Active Software:
Image Version: ww.x.y.zzzzz
Image Build Number: zzzzz
Image Description: NonDeployment_Build
Image Date: Thu Aug 28 20:11:02 EDT 2014
Boot Image: /flash/asr5500-16.2.0.56515.bin
Verify the system is running the expected software image version and build number.
5. Verify the system uptime of the chassis: #> show system uptime
Expected Output:
[local]RTP-ARES> show system uptime
Wednesday September 17 20:03:29 UTC 2014
System uptime: 14D 20H 36M
Make note of the length of time the system has been running. An unexpected value may needto be investigated further.
6. Verify the system for configuration errors : #> show configuration errors

System Verification
Expected Output:
[local]RTP-ARES> show configuration errors
###########################################
# Displaying Diameter Configuration errors
######################################################################################
Total 0 error(s) in this section !
######################################################################################
# Displaying Active-charging system errors
######################################################################################
Total 0 error(s) in this section !
######################################################################################
# Displaying IMSA-configuration errors
######################################################################################
Error : Invalid primary host/realm configuration under endpoint : DCCA-PCRF for
imsa service : IMSA dpca. Host : minid-simulator Realm : combination
not available in diameter configuration.
Total 1 error(s) in this section !
Verify the system configuration and fix reported configuration mistakes to avoid possible prob-lems on the system.
7. Verify the system’s boot configuration: #> show boot
Expected Output:
[local]RTP-ARES> show boot
Wednesday September 17 20:08:24 UTC 2014
boot system priority 75 \
image /flash/asr5500-16.2.0.56515.bin \
config /flash/RTP-ARES-PGW_MTU-Def_20140911.cfg
boot system priority 76 \
image /flash/asr5500-16.2.0.56515.bin \
config /flash/RTP-ARES-PGW_E911-PCSCF-CNG_20140903.cfg
boot system priority 77 \
System Verification
image /flash/asr5500-16.2.0.56515.bin \
config /flash/New-16.2-Sep2nd2014.cfg
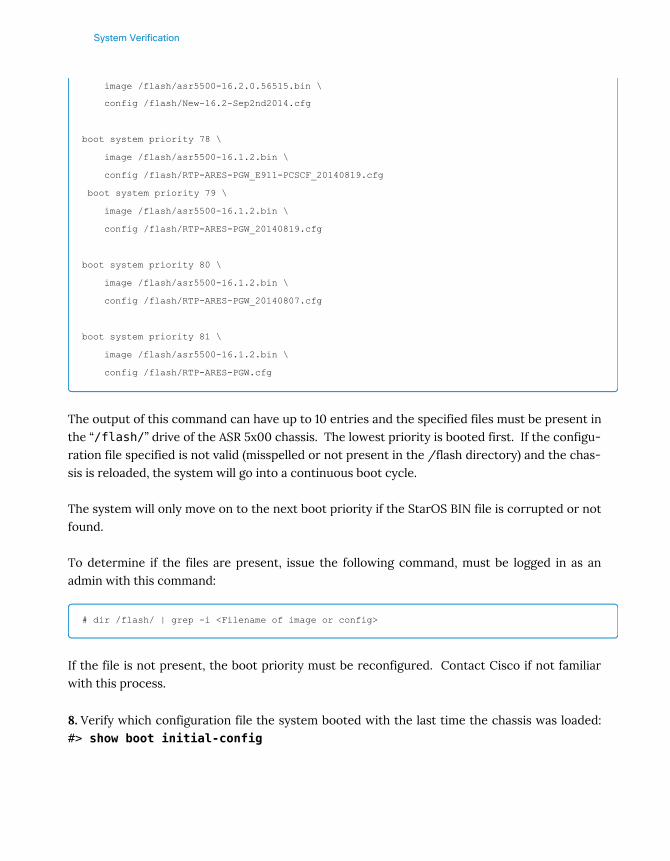
boot system priority 78 \
image /flash/asr5500-16.1.2.bin \
config /flash/RTP-ARES-PGW_E911-PCSCF_20140819.cfg
boot system priority 79 \
image /flash/asr5500-16.1.2.bin \
config /flash/RTP-ARES-PGW_20140819.cfg
boot system priority 80 \
image /flash/asr5500-16.1.2.bin \
config /flash/RTP-ARES-PGW_20140807.cfg
boot system priority 81 \
image /flash/asr5500-16.1.2.bin \
config /flash/RTP-ARES-PGW.cfg
The output of this command can have up to 10 entries and the specified files must be present inthe “/flash/” drive of the ASR 5x00 chassis. The lowest priority is booted first. If the configu-ration file specified is not valid (misspelled or not present in the /flash directory) and the chas-sis is reloaded, the system will go into a continuous boot cycle.
The system will only move on to the next boot priority if the StarOS BIN file is corrupted or notfound.
To determine if the files are present, issue the following command, must be logged in as anadmin with this command:
# dir /flash/ | grep -i <Filename of image or config>
If the file is not present, the boot priority must be reconfigured. Contact Cisco if not familiarwith this process.
8. Verify which configuration file the system booted with the last time the chassis was loaded:#> show boot initial-config
System Verification
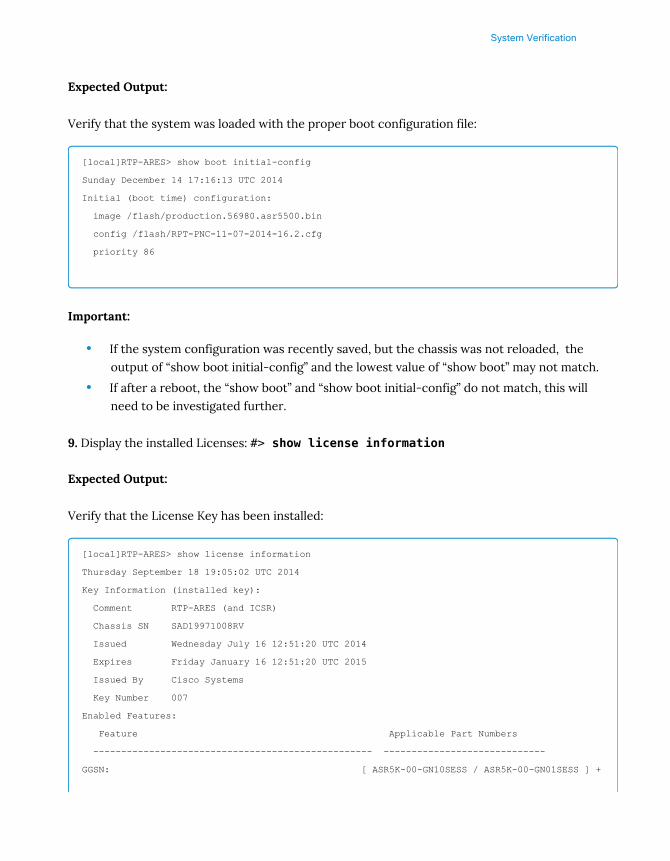
Expected Output:
Verify that the system was loaded with the proper boot configuration file:
[local]RTP-ARES> show boot initial-config
Sunday December 14 17:16:13 UTC 2014
Initial (boot time) configuration:
image /flash/production.56980.asr5500.bin
config /flash/RPT-PNC-11-07-2014-16.2.cfg
priority 86
Important:
• If the system configuration was recently saved, but the chassis was not reloaded, theoutput of “show boot initial-config” and the lowest value of “show boot” may not match.
• If after a reboot, the “show boot” and “show boot initial-config” do not match, this willneed to be investigated further.
9. Display the installed Licenses: #> show license information
Expected Output:
Verify that the License Key has been installed:
[local]RTP-ARES> show license information
Thursday September 18 19:05:02 UTC 2014
Key Information (installed key):
Comment RTP-ARES (and ICSR)
Chassis SN SAD19971008RV
Issued Wednesday July 16 12:51:20 UTC 2014
Expires Friday January 16 12:51:20 UTC 2015
Issued By Cisco Systems
Key Number 007
Enabled Features:
Feature Applicable Part Numbers
-------------------------------------------------- -----------------------------
GGSN: [ ASR5K-00-GN10SESS / ASR5K-00-GN01SESS ] +

System Verification
DHCP
[ ASR5K-00-CSXXDHCP ]
IPv4 Routing Protocols [ none ]
Enhanced Charging Bundle 2: [ ASR5K-00-CS01ECG2 ]
+ DIAMETER Closed-Loop Charging Interfac [ ASR5K-00-CSXXDCLI ]
+ Enhanced Charging Bundle 1 [ ASR5K-00-CS01ECG1 ]
IPSec [ ASR5K-00-CS01I-K9 / ASR5K-00-CS10I-K9 ]
Session Recovery [ ASR5K-00-PN01REC / ASR5K-00-HA01REC
ASR5K-00-00000000 / ASR5K-00-GN01REC
ASR5K-00-SN01REC / ASR5K-00-AN01REC
ASR5K-00-IS10PXY / ASR5K-00-IS01PXY
ASR5K-00-HWXXSREC / ASR5K-00-PW01REC
ASR5K-05-PHXXSREC / ASR5K-00-SY01R-K9
ASR5K-00-IG01REC / ASR5K-00-PC10SR
ASR5K-00-EG01SR / ASR5K-00-FY01SR
ASR5K-00-CS01LASR / ASR5K-00-FY01USR
ASR5K-00-EW01SR / ASR5K-00-SM01SR
ASR5K-00-S301SR ]
IPv6 [ N/A / N/A ]
Lawful Intercept [ ASR5K-00-CSXXLI ]
Inter-Chassis Session Recovery [ ASR5K-00-HA10GEOR / ASR5K-00-HA01GEOR
ASR5K-00-GN10ICSR / ASR5K-00-GN01ICSR
ASR5K-00-PW01ICSR / ASR5K-00-IGXXICSR
ASR5K-00-PC10GR / ASR5K-00-SW01ICSR
ASR5K-00-SG01ICSR ]
RADIUS AAA Server Groups [ ASR5K-00-CSXXAAA ]
Intelligent Traffic Control: [ ASR5K-00-CS01ITC ]
+ Dynamic Radius extensions (CoA and PoD) [ ASR5K-00-CSXXDYNR ]
+ Per-Subscriber Traffic Policing/Shapin [ ASR5K-00-CSXXTRPS ]
Enhanced Lawful Intercept [ ASR5K-00-CS01ELI / ASR5K-00-CS10ELI ]
Dynamic Policy Interface: [ ASR5K-00-CS01PIF ]
+ DIAMETER Closed-Loop Charging Interface [ ASR5K-00-CSXXDCLI ]
PGW [ ASR5K-00-PW10GTWY / ASR5K-00-PW01LIC ]
NAT/PAT with DPI [ ASR5K-00-CS01NAT ]
NAT Bypass [ ASR5K-02-CS01NATB ]
Local Policy Decision Engine [ ASR5K-00-PWXXDEC ]

System Verification
Session Limits:
Sessions Session Type
-------- -----------------------
10000 GGSN
11000 ECS
10000 PGW
CARD License Counts:
[none]
Status:
Chassis MEC SN Matches
License Status Good
If the output is not displayed as expected, please contact Cisco to investigate further or refer-ence the "Licensing" section in "Platform Troubleshooting".
10. Verify the Contexts that are configured on the system: #> show context
Expected Output:
[local]RTP-ARES# show context
Wednesday September 17 20:16:52 UTC 2014
Context Name ContextID State Description
--------------- --------- ---------- -----------------------
local 1 Active
PGWin 2 Active
PGWout 3 Active
SRP 4 Active
ECS 5 Active
Verify that all expected Contexts are present and in an “Active” state.
11. Verify all tasks on the chassis are in a “good” state: #> show task resources | grep -vgood

System Verification
Expected Output:
[local]RTP-ARES# show task resources | grep -v good
Wednesday September 17 21:38:25 UTC 2014
task cputime memory files sessions
cpu facility inst used allc used alloc used allc used allc S status
----------------------- --------- ------------- --------- ------------- ------
Total 700 369.37% 76.87G 20308 233
If any process is reported in a “Warn” or “Over” state, monitor the process to see if it clearsafter a short period (~15 minutes). If the process continues to stay in the “Warn” or “Over” orcontinuously goes in and out of that state, escalate to Cisco to assist in diagnosing the cause.
The above output is an example of a chassis with no issues.
12. Review all Events present on the chassis: #> show logs
Expected Output:
[local]RTP-ARES> show logs
Friday September 19 11:17:53 UTC 2014
2014-Sep-19+11:17:49.597 [snmp 22002 info] [5/0/4687 <cli:5004687> trap_api.c:930] [software
internal system
syslog] Internal trap notification 52 (CLISessStart) user vendgrp privilege level Operator
ttyname /dev/pts/3
2014-Sep-19+10:12:42.015 [snmp 22002 info] [5/0/10563 <cli:5010563> trap_api.c:930] [software
internal system
syslog] Internal trap notification 52 (CLISessStart) user emslogin privilege level Security
Administrator
ttyname /dev/pts/1
2014-Sep-19+10:06:31.518 [snmp 22002 info] [5/0/5972 <sitmain:50> trap_api.c:930] [software
internal system
syslog] Internal trap notification 53 (CLISessEnd) user emslogin privilege level Security
Administrator
ttyname /dev/pts/1
2014-Sep-19+09:54:52.061 [snmp 22020 error] [5/0/7431 <snmp:0> snmp_star_api.c:10218]
[software internal system
syslog] MISC ERROR: Failed to insert data[rc=status] rc=1

System Verification
2014-Sep-19+09:51:04.670 [snmp 22020 error] [5/0/7431 <snmp:0> snmp_star_api.c:10218]
[software internal system
syslog] MISC ERROR: Failed to insert data[rc=status] rc=1
2014-Sep-19+08:20:52.565 [snmp 22020 error] [5/0/7431 <snmp:0> snmp_star_api.c:10218]
[software internal system
syslog] MISC ERROR: Failed to insert data[rc=status] rc=1
The output of this command is listed from Newest to Oldest. The parameter “| more” can beadded to the end of the command to display the output page by page.
When reviewing this output, it is important to be familiar with the system.
13. Review all recent SNMP traps present on the chassis: #> show snmp traps historyverbose
Expected Output:
[local]RTP-ARES> show snmp trap history verbose
Friday September 19 11:21:06 UTC 2014
There are 2241 historical trap records (5000 maximum)
Timestamp Trap Information
------------------------ -------------------------------------------------------
Tue Sep 02 23:28:15 2014 Internal trap notification 55 (CardActive) card 14 type Fabric &
2x200GB Storage Card
Tue Sep 02 23:28:22 2014 Internal trap notification 55 (CardActive) card 17 type Fabric &
2x200GB Storage Card
Tue Sep 02 23:28:22 2014 Internal trap notification 55 (CardActive) card 15 type Fabric &
2x200GB Storage Card
The output of this command is listed from Oldest to Newest. The parameter “| more” can beadded to the end of the command to display the output page by page.
When reviewing this output, it is important to be familiar with the system.
14. Determine if there are any active alarms on the system:#> show alarm outstandingverbose
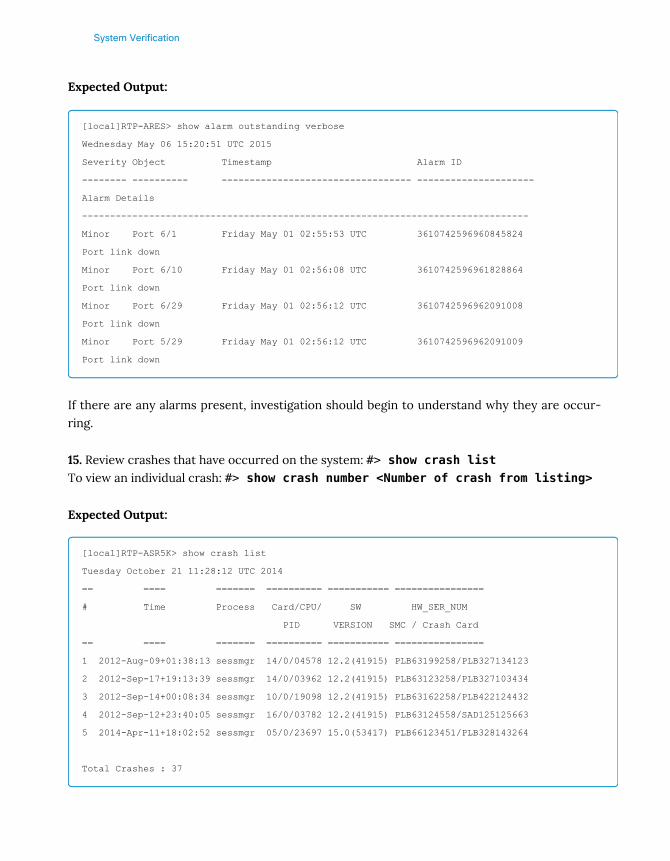
System Verification
Expected Output:
[local]RTP-ARES> show alarm outstanding verbose
Wednesday May 06 15:20:51 UTC 2015
Severity Object Timestamp Alarm ID
-------- ---------- ---------------------------------- ---------------------
Alarm Details
--------------------------------------------------------------------------------
Minor Port 6/1 Friday May 01 02:55:53 UTC 3610742596960845824
Port link down
Minor Port 6/10 Friday May 01 02:56:08 UTC 3610742596961828864
Port link down
Minor Port 6/29 Friday May 01 02:56:12 UTC 3610742596962091008
Port link down
Minor Port 5/29 Friday May 01 02:56:12 UTC 3610742596962091009
Port link down
If there are any alarms present, investigation should begin to understand why they are occur-ring.
15. Review crashes that have occurred on the system: #> show crash listTo view an individual crash: #> show crash number <Number of crash from listing>
Expected Output:
[local]RTP-ASR5K> show crash list
Tuesday October 21 11:28:12 UTC 2014
== ==== ======= ========== =========== ================
# Time Process Card/CPU/ SW HW_SER_NUM
PID VERSION SMC / Crash Card
== ==== ======= ========== =========== ================
1 2012-Aug-09+01:38:13 sessmgr 14/0/04578 12.2(41915) PLB63199258/PLB327134123
2 2012-Sep-17+19:13:39 sessmgr 14/0/03962 12.2(41915) PLB63123258/PLB327103434
3 2012-Sep-14+00:08:34 sessmgr 10/0/19098 12.2(41915) PLB63162258/PLB422124432
4 2012-Sep-12+23:40:05 sessmgr 16/0/03782 12.2(41915) PLB63124558/SAD125125663
5 2014-Apr-11+18:02:52 sessmgr 05/0/23697 15.0(53417) PLB66123451/PLB328143264
Total Crashes : 37
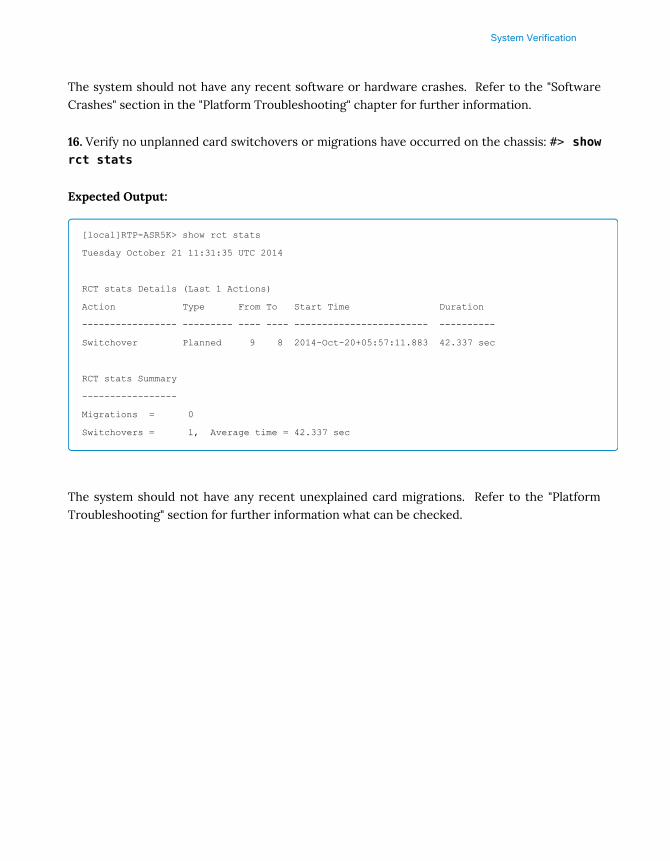
System Verification
The system should not have any recent software or hardware crashes. Refer to the "SoftwareCrashes" section in the "Platform Troubleshooting" chapter for further information.
16. Verify no unplanned card switchovers or migrations have occurred on the chassis: #> showrct stats
Expected Output:
[local]RTP-ASR5K> show rct stats
Tuesday October 21 11:31:35 UTC 2014
RCT stats Details (Last 1 Actions)
Action Type From To Start Time Duration
----------------- --------- ---- ---- ------------------------ ----------
Switchover Planned 9 8 2014-Oct-20+05:57:11.883 42.337 sec
RCT stats Summary
-----------------
Migrations = 0
Switchovers = 1, Average time = 42.337 sec
The system should not have any recent unexplained card migrations. Refer to the "PlatformTroubleshooting" section for further information what can be checked.

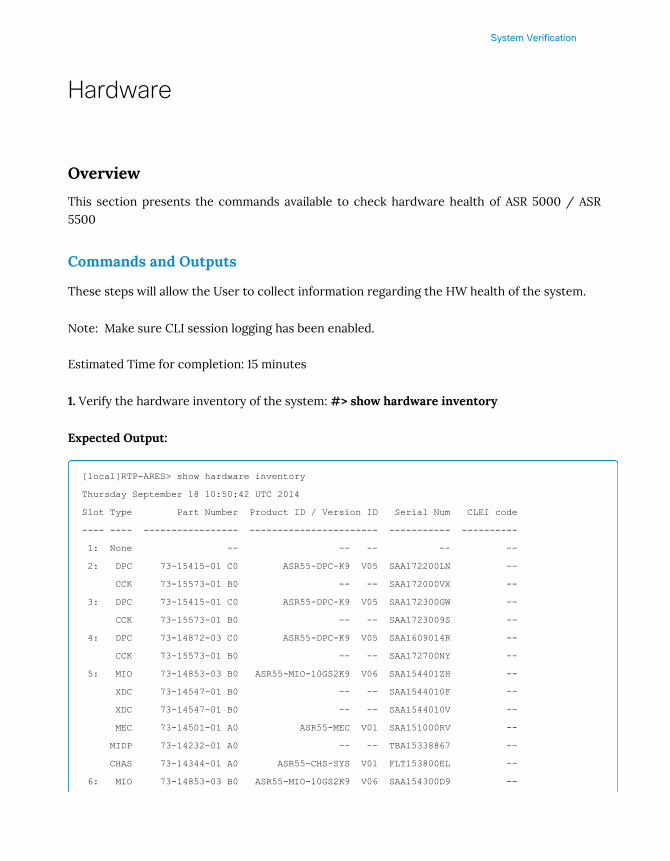
System Verification
Hardware
Overview
This section presents the commands available to check hardware health of ASR 5000 / ASR5500
Commands and Outputs
These steps will allow the User to collect information regarding the HW health of the system.
Note: Make sure CLI session logging has been enabled.
Estimated Time for completion: 15 minutes
1. Verify the hardware inventory of the system: #> show hardware inventory
Expected Output:
[local]RTP-ARES> show hardware inventory
Thursday September 18 10:50:42 UTC 2014
Slot Type Part Number Product ID / Version ID Serial Num CLEI code
---- ---- ----------------- ----------------------- ----------- ----------
1: None -- -- -- -- --
2: DPC 73-15415-01 C0 ASR55-DPC-K9 V05 SAA172200LN --
CCK 73-15573-01 B0 -- -- SAA172000VX --
3: DPC 73-15415-01 C0 ASR55-DPC-K9 V05 SAA172300GW --
CCK 73-15573-01 B0 -- -- SAA1723009S --
4: DPC 73-14872-03 C0 ASR55-DPC-K9 V05 SAA1609014R --
CCK 73-15573-01 B0 -- -- SAA172700NY --
5: MIO 73-14853-03 B0 ASR55-MIO-10GS2K9 V06 SAA154401ZH --
XDC 73-14547-01 B0 -- -- SAA1544010F --
XDC 73-14547-01 B0 -- -- SAA1544010V --
MEC 73-14501-01 A0 ASR55-MEC V01 SAA151000RV --
MIDP 73-14232-01 A0 -- -- TBA15338867 --
CHAS 73-14344-01 A0 ASR55-CHS-SYS V01 FLT153800EL --
6: MIO 73-14853-03 B0 ASR55-MIO-10GS2K9 V06 SAA154300D9 --

System Verification
XDC 73-14547-01 B0 -- -- SAA15440115 --
XDC 73-14547-01 B0 -- -- SAA15440109 --
MEC 73-14501-01 A0 ASR55-MEC V01 SAA151000RV --
MIDP 73-14232-01 A0 -- -- TBA15338867 --
CHAS 73-14344-01 A0 ASR55-CHS-SYS V01 FLA153800EL --
7: DPC 73-15415-01 C0 ASR55-DPC-K9 V05 SAA173300FF --
CCK 73-15573-01 B0 -- -- SAA1733005K --
8: DPC 73-14872-03 C0 ASR55-DPC-K9 V05 SAA155102SS --
CCK 73-15573-01 B0 -- -- KLL1735000M --
9: None -- -- -- -- --
10: None -- -- -- -- --
11: SSC 73-14235-01 B0 ASR55-SSC V01 SAA154102EX --
12: SSC 73-14235-01 B0 ASR55-SSC V01 PAL154102EZ --
13: None -- -- -- -- --
14: FSC 73-14236-01 B0 ASR55-FSC V01 KNL154103J8 --
15: FSC 73-14236-01 B0 ASR55-FSC V01 SAA154103H2 --
16: FSC 73-14236-01 B0 ASR55-FSC V01 SAA15400083 --
17: FSC 73-14236-01 B0 ASR55-FSC V01 SAA1540008B --
..
Fan Tray Part Number Product ID / Version ID Serial Num CLEI code
----------- ----------------- ----------------------- ----------- ----------
Lower Rear 73-14279-01 A0 ASR55-FANT-R V01 FLM1542000D --
Lower Front 73-14278-01 A0 ASR55-FANT-F V01 FLM1542000M --
Upper Rear 73-14279-01 A0 ASR55-FANT-R V01 FLM15420002 --
Upper Front 73-14278-01 A0 ASR55-FANT-F V01 FLM1542000R --
This command is used to get a listing of all hardware types, Part Numbers and Serial Numbersof the cards populated in the chassis.
2. Verify the status of cards in the system:
• ASR 5000: #> show card table all• ASR 5500:#> show card table

System Verification
Expected Output:
ASR 5000:
[local]RTP-ASR5K> show card table all
Wednesday September 17 22:30:24 UTC 2014
Slot Card Type Oper State SPOF Attach
----------- -------------------------------------- ------------- ---- ------
1: PSC None - - - -
2: PSC Packet Services Card 2 Active No 18 -
..
8: SMC System Management Card Active No 24 25
9: SMC System Management Card Standby No - -
..
17: LC None - - -
18: LC 1000 Ethernet Line Card Active Yes 2
19: LC 10 Gig Ethernet Line Card Active Yes 3
..
24: SPIO Switch Processor I/O Card Active No 8
25: SPIO Switch Processor I/O Card Standby - 8
26: LC None - - -..
40: RCC Redundancy Crossbar Card Active No
41: RCC Redundancy Crossbar Card Active No
..
48: LC None - - -
ASR 5500:
[local]RTP-ARES# show card table
Wednesday September 17 21:21:14 UTC 2014
Slot Card Type Oper State SPOF Attach
----------- -------------------------------------- ------------- ---- ------
1: DPC None - -
2: DPC Data Processing Card Active No
3: DPC Data Processing Card Active No
4: DPC Data Processing Card Active No
5: MMIO Management & 20x10Gb I/O Card Active No
6: MMIO Management & 20x10Gb I/O Card Standby -

System Verification
7: DPC Data Processing Card Active No
8: DPC Data Processing Card Standby -
9: DPC None - -
10: DPC None - -
11: SSC System Status Card Active No
12: SSC System Status Card Active No
13: FSC None - -
14: FSC Fabric & 2x200GB Storage Card Active No
15: FSC Fabric & 2x200GB Storage Card Active No
16: FSC Fabric & 2x200GB Storage Card Active No
17: FSC Fabric & 2x200GB Storage Card Active No
18: FSC None - -
All cards should either be in an “Active” or “Standby” state. The SPOF column should nothave any value other than “No” or a “-“.
“Oper State” displays the operational state of the card. The possible operational states are:
• Active: Indicates that the card is an active component and is providing services.
• Standby: Indicates that the card is a redundant component. Redundant componentswill become active through manual configuration or automatically should a failureoccur.
• Offline: Indicates that the card is installed but is not ready to process subscriber datasessions. This could be due to the fact that it is not completely installed (such as, thecard interlock switch is not locked). Refer to the Installation Guide for additionalinformation.
“SPOF” displays whether or not the component is a single point of failure (SPOF) in the system. Ifthe component is a SPOF, then a "Yes" will appear in this column. If not, a "No" will be displayed.
The only exception to this rule are XGLC cards that perform Layer 3 Active/Active redudancy,which could trigger SPOF only for these type of cards because a card pair might not be in theproper slots that are predefined for default hardware redundacy (for example, for HW redun-dancy Active/Standby, two XGLC in slots 17 and 18 are needed, but if Layer 3 Active/Active re-dundancy is used, XGLC cards can exist in any slots between 17-23 to 26-32 but they will triggerSPOF in that case).
Escalate to Cisco when any card is in an unexpected state.
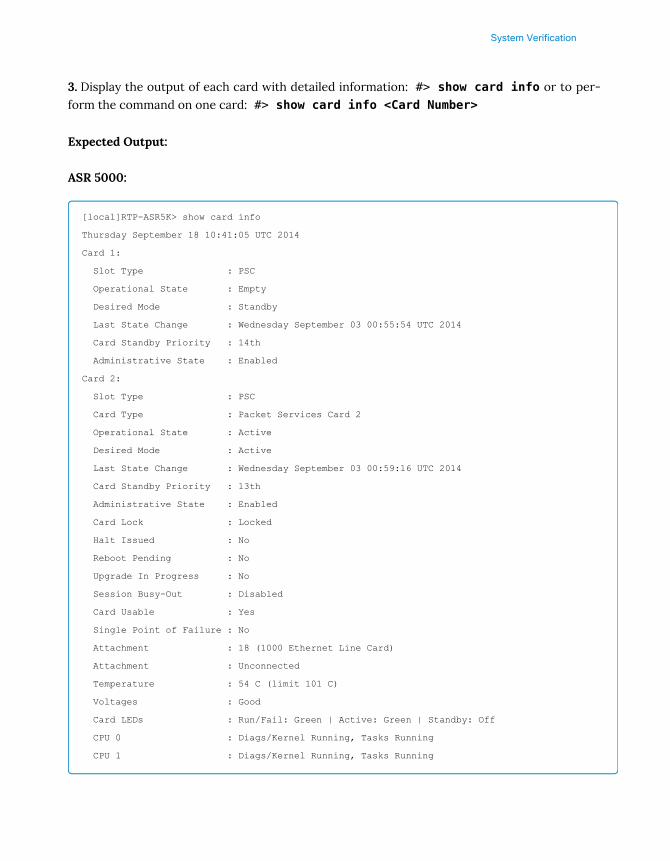
System Verification
3. Display the output of each card with detailed information: #> show card info or to per-form the command on one card: #> show card info <Card Number>
Expected Output:
ASR 5000:
[local]RTP-ASR5K> show card info
Thursday September 18 10:41:05 UTC 2014
Card 1:
Slot Type : PSC
Operational State : Empty
Desired Mode : Standby
Last State Change : Wednesday September 03 00:55:54 UTC 2014
Card Standby Priority : 14th
Administrative State : Enabled
Card 2:
Slot Type : PSC
Card Type : Packet Services Card 2
Operational State : Active
Desired Mode : Active
Last State Change : Wednesday September 03 00:59:16 UTC 2014
Card Standby Priority : 13th
Administrative State : Enabled
Card Lock : Locked
Halt Issued : No
Reboot Pending : No
Upgrade In Progress : No
Session Busy-Out : Disabled
Card Usable : Yes
Single Point of Failure : No
Attachment : 18 (1000 Ethernet Line Card)
Attachment : Unconnected
Temperature : 54 C (limit 101 C)
Voltages : Good
Card LEDs : Run/Fail: Green | Active: Green | Standby: Off
CPU 0 : Diags/Kernel Running, Tasks Running
CPU 1 : Diags/Kernel Running, Tasks Running
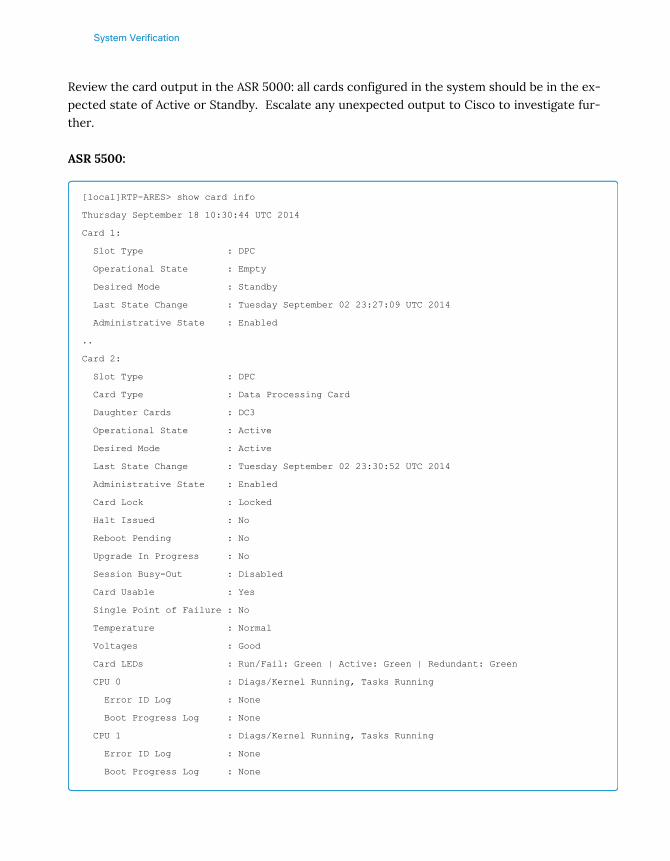
System Verification
Review the card output in the ASR 5000: all cards configured in the system should be in the ex-pected state of Active or Standby. Escalate any unexpected output to Cisco to investigate fur-ther.
ASR 5500:
[local]RTP-ARES> show card info
Thursday September 18 10:30:44 UTC 2014
Card 1:
Slot Type : DPC
Operational State : Empty
Desired Mode : Standby
Last State Change : Tuesday September 02 23:27:09 UTC 2014
Administrative State : Enabled
..
Card 2:
Slot Type : DPC
Card Type : Data Processing Card
Daughter Cards : DC3
Operational State : Active
Desired Mode : Active
Last State Change : Tuesday September 02 23:30:52 UTC 2014
Administrative State : Enabled
Card Lock : Locked
Halt Issued : No
Reboot Pending : No
Upgrade In Progress : No
Session Busy-Out : Disabled
Card Usable : Yes
Single Point of Failure : No
Temperature : Normal
Voltages : Good
Card LEDs : Run/Fail: Green | Active: Green | Redundant: Green
CPU 0 : Diags/Kernel Running, Tasks Running
Error ID Log : None
Boot Progress Log : None
CPU 1 : Diags/Kernel Running, Tasks Running
Error ID Log : None
Boot Progress Log : None
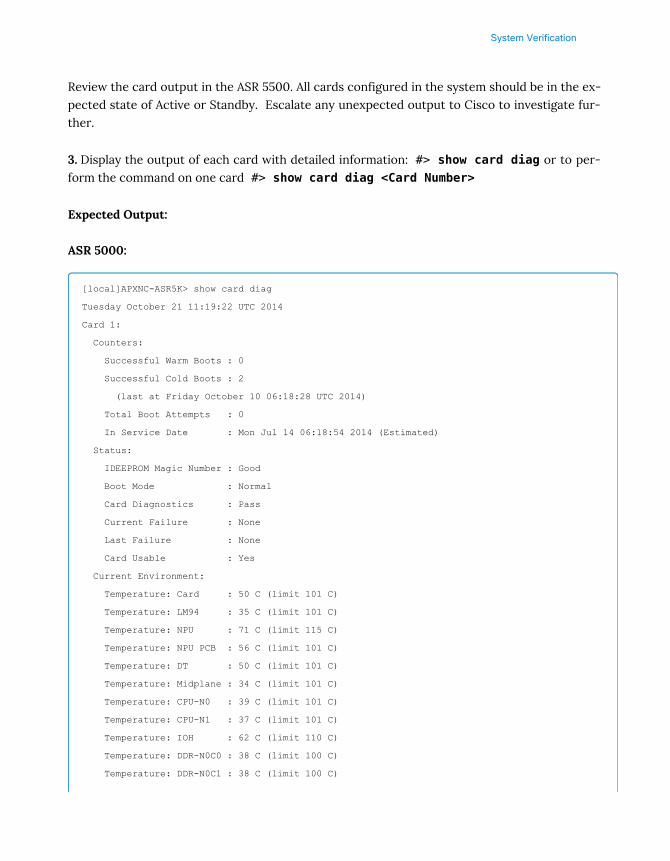
System Verification
Review the card output in the ASR 5500. All cards configured in the system should be in the ex-pected state of Active or Standby. Escalate any unexpected output to Cisco to investigate fur-ther.
3. Display the output of each card with detailed information: #> show card diag or to per-form the command on one card #> show card diag <Card Number>
Expected Output:
ASR 5000:
[local]APXNC-ASR5K> show card diag
Tuesday October 21 11:19:22 UTC 2014
Card 1:
Counters:
Successful Warm Boots : 0
Successful Cold Boots : 2
(last at Friday October 10 06:18:28 UTC 2014)
Total Boot Attempts : 0
In Service Date : Mon Jul 14 06:18:54 2014 (Estimated)
Status:
IDEEPROM Magic Number : Good
Boot Mode : Normal
Card Diagnostics : Pass
Current Failure : None
Last Failure : None
Card Usable : Yes
Current Environment:
Temperature: Card : 50 C (limit 101 C)
Temperature: LM94 : 35 C (limit 101 C)
Temperature: NPU : 71 C (limit 115 C)
Temperature: NPU PCB : 56 C (limit 101 C)
Temperature: DT : 50 C (limit 101 C)
Temperature: Midplane : 34 C (limit 101 C)
Temperature: CPU-N0 : 39 C (limit 101 C)
Temperature: CPU-N1 : 37 C (limit 101 C)
Temperature: IOH : 62 C (limit 110 C)
Temperature: DDR-N0C0 : 38 C (limit 100 C)
Temperature: DDR-N0C1 : 38 C (limit 100 C)
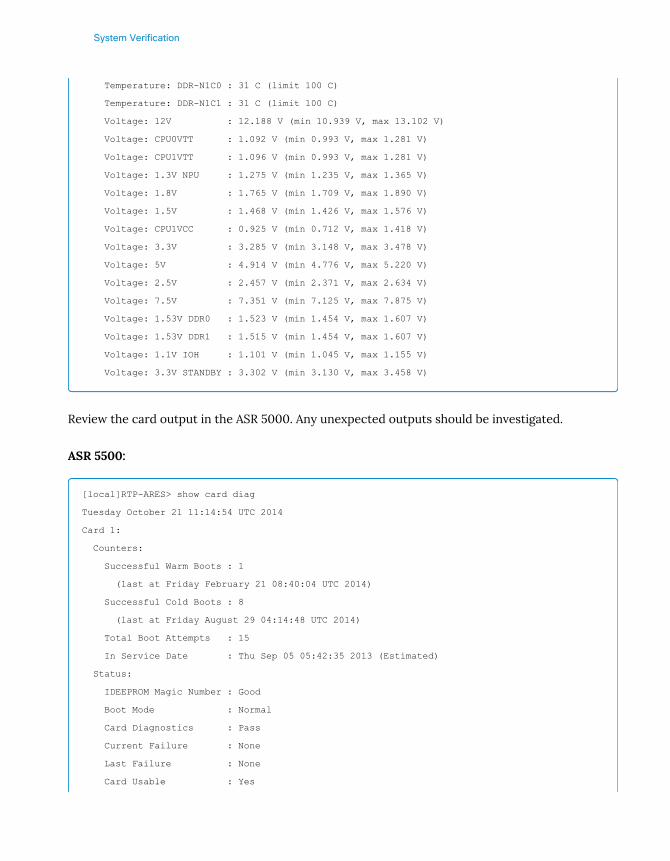
System Verification
Temperature: DDR-N1C0 : 31 C (limit 100 C)
Temperature: DDR-N1C1 : 31 C (limit 100 C)
Voltage: 12V : 12.188 V (min 10.939 V, max 13.102 V)
Voltage: CPU0VTT : 1.092 V (min 0.993 V, max 1.281 V)
Voltage: CPU1VTT : 1.096 V (min 0.993 V, max 1.281 V)
Voltage: 1.3V NPU : 1.275 V (min 1.235 V, max 1.365 V)
Voltage: 1.8V : 1.765 V (min 1.709 V, max 1.890 V)
Voltage: 1.5V : 1.468 V (min 1.426 V, max 1.576 V)
Voltage: CPU1VCC : 0.925 V (min 0.712 V, max 1.418 V)
Voltage: 3.3V : 3.285 V (min 3.148 V, max 3.478 V)
Voltage: 5V : 4.914 V (min 4.776 V, max 5.220 V)
Voltage: 2.5V : 2.457 V (min 2.371 V, max 2.634 V)
Voltage: 7.5V : 7.351 V (min 7.125 V, max 7.875 V)
Voltage: 1.53V DDR0 : 1.523 V (min 1.454 V, max 1.607 V)
Voltage: 1.53V DDR1 : 1.515 V (min 1.454 V, max 1.607 V)
Voltage: 1.1V IOH : 1.101 V (min 1.045 V, max 1.155 V)
Voltage: 3.3V STANDBY : 3.302 V (min 3.130 V, max 3.458 V)
Review the card output in the ASR 5000. Any unexpected outputs should be investigated.
ASR 5500:
[local]RTP-ARES> show card diag
Tuesday October 21 11:14:54 UTC 2014
Card 1:
Counters:
Successful Warm Boots : 1
(last at Friday February 21 08:40:04 UTC 2014)
Successful Cold Boots : 8
(last at Friday August 29 04:14:48 UTC 2014)
Total Boot Attempts : 15
In Service Date : Thu Sep 05 05:42:35 2013 (Estimated)
Status:
IDEEPROM Magic Number : Good
Boot Mode : Normal
Card Diagnostics : Pass
Current Failure : None
Last Failure : None
Card Usable : Yes
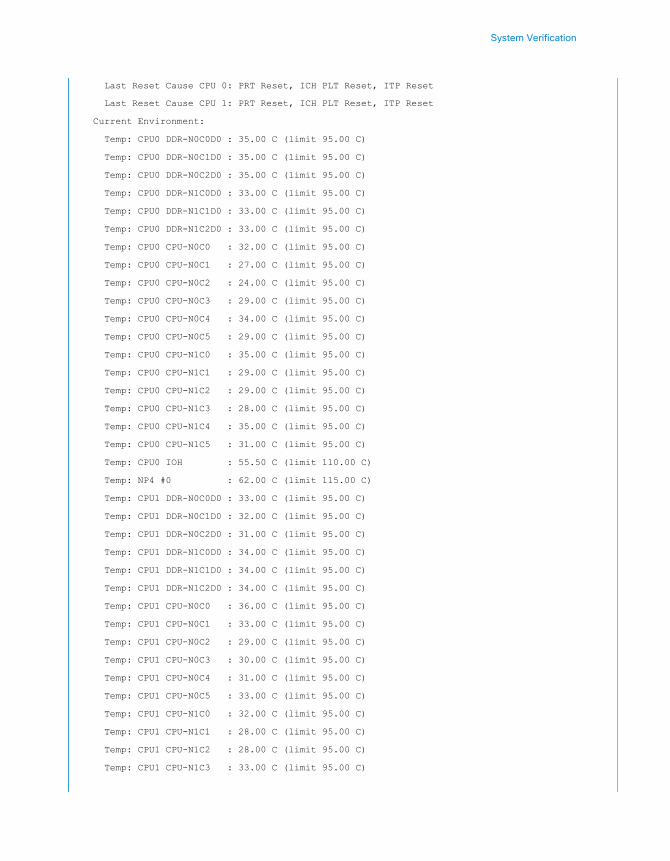
System Verification
Last Reset Cause CPU 0: PRT Reset, ICH PLT Reset, ITP Reset
Last Reset Cause CPU 1: PRT Reset, ICH PLT Reset, ITP Reset
Current Environment:
Temp: CPU0 DDR-N0C0D0 : 35.00 C (limit 95.00 C)
Temp: CPU0 DDR-N0C1D0 : 35.00 C (limit 95.00 C)
Temp: CPU0 DDR-N0C2D0 : 35.00 C (limit 95.00 C)
Temp: CPU0 DDR-N1C0D0 : 33.00 C (limit 95.00 C)
Temp: CPU0 DDR-N1C1D0 : 33.00 C (limit 95.00 C)
Temp: CPU0 DDR-N1C2D0 : 33.00 C (limit 95.00 C)
Temp: CPU0 CPU-N0C0 : 32.00 C (limit 95.00 C)
Temp: CPU0 CPU-N0C1 : 27.00 C (limit 95.00 C)
Temp: CPU0 CPU-N0C2 : 24.00 C (limit 95.00 C)
Temp: CPU0 CPU-N0C3 : 29.00 C (limit 95.00 C)
Temp: CPU0 CPU-N0C4 : 34.00 C (limit 95.00 C)
Temp: CPU0 CPU-N0C5 : 29.00 C (limit 95.00 C)
Temp: CPU0 CPU-N1C0 : 35.00 C (limit 95.00 C)
Temp: CPU0 CPU-N1C1 : 29.00 C (limit 95.00 C)
Temp: CPU0 CPU-N1C2 : 29.00 C (limit 95.00 C)
Temp: CPU0 CPU-N1C3 : 28.00 C (limit 95.00 C)
Temp: CPU0 CPU-N1C4 : 35.00 C (limit 95.00 C)
Temp: CPU0 CPU-N1C5 : 31.00 C (limit 95.00 C)
Temp: CPU0 IOH : 55.50 C (limit 110.00 C)
Temp: NP4 #0 : 62.00 C (limit 115.00 C)
Temp: CPU1 DDR-N0C0D0 : 33.00 C (limit 95.00 C)
Temp: CPU1 DDR-N0C1D0 : 32.00 C (limit 95.00 C)
Temp: CPU1 DDR-N0C2D0 : 31.00 C (limit 95.00 C)
Temp: CPU1 DDR-N1C0D0 : 34.00 C (limit 95.00 C)
Temp: CPU1 DDR-N1C1D0 : 34.00 C (limit 95.00 C)
Temp: CPU1 DDR-N1C2D0 : 34.00 C (limit 95.00 C)
Temp: CPU1 CPU-N0C0 : 36.00 C (limit 95.00 C)
Temp: CPU1 CPU-N0C1 : 33.00 C (limit 95.00 C)
Temp: CPU1 CPU-N0C2 : 29.00 C (limit 95.00 C)
Temp: CPU1 CPU-N0C3 : 30.00 C (limit 95.00 C)
Temp: CPU1 CPU-N0C4 : 31.00 C (limit 95.00 C)
Temp: CPU1 CPU-N0C5 : 33.00 C (limit 95.00 C)
Temp: CPU1 CPU-N1C0 : 32.00 C (limit 95.00 C)
Temp: CPU1 CPU-N1C1 : 28.00 C (limit 95.00 C)
Temp: CPU1 CPU-N1C2 : 28.00 C (limit 95.00 C)
Temp: CPU1 CPU-N1C3 : 33.00 C (limit 95.00 C)

System Verification
Temp: CPU1 CPU-N1C4 : 31.00 C (limit 95.00 C)
Temp: CPU1 CPU-N1C5 : 32.00 C (limit 95.00 C)
Temp: CPU1 IOH : 59.00 C (limit 110.00 C)
Temp: NP4 #1 : 57.00 C (limit 115.00 C)
Temp: LM94 D0 : 35.50 C
Temp: LM94 D1 : 34.50 C
Temp: Petra0 : 56.00 C (limit 100.00 C)
Temp: Petra1 : 53.00 C (limit 100.00 C)
Temp: Upper-right : 45.00 C (limit 95.00 C)
Temp: DDF1 : 60.00 C (limit 85.00 C)
Temp: DDF2 : 55.00 C (limit 85.00 C)
Temp: Mid-left : 41.00 C (limit 95.00 C)
Temp: Center : 46.00 C (limit 85.00 C)
Temp: Top Center : 54.00 C (limit 95.00 C)
Temp: F600 #1 : 39.86 C
Temp: F600 #2 : 29.45 C
Voltage: 12V-A : 12.035 V
Voltage: 1.0V NPU1 : 1.052 V (min 0.950 V, max 1.102 V)
Voltage: 0.9V DDF1 : 0.893 V (min 0.855 V, max 0.945 V)
Voltage: 1.8V : 1.790 V (min 1.700 V, max 1.900 V)
Voltage: CPU0/0 1.53V : 1.366 V (min 1.282 V, max 1.606 V)
Voltage: CPU0/1 1.53V : 1.366 V (min 1.282 V, max 1.606 V)
Voltage: CPU0/0 VCC : 0.906 V (min 0.712 V, max 1.417 V)
Voltage: CPU0/1 VCC : 0.943 V (min 0.712 V, max 1.417 V)
Voltage: 3.3V : 3.283 V (min 3.140 V, max 3.470 V)
Voltage: 5V : 4.999 V (min 4.750 V, max 5.250 V)
Voltage: 2.5V : 2.473 V (min 2.380 V, max 2.630 V)
Voltage: 1.5V : 1.476 V (min 1.430 V, max 1.580 V)
Voltage: CPU0/0 VTT : 1.085 V (min 0.992 V, max 1.281 V)
Voltage: CPU0/1 VTT : 1.085 V (min 0.992 V, max 1.281 V)
Voltage: CPU0 1.1V IO : 1.101 V (min 1.045 V, max 1.155 V)
Voltage: 3.3V Stdby : 3.319 V (min 2.970 V, max 3.630 V)
Voltage: 12V-B : 12.097 V
Voltage: 1.05V Petra : 1.048 V (min 0.997 V, max 1.102 V)
Voltage: 1.0V CC : 1.009 V (min 0.950 V, max 1.050 V)
Voltage: 1.2V : 1.193 V (min 1.140 V, max 1.260 V)
Voltage: CPU1/0 1.53V : 1.366 V (min 1.282 V, max 1.606 V)
Voltage: CPU1/0 1.53V : 1.366 V (min 1.282 V, max 1.606 V)
Voltage: CPU1/0 VCC : 0.918 V (min 0.712 V, max 1.417 V)

System Verification
Voltage: CPU1/1 VCC : 0.993 V (min 0.712 V, max 1.417 V)
Voltage: 7.5V : 7.579 V (min 7.130 V, max 7.880 V)
Voltage: 5V : 4.921 V (min 4.750 V, max 5.250 V)
Voltage: 12V-C : 11.812 V
Voltage: 1.5V Petra : 1.476 V (min 1.430 V, max 1.580 V)
Voltage: CPU1/0 VTT : 1.085 V (min 0.992 V, max 1.281 V)
Voltage: CPU1/1 VTT : 1.085 V (min 0.992 V, max 1.281 V)
Voltage: CPU1 1.1V IO : 1.096 V (min 1.045 V, max 1.155 V)
Voltage: 3.3V Stdby : 3.336 V (min 2.970 V, max 3.630 V)
Voltage: 48V-A : 50.150 V
Voltage: 48V-B : 51.150 V
Current: 48V-A : 3.82 A
Current: 48V-B : 5.26 A
Airflow: Middle Right : 293 FPM
Airflow: Middle Left : 254 FPM
Review the card output in the ASR 5500. Any unexpected outputs should be investigated.
4. Verify the status of all card programmables: #> show card hardware
Expected Output:
ASR 5000:
[local]RTP-ASR5K> show card hardware
Thursday May 07 18:34:38 UTC 2015
Card 2:
Card Type : Packet Services Card 2 (R02)
Description : PSC2
Starent Part Number : 530-60-1055 04
Starent Serial Num : PLB40101
Starent CLEI Code : CRCCACUDAA Switch Fabric Modes : control plane, switch fabric
Card Programmables : up to date
NPU Microcode : running 1.0
Slave SCB : on-card 1.6
PSR2 : on-card 0
BIOS : on-card-a 1.1.10, on-card-b 0.2.0
DT2 FPGA : running 3.27

System Verification
CPU 0 Type/Memory : Socket 0: Xeon L5518 D0, 2130 MHz
: Socket 1: Xeon L5518 D0, 2130 MHz
: Chipset: 5520-IOH B3, ICH10R A0, 32 GB
CPU 0 DIMM-N0D0 P/N : 36JCZS1G72PY-1G1A
CPU 0 DIMM-N0D1 P/N : 36JCZS1G72PY-1G1A
CPU 0 DIMM-N1D0 P/N : 36JCZS1G72PY-1G1A
CPU 0 DIMM-N1D1 P/N : 36JCZS1G72PY-1G1A
CPU 1 Type/Memory : IXP2855 A0, 1500 Mhz, 1536 MB
CPU 0 CFE/Diags : on-card 2.2.3, running 130.2.9
ASR 5500:
[local]SLK-ARES> show card hardware
Thursday May 07 18:37:30 UTC 2015
Card 2:
Card Type : Data Processing Card (R02)
Description : DPC
Cisco Part Number : 73-15415-01 C0
UDI Serial Number : SAD100897LN
UDI Product ID : ASR55-DPC-K9
UDI Version ID : V05
UDI Top Assem Num : 68-4945-01 C0
Daughter Card #3:
Card Type : DPC CCK Daughter Card (R02)
Description : DPC_CRYPTO_DC
Cisco Part Number : 73-15573-01 B0
UDI Serial Number : SAD100897LN
Card Programmables : up to date
BCF : on-card 0.2.7
CAF : on-card 0.0.56
CPU 0 Type/Memory : Socket 0: Xeon L5638 B1, 2000 MHz
: Socket 1: Xeon L5638 B1, 2000 MHz
: Chipset: 5520-IOH C2, ICH10R A0, 96 GB
CPU 0 DIMM-N0C0D0 P/N : M392B2G70BM0-YH9
CPU 0 DIMM-N0C1D0 P/N : M392B2G70BM0-YH9
CPU 0 DIMM-N0C2D0 P/N : M392B2G70BM0-YH9
CPU 0 DIMM-N1C0D0 P/N : M392B2G70BM0-YH9
CPU 0 DIMM-N1C1D0 P/N : M392B2G70BM0-YH9
CPU 0 DIMM-N1C2D0 P/N : M392B2G70BM0-YH9
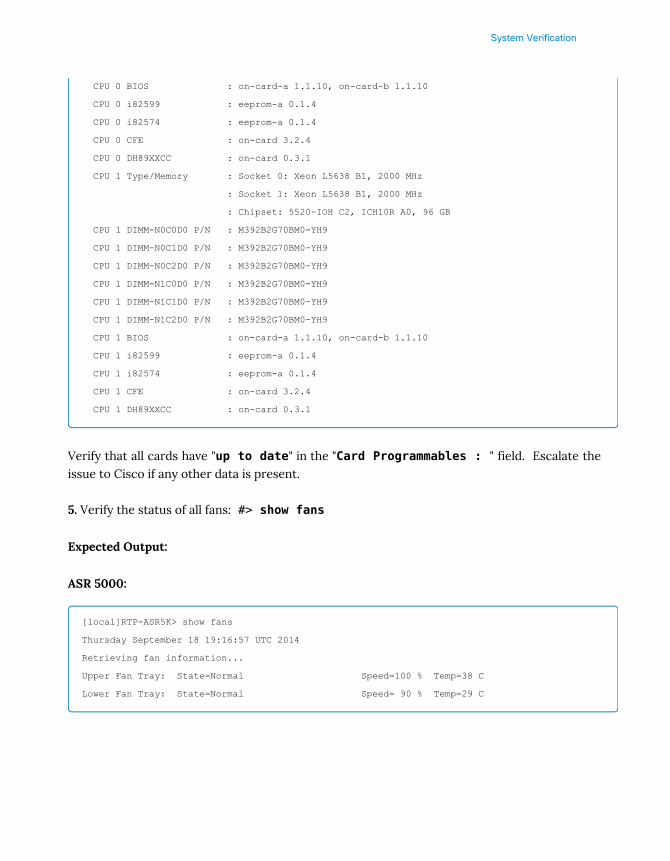
System Verification
CPU 0 BIOS : on-card-a 1.1.10, on-card-b 1.1.10
CPU 0 i82599 : eeprom-a 0.1.4
CPU 0 i82574 : eeprom-a 0.1.4
CPU 0 CFE : on-card 3.2.4
CPU 0 DH89XXCC : on-card 0.3.1
CPU 1 Type/Memory : Socket 0: Xeon L5638 B1, 2000 MHz
: Socket 1: Xeon L5638 B1, 2000 MHz
: Chipset: 5520-IOH C2, ICH10R A0, 96 GB
CPU 1 DIMM-N0C0D0 P/N : M392B2G70BM0-YH9
CPU 1 DIMM-N0C1D0 P/N : M392B2G70BM0-YH9
CPU 1 DIMM-N0C2D0 P/N : M392B2G70BM0-YH9
CPU 1 DIMM-N1C0D0 P/N : M392B2G70BM0-YH9
CPU 1 DIMM-N1C1D0 P/N : M392B2G70BM0-YH9
CPU 1 DIMM-N1C2D0 P/N : M392B2G70BM0-YH9
CPU 1 BIOS : on-card-a 1.1.10, on-card-b 1.1.10
CPU 1 i82599 : eeprom-a 0.1.4
CPU 1 i82574 : eeprom-a 0.1.4
CPU 1 CFE : on-card 3.2.4
CPU 1 DH89XXCC : on-card 0.3.1
Verify that all cards have "up to date" in the "Card Programmables : " field. Escalate theissue to Cisco if any other data is present.
5. Verify the status of all fans: #> show fans
Expected Output:
ASR 5000:
[local]RTP-ASR5K> show fans
Thursday September 18 19:16:57 UTC 2014
Retrieving fan information...
Upper Fan Tray: State=Normal Speed=100 % Temp=38 C
Lower Fan Tray: State=Normal Speed= 90 % Temp=29 C

System Verification
ASR 5500:
[local]RTP-ARES> show fans
Thursday September 18 19:16:27 UTC 2014
Lower Rear Fan Tray:
State: Normal
Speed: 50%
Temperature: 29C
Upper Rear Fan Tray:
State: Normal
Speed: 50%
Temperature: 37C
Lower Front Fan Tray:
State: Normal
Speed: 75%
Temperature: 27C
Upper Front Fan Tray:
State: Normal
Speed: 75%
Temperature: 35C
Verify the state of the fans are normal and the temperature is within normal operating range. The “verbose” parameter can be added to the command for additional details.
6. Verify the temperature of the chassis: #> show temperature
Expected Output:
ASR 5000:
[local]RTP-ASR5K> show temperature
Thursday September 18 19:25:14 UTC 2014
Card 2: 54 C (limit 101 C)
Card 3: 53 C (limit 101 C)
Card 4: 50 C (limit 101 C)
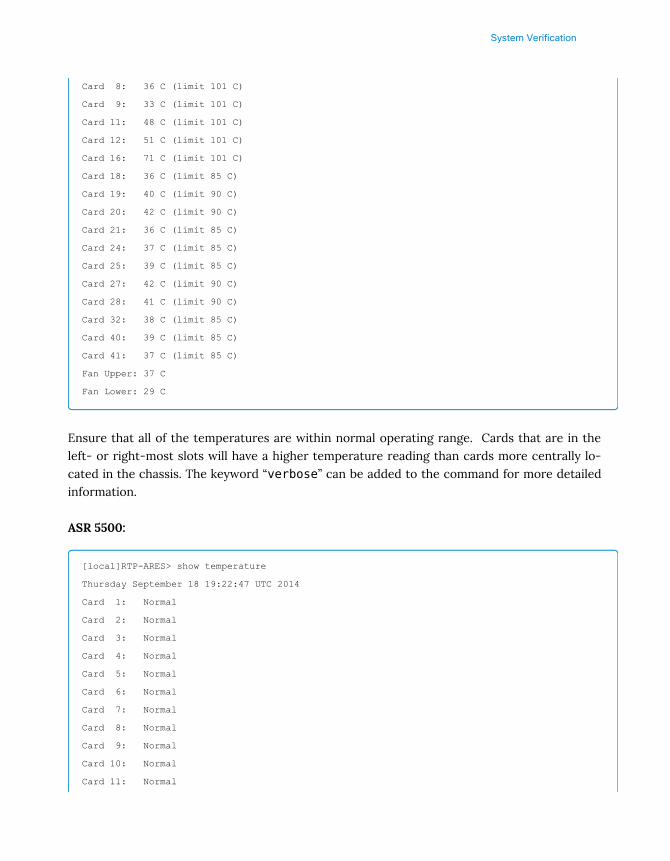
System Verification
Card 8: 36 C (limit 101 C)
Card 9: 33 C (limit 101 C)
Card 11: 48 C (limit 101 C)
Card 12: 51 C (limit 101 C)
Card 16: 71 C (limit 101 C)
Card 18: 36 C (limit 85 C)
Card 19: 40 C (limit 90 C)
Card 20: 42 C (limit 90 C)
Card 21: 36 C (limit 85 C)
Card 24: 37 C (limit 85 C)
Card 25: 39 C (limit 85 C)
Card 27: 42 C (limit 90 C)
Card 28: 41 C (limit 90 C)
Card 32: 38 C (limit 85 C)
Card 40: 39 C (limit 85 C)
Card 41: 37 C (limit 85 C)
Fan Upper: 37 C
Fan Lower: 29 C
Ensure that all of the temperatures are within normal operating range. Cards that are in theleft- or right-most slots will have a higher temperature reading than cards more centrally lo-cated in the chassis. The keyword “verbose” can be added to the command for more detailedinformation.
ASR 5500:
[local]RTP-ARES> show temperature
Thursday September 18 19:22:47 UTC 2014
Card 1: Normal
Card 2: Normal
Card 3: Normal
Card 4: Normal
Card 5: Normal
Card 6: Normal
Card 7: Normal
Card 8: Normal
Card 9: Normal
Card 10: Normal
Card 11: Normal
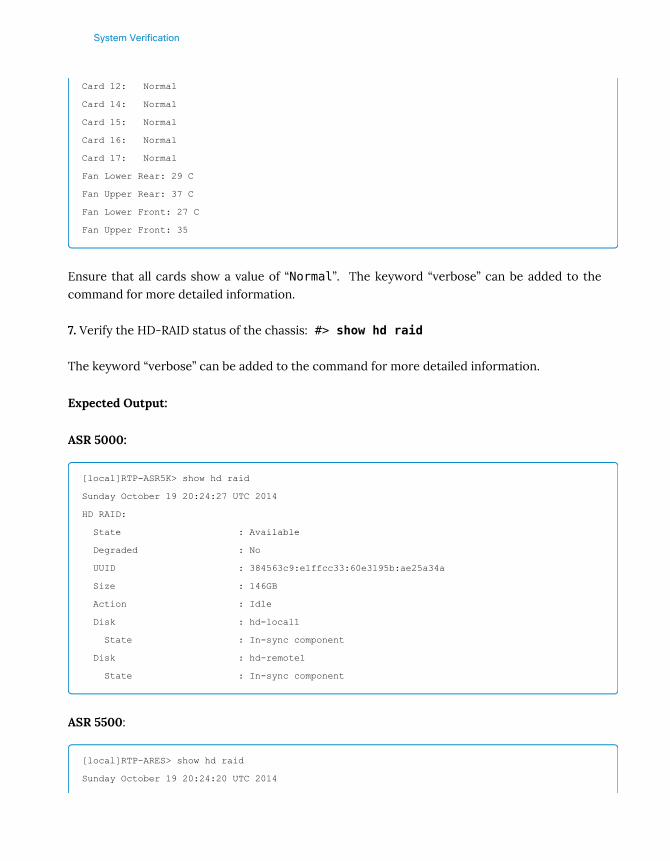
System Verification
Card 12: Normal
Card 14: Normal
Card 15: Normal
Card 16: Normal
Card 17: Normal
Fan Lower Rear: 29 C
Fan Upper Rear: 37 C
Fan Lower Front: 27 C
Fan Upper Front: 35
Ensure that all cards show a value of “Normal”. The keyword “verbose” can be added to thecommand for more detailed information.
7. Verify the HD-RAID status of the chassis: #> show hd raid
The keyword “verbose” can be added to the command for more detailed information.
Expected Output:
ASR 5000:
[local]RTP-ASR5K> show hd raid
Sunday October 19 20:24:27 UTC 2014
HD RAID:
State : Available
Degraded : No
UUID : 384563c9:e1ffcc33:60e3195b:ae25a34a
Size : 146GB
Action : Idle
Disk : hd-local1
State : In-sync component
Disk : hd-remote1
State : In-sync component
ASR 5500:
[local]RTP-ARES> show hd raid
Sunday October 19 20:24:20 UTC 2014
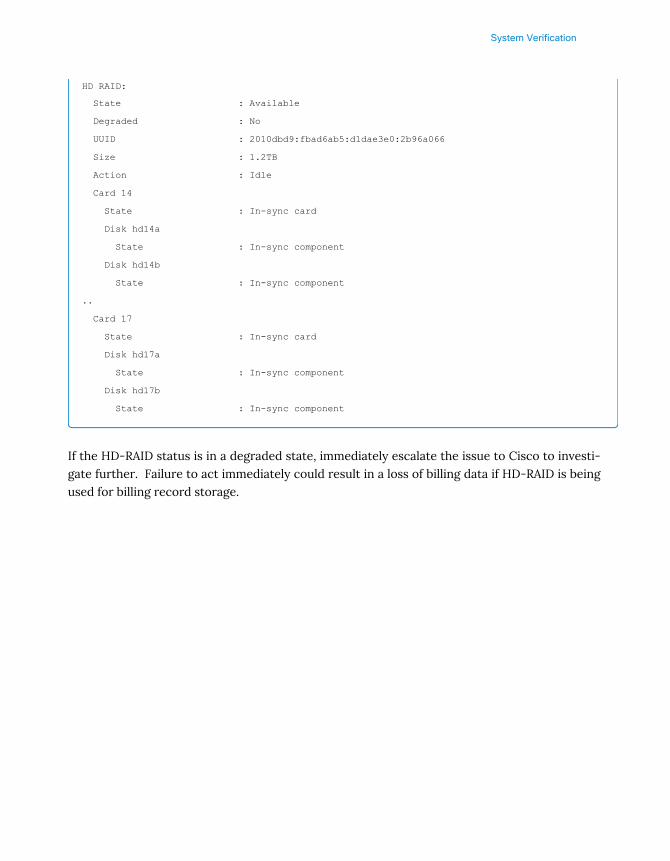
System Verification
HD RAID:
State : Available
Degraded : No
UUID : 2010dbd9:fbad6ab5:d1dae3e0:2b96a066
Size : 1.2TB
Action : Idle
Card 14
State : In-sync card
Disk hd14a
State : In-sync component
Disk hd14b
State : In-sync component
..
Card 17
State : In-sync card
Disk hd17a
State : In-sync component
Disk hd17b
State : In-sync component
If the HD-RAID status is in a degraded state, immediately escalate the issue to Cisco to investi-gate further. Failure to act immediately could result in a loss of billing data if HD-RAID is beingused for billing record storage.

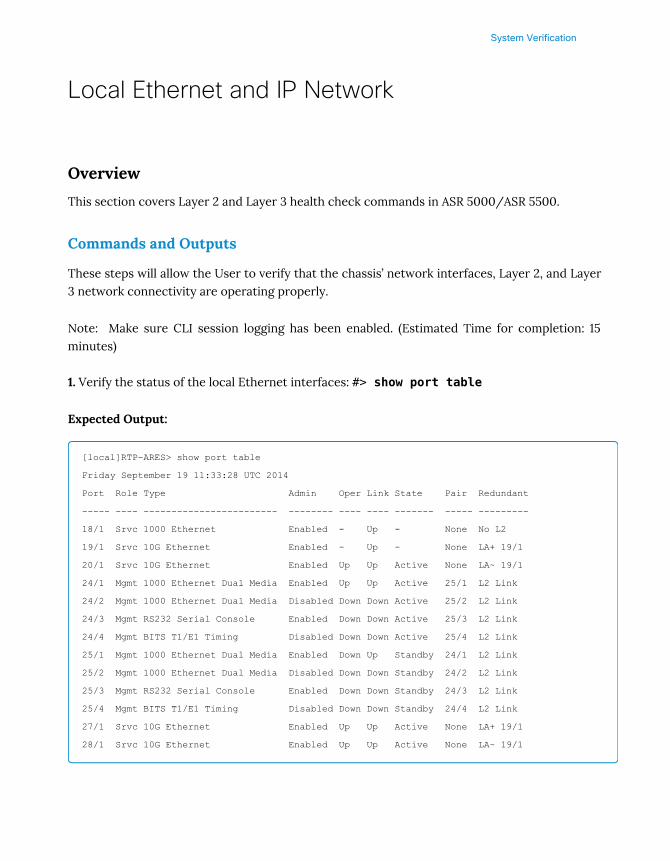
System Verification
Local Ethernet and IP Network
Overview
This section covers Layer 2 and Layer 3 health check commands in ASR 5000/ASR 5500.
Commands and Outputs
These steps will allow the User to verify that the chassis’ network interfaces, Layer 2, and Layer3 network connectivity are operating properly.
Note: Make sure CLI session logging has been enabled. (Estimated Time for completion: 15minutes)
1. Verify the status of the local Ethernet interfaces: #> show port table
Expected Output:
[local]RTP-ARES> show port table
Friday September 19 11:33:28 UTC 2014
Port Role Type Admin Oper Link State Pair Redundant
----- ---- ------------------------ -------- ---- ---- ------- ----- ---------
18/1 Srvc 1000 Ethernet Enabled - Up - None No L2
19/1 Srvc 10G Ethernet Enabled - Up - None LA+ 19/1
20/1 Srvc 10G Ethernet Enabled Up Up Active None LA~ 19/1
24/1 Mgmt 1000 Ethernet Dual Media Enabled Up Up Active 25/1 L2 Link
24/2 Mgmt 1000 Ethernet Dual Media Disabled Down Down Active 25/2 L2 Link
24/3 Mgmt RS232 Serial Console Enabled Down Down Active 25/3 L2 Link
24/4 Mgmt BITS T1/E1 Timing Disabled Down Down Active 25/4 L2 Link
25/1 Mgmt 1000 Ethernet Dual Media Enabled Down Up Standby 24/1 L2 Link
25/2 Mgmt 1000 Ethernet Dual Media Disabled Down Down Standby 24/2 L2 Link
25/3 Mgmt RS232 Serial Console Enabled Down Down Standby 24/3 L2 Link
25/4 Mgmt BITS T1/E1 Timing Disabled Down Down Standby 24/4 L2 Link
27/1 Srvc 10G Ethernet Enabled Up Up Active None LA+ 19/1
28/1 Srvc 10G Ethernet Enabled Up Up Active None LA~ 19/1

System Verification
If the implementation is using LACP (Link Aggregation Control Protocol), the LAG Ports willhave the following possible status:
+ means LAG distributing state, LAG is Active <Good>
~ means LAG agreed state, LAG is Standby <Good>
- means LAG not distributing state <Needs to be investigated>
* means LAG negotiated state <Needs to be investigated>
! means timeout <Needs to be investigated>
In the above output, verify the “Admin”, “Oper”, “Link” and “State” column. Ensure that all portsare in their expected state. If not, follow local procedures to troubleshoot the local network.
Refer to the "LAG Troubleshooting" section under "Platform Troubleshooting" for further instruc-tions on how to resolve.
If assistance is needed from Cisco, please open an SR.
2. This command reviews detailed information on individual ports: #> show port info<card/slot>
Expected Output:
[local]RTP-ARES> show port info 5/10
Sunday October 19 16:09:22 UTC 2014
Port: 5/10
Port Type : 10G Ethernet
Role : Service Port
Description : Ingress Line Card
Redundancy Mode : Port Mode
Framing Mode : Unspecified
Redundant With : 6/10
Preferred Port : Non-Revertive
Physical ifIndex : 84541440
Administrative State : Enabled
Configured Duplex : Auto
Configured Speed : Auto
Fault Unidirection Mode : 802_3ae clause 66
Local Fault : No
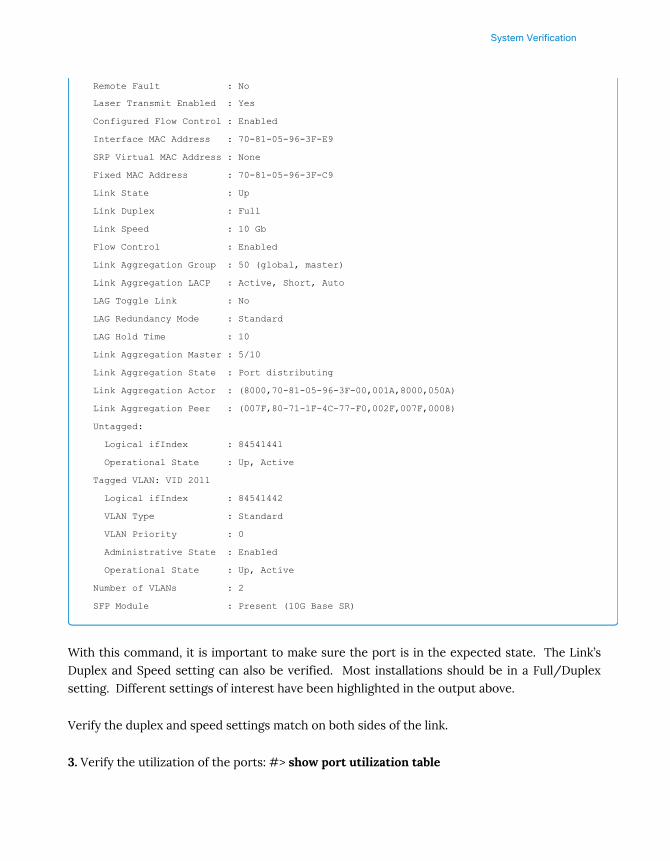
System Verification
Remote Fault : No
Laser Transmit Enabled : Yes
Configured Flow Control : Enabled
Interface MAC Address : 70-81-05-96-3F-E9
SRP Virtual MAC Address : None
Fixed MAC Address : 70-81-05-96-3F-C9
Link State : Up
Link Duplex : Full
Link Speed : 10 Gb
Flow Control : Enabled
Link Aggregation Group : 50 (global, master)
Link Aggregation LACP : Active, Short, Auto
LAG Toggle Link : No
LAG Redundancy Mode : Standard
LAG Hold Time : 10
Link Aggregation Master : 5/10
Link Aggregation State : Port distributing
Link Aggregation Actor : (8000,70-81-05-96-3F-00,001A,8000,050A)
Link Aggregation Peer : (007F,80-71-1F-4C-77-F0,002F,007F,0008)
Untagged:
Logical ifIndex : 84541441
Operational State : Up, Active
Tagged VLAN: VID 2011
Logical ifIndex : 84541442
VLAN Type : Standard
VLAN Priority : 0
Administrative State : Enabled
Operational State : Up, Active
Number of VLANs : 2
SFP Module : Present (10G Base SR)
With this command, it is important to make sure the port is in the expected state. The Link’sDuplex and Speed setting can also be verified. Most installations should be in a Full/Duplexsetting. Different settings of interest have been highlighted in the output above.
Verify the duplex and speed settings match on both sides of the link.
3. Verify the utilization of the ports: #> show port utilization table
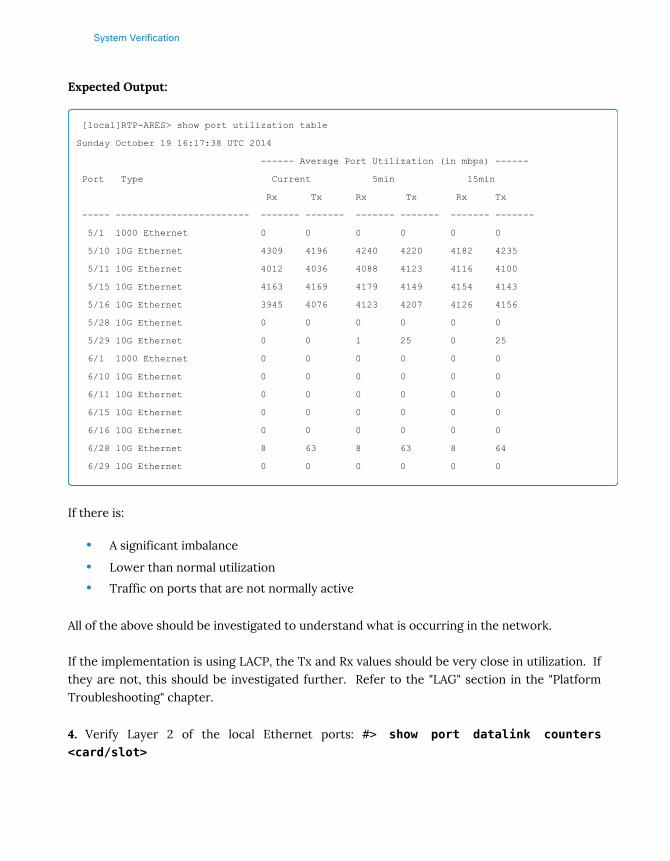
System Verification
Expected Output:
[local]RTP-ARES> show port utilization table
Sunday October 19 16:17:38 UTC 2014
------ Average Port Utilization (in mbps) ------
Port Type Current 5min 15min
Rx Tx Rx Tx Rx Tx
----- ------------------------ ------- ------- ------- ------- ------- -------
5/1 1000 Ethernet 0 0 0 0 0 0
5/10 10G Ethernet 4309 4196 4240 4220 4182 4235
5/11 10G Ethernet 4012 4036 4088 4123 4116 4100
5/15 10G Ethernet 4163 4169 4179 4149 4154 4143
5/16 10G Ethernet 3945 4076 4123 4207 4126 4156
5/28 10G Ethernet 0 0 0 0 0 0
5/29 10G Ethernet 0 0 1 25 0 25
6/1 1000 Ethernet 0 0 0 0 0 0
6/10 10G Ethernet 0 0 0 0 0 0
6/11 10G Ethernet 0 0 0 0 0 0
6/15 10G Ethernet 0 0 0 0 0 0
6/16 10G Ethernet 0 0 0 0 0 0
6/28 10G Ethernet 8 63 8 63 8 64
6/29 10G Ethernet 0 0 0 0 0 0
If there is:
• A significant imbalance
• Lower than normal utilization
• Traffic on ports that are not normally active
All of the above should be investigated to understand what is occurring in the network.
If the implementation is using LACP, the Tx and Rx values should be very close in utilization. Ifthey are not, this should be investigated further. Refer to the "LAG" section in the "PlatformTroubleshooting" chapter.
4. Verify Layer 2 of the local Ethernet ports: #> show port datalink counters<card/slot>
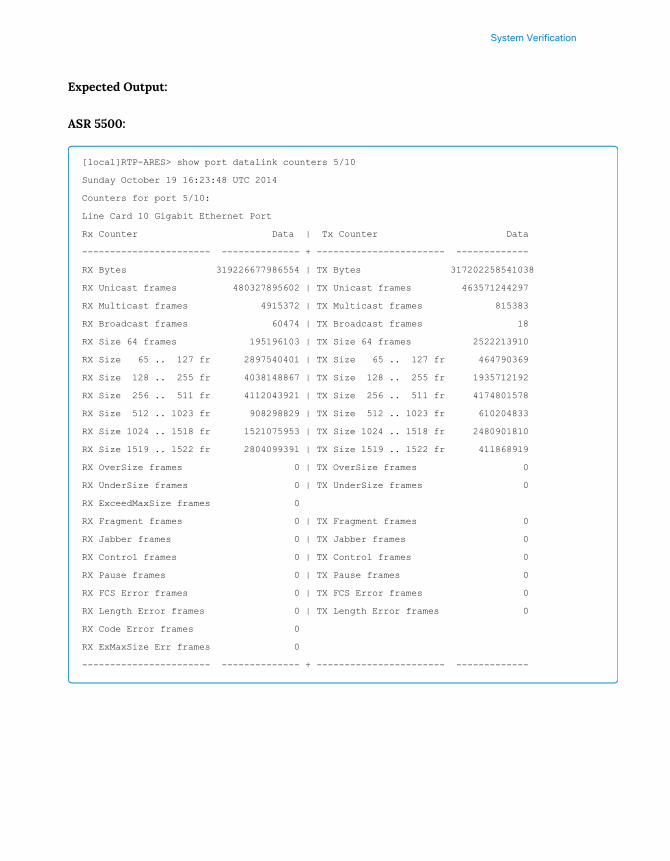
System Verification
Expected Output:
ASR 5500:
[local]RTP-ARES> show port datalink counters 5/10
Sunday October 19 16:23:48 UTC 2014
Counters for port 5/10:
Line Card 10 Gigabit Ethernet Port
Rx Counter Data | Tx Counter Data
----------------------- -------------- + ----------------------- -------------
RX Bytes 319226677986554 | TX Bytes 317202258541038
RX Unicast frames 480327895602 | TX Unicast frames 463571244297
RX Multicast frames 4915372 | TX Multicast frames 815383
RX Broadcast frames 60474 | TX Broadcast frames 18
RX Size 64 frames 195196103 | TX Size 64 frames 2522213910
RX Size 65 .. 127 fr 2897540401 | TX Size 65 .. 127 fr 464790369
RX Size 128 .. 255 fr 4038148867 | TX Size 128 .. 255 fr 1935712192
RX Size 256 .. 511 fr 4112043921 | TX Size 256 .. 511 fr 4174801578
RX Size 512 .. 1023 fr 908298829 | TX Size 512 .. 1023 fr 610204833
RX Size 1024 .. 1518 fr 1521075953 | TX Size 1024 .. 1518 fr 2480901810
RX Size 1519 .. 1522 fr 2804099391 | TX Size 1519 .. 1522 fr 411868919
RX OverSize frames 0 | TX OverSize frames 0
RX UnderSize frames 0 | TX UnderSize frames 0
RX ExceedMaxSize frames 0
RX Fragment frames 0 | TX Fragment frames 0
RX Jabber frames 0 | TX Jabber frames 0
RX Control frames 0 | TX Control frames 0
RX Pause frames 0 | TX Pause frames 0
RX FCS Error frames 0 | TX FCS Error frames 0
RX Length Error frames 0 | TX Length Error frames 0
RX Code Error frames 0
RX ExMaxSize Err frames 0
----------------------- -------------- + ----------------------- -------------
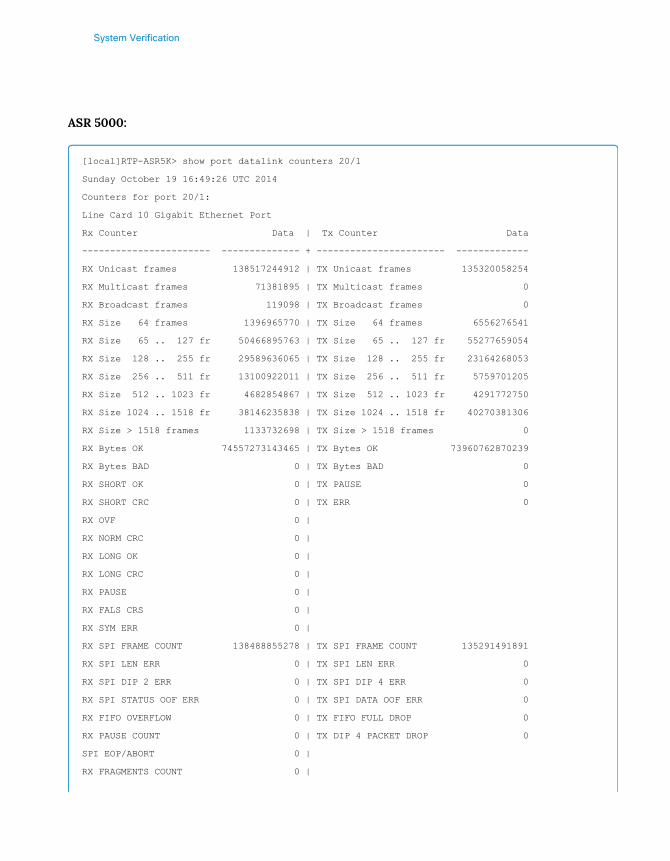
System Verification
ASR 5000:
[local]RTP-ASR5K> show port datalink counters 20/1
Sunday October 19 16:49:26 UTC 2014
Counters for port 20/1:
Line Card 10 Gigabit Ethernet Port
Rx Counter Data | Tx Counter Data
----------------------- -------------- + ----------------------- -------------
RX Unicast frames 138517244912 | TX Unicast frames 135320058254
RX Multicast frames 71381895 | TX Multicast frames 0
RX Broadcast frames 119098 | TX Broadcast frames 0
RX Size 64 frames 1396965770 | TX Size 64 frames 6556276541
RX Size 65 .. 127 fr 50466895763 | TX Size 65 .. 127 fr 55277659054
RX Size 128 .. 255 fr 29589636065 | TX Size 128 .. 255 fr 23164268053
RX Size 256 .. 511 fr 13100922011 | TX Size 256 .. 511 fr 5759701205
RX Size 512 .. 1023 fr 4682854867 | TX Size 512 .. 1023 fr 4291772750
RX Size 1024 .. 1518 fr 38146235838 | TX Size 1024 .. 1518 fr 40270381306
RX Size > 1518 frames 1133732698 | TX Size > 1518 frames 0
RX Bytes OK 74557273143465 | TX Bytes OK 73960762870239
RX Bytes BAD 0 | TX Bytes BAD 0
RX SHORT OK 0 | TX PAUSE 0
RX SHORT CRC 0 | TX ERR 0
RX OVF 0 |
RX NORM CRC 0 |
RX LONG OK 0 |
RX LONG CRC 0 |
RX PAUSE 0 |
RX FALS CRS 0 |
RX SYM ERR 0 |
RX SPI FRAME COUNT 138488855278 | TX SPI FRAME COUNT 135291491891
RX SPI LEN ERR 0 | TX SPI LEN ERR 0
RX SPI DIP 2 ERR 0 | TX SPI DIP 4 ERR 0
RX SPI STATUS OOF ERR 0 | TX SPI DATA OOF ERR 0
RX FIFO OVERFLOW 0 | TX FIFO FULL DROP 0
RX PAUSE COUNT 0 | TX DIP 4 PACKET DROP 0
SPI EOP/ABORT 0 |
RX FRAGMENTS COUNT 0 |
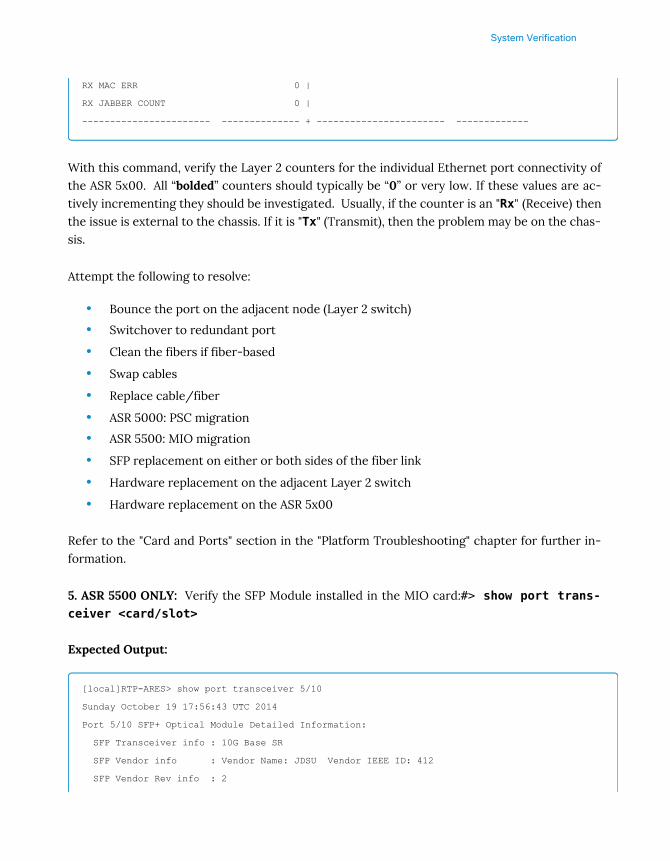
System Verification
RX MAC ERR 0 |
RX JABBER COUNT 0 |
----------------------- -------------- + ----------------------- -------------
With this command, verify the Layer 2 counters for the individual Ethernet port connectivity ofthe ASR 5x00. All “bolded” counters should typically be “0” or very low. If these values are ac-tively incrementing they should be investigated. Usually, if the counter is an "Rx" (Receive) thenthe issue is external to the chassis. If it is "Tx" (Transmit), then the problem may be on the chas-sis.
Attempt the following to resolve:
• Bounce the port on the adjacent node (Layer 2 switch)
• Switchover to redundant port
• Clean the fibers if fiber-based
• Swap cables
• Replace cable/fiber
• ASR 5000: PSC migration
• ASR 5500: MIO migration
• SFP replacement on either or both sides of the fiber link
• Hardware replacement on the adjacent Layer 2 switch
• Hardware replacement on the ASR 5x00
Refer to the "Card and Ports" section in the "Platform Troubleshooting" chapter for further in-formation.
5. ASR 5500 ONLY: Verify the SFP Module installed in the MIO card:#> show port trans‐ceiver <card/slot>
Expected Output:
[local]RTP-ARES> show port transceiver 5/10
Sunday October 19 17:56:43 UTC 2014
Port 5/10 SFP+ Optical Module Detailed Information:
SFP Transceiver info : 10G Base SR
SFP Vendor info : Vendor Name: JDSU Vendor IEEE ID: 412
SFP Vendor Rev info : 2

System Verification
SFP Parts info : P/N: PLRXPLSCS4322N S/N: CB33UF0P7 Date: 08/09/2011
Nominal Bitrate : 10300 MBits/sec
Length 50/125um : 80 m
Length 62.5/125um : 30 m
Wavelength : 850 nm
Diagnostic Monitor : Yes
Internally Calibrated: Yes
Externally Calibrated: No
SFF-8472 Compliance : Rev 10.2
: Low Alarm Low Warn Actual High Warn High Alarm
: Threshold Threshold Value Threshold Threshold
Temp(C) : -10.0000 -5.0000 44.1211 75.0000 80.0000
Voltage(V) : 2.8500 2.9700 3.2978 3.6300 3.7000
Bias(mA) : 2.6000 3.0000 7.6400 8.5000 10.0000
TxPower(dBm) : -8.0024 -7.5007 -2.5376 -1.3001 -1.0002
RxPower(dBm) : -14.0012 -11.9997 -4.5544 0.9851 1.4999
:(--)low_alarm (-)low_warn (+)high_warn (++)high_alarm
This command can be helpful when troubleshooting fiber links. This will provide readouts re-garding the Transmit and Receive power levels detected on the fiber link.
If the readings are not of the expected values, attempt the following:
• Clean fiber pairs
• Replace SFPs
• Replace fiber cable
6. Verify:
• ARP/Neighbor tables are populated for each of the configured Contexts: #> context<Each Context configured in the system>
• For configured IPv4 interfaces: #> show ip arp
• For configured IPv6 interfaces:#> show ipv6 neighbors
Expected Output:
[local]RTP-ASR5K> context Egress
Tuesday October 21 11:02:13 UTC 2014
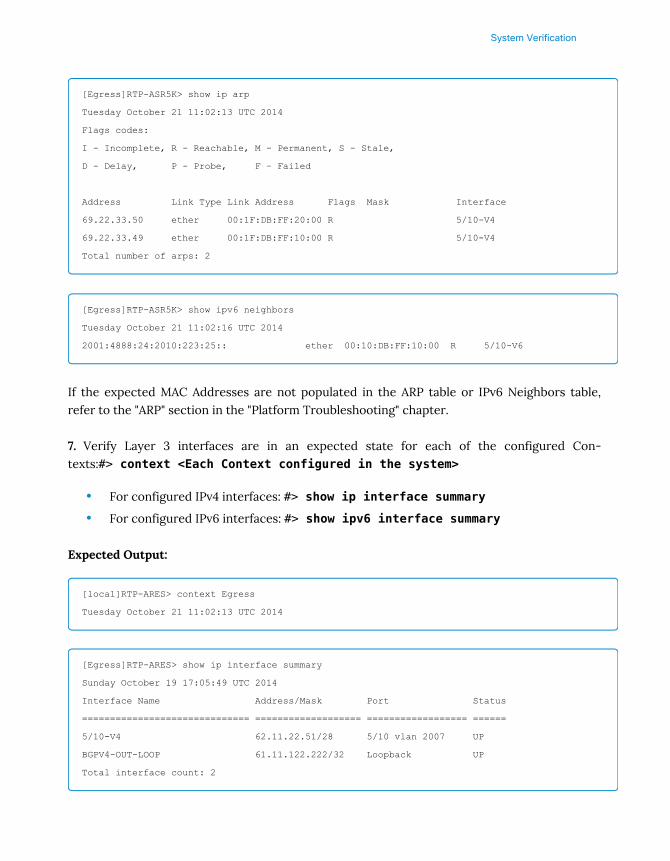
System Verification
[Egress]RTP-ASR5K> show ip arp
Tuesday October 21 11:02:13 UTC 2014
Flags codes:
I - Incomplete, R - Reachable, M - Permanent, S - Stale,
D - Delay, P - Probe, F – Failed
Address Link Type Link Address Flags Mask Interface
69.22.33.50 ether 00:1F:DB:FF:20:00 R 5/10-V4
69.22.33.49 ether 00:1F:DB:FF:10:00 R 5/10-V4
Total number of arps: 2
[Egress]RTP-ASR5K> show ipv6 neighbors
Tuesday October 21 11:02:16 UTC 2014
2001:4888:24:2010:223:25:: ether 00:10:DB:FF:10:00 R 5/10-V6
If the expected MAC Addresses are not populated in the ARP table or IPv6 Neighbors table,refer to the "ARP" section in the "Platform Troubleshooting" chapter.
7. Verify Layer 3 interfaces are in an expected state for each of the configured Con-texts:#> context <Each Context configured in the system>
• For configured IPv4 interfaces: #> show ip interface summary
• For configured IPv6 interfaces: #> show ipv6 interface summary
Expected Output:
[local]RTP-ARES> context Egress
Tuesday October 21 11:02:13 UTC 2014
[Egress]RTP-ARES> show ip interface summary
Sunday October 19 17:05:49 UTC 2014
Interface Name Address/Mask Port Status
============================== =================== ================== ======
5/10-V4 62.11.22.51/28 5/10 vlan 2007 UP
BGPV4-OUT-LOOP 61.11.122.222/32 Loopback UP
Total interface count: 2

System Verification
[Egress]RTP-ARES> show ipv6 interface summary
Sunday October 19 17:05:57 UTC 2014
Interface Name Address/Mask Port Status
============================== =================== ================== ======
5/10-V6 2001:beef:20:2010:201:200::/64 5/10 vlan 2427 UP
BGPV6-OUT-LOOP 2001:beef:0:1000:201:200::/128 Loopback UP
Total interface count: 2
All configured interfaces should be in their expected state. If an interface is not in the correctstate, refer to the section above containing the "show port info" command. Refer to the "ARP"or "Cards or Ports" section in the "Platform Troubleshooting" chapter for further information.
Loopback interfaces will show a state of “INACTIVE” if the chassis is in the SRP Standby state.
8. Verify Layer 3 interface counters: #> show port npu counters <card/slot>
Expected Output:
[Egress]RTP-ARES> show port npu counters 5/10
Sunday October 19 17:15:01 UTC 2014
Counters for port 5/10
Counter Rx Frames Rx Bytes Tx Frames Tx Bytes
-------------------- ------------- --------------- ------------- ---------------
Unicast 18779411596791267353810600788 18648945654951270718007953125
Multicast 8229798 701002284 6547597 811901048
Broadcast 121410 7284744 36 1656
IPv4 unicast 1579560569069 980548339107180 16484692962251186193652538372
IPv4 non-unicast 1869126 119624064 0 0
IPv6 unicast 298373893695 286804649948691 216424908839 67703541283852
IPv6 non-unicast 6360672 581378220 199773 53246531
Fragments received 2579634775 2040987368899 n/a n/a
Packets reassembled 1289756423 1988678514802 n/a n/a
Fragments to kernel 0 0 n/a n/a
HW error 0 0 n/a n/a
Port non-operational 0 0 0 0
SRC MAC is multicast 0 0 n/a n/a
Unknown VLAN tag 0 0 n/a n/a

System Verification
Other protocols 471638 28725024 n/a n/a
Not IPv4 298377074128 286804940769757 n/a n/a
Bad IPv4 header 0 0 n/a n/a
IPv4 MRU exceeded 0 0 n/a n/a
TCP tiny fragment 0 0 0 0
No ACL match 0 0 0 0
Filtered by ACL 0 0 0 0
TTL expired 0 0 n/a n/a
Flow lookup twice 0 0 n/a n/a
Unknown IPv4 class 0 0 n/a n/a
Too short: IP 0 0 n/a n/a
Too short: ICMP 0 0 0 0
Too short: IGMP 0 0 0 0
Too short: TCP 0 0 0 0
Too short: UDP 0 0 0 0
Too short: IPIP 0 0 n/a n/a
Too short: GRE 0 0 n/a n/a
Too short: GRE key 0 0 n/a n/a
Don't frag discards n/a n/a 0 0
Fragment packets n/a n/a 13124029886 20199200521626
Fragment fragments n/a n/a 26248059772 768398910185208
IPv4VlanMap dropped 0 0 n/a n/a
IPSec NATT keep alive 0 0 n/a n/a
MPLS Flow not found 0 0 n/a n/a
MPLS unicast 0 0 0 0
Size 0 .. 63 1007423352 60570440084 285852562031 16578104126990
Size 64 .. 127 821450909293 77484909314985 543905420671 48114421574111
Size 128 .. 255 143797753015 23968035265887 123416733852 22355615192367
Size 256 .. 511 65638054314 23520371737752 66883470267 23600696739172
Size 512 .. 1023 53512926638 39040090950903 53907682184 39277239295411
Size 1024 .. 2047 7925425481251103280617157154 7909353387951120792793292739
Size 2048 .. 4095 0 0 0 0
Size 4096 .. 8191 0 0 0 0
Size >= 8192 0 0 0 0
With this command, verify the Layer 3 counters for the individual Ethernet port of the ASR5x00. All “bolded” counters should typically be “0”. If they are actively incrementing theyshould be investigated. Usually, if the counter is an "Rx" (Receive) then the issue is external tothe chassis, if it is "Tx"(Transmit), then the problem may be on the chassis.

System Verification
Refer to the "Switch Fabric and NPU" section in the "Platform Troubleshooting" chapter for fur-ther information. If the “bolded” counters are increasing, contact Cisco in order to performanalysis and troubleshooting.
9. Verify IP Routing tables are present for each of the configured Contexts: #> context <EachContext configured in the system>
• For configured IPv4 interfaces: #> show ip route• For configured IPv6 interfaces: #> show ipv6 route
Expected Output:
[Egress]RTP-ARES> show ip route
Tuesday October 21 11:06:41 UTC 2014
"*" indicates the Best or Used route. S indicates Stale.
Destination Nexthop Protocol Prec Cost Interface
*0.0.0.0/0 69.33.39.49 bgp 20 0 5/10-V4
0.0.0.0/0 69.33.39.49 static 40 0 5/10-V4
*10.128.0.0/13 0.0.0.0 connected 0 0 pool admin41
*10.144.0.0/13 0.0.0.0 connected 0 0 pool appl41
*10.160.0.0/13 0.0.0.0 connected 0 0 pool inter41
*10.168.0.0/13 0.0.0.0 connected 0 0 pool inter41
*10.176.0.0/13 0.0.0.0 connected 0 0 pool inter41
*10.184.0.0/13 0.0.0.0 connected 0 0 pool inter41
*66.74.68.77/32 0.0.0.0 connected 0 0 BGPV4-OUT-LOOP
*69.83.39.48/28 0.0.0.0 connected 0 0 5/10-V4
*69.83.39.52/32 0.0.0.0 connected 0 0 5/10-V4
*69.83.228.33/32 69.83.39.49 static 1 0 5/10-V4
*69.83.228.34/32 69.83.39.49 static 1 0 5/10-V4
*70.209.0.0/20 0.0.0.0 connected 0 0 pool natl_inter
*70.209.16.0/20 0.0.0.0 connected 0 0 pool natl_inter
*72.96.136.0/23 0.0.0.0 connected 0 0 pool natl_admin
*72.96.138.0/23 0.0.0.0 connected 0 0 pool natl_admin
*72.104.104.0/21 0.0.0.0 connected 0 0 pool intr42
*72.120.72.0/23 0.0.0.0 connected 0 0 pool natl_appl
*72.120.74.0/23 0.0.0.0 connected 0 0 pool natl_appl
*167.163.60.0/24 0.0.0.0 connected 0 0 pool natl
*167.163.61.0/24 0.0.0.0 connected 0 0 pool natl_
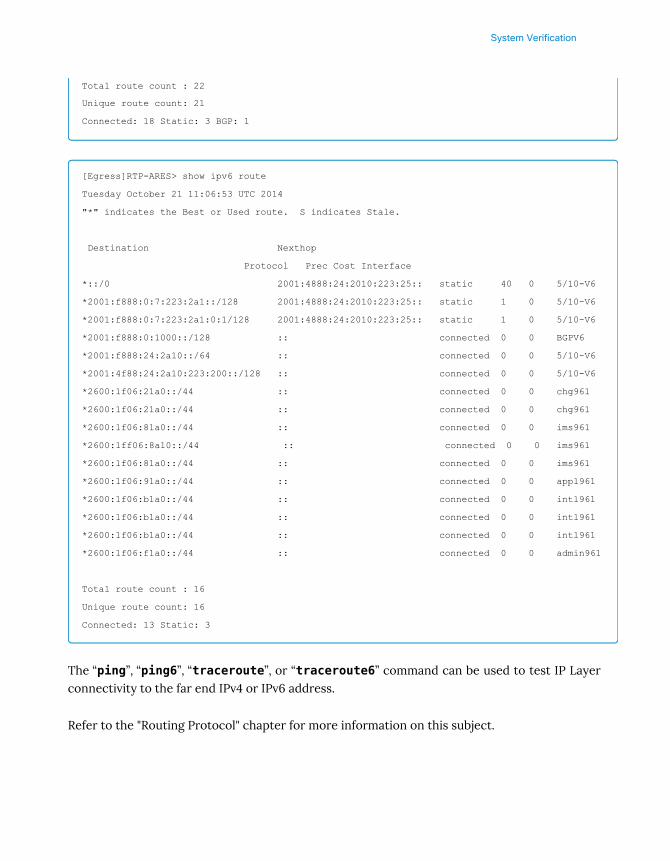
System Verification
Total route count : 22
Unique route count: 21
Connected: 18 Static: 3 BGP: 1
[Egress]RTP-ARES> show ipv6 route
Tuesday October 21 11:06:53 UTC 2014
"*" indicates the Best or Used route. S indicates Stale.
Destination Nexthop
Protocol Prec Cost Interface
*::/0 2001:4888:24:2010:223:25:: static 40 0 5/10-V6
*2001:f888:0:7:223:2a1::/128 2001:4888:24:2010:223:25:: static 1 0 5/10-V6
*2001:f888:0:7:223:2a1:0:1/128 2001:4888:24:2010:223:25:: static 1 0 5/10-V6
*2001:f888:0:1000::/128 :: connected 0 0 BGPV6
*2001:f888:24:2a10::/64 :: connected 0 0 5/10-V6
*2001:4f88:24:2a10:223:200::/128 :: connected 0 0 5/10-V6
*2600:1f06:21a0::/44 :: connected 0 0 chg961
*2600:1f06:21a0::/44 :: connected 0 0 chg961
*2600:1f06:81a0::/44 :: connected 0 0 ims961
*2600:1ff06:8a10::/44 :: connected 0 0 ims961
*2600:1f06:81a0::/44 :: connected 0 0 ims961
*2600:1f06:91a0::/44 :: connected 0 0 appl961
*2600:1f06:b1a0::/44 :: connected 0 0 intl961
*2600:1f06:b1a0::/44 :: connected 0 0 intl961
*2600:1f06:b1a0::/44 :: connected 0 0 intl961
*2600:1f06:f1a0::/44 :: connected 0 0 admin961
Total route count : 16
Unique route count: 16
Connected: 13 Static: 3
The “ping”, “ping6”, “traceroute”, or “traceroute6” command can be used to test IP Layerconnectivity to the far end IPv4 or IPv6 address.
Refer to the "Routing Protocol" chapter for more information on this subject.


System Verification
Call Processing
Overview
With many subscribers connecting to ASR 5000/ASR 5500, this section covers how to verifysession connections and setup times.
Commands and Outputs
These steps will allow the User to verify that the chassis is processing incoming calls with no is-sues.
Note: Make sure the CLI session logging has been enabled. (Estimated Time for completion: 15minutes)
1. Verify the total number of subscribers currently attached to the chassis:#> show sub‐scribers summary
Expected Output:
[local]RTP-ARES> show subscribers summary
Sunday October 19 18:17:45 UTC 2014
Total Subscribers: 2924438
Active: 2924438 Dormant: 0
pdsn-simple-ipv4: 0 pdsn-simple-ipv6: 0
pdsn-mobile-ip: 0 ha-mobile-ipv6: 0
hsgw-ipv6: 0 hsgw-ipv4: 0
hsgw-ipv4-ipv6: 0 pgw-pmip-ipv6: 138139
pgw-pmip-ipv4: 59 pgw-pmip-ipv4-ipv6: 94226
pgw-gtp-ipv6: 927412 pgw-gtp-ipv4: 3036
pgw-gtp-ipv4-ipv6: 764397 sgw-gtp-ipv6: 0
sgw-gtp-ipv4: 0 sgw-gtp-ipv4-ipv6: 0
sgw-pmip-ipv6: 0 sgw-pmip-ipv4: 0
sgw-pmip-ipv4-ipv6: 0 pgw-gtps2b-ipv4: 0
pgw-gtps2b-ipv6: 0 pgw-gtps2b-ipv4-ipv6: 0
pgw-gtps2a-ipv4: 0 pgw-gtps2a-ipv6: 0
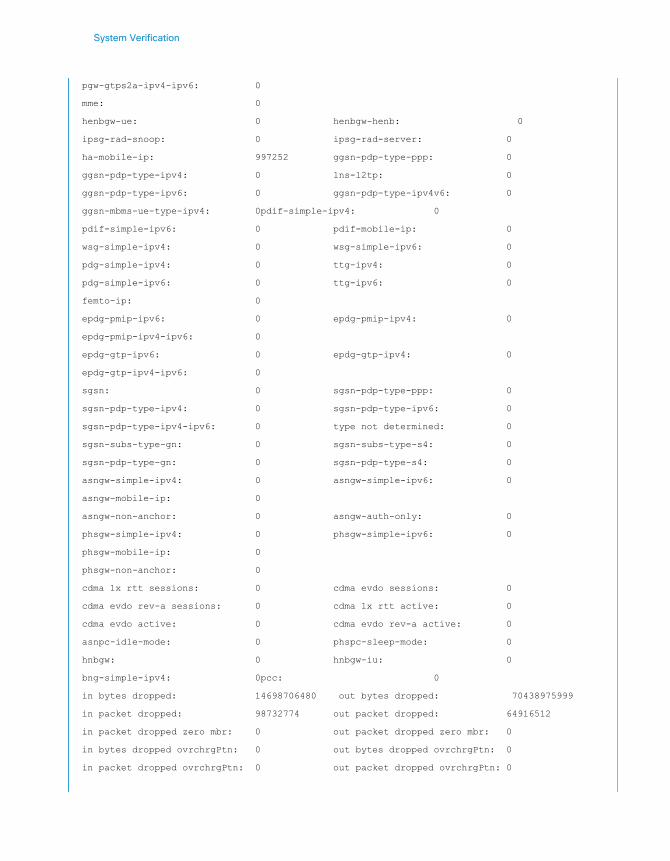
System Verification
pgw-gtps2a-ipv4-ipv6: 0
mme: 0
henbgw-ue: 0 henbgw-henb: 0
ipsg-rad-snoop: 0 ipsg-rad-server: 0
ha-mobile-ip: 997252 ggsn-pdp-type-ppp: 0
ggsn-pdp-type-ipv4: 0 lns-l2tp: 0
ggsn-pdp-type-ipv6: 0 ggsn-pdp-type-ipv4v6: 0
ggsn-mbms-ue-type-ipv4: 0pdif-simple-ipv4: 0
pdif-simple-ipv6: 0 pdif-mobile-ip: 0
wsg-simple-ipv4: 0 wsg-simple-ipv6: 0
pdg-simple-ipv4: 0 ttg-ipv4: 0
pdg-simple-ipv6: 0 ttg-ipv6: 0
femto-ip: 0
epdg-pmip-ipv6: 0 epdg-pmip-ipv4: 0
epdg-pmip-ipv4-ipv6: 0
epdg-gtp-ipv6: 0 epdg-gtp-ipv4: 0
epdg-gtp-ipv4-ipv6: 0
sgsn: 0 sgsn-pdp-type-ppp: 0
sgsn-pdp-type-ipv4: 0 sgsn-pdp-type-ipv6: 0
sgsn-pdp-type-ipv4-ipv6: 0 type not determined: 0
sgsn-subs-type-gn: 0 sgsn-subs-type-s4: 0
sgsn-pdp-type-gn: 0 sgsn-pdp-type-s4: 0
asngw-simple-ipv4: 0 asngw-simple-ipv6: 0
asngw-mobile-ip: 0
asngw-non-anchor: 0 asngw-auth-only: 0
phsgw-simple-ipv4: 0 phsgw-simple-ipv6: 0
phsgw-mobile-ip: 0
phsgw-non-anchor: 0
cdma 1x rtt sessions: 0 cdma evdo sessions: 0
cdma evdo rev-a sessions: 0 cdma 1x rtt active: 0
cdma evdo active: 0 cdma evdo rev-a active: 0
asnpc-idle-mode: 0 phspc-sleep-mode: 0
hnbgw: 0 hnbgw-iu: 0
bng-simple-ipv4: 0pcc: 0
in bytes dropped: 14698706480 out bytes dropped: 70438975999
in packet dropped: 98732774 out packet dropped: 64916512
in packet dropped zero mbr: 0 out packet dropped zero mbr: 0
in bytes dropped ovrchrgPtn: 0 out bytes dropped ovrchrgPtn: 0
in packet dropped ovrchrgPtn: 0 out packet dropped ovrchrgPtn: 0
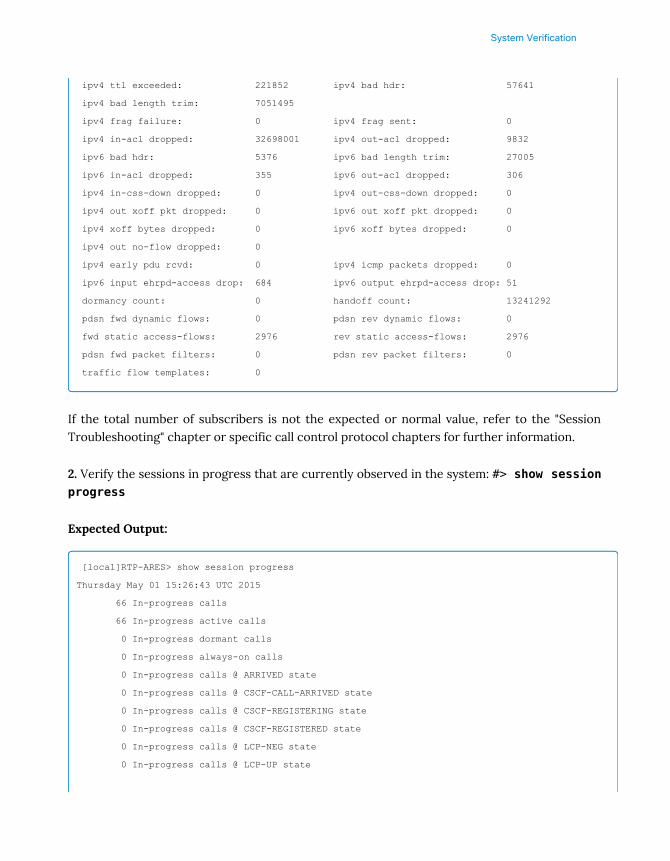
System Verification
ipv4 ttl exceeded: 221852 ipv4 bad hdr: 57641
ipv4 bad length trim: 7051495
ipv4 frag failure: 0 ipv4 frag sent: 0
ipv4 in-acl dropped: 32698001 ipv4 out-acl dropped: 9832
ipv6 bad hdr: 5376 ipv6 bad length trim: 27005
ipv6 in-acl dropped: 355 ipv6 out-acl dropped: 306
ipv4 in-css-down dropped: 0 ipv4 out-css-down dropped: 0
ipv4 out xoff pkt dropped: 0 ipv6 out xoff pkt dropped: 0
ipv4 xoff bytes dropped: 0 ipv6 xoff bytes dropped: 0
ipv4 out no-flow dropped: 0
ipv4 early pdu rcvd: 0 ipv4 icmp packets dropped: 0
ipv6 input ehrpd-access drop: 684 ipv6 output ehrpd-access drop: 51
dormancy count: 0 handoff count: 13241292
pdsn fwd dynamic flows: 0 pdsn rev dynamic flows: 0
fwd static access-flows: 2976 rev static access-flows: 2976
pdsn fwd packet filters: 0 pdsn rev packet filters: 0
traffic flow templates: 0
If the total number of subscribers is not the expected or normal value, refer to the "SessionTroubleshooting" chapter or specific call control protocol chapters for further information.
2. Verify the sessions in progress that are currently observed in the system: #> show sessionprogress
Expected Output:
[local]RTP-ARES> show session progress
Thursday May 01 15:26:43 UTC 2015
66 In-progress calls
66 In-progress active calls
0 In-progress dormant calls
0 In-progress always-on calls
0 In-progress calls @ ARRIVED state
0 In-progress calls @ CSCF-CALL-ARRIVED state
0 In-progress calls @ CSCF-REGISTERING state
0 In-progress calls @ CSCF-REGISTERED state
0 In-progress calls @ LCP-NEG state
0 In-progress calls @ LCP-UP state
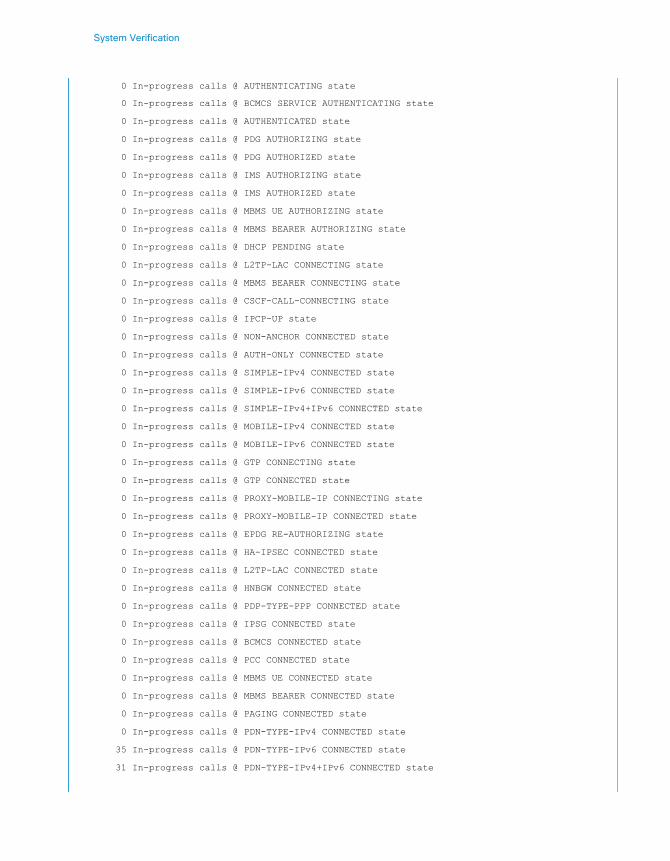
System Verification
0 In-progress calls @ AUTHENTICATING state
0 In-progress calls @ BCMCS SERVICE AUTHENTICATING state
0 In-progress calls @ AUTHENTICATED state
0 In-progress calls @ PDG AUTHORIZING state
0 In-progress calls @ PDG AUTHORIZED state
0 In-progress calls @ IMS AUTHORIZING state
0 In-progress calls @ IMS AUTHORIZED state
0 In-progress calls @ MBMS UE AUTHORIZING state
0 In-progress calls @ MBMS BEARER AUTHORIZING state
0 In-progress calls @ DHCP PENDING state
0 In-progress calls @ L2TP-LAC CONNECTING state
0 In-progress calls @ MBMS BEARER CONNECTING state
0 In-progress calls @ CSCF-CALL-CONNECTING state
0 In-progress calls @ IPCP-UP state
0 In-progress calls @ NON-ANCHOR CONNECTED state
0 In-progress calls @ AUTH-ONLY CONNECTED state
0 In-progress calls @ SIMPLE-IPv4 CONNECTED state
0 In-progress calls @ SIMPLE-IPv6 CONNECTED state
0 In-progress calls @ SIMPLE-IPv4+IPv6 CONNECTED state
0 In-progress calls @ MOBILE-IPv4 CONNECTED state
0 In-progress calls @ MOBILE-IPv6 CONNECTED state
0 In-progress calls @ GTP CONNECTING state
0 In-progress calls @ GTP CONNECTED state
0 In-progress calls @ PROXY-MOBILE-IP CONNECTING state
0 In-progress calls @ PROXY-MOBILE-IP CONNECTED state
0 In-progress calls @ EPDG RE-AUTHORIZING state
0 In-progress calls @ HA-IPSEC CONNECTED state
0 In-progress calls @ L2TP-LAC CONNECTED state
0 In-progress calls @ HNBGW CONNECTED state
0 In-progress calls @ PDP-TYPE-PPP CONNECTED state
0 In-progress calls @ IPSG CONNECTED state
0 In-progress calls @ BCMCS CONNECTED state
0 In-progress calls @ PCC CONNECTED state
0 In-progress calls @ MBMS UE CONNECTED state
0 In-progress calls @ MBMS BEARER CONNECTED state
0 In-progress calls @ PAGING CONNECTED state
0 In-progress calls @ PDN-TYPE-IPv4 CONNECTED state
35 In-progress calls @ PDN-TYPE-IPv6 CONNECTED state
31 In-progress calls @ PDN-TYPE-IPv4+IPv6 CONNECTED state
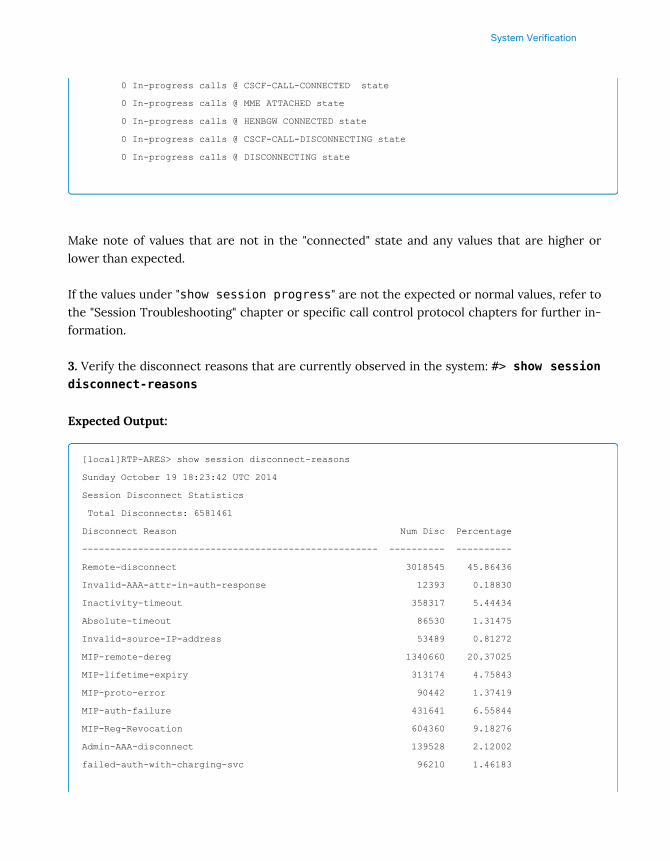
System Verification
0 In-progress calls @ CSCF-CALL-CONNECTED state
0 In-progress calls @ MME ATTACHED state
0 In-progress calls @ HENBGW CONNECTED state
0 In-progress calls @ CSCF-CALL-DISCONNECTING state
0 In-progress calls @ DISCONNECTING state
Make note of values that are not in the "connected" state and any values that are higher orlower than expected.
If the values under "show session progress" are not the expected or normal values, refer tothe "Session Troubleshooting" chapter or specific call control protocol chapters for further in-formation.
3. Verify the disconnect reasons that are currently observed in the system: #> show sessiondisconnect-reasons
Expected Output:
[local]RTP-ARES> show session disconnect-reasons
Sunday October 19 18:23:42 UTC 2014
Session Disconnect Statistics
Total Disconnects: 6581461
Disconnect Reason Num Disc Percentage
----------------------------------------------------- ---------- ----------
Remote-disconnect 3018545 45.86436
Invalid-AAA-attr-in-auth-response 12393 0.18830
Inactivity-timeout 358317 5.44434
Absolute-timeout 86530 1.31475
Invalid-source-IP-address 53489 0.81272
MIP-remote-dereg 1340660 20.37025
MIP-lifetime-expiry 313174 4.75843
MIP-proto-error 90442 1.37419
MIP-auth-failure 431641 6.55844
MIP-Reg-Revocation 604360 9.18276
Admin-AAA-disconnect 139528 2.12002
failed-auth-with-charging-svc 96210 1.46183
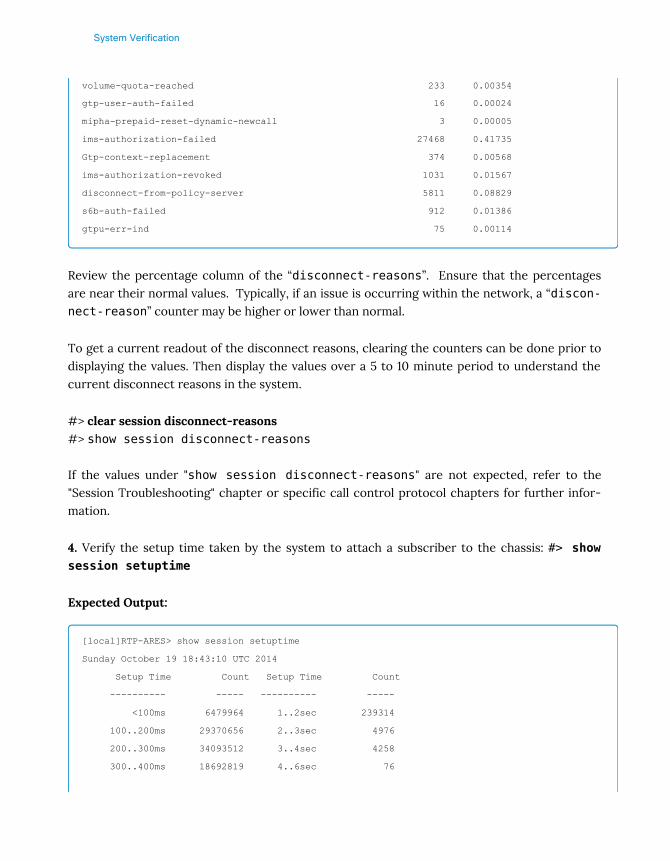
System Verification
volume-quota-reached 233 0.00354
gtp-user-auth-failed 16 0.00024
mipha-prepaid-reset-dynamic-newcall 3 0.00005
ims-authorization-failed 27468 0.41735
Gtp-context-replacement 374 0.00568
ims-authorization-revoked 1031 0.01567
disconnect-from-policy-server 5811 0.08829
s6b-auth-failed 912 0.01386
gtpu-err-ind 75 0.00114
Review the percentage column of the “disconnect-reasons”. Ensure that the percentagesare near their normal values. Typically, if an issue is occurring within the network, a “discon‐nect-reason” counter may be higher or lower than normal.
To get a current readout of the disconnect reasons, clearing the counters can be done prior todisplaying the values. Then display the values over a 5 to 10 minute period to understand thecurrent disconnect reasons in the system.
#> clear session disconnect-reasons #> show session disconnect-reasons
If the values under "show session disconnect-reasons" are not expected, refer to the"Session Troubleshooting" chapter or specific call control protocol chapters for further infor-mation.
4. Verify the setup time taken by the system to attach a subscriber to the chassis: #> showsession setuptime
Expected Output:
[local]RTP-ARES> show session setuptime
Sunday October 19 18:43:10 UTC 2014
Setup Time Count Setup Time Count
---------- ----- ---------- -----
<100ms 6479964 1..2sec 239314
100..200ms 29370656 2..3sec 4976
200..300ms 34093512 3..4sec 4258
300..400ms 18692819 4..6sec 76

System Verification
400..500ms 36872022 6..8sec 3
500..600ms 29481901 8..10sec 0
600..700ms 20918216 10..12sec 16
700..800ms 8672949 12..14sec 0
800..900ms 1817528 14..16sec 0
900..1000ms 409005 16..18sec 0
>18sec 0
To get a current readout of the session setup time, clearing the counters can be done prior todisplaying the values. Then display the values over a 5 to 10 minute period to understand thecurrent session setup time in the system.
#> clear session setuptime #> show session setuptime
If the values under "show session setuptime" are not expected, refer to the "Session Trou-bleshooting" chapter or specific call control protocol chapters for further information.
5. Verify the historical session counters of calls being attached to the system: #> show ses‐sion counters historical all
Expected Output:
[local]RTP-ARES> show session counters historical all
Sunday October 19 19:29:28 UTC 2014
------------------- Number of Calls ------------------
(A+R+D+F+H+R)
Intv Timestamp Arrived Rejected Connected Disconn Failed Handoffs Renewals CallOps
---- ------------------- -------- -------- --------- -------- ------- -------- -------- -------
1 2014:10:19:19:15:00 471139 22995 299716 267934 6377 409878 206282 1384605
2 2014:10:19:19:00:00 427698 22267 270171 257073 5909 390215 186181 1289343
3 2014:10:19:18:45:00 392151 21869 246758 252120 5712 373437 165098 1210387
4 2014:10:19:18:30:00 388653 22086 235112 252925 5467 386556 151795 1207482
5 2014:10:19:18:15:00 420167 21573 250441 253493 5637 414015 178711 1293596
6 2014:10:19:18:00:00 430109 22272 255530 252964 5407 419297 186714 1316763
7 2014:10:19:17:45:00 453561 22153 269089 258437 5499 432931 200689 1373270
8 2014:10:19:17:30:00 483870 22360 298484 259402 5968 428761 223685 1424046
9 2014:10:19:17:15:00 470265 22083 303149 267306 5881 400637 200586 1366758

System Verification
10 2014:10:19:17:00:00 428951 21384 275798 258064 5456 376979 176975 1267809
11 2014:10:19:16:45:00 380787 21031 241877 237038 5426 357499 159090 1160871
12 2014:10:19:16:30:00 368436 20792 225820 230429 5391 361535 147621 1134204
With the output of “show session counters historical all”, it is important to take no-tice of any sudden spikes in any of the columns. Such a spike will usually indicate an issue hastaken place in the network. If there is a large increase or decrease, follow local procedures totroubleshoot the issue.
If the values under "show session counters historical all" are not expected, refer tothe "Session Troubleshooting" chapter or specific call control protocol chapters for further in-formation.
6. Verify that all Session Managers on the system are evenly distributed: #> show task re‐sources facility sessmgr all
Expected Output:
[local]RTP-ARES> show task resources facility sessmgr all
Sunday October 19 19:49:21 UTC 2014
task cputime memory files sessions
cpu facility inst used allc used alloc used allc used allc S status
----------------------- --------- ------------- --------- ------------- ------
2/0 sessmgr 5012 0.2% 50% 121.4M 230.0M 109 500 -- -- S good
2/0 sessmgr 9 32% 100% 847.7M 2.49G 127 500 10254 35200 I good
2/0 sessmgr 21 29% 100% 840.0M 2.49G 127 500 10250 35200 I good
..
2/1 sessmgr 5006 0.2% 50% 120.9M 230.0M 110 500 -- -- S good
2/1 sessmgr 3 30% 100% 850.4M 2.49G 129 500 10206 35200 I good
2/1 sessmgr 15 31% 100% 841.4M 2.49G 127 500 10211 35200 I good
..
3/0 sessmgr 5014 0.2% 50% 121.0M 230.0M 111 500 -- -- S good
3/0 sessmgr 100 29% 100% 852.8M 2.49G 131 500 10263 35200 I good
3/0 sessmgr 113 33% 100% 848.1M 2.49G 132 500 10262 35200 I good
..
3/1 sessmgr 5008 0.2% 50% 121.3M 230.0M 108 500 -- -- S good
3/1 sessmgr 105 26% 100% 848.4M 2.49G 130 500 10271 35200 I good
3/1 sessmgr 125 32% 100% 846.2M 2.49G 130 500 10266 35200 I good

System Verification
..
Total 348 8750.83% 244.7G 44081 3.0m
All Session Managers on the system should show a value in the “used” column that is fairlyequal. If the system shows a Session Manager that has a value that is much higher or lowerthan other Session Managers on the system, this should be investigated immediately. Try todetermine if the affected Session Managers are all on the same card, or if it is affecting multiplecards.
If the sessions are not evenly distributed, refer to the "Session Managers Imbalanced" section inthe "Platform Troubleshooting" chapter for further information.


System Verification
Chassis Fabric
Overview
This section covers a health check of Swtich Fabric on ASR 5000/ASR 5500.
Commands and Outputs
These steps allow the User to verify the internal Fabric of the ASR 5000/ASR 5500 chassis.Some commands are specific to the ASR 5000 or ASR 5500 chassis and are marked accordingly. These commands require Administrative access rights to the chassis.
Note: Make sure CLI session logging has been enabled.
Estimated Time for completion: 15 minutes
The below CLI command requires CLI test-commands password configuredin the chassis. Please use the command with caution!Many TEST commands are processor-intensive and can cause serioussystem problems if used too frequently.
1. Access hidden/test mode of the chassis CLI:
#> hidden p <password>
Or
#> cli test-commands password <password>
Expected Output:
[local]RTP-ARES> hidden p xxxxxx
Thursday September 18 11:25:15 UTC 2014
Warning: HIDDEN access enables internal testing and debugging commands
USE OF THIS MODE MAY CAUSE SIGNIFICANT SERVICE INTERRUPTION

System Verification
Or
[local]RTP-ARES> cli test-commands password XXXXXX
Wednesday May 06 15:59:46 UTC 2015
Warning: Test commands enables internal testing and debugging commands
USE OF THIS MODE MAY CAUSE SIGNIFICANT SERVICE INTERRUPTION
Skip to Step 6 if for ASR 5000 chassis.
2. ASR 5500 Only, verify the SERDES Links on the chassis:
#> show fabric status
Expected Output:
[local]RTP-ARES> show fabric status
Sunday October 19 20:40:47 UTC 2014
Total number of FAPs: 24
Total number of FEs : 8
Total number of SERDES links: 1600
Total number of active SERDES links: 1600
The total number of SERDES links should be equal to the number of active SERDES links.
3. ASR 5500 Only, run twice 1 minute apart:
#> show fabric health | grep -i -E "̂Petra|EGQ"
Expected Output:
[local]RTP-ARES> show fabric health | grep -i -E "^Petra|EGQ"
Sunday October 19 20:46:41 UTC 2014
Petra-B 1=1/1
Petra-B 2=1/2
Petra-B 3=2/1
EGQ.RqpDiscardPacketCounter 5
EGQ.EhpDiscardPacketCounter 5
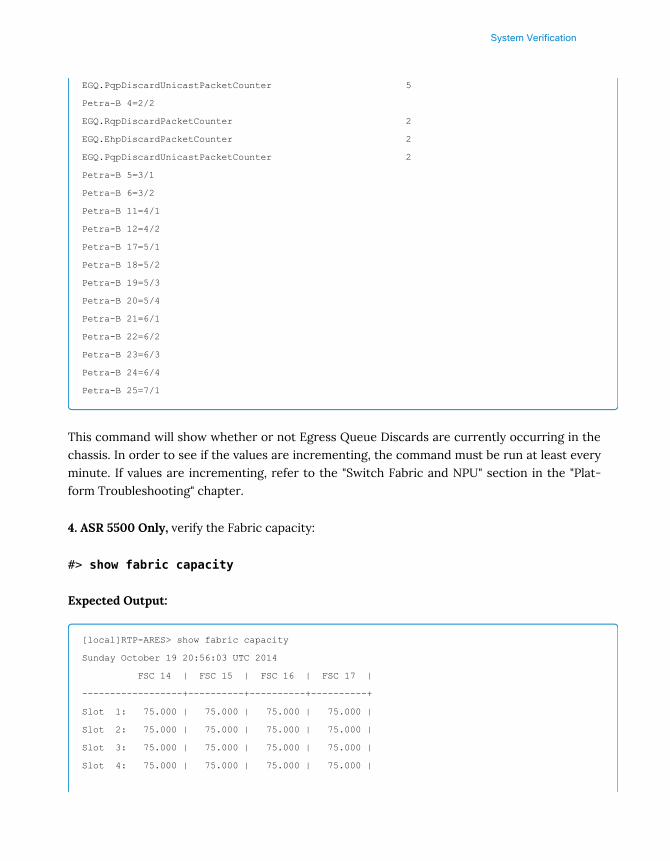
System Verification
EGQ.PqpDiscardUnicastPacketCounter 5
Petra-B 4=2/2
EGQ.RqpDiscardPacketCounter 2
EGQ.EhpDiscardPacketCounter 2
EGQ.PqpDiscardUnicastPacketCounter 2
Petra-B 5=3/1
Petra-B 6=3/2
Petra-B 11=4/1
Petra-B 12=4/2
Petra-B 17=5/1
Petra-B 18=5/2
Petra-B 19=5/3
Petra-B 20=5/4
Petra-B 21=6/1
Petra-B 22=6/2
Petra-B 23=6/3
Petra-B 24=6/4
Petra-B 25=7/1
This command will show whether or not Egress Queue Discards are currently occurring in thechassis. In order to see if the values are incrementing, the command must be run at least everyminute. If values are incrementing, refer to the "Switch Fabric and NPU" section in the "Plat-form Troubleshooting" chapter.
4. ASR 5500 Only, verify the Fabric capacity:
#> show fabric capacity
Expected Output:
[local]RTP-ARES> show fabric capacity
Sunday October 19 20:56:03 UTC 2014
FSC 14 | FSC 15 | FSC 16 | FSC 17 |
------------------+----------+----------+----------+
Slot 1: 75.000 | 75.000 | 75.000 | 75.000 |
Slot 2: 75.000 | 75.000 | 75.000 | 75.000 |
Slot 3: 75.000 | 75.000 | 75.000 | 75.000 |
Slot 4: 75.000 | 75.000 | 75.000 | 75.000 |

System Verification
Slot 5: 150.000 | 150.000 | 150.000 | 150.000 |
Slot 6: 150.000 | 150.000 | 150.000 | 150.000 |
Slot 7: 75.000 | 75.000 | 75.000 | 75.000 |
Slot 8: 75.000 | 75.000 | 75.000 | 75.000 |
Slot 9: 75.000 | 75.000 | 75.000 | 75.000 |
Slot 10: 75.000 | 75.000 | 75.000 | 75.000 |
units = gbps
Ensure the following values are observed:
• DPC1 slots show 75.000
• DPC2 slots show 37.500
• MIO slots show 150.000
Any other values should be escalated to Cisco via an SR.
5. ASR 5500 Only, verify the utilization of the Fabric paths:
#> show fabric utilization
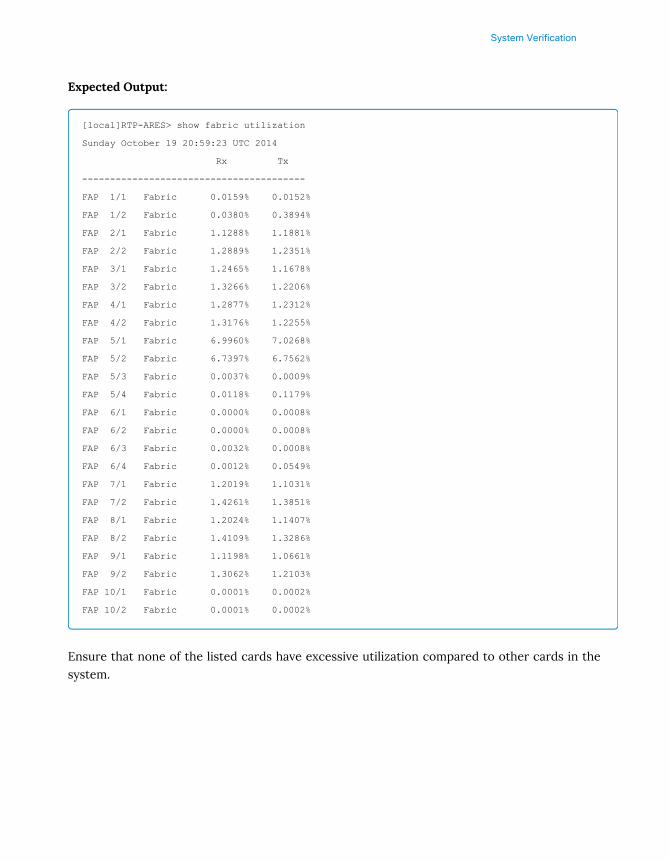
System Verification
Expected Output:
[local]RTP-ARES> show fabric utilization
Sunday October 19 20:59:23 UTC 2014
Rx Tx
----------------------------------------
FAP 1/1 Fabric 0.0159% 0.0152%
FAP 1/2 Fabric 0.0380% 0.3894%
FAP 2/1 Fabric 1.1288% 1.1881%
FAP 2/2 Fabric 1.2889% 1.2351%
FAP 3/1 Fabric 1.2465% 1.1678%
FAP 3/2 Fabric 1.3266% 1.2206%
FAP 4/1 Fabric 1.2877% 1.2312%
FAP 4/2 Fabric 1.3176% 1.2255%
FAP 5/1 Fabric 6.9960% 7.0268%
FAP 5/2 Fabric 6.7397% 6.7562%
FAP 5/3 Fabric 0.0037% 0.0009%
FAP 5/4 Fabric 0.0118% 0.1179%
FAP 6/1 Fabric 0.0000% 0.0008%
FAP 6/2 Fabric 0.0000% 0.0008%
FAP 6/3 Fabric 0.0032% 0.0008%
FAP 6/4 Fabric 0.0012% 0.0549%
FAP 7/1 Fabric 1.2019% 1.1031%
FAP 7/2 Fabric 1.4261% 1.3851%
FAP 8/1 Fabric 1.2024% 1.1407%
FAP 8/2 Fabric 1.4109% 1.3286%
FAP 9/1 Fabric 1.1198% 1.0661%
FAP 9/2 Fabric 1.3062% 1.2103%
FAP 10/1 Fabric 0.0001% 0.0002%
FAP 10/2 Fabric 0.0001% 0.0002%
Ensure that none of the listed cards have excessive utilization compared to other cards in thesystem.
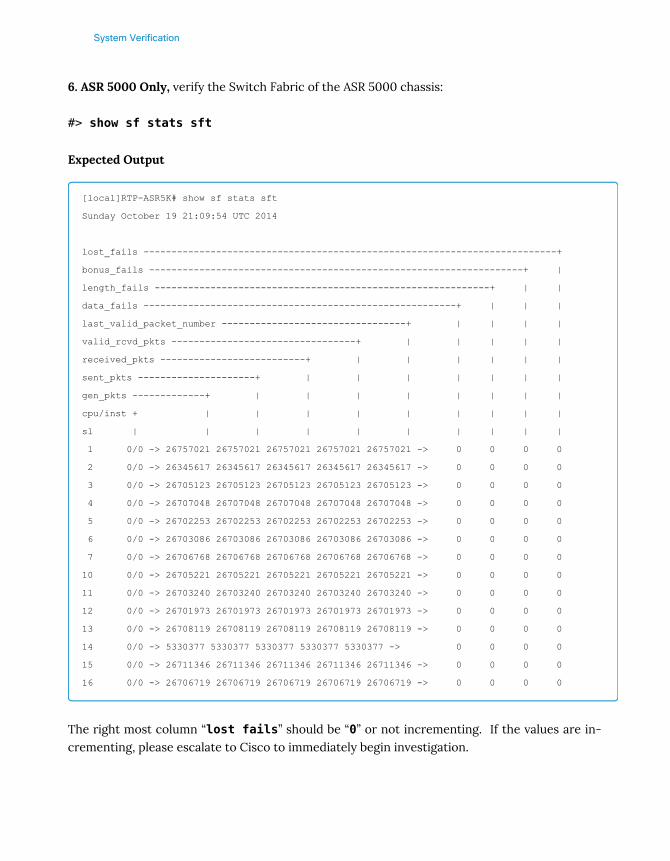
System Verification
6. ASR 5000 Only, verify the Switch Fabric of the ASR 5000 chassis:
#> show sf stats sft
Expected Output
[local]RTP-ASR5K# show sf stats sft
Sunday October 19 21:09:54 UTC 2014
lost_fails --------------------------------------------------------------------------+
bonus_fails -------------------------------------------------------------------+ |
length_fails ------------------------------------------------------------+ | |
data_fails --------------------------------------------------------+ | | |
last_valid_packet_number ---------------------------------+ | | | |
valid_rcvd_pkts ---------------------------------+ | | | | |
received_pkts --------------------------+ | | | | | |
sent_pkts ---------------------+ | | | | | | |
gen_pkts -------------+ | | | | | | | |
cpu/inst + | | | | | | | | |
sl | | | | | | | | | |
1 0/0 -> 26757021 26757021 26757021 26757021 26757021 -> 0 0 0 0
2 0/0 -> 26345617 26345617 26345617 26345617 26345617 -> 0 0 0 0
3 0/0 -> 26705123 26705123 26705123 26705123 26705123 -> 0 0 0 0
4 0/0 -> 26707048 26707048 26707048 26707048 26707048 -> 0 0 0 0
5 0/0 -> 26702253 26702253 26702253 26702253 26702253 -> 0 0 0 0
6 0/0 -> 26703086 26703086 26703086 26703086 26703086 -> 0 0 0 0
7 0/0 -> 26706768 26706768 26706768 26706768 26706768 -> 0 0 0 0
10 0/0 -> 26705221 26705221 26705221 26705221 26705221 -> 0 0 0 0
11 0/0 -> 26703240 26703240 26703240 26703240 26703240 -> 0 0 0 0
12 0/0 -> 26701973 26701973 26701973 26701973 26701973 -> 0 0 0 0
13 0/0 -> 26708119 26708119 26708119 26708119 26708119 -> 0 0 0 0
14 0/0 -> 5330377 5330377 5330377 5330377 5330377 -> 0 0 0 0
15 0/0 -> 26711346 26711346 26711346 26711346 26711346 -> 0 0 0 0
16 0/0 -> 26706719 26706719 26706719 26706719 26706719 -> 0 0 0 0
The right most column “lost fails” should be “0” or not incrementing. If the values are in-crementing, please escalate to Cisco to immediately begin investigation.

System Verification
Collecting a Show Support Details
Overview
This section covers how to collect Tech Support information for troubleshooting.
Commands and Outputs
These steps allow the User to collect a “show support details” from the ASR 5000/ASR 5500chassis.
Note: Make sure CLI session logging has been enabled.
Estimated Time for completion: 5-25 minutes, depends on the configuration of the chassis
1. This command will provide a snapshot of the system:
This version of the command will send the output to the User’s screen:
#> show support details
This version of the command will create a compressed file and save it to the “/flash/” file sys-tem on the chassis:
#> show support details to file /flash/<filename> compress
Expected Output:
Sending to the screen:
[local]RTP-ASR5K> show support details
Sunday October 19 21:20:07 UTC 2014
******** show version verbose *******
Active Software:
Image Version: 15.0 (54944)
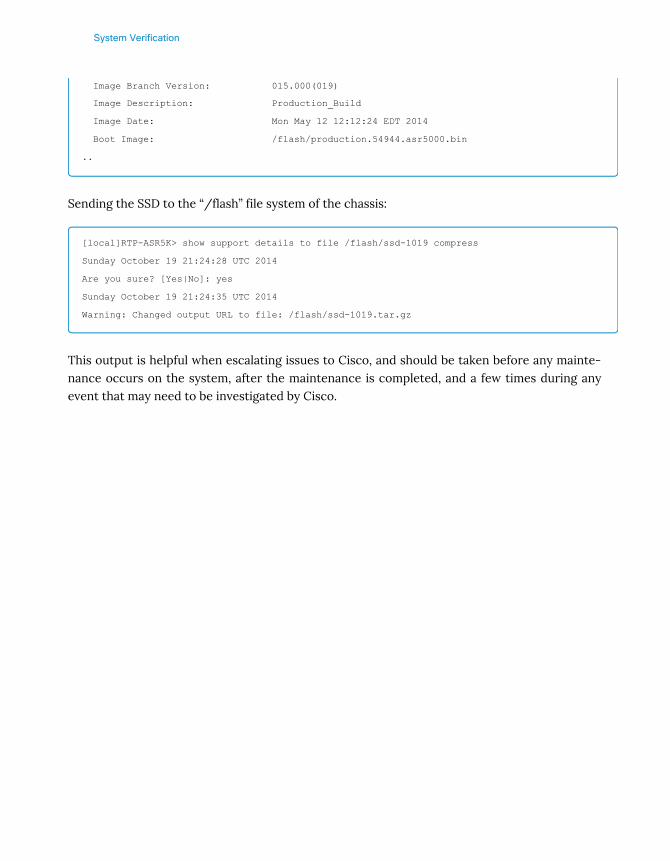
System Verification
Image Branch Version: 015.000(019)
Image Description: Production_Build
Image Date: Mon May 12 12:12:24 EDT 2014
Boot Image: /flash/production.54944.asr5000.bin
..
Sending the SSD to the “/flash” file system of the chassis:
[local]RTP-ASR5K> show support details to file /flash/ssd-1019 compress
Sunday October 19 21:24:28 UTC 2014
Are you sure? [Yes|No]: yes
Sunday October 19 21:24:35 UTC 2014
Warning: Changed output URL to file: /flash/ssd-1019.tar.gz
This output is helpful when escalating issues to Cisco, and should be taken before any mainte-nance occurs on the system, after the maintenance is completed, and a few times during anyevent that may need to be investigated by Cisco.

Platform Troubleshooting


Platform Troubleshooting
CPU/Memory issues
Overview
This section discusses different types of resources that can be monitored on ASR 5000/ASR5500.
Description
In the ASR 5000/ASR 5500 chassis, different types of resources are monitored.
• CPU
• Memory
• Files
• Sessions
CPU/Memory
CPU and memory usage are monitored by the system in multiple ways:
• CPU/Memory per card - This is the usage of physical cpu and memory on each card.
• CPU/Memory per process - This is the usage of each process.
• CPU/Memory per system/kernel - This is similar to the first, but from the Linux kernelperspective.
Files
This is a file descriptor opened by a process. The number of file descriptors is monitored by thesystem. There are also multiple ways the system monitors for files; process level and Linuxlevel.
Sessions
Session counts are applicable to sessmgrs, aaamgrs, and some demux tasks. A new sessionwould be rejected once the max-limit, defined by either the individual task limit or the systemlicense limit, is reached.
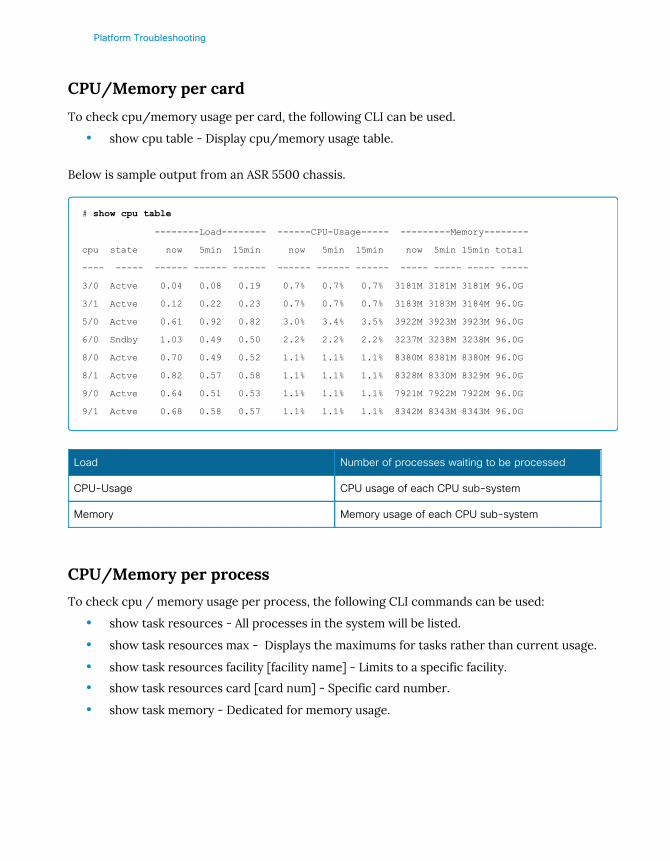
Platform Troubleshooting
CPU/Memory per card
To check cpu/memory usage per card, the following CLI can be used.
• show cpu table - Display cpu/memory usage table.
Below is sample output from an ASR 5500 chassis.
# show cpu table
--------Load-------- ------CPU-Usage----- ---------Memory--------
cpu state now 5min 15min now 5min 15min now 5min 15min total
---- ----- ------ ------ ------ ------ ------ ------ ----- ----- ----- -----
3/0 Actve 0.04 0.08 0.19 0.7% 0.7% 0.7% 3181M 3181M 3181M 96.0G
3/1 Actve 0.12 0.22 0.23 0.7% 0.7% 0.7% 3183M 3183M 3184M 96.0G
5/0 Actve 0.61 0.92 0.82 3.0% 3.4% 3.5% 3922M 3923M 3923M 96.0G
6/0 Sndby 1.03 0.49 0.50 2.2% 2.2% 2.2% 3237M 3238M 3238M 96.0G
8/0 Actve 0.70 0.49 0.52 1.1% 1.1% 1.1% 8380M 8381M 8380M 96.0G
8/1 Actve 0.82 0.57 0.58 1.1% 1.1% 1.1% 8328M 8330M 8329M 96.0G
9/0 Actve 0.64 0.51 0.53 1.1% 1.1% 1.1% 7921M 7922M 7922M 96.0G
9/1 Actve 0.68 0.58 0.57 1.1% 1.1% 1.1% 8342M 8343M 8343M 96.0G
CPU/Memory per process
To check cpu / memory usage per process, the following CLI commands can be used:
• show task resources - All processes in the system will be listed.
• show task resources max - Displays the maximums for tasks rather than current usage.
• show task resources facility [facility name] - Limits to a specific facility.
• show task resources card [card num] - Specific card number.
• show task memory - Dedicated for memory usage.
Load Number of processes waiting to be processed
CPU-Usage CPU usage of each CPU sub-system
Memory Memory usage of each CPU sub-system
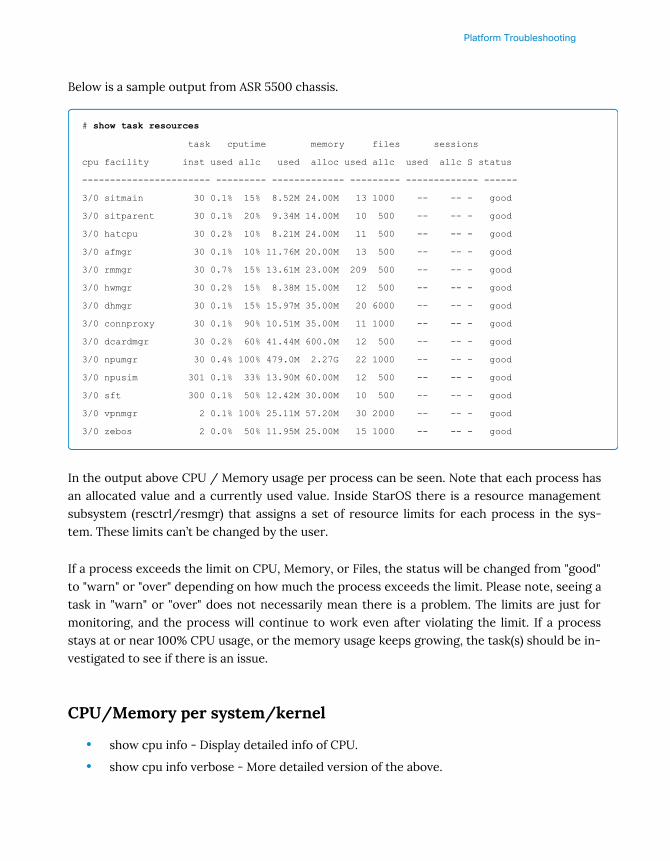
Platform Troubleshooting
Below is a sample output from ASR 5500 chassis.
# show task resources
task cputime memory files sessions
cpu facility inst used allc used alloc used allc used allc S status
----------------------- --------- ------------- --------- ------------- ------
3/0 sitmain 30 0.1% 15% 8.52M 24.00M 13 1000 -- -- - good
3/0 sitparent 30 0.1% 20% 9.34M 14.00M 10 500 -- -- - good
3/0 hatcpu 30 0.2% 10% 8.21M 24.00M 11 500 -- -- - good
3/0 afmgr 30 0.1% 10% 11.76M 20.00M 13 500 -- -- - good
3/0 rmmgr 30 0.7% 15% 13.61M 23.00M 209 500 -- -- - good
3/0 hwmgr 30 0.2% 15% 8.38M 15.00M 12 500 -- -- - good
3/0 dhmgr 30 0.1% 15% 15.97M 35.00M 20 6000 -- -- - good
3/0 connproxy 30 0.1% 90% 10.51M 35.00M 11 1000 -- -- - good
3/0 dcardmgr 30 0.2% 60% 41.44M 600.0M 12 500 -- -- - good
3/0 npumgr 30 0.4% 100% 479.0M 2.27G 22 1000 -- -- - good
3/0 npusim 301 0.1% 33% 13.90M 60.00M 12 500 -- -- - good
3/0 sft 300 0.1% 50% 12.42M 30.00M 10 500 -- -- - good
3/0 vpnmgr 2 0.1% 100% 25.11M 57.20M 30 2000 -- -- - good
3/0 zebos 2 0.0% 50% 11.95M 25.00M 15 1000 -- -- - good
In the output above CPU / Memory usage per process can be seen. Note that each process hasan allocated value and a currently used value. Inside StarOS there is a resource managementsubsystem (resctrl/resmgr) that assigns a set of resource limits for each process in the sys-tem. These limits can’t be changed by the user.
If a process exceeds the limit on CPU, Memory, or Files, the status will be changed from "good"to "warn" or "over" depending on how much the process exceeds the limit. Please note, seeing atask in "warn" or "over" does not necessarily mean there is a problem. The limits are just formonitoring, and the process will continue to work even after violating the limit. If a processstays at or near 100% CPU usage, or the memory usage keeps growing, the task(s) should be in-vestigated to see if there is an issue.
CPU/Memory per system/kernel
• show cpu info - Display detailed info of CPU.
• show cpu info verbose - More detailed version of the above.

Platform Troubleshooting
Below is a sample output from an ASR 5500 chassis.
# show cpu info verbose
Card 3, CPU 0:
Status : Active, Kernel Running, Tasks Running
Load Average : 0.20, 0.22, 0.22 (1.51 max)
Total Memory : 98304M (49152M node-0, 49152M node-1)
Kernel Uptime : 12D 1H 20M
Last Reading:
CPU Usage All : 0.6% user, 0.1% sys, 0.0% io, 0.0% irq, 99.3% idle
Node 0 : 0.5% user, 0.1% sys, 0.0% io, 0.0% irq, 99.4% idle
Core 0 : 0.1% user, 0.3% sys, 0.0% io, 0.0% irq, 99.6% idle
Core 12 : 0.1% user, 0.2% sys, 0.0% io, 0.0% irq, 99.7% idle
Core 1 : 0.0% user, 0.1% sys, 0.0% io, 0.0% irq, 99.9% idle
Core 13 : 0.2% user, 0.4% sys, 0.0% io, 0.0% irq, 99.4% idle
Core 2 : 0.1% user, 0.0% sys, 0.0% io, 0.0% irq, 99.9% idle
Core 14 : 0.0% user, 0.0% sys, 0.0% io, 0.0% irq, 100.0% idle
Core 3 : 0.0% user, 0.0% sys, 0.0% io, 0.0% irq, 100.0% idle
Core 15 : 0.0% user, 0.0% sys, 0.0% io, 0.0% irq, 100.0% idle
Core 4 : 4.7% user, 0.1% sys, 0.0% io, 0.1% irq, 95.1% idle
Core 16 : 0.2% user, 0.1% sys, 0.0% io, 0.0% irq, 99.7% idle
Core 5 : 0.1% user, 0.1% sys, 0.0% io, 0.0% irq, 99.8% idle
Core 17 : 0.1% user, 0.1% sys, 0.0% io, 0.0% irq, 99.8% idle
Node 1 : 0.6% user, 0.1% sys, 0.0% io, 0.0% irq, 99.2% idle
Core 6 : 5.7% user, 0.2% sys, 0.0% io, 0.1% irq, 94.0% idle
Core 18 : 0.3% user, 0.0% sys, 0.0% io, 0.0% irq, 99.7% idle
Core 7 : 0.0% user, 0.2% sys, 0.0% io, 0.0% irq, 99.8% idle
Core 19 : 0.0% user, 0.1% sys, 0.0% io, 0.0% irq, 99.9% idle
Core 8 : 0.0% user, 0.0% sys, 0.0% io, 0.0% irq, 100.0% idle
Core 20 : 0.0% user, 0.1% sys, 0.0% io, 0.0% irq, 99.9% idle
Core 9 : 1.4% user, 0.1% sys, 0.0% io, 0.0% irq, 98.5% idle
Core 21 : 0.0% user, 0.2% sys, 0.0% io, 0.0% irq, 99.8% idle
Core 10 : 0.0% user, 0.0% sys, 0.0% io, 0.0% irq, 100.0% idle
Core 22 : 0.1% user, 0.1% sys, 0.0% io, 0.0% irq, 99.8% idle
Core 11 : 0.2% user, 0.1% sys, 0.0% io, 0.1% irq, 99.6% idle
Core 23 : 0.0% user, 0.1% sys, 0.0% io, 0.0% irq, 99.9% idle
Processes / Tasks : 213 processes / 19 tasks
Network cpeth0 : 0.090 kpps rx, 0.102 mbps rx, 0.064 kpps tx, 0.442 mbps tx
[ High res sample : 0.097 kpps rx, 0.105 mbps rx, 0.064 kpps tx, 0.067 mbps tx ]

Platform Troubleshooting
Network cpeth1 : 0.075 kpps rx, 0.093 mbps rx, 0.043 kpps tx, 0.037 mbps tx
[ High res sample : 0.081 kpps rx, 0.096 mbps rx, 0.051 kpps tx, 0.044 mbps tx ]
Network mcdma0 : 0.000 kpps rx, 0.000 mbps rx, 0.000 kpps tx, 0.000 mbps tx
Network mcdma1 : 0.000 kpps rx, 0.000 mbps rx, 0.000 kpps tx, 0.000 mbps tx
Network mcdma2 : 0.000 kpps rx, 0.000 mbps rx, 0.000 kpps tx, 0.000 mbps tx
Network mcdma3 : 0.000 kpps rx, 0.000 mbps rx, 0.000 kpps tx, 0.000 mbps tx
Network mcdmaN : 0.000 kpps rx, 0.000 mbps rx, 0.000 kpps tx, 0.000 mbps tx
Network Total : 0.166 kpps rx, 0.195 mbps rx, 0.108 kpps tx, 0.480 mbps tx
File Usage : 1056 open files, 9899609 available
Memory Usage : 3180M 3.2% used (1549M 3.2% node-0, 1630M 3.3% node-1)
Memory Details:
Static : 1438M kernel, 177M image
System : 8M tmp, 0M buffers, 185M kcache, 70M cache
Process/Task : 1260M (126M small, 688M huge, 446M other)
Other : 38M shared data
In the output, as highlighted, is the cpu / memory usage at the Linux kernel level. For cpu, thefollowing can be checked:
If there is high cpu usage, check the following. For example, the high CPU in the output below isbeing caused by IO.
Card 5, CPU 0:
Status : Active, Kernel Running, Tasks Running
Load Average : 531.06, 529.32, 524.18 (531.06 max)
Total Memory : 98304M
Kernel Uptime : 23D 8H 23M
Last Reading:
CPU Usage All : 6.1% user, 3.8% sys, 80.6% io, 1.8% irq, 7.7% idle
user User process
sys Kernel process
io Waiting for I/O completion
irq Interrupts
idle Idle time

Platform Troubleshooting
Core 0 : 7.0% user, 6.9% sys, 83.5% io, 2.6% irq, 0.0% idle
Core 6 : 6.4% user, 5.4% sys, 84.7% io, 3.5% irq, 0.0% idle
Core 1 : 4.1% user, 3.3% sys, 91.4% io, 1.2% irq, 0.0% idle
Core 7 : 4.2% user, 4.3% sys, 90.6% io, 0.9% irq, 0.0% idle
Core 2 : 4.9% user, 2.8% sys, 90.8% io, 1.5% irq, 0.0% idle
Core 8 : 6.0% user, 1.9% sys, 91.1% io, 1.0% irq, 0.0% idle
Core 3 : 3.3% user, 3.7% sys, 91.3% io, 1.7% irq, 0.0% idle
Core 9 : 3.0% user, 1.8% sys, 94.4% io, 0.8% irq, 0.0% idle
Core 4 : 4.2% user, 2.1% sys, 0.0% io, 1.0% irq, 92.7% idle
Core 10 : 4.7% user, 2.8% sys, 90.1% io, 2.4% irq, 0.0% idle
Core 5 : 8.8% user, 5.8% sys, 83.3% io, 2.1% irq, 0.0% idle
Core 11 : 16.6% user, 5.0% sys, 75.8% io, 2.6% irq, 0.0% idle
An important command for live troubleshooting provides graphs per values reported in thecommand:
show cpu performance verbose graphs
The above CLI command requires CLI test-commands passwordconfigured in the chassis.Please use the command with caution! Many TEST commands areprocessor-intensive and can cause serious system problems if used toofrequently.
Troubleshooting for CPU/Memory issues
CPU
For high CPU issues, refer to the following commands:
• show task resources - Check if any proclet goes warn/over state.
• show task resource max - Check max usage rather than current usage.
• show snmp trap history - Check if there is any CPUWarn/Over event.
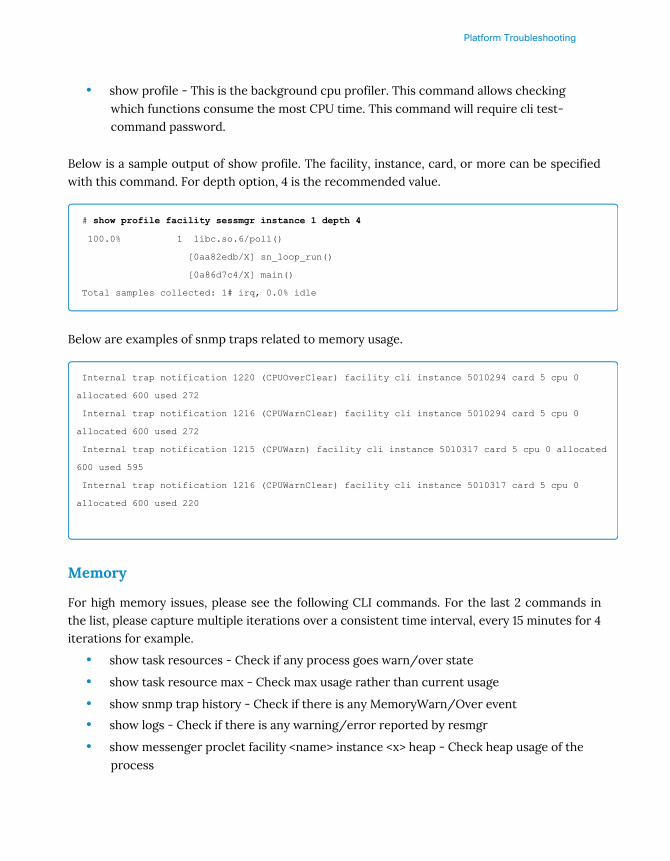
Platform Troubleshooting
• show profile - This is the background cpu profiler. This command allows checkingwhich functions consume the most CPU time. This command will require cli test-command password.
Below is a sample output of show profile. The facility, instance, card, or more can be specifiedwith this command. For depth option, 4 is the recommended value.
# show profile facility sessmgr instance 1 depth 4
100.0% 1 libc.so.6/poll()
[0aa82edb/X] sn_loop_run()
[0a86d7c4/X] main()
Total samples collected: 1# irq, 0.0% idle
Below are examples of snmp traps related to memory usage.
Internal trap notification 1220 (CPUOverClear) facility cli instance 5010294 card 5 cpu 0
allocated 600 used 272
Internal trap notification 1216 (CPUWarnClear) facility cli instance 5010294 card 5 cpu 0
allocated 600 used 272
Internal trap notification 1215 (CPUWarn) facility cli instance 5010317 card 5 cpu 0 allocated
600 used 595
Internal trap notification 1216 (CPUWarnClear) facility cli instance 5010317 card 5 cpu 0
allocated 600 used 220
Memory
For high memory issues, please see the following CLI commands. For the last 2 commands inthe list, please capture multiple iterations over a consistent time interval, every 15 minutes for 4iterations for example.
• show task resources - Check if any process goes warn/over state
• show task resource max - Check max usage rather than current usage
• show snmp trap history - Check if there is any MemoryWarn/Over event
• show logs - Check if there is any warning/error reported by resmgr
• show messenger proclet facility <name> instance <x> heap - Check heap usage of theprocess
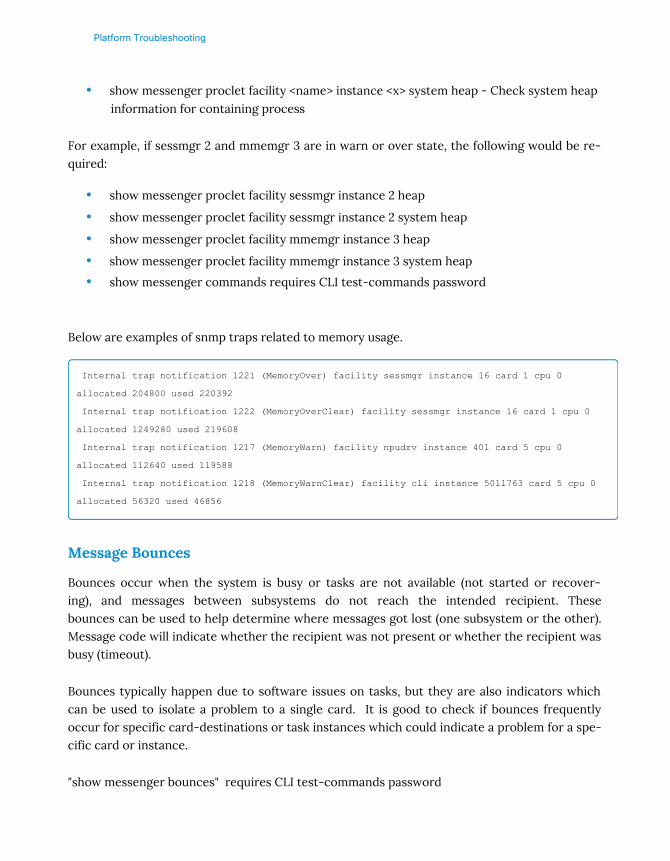
Platform Troubleshooting
• show messenger proclet facility <name> instance <x> system heap - Check system heapinformation for containing process
For example, if sessmgr 2 and mmemgr 3 are in warn or over state, the following would be re-quired:
• show messenger proclet facility sessmgr instance 2 heap
• show messenger proclet facility sessmgr instance 2 system heap
• show messenger proclet facility mmemgr instance 3 heap
• show messenger proclet facility mmemgr instance 3 system heap
• show messenger commands requires CLI test-commands password
Below are examples of snmp traps related to memory usage.
Internal trap notification 1221 (MemoryOver) facility sessmgr instance 16 card 1 cpu 0
allocated 204800 used 220392
Internal trap notification 1222 (MemoryOverClear) facility sessmgr instance 16 card 1 cpu 0
allocated 1249280 used 219608
Internal trap notification 1217 (MemoryWarn) facility npudrv instance 401 card 5 cpu 0
allocated 112640 used 119588
Internal trap notification 1218 (MemoryWarnClear) facility cli instance 5011763 card 5 cpu 0
allocated 56320 used 46856
Message Bounces
Bounces occur when the system is busy or tasks are not available (not started or recover-ing), and messages between subsystems do not reach the intended recipient. Thesebounces can be used to help determine where messages got lost (one subsystem or the other).Message code will indicate whether the recipient was not present or whether the recipient wasbusy (timeout).
Bounces typically happen due to software issues on tasks, but they are also indicators whichcan be used to isolate a problem to a single card. It is good to check if bounces frequentlyoccur for specific card-destinations or task instances which could indicate a problem for a spe-cific card or instance.
"show messenger bounces" requires CLI test-commands password
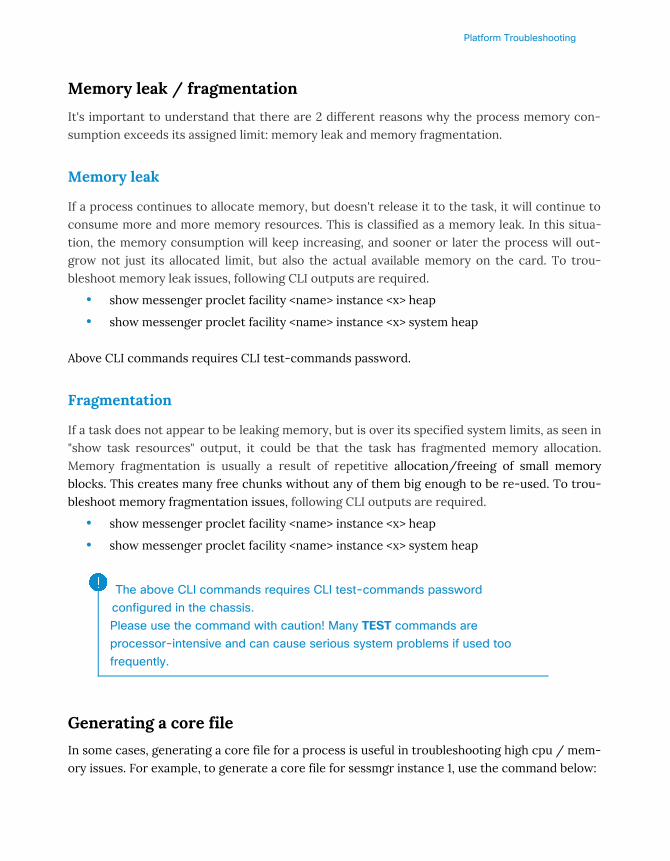
Platform Troubleshooting
Memory leak / fragmentation
It's important to understand that there are 2 different reasons why the process memory con-sumption exceeds its assigned limit: memory leak and memory fragmentation.
Memory leak
If a process continues to allocate memory, but doesn't release it to the task, it will continue toconsume more and more memory resources. This is classified as a memory leak. In this situa-tion, the memory consumption will keep increasing, and sooner or later the process will out-grow not just its allocated limit, but also the actual available memory on the card. To trou-bleshoot memory leak issues, following CLI outputs are required.
• show messenger proclet facility <name> instance <x> heap
• show messenger proclet facility <name> instance <x> system heap
Above CLI commands requires CLI test-commands password.
Fragmentation
If a task does not appear to be leaking memory, but is over its specified system limits, as seen in"show task resources" output, it could be that the task has fragmented memory allocation.Memory fragmentation is usually a result of repetitive allocation/freeing of small memoryblocks. This creates many free chunks without any of them big enough to be re-used. To trou-bleshoot memory fragmentation issues, following CLI outputs are required.
• show messenger proclet facility <name> instance <x> heap
• show messenger proclet facility <name> instance <x> system heap
The above CLI commands requires CLI test-commands passwordconfigured in the chassis.Please use the command with caution! Many TEST commands areprocessor-intensive and can cause serious system problems if used toofrequently.
Generating a core file
In some cases, generating a core file for a process is useful in troubleshooting high cpu / mem-ory issues. For example, to generate a core file for sessmgr instance 1, use the command below:

Platform Troubleshooting
• task core facility sessmgr instance 1
Above CLI command requires CLI test-commands password
Make sure "crash enable" is properly configured when issuing the above CLI.
Console Logs
If SSD is collected, please inspect the debug console card <> cpu <> tail 10000 only com-mand output for the relevant card(s) and observe if there are any recent kernel messages. Ifpresent, these may provide an indication of resource issues. Please note that in older versionsof StarOS, the beginning of the lines in the console logs are Unix timestamps.
Above CLI command requires CLI test-commands password
Following is an example of how to translate unixtime into UTC with date command on anyLinux server:
date -d @1376209406.298 -u Sun Aug 11 08:23:26 UTC 2013
Use http://www.epochconverter.com/ to convert unix time to human readable text or usebelow shell script in Linux M/c.
Action Plan for high CPU issues:
The following is standard information required to troubleshoot any task with high CPU. The fol-lowing commands are not intrusive to the system, but it is highly recommended to run themduring a Maintenance Window (MW) only.
CLI commands below require the CLI test-commands password:
• show task resources table - Check which task is utilizing high CPU
• Collect the output of the following commands in hidden mode: "show profile facility<task-facility> active instance <instance> depth 1" where depth could be 1,4 and/or 8
• Collect the core dump for any of the affected tasks with high CPU using "task corefacility <task-facility> instance <instance-value>"
• Collect SSD when some process/facility is facing high CPU state.
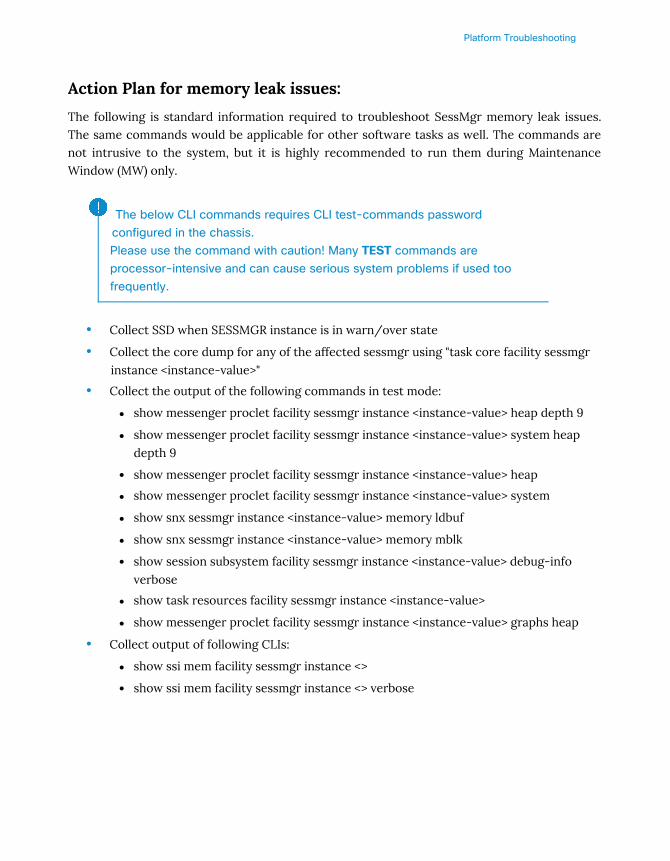
Platform Troubleshooting
Action Plan for memory leak issues:
The following is standard information required to troubleshoot SessMgr memory leak issues.The same commands would be applicable for other software tasks as well. The commands arenot intrusive to the system, but it is highly recommended to run them during MaintenanceWindow (MW) only.
The below CLI commands requires CLI test-commands passwordconfigured in the chassis.Please use the command with caution! Many TEST commands areprocessor-intensive and can cause serious system problems if used toofrequently.
• Collect SSD when SESSMGR instance is in warn/over state
• Collect the core dump for any of the affected sessmgr using "task core facility sessmgrinstance <instance-value>"
• Collect the output of the following commands in test mode:
show messenger proclet facility sessmgr instance <instance-value> heap depth 9
show messenger proclet facility sessmgr instance <instance-value> system heapdepth 9
show messenger proclet facility sessmgr instance <instance-value> heap
show messenger proclet facility sessmgr instance <instance-value> system
show snx sessmgr instance <instance-value> memory ldbuf
show snx sessmgr instance <instance-value> memory mblk
show session subsystem facility sessmgr instance <instance-value> debug-infoverbose
show task resources facility sessmgr instance <instance-value>
show messenger proclet facility sessmgr instance <instance-value> graphs heap
• Collect output of following CLIs:
show ssi mem facility sessmgr instance <>
show ssi mem facility sessmgr instance <> verbose
Platform Troubleshooting
In some cases it is necessary to collect several iterations of the same commands periodically inorder to observe which region of memory is increasing. It is highly recommended to monitorthe "show task memory" commands and observe any increase on a daily basis.
If a task crashes due to exhausting the physical memory of a card, or from being way over itsdefined limits, it is possible that the core files generated from the crash will be too big. Pleaserefer to the section related to crashes and how to increase maximum crash size. In extremecases, it may be required to capture the core prior to hitting memory maximum.
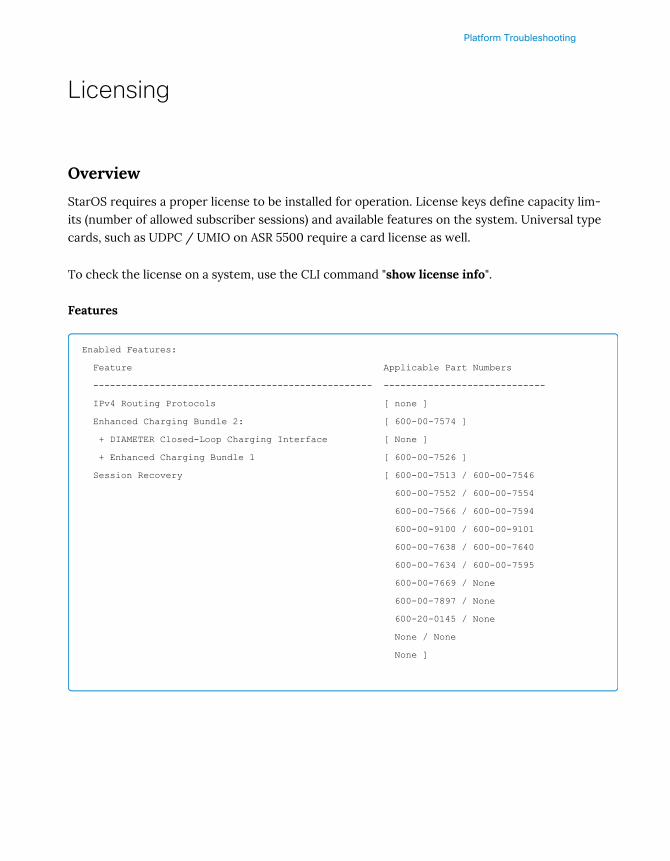
Platform Troubleshooting
Licensing
Overview
StarOS requires a proper license to be installed for operation. License keys define capacity lim-its (number of allowed subscriber sessions) and available features on the system. Universal typecards, such as UDPC / UMIO on ASR 5500 require a card license as well.
To check the license on a system, use the CLI command "show license info".
Features
Enabled Features:
Feature Applicable Part Numbers
-------------------------------------------------- -----------------------------
IPv4 Routing Protocols [ none ]
Enhanced Charging Bundle 2: [ 600-00-7574 ]
+ DIAMETER Closed-Loop Charging Interface [ None ]
+ Enhanced Charging Bundle 1 [ 600-00-7526 ]
Session Recovery [ 600-00-7513 / 600-00-7546
600-00-7552 / 600-00-7554
600-00-7566 / 600-00-7594
600-00-9100 / 600-00-9101
600-00-7638 / 600-00-7640
600-00-7634 / 600-00-7595
600-00-7669 / None
600-00-7897 / None
600-20-0145 / None
None / None
None ]

Platform Troubleshooting
Sessions
Session Limits:
Sessions Session Type
-------- -----------------------
50000 ECS
50000 PGW
Cards
CARD License Counts:
Cards License Type
------- -----------------------
4 ASR5500 Initial System SW, Per UDPC
2 ASR5500 Initial System SW, Per UMIO
How to install a new license
Several features of the ASR 5000/ASR 5500 can be used only when a license is installed. The li-cense can be obtained only from Cisco.
When the license is received, cut the text portion where indicated and paste it in configurationmode as below:
[local]ASR5000(config)# license key <A string> of size 100 to 2000
Verify that the license is properly installed with "show license info". Save the configuration asappropriate. Then synchronize the file system so the configuration file will be copied to theflash card in the standby management module.
[local]ASR5000# filesystem synchronize all
Log Collection
• show license info - To check what license is installed.

Platform Troubleshooting
• show license key - To check license key itself.
• show resources session - To check session count is under the limit.
• syslog - To check if there is any license-related log.
• snmp traps - To check if there is any license-related trap.
• show card hardware - To check serial numbers required for license.
Example Scenarios
Session count limits
Problem:
If the following license is installed, then new calls still can be established.
Always On Licensing [ 600-20-0111 ]
Logs and snmp traps similar to those shown below will be written if a license limit is exceeded:
Sat Feb 21 23:13:32 2015 Internal trap notification 65 (LicenseExceeded) license exceeded for
Enhanced Charging Service service; current sessions 1010 exceeds license 1000
Sat Feb 21 23:13:32 2015 Internal trap notification 65 (LicenseExceeded) license exceeded for
PGW service; current sessions 1010 exceeds license 1000
2015-Feb-21+23:13:32.251 [resmgr 14566 info] [5/0/27652 <rmctrl:0> ource_session.c:5136]
[software internal system critical-info syslog] The license limit for the PGW service has been
reached. In Use 1010, Limit 1000. License suppression tuned on, still accepting new PGW calls
2015-Feb-21+23:13:32.251 [resmgr 14566 info] [5/0/27652 <rmctrl:0> ource_session.c:5136]
[software internal system critical-info syslog] The license limit for the ECSv2 service has
been reached. In Use 1010, Limit 1000. License suppression tuned on, still accepting new ECSv2
calls
If the "Always on" license is not installed, new calls would be rejected, and the logs and snmptraps below will be seen:
Sat Feb 21 23:21:52 2015 Internal trap notification 65 (LicenseExceeded) license exceeded for

Platform Troubleshooting
Enhanced Charging Service service; current sessions 1010 exceeds license 1000
Sat Feb 21 23:21:52 2015 Internal trap notification 65 (LicenseExceeded) license exceeded for
PGW service; current sessions 1010 exceeds license 1000
2015-Feb-21+23:21:52.251 [resmgr 14530 warning] [5/0/27652 <rmctrl:0> ource_session.c:5138]
[software internal system critical-info syslog] The license limit for the PGW service has been
reached. In Use 1010, Limit 1000. No new PGW calls can be accepted until usage drops or
license is increased.
2015-Feb-21+23:21:52.251 [resmgr 14530 warning] [5/0/27652 <rmctrl:0> ource_session.c:5138]
[software internal system critical-info syslog] The license limit for the ECSv2 service has
been reached. In Use 1010, Limit 1000. No new ECSv2 calls can be accepted until usage drops or
license is increased.
The "show resources session" command indicates where current session levels are relative tolicense limits..
# show resources session
Session Information:
In-Use Session Managers:
Number of Managers : 6
Capacity : 52800 min / 105600 typical / 211200 max
Usage : 1010
Busy-Out Session Managers:
Number of Managers : 0
Capacity : 0 min / 0 typical / 0 max
Usage : 0
Standby Session Managers:
Number of Managers : 7
Per-Service "Max Used" values last cleared : Never
PGW Service:
In Use : 1010
Max Used : 1010 ( Saturday February 21 23:13:32 EST 2015 )
Limit : 1000
License Status : Over License Capacity (Rejecting Excess Calls)
ECS Information:
Enhanced Charging Service Service:
In Use : 1010
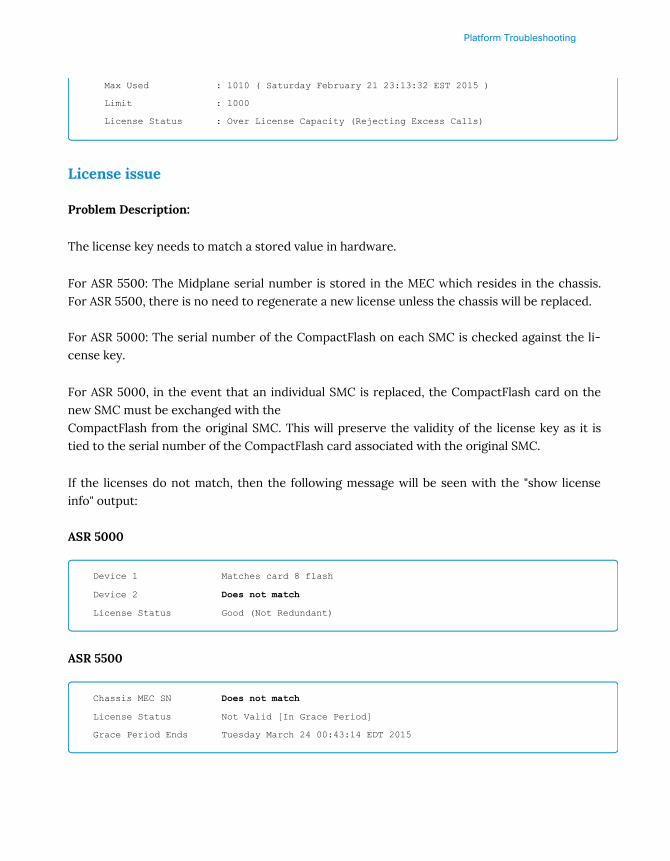
Platform Troubleshooting
Max Used : 1010 ( Saturday February 21 23:13:32 EST 2015 )
Limit : 1000
License Status : Over License Capacity (Rejecting Excess Calls)
License issue
Problem Description:
The license key needs to match a stored value in hardware.
For ASR 5500: The Midplane serial number is stored in the MEC which resides in the chassis.For ASR 5500, there is no need to regenerate a new license unless the chassis will be replaced.
For ASR 5000: The serial number of the CompactFlash on each SMC is checked against the li-cense key.
For ASR 5000, in the event that an individual SMC is replaced, the CompactFlash card on thenew SMC must be exchanged with theCompactFlash from the original SMC. This will preserve the validity of the license key as it istied to the serial number of the CompactFlash card associated with the original SMC.
If the licenses do not match, then the following message will be seen with the "show licenseinfo" output:
ASR 5000
Device 1 Matches card 8 flash
Device 2 Does not match
License Status Good (Not Redundant)
ASR 5500
Chassis MEC SN Does not match
License Status Not Valid [In Grace Period]
Grace Period Ends Tuesday March 24 00:43:14 EDT 2015
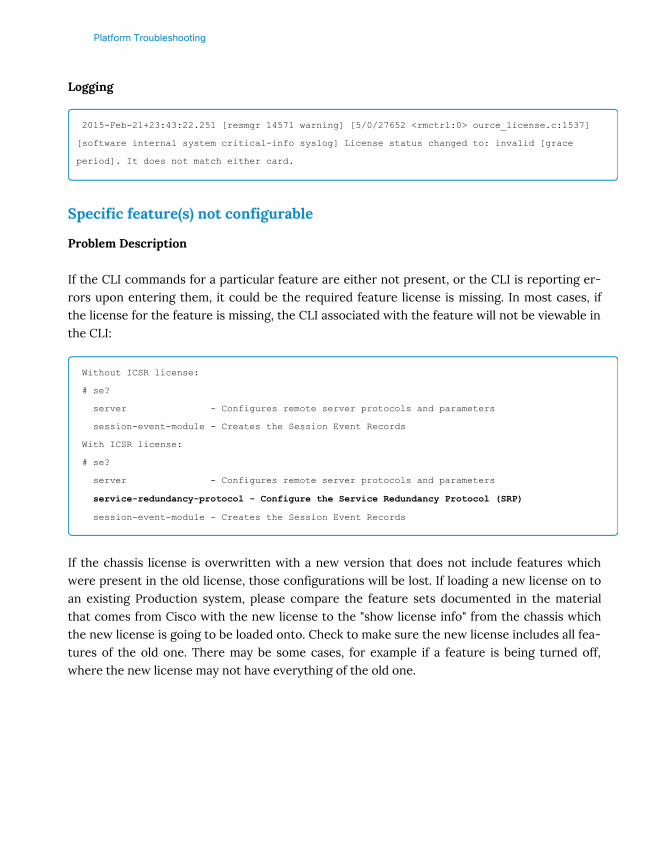
Platform Troubleshooting
Logging
2015-Feb-21+23:43:22.251 [resmgr 14571 warning] [5/0/27652 <rmctrl:0> ource_license.c:1537]
[software internal system critical-info syslog] License status changed to: invalid [grace
period]. It does not match either card.
Specific feature(s) not configurable
Problem Description
If the CLI commands for a particular feature are either not present, or the CLI is reporting er-rors upon entering them, it could be the required feature license is missing. In most cases, ifthe license for the feature is missing, the CLI associated with the feature will not be viewable inthe CLI:
Without ICSR license:
# se?
server - Configures remote server protocols and parameters
session-event-module - Creates the Session Event Records
With ICSR license:
# se?
server - Configures remote server protocols and parameters
service-redundancy-protocol - Configure the Service Redundancy Protocol (SRP)
session-event-module - Creates the Session Event Records
If the chassis license is overwritten with a new version that does not include features whichwere present in the old license, those configurations will be lost. If loading a new license on toan existing Production system, please compare the feature sets documented in the materialthat comes from Cisco with the new license to the "show license info" from the chassis whichthe new license is going to be loaded onto. Check to make sure the new license includes all fea-tures of the old one. There may be some cases, for example if a feature is being turned off,where the new license may not have everything of the old one.
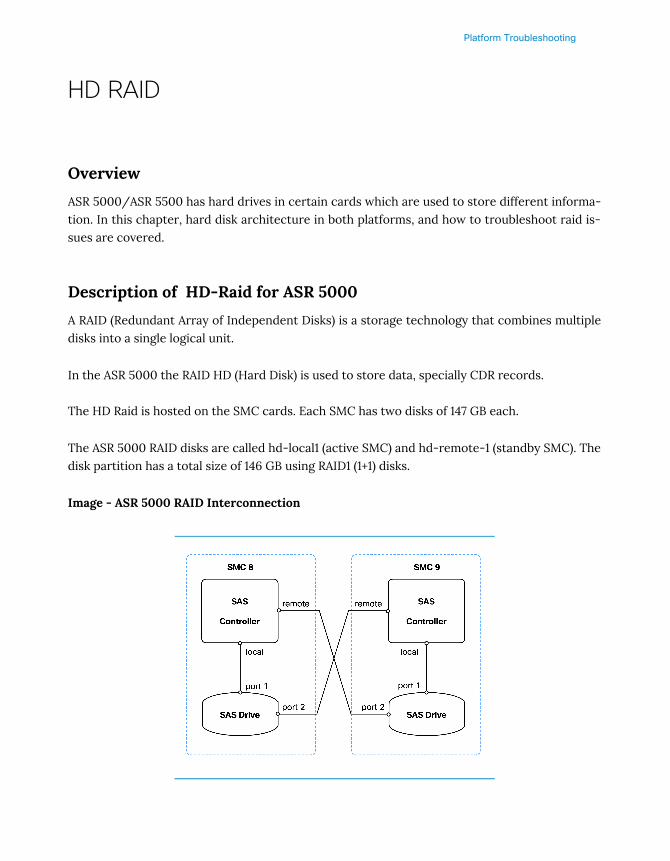
Platform Troubleshooting
HD RAID
Overview
ASR 5000/ASR 5500 has hard drives in certain cards which are used to store different informa-tion. In this chapter, hard disk architecture in both platforms, and how to troubleshoot raid is-sues are covered.
Description of HD-Raid for ASR 5000
A RAID (Redundant Array of Independent Disks) is a storage technology that combines multipledisks into a single logical unit.
In the ASR 5000 the RAID HD (Hard Disk) is used to store data, specially CDR records.
The HD Raid is hosted on the SMC cards. Each SMC has two disks of 147 GB each.
The ASR 5000 RAID disks are called hd-local1 (active SMC) and hd-remote-1 (standby SMC). Thedisk partition has a total size of 146 GB using RAID1 (1+1) disks.
Image - ASR 5000 RAID Interconnection

Platform Troubleshooting
Description of HD-Raid for ASR 5500
In the ASR 5500, the storage is located in the FSC (Fabric and Storage Cards) cards. A minimumof three FSCs is required, and a maximum of six FSCs are supported. Although four FSCs are re-quired for redundancy, the system can operate with three FSCs in the presence of a fourthfailed FSC. Four FSCs must be installed for normal operation. The drive size is 200 GB and thereare 2 dual port SSD drives.
In the ASR 5500 the disks are called hd13, hd14, hd15 etc. The total capacity of the RAID de-pends on the number of FSC cards.
Image - ASR 5500 RAID Interconnection
HDCTRL task. The hard disk controller task is called HDCTRL. It is responsible for diskmanagement, RAID setup, file system management and Network File System (NFS) support. Italso provides disk monitoring, file synchronization, basic free space management and simplecleanup support.
Troubleshooting HD RAID
The following are general troubleshooting commands that are useful for troubleshooting of HDRAID issues:

Platform Troubleshooting
• show hd raid verbose - Check HD RAID status
• show card table - Check card’s status
• show card hardware - Check a card’s hardware
• show active-charging edr-udr-file statistics / show cdr statistics
• dir /hd-raid/records/ - Check billing records
• show snmp trap history verbose - Monitor recent traps related to RAIDe.g. RaidDegraded
The below CLI commands requires CLI test-commands passwordconfigured in the chassis.Please use the command with caution! Many TEST commands areprocessor-intensive and can cause serious system problems if used toofrequently.
• debug hdctrl lssas - Check physical links
• show hd smart - Check Self-Monitoring, Analysis and Reporting Technology (SMART)statistics for hard drives
Please refer to the Console Logs in the CPU/Memory Issues chapter for additional trou-bleshooting steps.
Example Sceanrios
Uncorrected errors incrementing in HD Raid
Problem Description:
Total uncorrected errors incrementing continuously with the command "show hd smart ...":
Logs collected:
Error counter log:
Errors Corrected by Total Correction Gigabytes Total
ECC rereads/ errors algorithm processed uncorrected
fast | delayed rewrites corrected invocations [10^9 bytes] errors

Platform Troubleshooting
read: 0 0 0 0 0 135681.146 31554
write: 0 0 0 0 0 5250.918 4564
Resolution:
If the errors are incrementing continuously, the hardware must be replaced; contact Cisco forassistance.
Problem Description:
In ASR 5000, HD RAID is in 'degraded' state.
When chassis detects RAID is degraded, it will trigger the following snmp trap:
Internal trap notification 1079 (RaidDegraded) Raid array hd-raid degraded
CLI command 'show hd raid verbose' shows if RAID is degraded or not:
[local] HA# show hd raid verbose
HD RAID:
State : Available (clean)
Degraded : Yes
UUID : 954baf46:1198a1bb:c085fdd9:0a56c169
Size : 146000000000 bytes
Action : Idle
Disk : hd-local1
Created : Tue Apr 27 05:56:53 2010
Updated : Sat Sep 24 13:54:45 2011
Events : 1213068
Model : SEAGATE-ST9146802SS
Serial Number : 3NM1DKT8000000000SYS
Location : SMC8 PLB00000000
Size : 146815737856 bytes
Partitions : 1
Partition 1 : 146006913024 bytes or 285169752 sectors
Disk : hd-remote1
State : In-sync component
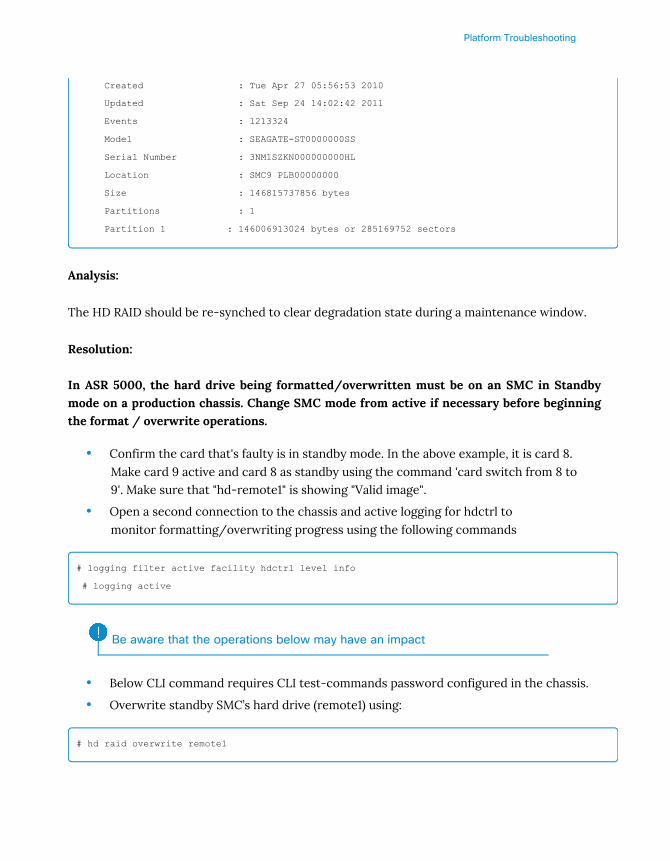
Platform Troubleshooting
Created : Tue Apr 27 05:56:53 2010
Updated : Sat Sep 24 14:02:42 2011
Events : 1213324
Model : SEAGATE-ST0000000SS
Serial Number : 3NM1SZKN000000000HL
Location : SMC9 PLB00000000
Size : 146815737856 bytes
Partitions : 1
Partition 1 : 146006913024 bytes or 285169752 sectors
Analysis:
The HD RAID should be re-synched to clear degradation state during a maintenance window.
Resolution:
In ASR 5000, the hard drive being formatted/overwritten must be on an SMC in Standbymode on a production chassis. Change SMC mode from active if necessary before beginningthe format / overwrite operations.
• Confirm the card that's faulty is in standby mode. In the above example, it is card 8.Make card 9 active and card 8 as standby using the command 'card switch from 8 to9'. Make sure that "hd-remote1" is showing "Valid image".
• Open a second connection to the chassis and active logging for hdctrl tomonitor formatting/overwriting progress using the following commands
# logging filter active facility hdctrl level info # logging active
Be aware that the operations below may have an impact
• Below CLI command requires CLI test-commands password configured in the chassis.
• Overwrite standby SMC’s hard drive (remote1) using:
# hd raid overwrite remote1
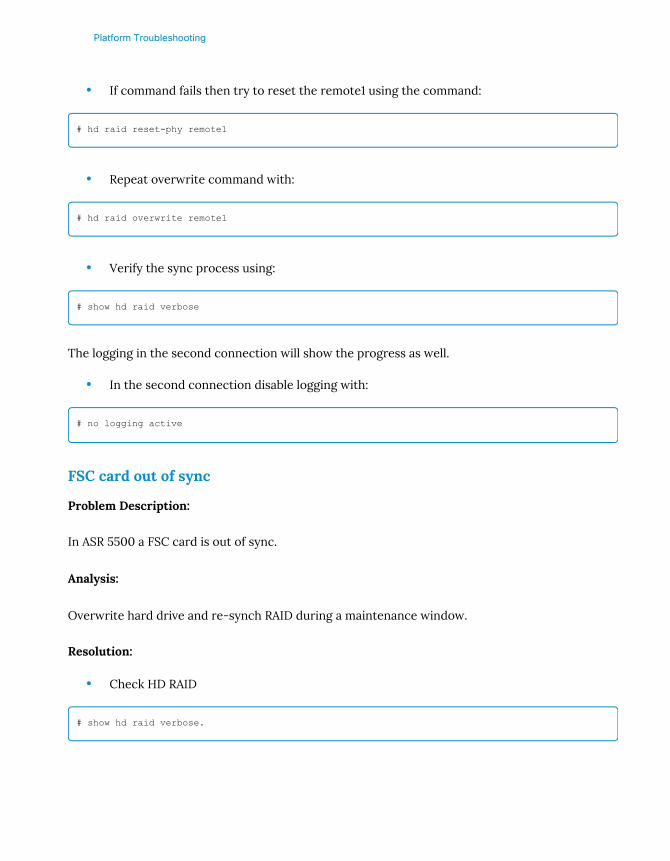
Platform Troubleshooting
• If command fails then try to reset the remote1 using the command:
# hd raid reset-phy remote1
• Repeat overwrite command with:
# hd raid overwrite remote1
• Verify the sync process using:
# show hd raid verbose
The logging in the second connection will show the progress as well.
• In the second connection disable logging with:
# no logging active
FSC card out of sync
Problem Description:
In ASR 5500 a FSC card is out of sync.
Analysis:
Overwrite hard drive and re-synch RAID during a maintenance window.
Resolution:
• Check HD RAID
# show hd raid verbose.

Platform Troubleshooting
• Open second connection to the chassis and active logging for hdctrl tomonitor overwrite progress:
# logging filter active facility hdctrl level info # logging active
• Below CLI command requires CLI test-commands password configured in the chassis.
• Overwrite hard drive with the issue (e.g. hd14, hd15, hd16, hd17)
Be aware that the operations below may have an impact
# hd raid overwrite < hd14, hd15, hd16, hd17>
• Check overwrite progress with "show hd raid verbose". The logging will show overwriteprogress as well.
• Disable logging in second connection:
# no logging active
Firmware upgrade Warning Logs for HD
Problem Description:
Following logs observed in the syslogs for FSC cards.
2014-Dec-10+00:19:17.899 [hdctrl 132018 warning] [6/0/18682 <hdctrl:0> ctrl_fsm_disk.c:2435]
[software internal system critical-info syslog] Disk hd16a (STEC Z0000000-200UCU E46E) needs
firmware upgrade!
Analysis:
In the output above the hard drive firmware on the disk, hd16a should be upgraded during themaintenance window (MW).

Platform Troubleshooting
Disk firmware upgrade. When HDCTRL issues the following warnings, the firmware of harddrive (HD) on a FSC card may be upgraded but most likely the data on disk would be wiped out,so the effect looks like formatting, and the procedures are similar.
HD firmware upgrade must be done one card at a time - do NOT startupgrade on another card utill it finished previous one.
Resolution:
• Check HD RAID, it has to be in non-degraded state. Do not start the followingprocedures with degraded HD RAID.
show hd raid verbose
The below CLI commands requires CLI test-commands passwordconfigured in the chassis.Please use the command with caution! Many TEST commands areprocessor-intensive and can cause serious system problems if used toofrequently.
• Remove FSC from RAID. This is needed before a firmware upgrade. To preserve RAIDdata, make sure RAID is not degraded before issuing this command:
# hd raid remove hd16 -force
Note that "-force" is needed to disable RAID0 on the two disks for further steps, and the com-mand should be executed even if a previous "hd raid remove hd16" had been executed (without"-force").
• Upgrade firmware of both disks:
# debug hdctrl upgrade-firmware hd16a # debug hdctrl upgrade-firmware hd16b

Platform Troubleshooting
Note that disks will be power cycled. Insert FSC back to RAID if needed:
# hd raid insert hd16
Note that this is needed only when trying to preseve RAID data. Do not reload the chassis whileRAID is being rebuilt.
• Check status with the command below:
# show hd raid verbose


Platform Troubleshooting
Software Crashes
Overview
As with any software, there are times when situations arise in processing where the underlyinglogic fails and the software task must restart itself to get back to proper working order. Thissection details how to check for such crash events in the system, and the information to collectso issues resulting in crashes can be addressed by Cisco.
Troubleshooting Commands
Use the commands below to get more information about crashes on the system:
• show crash list
• show crash number [number].
When reporting this crash to Cisco TAC support, the following info needs to be collected:
• show support details to file /flash/[name].tar.gz compress
this archive will contain SSD support file and minicore files
• core dump of the crash
A minicore file contains information about the failing task like current stack-trace, past profilersamples, past memory-activity samples, and a few other things bundled into a proprietary file-format.
A Core dump (or full core) provides a full memory dump of the process immediately after thecrash condition was encountered. This memory dump is often crucial to find the root cause ofthe software crash.

Platform Troubleshooting
Interpretations and collection of show crash list
The indication that some process has crashed is the TaskFailed SNMP trap. Example of SNMPtraps in the show snmp trap history verbose command:
Fri Dec 26 08:32:20 2014 Internal trap notification 73 (ManagerFailure) facility sessmgr
instance 188 card 7 cpu 0
Fri Dec 26 08:32:20 2014 Internal trap notification 150 (TaskFailed) facility sessmgr instance
188 on card 7 cpu 0
Fri Dec 26 08:32:23 2014 Internal trap notification 1099 (ManagerRestart) facility sessmgr
instance 139 card 4 cpu 1
Fri Dec 26 08:32:23 2014 Internal trap notification 151 (TaskRestart) facility sessmgr
instance 139 on card 4 cpu 1
Please monitor logs for the following message after a crash [show logs]:
2015-Apr-14+15:11:39.497 [sitmain 4090 warning] [5/0/7167 <sitparent:50> crashd.c:889]
[software internal system critical-info syslog] No full core destination configured; not
collecting core
If the above log is seen, it indicates that a location for full cores is not configured. Full cores areoften essential for a quick and complete analysis of software crash issues. Please be sure toconfigure a destination where the system can send full cores. This can be done via the followingconfig level CLI:
[local]asr5k(config)# crash enable url
One of: [file:]{/flash | /usb1 | /hd-raid}[/directory]/<filename>
tftp://<host>[:<port>][/<directory>]/<filename
ftp://[<username>[:<password>]@]<host>[:<port>][/<directory>]/<filename
sftp://[<username>[:<password>]@]<host>[:<port>][/<directory>]/<filename
Make sure there is space available for storing core files. To double check current crash configuse the following command (requires CLI test command password):
[local]asr5000# show crash config
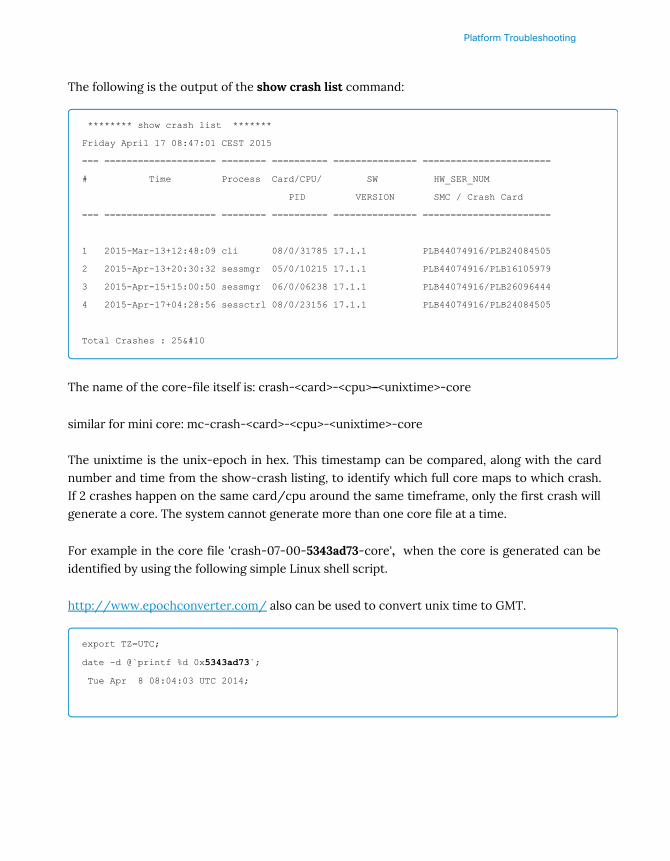
Platform Troubleshooting
The following is the output of the show crash list command:
******** show crash list *******
Friday April 17 08:47:01 CEST 2015
=== ==================== ======== ========== =============== =======================
# Time Process Card/CPU/ SW HW_SER_NUM
PID VERSION SMC / Crash Card
=== ==================== ======== ========== =============== =======================
1 2015-Mar-13+12:48:09 cli 08/0/31785 17.1.1 PLB44074916/PLB24084505
2 2015-Apr-13+20:30:32 sessmgr 05/0/10215 17.1.1 PLB44074916/PLB16105979
3 2015-Apr-15+15:00:50 sessmgr 06/0/06238 17.1.1 PLB44074916/PLB26096444
4 2015-Apr-17+04:28:56 sessctrl 08/0/23156 17.1.1 PLB44074916/PLB24084505
Total Crashes : 25

The name of the core-file itself is: crash-<card>-<cpu>-<unixtime>-core
similar for mini core: mc-crash-<card>-<cpu>-<unixtime>-core
The unixtime is the unix-epoch in hex. This timestamp can be compared, along with the cardnumber and time from the show-crash listing, to identify which full core maps to which crash.If 2 crashes happen on the same card/cpu around the same timeframe, only the first crash willgenerate a core. The system cannot generate more than one core file at a time.
For example in the core file 'crash-07-00-5343ad73-core', when the core is generated can beidentified by using the following simple Linux shell script.
http://www.epochconverter.com/ also can be used to convert unix time to GMT.
export TZ=UTC;
date -d @`printf %d 0x5343ad73`;
Tue Apr 8 08:04:03 UTC 2014;

Platform Troubleshooting
Perl example:
perl –e ‘print scalar(localtime(0x5343ad73))’;
Other behaviors within "show crash list" to be aware of:
• Similar crashes will be consolidated into one record. The record does display thenumber of times this crash type has occurred.
********************* CRASH #02 ***********************
SW Version : 15.0(55812)
Similar Crash Count : 2
Time of First Crash : 2015-Jan-26+10:37:08
• Sometimes only a core file is generated while there is no record in show crash list. Thiscould be a crash of non-StarOS processes such as telnet, or stack overflow.
Check crash related to one or more sessmgrs
With continuous or multiple task crashes, the first step is to determine if the crashes are re-lated to a specific task instance, specific card, or if they are equally distributed across all cards/ manager instances. To determine this, on any Unix/Linux server, parse output of the SSD(support_summary) or output the command "show snmp trap history verbose".
The following Linux command shows the distribution of the crashes per cards:
grep TaskFailed show_snmp_trap_history_verbose.txt | awk '{print $17}' | sort | uniq -c | sort
-n -r
21 15
19 6
11 13
10 4
In this example there are 21 crashes on card 15, 19 crashes on card 6 and 11 crashes on card13. In cases where multiple active cards are on the chassis, and crashes are related only to spe-cific cards, troubleshooting would require more detailed analysis of the info related to
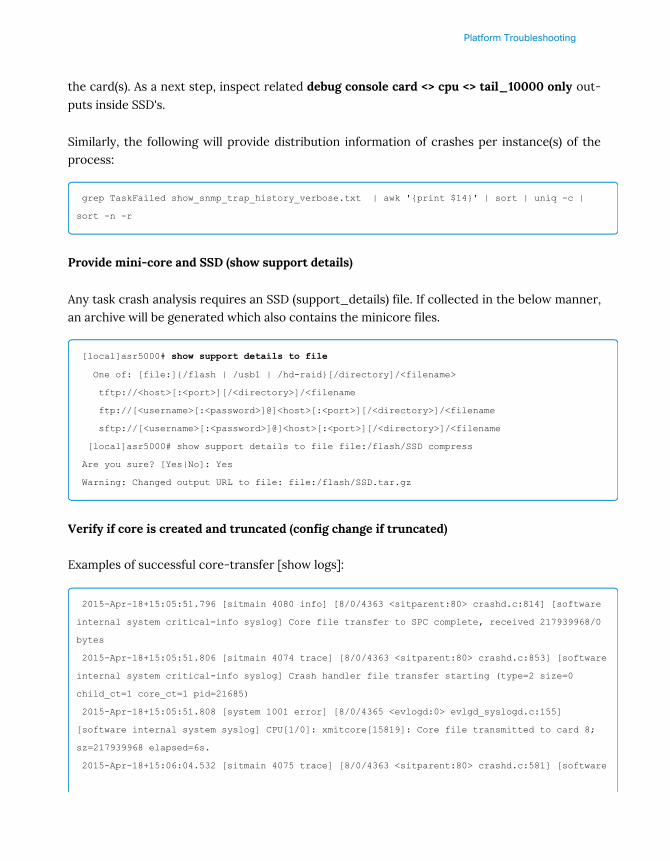
Platform Troubleshooting
the card(s). As a next step, inspect related debug console card <> cpu <> tail_10000 only out-puts inside SSD's.
Similarly, the following will provide distribution information of crashes per instance(s) of theprocess:
grep TaskFailed show_snmp_trap_history_verbose.txt | awk '{print $14}' | sort | uniq -c |
sort -n -r
Provide mini-core and SSD (show support details)
Any task crash analysis requires an SSD (support_details) file. If collected in the below manner,an archive will be generated which also contains the minicore files.
[local]asr5000# show support details to file
One of: [file:]{/flash | /usb1 | /hd-raid}[/directory]/<filename>
tftp://<host>[:<port>][/<directory>]/<filename
ftp://[<username>[:<password>]@]<host>[:<port>][/<directory>]/<filename
sftp://[<username>[:<password>]@]<host>[:<port>][/<directory>]/<filename
[local]asr5000# show support details to file file:/flash/SSD compress
Are you sure? [Yes|No]: Yes
Warning: Changed output URL to file: file:/flash/SSD.tar.gz
Verify if core is created and truncated (config change if truncated)
Examples of successful core-transfer [show logs]:
2015-Apr-18+15:05:51.796 [sitmain 4080 info] [8/0/4363 <sitparent:80> crashd.c:814] [software
internal system critical-info syslog] Core file transfer to SPC complete, received 217939968/0
bytes
2015-Apr-18+15:05:51.806 [sitmain 4074 trace] [8/0/4363 <sitparent:80> crashd.c:853] [software
internal system critical-info syslog] Crash handler file transfer starting (type=2 size=0
child_ct=1 core_ct=1 pid=21685)
2015-Apr-18+15:05:51.808 [system 1001 error] [8/0/4365 <evlogd:0> evlgd_syslogd.c:155]
[software internal system syslog] CPU[1/0]: xmitcore[15819]: Core file transmitted to card 8;
sz=217939968 elapsed=6s.
2015-Apr-18+15:06:04.532 [sitmain 4075 trace] [8/0/4363 <sitparent:80> crashd.c:581] [software

Platform Troubleshooting
internal system critical-info syslog] Crash handler file transfer ended (type=2 size=0
child_ct=0 core_ct=0 pid=21685 status=1 elapsed=13s)
Examples failed core-transfer [show logs]:
2015-Apr-18+15:02:14.877 [sitmain 4080 info] [8/0/4363 <sitparent:80> crashd.c:814] [software
internal system critical-info syslog] Core file transfer to SPC complete, received 196546560/0
bytes
2015-Apr-18+15:02:14.883 [sitmain 4074 trace] [8/0/4363 <sitparent:80> crashd.c:853] [software
internal system critical-info syslog] Crash handler file transfer starting (type=2 size=0
child_ct=1 core_ct=1 pid=21128)
2015-Apr-18+15:02:14.886 [system 1001 error] [8/0/4365 <evlogd:0> evlgd_syslogd.c:155]
[software internal system syslog] CPU[2/1]: xmitcore[18952]: Out of time after 20s while
writing core type 2 to master
If core files are already transferred, the following is a quick check to validate if the transfer wassuccessful:
$ mv crash-07-00-5343ad73-core crash-07-00-5343ad73-core.gz
$ gunzip crash-07-00-5343ad73-core
$ echo $?
0
If gunzip doesn't report any error, and output of the echo $? is 0, then the core transfer wassuccessful:
$ mv crash-16-00-51e7259a-core crash-16-00-51e7259a-core.gz
$ gunzip crash-16-00-51e7259a-core.gz
gunzip: crash-16-00-51e7259a-core.gz: unexpected end of file
$ echo $?
1
If gunzip reports an error such as "unexpected end of file", and output of the echo $? is 1, thencore transfer was not successful and the core file is truncated. If "failed core transfer" syslog
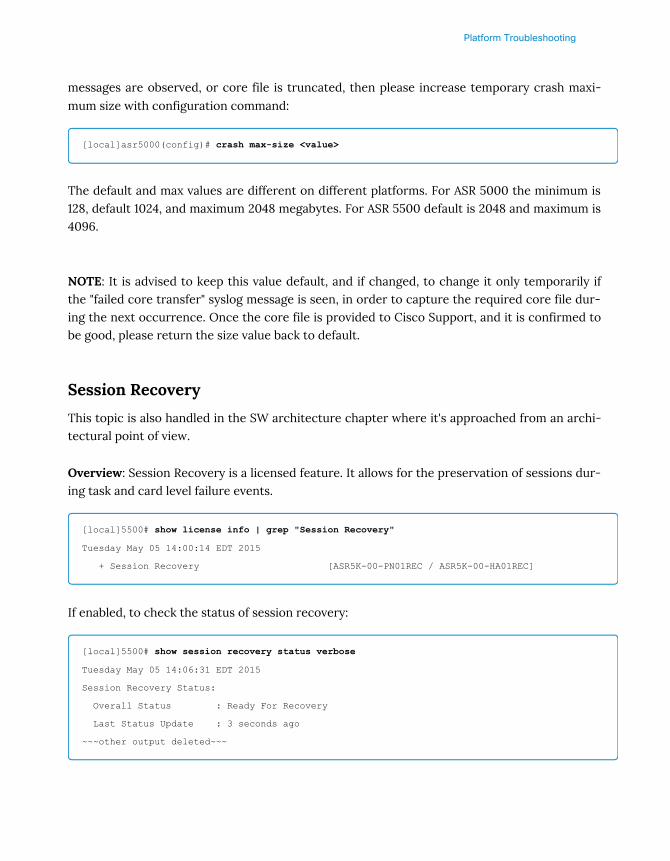
Platform Troubleshooting
messages are observed, or core file is truncated, then please increase temporary crash maxi-mum size with configuration command:
[local]asr5000(config)# crash max-size <value>
The default and max values are different on different platforms. For ASR 5000 the minimum is128, default 1024, and maximum 2048 megabytes. For ASR 5500 default is 2048 and maximum is4096.
NOTE: It is advised to keep this value default, and if changed, to change it only temporarily ifthe "failed core transfer" syslog message is seen, in order to capture the required core file dur-ing the next occurrence. Once the core file is provided to Cisco Support, and it is confirmed tobe good, please return the size value back to default.
Session Recovery
This topic is also handled in the SW architecture chapter where it's approached from an archi-tectural point of view.
Overview: Session Recovery is a licensed feature. It allows for the preservation of sessions dur-ing task and card level failure events.
[local]5500# show license info | grep "Session Recovery"
Tuesday May 05 14:00:14 EDT 2015
+ Session Recovery [ASR5K-00-PN01REC / ASR5K-00-HA01REC]
If enabled, to check the status of session recovery:
[local]5500# show session recovery status verbose
Tuesday May 05 14:06:31 EDT 2015
Session Recovery Status:
Overall Status : Ready For Recovery
Last Status Update : 3 seconds ago
~~~other output deleted~~~

Platform Troubleshooting
Session Recovery is based around three managers within the chassis; SessMgr, AAAMgr, andVPNMgr. The SessMgr and AAAMgr back each other up by instance number. For example, Sess-Mgr instance 100 is paired with AAAMgr instance 100. If one were to crash, the other could re-build the session info. VPNMgr comes into play with IP allocations and reservations for the ses-sions. The VPNMgr instance ID is equal to the context ID where the IP pools are configured forthe chassis. If there are multiple contexts with IP pools, there could be multiple VPNMgrs in-volved in a recovery event. As part of the requirements for Session Recovery, all three managersmust live on different cards in the chassis. SessMgr and AAAMgr will live on active processingcards whereas VPNMgr will live on the demux card.
[local]5500# show task resources facility sessmgr instance 100
Tuesday May 05 14:17:59 EDT 2015
task cputime memory files sessions
cpu facility inst used allc used alloc used allc used allc S status
----------------------- --------- ------------- --------- ------------- ------
3/1 sessmgr 100 12% 100% 414.9M 900.0M 35 500 4225 12000 I good
Total 1 12.67% 414.9M 35 4225
[local]5500# show task resources facility aaamgr instance 100
Tuesday May 05 14:18:10 EDT 2015
task cputime memory files sessions
cpu facility inst used allc used alloc used allc used allc S status
----------------------- --------- ------------- --------- ------------- ------
1/0 aaamgr 100 0.9% 95% 116.0M 250.0M 18 500 -- -- - good
Total 1 0.96% 116.0M 18 0
[local]5500# show task resources facility vpnmgr instance 3
Tuesday May 05 14:18:27 EDT 2015
task cputime memory files sessions
cpu facility inst used allc used alloc used allc used allc S status
----------------------- --------- ------------- --------- ------------- ------
5/0 vpnmgr 3 1.3% 100% 42.38M 147.9M 1948 2000 -- -- - good
Total 1 1.35% 42.38M 1948 0
Session Recovery requires a minimum of one Standby processor card (recommendation is twoprocessor cards to cover double failure scenarios) as well as a dedicated Demux card. In 5500the Demux can be either on MIO or DPC. In 5000, Demux must be on a PSC. Given the hard-ware requirements, for there to be a true hardware-related resource issue which would causeproblems with session recovery, there would need to be two processor card failures.
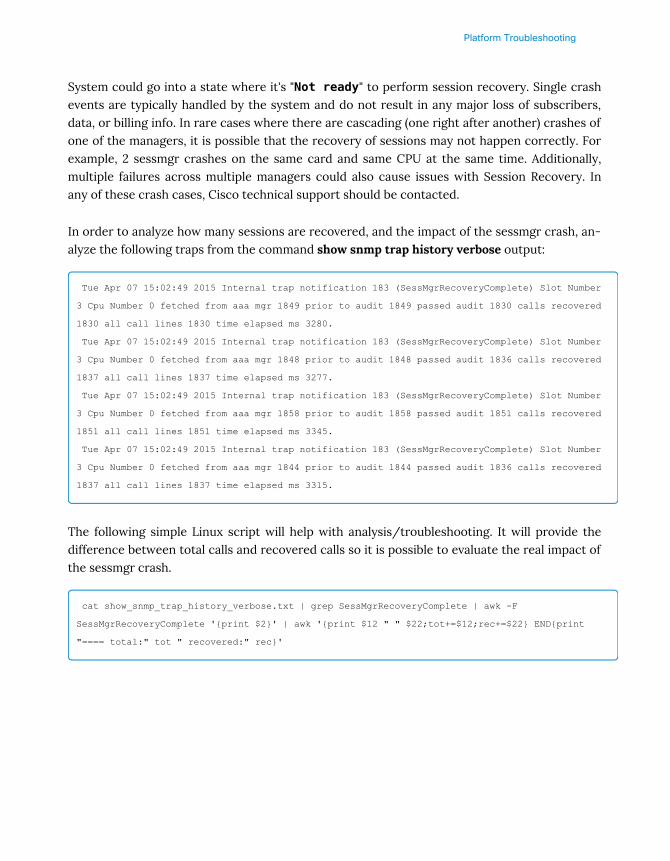
Platform Troubleshooting
System could go into a state where it's "Not ready" to perform session recovery. Single crashevents are typically handled by the system and do not result in any major loss of subscribers,data, or billing info. In rare cases where there are cascading (one right after another) crashes ofone of the managers, it is possible that the recovery of sessions may not happen correctly. Forexample, 2 sessmgr crashes on the same card and same CPU at the same time. Additionally,multiple failures across multiple managers could also cause issues with Session Recovery. Inany of these crash cases, Cisco technical support should be contacted.
In order to analyze how many sessions are recovered, and the impact of the sessmgr crash, an-alyze the following traps from the command show snmp trap history verbose output:
Tue Apr 07 15:02:49 2015 Internal trap notification 183 (SessMgrRecoveryComplete) Slot Number
3 Cpu Number 0 fetched from aaa mgr 1849 prior to audit 1849 passed audit 1830 calls recovered
1830 all call lines 1830 time elapsed ms 3280.
Tue Apr 07 15:02:49 2015 Internal trap notification 183 (SessMgrRecoveryComplete) Slot Number
3 Cpu Number 0 fetched from aaa mgr 1848 prior to audit 1848 passed audit 1836 calls recovered
1837 all call lines 1837 time elapsed ms 3277.
Tue Apr 07 15:02:49 2015 Internal trap notification 183 (SessMgrRecoveryComplete) Slot Number
3 Cpu Number 0 fetched from aaa mgr 1858 prior to audit 1858 passed audit 1851 calls recovered
1851 all call lines 1851 time elapsed ms 3345.
Tue Apr 07 15:02:49 2015 Internal trap notification 183 (SessMgrRecoveryComplete) Slot Number
3 Cpu Number 0 fetched from aaa mgr 1844 prior to audit 1844 passed audit 1836 calls recovered
1837 all call lines 1837 time elapsed ms 3315.
The following simple Linux script will help with analysis/troubleshooting. It will provide thedifference between total calls and recovered calls so it is possible to evaluate the real impact ofthe sessmgr crash.
cat show_snmp_trap_history_verbose.txt | grep SessMgrRecoveryComplete | awk -F
SessMgrRecoveryComplete '{print $2}' | awk '{print $12 " " $22;tot+=$12;rec+=$22} END{print
"==== total:" tot " recovered:" rec}'
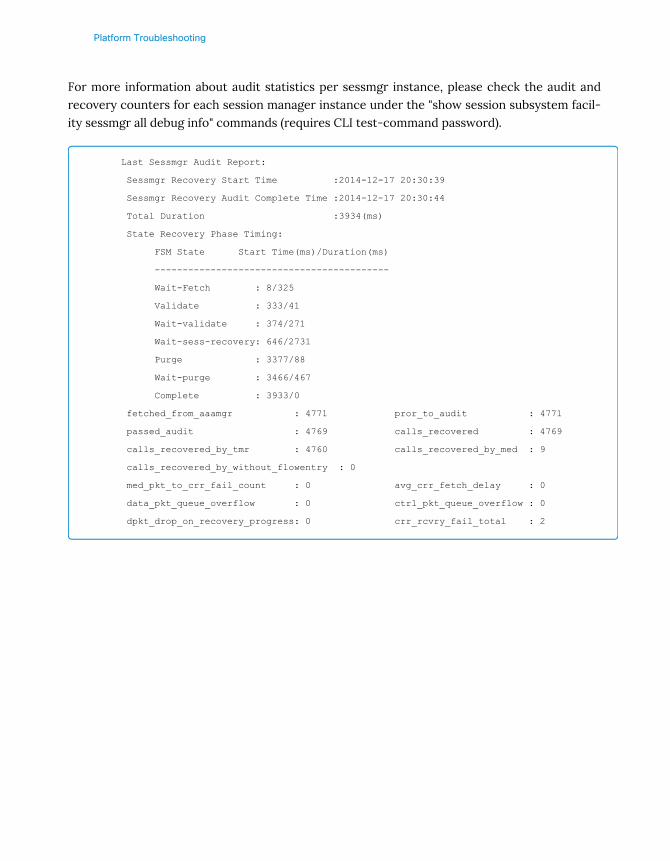
Platform Troubleshooting
For more information about audit statistics per sessmgr instance, please check the audit andrecovery counters for each session manager instance under the "show session subsystem facil-ity sessmgr all debug info" commands (requires CLI test-command password).
Last Sessmgr Audit Report:
Sessmgr Recovery Start Time :2014-12-17 20:30:39
Sessmgr Recovery Audit Complete Time :2014-12-17 20:30:44
Total Duration :3934(ms)
State Recovery Phase Timing:
FSM State Start Time(ms)/Duration(ms)
------------------------------------------
Wait-Fetch : 8/325
Validate : 333/41
Wait-validate : 374/271
Wait-sess-recovery: 646/2731
Purge : 3377/88
Wait-purge : 3466/467
Complete : 3933/0
fetched_from_aaamgr : 4771 pror_to_audit : 4771
passed_audit : 4769 calls_recovered : 4769
calls_recovered_by_tmr : 4760 calls_recovered_by_med : 9
calls_recovered_by_without_flowentry : 0
med_pkt_to_crr_fail_count : 0 avg_crr_fetch_delay : 0
data_pkt_queue_overflow : 0 ctrl_pkt_queue_overflow : 0
dpkt_drop_on_recovery_progress: 0 crr_rcvry_fail_total : 2

Platform Troubleshooting
ARP Troubleshooting
Overview
The following chapter covers the basic Address Resolution Protocol (ARP) troubleshooting.
The following commands are helpful in identifying ARP entries and clearing them. As every con-text is a virtual router, arp entries are for that particular context:
• show ip arp
• clear ip arp
Sample Output:
[local]SPGW-1#
[local]SPGW-1# context spgw
[spgw]SPGW-1#
[spgw]SPGW-1#
[spgw]SPGW-1# show ip arp
Flags codes:
I - Incomplete, R - Reachable, M - Permanent, S - Stale,
D - Delay, P - Probe, F - Failed
Address Link Type Link Address Flags Mask Interface
10.201.251.7 ether 00:50:56:9C:5D:2D R spgw
192.168.10.30 ether 00:50:56:9C:16:23 R spgw
10.201.251.23 ether 00:0C:29:D4:18:0A R spgw
10.201.251.25 ether 00:50:56:9C:0E:14 R spgw
10.201.251.1 ether 00:24:97:2F:4B:00 R spgw
10.201.251.9 ether 00:50:56:9C:36:77 R spgw
10.201.251.5 ether 00:50:56:9C:61:B8 R spgw
192.168.5.130 ether 00:50:56:9C:61:B8 R spgw
Total number of arps: 8
[spgw]SPGW-1#
[spgw]SPGW-1#

Platform Troubleshooting
1 Logging can be enabled to identify low level information about ARP. This should only be
done upon recommendation from Cisco Support as increasing the logging too high may
risk stress on the system and impact subscribers:
• logging filter active facility ip-arp level unusual
• logging filter active facility vpn level unusual
• logging filter active facility npumgr level unusual
• logging active
Once required logging output is collected, it is required to do 'no logging active'.

Platform Troubleshooting
Card and Port Troubleshooting
Overview
Major commands and multiple troubleshooting scenarios related to cards and ports in the ASR5000/ASR 5000 are covered in this chapter.
Troubleshooting commands
For troubleshooting ASR 5000 / ASR 5500 hardware problems, following commands/logsare used
• show system uptime - Check if the system recently reloaded
• show card table all - Shows cards operational states
• show card diag <slot> - Verify "Current Failure", Last Failure reason, environmentalvariables
• show cpu table - Monitor CPU utilization, see if it exceeds 70% on any of the cards
• show cpu info - Monitor CPU usage, file usage, memory usage
• show card memory - Monitor memory errors
• show cpu errors - Monitor CPU errors
• show rct stat - Found in 'show support details' prior to 16.0. Monitor if any cardmigration, switchovers and shutdowns happened recently
• show port table all - Monitor status of the interfaces
• show port transceiver <slot/port> - applicable to ASR 5500 only. Monitor RxPower /TxPower
• show port utilization table - Monitor port utilization, observe anomalies
• show port utilization graph - Monitor port utilization, observe anomalies
• show port datalink counters <slot/port> - Monitor datalink counters, look for errors
• show port npu counters <slot/port> - Monitor for errors
• show logs - Monitor recent logs, search for anomalies
• show snmp trap history verbose - Identifies recent SNMP traps
• show alarm outstanding - Monitor if any alarms are still outstanding
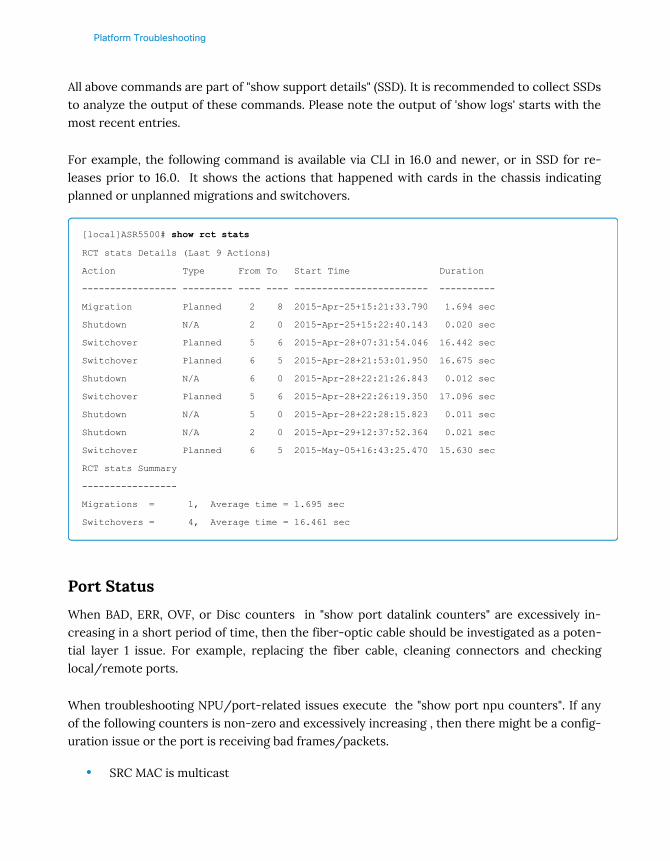
Platform Troubleshooting
All above commands are part of "show support details" (SSD). It is recommended to collect SSDsto analyze the output of these commands. Please note the output of 'show logs' starts with themost recent entries.
For example, the following command is available via CLI in 16.0 and newer, or in SSD for re-leases prior to 16.0. It shows the actions that happened with cards in the chassis indicatingplanned or unplanned migrations and switchovers.
[local]ASR5500# show rct stats
RCT stats Details (Last 9 Actions)
Action Type From To Start Time Duration
----------------- --------- ---- ---- ------------------------ ----------
Migration Planned 2 8 2015-Apr-25+15:21:33.790 1.694 sec
Shutdown N/A 2 0 2015-Apr-25+15:22:40.143 0.020 sec
Switchover Planned 5 6 2015-Apr-28+07:31:54.046 16.442 sec
Switchover Planned 6 5 2015-Apr-28+21:53:01.950 16.675 sec
Shutdown N/A 6 0 2015-Apr-28+22:21:26.843 0.012 sec
Switchover Planned 5 6 2015-Apr-28+22:26:19.350 17.096 sec
Shutdown N/A 5 0 2015-Apr-28+22:28:15.823 0.011 sec
Shutdown N/A 2 0 2015-Apr-29+12:37:52.364 0.021 sec
Switchover Planned 6 5 2015-May-05+16:43:25.470 15.630 sec
RCT stats Summary
-----------------
Migrations = 1, Average time = 1.695 sec
Switchovers = 4, Average time = 16.461 sec
Port Status
When BAD, ERR, OVF, or Disc counters in "show port datalink counters" are excessively in-creasing in a short period of time, then the fiber-optic cable should be investigated as a poten-tial layer 1 issue. For example, replacing the fiber cable, cleaning connectors and checkinglocal/remote ports.
When troubleshooting NPU/port-related issues execute the "show port npu counters". If anyof the following counters is non-zero and excessively increasing , then there might be a config-uration issue or the port is receiving bad frames/packets.
• SRC MAC is multicast

Platform Troubleshooting
• Unknown VLAN tag
• Bad IPv4 header
• IPv4 MRU exceeded
• TCP tiny fragment
• Filtered by ACL
• TTL expired
• Too short
• Don’t frag discards
• IPv4VlanMap dropped
• MPLS Flow not found
Example Scenarios
Problem description:
Card in slot 1 failure on boot. Card failed and standby card took over sessions.
Analysis:
Collect 'show support details'. In the SSD output 'show card diag ' shows the last reason for failure.
******** show card diag *******
Card 1:
Counters:
Successful Warm Boots : 2
(last at Tuesday May 05 05:22:14 UTC 2015)
Successful Cold Boots : 18
(last at Wednesday April 29 06:51:32 UTC 2015)
Total Boot Attempts : 0
In Service Date : Wed Feb 01 18:49:30 2012 (Estimated)
Status:
IDEEPROM Magic Number : Good
Boot Mode : Normal
Card Diagnostics : Pass
Current Failure : None
Last Failure : Failure: Device=CPU_0, Reason=CARD_BOOT_TIMEOUT_EXPIRED,
(0x03001000)
(last at Tuesday May 05 05:20:08 UTC 2015)
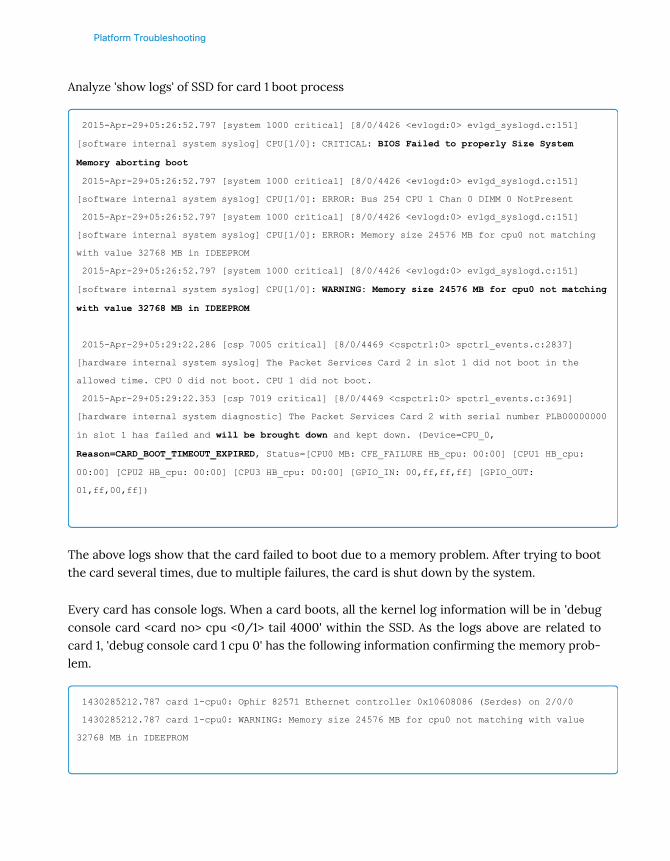
Platform Troubleshooting
Analyze 'show logs' of SSD for card 1 boot process
2015-Apr-29+05:26:52.797 [system 1000 critical] [8/0/4426 <evlogd:0> evlgd_syslogd.c:151]
[software internal system syslog] CPU[1/0]: CRITICAL: BIOS Failed to properly Size System
Memory aborting boot
2015-Apr-29+05:26:52.797 [system 1000 critical] [8/0/4426 <evlogd:0> evlgd_syslogd.c:151]
[software internal system syslog] CPU[1/0]: ERROR: Bus 254 CPU 1 Chan 0 DIMM 0 NotPresent
2015-Apr-29+05:26:52.797 [system 1000 critical] [8/0/4426 <evlogd:0> evlgd_syslogd.c:151]
[software internal system syslog] CPU[1/0]: ERROR: Memory size 24576 MB for cpu0 not matching
with value 32768 MB in IDEEPROM
2015-Apr-29+05:26:52.797 [system 1000 critical] [8/0/4426 <evlogd:0> evlgd_syslogd.c:151]
[software internal system syslog] CPU[1/0]: WARNING: Memory size 24576 MB for cpu0 not matching
with value 32768 MB in IDEEPROM
2015-Apr-29+05:29:22.286 [csp 7005 critical] [8/0/4469 <cspctrl:0> spctrl_events.c:2837]
[hardware internal system syslog] The Packet Services Card 2 in slot 1 did not boot in the
allowed time. CPU 0 did not boot. CPU 1 did not boot.
2015-Apr-29+05:29:22.353 [csp 7019 critical] [8/0/4469 <cspctrl:0> spctrl_events.c:3691]
[hardware internal system diagnostic] The Packet Services Card 2 with serial number PLB00000000
in slot 1 has failed and will be brought down and kept down. (Device=CPU_0,
Reason=CARD_BOOT_TIMEOUT_EXPIRED, Status=[CPU0 MB: CFE_FAILURE HB_cpu: 00:00] [CPU1 HB_cpu:
00:00] [CPU2 HB_cpu: 00:00] [CPU3 HB_cpu: 00:00] [GPIO_IN: 00,ff,ff,ff] [GPIO_OUT:
01,ff,00,ff])
The above logs show that the card failed to boot due to a memory problem. After trying to bootthe card several times, due to multiple failures, the card is shut down by the system.
Every card has console logs. When a card boots, all the kernel log information will be in 'debugconsole card <card no> cpu <0/1> tail 4000' within the SSD. As the logs above are related tocard 1, 'debug console card 1 cpu 0' has the following information confirming the memory prob-lem.
1430285212.787 card 1-cpu0: Ophir 82571 Ethernet controller 0x10608086 (Serdes) on 2/0/0
1430285212.787 card 1-cpu0: WARNING: Memory size 24576 MB for cpu0 not matching with value
32768 MB in IDEEPROM
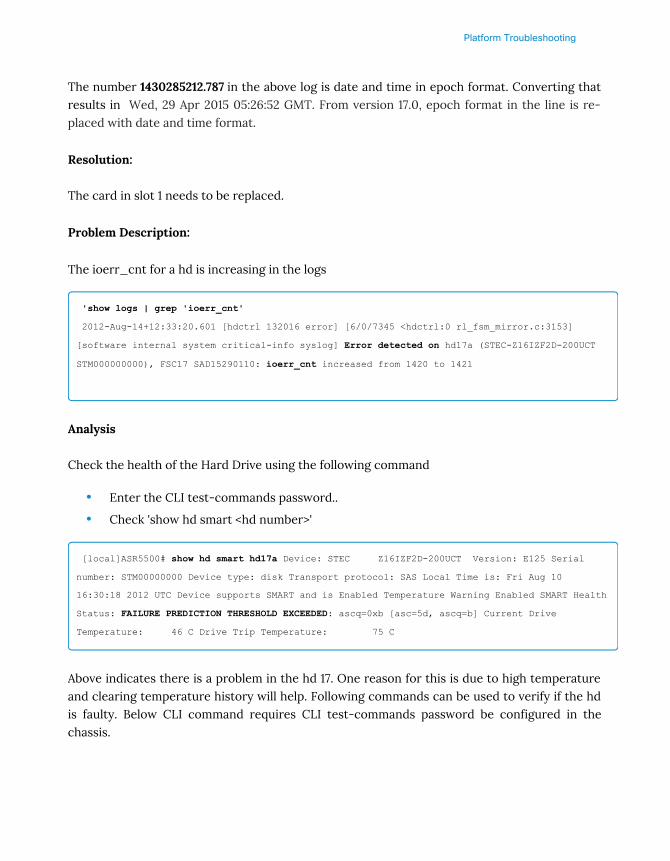
Platform Troubleshooting
The number 1430285212.787 in the above log is date and time in epoch format. Converting thatresults in Wed, 29 Apr 2015 05:26:52 GMT. From version 17.0, epoch format in the line is re-placed with date and time format.
Resolution:
The card in slot 1 needs to be replaced.
Problem Description:
The ioerr_cnt for a hd is increasing in the logs
'show logs | grep 'ioerr_cnt'
2012-Aug-14+12:33:20.601 [hdctrl 132016 error] [6/0/7345 <hdctrl:0 rl_fsm_mirror.c:3153]
[software internal system critical-info syslog] Error detected on hd17a (STEC-Z16IZF2D-200UCT
STM000000000), FSC17 SAD15290110: ioerr_cnt increased from 1420 to 1421
Analysis
Check the health of the Hard Drive using the following command
• Enter the CLI test-commands password..
• Check 'show hd smart <hd number>'
[local]ASR5500# show hd smart hd17a Device: STEC Z16IZF2D-200UCT Version: E125 Serial
number: STM00000000 Device type: disk Transport protocol: SAS Local Time is: Fri Aug 10
16:30:18 2012 UTC Device supports SMART and is Enabled Temperature Warning Enabled SMART Health
Status: FAILURE PREDICTION THRESHOLD EXCEEDED: ascq=0xb [asc=5d, ascq=b] Current Drive
Temperature: 46 C Drive Trip Temperature: 75 C
Above indicates there is a problem in the hd 17. One reason for this is due to high temperatureand clearing temperature history will help. Following commands can be used to verify if the hdis faulty. Below CLI command requires CLI test-commands password be configured in thechassis.
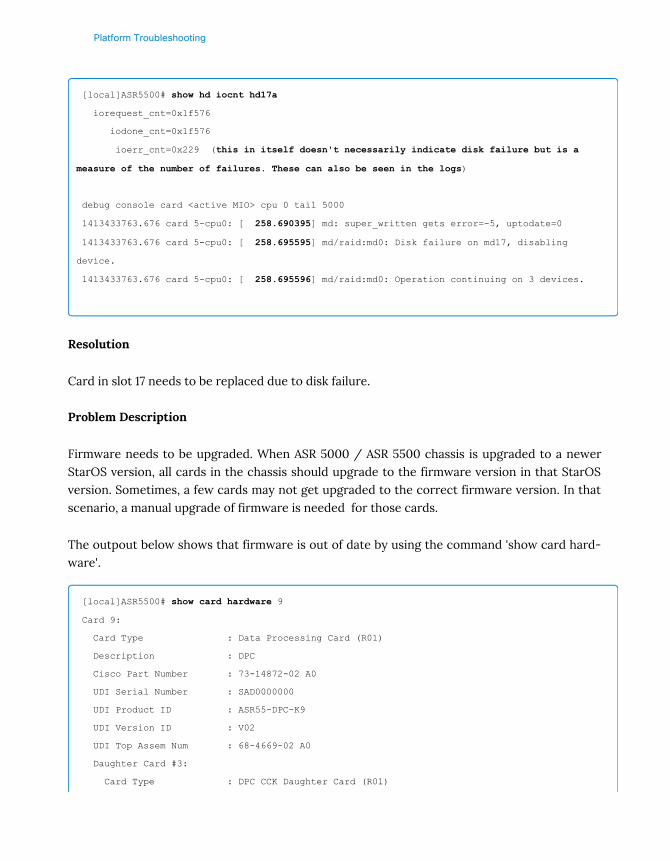
Platform Troubleshooting
[local]ASR5500# show hd iocnt hd17a
iorequest_cnt=0x1f576
iodone_cnt=0x1f576
ioerr_cnt=0x229 (this in itself doesn't necessarily indicate disk failure but is a
measure of the number of failures. These can also be seen in the logs)
debug console card <active MIO> cpu 0 tail 5000
1413433763.676 card 5-cpu0: [ 258.690395] md: super_written gets error=-5, uptodate=0
1413433763.676 card 5-cpu0: [ 258.695595] md/raid:md0: Disk failure on md17, disabling
device.
1413433763.676 card 5-cpu0: [ 258.695596] md/raid:md0: Operation continuing on 3 devices.
Resolution
Card in slot 17 needs to be replaced due to disk failure.
Problem Description
Firmware needs to be upgraded. When ASR 5000 / ASR 5500 chassis is upgraded to a newerStarOS version, all cards in the chassis should upgrade to the firmware version in that StarOSversion. Sometimes, a few cards may not get upgraded to the correct firmware version. In thatscenario, a manual upgrade of firmware is needed for those cards.
The outpout below shows that firmware is out of date by using the command 'show card hard-ware'.
[local]ASR5500# show card hardware 9
Card 9:
Card Type : Data Processing Card (R01)
Description : DPC
Cisco Part Number : 73-14872-02 A0
UDI Serial Number : SAD0000000
UDI Product ID : ASR55-DPC-K9
UDI Version ID : V02
UDI Top Assem Num : 68-4669-02 A0
Daughter Card #3:
Card Type : DPC CCK Daughter Card (R01)
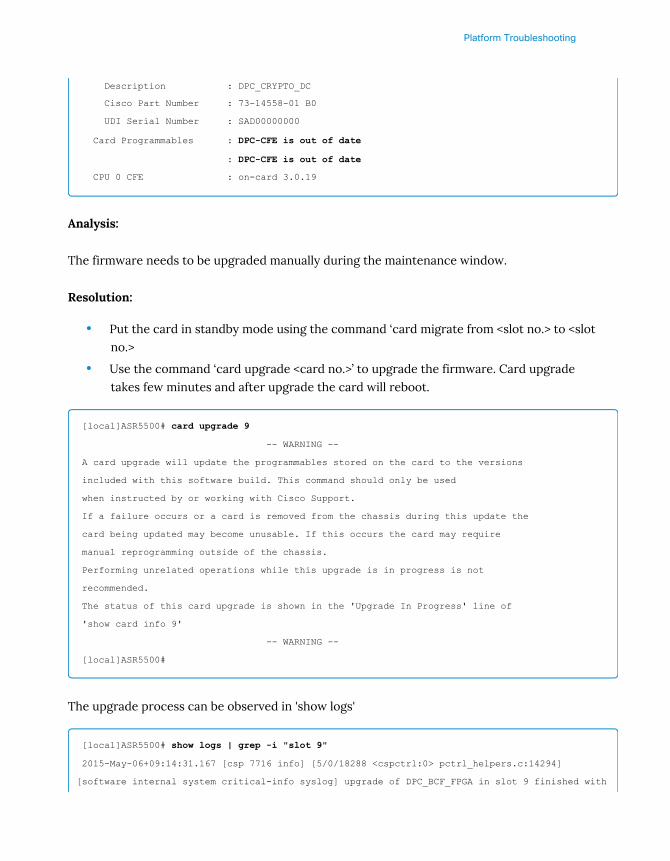
Platform Troubleshooting
Description : DPC_CRYPTO_DC
Cisco Part Number : 73-14558-01 B0
UDI Serial Number : SAD00000000
Card Programmables : DPC-CFE is out of date
: DPC-CFE is out of date
CPU 0 CFE : on-card 3.0.19
Analysis:
The firmware needs to be upgraded manually during the maintenance window.
Resolution:
• Put the card in standby mode using the command ‘card migrate from <slot no.> to <slotno.>
• Use the command ‘card upgrade <card no.>’ to upgrade the firmware. Card upgradetakes few minutes and after upgrade the card will reboot.
[local]ASR5500# card upgrade 9
-- WARNING --
A card upgrade will update the programmables stored on the card to the versions
included with this software build. This command should only be used
when instructed by or working with Cisco Support.
If a failure occurs or a card is removed from the chassis during this update the
card being updated may become unusable. If this occurs the card may require
manual reprogramming outside of the chassis.
Performing unrelated operations while this upgrade is in progress is not
recommended.
The status of this card upgrade is shown in the 'Upgrade In Progress' line of
'show card info 9'
-- WARNING --
[local]ASR5500#
The upgrade process can be observed in 'show logs'
[local]ASR5500# show logs | grep -i "slot 9"
2015-May-06+09:14:31.167 [csp 7716 info] [5/0/18288 <cspctrl:0> pctrl_helpers.c:14294]
[software internal system critical-info syslog] upgrade of DPC_BCF_FPGA in slot 9 finished with

Platform Troubleshooting
success
2015-May-06+09:14:30.188 [csp 7715 info] [5/0/18288 <cspctrl:0> pctrl_helpers.c:14470]
[software internal system critical-info syslog] upgrade of DPC_BCF_FPGA in slot 9 started
2015-May-06+09:14:30.186 [csp 7715 info] [5/0/18288 <cspctrl:0> pctrl_helpers.c:14387]
[software internal system critical-info syslog] upgrade of DPC_CAF_FPGA in slot 9 started
2015-May-06+09:14:28.751 [csp 7043 info] [5/0/18288 <cspctrl:0> spctrl_events.c:14169]
[hardware internal system critical-info syslog] Upgrade issued for the Data Processing Card
with serial number SAD00000000 in slot 9. Will upgrade 0x4180800000000000000000. Please
wait...
2015-May-06+09:13:48.385 [csp 7314 warning] [5/0/18288 <cspctrl:0> spctrl_events.c:2545]
[software internal system critical-info syslog] The DPC-CFE programmable on the Data Processing
Card in slot 9 is an out of date version
2015-May-06+09:13:48.385 [csp 7314 warning] [5/0/18288 <cspctrl:0> spctrl_events.c:2545]
[software internal system critical-info syslog] The DPC-CFE programmable on the Data Processing
Card in slot 9 is an out of date version
2015-May-06+09:13:42.908 [csp 7009 info] [5/0/18288 <cspctrl:0> pctrl_helpers.c:3078]
[hardware internal system critical-info syslog] Migrating all tasks on the Data Processing Card
in slot 9 to the one in slot 2.
Once the card is booted, verify the card has the latest firmware version using the command'show card hardware <card no.>'
[local]ASR5500# show card hardware 9
Card 9:
Card Type : Data Processing Card (R01)
Description : DPC
Cisco Part Number : 73-14872-02 A0
UDI Serial Number : SAD000000000
UDI Product ID : ASR55-DPC-K9
UDI Version ID : V02
UDI Top Assem Num : 68-4669-02 A0
Daughter Card #3:
Card Type : DPC CCK Daughter Card (R01)
Description : DPC_CRYPTO_DC
Cisco Part Number : 73-14558-01 B0
UDI Serial Number : SAD0000000
Card Programmables : up to date
CPU 0 CFE : on-card 3.1.4

Platform Troubleshooting
LAG Troubleshooting
Overview
This section covers LAG implementation and troubleshooting, along with some exampleissue scenarios.
LAG Description
Two or more physical ports can be logically combined in order to increase the bandwidth capa-bility and to create more resilient connections. A Link Aggregation Group (LAG) works by ex-changing control packets via Link Aggregation Control Protocol (LACP) over configured physi-cal ports with peers to reach agreement on an aggregation of links as defined in IEEE 802.3ad.The LAG sends and receives the control packets directly on physical ports. Link aggregation(also called trunking or bonding) provides higher total bandwidth, auto-negotiation, and recov-ery, by combining parallel network links between devices as a single link.
In the standard LAG configuration, the first port configured is selected as Master Port.
LAG on ASR 5000 vs ASR 5500:
On ASR 5000 LAG, there is a single master port and interfaces are always bound to it.
While on ASR 5500, LACP distributing status (LA+/LA~) is independent of master port selection.That is, the master port may be in the distributing (LA+) or agreed (LA~) set of ports. LACP distributing status changes do not affect LAG interface bindings - they’re always bound tothe master port, which may be LA+ or LA-. If the master port LC is removed, the system willautomatically select a new master port and move the LAG configuration to that port. Thischanges all LAG interface bindings. The LAG master port can also move if an LC does not re-cover or takes “too long” to recover, following a redundancy event (e.g., reboot or migra-tion/re-attachment). The “too long” period cannot be pinned down to a specific number asthere are events (such as boot time) which will cause variability. Generally speaking, the systemtries to avoid moving the master port configuration, as this requires changing the LAG systemID which is derived from the master port MAC and will bounce the LAG.
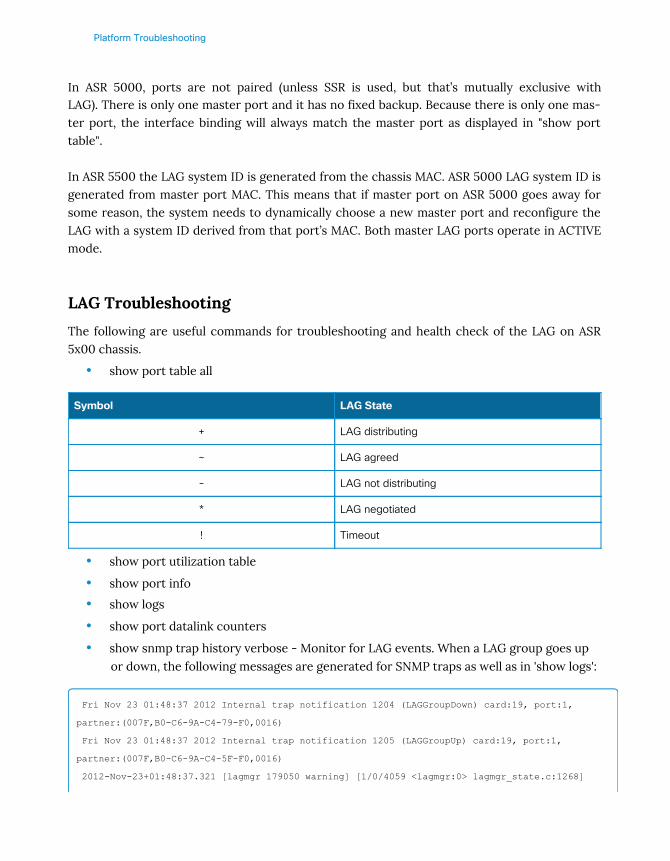
Platform Troubleshooting
In ASR 5000, ports are not paired (unless SSR is used, but that’s mutually exclusive withLAG). There is only one master port and it has no fixed backup. Because there is only one mas-ter port, the interface binding will always match the master port as displayed in "show porttable".
In ASR 5500 the LAG system ID is generated from the chassis MAC. ASR 5000 LAG system ID isgenerated from master port MAC. This means that if master port on ASR 5000 goes away forsome reason, the system needs to dynamically choose a new master port and reconfigure theLAG with a system ID derived from that port’s MAC. Both master LAG ports operate in ACTIVEmode.
LAG Troubleshooting
The following are useful commands for troubleshooting and health check of the LAG on ASR5x00 chassis.
• show port table all
• show port utilization table
• show port info
• show logs
• show port datalink counters
• show snmp trap history verbose - Monitor for LAG events. When a LAG group goes upor down, the following messages are generated for SNMP traps as well as in 'show logs':
Fri Nov 23 01:48:37 2012 Internal trap notification 1204 (LAGGroupDown) card:19, port:1,
partner:(007F,B0-C6-9A-C4-79-F0,0016)
Fri Nov 23 01:48:37 2012 Internal trap notification 1205 (LAGGroupUp) card:19, port:1,
partner:(007F,B0-C6-9A-C4-5F-F0,0016)
2012-Nov-23+01:48:37.321 [lagmgr 179050 warning] [1/0/4059 <lagmgr:0> lagmgr_state.c:1268]
Symbol LAG State
+ LAG distributing
~ LAG agreed
- LAG not distributing
* LAG negotiated
! Timeout

Platform Troubleshooting
[software internal system critical-infosyslog] LAG group 50 (global) with master port 19/1 has
changed partner from (007F,B0-C6-9A-C4-79-F0,0016) on 20/1, 26/1, 28/1 to (007F,B0-C6-9A-C4-5F-
F0,0016) on 19/1, 23/1, 27/1
Below is the command to switchover LAG groups (if applicable).
• link-aggregation port switch to <any-port-number-in-lag-agreed-state>
Below CLI commands require CLI test-commands password be configured in the chassis
• show lagmgr lacp-port
• show lagmgr counters
• show lagmgr events
* For show lagmgr events, note that the timestamp would be UTC. This may be different thanthe timestamps in snmp/logging.
Following is an example of normal operation for a LAG with redundant configuration. In theoutput below port 19/1 is master port. Ports 19/1, 23/1, 27/1 and 29/1 are in LAG distributingstate (carry traffic). Ports 20/1, 26/1, 28/1 and 30/1 are in agreed state.
******** show port table all ********
Port Role Type Admin Oper Link State Pair Redundant
----- ---- ------------------------ -------- ---- ---- ------- ----- ---------
19/1 Srvc 10G Ethernet Enabled - Up - None LA+ 19/1
Untagged Enabled Up - Active - -
Tagged VLAN 1 Enabled Up - Active - -
Tagged VLAN 2 Enabled Up - Active - -
Tagged VLAN 3 Enabled Up - Active - -
Tagged VLAN 4 Enabled Up - Active - -
Tagged VLAN 5 Enabled Up - Active - -
20/1 Srvc 10G Ethernet Enabled Up Up Active None LA~ 19/1
21/1 Srvc 1000 Ethernet Enabled - Up - 37/1 L2 Link
Untagged Enabled Down - Active - -
Tagged VLAN 6 Enabled Up - Active - -
22/1 Srvc 1000 Ethernet Enabled - Up - 38/1 L2 Link
Untagged Enabled Down - Active - -

Platform Troubleshooting
Tagged VLAN 7 Enabled Up - Active - -
23/1 Srvc 10G Ethernet Enabled Up Up Active None LA+ 19/1
24/1 Mgmt 1000 Ethernet Dual Media Enabled Up Up Active 25/1 L2 Link
24/2 Mgmt 1000 Ethernet Dual Media Disabled Down Down Active 25/2 L2 Link
24/3 Mgmt RS232 Serial Console Enabled Down Down Active 25/3 L2 Link
24/4 Mgmt BITS T1/E1 Timing Disabled Down Down Active 25/4 L2 Link
25/1 Mgmt 1000 Ethernet Dual Media Enabled Down Up Standby 24/1 L2 Link
25/2 Mgmt 1000 Ethernet Dual Media Disabled Down Down Standby 24/2 L2 Link
25/3 Mgmt RS232 Serial Console Enabled Down Down Standby 24/3 L2 Link
25/4 Mgmt BITS T1/E1 Timing Disabled Down Down Standby 24/4 L2 Link
26/1 Srvc 10G Ethernet Enabled Up Up Active None LA~ 19/1
27/1 Srvc 10G Ethernet Enabled Up Up Active None LA+ 19/1
28/1 Srvc 10G Ethernet Enabled Up Up Active None LA~ 19/1
29/1 Srvc 10G Ethernet Enabled Up Up Active None LA+ 19/1
30/1 Srvc 10G Ethernet Enabled Up Up Active None LA~ 19/1
37/1 Srvc 1000 Ethernet Enabled - Up - 21/1 L2 Link
Untagged Enabled Down - Standby - -
Tagged VLAN 6 Enabled Down - Standby - -
38/1 Srvc 1000 Ethernet Enabled - Up - 22/1 L2 Link
Untagged Enabled Down - Standby - -
Tagged VLAN 7 Enabled Down - Standby - -
******** show port utilization table ********
------ Average Port Utilization (in mbps) ------
Port Type Current 5min 15min
Rx Tx Rx Tx Rx Tx
----- ------------------------ ------- ------- ------- ------- ------- ------
19/1 10G Ethernet 2505 2492 2493 2534 2460 2520
20/1 10G Ethernet 0 0 0 0 0 0
21/1 1000 Ethernet 0 19 0 14 0 14
22/1 1000 Ethernet 7 46 7 45 7 46
23/1 10G Ethernet 2384 2685 2459 2595 2475 2548
26/1 10G Ethernet 0 0 0 0 0 0
27/1 10G Ethernet 2828 2500 2711 2587 2668 2580
28/1 10G Ethernet 0 0 0 0 0 0
29/1 10G Ethernet 2598 2661 2646 2620 2618 2586
30/1 10G Ethernet 0 0 0 0 0 0
[local]ASR5000> show port info | grep -i "Link Aggregation State"
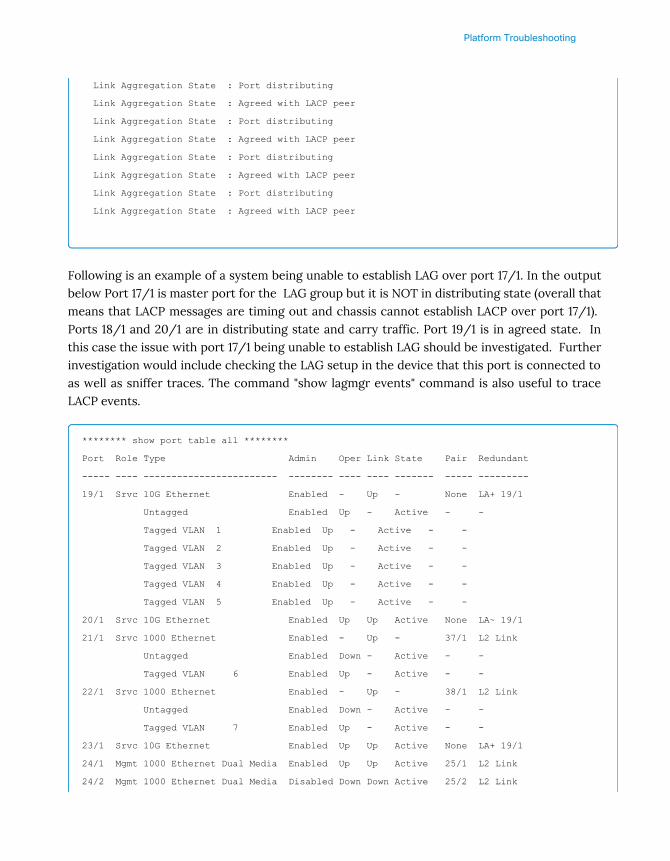
Platform Troubleshooting
Link Aggregation State : Port distributing
Link Aggregation State : Agreed with LACP peer
Link Aggregation State : Port distributing
Link Aggregation State : Agreed with LACP peer
Link Aggregation State : Port distributing
Link Aggregation State : Agreed with LACP peer
Link Aggregation State : Port distributing
Link Aggregation State : Agreed with LACP peer
Following is an example of a system being unable to establish LAG over port 17/1. In the outputbelow Port 17/1 is master port for the LAG group but it is NOT in distributing state (overall thatmeans that LACP messages are timing out and chassis cannot establish LACP over port 17/1). Ports 18/1 and 20/1 are in distributing state and carry traffic. Port 19/1 is in agreed state. Inthis case the issue with port 17/1 being unable to establish LAG should be investigated. Furtherinvestigation would include checking the LAG setup in the device that this port is connected toas well as sniffer traces. The command "show lagmgr events" command is also useful to traceLACP events.
******** show port table all ********
Port Role Type Admin Oper Link State Pair Redundant
----- ---- ------------------------ -------- ---- ---- ------- ----- ---------
19/1 Srvc 10G Ethernet Enabled - Up - None LA+ 19/1
Untagged Enabled Up - Active - -
Tagged VLAN 1 Enabled Up - Active - -
Tagged VLAN 2 Enabled Up - Active - -
Tagged VLAN 3 Enabled Up - Active - -
Tagged VLAN 4 Enabled Up - Active - -
Tagged VLAN 5 Enabled Up - Active - -
20/1 Srvc 10G Ethernet Enabled Up Up Active None LA~ 19/1
21/1 Srvc 1000 Ethernet Enabled - Up - 37/1 L2 Link
Untagged Enabled Down - Active - -
Tagged VLAN 6 Enabled Up - Active - -
22/1 Srvc 1000 Ethernet Enabled - Up - 38/1 L2 Link
Untagged Enabled Down - Active - -
Tagged VLAN 7 Enabled Up - Active - -
23/1 Srvc 10G Ethernet Enabled Up Up Active None LA+ 19/1
24/1 Mgmt 1000 Ethernet Dual Media Enabled Up Up Active 25/1 L2 Link
24/2 Mgmt 1000 Ethernet Dual Media Disabled Down Down Active 25/2 L2 Link
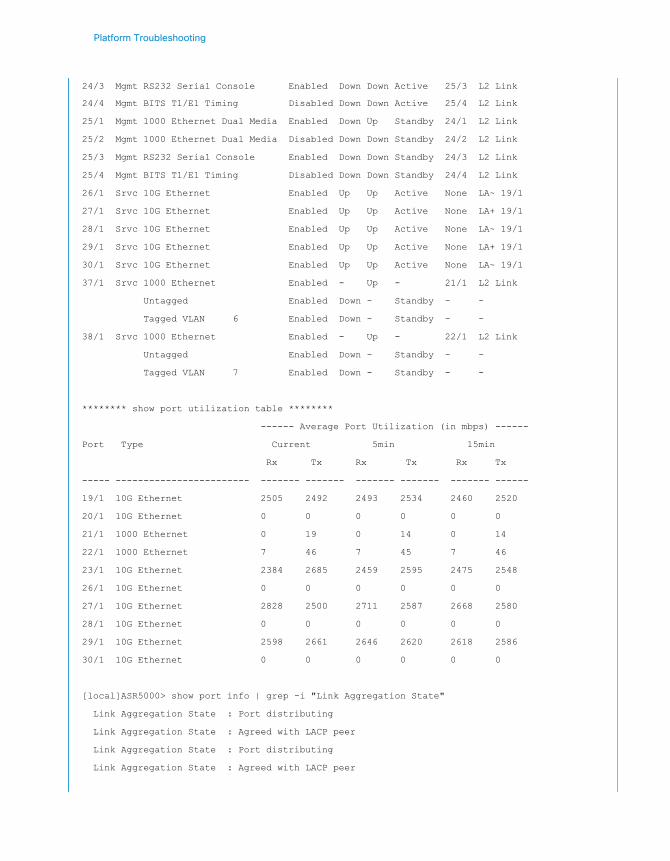
Platform Troubleshooting
24/3 Mgmt RS232 Serial Console Enabled Down Down Active 25/3 L2 Link
24/4 Mgmt BITS T1/E1 Timing Disabled Down Down Active 25/4 L2 Link
25/1 Mgmt 1000 Ethernet Dual Media Enabled Down Up Standby 24/1 L2 Link
25/2 Mgmt 1000 Ethernet Dual Media Disabled Down Down Standby 24/2 L2 Link
25/3 Mgmt RS232 Serial Console Enabled Down Down Standby 24/3 L2 Link
25/4 Mgmt BITS T1/E1 Timing Disabled Down Down Standby 24/4 L2 Link
26/1 Srvc 10G Ethernet Enabled Up Up Active None LA~ 19/1
27/1 Srvc 10G Ethernet Enabled Up Up Active None LA+ 19/1
28/1 Srvc 10G Ethernet Enabled Up Up Active None LA~ 19/1
29/1 Srvc 10G Ethernet Enabled Up Up Active None LA+ 19/1
30/1 Srvc 10G Ethernet Enabled Up Up Active None LA~ 19/1
37/1 Srvc 1000 Ethernet Enabled - Up - 21/1 L2 Link
Untagged Enabled Down - Standby - -
Tagged VLAN 6 Enabled Down - Standby - -
38/1 Srvc 1000 Ethernet Enabled - Up - 22/1 L2 Link
Untagged Enabled Down - Standby - -
Tagged VLAN 7 Enabled Down - Standby - -
******** show port utilization table ********
------ Average Port Utilization (in mbps) ------
Port Type Current 5min 15min
Rx Tx Rx Tx Rx Tx
----- ------------------------ ------- ------- ------- ------- ------- ------
19/1 10G Ethernet 2505 2492 2493 2534 2460 2520
20/1 10G Ethernet 0 0 0 0 0 0
21/1 1000 Ethernet 0 19 0 14 0 14
22/1 1000 Ethernet 7 46 7 45 7 46
23/1 10G Ethernet 2384 2685 2459 2595 2475 2548
26/1 10G Ethernet 0 0 0 0 0 0
27/1 10G Ethernet 2828 2500 2711 2587 2668 2580
28/1 10G Ethernet 0 0 0 0 0 0
29/1 10G Ethernet 2598 2661 2646 2620 2618 2586
30/1 10G Ethernet 0 0 0 0 0 0
[local]ASR5000> show port info | grep -i "Link Aggregation State"
Link Aggregation State : Port distributing
Link Aggregation State : Agreed with LACP peer
Link Aggregation State : Port distributing
Link Aggregation State : Agreed with LACP peer
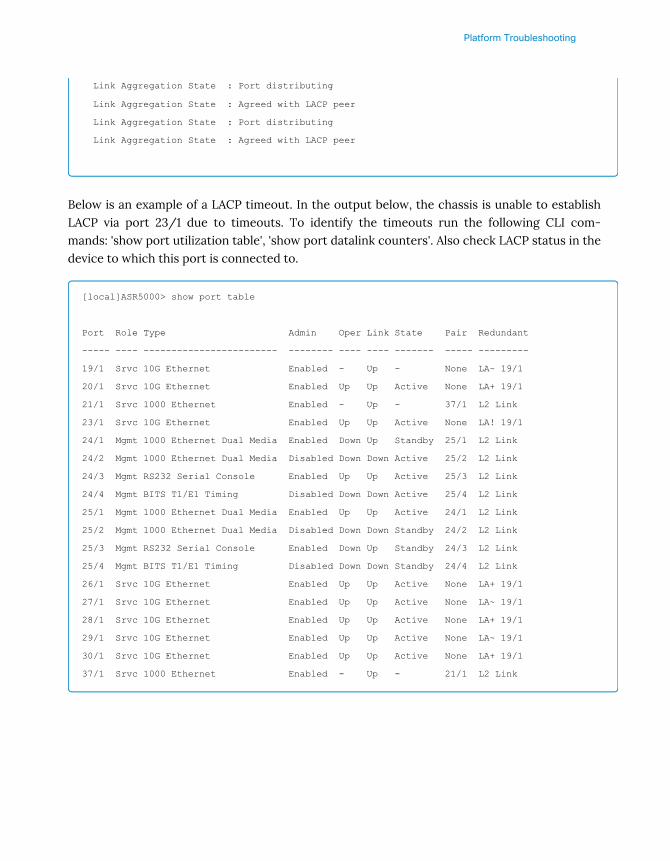
Platform Troubleshooting
Link Aggregation State : Port distributing
Link Aggregation State : Agreed with LACP peer
Link Aggregation State : Port distributing
Link Aggregation State : Agreed with LACP peer
Below is an example of a LACP timeout. In the output below, the chassis is unable to establishLACP via port 23/1 due to timeouts. To identify the timeouts run the following CLI com-mands: 'show port utilization table', 'show port datalink counters'. Also check LACP status in thedevice to which this port is connected to.
[local]ASR5000> show port table
Port Role Type Admin Oper Link State Pair Redundant
----- ---- ------------------------ -------- ---- ---- ------- ----- ---------
19/1 Srvc 10G Ethernet Enabled - Up - None LA~ 19/1
20/1 Srvc 10G Ethernet Enabled Up Up Active None LA+ 19/1
21/1 Srvc 1000 Ethernet Enabled - Up - 37/1 L2 Link
23/1 Srvc 10G Ethernet Enabled Up Up Active None LA! 19/1
24/1 Mgmt 1000 Ethernet Dual Media Enabled Down Up Standby 25/1 L2 Link
24/2 Mgmt 1000 Ethernet Dual Media Disabled Down Down Active 25/2 L2 Link
24/3 Mgmt RS232 Serial Console Enabled Up Up Active 25/3 L2 Link
24/4 Mgmt BITS T1/E1 Timing Disabled Down Down Active 25/4 L2 Link
25/1 Mgmt 1000 Ethernet Dual Media Enabled Up Up Active 24/1 L2 Link
25/2 Mgmt 1000 Ethernet Dual Media Disabled Down Down Standby 24/2 L2 Link
25/3 Mgmt RS232 Serial Console Enabled Down Up Standby 24/3 L2 Link
25/4 Mgmt BITS T1/E1 Timing Disabled Down Down Standby 24/4 L2 Link
26/1 Srvc 10G Ethernet Enabled Up Up Active None LA+ 19/1
27/1 Srvc 10G Ethernet Enabled Up Up Active None LA~ 19/1
28/1 Srvc 10G Ethernet Enabled Up Up Active None LA+ 19/1
29/1 Srvc 10G Ethernet Enabled Up Up Active None LA~ 19/1
30/1 Srvc 10G Ethernet Enabled Up Up Active None LA+ 19/1
37/1 Srvc 1000 Ethernet Enabled - Up - 21/1 L2 Link

Platform Troubleshooting
Example Scenarios
Multiple ports bounces in LAGs followed by LAGs lockup and unable to process any traffic due toflow control disabled.
Problem observed:
Observe LC bounces on their 2 LAG groups intermittently. Both LAG groups are affected withvarious ports bounces.
• LAGs went down and stopped processing any traffic even after majority of the traffic offboth LAGs.
• LAGs' ports reviewed traffic spike during the issue. The traffic was above of the pro-cessing capabilities of the LCs.
Logs collection:
• Collect 2 or more “show support details”
• Collect syslog
• Collect bulkstats/KPI for attach success rate and reject reason
• "monitor subscriber IMSI [value]" (verbosity 2)
• Collect external packet capture
CLI used to troubleshoot:
Below CLI commands requires CLI test-commands password configured inthe chassis. Please use the command with caution!Many TEST commands are processor-intensive and can cause serioussystem problems if used too frequently.
show port utilization table show port info
show port datalink counters show lagmgr lacp-port show lagmgr counters show npu stats debug all | grep -i lag
show lagmgr events

Platform Troubleshooting
Analysis:
From the output of ‘show port datalink counters <port>', TX PAUSE counts incrementing forthe LAG ports. This indicates that at some point LCs were hit with a high rate data which wasmore than what it could handle, which caused flow control to kick in.
Monitoring the 'show npu stats debug slot <>' output showed that rx-lag-cntl-pkt-cnt counterwas constant and not incrementing. This indicates that the LCs got stuck/clogged (probablydue to flow control not working correctly, this is yet to be root caused) leading to the LC to PSCNPU communication getting lost.
With a broken LC to NPU path, LACP packets from the LC could not reach corresponding NPUand hence do not get processed. This results in LAG down/bounce.
The issue is reproducible only when flow control is disabled on the next hop switch. The rootcause of lockup is deemed to be hardware misbehavior in the MAC chip under maximum loadand without flow control. The issue is not dependent on LAG itself, but LAG detects the lockup.
Workaround:
Resetting individual LC in LAG group normalized the LAGs for short time.
Resolution:
Enable the flow control on next hop switch to avoid traffic storm and LC clogging.
Consider adjusting LACP timeout values on next hop switch for a faster convergence.
LACP period short <<<< To let 5k send 1 LACP PDU per second, instead of 1 per 30 seconds.flow-control bidirectional <<<<< to slow down the flow rate from Router to ASR 5x00 has sentflow control beacon to Router when ASR 5x00 is throttled.

Platform Troubleshooting
P/0/RSP0/CPU0:-D#show int ten 0/1/1/1
TenGigE0/1/1/1 is up, line protocol is up
Interface state transitions: 1
Hardware is TenGigE, address is 4055.395f.8031 (bia 4055.395f.8031)
Layer 1 Transport Mode is LAN
Internet address is Unknown
MTU 9216 bytes, BW 10000000 Kbit (Max: 10000000 Kbit)
reliability 255/255, txload 0/255, rxload 0/255
Encapsulation ARPA,
Full-duplex, 10000Mb/s, link type is force-up
output flow control is off, input flow control is off << ingress/egress flow control off
by default
loopback not set,
Last input 00:00:00, output 00:00:00
Last clearing of "show interface" counters never
30 second input rate 0 bits/sec, 1 packets/sec
30 second output rate 2000 bits/sec, 3 packets/sec
923663 packets input, 81852921 bytes, 0 total input drops
0 drops for unrecognized upper-level protocol
Received 2 broadcast packets, 266014 multicast packets
0 runts, 0 giants, 0 throttles, 0 parity
0 input errors, 0 CRC, 0 frame, 0 overrun, 0 ignored, 0 abort
1149759 packets output, 121149359 bytes, 0 total output drops
Output 2 broadcast packets, 527159 multicast packets
0 output errors, 0 underruns, 0 applique, 0 resets
0 output buffer failures, 0 output buffers swapped out
1 carrier transitions
RP/0/RSP0/CPU0:ASR9006-D#show lacp bundle-ether 1
State: a - Port is marked as Aggregatable.
s - Port is Synchronized with peer.
c - Port is marked as Collecting.
d - Port is marked as Distributing.
A - Device is in Active mode.
F - Device requests PDUs from the peer at fast rate.
D - Port is using default values for partner information.
E - Information about partner has expired.
Bundle-Ether1
Port (rate) State Port ID Key System ID
-------------------- -------- ------------- ------ ------------------------
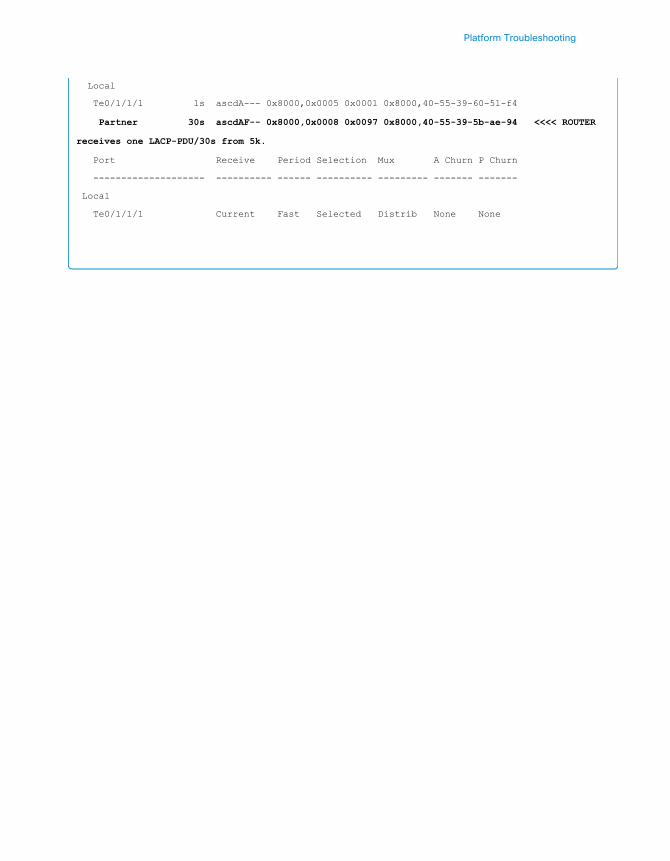
Platform Troubleshooting
Local
Te0/1/1/1 1s ascdA--- 0x8000,0x0005 0x0001 0x8000,40-55-39-60-51-f4
Partner 30s ascdAF-- 0x8000,0x0008 0x0097 0x8000,40-55-39-5b-ae-94 <<<< ROUTER
receives one LACP-PDU/30s from 5k.
Port Receive Period Selection Mux A Churn P Churn
-------------------- ---------- ------ ---------- --------- ------- -------
Local
Te0/1/1/1 Current Fast Selected Distrib None None

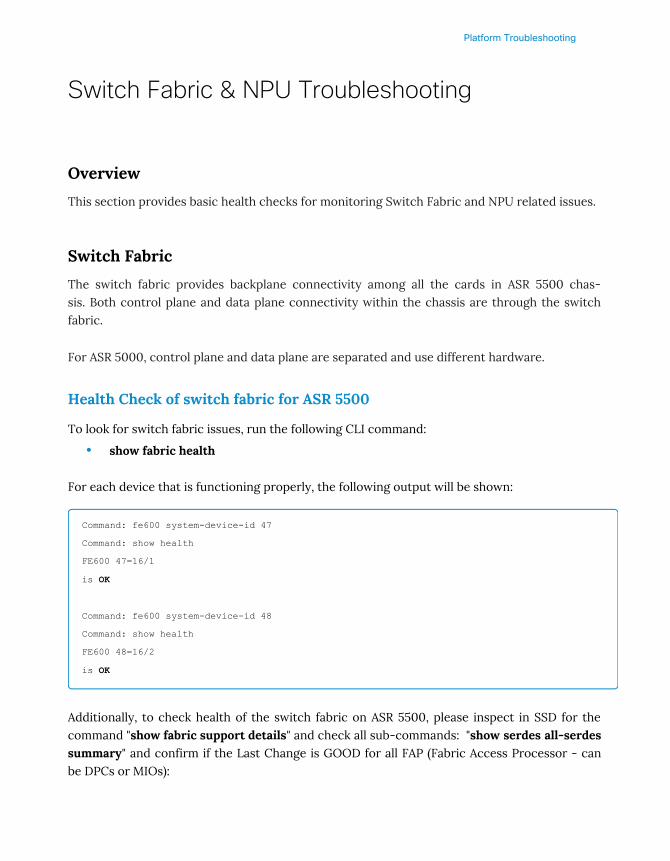
Platform Troubleshooting
Switch Fabric & NPU Troubleshooting
Overview
This section provides basic health checks for monitoring Switch Fabric and NPU related issues.
Switch Fabric
The switch fabric provides backplane connectivity among all the cards in ASR 5500 chas-sis. Both control plane and data plane connectivity within the chassis are through the switchfabric.
For ASR 5000, control plane and data plane are separated and use different hardware.
Health Check of switch fabric for ASR 5500
To look for switch fabric issues, run the following CLI command:
• show fabric health
For each device that is functioning properly, the following output will be shown:
Command: fe600 system-device-id 47
Command: show health
FE600 47=16/1
is OK
Command: fe600 system-device-id 48
Command: show health
FE600 48=16/2
is OK
Additionally, to check health of the switch fabric on ASR 5500, please inspect in SSD for thecommand "show fabric support details" and check all sub-commands: "show serdes all-serdessummary" and confirm if the Last Change is GOOD for all FAP (Fabric Access Processor - canbe DPCs or MIOs):

Platform Troubleshooting
Command: show serdes all-serdes summary
Fabric Status:
Status OK(+)------------------------+
Topology fault(T)------------------+|
Far side not expected(*)----------+||
Logically not connected(L)-------+|||
Physically not connected(P)-----+|||| NIF Status:
Rx Down(*)---------------------+||||| +----------NIF powered off(*)
Tx Down(*)--------------------+|||||| |+---------SERDES powered off(*)
Code Group(G)----------------+||||||| ||+--------Local side down(l)
Misalignment(M)-------------+|||||||| |||+-------Remote side down(r)
Cell Size(C)---------------+||||||||| ||||+------Rx activity(r)
Internally fixed(I)-------+|||||||||| |||||+-----Tx activity(t)
Not Accept Cells(A)------+||||||||||| ||||||+----Status OK(+)
|||||||||||| |||||||
SERDES Status: |||||||||||| |||||||
Status OK(+)-----------+ |||||||||||| |||||||
Rx power off(*)-------+| |||||||||||| |||||||
Tx power off(*)------+|| |||||||||||| |||||||
Sig not locked(S)---+||| |||||||||||| |||||||
Rx signal loss(*)--+|||| |||||||||||| |||||||
Modified Parms(m)-+||||| |||||||||||| |||||||
Admin down(D)----+|||||| |||||||||||| |||||||
||||||| |||||||||||| |||||||
Fabric lane-----+ ||||||| |||||||||||| |||||||
SERDES lane--+ | ||||||| |||||||||||| ||||||| Config
Source Dev SL FL vvvvvvv vvvvvvvvvvvv vvvvvvv Rate Topology CRC Errs Remote Dev SL FL
Last Change
------- --- -- -- ------- ------------ ------- ------------ -------- -------- ------- --- -- -- ------
----------------
4= 2/2 FAP 0 - + rt+ 3125.00 Mbps - - CP1 XAUI GOOD
4= 2/2 FAP 1 - + rt+ 3125.00 Mbps - - CP1 XAUI GOOD
4= 2/2 FAP 2 - + rt+ 3125.00 Mbps - - CP1 XAUI GOOD
4= 2/2 FAP 3 - + rt+ 3125.00 Mbps - - CP1 XAUI GOOD
4= 2/2 FAP 4 - + rt+ 3125.00 Mbps - - CP2 XAUI GOOD
4= 2/2 FAP 5 - + rt+ 3125.00 Mbps - - CP2 XAUI GOOD
4= 2/2 FAP 6 - + rt+ 3125.00 Mbps - - CP2 XAUI GOOD
Health Check of switch fabric for ASR 5000
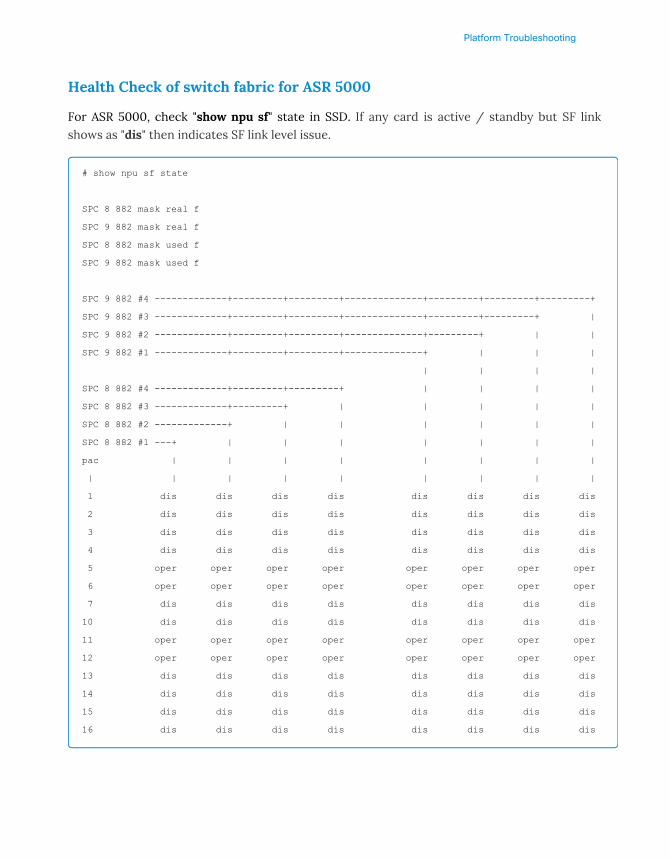
Platform Troubleshooting
Health Check of switch fabric for ASR 5000
For ASR 5000, check "show npu sf" state in SSD. If any card is active / standby but SF linkshows as "dis" then indicates SF link level issue.
# show npu sf state
SPC 8 882 mask real f
SPC 9 882 mask real f
SPC 8 882 mask used f
SPC 9 882 mask used f
SPC 9 882 #4 -------------+---------+---------+--------------+---------+---------+---------+
SPC 9 882 #3 -------------+---------+---------+--------------+---------+---------+ |
SPC 9 882 #2 -------------+---------+---------+--------------+---------+ | |
SPC 9 882 #1 -------------+---------+---------+--------------+ | | |
| | | |
SPC 8 882 #4 -------------+---------+---------+ | | | |
SPC 8 882 #3 -------------+---------+ | | | | |
SPC 8 882 #2 -------------+ | | | | | |
SPC 8 882 #1 ---+ | | | | | | |
pac | | | | | | | |
| | | | | | | | |
1 dis dis dis dis dis dis dis dis
2 dis dis dis dis dis dis dis dis
3 dis dis dis dis dis dis dis dis
4 dis dis dis dis dis dis dis dis
5 oper oper oper oper oper oper oper oper
6 oper oper oper oper oper oper oper oper
7 dis dis dis dis dis dis dis dis
10 dis dis dis dis dis dis dis dis
11 oper oper oper oper oper oper oper oper
12 oper oper oper oper oper oper oper oper
13 dis dis dis dis dis dis dis dis
14 dis dis dis dis dis dis dis dis
15 dis dis dis dis dis dis dis dis
16 dis dis dis dis dis dis dis dis
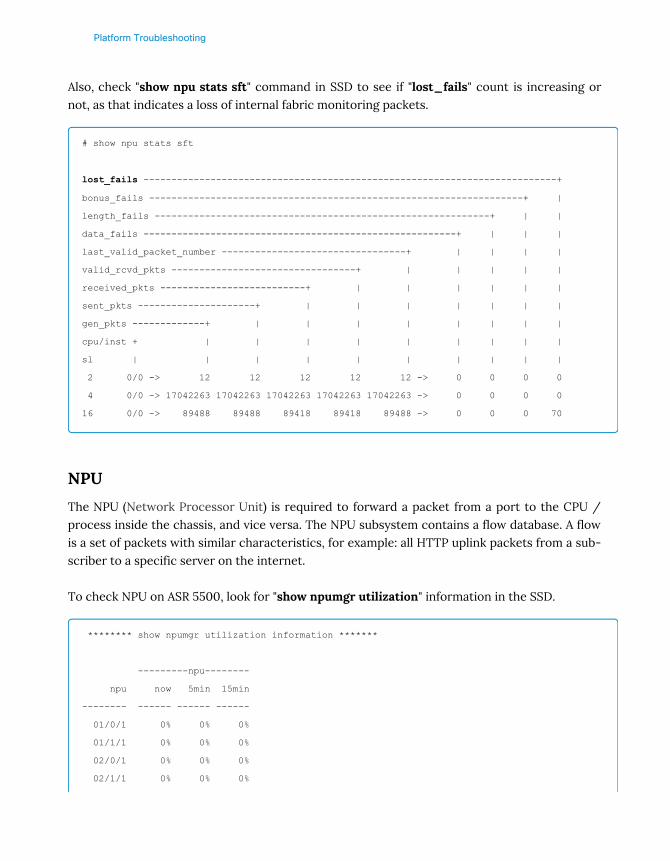
Platform Troubleshooting
Also, check "show npu stats sft" command in SSD to see if "lost_fails" count is increasing ornot, as that indicates a loss of internal fabric monitoring packets.
# show npu stats sft
lost_fails --------------------------------------------------------------------------+
bonus_fails -------------------------------------------------------------------+ |
length_fails ------------------------------------------------------------+ | |
data_fails --------------------------------------------------------+ | | |
last_valid_packet_number ---------------------------------+ | | | |
valid_rcvd_pkts ---------------------------------+ | | | | |
received_pkts --------------------------+ | | | | | |
sent_pkts ---------------------+ | | | | | | |
gen_pkts -------------+ | | | | | | | |
cpu/inst + | | | | | | | | |
sl | | | | | | | | | |
2 0/0 -> 12 12 12 12 12 -> 0 0 0 0
4 0/0 -> 17042263 17042263 17042263 17042263 17042263 -> 0 0 0 0
16 0/0 -> 89488 89488 89418 89418 89488 -> 0 0 0 70
NPU
The NPU (Network Processor Unit) is required to forward a packet from a port to the CPU /process inside the chassis, and vice versa. The NPU subsystem contains a flow database. A flowis a set of packets with similar characteristics, for example: all HTTP uplink packets from a sub-scriber to a specific server on the internet.
To check NPU on ASR 5500, look for "show npumgr utilization" information in the SSD.
******** show npumgr utilization information *******
---------npu--------
npu now 5min 15min
-------- ------ ------ ------
01/0/1 0% 0% 0%
01/1/1 0% 0% 0%
02/0/1 0% 0% 0%
02/1/1 0% 0% 0%

Platform Troubleshooting
03/0/1 0% 0% 0%
03/1/1 0% 0% 0%
04/0/1 0% 0% 0%
04/1/1 0% 0% 0%
05/0/1 0% 0% 0%
05/0/2 0% 0% 0%
05/0/3 0% 0% 0%
05/0/4 0% 0% 0%
06/0/1 0% 0% 0%
06/0/2 0% 0% 0%
06/0/3 0% 0% 0%
06/0/4 0% 0% 0%
07/0/1 0% 0% 0%
07/1/1 0% 0% 0%
08/0/1 0% 0% 0%
08/1/1 0% 0% 0%
09/0/1 0% 0% 0%
09/1/1 0% 0% 0%
10/0/1 0% 0% 0%
10/1/1 0% 0% 0%
For ASR 5000, look for "show npu utilization info card [num]" in the SSD.
******** show npu utilization info card 1 *******
Card: 1
5-Second Average:
NPU Receive From:
CPU : 0.419 kpps ( 0.01%), 4.034 mbps ( 0.04%)
Fabric A : 0.125 kpps ( 0.00%), 0.487 mbps ( 0.01%)
Fabric B : 0.397 kpps ( 0.01%), 1.128 mbps ( 0.01%)
Total : 0.940 kpps ( 0.03%), 5.649 mbps ( 0.06%)
NPU Transmit To:
CPU : 0.451 kpps ( 0.02%), 1.173 mbps ( 0.01%)
Fabric A : 0.418 kpps ( 0.01%), 4.003 mbps ( 0.04%)
Fabric B : 0.071 kpps ( 0.00%), 0.443 mbps ( 0.00%)
Total : 0.940 kpps ( 0.03%), 5.618 mbps ( 0.06%)
NPU ME Utilization:
SCH : Scheduler ( 0.00%)
QM : Queue Mgr ( 0.00%)
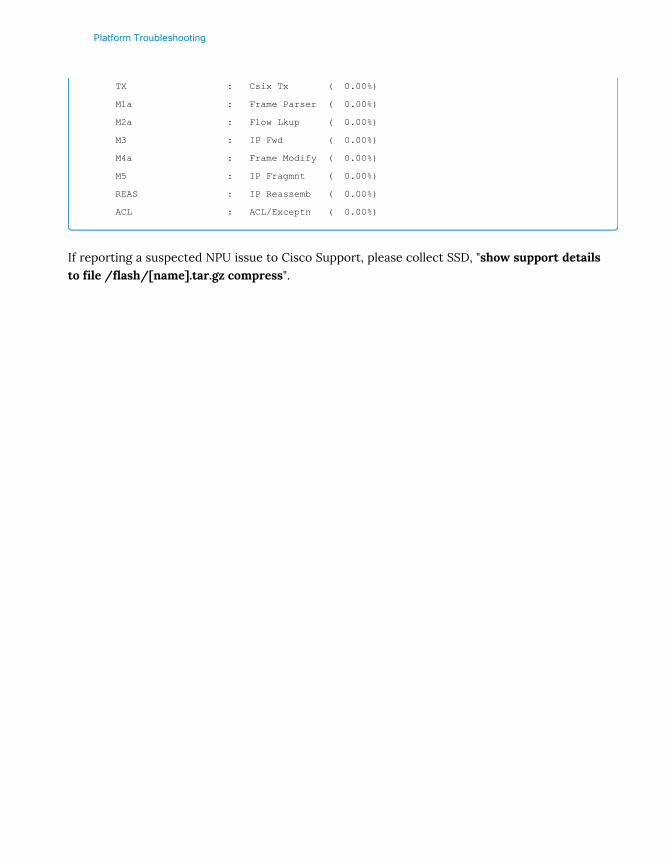
Platform Troubleshooting
TX : Csix Tx ( 0.00%)
M1a : Frame Parser ( 0.00%)
M2a : Flow Lkup ( 0.00%)
M3 : IP Fwd ( 0.00%)
M4a : Frame Modify ( 0.00%)
M5 : IP Fragmnt ( 0.00%)
REAS : IP Reassemb ( 0.00%)
ACL : ACL/Exceptn ( 0.00%)
If reporting a suspected NPU issue to Cisco Support, please collect SSD, "show support detailsto file /flash/[name].tar.gz compress".
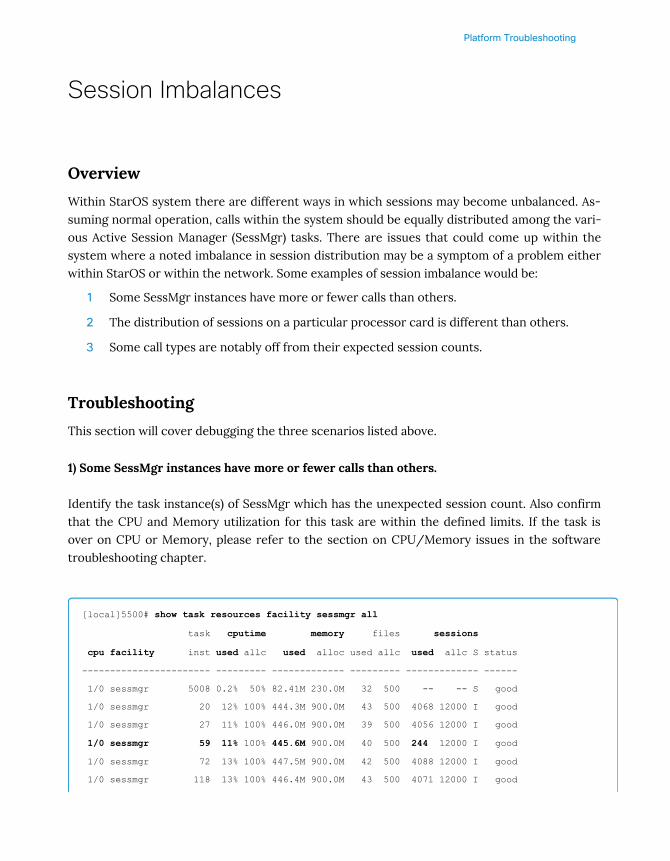
Platform Troubleshooting
Session Imbalances
Overview
Within StarOS system there are different ways in which sessions may become unbalanced. As-suming normal operation, calls within the system should be equally distributed among the vari-ous Active Session Manager (SessMgr) tasks. There are issues that could come up within thesystem where a noted imbalance in session distribution may be a symptom of a problem eitherwithin StarOS or within the network. Some examples of session imbalance would be:
1 Some SessMgr instances have more or fewer calls than others.
2 The distribution of sessions on a particular processor card is different than others.
3 Some call types are notably off from their expected session counts.
Troubleshooting
This section will cover debugging the three scenarios listed above.
1) Some SessMgr instances have more or fewer calls than others.
Identify the task instance(s) of SessMgr which has the unexpected session count. Also confirmthat the CPU and Memory utilization for this task are within the defined limits. If the task isover on CPU or Memory, please refer to the section on CPU/Memory issues in the softwaretroubleshooting chapter.
[local]5500# show task resources facility sessmgr all
task cputime memory files sessions
cpu facility inst used allc used alloc used allc used allc S status
----------------------- --------- ------------- --------- ------------- ------
1/0 sessmgr 5008 0.2% 50% 82.41M 230.0M 32 500 -- -- S good
1/0 sessmgr 20 12% 100% 444.3M 900.0M 43 500 4068 12000 I good
1/0 sessmgr 27 11% 100% 446.0M 900.0M 39 500 4056 12000 I good
1/0 sessmgr 59 11% 100% 445.6M 900.0M 40 500 244 12000 I good
1/0 sessmgr 72 13% 100% 447.5M 900.0M 42 500 4088 12000 I good
1/0 sessmgr 118 13% 100% 446.4M 900.0M 43 500 4071 12000 I good
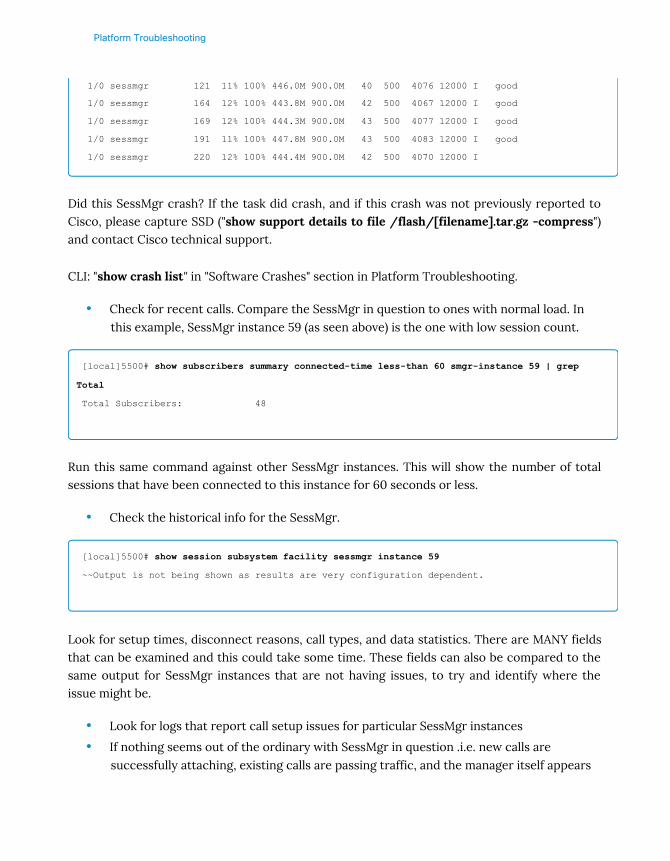
Platform Troubleshooting
1/0 sessmgr 121 11% 100% 446.0M 900.0M 40 500 4076 12000 I good
1/0 sessmgr 164 12% 100% 443.8M 900.0M 42 500 4067 12000 I good
1/0 sessmgr 169 12% 100% 444.3M 900.0M 43 500 4077 12000 I good
1/0 sessmgr 191 11% 100% 447.8M 900.0M 43 500 4083 12000 I good
1/0 sessmgr 220 12% 100% 444.4M 900.0M 42 500 4070 12000 I
Did this SessMgr crash? If the task did crash, and if this crash was not previously reported toCisco, please capture SSD ("show support details to file /flash/[filename].tar.gz -compress")and contact Cisco technical support.
CLI: "show crash list" in "Software Crashes" section in Platform Troubleshooting.
• Check for recent calls. Compare the SessMgr in question to ones with normal load. Inthis example, SessMgr instance 59 (as seen above) is the one with low session count.
[local]5500# show subscribers summary connected-time less-than 60 smgr-instance 59 | grep
Total
Total Subscribers: 48
Run this same command against other SessMgr instances. This will show the number of totalsessions that have been connected to this instance for 60 seconds or less.
• Check the historical info for the SessMgr.
[local]5500# show session subsystem facility sessmgr instance 59
~~Output is not being shown as results are very configuration dependent.
Look for setup times, disconnect reasons, call types, and data statistics. There are MANY fieldsthat can be examined and this could take some time. These fields can also be compared to thesame output for SessMgr instances that are not having issues, to try and identify where theissue might be.
• Look for logs that report call setup issues for particular SessMgr instances
• If nothing seems out of the ordinary with SessMgr in question .i.e. new calls aresuccessfully attaching, existing calls are passing traffic, and the manager itself appears

Platform Troubleshooting
in working order, then this issue could have been caused by a transient event (internalor external), that has self-corrected. If this is the case, check historical data such asbulkstats, SNMP traps or logs, or outstanding alarms to see if a start time for theimbalance can be identified.
• Monitor to make sure the session counts continue to equalize (catch up) with otherworking SessMgrs over time.
Below CLI commands requires CLI test-commands password configured inthe chassis. Please use the command with caution!Many TEST commands are processor-intensive and can cause serioussystem problems if used too frequently.
If required to check specific type of calls the following method can be used:
show session subsystem data-info verbose | grep "PDN-TYPE-IPv4 CONNECTED"
or any other "In-progress calls" which can be found in commands output:
show session subsystem facility sessmgr all debug-info
To filter In-progress calls types, the following options can be used with grep in above "showsession subsystem data-info verbose"
CSCF-CALL-ARRIVED, CSCF-REGISTERING, CSCF-REGISTERED, LCP-NEG, LCP-UP, AUTHENTICATING, BCMCS SERVICE AUTHENTICATING, AUTHENTICATED, PDG AUTHORIZING, PDG AUTHORIZED, IMS AUTHORIZING, IMS AUTHORIZED, MBMS UE AUTHORIZING, MBMS BEARER AUTHORIZING, DHCP PENDING, L2TP-LAC CONNECTING, MBMS BEARER CONNECTING, CSCF-CALL-CONNECTING, IPCP-UP, NON-ANCHOR CONNECTED, AUTH-ONLY CON‐NECTED, SIMPLE-IPv4 CONNECTED, SIMPLE-IPv6 CONNECTED, SIMPLE-IPv4+IPv6 CONNECTED, MOBILE-IPv4 CONNECTED, MOBILE-IPv6 CONNECTED, GTP CONNECTING, GTP CONNECTED, PROXY-MOBILE-IP CONNECTING, PROXY-MOBILE-IP CONNECTED, EPDG RE-AUTHORIZING, HA-IPSEC CONNECTED, L2TP-LAC CONNECTED, HNBGW CONNECTED, PDP-TYPE-PPP CONNECTED, IPSG CONNECTED, BCMCS CONNECTED, PCC CONNECTED, MBMS UE CON‐NECTED, MBMS BEARER CONNECTED, PAGING CONNECTED, PDN-TYPE-IPv4 CONNECTED, PDN-TYPE-IPv6 CON‐NECTED, PDN-TYPE-IPv4+IPv6 CONNECTED, CSCF-CALL-CONNECTED, MME ATTACHED, HENBGW CONNECTED
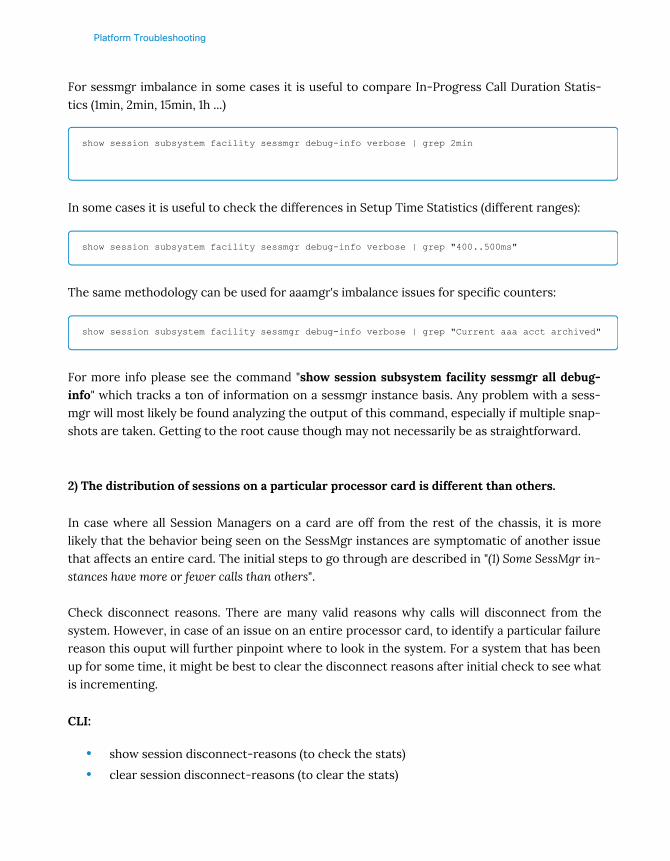
Platform Troubleshooting
For sessmgr imbalance in some cases it is useful to compare In-Progress Call Duration Statis-tics (1min, 2min, 15min, 1h ...)
show session subsystem facility sessmgr debug-info verbose | grep 2min
In some cases it is useful to check the differences in Setup Time Statistics (different ranges):
show session subsystem facility sessmgr debug-info verbose | grep "400..500ms"
The same methodology can be used for aaamgr's imbalance issues for specific counters:
show session subsystem facility sessmgr debug-info verbose | grep "Current aaa acct archived"
For more info please see the command "show session subsystem facility sessmgr all debug-info" which tracks a ton of information on a sessmgr instance basis. Any problem with a sess-mgr will most likely be found analyzing the output of this command, especially if multiple snap-shots are taken. Getting to the root cause though may not necessarily be as straightforward.
2) The distribution of sessions on a particular processor card is different than others.
In case where all Session Managers on a card are off from the rest of the chassis, it is morelikely that the behavior being seen on the SessMgr instances are symptomatic of another issuethat affects an entire card. The initial steps to go through are described in "(1) Some SessMgr in-stances have more or fewer calls than others".
Check disconnect reasons. There are many valid reasons why calls will disconnect from thesystem. However, in case of an issue on an entire processor card, to identify a particular failurereason this ouput will further pinpoint where to look in the system. For a system that has beenup for some time, it might be best to clear the disconnect reasons after initial check to see whatis incrementing.
CLI:
• show session disconnect-reasons (to check the stats)
• clear session disconnect-reasons (to clear the stats)

Platform Troubleshooting
[local]5500# show session disconnect-reasons
Session Disconnect Statistics
Total Disconnects: 437042538
Disconnect Reason Num Disc Percentage
----------------------------------------------------- ---------- ----------
Remote-disconnect 169318214 38.74182
Idle-Inactivity-timeout 326879 0.07479
Invalid-source-IP-address 657 0.00015
MIP-remote-dereg 127903569 29.26570
MIP-lifetime-expiry 99599 0.02279
static-ip-validation-failed 16 0.00000
Local-purge 139393476 31.89472
gtp-user-auth-failed 12 0.00000
No-response 116 0.00003
[local]5500# clear session disconnect-reasons
[local]5500# show session disconnect-reasons
Session Disconnect Statistics
Total Disconnects: 1066
Disconnect Reason Num Disc Percentage
----------------------------------------------------- ---------- ----------
Remote-disconnect 1063 99.71857
Local-purge 3 0.28143
Check diameter routing if using diameter proxy. In many configurations utilizing diameterservers across various interfaces (ie: s6b, Gx, Gy, Rf, etc.) is done with Diameter proxy. Thismeans that each processor card maintains its own TCP connection to different servers in thenetwork. It is possible there could be an issue relating back to one particular card.
CLI:
• show diameter peers full all | grep "Peers in"
• show diameter endpoints
• show subscribers data-rate card-num 3
• show subscribers summmary card-num 3
• show snmp trap history verbose | more
• show alarm outstanding
• show session counters historical all

Platform Troubleshooting
Below are examples of above CLI commands.
[local]5500# show diameter peers full all | grep "Peers in"
Tuesday May 05 11:44:31 EDT 2015
Peers in OPEN state: 266
Peers in CLOSED state: 0
Peers in intermediate state: 0
If some peers show as either "closed" or "intermediate" take a look at the individual diameterendpoints and see if these peers all relate back to a particular processor card.
First, get a list of the endpoints:
[local]5500# show diameter endpoints
Tuesday May 05 11:49:59 EDT 2015
Context: Ingress1 Endpoint: GSM3G-GY
Context: Ingress2 Endpoint: PGW-LTE-GX1
Context: Ingress2 Endpoint: PGW-LTE-S6B1
Context: Ingress2 Endpoint: PGW-LTE-S6B2
Look at individual end points. NOTE: The leading number in the "Local Hostname" row indicateswhich processor card the connection is coming from, "0007" in the output below equates to theprocessor card in slot 7.
[local]5500# show diameter peers full endpoint PGW-LTE-GX1
~~~output cut to one instance~~~
Peer Hostname: PGW-LTE-server1.test.com
Local Hostname: 0007-diamproxy.PGW-LTE-client1.test.com
Peer Realm: test1.com
Local Realm: test2.com
Peer Address: xx:xx:xxxx:xxxx:xxx:xx:::3899
Local Address: xx:xx:xxx:xxxx:xxx:xx:::52119
State: OPEN [TCP]
CPU: 3/1 Task: diamproxy-55
Messages Out/Queued: N/A
Supported Vendor IDs: 8164
Admin Status: Enable
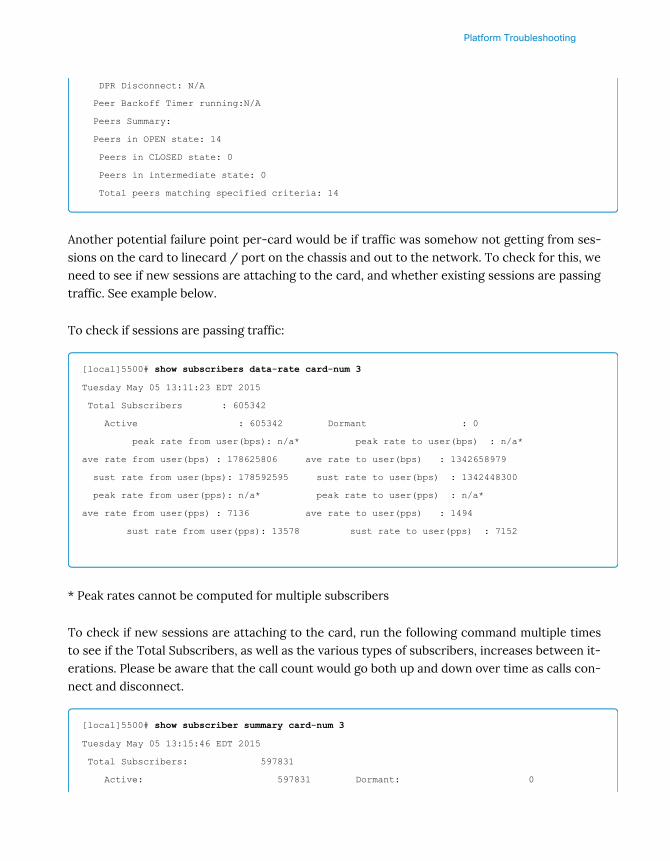
Platform Troubleshooting
DPR Disconnect: N/A
Peer Backoff Timer running:N/A
Peers Summary:
Peers in OPEN state: 14
Peers in CLOSED state: 0
Peers in intermediate state: 0
Total peers matching specified criteria: 14
Another potential failure point per-card would be if traffic was somehow not getting from ses-sions on the card to linecard / port on the chassis and out to the network. To check for this, weneed to see if new sessions are attaching to the card, and whether existing sessions are passingtraffic. See example below.
To check if sessions are passing traffic:
[local]5500# show subscribers data-rate card-num 3
Tuesday May 05 13:11:23 EDT 2015
Total Subscribers : 605342
Active : 605342 Dormant : 0
peak rate from user(bps): n/a* peak rate to user(bps) : n/a*
ave rate from user(bps) : 178625806 ave rate to user(bps) : 1342658979
sust rate from user(bps): 178592595 sust rate to user(bps) : 1342448300
peak rate from user(pps): n/a* peak rate to user(pps) : n/a*
ave rate from user(pps) : 7136 ave rate to user(pps) : 1494
sust rate from user(pps): 13578 sust rate to user(pps) : 7152
* Peak rates cannot be computed for multiple subscribers
To check if new sessions are attaching to the card, run the following command multiple timesto see if the Total Subscribers, as well as the various types of subscribers, increases between it-erations. Please be aware that the call count would go both up and down over time as calls con-nect and disconnect.
[local]5500# show subscriber summary card-num 3
Tuesday May 05 13:15:46 EDT 2015
Total Subscribers: 597831
Active: 597831 Dormant: 0

Platform Troubleshooting
LAPI Devices: 0
pdsn-simple-ipv4: 0 pdsn-simple-ipv6: 0
pdsn-mobile-ip: 0 ha-mobile-ipv6: 0
hsgw-ipv6: 0 hsgw-ipv4: 0
hsgw-ipv4-ipv6: 0 pgw-pmip-ipv6: 104399
pgw-pmip-ipv4: 0 pgw-pmip-ipv4-ipv6: 76648
pgw-gtp-ipv6: 253637 pgw-gtp-ipv4: 0
pgw-gtp-ipv4-ipv6: 194146 sgw-gtp-ipv6: 0
sgw-gtp-ipv4: 0 sgw-gtp-ipv4-ipv6: 0
sgw-pmip-ipv6: 0 sgw-pmip-ipv4: 0
sgw-pmip-ipv4-ipv6: 0 pgw-gtps2b-ipv4: 0
3) Some call types are notably off from their expected session counts.
Troubleshooting a scenario where certain call types are failing should start with commandsmentioned earlier in this section. In particular "show session disconnect-reasons" and "showsub summary smgr-instance <SessMgr instance>". Looking for other services that are either ina bad state or down, as with the diameter peering commands above, would also be a good placeto start. If a timestamp can be found relating to the start of the call loss, historical data from thechassis, or in off-chassis storage (bulkstats, syslog servers, SNMP trap servers, etc) should beconsulted to see if there were any chassis or network events corresponding to start of the calldegradation. "show session subsystem facility sessmgr" reports call type related information.Logs and data on the chassis can also be parsed for clues:
[local]5500# show snmp trap history verbose | more
Tuesday May 05 13:50:40 EDT 2015
There are 673 historical trap records (5000 maximum)
Timestamp Trap Information
------------------------ -------------------------------------------------------
~~~TRAPS
[local]5500# show logs level error | more
~~~ Show only "error" level logs.
[local]5500# show logs level error | more
~~~ Show all logs.
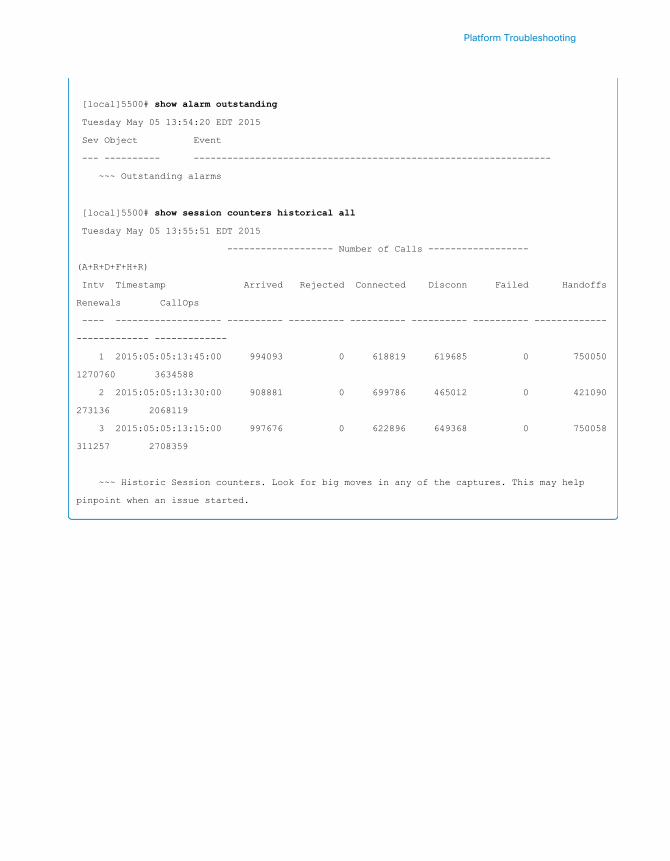
Platform Troubleshooting
[local]5500# show alarm outstanding
Tuesday May 05 13:54:20 EDT 2015
Sev Object Event
--- ---------- ----------------------------------------------------------------
~~~ Outstanding alarms
[local]5500# show session counters historical all
Tuesday May 05 13:55:51 EDT 2015
------------------- Number of Calls ------------------
(A+R+D+F+H+R)
Intv Timestamp Arrived Rejected Connected Disconn Failed Handoffs
Renewals CallOps
---- ------------------- ---------- ---------- ---------- ---------- ---------- -------------
------------- -------------
1 2015:05:05:13:45:00 994093 0 618819 619685 0 750050
1270760 3634588
2 2015:05:05:13:30:00 908881 0 699786 465012 0 421090
273136 2068119
3 2015:05:05:13:15:00 997676 0 622896 649368 0 750058
311257 2708359
~~~ Historic Session counters. Look for big moves in any of the captures. This may help
pinpoint when an issue started.


CDMA

CDMA
CDMA Overview
Overview
This chapter covers components of a CDMA network, different interfaces in the network andbasic call flows involved in an UE registration. This chapter also includes various ASR 5000/ASR500 platform commands to verify functionality of CDMA and available troubleshooting com-mands.
General Architecture
The ASR 5000/ASR 5500 provides wireless carriers with a flexible solution that functions as aPacket Data Serving Node (PDSN) in CDMA 2000 wireless data networks.
When supporting Simple IP data applications, the system is configured to perform the role of aPacket Data Serving Node (PDSN) within the carrier's 3G CDMA2000 data network. The PDSNterminates the mobile subscriber’s Point-to-Point Protocol (PPP) session and then routes datato and from the Packet Data Network (PDN) on behalf of the subscriber. The PDN can consist ofWireless Application Protocol (WAP) servers or it can be the Internet.
When supporting Mobile IP and/or Proxy Mobile IP data applications, the system can be con-figured to perform the role of the PDSN/Foreign Agent (FA) and/or the Home Agent (HA)within the carrier's 3G CDMA2000 data network. When functioning as an HA, the system caneither be located within the carrier’s 3G network or in an external enterprise or ISP network.The PDSN/FAs function is to terminate the mobile subscriber’s PPP session, and thenroute data to and from the appropriate HA on behalf of the subscriber.
The below diagram depicts a sample network configuration wherein the PDSN/FA and HA areseparate systems.

CDMA
Image - PDSN/FA and HA Network Deployment Configuration Example
Interface Descriptions
This section describes the primary interfaces used in a CDMA2000 wireless data network de-ployment.
R-P Interface
This interface exists between the Packet Control Function (PCF) and the PDSN/FA and imple-ments the A10 and A11 (data and bearer signaling respectively) protocols defined in 3GPP2 spec-ifications.
The PCF can be co-located with the Base Station Controller (BSC) as part of the Radio AccessNode (RAN).
Pi Interfaces
The Pi interface provides connectivity between the HA and its corresponding FA. The Pi inter-face is used to establish a Mobile IP tunnel between the PDSN/FA and HA.
PDN Interfaces
PDN interface provides connectivity between the PDSN and/or HA to packet data networkssuch as the Internet or a corporate intranet.

CDMA
AAA Interfaces
Ethernet interfaces carry AAA messages to and from Radius accounting and authenticationservers. User-based Radius messaging is transported using the Ethernet line cards.
Basic CDMA Call Flow
CDMA data consists of two main types of call flows; Simple IP (SIP) and Mobile IP (MIP).
For Simple IP, just a PDSN is required to communicate with the RAN, and an IP pool is requiredto provide an IP address to the subscriber. For Mobile IP, both an FA and HA are required inorder to extend the anchor point of the call beyond the PDSN to either an entirely different HAnode or to a co-located node.
The following figure and the text that follows provides a high-level view of the steps required tomake a Simple IP call that is initiated by the MN to an end host:

CDMA
Simple IP Call Flow Description:
1 Mobile Node (MN) secures a traffic channel over the air link with the RAN through the
BSC/PCF.
2 The PCF and PDSN establish the R-P interface for the session.
3 The PDSN and MN negotiate Link Control Protocol (LCP).
4 Upon successful LCP negotiation, the MN sends a PPP Authentication Request message
to the PDSN.
5 The PDSN sends an Access Request message to the Radius AAA server.
6 The Radius AAA server successfully authenticates the subscriber and returns an Access
Accept message to the PDSN. The Accept message may contain various attributes to be
assigned to the MN.
7 The PDSN sends a PPP Authentication Response message to the MN.
8 The MN and the PDSN negotiate the Internet Protocol Control Protocol (IPCP) that
results in the MN receiving an IP address.
9 The PDSN forwards a Radius Accounting Start message to the AAA server, fully
establishing the session allowing the MN to send/receive data to/from the PDN.
10 The PDSN returns a Mobile IP Registration Reply to the MN, establishing the session
allowing the MN to send/receive data to/from the PDN.
11 Upon completion of the session, the MN sends an LCP Terminate Request message to
the PDSN to end the PPP session.
12 The BSC closes the radio link while the PCF closes the R-P session between it and the
PDSN. All PDSN resources used to facilitate the session are reclaimed (IP address,
memory, etc.).
13 The PDSN sends accounting stop record to the AAA server, ending the session.
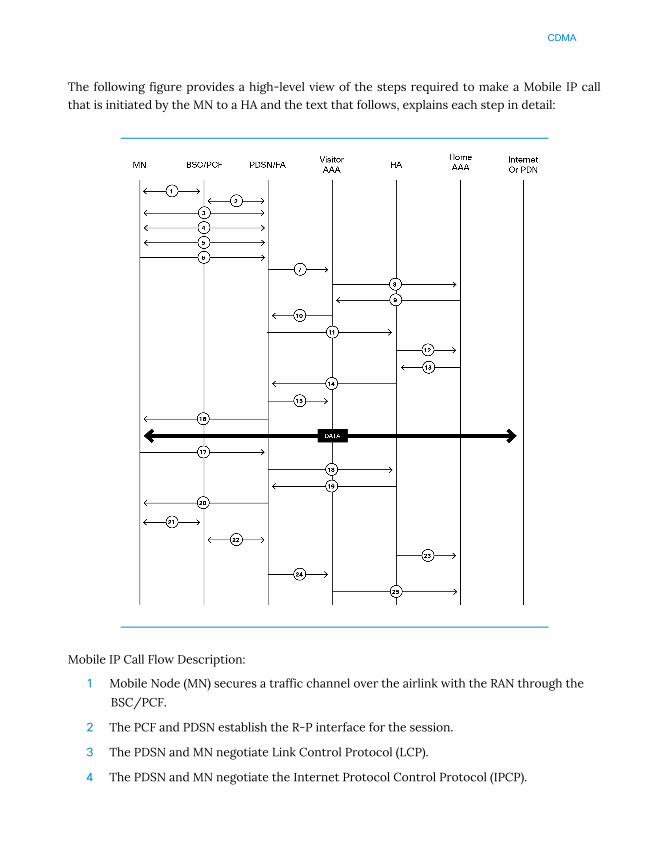
CDMA
The following figure provides a high-level view of the steps required to make a Mobile IP callthat is initiated by the MN to a HA and the text that follows, explains each step in detail:
Mobile IP Call Flow Description:
1 Mobile Node (MN) secures a traffic channel over the airlink with the RAN through the
BSC/PCF.
2 The PCF and PDSN establish the R-P interface for the session.
3 The PDSN and MN negotiate Link Control Protocol (LCP).
4 The PDSN and MN negotiate the Internet Protocol Control Protocol (IPCP).
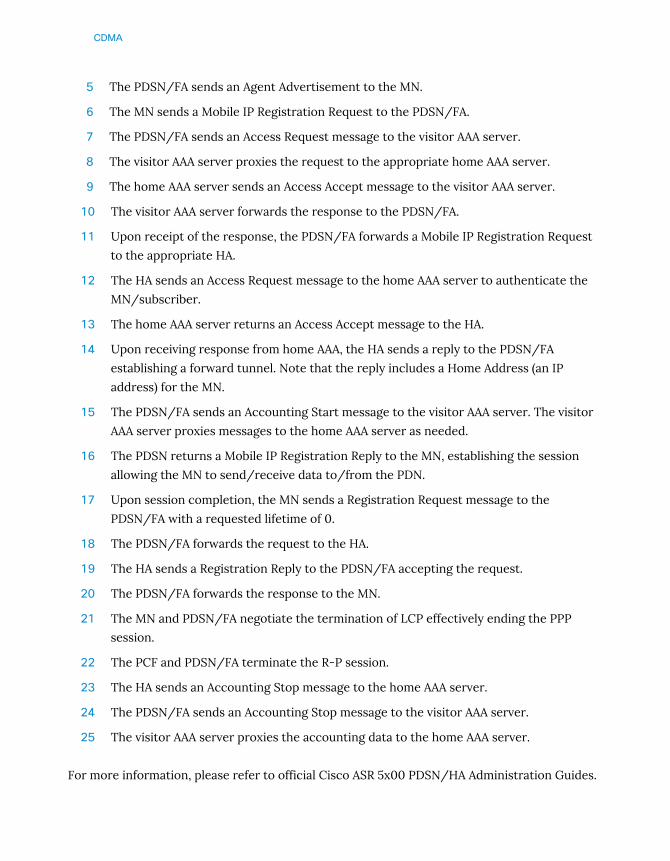
CDMA
5 The PDSN/FA sends an Agent Advertisement to the MN.
6 The MN sends a Mobile IP Registration Request to the PDSN/FA.
7 The PDSN/FA sends an Access Request message to the visitor AAA server.
8 The visitor AAA server proxies the request to the appropriate home AAA server.
9 The home AAA server sends an Access Accept message to the visitor AAA server.
10 The visitor AAA server forwards the response to the PDSN/FA.
11 Upon receipt of the response, the PDSN/FA forwards a Mobile IP Registration Request
to the appropriate HA.
12 The HA sends an Access Request message to the home AAA server to authenticate the
MN/subscriber.
13 The home AAA server returns an Access Accept message to the HA.
14 Upon receiving response from home AAA, the HA sends a reply to the PDSN/FA
establishing a forward tunnel. Note that the reply includes a Home Address (an IP
address) for the MN.
15 The PDSN/FA sends an Accounting Start message to the visitor AAA server. The visitor
AAA server proxies messages to the home AAA server as needed.
16 The PDSN returns a Mobile IP Registration Reply to the MN, establishing the session
allowing the MN to send/receive data to/from the PDN.
17 Upon session completion, the MN sends a Registration Request message to the
PDSN/FA with a requested lifetime of 0.
18 The PDSN/FA forwards the request to the HA.
19 The HA sends a Registration Reply to the PDSN/FA accepting the request.
20 The PDSN/FA forwards the response to the MN.
21 The MN and PDSN/FA negotiate the termination of LCP effectively ending the PPP
session.
22 The PCF and PDSN/FA terminate the R-P session.
23 The HA sends an Accounting Stop message to the home AAA server.
24 The PDSN/FA sends an Accounting Stop message to the visitor AAA server.
25 The visitor AAA server proxies the accounting data to the home AAA server.
For more information, please refer to official Cisco ASR 5x00 PDSN/HA Administration Guides.
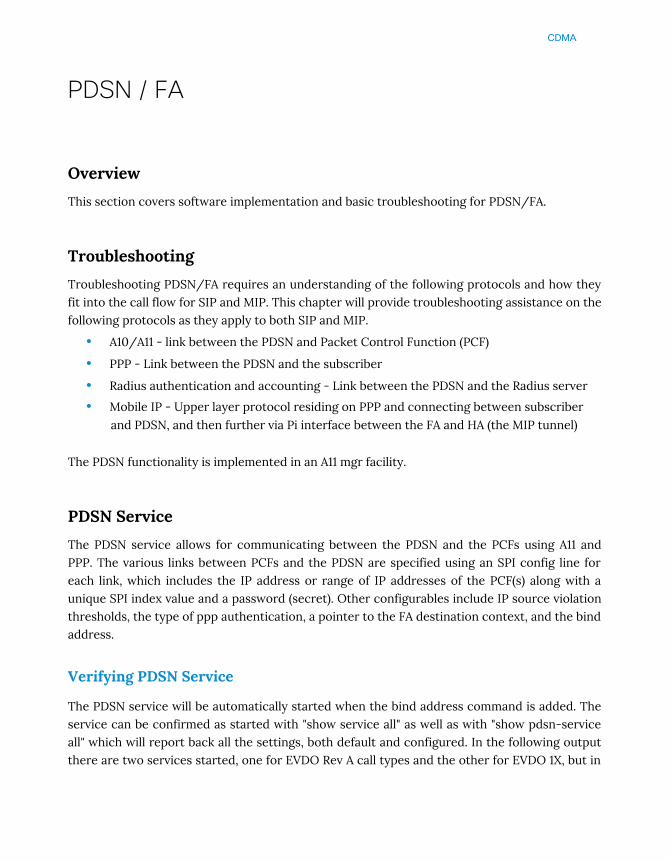
CDMA
PDSN / FA
Overview
This section covers software implementation and basic troubleshooting for PDSN/FA.
Troubleshooting
Troubleshooting PDSN/FA requires an understanding of the following protocols and how theyfit into the call flow for SIP and MIP. This chapter will provide troubleshooting assistance on thefollowing protocols as they apply to both SIP and MIP.
• A10/A11 - link between the PDSN and Packet Control Function (PCF)
• PPP - Link between the PDSN and the subscriber
• Radius authentication and accounting - Link between the PDSN and the Radius server
• Mobile IP - Upper layer protocol residing on PPP and connecting between subscriberand PDSN, and then further via Pi interface between the FA and HA (the MIP tunnel)
The PDSN functionality is implemented in an A11 mgr facility.
PDSN Service
The PDSN service allows for communicating between the PDSN and the PCFs using A11 andPPP. The various links between PCFs and the PDSN are specified using an SPI config line foreach link, which includes the IP address or range of IP addresses of the PCF(s) along with aunique SPI index value and a password (secret). Other configurables include IP source violationthresholds, the type of ppp authentication, a pointer to the FA destination context, and the bindaddress.
Verifying PDSN Service
The PDSN service will be automatically started when the bind address command is added. Theservice can be confirmed as started with "show service all" as well as with "show pdsn-serviceall" which will report back all the settings, both default and configured. In the following outputthere are two services started, one for EVDO Rev A call types and the other for EVDO 1X, but in
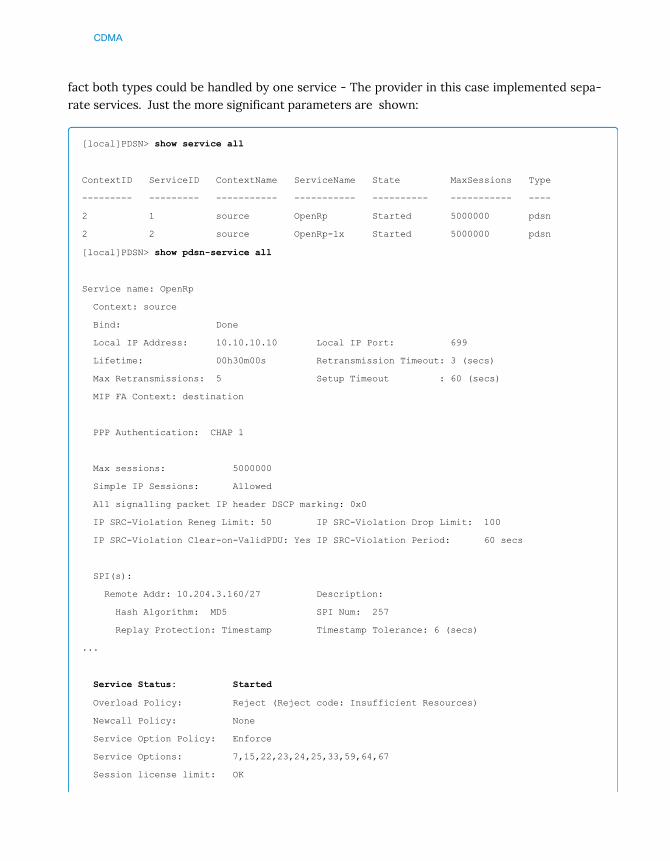
CDMA
fact both types could be handled by one service - The provider in this case implemented sepa-rate services. Just the more significant parameters are shown:
[local]PDSN> show service all
ContextID ServiceID ContextName ServiceName State MaxSessions Type
--------- --------- ----------- ----------- ---------- ----------- ----
2 1 source OpenRp Started 5000000 pdsn
2 2 source OpenRp-1x Started 5000000 pdsn
[local]PDSN> show pdsn-service all
Service name: OpenRp
Context: source
Bind: Done
Local IP Address: 10.10.10.10 Local IP Port: 699
Lifetime: 00h30m00s Retransmission Timeout: 3 (secs)
Max Retransmissions: 5 Setup Timeout : 60 (secs)
MIP FA Context: destination
PPP Authentication: CHAP 1
Max sessions: 5000000
Simple IP Sessions: Allowed
A11 signalling packet IP header DSCP marking: 0x0
IP SRC-Violation Reneg Limit: 50 IP SRC-Violation Drop Limit: 100
IP SRC-Violation Clear-on-ValidPDU: Yes IP SRC-Violation Period: 60 secs
SPI(s):
Remote Addr: 10.204.3.160/27 Description:
Hash Algorithm: MD5 SPI Num: 257
Replay Protection: Timestamp Timestamp Tolerance: 6 (secs)
...
Service Status: Started
Overload Policy: Reject (Reject code: Insufficient Resources)
Newcall Policy: None
Service Option Policy: Enforce
Service Options: 7,15,22,23,24,25,33,59,64,67
Session license limit: OK
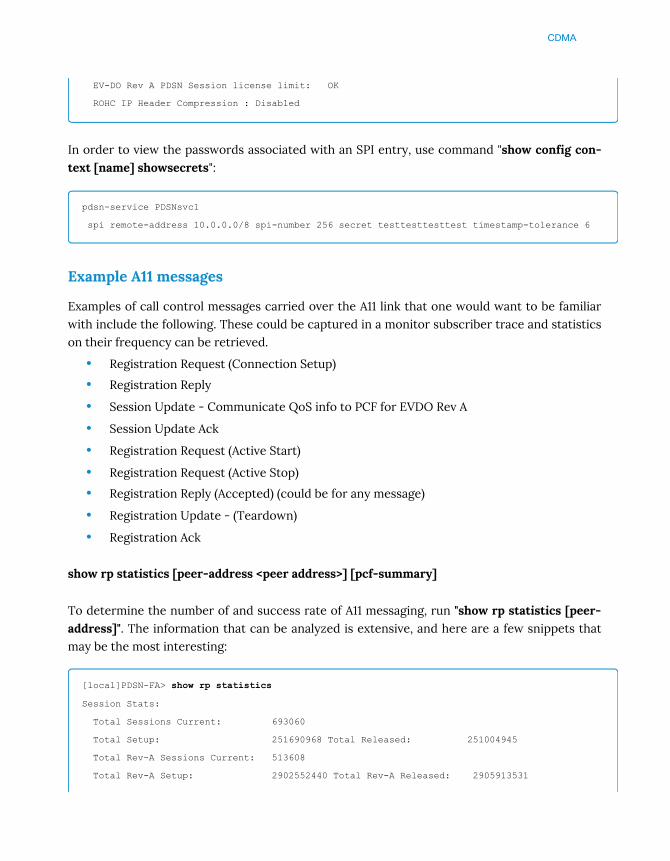
CDMA
EV-DO Rev A PDSN Session license limit: OK
ROHC IP Header Compression : Disabled
In order to view the passwords associated with an SPI entry, use command "show config con-text [name] showsecrets":
pdsn-service PDSNsvc1
spi remote-address 10.0.0.0/8 spi-number 256 secret testtesttesttest timestamp-tolerance 6
Example A11 messages
Examples of call control messages carried over the A11 link that one would want to be familiarwith include the following. These could be captured in a monitor subscriber trace and statisticson their frequency can be retrieved.
• Registration Request (Connection Setup)
• Registration Reply
• Session Update - Communicate QoS info to PCF for EVDO Rev A
• Session Update Ack
• Registration Request (Active Start)
• Registration Request (Active Stop)
• Registration Reply (Accepted) (could be for any message)
• Registration Update - (Teardown)
• Registration Ack
show rp statistics [peer-address <peer address>] [pcf-summary]
To determine the number of and success rate of A11 messaging, run "show rp statistics [peer-address]". The information that can be analyzed is extensive, and here are a few snippets thatmay be the most interesting:
[local]PDSN-FA> show rp statistics
Session Stats:
Total Sessions Current: 693060
Total Setup: 251690968 Total Released: 251004945
Total Rev-A Sessions Current: 513608
Total Rev-A Setup: 2902552440 Total Rev-A Released: 2905913531

CDMA
Session Releases:
De-registered: 625228420 Lifetime Expiry: 480874
PPP Layer Command: 3902253655 PCF-Monitor Fail: 0
GRE Key Mismatch: 2760239 Purged via Audit: 0
Other Reasons: 15249053
A10 Stats:
...
Registration Request/Reply:
Total RRQ/Renew/Dereg RX: 1865609874 Total Accept: 1771652785
Total Denied: 74691983 Total Discard: 19265106
Init RRQ RX: 334769449 Init RRQ Accept: 1605714446
Init RRQ Denied: 72939567 Init RRQ Discard: 10136926
Renew RRQ RX: 25059017 Renew RRQ Accept: 2591155576
Renew Actv Start Accept: 1620013447 Renew Actv Stop Accept: 3172517390
Renew RRQ Denied: 1553147 Renew RRQ Discard: 1495762
Dereg RRQ RX: 1505783217 Dereg RRQ Accept: 3360918218
Dereg Active Stop Accept: 2431998799
Dereg RRQ Denied: 199269 Dereg RRQ Discard: 7634227
Reply Send Error: 0 Airlink Seq Num Invalid: 3432185
Intra PDSN Active Handoff Intra PDSN Dormant Handoff
RRQ Accepted: 99469754 RRQ Accepted: 1093610388
Inter PDSN Handoff
Total RRQ Accepted: 2976123951
Init RRQ Accepted: 2940945806 Renew RRQ Accepted: 35178145
Rev-A RRQ RX: 2907024794 Rev-A RRQ Accept: 2902311549
Rev-A RRQ Denied: 1077569 Rev-A RRQ Discard: 3635676
Registration Request Denied:
Unspecified Reason: 13185685 Admin Prohibited: 178
Insufficient Resources: 5070 PCF Failed Auth: 235509
Identification Mismatch: 2934
Poorly Formed Request: 0
Unknown PDSN Address: 71161403
...
RRQ Denied - Insufficient Resource Reasons:
...

CDMA
RRQ Denied - Poorly Formed Request Reasons:
...
RRQ Denied - Unspecified Reasons:
Null Packet Received: 0 LifeTime Zero In Initial RRQ: 18
Session Manager NotReady: 938185 Closed RP Handoff In Progress:0
No Airlink Setup: 2040273 Intra PDSN Handoff Triggered: 308109
During Handoff: 72463
...
Registration Update/Ack:
...
Registration Update Send Reason:
...
Registration Update Denied:
Reason Unspecified: 5367918
...
Security Violations:
Total Violations: 235845 Bad SPI #: 343
Bad Authenticator: 0 Unknown SPI #: 235502
A number of issues can be narrowed down to a specific PCF peer, in which case the [peer-
address <peer address>] qualifier may turn out to be extremely valuable.
The table below is displayed on a PCF-basis when using the pcf-summary option:
[local]PDSN> show rp statistics pcf-summary
PDSN 10.211.28.133
PCF A11 A11 Curr Curr RRQ RRQ
IP RRQ RRP Sess RevA Accept Discard
10.204.221.65 9251103 9251090 487 516 9250804 13
10.204.221.66 9450869 9450855 518 551 9450581 14
10.204.221.67 9153903 9153896 493 525 9153630 7
10.204.221.68 9649240 9649228 487 529 9648930 12
10.204.221.70 9636193 9636182 550 590 9635899 12
10.204.221.72 9637108 9637097 484 513 9636825 11
10.204.221.74 9701789 9701777 520 561 9701466 12
10.204.221.76 9634613 9634603 509 541 9634383 10
10.204.221.78 9589452 9589441 479 519 9589091 11
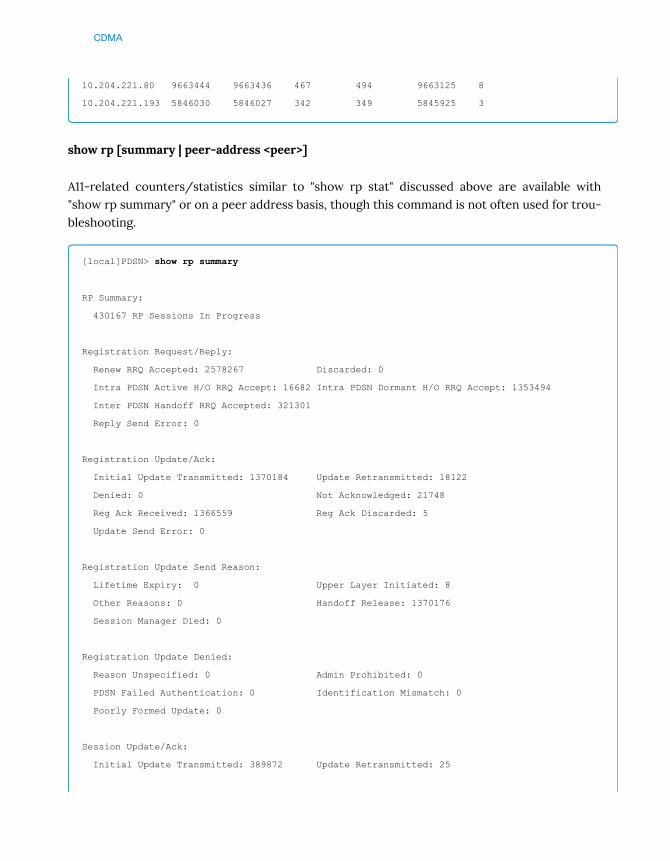
CDMA
10.204.221.80 9663444 9663436 467 494 9663125 8
10.204.221.193 5846030 5846027 342 349 5845925 3
show rp [summary | peer-address <peer>]
A11-related counters/statistics similar to "show rp stat" discussed above are available with"show rp summary" or on a peer address basis, though this command is not often used for trou-bleshooting.
[local]PDSN> show rp summary
RP Summary:
430167 RP Sessions In Progress
Registration Request/Reply:
Renew RRQ Accepted: 2578267 Discarded: 0
Intra PDSN Active H/O RRQ Accept: 16682 Intra PDSN Dormant H/O RRQ Accept: 1353494
Inter PDSN Handoff RRQ Accepted: 321301
Reply Send Error: 0
Registration Update/Ack:
Initial Update Transmitted: 1370184 Update Retransmitted: 18122
Denied: 0 Not Acknowledged: 21748
Reg Ack Received: 1366559 Reg Ack Discarded: 5
Update Send Error: 0
Registration Update Send Reason:
Lifetime Expiry: 0 Upper Layer Initiated: 8
Other Reasons: 0 Handoff Release: 1370176
Session Manager Died: 0
Registration Update Denied:
Reason Unspecified: 0 Admin Prohibited: 0
PDSN Failed Authentication: 0 Identification Mismatch: 0
Poorly Formed Update: 0
Session Update/Ack:
Initial Update Transmitted: 389872 Update Retransmitted: 25
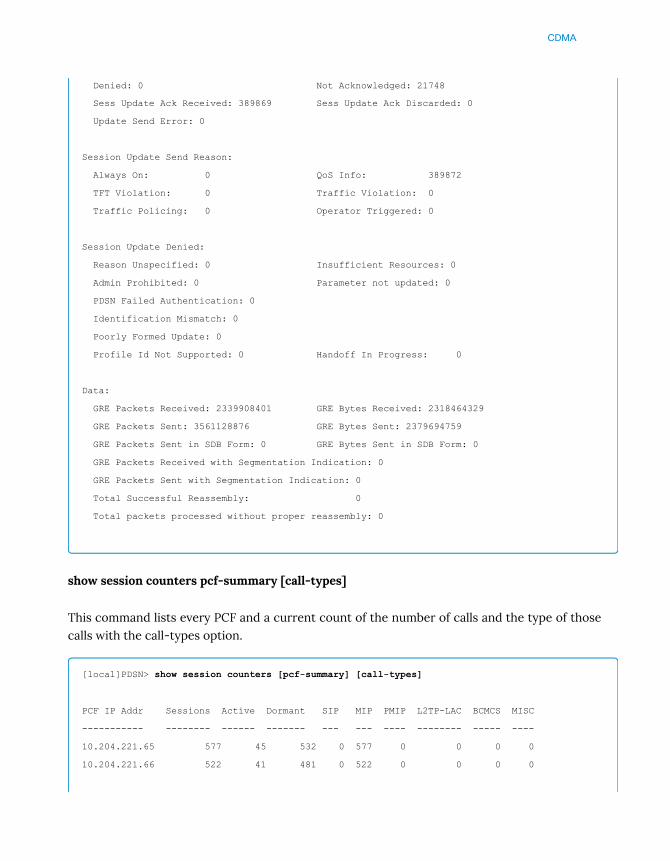
CDMA
Denied: 0 Not Acknowledged: 21748
Sess Update Ack Received: 389869 Sess Update Ack Discarded: 0
Update Send Error: 0
Session Update Send Reason:
Always On: 0 QoS Info: 389872
TFT Violation: 0 Traffic Violation: 0
Traffic Policing: 0 Operator Triggered: 0
Session Update Denied:
Reason Unspecified: 0 Insufficient Resources: 0
Admin Prohibited: 0 Parameter not updated: 0
PDSN Failed Authentication: 0
Identification Mismatch: 0
Poorly Formed Update: 0
Profile Id Not Supported: 0 Handoff In Progress: 0
Data:
GRE Packets Received: 2339908401 GRE Bytes Received: 2318464329
GRE Packets Sent: 3561128876 GRE Bytes Sent: 2379694759
GRE Packets Sent in SDB Form: 0 GRE Bytes Sent in SDB Form: 0
GRE Packets Received with Segmentation Indication: 0
GRE Packets Sent with Segmentation Indication: 0
Total Successful Reassembly: 0
Total packets processed without proper reassembly: 0
show session counters pcf-summary [call-types]
This command lists every PCF and a current count of the number of calls and the type of thosecalls with the call-types option.
[local]PDSN> show session counters [pcf-summary] [call-types]
PCF IP Addr Sessions Active Dormant SIP MIP PMIP L2TP-LAC BCMCS MISC
----------- -------- ------ ------- --- --- ---- -------- ----- ----
10.204.221.65 577 45 532 0 577 0 0 0 0
10.204.221.66 522 41 481 0 522 0 0 0 0
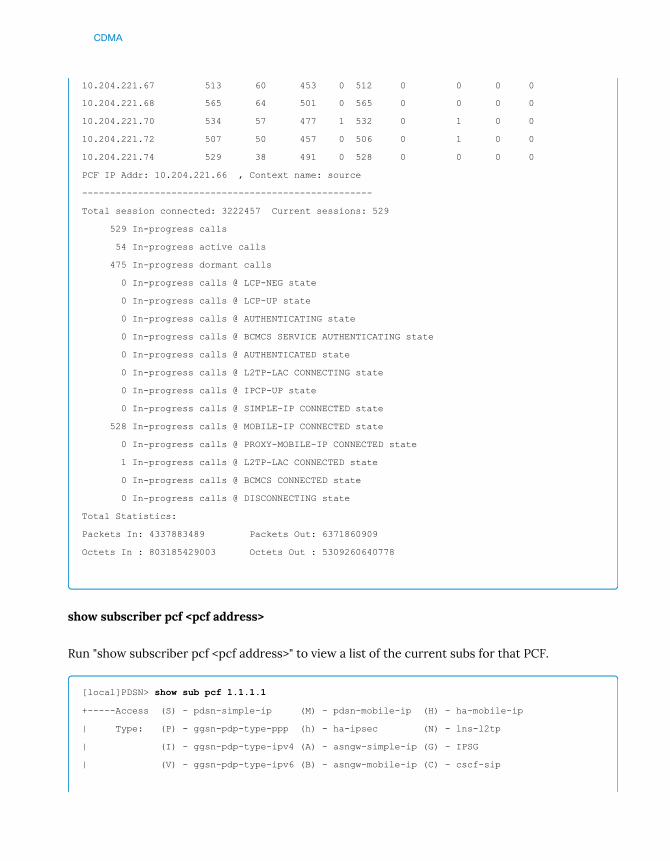
CDMA
10.204.221.67 513 60 453 0 512 0 0 0 0
10.204.221.68 565 64 501 0 565 0 0 0 0
10.204.221.70 534 57 477 1 532 0 1 0 0
10.204.221.72 507 50 457 0 506 0 1 0 0
10.204.221.74 529 38 491 0 528 0 0 0 0
PCF IP Addr: 10.204.221.66 , Context name: source
----------------------------------------------------
Total session connected: 3222457 Current sessions: 529
529 In-progress calls
54 In-progress active calls
475 In-progress dormant calls
0 In-progress calls @ LCP-NEG state
0 In-progress calls @ LCP-UP state
0 In-progress calls @ AUTHENTICATING state
0 In-progress calls @ BCMCS SERVICE AUTHENTICATING state
0 In-progress calls @ AUTHENTICATED state
0 In-progress calls @ L2TP-LAC CONNECTING state
0 In-progress calls @ IPCP-UP state
0 In-progress calls @ SIMPLE-IP CONNECTED state
528 In-progress calls @ MOBILE-IP CONNECTED state
0 In-progress calls @ PROXY-MOBILE-IP CONNECTED state
1 In-progress calls @ L2TP-LAC CONNECTED state
0 In-progress calls @ BCMCS CONNECTED state
0 In-progress calls @ DISCONNECTING state
Total Statistics:
Packets In: 4337883489 Packets Out: 6371860909
Octets In : 803185429003 Octets Out : 5309260640778
show subscriber pcf <pcf address>
Run "show subscriber pcf <pcf address>" to view a list of the current subs for that PCF.
[local]PDSN> show sub pcf 1.1.1.1
+-----Access (S) - pdsn-simple-ip (M) - pdsn-mobile-ip (H) - ha-mobile-ip
| Type: (P) - ggsn-pdp-type-ppp (h) - ha-ipsec (N) - lns-l2tp
| (I) - ggsn-pdp-type-ipv4 (A) - asngw-simple-ip (G) - IPSG
| (V) - ggsn-pdp-type-ipv6 (B) - asngw-mobile-ip (C) - cscf-sip
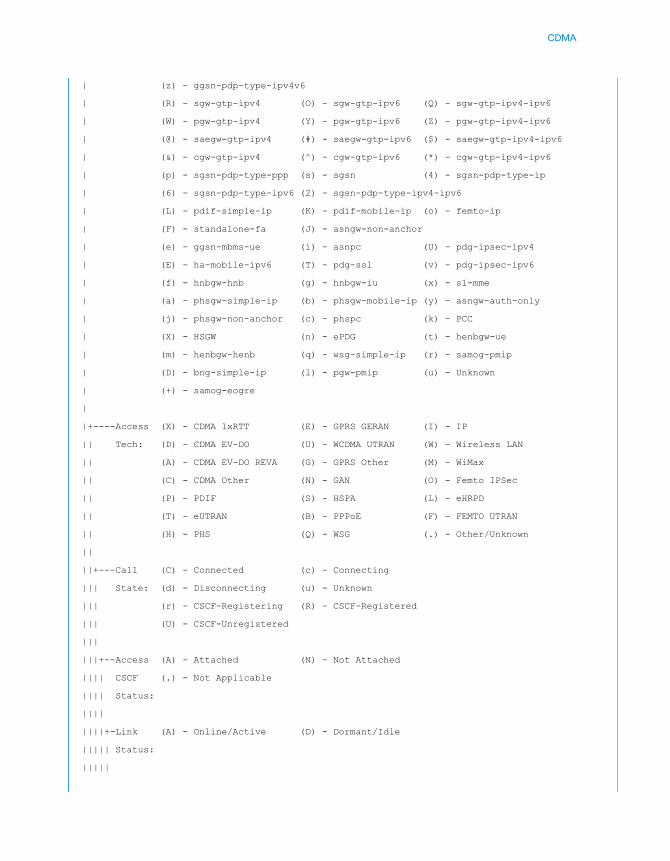
CDMA
| (z) - ggsn-pdp-type-ipv4v6
| (R) - sgw-gtp-ipv4 (O) - sgw-gtp-ipv6 (Q) - sgw-gtp-ipv4-ipv6
| (W) - pgw-gtp-ipv4 (Y) - pgw-gtp-ipv6 (Z) - pgw-gtp-ipv4-ipv6
| (@) - saegw-gtp-ipv4 (#) - saegw-gtp-ipv6 ($) - saegw-gtp-ipv4-ipv6
| (&) - cgw-gtp-ipv4 (^) - cgw-gtp-ipv6 (*) - cgw-gtp-ipv4-ipv6
| (p) - sgsn-pdp-type-ppp (s) - sgsn (4) - sgsn-pdp-type-ip
| (6) - sgsn-pdp-type-ipv6 (2) - sgsn-pdp-type-ipv4-ipv6
| (L) - pdif-simple-ip (K) - pdif-mobile-ip (o) - femto-ip
| (F) - standalone-fa (J) - asngw-non-anchor
| (e) - ggsn-mbms-ue (i) - asnpc (U) - pdg-ipsec-ipv4
| (E) - ha-mobile-ipv6 (T) - pdg-ssl (v) - pdg-ipsec-ipv6
| (f) - hnbgw-hnb (g) - hnbgw-iu (x) - s1-mme
| (a) - phsgw-simple-ip (b) - phsgw-mobile-ip (y) - asngw-auth-only
| (j) - phsgw-non-anchor (c) - phspc (k) - PCC
| (X) - HSGW (n) - ePDG (t) - henbgw-ue
| (m) - henbgw-henb (q) - wsg-simple-ip (r) - samog-pmip
| (D) - bng-simple-ip (l) - pgw-pmip (u) - Unknown
| (+) - samog-eogre
|
|+----Access (X) - CDMA 1xRTT (E) - GPRS GERAN (I) - IP
|| Tech: (D) - CDMA EV-DO (U) - WCDMA UTRAN (W) - Wireless LAN
|| (A) - CDMA EV-DO REVA (G) - GPRS Other (M) - WiMax
|| (C) - CDMA Other (N) - GAN (O) - Femto IPSec
|| (P) - PDIF (S) - HSPA (L) - eHRPD
|| (T) - eUTRAN (B) - PPPoE (F) - FEMTO UTRAN
|| (H) - PHS (Q) - WSG (.) - Other/Unknown
||
||+---Call (C) - Connected (c) - Connecting
||| State: (d) - Disconnecting (u) - Unknown
||| (r) - CSCF-Registering (R) - CSCF-Registered
||| (U) - CSCF-Unregistered
|||
|||+--Access (A) - Attached (N) - Not Attached
|||| CSCF (.) - Not Applicable
|||| Status:
||||
||||+-Link (A) - Online/Active (D) - Dormant/Idle
||||| Status:
|||||

CDMA
|||||+Network (I) - IP (M) - Mobile-IP (L) - L2TP
||||||Type: (P) - Proxy-Mobile-IP (i) - IP-in-IP (G) - GRE
|||||| (V) - IPv6-in-IPv4 (S) - IPSEC (C) - GTP
|||||| (A) - R4 (IP-GRE) (T) - IPv6 (u) - Unknown
|||||| (W) - PMIPv6(IPv4) (Y) - PMIPv6(IPv4+IPv6) (R) - IPv4+IPv6
|||||| (v) - PMIPv6(IPv6) (/) - GTPv1(For SAMOG) (+) - GTPv2(For SAMOG)
||||||
||||||
vvvvvv CALLID MSID USERNAME IP TIME-IDLE
------ -------- --------------- ---------------------- ----------------------------- ---------
MACNDM 000a0360 123451234567899 [email protected] 55.55.55.55 00h13m49s
Monitoring subscriber sessions
Monitoring specific subscriber sessions with mon sub is probably one of the most valuabletroubleshooting approaches available. By default, mon sub will automatically capture all A11,PPP and Radius protocol output as well as user-plane data. Increasing the verbosity to level 2should be sufficient. For dataplane issues, the Hex/ASCII options are of course always available.
If the issue being troubleshot is specifically related to A11, then note that monitoring by user-name will miss the A11 exchanges due to the fact that the username is not known at the begin-ning of the flow. In such cases, take an initial trace by username, then note down the MSIDfrom the A11 RRQ (or Radius Auth msg), and then re-run the mon sub by MSID to catch outputfrom the start.
If using the monitor subscriber menu, the following options are valuable for both MIP and SIP.
• Because the initial call setup messages indicate the RAN technology, options for EVDORev 0, Rev A, and 1X exist for distinguishing such calls
• Since some issues encountered are specific to a PCF (or range of PCFs), the monitor byPCF IP option may prove to be very valuable
a) By MSID/IMSI
b) By Username
c) By Callid
d) By IP Address
f) Next-Call
k) Next-1xRTT Call

CDMA
m) Next-CLOSEDRP Call - refers to a Nortel proprietary PDSN service that uses L2TP
protocol
n) Next-EVDO-Rev0 Call
o) Next-EVDO-RevA Call
z) By PCF IP Address
13) Next-OpenRP Call
show rp counters (callid | msid | username) <call identifier>
RP-related counters can be retrieved with "show rp counters (callid | msid | username) <callidentifier>" and may be useful in very specific troubleshooting scenarios where counts of mes-saging for a subscriber over a period of time may be useful.
Username: [email protected] Callid: 00082704 Msid: 123451234567899
Registration Request/Reply:
Renew RRQ Accepted: 718 Discarded: 0
Intra PDSN Active H/O RRQ Accept: 0 Intra PDSN Dormant H/O RRQ Accept: 2
Inter PDSN Handoff RRQ Accepted: 1
Reply Send Error: 0
Registration Update/Ack:
Initial Update Transmitted: 2 Update Retransmitted: 10
Denied: 0 Not Acknowledged: 12
Reg Ack Received: 0 Reg Ack Discarded: 0
Update Send Error: 0
Registration Update Send Reason:
Lifetime Expiry: 0 Upper Layer Initiated: 0
Other Reasons: 0 Handoff Release: 2
Session Manager Exited: 0
...
Session Update/Ack:
Initial Update Transmitted: 1 Update Retransmitted: 0
Denied: 0 Not Acknowledged: 0
Sess Update Ack Received: 1 Sess Update Ack Discarded: 0
Update Send Error: 0

CDMA
Session Update Send Reason:
Always On: 0 QoS Info: 1
TFT violation: 0 Traffic Violation: 0
Traffic Policing: 0 Operator Triggered: 0
GRE Receive:
Total Packets Received: 3995 Protocol Type Error: 0
Total Bytes Received: 346893 GRE Key Absent: 0
GRE Checksum Error: 0
Invalid Packet Length: 0
GRE Send:
Total Packets Sent: 2439
Total Bytes Sent: 395120
Total Packets Sent in SDB:0
Total Bytes Sent in SDB: 0
show rp full (callid | msid | username) <call identifier>
Another view of A11-related information for a subscriber can be found with "show rp full". Fieldsof interest may be the service option, remaining lifetime and handoff info.
[local]PDSN-FA> show rp full msid 123456789123456
Username: [email protected] Callid: 00082704 Msid: 123456789123456
A10 Connection #1:(Main)
PCF Address: 192.168.1.10 PDSN Address: 192.168.1.1
MN Sess Ref ID: 1 GRE Key: 172481
Service Option: 59
Flow Control State : XON
Lifetime: 00h30m00s Remaining Lifetime: 00h23m39s
GRE Receive:
Total Packets Rcvd: 226 Total Bytes Rcvd: 19912
GRE Send:
Total Packets Sent: 151 Total Bytes Sent: 23828
Data Over Signaling Packets: 0 Data Over Signaling Bytes: 0

CDMA
IP Header compression:
Forward: ROHC not negotiated
Reverse: ROHC not negotiated
...
SPI: 257
Prev System Id: 0 Current System Id: 0
Prev Network Id: 0 Current Network Id: 0
Prev Packet Zone Id: 0 Current Packet Zone Id: 0
BSID: 007700050003 GRE Segmentation : Disabled
Registration Request/Reply:
Renew RRQ Accepted: 719 Discarded: 0
Intra PDSN Active H/O RRQ Accept: 0 Intra PDSN Dormant H/O RRQ Accept: 2
Inter PDSN Handoff RRQ Accepted: 1
Reply Send Error: 0
Registration Update/Ack:
Initial Update Transmitted: 2 Update Retransmitted: 10
Denied: 0 Not Acknowledged: 12
Reg Ack Received: 0 Reg Ack Discarded: 0
Update Send Error: 0
Registration Update Send Reason:
Lifetime Expiry: 0 Upper Layer Initiated: 0
Other Reasons: 0 Handoff Release: 2
Session Manager Exited: 0
Registration Update Denied:
Reason Unspecified: 0 Admin Prohibited: 0
PDSN Failed Authentication: 0 Identification Mismatch: 0
Poorly Formed Update: 0
Session Update/Ack:
Initial Update Transmitted: 1 Update Retransmitted: 0
Denied: 0 Not Acknowledged: 0
Sess Update Ack Received: 1 Sess Update Ack Discarded: 0
Update Send Error: 0
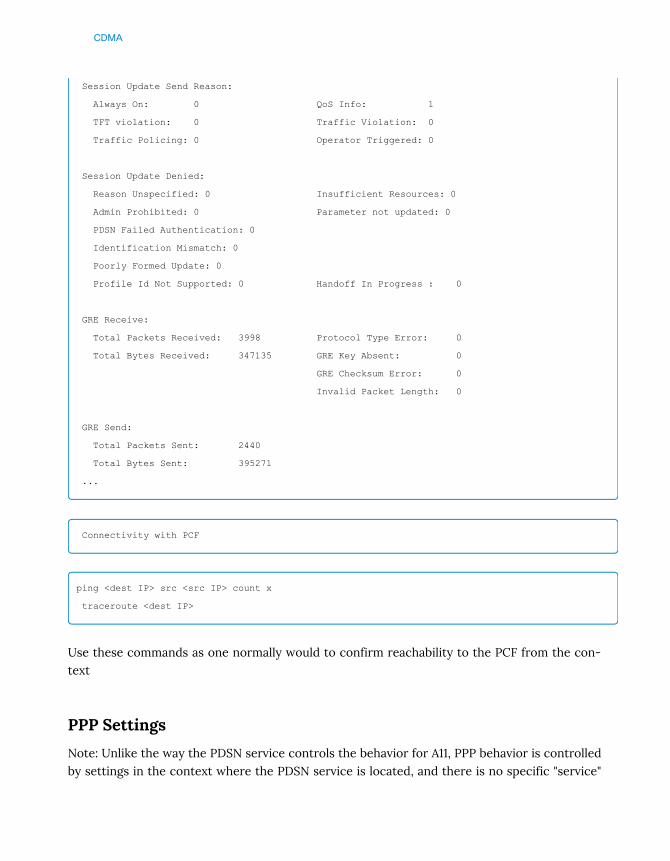
CDMA
Session Update Send Reason:
Always On: 0 QoS Info: 1
TFT violation: 0 Traffic Violation: 0
Traffic Policing: 0 Operator Triggered: 0
Session Update Denied:
Reason Unspecified: 0 Insufficient Resources: 0
Admin Prohibited: 0 Parameter not updated: 0
PDSN Failed Authentication: 0
Identification Mismatch: 0
Poorly Formed Update: 0
Profile Id Not Supported: 0 Handoff In Progress : 0
GRE Receive:
Total Packets Received: 3998 Protocol Type Error: 0
Total Bytes Received: 347135 GRE Key Absent: 0
GRE Checksum Error: 0
Invalid Packet Length: 0
GRE Send:
Total Packets Sent: 2440
Total Bytes Sent: 395271
...
Connectivity with PCF
ping <dest IP> src <src IP> count x
traceroute <dest IP>
Use these commands as one normally would to confirm reachability to the PCF from the con-text
PPP Settings
Note: Unlike the way the PDSN service controls the behavior for A11, PPP behavior is controlledby settings in the context where the PDSN service is located, and there is no specific "service"

CDMA
to start, for example:
ppp max-retransmissions 5
ppp dormant send-lcp-terminate
ppp negotiate default-value-options
ppp lcp-start-delay 50
show ppp statistics [pcf-address <pcf address>]
PPP stats are certainly useful in troubleshooting many issues. Issues are often where PPP nego-tiation does not complete due to timeouts and retries.
[local]PDSN> show ppp statistics
PPP statistics
total sessions initiated: 926984043 session re-negotiated: 302568379
successful sessions: 794350472 failed sessions: 132634235
total sessions released: 927123561 failed re-negotiations: 76565889
released by local side: 837559870 released by remote side: 89563691
Session Failures
LCP failure max-retry: 30279177 LCP failure option-issue: 0
LCP failure unknown: 0 IPCP failure max-retry: 4136030
IPCP failure option-issue: 0 IPCP failure unknown: 0
IPv6CP failure max-retry: 0
IPv6CP failure option-iss: 0 IPv6CP failure unknown: 0
VSNCP failure max-retry: 387 VSNCP failure option-iss: 188
VSNCP failure unknown: 0
Authentication failures: 108004150 Authentication aborted: 461813
remote terminated: 1517843 lower layer disconnected: 0
miscellaneous failures: 57092177
Session Progress
sessions (re)entered LCP: 1222172532 sessions (re)entered Auth: 144745436
sessions (re)entered IPCP: 1002603438 sessions (re)enter IPv6CP: 0
successful LCP: 1123620704
successful Authentication: 30978699
VSNCP Statistics
Attempted: 8183 Connected: 1508
Failed: 12 Released by local side: 0
Released by remote side: 218754167
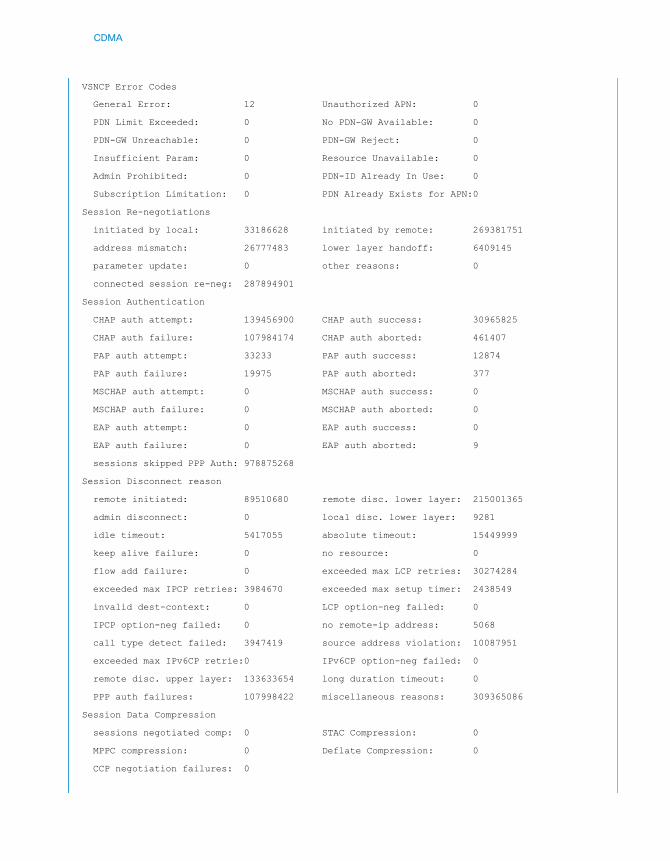
CDMA
VSNCP Error Codes
General Error: 12 Unauthorized APN: 0
PDN Limit Exceeded: 0 No PDN-GW Available: 0
PDN-GW Unreachable: 0 PDN-GW Reject: 0
Insufficient Param: 0 Resource Unavailable: 0
Admin Prohibited: 0 PDN-ID Already In Use: 0
Subscription Limitation: 0 PDN Already Exists for APN:0
Session Re-negotiations
initiated by local: 33186628 initiated by remote: 269381751
address mismatch: 26777483 lower layer handoff: 6409145
parameter update: 0 other reasons: 0
connected session re-neg: 287894901
Session Authentication
CHAP auth attempt: 139456900 CHAP auth success: 30965825
CHAP auth failure: 107984174 CHAP auth aborted: 461407
PAP auth attempt: 33233 PAP auth success: 12874
PAP auth failure: 19975 PAP auth aborted: 377
MSCHAP auth attempt: 0 MSCHAP auth success: 0
MSCHAP auth failure: 0 MSCHAP auth aborted: 0
EAP auth attempt: 0 EAP auth success: 0
EAP auth failure: 0 EAP auth aborted: 9
sessions skipped PPP Auth: 978875268
Session Disconnect reason
remote initiated: 89510680 remote disc. lower layer: 215001365
admin disconnect: 0 local disc. lower layer: 9281
idle timeout: 5417055 absolute timeout: 15449999
keep alive failure: 0 no resource: 0
flow add failure: 0 exceeded max LCP retries: 30274284
exceeded max IPCP retries: 3984670 exceeded max setup timer: 2438549
invalid dest-context: 0 LCP option-neg failed: 0
IPCP option-neg failed: 0 no remote-ip address: 5068
call type detect failed: 3947419 source address violation: 10087951
exceeded max IPv6CP retrie:0 IPv6CP option-neg failed: 0
remote disc. upper layer: 133633654 long duration timeout: 0
PPP auth failures: 107998422 miscellaneous reasons: 309365086
Session Data Compression
sessions negotiated comp: 0 STAC Compression: 0
MPPC compression: 0 Deflate Compression: 0
CCP negotiation failures: 0

CDMA
Session Header Compression
VJ compression: 7075
ROHC compression: 0
LCP Echo Statistics
total LCP Echo Req. sent: 0 LCP Echo Req. resent: 0
LCP Echo Reply received: 21 LCP Echo Request timeout: 0
LCP Vendor Specific Statistics
total LCP VSE Req. sent: 0 LCP VSE Req. resent: 0
LCP VSE Reply received: 0 LCP VSE Req. proto. rej.: 0
LCP VSE Req. timeout: 0 LCP VSE Req. max-retry: 0
Receive Errors
bad FCS errors: 1542748128 unknown protocol errors: 100893
bad Address errors: 0 bad control field errors: 0
bad pkt length: 300
There are also a number of PPP-related disconnect reasons that can be examined:
[local]PDSN> show session disconnect-reasons | grep -i ppp
PPP-LCP-max-retry-reached 1107275 3.41101
PPP-Auth-failed 3197373 9.84964 <= this is
actually due to Radius failures
PPP-Auth-failed-max-retry-reached 15687 0.04832
PPP-IPCP-max-retry-reached 143205 0.44115
PPP-LCP-remote-disconnect 2872204 8.84794
subscriber profile
The subscriber profile is a critical part of the configuration and is located in the source context.It specifies items such as:
• The AAA group that itself describes connectivity to the Radius server(s)
• Primary and secondary DNS servers to be assigned to the subscribers
• Idle and absolute timeouts
• Destination context name

CDMA
The subscriber profile that will be used is based on the domain of the username of the sub-scriber which is presented either thru a PPP CHAP response (SIP) or a MIP Registration Request(MIP). For this to happen, domain statements are configured to pair each possible domain witha named subscriber profile. Note that up to the point in time that the username has not yetbeen received in the call flow (MIP or SIP), the default subscriber profile with its settings will beused.
domain serviceprovider.com default subscriber serviceprovider
subscriber name serviceprovider
aaa group default
dns primary <dns 1>
dns secondary <dns 2>
timeout idle 7500
timeout absolute 86400
no ip header-compression
ip context-name destination
active-charging rulebase SIP
exit
Radius Settings
Radius protocol is used to authenticate subscribers during the call flow, and to report data usageduring a subscriber's session, or on disconnect. Settings are configured in a aaa group sectionand include timers, retries, and the Radius server IPs themselves, along with server priorities (orround robin). Similar to the above with PDSN SPIs, the encrypted passwords can be viewed withthe showsecrets option. Please see the Radius Chapter for details on troubleshooting Radius,which will apply to MIP, SIP, or any other protocol. The biggest area where issues are seen is withreachability to the Radius servers, which is reported by "show radius counters all".
FA Service
The FA service allows for passing through communications from the PDSN, to the Pi interfaceconnecting the FA and HA services (MIP tunnel). It is NOT used with SIP but with MIP only. Theservice can be located in the same context as PDSN, but it is often located in a separate (egress- towards the network/internet) context. As with PDSN and PCFs, there are SPI settings that
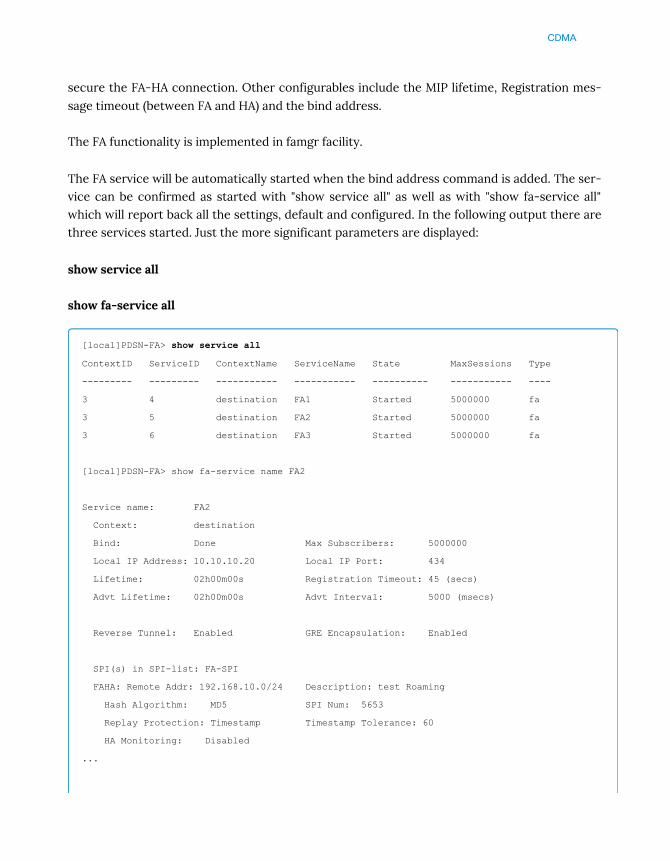
CDMA
secure the FA-HA connection. Other configurables include the MIP lifetime, Registration mes-sage timeout (between FA and HA) and the bind address.
The FA functionality is implemented in famgr facility.
The FA service will be automatically started when the bind address command is added. The ser-vice can be confirmed as started with "show service all" as well as with "show fa-service all"which will report back all the settings, default and configured. In the following output there arethree services started. Just the more significant parameters are displayed:
show service all
show fa-service all
[local]PDSN-FA> show service all
ContextID ServiceID ContextName ServiceName State MaxSessions Type
--------- --------- ----------- ----------- ---------- ----------- ----
3 4 destination FA1 Started 5000000 fa
3 5 destination FA2 Started 5000000 fa
3 6 destination FA3 Started 5000000 fa
[local]PDSN-FA> show fa-service name FA2
Service name: FA2
Context: destination
Bind: Done Max Subscribers: 5000000
Local IP Address: 10.10.10.20 Local IP Port: 434
Lifetime: 02h00m00s Registration Timeout: 45 (secs)
Advt Lifetime: 02h00m00s Advt Interval: 5000 (msecs)
Reverse Tunnel: Enabled GRE Encapsulation: Enabled
SPI(s) in SPI-list: FA-SPI
FAHA: Remote Addr: 192.168.10.0/24 Description: test Roaming
Hash Algorithm: MD5 SPI Num: 5653
Replay Protection: Timestamp Timestamp Tolerance: 60
HA Monitoring: Disabled
...

CDMA
Registration Revocation: Enabled
Reg-Revocation I Bit: Enabled
Reg-Revocation Max Retries: 3 Reg-Revocation Timeout: 1 (secs)
Service Status: Started
MN-AAA Auth Policy: Renew-and-dereg-noauth Optimize-Retries: Enabled
MN-HA Auth Policy: Allow-noauth
Newcall Policy: None
HA Failover: Disabled
Retrans Timeout: 2 (secs) Retries
show mipfa statistics [peer-address <peer>] | [ fa-service <fa service>]
Probably the most important command for the FA service, this tracks all MIP protocol activitybetween the FA and HA services. The peer-address option is fantastic for troubleshooting is-sues with particular HA peers, while the fa-service option will narrow down to a particular FAservice if there are multiple FA services configured.
[local]PDSN> show mipfa statistics
Agent Advt Sent: 989603885 Agent Solicit Rcvd: 11645690
MIP AAA Authentication:
Attempts: 943977906 Success: 830323604
Total Failures: 111922933
Actual Auth Failures: 110577641 Misc Auth Failures: 87773
DMU Auth Failures: 1257519
Registration Request Received:
Total Received Reg: 1310432155 Accepted Reg: 1144881296
Rejected Reg: 161584022
Denied Reg: 161584021 Discarded Reg: 1
Relayed Reg: 1192737581 Auth Failed Reg: 111922933
FA Denied Reg: 116634395 HA Denied Reg: 44764702
Rcvd with MIP Key Data: 266660
Init RRQ Received: 948975318 Init RRQ Accepted: 785032497

CDMA
Init RRQ Rejected: 159928015
Init RRQ Denied: 159928015 Init RRQ Discarded: 0
Init RRQ Relayed: 832558995 Init RRQ Auth Failed: 110665414
Init PMIP RRQ Xmit: 1 Init PMIP RRQ Re-Xmit: 0
Init RRQ Denied by FA: 115348237 Init RRQ Denied by HA: 44579778
Renew RRQ Received: 217036742 Renew RRQ Accepted: 215550059
Renew RRQ Rejected: 1469277
Renew RRQ Denied: 1469277 Renew RRQ Discarded: 0
Renew RRQ Relayed: 215760207 Renew RRQ Auth Failed: 0
Renew PMIP RRQ Xmit: 0 Renew PMIP RRQ Re-Xmit: 0
Renew RRQ Denied by FA: 1284353 Renew RRQ Denied by HA: 184924
Dereg RRQ Received: 144579389 Dereg RRQ Accepted: 144579390
Dereg RRQ Rejected: 1805
Dereg RRQ Denied: 1805 Dereg RRQ Discarded: 0
Dereg RRQ Relayed: 144418379 Dereg RRQ Auth Failed: 0
Dereg PMIP RRQ Xmit: 1 Dereg PMIP RRQ Re-Xmit: 0
Dereg RRQ Denied by FA: 1805 Dereg RRQ Denied by HA: 0
Denied by FA:
Unspecified error: 0 Reg Timeout: 11650
Admin Prohibited: 1051975 No Resources: 3255
MN Auth Failure: 110665414 HA Auth Failure: 4
Lifetime too long: 0 Poorly formed Request: 58490
Poorly formed Reply: 0 MN Too Distant: 0
Invalid COA: 0 Missing NAI: 13
Missing Home Agent: 6438 Missing Home Addr: 0
Unknown Challenge: 3559526 Missing Challenge: 4
Stale Challenge: 0
Encap Unavailable: 0 Rev Tunnel Unavailable: 0
Rev Tunnel Mandatory: 19961 HA Network Unreachable: 0
Delivery Style Unavailable: 0 HA Host Unreachable: 0
HA Port Unreachable: 117 HA Unreachable: 29
Unknown CVSE Rcvd: 0 MIP Key Request: 997189
AAA Authenticator: 260330 Public Key Invalid: 0
Discarded by FA:
Invalid Extn: 0 Invalid UDP Checksum: 1
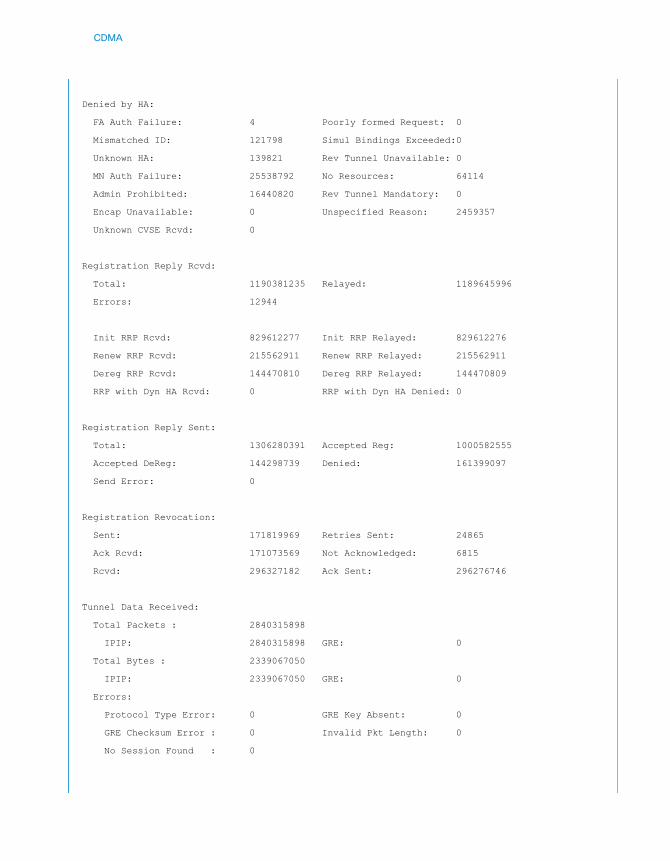
CDMA
Denied by HA:
FA Auth Failure: 4 Poorly formed Request: 0
Mismatched ID: 121798 Simul Bindings Exceeded:0
Unknown HA: 139821 Rev Tunnel Unavailable: 0
MN Auth Failure: 25538792 No Resources: 64114
Admin Prohibited: 16440820 Rev Tunnel Mandatory: 0
Encap Unavailable: 0 Unspecified Reason: 2459357
Unknown CVSE Rcvd: 0
Registration Reply Rcvd:
Total: 1190381235 Relayed: 1189645996
Errors: 12944
Init RRP Rcvd: 829612277 Init RRP Relayed: 829612276
Renew RRP Rcvd: 215562911 Renew RRP Relayed: 215562911
Dereg RRP Rcvd: 144470810 Dereg RRP Relayed: 144470809
RRP with Dyn HA Rcvd: 0 RRP with Dyn HA Denied: 0
Registration Reply Sent:
Total: 1306280391 Accepted Reg: 1000582555
Accepted DeReg: 144298739 Denied: 161399097
Send Error: 0
Registration Revocation:
Sent: 171819969 Retries Sent: 24865
Ack Rcvd: 171073569 Not Acknowledged: 6815
Rcvd: 296327182 Ack Sent: 296276746
Tunnel Data Received:
Total Packets : 2840315898
IPIP: 2840315898 GRE: 0
Total Bytes : 2339067050
IPIP: 2339067050 GRE: 0
Errors:
Protocol Type Error: 0 GRE Key Absent: 0
GRE Checksum Error : 0 Invalid Pkt Length: 0
No Session Found : 0
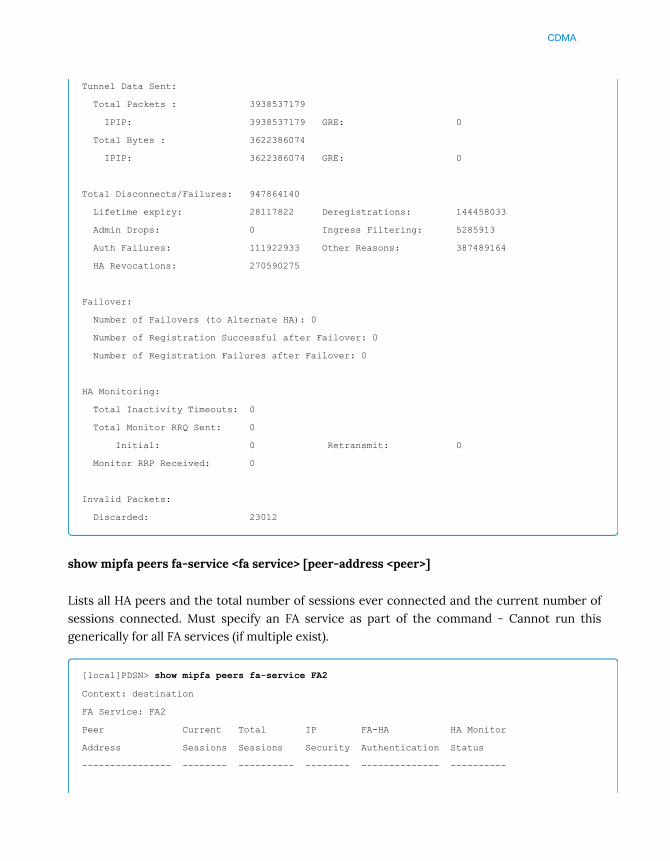
CDMA
Tunnel Data Sent:
Total Packets : 3938537179
IPIP: 3938537179 GRE: 0
Total Bytes : 3622386074
IPIP: 3622386074 GRE: 0
Total Disconnects/Failures: 947864140
Lifetime expiry: 28117822 Deregistrations: 144458033
Admin Drops: 0 Ingress Filtering: 5285913
Auth Failures: 111922933 Other Reasons: 387489164
HA Revocations: 270590275
Failover:
Number of Failovers (to Alternate HA): 0
Number of Registration Successful after Failover: 0
Number of Registration Failures after Failover: 0
HA Monitoring:
Total Inactivity Timeouts: 0
Total Monitor RRQ Sent: 0
Initial: 0 Retransmit: 0
Monitor RRP Received: 0
Invalid Packets:
Discarded: 23012
show mipfa peers fa-service <fa service> [peer-address <peer>]
Lists all HA peers and the total number of sessions ever connected and the current number ofsessions connected. Must specify an FA service as part of the command - Cannot run thisgenerically for all FA services (if multiple exist).
[local]PDSN> show mipfa peers fa-service FA2
Context: destination
FA Service: FA2
Peer Current Total IP FA-HA HA Monitor
Address Sessions Sessions Security Authentication Status
---------------- -------- ---------- -------- -------------- ----------

CDMA
192.168.6.147 0 0 Disabled Enabled Disabled
192.168.80.12 0 157 Disabled Enabled Disabled
192.168.20.195 0 2 Disabled Enabled Disabled
192.168.168.195 0 0 Disabled Enabled Disabled
192.168.33.195 1 30239 Disabled Enabled Disabled
show mipfa counters [peer-address]
MIP-specific protocol counters such as Initial/Renewal/De-Registration request received, ac-cepted, rejected, Replies Received/Replied, Denied by FA or HA, etc., for specific subscriber(s).
show mipfa full [callid | msid | username] <user identity>
Reports MIP-specific information stored for the subscriber, such as remaining lifetime. Some ofthis is already in "show sub full".
[local]PDSN> show mipfa full
Username: [email protected] Callid: 00085bb0
MSID: 123281234567899
Num Agent Advt Sent: 1 Num Agent Solicit Rcvd: 0
Home Address #1: 10.235.80.171 NAI: [email protected]
FA Address: 10.20.0.3 HA Address: 10.20.0.2
Lifetime: 02h00m00s Remaining Lifetime: 00h04m36s
Reverse Tunneling: On Encapsulation Type: IP-IP
GRE Key: n/a IPSec Required: No
IPSec Ctrl Tunnel Estab.: No IPSec Data Tunnel Estab.: No
MN-AAA Removal: No Proxy MIP: Disabled
DMU Auth Failures: 0 Send Terminal Verification: Disabled
Revocation Negotiated: YES Revocation I Bit Negotiated: YES
MN-HA-Key-Present: FALSE MN-HA-SPI: n/a
FA-HA-Key-Present: TRUE FA-HA-SPI: 8832
MN-FA-Key-Present: FALSE MN-FA-SPI: n/a
HA-RK-KEY-Present: FALSE HA-RK-SPI: n/a
HA-RK-Lifetime: n/a HA-RK-Remaining-Lifetime: n/a
Send Host Config: Disabled
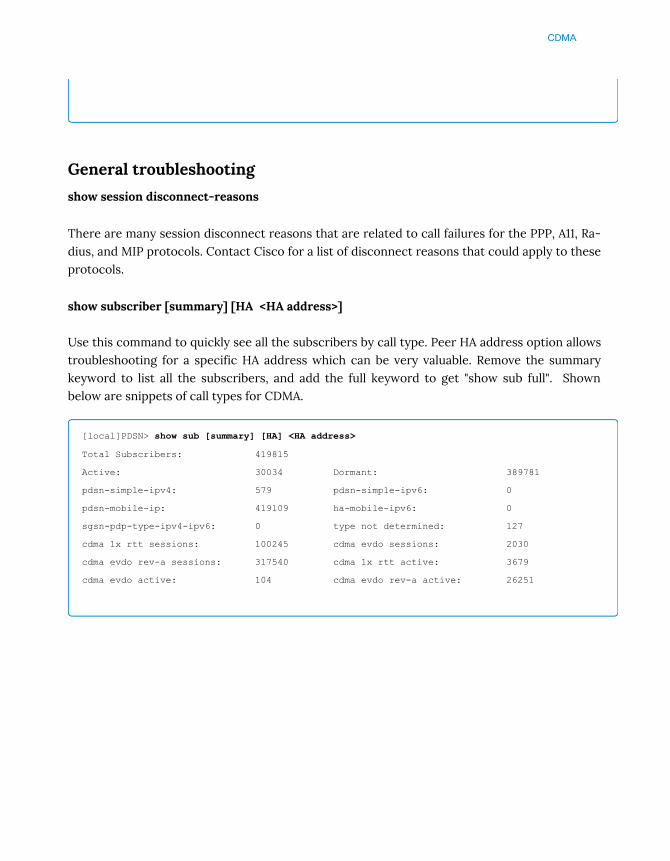
CDMA
General troubleshooting
show session disconnect-reasons
There are many session disconnect reasons that are related to call failures for the PPP, A11, Ra-dius, and MIP protocols. Contact Cisco for a list of disconnect reasons that could apply to theseprotocols.
show subscriber [summary] [HA <HA address>]
Use this command to quickly see all the subscribers by call type. Peer HA address option allowstroubleshooting for a specific HA address which can be very valuable. Remove the summarykeyword to list all the subscribers, and add the full keyword to get "show sub full". Shownbelow are snippets of call types for CDMA.
[local]PDSN> show sub [summary] [HA] <HA address>
Total Subscribers: 419815
Active: 30034 Dormant: 389781
pdsn-simple-ipv4: 579 pdsn-simple-ipv6: 0
pdsn-mobile-ip: 419109 ha-mobile-ipv6: 0
sgsn-pdp-type-ipv4-ipv6: 0 type not determined: 127
cdma 1x rtt sessions: 100245 cdma evdo sessions: 2030
cdma evdo rev-a sessions: 317540 cdma 1x rtt active: 3679
cdma evdo active: 104 cdma evdo rev-a active: 26251

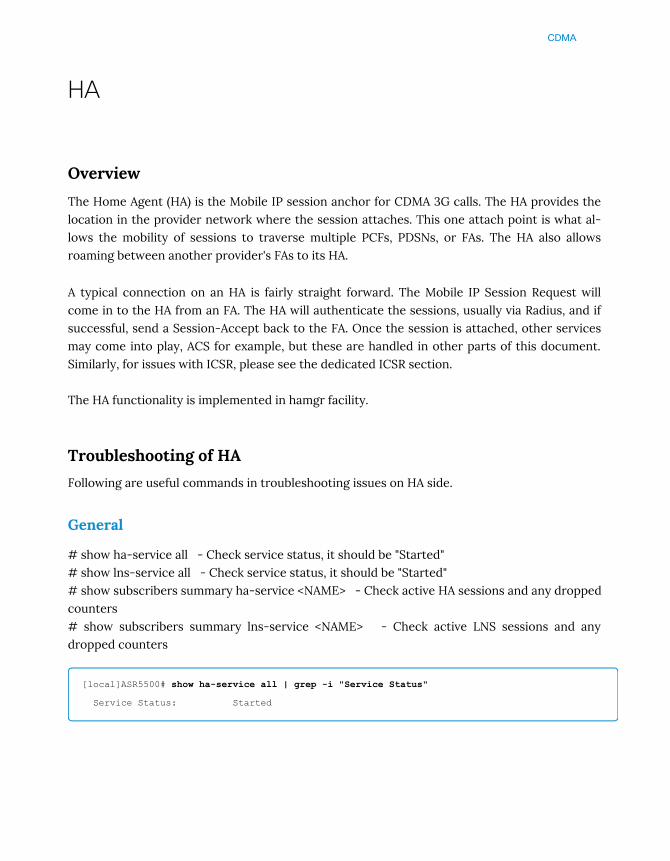
CDMA
HA
Overview
The Home Agent (HA) is the Mobile IP session anchor for CDMA 3G calls. The HA provides thelocation in the provider network where the session attaches. This one attach point is what al-lows the mobility of sessions to traverse multiple PCFs, PDSNs, or FAs. The HA also allowsroaming between another provider's FAs to its HA.
A typical connection on an HA is fairly straight forward. The Mobile IP Session Request willcome in to the HA from an FA. The HA will authenticate the sessions, usually via Radius, and ifsuccessful, send a Session-Accept back to the FA. Once the session is attached, other servicesmay come into play, ACS for example, but these are handled in other parts of this document.Similarly, for issues with ICSR, please see the dedicated ICSR section.
The HA functionality is implemented in hamgr facility.
Troubleshooting of HA
Following are useful commands in troubleshooting issues on HA side.
General
# show ha-service all - Check service status, it should be "Started"# show lns-service all - Check service status, it should be "Started"# show subscribers summary ha-service <NAME> - Check active HA sessions and any droppedcounters# show subscribers summary lns-service <NAME> - Check active LNS sessions and anydropped counters
[local]ASR5500# show ha-service all | grep -i "Service Status"
Service Status: Started

CDMA
Pi interface
# show mipha - Displays the call information for all mobile IP HA calls and statistics
AAA interface. Below are some major commands. Please note all commands are context spe-cific. Please refer to Radius chapter for details on troubleshooting:
# show radius counters all# show radius counters summary# show radius accounting servers # show radius authentication servers # show radius client status
Gx and Gy interfaces. Please refer to Diameter chapter for details on troubleshooting:
# show diameter peers full - Check Diameter peers config and status
IP Pool
# show ip pool - Displays ip address usage (Context Specific).
Below are variations for the IP Pools, which are also context-specific:
# show ip pool summary wide# show ip pool groups# show ip pool group-name <name># show ip pool pool-name <pool name>
Proxy DNS Intercept
# show dns-proxy statistics# show dns-proxy intercept-list <name> statistics# show dns-proxy intercept-list <name> rule <rule> statistics# show subscribers counters dns-proxy username <username>
NTP
# show ntp status - Verify NTP status
CDMA
CDRs - Please refer to CDR chapter for details on troubleshooting:
# show active-charging edr-udr-file statistics / show cdr statistics
Troubleshooting a subscriber connecting to HA:
• monitor subscriber - Collect and analyze a subscriber HA call with monitor subscriberfrom the beginning of a call till an issue with verbosity 3, option 19.
• show subscribers full username - Provides information on a subscriber sessioninformation.
• show active-charging sessions full username - Provides information on a subscriberACS session information.
Example Scenarios
HA Proxy-DNS Intercept not working
Problem Description:
HA Proxy DNS Intercept does not work
Analysis:
The HA Proxy DNS Intercept feature is designed to allow Mobile IP subscribers roamingthrough a Foreign Agent to be able to reach their home network’s DNS server instead of theroaming partner’s DNS server which may not be reachable from the subscriber's home net-work.
When configured properly, the intercept list created will include redirect lines for all of theroaming partners for which DNS packets should be redirected, and pass-through lines for all ofthe roaming partners for which DNS packets should be passed through without changes.
If redirect does not seem to be working, firstly DNS addresses from roaming partners should beconfirmed. Note that if a roaming partner is also using Cisco PDSN/FA, then the DNS addressescan be found in the default subscriber template (“dns (primary | secondary) <address>”) of thesource context, and NOT in any named subscriber template, because the username (NAI) is
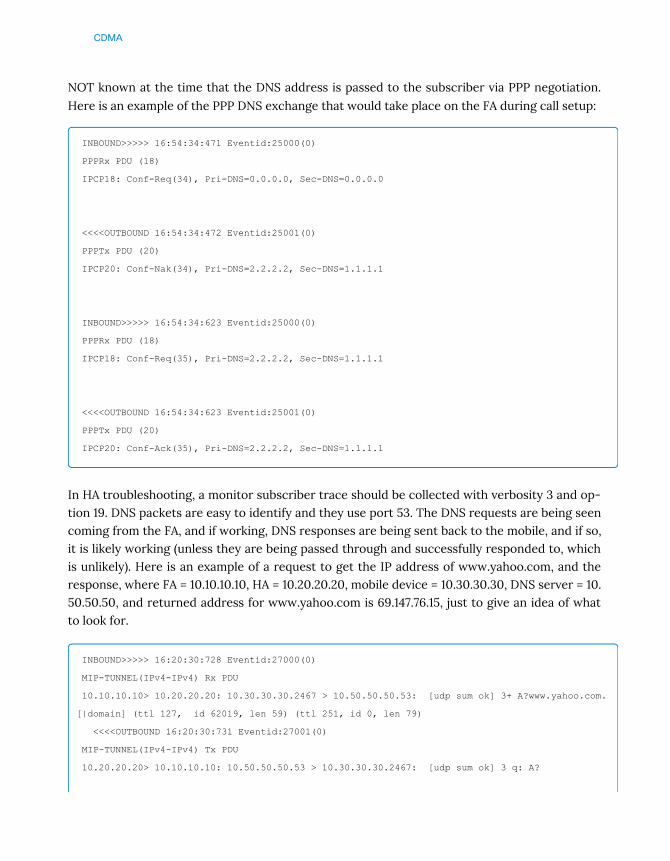
CDMA
NOT known at the time that the DNS address is passed to the subscriber via PPP negotiation.Here is an example of the PPP DNS exchange that would take place on the FA during call setup:
INBOUND>>>>> 16:54:34:471 Eventid:25000(0)
PPPRx PDU (18)
IPCP18: Conf-Req(34), Pri-DNS=0.0.0.0, Sec-DNS=0.0.0.0
<<<<OUTBOUND 16:54:34:472 Eventid:25001(0)
PPPTx PDU (20)
IPCP20: Conf-Nak(34), Pri-DNS=2.2.2.2, Sec-DNS=1.1.1.1
INBOUND>>>>> 16:54:34:623 Eventid:25000(0)
PPPRx PDU (18)
IPCP18: Conf-Req(35), Pri-DNS=2.2.2.2, Sec-DNS=1.1.1.1
<<<<OUTBOUND 16:54:34:623 Eventid:25001(0)
PPPTx PDU (20)
IPCP20: Conf-Ack(35), Pri-DNS=2.2.2.2, Sec-DNS=1.1.1.1
In HA troubleshooting, a monitor subscriber trace should be collected with verbosity 3 and op-tion 19. DNS packets are easy to identify and they use port 53. The DNS requests are being seencoming from the FA, and if working, DNS responses are being sent back to the mobile, and if so,it is likely working (unless they are being passed through and successfully responded to, whichis unlikely). Here is an example of a request to get the IP address of www.yahoo.com, and theresponse, where FA = 10.10.10.10, HA = 10.20.20.20, mobile device = 10.30.30.30, DNS server = 10.50.50.50, and returned address for www.yahoo.com is 69.147.76.15, just to give an idea of whatto look for.
INBOUND>>>>> 16:20:30:728 Eventid:27000(0)
MIP-TUNNEL(IPv4-IPv4) Rx PDU
10.10.10.10> 10.20.20.20: 10.30.30.30.2467 > 10.50.50.50.53: [udp sum ok] 3+ A?www.yahoo.com.
[|domain] (ttl 127, id 62019, len 59) (ttl 251, id 0, len 79)
<<<<OUTBOUND 16:20:30:731 Eventid:27001(0)
MIP-TUNNEL(IPv4-IPv4) Tx PDU
10.20.20.20> 10.10.10.10: 10.50.50.50.53 > 10.30.30.30.2467: [udp sum ok] 3 q: A?
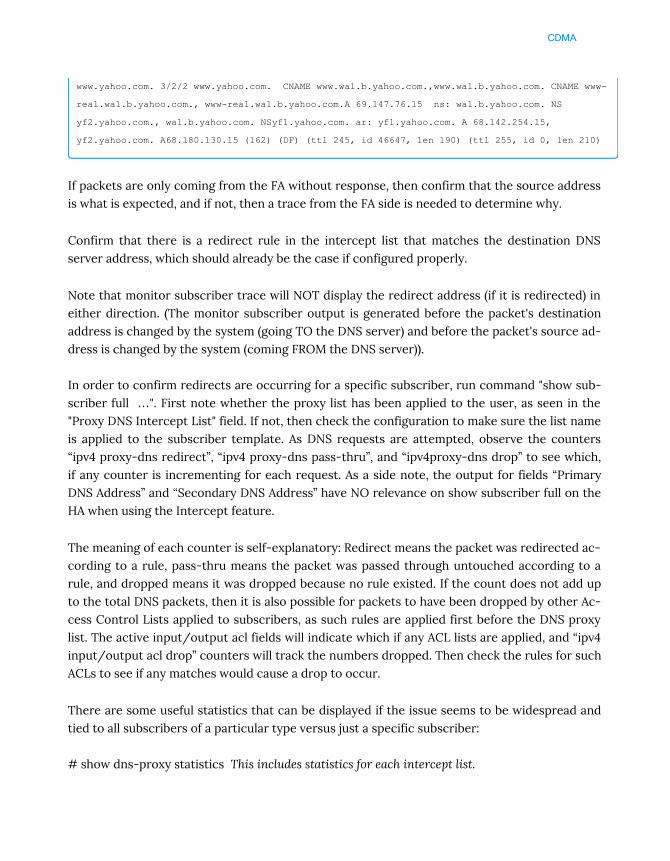
CDMA
www.yahoo.com. 3/2/2 www.yahoo.com. CNAME www.wa1.b.yahoo.com.,www.wa1.b.yahoo.com. CNAME www-
real.wa1.b.yahoo.com., www-real.wa1.b.yahoo.com.A 69.147.76.15 ns: wa1.b.yahoo.com. NS
yf2.yahoo.com., wa1.b.yahoo.com. NSyf1.yahoo.com. ar: yf1.yahoo.com. A 68.142.254.15,
yf2.yahoo.com. A68.180.130.15 (162) (DF) (ttl 245, id 46647, len 190) (ttl 255, id 0, len 210)
If packets are only coming from the FA without response, then confirm that the source addressis what is expected, and if not, then a trace from the FA side is needed to determine why.
Confirm that there is a redirect rule in the intercept list that matches the destination DNSserver address, which should already be the case if configured properly.
Note that monitor subscriber trace will NOT display the redirect address (if it is redirected) ineither direction. (The monitor subscriber output is generated before the packet's destinationaddress is changed by the system (going TO the DNS server) and before the packet's source ad-dress is changed by the system (coming FROM the DNS server)).
In order to confirm redirects are occurring for a specific subscriber, run command "show sub-scriber full …". First note whether the proxy list has been applied to the user, as seen in the"Proxy DNS Intercept List" field. If not, then check the configuration to make sure the list nameis applied to the subscriber template. As DNS requests are attempted, observe the counters“ipv4 proxy-dns redirect”, “ipv4 proxy-dns pass-thru”, and “ipv4proxy-dns drop” to see which,if any counter is incrementing for each request. As a side note, the output for fields “PrimaryDNS Address” and “Secondary DNS Address” have NO relevance on show subscriber full on theHA when using the Intercept feature.
The meaning of each counter is self-explanatory: Redirect means the packet was redirected ac-cording to a rule, pass-thru means the packet was passed through untouched according to arule, and dropped means it was dropped because no rule existed. If the count does not add upto the total DNS packets, then it is also possible for packets to have been dropped by other Ac-cess Control Lists applied to subscribers, as such rules are applied first before the DNS proxylist. The active input/output acl fields will indicate which if any ACL lists are applied, and “ipv4input/output acl drop” counters will track the numbers dropped. Then check the rules for suchACLs to see if any matches would cause a drop to occur.
There are some useful statistics that can be displayed if the issue seems to be widespread andtied to all subscribers of a particular type versus just a specific subscriber:
# show dns-proxy statistics This includes statistics for each intercept list.

CDMA
# show dns-proxy intercept-list <list name> statistics Shows counts for redirected, passed-through, dropped, for EACHRULE in the particular intercept list
# show dns-proxy intercept-list <list name> rule<rule> statistics For EACH RULE, this addscounters for the number of requests sent to the DNS redirect server(s), the number of responses re-ceived from the server(s), and number of timeouts.
Note when a redirect is applied, by default, the source address of the DNS packet is alsochanged, from the subscriber’s address to the address specified in the configuration in the re-spective destination context, with command:
ip dns-proxy source-address <interface source address for redirected DNS packets>
This will be different than non-redirected DNS packets which will maintain their subscribersource address, and, this could lead to unexpected routing/firewall issues where re-directedpackets never make it to the DNS server or don’t make it back due to this changed source ad-dress. It is possible to specify that the DNS packet source address NOT be changed using theappropriate subscriber template command “proxy-dns use-subscriber-address-as-source”, andthis could be used as a temporary (or permanent) solution.
Resolution:
Multiple scenarios are discussed above. The solution relies on a particular scenario.
PDNS with static IP addresses cannot register in the HA
Problem Description:
A group of subscribers on a PDNS with static IP addresses cannot register in the HA and the callfails from MIP to SIP.
Analysis:
The following traces were collected on the PDNS/FA and HA side.
• monitor subscriber username verbosity 3 and option 19 on HA side
• monitor subscriber msid verbosity 3 and option 19 on PDSN/FA side
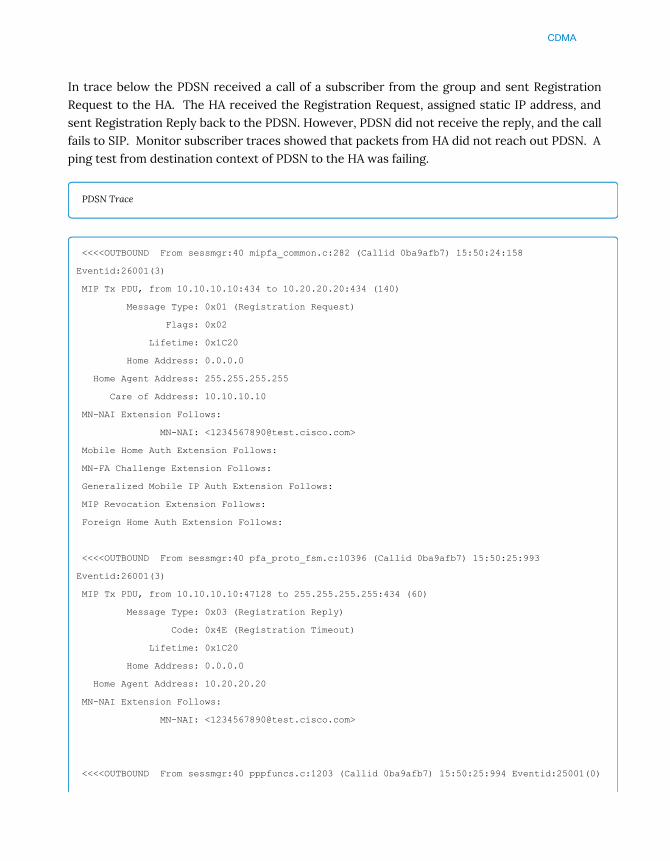
CDMA
In trace below the PDSN received a call of a subscriber from the group and sent RegistrationRequest to the HA. The HA received the Registration Request, assigned static IP address, andsent Registration Reply back to the PDSN. However, PDSN did not receive the reply, and the callfails to SIP. Monitor subscriber traces showed that packets from HA did not reach out PDSN. Aping test from destination context of PDSN to the HA was failing.
PDSN Trace
<<<<OUTBOUND From sessmgr:40 mipfa_common.c:282 (Callid 0ba9afb7) 15:50:24:158
Eventid:26001(3)
MIP Tx PDU, from 10.10.10.10:434 to 10.20.20.20:434 (140)
Message Type: 0x01 (Registration Request)
Flags: 0x02
Lifetime: 0x1C20
Home Address: 0.0.0.0
Home Agent Address: 255.255.255.255
Care of Address: 10.10.10.10
MN-NAI Extension Follows:
MN-NAI: <[email protected]>
Mobile Home Auth Extension Follows:
MN-FA Challenge Extension Follows:
Generalized Mobile IP Auth Extension Follows:
MIP Revocation Extension Follows:
Foreign Home Auth Extension Follows:
<<<<OUTBOUND From sessmgr:40 pfa_proto_fsm.c:10396 (Callid 0ba9afb7) 15:50:25:993
Eventid:26001(3)
MIP Tx PDU, from 10.10.10.10:47128 to 255.255.255.255:434 (60)
Message Type: 0x03 (Registration Reply)
Code: 0x4E (Registration Timeout)
Lifetime: 0x1C20
Home Address: 0.0.0.0
Home Agent Address: 10.20.20.20
MN-NAI Extension Follows:
MN-NAI: <[email protected]>
<<<<OUTBOUND From sessmgr:40 pppfuncs.c:1203 (Callid 0ba9afb7) 15:50:25:994 Eventid:25001(0)
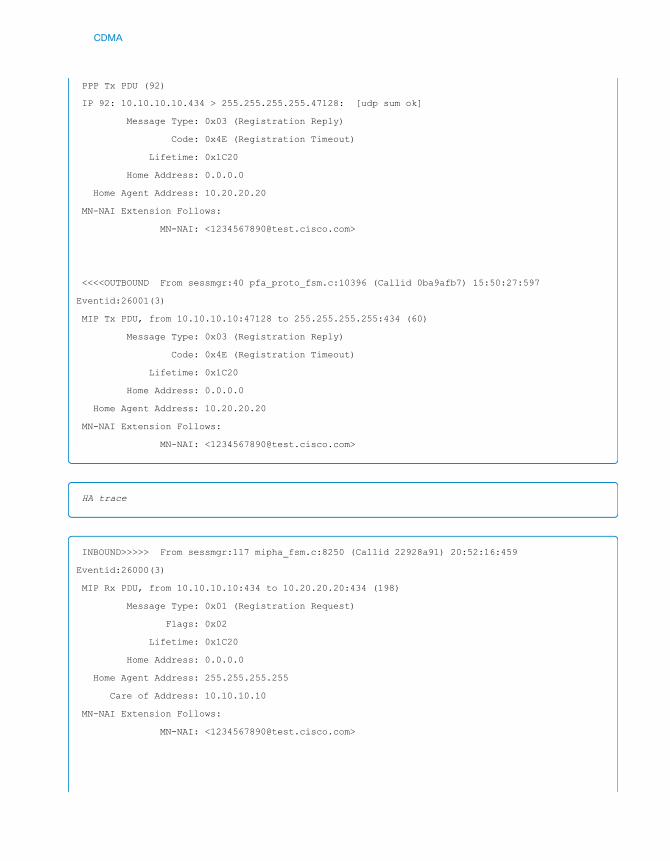
CDMA
PPP Tx PDU (92)
IP 92: 10.10.10.10.434 > 255.255.255.255.47128: [udp sum ok]
Message Type: 0x03 (Registration Reply)
Code: 0x4E (Registration Timeout)
Lifetime: 0x1C20
Home Address: 0.0.0.0
Home Agent Address: 10.20.20.20
MN-NAI Extension Follows:
MN-NAI: <[email protected]>
<<<<OUTBOUND From sessmgr:40 pfa_proto_fsm.c:10396 (Callid 0ba9afb7) 15:50:27:597
Eventid:26001(3)
MIP Tx PDU, from 10.10.10.10:47128 to 255.255.255.255:434 (60)
Message Type: 0x03 (Registration Reply)
Code: 0x4E (Registration Timeout)
Lifetime: 0x1C20
Home Address: 0.0.0.0
Home Agent Address: 10.20.20.20
MN-NAI Extension Follows:
MN-NAI: <[email protected]>
HA trace
INBOUND>>>>> From sessmgr:117 mipha_fsm.c:8250 (Callid 22928a91) 20:52:16:459
Eventid:26000(3)
MIP Rx PDU, from 10.10.10.10:434 to 10.20.20.20:434 (198)
Message Type: 0x01 (Registration Request)
Flags: 0x02
Lifetime: 0x1C20
Home Address: 0.0.0.0
Home Agent Address: 255.255.255.255
Care of Address: 10.10.10.10
MN-NAI Extension Follows:
MN-NAI: <[email protected]>

CDMA
<<<<OUTBOUND From sessmgr:117 mipha_fsm.c:6509 (Callid 22928a91) 20:52:16:459
Eventid:26001(3)
MIP Tx PDU, from 10.20.20.20:434 to 10.10.10.10:434 (112)
Message Type: 0x03 (Registration Reply)
Code: 0x00 (Accepted)
Lifetime: 0x1C20
Home Address: 10.10.150.155
Home Agent Address: 10.20.20.20
MN-NAI Extension Follows:
MN-NAI: <[email protected]>
Resolution:
The issue was in the routing between PDSN and HA and it was fixed outside of the HA andPDSN themselves.


UMTS

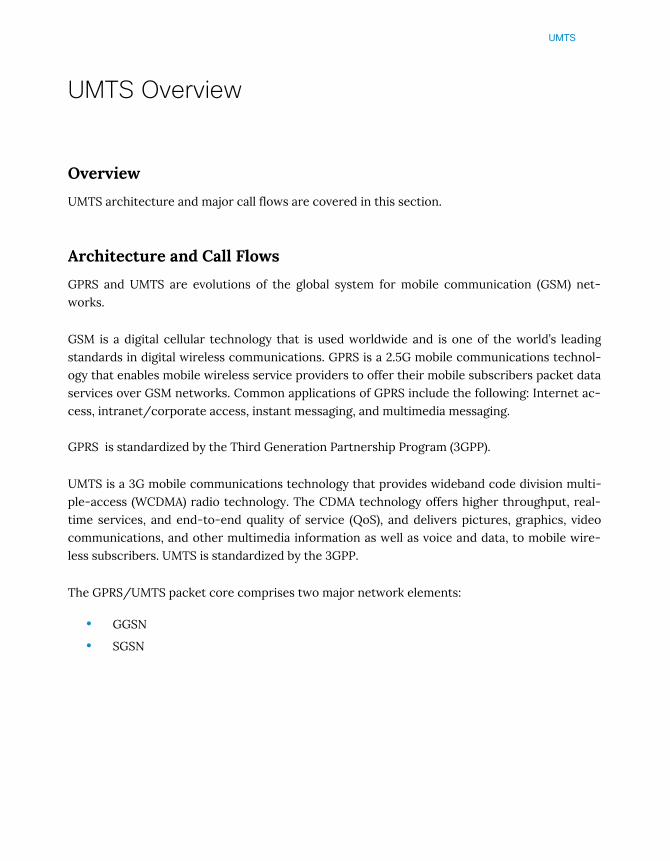
UMTS
UMTS Overview
Overview
UMTS architecture and major call flows are covered in this section.
Architecture and Call Flows
GPRS and UMTS are evolutions of the global system for mobile communication (GSM) net-works.
GSM is a digital cellular technology that is used worldwide and is one of the world’s leadingstandards in digital wireless communications. GPRS is a 2.5G mobile communications technol-ogy that enables mobile wireless service providers to offer their mobile subscribers packet dataservices over GSM networks. Common applications of GPRS include the following: Internet ac-cess, intranet/corporate access, instant messaging, and multimedia messaging.
GPRS is standardized by the Third Generation Partnership Program (3GPP).
UMTS is a 3G mobile communications technology that provides wideband code division multi-ple-access (WCDMA) radio technology. The CDMA technology offers higher throughput, real-time services, and end-to-end quality of service (QoS), and delivers pictures, graphics, videocommunications, and other multimedia information as well as voice and data, to mobile wire-less subscribers. UMTS is standardized by the 3GPP.
The GPRS/UMTS packet core comprises two major network elements:
• GGSN
• SGSN
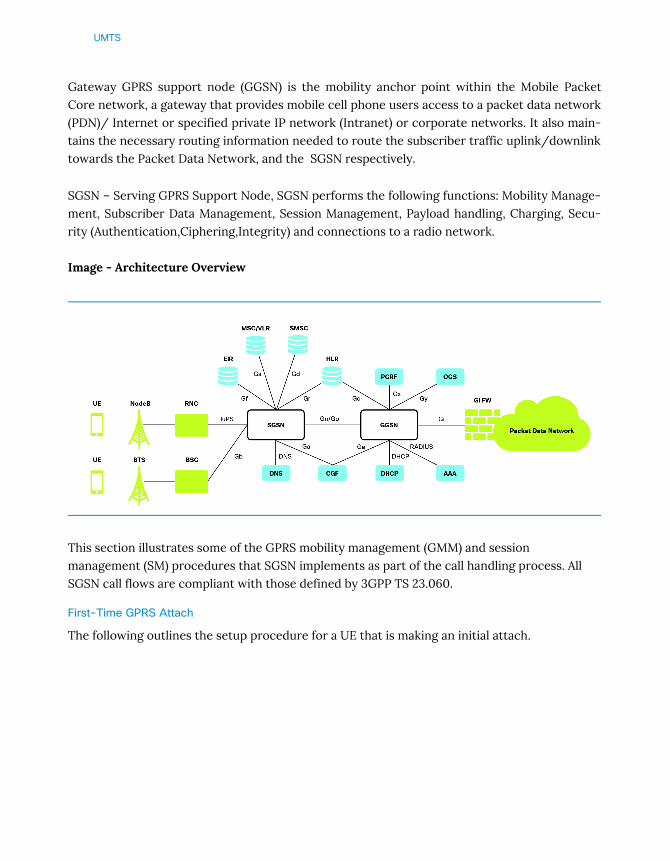
UMTS
Gateway GPRS support node (GGSN) is the mobility anchor point within the Mobile PacketCore network, a gateway that provides mobile cell phone users access to a packet data network(PDN)/ Internet or specified private IP network (Intranet) or corporate networks. It also main-tains the necessary routing information needed to route the subscriber traffic uplink/downlinktowards the Packet Data Network, and the SGSN respectively.
SGSN – Serving GPRS Support Node, SGSN performs the following functions: Mobility Manage-ment, Subscriber Data Management, Session Management, Payload handling, Charging, Secu-rity (Authentication,Ciphering,Integrity) and connections to a radio network.
Image - Architecture Overview
This section illustrates some of the GPRS mobility management (GMM) and sessionmanagement (SM) procedures that SGSN implements as part of the call handling process. AllSGSN call flows are compliant with those defined by 3GPP TS 23.060.
First-Time GPRS Attach
The following outlines the setup procedure for a UE that is making an initial attach.
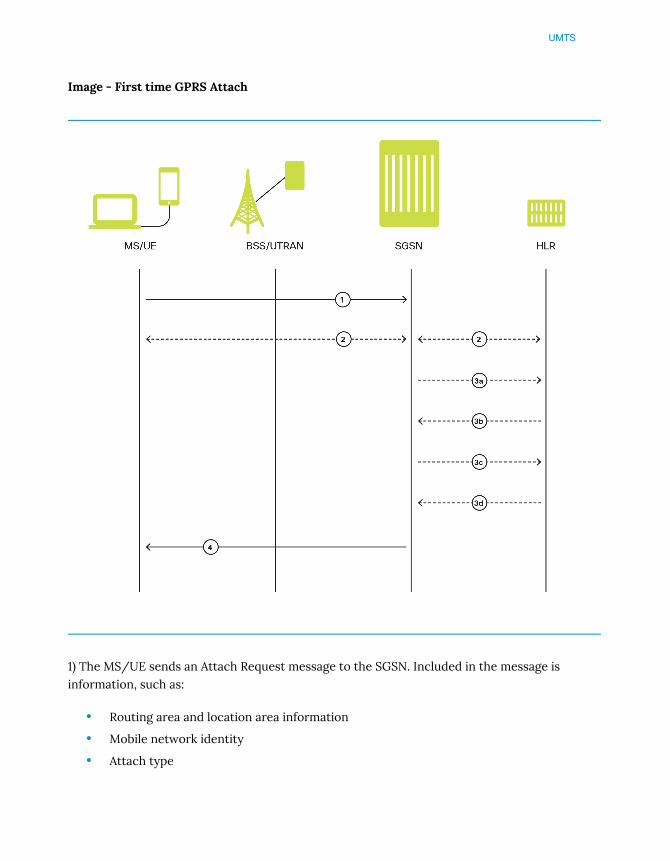
UMTS
Image - First time GPRS Attach
1) The MS/UE sends an Attach Request message to the SGSN. Included in the message isinformation, such as:
• Routing area and location area information
• Mobile network identity
• Attach type

UMTS
2) Authentication is mandatory if no MM context exists for the MS/UE:
• The SGSN gets a random value (RAND) from the HLR to use as a challenge to theMS/UE.
• The SGSN sends a Authentication Request message to the UE containing the randomRAND.
• The MS/UE contains a SIM that contains a secret key (Ki) shared between it and theHLR called an Individual Subscriber Key.
• The UE uses an algorithm to process the RAND and Ki to get the session key (Kc) andthe signed response (SRES).
• The MS/UE sends a Authentication Response to the SGSN containing the SRES.
3) The SGSN updates location information for the MS/UE:
• The SGSN sends an Update Location message, to the HLR, containing the SGSNnumber, SGSN address, and IMSI.
• The HLR sends an Insert Subscriber Data message to the “new” SGSN. It containssubscriber information such as IMSI and GPRS subscription data.
• The “New” SGSN validates the MS/UE in new routing area:
If invalid: The SGSN rejects the Attach Request with the appropriate cause code.
If valid: The SGSN creates a new MM context for the MS/UE and sends a Insert Sub-scriber Data Ack back to the HLR.
• The HLR sends a Update Location Ack to the SGSN after it successfully clears the oldMM context and creates new one
4) The SGSN sends an Attach Accept message to the MS/UE containing the P-TMSI (included ifit is new), VLR TMSI, P-TMSI Signature, and Radio Priority SMS.
At this point the GPRS Attach is complete and the SGSN begins generating M-CDRs.
If the MS/UE initiates a second call, the procedure is more complex and involves informationexchanges and validations between “old” and “new” SGSNs and “old” and “new” MSC/VLRs. Thedetails of this combined GPRS/IMSI attach procedure can be found in 3GPP TS23.060.
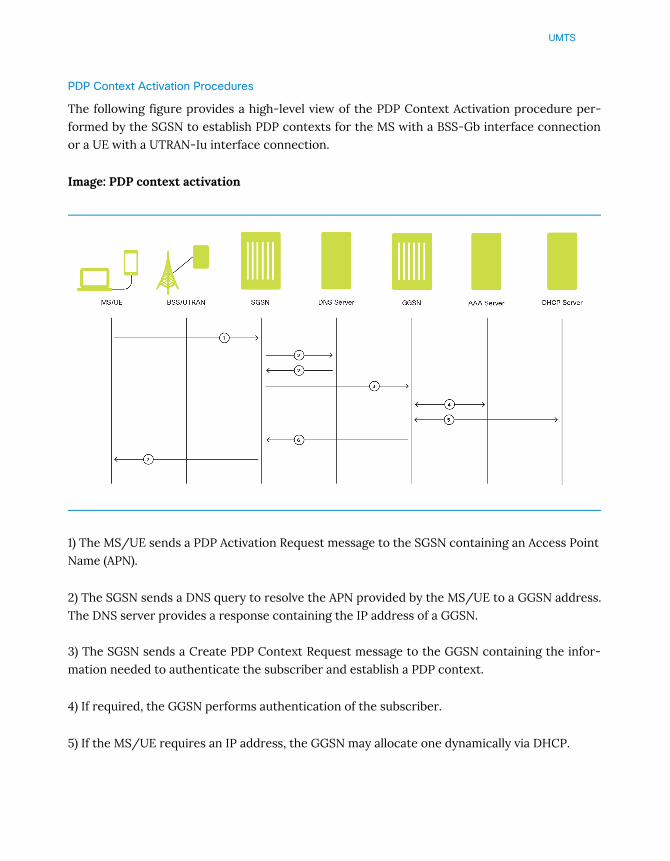
UMTS
PDP Context Activation Procedures
The following figure provides a high-level view of the PDP Context Activation procedure per-formed by the SGSN to establish PDP contexts for the MS with a BSS-Gb interface connectionor a UE with a UTRAN-Iu interface connection.
Image: PDP context activation
1) The MS/UE sends a PDP Activation Request message to the SGSN containing an Access PointName (APN).
2) The SGSN sends a DNS query to resolve the APN provided by the MS/UE to a GGSN address.The DNS server provides a response containing the IP address of a GGSN.
3) The SGSN sends a Create PDP Context Request message to the GGSN containing the infor-mation needed to authenticate the subscriber and establish a PDP context.
4) If required, the GGSN performs authentication of the subscriber.
5) If the MS/UE requires an IP address, the GGSN may allocate one dynamically via DHCP.
UMTS
6) The GGSN sends a Create PDP Context Response message back to the SGSN containing theIP Address assigned to the MS/UE.
7) The SGSN sends a Activate PDP Context Accept message to the MS/UE along with the IP Ad-dress. Upon PDP Context Activation, the SGSN begins generating S-CDRs. The S-CDRs are up-dated periodically based on Charging Characteristics and trigger conditions.
A GTP-U tunnel is now established and the MS/UE can send and receive data.
SGSN Overview
The ASR 5000 provides a highly flexible and efficient Serving GPRS Support Node (SGSN) ser-vice to the wireless carriers. Functioning as an SGSN, the system readily handles wireless dataservices within 2.5G General Packet Radio Service (GPRS) and 3G Universal Mobile Telecommu-nications System (UMTS) data networks.
In a GPRS/UMTS network, the SGSN works in conjunction with radio access networks (RANs)and Gateway GPRS Support Nodes (GGSNs) to:
• Communicate with home location registers (HLR) via a Gr interface and mobile visitorlocation registers (VLRs) via a Gs interface to register a subscriber’s user equipment(UE), or to authenticate, retrieve or update subscriber profile information.
• Support Gd interface to provide short message service (SMS) and other textbasednetwork services for attached subscribers.
• Activate and manage IPv4, IPv6 type packet data protocol (PDP) contexts for asubscriber session.
• Setup and manage the data plane between the RAN and the GGSN providing high-speeddata transfer.
• Provide mobility management, location management, and session management for theduration of a call to ensure smooth handover.
• Provide various types of charging data records (CDRs) to attached accounting/billingstorage mechanisms such as our SMC-based hard drive or a GTPP Storage Server (GSS)or a charging gateway function (CGF).
• Provide CALEA support for lawful intercepts.

UMTS
Services in 3G/2G SGSN
All the parameters specific to the operation of an SGSN in a UMTS network are configured in anSGSN service configuration. SGSN services use other service configurations such as those listedbelow, to communicate with other elements in the network.
• The IuPS-Service that facilitates the communication with/from the RNCs. IuPSis using the SS7 support configuration (SCCP Networks, SS7 Routing Domains)to communicate with the RNCs.
• The SGTP-Service that facilitates the communication with/from other SGSNs and theGGSN’s over the Gn/Gp core packet network.
• The Gs-Service facilitates the communication with/from VLRs
• The MAP-Service that facilitates the communication to/from the call controlSS7elements (the HLR, EIR, SMS). MAP-Service is using the SCCP Network support layerconfigured on the chassis to route the messages to the appropriate destinations.
All of the parameters needed for the system to perform as an SGSN in a GPRS network are con-figured in the GPRS service. The GPRS service uses other configurations such as SGTP and MAPto communicate with other network entities and setup communications between the BSS andthe GGSN.
SGSN Related Software Tasks
IMSIMgr Task will be created as soon as SGSN/GPRS service is started.
The IMSIMg task Started by the Session Controller, performs the following functions:
• Selects SessMgr, when not done by LinkMgr or SGTPCMgr, for calls sessions based onIMSI/P-TMSI.
• Load-balances across SessMgrs to select one for assigning subscriber sessions to.
• Maintains records for all subscribers on the system.
• Maintains mapping between the IMSI/P-TMSI and SessMgrs.
Important: For ASR 5x00s with session recovery enabled, this Demux manager is usually estab-lished on one of the CPUs on the first active Demux PSC. The IMSIMgr will not start on a PSC inwhich SessMgrs are already started.
SGTPCMgr Task will be spawned as soon the SGTP Service is created.
UMTS
Created by the Session Controller for each VPN context in which an SGSN service is config-ured, the SGTPC Manager task performs the following functions:
• Terminates Gn/Gp and GTP-U interfaces from peer GGSNs and SGSNs for SGSNServices.
• Terminates GTP-U interfaces from RNCs for IuPS Services.
• Controls standard ports for GTP-C and GTP-U.
• Processes and distributes GTP-traffic received from peers on these ports.
• Performs all node level procedures associated with Gn/Gp interface.
LinkMgr Task will be spawned as soon as SS7 routing domain is created.
Created by the Session Controller when the first SS7RD (routing domain) is activated, theLinkMgr performs the following functions:
• Multi-instanced for redundancy and scaling purposes.
• Provides SS7 and Gb connectivity to the platform.
• Routes per subscriber signalling across the SS7 (including Iu) and Gb interfaces to theSessMgr
GGSN Overview
Gateway GPRS Support Node (GGSN) is a gateway from a cellular network to an IP network thatallows mobile user equipment (UE) to access the public data network (PDN) or specified privateIP networks.
There is a dedicated link between the UE and the GGSN. This link is created through the PacketData Protocol (PDP) Context activation process. PDP Context is used to allocate the PDP ad-dress. There are three different types of PDP Contexts: IPv4, IPv6 and Point-to-Point Protocol(PPP).
The GGSN works in conjunction with Serving GPRS Support Nodes (SGSNs) within the networkto perform the following functions:
• Establish and maintain subscriber Internet Protocol (IP) or Point-to-Point Protocol(PPP) type Packet Data Protocol (PDP) contexts originated by either the mobile or thenetwork, and route traffic to PDN networks (Packet Data Network).

UMTS
• Allow mobile network operator to control authentication and authorization for eachsubscriber, and providing accounting management for the user sessions (online andoffline)
• Performing shallow and deep packet inspection for user traffic and perform action baseon traffic type (charging categories, firewalling, filtering, traffic shaping, blacklisting,etc.)
• PDNs are associated with Access Point Names (APNs) configured on the system. EachAPN consists of a set of parameters that dictate how subscriber authentication and IPaddress assignment is to be handled for that APN.
The Cisco ASR 5000/ASR 5500 chassis provides wireless carriers with a flexible solutionthat functions as a Gateway GPRS Support Node (GGSN) in General Packet Radio Service(GPRS) or Universal Mobile Telecommunications System (UMTS) wireless data networks.
GGSN related software tasks
When ggsn-service is configured, the system will create "gtpcmgr" task. This task is cre-ated by Session Controller for each context in which a GGSN service is configured, theGTPC Manager task performs the following functions:
• Receives the GTP sessions from the SGSN and distributes them to different SessionManager tasks for load balancing.
• Maintains a list of current Session Manager tasks to aid in system recovery.
• Verifies validity of GTPC messages.
• Maintains a list of current GTPC sessions.
• Handles GTPC Echo messaging to/from SGSN.
When gtpu-service is configured, the system will create "gtpumgr" task. This task is cre-ated by the Session Controller for each context in which a GTPU service is configured,the GTPU Manager performs the following functions:
• Maintains a list of the GTPU-services available within the context and performs load-balancing (of only Error-Ind) for them.
• Supports GTPU Echo handling.
• Provides Path Failure detection on no response for GTPU echo.
• Receives Error-Ind and demuxes it to a particular Session Manager.


UMTS
Troubleshooting SGSN
Overview
This section focuses on CLI commands in ASR 5000/ASR 5500 used to troubleshoot differentinterfaces on SGSN along with multiple example issue scenarios.
Troubleshooting Commands
SGSN functionality in ASR 5000/ASR 5500 is configured per the GPRS-service entity for 2G-SGSN and by SGSN-Service in case of 3G-SGSN.
CLI:
• show gprs-service all
• show sgsn-service all
Check the status of the service (should be "STARTED")
******** show gprs-service all *******
Service name : GPRS-SVC
Context : gbctx
Status : STARTED
Accounting Context Name : gbctx
SGSN Number : XXXXXXXXXX
Self PLMN Id : MCC: XXX, MNC: XX
******** show sgsn-service all *******
Service name : SGSN-SVC
Context : gnctx
Status : STARTED
Accounting Context Name : gnctx
SGSN Number : XXXXXXXXXX
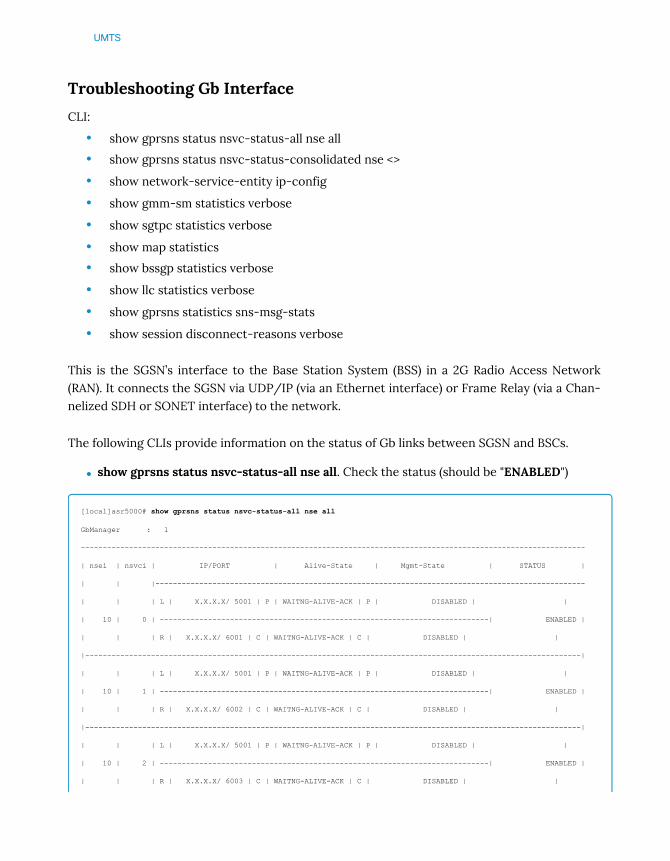
UMTS
Troubleshooting Gb Interface
CLI:
• show gprsns status nsvc-status-all nse all
• show gprsns status nsvc-status-consolidated nse <>
• show network-service-entity ip-config
• show gmm-sm statistics verbose
• show sgtpc statistics verbose
• show map statistics
• show bssgp statistics verbose
• show llc statistics verbose
• show gprsns statistics sns-msg-stats
• show session disconnect-reasons verbose
This is the SGSN’s interface to the Base Station System (BSS) in a 2G Radio Access Network(RAN). It connects the SGSN via UDP/IP (via an Ethernet interface) or Frame Relay (via a Chan-nelized SDH or SONET interface) to the network.
The following CLIs provide information on the status of Gb links between SGSN and BSCs.
• show gprsns status nsvc-status-all nse all. Check the status (should be "ENABLED")
[local]asr5000# show gprsns status nsvc-status-all nse all
GbManager : 1
-------------------------------------------------------------------------------------------------------------------
| nsei | nsvci | IP/PORT | Alive-State | Mgmt-State | STATUS |
| | |--------------------------------------------------------------------------------------------------
| | | L | X.X.X.X/ 5001 | P | WAITNG-ALIVE-ACK | P | DISABLED | |
| 10 | 0 | ---------------------------------------------------------------------------| ENABLED |
| | | R | X.X.X.X/ 6001 | C | WAITNG-ALIVE-ACK | C | DISABLED | |
|-----------------------------------------------------------------------------------------------------------------|
| | | L | X.X.X.X/ 5001 | P | WAITNG-ALIVE-ACK | P | DISABLED | |
| 10 | 1 | ---------------------------------------------------------------------------| ENABLED |
| | | R | X.X.X.X/ 6002 | C | WAITNG-ALIVE-ACK | C | DISABLED | |
|-----------------------------------------------------------------------------------------------------------------|
| | | L | X.X.X.X/ 5001 | P | WAITNG-ALIVE-ACK | P | DISABLED | |
| 10 | 2 | ---------------------------------------------------------------------------| ENABLED |
| | | R | X.X.X.X/ 6003 | C | WAITNG-ALIVE-ACK | C | DISABLED | |
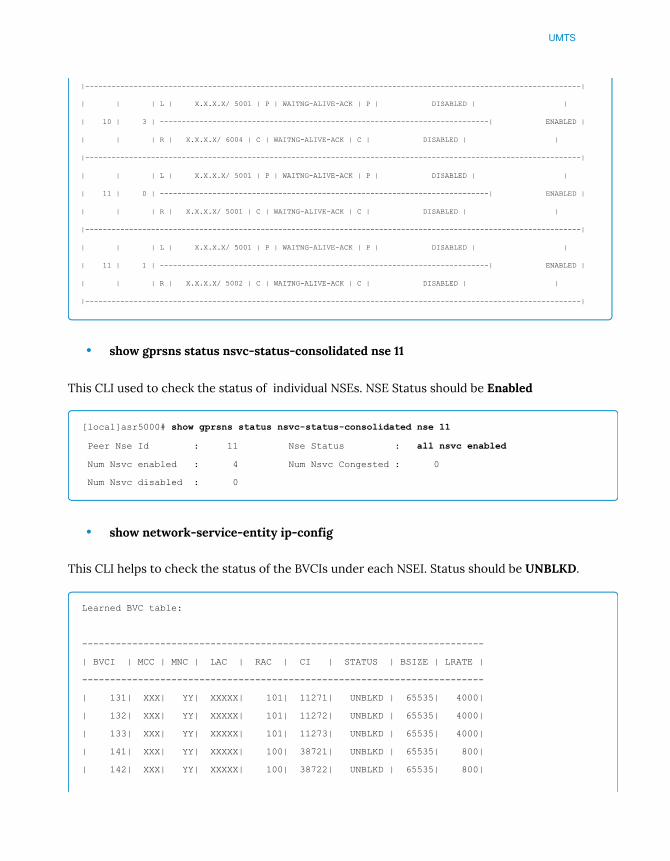
UMTS
|-----------------------------------------------------------------------------------------------------------------|
| | | L | X.X.X.X/ 5001 | P | WAITNG-ALIVE-ACK | P | DISABLED | |
| 10 | 3 | ---------------------------------------------------------------------------| ENABLED |
| | | R | X.X.X.X/ 6004 | C | WAITNG-ALIVE-ACK | C | DISABLED | |
|-----------------------------------------------------------------------------------------------------------------|
| | | L | X.X.X.X/ 5001 | P | WAITNG-ALIVE-ACK | P | DISABLED | |
| 11 | 0 | ---------------------------------------------------------------------------| ENABLED |
| | | R | X.X.X.X/ 5001 | C | WAITNG-ALIVE-ACK | C | DISABLED | |
|-----------------------------------------------------------------------------------------------------------------|
| | | L | X.X.X.X/ 5001 | P | WAITNG-ALIVE-ACK | P | DISABLED | |
| 11 | 1 | ---------------------------------------------------------------------------| ENABLED |
| | | R | X.X.X.X/ 5002 | C | WAITNG-ALIVE-ACK | C | DISABLED | |
|-----------------------------------------------------------------------------------------------------------------|
• show gprsns status nsvc-status-consolidated nse 11
This CLI used to check the status of individual NSEs. NSE Status should be Enabled
[local]asr5000# show gprsns status nsvc-status-consolidated nse 11
Peer Nse Id : 11 Nse Status : all nsvc enabled
Num Nsvc enabled : 4 Num Nsvc Congested : 0
Num Nsvc disabled : 0
• show network-service-entity ip-config
This CLI helps to check the status of the BVCIs under each NSEI. Status should be UNBLKD.
Learned BVC table:
------------------------------------------------------------------------
| BVCI | MCC | MNC | LAC | RAC | CI | STATUS | BSIZE | LRATE |
------------------------------------------------------------------------
| 131| XXX| YY| XXXXX| 101| 11271| UNBLKD | 65535| 4000|
| 132| XXX| YY| XXXXX| 101| 11272| UNBLKD | 65535| 4000|
| 133| XXX| YY| XXXXX| 101| 11273| UNBLKD | 65535| 4000|
| 141| XXX| YY| XXXXX| 100| 38721| UNBLKD | 65535| 800|
| 142| XXX| YY| XXXXX| 100| 38722| UNBLKD | 65535| 800|
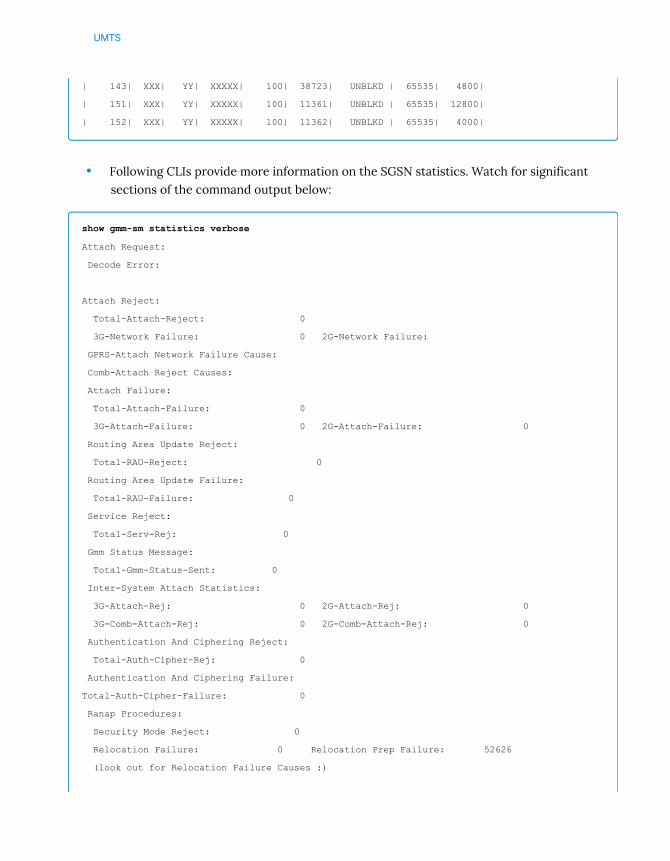
UMTS
| 143| XXX| YY| XXXXX| 100| 38723| UNBLKD | 65535| 4800|
| 151| XXX| YY| XXXXX| 100| 11361| UNBLKD | 65535| 12800|
| 152| XXX| YY| XXXXX| 100| 11362| UNBLKD | 65535| 4000|
• Following CLIs provide more information on the SGSN statistics. Watch for significantsections of the command output below:
show gmm-sm statistics verbose
Attach Request:
Decode Error:
Attach Reject:
Total-Attach-Reject: 0
3G-Network Failure: 0 2G-Network Failure:
GPRS-Attach Network Failure Cause:
Comb-Attach Reject Causes:
Attach Failure:
Total-Attach-Failure: 0
3G-Attach-Failure: 0 2G-Attach-Failure: 0
Routing Area Update Reject:
Total-RAU-Reject: 0
Routing Area Update Failure:
Total-RAU-Failure: 0
Service Reject:
Total-Serv-Rej: 0
Gmm Status Message:
Total-Gmm-Status-Sent: 0
Inter-System Attach Statistics:
3G-Attach-Rej: 0 2G-Attach-Rej: 0
3G-Comb-Attach-Rej: 0 2G-Comb-Attach-Rej: 0
Authentication And Ciphering Reject:
Total-Auth-Cipher-Rej: 0
Authentication And Ciphering Failure:
Total-Auth-Cipher-Failure: 0
Ranap Procedures:
Security Mode Reject: 0
Relocation Failure: 0 Relocation Prep Failure: 52626
(look out for Relocation Failure Causes :)
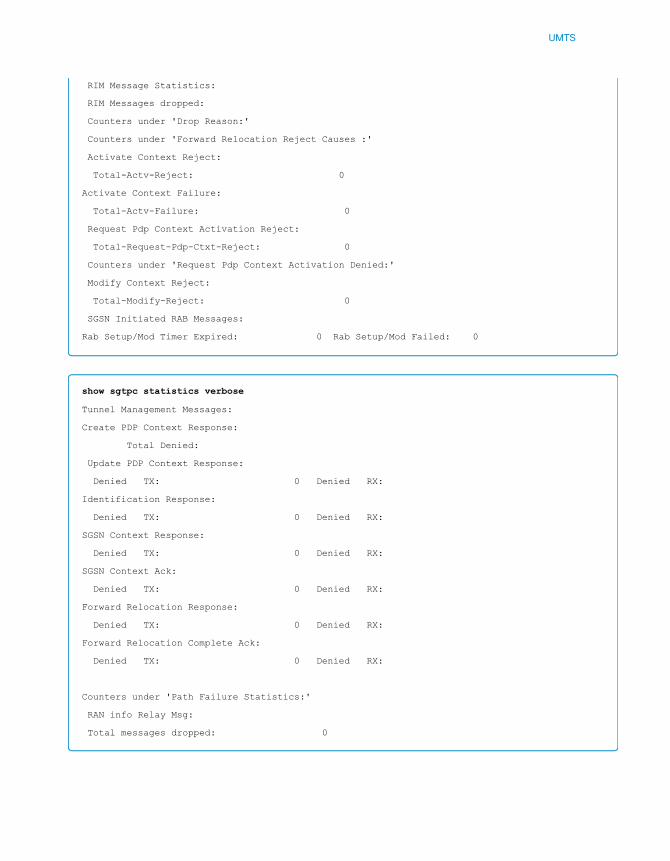
UMTS
RIM Message Statistics:
RIM Messages dropped:
Counters under 'Drop Reason:'
Counters under 'Forward Relocation Reject Causes :'
Activate Context Reject:
Total-Actv-Reject: 0
Activate Context Failure:
Total-Actv-Failure: 0
Request Pdp Context Activation Reject:
Total-Request-Pdp-Ctxt-Reject: 0
Counters under 'Request Pdp Context Activation Denied:'
Modify Context Reject:
Total-Modify-Reject: 0
SGSN Initiated RAB Messages:
Rab Setup/Mod Timer Expired: 0 Rab Setup/Mod Failed: 0
show sgtpc statistics verbose
Tunnel Management Messages:
Create PDP Context Response:
Total Denied:
Update PDP Context Response:
Denied TX: 0 Denied RX:
Identification Response:
Denied TX: 0 Denied RX:
SGSN Context Response:
Denied TX: 0 Denied RX:
SGSN Context Ack:
Denied TX: 0 Denied RX:
Forward Relocation Response:
Denied TX: 0 Denied RX:
Forward Relocation Complete Ack:
Denied TX: 0 Denied RX:
Counters under 'Path Failure Statistics:'
RAN info Relay Msg:
Total messages dropped: 0

UMTS
show map statistics
MAP Statistics:
Authentication Req
Failed:
Check IMEI Req
Failed:
GPRS Loc Upd Req TX:
Failed :
show bssgp statistics verbose
Total BSSGP user requests dropped : 0
BvcStatus messages transmitted : 0
DL packets Dropped : 0
In response to MS originated Messages
BVC Status received : 0
BVC Status transmitted : 0
RIM Messages
RIM messages dropped
show llc statistics verbose
XID Rx : 0
Total Discarded : 0
show gprsns statistics sns-msg-stats
failures in SNS-Size received :
Failures in SNS-Config received
Troubleshooting Gr Interface
MAP is the application-layer protocol used to access the Home Location Register (HLR), VisitorLocation Register (VLR), Mobile Switching Center (MSC), Equipment Identity Register (EIR), Au-thentication Center (AUC), Short Message Service Center (SMSC) and Serving GPRS SupportNode (SGSN).
Gr functionality in ASR 5000/ASR 5500 is configured in the MAP-service entity.
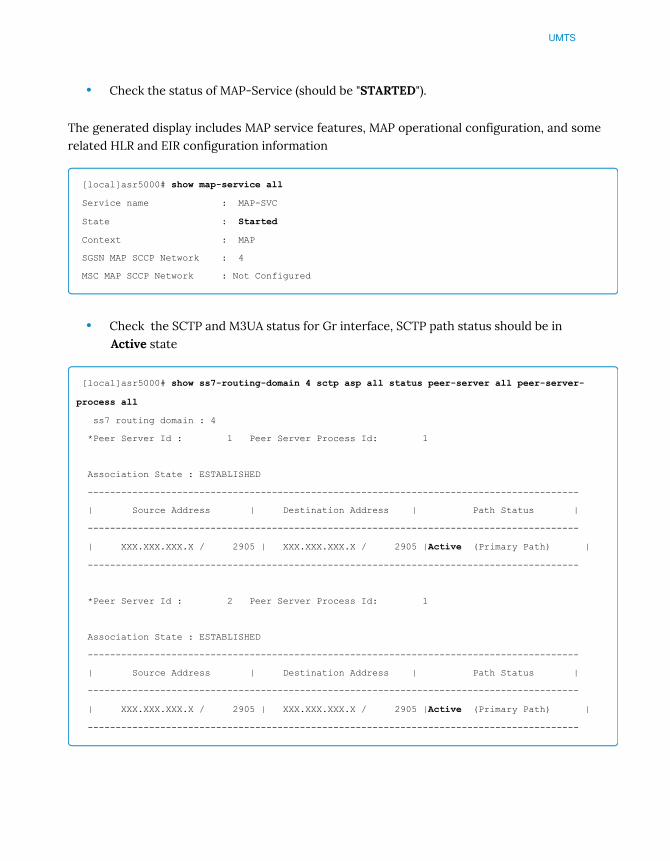
UMTS
• Check the status of MAP-Service (should be "STARTED").
The generated display includes MAP service features, MAP operational configuration, and somerelated HLR and EIR configuration information
[local]asr5000# show map-service all
Service name : MAP-SVC
State : Started
Context : MAP
SGSN MAP SCCP Network : 4
MSC MAP SCCP Network : Not Configured
• Check the SCTP and M3UA status for Gr interface, SCTP path status should be inActive state
[local]asr5000# show ss7-routing-domain 4 sctp asp all status peer-server all peer-server-
process all
ss7 routing domain : 4
*Peer Server Id : 1 Peer Server Process Id: 1
Association State : ESTABLISHED
----------------------------------------------------------------------------------------
| Source Address | Destination Address | Path Status |
----------------------------------------------------------------------------------------
| XXX.XXX.XXX.X / 2905 | XXX.XXX.XXX.X / 2905 |Active (Primary Path) |
----------------------------------------------------------------------------------------
*Peer Server Id : 2 Peer Server Process Id: 1
Association State : ESTABLISHED
----------------------------------------------------------------------------------------
| Source Address | Destination Address | Path Status |
----------------------------------------------------------------------------------------
| XXX.XXX.XXX.X / 2905 | XXX.XXX.XXX.X / 2905 |Active (Primary Path) |
----------------------------------------------------------------------------------------
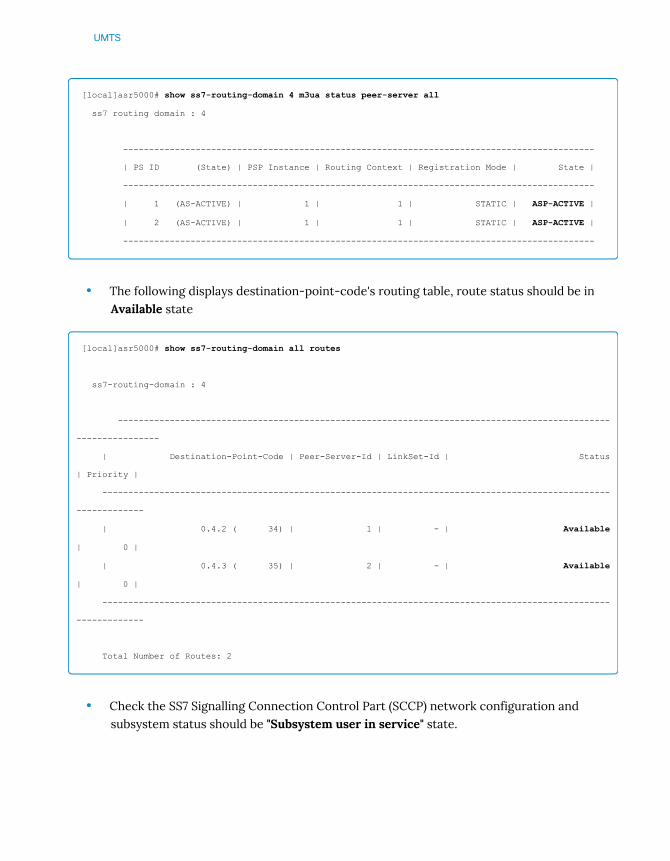
UMTS
[local]asr5000# show ss7-routing-domain 4 m3ua status peer-server all
ss7 routing domain : 4
-------------------------------------------------------------------------------------------
| PS ID (State) | PSP Instance | Routing Context | Registration Mode | State |
-------------------------------------------------------------------------------------------
| 1 (AS-ACTIVE) | 1 | 1 | STATIC | ASP-ACTIVE |
| 2 (AS-ACTIVE) | 1 | 1 | STATIC | ASP-ACTIVE |
-------------------------------------------------------------------------------------------
• The following displays destination-point-code's routing table, route status should be inAvailable state
[local]asr5000# show ss7-routing-domain all routes
ss7-routing-domain : 4
-----------------------------------------------------------------------------------------------
----------------
| Destination-Point-Code | Peer-Server-Id | LinkSet-Id | Status
| Priority |
--------------------------------------------------------------------------------------------------
-------------
| 0.4.2 ( 34) | 1 | - | Available
| 0 |
| 0.4.3 ( 35) | 2 | - | Available
| 0 |
--------------------------------------------------------------------------------------------------
-------------
Total Number of Routes: 2
• Check the SS7 Signalling Connection Control Part (SCCP) network configuration andsubsystem status should be "Subsystem user in service" state.
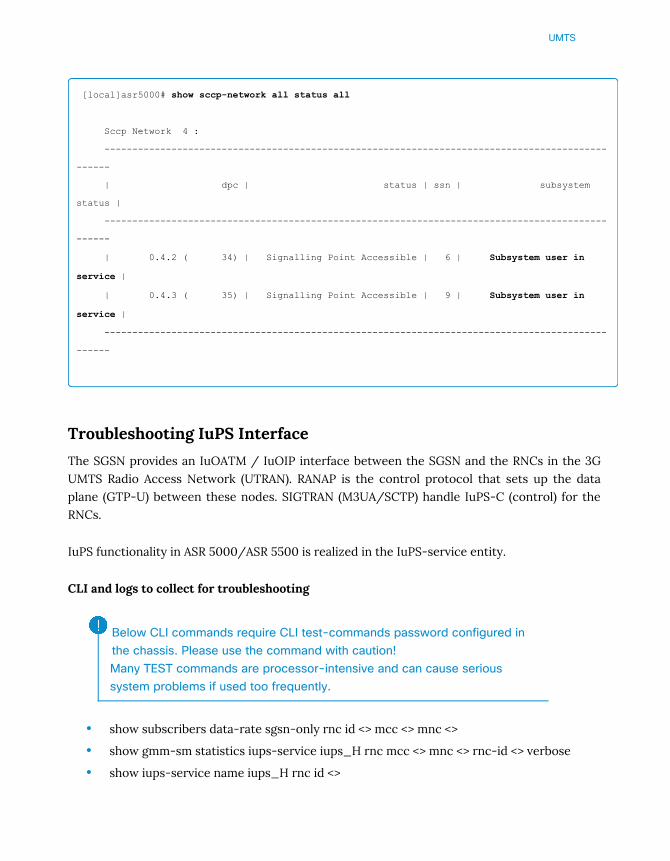
UMTS
[local]asr5000# show sccp-network all status all
Sccp Network 4 :
------------------------------------------------------------------------------------------
------
| dpc | status | ssn | subsystem
status |
------------------------------------------------------------------------------------------
------
| 0.4.2 ( 34) | Signalling Point Accessible | 6 | Subsystem user in
service |
| 0.4.3 ( 35) | Signalling Point Accessible | 9 | Subsystem user in
service |
------------------------------------------------------------------------------------------
------
Troubleshooting IuPS Interface
The SGSN provides an IuOATM / IuOIP interface between the SGSN and the RNCs in the 3GUMTS Radio Access Network (UTRAN). RANAP is the control protocol that sets up the dataplane (GTP-U) between these nodes. SIGTRAN (M3UA/SCTP) handle IuPS-C (control) for theRNCs.
IuPS functionality in ASR 5000/ASR 5500 is realized in the IuPS-service entity.
CLI and logs to collect for troubleshooting
Below CLI commands require CLI test-commands password configured inthe chassis. Please use the command with caution!Many TEST commands are processor-intensive and can cause serioussystem problems if used too frequently.
• show subscribers data-rate sgsn-only rnc id <> mcc <> mnc <>
• show gmm-sm statistics iups-service iups_H rnc mcc <> mnc <> rnc-id <> verbose
• show iups-service name iups_H rnc id <>
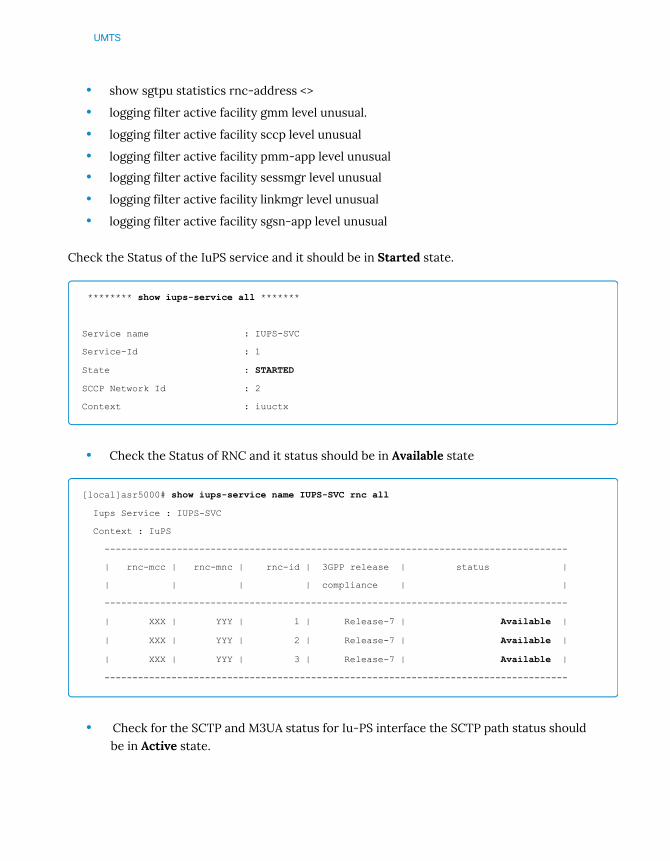
UMTS
• show sgtpu statistics rnc-address <>
• logging filter active facility gmm level unusual.
• logging filter active facility sccp level unusual
• logging filter active facility pmm-app level unusual
• logging filter active facility sessmgr level unusual
• logging filter active facility linkmgr level unusual
• logging filter active facility sgsn-app level unusual
Check the Status of the IuPS service and it should be in Started state.
******** show iups-service all *******
Service name : IUPS-SVC
Service-Id : 1
State : STARTED
SCCP Network Id : 2
Context : iuuctx
• Check the Status of RNC and it status should be in Available state
[local]asr5000# show iups-service name IUPS-SVC rnc all
Iups Service : IUPS-SVC
Context : IuPS
-----------------------------------------------------------------------------------
| rnc-mcc | rnc-mnc | rnc-id | 3GPP release | status |
| | | | compliance | |
-----------------------------------------------------------------------------------
| XXX | YYY | 1 | Release-7 | Available |
| XXX | YYY | 2 | Release-7 | Available |
| XXX | YYY | 3 | Release-7 | Available |
-----------------------------------------------------------------------------------
• Check for the SCTP and M3UA status for Iu-PS interface the SCTP path status shouldbe in Active state.

UMTS
[local]asr5000# show ss7-routing-domain 3 sctp asp all status peer-server all peer-server-
process all
ss7 routing domain : 3
*Peer Server Id : 1 Peer Server Process Id: 1
Association State : ESTABLISHED
----------------------------------------------------------------------------------------
| Source Address | Destination Address | Path Status |
----------------------------------------------------------------------------------------
| XXX.XXX.X.X / 2905 | XXX.XXX.X.XXX / 2905 |Active (Primary Path) |
----------------------------------------------------------------------------------------
*Peer Server Id : 2 Peer Server Process Id: 1
Association State : ESTABLISHED
----------------------------------------------------------------------------------------
| Source Address | Destination Address | Path Status |
----------------------------------------------------------------------------------------
| XXX.XXX.X.X / 2905 | XXX.XXX.X.XXX / 2905 |Active (Primary Path) |
----------------------------------------------------------------------------------------
*Peer Server Id : 3 Peer Server Process Id: 1
Association State : ESTABLISHED
----------------------------------------------------------------------------------------
| Source Address | Destination Address | Path Status |
----------------------------------------------------------------------------------------
| XXX.XXX.X.X / 2905 | XXX.XXX.X.XXX / 2905 |Active (Primary Path) |
----------------------------------------------------------------------------------------
[local]asr5000# show ss7-routing-domain 3 m3ua status peer-server all
ss7 routing domain : 3
--------------------------------------------------------------------------------------
-----
| PS ID (State) | PSP Instance | Routing Context | Registration Mode |
State |

UMTS
--------------------------------------------------------------------------------------
-----
| 1 (AS-ACTIVE) | 1 | 1 | STATIC | ASP-
ACTIVE |
| 2 (AS-ACTIVE) | 1 | 1 | STATIC | ASP-
ACTIVE |
| 3 (AS-ACTIVE) | 1 | 1 | STATIC | ASP-
ACTIVE |
--------------------------------------------------------------------------------------
-----
• Check for the destination-point-code's routing table, the route status should be inAvailable state
[local]asr5000# show ss7-routing-domain all routes
ss7-routing-domain : 3
------------------------------------------------------------------------------------------
---------------------
| Destination-Point-Code | Peer-Server-Id | LinkSet-Id |
Status | Priority |
------------------------------------------------------------------------------------------
---------------------
| 0.3.2 ( 26) | 1 | - |
Available | 0 |
| 0.3.3 ( 27) | 2 | - |
Available | 0 |
| 0.3.4 ( 28) | 3 | - |
Available | 0 |
------------------------------------------------------------------------------------------
---------------------
Total Number of Routes: 3
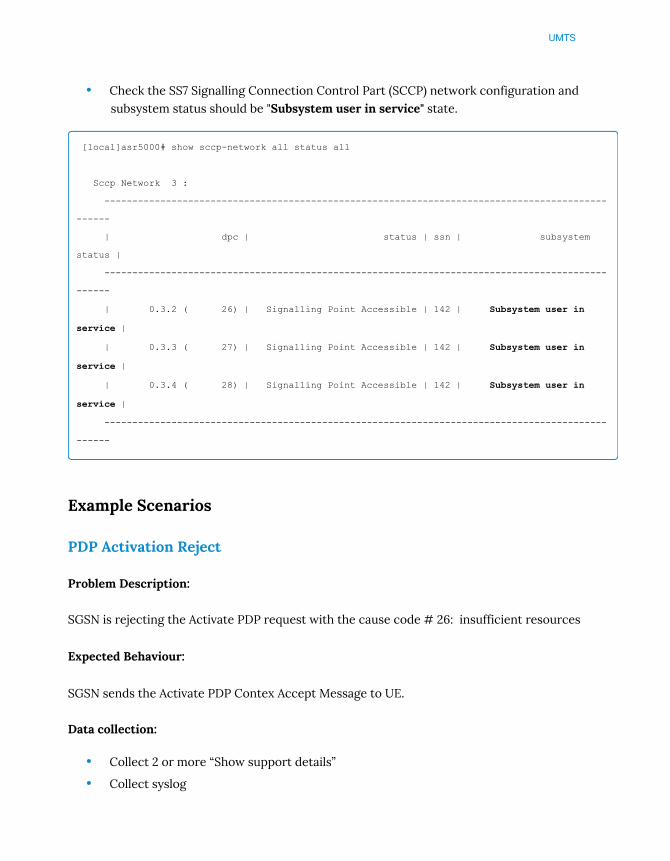
UMTS
• Check the SS7 Signalling Connection Control Part (SCCP) network configuration andsubsystem status should be "Subsystem user in service" state.
[local]asr5000# show sccp-network all status all
Sccp Network 3 :
------------------------------------------------------------------------------------------
------
| dpc | status | ssn | subsystem
status |
------------------------------------------------------------------------------------------
------
| 0.3.2 ( 26) | Signalling Point Accessible | 142 | Subsystem user in
service |
| 0.3.3 ( 27) | Signalling Point Accessible | 142 | Subsystem user in
service |
| 0.3.4 ( 28) | Signalling Point Accessible | 142 | Subsystem user in
service |
------------------------------------------------------------------------------------------
------
Example Scenarios
PDP Activation Reject
Problem Description:
SGSN is rejecting the Activate PDP request with the cause code # 26: insufficient resources
Expected Behaviour:
SGSN sends the Activate PDP Contex Accept Message to UE.
Data collection:
• Collect 2 or more “Show support details”
• Collect syslog

UMTS
• Collect bulkstats/KPI for attach success rate and reject reason
• "monitor subscriber imsi [value]" (verbosity 2)
• Collect external packet capture
CLI used to troubleshoot the issue:
• show gmm-sm statistics verbose
• show port datalink counters
• show snmp traps history verbose
• show subscriber sgsn-o full imsi [value]
• monitor subscriber imsi [value]
Analysis:
As per Spec 24.008, cause value = 26 Insufficient resources. This cause code is used by the MSor by the network to indicate that a PDP context activation request, secondary PDP context ac-tivation request, PDP context modification request, or MBMS context activation request cannotbe accepted due to insufficient resources.
Below is the call flow explaining this scenario.
1. SGSN sends RAB-Assignment Request to RNC.
2. RNC responds with RAB-Assignment Response with cause: release-due-to-utran-generated-reason.
3. SGSN sends Activate PDP reject with SM Cause: insufficient resources.
Activate Primary PDP Context Insufficient Resource Cause Segregation:
Total 3G-Insuff res triggers: 2732122
Total 3G-Insuff res external triggs: 2732122
3G-Qos Negotiation Fail: 0
3G-Operator Policy Fail: 0
3G-GGSN Has No Resources: 2339
3G-GGSN Changed PDP Type: 0
3G-GGSN PDP Addr Alloc Fail: 3
3G-RNC GTPU Path Failure: 0
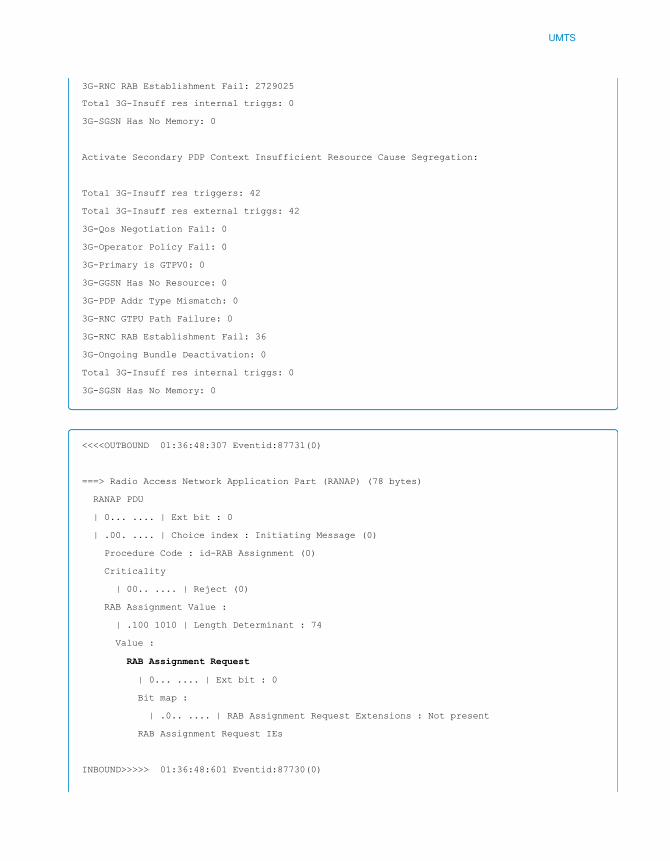
UMTS
3G-RNC RAB Establishment Fail: 2729025
Total 3G-Insuff res internal triggs: 0
3G-SGSN Has No Memory: 0
Activate Secondary PDP Context Insufficient Resource Cause Segregation:
Total 3G-Insuff res triggers: 42
Total 3G-Insuff res external triggs: 42
3G-Qos Negotiation Fail: 0
3G-Operator Policy Fail: 0
3G-Primary is GTPV0: 0
3G-GGSN Has No Resource: 0
3G-PDP Addr Type Mismatch: 0
3G-RNC GTPU Path Failure: 0
3G-RNC RAB Establishment Fail: 36
3G-Ongoing Bundle Deactivation: 0
Total 3G-Insuff res internal triggs: 0
3G-SGSN Has No Memory: 0
<<<<OUTBOUND 01:36:48:307 Eventid:87731(0)
===> Radio Access Network Application Part (RANAP) (78 bytes)
RANAP PDU
| 0... .... | Ext bit : 0
| .00. .... | Choice index : Initiating Message (0)
Procedure Code : id-RAB Assignment (0)
Criticality
| 00.. .... | Reject (0)
RAB Assignment Value :
| .100 1010 | Length Determinant : 74
Value :
RAB Assignment Request
| 0... .... | Ext bit : 0
Bit map :
| .0.. .... | RAB Assignment Request Extensions : Not present
RAB Assignment Request IEs
INBOUND>>>>> 01:36:48:601 Eventid:87730(0)
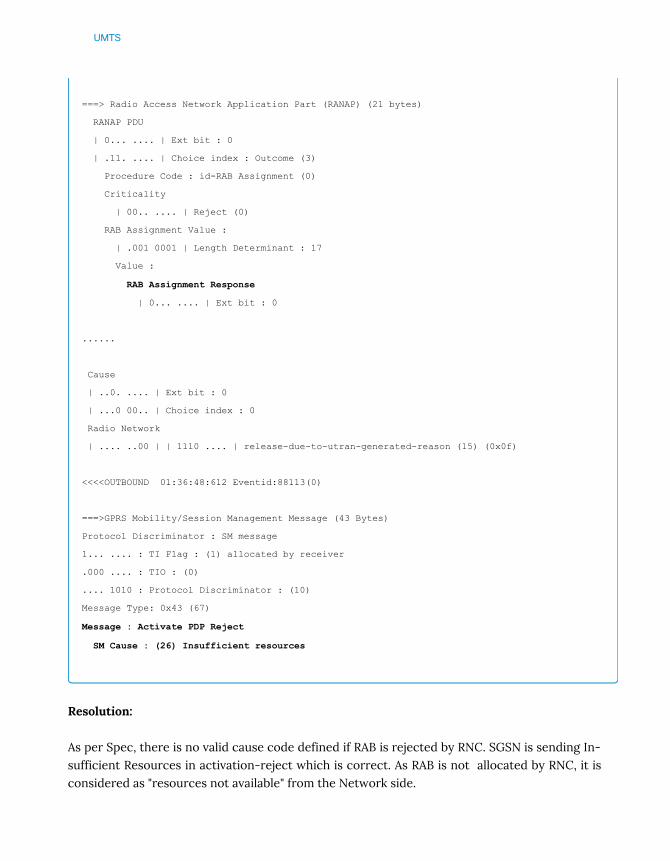
UMTS
===> Radio Access Network Application Part (RANAP) (21 bytes)
RANAP PDU
| 0... .... | Ext bit : 0
| .11. .... | Choice index : Outcome (3)
Procedure Code : id-RAB Assignment (0)
Criticality
| 00.. .... | Reject (0)
RAB Assignment Value :
| .001 0001 | Length Determinant : 17
Value :
RAB Assignment Response
| 0... .... | Ext bit : 0
......
Cause
| ..0. .... | Ext bit : 0
| ...0 00.. | Choice index : 0
Radio Network
| .... ..00 | | 1110 .... | release-due-to-utran-generated-reason (15) (0x0f)
<<<<OUTBOUND 01:36:48:612 Eventid:88113(0)
===>GPRS Mobility/Session Management Message (43 Bytes)
Protocol Discriminator : SM message
1... .... : TI Flag : (1) allocated by receiver
.000 .... : TIO : (0)
.... 1010 : Protocol Discriminator : (10)
Message Type: 0x43 (67)
Message : Activate PDP Reject
SM Cause : (26) Insufficient resources
Resolution:
As per Spec, there is no valid cause code defined if RAB is rejected by RNC. SGSN is sending In-sufficient Resources in activation-reject which is correct. As RAB is not allocated by RNC, it isconsidered as "resources not available" from the Network side.
UMTS
SGSN rejecting the ACTIVATION with SM Cause : (33) Requested serviceoption not subscribed
Problem Observed:
SGSN rejecting the ACTIVATION with SM Cause : (33) Requested service option not subscribed
Expected Behavior:
SGSN should send Activate accept to UE
Data collection:
• Collect 2 or more “Show support details”
• Collect syslog
• Collect bulkstats/KPI for attach success rate and reject reason
• Monitor subscriber imsi [value] (verbosity 2)
• Collect external packet capture
CLI used to troubleshoot the issue:
• show gmm-sm statistics verbose
• show sgtpc statistics
• show port datalink counters
• show snmp traps history verbose
• show subscriber sgsn-o full imsi [value]
• Monitor subscriber imsi [value]
Analysis:
Verify the link between SGSN and GGSN (Gn-interface)Verify no packet drops in SGSN.Check the network latency using ping test. Verify no port flaps or port drops in SGSN.
Collect "monitor subscriber imsi" trace or external packet capture (between SGSN and GGSN )for the subscriber. Inspect this data to see if the SGSN is sending ACTVATE PDP reject (SMCause : (33) Requested service option not subscribed).
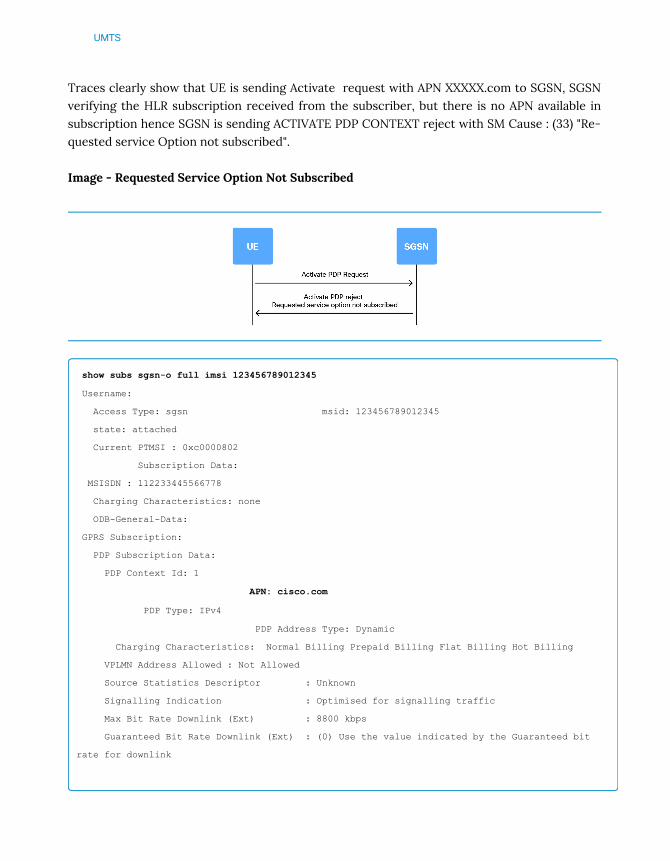
UMTS
Traces clearly show that UE is sending Activate request with APN XXXXX.com to SGSN, SGSNverifying the HLR subscription received from the subscriber, but there is no APN available insubscription hence SGSN is sending ACTIVATE PDP CONTEXT reject with SM Cause : (33) "Re-quested service Option not subscribed".
Image - Requested Service Option Not Subscribed
show subs sgsn-o full imsi 123456789012345
Username:
Access Type: sgsn msid: 123456789012345
state: attached
Current PTMSI : 0xc0000802
Subscription Data:
MSISDN : 112233445566778
Charging Characteristics: none
ODB-General-Data:
GPRS Subscription:
PDP Subscription Data:
PDP Context Id: 1
APN: cisco.com
PDP Type: IPv4
PDP Address Type: Dynamic
Charging Characteristics: Normal Billing Prepaid Billing Flat Billing Hot Billing
VPLMN Address Allowed : Not Allowed
Source Statistics Descriptor : Unknown
Signalling Indication : Optimised for signalling traffic
Max Bit Rate Downlink (Ext) : 8800 kbps
Guaranteed Bit Rate Downlink (Ext) : (0) Use the value indicated by the Guaranteed bit
rate for downlink
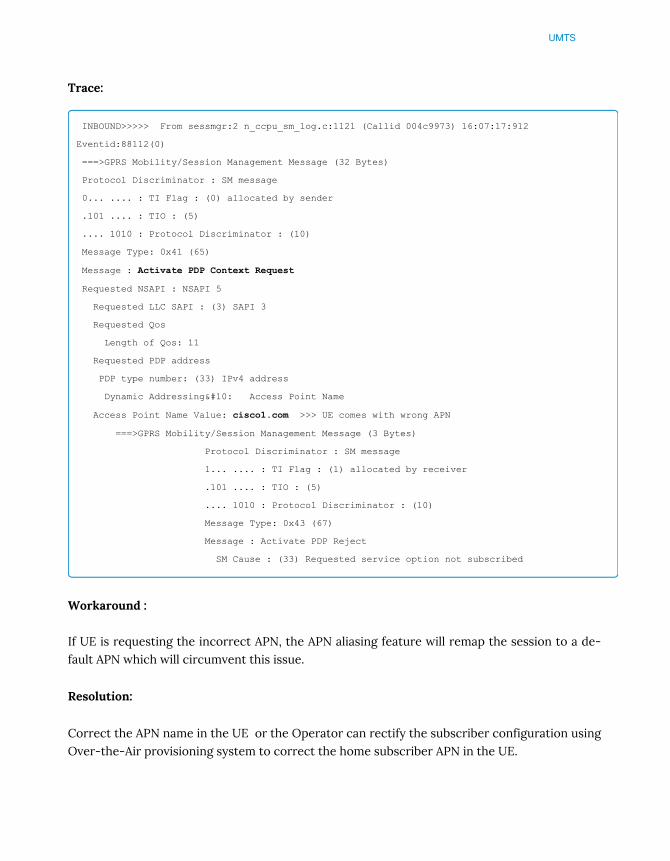
UMTS
Trace:
INBOUND>>>>> From sessmgr:2 n_ccpu_sm_log.c:1121 (Callid 004c9973) 16:07:17:912
Eventid:88112(0)
===>GPRS Mobility/Session Management Message (32 Bytes)
Protocol Discriminator : SM message
0... .... : TI Flag : (0) allocated by sender
.101 .... : TIO : (5)
.... 1010 : Protocol Discriminator : (10)
Message Type: 0x41 (65)
Message : Activate PDP Context Request
Requested NSAPI : NSAPI 5
Requested LLC SAPI : (3) SAPI 3
Requested Qos
Length of Qos: 11
Requested PDP address
PDP type number: (33) IPv4 address
Dynamic Addressing
: Access Point Name
Access Point Name Value: cisco1.com >>> UE comes with wrong APN
===>GPRS Mobility/Session Management Message (3 Bytes)
Protocol Discriminator : SM message
1... .... : TI Flag : (1) allocated by receiver
.101 .... : TIO : (5)
.... 1010 : Protocol Discriminator : (10)
Message Type: 0x43 (67)
Message : Activate PDP Reject
SM Cause : (33) Requested service option not subscribed
Workaround :
If UE is requesting the incorrect APN, the APN aliasing feature will remap the session to a de-fault APN which will circumvent this issue.
Resolution:
Correct the APN name in the UE or the Operator can rectify the subscriber configuration usingOver-the-Air provisioning system to correct the home subscriber APN in the UE.
SGSN Rejecting Activation with SM cause (Missing or Unknown APN(#27))
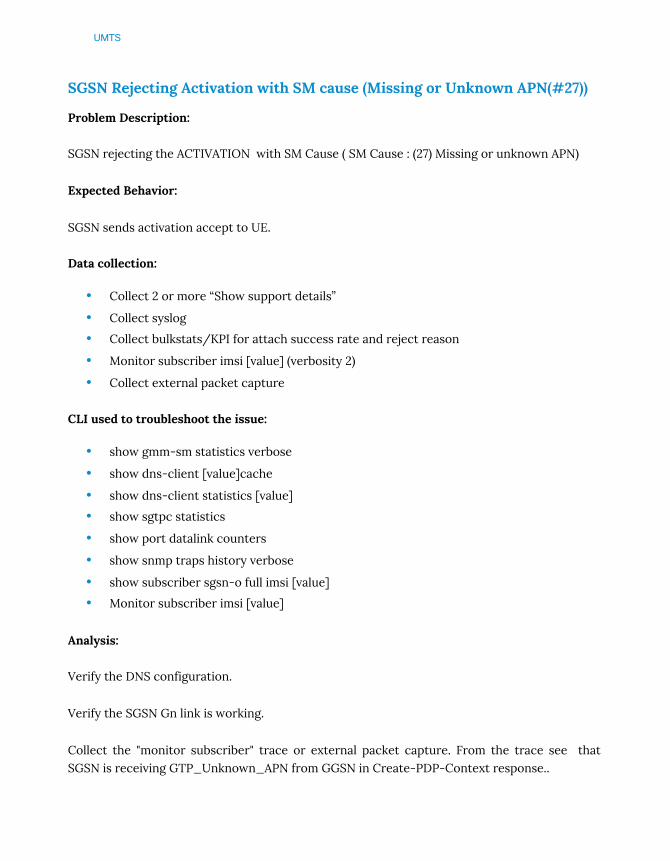
UMTS
SGSN Rejecting Activation with SM cause (Missing or Unknown APN(#27))
Problem Description:
SGSN rejecting the ACTIVATION with SM Cause ( SM Cause : (27) Missing or unknown APN)
Expected Behavior:
SGSN sends activation accept to UE.
Data collection:
• Collect 2 or more “Show support details”
• Collect syslog
• Collect bulkstats/KPI for attach success rate and reject reason
• Monitor subscriber imsi [value] (verbosity 2)
• Collect external packet capture
CLI used to troubleshoot the issue:
• show gmm-sm statistics verbose
• show dns-client [value]cache
• show dns-client statistics [value]
• show sgtpc statistics
• show port datalink counters
• show snmp traps history verbose
• show subscriber sgsn-o full imsi [value]
• Monitor subscriber imsi [value]
Analysis:
Verify the DNS configuration.
Verify the SGSN Gn link is working.
Collect the "monitor subscriber" trace or external packet capture. From the trace see thatSGSN is receiving GTP_Unknown_APN from GGSN in Create-PDP-Context response..
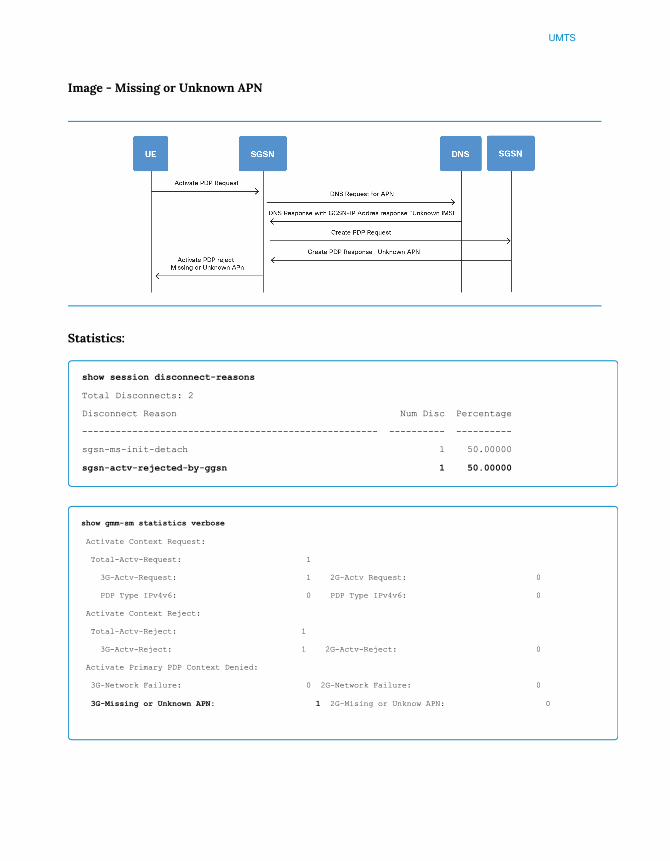
UMTS
Image - Missing or Unknown APN
Statistics:
show session disconnect-reasons
Total Disconnects: 2
Disconnect Reason Num Disc Percentage
----------------------------------------------------- ---------- ----------
sgsn-ms-init-detach 1 50.00000
sgsn-actv-rejected-by-ggsn 1 50.00000
show gmm-sm statistics verbose
Activate Context Request:
Total-Actv-Request: 1
3G-Actv-Request: 1 2G-Actv Request: 0
PDP Type IPv4v6: 0 PDP Type IPv4v6: 0
Activate Context Reject:
Total-Actv-Reject: 1
3G-Actv-Reject: 1 2G-Actv-Reject: 0
Activate Primary PDP Context Denied:
3G-Network Failure: 0 2G-Network Failure: 0
3G-Missing or Unknown APN: 1 2G-Mising or Unknow APN: 0
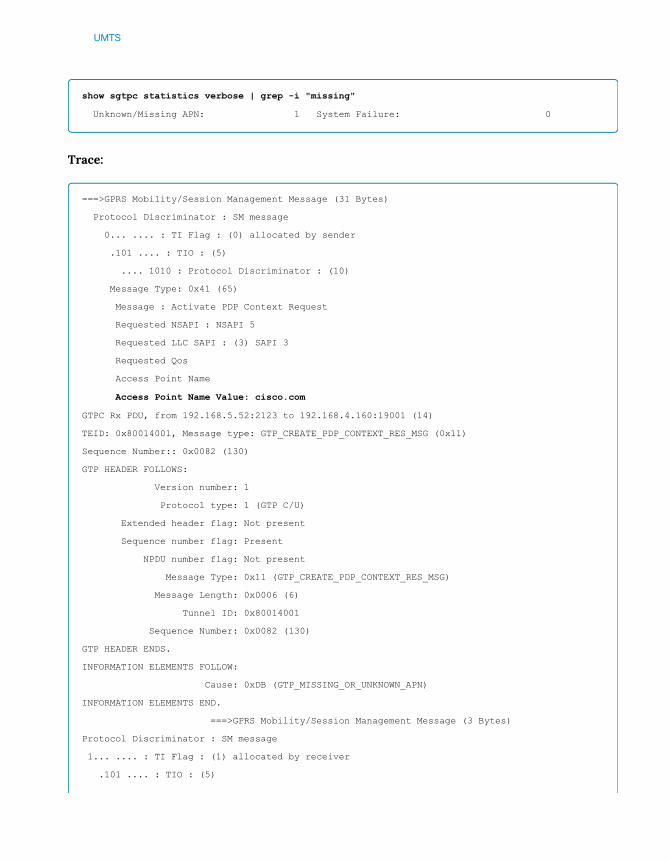
UMTS
show sgtpc statistics verbose | grep -i "missing"
Unknown/Missing APN: 1 System Failure: 0
Trace:
===>GPRS Mobility/Session Management Message (31 Bytes)
Protocol Discriminator : SM message
0... .... : TI Flag : (0) allocated by sender
.101 .... : TIO : (5)
.... 1010 : Protocol Discriminator : (10)
Message Type: 0x41 (65)
Message : Activate PDP Context Request
Requested NSAPI : NSAPI 5
Requested LLC SAPI : (3) SAPI 3
Requested Qos
Access Point Name
Access Point Name Value: cisco.com
GTPC Rx PDU, from 192.168.5.52:2123 to 192.168.4.160:19001 (14)
TEID: 0x80014001, Message type: GTP_CREATE_PDP_CONTEXT_RES_MSG (0x11)
Sequence Number:: 0x0082 (130)
GTP HEADER FOLLOWS:
Version number: 1
Protocol type: 1 (GTP C/U)
Extended header flag: Not present
Sequence number flag: Present
NPDU number flag: Not present
Message Type: 0x11 (GTP_CREATE_PDP_CONTEXT_RES_MSG)
Message Length: 0x0006 (6)
Tunnel ID: 0x80014001
Sequence Number: 0x0082 (130)
GTP HEADER ENDS.
INFORMATION ELEMENTS FOLLOW:
Cause: 0xDB (GTP_MISSING_OR_UNKNOWN_APN)
INFORMATION ELEMENTS END.
===>GPRS Mobility/Session Management Message (3 Bytes)
Protocol Discriminator : SM message
1... .... : TI Flag : (1) allocated by receiver
.101 .... : TIO : (5)

UMTS
.... 1010 : Protocol Discriminator : (10)
Message Type: 0x43 (67)
Message : Activate PDP Reject
SM Cause : (27) Missing or unknown APN
Resolution:
1.The most common reason for these failures is wrong DNS entries for APN to GGSN IP ad-dress mapping .
SGSN Rejecting Attach with GMM (MS not derived from network (#9))
Problem Observed:
SGSN rejecting the PTMSI ATTACH with cause code (MS not derived from network (#9))
Expected behavior:
SGSN send the Attach Accept to UE.
Data collection:
• Collect 2 or more “Show support details”
• Collect syslog
• Collect bulkstats/KPI for attach success rate and reject reason
• Monitor subscriber imsi [value] (verbosity 2)
• Collect external packet capture
CLI used to troubleshoot the issue:
• show gmm-sm statistics verbose
• show snmp traps history verbose
• show dns-client statistics client xxxx >>> where "xxxx" dns-client name
• show dns-client cache
• show session disconnect-reason
• show sgtpc statistics verbose.
• Monitor subscriber imsi [value]
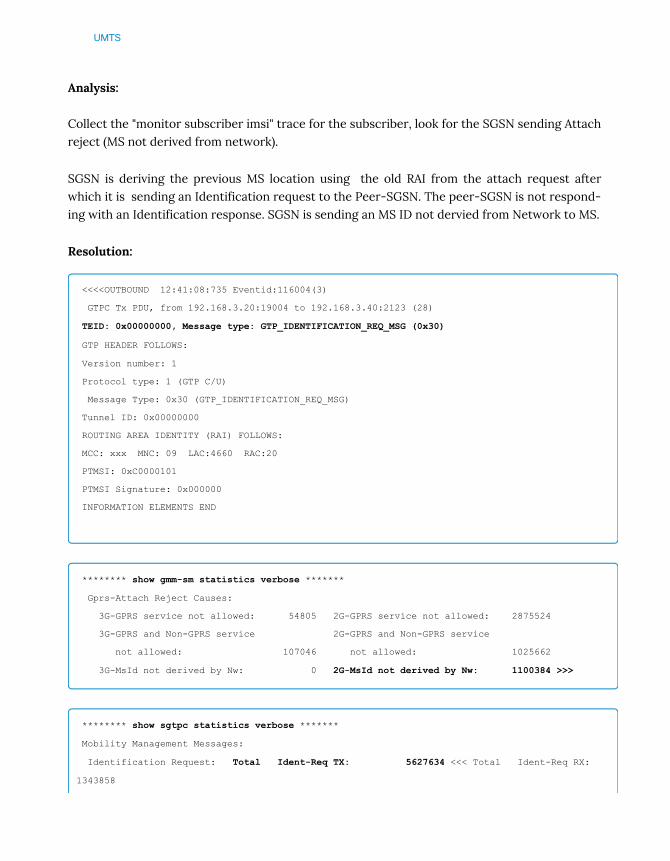
UMTS
Analysis:
Collect the "monitor subscriber imsi" trace for the subscriber, look for the SGSN sending Attachreject (MS not derived from network).
SGSN is deriving the previous MS location using the old RAI from the attach request afterwhich it is sending an Identification request to the Peer-SGSN. The peer-SGSN is not respond-ing with an Identification response. SGSN is sending an MS ID not dervied from Network to MS.
Resolution:
<<<<OUTBOUND 12:41:08:735 Eventid:116004(3)
GTPC Tx PDU, from 192.168.3.20:19004 to 192.168.3.40:2123 (28)
TEID: 0x00000000, Message type: GTP_IDENTIFICATION_REQ_MSG (0x30)
GTP HEADER FOLLOWS:
Version number: 1
Protocol type: 1 (GTP C/U)
Message Type: 0x30 (GTP_IDENTIFICATION_REQ_MSG)
Tunnel ID: 0x00000000
ROUTING AREA IDENTITY (RAI) FOLLOWS:
MCC: xxx MNC: 09 LAC:4660 RAC:20
PTMSI: 0xC0000101
PTMSI Signature: 0x000000
INFORMATION ELEMENTS END
******** show gmm-sm statistics verbose *******
Gprs-Attach Reject Causes:
3G-GPRS service not allowed: 54805 2G-GPRS service not allowed: 2875524
3G-GPRS and Non-GPRS service 2G-GPRS and Non-GPRS service
not allowed: 107046 not allowed: 1025662
3G-MsId not derived by Nw: 0 2G-MsId not derived by Nw: 1100384 >>>
******** show sgtpc statistics verbose *******
Mobility Management Messages:
Identification Request: Total Ident-Req TX: 5627634 <<< Total Ident-Req RX:
1343858
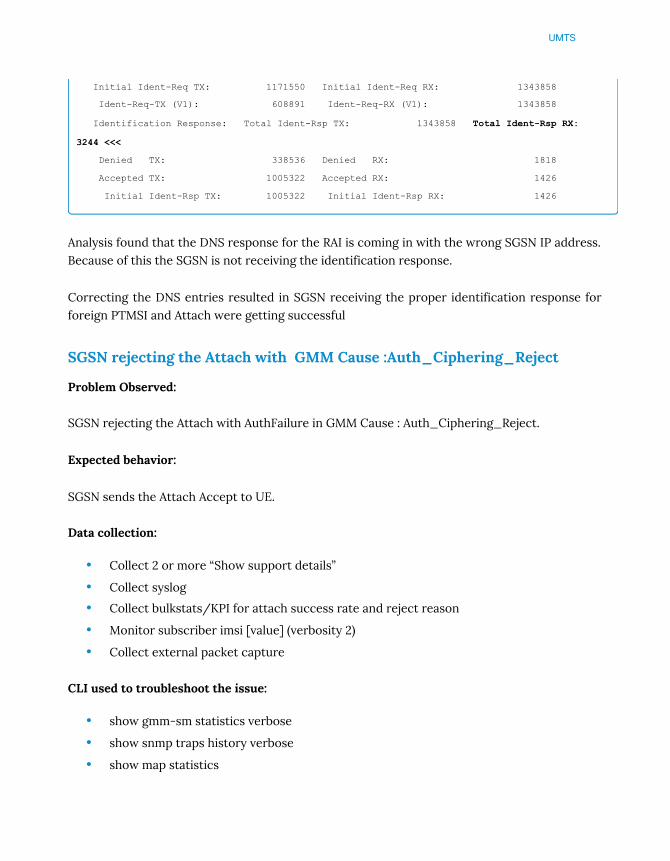
UMTS
Initial Ident-Req TX: 1171550 Initial Ident-Req RX: 1343858
Ident-Req-TX (V1): 608891 Ident-Req-RX (V1): 1343858
Identification Response: Total Ident-Rsp TX: 1343858 Total Ident-Rsp RX:
3244 <<<
Denied TX: 338536 Denied RX: 1818
Accepted TX: 1005322 Accepted RX: 1426
Initial Ident-Rsp TX: 1005322 Initial Ident-Rsp RX: 1426
Analysis found that the DNS response for the RAI is coming in with the wrong SGSN IP address.Because of this the SGSN is not receiving the identification response.
Correcting the DNS entries resulted in SGSN receiving the proper identification response forforeign PTMSI and Attach were getting successful
SGSN rejecting the Attach with GMM Cause :Auth_Ciphering_Reject
Problem Observed:
SGSN rejecting the Attach with AuthFailure in GMM Cause : Auth_Ciphering_Reject.
Expected behavior:
SGSN sends the Attach Accept to UE.
Data collection:
• Collect 2 or more “Show support details”
• Collect syslog
• Collect bulkstats/KPI for attach success rate and reject reason
• Monitor subscriber imsi [value] (verbosity 2)
• Collect external packet capture
CLI used to troubleshoot the issue:
• show gmm-sm statistics verbose
• show snmp traps history verbose
• show map statistics

UMTS
• monitor subscriber imsi [value]
Analysis:
In collected "monitor subscriber imsi" trace for the subscriber it is clear that SGSN is sendingAttach reject(Authentication_ciphering_reject).
From the trace:
• MS sending Attach request to SGSN
• SGSN is sending SAI Request to HLR.
• HLR is sending Triplets to SGSN
• SGSN is sending Auth_ciphering_request with RAND value to MS
• MS is sending SRES in Auth_Ciphering_response based on the RAND
• SGSN verifies the SRES value received from HLR and MS
SRES didn't match,hence SGSN is sending Auth_ciphering_reject to MS and also SGSN is re-porting this auth failure to HLR in MAP Auth_Failure_report.
Image - Auth Ciphering Reject

UMTS
Statistics:
show map statistics
Auth Fail Rep Req TX : 1 Successful: 1
Failed : 0 Timed Out 0
show session disconnect-reasons
Disconnect Reason Num Disc Percentage
----------------------------------------------------- ---------- ----------
sgsn-auth-failure 2 40.00000
sgsn-ms-init-detach 1 20.00000
sgsn-sai-failure 1 20.00000
sgsn-detach-init-deact 1 20.00000
show gmm-sm statistics verbose
GPRS-Attach Network Failure Cause:
Total 3G-Network Fail rejects: 1
Total 3G-external Triggers: 1 Total 2G-external Triggers: 0
3G-Data missing from HLR: 1 2G-Data missing from HLR: 0
Trace:
===> GSM Mobile Application (MAP)
MAP Send Authentication Info Response
Send Authentication Info Response Tag
Authentication Triplet
RAND
Value : 0x79 df 0d 86 48 70 00 00 09 00 01 02 03 04 05 06
SRES
Value : 0x79 df 0d 86
Kc
Value : 0x01 02 03 04 05 06 07 08
===>GPRS Mobility/Session Management Message
Protocol Discriminator : GMM message

UMTS
Message Type: 0x12 (18)
Message : Authentication and Ciphering Request
IMEISV Request : (0) IMEISV not requested
Authentication RAND
Element ID: 33
RAND Value: 79 df 0d 86 48 70 00 00 09 00 01 02 03 04 05 06
Ciphering Key Sequence : 0x0 (0)
===>GPRS Mobility/Session Management Message
Message : Authentication and Ciphering Request
Authentication RAND
RAND Value: 79 df 0d 86 48 70 00 00 09 00 01 02 03 04 05 06
===>GPRS Mobility/Session Management Message
Message : Authentication and ciphering Response
SRES Value: 0b 01 00 00 >>> SRES Value Not matching with HLR
Mobile Identity - IMEISV
BCD Digits: 2000154203230000
===> GSM Mobile Application (MAP)
MAP Authentication Failure Report Request
===>GPRS Mobility/Session Management Message
Protocol Discriminator : GMM message
Message : Authentication and ciphering Reject >>>
===> GSM Mobile Application (MAP)
MAP Authentication Failure Report Response
Resolution:
SGSN is behaving as expected since HLR keys and USIM in MS is not matching,
HLR/AUC needs to update the key DB for the user. Issue must be HLR or UE may be at fault fornot sending proper SRES to SGSN.
SGSN rejecting the ATTACH with GMM Cause : (8) GPRS services notallowed)
Problem Description:
SGSN rejecting the IMSI/PTMSI ATTACH with GMM Cause : (8) GPRS services and non-GPRSservices not allowed)
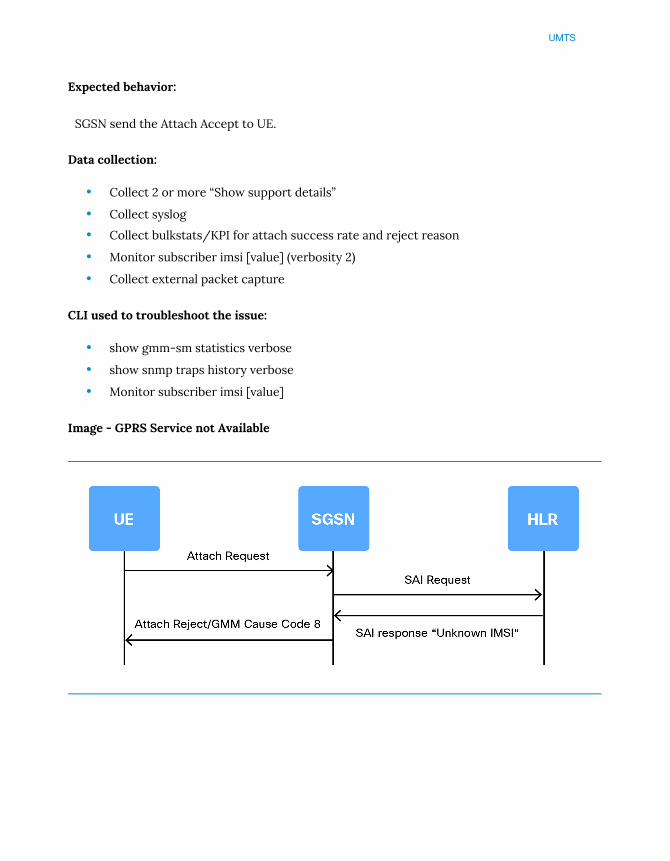
UMTS
Expected behavior:
SGSN send the Attach Accept to UE.
Data collection:
• Collect 2 or more “Show support details”
• Collect syslog
• Collect bulkstats/KPI for attach success rate and reject reason
• Monitor subscriber imsi [value] (verbosity 2)
• Collect external packet capture
CLI used to troubleshoot the issue:
• show gmm-sm statistics verbose
• show snmp traps history verbose
• Monitor subscriber imsi [value]
Image - GPRS Service not Available
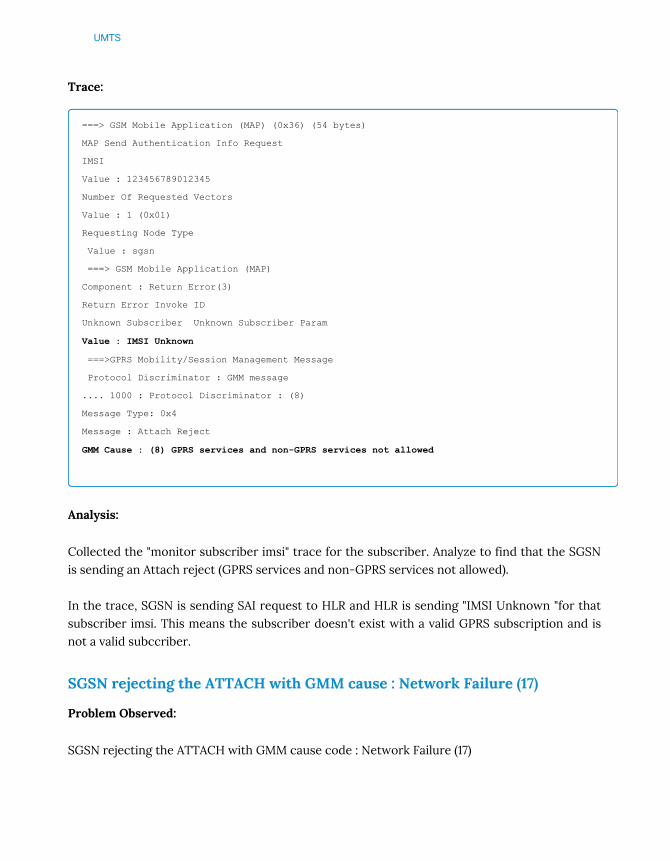
UMTS
Trace:
===> GSM Mobile Application (MAP) (0x36) (54 bytes)
MAP Send Authentication Info Request
IMSI
Value : 123456789012345
Number Of Requested Vectors
Value : 1 (0x01)
Requesting Node Type
Value : sgsn
===> GSM Mobile Application (MAP)
Component : Return Error(3)
Return Error Invoke ID
Unknown Subscriber Unknown Subscriber Param
Value : IMSI Unknown
===>GPRS Mobility/Session Management Message
Protocol Discriminator : GMM message
.... 1000 : Protocol Discriminator : (8)
Message Type: 0x4
Message : Attach Reject
GMM Cause : (8) GPRS services and non-GPRS services not allowed
Analysis:
Collected the "monitor subscriber imsi" trace for the subscriber. Analyze to find that the SGSNis sending an Attach reject (GPRS services and non-GPRS services not allowed).
In the trace, SGSN is sending SAI request to HLR and HLR is sending "IMSI Unknown "for thatsubscriber imsi. This means the subscriber doesn't exist with a valid GPRS subscription and isnot a valid subccriber.
SGSN rejecting the ATTACH with GMM cause : Network Failure (17)
Problem Observed:
SGSN rejecting the ATTACH with GMM cause code : Network Failure (17)
UMTS
Expected behavior:
SGSN send the Attach Accept to UE.
Data collection:
• Collect 2 or more “Show support details”
• Collect syslog
• Collect bulkstats/KPI for attach success rate and reject reason
• Monitor subscriber imsi [value] (verbosity 2)
• Collect external packet capture
CLI used to troubleshoot the issue:
• show gmm-sm statistics verbose
• show map statistics
• show snmp traps history verbose
• monitor subscriber imsi [value]
• show port datalink counters
Analysis:
Verify the link between SGSN and STP/HLR is working fine.
Verify there are no packet drops towards STP/HLR (ping test).
Verify no port flaps or port drops in SGSN.
Collect "monitor subscriber imsi" trace or external packet capture (between SGSN andHLR/STP) for the subscriber. Analyze the data to find if the SGSN is sending Attach re-ject(Network Failure).
In the trace, SGSN is sending SAI request to HLR and the SGSN waiting for 15 sec to get re-sponse from HLR. Since there is no response received from HLR, SGSN sends Network failureto MS

UMTS
Image - Network Failure
Trace
>>>>>>> INBOUND
===>GPRS Mobility/Session Management Message (33 Bytes)
Protocol Discriminator : GMM message
0000 .... : Skip Indicator : (0)
Message Type: 0x1 (1)
Message : Attach Request
MS Network Capability
<<<<OUTBOUND From sessmgr:1 n_ccpu_sm_log.c:1399 (Callid 00004e31) 15:12:30:308
Eventid:87114(0)
===> GSM Mobile Application (MAP)
Component : Invoke(1)
Component Length : Indefinite length format (0x80)
MAP Send Authentication Info Request
IMSI
Value : 231456789012345
Number Of Requested Vectors
Value : 1
Requesting Node Type
Value : sgsn
<<<<OUTBOUND From sessmgr:1 n_ccpu_sm_log.c:1174 (Callid 00004e31) 15:12:45:303
===>GPRS Mobility/Session Management Message
Protocol Discriminator : GMM message
0000 .... : Skip Indicator : (0)
.... 1000 : Protocol Discriminator : (8)
Message Type: 0x4 (4)
Message : Attach Reject
UMTS
GMM Cause : (17) Network failure
Resolution:
SGSN is behaving as expected. HLR didn’t send any response to the SGSN's SAI Requesthence SGSN is rejecting the call with Network failure #17.
Routing Area Update Reject with cause code MS not derived from network(#9)
Problem Observed:
SGSN rejecting the routing area update with cause code MS not derived from network (#9))
Expected behavior:
SGSN send the routing area update Accept to UE.
Data collection:
• Collect 2 or more “Show support details”
• Collect syslog
• Collect bulkstats/KPI for attach success rate and reject reason
• Monitor subscriber imsi [value] (verbosity 2)
• Collect external packet capture
CLI used to troubleshoot the issue:
• show gmm-sm statistics verbose
• show snmp traps history verbose
• show dns-client statistics client xxxx >>> where "xxxx" is dns-client name
• show dns-client cache
• show session disconnect-reason
• show sgtpc statistics verbose

UMTS
Analysis:
In "monitor subscriber IMSI" trace the SGSN is sending routing area reject (MS not derivedfrom network).
The SGSN is deriving previous MS location from PTMSI (NRI) & OLD RAI from the routing areaupdate request after which it's sending GTP SGSN Context Request to Peer-SGSN/MME. Peer-SGSN/MME is not responding with GTP SGSN Context Response.
As a result SGSN is sending MS ID that is not dervied from the Network to MS after retry timerexpiry "gtpc max-retransmissions". In this case gtpc retransmission-timeout is 5sec.
Image - callflow for MS not derived from network
Message Type: 0x32 (GTP_SGSN_CONTEXT_REQ_MSG)
Message Length: 0x0022 (34)
Tunnel ID: 0x00000000
Sequence Number: 0x08C7 (2247)
GTP HEADER ENDS.
INFORMATION ELEMENTS FOLLOW:
ROUTING AREA IDENTITY (RAI) FOLLOWS:
MCC: XXX
MNC: YYY
LAC:9C42

UMTS
RAC:F8
ROUTING AREA IDENTITY (RAI) ENDS.
PTMSI: 0xC0F85029
PTMSI Signature: 0x03BB61
MS Validated: 0
Tunnel ID Control I: 0x00000001
GSN Address I: 0xD1E21F64 (172.18.31.100)
===>GPRS Mobility/Session Management Message (4 Bytes)
Protocol Discriminator : GMM message
0000 .... : Skip Indicator : (0)
.... 1000 : Protocol Discriminator : (8)
Message Type: 0xb (11)
Message : Routing Area Update Reject
GMM Cause : (9) MS identity cannot be derived by the network
Force To Standby : (0) Force to standby not indicated
Spare half octet: (0)
******** show gmm-sm statistics verbose *******
Routing Area Update Reject:
Total-PS-Inter-RAU-Rej: 88564095
3G-PS-Inter-RAU-Rej: 974863 2G-PS-Inter-RAU-Rej: 87589232 >>
Total-Comb-Inter-RAU-Rej: 166
Inter SGSN PS Only Routing Area Update Reject Causes:
3G-GPRS service not allowed: 0 2G-GPRS service not allowed: 0
3G-GPRS and Non-GPRS service 2G-GPRS and Non-GPRS service
not allowed: 0 not allowed: 0
3G-MsId not derived by Nw: 973586 2G-MsId not derived by Nw: 83884662
3G-Implicitly Detached: 0 2G-Implicitly Detached: 607896
3G-PLMN not allowed: 0 2G-PLMN not allowed: 0
3G-Location Area not allowed: 0 2G-Location Area not allowed: 0
Troubleshooting Steps:
1 Check the Configuration under Call-Control profile. SGSN selects the call control
profile from SGSN Global config on the basis of RAI in RAU.
sgsn-global
imsi-range mcc XXX mnc YYY plmnid XXXYYY operator-policy home_oper1
operator-policy name home_oper1
UMTS
associate call-control-profile home_cc1
call-control-profile home_cc1
sgsn-address rac 176 lac 11600 nri 8 prefer local address ipv4 172.18.201.230 interface gn
2 Check the DNS response, make sure it returns correct IP address.
3 Check the IP connectivity.
Resolution:
1 If the DNS responds with incorrect IP address, correct the IP address in the DNS.
2 If there is a connectivity issue, then correct the routing problem.
Routing area update reject with cause code Network Failure #17
Problem Observed:
SGSN rejecting the Routing area update with cause code Network Failure #17
Expected behavior:
SGSN send the Routing area update Accept to UE.
Data collection:
• Collect 2 or more “Show support details”
• Collect syslog
• Collect bulkstats/KPI for attach success rate and reject reason
• Monitor subscriber imsi [value] (verbosity 2)
• Monitor protocol (Verbosity 2) -- Use caution when running this command in aProduction network.
• Collect external packet capture
CLI used to troubleshoot the issue:
• show gmm-sm statistics verbose
• show snmp traps history verbose
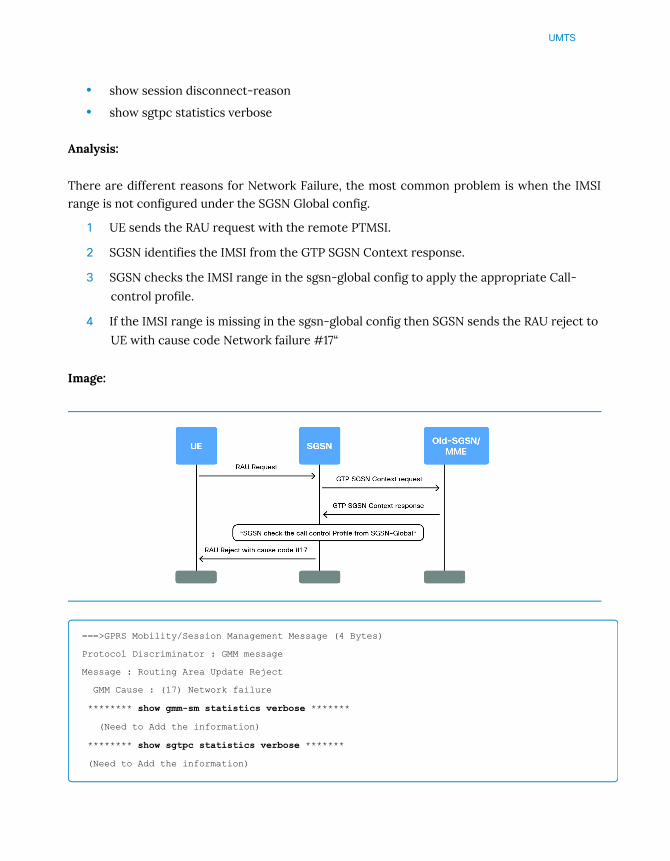
UMTS
• show session disconnect-reason
• show sgtpc statistics verbose
Analysis:
There are different reasons for Network Failure, the most common problem is when the IMSIrange is not configured under the SGSN Global config.
1 UE sends the RAU request with the remote PTMSI.
2 SGSN identifies the IMSI from the GTP SGSN Context response.
3 SGSN checks the IMSI range in the sgsn-global config to apply the appropriate Call-
control profile.
4 If the IMSI range is missing in the sgsn-global config then SGSN sends the RAU reject to
UE with cause code Network failure #17“
Image:
===>GPRS Mobility/Session Management Message (4 Bytes)
Protocol Discriminator : GMM message
Message : Routing Area Update Reject
GMM Cause : (17) Network failure
******** show gmm-sm statistics verbose *******
(Need to Add the information)
******** show sgtpc statistics verbose *******
(Need to Add the information)
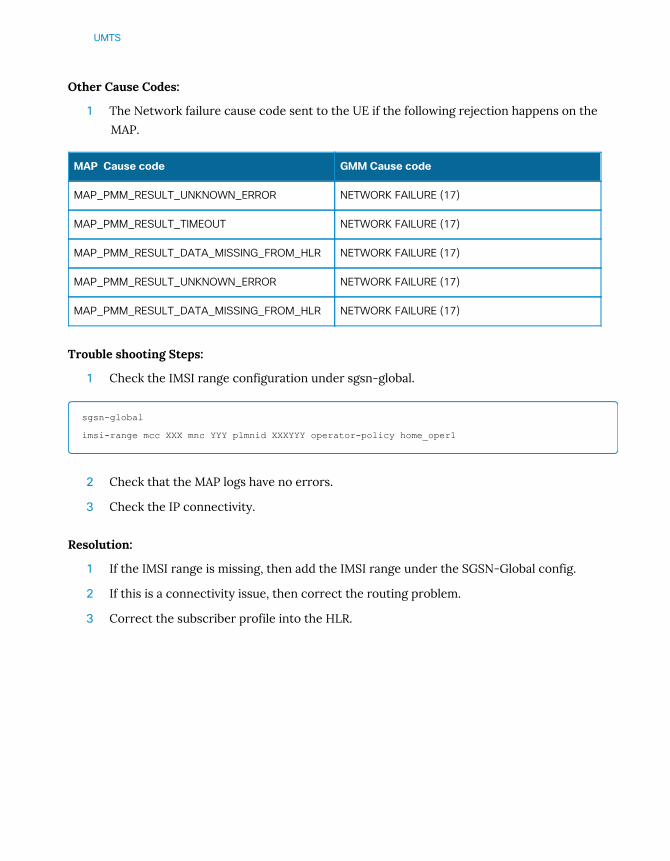
UMTS
Other Cause Codes:
1 The Network failure cause code sent to the UE if the following rejection happens on the
MAP.
Trouble shooting Steps:
1 Check the IMSI range configuration under sgsn-global.
sgsn-global
imsi-range mcc XXX mnc YYY plmnid XXXYYY operator-policy home_oper1
2 Check that the MAP logs have no errors.
3 Check the IP connectivity.
Resolution:
1 If the IMSI range is missing, then add the IMSI range under the SGSN-Global config.
2 If this is a connectivity issue, then correct the routing problem.
3 Correct the subscriber profile into the HLR.
MAP Cause code GMM Cause code
MAP_PMM_RESULT_UNKNOWN_ERROR NETWORK FAILURE (17)
MAP_PMM_RESULT_TIMEOUT NETWORK FAILURE (17)
MAP_PMM_RESULT_DATA_MISSING_FROM_HLR NETWORK FAILURE (17)
MAP_PMM_RESULT_UNKNOWN_ERROR NETWORK FAILURE (17)
MAP_PMM_RESULT_DATA_MISSING_FROM_HLR NETWORK FAILURE (17)

UMTS
Troubleshooting GGSN
Overview
This section focuses on CLI commands in ASR 5000/ASR 5500 used for troubleshooting differ-ent interfaces on GGSN and UMTS along with multiple issue scenarios.
Troubleshooting Commands
• show gtpc statistics verbose
Description:
View GTPC statistics (this command is present in every #show support details). Follow-ing are most important sections of the command output:
Red - If counters marked with red start to increase and there is an issue on the systemthen please contact Cisco TAC.
Blue - If counters marked with blue start to increase, there is an issue in communicationbetween the Client (GGSN) and AAA servers (Radius server, Online chargingserver/OCS, PCRF)
Orange - If counters marked with Orange start to increase, there is an issue regarding IPaddress assignment from the IP pool that is configured on GGSN.
Session Release Reasons:
SGSN Initiated: 0 Secondary Teardown: 0
Session Mgr. Died: 0 Admin Releases: 0
APN Removed: 0 Call Aborted: 0
Idle Timeout: 0 Absolute Timeout: 0
Source Addr Violation: 0 Flow Addition Failure: 0
DHCP Renewal Failure: 0 Long Duration Timeout: 0
Error Indication: 0 Context replacement: 0
Other Reasons: 0 Purged via Audit: 0
Update Handoff Reject: 0
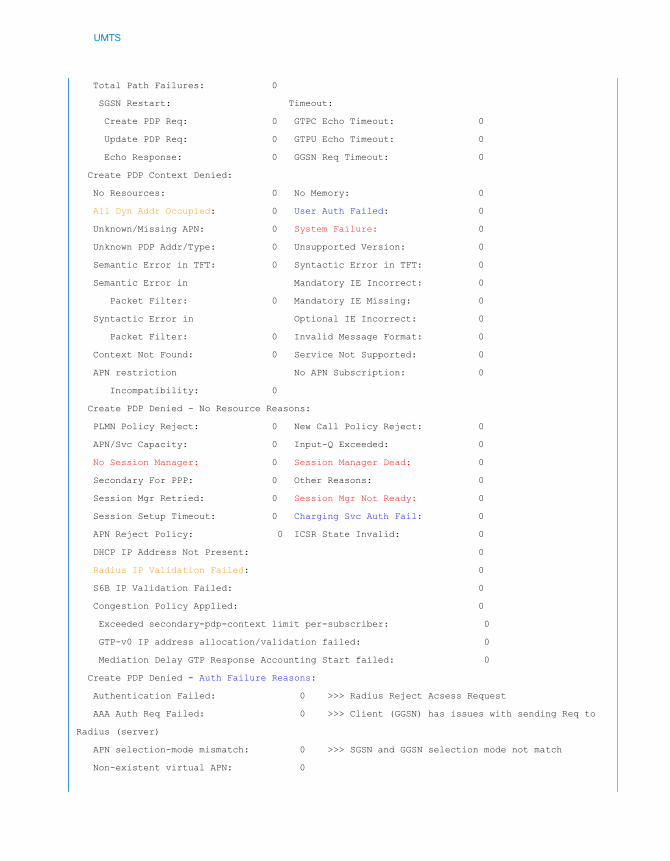
UMTS
Total Path Failures: 0
SGSN Restart: Timeout:
Create PDP Req: 0 GTPC Echo Timeout: 0
Update PDP Req: 0 GTPU Echo Timeout: 0
Echo Response: 0 GGSN Req Timeout: 0
Create PDP Context Denied:
No Resources: 0 No Memory: 0
All Dyn Addr Occupied: 0 User Auth Failed: 0
Unknown/Missing APN: 0 System Failure: 0
Unknown PDP Addr/Type: 0 Unsupported Version: 0
Semantic Error in TFT: 0 Syntactic Error in TFT: 0
Semantic Error in Mandatory IE Incorrect: 0
Packet Filter: 0 Mandatory IE Missing: 0
Syntactic Error in Optional IE Incorrect: 0
Packet Filter: 0 Invalid Message Format: 0
Context Not Found: 0 Service Not Supported: 0
APN restriction No APN Subscription: 0
Incompatibility: 0
Create PDP Denied - No Resource Reasons:
PLMN Policy Reject: 0 New Call Policy Reject: 0
APN/Svc Capacity: 0 Input-Q Exceeded: 0
No Session Manager: 0 Session Manager Dead: 0
Secondary For PPP: 0 Other Reasons: 0
Session Mgr Retried: 0 Session Mgr Not Ready: 0
Session Setup Timeout: 0 Charging Svc Auth Fail: 0
APN Reject Policy: 0 ICSR State Invalid: 0
DHCP IP Address Not Present: 0
Radius IP Validation Failed: 0
S6B IP Validation Failed: 0
Congestion Policy Applied: 0
Exceeded secondary-pdp-context limit per-subscriber: 0
GTP-v0 IP address allocation/validation failed: 0
Mediation Delay GTP Response Accounting Start failed: 0
Create PDP Denied - Auth Failure Reasons:
Authentication Failed: 0 >>> Radius Reject Acsess Request
AAA Auth Req Failed: 0 >>> Client (GGSN) has issues with sending Req to
Radius (server)
APN selection-mode mismatch: 0 >>> SGSN and GGSN selection mode not match
Non-existent virtual APN: 0

UMTS
Reject Foreign Subscriber: 0
IMS Authorization Fail: 0 >>> PCRF Reject the subscriber
Create PDP Denied - Dynamic Address Occupied:
DHCP No IP Address Alloc: 0
DHCP Timer Notification: 0
Local IP Validation Failed: 0
Local IP Pool All Address Occupied: 0
• show ggsn-service all
Description:
Use this command for quick a check regarding parameters configured in the GGSN ser-vice, for example GTPC Echo timers.
• show ggsn-service sgsn-table
Description:
Use this command to check which SGSNs this GGSN is communicating with.
• show subscribers ggsn-only full imsi [value]
Description:
Use this command to check only GGSN relevant information per IMSI.
Example Scenarios
PDP Context Reject - User Authentication failed
Problem Description:
Mobile operator reports that subscriber cannot establish PDP session.

UMTS
Data collection:
• Collect mulitiple SSDs
• Collect external PCAP
• Collect sample "monitor subscriber" at verbosity 2 showing the error behavior
• Collect syslog
CLI used to troubleshoot the issue:
#show gtpc statistics verbose
#show session disconnect-reasons
# monitor subscriber
Image - callflow for user authentication failed
Analysis:
1 Run multiple iterations of the command show gtpc statistics verbose. Compare counter
values to see which ones increased in section "Create PDP Context Denied". In this
case, the counter "User Auth Failed" increased. The counter "Authentication Failed" also
increased in the output of "Create PDP Denied - Auth Failure Reasons:"
Create PDP Context Denied:
No Resources: 0 No Memory: 0

UMTS
All Dyn Addr Occupied: 0 User Auth Failed: 1
Unknown/Missing APN: 0 System Failure: 0
Unknown PDP Addr/Type: 0 Unsupported Version: 0
Semantic Error in TFT: 0 Syntactic Error in TFT: 0
Semantic Error in Mandatory IE Incorrect: 0
Packet Filter: 0 Mandatory IE Missing: 0
Syntactic Error in Optional IE Incorrect: 0
Packet Filter: 0 Invalid Message Format: 0
Context Not Found: 0 Service Not Supported: 0
APN restriction No APN Subscription: 0
Incompatibility: 0 Create PDP Denied - Auth Failure Reasons:
Authentication Failed: 1
AAA Auth Req Failed: 0
APN selection-mode mismatch: 0
Non-existent virtual APN: 0
Reject Foreign Subscriber: 0
IMS Authorization Fail: 0
Total Disconnects: 1
2 Take a few samples of the command show session disconnect-reasons. Compare
counter values to see which ones increased the most. In this case it is "user authentica-tion failiure".
Disconnect Reason Num Disc Percentage
----------------------------------------------------- ---------- ----------
gtp-user-auth-failed 1 100.00000
3 Collect "monitor subscriber next-call" data, until a session experiencing the disconnect
is caught. If information like MSISDN, IMSI or APN are available, the "mon sub" can be
narrowed by using them as a filter. In this scenario, the Radius server rejected this
subscriber.
----------------------------------------------------------------------
(Switching Trace) - New Incoming Call:
----------------------------------------------------------------------
MSID/IMSI : 450061234554321 Callid : 00004e21
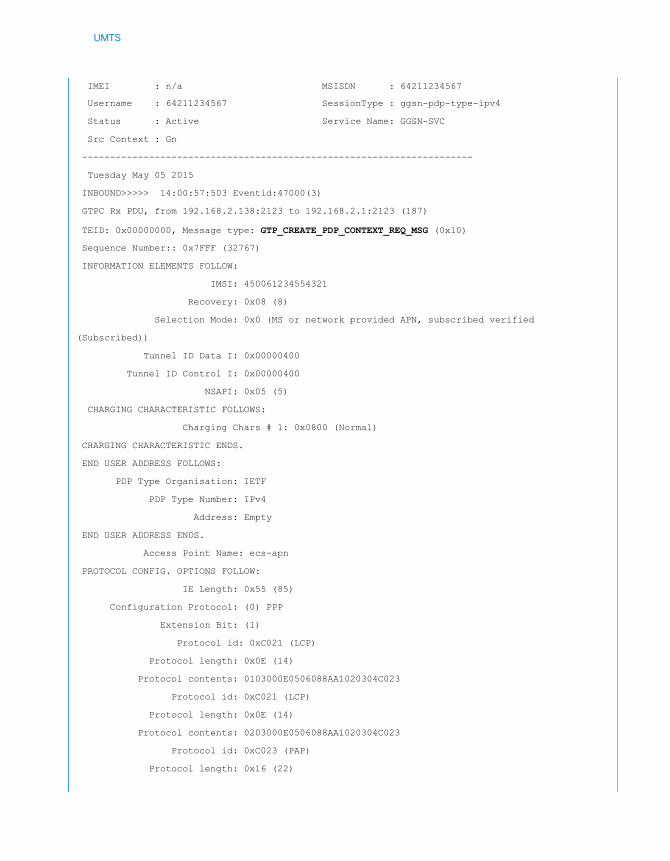
UMTS
IMEI : n/a MSISDN : 64211234567
Username : 64211234567 SessionType : ggsn-pdp-type-ipv4
Status : Active Service Name: GGSN-SVC
Src Context : Gn
----------------------------------------------------------------------
Tuesday May 05 2015
INBOUND>>>>> 14:00:57:503 Eventid:47000(3)
GTPC Rx PDU, from 192.168.2.138:2123 to 192.168.2.1:2123 (187)
TEID: 0x00000000, Message type: GTP_CREATE_PDP_CONTEXT_REQ_MSG (0x10)
Sequence Number:: 0x7FFF (32767)
INFORMATION ELEMENTS FOLLOW:
IMSI: 450061234554321
Recovery: 0x08 (8)
Selection Mode: 0x0 (MS or network provided APN, subscribed verified
(Subscribed))
Tunnel ID Data I: 0x00000400
Tunnel ID Control I: 0x00000400
NSAPI: 0x05 (5)
CHARGING CHARACTERISTIC FOLLOWS:
Charging Chars # 1: 0x0800 (Normal)
CHARGING CHARACTERISTIC ENDS.
END USER ADDRESS FOLLOWS:
PDP Type Organisation: IETF
PDP Type Number: IPv4
Address: Empty
END USER ADDRESS ENDS.
Access Point Name: ecs-apn
PROTOCOL CONFIG. OPTIONS FOLLOW:
IE Length: 0x55 (85)
Configuration Protocol: (0) PPP
Extension Bit: (1)
Protocol id: 0xC021 (LCP)
Protocol length: 0x0E (14)
Protocol contents: 0103000E0506088AA1020304C023
Protocol id: 0xC021 (LCP)
Protocol length: 0x0E (14)
Protocol contents: 0203000E0506088AA1020304C023
Protocol id: 0xC023 (PAP)
Protocol length: 0x16 (22)
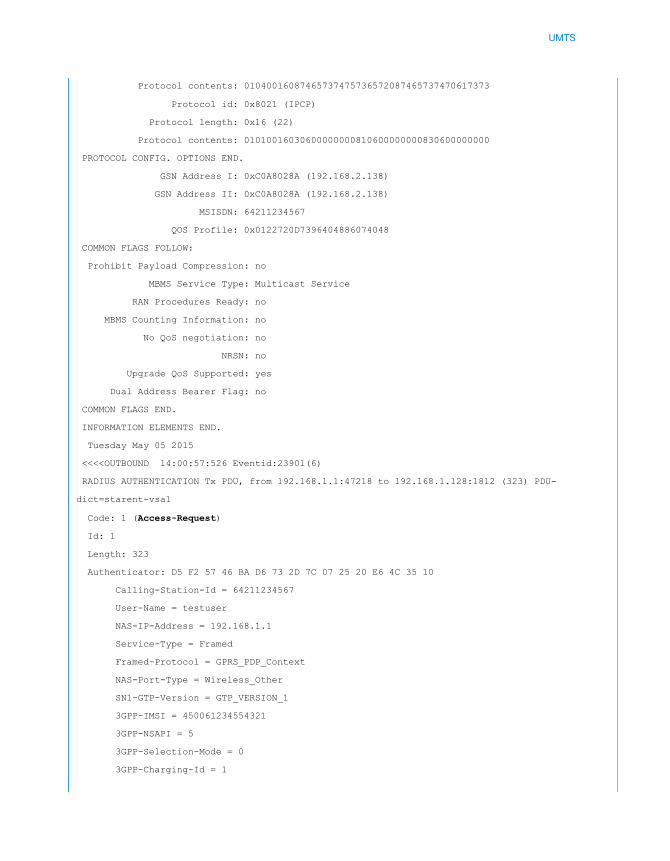
UMTS
Protocol contents: 01040016087465737475736572087465737470617373
Protocol id: 0x8021 (IPCP)
Protocol length: 0x16 (22)
Protocol contents: 01010016030600000000810600000000830600000000
PROTOCOL CONFIG. OPTIONS END.
GSN Address I: 0xC0A8028A (192.168.2.138)
GSN Address II: 0xC0A8028A (192.168.2.138)
MSISDN: 64211234567
QOS Profile: 0x0122720D7396404886074048
COMMON FLAGS FOLLOW:
Prohibit Payload Compression: no
MBMS Service Type: Multicast Service
RAN Procedures Ready: no
MBMS Counting Information: no
No QoS negotiation: no
NRSN: no
Upgrade QoS Supported: yes
Dual Address Bearer Flag: no
COMMON FLAGS END.
INFORMATION ELEMENTS END.
Tuesday May 05 2015
<<<<OUTBOUND 14:00:57:526 Eventid:23901(6)
RADIUS AUTHENTICATION Tx PDU, from 192.168.1.1:47218 to 192.168.1.128:1812 (323) PDU-
dict=starent-vsa1
Code: 1 (Access-Request)
Id: 1
Length: 323
Authenticator: D5 F2 57 46 BA D6 73 2D 7C 07 25 20 E6 4C 35 10
Calling-Station-Id = 64211234567
User-Name = testuser
NAS-IP-Address = 192.168.1.1
Service-Type = Framed
Framed-Protocol = GPRS_PDP_Context
NAS-Port-Type = Wireless_Other
SN1-GTP-Version = GTP_VERSION_1
3GPP-IMSI = 450061234554321
3GPP-NSAPI = 5
3GPP-Selection-Mode = 0
3GPP-Charging-Id = 1
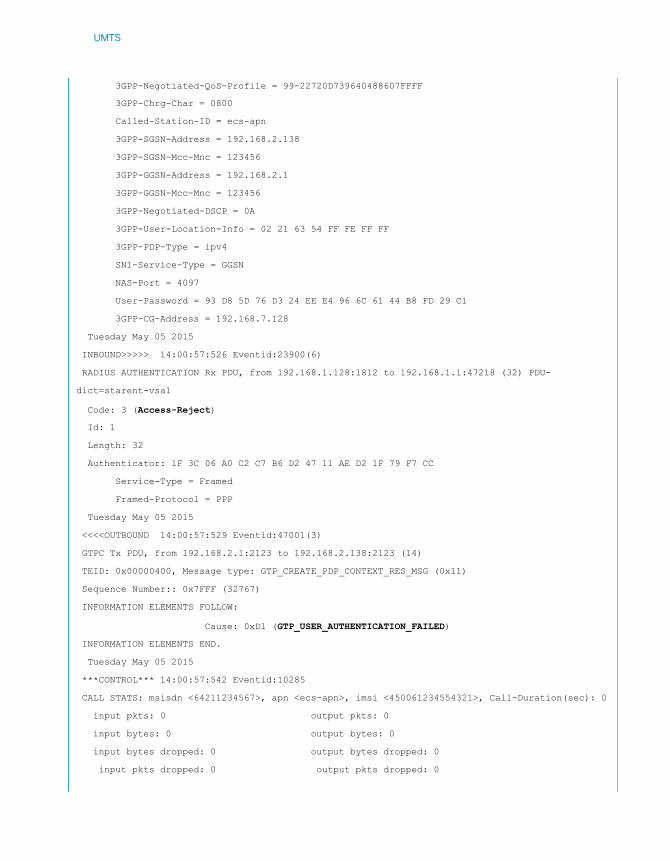
UMTS
3GPP-Negotiated-QoS-Profile = 99-22720D739640488607FFFF
3GPP-Chrg-Char = 0800
Called-Station-ID = ecs-apn
3GPP-SGSN-Address = 192.168.2.138
3GPP-SGSN-Mcc-Mnc = 123456
3GPP-GGSN-Address = 192.168.2.1
3GPP-GGSN-Mcc-Mnc = 123456
3GPP-Negotiated-DSCP = 0A
3GPP-User-Location-Info = 02 21 63 54 FF FE FF FF
3GPP-PDP-Type = ipv4
SN1-Service-Type = GGSN
NAS-Port = 4097
User-Password = 93 D8 5D 76 D3 24 EE E4 96 6C 61 44 B8 FD 29 C1
3GPP-CG-Address = 192.168.7.128
Tuesday May 05 2015
INBOUND>>>>> 14:00:57:526 Eventid:23900(6)
RADIUS AUTHENTICATION Rx PDU, from 192.168.1.128:1812 to 192.168.1.1:47218 (32) PDU-
dict=starent-vsa1
Code: 3 (Access-Reject)
Id: 1
Length: 32
Authenticator: 1F 3C 06 A0 C2 C7 B6 D2 47 11 AE D2 1F 79 F7 CC
Service-Type = Framed
Framed-Protocol = PPP
Tuesday May 05 2015
<<<<OUTBOUND 14:00:57:529 Eventid:47001(3)
GTPC Tx PDU, from 192.168.2.1:2123 to 192.168.2.138:2123 (14)
TEID: 0x00000400, Message type: GTP_CREATE_PDP_CONTEXT_RES_MSG (0x11)
Sequence Number:: 0x7FFF (32767)
INFORMATION ELEMENTS FOLLOW:
Cause: 0xD1 (GTP_USER_AUTHENTICATION_FAILED)
INFORMATION ELEMENTS END.
Tuesday May 05 2015
***CONTROL*** 14:00:57:542 Eventid:10285
CALL STATS: msisdn <64211234567>, apn <ecs-apn>, imsi <450061234554321>, Call-Duration(sec): 0
input pkts: 0 output pkts: 0
input bytes: 0 output bytes: 0
input bytes dropped: 0 output bytes dropped: 0
input pkts dropped: 0 output pkts dropped: 0

UMTS
dlnk pkts exceeded bw: 0 dlnk pkts violated bw: 0
uplnk pkts exceeded bw: 0 uplnk pkts violated bw: 0
Disconnect Reason: gtp-user-auth-failed
Last Progress State: Authenticating
Resolution :
Check the Radius server for the subscriber getting rejected, and confirm whether the sub-scriber is allowed to connect to the network.
GGSN Rejecting PDP with cause ims-authorization-failed
Problem Description:
Mobile operator reports that subscribers for a specific APN can not establish PDP context con-nections.
Data Collection:
• Collect multiple SSDs
• Collect external PCAP
• Collect sample "monitor subscriber" traces at verbosity 2 showing the error behavior
• Collect syslog
CLI used to troubleshoot the issue:
• show gtpc statistics verbose
• show session disconnect-reasons
• monitor subscriber
• show ims-auth policy-control statsistics
• show task resources | grep -v good
• show diameter peers full all | grep -i state
• show port datalink counters
• show snmp traps history verbose

UMTS
Troubleshooting steps:
Verify the configuration for the APN.
Verify all the neccessary interfaces associated for the APN are working.
Verify if any interfaces or ports are down using SNMP traps, or "show alarm outstanding" out-puts.
Verify any packet drops observed in the network or in the GGSN using NPU commands. Refer HW troubleshooting section
Verify latency in the network between GGSN and other connected network elements.
Image - Call Flow for ims-authorization-failed
Analysis:
1 GGSN is receving the CPC request from the SGSN and GGSN is sending CPC reponse
with GTP_Authentication_failed. The end of the monitor subscriber trace shows the
call is failed due to " Disconnect Reason: ims-authorization-failed".
----------------------------------------------------------------------
Incoming Call:
----------------------------------------------------------------------

UMTS
MSID/IMSI : 123456000000002 Callid : 000062af
IMEI : n/a MSISDN : 9876543210
Username : 9876543210 SessionType : ggsn-pdp-type-ipv4
Status : Active Service Name: ggsn
Src Context : spgw
----------------------------------------------------------------------
Wednesday May 06 2015
GTPC Rx PDU, from 10.201.251.5:2123 to 192.168.5.52:2123 (157)
TEID: 0x00000000, Message type: GTP_CREATE_PDP_CONTEXT_REQ_MSG (0x10)
Sequence Number:: 0x7FFF (32767)
GTP HEADER FOLLOWS:
Version number: 1
Protocol type: 1 (GTP C/U)
Extended header flag: Not present
Sequence number flag: Present
NPDU number flag: Not present
Message Type: 0x10 (GTP_CREATE_PDP_CONTEXT_REQ_MSG)
Message Length: 0x0095 (149)
Tunnel ID: 0x00000000
Sequence Number: 0x7FFF (32767)
GTP HEADER ENDS.
INFORMATION ELEMENTS FOLLOW:
IMSI: 123456000000002
Recovery: 0xE3 (227)
Selection Mode: 0x1 (MS provided APN, subscription not verified (Sent by MS))
Tunnel ID Data I: 0x00000400
Tunnel ID Control I: 0x00000400
NSAPI: 0x05 (5)
CHARGING CHARACTERISTIC FOLLOWS:
Charging Chars # 1: 0x0800 (Normal)
CHARGING CHARACTERISTIC ENDS.
END USER ADDRESS FOLLOWS:
PDP Type Organisation: IETF
PDP Type Number: IPv4
Address: Empty
END USER ADDRESS ENDS.
Access Point Name: cisco.com
PROTOCOL CONFIG. OPTIONS FOLLOW:

UMTS
IE Length: 0x36 (54)
Configuration Protocol: (0) PPP
Extension Bit: (1)
Protocol id: 0xC021 (LCP)
Protocol length: 0x0E (14)
PROTOCOL-1 CONTENTS FOLLOW:
Conf-Req(3), Magic-Num=088aa102, Auth-Prot PAP
PROTOCOL-1 CONTENTS END.
Protocol id: 0xC021 (LCP)
Protocol length: 0x0E (14)
PROTOCOL-2 CONTENTS FOLLOW:
Conf-Ack(3), Magic-Num=088aa102, Auth-Prot PAP
PROTOCOL-2 CONTENTS END.
Protocol id: 0xC023 (PAP)
Protocol length: 0x10 (16)
PROTOCOL-3 CONTENTS FOLLOW:
Auth-Req(4), Name=test, Passwd=secret
PROTOCOL-3 CONTENTS END.
PROTOCOL CONFIG. OPTIONS END.
GSN Address I: 0x0AC9FB05 (10.201.251.5)
GSN Address II: 0x0AC9FB05 (10.201.251.5)
MSISDN FOLLOWS:
Nature of address: 1 (International number)
Numbering Plan: 1 (ISDN/Telephone numbering plan (E.164))
Address: 9876543210
MSISDN ENDS.
QOS PROFILE FOLLOWS (Length = 12)
Alloc./Retention priority: 0x01 (1)
Spare Octet1: 0x0 (0)
QOS PROFILE ENDS.
COMMON FLAGS FOLLOW:
Prohibit Payload Compression: no
MBMS Service Type: Multicast Service
RAN Procedures Ready: no
MBMS Counting Information: no
No QoS negotiation: no
NRSN: no
Upgrade QoS Supported: yes
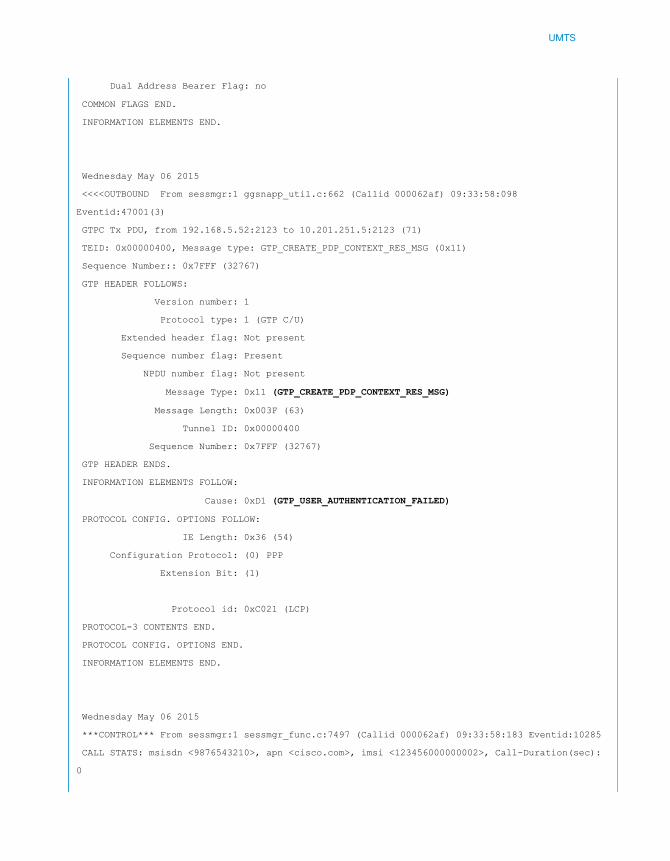
UMTS
Dual Address Bearer Flag: no
COMMON FLAGS END.
INFORMATION ELEMENTS END.
Wednesday May 06 2015
<<<<OUTBOUND From sessmgr:1 ggsnapp_util.c:662 (Callid 000062af) 09:33:58:098
Eventid:47001(3)
GTPC Tx PDU, from 192.168.5.52:2123 to 10.201.251.5:2123 (71)
TEID: 0x00000400, Message type: GTP_CREATE_PDP_CONTEXT_RES_MSG (0x11)
Sequence Number:: 0x7FFF (32767)
GTP HEADER FOLLOWS:
Version number: 1
Protocol type: 1 (GTP C/U)
Extended header flag: Not present
Sequence number flag: Present
NPDU number flag: Not present
Message Type: 0x11 (GTP_CREATE_PDP_CONTEXT_RES_MSG)
Message Length: 0x003F (63)
Tunnel ID: 0x00000400
Sequence Number: 0x7FFF (32767)
GTP HEADER ENDS.
INFORMATION ELEMENTS FOLLOW:
Cause: 0xD1 (GTP_USER_AUTHENTICATION_FAILED)
PROTOCOL CONFIG. OPTIONS FOLLOW:
IE Length: 0x36 (54)
Configuration Protocol: (0) PPP
Extension Bit: (1)
Protocol id: 0xC021 (LCP)
PROTOCOL-3 CONTENTS END.
PROTOCOL CONFIG. OPTIONS END.
INFORMATION ELEMENTS END.
Wednesday May 06 2015
***CONTROL*** From sessmgr:1 sessmgr_func.c:7497 (Callid 000062af) 09:33:58:183 Eventid:10285
CALL STATS: msisdn <9876543210>, apn <cisco.com>, imsi <123456000000002>, Call-Duration(sec):
0

UMTS
input pkts: 0 output pkts: 0
input bytes: 0 output bytes: 0
input bytes dropped: 0 output bytes dropped: 0
dlnk pkts exceeded bw: 0 dlnk pkts violated bw: 0
uplnk pkts exceeded bw: 0 uplnk pkts violated bw: 0
Disconnect Reason: ims-authorization-failed
Last Progress State: Authenticating
2 From the packet trace / monitor subscriber it was found that the Gx CCR-I was not
leaving the GGSN. However, the Diameter interface status and peer
Diameter status looked good .
3 When Gx IMS auth service was removed, the calls started working.
4 While verifying the configuration for the APN it was found that "IP access group
<SERVICE>" was wrong, hence it was not redirecting the Gx CCR trigger towards PCRF.
This caused the call to fail internally.
show diameter peers full all | grep -i state
State: OPEN [TCP]
State: OPEN [TCP]
show gtpc statistics verbose
Tunnel Management Messages:
Total CPC Req: 2
CPC Req(V1): 2 CPC Req(V0): 0
Primary CPC Req: 2 Secondary CPC Req: 0
Initial CPC Req: 2 Retransmitted: 0
Total Accepted: 0 Total Denied: 2
Total Discarded: 0
Create PDP Denied - Auth Failure Reasons:
Authentication Failed: 0
AAA Auth Req Failed: 0
Reject Foreign Subscriber: 0
IMS Authorization Fail: 2
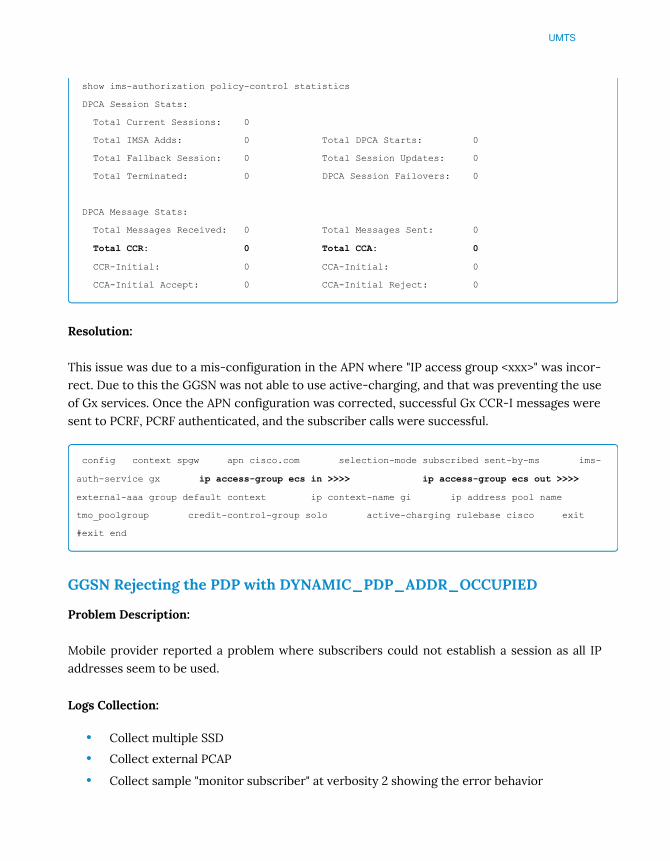
UMTS
show ims-authorization policy-control statistics
DPCA Session Stats:
Total Current Sessions: 0
Total IMSA Adds: 0 Total DPCA Starts: 0
Total Fallback Session: 0 Total Session Updates: 0
Total Terminated: 0 DPCA Session Failovers: 0
DPCA Message Stats:
Total Messages Received: 0 Total Messages Sent: 0
Total CCR: 0 Total CCA: 0
CCR-Initial: 0 CCA-Initial: 0
CCA-Initial Accept: 0 CCA-Initial Reject: 0
Resolution:
This issue was due to a mis-configuration in the APN where "IP access group <xxx>" was incor-rect. Due to this the GGSN was not able to use active-charging, and that was preventing the useof Gx services. Once the APN configuration was corrected, successful Gx CCR-I messages weresent to PCRF, PCRF authenticated, and the subscriber calls were successful.
config context spgw apn cisco.com selection-mode subscribed sent-by-ms ims-
auth-service gx ip access-group ecs in >>>> ip access-group ecs out >>>>
external-aaa group default context ip context-name gi ip address pool name
tmo_poolgroup credit-control-group solo active-charging rulebase cisco exit
#exit end
GGSN Rejecting the PDP with DYNAMIC_PDP_ADDR_OCCUPIED
Problem Description:
Mobile provider reported a problem where subscribers could not establish a session as all IPaddresses seem to be used.
Logs Collection:
• Collect multiple SSD
• Collect external PCAP
• Collect sample "monitor subscriber" at verbosity 2 showing the error behavior

UMTS
• Collect syslog
CLI used to troubleshoot the issue:
• show gtpc statistics verbose
• show session disconnect-reasons
• monitor subscriber
• show ims-auth policy-control statsistics
• show task resources | grep -v good
• show diameter peers full all | grep -i state
• show port datalink counters
• show snmp traps history verbose
Troubleshooting steps:
Verify the configuration for the APN.
Verify all the necessary interfaces associated for the APN are working
Verify if any interfaces or ports are down using SNMP traps, or "show alarm outstanding" out-put.
Verify any packet drops observed in the network or in the GGSN using NPU commands. Refer HW troubleshooting section
Verify latency in the network between GGSN and other connected network elements.
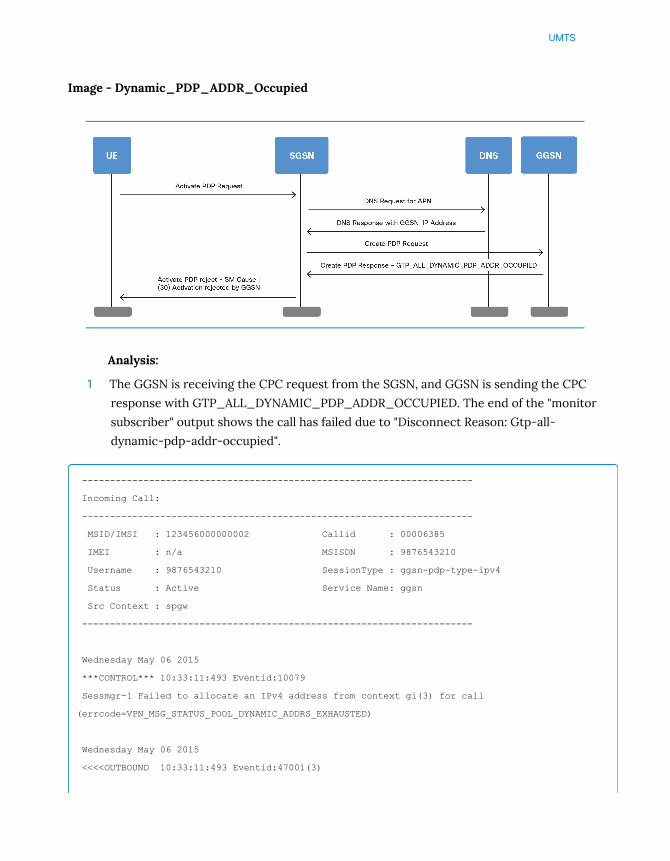
UMTS
Image - Dynamic_PDP_ADDR_Occupied
Analysis:
1 The GGSN is receiving the CPC request from the SGSN, and GGSN is sending the CPC
response with GTP_ALL_DYNAMIC_PDP_ADDR_OCCUPIED. The end of the "monitor
subscriber" output shows the call has failed due to "Disconnect Reason: Gtp-all-
dynamic-pdp-addr-occupied".
----------------------------------------------------------------------
Incoming Call:
----------------------------------------------------------------------
MSID/IMSI : 123456000000002 Callid : 00006385
IMEI : n/a MSISDN : 9876543210
Username : 9876543210 SessionType : ggsn-pdp-type-ipv4
Status : Active Service Name: ggsn
Src Context : spgw
----------------------------------------------------------------------
Wednesday May 06 2015
***CONTROL*** 10:33:11:493 Eventid:10079
Sessmgr-1 Failed to allocate an IPv4 address from context gi(3) for call
(errcode=VPN_MSG_STATUS_POOL_DYNAMIC_ADDRS_EXHAUSTED)
Wednesday May 06 2015
<<<<OUTBOUND 10:33:11:493 Eventid:47001(3)
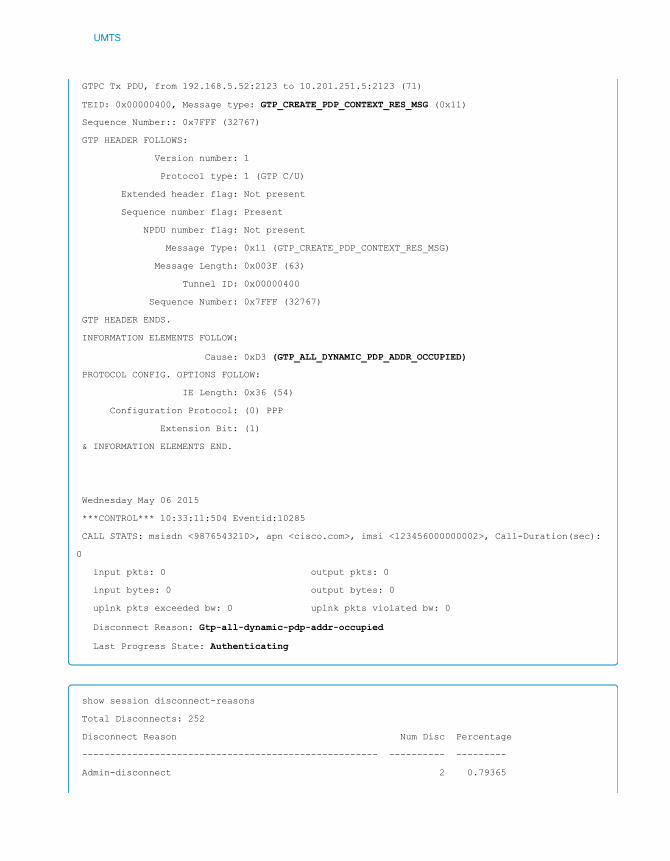
UMTS
GTPC Tx PDU, from 192.168.5.52:2123 to 10.201.251.5:2123 (71)
TEID: 0x00000400, Message type: GTP_CREATE_PDP_CONTEXT_RES_MSG (0x11)
Sequence Number:: 0x7FFF (32767)
GTP HEADER FOLLOWS:
Version number: 1
Protocol type: 1 (GTP C/U)
Extended header flag: Not present
Sequence number flag: Present
NPDU number flag: Not present
Message Type: 0x11 (GTP_CREATE_PDP_CONTEXT_RES_MSG)
Message Length: 0x003F (63)
Tunnel ID: 0x00000400
Sequence Number: 0x7FFF (32767)
GTP HEADER ENDS.
INFORMATION ELEMENTS FOLLOW:
Cause: 0xD3 (GTP_ALL_DYNAMIC_PDP_ADDR_OCCUPIED)
PROTOCOL CONFIG. OPTIONS FOLLOW:
IE Length: 0x36 (54)
Configuration Protocol: (0) PPP
Extension Bit: (1)
& INFORMATION ELEMENTS END.
Wednesday May 06 2015
***CONTROL*** 10:33:11:504 Eventid:10285
CALL STATS: msisdn <9876543210>, apn <cisco.com>, imsi <123456000000002>, Call-Duration(sec):
0
input pkts: 0 output pkts: 0
input bytes: 0 output bytes: 0
uplnk pkts exceeded bw: 0 uplnk pkts violated bw: 0
Disconnect Reason: Gtp-all-dynamic-pdp-addr-occupied
Last Progress State: Authenticating
show session disconnect-reasons
Total Disconnects: 252
Disconnect Reason Num Disc Percentage
----------------------------------------------------- ---------- ---------
Admin-disconnect 2 0.79365

UMTS
path-failure 54 21.42857
Gtp-all-dynamic-pdp-addr-occupied 188 74.60317
ims-authorization-failed 2 0.79365
Gtp-context-replacement 6 2.38095
show gtpc statistics verbose
Tunnel Management Messages:
Total CPC Req: 256
CPC Req(V1): 256 CPC Req(V0): 0
Primary CPC Req: 227 Secondary CPC Req: 29
Initial CPC Req: 256 Retransmitted: 0
Total Accepted: 66 Total Denied: 1
Dynamic Address Allocation:
IPv4 Attempt: 227 Successful: 37
IPv6 Attempt: 0 Successful: 0
Create PDP Denied - Dynamic Address Occupied:
DHCP No IP Address Alloc: 0
DHCP Timer Notification: 0
Local IP Validation Failed: 0
Local IP Pool All Address Occupied: 188
[gi]SPGW-1# show ip pool sum
context gi:
+-----Type: (P) - Public (R) - Private (N) - NAT
| (S) - Static (E) - Resource (O) - One-to-One NAT
| (M) - Many-to-One NAT
|
|+----State: (G) - Good (D) - Pending Delete (R)-Resizing
|| (I) - Inactive
||
||++--Priority: 0..10 (Highest (0) .. Lowest (10))
||||
||||+-Busyout: (B) - Busyout configured
|||||
|||||
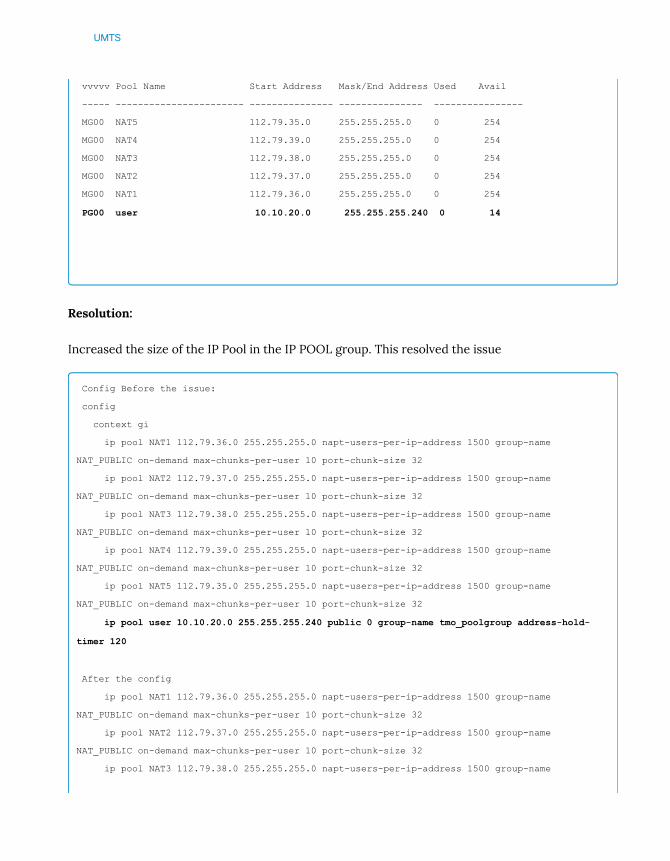
UMTS
vvvvv Pool Name Start Address Mask/End Address Used Avail
----- ----------------------- --------------- --------------- ----------------
MG00 NAT5 112.79.35.0 255.255.255.0 0 254
MG00 NAT4 112.79.39.0 255.255.255.0 0 254
MG00 NAT3 112.79.38.0 255.255.255.0 0 254
MG00 NAT2 112.79.37.0 255.255.255.0 0 254
MG00 NAT1 112.79.36.0 255.255.255.0 0 254
PG00 user 10.10.20.0 255.255.255.240 0 14
Resolution:
Increased the size of the IP Pool in the IP POOL group. This resolved the issue
Config Before the issue:
config
context gi
ip pool NAT1 112.79.36.0 255.255.255.0 napt-users-per-ip-address 1500 group-name
NAT_PUBLIC on-demand max-chunks-per-user 10 port-chunk-size 32
ip pool NAT2 112.79.37.0 255.255.255.0 napt-users-per-ip-address 1500 group-name
NAT_PUBLIC on-demand max-chunks-per-user 10 port-chunk-size 32
ip pool NAT3 112.79.38.0 255.255.255.0 napt-users-per-ip-address 1500 group-name
NAT_PUBLIC on-demand max-chunks-per-user 10 port-chunk-size 32
ip pool NAT4 112.79.39.0 255.255.255.0 napt-users-per-ip-address 1500 group-name
NAT_PUBLIC on-demand max-chunks-per-user 10 port-chunk-size 32
ip pool NAT5 112.79.35.0 255.255.255.0 napt-users-per-ip-address 1500 group-name
NAT_PUBLIC on-demand max-chunks-per-user 10 port-chunk-size 32
ip pool user 10.10.20.0 255.255.255.240 public 0 group-name tmo_poolgroup address-hold-
timer 120
After the config
ip pool NAT1 112.79.36.0 255.255.255.0 napt-users-per-ip-address 1500 group-name
NAT_PUBLIC on-demand max-chunks-per-user 10 port-chunk-size 32
ip pool NAT2 112.79.37.0 255.255.255.0 napt-users-per-ip-address 1500 group-name
NAT_PUBLIC on-demand max-chunks-per-user 10 port-chunk-size 32
ip pool NAT3 112.79.38.0 255.255.255.0 napt-users-per-ip-address 1500 group-name

UMTS
NAT_PUBLIC on-demand max-chunks-per-user 10 port-chunk-size 32
ip pool NAT4 112.79.39.0 255.255.255.0 napt-users-per-ip-address 1500 group-name
NAT_PUBLIC on-demand max-chunks-per-user 10 port-chunk-size 32
ip pool NAT5 112.79.35.0 255.255.255.0 napt-users-per-ip-address 1500 group-name
NAT_PUBLIC on-demand max-chunks-per-user 10 port-chunk-size 32
ip pool user 10.10.20.0 255.255.255.240 public 0 group-name user_poolgroup address-hold-
timer 120
ip pool user1 10.10.30.0 255.255.255.240 public 0 group-name user_poolgroup address-hold-
timer 120 >>>Newly added pool
ipv6 pool tmo1 prefix 2600:100c:100::/56 public 0 group-name tmo_poolgroup
GGSN Rejecting the PDP with No Resources
Problem Observed:
Subscriber cannot establish PDP session.
Logs Collection:
Collect multiple SSD
Collect external PCAP
Collect sample "monitor subscriber" at verbosity 2 showing the error behavior
Collect syslog
CLI used to troubleshoot the issue:
• show gtpc statistics verbose
• show session disconnect-reasons
• monitor subscriber imsi [value]
• show task resources | grep -v good
• show diameter peers full all | grep -i state
• show port datalink counters
• show snmp traps history verbose

UMTS
Troubleshooting steps:
Verify the configuration for the APN.
Verify all the necessary interfaces associated for the APN are working.
Verify if any interfaces or ports are down using SNMP traps or show outstanding alarm outputs.
Verify any packet drops observed in the network or in the GGSN using NPU commands. [ReferHW troubleshooting section.]
Verify latency in the network between GGSN and Other connected network elements.
Image - GGSN No Resources
Statistsics:
Analysis:
1 The GGSN is receiving the CPC request from the SGSN and GGSN is not sending CPC to
SGSN. Within the GGSN system it was found that an internal task, sessmgr, was not
started, hence calls were not handled in GGSN.
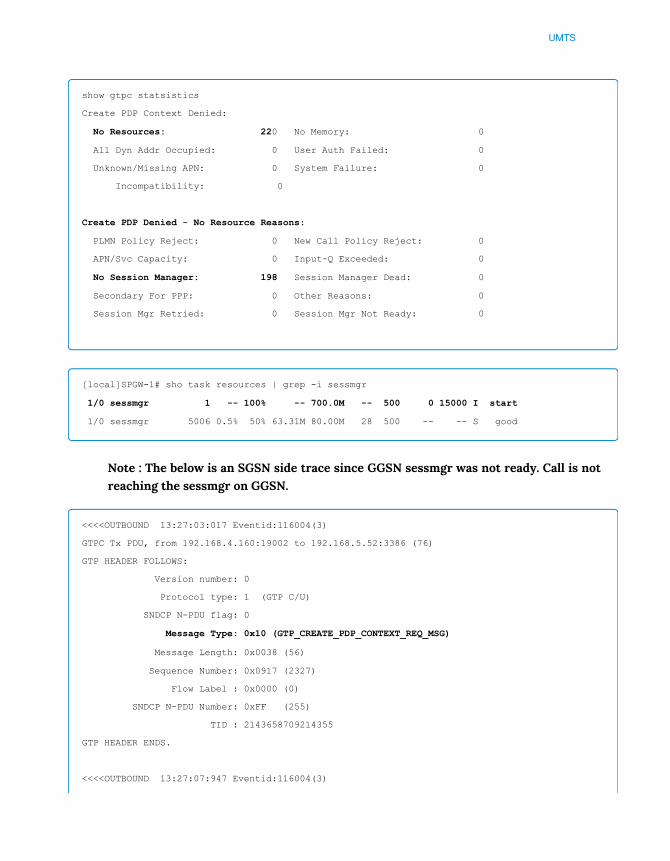
UMTS
show gtpc statsistics
Create PDP Context Denied:
No Resources: 220 No Memory: 0
All Dyn Addr Occupied: 0 User Auth Failed: 0
Unknown/Missing APN: 0 System Failure: 0
Incompatibility: 0
Create PDP Denied - No Resource Reasons:
PLMN Policy Reject: 0 New Call Policy Reject: 0
APN/Svc Capacity: 0 Input-Q Exceeded: 0
No Session Manager: 198 Session Manager Dead: 0
Secondary For PPP: 0 Other Reasons: 0
Session Mgr Retried: 0 Session Mgr Not Ready: 0
[local]SPGW-1# sho task resources | grep -i sessmgr
1/0 sessmgr 1 -- 100% -- 700.0M -- 500 0 15000 I start
1/0 sessmgr 5006 0.5% 50% 63.31M 80.00M 28 500 -- -- S good
Note : The below is an SGSN side trace since GGSN sessmgr was not ready. Call is notreaching the sessmgr on GGSN.
<<<<OUTBOUND 13:27:03:017 Eventid:116004(3)
GTPC Tx PDU, from 192.168.4.160:19002 to 192.168.5.52:3386 (76)
GTP HEADER FOLLOWS:
Version number: 0
Protocol type: 1 (GTP C/U)
SNDCP N-PDU flag: 0
Message Type: 0x10 (GTP_CREATE_PDP_CONTEXT_REQ_MSG)
Message Length: 0x0038 (56)
Sequence Number: 0x0917 (2327)
Flow Label : 0x0000 (0)
SNDCP N-PDU Number: 0xFF (255)
TID : 2143658709214355
GTP HEADER ENDS.
<<<<OUTBOUND 13:27:07:947 Eventid:116004(3)
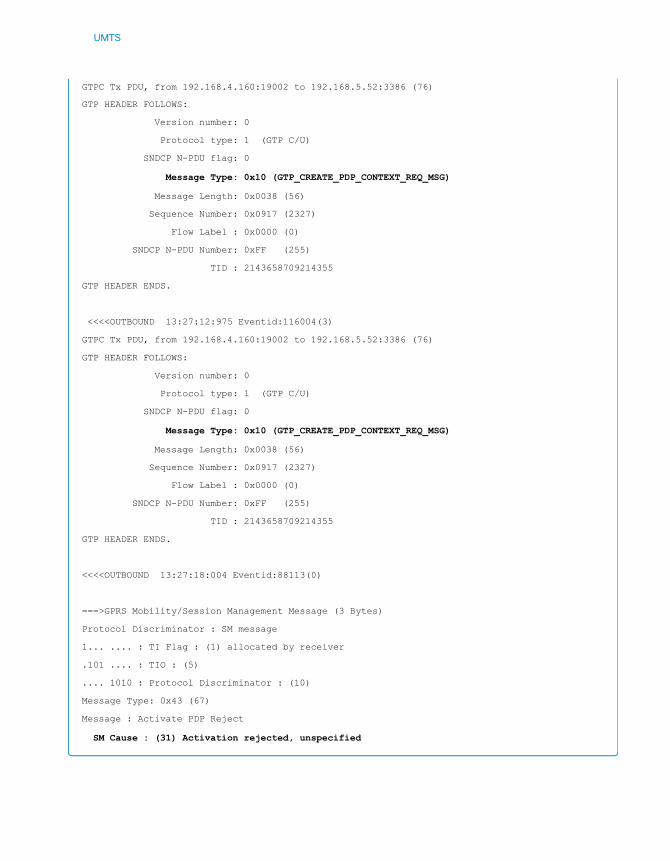
UMTS
GTPC Tx PDU, from 192.168.4.160:19002 to 192.168.5.52:3386 (76)
GTP HEADER FOLLOWS:
Version number: 0
Protocol type: 1 (GTP C/U)
SNDCP N-PDU flag: 0
Message Type: 0x10 (GTP_CREATE_PDP_CONTEXT_REQ_MSG)
Message Length: 0x0038 (56)
Sequence Number: 0x0917 (2327)
Flow Label : 0x0000 (0)
SNDCP N-PDU Number: 0xFF (255)
TID : 2143658709214355
GTP HEADER ENDS.
<<<<OUTBOUND 13:27:12:975 Eventid:116004(3)
GTPC Tx PDU, from 192.168.4.160:19002 to 192.168.5.52:3386 (76)
GTP HEADER FOLLOWS:
Version number: 0
Protocol type: 1 (GTP C/U)
SNDCP N-PDU flag: 0
Message Type: 0x10 (GTP_CREATE_PDP_CONTEXT_REQ_MSG)
Message Length: 0x0038 (56)
Sequence Number: 0x0917 (2327)
Flow Label : 0x0000 (0)
SNDCP N-PDU Number: 0xFF (255)
TID : 2143658709214355
GTP HEADER ENDS.
<<<<OUTBOUND 13:27:18:004 Eventid:88113(0)
===>GPRS Mobility/Session Management Message (3 Bytes)
Protocol Discriminator : SM message
1... .... : TI Flag : (1) allocated by receiver
.101 .... : TIO : (5)
.... 1010 : Protocol Discriminator : (10)
Message Type: 0x43 (67)
Message : Activate PDP Reject
SM Cause : (31) Activation rejected, unspecified
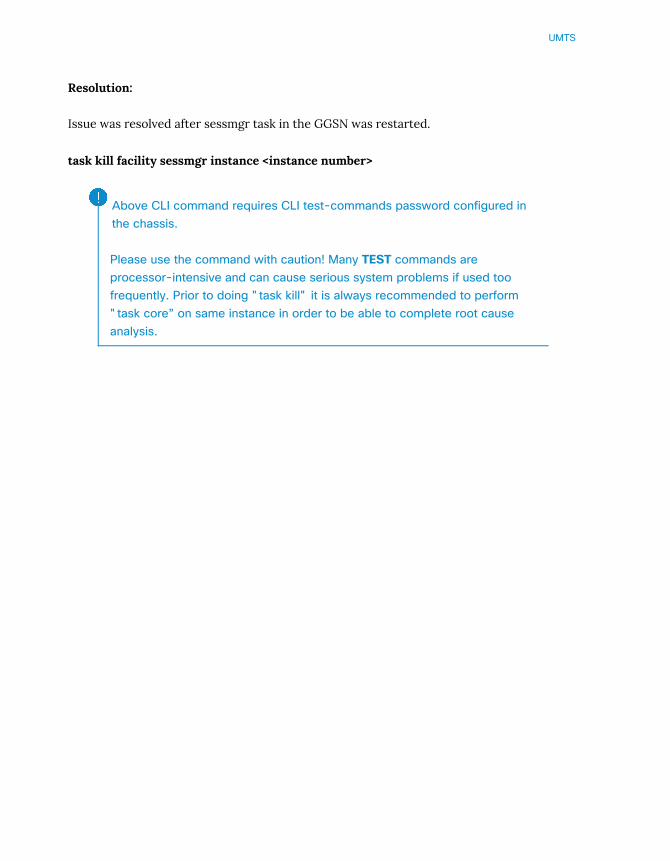
UMTS
Resolution:
Issue was resolved after sessmgr task in the GGSN was restarted.
task kill facility sessmgr instance <instance number>
Above CLI command requires CLI test-commands password configured inthe chassis.
Please use the command with caution! Many TEST commands areprocessor-intensive and can cause serious system problems if used toofrequently. Prior to doing "task kill" it is always recommended to perform"task core” on same instance in order to be able to complete root causeanalysis.


LTE

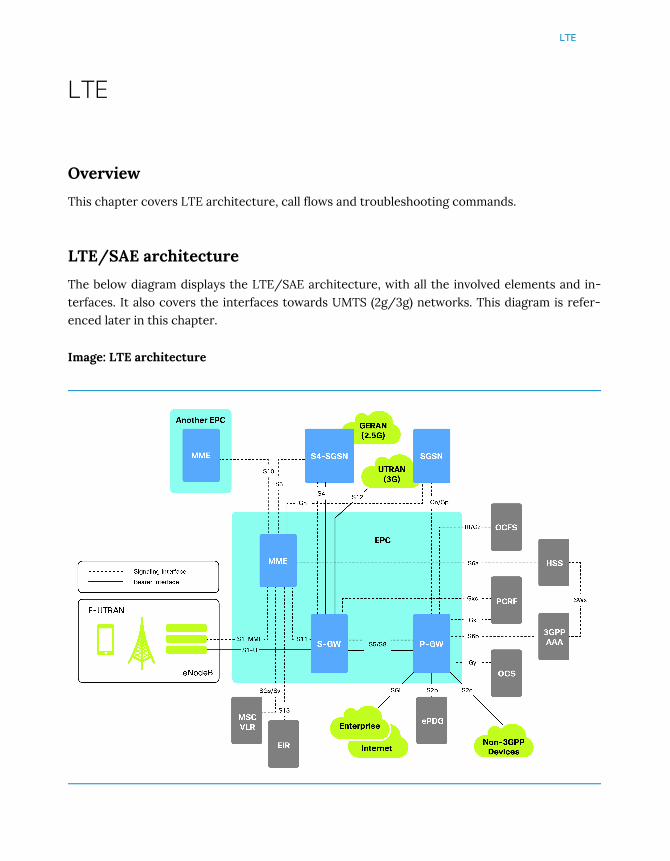
LTE
LTE
Overview
This chapter covers LTE architecture, call flows and troubleshooting commands.
LTE/SAE architecture
The below diagram displays the LTE/SAE architecture, with all the involved elements and in-terfaces. It also covers the interfaces towards UMTS (2g/3g) networks. This diagram is refer-enced later in this chapter.
Image: LTE architecture
LTE
In the sections below the focus will be on the following functionalities:
• MME: Mobility Management Entity
• SGW: Serving Gateway
• PGW: Packet Gateway
Basic LTE procedures
The following figure and the text that follows describe the message flow for a successful user-initiated subscriber attach procedure. For more information, please refer to official Cisco ASR5000 MME/SGW/PGW Administration Guides.
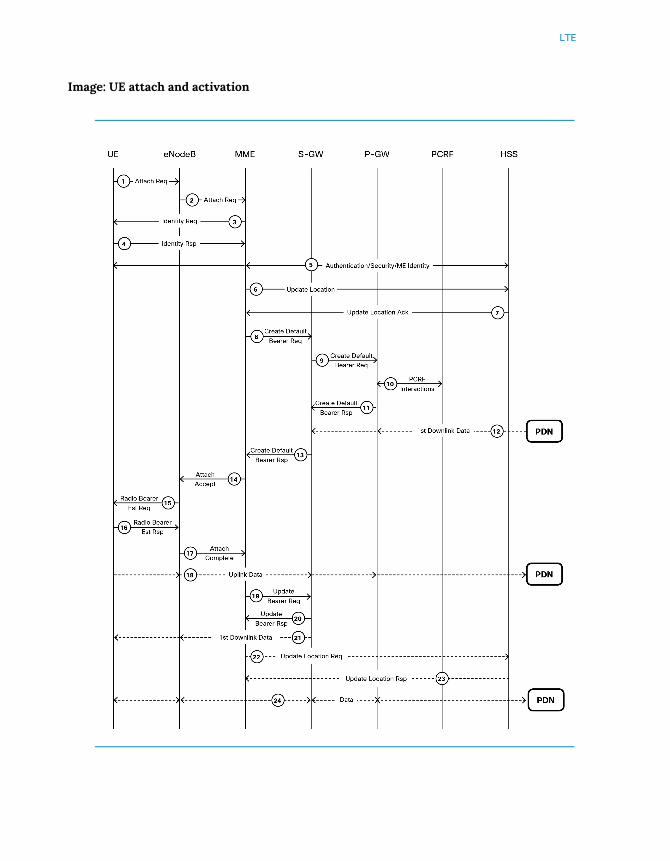
LTE
Image: UE attach and activation

LTE
1 The UE initiates the Attach procedure by the transmission of an Attach Request (IMSI or
old GUTI, last visited TAI (if available), UE Network Capability, PDN Address Allocation,
Protocol Configuration Options, Attach Type) message together with an indication of
the Selected Network to the EnodeB. IMSI is included if the UE does not have a valid
GUTI available. If the UE has a valid GUTI, it is included.
2 The EnodeB derives the MME from the GUTI and from the indicated Selected Network.
If that MME is not associated with the EnodeB, the EnodeB selects an MME using an
“MME selection function”. The EnodeB forwards the Attach Request message to the
new MME contained in a S1-MME control message (Initial UE message) together with
the Selected Network and an indication of the E-UTRAN Area identity, a globally unique
E-UTRAN ID of the cell from where it received the message to the new MME.
3 If the UE is unknown in the MME, the MME sends an Identity Request to the UE to
request the IMSI.
4 The UE responds with Identity Response (IMSI).
5 If no UE context for the UE exists anywhere in the network, authentication is
mandatory. Otherwise this step is optional. However, at least integrity checking is
started and the ME Identity is retrieved from the UE at Initial Attach. The
authentication functions, if performed at this step, involve AKA authentication and
establishment of a NAS level security association with the UE in order to protect further
NAS protocol messages.
6 The MME sends an Update Location Request (MME Identity, IMSI, ME Identity) to the
HSS.
7 The HSS acknowledges the Update Location message by sending an Update Location
Ack to the MME. This message also contains the Insert Subscriber Data (IMSI,
Subscription Data) Request. The Subscription Data contains the list of all APNs that the
UE is permitted to access, an indication about which of those APNs is the Default APN,
and the 'EPS subscribed QoS profile' for each permitted APN. If the Update Location is
rejected by the HSS, the MME rejects the Attach Request from the UE with an
appropriate cause.
8 The MME selects an S-GW using “Serving GW selection function” and allocates an EPS
Bearer Identity for the Default Bearer associated with the UE. If the PDN subscription
context contains no P-GW address the MME selects a P-GW as described in clause
“PDN GW selection function”. Then it sends a Create Default Bearer Request (IMSI,
MME Context ID, APN, RAT type, Default Bearer QoS, PDN Address Allocation, AMBR,
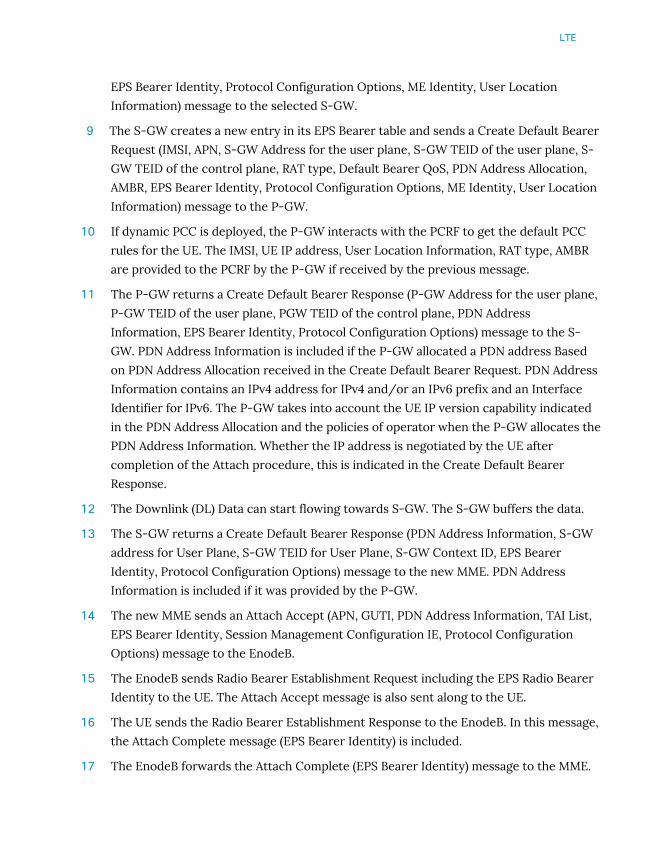
LTE
EPS Bearer Identity, Protocol Configuration Options, ME Identity, User Location
Information) message to the selected S-GW.
9 The S-GW creates a new entry in its EPS Bearer table and sends a Create Default Bearer
Request (IMSI, APN, S-GW Address for the user plane, S-GW TEID of the user plane, S-
GW TEID of the control plane, RAT type, Default Bearer QoS, PDN Address Allocation,
AMBR, EPS Bearer Identity, Protocol Configuration Options, ME Identity, User Location
Information) message to the P-GW.
10 If dynamic PCC is deployed, the P-GW interacts with the PCRF to get the default PCC
rules for the UE. The IMSI, UE IP address, User Location Information, RAT type, AMBR
are provided to the PCRF by the P-GW if received by the previous message.
11 The P-GW returns a Create Default Bearer Response (P-GW Address for the user plane,
P-GW TEID of the user plane, PGW TEID of the control plane, PDN Address
Information, EPS Bearer Identity, Protocol Configuration Options) message to the S-
GW. PDN Address Information is included if the P-GW allocated a PDN address Based
on PDN Address Allocation received in the Create Default Bearer Request. PDN Address
Information contains an IPv4 address for IPv4 and/or an IPv6 prefix and an Interface
Identifier for IPv6. The P-GW takes into account the UE IP version capability indicated
in the PDN Address Allocation and the policies of operator when the P-GW allocates the
PDN Address Information. Whether the IP address is negotiated by the UE after
completion of the Attach procedure, this is indicated in the Create Default Bearer
Response.
12 The Downlink (DL) Data can start flowing towards S-GW. The S-GW buffers the data.
13 The S-GW returns a Create Default Bearer Response (PDN Address Information, S-GW
address for User Plane, S-GW TEID for User Plane, S-GW Context ID, EPS Bearer
Identity, Protocol Configuration Options) message to the new MME. PDN Address
Information is included if it was provided by the P-GW.
14 The new MME sends an Attach Accept (APN, GUTI, PDN Address Information, TAI List,
EPS Bearer Identity, Session Management Configuration IE, Protocol Configuration
Options) message to the EnodeB.
15 The EnodeB sends Radio Bearer Establishment Request including the EPS Radio Bearer
Identity to the UE. The Attach Accept message is also sent along to the UE.
16 The UE sends the Radio Bearer Establishment Response to the EnodeB. In this message,
the Attach Complete message (EPS Bearer Identity) is included.
17 The EnodeB forwards the Attach Complete (EPS Bearer Identity) message to the MME.
LTE
18 The Attach is complete and UE sends data over the default bearer. At this time the UE
can send uplink packets towards the EnodeB which are then tunnelled to the S-GW and
P-GW.
19 The MME sends an Update Bearer Request (EnodeB address, EnodeB TEID) message to
the S-GW.
20 The S-GW acknowledges by sending Update Bearer Response (EPS Bearer Identity)
message to the MME.
21 The S-GW sends its buffered downlink packets.
22 After the MME receives Update Bearer Response (EPS Bearer Identity) message, if an
EPS bearer is established and the subscription data indicates that the user is allowed to
perform handover to non-3GPP accesses, and if the MME selected a P-GW that is
different from the P-GW address which was indicated by the HSS in the PDN
subscription context, the MME sends an Update Location Request including the APN
and P-GW address to the HSS for mobility with non-3GPP accesses
23 The HSS stores the APN and P-GW address pair and sends an Update Location
Response to the MME
24 Bidirectional data is passed between the UE and PDN
The following figure and the text that follows describe the message flow for a user-initiatedsubscriber de-registration procedure. For more information, please refer to the official CiscoASR 5000 MME/SGW/PGW Administration Guides.
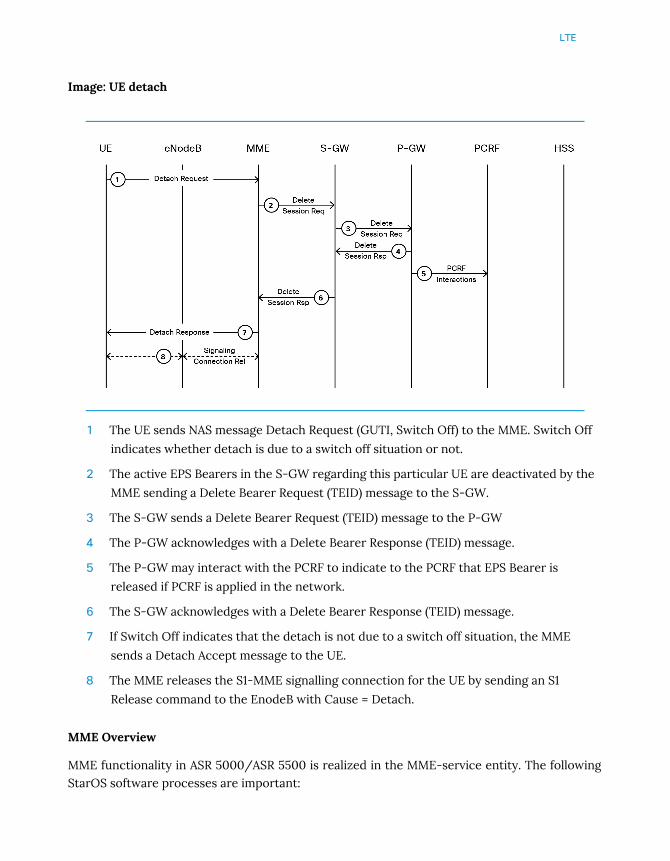
LTE
Image: UE detach
1 The UE sends NAS message Detach Request (GUTI, Switch Off) to the MME. Switch Off
indicates whether detach is due to a switch off situation or not.
2 The active EPS Bearers in the S-GW regarding this particular UE are deactivated by the
MME sending a Delete Bearer Request (TEID) message to the S-GW.
3 The S-GW sends a Delete Bearer Request (TEID) message to the P-GW
4 The P-GW acknowledges with a Delete Bearer Response (TEID) message.
5 The P-GW may interact with the PCRF to indicate to the PCRF that EPS Bearer is
released if PCRF is applied in the network.
6 The S-GW acknowledges with a Delete Bearer Response (TEID) message.
7 If Switch Off indicates that the detach is not due to a switch off situation, the MME
sends a Detach Accept message to the UE.
8 The MME releases the S1-MME signalling connection for the UE by sending an S1
Release command to the EnodeB with Cause = Detach.
MME Overview
MME functionality in ASR 5000/ASR 5500 is realized in the MME-service entity. The followingStarOS software processes are important:

LTE
MMEmgr: The MME Mgr tasks will be started when a MME service configuration is detected.There will be multiple instances of this task for load sharing. All MME Mgrs will have all the Ac-tive MME Services configured and will be identical in configuration and capabilities. This taskwill run the SCTP protocol stack. It will also handle SGSAP protocol towards MSC/VLR andsome of the S1AP functionality towards EnodeB.
MMEdemux: Since there are multiple MMEmgr tasks, its the responsibility of the MMEdemuxprocess to distribute across different MMEmgr processes.
Imsimgr: The IMSIMgr is the de-multiplexing process that selects the SessMgr instance to hosta new session based on a demux algorithm logic to host a new session by handling new calls re-quests from the MMEMgr, the EGTPC Mgr. The new call requests or signalling procedures in-clude Attach, Inter-MME TAU, PS Handover, and SGs, all of which go through the IMSIMgr. TheIMSIMgr process also maintains the mapping of the UE identifier (e.g., IMSI/GUTI) to the Sess-Mgr instance.
Diamproxy: MME has connection to the HSS which is run over diameter. Diamproxy process isthe process responsible for maintaining the Diameter connection to the HSS.
Sessmgr: The sessmgr process is responsible for subscriber session handling. It will also estab-lish an (internal only) diameter connection to the Diameter proxy process.
SGW Overview
The Serving Gateway routes and forwards data packets from the UE and acts as the mobilityanchor during inter-EnodeB handovers. The MME selects the best SGW for a particular UE.
The following StarOS software processes are important on SGW:
egtpinmgr: Handles EGTP control plane inbound over S11 (from MME) interface.
egtpegmgr: Handles EGTP control plane outbound over S5/S8 interface
sessmgr: Subscriber specific processing.
gtpumgr: Handles GTP-U data plane traffic over S1U and S5/S8 interface
LTE
PGW Overview
The PGW is not only a node in the network path of a call setup, it is the endpoint of the call andit has the intelligence built in to do deep packet inspection (ECS ), policy control (Gx), chargingcontrol (Gy), and billing (Rf), and possibly QoS. In addition, it requires three services for callcontrol (EGTP, PGW) and user plane (GTU). The one easy part is that since it is the endpoint ofthe call, there is no egress call control to be concerned about, as there would be for SGW andMME which will have both ingress and egress.
The following StarOS software processes are important on PGW:
egtpinmgr: Handles EGTP control plane inbound over the S5/S8 interface and acts as demux topass call requests to sessmgrs
sessmgr: Subscriber specific processing.
diamproxy: PGW has connections to various servers (Gx/Gy) over the Diameter protocol. Di-amproxy process is the process responsible for maintaining the Diameter connection to theseservers
aaamgr: Performs all AAA protocol operations and functions for subscribers
vpnmgr: Performs IP address pool and subscriber IP address management, and also contextspecific operations
Quick Command Reference
For more information about each command, refer to the specific troubleshooting session or theCLI Document Guide.Always collect multiple SSDs for analysis when troubleshooting any issue.
MME Commands
Some of the CLI commands below require CLI test-commands passwordconfigured in the chassis.Please use the commands with caution! Many TEST commands areprocessor-intensive and can cause serious system problems if used toofrequently.
LTE
• show mme-service all
• show mme-service db statistics
• show mme-service statistics debug
• show session subsystem facility sessmgr all debug-info
• show mme-service session full <imsi/imei/msisdn>
• show mme-service db record <imsi/all/call-id>
• show mme-service enodeb-association full all
• show mme-service enodeb-association summary all
• show hss-peer-service service all
• show diameter peers full all
• show hss-peer-service statistics all
• show sgs-service all
• show sgs-service vlr-status
• show sgs-service vlr-status full
• show sgs-service statistics all
• show subscribers mme-only full
• show subscribers full imsi
monitor protocolmonitor subscriber logging filter active facility mme-app level info
SGW Commands
Some of the CLI commands below require CLI test-commands passwordconfigured in the chassis.Please use the commands with caution! Many TEST commands areprocessor-intensive and can cause serious system problems if used toofrequently.
• show egtp-service all
• show gtpu-service all
• show sgw-service name <sgw_service_name>
• show sgw-service statistics all verbose

LTE
• show sgw-service statistics name <sgw_service_name>
• show egtp-service name <egtp_ingress_service_name>
• show egtpc statistics path-failure-reasons
• show egtpc statistics summary
• show egtp-service name <egtp_egress_service_name>
• show egtpc statistics egtp-service <egtp_service_name>
• show gtpu-service name <S1U_GTPU_service_name>
• monitor protocol
• monitor subscriber
• logging filter active facility sgw level info
PGW Commands
Some of the CLI commands below require CLI test-commands passwordconfigured in the chassis.Please use the commands with caution! Many TEST commands areprocessor-intensive and can cause serious system problems if used toofrequently.
• show egtpc-service all
• show pgw-service all
• show gtpu-service all
• show egtpc statistics
• show session disconnect-reasons
• show pgw-service statistics all verbose
• show sub full
• show sub pgw-only full
• show active-charging sessions full
• show apn statistics name <APN> query-type AAAA
• show dns-client cache client <DNS client name> query-type AAAA
• dns-client query client-name PGW-DNS query-type AAAA query-name <FQDN>
• show egtpc peers [egtp-service <service>]
• egtpc test echo gtp-version 2 src-address <service address> peer-address <peeraddress>
LTE
• show egtpc statistics [[[ (sgw-address | pgw-address | mme-address) <address>][demux-only]] [debug-only] [verbose] | [path-failure-reasons]
• show gtpu statistics [peer-address <peer>]
• show gtpc statistics [ggsn-service <service>] [smgr-instance <instance>]
• show demux-mgr statistics <egtpinmgr | egtpegmgr | gtpumgr> all (SGW-egress |GGSN/ PGW,/SGW ingress | GTPU)
• show egtpc statistics interface mme
• show egtpc statistics interface sgw-ingress
• show egtpc statistics interface sgw-egress
• show egtpc statistics interface pgw-ingress
• show egtpc stat path-failure-reasons
• monitor protocol
• monitor subscriber
• logging filter active facility pgw level info

LTE
Troubleshooting MME
Overview
This section focuses on MME troubleshooting techniques along with examples in ASR5000/ASR 5500.
Basic Troubleshooting
NOTE: Always capture multiple "show support detail" instances for analysis as required.
• show mme-service all Check the status (should be "STARTED")
Service name : TEST-MME
Context : mme
Status : STARTED
Bind : Done
S1-MME IP Address : 10.10.10.10
10.10.20.0
• show mme-service db statistics Provides MME database statistics for all instances ofDB, check "DB record limit reached".
Please refer to official MME Administration Guide, StarOS with corresponding software release onCisco.com website for further details on the checks and general troubleshooting commands.
The CLI commands below require CLI test-commands passwordconfigured in the chassis.Please use the command with caution! Many TEST commands areprocessor-intensive and can cause serious system problems if used toofrequently.
• show mme-service statistics debug
This command is extremely useful for various statistics around the MME service. IncludingSCTP, S1AP, network procedures, handovers, etc

LTE
• show demux-mgr statistics imsimgr full
This is the command to audit the imsimgr process. It contains various statistics about howmany new requests were coming in for various procedures, and if a sessmgr was found to han-dle this request, as well as MME Overload Protection and a few tables that show distributionper sessmgr.
SCTP Statistics and S1AP Statistics, transmitted, received, re-transmitted data per MMEmgr in-stance.
• show mme-service session full <imsi/imei/msisdn> - provides several details about asubscriber session.
• show mme-service db record <imsi/all/call-id> - provides subscriber MME databaserecords.
Troubleshooting S1-AP interface
S1 Application Protocol (S1-AP) uses the Stream Control Transmission Protocol (SCTP) as thetransport layer protocol for guaranteed delivery of signalling messages (S1AP and NAS) betweenMME and EnodeB. The following CLIs provide information on the status of S1-AP links betweenMME and EnodeB.
• show mme-service EnodeB-association full all - Detailed EnodeB-related info showsMME service name, MME IP addresses and EnodeB addresses for S1-AP interface.
MMEMgr : Instance
Peerid : 16900006
Global EnodeB ID : 17000:208:01
Assoc UpTime : 00h03m33s
EnodeB Name :
EnodeB Type : Macro
MME Service Name : mme
MME Service Address(s) : 172.16.1.1
172.16.2.1
MME Service Port : 36412
EnodeB Port : 36412
EnodeB IP Address : 172.16.3.1
Crypto-map Name(s) : n/a
Paging DRX : 0(v32)
Supported TAI(s) : 600:20001
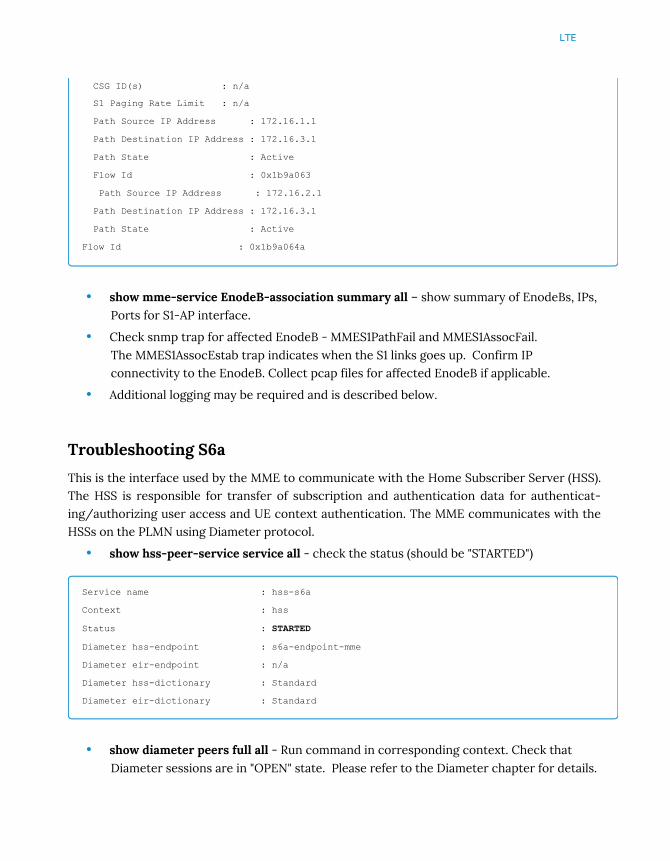
LTE
CSG ID(s) : n/a
S1 Paging Rate Limit : n/a
Path Source IP Address : 172.16.1.1
Path Destination IP Address : 172.16.3.1
Path State : Active
Flow Id : 0x1b9a063
Path Source IP Address : 172.16.2.1
Path Destination IP Address : 172.16.3.1
Path State : Active
Flow Id : 0x1b9a064a
• show mme-service EnodeB-association summary all – show summary of EnodeBs, IPs,Ports for S1-AP interface.
• Check snmp trap for affected EnodeB - MMES1PathFail and MMES1AssocFail.The MMES1AssocEstab trap indicates when the S1 links goes up. Confirm IPconnectivity to the EnodeB. Collect pcap files for affected EnodeB if applicable.
• Additional logging may be required and is described below.
Troubleshooting S6a
This is the interface used by the MME to communicate with the Home Subscriber Server (HSS).The HSS is responsible for transfer of subscription and authentication data for authenticat-ing/authorizing user access and UE context authentication. The MME communicates with theHSSs on the PLMN using Diameter protocol.
• show hss-peer-service service all - check the status (should be "STARTED")
Service name : hss-s6a
Context : hss
Status : STARTED
Diameter hss-endpoint : s6a-endpoint-mme
Diameter eir-endpoint : n/a
Diameter hss-dictionary : Standard
Diameter eir-dictionary : Standard
• show diameter peers full all - Run command in corresponding context. Check thatDiameter sessions are in "OPEN" state. Please refer to the Diameter chapter for details.

LTE
• show hss-peer-service statistics all - Run command in correspondingcontext. Monitor failovers and Message Error stats.
• Check SNMP traps for HSS reset – SGSNHLRReset – investigate the reset on HSS side.
• Confirm IP connectivity to the HSS.
NOTE: check the Diameter section for additional information.
Troubleshooting SGs
The SGs interface connects the databases in the VLR and the MME to support circuit switchfallback scenarios.
• show sgs-service all Check the status (should be "STARTED")
Service name : sgs
Context : mme
Status : STARTED
Bind : Done
IP Address : 172.16.1.10 172.16.1.110
SCTP port : 29118
Num VLRs : 3
• show sgs-service vlr-status Check associated state (should be "UP")
MMEMGR : Instance 1
MME Reset : No
Service ID : 6
Peer ID : 17171000
VLR Name : AB01.MNC01.MCC001.3GPPNETWORK.ORG
SGS Service Name : sgs
VLR Offload : No
SGS Service Address : 172.17.1.25 172.20.70.26
SGS Service Port : 29118
VLR IP Address : 172.18.1.161 172.18.1.169
VLR Port : 29118
Assoc State : UP
Assoc Uptime : 0021d20h20m
Assoc State Up Count : 1

LTE
Assoc Path State
172.20.72.161 172.20.70.25 UP 0x1b986db
172.20.72.161 172.20.70.26 UP 0x1b986dc
172.20.72.169 172.20.70.25 UP 0x1b986dd
172.20.72.169 172.20.70.26 UP 0x1b986de
• show sgs-service vlr-status full Provides additional info on VLR status.
• show sgs-service statistics all Provides SCTP Statistics, search for Errors, Aborts, etc
• Check VLR reset in snmp traps - VLRAssocDown and VLRDown. The trap VLRUpindicates when the VLR links comes back UP.
Troubleshooting a subscriber connecting to MME
• monitor subscriber Collect and analyze a subscriber MME call with monitor subscriberfrom the beginning of a call till an issue with verbosity 3, options S and Y.
• show subscribers mme-only full Provides information on a MME subscriber session .
• show subscribers full imsi Provides subscriber session information.
• monitor protocol Select option 70 and verbosity 3 to collect DNS queries during themonitor subscriber test call. Note: Running monitor protocol may impact systemperformance when many subscribers are connected.
• various debugs can be activated to find issues on MME side. Activating unusual leveldebugs is not posing a risk to the stability of the node. Sometimes however itsnecessary to use debug levels of logging; increasing the debug level has to be done withcaution.
logging filter active facility mme-app level unusuallogging filter active facility nas level unusuallogging filter active facility s1ap level unusuallogging filter active facility egtpc level unusuallogging active
Troubleshooting of SPGW Selection by MME
One of the main tasks of MME is to select the SGW and PGW which will handle the subscribersession. This is usually done through DNS. Typically SGW is selected through TAC-based DNS(NAPTR) query, and PGW is selected through APN-based DNS (NAPTR) query.
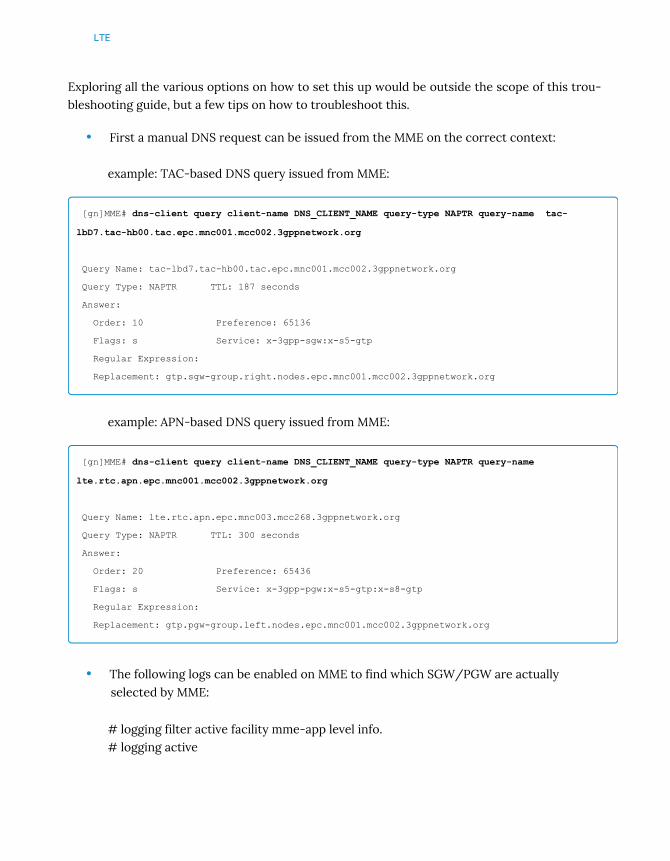
LTE
Exploring all the various options on how to set this up would be outside the scope of this trou-bleshooting guide, but a few tips on how to troubleshoot this.
• First a manual DNS request can be issued from the MME on the correct context:
example: TAC-based DNS query issued from MME:
[gn]MME# dns-client query client-name DNS_CLIENT_NAME query-type NAPTR query-name tac-
lbD7.tac-hb00.tac.epc.mnc001.mcc002.3gppnetwork.org
Query Name: tac-lbd7.tac-hb00.tac.epc.mnc001.mcc002.3gppnetwork.org
Query Type: NAPTR TTL: 187 seconds
Answer:
Order: 10 Preference: 65136
Flags: s Service: x-3gpp-sgw:x-s5-gtp
Regular Expression:
Replacement: gtp.sgw-group.right.nodes.epc.mnc001.mcc002.3gppnetwork.org
example: APN-based DNS query issued from MME:
[gn]MME# dns-client query client-name DNS_CLIENT_NAME query-type NAPTR query-name
lte.rtc.apn.epc.mnc001.mcc002.3gppnetwork.org
Query Name: lte.rtc.apn.epc.mnc003.mcc268.3gppnetwork.org
Query Type: NAPTR TTL: 300 seconds
Answer:
Order: 20 Preference: 65436
Flags: s Service: x-3gpp-pgw:x-s5-gtp:x-s8-gtp
Regular Expression:
Replacement: gtp.pgw-group.left.nodes.epc.mnc001.mcc002.3gppnetwork.org
• The following logs can be enabled on MME to find which SGW/PGW are actuallyselected by MME:
# logging filter active facility mme-app level info.# logging active
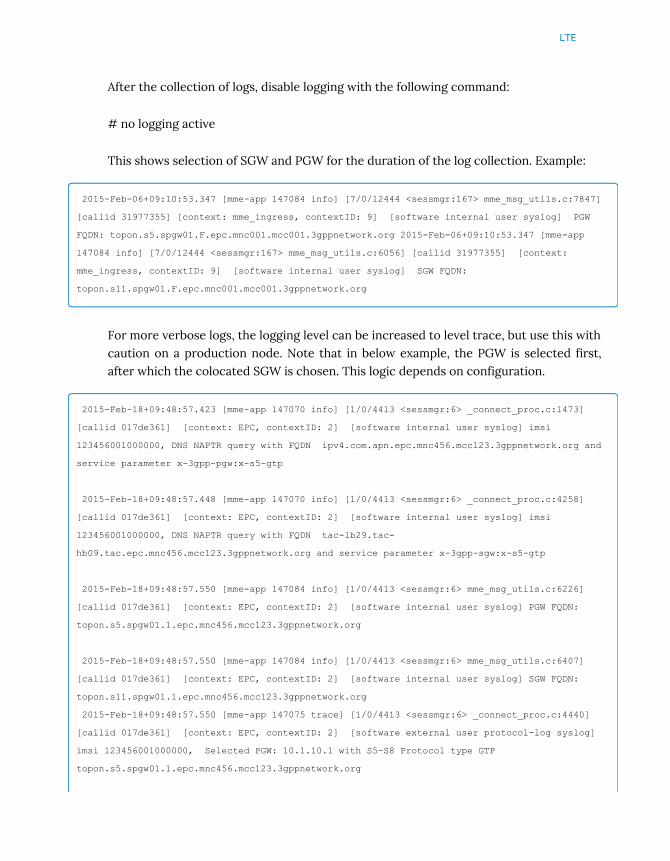
LTE
After the collection of logs, disable logging with the following command:
# no logging active
This shows selection of SGW and PGW for the duration of the log collection. Example:
2015-Feb-06+09:10:53.347 [mme-app 147084 info] [7/0/12444 <sessmgr:167> mme_msg_utils.c:7847]
[callid 31977355] [context: mme_ingress, contextID: 9] [software internal user syslog] PGW
FQDN: topon.s5.spgw01.F.epc.mnc001.mcc001.3gppnetwork.org 2015-Feb-06+09:10:53.347 [mme-app
147084 info] [7/0/12444 <sessmgr:167> mme_msg_utils.c:6056] [callid 31977355] [context:
mme_ingress, contextID: 9] [software internal user syslog] SGW FQDN:
topon.s11.spgw01.F.epc.mnc001.mcc001.3gppnetwork.org
For more verbose logs, the logging level can be increased to level trace, but use this withcaution on a production node. Note that in below example, the PGW is selected first,after which the colocated SGW is chosen. This logic depends on configuration.
2015-Feb-18+09:48:57.423 [mme-app 147070 info] [1/0/4413 <sessmgr:6> _connect_proc.c:1473]
[callid 017de361] [context: EPC, contextID: 2] [software internal user syslog] imsi
123456001000000, DNS NAPTR query with FQDN ipv4.com.apn.epc.mnc456.mcc123.3gppnetwork.org and
service parameter x-3gpp-pgw:x-s5-gtp
2015-Feb-18+09:48:57.448 [mme-app 147070 info] [1/0/4413 <sessmgr:6> _connect_proc.c:4258]
[callid 017de361] [context: EPC, contextID: 2] [software internal user syslog] imsi
123456001000000, DNS NAPTR query with FQDN tac-lb29.tac-
hb09.tac.epc.mnc456.mcc123.3gppnetwork.org and service parameter x-3gpp-sgw:x-s5-gtp
2015-Feb-18+09:48:57.550 [mme-app 147084 info] [1/0/4413 <sessmgr:6> mme_msg_utils.c:6226]
[callid 017de361] [context: EPC, contextID: 2] [software internal user syslog] PGW FQDN:
topon.s5.spgw01.1.epc.mnc456.mcc123.3gppnetwork.org
2015-Feb-18+09:48:57.550 [mme-app 147084 info] [1/0/4413 <sessmgr:6> mme_msg_utils.c:6407]
[callid 017de361] [context: EPC, contextID: 2] [software internal user syslog] SGW FQDN:
topon.s11.spgw01.1.epc.mnc456.mcc123.3gppnetwork.org
2015-Feb-18+09:48:57.550 [mme-app 147075 trace] [1/0/4413 <sessmgr:6> _connect_proc.c:4440]
[callid 017de361] [context: EPC, contextID: 2] [software external user protocol-log syslog]
imsi 123456001000000, Selected PGW: 10.1.10.1 with S5-S8 Protocol type GTP
topon.s5.spgw01.1.epc.mnc456.mcc123.3gppnetwork.org

LTE
2015-Feb-18+09:48:57.550 [mme-app 147076 trace] [1/0/4413 <sessmgr:6> _connect_proc.c:4444]
[callid 017de361] [context: EPC, contextID: 2] [software external user protocol-log syslog]
imsi 123456001000000, New SGW selected: 10.1.17.1
topon.s11.spgw01.1.epc.mnc456.mcc123.3gppnetwork.org
Example Scenarios
CSFB Failure
Problem Description:
It was noted that CSFB doesn't work on phones connected to 4G intermittently. The caller getsa busy tone, and the called party doesn't receive the call.
CSFB is triggered, MME communicates with EnodeB and MSC to get subscriber on 2g/3g to re-ceive the phone call via traditional CS network.
Logs collection:
• Collect 2 “show support detail”
• Collect monitor subscriber verbosity 5 for the subscriber, while the CSFB procedurewas initiated from MSC side towards MME.
• Collect external packet capture on the relevant interfaces (S1AP, and Sgs).
Analysis:
Below is analysis of the monitor subscriber with notes and snippet of the trace. MME is behav-ing as expected. Please note that the CSFB specification can be found in 3GPP TS 23.272.
Inbound paging from SGS
INBOUND>>>>> 16:10:13:369 Eventid:173001(3)
SGS Rx PDU, from 10.20.20.2:29118 to 10.20.30.2:29118 (68)

LTE
Outbound CS service notification to UE
<<<<OUTBOUND 16:10:13:370 Eventid:153002(3)
NAS Tx PDU, from 10.20.40.2:36412 to 10.20.50.2:36412 (9)
Message Type
CS SERVICE NOTIFICATION(0x64)
Outbound service request to SGs
<<<<OUTBOUND 16:10:13:370 Eventid:173002(3)
SGS Tx PDU, from 10.20.30.2:29118 to 10.20.20.2:29118 (51)
Inbound CS service notification from UE
INBOUND>>>>> 16:10:13:423 Eventid:153001(3)
NAS Rx PDU, from 10.20.50.2:36412 to 10.20.40.2:36412 (20)
Message Type
EXTENDED SERVICE REQUEST(0x4c)
UE context modification
<<<<OUTBOUND 16:10:13:423 Eventid:155213(3)
S1AP Tx PDU, from 10.20.40.2:36412 to 10.20.50.2:36412 (28)
Procedure Code : UE CONTEXT MODIFICATION (21)
INBOUND>>>>> 16:10:13:458 Eventid:155212(3)
S1AP Rx PDU, from 10.20.50.2:36412 to 10.20.40.2:36412 (23)
Procedure Code : UE CONTEXT MODIFICATION (21)
Context Release
INBOUND>>>>> 16:10:13:458 Eventid:155212(3)
S1AP Rx PDU, from 10.20.50.2:36412 to 10.20.40.2:36412 (29)
Procedure Code : CONTEXT RELEASE REQUEST (18)
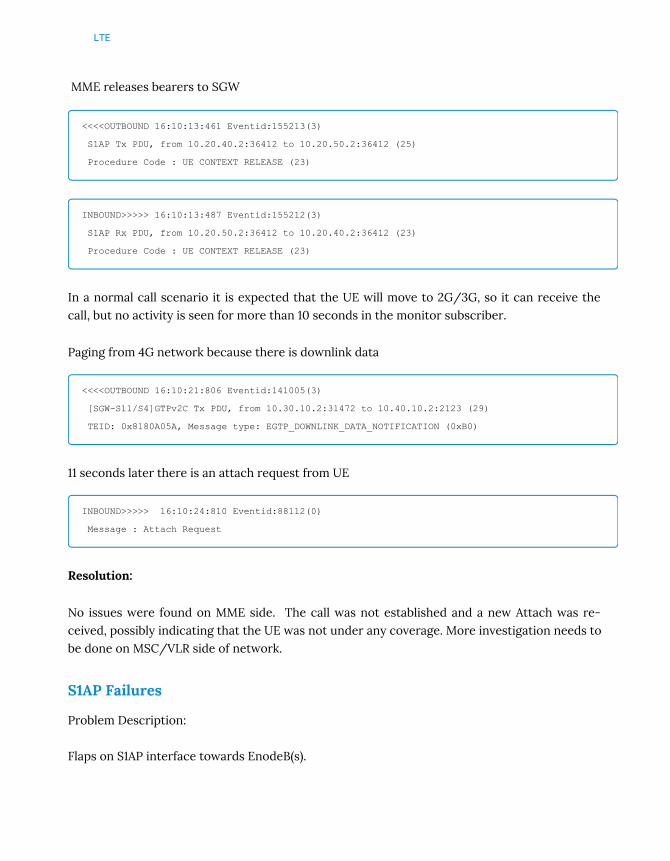
LTE
MME releases bearers to SGW
<<<<OUTBOUND 16:10:13:461 Eventid:155213(3)
S1AP Tx PDU, from 10.20.40.2:36412 to 10.20.50.2:36412 (25)
Procedure Code : UE CONTEXT RELEASE (23)
INBOUND>>>>> 16:10:13:487 Eventid:155212(3)
S1AP Rx PDU, from 10.20.50.2:36412 to 10.20.40.2:36412 (23)
Procedure Code : UE CONTEXT RELEASE (23)
In a normal call scenario it is expected that the UE will move to 2G/3G, so it can receive thecall, but no activity is seen for more than 10 seconds in the monitor subscriber.
Paging from 4G network because there is downlink data
<<<<OUTBOUND 16:10:21:806 Eventid:141005(3)
[SGW-S11/S4]GTPv2C Tx PDU, from 10.30.10.2:31472 to 10.40.10.2:2123 (29)
TEID: 0x8180A05A, Message type: EGTP_DOWNLINK_DATA_NOTIFICATION (0xB0)
11 seconds later there is an attach request from UE
INBOUND>>>>> 16:10:24:810 Eventid:88112(0)
Message : Attach Request
Resolution:
No issues were found on MME side. The call was not established and a new Attach was re-ceived, possibly indicating that the UE was not under any coverage. More investigation needs tobe done on MSC/VLR side of network.
S1AP Failures
Problem Description:
Flaps on S1AP interface towards EnodeB(s).
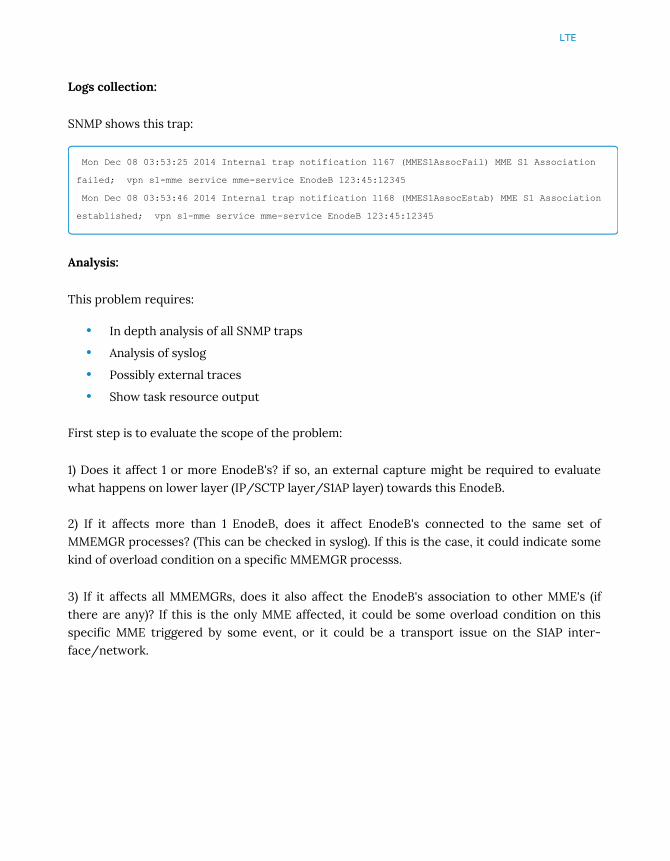
LTE
Logs collection:
SNMP shows this trap:
Mon Dec 08 03:53:25 2014 Internal trap notification 1167 (MMES1AssocFail) MME S1 Association
failed; vpn s1-mme service mme-service EnodeB 123:45:12345
Mon Dec 08 03:53:46 2014 Internal trap notification 1168 (MMES1AssocEstab) MME S1 Association
established; vpn s1-mme service mme-service EnodeB 123:45:12345
Analysis:
This problem requires:
• In depth analysis of all SNMP traps
• Analysis of syslog
• Possibly external traces
• Show task resource output
First step is to evaluate the scope of the problem:
1) Does it affect 1 or more EnodeB's? if so, an external capture might be required to evaluatewhat happens on lower layer (IP/SCTP layer/S1AP layer) towards this EnodeB.
2) If it affects more than 1 EnodeB, does it affect EnodeB's connected to the same set ofMMEMGR processes? (This can be checked in syslog). If this is the case, it could indicate somekind of overload condition on a specific MMEMGR processs.
3) If it affects all MMEMGRs, does it also affect the EnodeB's association to other MME's (ifthere are any)? If this is the only MME affected, it could be some overload condition on thisspecific MME triggered by some event, or it could be a transport issue on the S1AP inter-face/network.

LTE
In case (2), check if there is improper balancing of EnodeB associations by checking the 'showtask resource' output:
[local]MME# show task resources | grep mmemgr
cputime memory files sessions
cpu facility used allc used alloc used allc used allc status
--------------------------------- --------------------------
2/0 mmemgr 1 85% 95% 99.18M 400.0M 216 1000 736 8100 - good
2/0 mmemgr 2 82% 95% 95.00M 400.0M 215 1000 733 8100 - good
2/0 mmemgr 3 86% 95% 96.39M 400.0M 214 1000 766 8100 - good
2/0 mmemgr 4 60% 95% 77.34M 400.0M 214 1000 435 8100 - good
2/0 mmemgr 5 62% 95% 76.93M 400.0M 214 1000 435 8100 - good
2/0 mmemgr 6 55% 95% 75.03M 400.0M 215 1000 430 8100 - good
2/0 mmemgr 7 56% 95% 75.14M 400.0M 217 1000 429 8100 - good
2/0 mmemgr 8 51% 95% 76.01M 400.0M 214 1000 430 8100 - good
The number of sessions is higher on the first three mmemgr's. This may need to be investigatedby Cisco TAC as this is not a normal condition.
In case (3), it might be worth to check if there was a specific event that could have caused avery high load on all MMEMGR processes. Examples of such events include:
-Large EGTP path failures (which will result in massive disconnection/reconnection/paging) :verify with logs.
-crash of MMEmgr process : verify with "show crash list".
Resolution:
Several different causes can trigger such traps, so a broad investigation with the steps above isrequired.

LTE
Troubleshooting SGW
Overview
This section focuses on SGW troubleshooting techniques in ASR 5000/ASR 5500.
Basic Troubleshooting
The folowing section covers the troubleshooting commands for the SGW.
# show sgw-service name <sgw_service_name> : this command provides the status of theSGW service, and which EGTP services are linked to it and the contexts used for ingress andegress.
Service name : SGW-SVC
Service-Id : 17
Context : EPC <-- ingress EGTP context
Accounting context : EPC
Accounting gtpp group : default
Accounting mode : Gtpp
Accounting stop-trigger : Default
Status : STARTED
Egress protocol : gtp
Ingress EGTP service : S11-SGW
Egress context : EPC <-- egress EGTP context
Egress EGTP service : S5-S8-SGW
Egress MAG service : n/a
IMS auth. service : n/a
Peer Map : n/a
Accounting policy : n/a
Newcall policy : n/a
QCI-QOS mapping table : n/a
Event Reporting : Disabled
...

LTE
# show sgw-service statistics all verbose : this will provide total number of subscribers, han-dover statistics, paging statistics, packet counters.
# show sgw-service statistics name <sgw_service_name> : this command shows statistics re-lated to the SGW service. It contains info about the different kind of subscribers, handover sta-tistics, setup counts, paging statistics, etc.
Subscribers Total:
Active: 253 Setup: 254
Released: 1
Inactivity Timeout: 0
Current Subscribers By State:
Idle: 253 Active: 0
Current Subscribers By RAT-Type:
EUTRAN: 253 UTRAN: 0
GERAN: 0 OTHER: 0
PDNs Total:
Active: 253 Setup: 254
Released: 1 Rejected: 4482
LIPA: 0 Paused Charging: 0
Current PDNs By RAT-Type:
EUTRAN: 253 UTRAN: 0
GERAN: 0 OTHER: 0
PDNs By PDN-Type:
IPv4 PDNs:
Active: 253 Setup: 254
Released: 1 Rejected: 4482
IPv6 PDNs:
Active: 0 Setup: 0
Released: 0
Rejected: 0
IPv4v6 PDNs:
Active: 0 Setup: 0

LTE
Released: 0
Rejected: 0
Troubleshooting S11
The S11 interface is the interface between MME and SGW. It's only used for control plane traf-fic, and the EGTP (GTPv2) protocol is used to communicate over this interface.
• show egtp-service name <egtp_ingress_service_name> : basic settings for the EGTPservice between MME and SGW
Service name : S5-S8-SGW
Service-Id : 13
Context : EPC
Interface Type : sgw-ingress
Status : STARTED
Restart Counter : 9
Message Validation Mode : Standard
GTPU-Context : EPC
GTPC Retransmission Timeout : 5
GTPC Maximum Request Retransmissions : 4
GTPC IP QOS DSCP value : 10
GTPC Echo : Enabled
GTPC Echo Mode : Default
GTPC Echo Retransmission Timeout : 5
GTPC Echo Interval : 60
GTP-C Bind IPv4 Address : 10.1.10.1
GTP-C Bind IPv6 Address : Not configured
• show egtpc statistics path-failure-reasons : will provide counters and reasons forfailures. Related SNMP traps: EGTPCPathFail
Reasons for path failure at EGTPC:
Echo Request restart counter change: 0
Echo Response restart counter change: 0
No Echo Response received: 0
Control message restart counter change at demux: 0
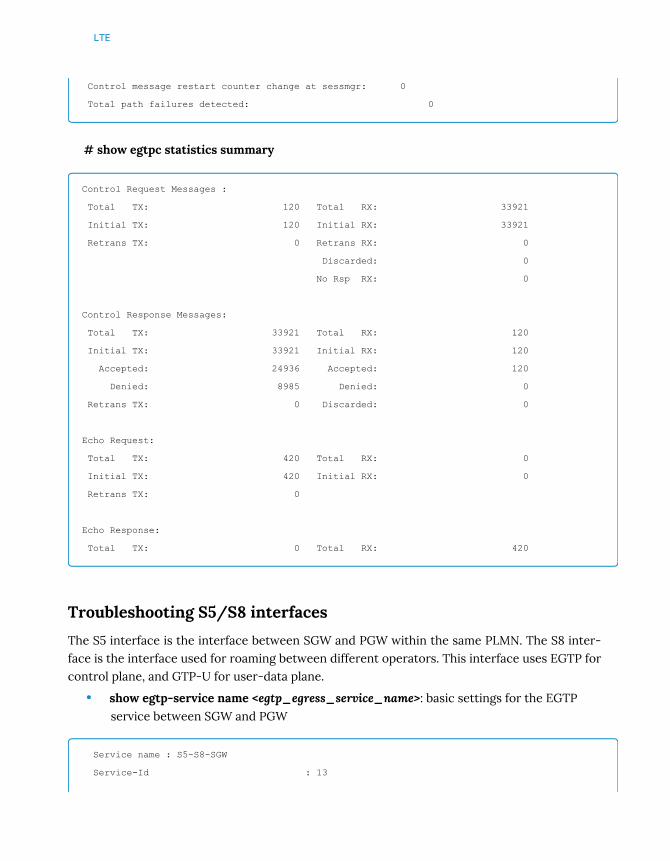
LTE
Control message restart counter change at sessmgr: 0
Total path failures detected: 0
# show egtpc statistics summary
Control Request Messages :
Total TX: 120 Total RX: 33921
Initial TX: 120 Initial RX: 33921
Retrans TX: 0 Retrans RX: 0
Discarded: 0
No Rsp RX: 0
Control Response Messages:
Total TX: 33921 Total RX: 120
Initial TX: 33921 Initial RX: 120
Accepted: 24936 Accepted: 120
Denied: 8985 Denied: 0
Retrans TX: 0 Discarded: 0
Echo Request:
Total TX: 420 Total RX: 0
Initial TX: 420 Initial RX: 0
Retrans TX: 0
Echo Response:
Total TX: 0 Total RX: 420
Troubleshooting S5/S8 interfaces
The S5 interface is the interface between SGW and PGW within the same PLMN. The S8 inter-face is the interface used for roaming between different operators. This interface uses EGTP forcontrol plane, and GTP-U for user-data plane.
• show egtp-service name <egtp_egress_service_name>: basic settings for the EGTPservice between SGW and PGW
Service name : S5-S8-SGW
Service-Id : 13
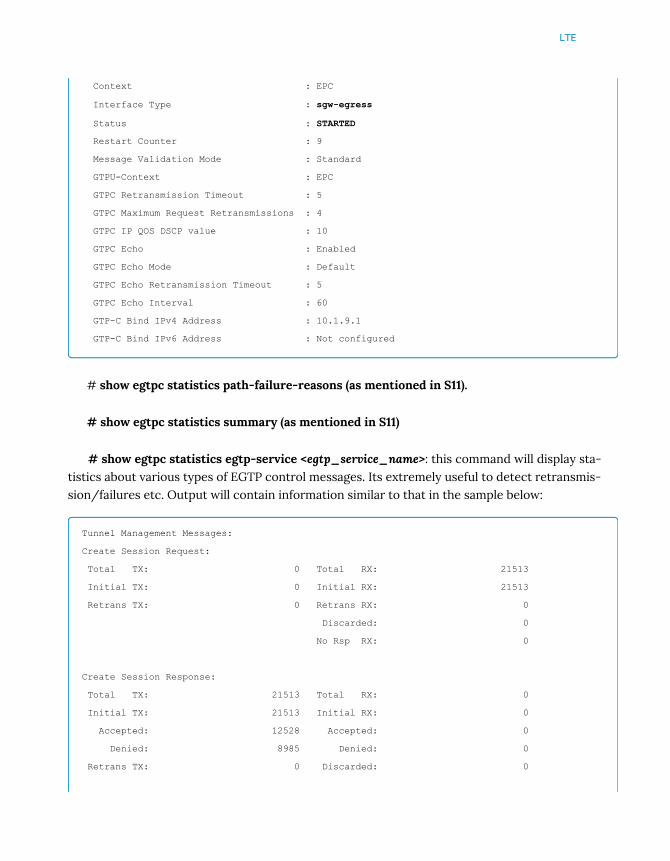
LTE
Context : EPC
Interface Type : sgw-egress
Status : STARTED
Restart Counter : 9
Message Validation Mode : Standard
GTPU-Context : EPC
GTPC Retransmission Timeout : 5
GTPC Maximum Request Retransmissions : 4
GTPC IP QOS DSCP value : 10
GTPC Echo : Enabled
GTPC Echo Mode : Default
GTPC Echo Retransmission Timeout : 5
GTPC Echo Interval : 60
GTP-C Bind IPv4 Address : 10.1.9.1
GTP-C Bind IPv6 Address : Not configured
# show egtpc statistics path-failure-reasons (as mentioned in S11).
# show egtpc statistics summary (as mentioned in S11)
# show egtpc statistics egtp-service <egtp_service_name>: this command will display sta-tistics about various types of EGTP control messages. Its extremely useful to detect retransmis-sion/failures etc. Output will contain information similar to that in the sample below:
Tunnel Management Messages:
Create Session Request:
Total TX: 0 Total RX: 21513
Initial TX: 0 Initial RX: 21513
Retrans TX: 0 Retrans RX: 0
Discarded: 0
No Rsp RX: 0
Create Session Response:
Total TX: 21513 Total RX: 0
Initial TX: 21513 Initial RX: 0
Accepted: 12528 Accepted: 0
Denied: 8985 Denied: 0
Retrans TX: 0 Discarded: 0

LTE
Modify Bearer Request:
Total TX: 0 Total RX: 0
Initial TX: 0 Initial RX: 0
Retrans TX: 0 Retrans RX: 0
Discarded: 0
No Rsp RX: 0
• related SNMP traps: EGTPCPathFail, EGTPUPathFail
• logging facility: egtpegmgr, gtpumgr
Troubleshooting S1-U interface
The S1-U interface is the interface between SGW and EnodeB. Its used for userplane traffic onlyand it uses GTPU protocol for encapsulating subscriber traffic.
# show gtpu-service name <S1U_GTPU_service_name>
Service name: S1U-SGW
Context: EPC
State: Started
Echo Interval: Disabled
Sequence number: Disabled
Include UDP Port Ext Hdr: FALSE
Max-retransmissions: 4
Retransmission Timeout: 5 (secs)
IPSEC Tunnel Idle Timeout:60 (secs)
Allow Error-Indication: Disabled
Address List:
10.1.4.1
GTPU UDP Checksum: Enabled - Attempt Optimize Default Mode
Path Failure Detection
on gtp echo msgs: Set
Path Failure Clear Trap : non-echo
# show gtpu statistics gtpu-service <name> : will indicate statistics related to the gtpu-ser-vice.

LTE
# show gtpu statistics peer-address <ip-address> : will indicate the number of packetstransmitted, received and droppped for a particular peer.
• related SNMP traps: EGTPUPathFail. Please refer to EGTP chapter.
• logging facility: gtpumgr
Troubleshooting a subscriber SGW call
• monitor subscriber Collect and analyze a subscriber SGW call with monitor subscriberfrom the beginning of a call until an issue with verbosity 2, options S and Y.
• show subscribers sgw-only full imsi <imsi> Provides information on a MME subscribersession information.
• show subscribers full imsi <imsi> Provides information on a subscriber sessioninformation.


LTE
Troubleshooting PGW
Overview
This section's focus is PGW troubleshooting techniques along with examples in ASR 5000/ASR5500.
Troubleshooting service status:
PGW functionality in ASR 5000/ASR 5500 is implemented in the PGW and EGTP services. Ver-ify the service status is 'STARTED' in the following commands.
• show egtp-service all
Service name : TEST-GTP
Context : PGW
Status : STARTED
GTP-C Bind IPv4 Address : <ipv4>
GTP-C Bind IPv6 Address : <ipv6>
• show pgw-service all
Service name : TEST-PGW
Context : PGW
Status : STARTED
EGTP Service : TEST-GTP
• show gtpu-service all
Service name : TEST-GTPU
Context : PGW
State : Started
Address List:
<ipv4> all
<ipv6> all
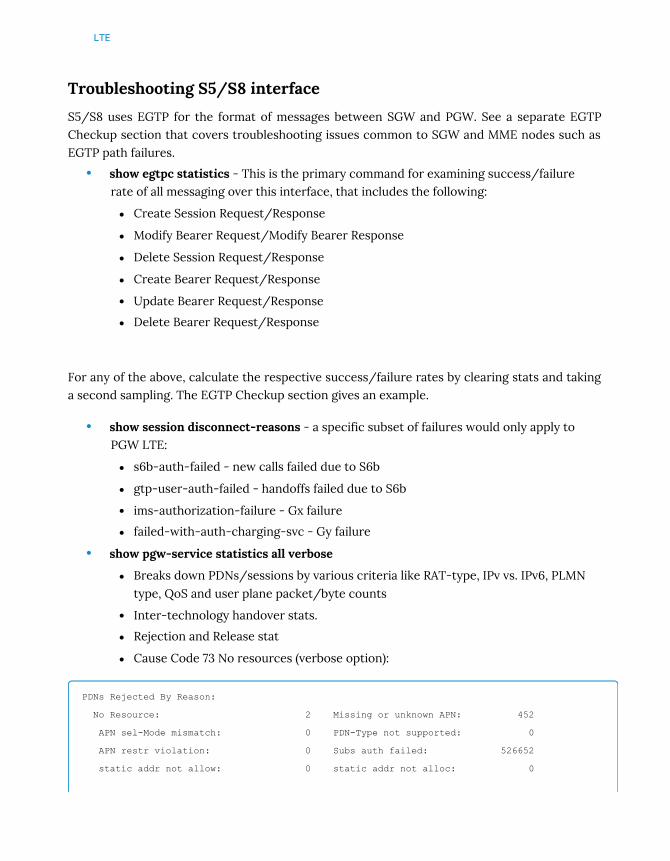
LTE
Troubleshooting S5/S8 interface
S5/S8 uses EGTP for the format of messages between SGW and PGW. See a separate EGTPCheckup section that covers troubleshooting issues common to SGW and MME nodes such asEGTP path failures.
• show egtpc statistics - This is the primary command for examining success/failurerate of all messaging over this interface, that includes the following:
Create Session Request/Response
Modify Bearer Request/Modify Bearer Response
Delete Session Request/Response
Create Bearer Request/Response
Update Bearer Request/Response
Delete Bearer Request/Response
For any of the above, calculate the respective success/failure rates by clearing stats and takinga second sampling. The EGTP Checkup section gives an example.
• show session disconnect-reasons - a specific subset of failures would only apply toPGW LTE:
s6b-auth-failed - new calls failed due to S6b
gtp-user-auth-failed - handoffs failed due to S6b
ims-authorization-failure - Gx failure
failed-with-auth-charging-svc - Gy failure
• show pgw-service statistics all verbose
Breaks down PDNs/sessions by various criteria like RAT-type, IPv vs. IPv6, PLMNtype, QoS and user plane packet/byte counts
Inter-technology handover stats.
Rejection and Release stat
Cause Code 73 No resources (verbose option):
PDNs Rejected By Reason:
No Resource: 2 Missing or unknown APN: 452
APN sel-Mode mismatch: 0 PDN-Type not supported: 0
APN restr violation: 0 Subs auth failed: 526652
static addr not allow: 0 static addr not alloc: 0
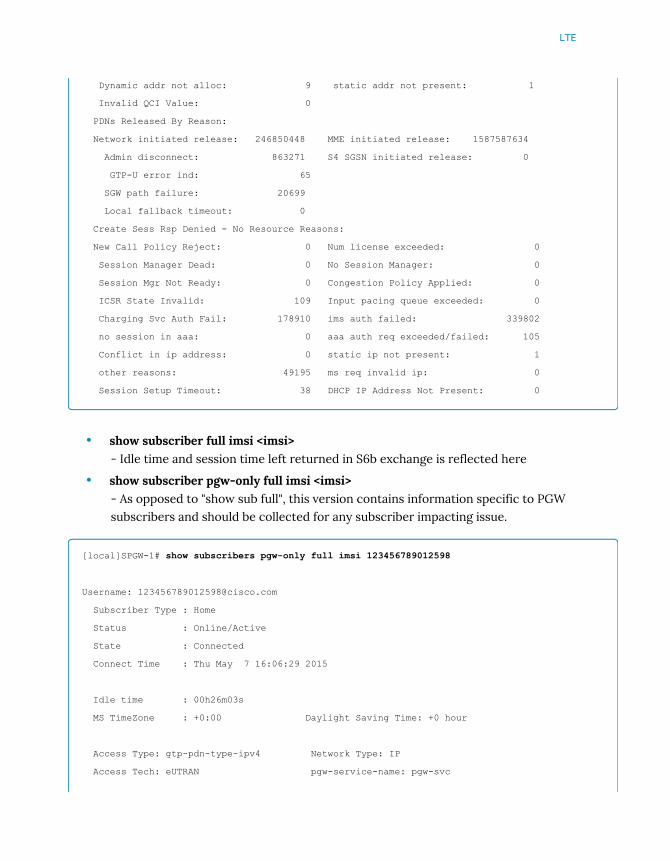
LTE
Dynamic addr not alloc: 9 static addr not present: 1
Invalid QCI Value: 0
PDNs Released By Reason:
Network initiated release: 246850448 MME initiated release: 1587587634
Admin disconnect: 863271 S4 SGSN initiated release: 0
GTP-U error ind: 65
SGW path failure: 20699
Local fallback timeout: 0
Create Sess Rsp Denied - No Resource Reasons:
New Call Policy Reject: 0 Num license exceeded: 0
Session Manager Dead: 0 No Session Manager: 0
Session Mgr Not Ready: 0 Congestion Policy Applied: 0
ICSR State Invalid: 109 Input pacing queue exceeded: 0
Charging Svc Auth Fail: 178910 ims auth failed: 339802
no session in aaa: 0 aaa auth req exceeded/failed: 105
Conflict in ip address: 0 static ip not present: 1
other reasons: 49195 ms req invalid ip: 0
Session Setup Timeout: 38 DHCP IP Address Not Present: 0
• show subscriber full imsi <imsi>- Idle time and session time left returned in S6b exchange is reflected here
• show subscriber pgw-only full imsi <imsi>- As opposed to "show sub full", this version contains information specific to PGWsubscribers and should be collected for any subscriber impacting issue.
[local]SPGW-1# show subscribers pgw-only full imsi 123456789012598
Username: [email protected]
Subscriber Type : Home
Status : Online/Active
State : Connected
Connect Time : Thu May 7 16:06:29 2015
Idle time : 00h26m03s
MS TimeZone : +0:00 Daylight Saving Time: +0 hour
Access Type: gtp-pdn-type-ipv4 Network Type: IP
Access Tech: eUTRAN pgw-service-name: pgw-svc
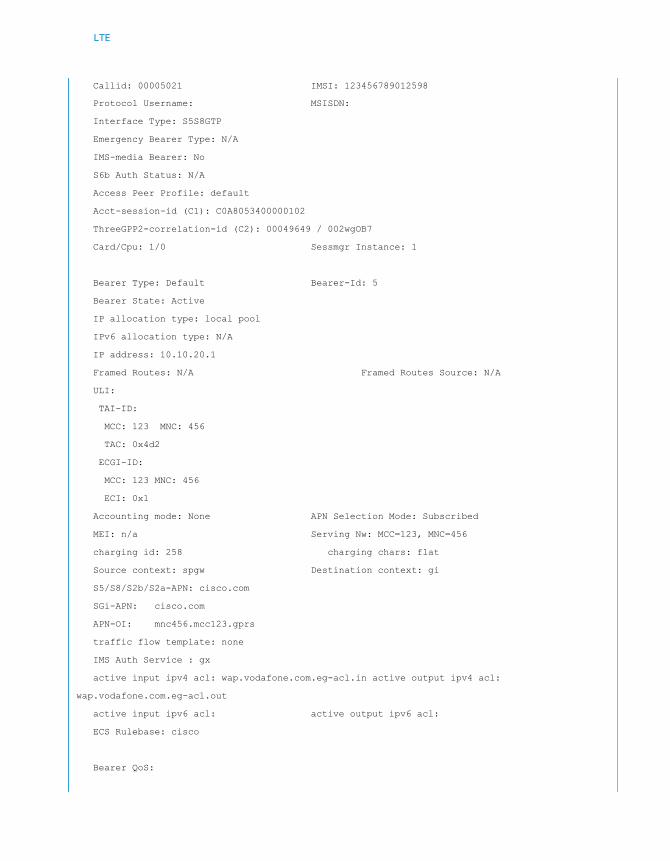
LTE
Callid: 00005021 IMSI: 123456789012598
Protocol Username: MSISDN:
Interface Type: S5S8GTP
Emergency Bearer Type: N/A
IMS-media Bearer: No
S6b Auth Status: N/A
Access Peer Profile: default
Acct-session-id (C1): C0A8053400000102
ThreeGPP2-correlation-id (C2): 00049649 / 002wgOB7
Card/Cpu: 1/0 Sessmgr Instance: 1
Bearer Type: Default Bearer-Id: 5
Bearer State: Active
IP allocation type: local pool
IPv6 allocation type: N/A
IP address: 10.10.20.1
Framed Routes: N/A Framed Routes Source: N/A
ULI:
TAI-ID:
MCC: 123 MNC: 456
TAC: 0x4d2
ECGI-ID:
MCC: 123 MNC: 456
ECI: 0x1
Accounting mode: None APN Selection Mode: Subscribed
MEI: n/a Serving Nw: MCC=123, MNC=456
charging id: 258 charging chars: flat
Source context: spgw Destination context: gi
S5/S8/S2b/S2a-APN: cisco.com
SGi-APN: cisco.com
APN-OI: mnc456.mcc123.gprs
traffic flow template: none
IMS Auth Service : gx
active input ipv4 acl: wap.vodafone.com.eg-acl.in active output ipv4 acl:
wap.vodafone.com.eg-acl.out
active input ipv6 acl: active output ipv6 acl:
ECS Rulebase: cisco
Bearer QoS:
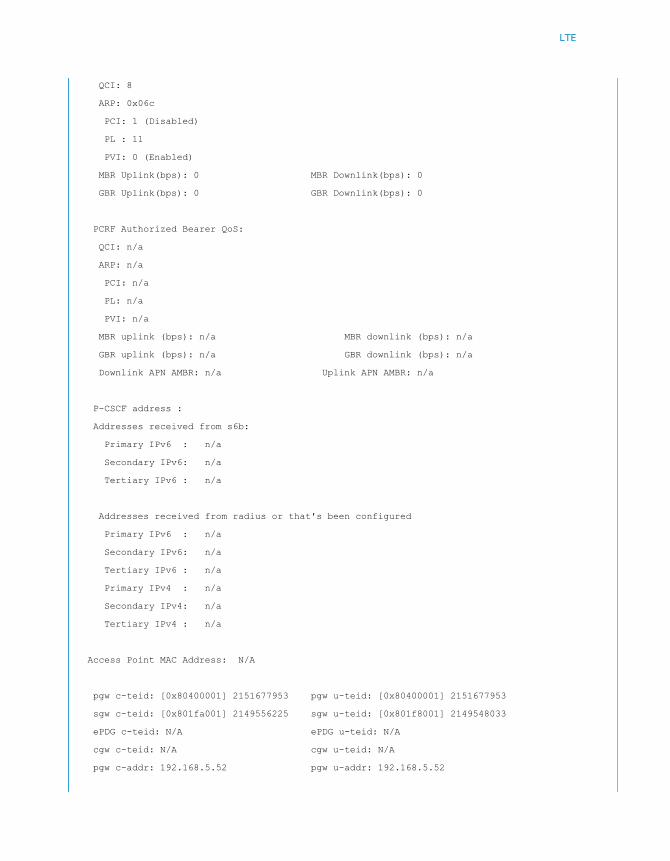
LTE
QCI: 8
ARP: 0x06c
PCI: 1 (Disabled)
PL : 11
PVI: 0 (Enabled)
MBR Uplink(bps): 0 MBR Downlink(bps): 0
GBR Uplink(bps): 0 GBR Downlink(bps): 0
PCRF Authorized Bearer QoS:
QCI: n/a
ARP: n/a
PCI: n/a
PL: n/a
PVI: n/a
MBR uplink (bps): n/a MBR downlink (bps): n/a
GBR uplink (bps): n/a GBR downlink (bps): n/a
Downlink APN AMBR: n/a Uplink APN AMBR: n/a
P-CSCF address :
Addresses received from s6b:
Primary IPv6 : n/a
Secondary IPv6: n/a
Tertiary IPv6 : n/a
Addresses received from radius or that's been configured
Primary IPv6 : n/a
Secondary IPv6: n/a
Tertiary IPv6 : n/a
Primary IPv4 : n/a
Secondary IPv4: n/a
Tertiary IPv4 : n/a
Access Point MAC Address: N/A
pgw c-teid: [0x80400001] 2151677953 pgw u-teid: [0x80400001] 2151677953
sgw c-teid: [0x801fa001] 2149556225 sgw u-teid: [0x801f8001] 2149548033
ePDG c-teid: N/A ePDG u-teid: N/A
cgw c-teid: N/A cgw u-teid: N/A
pgw c-addr: 192.168.5.52 pgw u-addr: 192.168.5.52
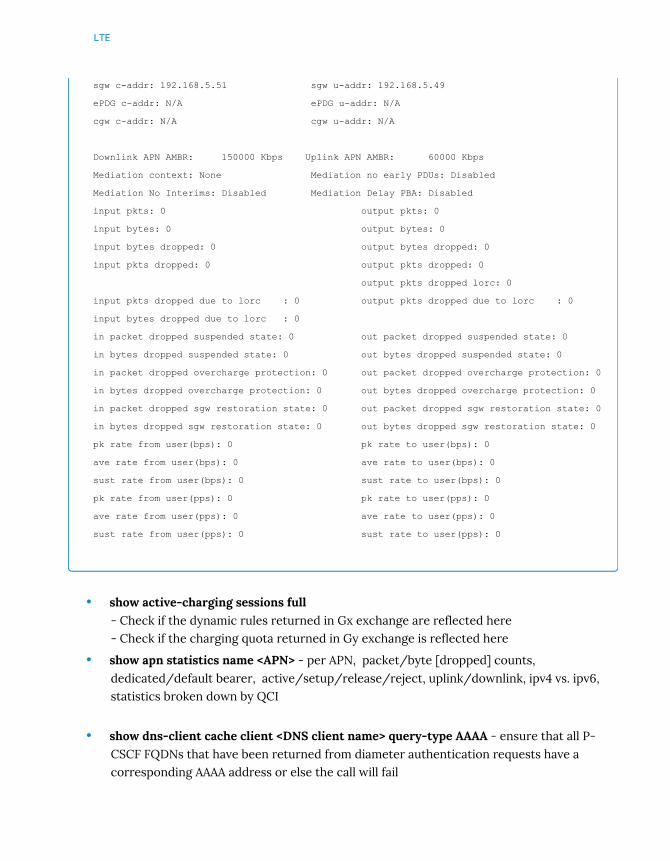
LTE
sgw c-addr: 192.168.5.51 sgw u-addr: 192.168.5.49
ePDG c-addr: N/A ePDG u-addr: N/A
cgw c-addr: N/A cgw u-addr: N/A
Downlink APN AMBR: 150000 Kbps Uplink APN AMBR: 60000 Kbps
Mediation context: None Mediation no early PDUs: Disabled
Mediation No Interims: Disabled Mediation Delay PBA: Disabled
input pkts: 0 output pkts: 0
input bytes: 0 output bytes: 0
input bytes dropped: 0 output bytes dropped: 0
input pkts dropped: 0 output pkts dropped: 0
output pkts dropped lorc: 0
input pkts dropped due to lorc : 0 output pkts dropped due to lorc : 0
input bytes dropped due to lorc : 0
in packet dropped suspended state: 0 out packet dropped suspended state: 0
in bytes dropped suspended state: 0 out bytes dropped suspended state: 0
in packet dropped overcharge protection: 0 out packet dropped overcharge protection: 0
in bytes dropped overcharge protection: 0 out bytes dropped overcharge protection: 0
in packet dropped sgw restoration state: 0 out packet dropped sgw restoration state: 0
in bytes dropped sgw restoration state: 0 out bytes dropped sgw restoration state: 0
pk rate from user(bps): 0 pk rate to user(bps): 0
ave rate from user(bps): 0 ave rate to user(bps): 0
sust rate from user(bps): 0 sust rate to user(bps): 0
pk rate from user(pps): 0 pk rate to user(pps): 0
ave rate from user(pps): 0 ave rate to user(pps): 0
sust rate from user(pps): 0 sust rate to user(pps): 0
• show active-charging sessions full - Check if the dynamic rules returned in Gx exchange are reflected here- Check if the charging quota returned in Gy exchange is reflected here
• show apn statistics name <APN> - per APN, packet/byte [dropped] counts,dedicated/default bearer, active/setup/release/reject, uplink/downlink, ipv4 vs. ipv6,statistics broken down by QCI
• show dns-client cache client <DNS client name> query-type AAAA - ensure that all P-CSCF FQDNs that have been returned from diameter authentication requests have acorresponding AAAA address or else the call will fail
LTE
• dns-client query client-name <DNS client name> query-type AAAA query-name<FQDN> - force a query for a specific FQDN that has been returned
• monitor protocol - Select option 70 to collect DNS queries during the monitorsubscriber test call.
• monitor subscriber- Collect and analyze a subscriber PGW call with monitor subscriber from the beginningof a call till an issue with verbosity level 3, with options: - S = sessmgr instance # - Y = Multi-Call = Yes to capture all APNs for the IMSI - 26 = GTPU user-plane data- Menu option: - 24 Next call by APN - 27 Next PGW call (if other call types on node this will differentiate)- Reading trace - TEIDs at top of GTPU packet can identify which bearer the packet belongs to if morethan one bearer's data is collected in the trace
Troubleshooting S6b
This is the interface used by the PGW to communicate with the Diameter authentication serverfor purposes of user authentication, including IP pool group, session duration and idle time-outs.
• show diameter peers full all - Run command in corresponding context. Check thatDiameter sessions are in "OPEN" state. Please refer to the Diameter chapter for details.
• show diameter aaa-statistics [all | group server]

LTE
Troubleshooting Tips for "No Resource Available" Response fromPGW
In the 16.0 and higher software releases, sub-causes are added for the 'No Resource Available'in "show pgw-service statistics all" to provide granularity.
show pgw-service statistics all verbose
Create Sess Rsp Denied - No Resource Reasons:
New Call Policy Reject: 0 Num license exceeded: 0
Session Manager Dead: 0 No Session Manager: 0
Session Mgr Not Ready: 0 Congestion Policy Applied: 0
ICSR State Invalid: 0 Input pacing queue exceeded: 0
Charging Svc Auth Fail: 4774 ims auth failed: 209222
no session in aaa: 0 aaa auth req exceeded/failed: 6
Conflict in ip address: 0 static ip not present: 22555
other reasons: 0 ms req invalid ip: 0
Session Setup Timeout: 0 DHCP IP Address Not Present: 0
S6B/radius IP Validation Failed: 0 mem_alloc_failed: 0
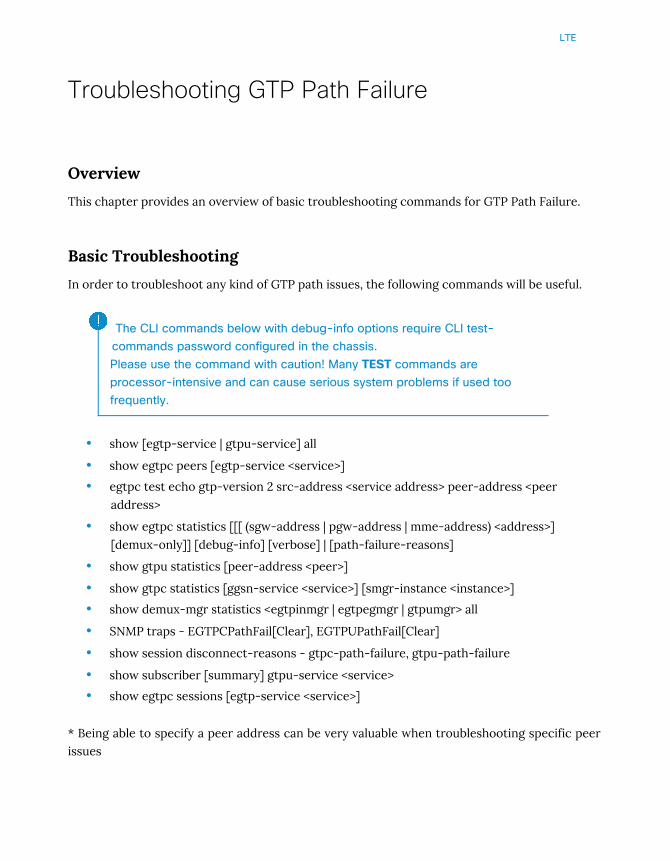
LTE
Troubleshooting GTP Path Failure
Overview
This chapter provides an overview of basic troubleshooting commands for GTP Path Failure.
Basic Troubleshooting
In order to troubleshoot any kind of GTP path issues, the following commands will be useful.
The CLI commands below with debug-info options require CLI test-commands password configured in the chassis.Please use the command with caution! Many TEST commands areprocessor-intensive and can cause serious system problems if used toofrequently.
• show [egtp-service | gtpu-service] all
• show egtpc peers [egtp-service <service>]
• egtpc test echo gtp-version 2 src-address <service address> peer-address <peeraddress>
• show egtpc statistics [[[ (sgw-address | pgw-address | mme-address) <address>][demux-only]] [debug-info] [verbose] | [path-failure-reasons]
• show gtpu statistics [peer-address <peer>]
• show gtpc statistics [ggsn-service <service>] [smgr-instance <instance>]
• show demux-mgr statistics <egtpinmgr | egtpegmgr | gtpumgr> all
• SNMP traps - EGTPCPathFail[Clear], EGTPUPathFail[Clear]
• show session disconnect-reasons - gtpc-path-failure, gtpu-path-failure
• show subscriber [summary] gtpu-service <service>
• show egtpc sessions [egtp-service <service>]
* Being able to specify a peer address can be very valuable when troubleshooting specific peerissues

LTE
Statistics counter by interface:
• show egtpc statistics interface mme shows EGTPC statistics on S11 interface on MMEside.
• show egtpc statistics interface sgw-ingress shows EGTPC statistics on S11 interface onSGW side.
• show egtpc statistics interface sgw-egress shows EGTPC statistics on S5/S8 interfaceson SGW side.
• show egtpc statistics interface pgw-ingress show EGTPC statistics on S5/S8 interfaceson PGW side.
For example below is a snippet of show egtpc statistics interface mme statistics that indicatesthat the MME had 39547 retransmissions of Create Session Requests out of 72120781 initial Cre-ate Session Requests (which is ~0.00005%) and 71954773 Accepted Create Session Responsesout of 72118219 total Create Session Response (which is ~99.77% )
Tunnel Management Messages:
Create Session Request:
Total TX: 72160328 Total RX: 0
Initial TX: 72120781 Initial RX: 0
Retrans TX: 39547 Retrans RX: 0
Discarded: 0
No Rsp RX: 11628
Create Session Response:
Total TX: 0 Total RX: 72118219
Initial TX: 0 Initial RX: 72118219
Accepted: 0 Accepted: 71954773
Denied: 0 Denied: 163446
Retrans TX: 0 Discarded: 0
The basic command to check the status and configuration of all EGTP services is show egtp-service.
[local]SPGW-1# show egtp-service all
Service name : pgwin
Service-Id : 5
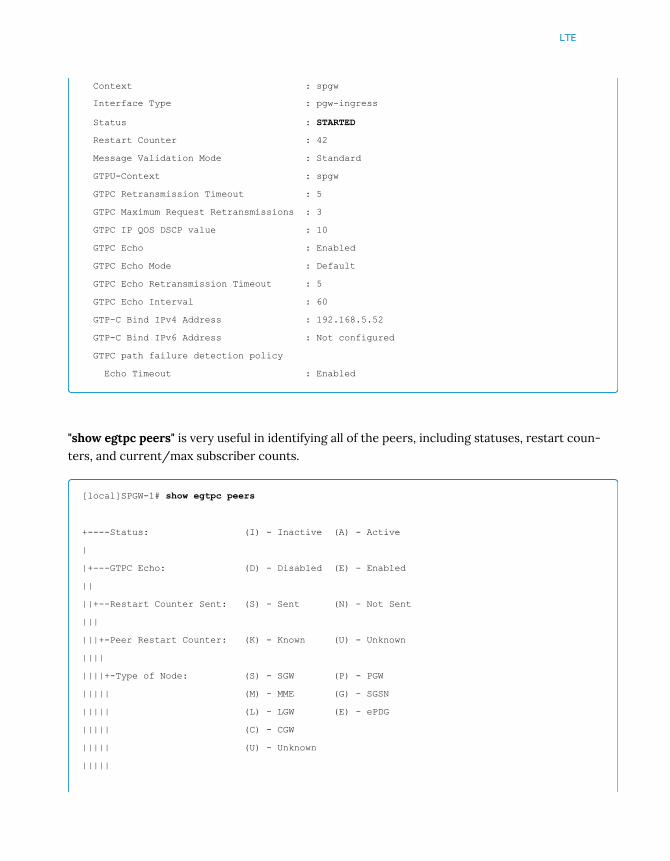
LTE
Context : spgw
Interface Type : pgw-ingress
Status : STARTED
Restart Counter : 42
Message Validation Mode : Standard
GTPU-Context : spgw
GTPC Retransmission Timeout : 5
GTPC Maximum Request Retransmissions : 3
GTPC IP QOS DSCP value : 10
GTPC Echo : Enabled
GTPC Echo Mode : Default
GTPC Echo Retransmission Timeout : 5
GTPC Echo Interval : 60
GTP-C Bind IPv4 Address : 192.168.5.52
GTP-C Bind IPv6 Address : Not configured
GTPC path failure detection policy
Echo Timeout : Enabled
"show egtpc peers" is very useful in identifying all of the peers, including statuses, restart coun-ters, and current/max subscriber counts.
[local]SPGW-1# show egtpc peers
+----Status: (I) - Inactive (A) - Active
|
|+---GTPC Echo: (D) - Disabled (E) - Enabled
||
||+--Restart Counter Sent: (S) - Sent (N) - Not Sent
|||
|||+-Peer Restart Counter: (K) - Known (U) - Unknown
||||
||||+-Type of Node: (S) - SGW (P) - PGW
||||| (M) - MME (G) - SGSN
||||| (L) - LGW (E) - ePDG
||||| (C) - CGW
||||| (U) - Unknown
|||||

LTE
||||| Service Restart--------+ No. of
||||| ID Counter | restarts
||||| | | | Current Max
vvvvv v Peer Address v v sessions sessions
----- --- --------------------------------------- --- --- ----------- -----------
IDNUG 4 10.201.251.5 0 4 0 1
AESKS 5 192.168.5.51 42 0 253 253
AESKM 6 192.168.5.110 10 0 253 253
AESKP 7 192.168.5.52 42 0 253 253
Total Peers: 4
Since this command includes all peer types, the peer type can be filtered on via the servicename.
"egtpc test echo" is used to check a specific peer to see if it is reachable or not and must be runin the context where the service is defined.
• Using ping command is not a valid test, though if it is successful, one knows that thereis some level of reachability.
• The peer restart counter (Recovery) is displayed.
• Running this command will increment the Tx echo request / Rx Echo responsecounters in "show egtpc statistics"
[EGTP Context]PGW> egtpc test echo gtp-version 2 src-address <src IP> peer-address <peer IP>
EGTPC test echo
---------------
Peer: <peer IP> Tx/Rx: 1/1 RTT(ms): 83 (COMPLETE) Recovery: 14
(0x0E)
If the test fails, then there is either a connectivity issue or the peer is down and not responding.
"show egtpc statistics" is for EGTPC (v2) and will report amongst many other things, all pathmanagement counters for Echo Request/Response Tx/Rx, and based on the timers, one canpredict the growth of these counters and use them to troubleshoot if they are not incrementingas expected.
LTE
"show gtpu statistics" reports stats on the user-plane traffic handled by the GTP-U service(s)that are associated with EGTPC service(s). One interesting counter is Error Indication Tx/Rxwhich is sent when the receiving node has no record of the subscriber that should be associ-ated with the TEID of a packet in question. That could happen for a number of reasons wherethe subscriber has been dropped inadvertently, and/or maybe the peer was never notified ofdisconnect.
The peer versions of the above stat commands are necessary when troubleshooting specificpeers, which often will be the case.
Example Scenarios
EGTPC Path Failure detection
Problem Description:
EGTPC path failure was detected.
Troubleshooting steps and analysis:
General troubleshooting steps are listed below.
• Collect 2 “show support detail”
• Collect external packet capture on the relevant interfaces (S11-S5/8)
• Syslog
• Check EGTP layer with egtpc test echo.
• Check IP connectivity.
Below couple examples with SNMP traps.
Internal trap notification 1112 (EGTPCPathFail) context Gn, service GGSN, interface type ggsn,self address 10.10.10.10, peer address 20.20.20.20, peer old restart counter 191, peer newrestart counter 59, peer session count 21, failure reason echo-rsp-restart-counter-change
Internal trap notification 1112 (EGTPCPathFail) context mme_ctx, service mme_svc_egtp, in-terface type mme, self address 10.10.10.10, peer address 20.20.20.20, peer old restart counter3, peer new restart counter 20, peer session count 1994, failure reason restart-counter-change

LTE
The EGTPCPathFail trap is the key for knowing when a path failure has occurred ( no responsereceived for GTPV2 request sent from MME or SGW or PGW). Amongst some basic values, itwill report the number of calls dropped, the old and new restart counters, and the reason forthe failure. In addition, the session disconnect reason gtpc-path-failure will be incremented.
The following are path failure counts that are reported from "show egtpc stat path-failure-rea-sons" on a PGW.
[local]PGW> show egtpc statistics path-failure-reasons
Reasons for path failure at EGTPC:
Echo Request restart counter change: 3
Echo Response restart counter change: 0 echo-rsp-restart-counter-change
No Echo Response received: 0 no-response-from-peer
Control message restart counter change at demux: 23 Create Session Req Restart Counter
changed or create-sess-restart-counter-change
Control message restart counter change at sessmgr: 0 cpc-restart-counter-change or upc-
restart-counter-change
Total path failures detected: 26
It is important to understand how EGTPC/GTPC and to a lesser degree EGTPU/GTPU (asuser-plane failure detection is not always configured) path failure detection is implemented tomonitor the connection between EGTP nodes. A PCAP will likely be needed to confirm that themessaging is taking place as expected.

LTE
Handover Troubleshooting
Overview
This section provides overview of basic troubleshooting commands for Handover issues in LTE.
Basic Troubleshooting
The following CLIs are useful in identifying issues during handover scenarios:
• monitor subscriber - Set verbosity to 3 and select options Y and S
• packet capture
• monitor protocol - Set verbosity to 3 and option 70 for DNS
• show support details
• dns-client query client-name <dns name>
• show dns-client cache
• show mme-service statistics -Provides an overview of handover statistics, see belowsnippet:
Handover Statistics:
Intra MME Handover:
X2-based handover:
Attempted: 4867039 Success: 4866487
Failures: 552
S1-based handover:
Attempted: 31977 Success: 7955
Failures: 24022
EUTRAN<-> EUTRAN using S10 Interface:
Outbound relocation using TAU procedure:
Attempted: 0 Success: 0
Failures: 0
Outbound relocation using S1 HO procedure:
Attempted: 0 Success: 0
Failures: 0
Inbound relocation using TAU procedure:
Attempted: 448 Success: 0
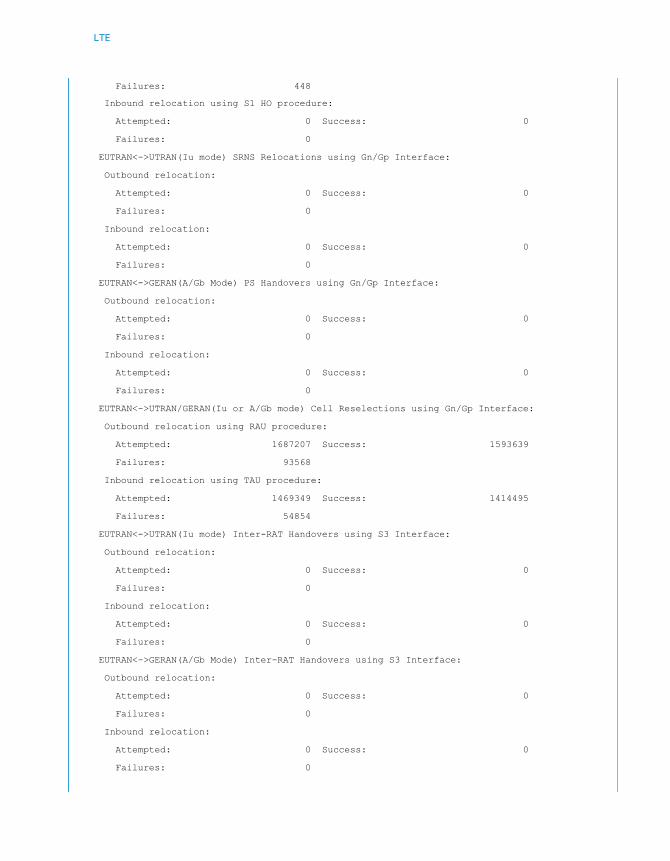
LTE
Failures: 448
Inbound relocation using S1 HO procedure:
Attempted: 0 Success: 0
Failures: 0
EUTRAN<->UTRAN(Iu mode) SRNS Relocations using Gn/Gp Interface:
Outbound relocation:
Attempted: 0 Success: 0
Failures: 0
Inbound relocation:
Attempted: 0 Success: 0
Failures: 0
EUTRAN<->GERAN(A/Gb Mode) PS Handovers using Gn/Gp Interface:
Outbound relocation:
Attempted: 0 Success: 0
Failures: 0
Inbound relocation:
Attempted: 0 Success: 0
Failures: 0
EUTRAN<->UTRAN/GERAN(Iu or A/Gb mode) Cell Reselections using Gn/Gp Interface:
Outbound relocation using RAU procedure:
Attempted: 1687207 Success: 1593639
Failures: 93568
Inbound relocation using TAU procedure:
Attempted: 1469349 Success: 1414495
Failures: 54854
EUTRAN<->UTRAN(Iu mode) Inter-RAT Handovers using S3 Interface:
Outbound relocation:
Attempted: 0 Success: 0
Failures: 0
Inbound relocation:
Attempted: 0 Success: 0
Failures: 0
EUTRAN<->GERAN(A/Gb Mode) Inter-RAT Handovers using S3 Interface:
Outbound relocation:
Attempted: 0 Success: 0
Failures: 0
Inbound relocation:
Attempted: 0 Success: 0
Failures: 0
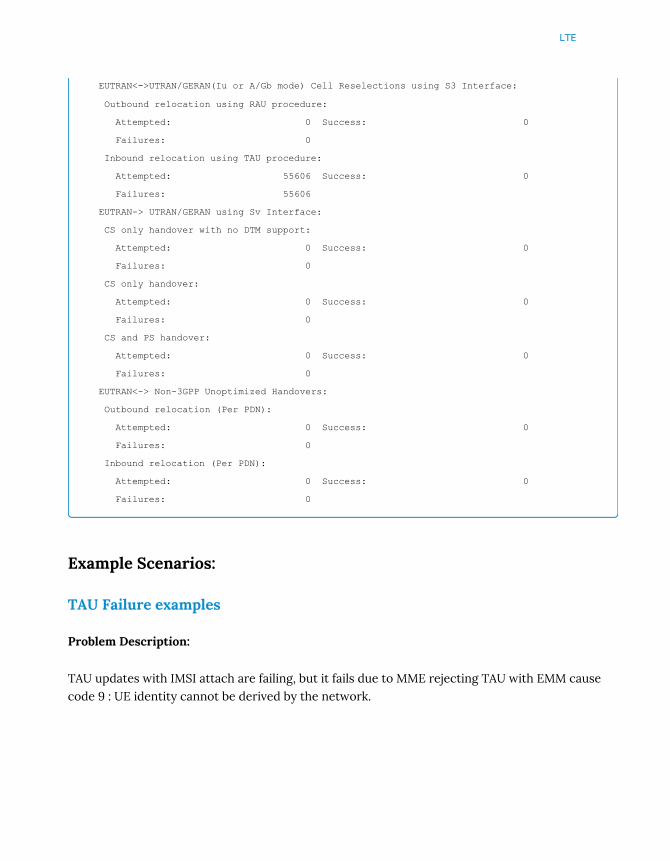
LTE
EUTRAN<->UTRAN/GERAN(Iu or A/Gb mode) Cell Reselections using S3 Interface:
Outbound relocation using RAU procedure:
Attempted: 0 Success: 0
Failures: 0
Inbound relocation using TAU procedure:
Attempted: 55606 Success: 0
Failures: 55606
EUTRAN-> UTRAN/GERAN using Sv Interface:
CS only handover with no DTM support:
Attempted: 0 Success: 0
Failures: 0
CS only handover:
Attempted: 0 Success: 0
Failures: 0
CS and PS handover:
Attempted: 0 Success: 0
Failures: 0
EUTRAN<-> Non-3GPP Unoptimized Handovers:
Outbound relocation (Per PDN):
Attempted: 0 Success: 0
Failures: 0
Inbound relocation (Per PDN):
Attempted: 0 Success: 0
Failures: 0
Example Scenarios:
TAU Failure examples
Problem Description:
TAU updates with IMSI attach are failing, but it fails due to MME rejecting TAU with EMM causecode 9 : UE identity cannot be derived by the network.
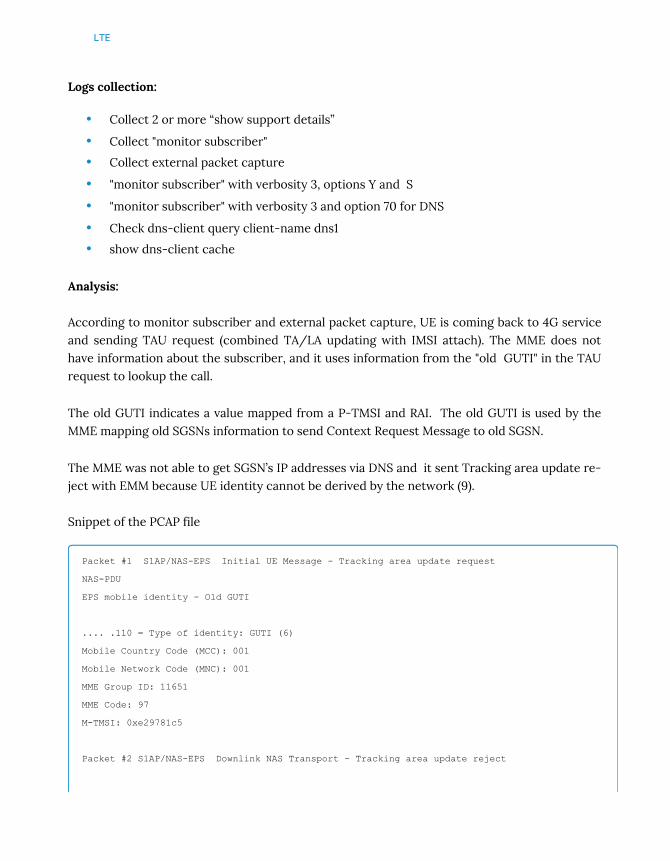
LTE
Logs collection:
• Collect 2 or more “show support details”
• Collect "monitor subscriber"
• Collect external packet capture
• "monitor subscriber" with verbosity 3, options Y and S
• "monitor subscriber" with verbosity 3 and option 70 for DNS
• Check dns-client query client-name dns1
• show dns-client cache
Analysis:
According to monitor subscriber and external packet capture, UE is coming back to 4G serviceand sending TAU request (combined TA/LA updating with IMSI attach). The MME does nothave information about the subscriber, and it uses information from the "old GUTI" in the TAUrequest to lookup the call.
The old GUTI indicates a value mapped from a P-TMSI and RAI. The old GUTI is used by theMME mapping old SGSNs information to send Context Request Message to old SGSN.
The MME was not able to get SGSN’s IP addresses via DNS and it sent Tracking area update re-ject with EMM because UE identity cannot be derived by the network (9).
Snippet of the PCAP file
Packet #1 S1AP/NAS-EPS Initial UE Message - Tracking area update request
NAS-PDU
EPS mobile identity - Old GUTI
.... .110 = Type of identity: GUTI (6)
Mobile Country Code (MCC): 001
Mobile Network Code (MNC): 001
MME Group ID: 11651
MME Code: 97
M-TMSI: 0xe29781c5
Packet #2 S1AP/NAS-EPS Downlink NAS Transport - Tracking area update reject

LTE
NAS-PDU
EMM cause
Cause: UE identity cannot be derived by the network (9)
Snippet of the MME's configuration:
mme-service MME
nri length 5 plmn-id mcc 001 mnc 001
According to 3GPP TS 23.003 V9.9.0 (2011-12) the following mappings are being used.
E?UTRAN <MCC> maps to GERAN/UTRAN <MCC>
E?UTRAN <MNC> maps to GERAN/UTRAN <MNC>
E?UTRAN <MME Group ID> maps to GERAN/UTRAN <LAC>
E?UTRAN <MME Code> maps to GERAN/UTRAN <RAC> and is also copied into the 8 most sig-nificant bits of the NRI field within the P?TMSI;
NRI length is 5. MME code = 97 = 1100001. Prepend 0 to previous value and get the result of:01100001 where 5 most significant bits are NRI 01100 that equals C in hex.
DNS requests sent by the MME are the followings.
nri-sgsn000c.rac0097.lac2d83.rac.epc.mnc001.mcc001.3gppnetwork.org (NAPTR RRs)
rac0097.lac2d83.rac.epc.mnc001.mcc001.3gppnetwork.org (NAPTR RRs)
nri000c.rac0097.lac2d83.mnc001.mcc001.gprs (A/AAAA RRs)
rac0097.lac2d83.mnc001.mcc001.gprs (A/AAAA RRs)
The DNS queries can be checked with commands if DNS client is configured on the chassis.
Below are examples of the DNS test queries – DNS replied with "DNS record does not exist".
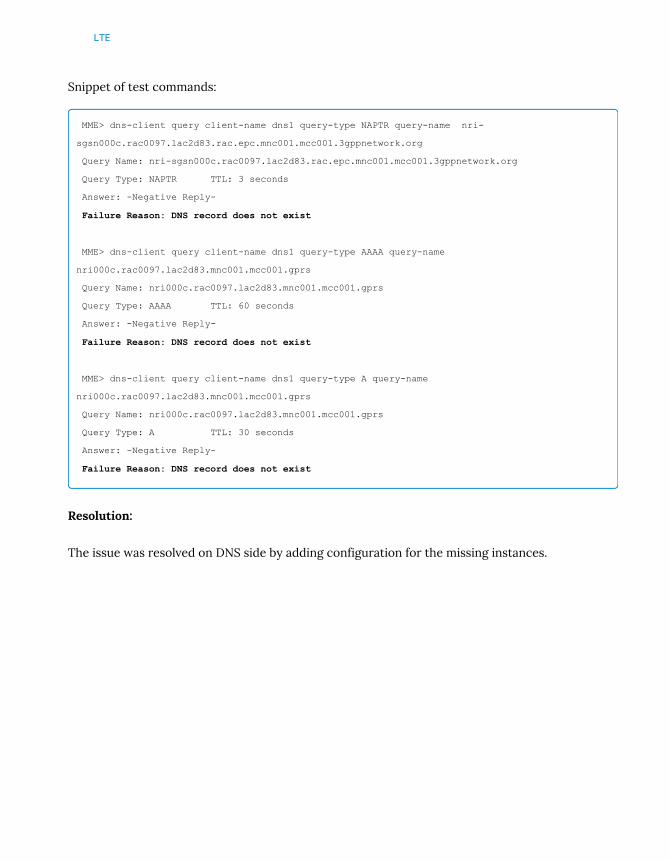
LTE
Snippet of test commands:
MME> dns-client query client-name dns1 query-type NAPTR query-name nri-
sgsn000c.rac0097.lac2d83.rac.epc.mnc001.mcc001.3gppnetwork.org
Query Name: nri-sgsn000c.rac0097.lac2d83.rac.epc.mnc001.mcc001.3gppnetwork.org
Query Type: NAPTR TTL: 3 seconds
Answer: -Negative Reply-
Failure Reason: DNS record does not exist
MME> dns-client query client-name dns1 query-type AAAA query-name
nri000c.rac0097.lac2d83.mnc001.mcc001.gprs
Query Name: nri000c.rac0097.lac2d83.mnc001.mcc001.gprs
Query Type: AAAA TTL: 60 seconds
Answer: -Negative Reply-
Failure Reason: DNS record does not exist
MME> dns-client query client-name dns1 query-type A query-name
nri000c.rac0097.lac2d83.mnc001.mcc001.gprs
Query Name: nri000c.rac0097.lac2d83.mnc001.mcc001.gprs
Query Type: A TTL: 30 seconds
Answer: -Negative Reply-
Failure Reason: DNS record does not exist
Resolution:
The issue was resolved on DNS side by adding configuration for the missing instances.

Session Troubleshooting


Session Troubleshooting
Overview
This chapters covers the session troubleshooting commands used in ASR 5000/ASR 5500.
Monitor Subscriber Utility
Monitor subscriber provides the ability to trace control path messages and data traffic on a persubscriber basis. Operators can trace control messages of a particular subscriber using IMSI,username, callid, or next incoming call (next-call).
Here is an example of the command as it would be entered into the system using the IMSI para-meter:
[local]RTP-ARES> monitor subscriber imsi <Mobile Station Identifier - a sequence of digits>
Below is a list of the most commonly used monitor subscriber options:
imsi - Specific International Mobile Subscriber Identification (IMSI). Must be
followed by 3 digits of MCC(Mobile Country Code) 2 or 3 digits of
MNC(Mobile Network Code) and the rest with MSIN(Mobile Subscriber
Identification Number). The total should not exceed 15 digits. Ex
123-45-678910234 can be entered as 12345678910234
ipaddr - Specific IP address. Must be followed by IPv4 address in dotted decimal
notation
msisdn - Specific Mobile Station Integrated Services Digital Network (MSISDN)
Number. Must be followed by CC(Country Code) and National (significant)
mobile number. The total should not exceed 15 digits. Ex 91-9123412345
can be entered as 919123412345
next-call - Monitors the next call established in the system
username - Name of specific user within current context. Must be followed by user
name
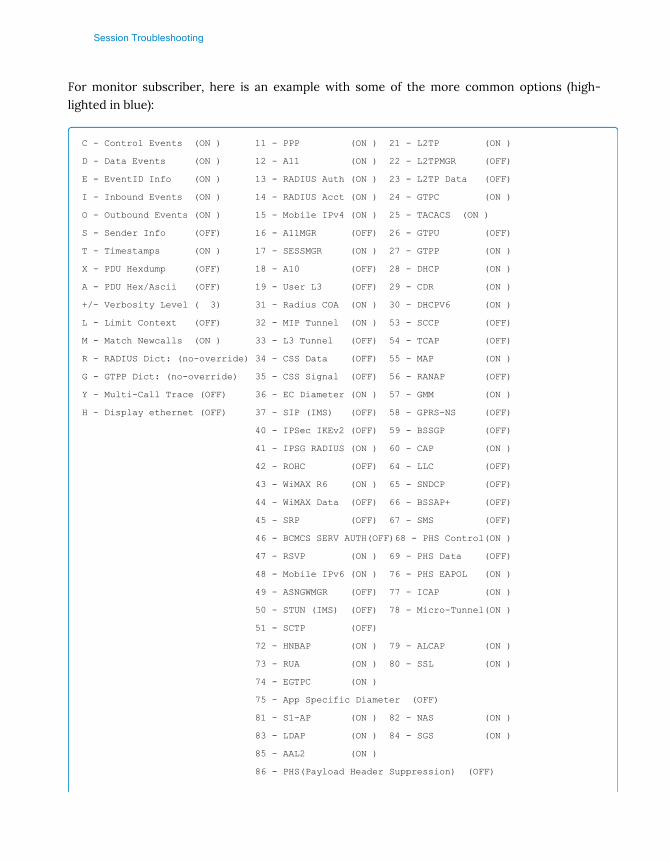
Session Troubleshooting
For monitor subscriber, here is an example with some of the more common options (high-lighted in blue):
C - Control Events (ON ) 11 - PPP (ON ) 21 - L2TP (ON )
D - Data Events (ON ) 12 - A11 (ON ) 22 - L2TPMGR (OFF)
E - EventID Info (ON ) 13 - RADIUS Auth (ON ) 23 - L2TP Data (OFF)
I - Inbound Events (ON ) 14 - RADIUS Acct (ON ) 24 - GTPC (ON )
O - Outbound Events (ON ) 15 - Mobile IPv4 (ON ) 25 - TACACS (ON )
S - Sender Info (OFF) 16 - A11MGR (OFF) 26 - GTPU (OFF)
T - Timestamps (ON ) 17 - SESSMGR (ON ) 27 - GTPP (ON )
X - PDU Hexdump (OFF) 18 - A10 (OFF) 28 - DHCP (ON )
A - PDU Hex/Ascii (OFF) 19 - User L3 (OFF) 29 - CDR (ON )
+/- Verbosity Level ( 3) 31 - Radius COA (ON ) 30 - DHCPV6 (ON )
L - Limit Context (OFF) 32 - MIP Tunnel (ON ) 53 - SCCP (OFF)
M - Match Newcalls (ON ) 33 - L3 Tunnel (OFF) 54 - TCAP (OFF)
R - RADIUS Dict: (no-override) 34 - CSS Data (OFF) 55 - MAP (ON )
G - GTPP Dict: (no-override) 35 - CSS Signal (OFF) 56 - RANAP (OFF)
Y - Multi-Call Trace (OFF) 36 - EC Diameter (ON ) 57 - GMM (ON )
H - Display ethernet (OFF) 37 - SIP (IMS) (OFF) 58 - GPRS-NS (OFF)
40 - IPSec IKEv2 (OFF) 59 - BSSGP (OFF)
41 - IPSG RADIUS (ON ) 60 - CAP (ON )
42 - ROHC (OFF) 64 - LLC (OFF)
43 - WiMAX R6 (ON ) 65 - SNDCP (OFF)
44 - WiMAX Data (OFF) 66 - BSSAP+ (OFF)
45 - SRP (OFF) 67 - SMS (OFF)
46 - BCMCS SERV AUTH(OFF)68 - PHS Control(ON )
47 - RSVP (ON ) 69 - PHS Data (OFF)
48 - Mobile IPv6 (ON ) 76 - PHS EAPOL (ON )
49 - ASNGWMGR (OFF) 77 - ICAP (ON )
50 - STUN (IMS) (OFF) 78 - Micro-Tunnel(ON )
51 - SCTP (OFF)
72 - HNBAP (ON ) 79 - ALCAP (ON )
73 - RUA (ON ) 80 - SSL (ON )
74 - EGTPC (ON )
75 - App Specific Diameter (OFF)
81 - S1-AP (ON ) 82 - NAS (ON )
83 - LDAP (ON ) 84 - SGS (ON )
85 - AAL2 (ON )
86 - PHS(Payload Header Suppression) (OFF)
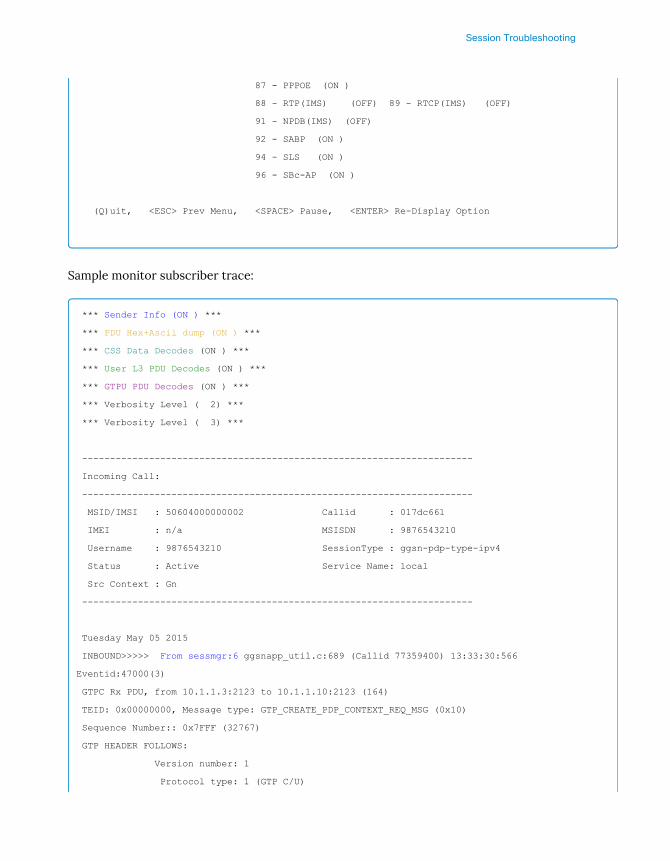
Session Troubleshooting
87 - PPPOE (ON )
88 - RTP(IMS) (OFF) 89 - RTCP(IMS) (OFF)
91 - NPDB(IMS) (OFF)
92 - SABP (ON )
94 - SLS (ON )
96 - SBc-AP (ON )
(Q)uit, <ESC> Prev Menu, <SPACE> Pause, <ENTER> Re-Display Option
Sample monitor subscriber trace:
*** Sender Info (ON ) ***
*** PDU Hex+Ascii dump (ON ) ***
*** CSS Data Decodes (ON ) ***
*** User L3 PDU Decodes (ON ) ***
*** GTPU PDU Decodes (ON ) ***
*** Verbosity Level ( 2) ***
*** Verbosity Level ( 3) ***
----------------------------------------------------------------------
Incoming Call:
----------------------------------------------------------------------
MSID/IMSI : 50604000000002 Callid : 017dc661
IMEI : n/a MSISDN : 9876543210
Username : 9876543210 SessionType : ggsn-pdp-type-ipv4
Status : Active Service Name: local
Src Context : Gn
----------------------------------------------------------------------
Tuesday May 05 2015
INBOUND>>>>> From sessmgr:6 ggsnapp_util.c:689 (Callid 77359400) 13:33:30:566
Eventid:47000(3)
GTPC Rx PDU, from 10.1.1.3:2123 to 10.1.1.10:2123 (164)
TEID: 0x00000000, Message type: GTP_CREATE_PDP_CONTEXT_REQ_MSG (0x10)
Sequence Number:: 0x7FFF (32767)
GTP HEADER FOLLOWS:
Version number: 1
Protocol type: 1 (GTP C/U)
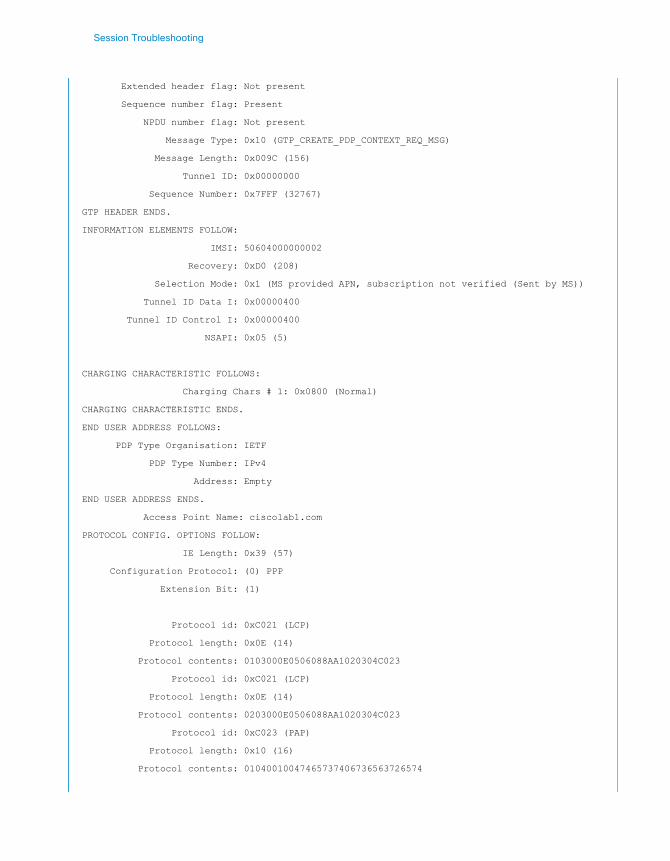
Session Troubleshooting
Extended header flag: Not present
Sequence number flag: Present
NPDU number flag: Not present
Message Type: 0x10 (GTP_CREATE_PDP_CONTEXT_REQ_MSG)
Message Length: 0x009C (156)
Tunnel ID: 0x00000000
Sequence Number: 0x7FFF (32767)
GTP HEADER ENDS.
INFORMATION ELEMENTS FOLLOW:
IMSI: 50604000000002
Recovery: 0xD0 (208)
Selection Mode: 0x1 (MS provided APN, subscription not verified (Sent by MS))
Tunnel ID Data I: 0x00000400
Tunnel ID Control I: 0x00000400
NSAPI: 0x05 (5)
CHARGING CHARACTERISTIC FOLLOWS:
Charging Chars # 1: 0x0800 (Normal)
CHARGING CHARACTERISTIC ENDS.
END USER ADDRESS FOLLOWS:
PDP Type Organisation: IETF
PDP Type Number: IPv4
Address: Empty
END USER ADDRESS ENDS.
Access Point Name: ciscolab1.com
PROTOCOL CONFIG. OPTIONS FOLLOW:
IE Length: 0x39 (57)
Configuration Protocol: (0) PPP
Extension Bit: (1)
Protocol id: 0xC021 (LCP)
Protocol length: 0x0E (14)
Protocol contents: 0103000E0506088AA1020304C023
Protocol id: 0xC021 (LCP)
Protocol length: 0x0E (14)
Protocol contents: 0203000E0506088AA1020304C023
Protocol id: 0xC023 (PAP)
Protocol length: 0x10 (16)
Protocol contents: 01040010047465737406736563726574
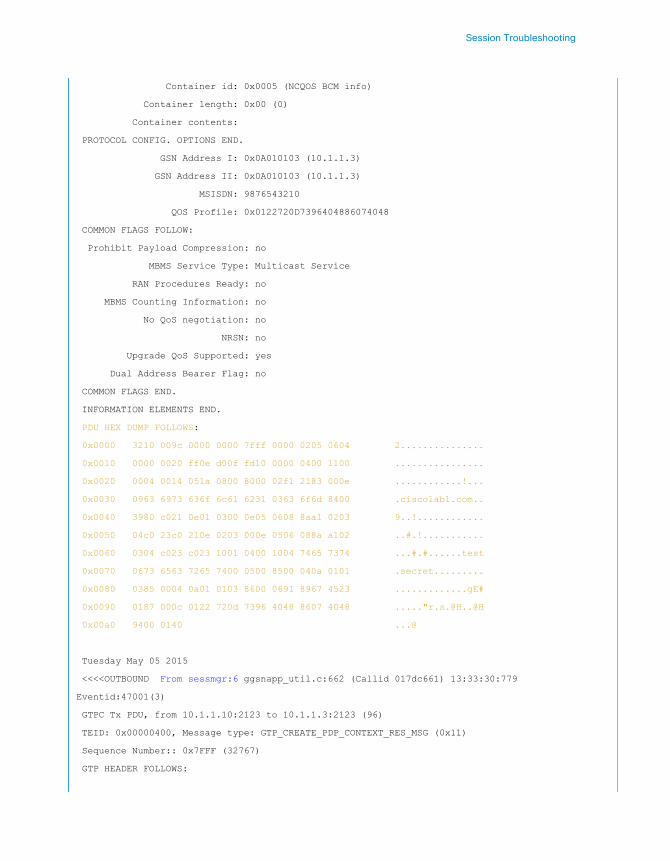
Session Troubleshooting
Container id: 0x0005 (NCQOS BCM info)
Container length: 0x00 (0)
Container contents:
PROTOCOL CONFIG. OPTIONS END.
GSN Address I: 0x0A010103 (10.1.1.3)
GSN Address II: 0x0A010103 (10.1.1.3)
MSISDN: 9876543210
QOS Profile: 0x0122720D7396404886074048
COMMON FLAGS FOLLOW:
Prohibit Payload Compression: no
MBMS Service Type: Multicast Service
RAN Procedures Ready: no
MBMS Counting Information: no
No QoS negotiation: no
NRSN: no
Upgrade QoS Supported: yes
Dual Address Bearer Flag: no
COMMON FLAGS END.
INFORMATION ELEMENTS END.
PDU HEX DUMP FOLLOWS:
0x0000 3210 009c 0000 0000 7fff 0000 0205 0604 2...............
0x0010 0000 0020 ff0e d00f fd10 0000 0400 1100 ................
0x0020 0004 0014 051a 0800 8000 02f1 2183 000e ............!...
0x0030 0963 6973 636f 6c61 6231 0363 6f6d 8400 .ciscolab1.com..
0x0040 3980 c021 0e01 0300 0e05 0608 8aa1 0203 9..!............
0x0050 04c0 23c0 210e 0203 000e 0506 088a a102 ..#.!...........
0x0060 0304 c023 c023 1001 0400 1004 7465 7374 ...#.#......test
0x0070 0673 6563 7265 7400 0500 8500 040a 0101 .secret.........
0x0080 0385 0004 0a01 0103 8600 0691 8967 4523 .............gE#
0x0090 0187 000c 0122 720d 7396 4048 8607 4048 ....."r.s.@H..@H
0x00a0 9400 0140 ...@
Tuesday May 05 2015
<<<<OUTBOUND From sessmgr:6 ggsnapp_util.c:662 (Callid 017dc661) 13:33:30:779
Eventid:47001(3)
GTPC Tx PDU, from 10.1.1.10:2123 to 10.1.1.3:2123 (96)
TEID: 0x00000400, Message type: GTP_CREATE_PDP_CONTEXT_RES_MSG (0x11)
Sequence Number:: 0x7FFF (32767)
GTP HEADER FOLLOWS:
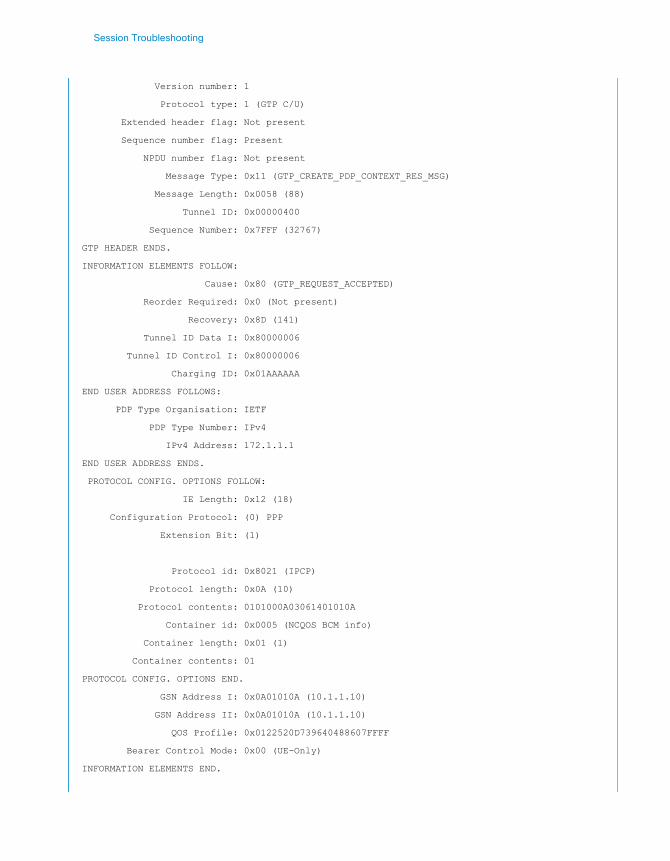
Session Troubleshooting
Version number: 1
Protocol type: 1 (GTP C/U)
Extended header flag: Not present
Sequence number flag: Present
NPDU number flag: Not present
Message Type: 0x11 (GTP_CREATE_PDP_CONTEXT_RES_MSG)
Message Length: 0x0058 (88)
Tunnel ID: 0x00000400
Sequence Number: 0x7FFF (32767)
GTP HEADER ENDS.
INFORMATION ELEMENTS FOLLOW:
Cause: 0x80 (GTP_REQUEST_ACCEPTED)
Reorder Required: 0x0 (Not present)
Recovery: 0x8D (141)
Tunnel ID Data I: 0x80000006
Tunnel ID Control I: 0x80000006
Charging ID: 0x01AAAAAA
END USER ADDRESS FOLLOWS:
PDP Type Organisation: IETF
PDP Type Number: IPv4
IPv4 Address: 172.1.1.1
END USER ADDRESS ENDS.
PROTOCOL CONFIG. OPTIONS FOLLOW:
IE Length: 0x12 (18)
Configuration Protocol: (0) PPP
Extension Bit: (1)
Protocol id: 0x8021 (IPCP)
Protocol length: 0x0A (10)
Protocol contents: 0101000A03061401010A
Container id: 0x0005 (NCQOS BCM info)
Container length: 0x01 (1)
Container contents: 01
PROTOCOL CONFIG. OPTIONS END.
GSN Address I: 0x0A01010A (10.1.1.10)
GSN Address II: 0x0A01010A (10.1.1.10)
QOS Profile: 0x0122520D739640488607FFFF
Bearer Control Mode: 0x00 (UE-Only)
INFORMATION ELEMENTS END.
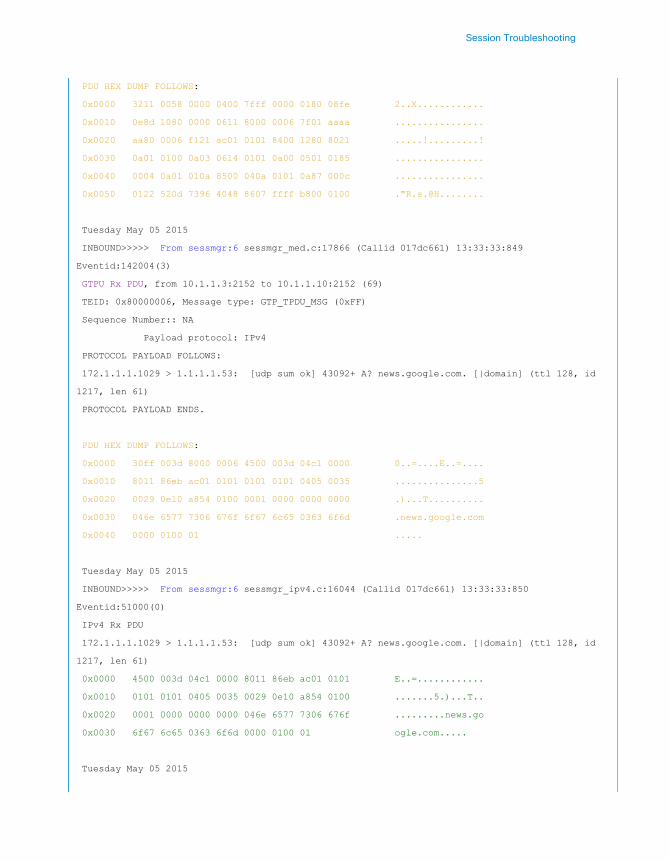
Session Troubleshooting
PDU HEX DUMP FOLLOWS:
0x0000 3211 0058 0000 0400 7fff 0000 0180 08fe 2..X............
0x0010 0e8d 1080 0000 0611 8000 0006 7f01 aaaa ................
0x0020 aa80 0006 f121 ac01 0101 8400 1280 8021 .....!.........!
0x0030 0a01 0100 0a03 0614 0101 0a00 0501 0185 ................
0x0040 0004 0a01 010a 8500 040a 0101 0a87 000c ................
0x0050 0122 520d 7396 4048 8607 ffff b800 0100 ."R.s.@H........
Tuesday May 05 2015
INBOUND>>>>> From sessmgr:6 sessmgr_med.c:17866 (Callid 017dc661) 13:33:33:849
Eventid:142004(3)
GTPU Rx PDU, from 10.1.1.3:2152 to 10.1.1.10:2152 (69)
TEID: 0x80000006, Message type: GTP_TPDU_MSG (0xFF)
Sequence Number:: NA
Payload protocol: IPv4
PROTOCOL PAYLOAD FOLLOWS:
172.1.1.1.1029 > 1.1.1.1.53: [udp sum ok] 43092+ A? news.google.com. [|domain] (ttl 128, id
1217, len 61)
PROTOCOL PAYLOAD ENDS.
PDU HEX DUMP FOLLOWS:
0x0000 30ff 003d 8000 0006 4500 003d 04c1 0000 0..=....E..=....
0x0010 8011 86eb ac01 0101 0101 0101 0405 0035 ...............5
0x0020 0029 0e10 a854 0100 0001 0000 0000 0000 .)...T..........
0x0030 046e 6577 7306 676f 6f67 6c65 0363 6f6d .news.google.com
0x0040 0000 0100 01 .....
Tuesday May 05 2015
INBOUND>>>>> From sessmgr:6 sessmgr_ipv4.c:16044 (Callid 017dc661) 13:33:33:850
Eventid:51000(0)
IPv4 Rx PDU
172.1.1.1.1029 > 1.1.1.1.53: [udp sum ok] 43092+ A? news.google.com. [|domain] (ttl 128, id
1217, len 61)
0x0000 4500 003d 04c1 0000 8011 86eb ac01 0101 E..=............
0x0010 0101 0101 0405 0035 0029 0e10 a854 0100 .......5.)...T..
0x0020 0001 0000 0000 0000 046e 6577 7306 676f .........news.go
0x0030 6f67 6c65 0363 6f6d 0000 0100 01 ogle.com.....
Tuesday May 05 2015
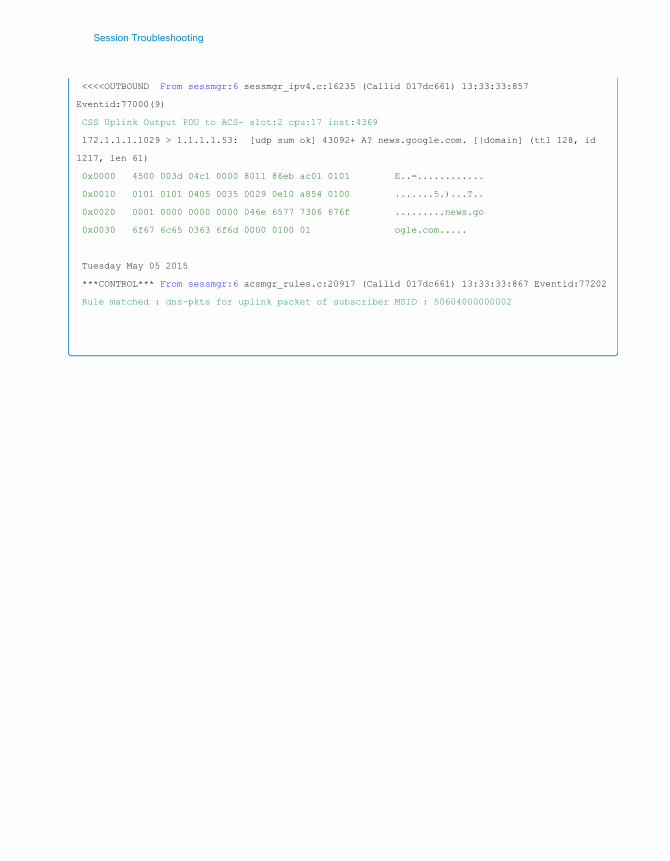
Session Troubleshooting
<<<<OUTBOUND From sessmgr:6 sessmgr_ipv4.c:16235 (Callid 017dc661) 13:33:33:857
Eventid:77000(9)
CSS Uplink Output PDU to ACS- slot:2 cpu:17 inst:4369
172.1.1.1.1029 > 1.1.1.1.53: [udp sum ok] 43092+ A? news.google.com. [|domain] (ttl 128, id
1217, len 61)
0x0000 4500 003d 04c1 0000 8011 86eb ac01 0101 E..=............
0x0010 0101 0101 0405 0035 0029 0e10 a854 0100 .......5.)...T..
0x0020 0001 0000 0000 0000 046e 6577 7306 676f .........news.go
0x0030 6f67 6c65 0363 6f6d 0000 0100 01 ogle.com.....
Tuesday May 05 2015
***CONTROL*** From sessmgr:6 acsmgr_rules.c:20917 (Callid 017dc661) 13:33:33:867 Eventid:77202
Rule matched : dns-pkts for uplink packet of subscriber MSID : 50604000000002

Session Troubleshooting
Protocol Analyzer Utility
Overview
The utility displays information for all sessions that are currently being processed. This cancause a large amount of data to be displayed, depending on the number of protocols monitored,and the number of sessions in progress. Logging should be enabled on the terminal client torecord all of the information that is generated. A monitor protocol on a busy interface (for ex-ample, S1AP) should be planned during a maintenance window.
Troubleshooting Command
Below are the instructions to start a monitor protocol session:
1 Run from the Exec mode by entering the "monitor protocol" command. An output listing
all the currently available protocols, each with an assigned number, is displayed.
2 Select the protocol to be monitored by entering the associated number at the
"Select:" prompt. A right arrow ( ">" ) appears next to the selected protocol.
3 Repeat step 2 as needed to choose multiple protocols.
4 Press B to begin the protocol monitor, and the following warning will be displayed:
WARNING!!! You have selected options that can DISRUPT USER SERVICE Existing CALLS MAY BE
DROPPED and/or new CALLS MAY FAIL!!! (Under heavy call load, some debugging output may not be
displayed) Proceed? - Select (Y)es or (N)o
5 Enter Y to proceed with the monitor or N to go back to the previous menu. If Y is
entered the following menu will appear:
C - Control Events (ON ) D - Data Events (ON ) E - EventID Info (ON ) H - Disply
ethernet (ON ) I - Inbound Events (ON ) O - Outbound Event (ON ) S - Sender Info (OFF) T
- Timestamps (ON ) X - PDU Hexdump (OFF) A - PDU Hex/Ascii (OFF) +/- Verbosity Level
( 1) L - Limit Context (OFF) M - Match Newcalls (ON ) R - RADIUS Dict (no-override) G -
GTPP Dict (no-override) Y - Multi-Call Trace ((OFF)) (Q)uit, <ESC> Prev Menu,
<SPACE> Pause, <ENTER> Re-Display Options

Session Troubleshooting
6 Configure the amount of information that is displayed by the monitor.
• To enable or disable options, enter the letter associated with that option (C, D,E, etc.).
• To increase or decrease the verbosity, use the plus ( + ) or minus ( - ) keys.
• The current state, ON (enabled) or OFF (disabled), is shown to the right of eachoption.
7 Typically for troubleshooting purposes, verbosity 3 or higher is recommended.
8 Press the Enter key to refresh the screen and begin monitoring. To quit the protocol
monitor and return to the prompt, press q.
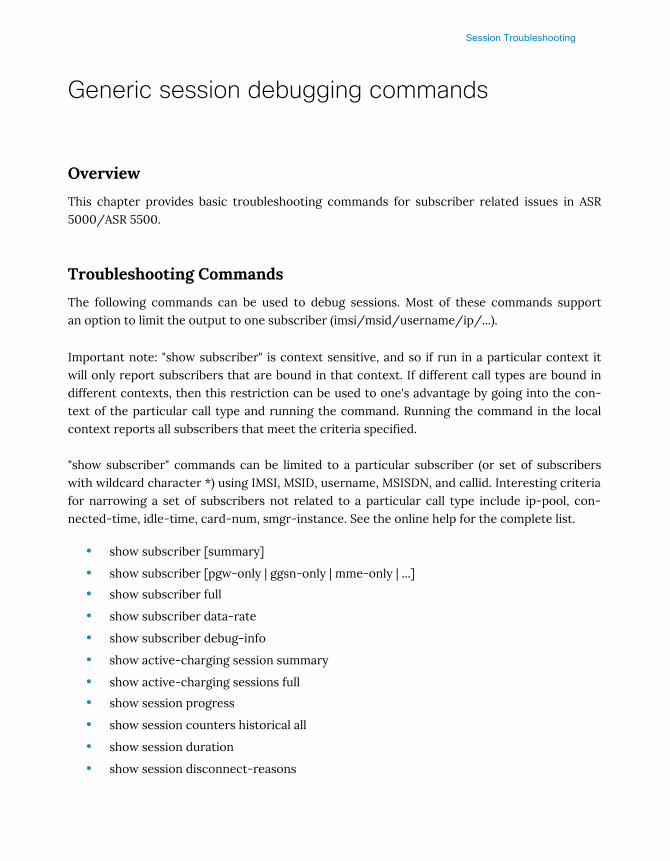
Session Troubleshooting
Generic session debugging commands
Overview
This chapter provides basic troubleshooting commands for subscriber related issues in ASR5000/ASR 5500.
Troubleshooting Commands
The following commands can be used to debug sessions. Most of these commands supportan option to limit the output to one subscriber (imsi/msid/username/ip/...).
Important note: "show subscriber" is context sensitive, and so if run in a particular context itwill only report subscribers that are bound in that context. If different call types are bound indifferent contexts, then this restriction can be used to one's advantage by going into the con-text of the particular call type and running the command. Running the command in the localcontext reports all subscribers that meet the criteria specified.
"show subscriber" commands can be limited to a particular subscriber (or set of subscriberswith wildcard character *) using IMSI, MSID, username, MSISDN, and callid. Interesting criteriafor narrowing a set of subscribers not related to a particular call type include ip-pool, con-nected-time, idle-time, card-num, smgr-instance. See the online help for the complete list.
• show subscriber [summary]
• show subscriber [pgw-only | ggsn-only | mme-only | ...]
• show subscriber full
• show subscriber data-rate
• show subscriber debug-info
• show active-charging session summary
• show active-charging sessions full
• show session progress
• show session counters historical all
• show session duration
• show session disconnect-reasons
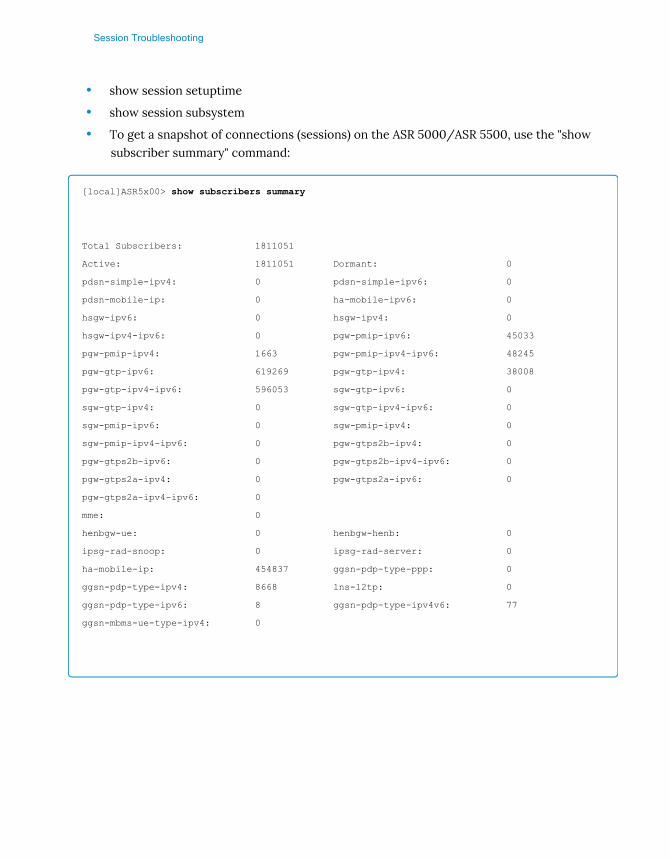
Session Troubleshooting
• show session setuptime
• show session subsystem
• To get a snapshot of connections (sessions) on the ASR 5000/ASR 5500, use the "showsubscriber summary" command:
[local]ASR5x00> show subscribers summary
Total Subscribers: 1811051
Active: 1811051 Dormant: 0
pdsn-simple-ipv4: 0 pdsn-simple-ipv6: 0
pdsn-mobile-ip: 0 ha-mobile-ipv6: 0
hsgw-ipv6: 0 hsgw-ipv4: 0
hsgw-ipv4-ipv6: 0 pgw-pmip-ipv6: 45033
pgw-pmip-ipv4: 1663 pgw-pmip-ipv4-ipv6: 48245
pgw-gtp-ipv6: 619269 pgw-gtp-ipv4: 38008
pgw-gtp-ipv4-ipv6: 596053 sgw-gtp-ipv6: 0
sgw-gtp-ipv4: 0 sgw-gtp-ipv4-ipv6: 0
sgw-pmip-ipv6: 0 sgw-pmip-ipv4: 0
sgw-pmip-ipv4-ipv6: 0 pgw-gtps2b-ipv4: 0
pgw-gtps2b-ipv6: 0 pgw-gtps2b-ipv4-ipv6: 0
pgw-gtps2a-ipv4: 0 pgw-gtps2a-ipv6: 0
pgw-gtps2a-ipv4-ipv6: 0
mme: 0
henbgw-ue: 0 henbgw-henb: 0
ipsg-rad-snoop: 0 ipsg-rad-server: 0
ha-mobile-ip: 454837 ggsn-pdp-type-ppp: 0
ggsn-pdp-type-ipv4: 8668 lns-l2tp: 0
ggsn-pdp-type-ipv6: 8 ggsn-pdp-type-ipv4v6: 77
ggsn-mbms-ue-type-ipv4: 0
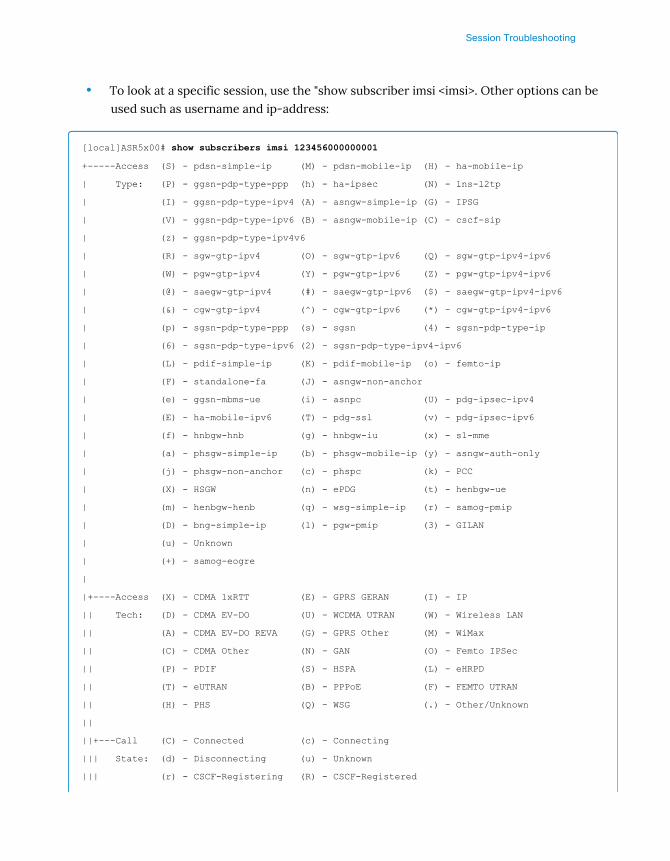
Session Troubleshooting
• To look at a specific session, use the "show subscriber imsi <imsi>. Other options can beused such as username and ip-address:
[local]ASR5x00# show subscribers imsi 123456000000001
+-----Access (S) - pdsn-simple-ip (M) - pdsn-mobile-ip (H) - ha-mobile-ip
| Type: (P) - ggsn-pdp-type-ppp (h) - ha-ipsec (N) - lns-l2tp
| (I) - ggsn-pdp-type-ipv4 (A) - asngw-simple-ip (G) - IPSG
| (V) - ggsn-pdp-type-ipv6 (B) - asngw-mobile-ip (C) - cscf-sip
| (z) - ggsn-pdp-type-ipv4v6
| (R) - sgw-gtp-ipv4 (O) - sgw-gtp-ipv6 (Q) - sgw-gtp-ipv4-ipv6
| (W) - pgw-gtp-ipv4 (Y) - pgw-gtp-ipv6 (Z) - pgw-gtp-ipv4-ipv6
| (@) - saegw-gtp-ipv4 (#) - saegw-gtp-ipv6 ($) - saegw-gtp-ipv4-ipv6
| (&) - cgw-gtp-ipv4 (^) - cgw-gtp-ipv6 (*) - cgw-gtp-ipv4-ipv6
| (p) - sgsn-pdp-type-ppp (s) - sgsn (4) - sgsn-pdp-type-ip
| (6) - sgsn-pdp-type-ipv6 (2) - sgsn-pdp-type-ipv4-ipv6
| (L) - pdif-simple-ip (K) - pdif-mobile-ip (o) - femto-ip
| (F) - standalone-fa (J) - asngw-non-anchor
| (e) - ggsn-mbms-ue (i) - asnpc (U) - pdg-ipsec-ipv4
| (E) - ha-mobile-ipv6 (T) - pdg-ssl (v) - pdg-ipsec-ipv6
| (f) - hnbgw-hnb (g) - hnbgw-iu (x) - s1-mme
| (a) - phsgw-simple-ip (b) - phsgw-mobile-ip (y) - asngw-auth-only
| (j) - phsgw-non-anchor (c) - phspc (k) - PCC
| (X) - HSGW (n) - ePDG (t) - henbgw-ue
| (m) - henbgw-henb (q) - wsg-simple-ip (r) - samog-pmip
| (D) - bng-simple-ip (l) - pgw-pmip (3) - GILAN
| (u) - Unknown
| (+) - samog-eogre
|
|+----Access (X) - CDMA 1xRTT (E) - GPRS GERAN (I) - IP
|| Tech: (D) - CDMA EV-DO (U) - WCDMA UTRAN (W) - Wireless LAN
|| (A) - CDMA EV-DO REVA (G) - GPRS Other (M) - WiMax
|| (C) - CDMA Other (N) - GAN (O) - Femto IPSec
|| (P) - PDIF (S) - HSPA (L) - eHRPD
|| (T) - eUTRAN (B) - PPPoE (F) - FEMTO UTRAN
|| (H) - PHS (Q) - WSG (.) - Other/Unknown
||
||+---Call (C) - Connected (c) - Connecting
||| State: (d) - Disconnecting (u) - Unknown
||| (r) - CSCF-Registering (R) - CSCF-Registered
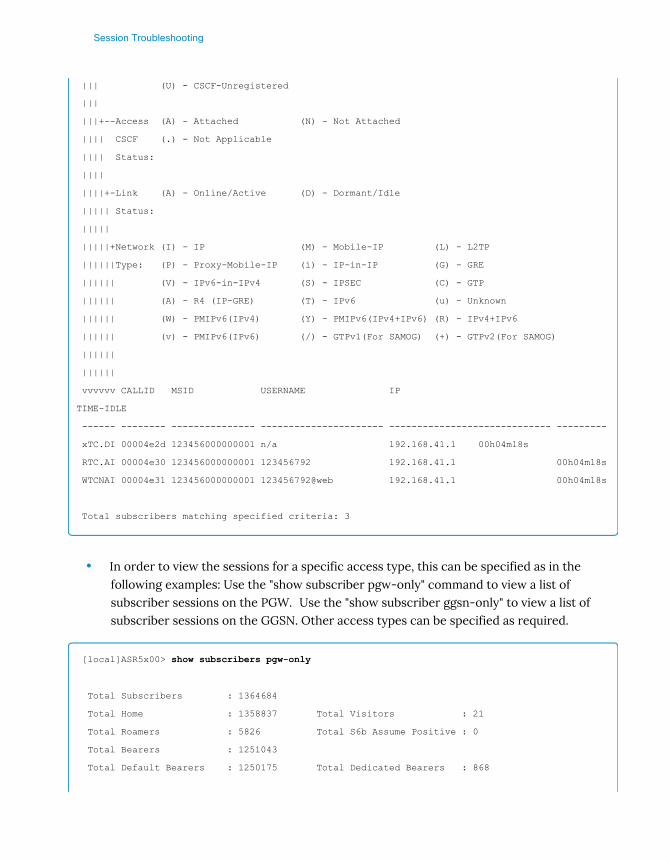
Session Troubleshooting
||| (U) - CSCF-Unregistered
|||
|||+--Access (A) - Attached (N) - Not Attached
|||| CSCF (.) - Not Applicable
|||| Status:
||||
||||+-Link (A) - Online/Active (D) - Dormant/Idle
||||| Status:
|||||
|||||+Network (I) - IP (M) - Mobile-IP (L) - L2TP
||||||Type: (P) - Proxy-Mobile-IP (i) - IP-in-IP (G) - GRE
|||||| (V) - IPv6-in-IPv4 (S) - IPSEC (C) - GTP
|||||| (A) - R4 (IP-GRE) (T) - IPv6 (u) - Unknown
|||||| (W) - PMIPv6(IPv4) (Y) - PMIPv6(IPv4+IPv6) (R) - IPv4+IPv6
|||||| (v) - PMIPv6(IPv6) (/) - GTPv1(For SAMOG) (+) - GTPv2(For SAMOG)
||||||
||||||
vvvvvv CALLID MSID USERNAME IP
TIME-IDLE
------ -------- --------------- ---------------------- ----------------------------- ---------
xTC.DI 00004e2d 123456000000001 n/a 192.168.41.1 00h04m18s
RTC.AI 00004e30 123456000000001 123456792 192.168.41.1 00h04m18s
WTCNAI 00004e31 123456000000001 123456792@web 192.168.41.1 00h04m18s
Total subscribers matching specified criteria: 3
• In order to view the sessions for a specific access type, this can be specified as in thefollowing examples: Use the "show subscriber pgw-only" command to view a list ofsubscriber sessions on the PGW. Use the "show subscriber ggsn-only" to view a list ofsubscriber sessions on the GGSN. Other access types can be specified as required.
[local]ASR5x00> show subscribers pgw-only
Total Subscribers : 1364684
Total Home : 1358837 Total Visitors : 21
Total Roamers : 5826 Total S6b Assume Positive : 0
Total Bearers : 1251043
Total Default Bearers : 1250175 Total Dedicated Bearers : 868
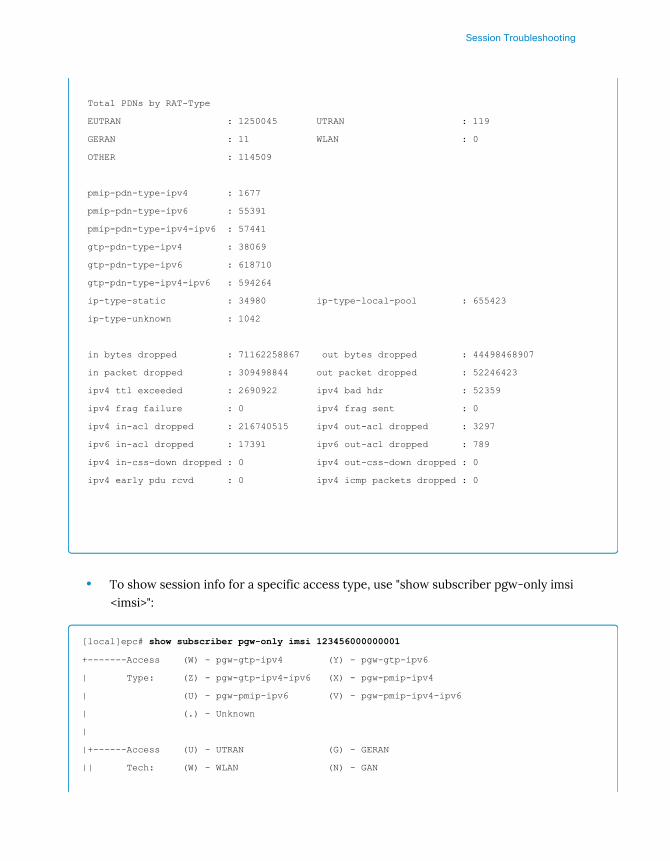
Session Troubleshooting
Total PDNs by RAT-Type
EUTRAN : 1250045 UTRAN : 119
GERAN : 11 WLAN : 0
OTHER : 114509
pmip-pdn-type-ipv4 : 1677
pmip-pdn-type-ipv6 : 55391
pmip-pdn-type-ipv4-ipv6 : 57441
gtp-pdn-type-ipv4 : 38069
gtp-pdn-type-ipv6 : 618710
gtp-pdn-type-ipv4-ipv6 : 594264
ip-type-static : 34980 ip-type-local-pool : 655423
ip-type-unknown : 1042
in bytes dropped : 71162258867 out bytes dropped : 44498468907
in packet dropped : 309498844 out packet dropped : 52246423
ipv4 ttl exceeded : 2690922 ipv4 bad hdr : 52359
ipv4 frag failure : 0 ipv4 frag sent : 0
ipv4 in-acl dropped : 216740515 ipv4 out-acl dropped : 3297
ipv6 in-acl dropped : 17391 ipv6 out-acl dropped : 789
ipv4 in-css-down dropped : 0 ipv4 out-css-down dropped : 0
ipv4 early pdu rcvd : 0 ipv4 icmp packets dropped : 0
• To show session info for a specific access type, use "show subscriber pgw-only imsi<imsi>":
[local]epc# show subscriber pgw-only imsi 123456000000001
+-------Access (W) - pgw-gtp-ipv4 (Y) - pgw-gtp-ipv6
| Type: (Z) - pgw-gtp-ipv4-ipv6 (X) - pgw-pmip-ipv4
| (U) - pgw-pmip-ipv6 (V) - pgw-pmip-ipv4-ipv6
| (.) - Unknown
|
|+------Access (U) - UTRAN (G) - GERAN
|| Tech: (W) - WLAN (N) - GAN
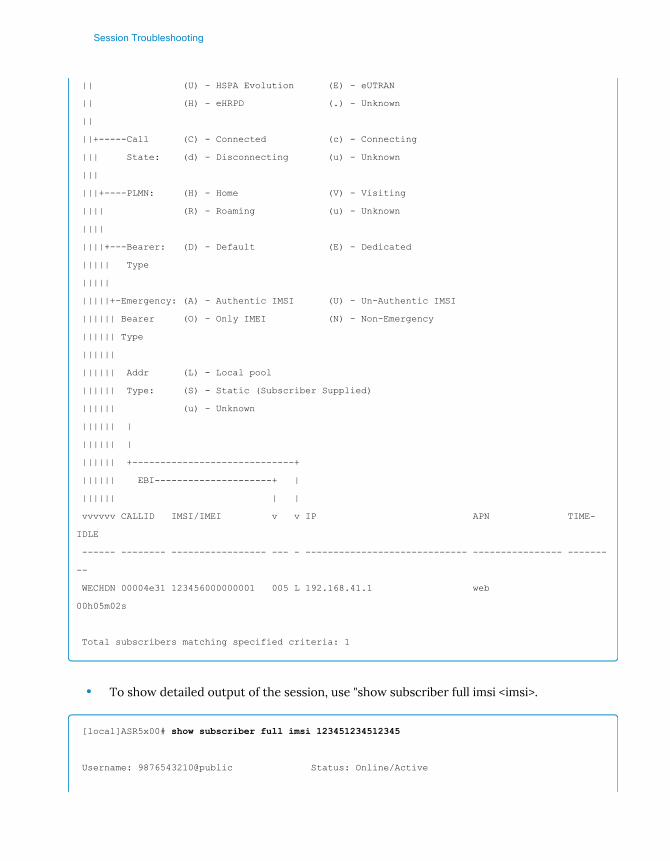
Session Troubleshooting
|| (U) - HSPA Evolution (E) - eUTRAN
|| (H) - eHRPD (.) - Unknown
||
||+-----Call (C) - Connected (c) - Connecting
||| State: (d) - Disconnecting (u) - Unknown
|||
|||+----PLMN: (H) - Home (V) - Visiting
|||| (R) - Roaming (u) - Unknown
||||
||||+---Bearer: (D) - Default (E) - Dedicated
||||| Type
|||||
|||||+-Emergency: (A) - Authentic IMSI (U) - Un-Authentic IMSI
|||||| Bearer (O) - Only IMEI (N) - Non-Emergency
|||||| Type
||||||
|||||| Addr (L) - Local pool
|||||| Type: (S) - Static (Subscriber Supplied)
|||||| (u) - Unknown
|||||| |
|||||| |
|||||| +-----------------------------+
|||||| EBI---------------------+ |
|||||| | |
vvvvvv CALLID IMSI/IMEI v v IP APN TIME-
IDLE
------ -------- ----------------- --- - ----------------------------- ---------------- -------
--
WECHDN 00004e31 123456000000001 005 L 192.168.41.1 web
00h05m02s
Total subscribers matching specified criteria: 1
• To show detailed output of the session, use "show subscriber full imsi <imsi>.
[local]ASR5x00# show subscriber full imsi 123451234512345
Username: 9876543210@public Status: Online/Active
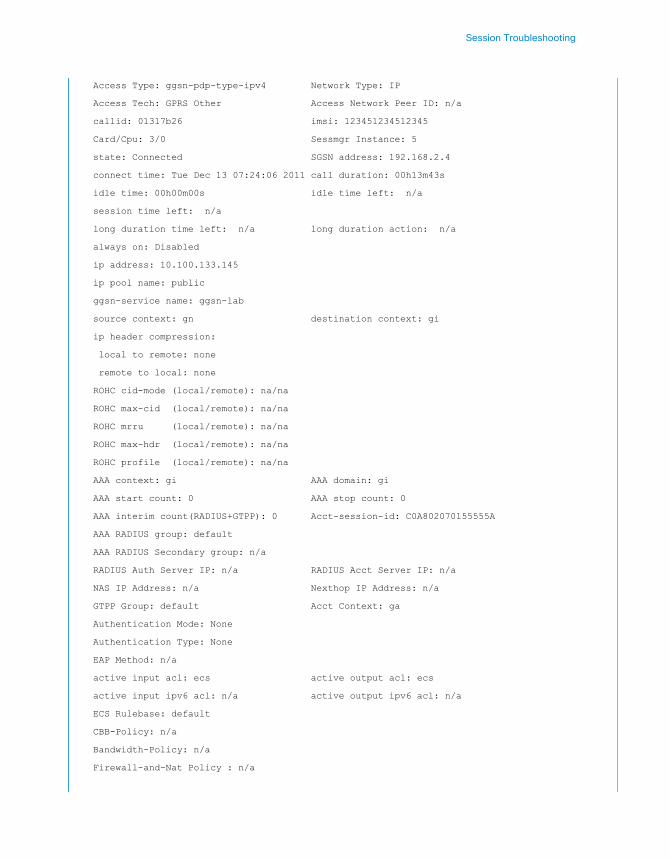
Session Troubleshooting
Access Type: ggsn-pdp-type-ipv4 Network Type: IP
Access Tech: GPRS Other Access Network Peer ID: n/a
callid: 01317b26 imsi: 123451234512345
Card/Cpu: 3/0 Sessmgr Instance: 5
state: Connected SGSN address: 192.168.2.4
connect time: Tue Dec 13 07:24:06 2011 call duration: 00h13m43s
idle time: 00h00m00s idle time left: n/a
session time left: n/a
long duration time left: n/a long duration action: n/a
always on: Disabled
ip address: 10.100.133.145
ip pool name: public
ggsn-service name: ggsn-lab
source context: gn destination context: gi
ip header compression:
local to remote: none
remote to local: none
ROHC cid-mode (local/remote): na/na
ROHC max-cid (local/remote): na/na
ROHC mrru (local/remote): na/na
ROHC max-hdr (local/remote): na/na
ROHC profile (local/remote): na/na
AAA context: gi AAA domain: gi
AAA start count: 0 AAA stop count: 0
AAA interim count(RADIUS+GTPP): 0 Acct-session-id: C0A802070155555A
AAA RADIUS group: default
AAA RADIUS Secondary group: n/a
RADIUS Auth Server IP: n/a RADIUS Acct Server IP: n/a
NAS IP Address: n/a Nexthop IP Address: n/a
GTPP Group: default Acct Context: ga
Authentication Mode: None
Authentication Type: None
EAP Method: n/a
active input acl: ecs active output acl: ecs
active input ipv6 acl: n/a active output ipv6 acl: n/a
ECS Rulebase: default
CBB-Policy: n/a
Bandwidth-Policy: n/a
Firewall-and-Nat Policy : n/a

Session Troubleshooting
Nat Policy: Not-required
CF Policy ID: n/a
TPO Policy: n/a
active input plcy grp: n/a active output plcy grp: n/a
Layer 3 tunneling: Disabled
prepaid status: Off
external inline srvr processing: Off
IPv6 Egress address filtering: Off
IPv6 DNS Proxy: Disabled
Proxy DNS Intercept List: n/a
access-link ip-frag: df-ignore
ignore DF-bit data-tunnel: On MIP grat-ARP mode: n/a
Downlink traffic-policing: Disabled
Uplink traffic-policing: Disabled
Downlink traffic-shaping: Disabled
Uplink traffic-shaping: Disabled
Radius Accounting Mode: access-flow-based auxiliary-flows
Downlink CSS Information
Service/ACL Names: ecs/ecs
(Active Charging Optimized Mode)
downlink pkts to svc: 926 downlink pkts from svc: 926
Uplink CSS Information
Service/ACL Names: ecs/ecs
(Active Charging Optimized Mode)
uplink pkts to svc: 807 uplink pkts from svc: 807
Collapsed cscf subscribers: none
input pkts: 807 output pkts: 926
input bytes: 143864 output bytes: 657989
input bytes dropped: 0 output bytes dropped: 0
input pkts dropped: 0 output pkts dropped: 0
output pkts dropped lorc: 0
input pkts dropped due to lorc : 0 output pkts dropped due to lorc :
0
input bytes dropped due to lorc : 0
pk rate from user(bps): 584 pk rate to user(bps): 398
ave rate from user(bps): 446 ave rate to user(bps): 293
sust rate from user(bps): 446 sust rate to user(bps): 294
pk rate from user(pps): 0 pk rate to user(pps): 0
ave rate from user(pps): 0 ave rate to user(pps): 0
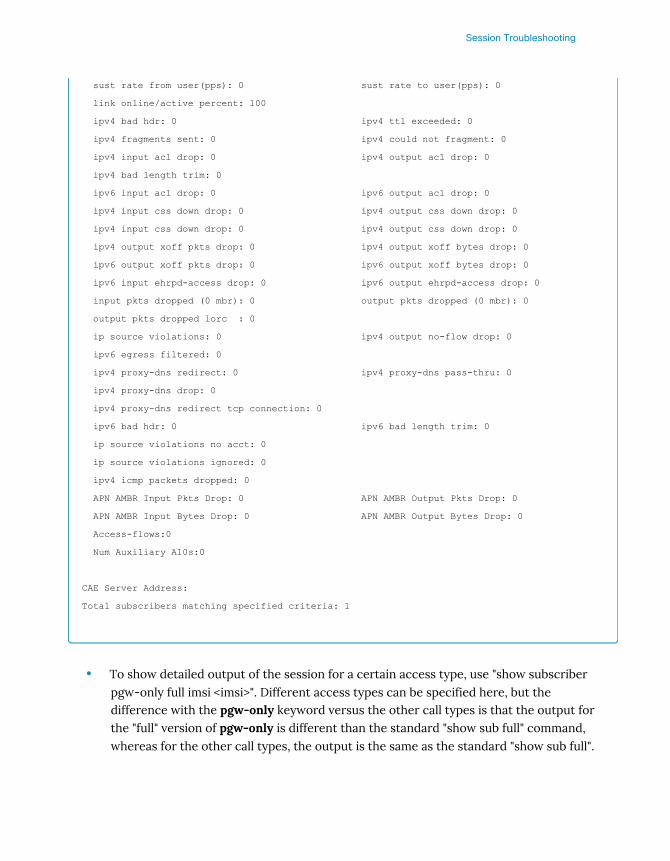
Session Troubleshooting
sust rate from user(pps): 0 sust rate to user(pps): 0
link online/active percent: 100
ipv4 bad hdr: 0 ipv4 ttl exceeded: 0
ipv4 fragments sent: 0 ipv4 could not fragment: 0
ipv4 input acl drop: 0 ipv4 output acl drop: 0
ipv4 bad length trim: 0
ipv6 input acl drop: 0 ipv6 output acl drop: 0
ipv4 input css down drop: 0 ipv4 output css down drop: 0
ipv4 input css down drop: 0 ipv4 output css down drop: 0
ipv4 output xoff pkts drop: 0 ipv4 output xoff bytes drop: 0
ipv6 output xoff pkts drop: 0 ipv6 output xoff bytes drop: 0
ipv6 input ehrpd-access drop: 0 ipv6 output ehrpd-access drop: 0
input pkts dropped (0 mbr): 0 output pkts dropped (0 mbr): 0
output pkts dropped lorc : 0
ip source violations: 0 ipv4 output no-flow drop: 0
ipv6 egress filtered: 0
ipv4 proxy-dns redirect: 0 ipv4 proxy-dns pass-thru: 0
ipv4 proxy-dns drop: 0
ipv4 proxy-dns redirect tcp connection: 0
ipv6 bad hdr: 0 ipv6 bad length trim: 0
ip source violations no acct: 0
ip source violations ignored: 0
ipv4 icmp packets dropped: 0
APN AMBR Input Pkts Drop: 0 APN AMBR Output Pkts Drop: 0
APN AMBR Input Bytes Drop: 0 APN AMBR Output Bytes Drop: 0
Access-flows:0
Num Auxiliary A10s:0
CAE Server Address:
Total subscribers matching specified criteria: 1
• To show detailed output of the session for a certain access type, use "show subscriberpgw-only full imsi <imsi>". Different access types can be specified here, but thedifference with the pgw-only keyword versus the other call types is that the output forthe "full" version of pgw-only is different than the standard "show sub full" command,whereas for the other call types, the output is the same as the standard "show sub full".
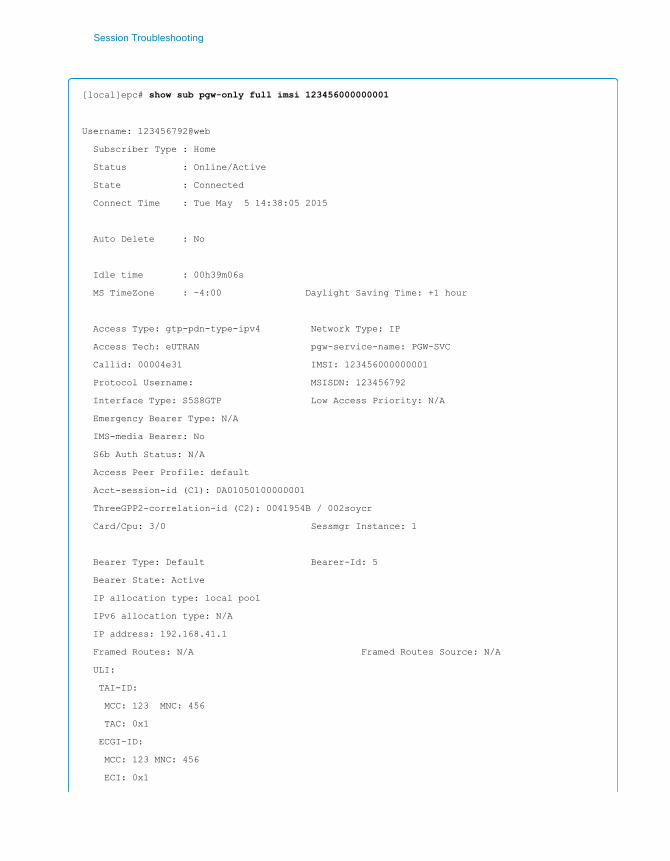
Session Troubleshooting
[local]epc# show sub pgw-only full imsi 123456000000001
Username: 123456792@web
Subscriber Type : Home
Status : Online/Active
State : Connected
Connect Time : Tue May 5 14:38:05 2015
Auto Delete : No
Idle time : 00h39m06s
MS TimeZone : -4:00 Daylight Saving Time: +1 hour
Access Type: gtp-pdn-type-ipv4 Network Type: IP
Access Tech: eUTRAN pgw-service-name: PGW-SVC
Callid: 00004e31 IMSI: 123456000000001
Protocol Username: MSISDN: 123456792
Interface Type: S5S8GTP Low Access Priority: N/A
Emergency Bearer Type: N/A
IMS-media Bearer: No
S6b Auth Status: N/A
Access Peer Profile: default
Acct-session-id (C1): 0A01050100000001
ThreeGPP2-correlation-id (C2): 0041954B / 002soycr
Card/Cpu: 3/0 Sessmgr Instance: 1
Bearer Type: Default Bearer-Id: 5
Bearer State: Active
IP allocation type: local pool
IPv6 allocation type: N/A
IP address: 192.168.41.1
Framed Routes: N/A Framed Routes Source: N/A
ULI:
TAI-ID:
MCC: 123 MNC: 456
TAC: 0x1
ECGI-ID:
MCC: 123 MNC: 456
ECI: 0x1
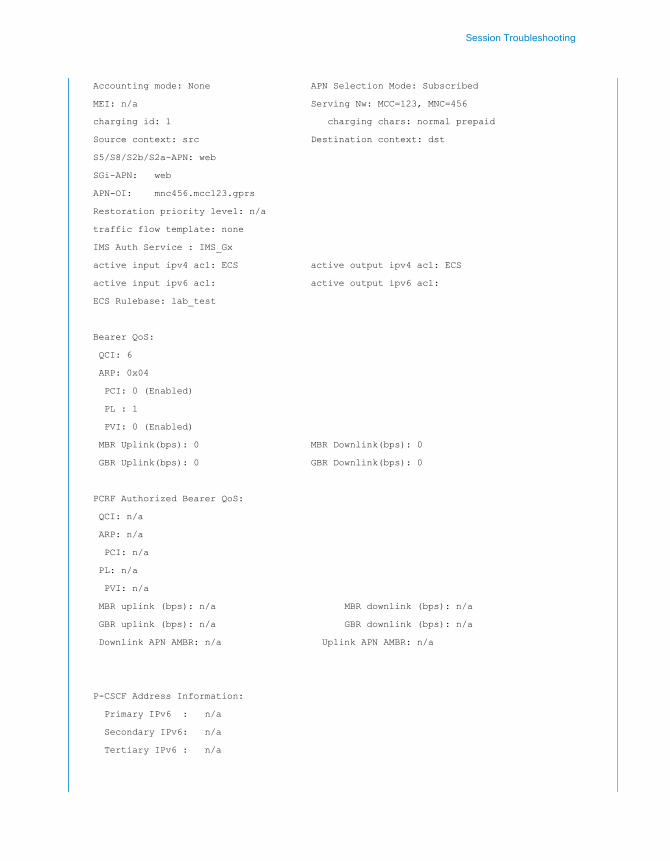
Session Troubleshooting
Accounting mode: None APN Selection Mode: Subscribed
MEI: n/a Serving Nw: MCC=123, MNC=456
charging id: 1 charging chars: normal prepaid
Source context: src Destination context: dst
S5/S8/S2b/S2a-APN: web
SGi-APN: web
APN-OI: mnc456.mcc123.gprs
Restoration priority level: n/a
traffic flow template: none
IMS Auth Service : IMS_Gx
active input ipv4 acl: ECS active output ipv4 acl: ECS
active input ipv6 acl: active output ipv6 acl:
ECS Rulebase: lab_test
Bearer QoS:
QCI: 6
ARP: 0x04
PCI: 0 (Enabled)
PL : 1
PVI: 0 (Enabled)
MBR Uplink(bps): 0 MBR Downlink(bps): 0
GBR Uplink(bps): 0 GBR Downlink(bps): 0
PCRF Authorized Bearer QoS:
QCI: n/a
ARP: n/a
PCI: n/a
PL: n/a
PVI: n/a
MBR uplink (bps): n/a MBR downlink (bps): n/a
GBR uplink (bps): n/a GBR downlink (bps): n/a
Downlink APN AMBR: n/a Uplink APN AMBR: n/a
P-CSCF Address Information:
Primary IPv6 : n/a
Secondary IPv6: n/a
Tertiary IPv6 : n/a

Session Troubleshooting
Primary IPv4 : n/a
Secondary IPv4: n/a
Tertiary IPv4 : n/a
Access Point MAC Address: N/A
pgw c-teid: [0x80002001] 2147491841 pgw u-teid: [0x80002001] 2147491841
sgw c-teid: [0x80002001] 2147491841 sgw u-teid: [0x80000001] 2147483649
ePDG c-teid: N/A ePDG u-teid: N/A
cgw c-teid: N/A cgw u-teid: N/A
pgw c-addr: 10.1.5.1 pgw u-addr: 10.1.5.1
sgw c-addr: 10.1.5.2 sgw u-addr: 10.1.5.2
ePDG c-addr: N/A ePDG u-addr: N/A
cgw c-addr: N/A cgw u-addr: N/A
Downlink APN AMBR: 20000 bps Uplink APN AMBR: 10000 bps
Mediation context: None Mediation no early PDUs: Disabled
Mediation No Interims: Disabled Mediation Delay PBA: Disabled
input pkts: 0 output pkts: 0
input bytes: 0 output bytes: 0
input bytes dropped: 0 output bytes dropped: 0
input pkts dropped: 0 output pkts dropped: 0
input pkts dropped due to lorc : 0 output pkts dropped due to lorc :
0
input bytes dropped due to lorc : 0
in packet dropped suspended state: 0 out packet dropped suspended state:
0
in bytes dropped suspended state: 0 out bytes dropped suspended state: 0
in packet dropped overcharge protection: 0 out packet dropped overcharge protection:
0
in bytes dropped overcharge protection: 0 out bytes dropped overcharge protection:
0
in packet dropped sgw restoration state: 0 out packet dropped sgw restoration state:
0
in bytes dropped sgw restoration state: 0 out bytes dropped sgw restoration state:
0
pk rate from user(bps): 0 pk rate to user(bps): 0
ave rate from user(bps): 0 ave rate to user(bps): 0
sust rate from user(bps): 0 sust rate to user(bps): 0
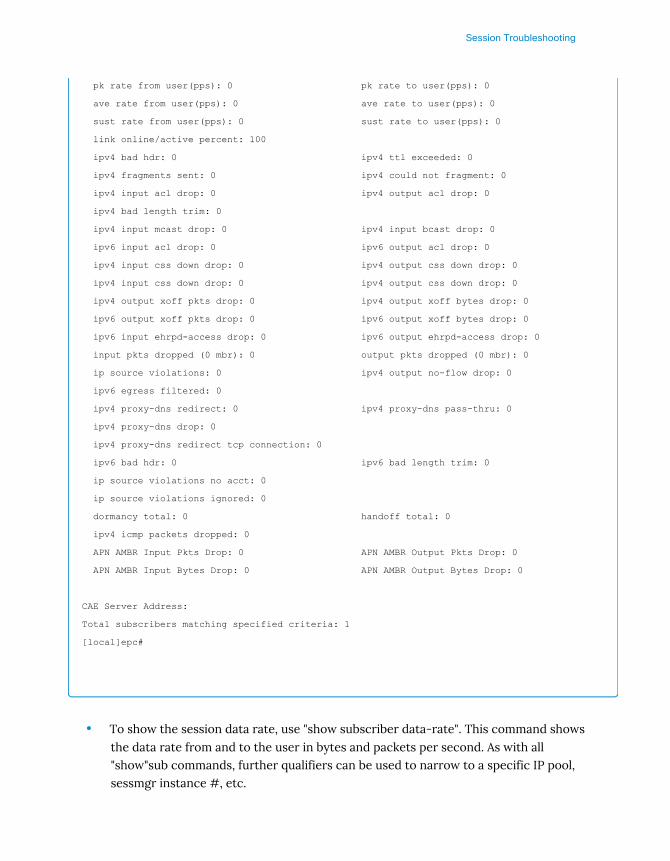
Session Troubleshooting
pk rate from user(pps): 0 pk rate to user(pps): 0
ave rate from user(pps): 0 ave rate to user(pps): 0
sust rate from user(pps): 0 sust rate to user(pps): 0
link online/active percent: 100
ipv4 bad hdr: 0 ipv4 ttl exceeded: 0
ipv4 fragments sent: 0 ipv4 could not fragment: 0
ipv4 input acl drop: 0 ipv4 output acl drop: 0
ipv4 bad length trim: 0
ipv4 input mcast drop: 0 ipv4 input bcast drop: 0
ipv6 input acl drop: 0 ipv6 output acl drop: 0
ipv4 input css down drop: 0 ipv4 output css down drop: 0
ipv4 input css down drop: 0 ipv4 output css down drop: 0
ipv4 output xoff pkts drop: 0 ipv4 output xoff bytes drop: 0
ipv6 output xoff pkts drop: 0 ipv6 output xoff bytes drop: 0
ipv6 input ehrpd-access drop: 0 ipv6 output ehrpd-access drop: 0
input pkts dropped (0 mbr): 0 output pkts dropped (0 mbr): 0
ip source violations: 0 ipv4 output no-flow drop: 0
ipv6 egress filtered: 0
ipv4 proxy-dns redirect: 0 ipv4 proxy-dns pass-thru: 0
ipv4 proxy-dns drop: 0
ipv4 proxy-dns redirect tcp connection: 0
ipv6 bad hdr: 0 ipv6 bad length trim: 0
ip source violations no acct: 0
ip source violations ignored: 0
dormancy total: 0 handoff total: 0
ipv4 icmp packets dropped: 0
APN AMBR Input Pkts Drop: 0 APN AMBR Output Pkts Drop: 0
APN AMBR Input Bytes Drop: 0 APN AMBR Output Bytes Drop: 0
CAE Server Address:
Total subscribers matching specified criteria: 1
[local]epc#
• To show the session data rate, use "show subscriber data-rate". This command showsthe data rate from and to the user in bytes and packets per second. As with all"show"sub commands, further qualifiers can be used to narrow to a specific IP pool,sessmgr instance #, etc.
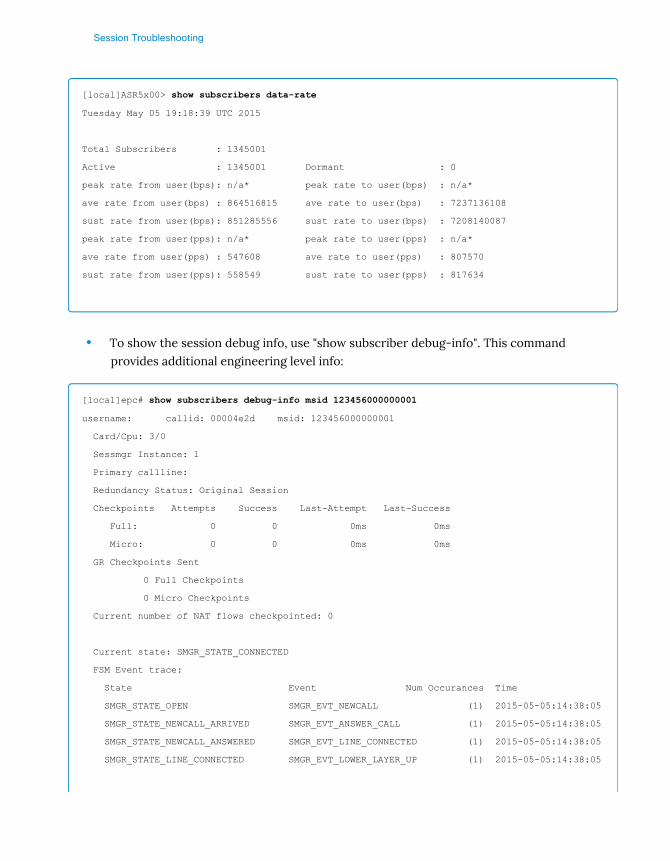
Session Troubleshooting
[local]ASR5x00> show subscribers data-rate
Tuesday May 05 19:18:39 UTC 2015
Total Subscribers : 1345001
Active : 1345001 Dormant : 0
peak rate from user(bps): n/a* peak rate to user(bps) : n/a*
ave rate from user(bps) : 864516815 ave rate to user(bps) : 7237136108
sust rate from user(bps): 851285556 sust rate to user(bps) : 7208140087
peak rate from user(pps): n/a* peak rate to user(pps) : n/a*
ave rate from user(pps) : 547608 ave rate to user(pps) : 807570
sust rate from user(pps): 558549 sust rate to user(pps) : 817634
• To show the session debug info, use "show subscriber debug-info". This commandprovides additional engineering level info:
[local]epc# show subscribers debug-info msid 123456000000001
username: callid: 00004e2d msid: 123456000000001
Card/Cpu: 3/0
Sessmgr Instance: 1
Primary callline:
Redundancy Status: Original Session
Checkpoints Attempts Success Last-Attempt Last-Success
Full: 0 0 0ms 0ms
Micro: 0 0 0ms 0ms
GR Checkpoints Sent
0 Full Checkpoints
0 Micro Checkpoints
Current number of NAT flows checkpointed: 0
Current state: SMGR_STATE_CONNECTED
FSM Event trace:
State Event Num Occurances Time
SMGR_STATE_OPEN SMGR_EVT_NEWCALL (1) 2015-05-05:14:38:05
SMGR_STATE_NEWCALL_ARRIVED SMGR_EVT_ANSWER_CALL (1) 2015-05-05:14:38:05
SMGR_STATE_NEWCALL_ANSWERED SMGR_EVT_LINE_CONNECTED (1) 2015-05-05:14:38:05
SMGR_STATE_LINE_CONNECTED SMGR_EVT_LOWER_LAYER_UP (1) 2015-05-05:14:38:05
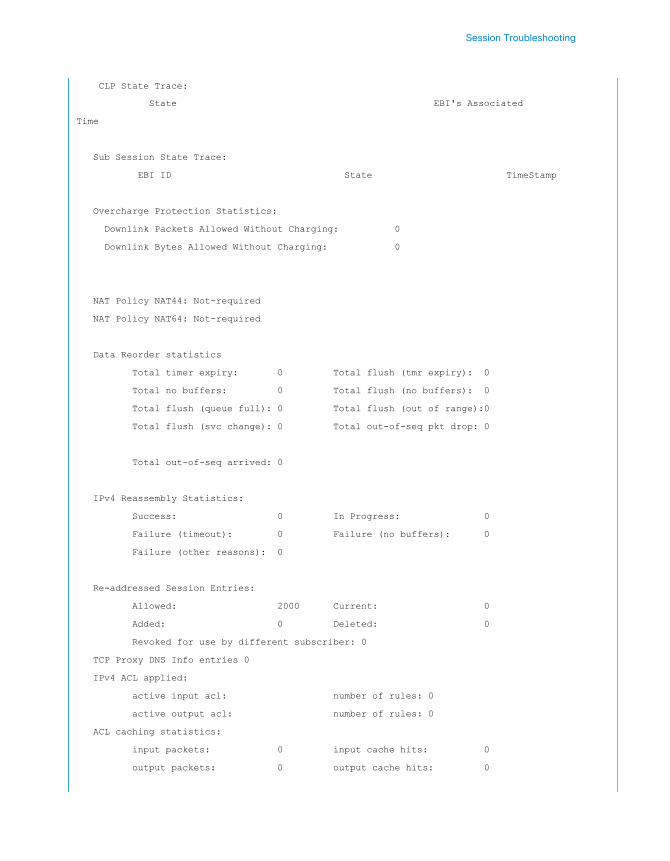
Session Troubleshooting
CLP State Trace:
State EBI's Associated
Time
Sub Session State Trace:
EBI ID State TimeStamp
Overcharge Protection Statistics:
Downlink Packets Allowed Without Charging: 0
Downlink Bytes Allowed Without Charging: 0
NAT Policy NAT44: Not-required
NAT Policy NAT64: Not-required
Data Reorder statistics
Total timer expiry: 0 Total flush (tmr expiry): 0
Total no buffers: 0 Total flush (no buffers): 0
Total flush (queue full): 0 Total flush (out of range):0
Total flush (svc change): 0 Total out-of-seq pkt drop: 0
Total out-of-seq arrived: 0
IPv4 Reassembly Statistics:
Success: 0 In Progress: 0
Failure (timeout): 0 Failure (no buffers): 0
Failure (other reasons): 0
Re-addressed Session Entries:
Allowed: 2000 Current: 0
Added: 0 Deleted: 0
Revoked for use by different subscriber: 0
TCP Proxy DNS Info entries 0
IPv4 ACL applied:
active input acl: number of rules: 0
active output acl: number of rules: 0
ACL caching statistics:
input packets: 0 input cache hits: 0
output packets: 0 output cache hits: 0

Session Troubleshooting
IPv6 ACL applied:
active input ipv6 acl: number of rules: 0
active output ipv6 acl: number of rules: 0
IPv6 ACL caching statistics:
input cache hits: 0 output cache hits: 0
Total number of ACL reload: 0
Total number of ACS session deleted on ACL reload: 0
NEMO Detail:
Peer bond: NO Peer Callid: 00000000
Mode: N/A Multi-VRF Enabled: NO
sessmgr NPU Flow Details:
Flow Id Flow Type Nat Realm VPN Id
Private IP NPU flow timeout (Seconds) : n/a
ACS PCP Service: n/a
username: callid: 00004e30 msid: 123456000000001
Card/Cpu: 3/0
Sessmgr Instance: 1
Primary callline:
Redundancy Status: Original Session
Checkpoints Attempts Success Last-Attempt Last-Success
Full: 1 0 376100ms 0ms
Micro: 0 0 0ms 0ms
GR Checkpoints Sent
0 Full Checkpoints
0 Micro Checkpoints
Current number of NAT flows checkpointed: 0
Current state: SMGR_STATE_CONNECTED
FSM Event trace:
State Event Num Occurrences Time
SMGR_STATE_OPEN SMGR_EVT_NEWCALL (1) 2015-05-05:14:38:05
SMGR_STATE_NEWCALL_ARRIVED SMGR_EVT_ANSWER_CALL (1) 2015-05-05:14:38:05
SMGR_STATE_NEWCALL_ANSWERED SMGR_EVT_LINE_CONNECTED (1) 2015-05-05:14:38:05
SMGR_STATE_LINE_CONNECTED SMGR_EVT_LOWER_LAYER_UP (1) 2015-05-05:14:38:05

Session Troubleshooting
CLP State Trace:
State EBI's Associated
Time
Sub Session State Trace:
EBI ID State TimeStamp
Overcharge Protection Statistics:
Downlink Packets Allowed Without Charging: 0
Downlink Bytes Allowed Without Charging: 0
NAT Policy NAT44: Not-required
NAT Policy NAT64: Not-required
Data Reorder statistics
Total timer expiry: 0 Total flush (tmr expiry): 0
Total no buffers: 0 Total flush (no buffers): 0
Total flush (queue full): 0 Total flush (out of range):0
Total flush (svc change): 0 Total out-of-seq pkt drop: 0
Total out-of-seq arrived: 0
IPv4 Reassembly Statistics:
Success: 0 In Progress: 0
Failure (timeout): 0 Failure (no buffers): 0
Failure (other reasons): 0
Re-addressed Session Entries:
Allowed: 2000 Current: 0
Added: 0 Deleted: 0
Revoked for use by different subscriber: 0
TCP Proxy DNS Info entries 0
IPv4 ACL applied:
active input acl: number of rules: 0
active output acl: number of rules: 0
ACL caching statistics:
input packets: 0 input cache hits: 0
output packets: 0 output cache hits: 0
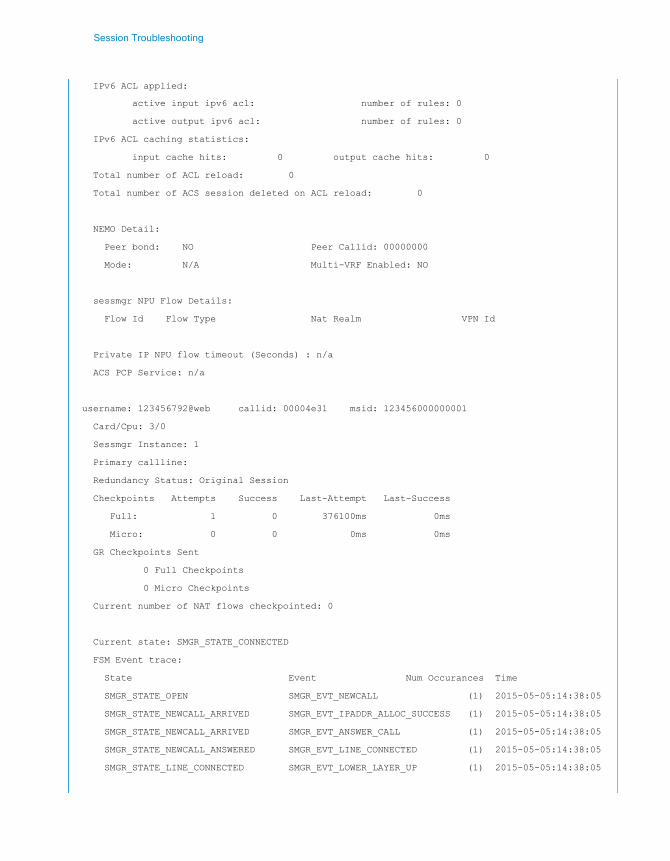
Session Troubleshooting
IPv6 ACL applied:
active input ipv6 acl: number of rules: 0
active output ipv6 acl: number of rules: 0
IPv6 ACL caching statistics:
input cache hits: 0 output cache hits: 0
Total number of ACL reload: 0
Total number of ACS session deleted on ACL reload: 0
NEMO Detail:
Peer bond: NO Peer Callid: 00000000
Mode: N/A Multi-VRF Enabled: NO
sessmgr NPU Flow Details:
Flow Id Flow Type Nat Realm VPN Id
Private IP NPU flow timeout (Seconds) : n/a
ACS PCP Service: n/a
username: 123456792@web callid: 00004e31 msid: 123456000000001
Card/Cpu: 3/0
Sessmgr Instance: 1
Primary callline:
Redundancy Status: Original Session
Checkpoints Attempts Success Last-Attempt Last-Success
Full: 1 0 376100ms 0ms
Micro: 0 0 0ms 0ms
GR Checkpoints Sent
0 Full Checkpoints
0 Micro Checkpoints
Current number of NAT flows checkpointed: 0
Current state: SMGR_STATE_CONNECTED
FSM Event trace:
State Event Num Occurances Time
SMGR_STATE_OPEN SMGR_EVT_NEWCALL (1) 2015-05-05:14:38:05
SMGR_STATE_NEWCALL_ARRIVED SMGR_EVT_IPADDR_ALLOC_SUCCESS (1) 2015-05-05:14:38:05
SMGR_STATE_NEWCALL_ARRIVED SMGR_EVT_ANSWER_CALL (1) 2015-05-05:14:38:05
SMGR_STATE_NEWCALL_ANSWERED SMGR_EVT_LINE_CONNECTED (1) 2015-05-05:14:38:05
SMGR_STATE_LINE_CONNECTED SMGR_EVT_LOWER_LAYER_UP (1) 2015-05-05:14:38:05
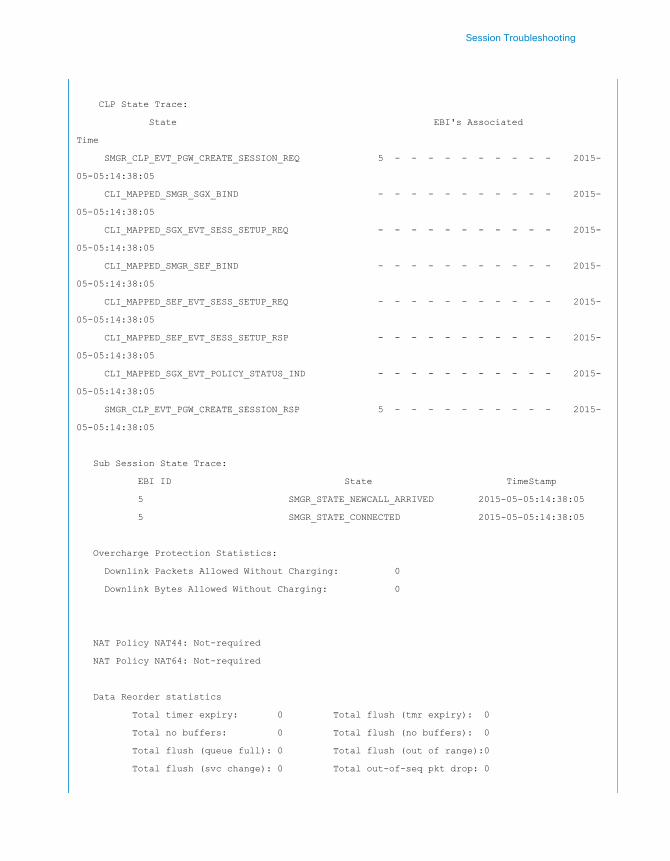
Session Troubleshooting
CLP State Trace:
State EBI's Associated
Time
SMGR_CLP_EVT_PGW_CREATE_SESSION_REQ 5 - - - - - - - - - - 2015-
05-05:14:38:05
CLI_MAPPED_SMGR_SGX_BIND - - - - - - - - - - - 2015-
05-05:14:38:05
CLI_MAPPED_SGX_EVT_SESS_SETUP_REQ - - - - - - - - - - - 2015-
05-05:14:38:05
CLI_MAPPED_SMGR_SEF_BIND - - - - - - - - - - - 2015-
05-05:14:38:05
CLI_MAPPED_SEF_EVT_SESS_SETUP_REQ - - - - - - - - - - - 2015-
05-05:14:38:05
CLI_MAPPED_SEF_EVT_SESS_SETUP_RSP - - - - - - - - - - - 2015-
05-05:14:38:05
CLI_MAPPED_SGX_EVT_POLICY_STATUS_IND - - - - - - - - - - - 2015-
05-05:14:38:05
SMGR_CLP_EVT_PGW_CREATE_SESSION_RSP 5 - - - - - - - - - - 2015-
05-05:14:38:05
Sub Session State Trace:
EBI ID State TimeStamp
5 SMGR_STATE_NEWCALL_ARRIVED 2015-05-05:14:38:05
5 SMGR_STATE_CONNECTED 2015-05-05:14:38:05
Overcharge Protection Statistics:
Downlink Packets Allowed Without Charging: 0
Downlink Bytes Allowed Without Charging: 0
NAT Policy NAT44: Not-required
NAT Policy NAT64: Not-required
Data Reorder statistics
Total timer expiry: 0 Total flush (tmr expiry): 0
Total no buffers: 0 Total flush (no buffers): 0
Total flush (queue full): 0 Total flush (out of range):0
Total flush (svc change): 0 Total out-of-seq pkt drop: 0
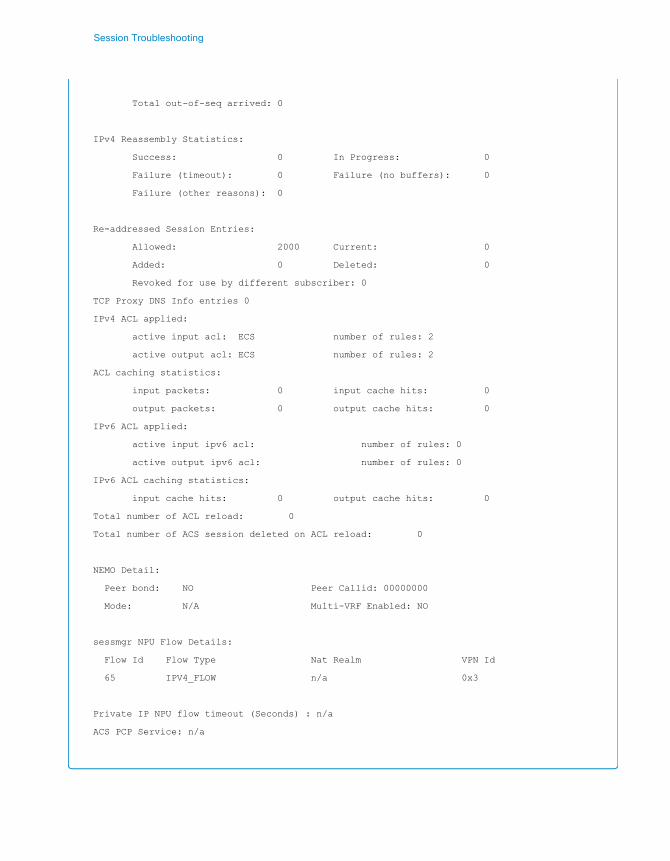
Session Troubleshooting
Total out-of-seq arrived: 0
IPv4 Reassembly Statistics:
Success: 0 In Progress: 0
Failure (timeout): 0 Failure (no buffers): 0
Failure (other reasons): 0
Re-addressed Session Entries:
Allowed: 2000 Current: 0
Added: 0 Deleted: 0
Revoked for use by different subscriber: 0
TCP Proxy DNS Info entries 0
IPv4 ACL applied:
active input acl: ECS number of rules: 2
active output acl: ECS number of rules: 2
ACL caching statistics:
input packets: 0 input cache hits: 0
output packets: 0 output cache hits: 0
IPv6 ACL applied:
active input ipv6 acl: number of rules: 0
active output ipv6 acl: number of rules: 0
IPv6 ACL caching statistics:
input cache hits: 0 output cache hits: 0
Total number of ACL reload: 0
Total number of ACS session deleted on ACL reload: 0
NEMO Detail:
Peer bond: NO Peer Callid: 00000000
Mode: N/A Multi-VRF Enabled: NO
sessmgr NPU Flow Details:
Flow Id Flow Type Nat Realm VPN Id
65 IPV4_FLOW n/a 0x3
Private IP NPU flow timeout (Seconds) : n/a
ACS PCP Service: n/a
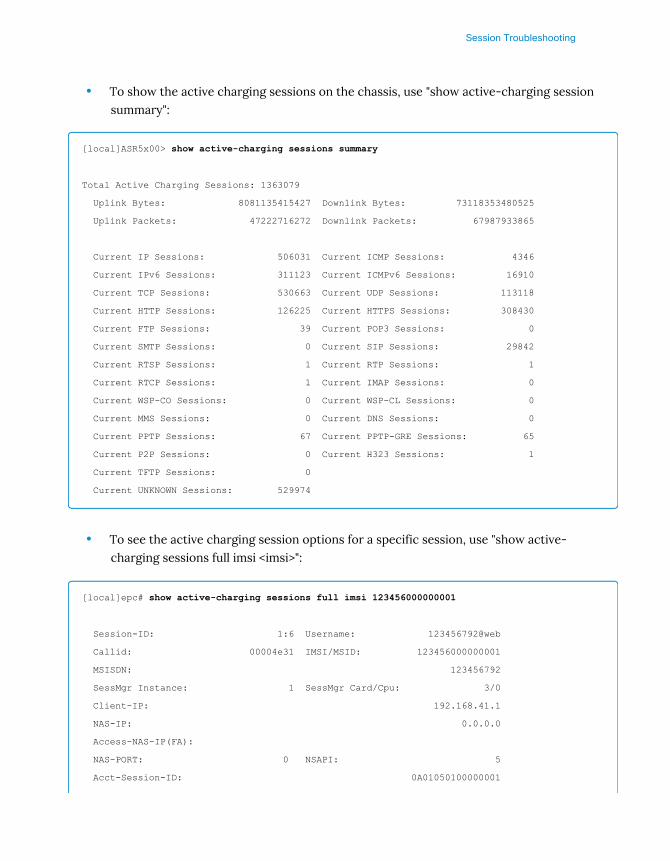
Session Troubleshooting
• To show the active charging sessions on the chassis, use "show active-charging sessionsummary":
[local]ASR5x00> show active-charging sessions summary
Total Active Charging Sessions: 1363079
Uplink Bytes: 8081135415427 Downlink Bytes: 73118353480525
Uplink Packets: 47222716272 Downlink Packets: 67987933865
Current IP Sessions: 506031 Current ICMP Sessions: 4346
Current IPv6 Sessions: 311123 Current ICMPv6 Sessions: 16910
Current TCP Sessions: 530663 Current UDP Sessions: 113118
Current HTTP Sessions: 126225 Current HTTPS Sessions: 308430
Current FTP Sessions: 39 Current POP3 Sessions: 0
Current SMTP Sessions: 0 Current SIP Sessions: 29842
Current RTSP Sessions: 1 Current RTP Sessions: 1
Current RTCP Sessions: 1 Current IMAP Sessions: 0
Current WSP-CO Sessions: 0 Current WSP-CL Sessions: 0
Current MMS Sessions: 0 Current DNS Sessions: 0
Current PPTP Sessions: 67 Current PPTP-GRE Sessions: 65
Current P2P Sessions: 0 Current H323 Sessions: 1
Current TFTP Sessions: 0
Current UNKNOWN Sessions: 529974
• To see the active charging session options for a specific session, use "show active-charging sessions full imsi <imsi>":
[local]epc# show active-charging sessions full imsi 123456000000001
Session-ID: 1:6 Username: 123456792@web
Callid: 00004e31 IMSI/MSID: 123456000000001
MSISDN: 123456792
SessMgr Instance: 1 SessMgr Card/Cpu: 3/0
Client-IP: 192.168.41.1
NAS-IP: 0.0.0.0
Access-NAS-IP(FA):
NAS-PORT: 0 NSAPI: 5
Acct-Session-ID: 0A01050100000001
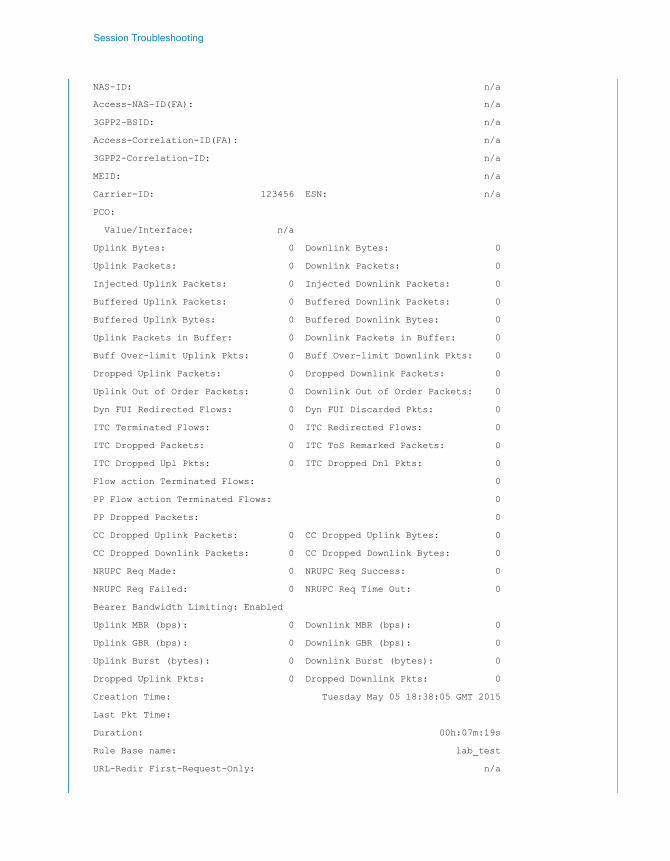
Session Troubleshooting
NAS-ID: n/a
Access-NAS-ID(FA): n/a
3GPP2-BSID: n/a
Access-Correlation-ID(FA): n/a
3GPP2-Correlation-ID: n/a
MEID: n/a
Carrier-ID: 123456 ESN: n/a
PCO:
Value/Interface: n/a
Uplink Bytes: 0 Downlink Bytes: 0
Uplink Packets: 0 Downlink Packets: 0
Injected Uplink Packets: 0 Injected Downlink Packets: 0
Buffered Uplink Packets: 0 Buffered Downlink Packets: 0
Buffered Uplink Bytes: 0 Buffered Downlink Bytes: 0
Uplink Packets in Buffer: 0 Downlink Packets in Buffer: 0
Buff Over-limit Uplink Pkts: 0 Buff Over-limit Downlink Pkts: 0
Dropped Uplink Packets: 0 Dropped Downlink Packets: 0
Uplink Out of Order Packets: 0 Downlink Out of Order Packets: 0
Dyn FUI Redirected Flows: 0 Dyn FUI Discarded Pkts: 0
ITC Terminated Flows: 0 ITC Redirected Flows: 0
ITC Dropped Packets: 0 ITC ToS Remarked Packets: 0
ITC Dropped Upl Pkts: 0 ITC Dropped Dnl Pkts: 0
Flow action Terminated Flows: 0
PP Flow action Terminated Flows: 0
PP Dropped Packets: 0
CC Dropped Uplink Packets: 0 CC Dropped Uplink Bytes: 0
CC Dropped Downlink Packets: 0 CC Dropped Downlink Bytes: 0
NRUPC Req Made: 0 NRUPC Req Success: 0
NRUPC Req Failed: 0 NRUPC Req Time Out: 0
Bearer Bandwidth Limiting: Enabled
Uplink MBR (bps): 0 Downlink MBR (bps): 0
Uplink GBR (bps): 0 Downlink GBR (bps): 0
Uplink Burst (bytes): 0 Downlink Burst (bytes): 0
Dropped Uplink Pkts: 0 Dropped Downlink Pkts: 0
Creation Time: Tuesday May 05 18:38:05 GMT 2015
Last Pkt Time:
Duration: 00h:07m:19s
Rule Base name: lab_test
URL-Redir First-Request-Only: n/a

Session Troubleshooting
Tethering-detection notification: Disabled
Tethering-detected notification sent: n/a
Service Detection:
Session Update:
QOS Upgrade Triggered: No
Bandwidth Policy: n/a
Bandwidth Policy Fallback Applied: No
FW-and-NAT Policy: n/a
FW-and-NAT Policy ID: n/a
Firewall Policy IPv4: n/a
Firewall Policy IPv6: n/a
NAT Policy NAT44: n/a
NAT Policy NAT64: n/a
Bypass NAT Flow Present: n/a
Congestion Mgmt Policy: n/a
CF Policy ID: n/a
Old CF Policy ID: n/a
Dynamic Charging: Enabled
Dynamic Chrg Msg Received: 0 Rule Definitions Received: 0
Installs Received: 0 Removes Received: 0
Installs Succeeded: 0 Installs Failed: 0
Removes Succeeded: 0 Removes Failed: 0
Uplink Dynamic Rule Packets: 0 Downlink Dynamic Rule Packets: 0
Dynamic Charging Packet Drop statistics:
PCC Rule BW Limit Upl Pkts: 0 PCC Rule BW Limit Dnl Pkts: 0
PCC Rule Gating Upl Pkts: 0 PCC Rule Gating Dnl Pkts: 0
RuleMatch Fail Upl Pkts: 0 RuleMatch Fail Dnl Pkts: 0
Credit-Control: Off
Event-Triggers:
QoS Renegotiate Up: 0 QoS Renegotiate Dn: 0
TCP Proxy Flows Requests: 0 TCP Proxy Flows Request Success: 0
Disable TCP Proxy Flows Requests: 0 Disable TCP Proxy Flows Success: 0
Current TCP Proxy Flows: 0 Total TCP Proxy Flows: 0
TCP-proxy reset for non-SYN flows: 0
Current IP Flows: 0 Current ICMP Flows: 0
Current IPv6 Flows: 0 Current ICMPv6 Flows: 0
Current TCP Flows: 0 Current UDP Flows: 0
Current HTTP Flows: 0 Current HTTPS Flows: 0
Current FTP Flows: 0 Current POP3 Flows: 0

Session Troubleshooting
Current SMTP Flows: 0 Current SIP Flows: 0
Current RTSP Flows: 0 Current RTP Flows: 0
Current RTCP Flows: 0 Current IMAP Flows: 0
Current WSP-CO Flows: 0 Current WSP-CL Flows: 0
Current MMS Flows: 0 Current DNS Flows: 0
Current PPTP-GRE Flows: 0 Current PPTP Flows: 0
Current P2P Flows: 0 Current H323 Flows: 0
Current TFTP Flows: 0
Current UNKNOWN Flows: 0
Max (L3) Flows: 0
Max Flows Timestamp: n/a
TCP-Proxy Session Stats: n/a
Link Monitoring Average Throughput: 0 kbps
Link Monitoring Average RTT: 0 ms
Charging Updates: n/a
No Charging ruledef(s) match the specified criteria
No Firewall ruledef(s) match the specified criteria
Post-processing Rulestats : No Post-processing ruledef(s) match the specified criteria
Dynamic Charging Rule Name Statistics: n/a
Total Dynamic Rules: 0
Total Predefined Rules: 0
Total Firewall Predefined Rules: 0
Charging-Updates Statistics: n/a
Dynamic Charging Rule Definition(s) Configured: n/a
Predefined Rules Enabled List: n/a
Predefined Firewall Rules Enabled List: n/a
Total acs sessions matching specified criteria: 1

Session Troubleshooting
• To see the status of the sessions on the chassis, use "show session progress". Thiscommand will show the total sessions and break out the various access types:
[local]ASR5x00> show session progress
1367837 In-progress calls
1367837 In-progress active calls
0 In-progress dormant calls
0 In-progress always-on calls
14 In-progress calls @ ARRIVED state
0 In-progress calls @ CSCF-CALL-ARRIVED state
0 In-progress calls @ CSCF-REGISTERING state
0 In-progress calls @ CSCF-REGISTERED state
0 In-progress calls @ LCP-NEG state
0 In-progress calls @ LCP-UP state
0 In-progress calls @ AUTHENTICATING state
0 In-progress calls @ BCMCS SERVICE AUTHENTICATING state
0 In-progress calls @ AUTHENTICATED state
0 In-progress calls @ PDG AUTHORIZING state
0 In-progress calls @ PDG AUTHORIZED state
10 In-progress calls @ IMS AUTHORIZING state
13 In-progress calls @ IMS AUTHORIZED state
0 In-progress calls @ MBMS UE AUTHORIZING state
0 In-progress calls @ MBMS BEARER AUTHORIZING state
0 In-progress calls @ DHCP PENDING state
0 In-progress calls @ L2TP-LAC CONNECTING state
0 In-progress calls @ MBMS BEARER CONNECTING state
0 In-progress calls @ CSCF-CALL-CONNECTING state
0 In-progress calls @ IPCP-UP state
0 In-progress calls @ NON-ANCHOR CONNECTED state
0 In-progress calls @ AUTH-ONLY CONNECTED state
0 In-progress calls @ SIMPLE-IPv4 CONNECTED state
0 In-progress calls @ SIMPLE-IPv6 CONNECTED state
0 In-progress calls @ SIMPLE-IPv4+IPv6 CONNECTED state
0 In-progress calls @ MOBILE-IPv4 CONNECTED state
0 In-progress calls @ MOBILE-IPv6 CONNECTED state
0 In-progress calls @ GTP CONNECTING state
0 In-progress calls @ GTP CONNECTED state
0 In-progress calls @ PROXY-MOBILE-IP CONNECTING state
0 In-progress calls @ PROXY-MOBILE-IP CONNECTED state
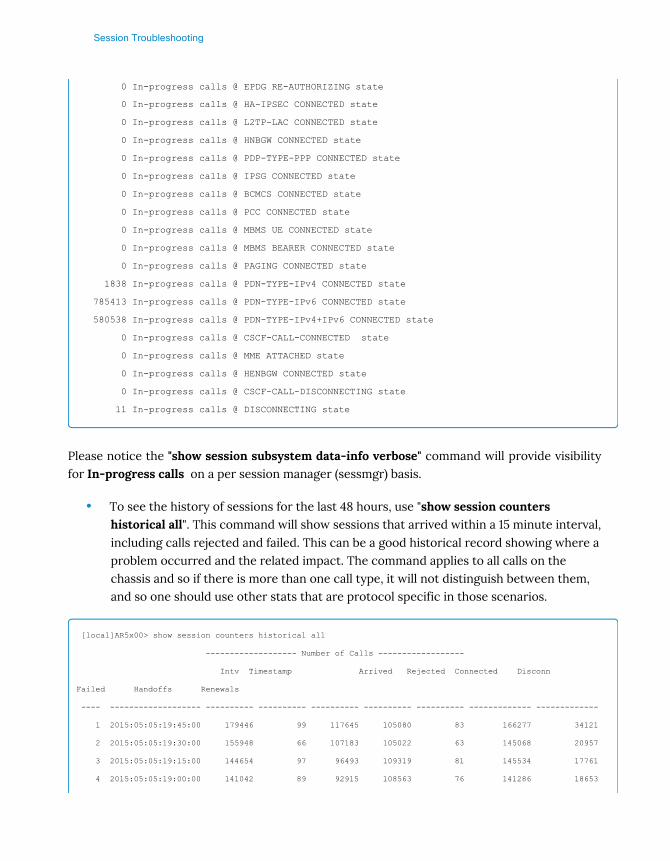
Session Troubleshooting
0 In-progress calls @ EPDG RE-AUTHORIZING state
0 In-progress calls @ HA-IPSEC CONNECTED state
0 In-progress calls @ L2TP-LAC CONNECTED state
0 In-progress calls @ HNBGW CONNECTED state
0 In-progress calls @ PDP-TYPE-PPP CONNECTED state
0 In-progress calls @ IPSG CONNECTED state
0 In-progress calls @ BCMCS CONNECTED state
0 In-progress calls @ PCC CONNECTED state
0 In-progress calls @ MBMS UE CONNECTED state
0 In-progress calls @ MBMS BEARER CONNECTED state
0 In-progress calls @ PAGING CONNECTED state
1838 In-progress calls @ PDN-TYPE-IPv4 CONNECTED state
785413 In-progress calls @ PDN-TYPE-IPv6 CONNECTED state
580538 In-progress calls @ PDN-TYPE-IPv4+IPv6 CONNECTED state
0 In-progress calls @ CSCF-CALL-CONNECTED state
0 In-progress calls @ MME ATTACHED state
0 In-progress calls @ HENBGW CONNECTED state
0 In-progress calls @ CSCF-CALL-DISCONNECTING state
11 In-progress calls @ DISCONNECTING state
Please notice the "show session subsystem data-info verbose" command will provide visibilityfor In-progress calls on a per session manager (sessmgr) basis.
• To see the history of sessions for the last 48 hours, use "show session countershistorical all". This command will show sessions that arrived within a 15 minute interval,including calls rejected and failed. This can be a good historical record showing where aproblem occurred and the related impact. The command applies to all calls on thechassis and so if there is more than one call type, it will not distinguish between them,and so one should use other stats that are protocol specific in those scenarios.
[local]AR5x00> show session counters historical all
------------------- Number of Calls ------------------
Intv Timestamp Arrived Rejected Connected Disconn
Failed Handoffs Renewals
---- ------------------- ---------- ---------- ---------- ---------- ---------- ------------- -------------
1 2015:05:05:19:45:00 179446 99 117645 105080 83 166277 34121
2 2015:05:05:19:30:00 155948 66 107183 105022 63 145068 20957
3 2015:05:05:19:15:00 144654 97 96493 109319 81 145534 17761
4 2015:05:05:19:00:00 141042 89 92915 108563 76 141286 18653

Session Troubleshooting
5 2015:05:05:18:45:00 145822 60 92602 113185 59 149698 20583
6 2015:05:05:18:30:00 166377 103 102026 113575 81 167989 33319
7 2015:05:05:18:15:00 183108 98 113159 112063 107 179286 38824
8 2015:05:05:18:00:00 186720 160 117990 119896 132 176960 40968
9 2015:05:05:17:45:00 188923 117 119304 120118 111 180304 44595
10 2015:05:05:17:30:00 183393 118 113965 113482 128 178033 38427
• To see the various disconnect reasons for the sessions, use "show session disconnect-reasons":
[local]ASR5x00> show session disconnect-reasons
Session Disconnect Statistics
Total Disconnects: 2484440
Disconnect Reason Num Disc Percentage
----------------------------------------------------- ---------- ----------
Remote-disconnect 1738989 69.99521
Inactivity-timeout 108253 4.35724
Absolute-timeout 194 0.00781
Invalid-source-IP-address 21431 0.86261
MIP-remote-dereg 212688 8.56080
MIP-lifetime-expiry 10886 0.43817
MIP-auth-failure 21 0.00085
Gtp-unknown-pdp-addr-or-pdp-type 346 0.01393
Local-purge 288 0.01159
Admin-AAA-disconnect 307987 12.39664
failed-auth-with-charging-svc 844 0.03397
gtp-user-auth-failed 29 0.00117
ims-authorization-failed 1737 0.06992
Gtp-context-replacement 344 0.01385
ims-authorization-revoked 1308 0.05265
No-response 6 0.00024
Re-Auth-failed 7 0.00028
disconnect-from-policy-server 73009 2.93865
s6b-auth-failed 95 0.00382
gtpu-err-ind 5978 0.24062
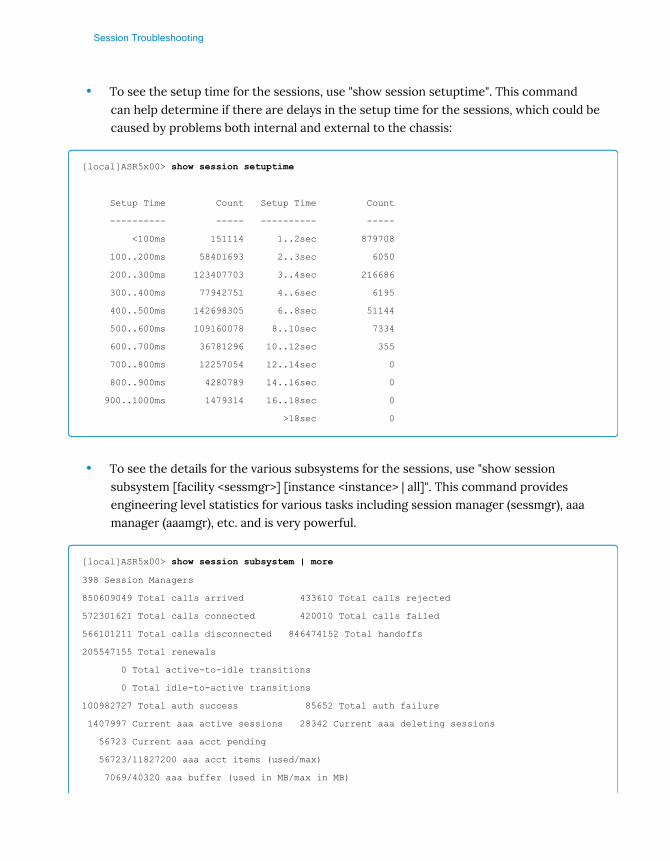
Session Troubleshooting
• To see the setup time for the sessions, use "show session setuptime". This commandcan help determine if there are delays in the setup time for the sessions, which could becaused by problems both internal and external to the chassis:
[local]ASR5x00> show session setuptime
Setup Time Count Setup Time Count
---------- ----- ---------- -----
<100ms 151114 1..2sec 879708
100..200ms 58401693 2..3sec 6050
200..300ms 123407703 3..4sec 216686
300..400ms 77942751 4..6sec 6195
400..500ms 142698305 6..8sec 51144
500..600ms 109160078 8..10sec 7334
600..700ms 36781296 10..12sec 355
700..800ms 12257054 12..14sec 0
800..900ms 4280789 14..16sec 0
900..1000ms 1479314 16..18sec 0
>18sec 0
• To see the details for the various subsystems for the sessions, use "show sessionsubsystem [facility <sessmgr>] [instance <instance> | all]". This command providesengineering level statistics for various tasks including session manager (sessmgr), aaamanager (aaamgr), etc. and is very powerful.
[local]ASR5x00> show session subsystem | more
398 Session Managers
850609049 Total calls arrived 433610 Total calls rejected
572301621 Total calls connected 420010 Total calls failed
566101211 Total calls disconnected 846474152 Total handoffs
205547155 Total renewals
0 Total active-to-idle transitions
0 Total idle-to-active transitions
100982727 Total auth success 85652 Total auth failure
1407997 Current aaa active sessions 28342 Current aaa deleting sessions
56723 Current aaa acct pending
56723/11827200 aaa acct items (used/max)
7069/40320 aaa buffer (used in MB/max in MB)
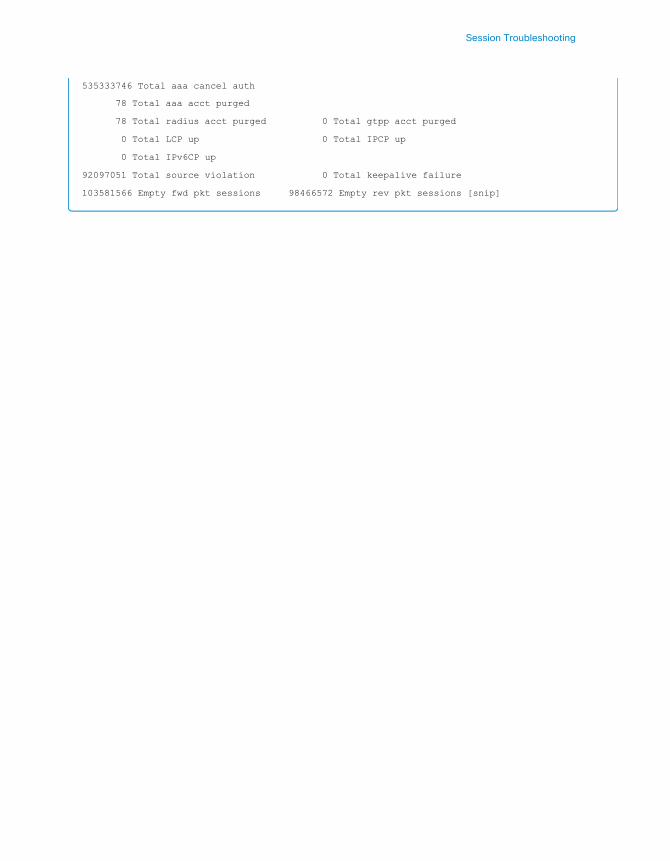
Session Troubleshooting
535333746 Total aaa cancel auth
78 Total aaa acct purged
78 Total radius acct purged 0 Total gtpp acct purged
0 Total LCP up 0 Total IPCP up
0 Total IPv6CP up
92097051 Total source violation 0 Total keepalive failure
103581566 Empty fwd pkt sessions 98466572 Empty rev pkt sessions [snip]

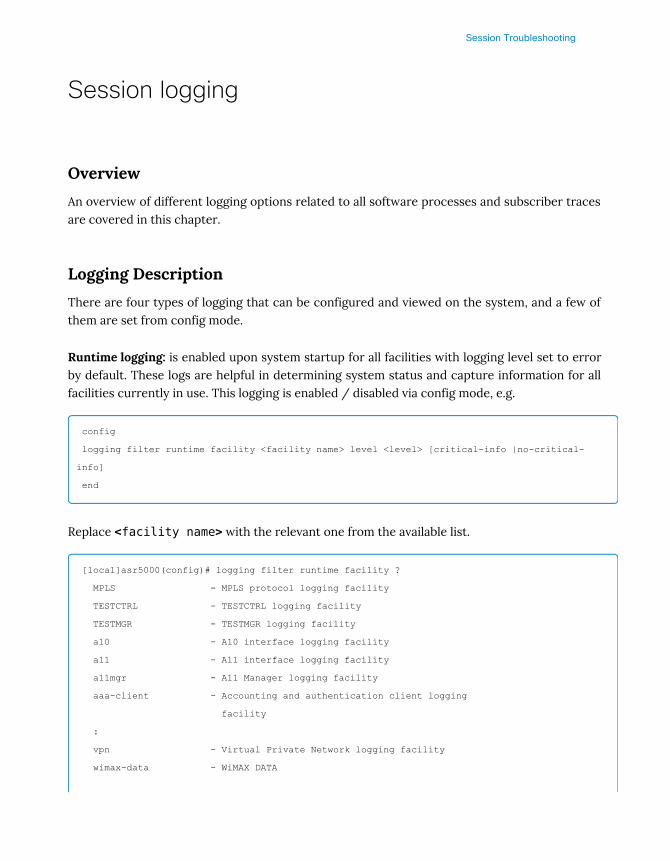
Session Troubleshooting
Session logging
Overview
An overview of different logging options related to all software processes and subscriber tracesare covered in this chapter.
Logging Description
There are four types of logging that can be configured and viewed on the system, and a few ofthem are set from config mode.
Runtime logging: is enabled upon system startup for all facilities with logging level set to errorby default. These logs are helpful in determining system status and capture information for allfacilities currently in use. This logging is enabled / disabled via config mode, e.g.
config
logging filter runtime facility <facility name> level <level> [critical-info |no-critical-
info]
end
Replace <facility name> with the relevant one from the available list.
[local]asr5000(config)# logging filter runtime facility ?
MPLS - MPLS protocol logging facility
TESTCTRL - TESTCTRL logging facility
TESTMGR - TESTMGR logging facility
a10 - A10 interface logging facility
a11 - A11 interface logging facility
a11mgr - A11 Manager logging facility
aaa-client - Accounting and authentication client logging
facility
:
vpn - Virtual Private Network logging facility
wimax-data - WiMAX DATA
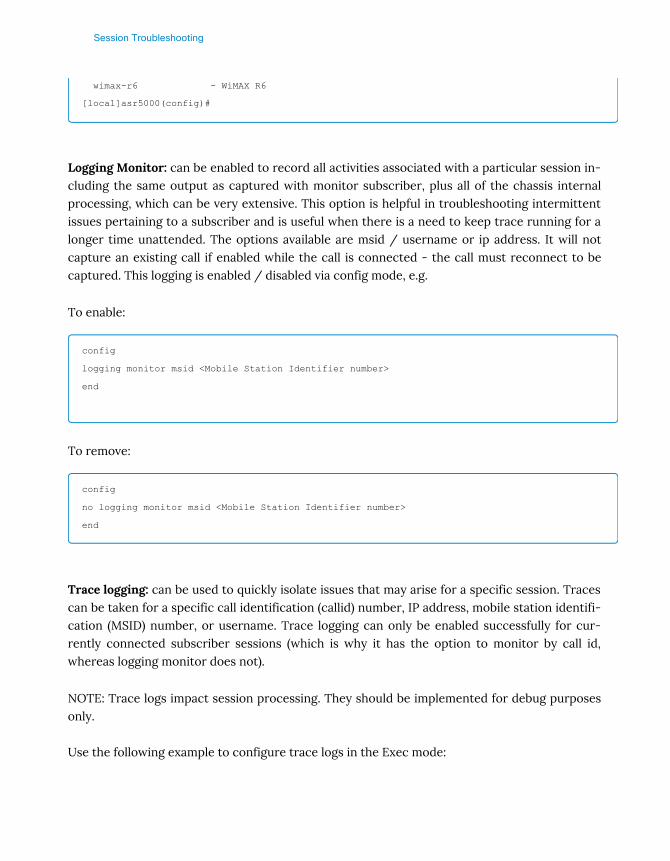
Session Troubleshooting
wimax-r6 - WiMAX R6
[local]asr5000(config)#
Logging Monitor: can be enabled to record all activities associated with a particular session in-cluding the same output as captured with monitor subscriber, plus all of the chassis internalprocessing, which can be very extensive. This option is helpful in troubleshooting intermittentissues pertaining to a subscriber and is useful when there is a need to keep trace running for alonger time unattended. The options available are msid / username or ip address. It will notcapture an existing call if enabled while the call is connected - the call must reconnect to becaptured. This logging is enabled / disabled via config mode, e.g.
To enable:
config
logging monitor msid <Mobile Station Identifier number>
end
To remove:
config
no logging monitor msid <Mobile Station Identifier number>
end
Trace logging: can be used to quickly isolate issues that may arise for a specific session. Tracescan be taken for a specific call identification (callid) number, IP address, mobile station identifi-cation (MSID) number, or username. Trace logging can only be enabled successfully for cur-rently connected subscriber sessions (which is why it has the option to monitor by call id,whereas logging monitor does not).
NOTE: Trace logs impact session processing. They should be implemented for debug purposesonly.
Use the following example to configure trace logs in the Exec mode:

Session Troubleshooting
[local]<hostname>#logging trace { callid call_id | ipaddr ip_address | msid ms_id | username
username }
Once all of the necessary information has been gathered, the trace log can be stopped by en-tering the following command:
[local]<hostname>#no logging trace { callid call_id | ipaddr ip_address | msid ms_id |
username username }
Active logging: can be used for troubleshooting active sessions. This can be configured on a peradministrative user basis (i.e. each administrative user can have their own individual active log-ging sessions). Active logs configured by an administrative user in one CLI instance cannot beviewed by an administrative user in a different CLI instance. Each active log can be configuredwith filter and display properties that are independent of those configured globally for the sys-tem in the runtime log. Active logs are displayed in real time, on the management user’s termi-nal display, as they are generated. The logging configured is temporary while the CLI session isactive, and is lost if the session times out or the CLI window is closed. e.g. type "logging ac‐tive" to start active logging and "no logging active" to stop it.
Active logging can be executed with the following command:
logging filter active facility <facility name> level <1-7>
Here is an example of the command and output:
[local]asr5000# logging filter active facility
a10 - A10 interface logging facility
a11 - A11 interface logging facility
a11mgr - A11 Manager logging facility
:
vpn - Virtual Private Network logging facility
wimax-data - WiMAX DATA
wimax-r6 - WiMAX R6
[local]asr5000# logging filter active facility sessmgr level
critical - Level 1: Reports critical errors contained in log file

Session Troubleshooting
error - Level 2: Reports error notifications contained in log file
warning - Level 3: Reports warning messages contained in log file
unusual - Level 4: Reports unexpected errors contained in log file
info - Level 5: Reports informational messages contained in log file
trace - Level 6: Reports trace information contained in log file
debug - Level 7: Reports debug information contained in log file
[local]asr5000# logging active
critical: logs only those events indicating a serious error has occurred and is causing the sys-tem or a system component to cease functioning. This is the highest severity level.
error: logs events that indicate an error has occurred that is causing the system or a systemcomponent to operate in a degraded state. This level also logs events with a higher severitylevel.
warning: logs events that may indicate a potential problem. This level also logs events with ahigher severity level.
unusual: logs events that are very unusual and may need to be investigated. This level also logsevents with a higher severity level.
info: logs informational events and events with a higher severity level.
trace: logs events useful for tracing and events with a higher severity level.
debug: logs all events regardless of the severity.
Warning: trace and debug level logging can be very verbose. It isrecommended to run this during the scheduled maintenance hours.Please contact Cisco Support prior to running this on a productionsystem. After any troubleshooting activity always disable logging with"no logging active"

Routing Protocol

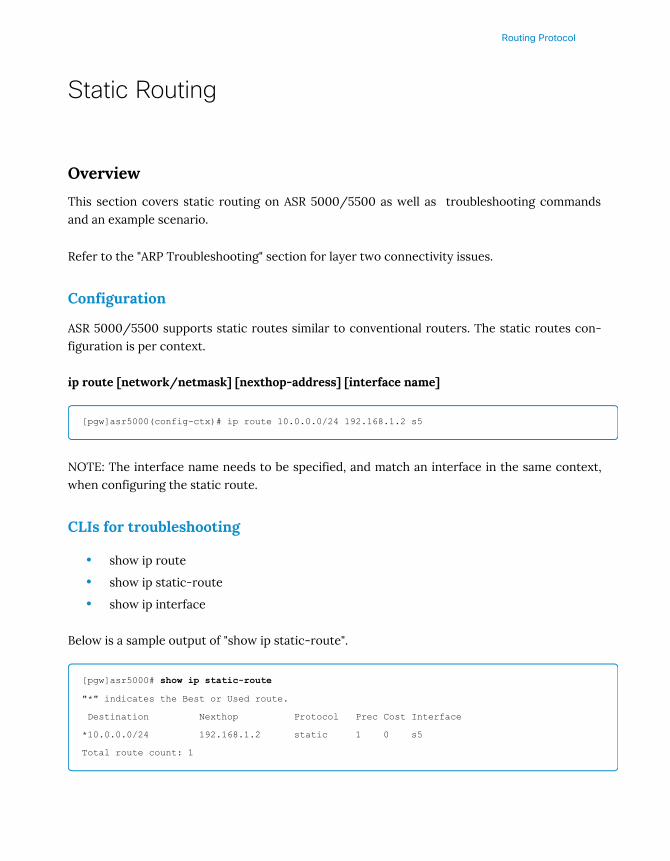
Routing Protocol
Static Routing
Overview
This section covers static routing on ASR 5000/5500 as well as troubleshooting commandsand an example scenario.
Refer to the "ARP Troubleshooting" section for layer two connectivity issues.
Configuration
ASR 5000/5500 supports static routes similar to conventional routers. The static routes con-figuration is per context.
ip route [network/netmask] [nexthop-address] [interface name]
[pgw]asr5000(config-ctx)# ip route 10.0.0.0/24 192.168.1.2 s5
NOTE: The interface name needs to be specified, and match an interface in the same context,when configuring the static route.
CLIs for troubleshooting
• show ip route
• show ip static-route
• show ip interface
Below is a sample output of "show ip static-route".
[pgw]asr5000# show ip static-route
"*" indicates the Best or Used route.
Destination Nexthop Protocol Prec Cost Interface
*10.0.0.0/24 192.168.1.2 static 1 0 s5
Total route count: 1
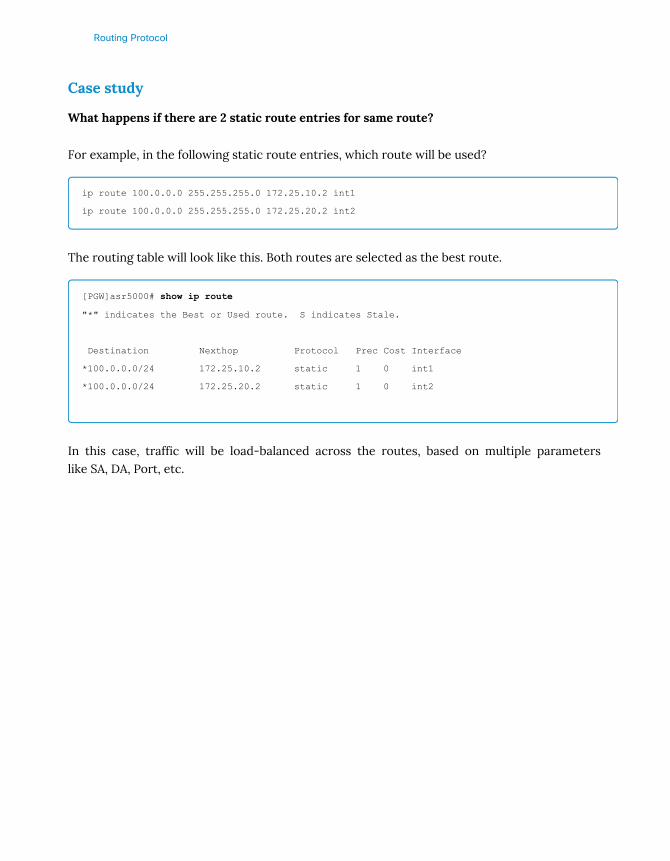
Routing Protocol
Case study
What happens if there are 2 static route entries for same route?
For example, in the following static route entries, which route will be used?
ip route 100.0.0.0 255.255.255.0 172.25.10.2 int1
ip route 100.0.0.0 255.255.255.0 172.25.20.2 int2
The routing table will look like this. Both routes are selected as the best route.
[PGW]asr5000# show ip route
"*" indicates the Best or Used route. S indicates Stale.
Destination Nexthop Protocol Prec Cost Interface
*100.0.0.0/24 172.25.10.2 static 1 0 int1
*100.0.0.0/24 172.25.20.2 static 1 0 int2
In this case, traffic will be load-balanced across the routes, based on multiple parameterslike SA, DA, Port, etc.

Routing Protocol
OSPF Routing
Overview
This section covers OSPF routing on ASR 5000 / 5500 with multiple troubleshooting com-mands and two scenarios.
ASR 5x00 supports two versions of the Open Shortest Path First (OSPF) protocol – OSPF Ver-sion 2 and OSPF Version 3.
Refer to the "ARP Troubleshooting" section for layer two connectivity issues.
OSPF Version 2
OSPF is a link-state routing protocol that employs an interior gateway protocol (IGP) to routeIP packets using the shortest path first, based solely on the destination IP address in the IPpacket header. OSPF-routed IP packets are not encapsulated in any additional protocol headersas they transit the network.
An Autonomous System (AS), or Domain, is defined as a group of networks within a commonrouting infrastructure. OSPF is a dynamic routing protocol that quickly detects topologicalchanges in the Autonomous System (AS) (such as router interface failures) and calculates newloop-free routes after a period of convergence.
In a link-state routing protocol, each router maintains a database, referred to as the link-statedatabase, that describes the Autonomous System's topology. Each participating router has anidentical database. Each entry in this database is a particular router's local state and the routerdistributes its local state throughout the AS via multicast. All routers run the same algorithm inparallel. From the link-state database, each router constructs a tree of shortest paths with itselfas root to each destination in the AS. Externally derived routing information appears on thetree as leaves. The cost of a route is described by a single dimensionless metric.
OSPF allows sets of networks to be grouped together. Such a grouping is called an area. Thetopology of this area is hidden from the rest of the AS, which enables a significant reduction inrouting traffic. Also, routing within the area is determined only by the area‘s own topology,lending the area protection from bad routing data. An area is a generalization of an IP subnet-
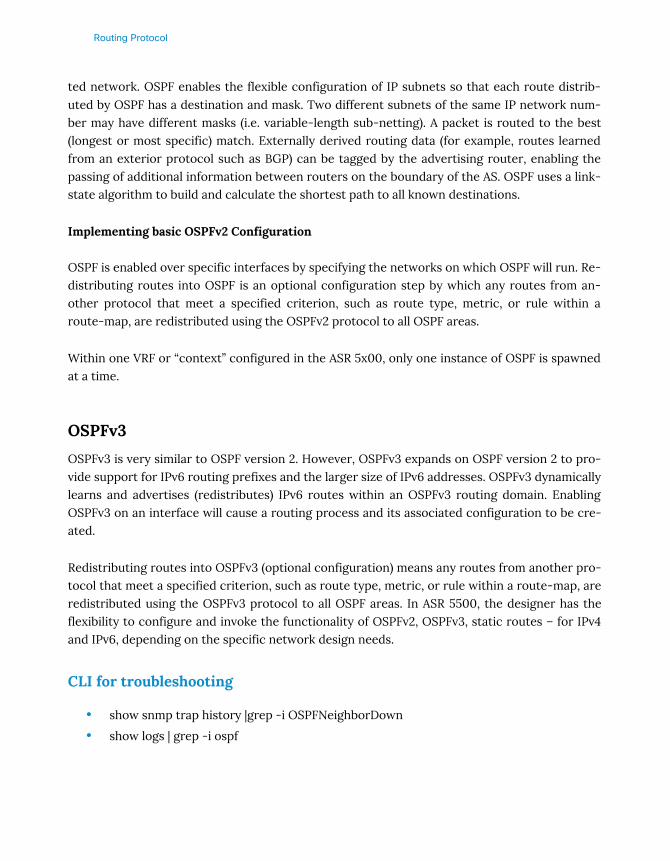
Routing Protocol
ted network. OSPF enables the flexible configuration of IP subnets so that each route distrib-uted by OSPF has a destination and mask. Two different subnets of the same IP network num-ber may have different masks (i.e. variable-length sub-netting). A packet is routed to the best(longest or most specific) match. Externally derived routing data (for example, routes learnedfrom an exterior protocol such as BGP) can be tagged by the advertising router, enabling thepassing of additional information between routers on the boundary of the AS. OSPF uses a link-state algorithm to build and calculate the shortest path to all known destinations.
Implementing basic OSPFv2 Configuration
OSPF is enabled over specific interfaces by specifying the networks on which OSPF will run. Re-distributing routes into OSPF is an optional configuration step by which any routes from an-other protocol that meet a specified criterion, such as route type, metric, or rule within aroute-map, are redistributed using the OSPFv2 protocol to all OSPF areas.
Within one VRF or “context” configured in the ASR 5x00, only one instance of OSPF is spawnedat a time.
OSPFv3
OSPFv3 is very similar to OSPF version 2. However, OSPFv3 expands on OSPF version 2 to pro-vide support for IPv6 routing prefixes and the larger size of IPv6 addresses. OSPFv3 dynamicallylearns and advertises (redistributes) IPv6 routes within an OSPFv3 routing domain. EnablingOSPFv3 on an interface will cause a routing process and its associated configuration to be cre-ated.
Redistributing routes into OSPFv3 (optional configuration) means any routes from another pro-tocol that meet a specified criterion, such as route type, metric, or rule within a route-map, areredistributed using the OSPFv3 protocol to all OSPF areas. In ASR 5500, the designer has theflexibility to configure and invoke the functionality of OSPFv2, OSPFv3, static routes – for IPv4and IPv6, depending on the specific network design needs.
CLI for troubleshooting
• show snmp trap history |grep -i OSPFNeighborDown
• show logs | grep -i ospf

Routing Protocol
OSPF related commands can be run only from the context where OSPF is configured. Givenbelow are some CLIs that can be used for troubleshooting on an ASR 5x00 platform followed bysample output from a lab setup.
• show ip ospf
• show ip ospf neighbor details
• show ip ospf database verbose
• show ip ospf routes
• ping <ospf neighbor ip> src <interface / loopback address>
For capturing active logs
• logging filter active facility ospf level debug
• logging active
# show ip ospf
[gi]SPGW-2# show ip ospf
OSPF Routing Process 0, Router ID: 192.168.7.2
Supports only single TOS (TOS0) routes
This implementation conforms to RFC2328
Graceful-Restart: Capability: Enabled, Router Mode: Disabled
SPF schedule delay 5 secs, Hold time between two SPFs 10 secs
Refresh timer 10 secs
This router is an ASBR (injecting external routing information)
Number of external LSA 2
Area ID: 0.0.0.0 (Backbone)
Number of interfaces in this area: Total: 1, Active: 1
Number of fully adjacent neighbors in this area: 1
Area has no authentication
SPF algorithm executed 579619 times
Number of LSA 3
[gi]SPGW-2#
# show ip ospf neighbor details
[gi]SPGW-2# show ip ospf neighbor details
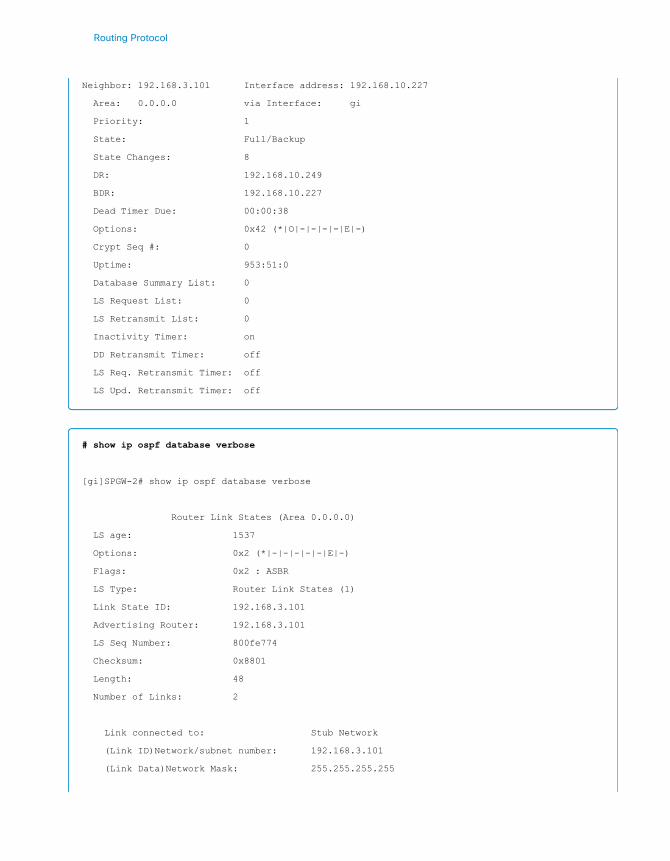
Routing Protocol
Neighbor: 192.168.3.101 Interface address: 192.168.10.227
Area: 0.0.0.0 via Interface: gi
Priority: 1
State: Full/Backup
State Changes: 8
DR: 192.168.10.249
BDR: 192.168.10.227
Dead Timer Due: 00:00:38
Options: 0x42 (*|O|-|-|-|-|E|-)
Crypt Seq #: 0
Uptime: 953:51:0
Database Summary List: 0
LS Request List: 0
LS Retransmit List: 0
Inactivity Timer: on
DD Retransmit Timer: off
LS Req. Retransmit Timer: off
LS Upd. Retransmit Timer: off
# show ip ospf database verbose
[gi]SPGW-2# show ip ospf database verbose
Router Link States (Area 0.0.0.0)
LS age: 1537
Options: 0x2 (*|-|-|-|-|-|E|-)
Flags: 0x2 : ASBR
LS Type: Router Link States (1)
Link State ID: 192.168.3.101
Advertising Router: 192.168.3.101
LS Seq Number: 800fe774
Checksum: 0x8801
Length: 48
Number of Links: 2
Link connected to: Stub Network
(Link ID)Network/subnet number: 192.168.3.101
(Link Data)Network Mask: 255.255.255.255
Routing Protocol
Number of TOS metrics: 0
TOS 0 Metric: 10
Link connected to: a Transit Network
(Link ID)Designated Router address: 192.168.10.249
(Link Data)Router Interface address: 192.168.10.227
Number of TOS metrics: 0
TOS 0 Metric: 10
LS age: 1052
Options: 0x2 (*|-|-|-|-|-|E|-)
Flags: 0x2 : ASBR
LS Type: Router Link States (1)
Link State ID: 192.168.7.2
Advertising Router: 192.168.7.2
LS Seq Number: 8000100e
Checksum: 0xd694
Length: 36
Number of Links: 1
Link connected to: a Transit Network
(Link ID)Designated Router address: 192.168.10.249
(Link Data)Router Interface address: 192.168.10.249
Number of TOS metrics: 0
TOS 0 Metric: 10
Network Link States (Area 0.0.0.0)
LS age: 952
Options: 0x2 (*|-|-|-|-|-|E|-)
LS Type: Net Link States (2)
Link State ID: 192.168.10.249 (address of Designated Router)
Advertising Router: 192.168.7.2
LS Seq Number: 80000e46
Checksum: 0x6082
Length: 32
Network Mask: /24
Attached Router: 192.168.7.2
Attached Router: 192.168.3.101
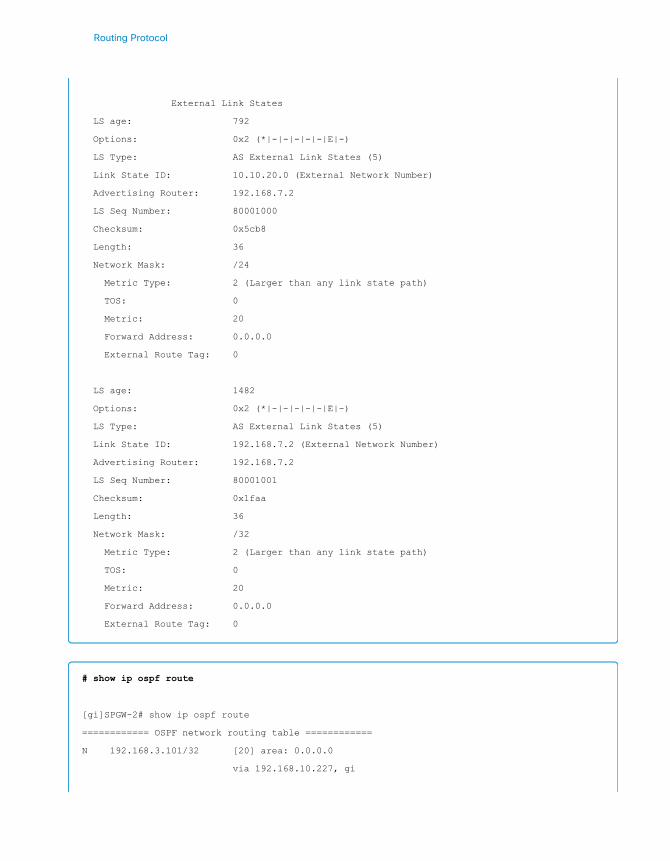
Routing Protocol
External Link States
LS age: 792
Options: 0x2 (*|-|-|-|-|-|E|-)
LS Type: AS External Link States (5)
Link State ID: 10.10.20.0 (External Network Number)
Advertising Router: 192.168.7.2
LS Seq Number: 80001000
Checksum: 0x5cb8
Length: 36
Network Mask: /24
Metric Type: 2 (Larger than any link state path)
TOS: 0
Metric: 20
Forward Address: 0.0.0.0
External Route Tag: 0
LS age: 1482
Options: 0x2 (*|-|-|-|-|-|E|-)
LS Type: AS External Link States (5)
Link State ID: 192.168.7.2 (External Network Number)
Advertising Router: 192.168.7.2
LS Seq Number: 80001001
Checksum: 0x1faa
Length: 36
Network Mask: /32
Metric Type: 2 (Larger than any link state path)
TOS: 0
Metric: 20
Forward Address: 0.0.0.0
External Route Tag: 0
# show ip ospf route
[gi]SPGW-2# show ip ospf route
============ OSPF network routing table ============
N 192.168.3.101/32 [20] area: 0.0.0.0
via 192.168.10.227, gi
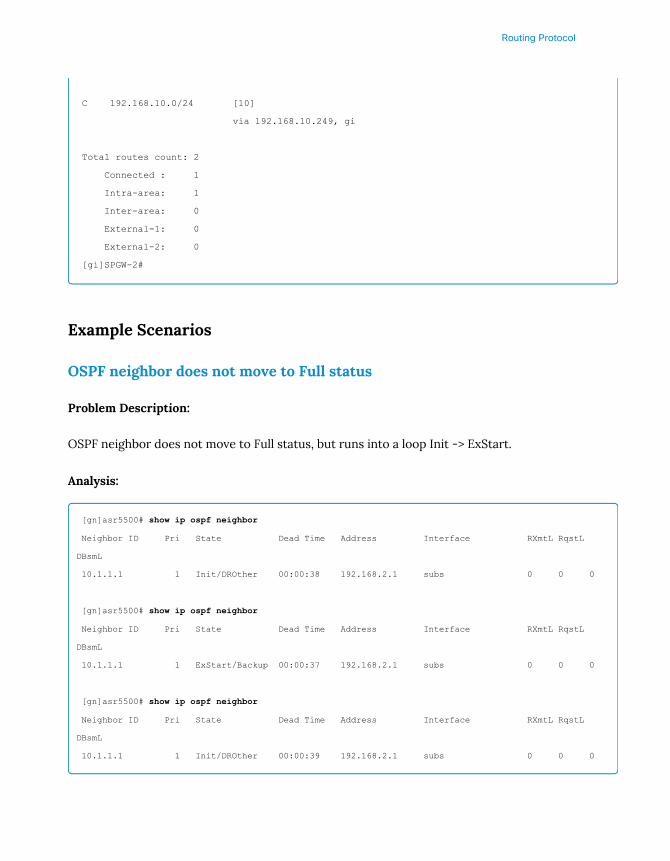
Routing Protocol
C 192.168.10.0/24 [10]
via 192.168.10.249, gi
Total routes count: 2
Connected : 1
Intra-area: 1
Inter-area: 0
External-1: 0
External-2: 0
[gi]SPGW-2#
Example Scenarios
OSPF neighbor does not move to Full status
Problem Description:
OSPF neighbor does not move to Full status, but runs into a loop Init -> ExStart.
Analysis:
[gn]asr5500# show ip ospf neighbor
Neighbor ID Pri State Dead Time Address Interface RXmtL RqstL
DBsmL
10.1.1.1 1 Init/DROther 00:00:38 192.168.2.1 subs 0 0 0
[gn]asr5500# show ip ospf neighbor
Neighbor ID Pri State Dead Time Address Interface RXmtL RqstL
DBsmL
10.1.1.1 1 ExStart/Backup 00:00:37 192.168.2.1 subs 0 0 0
[gn]asr5500# show ip ospf neighbor
Neighbor ID Pri State Dead Time Address Interface RXmtL RqstL
DBsmL
10.1.1.1 1 Init/DROther 00:00:39 192.168.2.1 subs 0 0 0
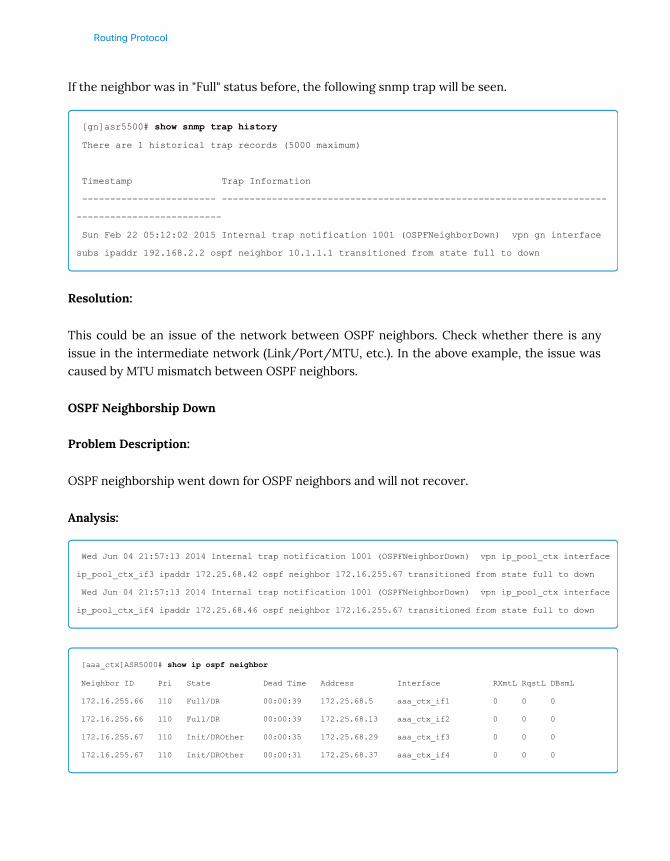
Routing Protocol
If the neighbor was in "Full" status before, the following snmp trap will be seen.
[gn]asr5500# show snmp trap history
There are 1 historical trap records (5000 maximum)
Timestamp Trap Information
------------------------ ---------------------------------------------------------------------
--------------------------
Sun Feb 22 05:12:02 2015 Internal trap notification 1001 (OSPFNeighborDown) vpn gn interface
subs ipaddr 192.168.2.2 ospf neighbor 10.1.1.1 transitioned from state full to down
Resolution:
This could be an issue of the network between OSPF neighbors. Check whether there is anyissue in the intermediate network (Link/Port/MTU, etc.). In the above example, the issue wascaused by MTU mismatch between OSPF neighbors.
OSPF Neighborship Down
Problem Description:
OSPF neighborship went down for OSPF neighbors and will not recover.
Analysis:
Wed Jun 04 21:57:13 2014 Internal trap notification 1001 (OSPFNeighborDown) vpn ip_pool_ctx interface
ip_pool_ctx_if3 ipaddr 172.25.68.42 ospf neighbor 172.16.255.67 transitioned from state full to down
Wed Jun 04 21:57:13 2014 Internal trap notification 1001 (OSPFNeighborDown) vpn ip_pool_ctx interface
ip_pool_ctx_if4 ipaddr 172.25.68.46 ospf neighbor 172.16.255.67 transitioned from state full to down
[aaa_ctx]ASR5000# show ip ospf neighbor
Neighbor ID Pri State Dead Time Address Interface RXmtL RqstL DBsmL
172.16.255.66 110 Full/DR 00:00:39 172.25.68.5 aaa_ctx_if1 0 0 0
172.16.255.66 110 Full/DR 00:00:39 172.25.68.13 aaa_ctx_if2 0 0 0
172.16.255.67 110 Init/DROther 00:00:35 172.25.68.29 aaa_ctx_if3 0 0 0
172.16.255.67 110 Init/DROther 00:00:31 172.25.68.37 aaa_ctx_if4 0 0 0
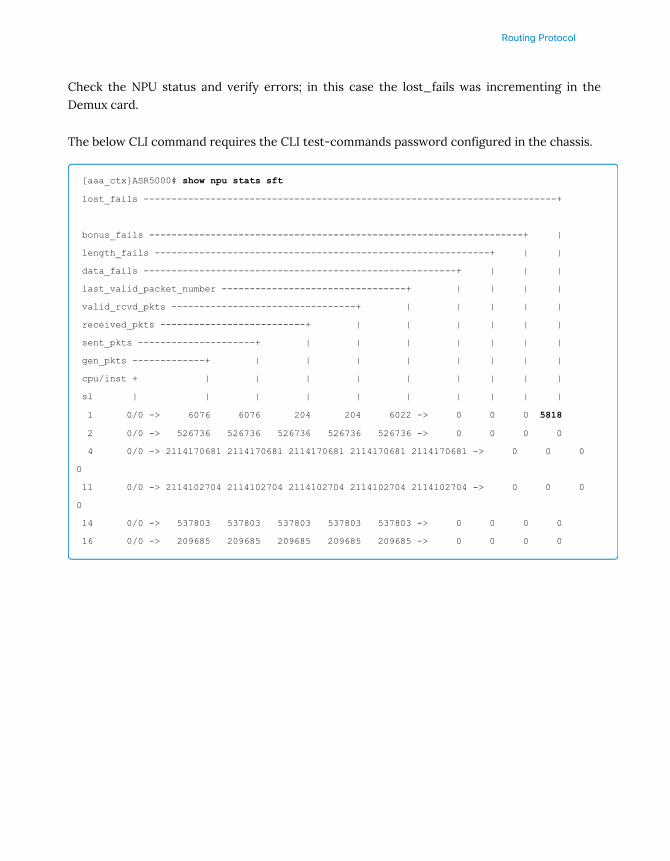
Routing Protocol
Check the NPU status and verify errors; in this case the lost_fails was incrementing in theDemux card.
The below CLI command requires the CLI test-commands password configured in the chassis.
[aaa_ctx]ASR5000# show npu stats sft
lost_fails --------------------------------------------------------------------------+
bonus_fails -------------------------------------------------------------------+ |
length_fails ------------------------------------------------------------+ | |
data_fails --------------------------------------------------------+ | | |
last_valid_packet_number ---------------------------------+ | | | |
valid_rcvd_pkts ---------------------------------+ | | | | |
received_pkts --------------------------+ | | | | | |
sent_pkts ---------------------+ | | | | | | |
gen_pkts -------------+ | | | | | | | |
cpu/inst + | | | | | | | | |
sl | | | | | | | | | |
1 0/0 -> 6076 6076 204 204 6022 -> 0 0 0 5818
2 0/0 -> 526736 526736 526736 526736 526736 -> 0 0 0 0
4 0/0 -> 2114170681 2114170681 2114170681 2114170681 2114170681 -> 0 0 0
0
11 0/0 -> 2114102704 2114102704 2114102704 2114102704 2114102704 -> 0 0 0
0
14 0/0 -> 537803 537803 537803 537803 537803 -> 0 0 0 0
16 0/0 -> 209685 209685 209685 209685 209685 -> 0 0 0 0
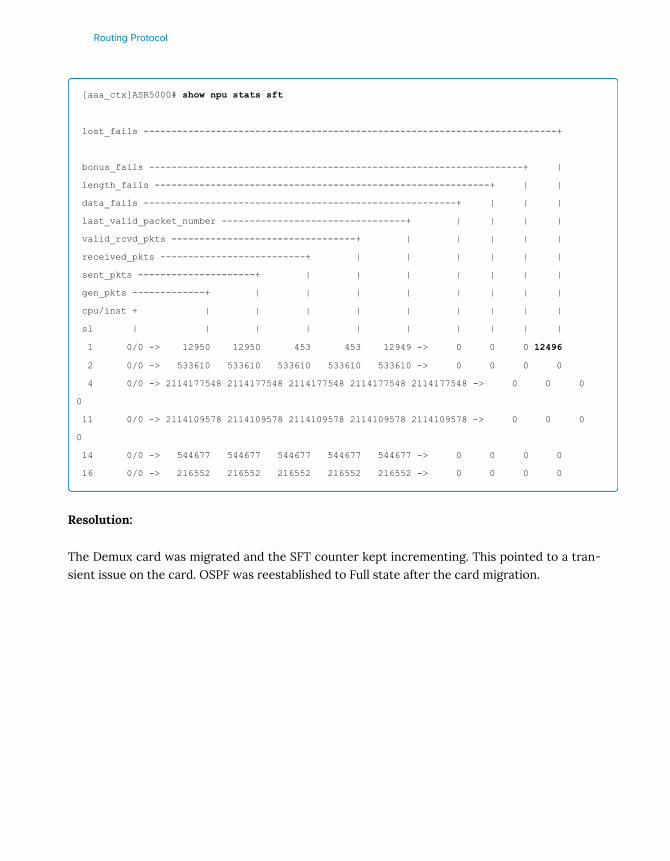
Routing Protocol
[aaa_ctx]ASR5000# show npu stats sft
lost_fails --------------------------------------------------------------------------+
bonus_fails -------------------------------------------------------------------+ |
length_fails ------------------------------------------------------------+ | |
data_fails --------------------------------------------------------+ | | |
last_valid_packet_number ---------------------------------+ | | | |
valid_rcvd_pkts ---------------------------------+ | | | | |
received_pkts --------------------------+ | | | | | |
sent_pkts ---------------------+ | | | | | | |
gen_pkts -------------+ | | | | | | | |
cpu/inst + | | | | | | | | |
sl | | | | | | | | | |
1 0/0 -> 12950 12950 453 453 12949 -> 0 0 0 12496
2 0/0 -> 533610 533610 533610 533610 533610 -> 0 0 0 0
4 0/0 -> 2114177548 2114177548 2114177548 2114177548 2114177548 -> 0 0 0
0
11 0/0 -> 2114109578 2114109578 2114109578 2114109578 2114109578 -> 0 0 0
0
14 0/0 -> 544677 544677 544677 544677 544677 -> 0 0 0 0
16 0/0 -> 216552 216552 216552 216552 216552 -> 0 0 0 0
Resolution:
The Demux card was migrated and the SFT counter kept incrementing. This pointed to a tran-sient issue on the card. OSPF was reestablished to Full state after the card migration.
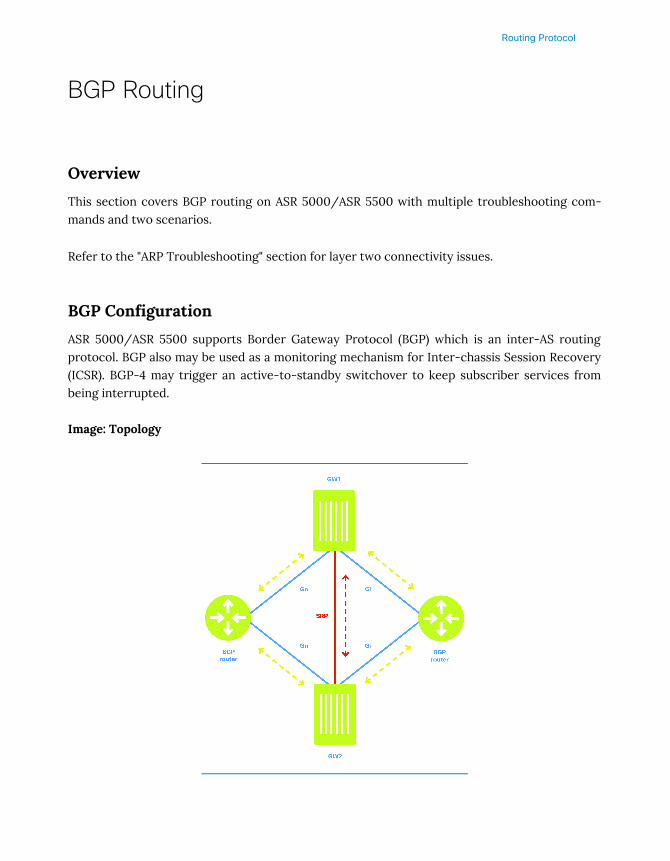
Routing Protocol
BGP Routing
Overview
This section covers BGP routing on ASR 5000/ASR 5500 with multiple troubleshooting com-mands and two scenarios.
Refer to the "ARP Troubleshooting" section for layer two connectivity issues.
BGP Configuration
ASR 5000/ASR 5500 supports Border Gateway Protocol (BGP) which is an inter-AS routingprotocol. BGP also may be used as a monitoring mechanism for Inter-chassis Session Recovery(ICSR). BGP-4 may trigger an active-to-standby switchover to keep subscriber services frombeing interrupted.
Image: Topology

Routing Protocol
Below is the basic configuration of BGP.
config
context contextname
router bgp as_number
neighbor ip_address remote-as remote_as_number
CLI for troubleshooting
• show snmp trap history verbose | grep -i bgp
• show logs | grep -i bgp
• show srp monitor all (if ICSR is used)
Below are context aware CLIs. These commands will need to run from the proper context.context <context name>
• show ip interface summary
• show ipv6 interface summary
• show ip bgp
• show ip bgp summary
• show ip bgp neighbors
• show ip bgp neighbors <IP Address> accepted-routes
• show ip bgp neighbors <IP Address> advertised-routes
• show ip bgp neighbors <IP Address> received-routes
• ping <BGP Neighbor IPV4> src <IPv4 Loopback>
• ping6 <BGP Neighbor IPv6> src <IPv6 Loopback>
The following commands should only be done upon recommendation from Cisco Support asincreasing the logging too high may risk stress on the system and impact subscribers.
• logging filter active facility bgp level debug
• logging filter active facility iparp level debug
• logging active
• no logging active
• Wireshark traces
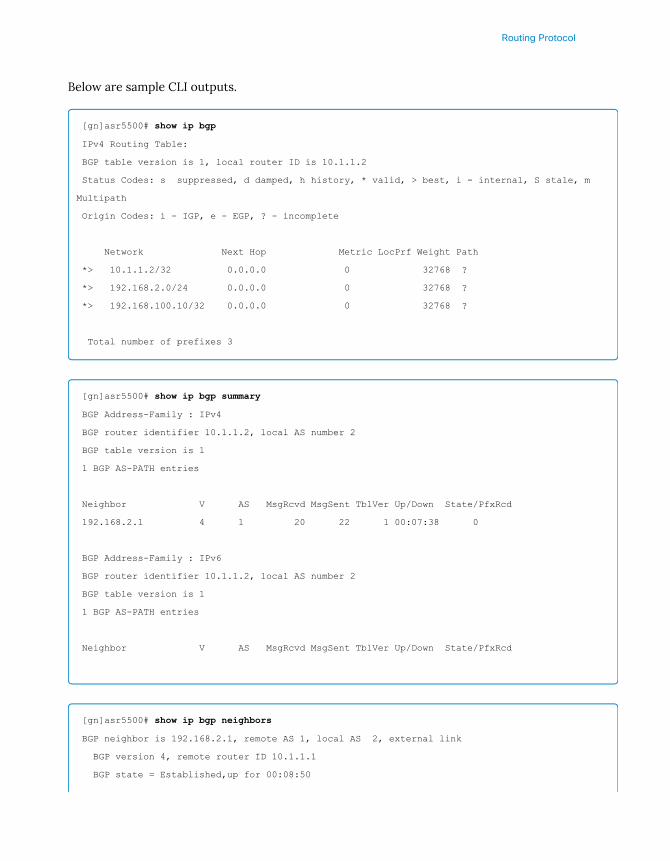
Routing Protocol
Below are sample CLI outputs.
[gn]asr5500# show ip bgp
IPv4 Routing Table:
BGP table version is 1, local router ID is 10.1.1.2
Status Codes: s suppressed, d damped, h history, * valid, > best, i - internal, S stale, m
Multipath
Origin Codes: i - IGP, e - EGP, ? - incomplete
Network Next Hop Metric LocPrf Weight Path
*> 10.1.1.2/32 0.0.0.0 0 32768 ?
*> 192.168.2.0/24 0.0.0.0 0 32768 ?
*> 192.168.100.10/32 0.0.0.0 0 32768 ?
Total number of prefixes 3
[gn]asr5500# show ip bgp summary
BGP Address-Family : IPv4
BGP router identifier 10.1.1.2, local AS number 2
BGP table version is 1
1 BGP AS-PATH entries
Neighbor V AS MsgRcvd MsgSent TblVer Up/Down State/PfxRcd
192.168.2.1 4 1 20 22 1 00:07:38 0
BGP Address-Family : IPv6
BGP router identifier 10.1.1.2, local AS number 2
BGP table version is 1
1 BGP AS-PATH entries
Neighbor V AS MsgRcvd MsgSent TblVer Up/Down State/PfxRcd
[gn]asr5500# show ip bgp neighbors
BGP neighbor is 192.168.2.1, remote AS 1, local AS 2, external link
BGP version 4, remote router ID 10.1.1.1
BGP state = Established,up for 00:08:50
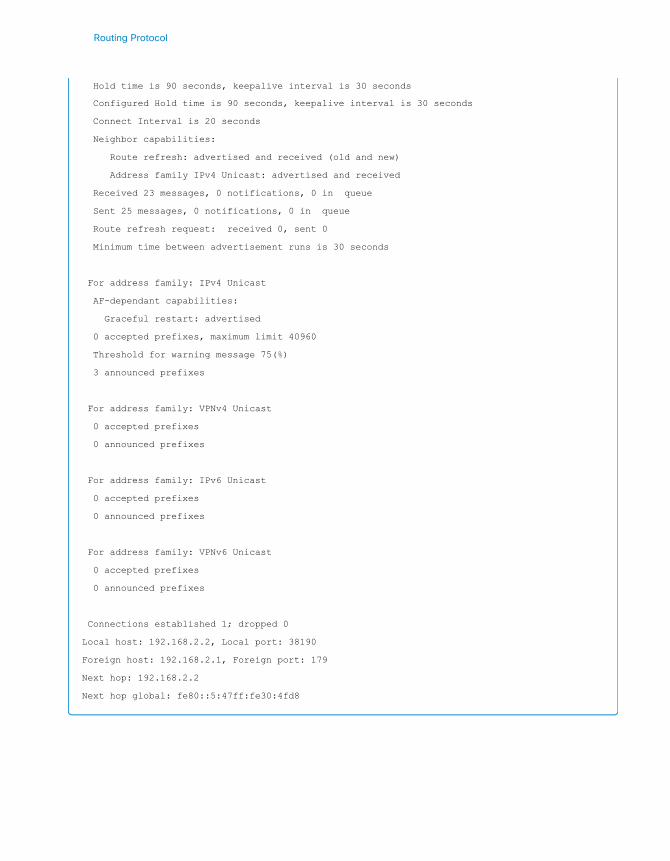
Routing Protocol
Hold time is 90 seconds, keepalive interval is 30 seconds
Configured Hold time is 90 seconds, keepalive interval is 30 seconds
Connect Interval is 20 seconds
Neighbor capabilities:
Route refresh: advertised and received (old and new)
Address family IPv4 Unicast: advertised and received
Received 23 messages, 0 notifications, 0 in queue
Sent 25 messages, 0 notifications, 0 in queue
Route refresh request: received 0, sent 0
Minimum time between advertisement runs is 30 seconds
For address family: IPv4 Unicast
AF-dependant capabilities:
Graceful restart: advertised
0 accepted prefixes, maximum limit 40960
Threshold for warning message 75(%)
3 announced prefixes
For address family: VPNv4 Unicast
0 accepted prefixes
0 announced prefixes
For address family: IPv6 Unicast
0 accepted prefixes
0 announced prefixes
For address family: VPNv6 Unicast
0 accepted prefixes
0 announced prefixes
Connections established 1; dropped 0
Local host: 192.168.2.2, Local port: 38190
Foreign host: 192.168.2.1, Foreign port: 179
Next hop: 192.168.2.2
Next hop global: fe80::5:47ff:fe30:4fd8
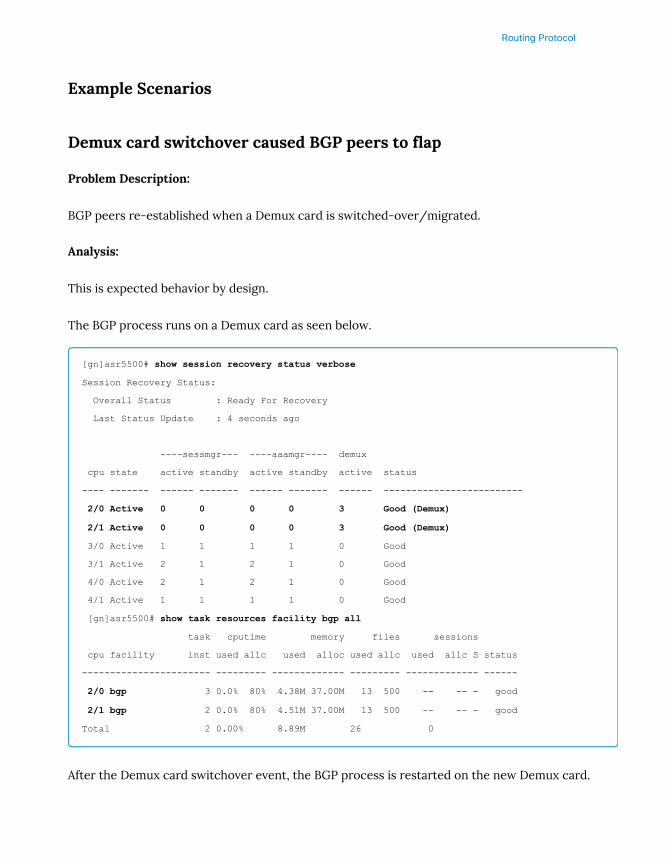
Routing Protocol
Example Scenarios
Demux card switchover caused BGP peers to flap
Problem Description:
BGP peers re-established when a Demux card is switched-over/migrated.
Analysis:
This is expected behavior by design.
The BGP process runs on a Demux card as seen below.
[gn]asr5500# show session recovery status verbose
Session Recovery Status:
Overall Status : Ready For Recovery
Last Status Update : 4 seconds ago
----sessmgr--- ----aaamgr---- demux
cpu state active standby active standby active status
---- ------- ------ ------- ------ ------- ------ -------------------------
2/0 Active 0 0 0 0 3 Good (Demux)
2/1 Active 0 0 0 0 3 Good (Demux)
3/0 Active 1 1 1 1 0 Good
3/1 Active 2 1 2 1 0 Good
4/0 Active 2 1 2 1 0 Good
4/1 Active 1 1 1 1 0 Good
[gn]asr5500# show task resources facility bgp all
task cputime memory files sessions
cpu facility inst used allc used alloc used allc used allc S status
----------------------- --------- ------------- --------- ------------- ------
2/0 bgp 3 0.0% 80% 4.38M 37.00M 13 500 -- -- - good
2/1 bgp 2 0.0% 80% 4.51M 37.00M 13 500 -- -- - good
Total 2 0.00% 8.89M 26 0
After the Demux card switchover event, the BGP process is restarted on the new Demux card.
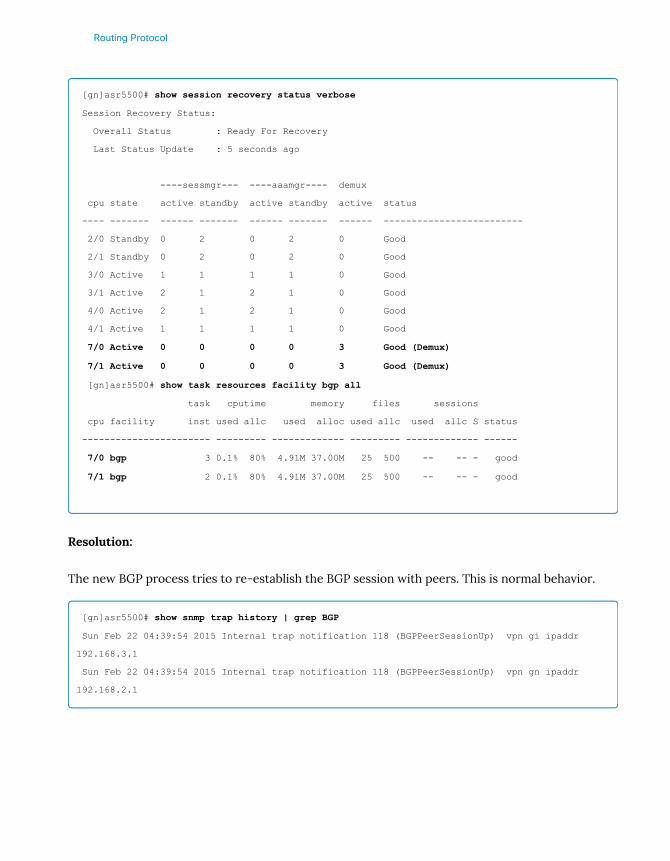
Routing Protocol
[gn]asr5500# show session recovery status verbose
Session Recovery Status:
Overall Status : Ready For Recovery
Last Status Update : 5 seconds ago
----sessmgr--- ----aaamgr---- demux
cpu state active standby active standby active status
---- ------- ------ ------- ------ ------- ------ -------------------------
2/0 Standby 0 2 0 2 0 Good
2/1 Standby 0 2 0 2 0 Good
3/0 Active 1 1 1 1 0 Good
3/1 Active 2 1 2 1 0 Good
4/0 Active 2 1 2 1 0 Good
4/1 Active 1 1 1 1 0 Good
7/0 Active 0 0 0 0 3 Good (Demux)
7/1 Active 0 0 0 0 3 Good (Demux)
[gn]asr5500# show task resources facility bgp all
task cputime memory files sessions
cpu facility inst used allc used alloc used allc used allc S status
----------------------- --------- ------------- --------- ------------- ------
7/0 bgp 3 0.1% 80% 4.91M 37.00M 25 500 -- -- - good
7/1 bgp 2 0.1% 80% 4.91M 37.00M 25 500 -- -- - good
Resolution:
The new BGP process tries to re-establish the BGP session with peers. This is normal behavior.
[gn]asr5500# show snmp trap history | grep BGP
Sun Feb 22 04:39:54 2015 Internal trap notification 118 (BGPPeerSessionUp) vpn gi ipaddr
192.168.3.1
Sun Feb 22 04:39:54 2015 Internal trap notification 118 (BGPPeerSessionUp) vpn gn ipaddr
192.168.2.1
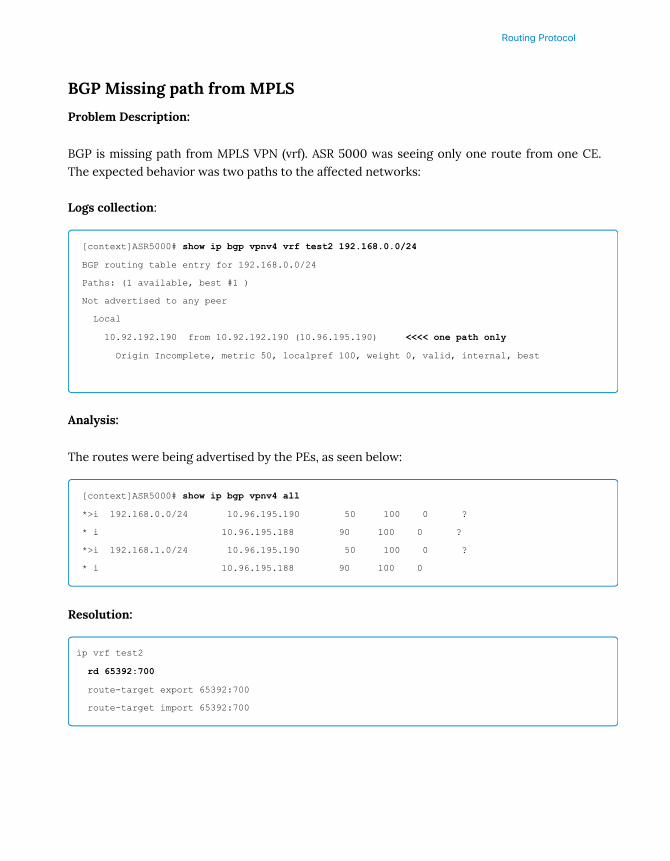
Routing Protocol
BGP Missing path from MPLS
Problem Description:
BGP is missing path from MPLS VPN (vrf). ASR 5000 was seeing only one route from one CE.The expected behavior was two paths to the affected networks:
Logs collection:
[context]ASR5000# show ip bgp vpnv4 vrf test2 192.168.0.0/24
BGP routing table entry for 192.168.0.0/24
Paths: (1 available, best #1 )
Not advertised to any peer
Local
10.92.192.190 from 10.92.192.190 (10.96.195.190) <<<< one path only
Origin Incomplete, metric 50, localpref 100, weight 0, valid, internal, best
Analysis:
The routes were being advertised by the PEs, as seen below:
[context]ASR5000# show ip bgp vpnv4 all
*>i 192.168.0.0/24 10.96.195.190 50 100 0 ?
* i 10.96.195.188 90 100 0 ?
*>i 192.168.1.0/24 10.96.195.190 50 100 0 ?
* i 10.96.195.188 90 100 0
Resolution:
ip vrf test2
rd 65392:700
route-target export 65392:700 route-target import 65392:700
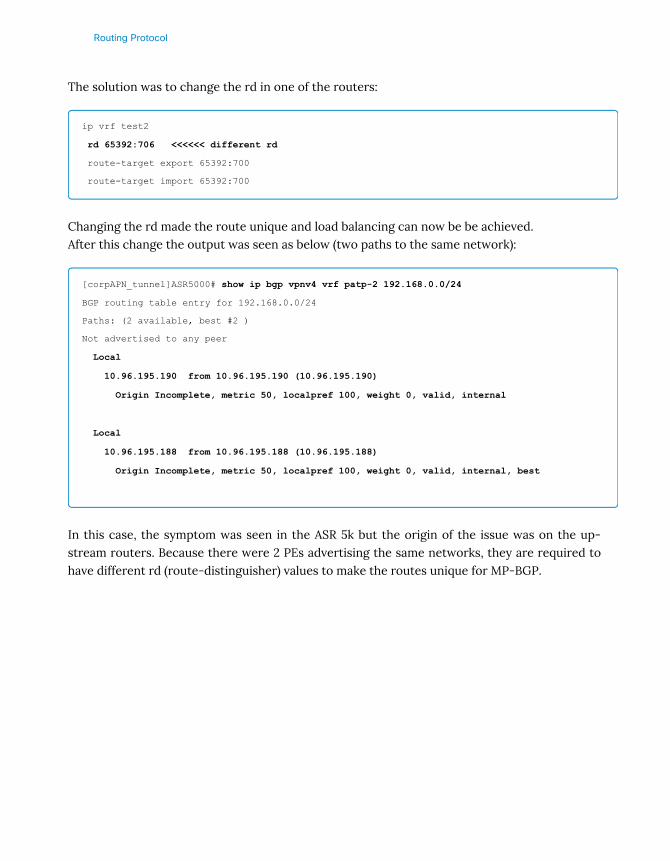
Routing Protocol
The solution was to change the rd in one of the routers:
ip vrf test2
rd 65392:706 <<<<<< different rd
route-target export 65392:700 route-target import 65392:700
Changing the rd made the route unique and load balancing can now be be achieved.After this change the output was seen as below (two paths to the same network):
[corpAPN_tunnel]ASR5000# show ip bgp vpnv4 vrf patp-2 192.168.0.0/24
BGP routing table entry for 192.168.0.0/24
Paths: (2 available, best #2 )
Not advertised to any peer
Local
10.96.195.190 from 10.96.195.190 (10.96.195.190)
Origin Incomplete, metric 50, localpref 100, weight 0, valid, internal
Local
10.96.195.188 from 10.96.195.188 (10.96.195.188)
Origin Incomplete, metric 50, localpref 100, weight 0, valid, internal, best
In this case, the symptom was seen in the ASR 5k but the origin of the issue was on the up-stream routers. Because there were 2 PEs advertising the same networks, they are required tohave different rd (route-distinguisher) values to make the routes unique for MP-BGP.

Interchassis SessionRecovery

Interchassis Session Recovery
Inter Chassis Session Recovery
Overview
This section talks about how redundancy works in the ASR 5x00 platform using ICSR, providestroubleshooting commands, and then goes over common issues related to ICSR.
ICSR Architecture
Inter Chassis Session Recovery (ICSR) provides a solution using a pair of redundant nodes (i.e.HA and PGWs) where one node is Active, handling subscribers, and the other is Standby, readyto handle those subscribers in case the Active chassis has an issue and needs to switch over.This architecture is beneficial not only for outage scenarios but also for upgrades where thesubscribers can maintain their connections while both nodes are upgraded, one after the other,and switching over in between.
Although not required, both nodes are typically geographically separated from each other. Theywould be configured similarly with the same services, IP pools, contexts, and hardware, andeven some of the same loopback addresses used by the services running on the chassis. Eachchassis will have its own specific physical addresses.
Besides the ability of being able to manually switch sessions over to the Standby, the Activechassis is also able to monitor itself for BGP, Diameter, and Radius connectivity in various con-texts. If the specified protocols being monitored lose connectivity, then an unplannedswitchover will occur.
ICSR relies on a special configuration section called service-redundancy-protocol (SRP) inwhich all the SRP-related configuration is done. An IP address is bound to the service and itcommunicates over a TCP/IP link to the other ICSR node, regularly sending and receiving SRPmessages that contain the state of both sides as well as detailed information about every call onthe system that has been attached longer than the configured threshold. These messages arecalled checkpoints and they allow the Standby to immediately re-create sessions and preservestate in the case of a switchover event.
Since both chassis are present on the network, and sharing much of the same IP information,the network must be able to know which chassis is active and be able to re-converge the trans-

Interchassis Session Recovery
port network in the event of a switchover. To do this, BGP is used, and in particular, BGP han-dles route modifiers. The Active chassis will always be the one that has the lower-numberedBGP route modifier, while the Standby chassis will have a route modifier value (usually one)greater than the active. This will result in more pre-pends added to BGP packet advertisementscoming from the nodes, and as a result, network traffic will be pointed to the chassis sendingupdates that have fewer pre-pends. BGP route advertisements from the Standby are highly re-stricted and most of the loopbacks are in 'down' state. This further reduces the likelihood of in-troducing routing issues into the transport network.
If the connection between both nodes is severed, the standby node will become pseudo-activeand send BGP updates. In this case both chassis in the pair will be in Active state. Due to thenature of the route modifiers in BGP, however, the newly-Active chassis should not receive anytraffic since its updates have more pre-pends. If at any point the originally Active node stopssending BGP updates (ie: it gets reloaded, internal failures for BGP, chassis stops processingtraffic), then that Standby chassis should start to receive traffic
More details about ICSR architecture, along with diagrams, can be found in the product docu-mentation available on Cisco's support site.
Useful commands:
• show srp checkpoint statistics
• show srp checkpoint statistics verbose
• show srp audit-statistics all
• show srp checkpoint statistics debug-info
• show srp checkpoint statistics standby debug-info verbose
• show srp checkpoint statistics active verbose
• show srp call-loss statistics
• show srp info
• show srp statistics
• show srp audit-statistics
• show snmp trap statistics
• show snmp trap history
Interchassis Session Recovery
ICSR Troubleshooting
Overview
This chapter talks about known SRP issues and how to troubleshoot them.
Common SRP issues
1 SRP Connection down
2 SRP Configuration mismatch
3 Unplanned SRP Switchover
4 SRP Switchover takes longer than planned
5 Confirm that ICSR chassis pair is ready for an SRP Switchover
6 Verify that SRP Switchover was successful
SRP Connection Down
The SRP connection between the the Active and the Standby SRP chassis can go down for manyreasons. Following are the steps to take in order to investigate why an SRP connectiondown occured. If at the end of the following the steps, the issue is not resolved, please open acase with Cisco in order to assist in troubleshooting.
1 Take an SSD before executing the following steps
2 Log into the normally SRP Active chassis
3 Issue the "show srp info" command
• Make note of the "Peer Remote Address"• Verify the "Chassis State" is "Active" and the "Connection State" is "Not
Connected", which would be an indication of the SRP connection down issue.
4 Access the context configured for the SRP feature:
• context <SRP Context name>

Interchassis Session Recovery
5 Verify the interface configured for connectivity to the SRP mate:
• show ip interface summary
• Verify the interface status is in the "up" state
• If the interface is not in the "up" state, follow steps in the the "Card and PortTroubleshooting" and "L2 Troubleshooting" chapter.
6 Obtain the default route for the SRP interface by issuing the "show ip route" command
• Make note of the Nexthop address
7 Ping the Nexthop address of the local SRP interface:
• ping <Nexthop Address>
• ping <Peer Remote Address>
• If the IP address is not reachable, follow the "Routing Protocol" section toaddress network connectivity.
8 Log into the normal SRP Standby chassis and execute steps 2-6
9 Verify that both chassis are configured with the correct Peer Remote Address
10 If all of the above has been verified, and the SRP Connection remains down, please open
a case with Cisco
SRP Configuration Mismatch:
An SRP configuration mismatch can occur when the configuration that is monitored by the SRPfeature is changed on either the Active or Standby chassis without ensuring the changes arealso made on the mated SRP chassis. Here are the steps to take in order to identify and resolvethe issue. If the issue is not cleared at the end of the steps, please open a case with Cisco:
1 Take an SSD before executing the following steps
2 Log into the normally SRP Active chassis
3 Issue the "show srp info" command
• Make note of the "Last Peer Configuration Error field". Ensure "InvalidChecksum" is not displayed. If present, it would be an indication that there isan SRP configuration mismatch between the two chassis.
4 Issue the command "show configuration srp checksum"
• Make note of the "Configuration checksum" that was generated
Interchassis Session Recovery
5 Display the configuration that SRP uses to generate the SRP Checksum by issuing the
command "show configuration srp"
• Save the displayed data to a text file.
6 Now log into the normally SRP Standby chassis and execute steps 2-5
7 Compare the checksum from both the SRP Active and SRP Standby chassis
• If the checksums are the same and the "Invalid Checksum" is still displayed inthe "show srp info" command, please open a case with Cisco for furthertroubleshooting
8 Compare the two text files containing the "show configuration srp" data line- by-line to
ensure there are no differences in the configuration. Using a diff utility can save time
and avoid missing differences.
If no differences are found in the text files, please open a case with Cisco for further
troubleshooting
9 If differences were found in the configuration, modify the configuration so that both
chassis match.
Unplanned SRP Switchover occurred
SRP switchovers occur when the system identifies trigger events that cause it to transfer theSRP Active state to the normally SRP Standby chassis. These trigger events are defined in theSRP Configuration context using the "monitor" configuration command.
1 Take an SSD before executing the following steps
2 Log into the chassis that was formerly the SRP Active chassis
3 Issue the "show srp info" command and verify the chassis state is "Standby" and the
"Connection State" is "Connected"
4 Issue the command "show srp call-loss statistics"
• This command will display the SRP Switchovers that have occured with themost recent display first
• Make note of the "Switchover-X started at :" field.
"x" will be the number of Switchovers that have been recorded by thischassis.
• Make note of the "Switchover reason :"
Interchassis Session Recovery
5 Review system logs and SNMP Traps that occurred during the period leading up to the
SRP switchover
• show logs
• show snmp trap history verbose
SRPStandy trap indicates when chassis went standby
Some traps to look for include BGPPeerSessionDown,DiameterIPv6PeerDown, DiameterPeerDown, SRPAAAAuthSrvUnreachableleading up to the switchover
6 If the SRP switchover cannot be explained with the data collected, please open a case
with Cisco for help in identifying the trigger event.
SRP Switchover takes longer than expected
In order for the ICSR feature to checkpoint subscriber sessions from the SRP Active chassis tothe SRP Standby chassis, the SRP Standby chassis will initiate a TCP SRP socket with the SRPActive chassis for each sessmgr on the system. For instance sessmgr 1 on the SRP Standby willhave a connection to sessmgr 1 on the SRP Active chassis, and this will be the case for all activesessmgrs on the system. If one of these sessmgr connections is not in the proper state, the SRPActive chassis will not be able to checkpoint its subscriber sessions to the SRP Standby chassis. If an SRP switchover is performed when in this state, the system will attempt to checkpoint thesubscribers for 300 seconds and at the expiration of 300 seconds, the system will force the SRPswitchover. This will result in the loss of all subscribers who were not checkpointed.
To avoid this situation, always follow the steps in the section below.
Confirm ICSR chassis pair are ready for an SRP Switchover
Before executing an SRP switchover, it is important to ensure the SRP Active chassis has check-pointed all subscriber sessions and all SRP sessmgr connections are connected. This procedurewill help to ensure all recommended checks are done prior to performing the SRP Switchover.

Interchassis Session Recovery
Warning:Wait 15 minutes after any crash, task restart, card migration on the samechassis pair.Wait 20 minutes after any previous SRP switchover on the same chassispair.Failure to wait the required time could have session and billing impact.
1 Perform the Health Check steps detailed in the ASR 5x00 Health Check chapter
2 Log into the Active and Standby chassis to verify their "Chassis State:"
• context local
• show srp infoChassis State: Active (From)Chassis State: Standby (To)
• If the SRP Link has been removed, these SRP commands will give invalid results.
3 Perform these SRP switchover pre-checks on both the Active and Standby chassis.
• show session recovery status verbose
Verify all are in the "Good" state
• show card table
Verify the status of all cards (Active/Standby)
• show task resources | grep -v good
Should only show the total
• show crash list
Verify there was no new crash within the last 15 minutes
4 Verify Sessions are checkpointed from the Active to the Standby
• Perform these SRP switchover pre-checks on the Active chassis
show subscriber summary | grep Total
Make note of the "Total Subscribers:" on the chassis
• Perform these SRP switchover pre-checks on the Standby chassis
show srp checkpoint-statistics | grep allocated
Make note of the total number of "Current pre-allocated calls:"
• Before the switchover can occur, the "Current pre-allocated calls:" value on theStandby chassis should be within 3% of the "Total Subscribers:" value onthe Active chassis.

Interchassis Session Recovery
5 Verify all sessmgrs are in the standby-connected state on the Standby chassis
• show srp checkpoint statistics | grep Sessmgrs
Verify the "Number of Sessmgrs:" is equal to "Sessmgrs in Standby-Connected state:"
If these values ARE NOT the same, do not proceed with an SRPswitchover, and open a case with Cisco for further troubleshooting
6 Validate the Active chassis is ready for the SRP switchover
• srp validate-configuration
• srp validate-switchover
Wait at least 15 seconds
• show srp info | grep "Last Validate Switchover Status:"
The "Last Validate Switchover Status:" should display "Remote Chassis -Ready for Switchover"
Please open a case with Cisco for further troubleshooting if "RemoteChassis - Ready for Switchover" is not displayed after waiting atleast 10 minutes
7 The system is now ready for a SRP switchover
• srp initiate-switchover
• Answer "yes" when the system asks "Are you sure?"
• After a successful SRP switchover the SRP Active chassis will now become theSRP Standby chassis
Verification SRP Switchover successful
After an SRP switchover, whether it was manual or unplanned, the system should be verified inorder to make sure processing of subscriber sessions is working normally. Here are the stepsto verify.
1 Log into the Active and Standby chassis to verify their "Chassis State:"
• context local
• show srp infoChassis State: StandbyChassis State: Active (Chassis that was Switched over To)
• If the SRP Link has been removed, these SRP commands will give invalid results.

Interchassis Session Recovery
2 On the Active and Standby chassis
• Verify Session Recovery state:
show session recovery status verbose
Verify all are in the "Good" state.
3 On the Active chassis
• Verify Sessions are checkpointed from the Active to the Standby
Perform these SRP switchover pre-checks on the Active chassis
show subscriber summary | grep Total
Make note of the "Total Subscribers:" on the chassis
Perform these SRP switchover pre-checks on the Standby chassis
show srp checkpoint-statistics | grep allocated
Make note of the total number of "Current pre-allocated calls:"
After the switchover, make sure the newly Standby chassis has the "Currentpre-allocated calls:" value on the Standby chassis within 3% of the "TotalSubscribers:" value on the newly Active chassis.
Open a case with Cisco if the values are not within 3% after 10 minutes forfurther troubleshooting.
4 Verify all sessmgrs are in the standby-connected state on the Standby chassis
• show srp checkpoint statistics | grep Sessmgrs
Verify the "Number of Sessmgrs:" is equal to "Sessmgrs in Standby-Connected state:"
If these values ARE NOT the same, open a case with Cisco for furthertroubleshooting.
5 Verify all Diameter connections have restored on the Active chassis
• show diameter peer full all | grep -i State
Verify all Diameter connections show "State: OPEN [TCP]" in the output
Follow local procedures to troubleshoot any Diameter connection in anunexpected state
Open a case with Cisco for futher troubleshooting if necessary.
6 Verify the state of all SRP Monitors on the Active chassis
• show srp monitor all
Verify all configured monitor statements have the state of "U" for up.
If any lines are not in the expected state, follow above steps to troubleshoot
Open a case with Cisco if further assistance is needed.
7 Perform the Health Check steps detailed in the ASR 5x00 Health Check chapter.


Radius

Radius
Overview
Radius authentication and accounting are typically components on call flows for CDMA, UMTS,and LTE. Sometimes when troubleshooting call failures, it is not immediately obvious that Ra-dius authentication is the root cause. In this section, various commands used to determinewhere and if there are Radius issues will be investigated.
The section examines how Radius authentication and accounting tie into the call flow; the rele-vant Radius configurables; the state machine behavior – how it maintains the state of the con-figured servers; overload issues, recovery methods, and high-level descriptions of the types ofissues one might expect to encounter, along with the information (traces, logs, counters, etc.)one might need to collect.
Authentication and Accounting Overview
"Monitor subscriber" trace will show how Radius authentication works. It is important to knowwhen authentication and accounting take place.
For example, whether it be SIP (Simple IP) or MIP (Mobile IP), a call starts with A11 protocolmessage exchange followed by some PPP negotiation. For SIP, as soon as the username is re-ceived during PPP negotiation, Radius authentication can take place, followed by further PPPnegotiation where compression is negotiated along with the DNS and mobile IP address beinggiven out. For MIP (Mobile IP), unlike for SIP (Simple IP), the username is not received duringPPP negotiation. Rather, the DNS information is given out, and header compression negotiationtakes place. At this point PPP is finished and MIP (Mobile IP) protocol takes over, with MIP (Mo-bile IP) router advertisement and a MIP (Mobile IP) RRQ being received with the username, atwhich time Radius authentication takes place.
So the key for both SIP (Simple IP) and MIP (Mobile IP) Radius authentication is getting theusername which is needed to identify the subscriber to the Radius server.
Finally Radius accounting takes place. Radius accounting also takes place at call teardown.
It is recommended to study some example traces of MIP (Mobile IP) and SIP (Simple IP) orwhatever call-control protocol is being used, to understand the full call flow and to see how au-
Radius
thentication and accounting play a role. Grabbing a trace from the live network using monitorsubscriber is an easy way to get started.
Timers, Retries, related counters
When a Radius (accounting or access) request is sent, a reply is expected. When a reply is notreceived within the timeout period (seconds):
radius (accounting) timeout 3
then the request is resent up to the number of times specified:
radius (accounting) max-retries 5
This means that a request can be sent a total of max-retries + 1 times until it gives up on theparticular Radius server being tried. At this point, it will try the same sequence to the next Ra-dius server in order. If each of the servers have been tried the max-retries + 1 times without re-sponse, then the call will be rejected, assuming there is no other reason for failure up to thatpoint.
Also, there are configurables that can limit the absolute total number of transmissions of a par-ticular request across all the configured servers, and these are disabled by default:
radius (accounting) max-transmissions 256
For example if this is set = 1, then even if there is a secondary server, it will never be attemptedbecause only one attempt for a specific subscriber setup will ever even be attempted.
The "show radius counters all" command is very valuable in tracking success and failures on aserver basis, and it is very important to understand the meaning of the various counters thatcompose this command, as it may not be obvious. In the following output, note "Access-Re-quest Sent" = 1, while "Access-Request Retried" = 3. So, any given new request to a particularRadius server is only counted once, and all the retries are counted separately. In this case, thatis a total of 3 + 1 = 4 access requests sent.
Note the counter "Access-Request Timeouts" = 1. A single timeout occurs only when ALL the re-tries fail, so in this case, 3 retries without a response result in 1 Timeout (not 4). This will hap-

Radius
pen across all of the configured servers until there is success, or all attempts have failed. Fol-lowing is an example of this:
Radius max-retries 3
Radius server 192.168.50.200 encrypted key 01abd002c82b4a2c port 1812 priority 1
Radius server 192.168.50.250 encrypted key 01abd002c82b4a2c port 1812 priority 2
[destination]CSE2# show Radius counters all
Server-specific Authentication Counters
---------------------------------------
Authentication server address 192.168.50.200, port 1812:
Access-Request Sent: 1
Access-Request with DMU Attributes Sent: 0
Access-Request Pending: 0
Access-Request Retried: 3
Access-Request with DMU Attributes Retried: 0
Access-Challenge Received: 0
Access-Accept Received: 0
Access-Reject Received: 0
Access-Reject Received with DMU Attributes: 0
Access-Request Timeouts: 1
Access-Request Current Consecutive Failures in a mgr: 1
Access-Request Response Bad Authenticator Received: 0
Access-Request Response Malformed Received: 0
Access-Request Response Malformed Attribute Received: 0
Access-Request Response Unknown Type Received: 0
Access-Request Response Dropped: 0
Access-Request Response Last Round Trip Time: 0.0 ms
…
Authentication server address 192.168.50.250, port 1812:
Access-Request Sent: 1
Access-Request with DMU Attributes Sent: 0
Access-Request Pending: 0
Access-Request Retried: 3
Access-Request with DMU Attributes Retried: 0
Access-Challenge Received: 0

Radius
Access-Accept Received: 0
Access-Reject Received: 0
Access-Reject Received with DMU Attributes: 0
Access-Request Timeouts: 1
Access-Request Current Consecutive Failures in a mgr: 1
Access-Request Response Bad Authenticator Received: 0
Access-Request Response Malformed Received: 0
Access-Request Response Malformed Attribute Received: 0
Access-Request Response Unknown Type Received: 0
Access-Request Response Dropped: 0
Access-Request Response Last Round Trip Time: 0.0 ms
Note also that timeouts are NOT counted as failures, the result being that the number of Ac-cess-Accepts received and Access-Rejects received will not add up to Access-Request Sent ifthere are any timeouts.
For MIP, it can be even more complicated than just described, because as the authenticationsare failing due to timeouts, there is no MIP RRP being sent, and the mobile may continue to ini-tiate new MIP RRQs because it has not received a MIP RRP. Each new MIP RRQ causes thePDSN to send a new Authentication request which itself can have its own series of retries. Thiscan be seen in the ID field at the top of a packet trace – it will be unique for each set of retries.The result is that the counters for Sent, Retried, and Timeout can be much higher than ex-pected for the number of unique subscriber calls received. There is an option that can be en-abled to minimize these extra re-tries, and it can be set in the FA (but not on the HA) service:“authentication mn-aaa <6 choices here> optimize-retries”
Note: Over an un-monitored time period, it is difficult to draw any conclusions from thecounter values or the relationships amongst counters. To make accurate conclusions, the bestapproach is to reset the counters and monitor them over a period of time when the issue one istroubleshooting is occurring.
Whenever running Radius commands, be sure to be in the context where the aaa group that isbeing troubleshot is located.
show radius counters { {all | server <server IP>} [instance <aaamgr #>] | summary}
show radius {accounting | authentication} servers detail
Radius
A few things to note:
• instance # option (CLI test-commnds password required) is valuable when trou-bleshooting a particular aaamgr instance
• show support details does not contain “show radius [[accounting] [authentica-tion]] servers detail”
• “show radius servers detail” only saves the last ten Radius state changes – so run thecommand multiple times to get a complete history of troubleshooting over an extendedperiod.
• clearing the Radius counters is a good idea if monitoring the counters over a time pe-riod.
• The summary version of "show radius counters" groups together all the counters of aspecific type (accounting, authentication, probe, etc.).
• Trying to look for exact correlations of various counters, even over a monitored period,can be tricky. Check for general patterns, as getting too specific may not be feasible.
State Machine Behaviors
There are two different models/algorithms/approaches to choose from to determine the sta-tus of a Radius server and when to try a different server if failures are occurring. It is importantto know which one has been implemented for the system being troubleshot.
The original approach involves keeping track of the number of failures that have occurred in arow for a particular aaamgr process. An aaamgr process is responsible for all Radius messageprocessing and exchanges with a Radius server, and many aaamgr processes will exist on all ac-tive processor cards (DPC or PSC) on a chassis. Each one paired with sessmgr processes (whichare main processes responsible for call control). "show task resources facility aaamgr all" com-mand can be used to view all the aaamgr processes. A particular aaamgr process will thereforebe processing Radius messages for many calls, not just a single call, and this algorithm involvestracking how many times in a row a particular aaamgr process has failed to get a response tothe same request it has had to resend - an "Access-Request Timeout" as described in earliersection. The respective counter "Access-Request Current Consecutive Failures in a mgr" is in-cremented when this occurs, and the "show radius [[accounting] [authentication]] serversdetail" command will indicate the timestamps of the Radius state change from Active to NotResponding (but no SNMP trap or logs will be generated). For example:

Radius
[source]ASR5000> show radius accounting servers detail
+-----Type: (A) - Authentication (a) - Accounting
| (C) - Charging (c) - Charging Accounting
| (M) - Mediation (m) - Mediation Accounting
|
|+----Preference: (P) - Primary (S) - Secondary
||
||+---State: (A) - Active (N) - Not Responding
||| (D) - Down (W) - Waiting Accounting-On
||| (I) - Initializing (w) - Waiting Accounting-Off
||| (a) - Active Pending (U) - Unknown
|||
|||+--Admin (E) - Enabled (D) - Disabled
|||| Status:
||||
||||+-Admin
||||| status (O) - Overridden (.) - Not Overridden
||||| Overridden:
|||||
vvvvv IP PORT GROUP
----- --------------- ----- -----------------------
aPNE. 17.2.22.5 1813 default
Event History:
2008-Nov-28+23:18:36 Active
2008-Nov-28+23:18:57 Not Responding
2008-Nov-28+23:19:12 Active
2008-Nov-28+23:19:30 Not Responding
2008-Nov-28+23:19:36 Active
2008-Nov-28+23:20:57 Not Responding
2008-Nov-28+23:21:12 Active
2008-Nov-28+23:22:31 Not Responding
2008-Nov-28+23:22:36 Active
2008-Nov-28+23:23:30 Not Responding
Radius
If this counter reaches the value configured (Default = 4) without ever being reset:
radius (accounting) detect-dead-server consecutive-failures 4
then this server will be marked "Down" for the period (minutes) configured:
radius (accounting) deadtime 10
An SNMP trap and logs will be triggered as well, for example, for authentication and accountingrespectively:
Fri Jan 30 06:17:19 2009 Internal trap notification 39 (AAAAuthSvrUnreachable) server 2 ip
address 17.2.22.1
Fri Jan 30 06:22:19 2009 Internal trap notification 40 (AAAAuthSvrReachable) server 2 ip
address 17.2.22.1
Fri Nov 28 21:59:12 2008 Internal trap notification 42 (AAAAccSvrUnreachable) server 6 ip
address 17.2.22.1
Fri Nov 28 22:28:29 2008 Internal trap notification 43 (AAAAccSvrReachable) server 6 ip
address 17.2.22.1
2008-Nov-28+21:59:12.899 [radius-acct 24006 warning] [8/0/518 <aaamgr:231>
aaamgr_config.c:1060] [context: source, contextID: 2] [software internal security config user
critical-info] Server 17.2.22.1:1813 unreachable
2008-Nov-28+22:28:29.280 [radius-acct 24007 info] [8/0/518 <aaamgr:231> aaamgr_config.c:1068]
[context: source, contextID: 2] [software internal security config user critical-info] Server
17.2.22.1:1813 reachable
Note: Only ONE trap will be triggered regardless of how many aaamgrs get into this state atonce, in order to avoid overloading the number of traps triggered. The instance # of the logversion of the trap (as shown above) will be the management aaamgr instance which resides ei-ther on the SMC or the MIO and does not actually process subscriber authentication/account-ing traffic.
Also, the "show radius accounting (or authentication) servers detail" command will indicatethe timestamps of the state changes:
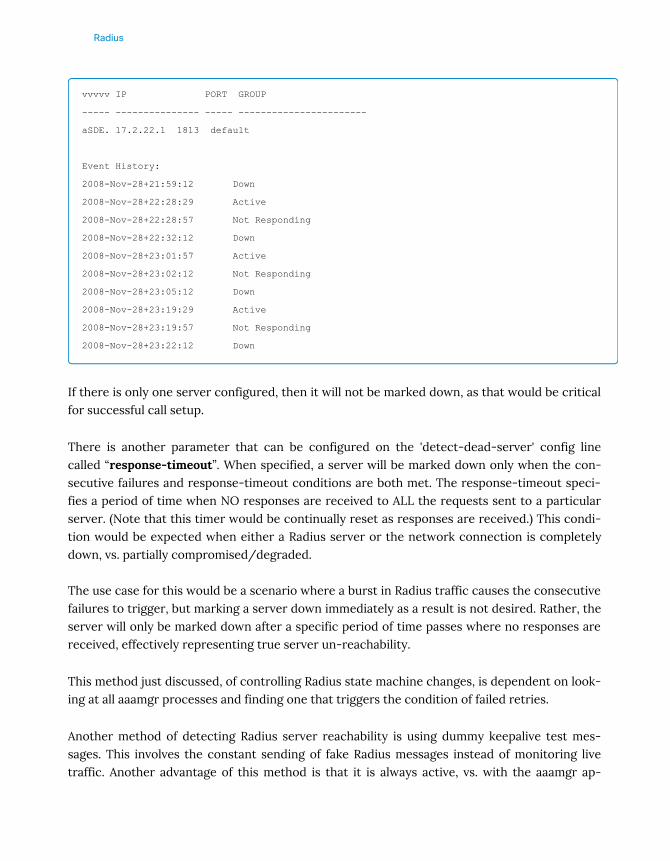
Radius
vvvvv IP PORT GROUP
----- --------------- ----- -----------------------
aSDE. 17.2.22.1 1813 default
Event History:
2008-Nov-28+21:59:12 Down
2008-Nov-28+22:28:29 Active
2008-Nov-28+22:28:57 Not Responding
2008-Nov-28+22:32:12 Down
2008-Nov-28+23:01:57 Active
2008-Nov-28+23:02:12 Not Responding
2008-Nov-28+23:05:12 Down
2008-Nov-28+23:19:29 Active
2008-Nov-28+23:19:57 Not Responding
2008-Nov-28+23:22:12 Down
If there is only one server configured, then it will not be marked down, as that would be criticalfor successful call setup.
There is another parameter that can be configured on the 'detect-dead-server' config linecalled “response-timeout”. When specified, a server will be marked down only when the con-secutive failures and response-timeout conditions are both met. The response-timeout speci-fies a period of time when NO responses are received to ALL the requests sent to a particularserver. (Note that this timer would be continually reset as responses are received.) This condi-tion would be expected when either a Radius server or the network connection is completelydown, vs. partially compromised/degraded.
The use case for this would be a scenario where a burst in Radius traffic causes the consecutivefailures to trigger, but marking a server down immediately as a result is not desired. Rather, theserver will only be marked down after a specific period of time passes where no responses arereceived, effectively representing true server un-reachability.
This method just discussed, of controlling Radius state machine changes, is dependent on look-ing at all aaamgr processes and finding one that triggers the condition of failed retries.
Another method of detecting Radius server reachability is using dummy keepalive test mes-sages. This involves the constant sending of fake Radius messages instead of monitoring livetraffic. Another advantage of this method is that it is always active, vs. with the aaamgr ap-

Radius
proach, where there could be periods where no Radius traffic is sent, and so there is no way toknow if a problem exists during those times, resulting in delayed detection when attempts dostart occurring. Also when a server is marked down, these keepalives continue to be sent sothat the server can be marked up as soon as possible.
Here are the various configurables relevant to this approach:
radius (accounting) detect-dead-server keepalive
radius (accounting) keepalive interval 30
radius (accounting) keepalive retries 3
radius (accounting) keepalive timeout 3
radius (accounting) keepalive consecutive-response 1
radius (accounting) keepalive username Test-Username
radius keepalive encrypted password 2ec59b3188f07d9b49f5ea4cc44d9586
radius (accounting) keepalive calling-station-id 000000000000000
radius keepalive valid-response access-accept
The command “radius (accounting) detect-dead-server keepalive” turns on the keep-alive
approach instead of the consecutive failures in a aaamgr approach. In the example above, the
system will send a test message with username Test-Username and password Test-Username every 30
seconds, and will retry every 3 seconds if no response is received, and will retry up to 3
times, after which it will mark the server down. Once it gets its first response, it will mark
it back up again.
Here is an example authentication request/response for the above settings:
<<<<OUTBOUND 17:50:12:657 Eventid:23901(6)
RADIUS AUTHENTICATION Tx PDU, from 192.168.50.151:32783 to 192.168.50.200:1812 (142) PDU-
dict=starent-vsa1
Code: 1 (Access-Request)
Id: 16
Length: 142
Authenticator: 51 6D B2 7D 6A C6 9A 96 0C AB 44 19 66 2C 12 0A
User-Name = Test-Username
User-Password = B7 23 1F D1 86 46 4D 7F 8F E0 2A EF 17 A1 F3 BF
Calling-Station-Id = 000000000000000
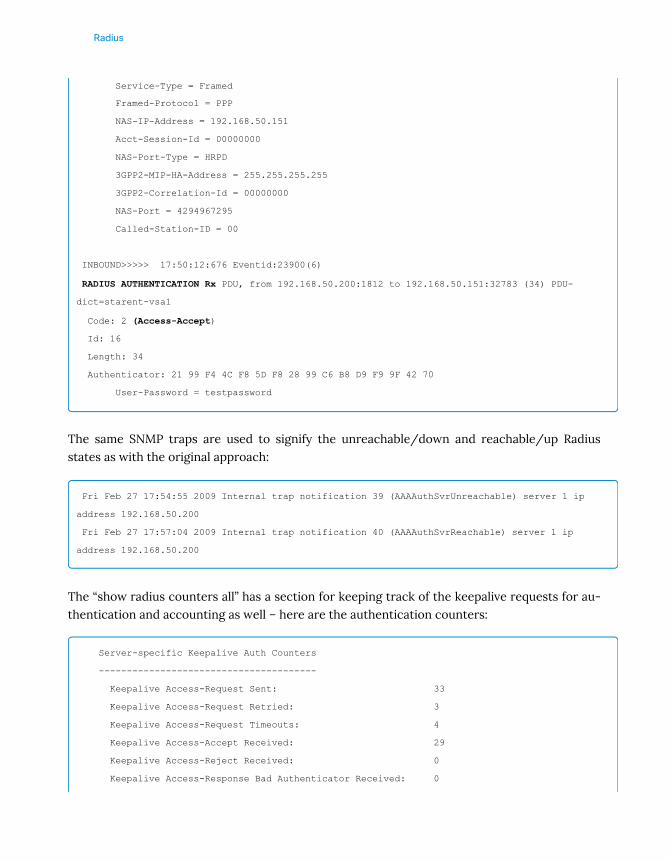
Radius
Service-Type = Framed
Framed-Protocol = PPP
NAS-IP-Address = 192.168.50.151
Acct-Session-Id = 00000000
NAS-Port-Type = HRPD
3GPP2-MIP-HA-Address = 255.255.255.255
3GPP2-Correlation-Id = 00000000
NAS-Port = 4294967295
Called-Station-ID = 00
INBOUND>>>>> 17:50:12:676 Eventid:23900(6)
RADIUS AUTHENTICATION Rx PDU, from 192.168.50.200:1812 to 192.168.50.151:32783 (34) PDU-
dict=starent-vsa1
Code: 2 (Access-Accept)
Id: 16
Length: 34
Authenticator: 21 99 F4 4C F8 5D F8 28 99 C6 B8 D9 F9 9F 42 70
User-Password = testpassword
The same SNMP traps are used to signify the unreachable/down and reachable/up Radiusstates as with the original approach:
Fri Feb 27 17:54:55 2009 Internal trap notification 39 (AAAAuthSvrUnreachable) server 1 ip
address 192.168.50.200
Fri Feb 27 17:57:04 2009 Internal trap notification 40 (AAAAuthSvrReachable) server 1 ip
address 192.168.50.200
The “show radius counters all” has a section for keeping track of the keepalive requests for au-thentication and accounting as well – here are the authentication counters:
Server-specific Keepalive Auth Counters
---------------------------------------
Keepalive Access-Request Sent: 33
Keepalive Access-Request Retried: 3
Keepalive Access-Request Timeouts: 4
Keepalive Access-Accept Received: 29
Keepalive Access-Reject Received: 0
Keepalive Access-Response Bad Authenticator Received: 0
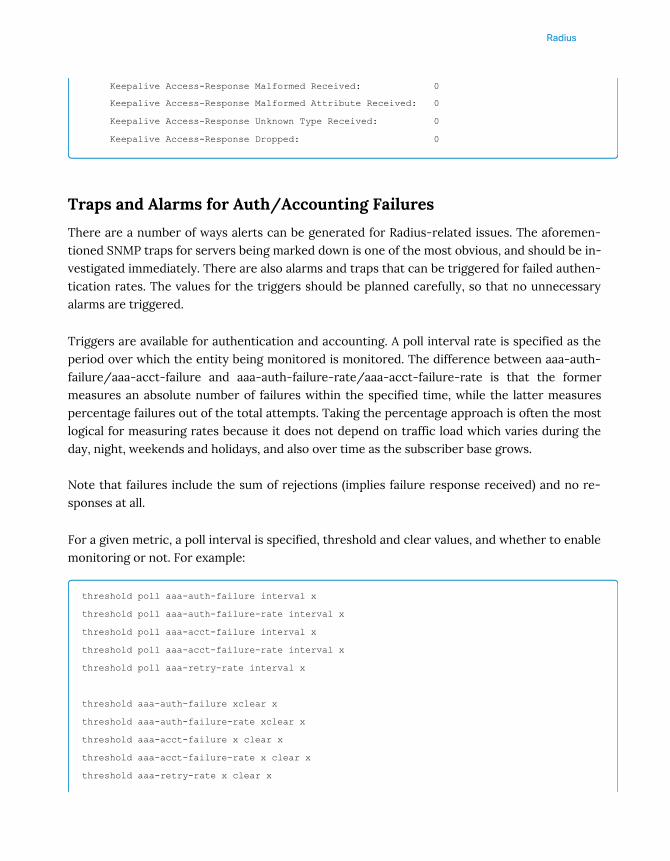
Radius
Keepalive Access-Response Malformed Received: 0
Keepalive Access-Response Malformed Attribute Received: 0
Keepalive Access-Response Unknown Type Received: 0
Keepalive Access-Response Dropped: 0
Traps and Alarms for Auth/Accounting Failures
There are a number of ways alerts can be generated for Radius-related issues. The aforemen-tioned SNMP traps for servers being marked down is one of the most obvious, and should be in-vestigated immediately. There are also alarms and traps that can be triggered for failed authen-tication rates. The values for the triggers should be planned carefully, so that no unnecessaryalarms are triggered.
Triggers are available for authentication and accounting. A poll interval rate is specified as theperiod over which the entity being monitored is monitored. The difference between aaa-auth-failure/aaa-acct-failure and aaa-auth-failure-rate/aaa-acct-failure-rate is that the formermeasures an absolute number of failures within the specified time, while the latter measurespercentage failures out of the total attempts. Taking the percentage approach is often the mostlogical for measuring rates because it does not depend on traffic load which varies during theday, night, weekends and holidays, and also over time as the subscriber base grows.
Note that failures include the sum of rejections (implies failure response received) and no re-sponses at all.
For a given metric, a poll interval is specified, threshold and clear values, and whether to enablemonitoring or not. For example:
threshold poll aaa-auth-failure interval x
threshold poll aaa-auth-failure-rate interval x
threshold poll aaa-acct-failure interval x
threshold poll aaa-acct-failure-rate interval x
threshold poll aaa-retry-rate interval x
threshold aaa-auth-failure xclear x
threshold aaa-auth-failure-rate xclear x
threshold aaa-acct-failure x clear x
threshold aaa-acct-failure-rate x clear x
threshold aaa-retry-rate x clear x
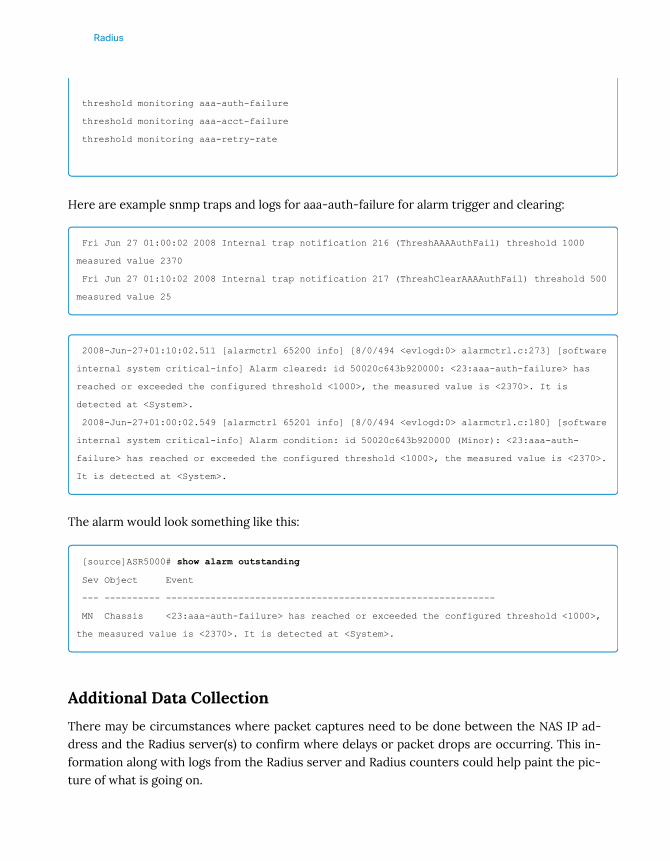
Radius
threshold monitoring aaa-auth-failure
threshold monitoring aaa-acct-failure
threshold monitoring aaa-retry-rate
Here are example snmp traps and logs for aaa-auth-failure for alarm trigger and clearing:
Fri Jun 27 01:00:02 2008 Internal trap notification 216 (ThreshAAAAuthFail) threshold 1000
measured value 2370
Fri Jun 27 01:10:02 2008 Internal trap notification 217 (ThreshClearAAAAuthFail) threshold 500
measured value 25
2008-Jun-27+01:10:02.511 [alarmctrl 65200 info] [8/0/494 <evlogd:0> alarmctrl.c:273] [software
internal system critical-info] Alarm cleared: id 50020c643b920000: <23:aaa-auth-failure> has
reached or exceeded the configured threshold <1000>, the measured value is <2370>. It is
detected at <System>.
2008-Jun-27+01:00:02.549 [alarmctrl 65201 info] [8/0/494 <evlogd:0> alarmctrl.c:180] [software
internal system critical-info] Alarm condition: id 50020c643b920000 (Minor): <23:aaa-auth-
failure> has reached or exceeded the configured threshold <1000>, the measured value is <2370>.
It is detected at <System>.
The alarm would look something like this:
[source]ASR5000# show alarm outstanding
Sev Object Event
--- ---------- -----------------------------------------------------------
MN Chassis <23:aaa-auth-failure> has reached or exceeded the configured threshold <1000>,
the measured value is <2370>. It is detected at <System>.
Additional Data Collection
There may be circumstances where packet captures need to be done between the NAS IP ad-dress and the Radius server(s) to confirm where delays or packet drops are occurring. This in-formation along with logs from the Radius server and Radius counters could help paint the pic-ture of what is going on.
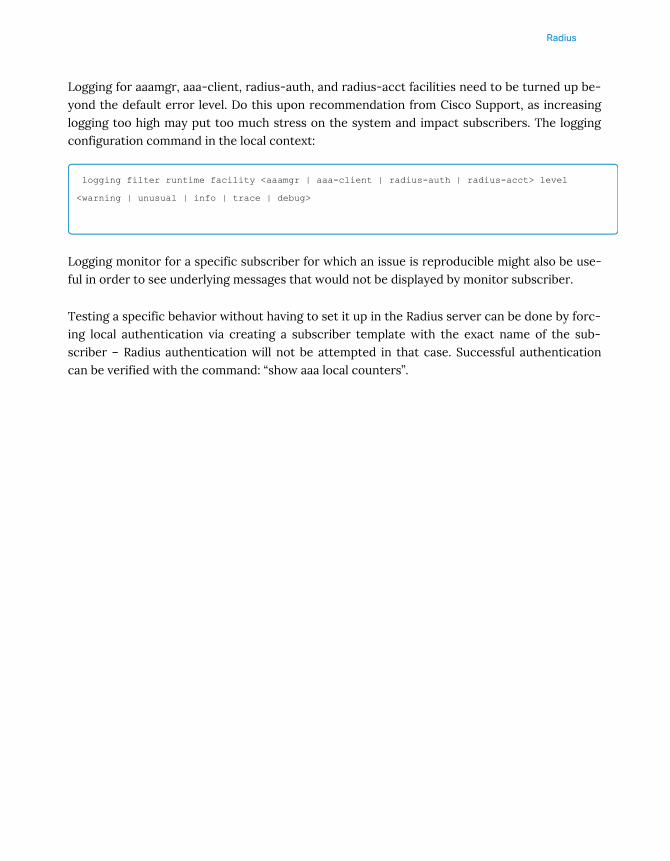
Radius
Logging for aaamgr, aaa-client, radius-auth, and radius-acct facilities need to be turned up be-yond the default error level. Do this upon recommendation from Cisco Support, as increasinglogging too high may put too much stress on the system and impact subscribers. The loggingconfiguration command in the local context:
logging filter runtime facility <aaamgr | aaa-client | radius-auth | radius-acct> level
<warning | unusual | info | trace | debug>
Logging monitor for a specific subscriber for which an issue is reproducible might also be use-ful in order to see underlying messages that would not be displayed by monitor subscriber.
Testing a specific behavior without having to set it up in the Radius server can be done by forc-ing local authentication via creating a subscriber template with the exact name of the sub-scriber – Radius authentication will not be attempted in that case. Successful authenticationcan be verified with the command: “show aaa local counters”.

Radius
Troubleshooting Radius Issues
Overview
This chapter discusses troubleshooting techniques for Radius-related issues to do with ac-counting and authentication.
Radius Overload
If the Radius server is getting overloaded, decrease the load by decreasing the value (default256) configured for “radius (accounting) max-outstanding”, which sets a limit on the number ofoutstanding (unanswered) requests for any given aaamgr process. If the limit is reached, logsmay indicate this: “Failed to assign message id for radius authentication server x.x.x.x:1812”. There is no way to specifically rate-limit authentication/accounting messages.
Radius Archiving
A feature for accounting that may be turned on is archiving, enabled with the command “radiusaccounting archive”. This allows for accounting packets that have failed to be responded to, tobe re-queued and sent at a later time when the aaamgr processes have free cycles and are notbusy processing authentication requests. The idea is that timeliness of accounting packets isnot as important as authentication, though this may not be true in all situations. Note thoughthere is no way to flush out existing archived messages. The "show radius" counter “Account-ing-Request Pending” will show the number of archived accounting messages, which could in-crease over time if the accounting server gets bogged down. On the other hand, the “Access-Request Pending” counter for Access-Requests will decrement when it has given up trying toauthenticate for a given call, which will always be a limited period of time (vs. accounting whichcould theoretically be tried forever).
Removing a Radius Server Temporarily
If during the troubleshooting process it has been decided to remove a Radius authentication oraccounting server from the list of live servers for whatever reason, there is a (non-config) com-mand that will take a server out of service indefinitely until it is desired to put it back in service.This is a cleaner approach than having to remove it from the configuration manually:
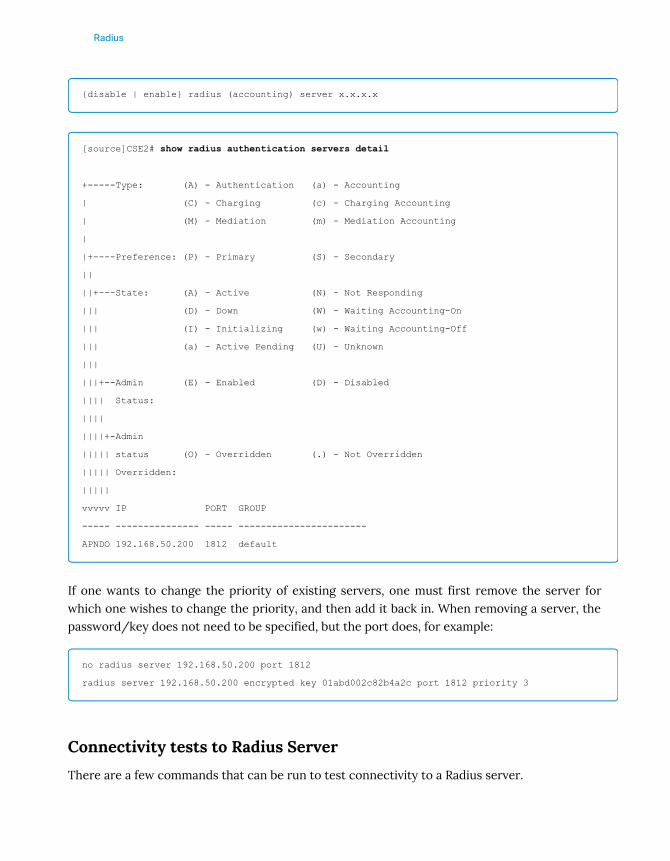
Radius
{disable | enable} radius (accounting) server x.x.x.x
[source]CSE2# show radius authentication servers detail
+-----Type: (A) - Authentication (a) - Accounting
| (C) - Charging (c) - Charging Accounting
| (M) - Mediation (m) - Mediation Accounting
|
|+----Preference: (P) - Primary (S) - Secondary
||
||+---State: (A) - Active (N) - Not Responding
||| (D) - Down (W) - Waiting Accounting-On
||| (I) - Initializing (w) - Waiting Accounting-Off
||| (a) - Active Pending (U) - Unknown
|||
|||+--Admin (E) - Enabled (D) - Disabled
|||| Status:
||||
||||+-Admin
||||| status (O) - Overridden (.) - Not Overridden
||||| Overridden:
|||||
vvvvv IP PORT GROUP
----- --------------- ----- -----------------------
APNDO 192.168.50.200 1812 default
If one wants to change the priority of existing servers, one must first remove the server forwhich one wishes to change the priority, and then add it back in. When removing a server, thepassword/key does not need to be specified, but the port does, for example:
no radius server 192.168.50.200 port 1812
radius server 192.168.50.200 encrypted key 01abd002c82b4a2c port 1812 priority 3
Connectivity tests to Radius Server
There are a few commands that can be run to test connectivity to a Radius server.

Radius
radius test
This command (as shown below) sends a basic authentication request or accounting start andstop requests and waits for a response. For authentication, use any username and password, inwhich case a reject response will be received, confirming that Radius is working as designed, oruse a known working username/password, in which case an accept response should be re-ceived.
radius test authentication server x.x.x.x port yyyy <user> <password>
radius test accoun
NOTE: This command uses the aaamgr process running on the SMC/MIO card to process themessages. Normal subscriber Radius traffic is handled by aaamgr processes running on thePSC/DPC cards. This applies to the aaa test command discussed in the next section also.
Here is an example output from monitor protocol and running the authentication version of thecommand on lab chassis:
[source]ASR5000# radius test authentication server 192.168.50.200 port 1812 test test
Authentication from authentication server 192.168.50.200, port 1812
Authentication Success: Access-Accept received
Round-trip time for response was 12.3 ms
<<<<OUTBOUND 14:53:49:202 Eventid:23901(6)
RADIUS AUTHENTICATION Tx PDU, from 192.168.50.151:32783 to 192.168.50.200:1812 (58) PDU-
dict=starent-vsa1
Code: 1 (Access-Request)
Id: 5
Length: 58
Authenticator: 56 97 57 9C 51 EF A4 08 20 E1 14 89 40 DE 0B 62
User-Name = test
User-Password = 49 B0 92 4D DC 64 49 BA B0 0E 18 36 3F B6 1B 37
NAS-IP-Address = 192.168.50.151
NAS-Identifier = source
INBOUND>>>>> 14:53:49:214 Eventid:23900(6)
RADIUS AUTHENTICATION Rx PDU, from 192.168.50.200:1812 to 192.168.50.151:32783 (34) PDU-
dict=starent-vsa1
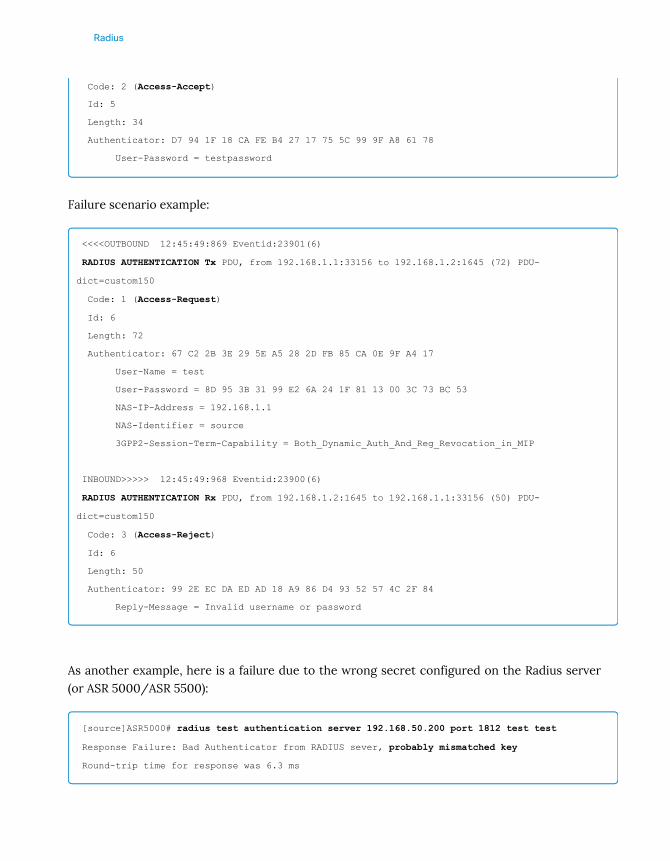
Radius
Code: 2 (Access-Accept)
Id: 5
Length: 34
Authenticator: D7 94 1F 18 CA FE B4 27 17 75 5C 99 9F A8 61 78
User-Password = testpassword
Failure scenario example:
<<<<OUTBOUND 12:45:49:869 Eventid:23901(6)
RADIUS AUTHENTICATION Tx PDU, from 192.168.1.1:33156 to 192.168.1.2:1645 (72) PDU-
dict=custom150
Code: 1 (Access-Request)
Id: 6
Length: 72
Authenticator: 67 C2 2B 3E 29 5E A5 28 2D FB 85 CA 0E 9F A4 17
User-Name = test
User-Password = 8D 95 3B 31 99 E2 6A 24 1F 81 13 00 3C 73 BC 53
NAS-IP-Address = 192.168.1.1
NAS-Identifier = source
3GPP2-Session-Term-Capability = Both_Dynamic_Auth_And_Reg_Revocation_in_MIP
INBOUND>>>>> 12:45:49:968 Eventid:23900(6)
RADIUS AUTHENTICATION Rx PDU, from 192.168.1.2:1645 to 192.168.1.1:33156 (50) PDU-
dict=custom150
Code: 3 (Access-Reject)
Id: 6
Length: 50
Authenticator: 99 2E EC DA ED AD 18 A9 86 D4 93 52 57 4C 2F 84
Reply-Message = Invalid username or password
As another example, here is a failure due to the wrong secret configured on the Radius server(or ASR 5000/ASR 5500):
[source]ASR5000# radius test authentication server 192.168.50.200 port 1812 test test
Response Failure: Bad Authenticator from RADIUS sever, probably mismatched key
Round-trip time for response was 6.3 ms
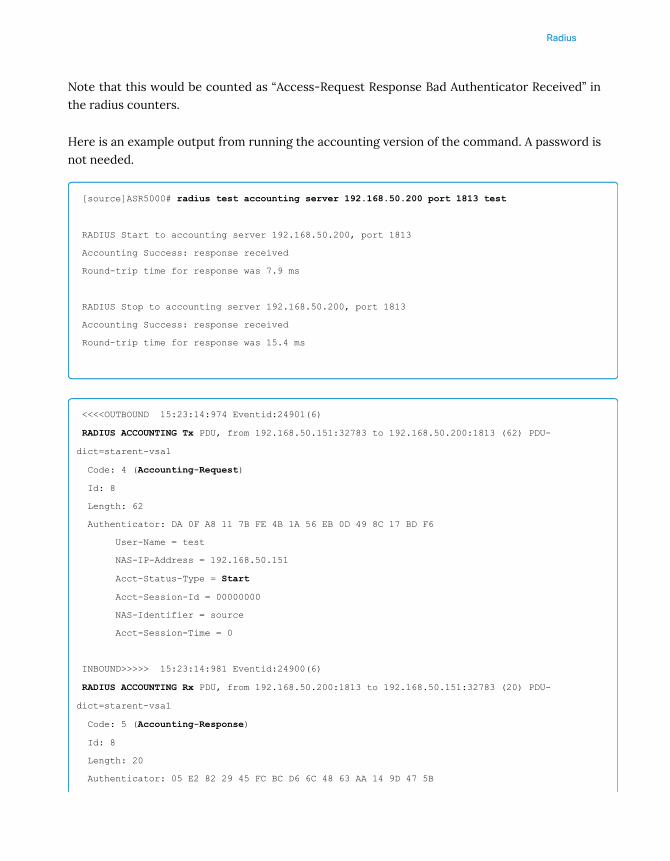
Radius
Note that this would be counted as “Access-Request Response Bad Authenticator Received” inthe radius counters.
Here is an example output from running the accounting version of the command. A password isnot needed.
[source]ASR5000# radius test accounting server 192.168.50.200 port 1813 test
RADIUS Start to accounting server 192.168.50.200, port 1813
Accounting Success: response received
Round-trip time for response was 7.9 ms
RADIUS Stop to accounting server 192.168.50.200, port 1813
Accounting Success: response received
Round-trip time for response was 15.4 ms
<<<<OUTBOUND 15:23:14:974 Eventid:24901(6)
RADIUS ACCOUNTING Tx PDU, from 192.168.50.151:32783 to 192.168.50.200:1813 (62) PDU-
dict=starent-vsa1
Code: 4 (Accounting-Request)
Id: 8
Length: 62
Authenticator: DA 0F A8 11 7B FE 4B 1A 56 EB 0D 49 8C 17 BD F6
User-Name = test
NAS-IP-Address = 192.168.50.151
Acct-Status-Type = Start
Acct-Session-Id = 00000000
NAS-Identifier = source
Acct-Session-Time = 0
INBOUND>>>>> 15:23:14:981 Eventid:24900(6)
RADIUS ACCOUNTING Rx PDU, from 192.168.50.200:1813 to 192.168.50.151:32783 (20) PDU-
dict=starent-vsa1
Code: 5 (Accounting-Response)
Id: 8
Length: 20
Authenticator: 05 E2 82 29 45 FC BC D6 6C 48 63 AA 14 9D 47 5B

Radius
<<<<OUTBOUND 15:23:14:983 Eventid:24901(6)
RADIUS ACCOUNTING Tx PDU, from 192.168.50.151:32783 to 192.168.50.200:1813 (62) PDU-
dict=starent-vsa1
Code: 4 (Accounting-Request)
Id: 9
Length: 62
Authenticator: 29 DB F1 0B EC CE 68 DB C7 4D 60 E4 7F A2 D0 3A
User-Name = test
NAS-IP-Address = 192.168.50.151
Acct-Status-Type = Stop
Acct-Session-Id = 00000000
NAS-Identifier = source
Acct-Session-Time = 0
INBOUND>>>>> 15:23:14:998 Eventid:24900(6)
RADIUS ACCOUNTING Rx PDU, from 192.168.50.200:1813 to 192.168.50.151:32783 (20) PDU-
dict=starent-vsa1
Code: 5 (Accounting-Response)
Id: 9
Length: 20
Authenticator: D8 3D EF 67 EA 75 E0 31 A5 31 7F E8 7E 69 73 DC
In all of the above examples, the Radius test message was sent using the management aaamgrlocated on the SMC/MIO card. There is a more specific version of the command that can berun in tech support mode that allows specifying a specific aaamgr instance that is suspected ofhaving an issue. For example, in the following example no response was received for instance92 but was received for instance 93:
[source]ASR5000# radius test instance 92 authentication server 192.168.1.1 port 1645 test test
Authentication from authentication server 192.168.1.1, port 1645
Communication Failure: No response received
[source]CSE2# radius test instance 93 authentication server 192.168.1.1 port 1645 test test
Authentication from authentication server 192.168.1.1, port 1645
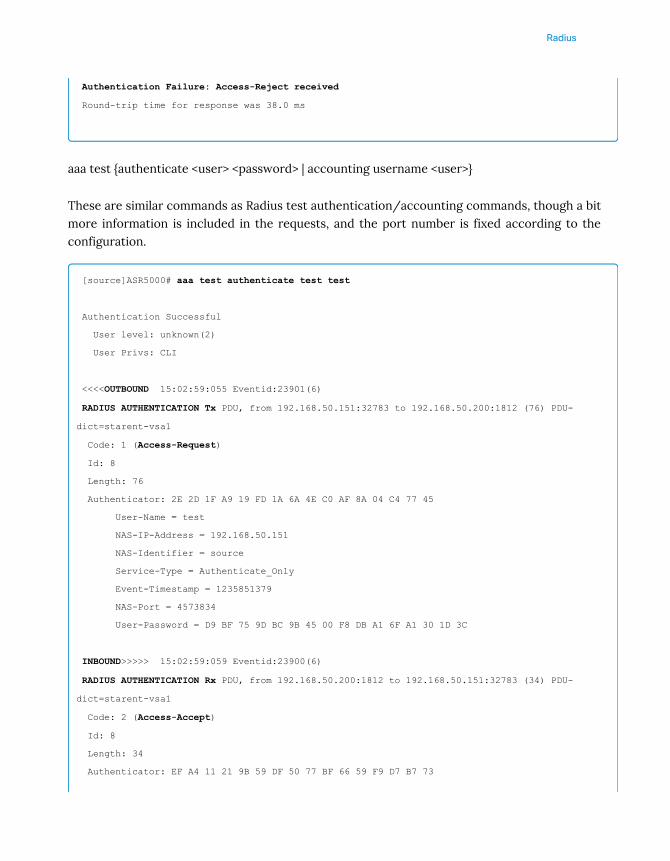
Radius
Authentication Failure: Access-Reject received
Round-trip time for response was 38.0 ms
aaa test {authenticate <user> <password> | accounting username <user>}
These are similar commands as Radius test authentication/accounting commands, though a bitmore information is included in the requests, and the port number is fixed according to theconfiguration.
[source]ASR5000# aaa test authenticate test test
Authentication Successful
User level: unknown(2)
User Privs: CLI
<<<<OUTBOUND 15:02:59:055 Eventid:23901(6)
RADIUS AUTHENTICATION Tx PDU, from 192.168.50.151:32783 to 192.168.50.200:1812 (76) PDU-
dict=starent-vsa1
Code: 1 (Access-Request)
Id: 8
Length: 76
Authenticator: 2E 2D 1F A9 19 FD 1A 6A 4E C0 AF 8A 04 C4 77 45
User-Name = test
NAS-IP-Address = 192.168.50.151
NAS-Identifier = source
Service-Type = Authenticate_Only
Event-Timestamp = 1235851379
NAS-Port = 4573834
User-Password = D9 BF 75 9D BC 9B 45 00 F8 DB A1 6F A1 30 1D 3C
INBOUND>>>>> 15:02:59:059 Eventid:23900(6)
RADIUS AUTHENTICATION Rx PDU, from 192.168.50.200:1812 to 192.168.50.151:32783 (34) PDU-
dict=starent-vsa1
Code: 2 (Access-Accept)
Id: 8
Length: 34
Authenticator: EF A4 11 21 9B 59 DF 50 77 BF 66 59 F9 D7 B7 73
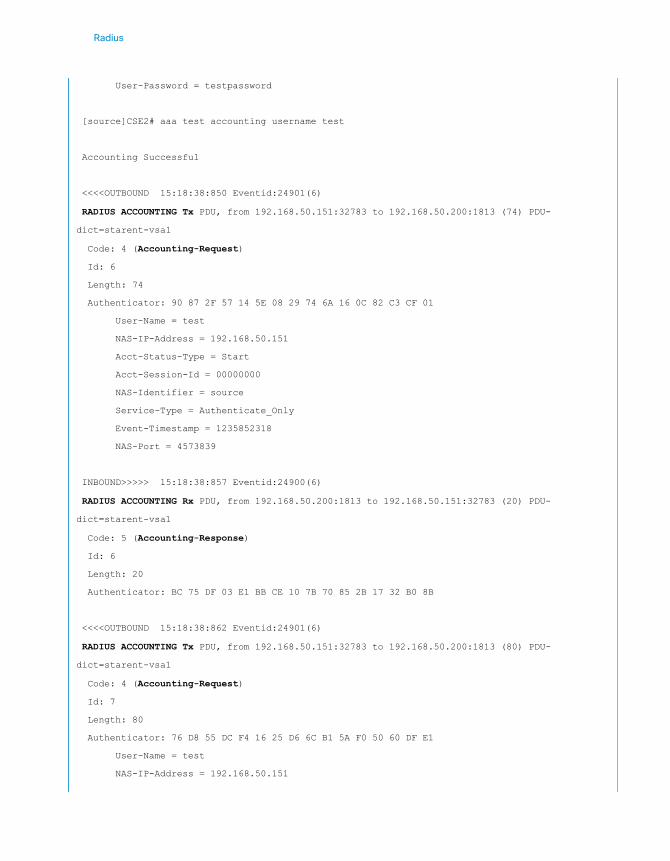
Radius
User-Password = testpassword
[source]CSE2# aaa test accounting username test
Accounting Successful
<<<<OUTBOUND 15:18:38:850 Eventid:24901(6)
RADIUS ACCOUNTING Tx PDU, from 192.168.50.151:32783 to 192.168.50.200:1813 (74) PDU-
dict=starent-vsa1
Code: 4 (Accounting-Request)
Id: 6
Length: 74
Authenticator: 90 87 2F 57 14 5E 08 29 74 6A 16 0C 82 C3 CF 01
User-Name = test
NAS-IP-Address = 192.168.50.151
Acct-Status-Type = Start
Acct-Session-Id = 00000000
NAS-Identifier = source
Service-Type = Authenticate_Only
Event-Timestamp = 1235852318
NAS-Port = 4573839
INBOUND>>>>> 15:18:38:857 Eventid:24900(6)
RADIUS ACCOUNTING Rx PDU, from 192.168.50.200:1813 to 192.168.50.151:32783 (20) PDU-
dict=starent-vsa1
Code: 5 (Accounting-Response)
Id: 6
Length: 20
Authenticator: BC 75 DF 03 E1 BB CE 10 7B 70 85 2B 17 32 B0 8B
<<<<OUTBOUND 15:18:38:862 Eventid:24901(6)
RADIUS ACCOUNTING Tx PDU, from 192.168.50.151:32783 to 192.168.50.200:1813 (80) PDU-
dict=starent-vsa1
Code: 4 (Accounting-Request)
Id: 7
Length: 80
Authenticator: 76 D8 55 DC F4 16 25 D6 6C B1 5A F0 50 60 DF E1
User-Name = test
NAS-IP-Address = 192.168.50.151

Radius
Acct-Status-Type = Stop
Acct-Session-Id = 00000000
NAS-Identifier = source
Service-Type = Authenticate_Only
Event-Timestamp = 1235852318
Acct-Session-Time = 0
NAS-Port = 4573839
INBOUND>>>>> 15:18:38:876 Eventid:24900(6)
RADIUS ACCOUNTING Rx PDU, from 192.168.50.200:1813 to 192.168.50.151:32783 (20) PDU-
dict=starent-vsa1
Code: 5 (Accounting-Response)
Id: 7
Length: 20
Authenticator: 47 F2 35 A5 86 07 12 EB 48 BC 49 C4 39 79 25 43
Problem Description:
AAAAccSvrUnreachable for a single aaamgr
This issue has been seen multiple times at multiple sites, always on a PDSN. Much trou-bleshooting has taken place without being able to determine root cause, and chassis reloadshave fixed the issue. The issue has been seen just for accounting, and in each instance just forone aaamgr instance.
Log Collection:
• show snmp trap hist verbose | grep AAAAccSvrUnreachable- instance(s) causing the issue will NOT be reported here- should see AAAAccSrvReachable very quickly as long as any aaamgrs are receivingresponses
• show context
• show config context source
• [source] show radius counters all [instance X]| grep -E "Accounting serveraddress|Accounting-Request Sent|Accounting-Response Received|Accounting-RequestTimeouts"
• show session susbsystem facility aaamgr <all | instance X>
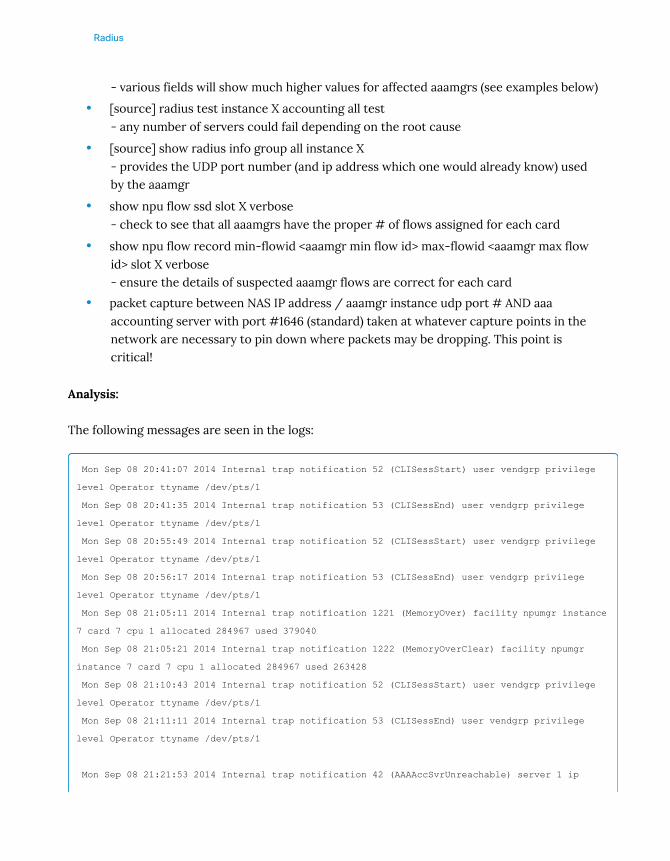
Radius
- various fields will show much higher values for affected aaamgrs (see examples below)
• [source] radius test instance X accounting all test- any number of servers could fail depending on the root cause
• [source] show radius info group all instance X- provides the UDP port number (and ip address which one would already know) usedby the aaamgr
• show npu flow ssd slot X verbose- check to see that all aaamgrs have the proper # of flows assigned for each card
• show npu flow record min-flowid <aaamgr min flow id> max-flowid <aaamgr max flowid> slot X verbose- ensure the details of suspected aaamgr flows are correct for each card
• packet capture between NAS IP address / aaamgr instance udp port # AND aaaaccounting server with port #1646 (standard) taken at whatever capture points in thenetwork are necessary to pin down where packets may be dropping. This point iscritical!
Analysis:
The following messages are seen in the logs:
Mon Sep 08 20:41:07 2014 Internal trap notification 52 (CLISessStart) user vendgrp privilege
level Operator ttyname /dev/pts/1
Mon Sep 08 20:41:35 2014 Internal trap notification 53 (CLISessEnd) user vendgrp privilege
level Operator ttyname /dev/pts/1
Mon Sep 08 20:55:49 2014 Internal trap notification 52 (CLISessStart) user vendgrp privilege
level Operator ttyname /dev/pts/1
Mon Sep 08 20:56:17 2014 Internal trap notification 53 (CLISessEnd) user vendgrp privilege
level Operator ttyname /dev/pts/1
Mon Sep 08 21:05:11 2014 Internal trap notification 1221 (MemoryOver) facility npumgr instance
7 card 7 cpu 1 allocated 284967 used 379040
Mon Sep 08 21:05:21 2014 Internal trap notification 1222 (MemoryOverClear) facility npumgr
instance 7 card 7 cpu 1 allocated 284967 used 263428
Mon Sep 08 21:10:43 2014 Internal trap notification 52 (CLISessStart) user vendgrp privilege
level Operator ttyname /dev/pts/1
Mon Sep 08 21:11:11 2014 Internal trap notification 53 (CLISessEnd) user vendgrp privilege
level Operator ttyname /dev/pts/1
Mon Sep 08 21:21:53 2014 Internal trap notification 42 (AAAAccSvrUnreachable) server 1 ip

Radius
address 192.168.86.10
Mon Sep 08 21:21:55 2014 Internal trap notification 43 (AAAAccSvrReachable) server 1 ip
address 192.168.86.10
Wed Sep 10 08:36:54 2014 Internal trap notification 42 (AAAAccSvrUnreachable) server 1 ip
address 66.168.86.10
Wed Sep 10 08:37:00 2014 Internal trap notification 43 (AAAAccSvrReachable) server 1 ip
address 192.168.86.10
[source]5000> show snmp trap statistics | grep -i aaa
Wednesday September 10 08:38:19 UTC 2014
Trap Name #Gen #Disc Disable Last Generated
----------------------------------- ----- ----- ------- --------------------
AAAAccSvrUnreachable 833 0 0 2014:09:10:08:36:54
AAAAccSvrReachable 839 0 0 2014:09:10:08:37:00
The issue is occurring for aaamgr instance 36 and further only seen with one Radius server 192.168.86.10.
Note: the output below is taken from two different instances (tickets) for this issue, where theaaamgr instance # was different for both tickets (36 in one and 114 in the other)
REFERENCE SECTION
Here are the commands that one could use to troubleshoot this issue, some of which are techsupport commands. These same steps for the most part can be used for AAAAuthSrvUnreach-able also.
• show snmp trap hist verbose | grep AAAAccSvrUnreachable
instance(s) causing the issue will NOT be reported here
should see AAAAccSrvReachable very quickly as long as any aaamgrs are receivingresponses
• show context
• show config context source
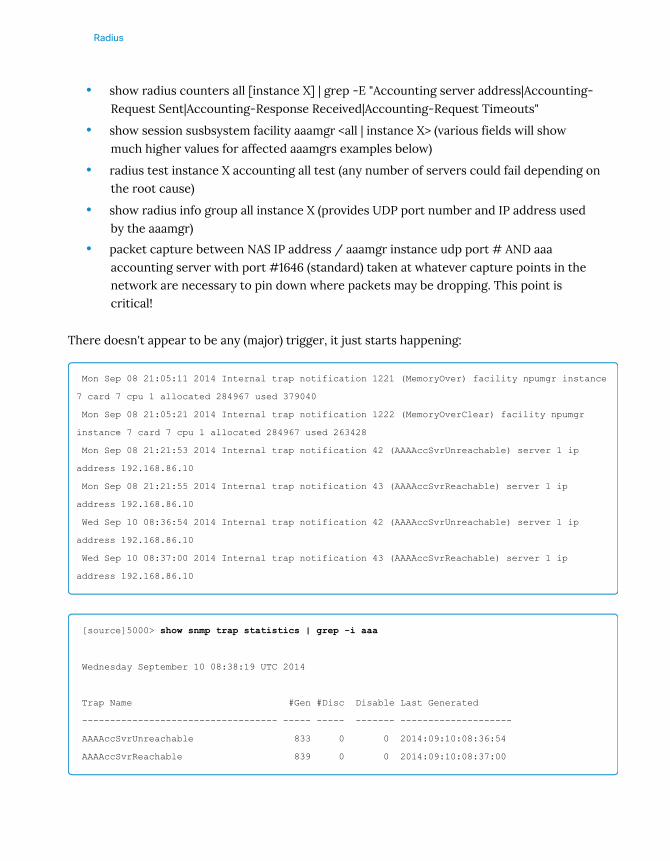
Radius
• show radius counters all [instance X] | grep -E "Accounting server address|Accounting-Request Sent|Accounting-Response Received|Accounting-Request Timeouts"
• show session susbsystem facility aaamgr <all | instance X> (various fields will showmuch higher values for affected aaamgrs examples below)
• radius test instance X accounting all test (any number of servers could fail depending onthe root cause)
• show radius info group all instance X (provides UDP port number and IP address usedby the aaamgr)
• packet capture between NAS IP address / aaamgr instance udp port # AND aaaaccounting server with port #1646 (standard) taken at whatever capture points in thenetwork are necessary to pin down where packets may be dropping. This point iscritical!
There doesn't appear to be any (major) trigger, it just starts happening:
Mon Sep 08 21:05:11 2014 Internal trap notification 1221 (MemoryOver) facility npumgr instance
7 card 7 cpu 1 allocated 284967 used 379040
Mon Sep 08 21:05:21 2014 Internal trap notification 1222 (MemoryOverClear) facility npumgr
instance 7 card 7 cpu 1 allocated 284967 used 263428
Mon Sep 08 21:21:53 2014 Internal trap notification 42 (AAAAccSvrUnreachable) server 1 ip
address 192.168.86.10
Mon Sep 08 21:21:55 2014 Internal trap notification 43 (AAAAccSvrReachable) server 1 ip
address 192.168.86.10
Wed Sep 10 08:36:54 2014 Internal trap notification 42 (AAAAccSvrUnreachable) server 1 ip
address 192.168.86.10
Wed Sep 10 08:37:00 2014 Internal trap notification 43 (AAAAccSvrReachable) server 1 ip
address 192.168.86.10
[source]5000> show snmp trap statistics | grep -i aaa
Wednesday September 10 08:38:19 UTC 2014
Trap Name #Gen #Disc Disable Last Generated
----------------------------------- ----- ----- ------- --------------------
AAAAccSvrUnreachable 833 0 0 2014:09:10:08:36:54
AAAAccSvrReachable 839 0 0 2014:09:10:08:37:00
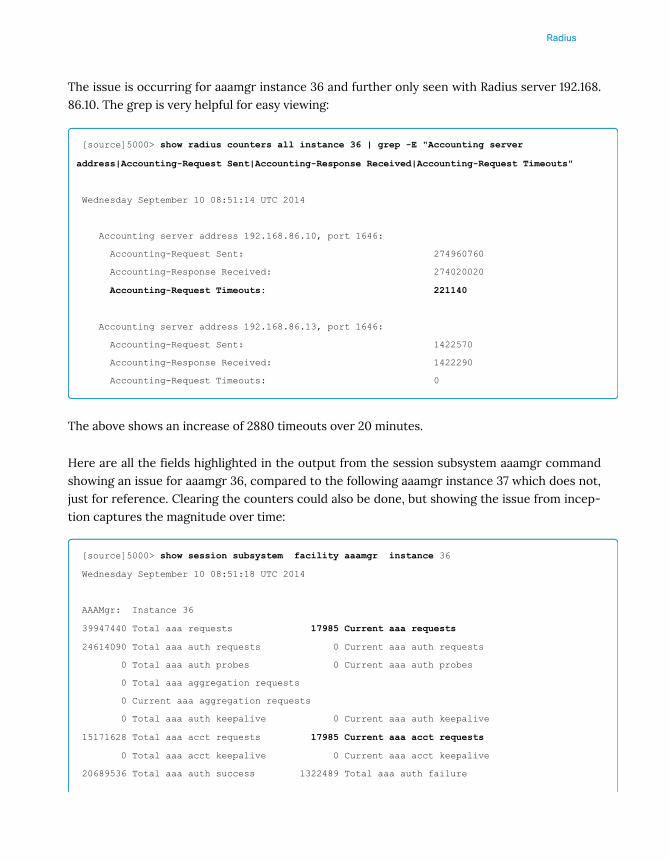
Radius
The issue is occurring for aaamgr instance 36 and further only seen with Radius server 192.168.86.10. The grep is very helpful for easy viewing:
[source]5000> show radius counters all instance 36 | grep -E "Accounting server
address|Accounting-Request Sent|Accounting-Response Received|Accounting-Request Timeouts"
Wednesday September 10 08:51:14 UTC 2014
Accounting server address 192.168.86.10, port 1646:
Accounting-Request Sent: 274960760
Accounting-Response Received: 274020020
Accounting-Request Timeouts: 221140
Accounting server address 192.168.86.13, port 1646:
Accounting-Request Sent: 1422570
Accounting-Response Received: 1422290
Accounting-Request Timeouts: 0
The above shows an increase of 2880 timeouts over 20 minutes.
Here are all the fields highlighted in the output from the session subsystem aaamgr commandshowing an issue for aaamgr 36, compared to the following aaamgr instance 37 which does not,just for reference. Clearing the counters could also be done, but showing the issue from incep-tion captures the magnitude over time:
[source]5000> show session subsystem facility aaamgr instance 36
Wednesday September 10 08:51:18 UTC 2014
AAAMgr: Instance 36
39947440 Total aaa requests 17985 Current aaa requests
24614090 Total aaa auth requests 0 Current aaa auth requests
0 Total aaa auth probes 0 Current aaa auth probes
0 Total aaa aggregation requests
0 Current aaa aggregation requests
0 Total aaa auth keepalive 0 Current aaa auth keepalive
15171628 Total aaa acct requests 17985 Current aaa acct requests
0 Total aaa acct keepalive 0 Current aaa acct keepalive
20689536 Total aaa auth success 1322489 Total aaa auth failure

Radius
86719 Total aaa auth purged 1016 Total aaa auth cancelled
0 Total auth keepalive success 0 Total auth keepalive failure
0 Total auth keepalive purged
0 Total aaa aggregation success requests
0 Total aaa aggregation failure requests
0 Total aaa aggregation purged requests
15237 Total aaa auth DMU challenged
17985/70600 aaa request (used/max)
14 Total diameter auth responses dropped
6960270 Total Diameter auth requests 0 Current Diameter auth requests
23995 Total Diameter auth requests retried
52 Total Diameter auth requests dropped
9306676 Total radius auth requests 0 Current radius auth requests
0 Total radius auth requests retried
988 Total radius auth responses dropped
13 Total local auth requests 0 Current local auth requests
8500275 Total pseudo auth requests 0 Current pseudo auth requests
8578 Total null-username auth requests (rejected)
0 Total aggregation responses dropped
15073834 Total aaa acct completed 79763 Total aaa acct purged <<< If issue started
recently, this may not have yet started incrementing
:
15171628 Total radius acct requests 17985 Current radius acct requests
46 Total radius acct cancelled
79763 Total radius acct purged
11173 Total radius acct requests retried
49 Total radius acct responses dropped
[source]5000> show session subsystem facility aaamgr instance 37
Wednesday September 10 08:51:28 UTC 2014
AAAMgr: Instance 37
39571859 Total aaa requests 0 Current aaa requests
24368622 Total aaa auth requests 0 Current aaa auth requests
0 Total aaa auth probes 0 Current aaa auth probes
0 Total aaa aggregation requests
0 Current aaa aggregation requests

Radius
0 Total aaa auth keepalive 0 Current aaa auth keepalive
15043217 Total aaa acct requests 0 Current aaa acct requests
0 Total aaa acct keepalive 0 Current aaa acct keepalive
20482618 Total aaa auth success 1309507 Total aaa auth failure
85331 Total aaa auth purged 968 Total aaa auth cancelled
0 Total auth keepalive success 0 Total auth keepalive failure
0 Total auth keepalive purged
0 Total aaa aggregation success requests
0 Total aaa aggregation failure requests
0 Total aaa aggregation purged requests
15167 Total aaa auth DMU challenged
1/70600 aaa request (used/max)
41 Total diameter auth responses dropped
6883765 Total Diameter auth requests 0 Current Diameter auth requests
23761 Total Diameter auth requests retried
37 Total Diameter auth requests dropped
9216203 Total radius auth requests 0 Current radius auth requests
0 Total radius auth requests retried
927 Total radius auth responses dropped
15 Total local auth requests 0 Current local auth requests
8420022 Total pseudo auth requests 0 Current pseudo auth requests
8637 Total null-username auth requests (rejected)
0 Total aggregation responses dropped
15043177 Total aaa acct completed 0 Total aaa acct purged
0 Total acct keepalive success 0 Total acct keepalive timeout
:
15043217 Total radius acct requests 0 Current radius acct requests
40 Total radius acct cancelled
0 Total radius acct purged
476 Total radius acct requests retried
37 Total radius acct responses dropped
Radius accounting tests fail for this aaamgr for just 192.168.86.10
[source]5000> radius test instance 36 accounting all test
Wednesday September 10 10:06:29 UTC 2014
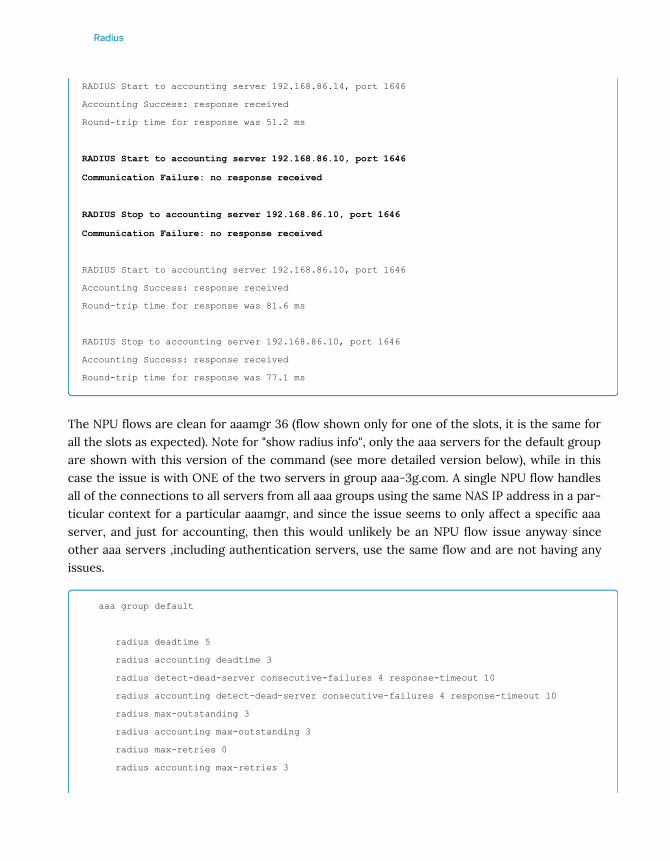
Radius
RADIUS Start to accounting server 192.168.86.14, port 1646
Accounting Success: response received
Round-trip time for response was 51.2 ms
RADIUS Start to accounting server 192.168.86.10, port 1646
Communication Failure: no response received
RADIUS Stop to accounting server 192.168.86.10, port 1646
Communication Failure: no response received
RADIUS Start to accounting server 192.168.86.10, port 1646
Accounting Success: response received
Round-trip time for response was 81.6 ms
RADIUS Stop to accounting server 192.168.86.10, port 1646
Accounting Success: response received
Round-trip time for response was 77.1 ms
The NPU flows are clean for aaamgr 36 (flow shown only for one of the slots, it is the same forall the slots as expected). Note for "show radius info", only the aaa servers for the default groupare shown with this version of the command (see more detailed version below), while in thiscase the issue is with ONE of the two servers in group aaa-3g.com. A single NPU flow handlesall of the connections to all servers from all aaa groups using the same NAS IP address in a par-ticular context for a particular aaamgr, and since the issue seems to only affect a specific aaaserver, and just for accounting, then this would unlikely be an NPU flow issue anyway sinceother aaa servers ,including authentication servers, use the same flow and are not having anyissues.
aaa group default
radius deadtime 5
radius accounting deadtime 3
radius detect-dead-server consecutive-failures 4 response-timeout 10
radius accounting detect-dead-server consecutive-failures 4 response-timeout 10
radius max-outstanding 3
radius accounting max-outstanding 3
radius max-retries 0
radius accounting max-retries 3
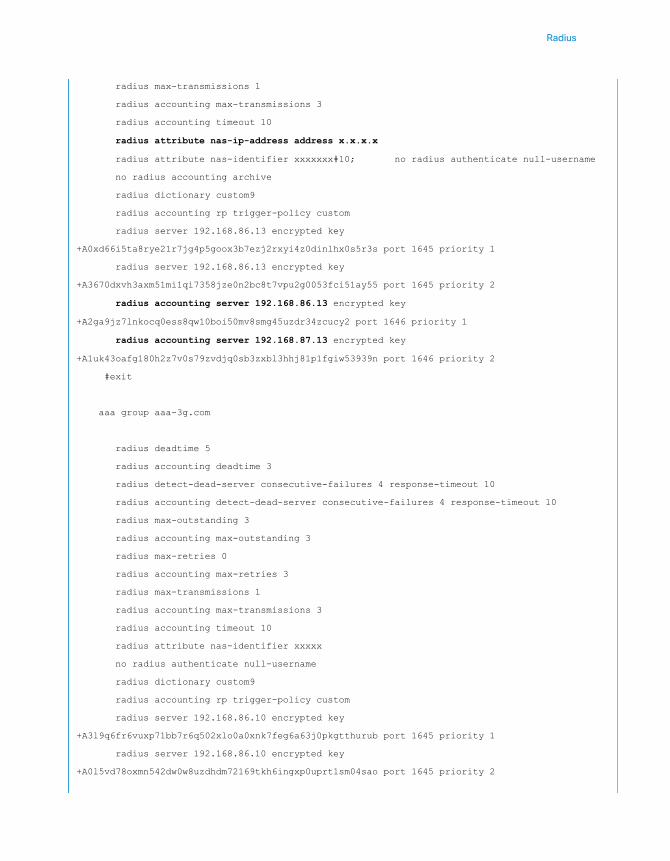
Radius
radius max-transmissions 1
radius accounting max-transmissions 3
radius accounting timeout 10
radius attribute nas-ip-address address x.x.x.x
radius attribute nas-identifier xxxxxxx#10; no radius authenticate null-username
no radius accounting archive
radius dictionary custom9
radius accounting rp trigger-policy custom
radius server 192.168.86.13 encrypted key
+A0xd66i5ta8rye21r7jg4p5goox3b7ezj2rxyi4z0dinlhx0s5r3s port 1645 priority 1
radius server 192.168.86.13 encrypted key
+A3670dxvh3axm51mi1qi7358jze0n2bc8t7vpu2g0053fci51ay55 port 1645 priority 2
radius accounting server 192.168.86.13 encrypted key
+A2ga9jz7lnkocq0ess8qw10boi50mv8smg45uzdr34zcucy2 port 1646 priority 1
radius accounting server 192.168.87.13 encrypted key
+A1uk43oafg180h2z7v0s79zvdjq0sb3zxbl3hhj81p1fgiw53939n port 1646 priority 2
#exit
aaa group aaa-3g.com
radius deadtime 5
radius accounting deadtime 3
radius detect-dead-server consecutive-failures 4 response-timeout 10
radius accounting detect-dead-server consecutive-failures 4 response-timeout 10
radius max-outstanding 3
radius accounting max-outstanding 3
radius max-retries 0
radius accounting max-retries 3
radius max-transmissions 1
radius accounting max-transmissions 3
radius accounting timeout 10
radius attribute nas-identifier xxxxx
no radius authenticate null-username
radius dictionary custom9
radius accounting rp trigger-policy custom
radius server 192.168.86.10 encrypted key
+A3l9q6fr6vuxp71bb7r6q502xlo0a0xnk7feg6a63j0pkgtthurub port 1645 priority 1
radius server 192.168.86.10 encrypted key
+A0l5vd78oxmn542dw0w8uzdhdm72169tkh6ingxp0uprt1sm04sao port 1645 priority 2
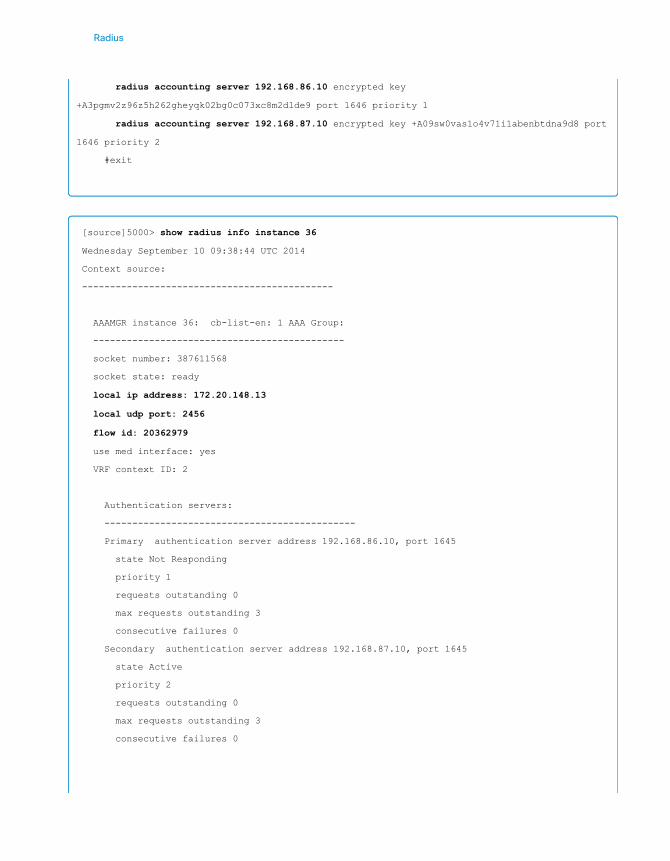
Radius
radius accounting server 192.168.86.10 encrypted key
+A3pgmv2z96z5h262gheyqk02bg0c073xc8m2dlde9 port 1646 priority 1
radius accounting server 192.168.87.10 encrypted key +A09sw0vas1o4v71i1abenbtdna9d8 port
1646 priority 2
#exit
[source]5000> show radius info instance 36
Wednesday September 10 09:38:44 UTC 2014
Context source:
---------------------------------------------
AAAMGR instance 36: cb-list-en: 1 AAA Group:
---------------------------------------------
socket number: 387611568
socket state: ready
local ip address: 172.20.148.13
local udp port: 2456
flow id: 20362979
use med interface: yes
VRF context ID: 2
Authentication servers:
---------------------------------------------
Primary authentication server address 192.168.86.10, port 1645
state Not Responding
priority 1
requests outstanding 0
max requests outstanding 3
consecutive failures 0
Secondary authentication server address 192.168.87.10, port 1645
state Active
priority 2
requests outstanding 0
max requests outstanding 3
consecutive failures 0
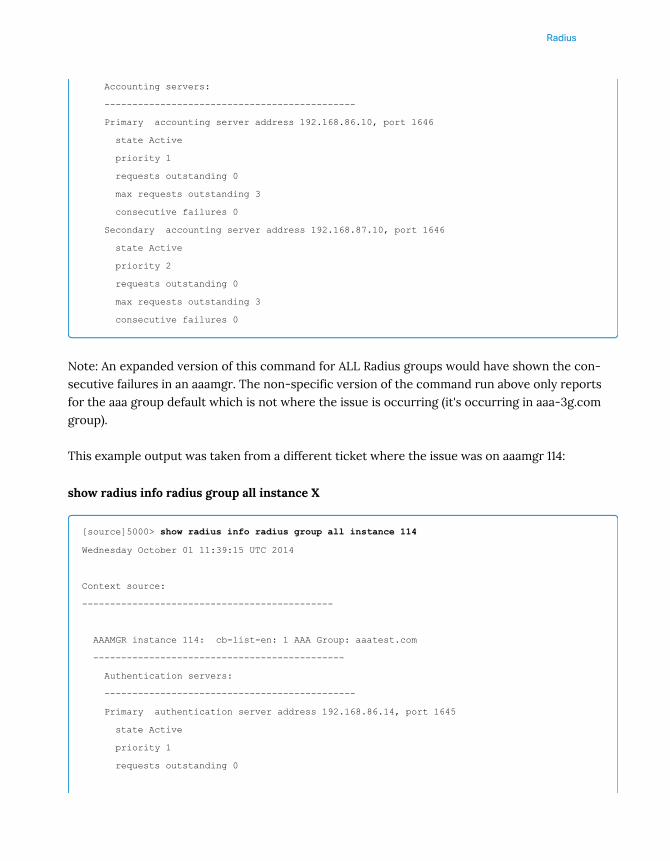
Radius
Accounting servers:
---------------------------------------------
Primary accounting server address 192.168.86.10, port 1646
state Active
priority 1
requests outstanding 0
max requests outstanding 3
consecutive failures 0
Secondary accounting server address 192.168.87.10, port 1646
state Active
priority 2
requests outstanding 0
max requests outstanding 3
consecutive failures 0
Note: An expanded version of this command for ALL Radius groups would have shown the con-secutive failures in an aaamgr. The non-specific version of the command run above only reportsfor the aaa group default which is not where the issue is occurring (it's occurring in aaa-3g.comgroup).
This example output was taken from a different ticket where the issue was on aaamgr 114:
show radius info radius group all instance X
[source]5000> show radius info radius group all instance 114
Wednesday October 01 11:39:15 UTC 2014
Context source:
---------------------------------------------
AAAMGR instance 114: cb-list-en: 1 AAA Group: aaatest.com
---------------------------------------------
Authentication servers:
---------------------------------------------
Primary authentication server address 192.168.86.14, port 1645
state Active
priority 1
requests outstanding 0
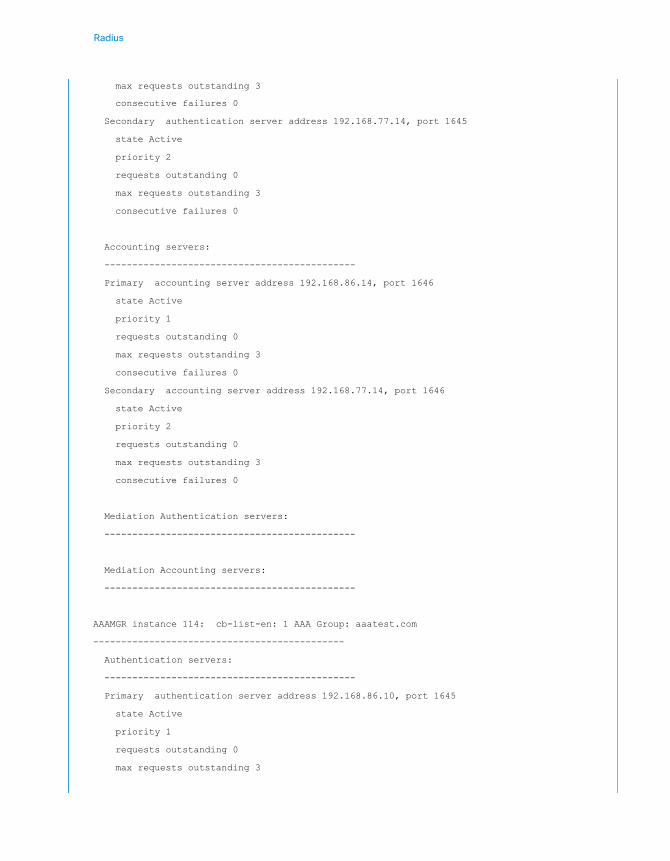
Radius
max requests outstanding 3
consecutive failures 0
Secondary authentication server address 192.168.77.14, port 1645
state Active
priority 2
requests outstanding 0
max requests outstanding 3
consecutive failures 0
Accounting servers:
---------------------------------------------
Primary accounting server address 192.168.86.14, port 1646
state Active
priority 1
requests outstanding 0
max requests outstanding 3
consecutive failures 0
Secondary accounting server address 192.168.77.14, port 1646
state Active
priority 2
requests outstanding 0
max requests outstanding 3
consecutive failures 0
Mediation Authentication servers:
---------------------------------------------
Mediation Accounting servers:
---------------------------------------------
AAAMGR instance 114: cb-list-en: 1 AAA Group: aaatest.com
---------------------------------------------
Authentication servers:
---------------------------------------------
Primary authentication server address 192.168.86.10, port 1645
state Active
priority 1
requests outstanding 0
max requests outstanding 3
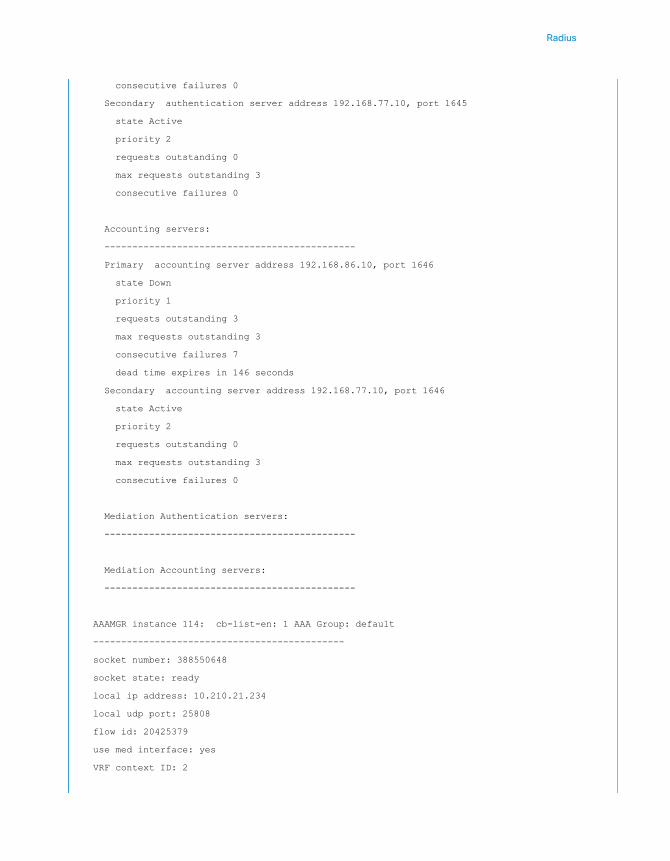
Radius
consecutive failures 0
Secondary authentication server address 192.168.77.10, port 1645
state Active
priority 2
requests outstanding 0
max requests outstanding 3
consecutive failures 0
Accounting servers:
---------------------------------------------
Primary accounting server address 192.168.86.10, port 1646
state Down
priority 1
requests outstanding 3
max requests outstanding 3
consecutive failures 7
dead time expires in 146 seconds
Secondary accounting server address 192.168.77.10, port 1646
state Active
priority 2
requests outstanding 0
max requests outstanding 3
consecutive failures 0
Mediation Authentication servers:
---------------------------------------------
Mediation Accounting servers:
---------------------------------------------
AAAMGR instance 114: cb-list-en: 1 AAA Group: default
---------------------------------------------
socket number: 388550648
socket state: ready
local ip address: 10.210.21.234
local udp port: 25808
flow id: 20425379
use med interface: yes
VRF context ID: 2
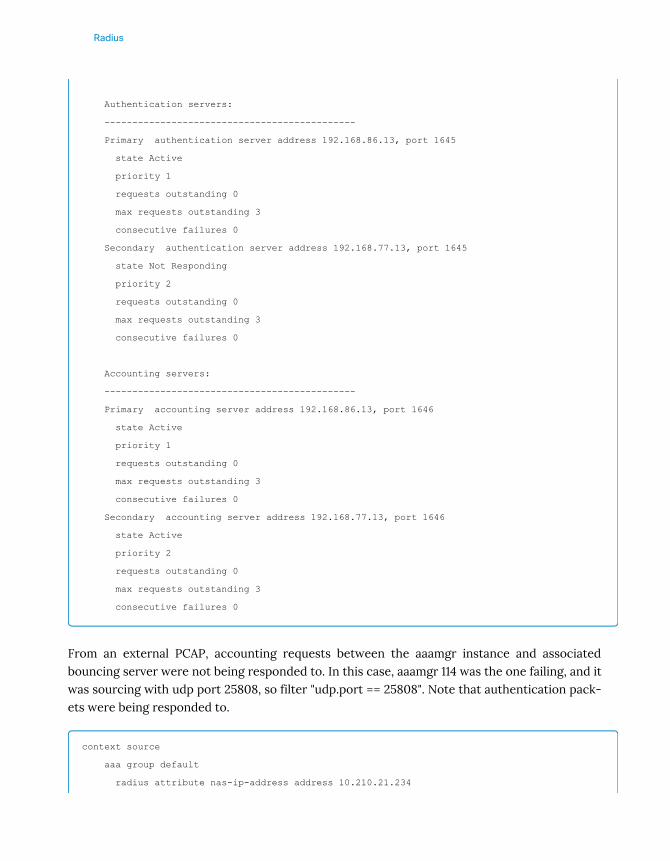
Radius
Authentication servers:
---------------------------------------------
Primary authentication server address 192.168.86.13, port 1645
state Active
priority 1
requests outstanding 0
max requests outstanding 3
consecutive failures 0
Secondary authentication server address 192.168.77.13, port 1645
state Not Responding
priority 2
requests outstanding 0
max requests outstanding 3
consecutive failures 0
Accounting servers:
---------------------------------------------
Primary accounting server address 192.168.86.13, port 1646
state Active
priority 1
requests outstanding 0
max requests outstanding 3
consecutive failures 0
Secondary accounting server address 192.168.77.13, port 1646
state Active
priority 2
requests outstanding 0
max requests outstanding 3
consecutive failures 0
From an external PCAP, accounting requests between the aaamgr instance and associatedbouncing server were not being responded to. In this case, aaamgr 114 was the one failing, and itwas sourcing with udp port 25808, so filter "udp.port == 25808". Note that authentication pack-ets were being responded to.
context source
aaa group default
radius attribute nas-ip-address address 10.210.21.234

Radius
aaa group aaatest.com
radius accounting server 192.168.86.10 encrypted key +A2ntd8tcfamm0nr179l44h06jtio port
1646 priority 1
[source]HSGW> show radius client status
RADIUS client status: UP
Active nas-ip-address: 172.21.21.234
Configured primary nas-ip-address: 10.210.21.234 UP
Configured backup nas-ip-address: NONE DOWN
[source]HSGW> show radius info radius group all instance 114
Saturday October 18 04:57:39 UTC 2014
Context source:
---------------------------------------------
AAAMGR instance 114: cb-list-en: 1 AAA Group: aaatest.com
Accounting servers:
---------------------------------------------
Primary accounting server address 192.168.86.10, port 1646
state Down
priority 1
requests outstanding 3
max requests outstanding 3
consecutive failures 4
dead time expires in 174 seconds
AAAMGR instance 114: cb-list-en: 1 AAA Group: default
---------------------------------------------
socket number: 388550648
socket state: ready
local ip address: 10.210.21.234
local udp port: 25808
flow id: 20425379
use med interface: yes
VRF context ID: 2
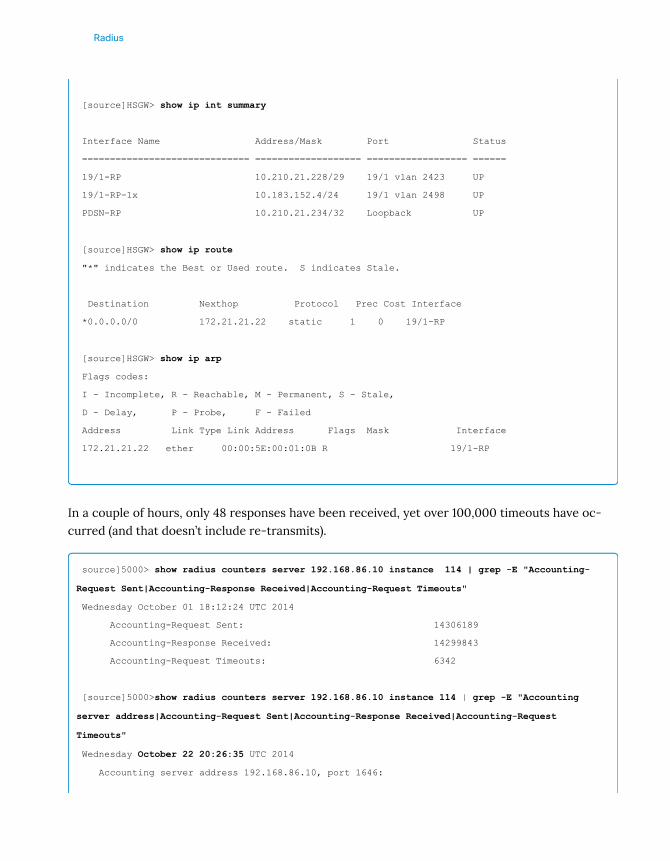
Radius
[source]HSGW> show ip int summary
Interface Name Address/Mask Port Status
============================== =================== ================== ======
19/1-RP 10.210.21.228/29 19/1 vlan 2423 UP
19/1-RP-1x 10.183.152.4/24 19/1 vlan 2498 UP
PDSN-RP 10.210.21.234/32 Loopback UP
[source]HSGW> show ip route
"*" indicates the Best or Used route. S indicates Stale.
Destination Nexthop Protocol Prec Cost Interface
*0.0.0.0/0 172.21.21.22 static 1 0 19/1-RP
[source]HSGW> show ip arp
Flags codes:
I - Incomplete, R - Reachable, M - Permanent, S - Stale,
D - Delay, P - Probe, F - Failed
Address Link Type Link Address Flags Mask Interface
172.21.21.22 ether 00:00:5E:00:01:0B R 19/1-RP
In a couple of hours, only 48 responses have been received, yet over 100,000 timeouts have oc-curred (and that doesn’t include re-transmits).
source]5000> show radius counters server 192.168.86.10 instance 114 | grep -E "Accounting-
Request Sent|Accounting-Response Received|Accounting-Request Timeouts"
Wednesday October 01 18:12:24 UTC 2014
Accounting-Request Sent: 14306189
Accounting-Response Received: 14299843
Accounting-Request Timeouts: 6342
[source]5000>show radius counters server 192.168.86.10 instance 114 | grep -E "Accounting
server address|Accounting-Request Sent|Accounting-Response Received|Accounting-Request
Timeouts"
Wednesday October 22 20:26:35 UTC 2014
Accounting server address 192.168.86.10, port 1646:

Radius
Accounting-Request Sent: 15105872
Accounting-Response Received: 14299891
Accounting-Request Timeouts: 158989
[source]5000> show radius counters server 192.168.86.10 instance 114 | grep Accounting
Wednesday October 22 20:33:09 UTC 2014
Per-Context RADIUS Accounting Counters
Accounting Response
Server-specific Accounting Counters
Accounting-Response Received: 14299891
Accounting-Request Current Consecutive Failures in a mgr: 11
Current Accounting-Request Queued: 17821
[source]5000> show radius counters server 192.168.86.10 instance 114 | grep Accounting
Wednesday October 22 20:38:57 UTC 2014
Per-Context RADIUS Accounting Counters
Accounting Response
Server-specific Accounting Counters
Accounting server address 192.168.86.10, port 1646:
Accounting-Response Received: 14299891 <== NO successes in 12 minutes
Resolution:
Packet captures were taken between a Load Balancer and firewall that were located betweenthe ASR 5000 and the Radius server, and these show that the firewall was dropping packets.This turned out to be a bug in the firewall and so the problem would just start occuring on thePDSN without any apparent trigger (as mentioned earlier). Restarting the failing aaamgr task ordoing a PSC migration for the PSC housing the aaamgr would not resolve the issue, because thesource UDP port used for Radius requests for that particular aaamgr would not change in theprocess of doing so.
The only resolutions for this issue are: 1) Reloading the PDSN which changes all the UDP portsused by all aaamgr instances, or 2) switching over to the redundant firewall (and rebooting thefirewall with the issue), or 3) ultimately fixing the bug in the firewall

Radius
While the key to getting to the root cause of this issue was obtaining a PCAP to confirm that thePDSN was not dropping resposes, running the various CLIs on the PDSN helped in narrowingdown the issue.

Diameter

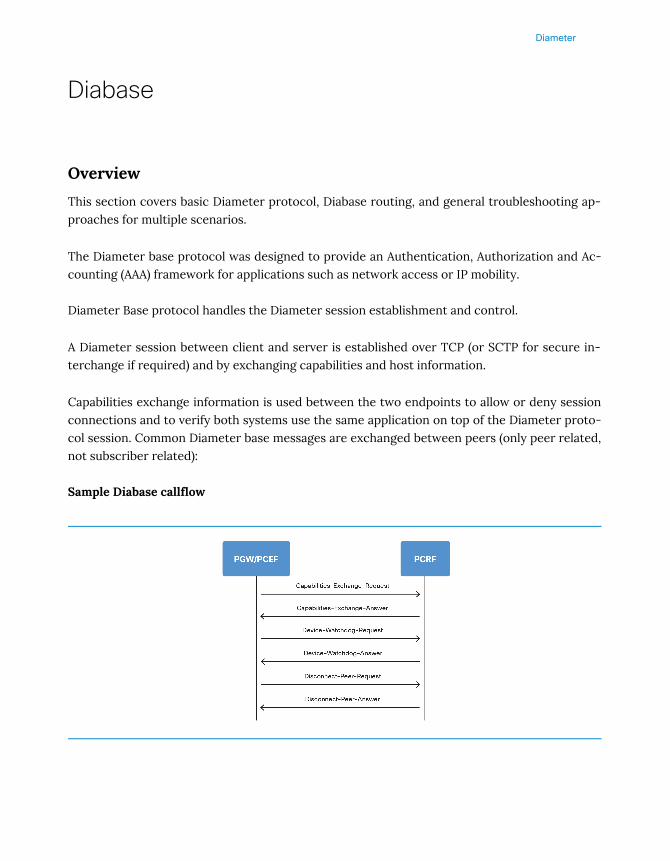
Diameter
Diabase
Overview
This section covers basic Diameter protocol, Diabase routing, and general troubleshooting ap-proaches for multiple scenarios.
The Diameter base protocol was designed to provide an Authentication, Authorization and Ac-counting (AAA) framework for applications such as network access or IP mobility.
Diameter Base protocol handles the Diameter session establishment and control.
A Diameter session between client and server is established over TCP (or SCTP for secure in-terchange if required) and by exchanging capabilities and host information.
Capabilities exchange information is used between the two endpoints to allow or deny sessionconnections and to verify both systems use the same application on top of the Diameter proto-col session. Common Diameter base messages are exchanged between peers (only peer related,not subscriber related):
Sample Diabase callflow

Diameter
Messages description:
• Capabilities-Exchange-Request (CER): This message is sent from the client to theserver to know the capabilities of the server.
• Capabilities-Exchange-Answer (CEA): This message is sent from the server to theclient in response to the CER message.
• Device-Watchdog-Request (DWR): After the CER/CEA messages are exchanged, ifthere is no more traffic between peers for a while, to monitor the health of theconnection, a DWR message is sent from the client. The Device Watchdog timer (Tw) isconfigurable in PCEF / GW and can vary from 6 through 30 seconds. A very low valuewill result in duplication of messages. The default value is 30 seconds. On twoconsecutive expiries of Tw without a DWA, the peer is taken down.
• Device-Watchdog-Answer (DWA): This is the response to the DWR message from theserver. This is used to monitor the connection state.
• Disconnect-Peer-Request (DPR): This message is sent to the peer to confirmthe shutdown of connection. PCEF / GW only receives this message.
• Disconnect-Peer-Answer (DPA): This message is the response to the DPR request fromthe peer. On receiving the DPR, the peer sends DPA and puts the connection state to“DO NOT WANT TO TALK TO YOU” state. If a connection is stuck, there are a fewoptions to get the connection back. One is reconfiguring (remove/re-add) the peeragain and another is "Diameter reset connection endpoint <endpoint name>" at adminuser mode.
Diabase Commands
• show diameter statistics
• show diameter peers full all
• show diameter message-queue counters outbound
• show diameter message-queue counters inbound
• show diameter route status
• show diameter route status full
• show diameter route table wide
• show session disconnect-reasons
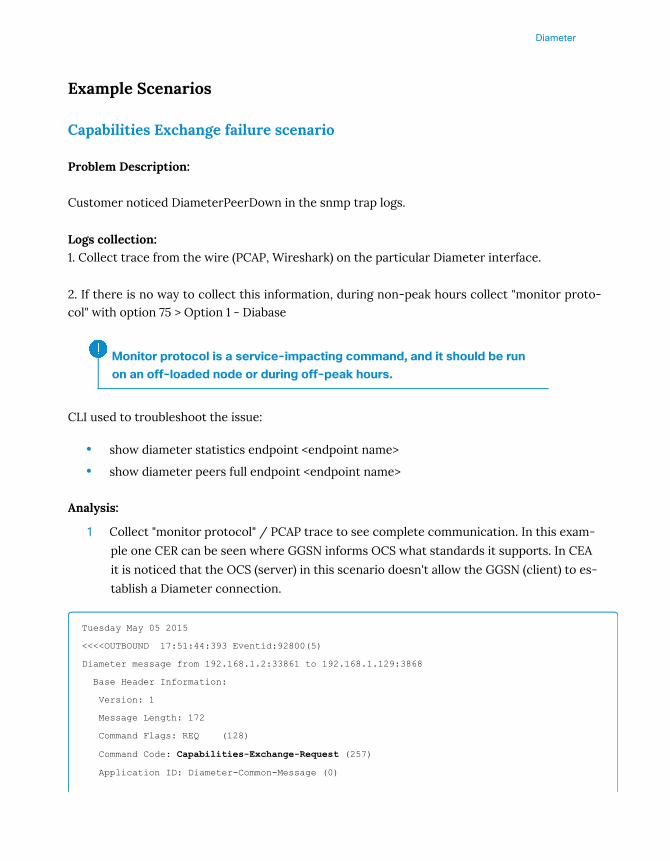
Diameter
Example Scenarios
Capabilities Exchange failure scenario
Problem Description:
Customer noticed DiameterPeerDown in the snmp trap logs.
Logs collection:1. Collect trace from the wire (PCAP, Wireshark) on the particular Diameter interface.
2. If there is no way to collect this information, during non-peak hours collect "monitor proto-col" with option 75 > Option 1 - Diabase
Monitor protocol is a service-impacting command, and it should be runon an off-loaded node or during off-peak hours.
CLI used to troubleshoot the issue:
• show diameter statistics endpoint <endpoint name>
• show diameter peers full endpoint <endpoint name>
Analysis:
1 Collect "monitor protocol" / PCAP trace to see complete communication. In this exam-ple one CER can be seen where GGSN informs OCS what standards it supports. In CEA
it is noticed that the OCS (server) in this scenario doesn't allow the GGSN (client) to es-tablish a Diameter connection.
Tuesday May 05 2015
<<<<OUTBOUND 17:51:44:393 Eventid:92800(5)
Diameter message from 192.168.1.2:33861 to 192.168.1.129:3868
Base Header Information:
Version: 1
Message Length: 172
Command Flags: REQ (128)
Command Code: Capabilities-Exchange-Request (257)
Application ID: Diameter-Common-Message (0)
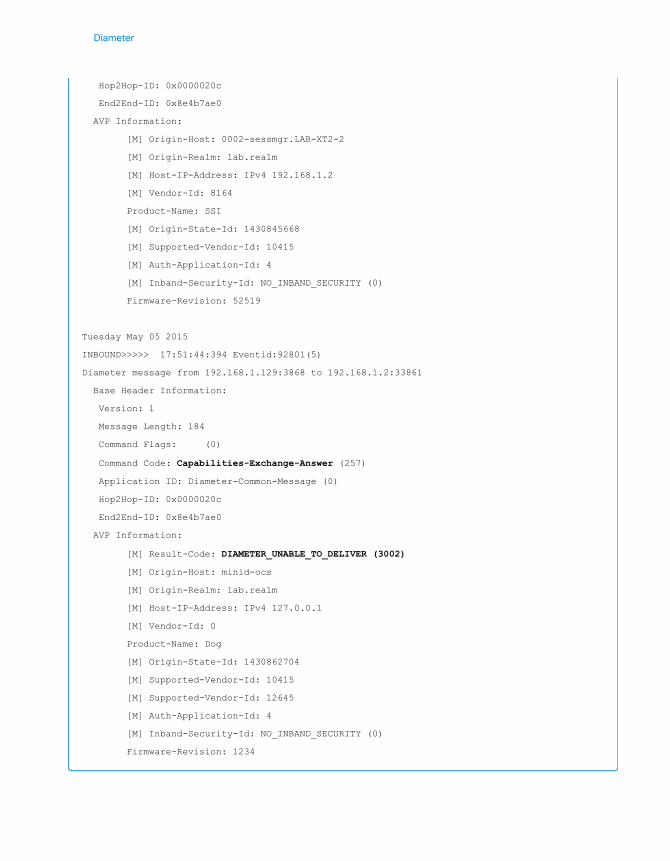
Diameter
Hop2Hop-ID: 0x0000020c
End2End-ID: 0x8e4b7ae0
AVP Information:
[M] Origin-Host: 0002-sessmgr.LAB-XT2-2
[M] Origin-Realm: lab.realm
[M] Host-IP-Address: IPv4 192.168.1.2
[M] Vendor-Id: 8164
Product-Name: SSI
[M] Origin-State-Id: 1430845668
[M] Supported-Vendor-Id: 10415
[M] Auth-Application-Id: 4
[M] Inband-Security-Id: NO_INBAND_SECURITY (0)
Firmware-Revision: 52519
Tuesday May 05 2015
INBOUND>>>>> 17:51:44:394 Eventid:92801(5)
Diameter message from 192.168.1.129:3868 to 192.168.1.2:33861
Base Header Information:
Version: 1
Message Length: 184
Command Flags: (0)
Command Code: Capabilities-Exchange-Answer (257)
Application ID: Diameter-Common-Message (0)
Hop2Hop-ID: 0x0000020c
End2End-ID: 0x8e4b7ae0
AVP Information:
[M] Result-Code: DIAMETER_UNABLE_TO_DELIVER (3002)
[M] Origin-Host: minid-ocs
[M] Origin-Realm: lab.realm
[M] Host-IP-Address: IPv4 127.0.0.1
[M] Vendor-Id: 0
Product-Name: Dog
[M] Origin-State-Id: 1430862704
[M] Supported-Vendor-Id: 10415
[M] Supported-Vendor-Id: 12645
[M] Auth-Application-Id: 4
[M] Inband-Security-Id: NO_INBAND_SECURITY (0)
Firmware-Revision: 1234
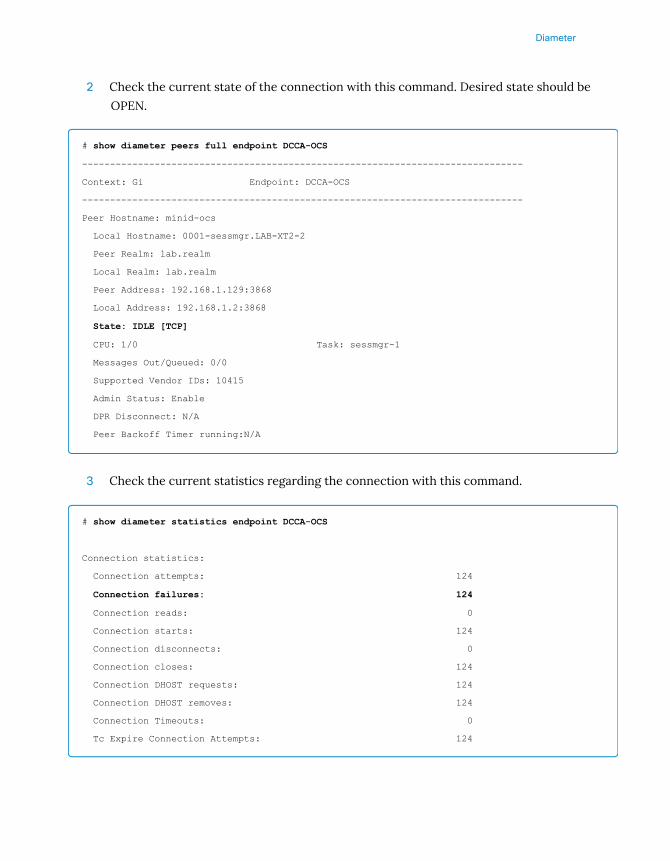
Diameter
2 Check the current state of the connection with this command. Desired state should be
OPEN.
# show diameter peers full endpoint DCCA-OCS
-------------------------------------------------------------------------------
Context: Gi Endpoint: DCCA-OCS
-------------------------------------------------------------------------------
Peer Hostname: minid-ocs
Local Hostname: 0001-sessmgr.LAB-XT2-2
Peer Realm: lab.realm
Local Realm: lab.realm
Peer Address: 192.168.1.129:3868
Local Address: 192.168.1.2:3868
State: IDLE [TCP]
CPU: 1/0 Task: sessmgr-1
Messages Out/Queued: 0/0
Supported Vendor IDs: 10415
Admin Status: Enable
DPR Disconnect: N/A
Peer Backoff Timer running:N/A
3 Check the current statistics regarding the connection with this command.
# show diameter statistics endpoint DCCA-OCS
Connection statistics:
Connection attempts: 124
Connection failures: 124
Connection reads: 0
Connection starts: 124
Connection disconnects: 0
Connection closes: 124
Connection DHOST requests: 124
Connection DHOST removes: 124
Connection Timeouts: 0
Tc Expire Connection Attempts: 124
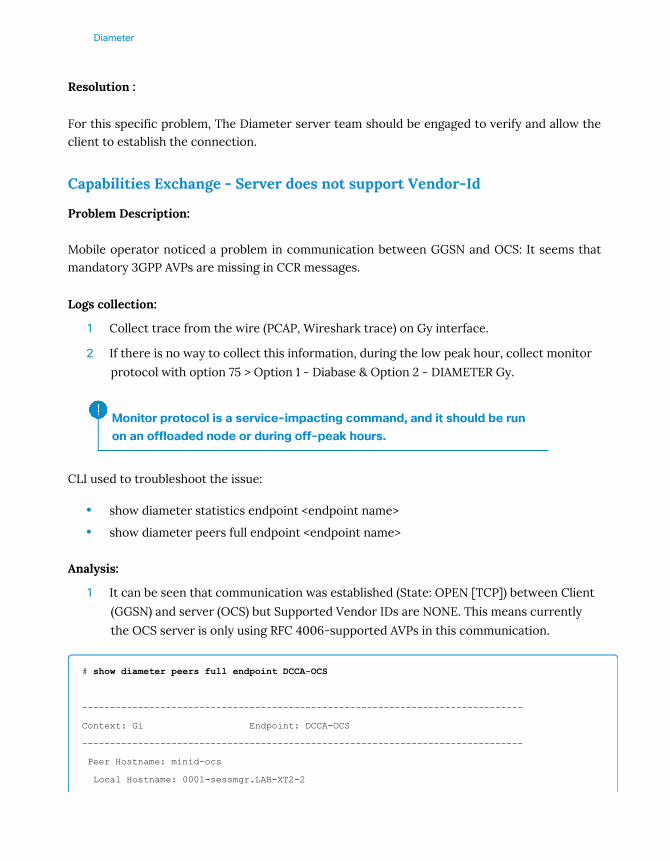
Diameter
Resolution :
For this specific problem, The Diameter server team should be engaged to verify and allow theclient to establish the connection.
Capabilities Exchange - Server does not support Vendor-Id
Problem Description:
Mobile operator noticed a problem in communication between GGSN and OCS: It seems thatmandatory 3GPP AVPs are missing in CCR messages.
Logs collection:
1 Collect trace from the wire (PCAP, Wireshark trace) on Gy interface.
2 If there is no way to collect this information, during the low peak hour, collect monitor
protocol with option 75 > Option 1 - Diabase & Option 2 - DIAMETER Gy.
Monitor protocol is a service-impacting command, and it should be runon an offloaded node or during off-peak hours.
CLI used to troubleshoot the issue:
• show diameter statistics endpoint <endpoint name>
• show diameter peers full endpoint <endpoint name>
Analysis:
1 It can be seen that communication was established (State: OPEN [TCP]) between Client
(GGSN) and server (OCS) but Supported Vendor IDs are NONE. This means currently
the OCS server is only using RFC 4006-supported AVPs in this communication.
# show diameter peers full endpoint DCCA-OCS
-------------------------------------------------------------------------------
Context: Gi Endpoint: DCCA-OCS
-------------------------------------------------------------------------------
Peer Hostname: minid-ocs
Local Hostname: 0001-sessmgr.LAB-XT2-2
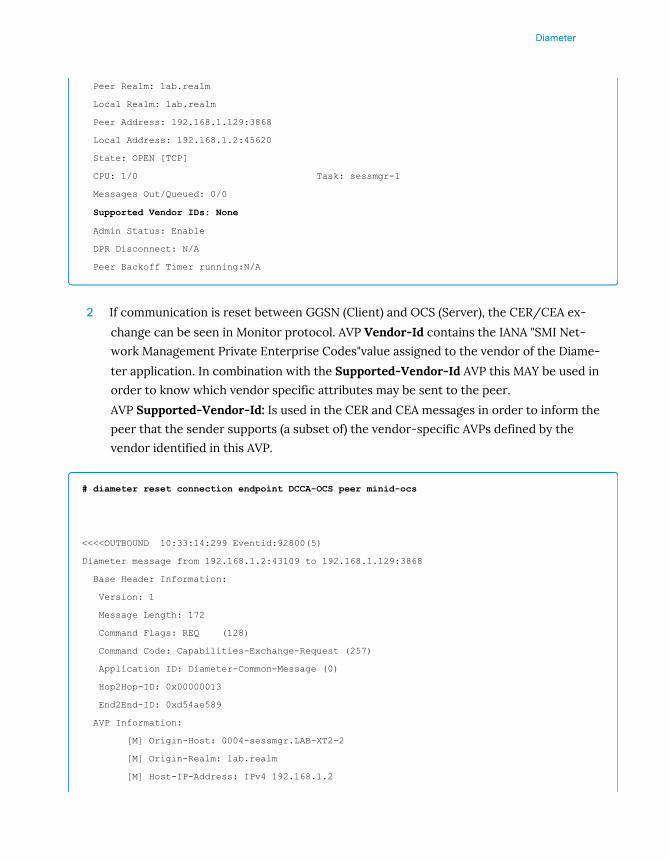
Diameter
Peer Realm: lab.realm
Local Realm: lab.realm
Peer Address: 192.168.1.129:3868
Local Address: 192.168.1.2:45620
State: OPEN [TCP]
CPU: 1/0 Task: sessmgr-1
Messages Out/Queued: 0/0
Supported Vendor IDs: None
Admin Status: Enable
DPR Disconnect: N/A
Peer Backoff Timer running:N/A
2 If communication is reset between GGSN (Client) and OCS (Server), the CER/CEA ex-change can be seen in Monitor protocol. AVP Vendor-Id contains the IANA "SMI Net-work Management Private Enterprise Codes"value assigned to the vendor of the Diame-ter application. In combination with the Supported-Vendor-Id AVP this MAY be used in
order to know which vendor specific attributes may be sent to the peer.
AVP Supported-Vendor-Id: Is used in the CER and CEA messages in order to inform the
peer that the sender supports (a subset of) the vendor-specific AVPs defined by the
vendor identified in this AVP.
# diameter reset connection endpoint DCCA-OCS peer minid-ocs
<<<<OUTBOUND 10:33:14:299 Eventid:92800(5)
Diameter message from 192.168.1.2:43109 to 192.168.1.129:3868
Base Header Information:
Version: 1
Message Length: 172
Command Flags: REQ (128)
Command Code: Capabilities-Exchange-Request (257)
Application ID: Diameter-Common-Message (0)
Hop2Hop-ID: 0x00000013
End2End-ID: 0xd54ae589
AVP Information:
[M] Origin-Host: 0004-sessmgr.LAB-XT2-2
[M] Origin-Realm: lab.realm
[M] Host-IP-Address: IPv4 192.168.1.2
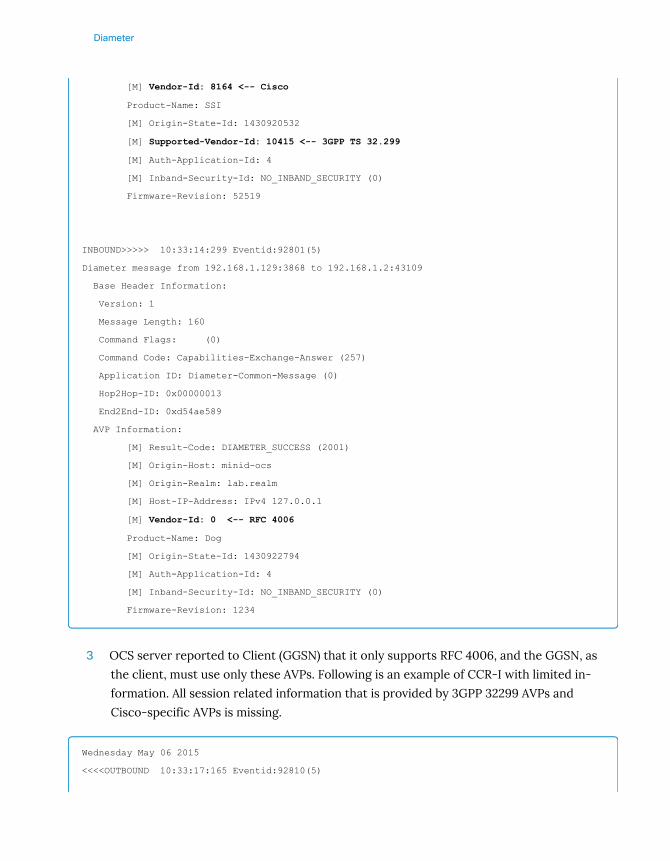
Diameter
[M] Vendor-Id: 8164 <-- Cisco
Product-Name: SSI
[M] Origin-State-Id: 1430920532
[M] Supported-Vendor-Id: 10415 <-- 3GPP TS 32.299
[M] Auth-Application-Id: 4
[M] Inband-Security-Id: NO_INBAND_SECURITY (0)
Firmware-Revision: 52519
INBOUND>>>>> 10:33:14:299 Eventid:92801(5)
Diameter message from 192.168.1.129:3868 to 192.168.1.2:43109
Base Header Information:
Version: 1
Message Length: 160
Command Flags: (0)
Command Code: Capabilities-Exchange-Answer (257)
Application ID: Diameter-Common-Message (0)
Hop2Hop-ID: 0x00000013
End2End-ID: 0xd54ae589
AVP Information:
[M] Result-Code: DIAMETER_SUCCESS (2001)
[M] Origin-Host: minid-ocs
[M] Origin-Realm: lab.realm
[M] Host-IP-Address: IPv4 127.0.0.1
[M] Vendor-Id: 0 <-- RFC 4006
Product-Name: Dog
[M] Origin-State-Id: 1430922794
[M] Auth-Application-Id: 4
[M] Inband-Security-Id: NO_INBAND_SECURITY (0)
Firmware-Revision: 1234
3 OCS server reported to Client (GGSN) that it only supports RFC 4006, and the GGSN, as
the client, must use only these AVPs. Following is an example of CCR-I with limited in-formation. All session related information that is provided by 3GPP 32299 AVPs and
Cisco-specific AVPs is missing.
Wednesday May 06 2015
<<<<OUTBOUND 10:33:17:165 Eventid:92810(5)
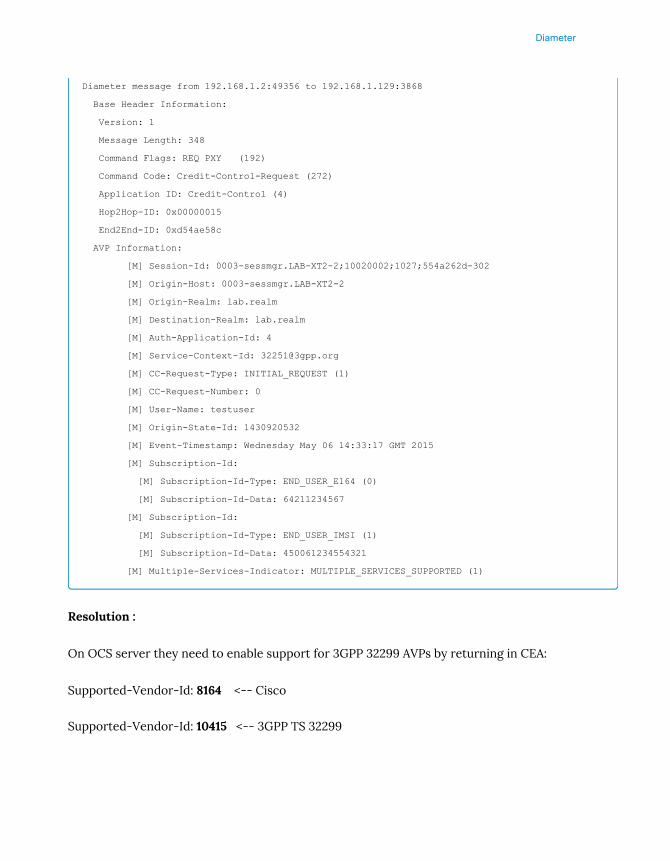
Diameter
Diameter message from 192.168.1.2:49356 to 192.168.1.129:3868
Base Header Information:
Version: 1
Message Length: 348
Command Flags: REQ PXY (192)
Command Code: Credit-Control-Request (272)
Application ID: Credit-Control (4)
Hop2Hop-ID: 0x00000015
End2End-ID: 0xd54ae58c
AVP Information:
[M] Session-Id: 0003-sessmgr.LAB-XT2-2;10020002;1027;554a262d-302
[M] Origin-Host: 0003-sessmgr.LAB-XT2-2
[M] Origin-Realm: lab.realm
[M] Destination-Realm: lab.realm
[M] Auth-Application-Id: 4
[M] Service-Context-Id: [email protected]
[M] CC-Request-Type: INITIAL_REQUEST (1)
[M] CC-Request-Number: 0
[M] User-Name: testuser
[M] Origin-State-Id: 1430920532
[M] Event-Timestamp: Wednesday May 06 14:33:17 GMT 2015
[M] Subscription-Id:
[M] Subscription-Id-Type: END_USER_E164 (0)
[M] Subscription-Id-Data: 64211234567
[M] Subscription-Id:
[M] Subscription-Id-Type: END_USER_IMSI (1)
[M] Subscription-Id-Data: 450061234554321
[M] Multiple-Services-Indicator: MULTIPLE_SERVICES_SUPPORTED (1)
Resolution :
On OCS server they need to enable support for 3GPP 32299 AVPs by returning in CEA:
Supported-Vendor-Id: 8164 <-- Cisco
Supported-Vendor-Id: 10415 <-- 3GPP TS 32299
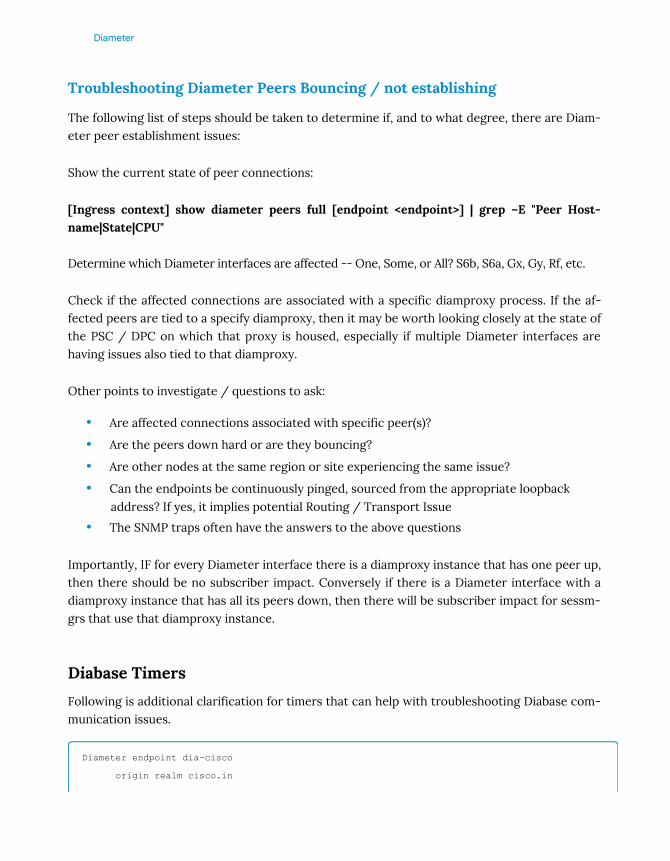
Diameter
Troubleshooting Diameter Peers Bouncing / not establishing
The following list of steps should be taken to determine if, and to what degree, there are Diam-eter peer establishment issues:
Show the current state of peer connections:
[Ingress context] show diameter peers full [endpoint <endpoint>] | grep –E "Peer Host-name|State|CPU"
Determine which Diameter interfaces are affected -- One, Some, or All? S6b, S6a, Gx, Gy, Rf, etc.
Check if the affected connections are associated with a specific diamproxy process. If the af-fected peers are tied to a specify diamproxy, then it may be worth looking closely at the state ofthe PSC / DPC on which that proxy is housed, especially if multiple Diameter interfaces arehaving issues also tied to that diamproxy.
Other points to investigate / questions to ask:
• Are affected connections associated with specific peer(s)?
• Are the peers down hard or are they bouncing?
• Are other nodes at the same region or site experiencing the same issue?
• Can the endpoints be continuously pinged, sourced from the appropriate loopbackaddress? If yes, it implies potential Routing / Transport Issue
• The SNMP traps often have the answers to the above questions
Importantly, IF for every Diameter interface there is a diamproxy instance that has one peer up,then there should be no subscriber impact. Conversely if there is a Diameter interface with adiamproxy instance that has all its peers down, then there will be subscriber impact for sessm-grs that use that diamproxy instance.
Diabase Timers
Following is additional clarification for timers that can help with troubleshooting Diabase com-munication issues.
Diameter endpoint dia-cisco
origin realm cisco.in
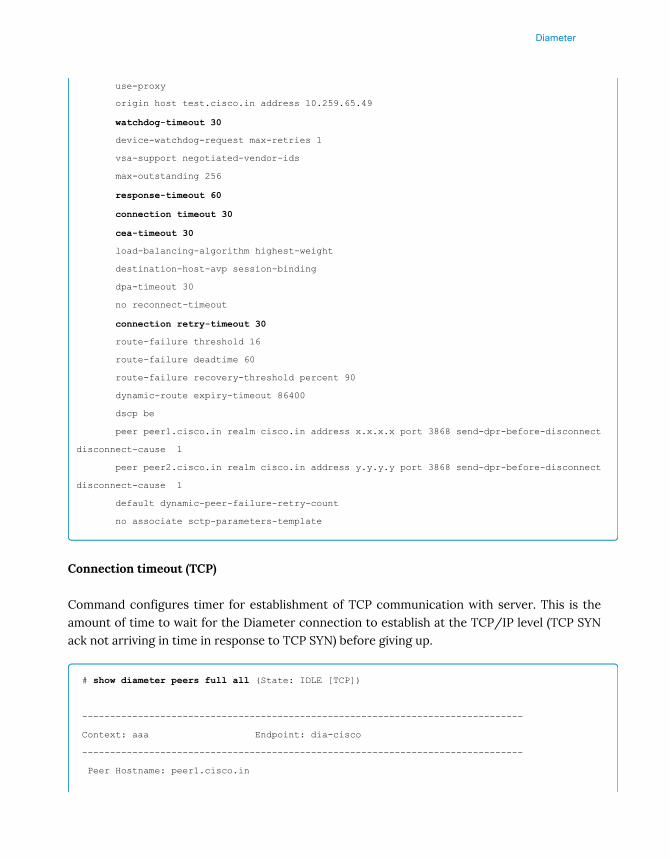
Diameter
use-proxy
origin host test.cisco.in address 10.259.65.49
watchdog-timeout 30
device-watchdog-request max-retries 1
vsa-support negotiated-vendor-ids
max-outstanding 256
response-timeout 60
connection timeout 30
cea-timeout 30
load-balancing-algorithm highest-weight
destination-host-avp session-binding
dpa-timeout 30
no reconnect-timeout
connection retry-timeout 30
route-failure threshold 16
route-failure deadtime 60
route-failure recovery-threshold percent 90
dynamic-route expiry-timeout 86400
dscp be
peer peer1.cisco.in realm cisco.in address x.x.x.x port 3868 send-dpr-before-disconnect
disconnect-cause 1
peer peer2.cisco.in realm cisco.in address y.y.y.y port 3868 send-dpr-before-disconnect
disconnect-cause 1
default dynamic-peer-failure-retry-count
no associate sctp-parameters-template
Connection timeout (TCP)
Command configures timer for establishment of TCP communication with server. This is theamount of time to wait for the Diameter connection to establish at the TCP/IP level (TCP SYNack not arriving in time in response to TCP SYN) before giving up.
# show diameter peers full all (State: IDLE [TCP])
-------------------------------------------------------------------------------
Context: aaa Endpoint: dia-cisco
-------------------------------------------------------------------------------
Peer Hostname: peer1.cisco.in
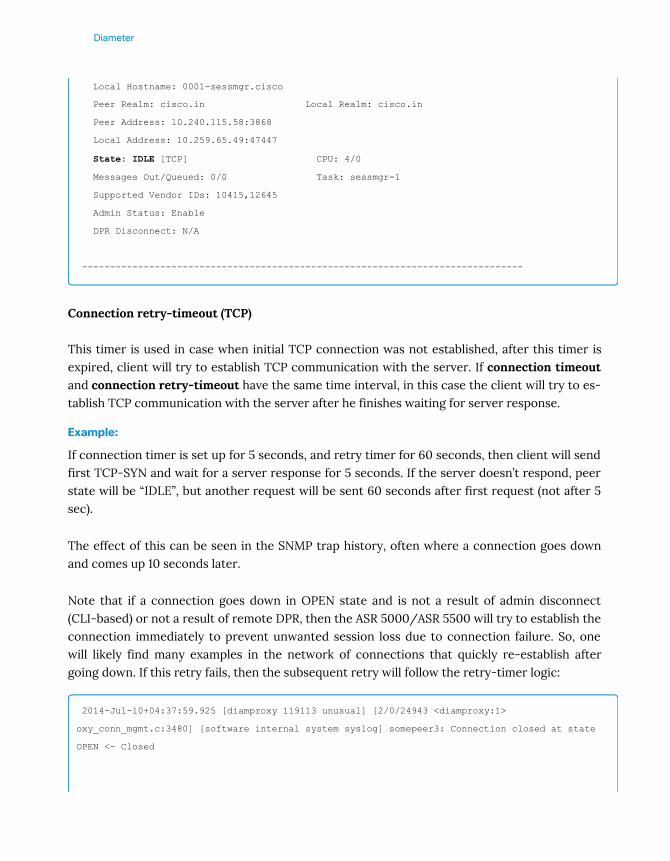
Diameter
Local Hostname: 0001-sessmgr.cisco
Peer Realm: cisco.in Local Realm: cisco.in
Peer Address: 10.240.115.58:3868
Local Address: 10.259.65.49:47447
State: IDLE [TCP] CPU: 4/0
Messages Out/Queued: 0/0 Task: sessmgr-1
Supported Vendor IDs: 10415,12645
Admin Status: Enable
DPR Disconnect: N/A
-------------------------------------------------------------------------------
Connection retry-timeout (TCP)
This timer is used in case when initial TCP connection was not established, after this timer isexpired, client will try to establish TCP communication with the server. If connection timeoutand connection retry-timeout have the same time interval, in this case the client will try to es-tablish TCP communication with the server after he finishes waiting for server response.
Example:
If connection timer is set up for 5 seconds, and retry timer for 60 seconds, then client will sendfirst TCP-SYN and wait for a server response for 5 seconds. If the server doesn’t respond, peerstate will be “IDLE”, but another request will be sent 60 seconds after first request (not after 5sec).
The effect of this can be seen in the SNMP trap history, often where a connection goes downand comes up 10 seconds later.
Note that if a connection goes down in OPEN state and is not a result of admin disconnect(CLI-based) or not a result of remote DPR, then the ASR 5000/ASR 5500 will try to establish theconnection immediately to prevent unwanted session loss due to connection failure. So, onewill likely find many examples in the network of connections that quickly re-establish aftergoing down. If this retry fails, then the subsequent retry will follow the retry-timer logic:
2014-Jul-10+04:37:59.925 [diamproxy 119113 unusual] [2/0/24943 <diamproxy:1>
oxy_conn_mgmt.c:3480] [software internal system syslog] somepeer3: Connection closed at state
OPEN <- Closed
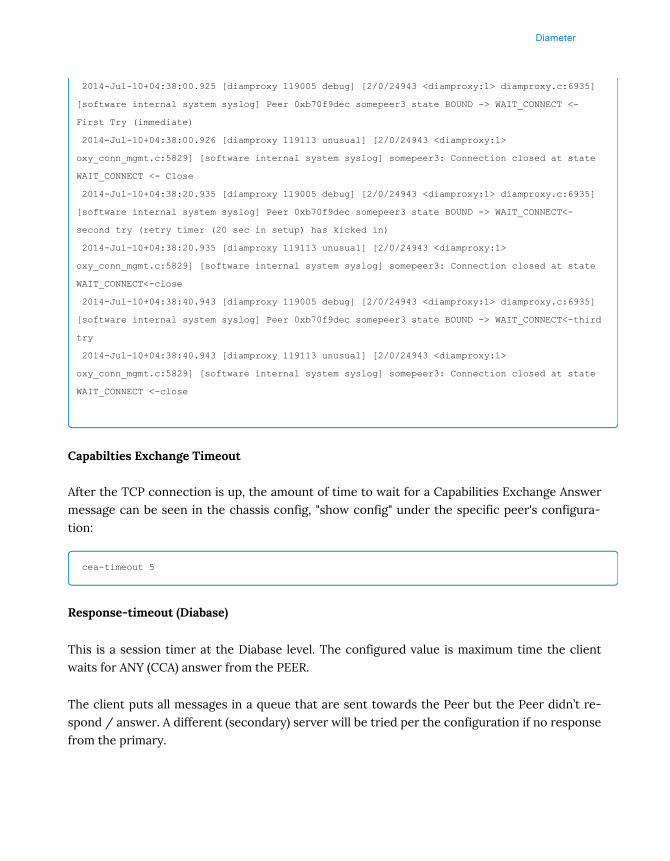
Diameter
2014-Jul-10+04:38:00.925 [diamproxy 119005 debug] [2/0/24943 <diamproxy:1> diamproxy.c:6935]
[software internal system syslog] Peer 0xb70f9dec somepeer3 state BOUND -> WAIT_CONNECT <-
First Try (immediate)
2014-Jul-10+04:38:00.926 [diamproxy 119113 unusual] [2/0/24943 <diamproxy:1>
oxy_conn_mgmt.c:5829] [software internal system syslog] somepeer3: Connection closed at state
WAIT_CONNECT <- Close
2014-Jul-10+04:38:20.935 [diamproxy 119005 debug] [2/0/24943 <diamproxy:1> diamproxy.c:6935]
[software internal system syslog] Peer 0xb70f9dec somepeer3 state BOUND -> WAIT_CONNECT<-
second try (retry timer (20 sec in setup) has kicked in)
2014-Jul-10+04:38:20.935 [diamproxy 119113 unusual] [2/0/24943 <diamproxy:1>
oxy_conn_mgmt.c:5829] [software internal system syslog] somepeer3: Connection closed at state
WAIT_CONNECT<-close
2014-Jul-10+04:38:40.943 [diamproxy 119005 debug] [2/0/24943 <diamproxy:1> diamproxy.c:6935]
[software internal system syslog] Peer 0xb70f9dec somepeer3 state BOUND -> WAIT_CONNECT<-third
try
2014-Jul-10+04:38:40.943 [diamproxy 119113 unusual] [2/0/24943 <diamproxy:1>
oxy_conn_mgmt.c:5829] [software internal system syslog] somepeer3: Connection closed at state
WAIT_CONNECT <-close
Capabilties Exchange Timeout
After the TCP connection is up, the amount of time to wait for a Capabilities Exchange Answermessage can be seen in the chassis config, "show config" under the specific peer's configura-tion:
cea-timeout 5
Response-timeout (Diabase)
This is a session timer at the Diabase level. The configured value is maximum time the clientwaits for ANY (CCA) answer from the PEER.
The client puts all messages in a queue that are sent towards the Peer but the Peer didn’t re-spond / answer. A different (secondary) server will be tried per the configuration if no responsefrom the primary.
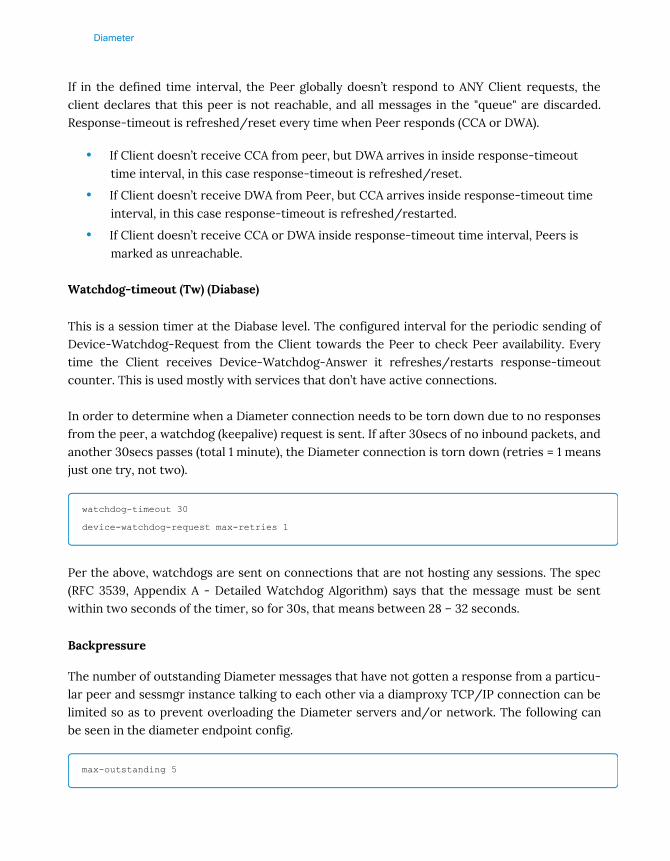
Diameter
If in the defined time interval, the Peer globally doesn’t respond to ANY Client requests, theclient declares that this peer is not reachable, and all messages in the "queue" are discarded.Response-timeout is refreshed/reset every time when Peer responds (CCA or DWA).
• If Client doesn’t receive CCA from peer, but DWA arrives in inside response-timeouttime interval, in this case response-timeout is refreshed/reset.
• If Client doesn’t receive DWA from Peer, but CCA arrives inside response-timeout timeinterval, in this case response-timeout is refreshed/restarted.
• If Client doesn’t receive CCA or DWA inside response-timeout time interval, Peers ismarked as unreachable.
Watchdog-timeout (Tw) (Diabase)
This is a session timer at the Diabase level. The configured interval for the periodic sending ofDevice-Watchdog-Request from the Client towards the Peer to check Peer availability. Everytime the Client receives Device-Watchdog-Answer it refreshes/restarts response-timeoutcounter. This is used mostly with services that don’t have active connections.
In order to determine when a Diameter connection needs to be torn down due to no responsesfrom the peer, a watchdog (keepalive) request is sent. If after 30secs of no inbound packets, andanother 30secs passes (total 1 minute), the Diameter connection is torn down (retries = 1 meansjust one try, not two).
watchdog-timeout 30
device-watchdog-request max-retries 1
Per the above, watchdogs are sent on connections that are not hosting any sessions. The spec(RFC 3539, Appendix A - Detailed Watchdog Algorithm) says that the message must be sentwithin two seconds of the timer, so for 30s, that means between 28 – 32 seconds.
Backpressure
The number of outstanding Diameter messages that have not gotten a response from a particu-lar peer and sessmgr instance talking to each other via a diamproxy TCP/IP connection can belimited so as to prevent overloading the Diameter servers and/or network. The following canbe seen in the diameter endpoint config.
max-outstanding 5
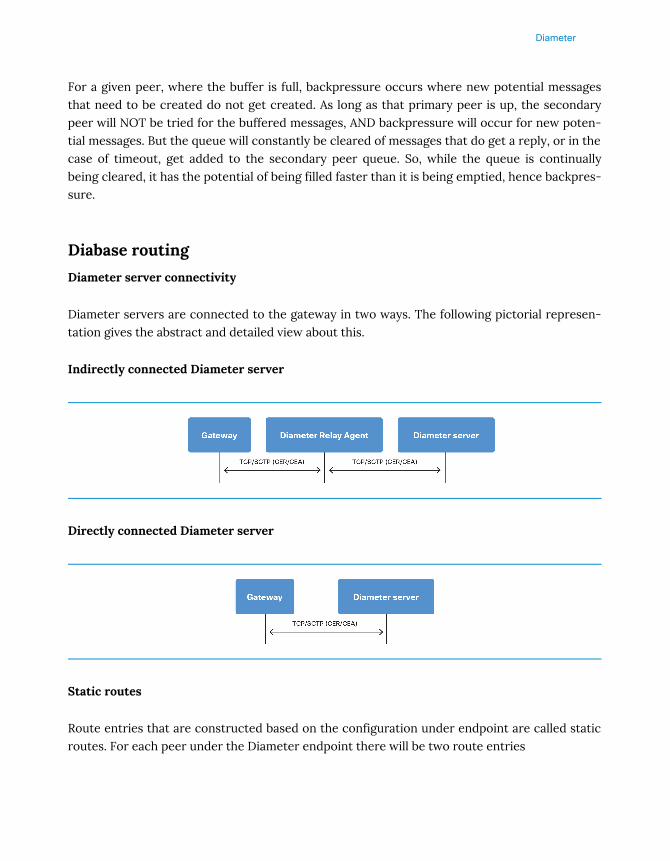
Diameter
For a given peer, where the buffer is full, backpressure occurs where new potential messagesthat need to be created do not get created. As long as that primary peer is up, the secondarypeer will NOT be tried for the buffered messages, AND backpressure will occur for new poten-tial messages. But the queue will constantly be cleared of messages that do get a reply, or in thecase of timeout, get added to the secondary peer queue. So, while the queue is continuallybeing cleared, it has the potential of being filled faster than it is being emptied, hence backpres-sure.
Diabase routing
Diameter server connectivity
Diameter servers are connected to the gateway in two ways. The following pictorial represen-tation gives the abstract and detailed view about this.
Indirectly connected Diameter server
Directly connected Diameter server
Static routes
Route entries that are constructed based on the configuration under endpoint are called staticroutes. For each peer under the Diameter endpoint there will be two route entries

Diameter
Config: peer dra1 realm cisco.com address 192.168.10.1 port 3867
The first route entry is called directly connected route as the host is directly attached.
The second route entry is called realm based route as the host is wild carded here. This is alsocalled wild carded route.
Config:
route-entry host DS1 realm cisco.com peer dra1
Dynamic routes:
Route entries that are dynamically learnt from the response messages from the peer are calleddynamic routes. Consider the following Diameter server connection.
Flag Host Peer Explanation
S [email protected] dra1 To reach the Diameter entity dra1, Gateway should send themessage to dra1
S *@cisco.com dra1 To reach any Diameter entity in realm “cisco.com”, Gatewaycan send the message to dra1.
Flag Host Peer Explanation
S DS1@ cisco.com dra1 To reach the Diameter entity DS1, Gateway should send themessage to dra1
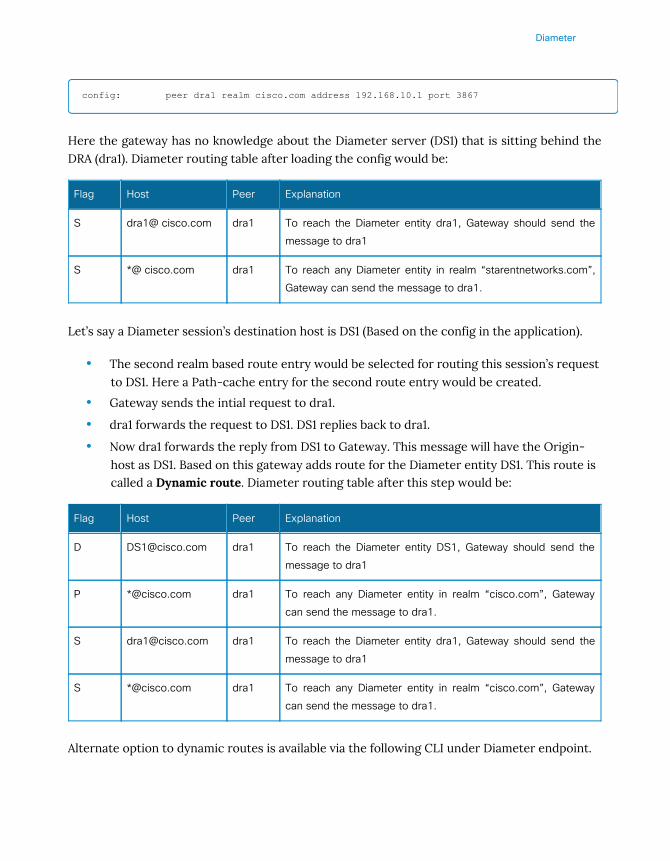
Diameter
config: peer dra1 realm cisco.com address 192.168.10.1 port 3867
Here the gateway has no knowledge about the Diameter server (DS1) that is sitting behind theDRA (dra1). Diameter routing table after loading the config would be:
Let’s say a Diameter session’s destination host is DS1 (Based on the config in the application).
• The second realm based route entry would be selected for routing this session’s requestto DS1. Here a Path-cache entry for the second route entry would be created.
• Gateway sends the intial request to dra1.
• dra1 forwards the request to DS1. DS1 replies back to dra1.
• Now dra1 forwards the reply from DS1 to Gateway. This message will have the Origin-host as DS1. Based on this gateway adds route for the Diameter entity DS1. This route iscalled a Dynamic route. Diameter routing table after this step would be:
Alternate option to dynamic routes is available via the following CLI under Diameter endpoint.
Flag Host Peer Explanation
S dra1@ cisco.com dra1 To reach the Diameter entity dra1, Gateway should send themessage to dra1
S *@ cisco.com dra1 To reach any Diameter entity in realm “starentnetworks.com”,Gateway can send the message to dra1.
Flag Host Peer Explanation
D [email protected] dra1 To reach the Diameter entity DS1, Gateway should send themessage to dra1
P *@cisco.com dra1 To reach any Diameter entity in realm “cisco.com”, Gatewaycan send the message to dra1.
S [email protected] dra1 To reach the Diameter entity dra1, Gateway should send themessage to dra1
S *@cisco.com dra1 To reach any Diameter entity in realm “cisco.com”, Gatewaycan send the message to dra1.
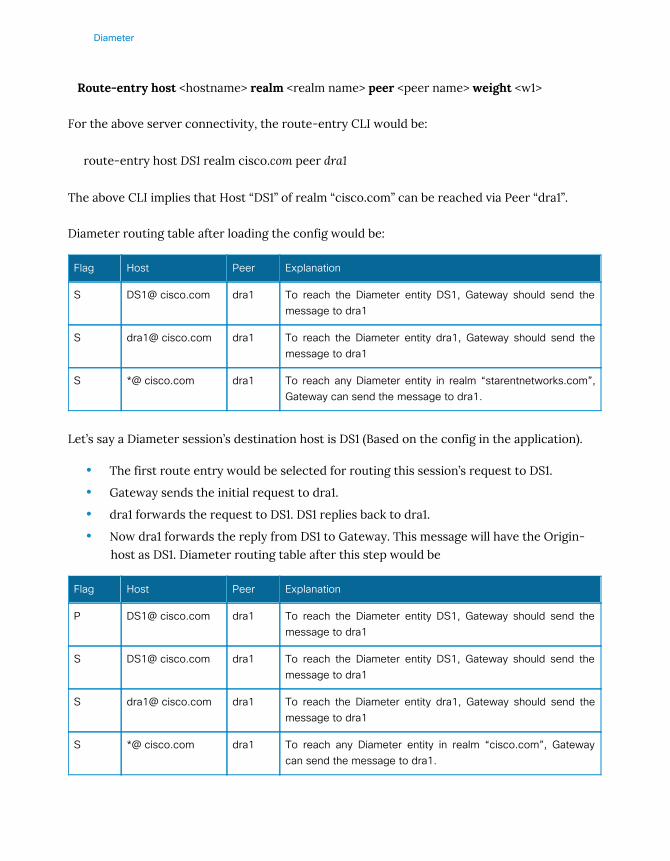
Diameter
Route-entry host <hostname> realm <realm name> peer <peer name> weight <w1>
For the above server connectivity, the route-entry CLI would be:
route-entry host DS1 realm cisco.com peer dra1
The above CLI implies that Host “DS1” of realm “cisco.com” can be reached via Peer “dra1”.
Diameter routing table after loading the config would be:
Let’s say a Diameter session’s destination host is DS1 (Based on the config in the application).
• The first route entry would be selected for routing this session’s request to DS1.
• Gateway sends the initial request to dra1.
• dra1 forwards the request to DS1. DS1 replies back to dra1.
• Now dra1 forwards the reply from DS1 to Gateway. This message will have the Origin-host as DS1. Diameter routing table after this step would be
Flag Host Peer Explanation
S DS1@ cisco.com dra1 To reach the Diameter entity DS1, Gateway should send themessage to dra1
S dra1@ cisco.com dra1 To reach the Diameter entity dra1, Gateway should send themessage to dra1
S *@ cisco.com dra1 To reach any Diameter entity in realm “starentnetworks.com”,Gateway can send the message to dra1.
Flag Host Peer Explanation
P DS1@ cisco.com dra1 To reach the Diameter entity DS1, Gateway should send themessage to dra1
S DS1@ cisco.com dra1 To reach the Diameter entity DS1, Gateway should send themessage to dra1
S dra1@ cisco.com dra1 To reach the Diameter entity dra1, Gateway should send themessage to dra1
S *@ cisco.com dra1 To reach any Diameter entity in realm “cisco.com”, Gatewaycan send the message to dra1.
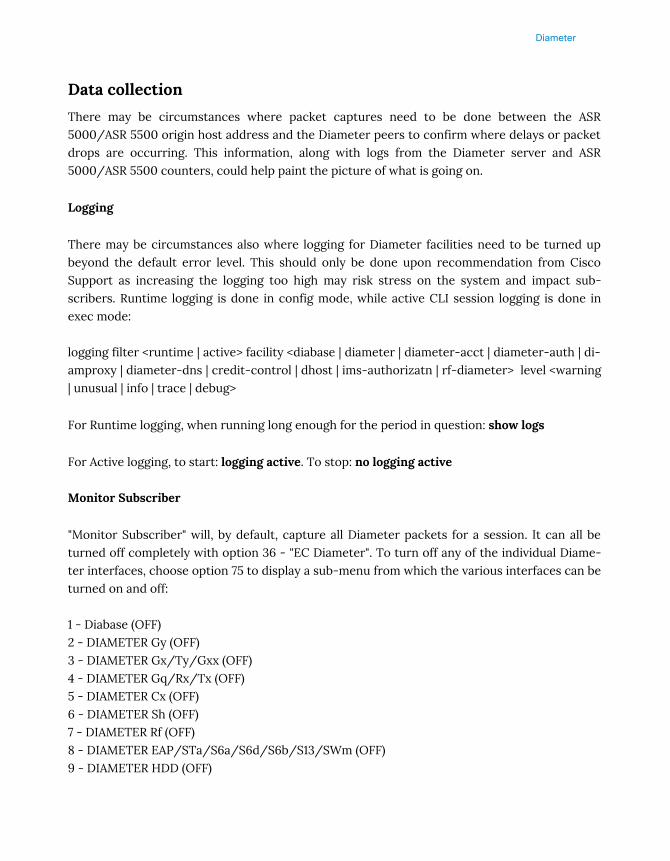
Diameter
Data collection
There may be circumstances where packet captures need to be done between the ASR5000/ASR 5500 origin host address and the Diameter peers to confirm where delays or packetdrops are occurring. This information, along with logs from the Diameter server and ASR5000/ASR 5500 counters, could help paint the picture of what is going on.
Logging
There may be circumstances also where logging for Diameter facilities need to be turned upbeyond the default error level. This should only be done upon recommendation from CiscoSupport as increasing the logging too high may risk stress on the system and impact sub-scribers. Runtime logging is done in config mode, while active CLI session logging is done inexec mode:
logging filter <runtime | active> facility <diabase | diameter | diameter-acct | diameter-auth | di-amproxy | diameter-dns | credit-control | dhost | ims-authorizatn | rf-diameter> level <warning| unusual | info | trace | debug>
For Runtime logging, when running long enough for the period in question: show logs
For Active logging, to start: logging active. To stop: no logging active
Monitor Subscriber
"Monitor Subscriber" will, by default, capture all Diameter packets for a session. It can all beturned off completely with option 36 - "EC Diameter". To turn off any of the individual Diame-ter interfaces, choose option 75 to display a sub-menu from which the various interfaces can beturned on and off:
1 - Diabase (OFF)2 - DIAMETER Gy (OFF)3 - DIAMETER Gx/Ty/Gxx (OFF)4 - DIAMETER Gq/Rx/Tx (OFF)5 - DIAMETER Cx (OFF)6 - DIAMETER Sh (OFF)7 - DIAMETER Rf (OFF)8 - DIAMETER EAP/STa/S6a/S6d/S6b/S13/SWm (OFF)9 - DIAMETER HDD (OFF)

Diameter
Turning up the verbosity can be helpful in certain situations, but Verbosity 2 should sufficemost of the time.
Monitor Protocol
"Monitor Protocol" using option 36 will capture all Diameter packets, or use option 75 and thesubmenu that follows to choose the specific Diameter interface being troubleshot. Nonethe-less, this must be used with care in a live network as it will easily miss packets under load andcause undo strain.
Logging Monitor
Logging monitor for a specific subscriber for which an issue is reproducible might also be use-ful in order to see underlying messages that would not be displayed by monitor subscriber.
Bulkstats
The most extensive and granular way to gather statistics over a given time period is bulkstats.The following are some of the defined schemas related to Diameter, and the variable definitionscan be found in the documentation: System, DCCA, Diameter Accounting, Diameter Authenti-cation, IMSA
The System schema contains data for many areas besides Diameter. It is broken down into sep-arate schemas in the configuration and Diameter-related variables can be found in more thanone schema. Search for “diam” in the System Schema Stats chapter of the documentation forvariables related to Diameter, and then search for those variables in the config to see whichschema they are listed under.
Packet Captures
Packet captures may be needed for troubleshooting the TCP/IP transport packets to setup andteardown Diameter connections as this is not available in any monitoring or CLI commands.Some counters in “show diameter stat proxy [endpoint <endpoint>] debug-info” will displayvaluable information, but they still don’t indicate what is on the wire or what may be causingthe behavior observed. Packet captures can also be helpful for analyzing when unexpected, un-known, or corrupted AVPs are received.
ASR 5000/ASR 5500 have a tcpdump facility in debug mode (will require CLI test-commandspassword) that can be used to capture packets according to various criteria. While user data
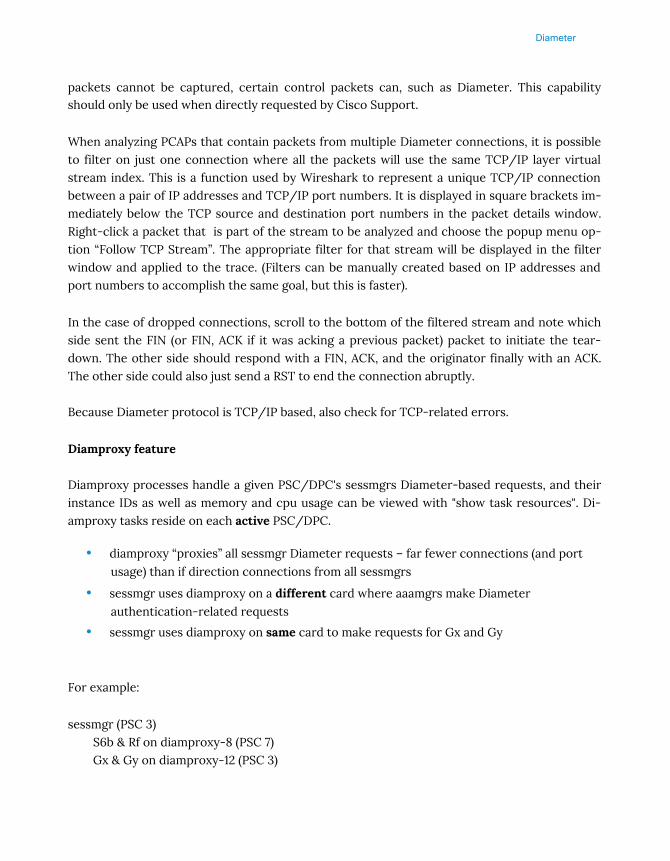
Diameter
packets cannot be captured, certain control packets can, such as Diameter. This capabilityshould only be used when directly requested by Cisco Support.
When analyzing PCAPs that contain packets from multiple Diameter connections, it is possibleto filter on just one connection where all the packets will use the same TCP/IP layer virtualstream index. This is a function used by Wireshark to represent a unique TCP/IP connectionbetween a pair of IP addresses and TCP/IP port numbers. It is displayed in square brackets im-mediately below the TCP source and destination port numbers in the packet details window.Right-click a packet that is part of the stream to be analyzed and choose the popup menu op-tion “Follow TCP Stream”. The appropriate filter for that stream will be displayed in the filterwindow and applied to the trace. (Filters can be manually created based on IP addresses andport numbers to accomplish the same goal, but this is faster).
In the case of dropped connections, scroll to the bottom of the filtered stream and note whichside sent the FIN (or FIN, ACK if it was acking a previous packet) packet to initiate the tear-down. The other side should respond with a FIN, ACK, and the originator finally with an ACK.The other side could also just send a RST to end the connection abruptly.
Because Diameter protocol is TCP/IP based, also check for TCP-related errors.
Diamproxy feature
Diamproxy processes handle a given PSC/DPC's sessmgrs Diameter-based requests, and theirinstance IDs as well as memory and cpu usage can be viewed with "show task resources". Di-amproxy tasks reside on each active PSC/DPC.
• diamproxy “proxies” all sessmgr Diameter requests – far fewer connections (and portusage) than if direction connections from all sessmgrs
• sessmgr uses diamproxy on a different card where aaamgrs make Diameterauthentication-related requests
• sessmgr uses diamproxy on same card to make requests for Gx and Gy
For example:
sessmgr (PSC 3) S6b & Rf on diamproxy-8 (PSC 7) Gx & Gy on diamproxy-12 (PSC 3)

Diameter
[PGWin]PGW# show task resources facility diamproxy all
task cputime memory files sessions
cpu facility inst used allc used alloc used allc used allc Sstatus
----------------------- --------- ------------- --------- ------------- ------
2/0 diamproxy 11 1.8% 50% 11.3M 100.0M 258 1000 -- -- - good
3/0 diamproxy 12 1.7% 50% 11.3M 100.0M 255 1000 -- -- - good
4/0 diamproxy 5 1.8% 50% 11.1M 100.0M 288 1000 -- -- - good
5/0 diamproxy 1 2.0% 50% 11.2M 100.0M 248 1000 -- -- - good
6/0 diamproxy 9 1.9% 50% 11.3M 100.0M 260 1000 -- -- - good
7/0 diamproxy 8 1.9% 50% 11.2M 100.0M 255 1000 -- -- - good
10/0 diamproxy 10 1.9% 50% 11.1M 100.0M 240 1000 -- -- - good
11/0 diamproxy 6 2.1% 50% 11.4M 100.0M 258 1000 -- -- - good
12/0 diamproxy 3 2.1% 50% 11.1M 100.0M 224 1000 -- -- - good
14/0 diamproxy 2 2.0% 50% 11.2M 100.0M 242 1000 -- -- - good
15/0 diamproxy 7 2.0% 50% 11.3M 100.0M 257 1000 -- -- - good
16/0 diamproxy 4 2.0% 50% 11.2M 100.0M 136 1000 -- -- - good
Total 12 23.6% - 134.6M -- 2921 - 0
Session Disconnect Reasons
This is the general command to see reasons for call failures (setup and teardown). This com-mand will tell why calls disconnected or failed to setup. Following is a subset of reasons thatcould be related to Diameter.
[local]PGW# show sess disconnect-reasons
Session Disconnect Statistics
Total Disconnects: 598231358
Disconnect Reason Num Disc Percentage
----------------------------------------------------- ---------- ----------
Admin-disconnect 801121 0.13391
Remote-disconnect 236090433 39.46474
Session-setup-timeout 219129 0.03663
Local-purge 89951324 15.03621
Admin-AAA-disconnect 796685 0.13317
Diameter
failed-auth-with-charging-svc 117536 0.01965
gtp-user-auth-failed 175798 0.02939
ims-authorization-failed 170688 0.02853
ims-authorization-revoked 71433 0.01194
ims-auth-decision-invalid 24 0.00000
Re-Auth-failed 20981 0.00351
disconnect-from-policy-server 2 0.00000
s6b-auth-failed 103351 0.01728
aaa-unreachable 811 0.00014
Diameter session IDs
The Diameter session ID which is a part of all Diameter protocol messages contains long se-quences of digits that encapsulate the time the subscriber connected, the sessmgr instance ID,etc. This can be valuable when trying to identify which subscriber a packet is associated with,as well as troubleshooting other difficult issues. Here is an example of Diameter session id bro-ken down:
Session-Id:0004-diamproxy.test.com;570906393;11823987;52377bbc-7303
• The first field: 0004-diamproxy.test.com is the name of the Diameter endpoint and localDiameter proxy task being used to communicate with that endpoint.
• The second field: 570906393 is a decimal notation of the hexadecimal callid. Convert570906393 to hex and get 0x22075719
• The third field: 11823987 is an internal session number
• The fourth field: 52377bbc is the Epoch time that the session was created.
• The fifth field: 7303 is the sessmgr instance, in the first two (or 3) digits are the sessmgrinstance id. The 73 has to be converted from hex, which in this case means the sessmgrinstance is 115 decimal. The last two digits (03) in this case can be ignored for thepurposes of this material.

Diameter
Policy Control - Gx
Overview
This section covers Diameter Policy Control over Gx interface and basic troubleshooting com-mands with multiple examples. Policy Control is the process whereby the PCRF indicates to thePCEF/GGSN/PGW how to control the IP-CAN (connectivity access network) bearer/session.
Classifications
Policy-Control can be classified and defined as below:
• Bearer Binding : Association between a service data flow and the IP-CAN bearertransporting that service data flow.
• Gating Control : Blocking or allowing of packets, belonging to a service data flow, topass through to the desired endpoint.
• Event Reporting : Notification of, and reaction to, application events to trigger newbehavior in the user plane as well as the reporting of events related to the resources inthe GW (PCEF),
• QOS Control : The authorization and enforcement of the maximum QoS that isauthorized for a service data flow or an IP CAN bearer or APN, IP-CAN bearerestablishment for IP-CANs that support network initiated procedures for IP CAN bearerestablishment.
For session establishment and policy control over Gx, the following messages are used:
Initiated from PCEF to PCRF (PULL):
• CCR-I : Initialization of session from PCEF to PCRF, exchange of session informationfrom subscriber, and all relevant information that PCRF might use to determine logicand policies that will apply. There is one Gx CCR-I per IP-CAN session (example forprimary and all secondary PDP context or Default bearers plus all Dedicated bearers).
• CCA-I : PCRF’s answer to CCR-I request. In this message PCRF includes result-codethat defines if authorization is successful, or not. Also with authorization for session,PCRF provides a set of attributes that PCEF should enforce to subscriber’s session.
Diameter
Result code: defining if PCRF accepts session or terminates it. Valid codes andexpected causes are reused from 3GPP 29.212, RFC 4006 and RFC 3588.
QoS change: and THP/ARP setting change for session
Event trigger provisioning : setting monitoring points triggers for which PCRFwants to be notified from PCEF
PCC rule and/or group of PPC rules install/remove commands:activating/deactivating pre-defined dynamic rules on PCEF, with option to setpredefined future time of automatic activation and deactivation.
Volume monitoring and reporting: Setting up thresholds for monitoring keys,which enables PCEF to count and report counted volume per Service Data Flow (orset of SDFs) or for entire session.
• CCR-U : PCEF sends update for session, based on one of the triggers that PCRF setduring session initialization. Update message is sent together with trigger that causedthis update message, and with attributes that are related to the change, for examplenew RAT TYPE, new QOS, Usage-Report due to Volume monitoring threshold exceeded,access network gateway (e.g. SGW/SGSN) change or Revalidation timer.
• CCA-U : PCRF answer to CCR-U request. In this message PCRF has full control todeny/modify policies on PCEF for subscriber session, by setting up result-code andprovisioning any of the rules and applicable modifications with same procedure as inINIT message (Changing QoS, Setting new event-triggers, installing new rules, settingup or discarding volume monitoring).
• CCR-T : PCEF sends TERMINATE request when subscriber session is closed, due to anyreason (UE PDP disconnection, or administrative disconnect by other entity). Intermination request message, PCEF reports termination-reason, and also anyoutstanding information that was valid at session termination stage (Like reportingused volume or active volume-monitoring threshold).
• CCA-T : PCRF answer to CCR-T request which just acknowledges that the request hasbeen processed. Failure to send a CCA-T can cause the PCEF to retransmit the CCR-Tto a secondary PCRF.
Initiated from PCRF to PCEF (PUSH):
• RAR : PCRF can initiate change by itself using Re-Authorization-Request. Unlike Gy andDiameter Credit Control, this message does not trigger a CCR-U, but instead this isused when PCRF needs to modify session policy control during active session. WithRAR, PCRF can push new policy attributes like an INIT response and UPDATE responsemessages, and also PCRF can request explicit volume usage-report.
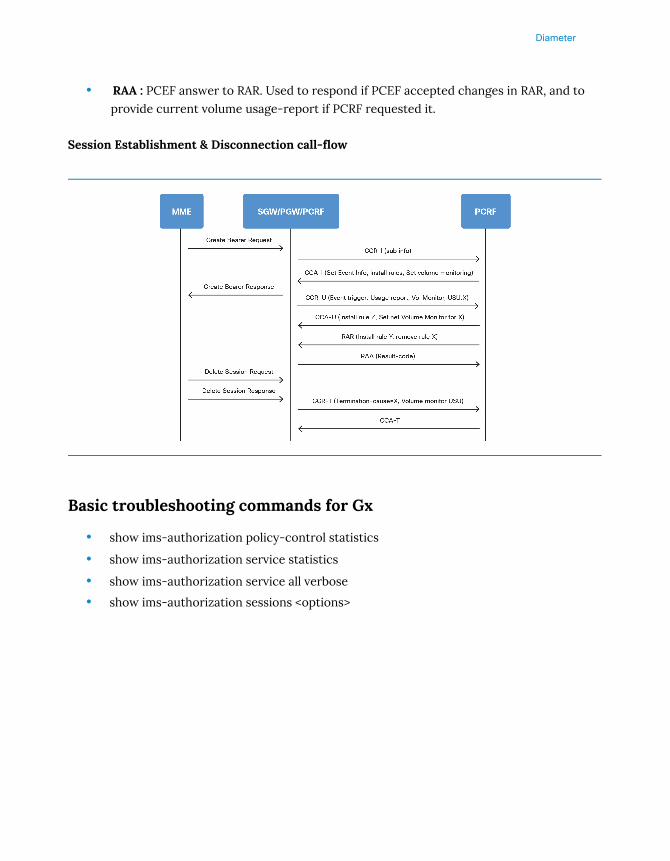
Diameter
• RAA : PCEF answer to RAR. Used to respond if PCEF accepted changes in RAR, and toprovide current volume usage-report if PCRF requested it.
Session Establishment & Disconnection call-flow
Basic troubleshooting commands for Gx
• show ims-authorization policy-control statistics
• show ims-authorization service statistics
• show ims-authorization service all verbose
• show ims-authorization sessions <options>
Diameter
Gx session failure-handling
Failure Handling Procedure for Gx can be invoked under the following scenarios:
1 DIABASE ERROR:
This happens in the path of the request, mainly due to socket-based errors like link
failure which happens when the server goes down.
2 2. APPLICATION BASED TIMER:
Default value "diameter request-timeout 10" inside ims-auth-service / policy-control
3 RESPONSE TIMEOUT:
Default value "response-timeout 60" inside diameter endpoint configuration
The following table explains the StarOS failure-handling logic for Gx:

Even
tC
CR
Mes
sage
Ty
pe
Failu
re H
an-
dlin
g Se
tting
Fa
ilure
Han
-dl
ing
Con
fig
Seco
ndar
y se
rver
con
figur
ed
and
activ
e Se
cond
ary
serv
er n
ot c
onfi-
gure
d or
its
dow
n Se
cond
ary
Serv
er N
ot R
espo
n-di
ng
Sess
ion
Esta
blis
h-m
ent
Initi
alC
ontin
uefa
ilure
-han
-dl
ing
cc-
requ
est-
type
in
itial
-re-
ques
t
<fai
lure
_ha
ndlin
g_ac
-tio
n>
Retry
hap
pens
to th
e se
cond
ary
serv
er c
ontin
ues
with
ses
sion
es
tabl
ishm
ent.
1. N
o fu
rther
mes
sagi
ng w
ith
PCRF
and
no
diam
eter
ses
sion
is
esta
blis
hed.
2.
The
imsa
ses
sion
is d
elet
ed
but t
he c
all i
s no
t bro
ught
dow
n.
Sam
e be
havi
or a
s in
the
case
of
serv
er d
own
but t
his
is d
etec
t-ed
afte
r the
app
licat
ion
timeo
ut
valu
e of
10
seco
nds
or th
e en
dpoi
nt le
vel r
espo
nse
timeo
ut
valu
e w
hich
ever
hap
pens
firs
tRe
-try
-and
-Ter
-m
inat
e
Retry
hap
pens
to th
e se
cond
ary
serv
er a
nd c
ontin
ues
with
ses
-si
on e
stab
lishm
ent.
The
call
is b
roug
ht d
own
by
initi
atin
g a
dele
te P
DP
with
te
ardo
wn
indi
cato
r whi
ch b
rings
do
wn
all t
he s
essi
ons.
Sam
e be
havi
or a
s in
the
case
of
serv
er d
own
but t
his
is d
etec
t-ed
afte
r the
app
licat
ion
timeo
ut
valu
e of
10
seco
nds
or th
e en
dpoi
nt le
vel r
espo
nse
timeo
ut
valu
e w
hich
ever
hap
pens
firs
tTe
rmin
ate
The
call
is b
roug
ht d
own
by
initi
atin
g a
dele
te P
DP
with
te
ardo
wn
indi
cato
r whi
ch b
rings
do
wn
all t
he s
essi
ons.
NA
NA
Sess
ion
Mod
ifica
-tio
n
Upd
ate
Con
tinue
failu
re-h
an-
dlin
g cc
-re
ques
t-ty
pe
upda
te-r
e-qu
est
<f
ailu
re_
hand
ling_
ac-
tion>
Retry
hap
pens
to th
e se
cond
ary
serv
er a
nd c
ontin
ues
with
ses
-si
on m
odifi
catio
n.
1. N
o fu
rther
mes
sagi
ng w
ith
PCRF
and
no
diam
eter
ses
sion
is
esta
blis
hed.
2. T
he im
sa s
essi
on is
not
de-
lete
d an
d th
e ca
ll is
not
bro
ught
do
wn.
Sam
e be
havi
or a
s in
the
case
of
serv
er d
own
but t
his
is d
etec
t-ed
afte
r the
app
licat
ion
timeo
ut
valu
e of
10
seco
nds
or th
e en
dpoi
nt le
vel r
espo
nse
timeo
ut
valu
e w
hich
ever
hap
pens
firs
tRe
-try
-and
-Ter
-m
inat
e
Retry
hap
pens
to th
e se
cond
ary
serv
er a
nd c
ontin
ues
with
ses
-si
on m
odifi
catio
n.
The
call
is b
roug
ht d
own
by
initi
atin
g a
dele
te P
DP
with
te
ardo
wn
indi
cato
r whi
ch b
rings
do
wn
all t
he s
essi
ons.
Sam
e be
havi
or a
s in
the
case
of
serv
er d
own
but t
his
is d
etec
t-ed
afte
r the
app
licat
ion
timeo
ut
valu
e of
10
seco
nds
or th
e en
dpoi
nt le
vel r
espo
nse
timeo
ut
valu
e w
hich
ever
hap
pens
firs
tTe
rmin
ate
The
call
is b
roug
ht d
own
by
initi
atin
g a
dele
te P
DP
with
te
ardo
wn
indi
cato
r whi
ch b
rings
do
wn
all t
he s
essi
ons.
NA
NA
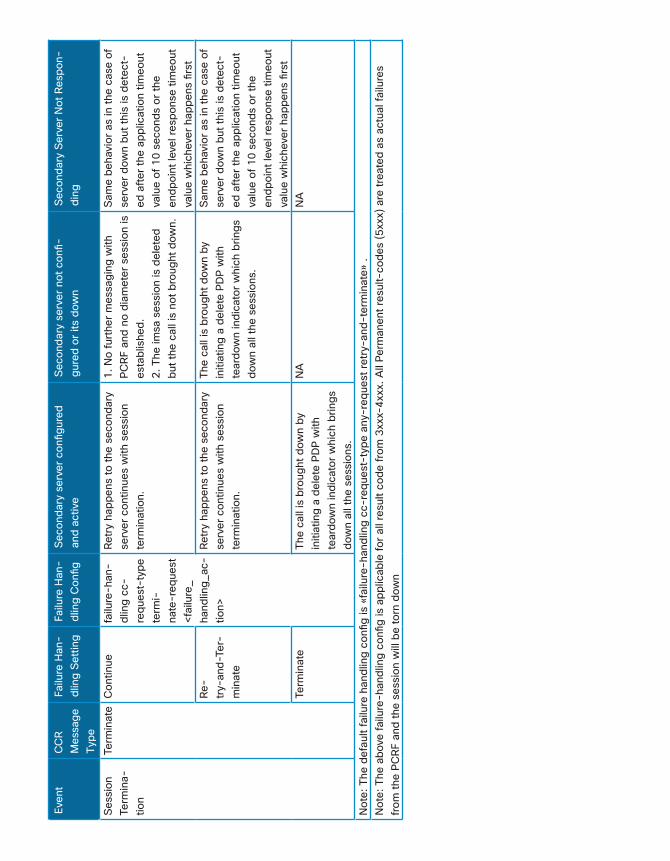
Even
tC
CR
Mes
sage
Ty
pe
Failu
re H
an-
dlin
g Se
tting
Fa
ilure
Han
-dl
ing
Con
fig
Seco
ndar
y se
rver
con
figur
ed
and
activ
e Se
cond
ary
serv
er n
ot c
onfi-
gure
d or
its
dow
n Se
cond
ary
Serv
er N
ot R
espo
n-di
ng
Sess
ion
Term
ina-
tion
Term
inat
eC
ontin
uefa
ilure
-han
-dl
ing
cc-
requ
est-
type
te
rmi-
nate
-req
uest
<f
ailu
re_
hand
ling_
ac-
tion>
Retry
hap
pens
to th
e se
cond
ary
serv
er c
ontin
ues
with
ses
sion
te
rmin
atio
n.
1. N
o fu
rther
mes
sagi
ng w
ith
PCRF
and
no
diam
eter
ses
sion
is
esta
blis
hed.
2. T
he im
sa s
essi
on is
del
eted
bu
t the
cal
l is
not b
roug
ht d
own.
Sam
e be
havi
or a
s in
the
case
of
serv
er d
own
but t
his
is d
etec
t-ed
afte
r the
app
licat
ion
timeo
ut
valu
e of
10
seco
nds
or th
e en
dpoi
nt le
vel r
espo
nse
timeo
ut
valu
e w
hich
ever
hap
pens
firs
tRe
-try
-and
-Ter
-m
inat
e
Retry
hap
pens
to th
e se
cond
ary
serv
er c
ontin
ues
with
ses
sion
te
rmin
atio
n.
The
call
is b
roug
ht d
own
by
initi
atin
g a
dele
te P
DP
with
te
ardo
wn
indi
cato
r whi
ch b
rings
do
wn
all t
he s
essi
ons.
Sam
e be
havi
or a
s in
the
case
of
serv
er d
own
but t
his
is d
etec
t-ed
afte
r the
app
licat
ion
timeo
ut
valu
e of
10
seco
nds
or th
e en
dpoi
nt le
vel r
espo
nse
timeo
ut
valu
e w
hich
ever
hap
pens
firs
tTe
rmin
ate
The
call
is b
roug
ht d
own
by
initi
atin
g a
dele
te P
DP
with
te
ardo
wn
indi
cato
r whi
ch b
rings
do
wn
all t
he s
essi
ons.
NA
NA
Not
e: T
he d
efau
lt fa
ilure
han
dlin
g co
nfig
is «
failu
re-h
andl
ing
cc-r
eque
st-t
ype
any-
requ
est r
etry
-and
-ter
min
ate»
.N
ote:
The
abo
ve fa
ilure
-han
dlin
g co
nfig
is a
pplic
able
for a
ll re
sult
code
from
3xx
x-4x
xx. A
ll Pe
rman
ent r
esul
t-co
des
(5xx
x) a
re tr
eate
d as
act
ual f
ailu
res
from
the
PCRF
and
the
sess
ion
will
be
torn
dow
n

Diameter
Example Scenarios
PCRF change where some subscribers cannot establish a data call
Problem Observed:
Mobile operator noticed that after activating a new use case on the PCRF that some subscriberscan't establish a data call.
Logs collection:
• monitor subscriber <imsi> with verbosity 3
Analysis:
1 In "monitor subscriber" the PCRF wants to install a new rulebase. After receiving this
CCA-I, the GGSN disconnects the session with cause "No resources".
----------------------------------------------------------------------
Incoming Call:
----------------------------------------------------------------------
MSID/IMSI : 450061234554321 Callid : 00004e22
IMEI : n/a MSISDN : 64211234567
Username : 64211234567 SessionType : ggsn-pdp-type-ipv4
Status : Active Service Name: GGSN-SVC
Src Context : Gn
----------------------------------------------------------------------
INBOUND>>>>> 15:49:03:249 Eventid:47000(3)
GTPC Rx PDU, from 192.168.2.138:2123 to 192.168.2.1:2123 (191)
TEID: 0x00000000, Message type: GTP_CREATE_PDP_CONTEXT_REQ_MSG (0x10)
Sequence Number:: 0x7FFF (32767)
GTP HEADER FOLLOWS:
Version number: 1
Protocol type: 1 (GTP C/U)
Extended header flag: Not present
Sequence number flag: Present

Diameter
NPDU number flag: Not present
Message Type: 0x10 (GTP_CREATE_PDP_CONTEXT_REQ_MSG)
Message Length: 0x00B7 (183)
Tunnel ID: 0x00000000
Sequence Number: 0x7FFF (32767)
GTP HEADER ENDS.
INFORMATION ELEMENTS FOLLOW:
IMSI: 450061234554321
Recovery: 0x07 (7)
Selection Mode: 0x0 (MS or network provided APN, subscribed verified
(Subscribed))
Tunnel ID Data I: 0x00000400
Tunnel ID Control I: 0x00000400
NSAPI: 0x05 (5)
CHARGING CHARACTERISTIC FOLLOWS:
Charging Chars # 1: 0x0800 (Normal)
CHARGING CHARACTERISTIC ENDS.
END USER ADDRESS FOLLOWS:
PDP Type Organisation: IETF
PDP Type Number: IPv4
Address: Empty
END USER ADDRESS ENDS.
Access Point Name: ecs-apn
PROTOCOL CONFIG. OPTIONS FOLLOW:
IE Length: 0x59 (89)
Configuration Protocol: (0) PPP
Extension Bit: (1)
Protocol id: 0xC021 (LCP)
Protocol length: 0x0E (14)
Protocol contents: 0103000E0506088AA1020304C023
Protocol id: 0xC021 (LCP)
Protocol length: 0x0E (14)
Protocol contents: 0203000E0506088AA1020304C023
Protocol id: 0xC023 (PAP)
Protocol length: 0x1A (26)
Protocol contents: 0104001A0874657374757365720C7465737470617373776F7264
Protocol id: 0x8021 (IPCP)

Diameter
Protocol length: 0x16 (22)
Protocol contents: 01010016030600000000810600000000830600000000
PROTOCOL CONFIG. OPTIONS END.
GSN Address I: 0xC0A8028A (192.168.2.138)
GSN Address II: 0xC0A8028A (192.168.2.138)
MSISDN: 64211234567
QOS Profile: 0x0122720D7396404886074048
COMMON FLAGS FOLLOW:
Prohibit Payload Compression: no
MBMS Service Type: Multicast Service
RAN Procedures Ready: no
MBMS Counting Information: no
No QoS negotiation: no
NRSN: no
Upgrade QoS Supported: yes
Dual Address Bearer Flag: no
COMMON FLAGS END.
INFORMATION ELEMENTS END.
<<<<OUTBOUND 15:49:03:256 Eventid:81990(5)
Diameter message from 192.168.1.1:33937 to 192.168.1.128:3868
Base Header Information:
Version: 1
Message Length: 732
Command Flags: REQ PXY (192)
Command Code: Credit-Control-Request (272)
Application ID: 3GPP-Gx (16777238)
Hop2Hop-ID: 0x00000298
End2End-ID: 0xd54aea6d
AVP Information:
[M] Session-Id: 0001-sessmgr.LAB-XT2;20002;513;554a702f-102
[M] Auth-Application-Id: 16777238
[M] Origin-Host: 0001-sessmgr.LAB-XT2
[M] Origin-Realm: lab.realm
[M] Destination-Realm: lab.realm
[M] CC-Request-Type: INITIAL_REQUEST (1)
[M] CC-Request-Number: 0
[M] Origin-State-Id: 1430920532

Diameter
[M] Subscription-Id:
[M] Subscription-Id-Type: END_USER_E164 (0)
[M] Subscription-Id-Data: 64211234567
[M] Subscription-Id:
[M] Subscription-Id-Type: END_USER_IMSI (1)
[M] Subscription-Id-Data: 450061234554321
[V] [M] Supported-Features:
[M] Vendor-Id: 10415
[V] Feature-List-ID: 1
[V] Feature-List: 1
[V] [M] Bearer-Identifier: 0x00000004
[V] [M] Bearer-Operation: ESTABLISHMENT (1)
[M] Framed-IP-Address: IPv4 172.16.0.8
[V] [M] IP-CAN-Type: 3GPP-GPRS (0)
[V] [M] QoS-Information:
[V] [M] QoS-Class-Identifier: QCI_8 (8)
[V] [M] Max-Requested-Bandwidth-UL: 64000
[V] [M] Max-Requested-Bandwidth-DL: 128000
[V] [M] Bearer-Identifier: 0x00000004
[V] [M] Allocation-Retention-Priority:
[V] [M] Priority-Level: 1
[V] [M] Pre-emption-Capability: PRE-EMPTION_CAPABILITY_DISABLED (1)
[V] [M] Pre-emption-Vulnerability: PRE-EMPTION_VULNERABILITY_ENABLED (0)
[V] [M] QoS-Upgrade: QoS_UPGRADE_SUPPORTED (1)
[V] [M] 3GPP-SGSN-MCC-MNC: 123456
[V] [M] 3GPP-SGSN-Address: IPv4 192.168.2.138
[V] [M] RAI: 123456FFFEFF
[V] [M] 3GPP-User-Location-Info: Location Type: RAI (2) Location Info (RAI): 123-456-
0xFFFE-0xFFFF
[M] Called-Station-Id: ecs-apn
[V] [M] Bearer-Usage: GENERAL (0)
[V] [M] Online: DISABLE_ONLINE (0)
[V] [M] Offline: DISABLE_OFFLINE (0)
[V] [M] Access-Network-Charging-Address: IPv4 192.168.2.1
[V] [M] Access-Network-Charging-Identifier-Gx:
[V] [M] Access-Network-Charging-Identifier-Value: 0x00000002
INBOUND>>>>> 15:49:03:257 Eventid:81991(5)
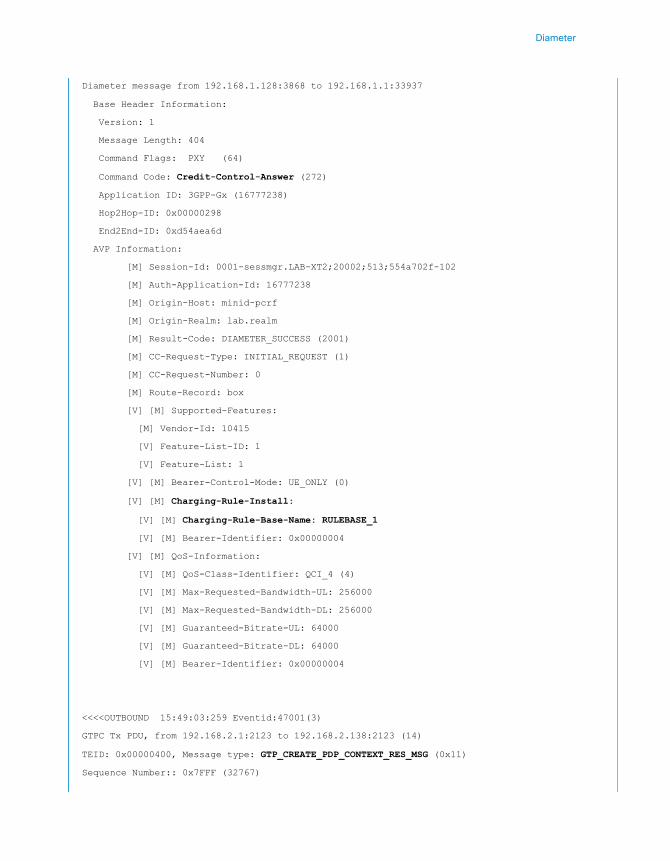
Diameter
Diameter message from 192.168.1.128:3868 to 192.168.1.1:33937
Base Header Information:
Version: 1
Message Length: 404
Command Flags: PXY (64)
Command Code: Credit-Control-Answer (272)
Application ID: 3GPP-Gx (16777238)
Hop2Hop-ID: 0x00000298
End2End-ID: 0xd54aea6d
AVP Information:
[M] Session-Id: 0001-sessmgr.LAB-XT2;20002;513;554a702f-102
[M] Auth-Application-Id: 16777238
[M] Origin-Host: minid-pcrf
[M] Origin-Realm: lab.realm
[M] Result-Code: DIAMETER_SUCCESS (2001)
[M] CC-Request-Type: INITIAL_REQUEST (1)
[M] CC-Request-Number: 0
[M] Route-Record: box
[V] [M] Supported-Features:
[M] Vendor-Id: 10415
[V] Feature-List-ID: 1
[V] Feature-List: 1
[V] [M] Bearer-Control-Mode: UE_ONLY (0)
[V] [M] Charging-Rule-Install:
[V] [M] Charging-Rule-Base-Name: RULEBASE_1
[V] [M] Bearer-Identifier: 0x00000004
[V] [M] QoS-Information:
[V] [M] QoS-Class-Identifier: QCI_4 (4)
[V] [M] Max-Requested-Bandwidth-UL: 256000
[V] [M] Max-Requested-Bandwidth-DL: 256000
[V] [M] Guaranteed-Bitrate-UL: 64000
[V] [M] Guaranteed-Bitrate-DL: 64000
[V] [M] Bearer-Identifier: 0x00000004
<<<<OUTBOUND 15:49:03:259 Eventid:47001(3)
GTPC Tx PDU, from 192.168.2.1:2123 to 192.168.2.138:2123 (14)
TEID: 0x00000400, Message type: GTP_CREATE_PDP_CONTEXT_RES_MSG (0x11)
Sequence Number:: 0x7FFF (32767)

Diameter
GTP HEADER FOLLOWS:
Version number: 1
Protocol type: 1 (GTP C/U)
Extended header flag: Not present
Sequence number flag: Present
NPDU number flag: Not present
Message Type: 0x11 (GTP_CREATE_PDP_CONTEXT_RES_MSG)
Message Length: 0x0006 (6)
Tunnel ID: 0x00000400
Sequence Number: 0x7FFF (32767)
GTP HEADER ENDS.
INFORMATION ELEMENTS FOLLOW:
Cause: 0xC7 (GTP_NO_RESOURCES_AVAILABLE)
INFORMATION ELEMENTS END.
<<<<OUTBOUND 15:49:03:279 Eventid:81990(5)
Diameter message from 192.168.1.1:33937 to 192.168.1.128:3868
Base Header Information:
Version: 1
Message Length: 352
Command Flags: REQ PXY (192)
Command Code: Credit-Control-Request (272)
Application ID: 3GPP-Gx (16777238)
Hop2Hop-ID: 0x00000299
End2End-ID: 0xd54aea6e
AVP Information:
[M] Session-Id: 0001-sessmgr.LAB-XT2;20002;513;554a702f-102
[M] Auth-Application-Id: 16777238
[M] Origin-Host: 0001-sessmgr.LAB-XT2
[M] Origin-Realm: lab.realm
[M] Destination-Realm: lab.realm
[M] CC-Request-Type: TERMINATION_REQUEST (3)
[M] CC-Request-Number: 1
[M] Destination-Host: minid-pcrf
[M] Origin-State-Id: 1430920532
[M] Subscription-Id:
[M] Subscription-Id-Type: END_USER_E164 (0)
[M] Subscription-Id-Data: 64211234567

Diameter
[M] Subscription-Id:
[M] Subscription-Id-Type: END_USER_IMSI (1)
[M] Subscription-Id-Data: 450061234554321
[M] Framed-IP-Address: IPv4 172.16.0.8
[M] Termination-Cause: DIAMETER_ADMINISTRATIVE (4)
[M] Called-Station-Id: ecs-apn
[V] [M] Access-Network-Charging-Address: IPv4 192.168.2.1
Wednesday May 06 2015
***CONTROL*** 15:49:03:279 Eventid:10285
CALL STATS: msisdn <64211234567>, apn <ecs-apn>, imsi <450061234554321>, Call-Duration(sec): 0
... Disconnect Reason: failed-auth-with-charging-svc
Last Progress State: IMS Authorized
INBOUND>>>>> 15:49:03:280 Eventid:81991(5)
Diameter message from 192.168.1.128:3868 to 192.168.1.1:33937
Base Header Information:
Version: 1
Message Length: 172
Command Flags: PXY (64)
Command Code: Credit-Control-Answer (272)
Application ID: 3GPP-Gx (16777238)
Hop2Hop-ID: 0x00000299
End2End-ID: 0xd54aea6e
AVP Information:
[M] Session-Id: 0001-sessmgr.LAB-XT2;20002;513;554a702f-102
[M] Auth-Application-Id: 16777238
[M] Origin-Host: minid-pcrf
[M] Origin-Realm: lab.realm
[M] Result-Code: DIAMETER_SUCCESS (2001)
[M] CC-Request-Type: TERMINATION_REQUEST (3)
[M] CC-Request-Number: 1
[M] Route-Record: box

Diameter
2 For more information additional logging can be enabled:
• config
• logging monitor msid <imsi>
• logs checkpoint (move all logs from active to standby buffer)
After reproduction of the issue, this log message can be seen: "Gx No resources: No suchgroup:, RULEBASE_1".
2015-May-06+15:49:03.257 [acsmgr 91746 debug] [1/0/3784 <sessmgr:1> acsmgr_gx.c:341] [callid
00004e22] [Call Trace] [context: Ga, contextID: 4] [software internal system syslog] Gx No
resources: No such group:, RULEBASE_1, 0
2015-May-06+15:49:03.257 [acsmgr 91431 trace] [1/0/3784 <sessmgr:1> mgr_call_mgmt.c:2347]
[callid 00004e22] [Call Trace] [software internal system syslog] ACS_SEF event: Populating the
dynamic rules list for quota request: 0, 0, 0
2015-May-06+15:49:03.257 [acsmgr 91431 trace] [1/0/3784 <sessmgr:1> mgr_call_mgmt.c:1767]
[callid 00004e22] [Call Trace] [software internal system syslog] ACS_SEF event: Storing Policy
Received from CCM: 0, 0, 0
2015-May-06+15:49:03.257 [acsmgr 91037 trace] [1/0/3784 <sessmgr:1> acsmgr.c:4444] [callid
00004e22] [Call Trace] [software internal user syslog] Rulebase default assigned
3 The rulebase seems to be properly configured:
# show active-charging rulebase name RULEBASE_1
Service Name: ECS-SVC
Rule Base Name: RULEBASE_1
4 PCRF indicates the rulebase to use via the Charging-Rule-Base-Name AVP (CRBN).
However, the 3GPP model of a rulebase is just a set of charging rules whereas an ECS
rulebase also defines a range of other parameters such as analysers, P2P inspection,
some charging parameters and various other aspects of a session. As a result, StarOS
offers two ways to interpret the CRBN AVP received from PCRF controlled via CLI:
# show configuration verbose | grep {policy-control | charging-rule-base-name | active-
charging-group-of-ruledefs}
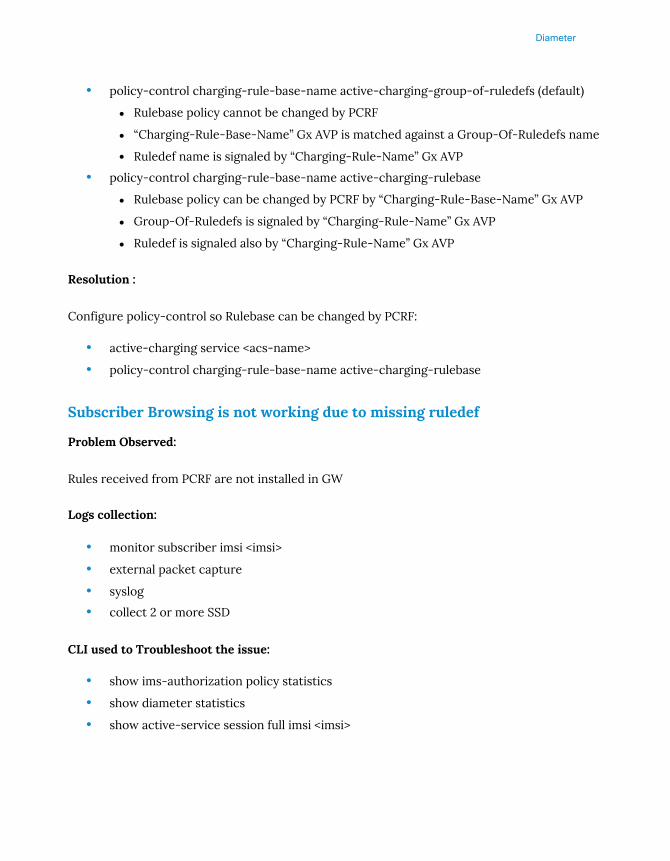
Diameter
• policy-control charging-rule-base-name active-charging-group-of-ruledefs (default)
Rulebase policy cannot be changed by PCRF
“Charging-Rule-Base-Name” Gx AVP is matched against a Group-Of-Ruledefs name
Ruledef name is signaled by “Charging-Rule-Name” Gx AVP
• policy-control charging-rule-base-name active-charging-rulebase
Rulebase policy can be changed by PCRF by “Charging-Rule-Base-Name” Gx AVP
Group-Of-Ruledefs is signaled by “Charging-Rule-Name” Gx AVP
Ruledef is signaled also by “Charging-Rule-Name” Gx AVP
Resolution :
Configure policy-control so Rulebase can be changed by PCRF:
• active-charging service <acs-name>
• policy-control charging-rule-base-name active-charging-rulebase
Subscriber Browsing is not working due to missing ruledef
Problem Observed:
Rules received from PCRF are not installed in GW
Logs collection:
• monitor subscriber imsi <imsi>
• external packet capture
• syslog
• collect 2 or more SSD
CLI used to Troubleshoot the issue:
• show ims-authorization policy statistics
• show diameter statistics
• show active-service session full imsi <imsi>

Diameter
Analysis:
In a monitor subscriber trace or packet capture CCR-I is being sent from GGSN to PCRF, PCRFis replying back with pre-defined Charging rulename in CCR-A. GGSN is sending CCR-U with"PCC-Rule-Status: INACTIVE (1)". PCRF is sending CCR-U success, GGSN is removing the ses-sion from Active Charging Service.
Call Flow: Rule Failure
Trace:
----------------------------------------------------------------------
Incoming Call:
----------------------------------------------------------------------
MSID/IMSI : 123456000000002 Callid : 00004e8b
IMEI : n/a MSISDN : 9876543210
Username : 9876543210 SessionType : ggsn-pdp-type-ipv4
Status : Active Service Name: ggsn
Src Context : spgw
----------------------------------------------------------------------
INBOUND>>>>> 15:29:57:410 Eventid:47000(3)
GTPC Rx PDU, from 10.201.251.5:2123 to 192.168.5.52:2123 (157)
TEID: 0x00000000, Message type: GTP_CREATE_PDP_CONTEXT_REQ_MSG (0x10)
Sequence Number:: 0x7FFF (32767)
GTP HEADER FOLLOWS:

Diameter
Version number: 1
Protocol type: 1 (GTP C/U)
Extended header flag: Not present
Sequence number flag: Present
NPDU number flag: Not present
Message Type: 0x10 (GTP_CREATE_PDP_CONTEXT_REQ_MSG)
Message Length: 0x0095 (149)
Tunnel ID: 0x00000000
Sequence Number: 0x7FFF (32767)
GTP HEADER ENDS.
INFORMATION ELEMENTS FOLLOW:
IMSI: 123456000000002
Recovery: 0xFA (250)
Selection Mode: 0x1 (MS provided APN, subscription not verified (Sent by MS))
Tunnel ID Data I: 0x00000400
Tunnel ID Control I: 0x00000400
NSAPI: 0x05 (5)
CHARGING CHARACTERISTIC FOLLOWS:
Charging Chars # 1: 0x0800 (Normal)
CHARGING CHARACTERISTIC ENDS.
END USER ADDRESS FOLLOWS:
PDP Type Organisation: IETF
PDP Type Number: IPv4
Address: Empty
END USER ADDRESS ENDS.
Access Point Name: cisco.com
PROTOCOL CONFIG. OPTIONS FOLLOW:
IE Length: 0x36 (54)
Configuration Protocol: (0) PPP
INFORMATION ELEMENTS END.
Wednesday May 06 2015
<<<<OUTBOUND 15:29:57:413 Eventid:81990(5)
Diameter message from 192.168.4.200:35121 to 192.168.4.111:3868
Base Header Information:
Version: 1
Message Length: 596
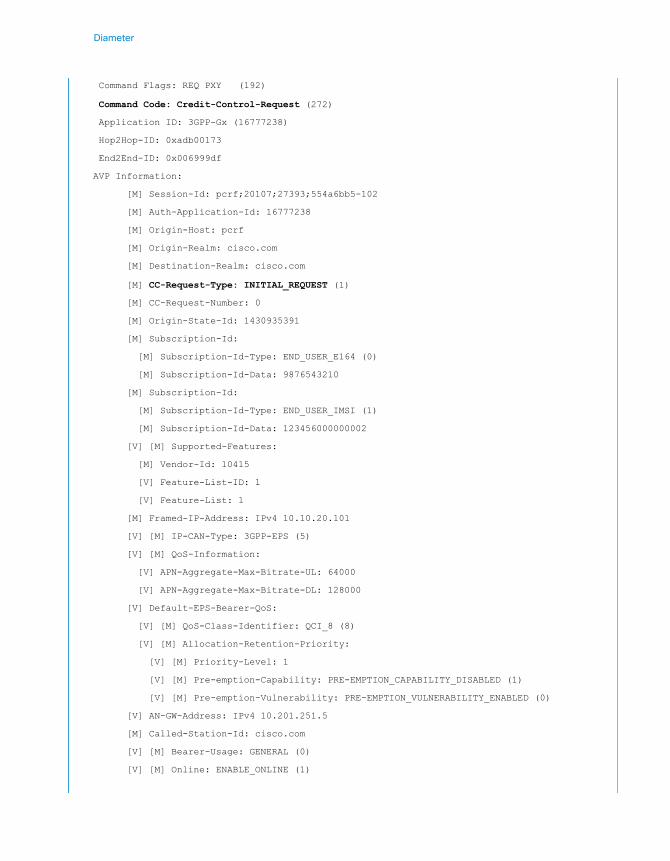
Diameter
Command Flags: REQ PXY (192)
Command Code: Credit-Control-Request (272)
Application ID: 3GPP-Gx (16777238)
Hop2Hop-ID: 0xadb00173
End2End-ID: 0x006999df
AVP Information:
[M] Session-Id: pcrf;20107;27393;554a6bb5-102
[M] Auth-Application-Id: 16777238
[M] Origin-Host: pcrf
[M] Origin-Realm: cisco.com
[M] Destination-Realm: cisco.com
[M] CC-Request-Type: INITIAL_REQUEST (1)
[M] CC-Request-Number: 0
[M] Origin-State-Id: 1430935391
[M] Subscription-Id:
[M] Subscription-Id-Type: END_USER_E164 (0)
[M] Subscription-Id-Data: 9876543210
[M] Subscription-Id:
[M] Subscription-Id-Type: END_USER_IMSI (1)
[M] Subscription-Id-Data: 123456000000002
[V] [M] Supported-Features:
[M] Vendor-Id: 10415
[V] Feature-List-ID: 1
[V] Feature-List: 1
[M] Framed-IP-Address: IPv4 10.10.20.101
[V] [M] IP-CAN-Type: 3GPP-EPS (5)
[V] [M] QoS-Information:
[V] APN-Aggregate-Max-Bitrate-UL: 64000
[V] APN-Aggregate-Max-Bitrate-DL: 128000
[V] Default-EPS-Bearer-QoS:
[V] [M] QoS-Class-Identifier: QCI_8 (8)
[V] [M] Allocation-Retention-Priority:
[V] [M] Priority-Level: 1
[V] [M] Pre-emption-Capability: PRE-EMPTION_CAPABILITY_DISABLED (1)
[V] [M] Pre-emption-Vulnerability: PRE-EMPTION_VULNERABILITY_ENABLED (0)
[V] AN-GW-Address: IPv4 10.201.251.5
[M] Called-Station-Id: cisco.com
[V] [M] Bearer-Usage: GENERAL (0)
[V] [M] Online: ENABLE_ONLINE (1)
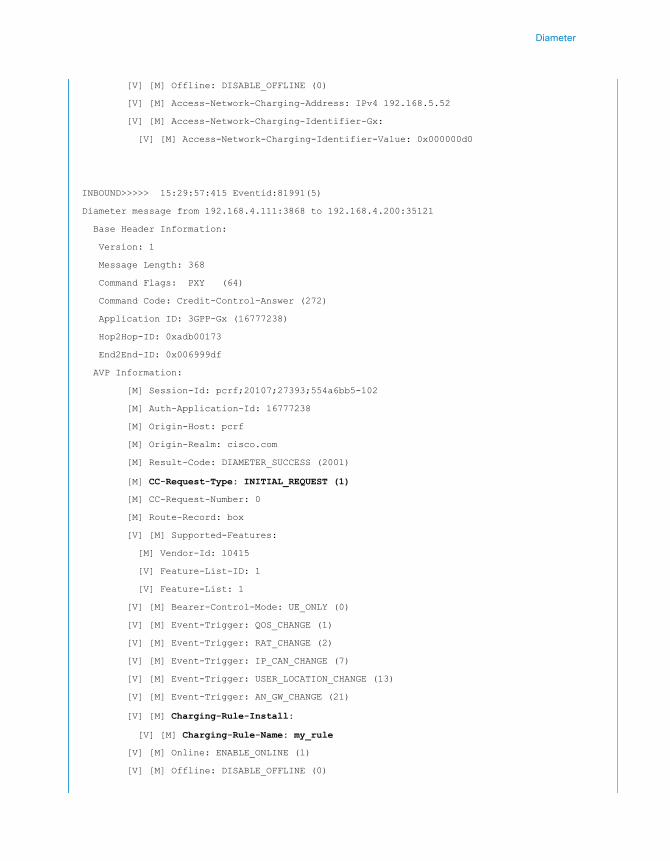
Diameter
[V] [M] Offline: DISABLE_OFFLINE (0)
[V] [M] Access-Network-Charging-Address: IPv4 192.168.5.52
[V] [M] Access-Network-Charging-Identifier-Gx:
[V] [M] Access-Network-Charging-Identifier-Value: 0x000000d0
INBOUND>>>>> 15:29:57:415 Eventid:81991(5)
Diameter message from 192.168.4.111:3868 to 192.168.4.200:35121
Base Header Information:
Version: 1
Message Length: 368
Command Flags: PXY (64)
Command Code: Credit-Control-Answer (272)
Application ID: 3GPP-Gx (16777238)
Hop2Hop-ID: 0xadb00173
End2End-ID: 0x006999df
AVP Information:
[M] Session-Id: pcrf;20107;27393;554a6bb5-102
[M] Auth-Application-Id: 16777238
[M] Origin-Host: pcrf
[M] Origin-Realm: cisco.com
[M] Result-Code: DIAMETER_SUCCESS (2001)
[M] CC-Request-Type: INITIAL_REQUEST (1)
[M] CC-Request-Number: 0
[M] Route-Record: box
[V] [M] Supported-Features:
[M] Vendor-Id: 10415
[V] Feature-List-ID: 1
[V] Feature-List: 1
[V] [M] Bearer-Control-Mode: UE_ONLY (0)
[V] [M] Event-Trigger: QOS_CHANGE (1)
[V] [M] Event-Trigger: RAT_CHANGE (2)
[V] [M] Event-Trigger: IP_CAN_CHANGE (7)
[V] [M] Event-Trigger: USER_LOCATION_CHANGE (13)
[V] [M] Event-Trigger: AN_GW_CHANGE (21)
[V] [M] Charging-Rule-Install:
[V] [M] Charging-Rule-Name: my_rule
[V] [M] Online: ENABLE_ONLINE (1)
[V] [M] Offline: DISABLE_OFFLINE (0)
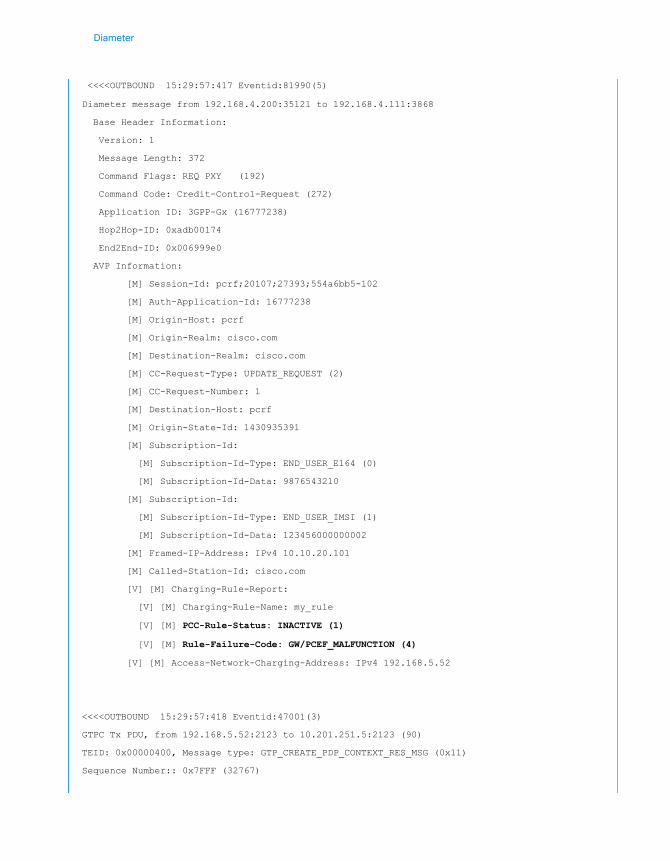
Diameter
<<<<OUTBOUND 15:29:57:417 Eventid:81990(5)
Diameter message from 192.168.4.200:35121 to 192.168.4.111:3868
Base Header Information:
Version: 1
Message Length: 372
Command Flags: REQ PXY (192)
Command Code: Credit-Control-Request (272)
Application ID: 3GPP-Gx (16777238)
Hop2Hop-ID: 0xadb00174
End2End-ID: 0x006999e0
AVP Information:
[M] Session-Id: pcrf;20107;27393;554a6bb5-102
[M] Auth-Application-Id: 16777238
[M] Origin-Host: pcrf
[M] Origin-Realm: cisco.com
[M] Destination-Realm: cisco.com
[M] CC-Request-Type: UPDATE_REQUEST (2)
[M] CC-Request-Number: 1
[M] Destination-Host: pcrf
[M] Origin-State-Id: 1430935391
[M] Subscription-Id:
[M] Subscription-Id-Type: END_USER_E164 (0)
[M] Subscription-Id-Data: 9876543210
[M] Subscription-Id:
[M] Subscription-Id-Type: END_USER_IMSI (1)
[M] Subscription-Id-Data: 123456000000002
[M] Framed-IP-Address: IPv4 10.10.20.101
[M] Called-Station-Id: cisco.com
[V] [M] Charging-Rule-Report:
[V] [M] Charging-Rule-Name: my_rule
[V] [M] PCC-Rule-Status: INACTIVE (1)
[V] [M] Rule-Failure-Code: GW/PCEF_MALFUNCTION (4)
[V] [M] Access-Network-Charging-Address: IPv4 192.168.5.52
<<<<OUTBOUND 15:29:57:418 Eventid:47001(3)
GTPC Tx PDU, from 192.168.5.52:2123 to 10.201.251.5:2123 (90)
TEID: 0x00000400, Message type: GTP_CREATE_PDP_CONTEXT_RES_MSG (0x11)
Sequence Number:: 0x7FFF (32767)
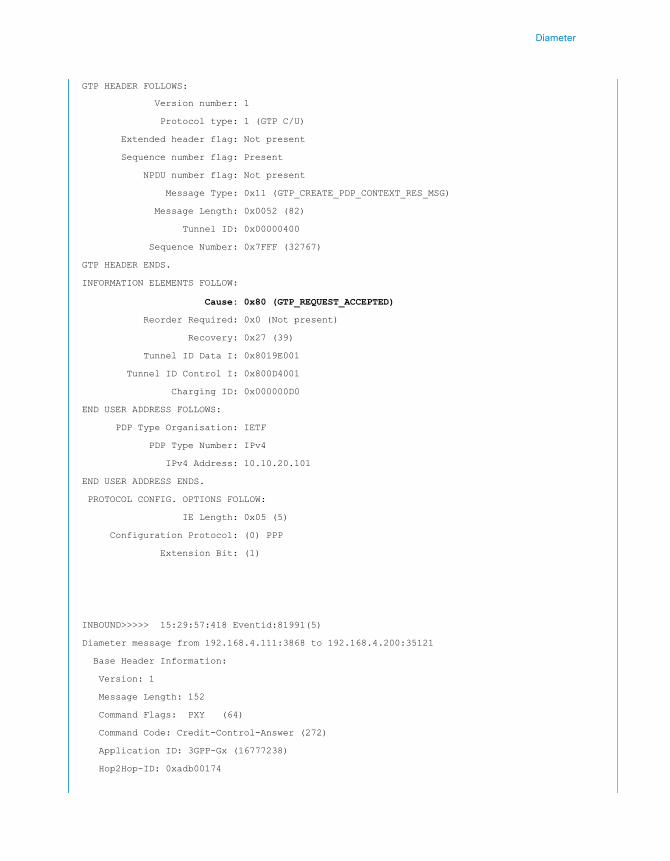
Diameter
GTP HEADER FOLLOWS:
Version number: 1
Protocol type: 1 (GTP C/U)
Extended header flag: Not present
Sequence number flag: Present
NPDU number flag: Not present
Message Type: 0x11 (GTP_CREATE_PDP_CONTEXT_RES_MSG)
Message Length: 0x0052 (82)
Tunnel ID: 0x00000400
Sequence Number: 0x7FFF (32767)
GTP HEADER ENDS.
INFORMATION ELEMENTS FOLLOW:
Cause: 0x80 (GTP_REQUEST_ACCEPTED)
Reorder Required: 0x0 (Not present)
Recovery: 0x27 (39)
Tunnel ID Data I: 0x8019E001
Tunnel ID Control I: 0x800D4001
Charging ID: 0x000000D0
END USER ADDRESS FOLLOWS:
PDP Type Organisation: IETF
PDP Type Number: IPv4
IPv4 Address: 10.10.20.101
END USER ADDRESS ENDS.
PROTOCOL CONFIG. OPTIONS FOLLOW:
IE Length: 0x05 (5)
Configuration Protocol: (0) PPP
Extension Bit: (1)
INBOUND>>>>> 15:29:57:418 Eventid:81991(5)
Diameter message from 192.168.4.111:3868 to 192.168.4.200:35121
Base Header Information:
Version: 1
Message Length: 152
Command Flags: PXY (64)
Command Code: Credit-Control-Answer (272)
Application ID: 3GPP-Gx (16777238)
Hop2Hop-ID: 0xadb00174
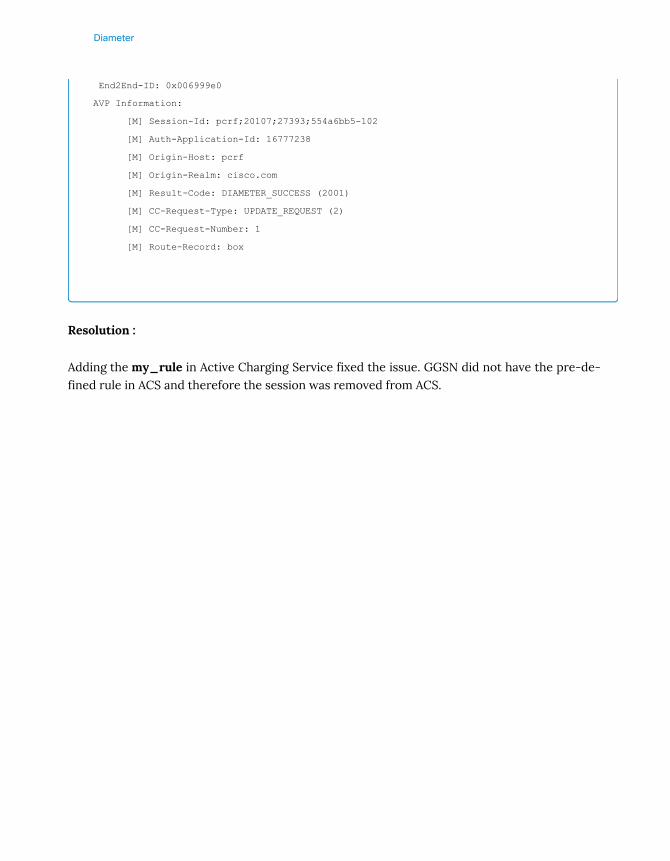
Diameter
End2End-ID: 0x006999e0
AVP Information:
[M] Session-Id: pcrf;20107;27393;554a6bb5-102
[M] Auth-Application-Id: 16777238
[M] Origin-Host: pcrf
[M] Origin-Realm: cisco.com
[M] Result-Code: DIAMETER_SUCCESS (2001)
[M] CC-Request-Type: UPDATE_REQUEST (2)
[M] CC-Request-Number: 1
[M] Route-Record: box
Resolution :
Adding the my_rule in Active Charging Service fixed the issue. GGSN did not have the pre-de-fined rule in ACS and therefore the session was removed from ACS.
Diameter
Online Charging - Gy
Overview
This section covers Diameter Online Charging over Gy interface and basic troubleshootingcommands with multiple examples.
The Gy interface is the online charging interface between the Gateway and the Online ChargingSystem (OCS). The Diameter protocol is used over this interface to provide online chargingfunctionality. This is also known as the Diameter Credit Control Application (DCCA).
The Gy interface makes use of the Active Charging Service (ACS) / Enhanced Charging Service(ECS) for real-time content-based charging of data services. It is based on the 3GPP standardsand relies on quota allocation. With Gy, customer traffic can be gated and billed in an online orprepaid style.
Call Flows and Troubleshooting
Depending on configuration, the Gy session shall be triggered two possible ways:
• During the session establishment (Call Flow 1)
• After the session establishment and the traffic starts (Call Flow 2)
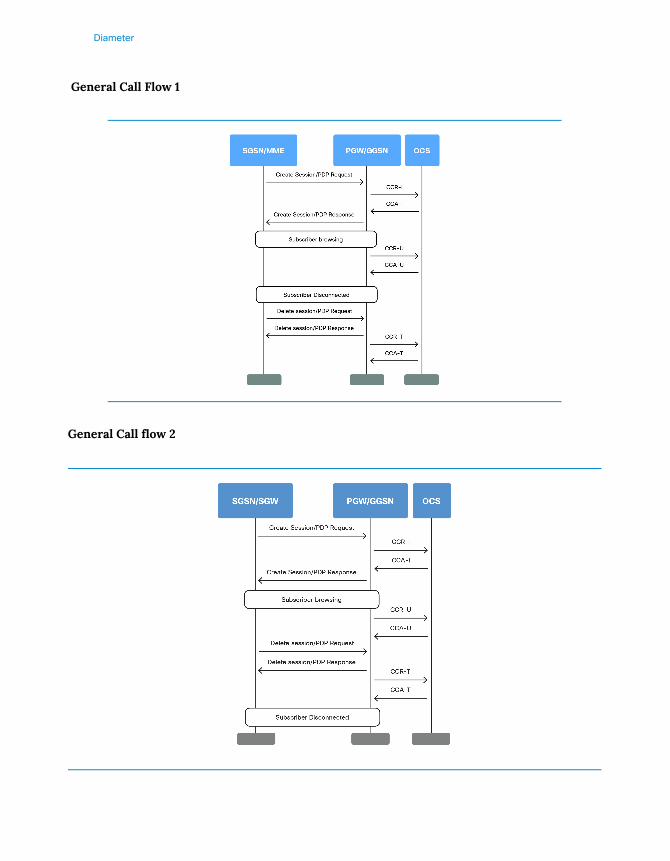
Diameter
General Call Flow 1
General Call flow 2
Diameter
Failure Handling
The session failover setting determines whether the session needs to be tried and bound to an-other OCS in case of the primary OCS failure. The setting can be done in the credit-controlconfiguration under active-charging service configuration as below:
active-charging service service-1
credit-control group default
diameter session failover
exit
Alternatively, the OCS can send the setting in the Session-Failover AVP in the CCA-I. Whatever issent from the OCS takes precedence over what is configured in the ASR 5000/ASR 5500. If Ses-sion-Failover is not enabled through interaction with OCS, even if there is secondary OCS config-ured and failure-handling configured, it will not take effect and the session will be terminated.
The failure-handling setting determines what needs to be done for the session in case of failureof the OCS. Failure-handling settings can come from local configuration, or from the OCSthrough the Credit-Control-Failure-Handling AVP. The AVP can have any of the 3 values listedbelow.
• CONTINUE - Retry to the secondary OCS and in case that too is not reachable or not re-sponding, then Continue the ongoing session, without any further OCS interaction. [Sessiongoes Offline]
• RETRY-AND-TERMINATE - Retry to the secondary OCS and in case that too is not reachableor not responding, terminate the session.
• TERMINATE - Terminate the session without retrying the secondary.
Note that all the above retries are done only if the session-failover is set. If it is not set, the ses-sion is either terminated or made offline based on the failure-handling setting and the sec-ondary is never retried.
The failure-handling setting is more comprehensive in ASR 5000/ASR 5500, where there aredifferent options to set different failure-handling behavior for different messages (Initial/Up-date/Terminate).
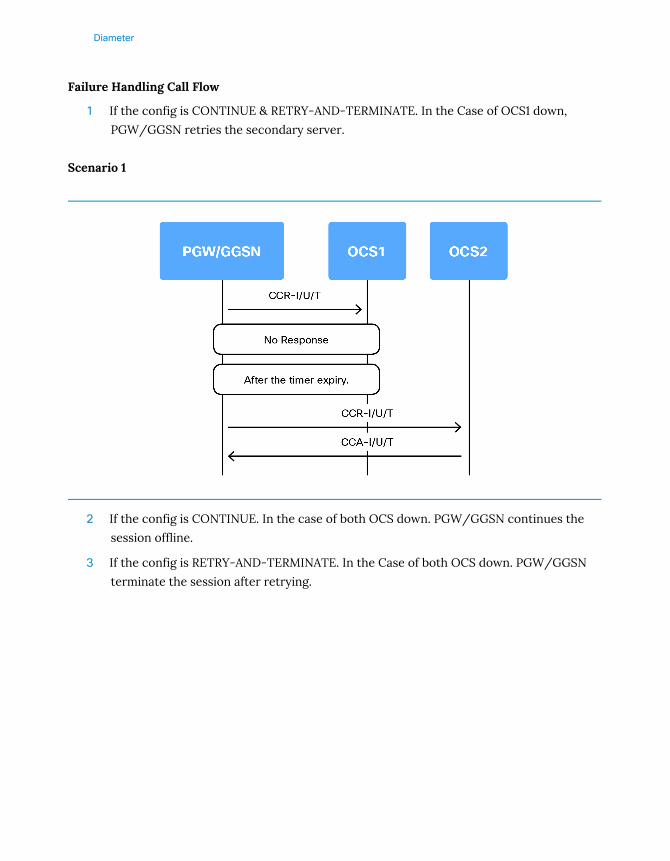
Diameter
Failure Handling Call Flow
1 If the config is CONTINUE & RETRY-AND-TERMINATE. In the Case of OCS1 down,
PGW/GGSN retries the secondary server.
Scenario 1
2 If the config is CONTINUE. In the case of both OCS down. PGW/GGSN continues the
session offline.
3 If the config is RETRY-AND-TERMINATE. In the Case of both OCS down. PGW/GGSN
terminate the session after retrying.

Diameter
Scenario 3
Basic troubleshooting commands for Gy
Some of the below CLI commands requires CLI test-commands passwordconfigured in the chassis. Please use the command with caution!Many TEST commands are processor-intensive and can cause serioussystem problems if used too frequently.
• show active-charging sessions full imsi <>
• show active-charging credit-control statistics group <>
• show diameter statistics endpoint <>
• show diameter peers full endpoint <>
• show diameter route table endpoint <>
• show support detail

Diameter
• Sniffer PCAP trace (wireshark or similar)
Capture mulitiple iterations so the delta between them can be seen.
• show active-charging sessions full <>
The following are descriptions for values of "Credit-Control:" in the output:
• Offline Charging - Sessions that were initially online but later moved into Offlinecharging due to failure handling or some Offline indication from OCS server.
• On - Session is online enabled and charging and currently not waiting for CCA-I, CCA-Uor CCA-T.
• Off - The session is non-online enabled.
[local]SPGW-1# show active-charging sessions full imsi 123456789012410
Session-ID: 1:10238 Username: [email protected]
Callid: 000063fc IMSI/MSID: 123456789012410
MSISDN: 112233445566843
ACSMgr Instance: 1 ACSMgr Card/Cpu: 1/0
SessMgr Instance: 1
Client-IP: 10.10.20.7
...
[snip]
...
Credit-Control: On
CC Peer: minid-gy.ciscolab1.com
CC Group: solo
CC Mode: DIAMETER
CC Failure Handling: Terminate
CC Session Failover: Enabled
CCR-I Server Unreachable Handling: Not-Configured
CCR-U Server Unreachable Handling: Not-Configured
Total CCR-U 0
Total Server Unreachable States Hit: 0
Tx-Expiry: 0 Response-TimeOut: 0
Connection-Failure: 0 Result-Code Based: 0
Current Server Unreachable State: n/a
Interim Volume in Bytes (used / allotted): na/ na

Diameter
Interim Time in Seconds (used / allotted): na/ na
Server Retries (attempted / configured): na/ na
Server Unreachable Reason: na
...
• show active-charging credit-control statistics group <>
This command will provide: Success & failure information, All error Cause-Code Infor-mation Stats, Total FH & Offline session information, and backpressure stats.
[local]ASR5000# show active-charging credit-control statistics group PGW-GY
Active Charging Service : ecs
Credit Control Group : PGW-GY
CC Session Stats:
Total Current Sessions: 0
Total ECS Adds: 2334 Total CC Starts: 11
Total Session Updates: 0 Total Terminated: 2334
Session Switchovers: 0
CC Message Stats:
Total Messages Received: 24 Total Messages Sent: 24
Total CC Requests: 24 Total CC Answers: 24
CCR-Initial: 11 CCA-Initial: 11
CCA-Initial Accept: 11 CCA-Initial Reject: 0
CCA-Initial Timeouts: 0
CCR-Update: 2 CCA-Update: 2
CCA-Update Timeouts: 0
CCR-Final: 11 CCA-Final: 11
CCA-Final Timeouts: 0
CCR-Event: 0 CCA-Event: 0
CCA-Event Timeouts: 0 CCR-Event Retry: 0
ASR: 0 ASA: 0
RAR: 0 RAA: 0
CCA Dropped: 0
CC Message Error Stats:
Diameter Protocol Errs: 0 Transient Failures: 0
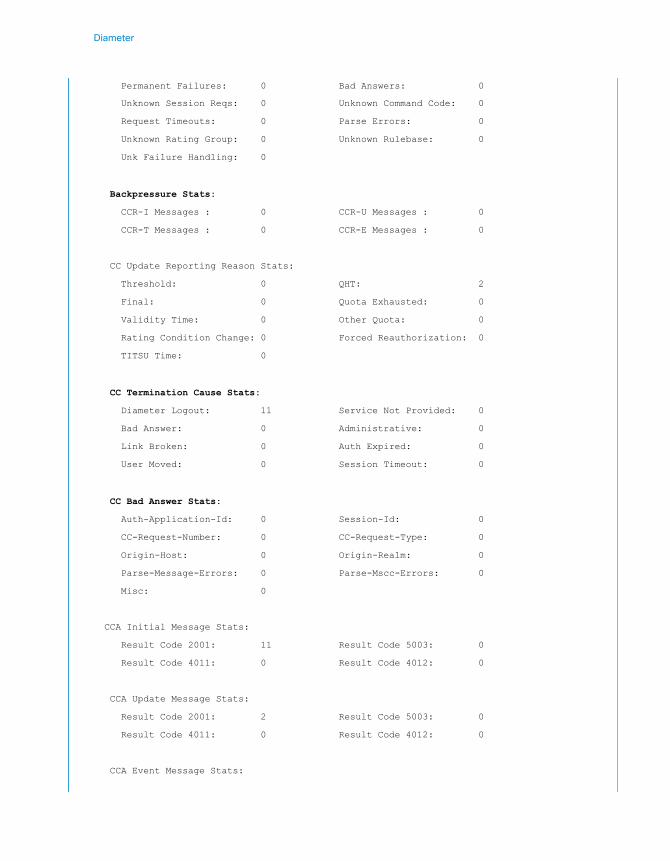
Diameter
Permanent Failures: 0 Bad Answers: 0
Unknown Session Reqs: 0 Unknown Command Code: 0
Request Timeouts: 0 Parse Errors: 0
Unknown Rating Group: 0 Unknown Rulebase: 0
Unk Failure Handling: 0
Backpressure Stats:
CCR-I Messages : 0 CCR-U Messages : 0
CCR-T Messages : 0 CCR-E Messages : 0
CC Update Reporting Reason Stats:
Threshold: 0 QHT: 2
Final: 0 Quota Exhausted: 0
Validity Time: 0 Other Quota: 0
Rating Condition Change: 0 Forced Reauthorization: 0
TITSU Time: 0
CC Termination Cause Stats:
Diameter Logout: 11 Service Not Provided: 0
Bad Answer: 0 Administrative: 0
Link Broken: 0 Auth Expired: 0
User Moved: 0 Session Timeout: 0
CC Bad Answer Stats:
Auth-Application-Id: 0 Session-Id: 0
CC-Request-Number: 0 CC-Request-Type: 0
Origin-Host: 0 Origin-Realm: 0
Parse-Message-Errors: 0 Parse-Mscc-Errors: 0
Misc: 0
CCA Initial Message Stats:
Result Code 2001: 11 Result Code 5003: 0
Result Code 4011: 0 Result Code 4012: 0
CCA Update Message Stats:
Result Code 2001: 2 Result Code 5003: 0
Result Code 4011: 0 Result Code 4012: 0
CCA Event Message Stats:

Diameter
Result Code 2001: 0 Other Result Codes: 0
Failure Handling Stats:
Action-Terminated: 0 Action-Continue: 0
Offline Active Sessions: 0
CCA Result Code 2xxx Stats:
Result Code 2xxx: 24 Result Code 2001: 24
Result Code 2002: 0
CCA Result Code 4xxx Stats:
Result Code 4001: 0 Result Code 4002: 0
Result Code 4011: 0 Result Code 4012: 0
CCA Result Code 5xxx Stats:
Result Code 5001: 0 Result Code 5002: 0
Result Code 5003: 0 Result Code 5004: 0
Result Code 5005: 0 Result Code 5006: 0
All Other Result Codes: 0
OCS Unreachable Stats:
Tx-Expiry: 0 Response-TimeOut: 0
Connection-Failure: 0 Action-Continue: 0
Action-Terminated: 0 Server Retries: 0
Assumed-Positive Sessions:
Current: 0 Cumulative: 0
• show diameter statistics endpoint <>
[local]ASR5000# show diameter statistics endpoint credit-control
Create Messages statistics:
Calls: 0
Success: 108
Routed: 0

Diameter
Unrouted: 0
Directed: 0
Buffer Errors: 0
Peer Never Up Errors: 0
Window Errors: 0
Unsupported Application Errors: 0
Message Parse statistics:
Message Pool Expand Attempts: 0
Buffer Expand Attempts: 0
Calls: 108
Too Many AVP Errors: 0
Header Errors: 0
AVP Unknown Errors: 0
Runt Errors: 0
AVP Header Errors: 0
Message Protocol Error: 0
Mand AVP Unknown Errors: 0
Message aborts: 0
Send Message statistics:
Calls: 108
Truncated Errors: 0
Read statistics:
Read Bytes: 0
Read Messages Total: 0
Requests Read: 0
Requests Timed Out: 0
Answers Read: 108
Answers Timed Out: 0
Read Application Messages: 108
Unexpected Answers Read: 0
Read Parse statistics:
Begin: 108
E2E Errors: 0
Success: 108
Application ID Errors: 0
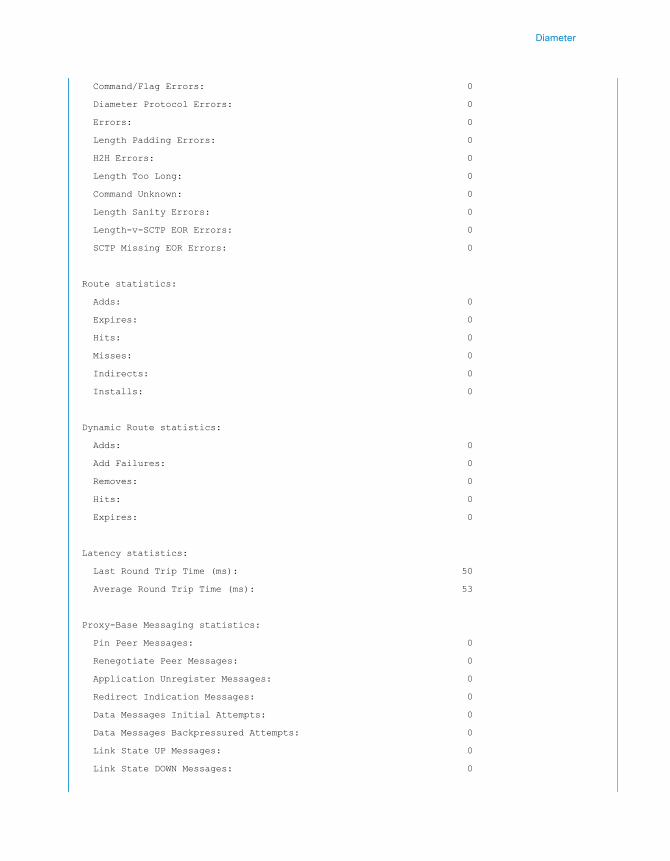
Diameter
Command/Flag Errors: 0
Diameter Protocol Errors: 0
Errors: 0
Length Padding Errors: 0
H2H Errors: 0
Length Too Long: 0
Command Unknown: 0
Length Sanity Errors: 0
Length-v-SCTP EOR Errors: 0
SCTP Missing EOR Errors: 0
Route statistics:
Adds: 0
Expires: 0
Hits: 0
Misses: 0
Indirects: 0
Installs: 0
Dynamic Route statistics:
Adds: 0
Add Failures: 0
Removes: 0
Hits: 0
Expires: 0
Latency statistics:
Last Round Trip Time (ms): 50
Average Round Trip Time (ms): 53
Proxy-Base Messaging statistics:
Pin Peer Messages: 0
Renegotiate Peer Messages: 0
Application Unregister Messages: 0
Redirect Indication Messages: 0
Data Messages Initial Attempts: 0
Data Messages Backpressured Attempts: 0
Link State UP Messages: 0
Link State DOWN Messages: 0
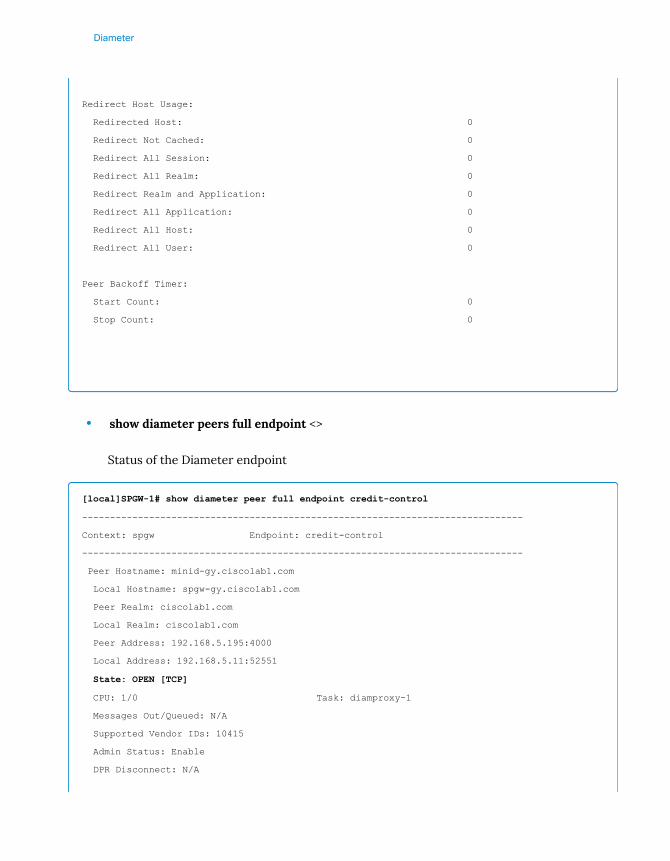
Diameter
Redirect Host Usage:
Redirected Host: 0
Redirect Not Cached: 0
Redirect All Session: 0
Redirect All Realm: 0
Redirect Realm and Application: 0
Redirect All Application: 0
Redirect All Host: 0
Redirect All User: 0
Peer Backoff Timer:
Start Count: 0
Stop Count: 0
• show diameter peers full endpoint <>
Status of the Diameter endpoint
[local]SPGW-1# show diameter peer full endpoint credit-control
-------------------------------------------------------------------------------
Context: spgw Endpoint: credit-control
-------------------------------------------------------------------------------
Peer Hostname: minid-gy.ciscolab1.com
Local Hostname: spgw-gy.ciscolab1.com
Peer Realm: ciscolab1.com
Local Realm: ciscolab1.com
Peer Address: 192.168.5.195:4000
Local Address: 192.168.5.11:52551
State: OPEN [TCP]
CPU: 1/0 Task: diamproxy-1
Messages Out/Queued: N/A
Supported Vendor IDs: 10415
Admin Status: Enable
DPR Disconnect: N/A

Diameter
Peer Backoff Timer running:N/A
Peers Summary:
Peers in OPEN state: 1
Peers in CLOSED state: 0
Peers in intermediate state: 0
Total peers matching specified criteria: 1
• show diameter route table endpoint <>
Current route entries
[local]asr 5000# show diameter route table endpoint dcca
-------------------------------------------------------------------------------
Context: local Endpoint: dcca
-------------------------------------------------------------------------------
+--- Static/Redirect/Dynamic
v Origin Host@Realm App Peer Wgt Exp
D 0001-diamproxy.gy.c [email protected] * dra1.drarealm.c 10 86391
S * [email protected] * dra1.drarealm.c 10
S * *@drarealm.com * dra1.drarealm.c 10
D 0002-diamproxy.gy.c [email protected] * dra1.drarealm.c 10 86377
Total items matching specified criteria: 4
Example Scenarios
OCS reports error code 3004
Problem Description:
After some changes on OCS side, service degradation was experienced. An extremely high num-ber of disconnects caused signaling overload on some other products. The expected behavior withOCS issues is that subscriber sessions continue, and no session disconnects should occur.
Logs Collection:
• Collect 2 or more “Show support details”

Diameter
• Collect syslog
• Collect bulkstats/KPI for Diameter
• Monitor subscriber imsi <imsi> (verbosity 3)
• Monitor protocol (verbosity 3) -- Consult Cisco support before running this commandin a production network.
• Collect external packet capture
• Show active-charging credit-control statistics group <credit-control group name>
• Show active-charging sessions full <imsi>
• Show session disconnect-reason
• Show support detail
Analysis:
• Based on the KPIs and show command output, it was noticed that OCS session failoveroccurred, and the diameter protocol Error (3xxx) started increasing.
show active-charging credit-control statistics group “PGW-GY”
The above CLI gives a lot of information, the fields of interest are highlightedbelow.
Failure Handling Stats:
Action-Terminated: 2000 Action-Continue: 3000
Offline Active Sessions: 3000
CC Message Error Stats:
Diameter Protocol Errs: 6000 Transient Failures: 0
• Both OCS were resonding with error 3004 (Diameter too Busy )
• Logs show both OCSs send “DIAMETER_TOO_BUSY” (3004) error to PGW.
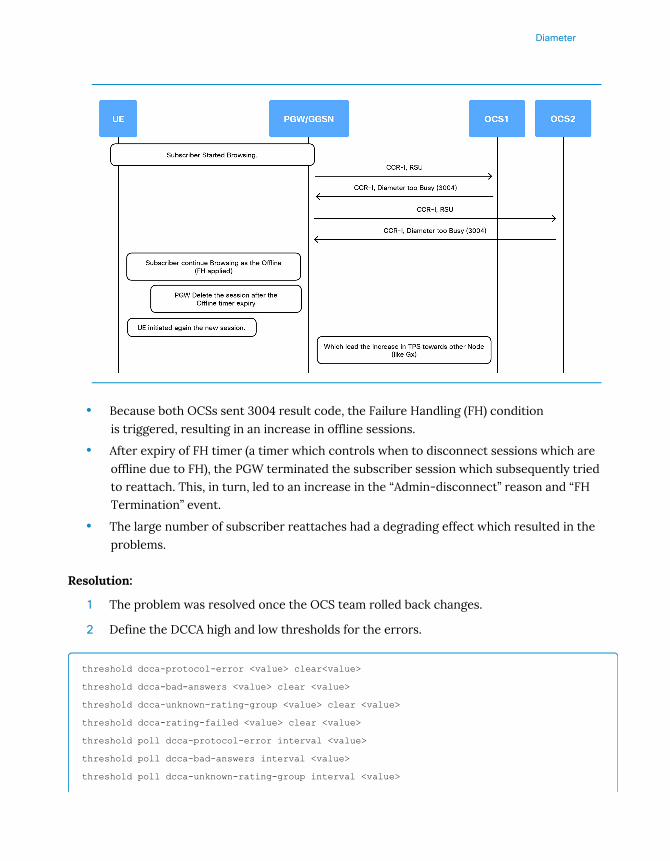
Diameter
• Because both OCSs sent 3004 result code, the Failure Handling (FH) conditionis triggered, resulting in an increase in offline sessions.
• After expiry of FH timer (a timer which controls when to disconnect sessions which areoffline due to FH), the PGW terminated the subscriber session which subsequently triedto reattach. This, in turn, led to an increase in the “Admin-disconnect” reason and “FHTermination” event.
• The large number of subscriber reattaches had a degrading effect which resulted in theproblems.
Resolution:
1 The problem was resolved once the OCS team rolled back changes.
2 Define the DCCA high and low thresholds for the errors.
threshold dcca-protocol-error <value> clear<value>
threshold dcca-bad-answers <value> clear <value>
threshold dcca-unknown-rating-group <value> clear <value>
threshold dcca-rating-failed <value> clear <value>
threshold poll dcca-protocol-error interval <value>
threshold poll dcca-bad-answers interval <value>
threshold poll dcca-unknown-rating-group interval <value>
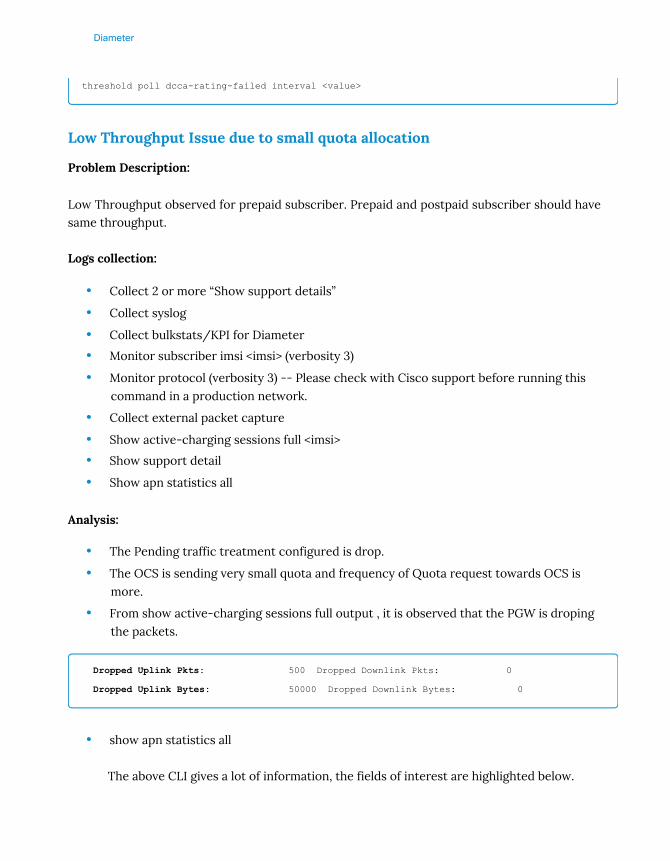
Diameter
threshold poll dcca-rating-failed interval <value>
Low Throughput Issue due to small quota allocation
Problem Description:
Low Throughput observed for prepaid subscriber. Prepaid and postpaid subscriber should havesame throughput.
Logs collection:
• Collect 2 or more “Show support details”
• Collect syslog
• Collect bulkstats/KPI for Diameter
• Monitor subscriber imsi <imsi> (verbosity 3)
• Monitor protocol (verbosity 3) -- Please check with Cisco support before running thiscommand in a production network.
• Collect external packet capture
• Show active-charging sessions full <imsi>
• Show support detail
• Show apn statistics all
Analysis:
• The Pending traffic treatment configured is drop.
• The OCS is sending very small quota and frequency of Quota request towards OCS ismore.
• From show active-charging sessions full output , it is observed that the PGW is dropingthe packets.
Dropped Uplink Pkts: 500 Dropped Downlink Pkts: 0
Dropped Uplink Bytes: 50000 Dropped Downlink Bytes: 0
• show apn statistics all
The above CLI gives a lot of information, the fields of interest are highlighted below.
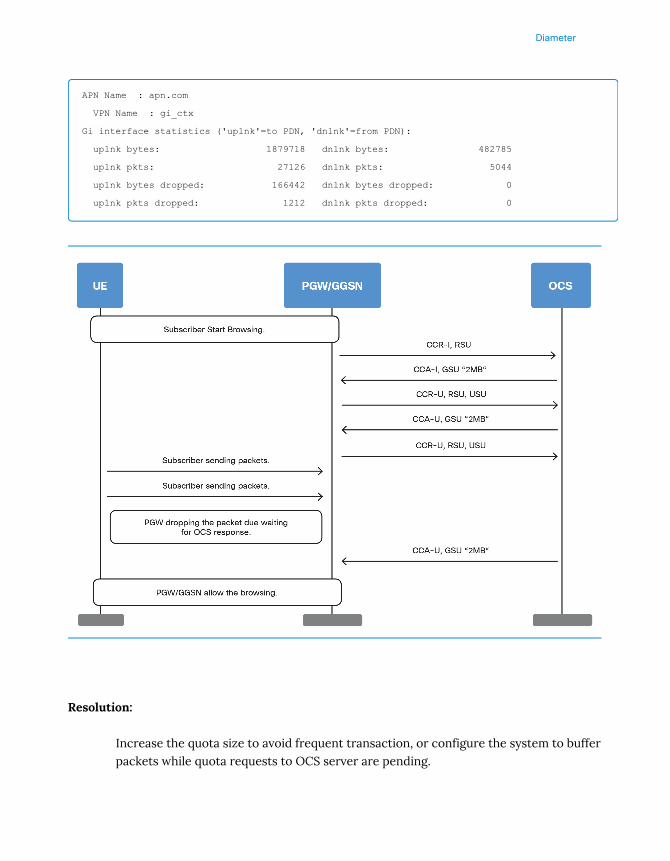
Diameter
APN Name : apn.com
VPN Name : gi_ctx
Gi interface statistics ('uplnk'=to PDN, 'dnlnk'=from PDN):
uplnk bytes: 1879718 dnlnk bytes: 482785
uplnk pkts: 27126 dnlnk pkts: 5044
uplnk bytes dropped: 166442 dnlnk bytes dropped: 0
uplnk pkts dropped: 1212 dnlnk pkts dropped: 0
Resolution:
Increase the quota size to avoid frequent transaction, or configure the system to bufferpackets while quota requests to OCS server are pending.


Diameter
Authentication - S6a
Overview
This section covers Diameter Authentication over S6a interface and basic troubleshooting com-mands with an example.
The S6a interface is used to provide AAA functionality for subscriber EPS Bearer contexts be-tween MME and HSS using Diameter protocol. The underlying transport protocol is SCTP.
The following messages are initiated by MME to HSS.
• Authentication-Information-Request(AIR)
• Update-Location-Request(ULR)
• Notify-Request(NR)
• Purge-Ue-Request(PUR)
Authentication-Information Request/Response
The Authentication Information Retrieval Procedure shall be used by the MME to request Au-thentication Information from the HSS.
Image - Call flow:
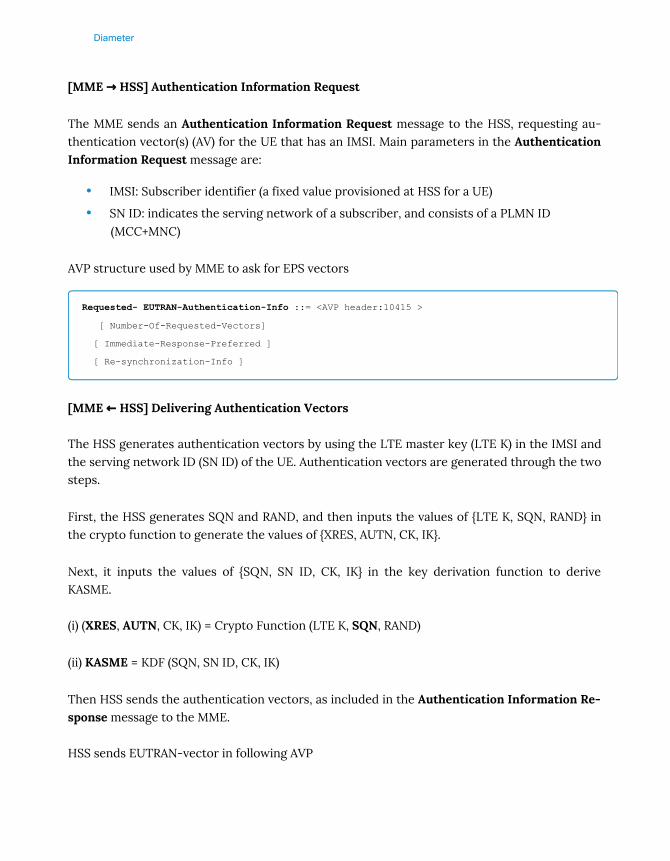
Diameter
[MME → HSS] Authentication Information Request
The MME sends an Authentication Information Request message to the HSS, requesting au-thentication vector(s) (AV) for the UE that has an IMSI. Main parameters in the AuthenticationInformation Request message are:
• IMSI: Subscriber identifier (a fixed value provisioned at HSS for a UE)
• SN ID: indicates the serving network of a subscriber, and consists of a PLMN ID(MCC+MNC)
AVP structure used by MME to ask for EPS vectors
Requested- EUTRAN-Authentication-Info ::= <AVP header:10415 >
[ Number-Of-Requested-Vectors]
[ Immediate-Response-Preferred ]
[ Re-synchronization-Info ]
[MME ← HSS] Delivering Authentication Vectors
The HSS generates authentication vectors by using the LTE master key (LTE K) in the IMSI andthe serving network ID (SN ID) of the UE. Authentication vectors are generated through the twosteps.
First, the HSS generates SQN and RAND, and then inputs the values of {LTE K, SQN, RAND} inthe crypto function to generate the values of {XRES, AUTN, CK, IK}.
Next, it inputs the values of {SQN, SN ID, CK, IK} in the key derivation function to deriveKASME.
(i) (XRES, AUTN, CK, IK) = Crypto Function (LTE K, SQN, RAND)
(ii) KASME = KDF (SQN, SN ID, CK, IK)
Then HSS sends the authentication vectors, as included in the Authentication Information Re-sponse message to the MME.
HSS sends EUTRAN-vector in following AVP

Diameter
E-UTRAN-Vector ::= <AVP header: 1414 10415>
[ Item-Number ]
{ RAND }
{ XRES }
{ AUTN }
 { KASME }
The MME then uses this information to perform mutual authentication with the UE.
Update-Location Request/Answer
Once the procedures for authentication and NAS security setup are completed, MME has toregister the subscriber in the network, and find out what services the subscriber can use.
The call flow during this procedure is as in below figure.
Call flow
[MME → HSS] Notifying UE Location
The MME sends an Update Location Request (IMSI, MME ID) message to the HSS in order tonotify of the UE’s registration and obtain the subscription information of the UE.
[MME ← HSS] Delivering User Subscription Information
The HSS registers the MME ID to indicate in which MME the UE is located in. Then HSS sendsthe MME subscription information of the subscriber as included in an Update Location An-
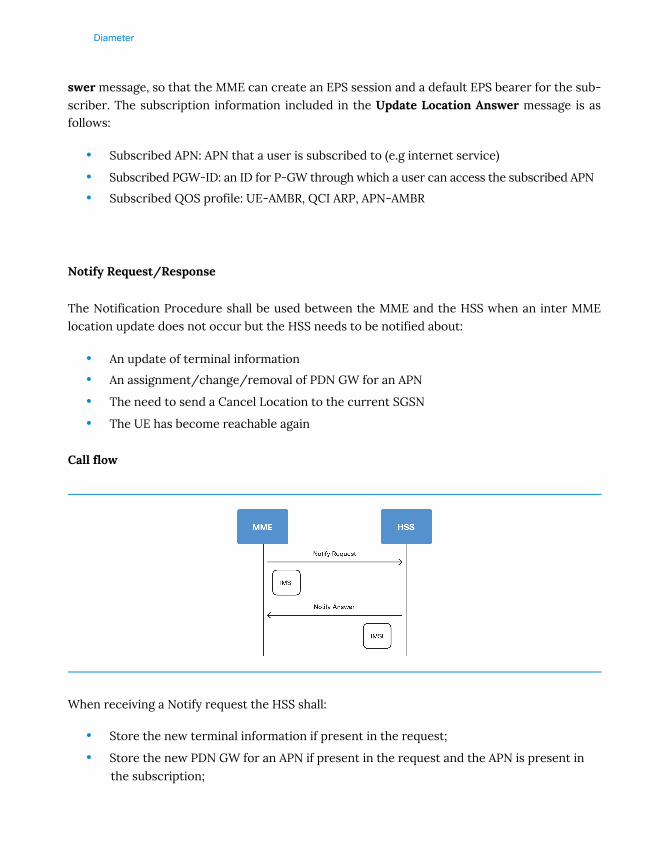
Diameter
swer message, so that the MME can create an EPS session and a default EPS bearer for the sub-scriber. The subscription information included in the Update Location Answer message is asfollows:
• Subscribed APN: APN that a user is subscribed to (e.g internet service)
• Subscribed PGW-ID: an ID for P-GW through which a user can access the subscribed APN
• Subscribed QOS profile: UE-AMBR, QCI ARP, APN-AMBR
Notify Request/Response
The Notification Procedure shall be used between the MME and the HSS when an inter MMElocation update does not occur but the HSS needs to be notified about:
• An update of terminal information
• An assignment/change/removal of PDN GW for an APN
• The need to send a Cancel Location to the current SGSN
• The UE has become reachable again
Call flow
When receiving a Notify request the HSS shall:
• Store the new terminal information if present in the request;
• Store the new PDN GW for an APN if present in the request and the APN is present inthe subscription;

Diameter
• Mark the location area as "restricted" if so indicated in the request;
• Send Cancel Location to the current SGSN if so indicated in the request;
• If the UE has become reachable again, send an indication to the Service Related Entity.
Purge-UE Request/Response
The Purge UE Procedure shall be used between the MME and the HSS to indicate that the sub-scriber's profile has been deleted from the MME either by an Operator or automatically, e.g. be-cause the UE has been inactive for several days.
Image - Call flow
The MME shall make use of this procedure to set the "UE Purged in the MME" flag in the HSSwhen the subscription profile is deleted from the MME database due to MME interaction orafter long UE inactivity.
When MME sends PUR to HSS, HSS will mark that subscriber as Purged from MME. In re-sponse, HSS shall send an indication to freeze the M-TMSI (Temporary Identity) to MME forsome time so that same temporary identity can be used when subscriber became active.
Basic troubleshooting commands for S6a
CLIs:
• show diameter peers full all

Diameter
• show diameter route table
• show hss-peer-service service name | all
• show hss-peer-service statistics all | service | summary
• show snmp traps
Logging:
Note:This should only be done upon recommendation from CiscoSupport as increasing the logging too high may risk stress on the systemand impact subscribers.
• logging filter active facility mme-app level debug
• logging filter active facility hss-peer-service level debug
• logging filter active facility diameter level debug
• logging filter active facility diabase level debug
• logging filter active facility diamproxy level debug
• logging filter active facility diameter-dns level debug
• Check for the hss-peer-service and the Status should be Started.
[local]asr5000# show hss-peer-service service all
Service name : S6A-MME
Context : SIG
Status : STARTED
Diameter hss-endpoint : S6A-MME
Diameter eir-endpoint : n/a
Diameter hss-dictionary : Standard
Diameter eir-dictionary : Standard
Request timeout : 20s
Request Auth-vectors : 1
Notify Request Message : Enable
• Check for the Diameter Peer Status and the state should be Open.
[local]asr5000# show diameter peers full
-------------------------------------------------------------------------------
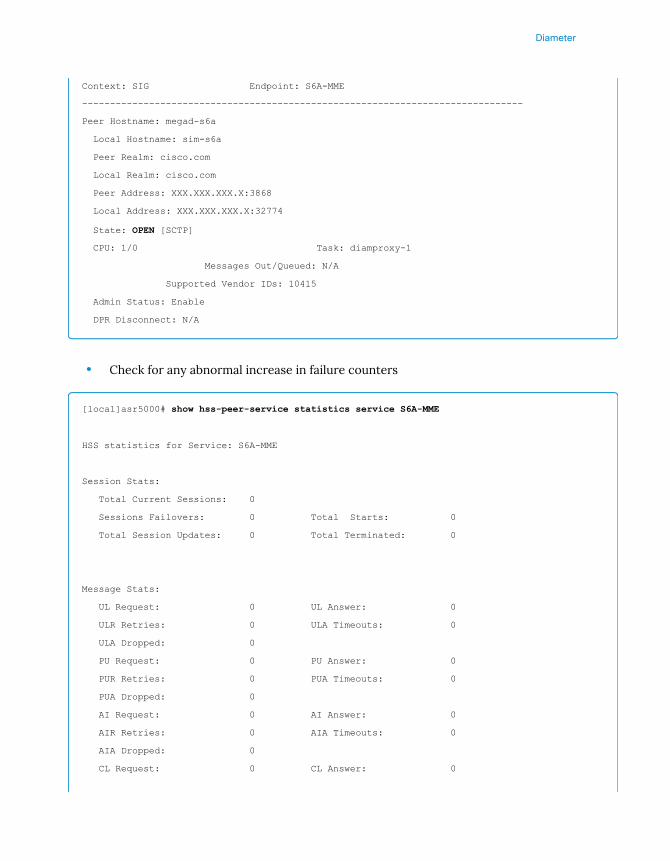
Diameter
Context: SIG Endpoint: S6A-MME
-------------------------------------------------------------------------------
Peer Hostname: megad-s6a
Local Hostname: sim-s6a
Peer Realm: cisco.com
Local Realm: cisco.com
Peer Address: XXX.XXX.XXX.X:3868
Local Address: XXX.XXX.XXX.X:32774
State: OPEN [SCTP]
CPU: 1/0 Task: diamproxy-1
Messages Out/Queued: N/A
Supported Vendor IDs: 10415
Admin Status: Enable
DPR Disconnect: N/A
• Check for any abnormal increase in failure counters
[local]asr5000# show hss-peer-service statistics service S6A-MME
HSS statistics for Service: S6A-MME
Session Stats:
Total Current Sessions: 0
Sessions Failovers: 0 Total Starts: 0
Total Session Updates: 0 Total Terminated: 0
Message Stats:
UL Request: 0 UL Answer: 0
ULR Retries: 0 ULA Timeouts: 0
ULA Dropped: 0
PU Request: 0 PU Answer: 0
PUR Retries: 0 PUA Timeouts: 0
PUA Dropped: 0
AI Request: 0 AI Answer: 0
AIR Retries: 0 AIA Timeouts: 0
AIA Dropped: 0
CL Request: 0 CL Answer: 0
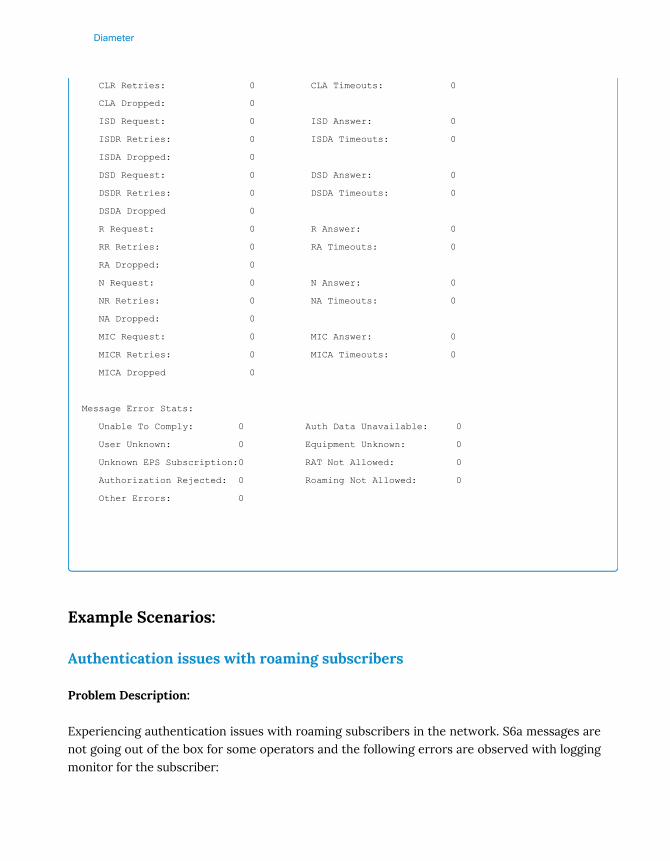
Diameter
CLR Retries: 0 CLA Timeouts: 0
CLA Dropped: 0
ISD Request: 0 ISD Answer: 0
ISDR Retries: 0 ISDA Timeouts: 0
ISDA Dropped: 0
DSD Request: 0 DSD Answer: 0
DSDR Retries: 0 DSDA Timeouts: 0
DSDA Dropped 0
R Request: 0 R Answer: 0
RR Retries: 0 RA Timeouts: 0
RA Dropped: 0
N Request: 0 N Answer: 0
NR Retries: 0 NA Timeouts: 0
NA Dropped: 0
MIC Request: 0 MIC Answer: 0
MICR Retries: 0 MICA Timeouts: 0
MICA Dropped 0
Message Error Stats:
Unable To Comply: 0 Auth Data Unavailable: 0
User Unknown: 0 Equipment Unknown: 0
Unknown EPS Subscription:0 RAT Not Allowed: 0
Authorization Rejected: 0 Roaming Not Allowed: 0
Other Errors: 0
Example Scenarios:
Authentication issues with roaming subscribers
Problem Description:
Experiencing authentication issues with roaming subscribers in the network. S6a messages arenot going out of the box for some operators and the following errors are observed with loggingmonitor for the subscriber:

Diameter
Mar 30 17:55:33 lou_cps1 evlogd: [local-60sec33.790] [mme-app 147036 error] [14/0/26859
<sessmgr:297> mme_auth_proc.c:1611] [callid 487bacae] [context: mme, contextID: 2] [software
internal user syslog] imsi <>, procedure MME Authentication procedure , Error sending HSS-S6a
message
Required information for troubleshooting
• show support detail
• show diameter endpoints all
• show diameter route table [debug]
• show configuration
• monitor subscriber imsi <>
Analysis:
The current configuration indicates that static route entry is missing for the diameter endpoint.
According to the MME administration guide, (section: Configuring Dynamic Destination RealmConstruction for Foreign Subscribers - page 89 Release 16 ), configuring Dynamic DestinationRealm for Foreign Subscribers requires a static route entry to be added in the diameter end-point configuration for each foreign realm.
Resolution:
Adding the static route entry in Diameter endpoint configuration solved the issue:
context signal
diameter endpoint hss
route-entry realm epc.mnc001.mcc001.3gppnetwork.org peer dsr1.dea.test.net
route-entry realm epc.mnc0o1.mcc001.3gppnetwork.org peer dsr2.dea.test.net


DNS

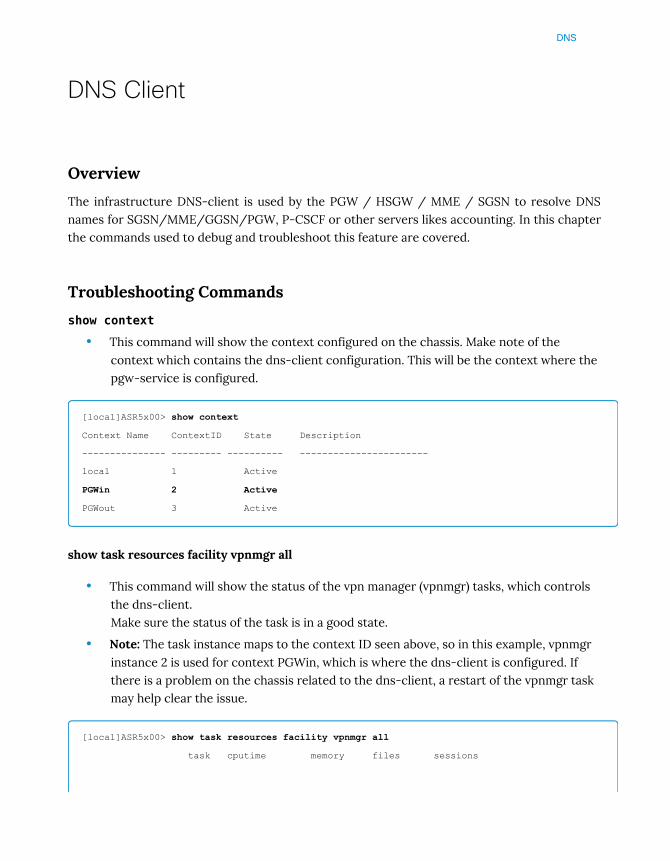
DNS
DNS Client
Overview
The infrastructure DNS-client is used by the PGW / HSGW / MME / SGSN to resolve DNSnames for SGSN/MME/GGSN/PGW, P-CSCF or other servers likes accounting. In this chapterthe commands used to debug and troubleshoot this feature are covered.
Troubleshooting Commands
show context• This command will show the context configured on the chassis. Make note of the
context which contains the dns-client configuration. This will be the context where thepgw-service is configured.
[local]ASR5x00> show context
Context Name ContextID State Description
--------------- --------- ---------- -----------------------
local 1 Active
PGWin 2 Active
PGWout 3 Active
show task resources facility vpnmgr all
• This command will show the status of the vpn manager (vpnmgr) tasks, which controlsthe dns-client.Make sure the status of the task is in a good state.
• Note: The task instance maps to the context ID seen above, so in this example, vpnmgrinstance 2 is used for context PGWin, which is where the dns-client is configured. Ifthere is a problem on the chassis related to the dns-client, a restart of the vpnmgr taskmay help clear the issue.
[local]ASR5x00> show task resources facility vpnmgr all
task cputime memory files sessions
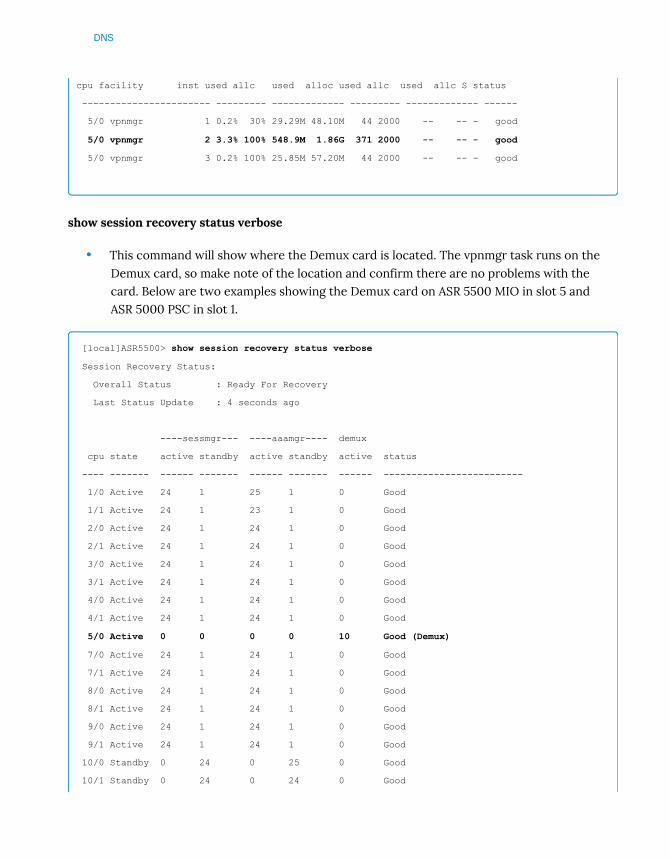
DNS
cpu facility inst used allc used alloc used allc used allc S status
----------------------- --------- ------------- --------- ------------- ------
5/0 vpnmgr 1 0.2% 30% 29.29M 48.10M 44 2000 -- -- - good
5/0 vpnmgr 2 3.3% 100% 548.9M 1.86G 371 2000 -- -- - good
5/0 vpnmgr 3 0.2% 100% 25.85M 57.20M 44 2000 -- -- - good
show session recovery status verbose
• This command will show where the Demux card is located. The vpnmgr task runs on theDemux card, so make note of the location and confirm there are no problems with thecard. Below are two examples showing the Demux card on ASR 5500 MIO in slot 5 andASR 5000 PSC in slot 1.
[local]ASR5500> show session recovery status verbose
Session Recovery Status:
Overall Status : Ready For Recovery
Last Status Update : 4 seconds ago
----sessmgr--- ----aaamgr---- demux
cpu state active standby active standby active status
---- ------- ------ ------- ------ ------- ------ -------------------------
1/0 Active 24 1 25 1 0 Good
1/1 Active 24 1 23 1 0 Good
2/0 Active 24 1 24 1 0 Good
2/1 Active 24 1 24 1 0 Good
3/0 Active 24 1 24 1 0 Good
3/1 Active 24 1 24 1 0 Good
4/0 Active 24 1 24 1 0 Good
4/1 Active 24 1 24 1 0 Good
5/0 Active 0 0 0 0 10 Good (Demux)
7/0 Active 24 1 24 1 0 Good
7/1 Active 24 1 24 1 0 Good
8/0 Active 24 1 24 1 0 Good
8/1 Active 24 1 24 1 0 Good
9/0 Active 24 1 24 1 0 Good
9/1 Active 24 1 24 1 0 Good
10/0 Standby 0 24 0 25 0 Good
10/1 Standby 0 24 0 24 0 Good
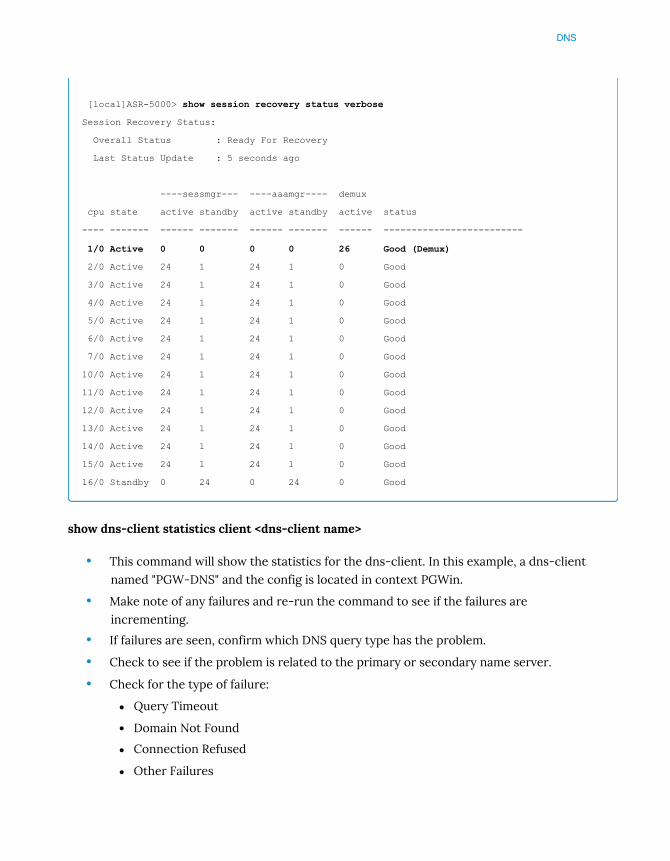
DNS
[local]ASR-5000> show session recovery status verbose
Session Recovery Status:
Overall Status : Ready For Recovery
Last Status Update : 5 seconds ago
----sessmgr--- ----aaamgr---- demux
cpu state active standby active standby active status
---- ------- ------ ------- ------ ------- ------ -------------------------
1/0 Active 0 0 0 0 26 Good (Demux)
2/0 Active 24 1 24 1 0 Good
3/0 Active 24 1 24 1 0 Good
4/0 Active 24 1 24 1 0 Good
5/0 Active 24 1 24 1 0 Good
6/0 Active 24 1 24 1 0 Good
7/0 Active 24 1 24 1 0 Good
10/0 Active 24 1 24 1 0 Good
11/0 Active 24 1 24 1 0 Good
12/0 Active 24 1 24 1 0 Good
13/0 Active 24 1 24 1 0 Good
14/0 Active 24 1 24 1 0 Good
15/0 Active 24 1 24 1 0 Good
16/0 Standby 0 24 0 24 0 Good
show dns-client statistics client <dns-client name>
• This command will show the statistics for the dns-client. In this example, a dns-clientnamed "PGW-DNS" and the config is located in context PGWin.
• Make note of any failures and re-run the command to see if the failures areincrementing.
• If failures are seen, confirm which DNS query type has the problem.
• Check to see if the problem is related to the primary or secondary name server.
• Check for the type of failure:
Query Timeout
Domain Not Found
Connection Refused
Other Failures
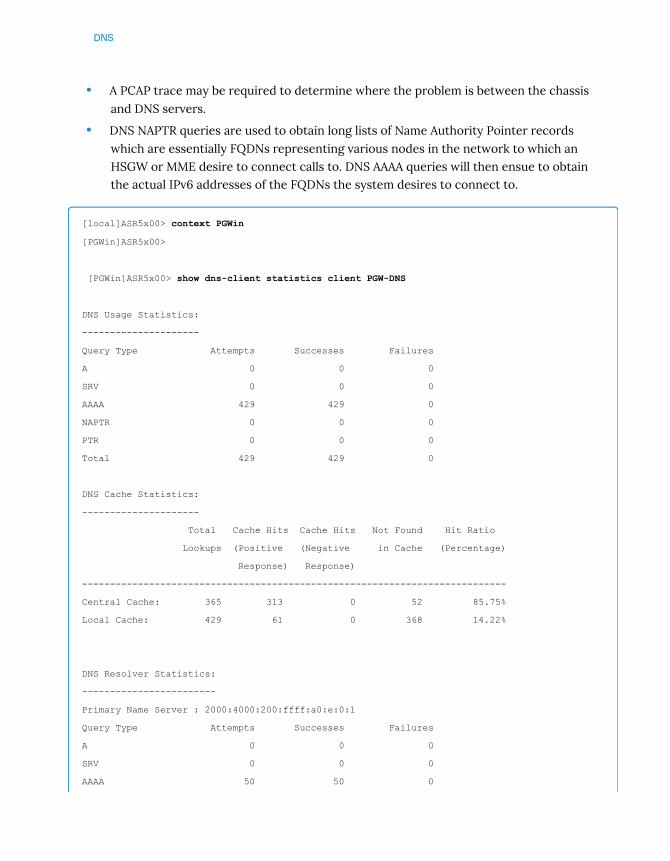
DNS
• A PCAP trace may be required to determine where the problem is between the chassisand DNS servers.
• DNS NAPTR queries are used to obtain long lists of Name Authority Pointer recordswhich are essentially FQDNs representing various nodes in the network to which anHSGW or MME desire to connect calls to. DNS AAAA queries will then ensue to obtainthe actual IPv6 addresses of the FQDNs the system desires to connect to.
[local]ASR5x00> context PGWin
[PGWin]ASR5x00>
[PGWin]ASR5x00> show dns-client statistics client PGW-DNS
DNS Usage Statistics:
---------------------
Query Type Attempts Successes Failures
A 0 0 0
SRV 0 0 0
AAAA 429 429 0
NAPTR 0 0 0
PTR 0 0 0
Total 429 429 0
DNS Cache Statistics:
---------------------
Total Cache Hits Cache Hits Not Found Hit Ratio
Lookups (Positive (Negative in Cache (Percentage)
Response) Response)
----------------------------------------------------------------------------
Central Cache: 365 313 0 52 85.75%
Local Cache: 429 61 0 368 14.22%
DNS Resolver Statistics:
------------------------
Primary Name Server : 2000:4000:200:ffff:a0:e:0:1
Query Type Attempts Successes Failures
A 0 0 0
SRV 0 0 0
AAAA 50 50 0
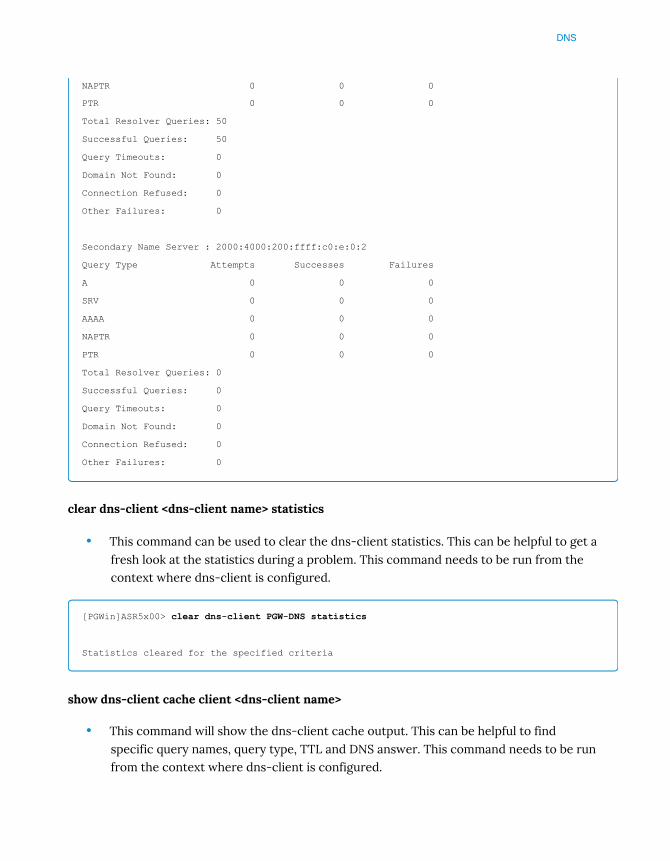
DNS
NAPTR 0 0 0
PTR 0 0 0
Total Resolver Queries: 50
Successful Queries: 50
Query Timeouts: 0
Domain Not Found: 0
Connection Refused: 0
Other Failures: 0
Secondary Name Server : 2000:4000:200:ffff:c0:e:0:2
Query Type Attempts Successes Failures
A 0 0 0
SRV 0 0 0
AAAA 0 0 0
NAPTR 0 0 0
PTR 0 0 0
Total Resolver Queries: 0
Successful Queries: 0
Query Timeouts: 0
Domain Not Found: 0
Connection Refused: 0
Other Failures: 0
clear dns-client <dns-client name> statistics
• This command can be used to clear the dns-client statistics. This can be helpful to get afresh look at the statistics during a problem. This command needs to be run from thecontext where dns-client is configured.
[PGWin]ASR5x00> clear dns-client PGW-DNS statistics
Statistics cleared for the specified criteria
show dns-client cache client <dns-client name>
• This command will show the dns-client cache output. This can be helpful to findspecific query names, query type, TTL and DNS answer. This command needs to be runfrom the context where dns-client is configured.
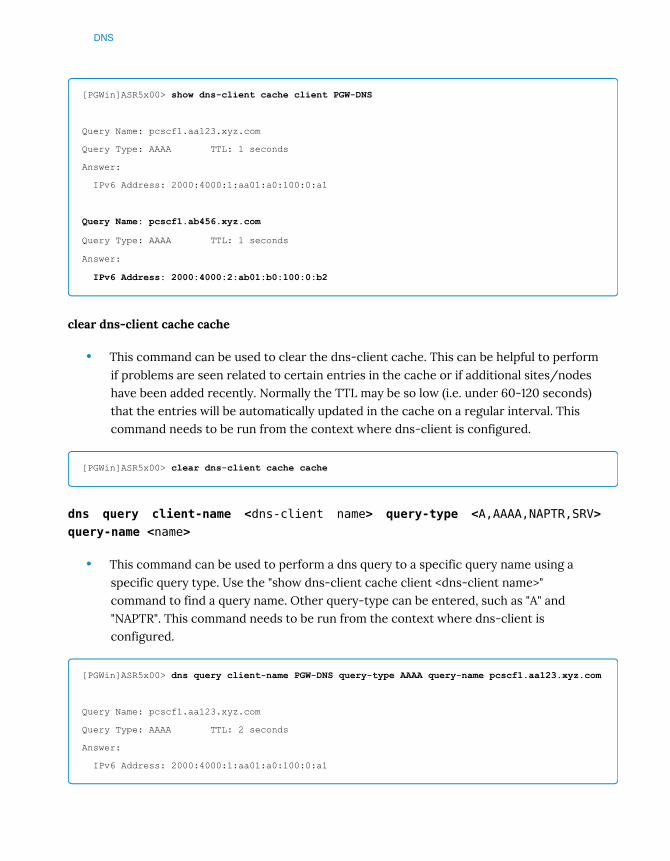
DNS
[PGWin]ASR5x00> show dns-client cache client PGW-DNS
Query Name: pcscf1.aa123.xyz.com
Query Type: AAAA TTL: 1 seconds
Answer:
IPv6 Address: 2000:4000:1:aa01:a0:100:0:a1
Query Name: pcscf1.ab456.xyz.com
Query Type: AAAA TTL: 1 seconds
Answer:
IPv6 Address: 2000:4000:2:ab01:b0:100:0:b2
clear dns-client cache cache
• This command can be used to clear the dns-client cache. This can be helpful to performif problems are seen related to certain entries in the cache or if additional sites/nodeshave been added recently. Normally the TTL may be so low (i.e. under 60-120 seconds)that the entries will be automatically updated in the cache on a regular interval. Thiscommand needs to be run from the context where dns-client is configured.
[PGWin]ASR5x00> clear dns-client cache cache
dns query client-name <dns-client name> query-type <A,AAAA,NAPTR,SRV>query-name <name>
• This command can be used to perform a dns query to a specific query name using aspecific query type. Use the "show dns-client cache client <dns-client name>"command to find a query name. Other query-type can be entered, such as "A" and"NAPTR". This command needs to be run from the context where dns-client isconfigured.
[PGWin]ASR5x00> dns query client-name PGW-DNS query-type AAAA query-name pcscf1.aa123.xyz.com
Query Name: pcscf1.aa123.xyz.com
Query Type: AAAA TTL: 2 seconds
Answer:
IPv6 Address: 2000:4000:1:aa01:a0:100:0:a1
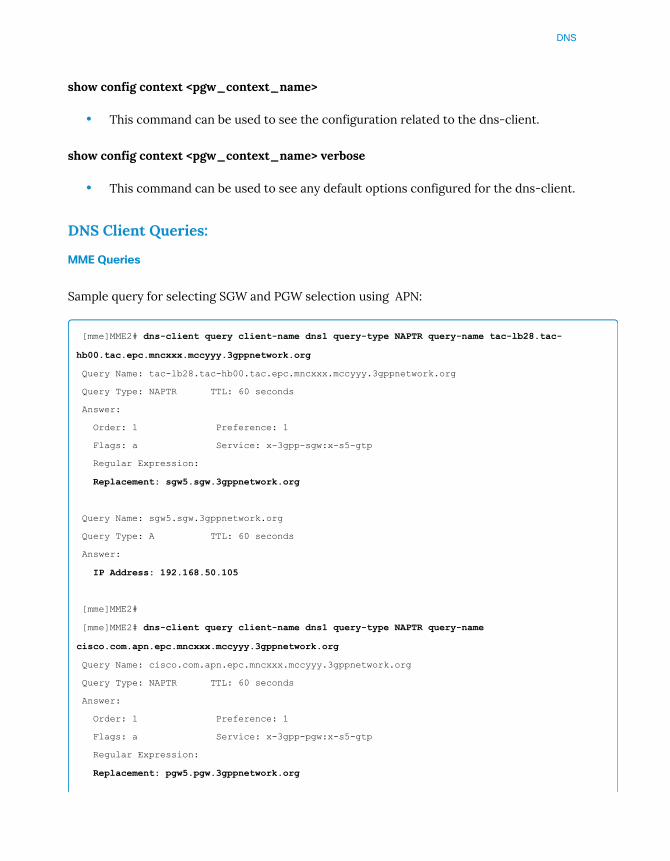
DNS
show config context <pgw_context_name>
• This command can be used to see the configuration related to the dns-client.
show config context <pgw_context_name> verbose
• This command can be used to see any default options configured for the dns-client.
DNS Client Queries:
MME Queries
Sample query for selecting SGW and PGW selection using APN:
[mme]MME2# dns-client query client-name dns1 query-type NAPTR query-name tac-lb28.tac-
hb00.tac.epc.mncxxx.mccyyy.3gppnetwork.org
Query Name: tac-lb28.tac-hb00.tac.epc.mncxxx.mccyyy.3gppnetwork.org
Query Type: NAPTR TTL: 60 seconds
Answer:
Order: 1 Preference: 1
Flags: a Service: x-3gpp-sgw:x-s5-gtp
Regular Expression:
Replacement: sgw5.sgw.3gppnetwork.org
Query Name: sgw5.sgw.3gppnetwork.org
Query Type: A TTL: 60 seconds
Answer:
IP Address: 192.168.50.105
[mme]MME2#
[mme]MME2# dns-client query client-name dns1 query-type NAPTR query-name
cisco.com.apn.epc.mncxxx.mccyyy.3gppnetwork.org
Query Name: cisco.com.apn.epc.mncxxx.mccyyy.3gppnetwork.org
Query Type: NAPTR TTL: 60 seconds
Answer:
Order: 1 Preference: 1
Flags: a Service: x-3gpp-pgw:x-s5-gtp
Regular Expression:
Replacement: pgw5.pgw.3gppnetwork.org
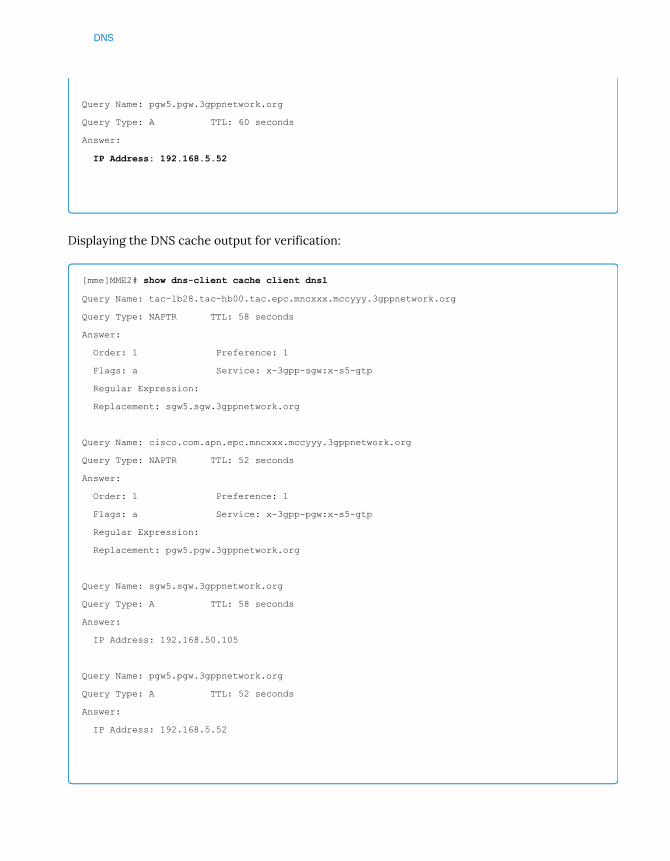
DNS
Query Name: pgw5.pgw.3gppnetwork.org
Query Type: A TTL: 60 seconds
Answer:
IP Address: 192.168.5.52
Displaying the DNS cache output for verification:
[mme]MME2# show dns-client cache client dns1
Query Name: tac-lb28.tac-hb00.tac.epc.mncxxx.mccyyy.3gppnetwork.org
Query Type: NAPTR TTL: 58 seconds
Answer:
Order: 1 Preference: 1
Flags: a Service: x-3gpp-sgw:x-s5-gtp
Regular Expression:
Replacement: sgw5.sgw.3gppnetwork.org
Query Name: cisco.com.apn.epc.mncxxx.mccyyy.3gppnetwork.org
Query Type: NAPTR TTL: 52 seconds
Answer:
Order: 1 Preference: 1
Flags: a Service: x-3gpp-pgw:x-s5-gtp
Regular Expression:
Replacement: pgw5.pgw.3gppnetwork.org
Query Name: sgw5.sgw.3gppnetwork.org
Query Type: A TTL: 58 seconds
Answer:
IP Address: 192.168.50.105
Query Name: pgw5.pgw.3gppnetwork.org
Query Type: A TTL: 52 seconds
Answer:
IP Address: 192.168.5.52
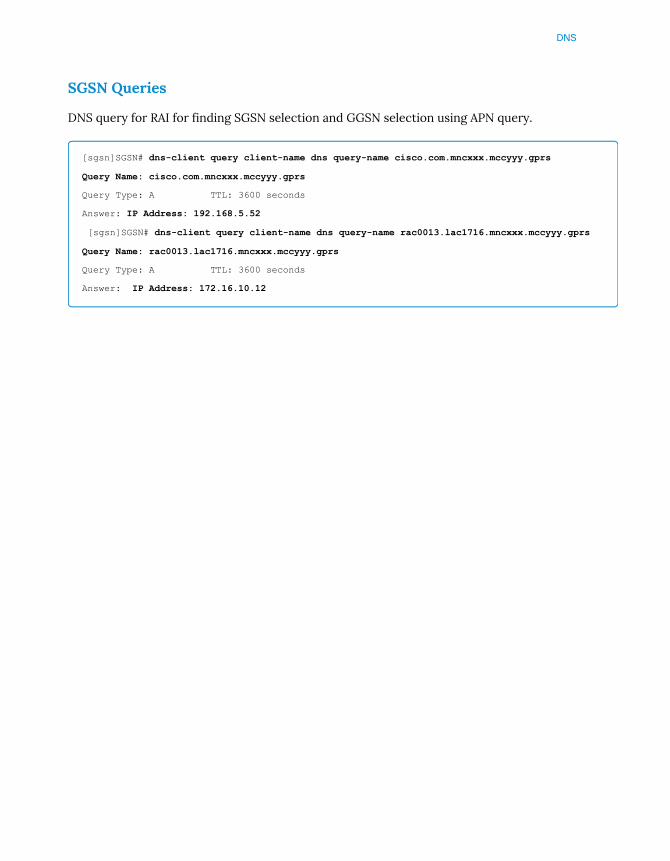
DNS
SGSN Queries
DNS query for RAI for finding SGSN selection and GGSN selection using APN query.
[sgsn]SGSN# dns-client query client-name dns query-name cisco.com.mncxxx.mccyyy.gprs
Query Name: cisco.com.mncxxx.mccyyy.gprs
Query Type: A TTL: 3600 seconds
Answer: IP Address: 192.168.5.52
[sgsn]SGSN# dns-client query client-name dns query-name rac0013.lac1716.mncxxx.mccyyy.gprs
Query Name: rac0013.lac1716.mncxxx.mccyyy.gprs
Query Type: A TTL: 3600 seconds
Answer: IP Address: 172.16.10.12

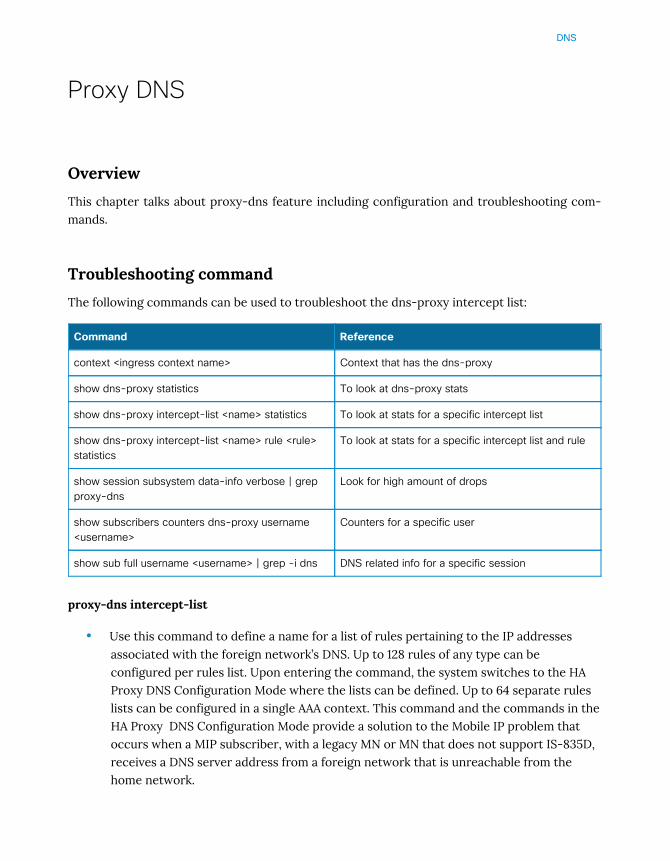
DNS
Proxy DNS
Overview
This chapter talks about proxy-dns feature including configuration and troubleshooting com-mands.
Troubleshooting command
The following commands can be used to troubleshoot the dns-proxy intercept list:
proxy-dns intercept-list
• Use this command to define a name for a list of rules pertaining to the IP addressesassociated with the foreign network’s DNS. Up to 128 rules of any type can beconfigured per rules list. Upon entering the command, the system switches to the HAProxy DNS Configuration Mode where the lists can be defined. Up to 64 separate ruleslists can be configured in a single AAA context. This command and the commands in theHA Proxy DNS Configuration Mode provide a solution to the Mobile IP problem thatoccurs when a MIP subscriber, with a legacy MN or MN that does not support IS-835D,receives a DNS server address from a foreign network that is unreachable from thehome network.
Command Reference
context <ingress context name> Context that has the dns-proxy
show dns-proxy statistics To look at dns-proxy stats
show dns-proxy intercept-list <name> statistics To look at stats for a specific intercept list
show dns-proxy intercept-list <name> rule <rule>statistics
To look at stats for a specific intercept list and rule
show session subsystem data-info verbose | grepproxy-dns
Look for high amount of drops
show subscribers counters dns-proxy username<username>
Counters for a specific user
show sub full username <username> | grep -i dns DNS related info for a specific session
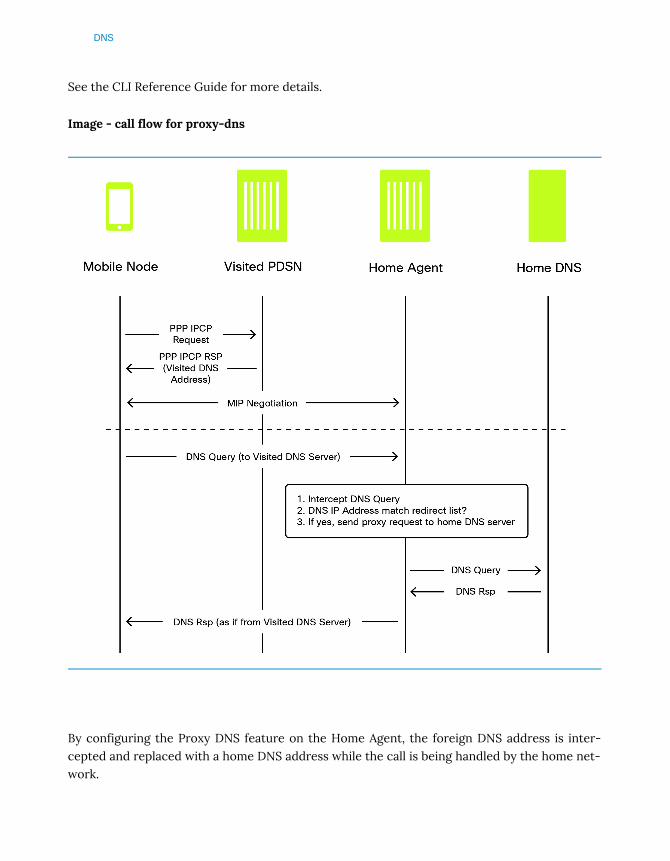
DNS
See the CLI Reference Guide for more details.
Image - call flow for proxy-dns
By configuring the Proxy DNS feature on the Home Agent, the foreign DNS address is inter-cepted and replaced with a home DNS address while the call is being handled by the home net-work.
DNS
Configuration
The following command creates a proxy DNS rules list named list1 and places the CLI in the HAProxy DNS Configuration Mode. A redirect and pass-thru rule has been configured.
configure
context <ingress_context>
proxy-dns intercept-list list1
redirect 0.0.0.0/0 primary-dns 1.1.1.1 secondary-dns 2.2.2.2
pass-thru 5.5.0.0/16
exit
end
In the egress context the dns-proxy source address is configured. Use this command to iden-tify the interface in this context where redirected DNS packets are sent to the home DNS. Thesystem uses this address as the source address of the DNS packets when forwarding the inter-cepted DNS request to the home DNS server.
configure
context <egress_context>
ip dns-proxy source-address 192.168.1.1
end


Active Charging Service


Active Charging Service
Active Charging Service
Overview
The Active Charging Service (ACS), also called ECS (Enhanced Charging Service) is an in-lineservice that provides flexible, differentiated, and detailed billing to subscribers with Layer 3through Layer 7 packet inspection.
This chapter will cover the basic principles of ACS: the architecture, the main building blocks,advanced functionalities, and a section with troubleshooting scenarios.
Architecture
Content Service Steering: Redirects incoming traffic to the ECS subsystem.
CSS uses Access Control Lists (ACLs) to redirect selective subscriber traffic flows. ACLs controlthe flow of packets into and out of the system.
Protocol Analyzer: Performs inspection of incoming packets. The Protocol Analyzer is the soft-ware stack responsible for analyzing the individual protocol fields and states during packet in-spection.
Image - ECS Traffic
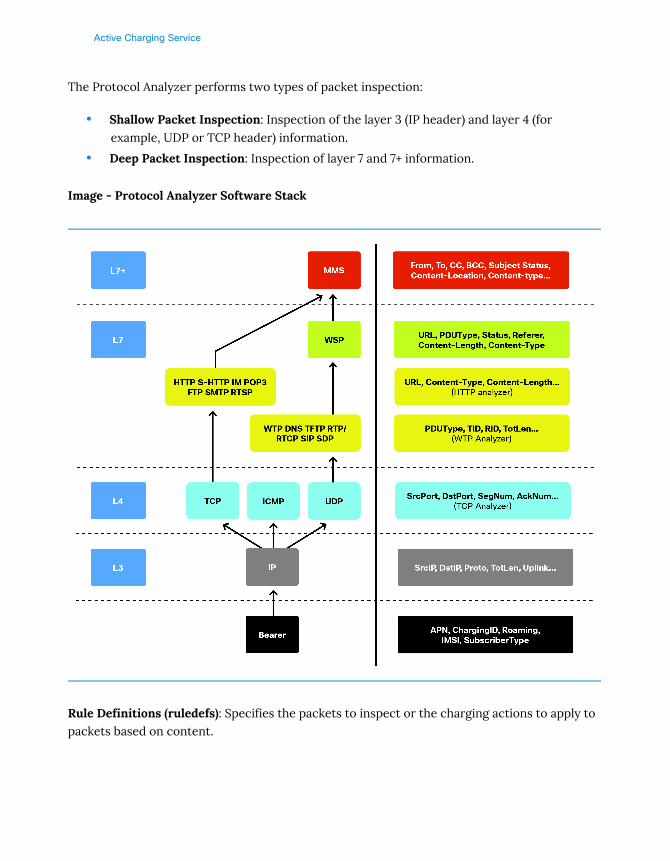
Active Charging Service
The Protocol Analyzer performs two types of packet inspection:
• Shallow Packet Inspection: Inspection of the layer 3 (IP header) and layer 4 (forexample, UDP or TCP header) information.
• Deep Packet Inspection: Inspection of layer 7 and 7+ information.
Image - Protocol Analyzer Software Stack
Rule Definitions (ruledefs): Specifies the packets to inspect or the charging actions to apply topackets based on content.
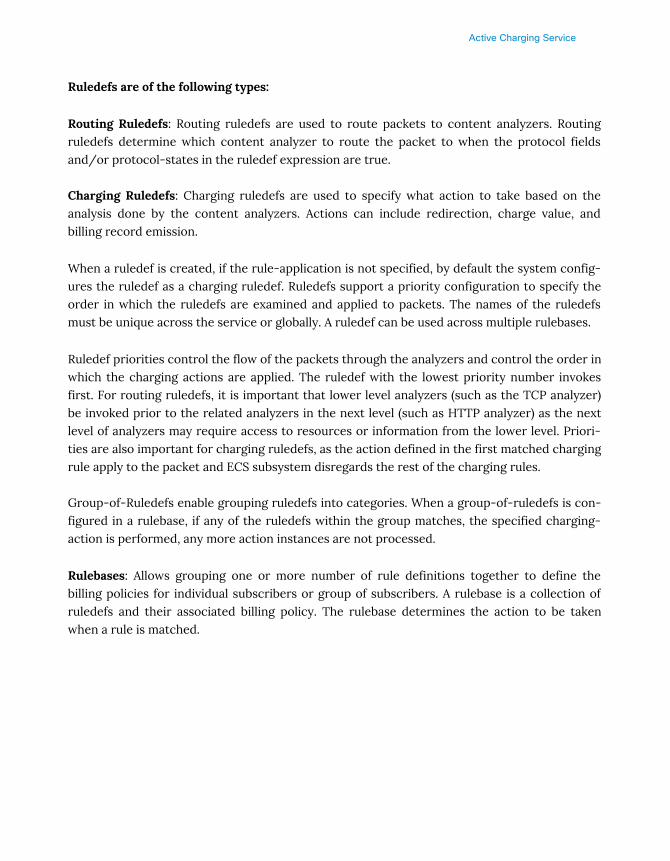
Active Charging Service
Ruledefs are of the following types:
Routing Ruledefs: Routing ruledefs are used to route packets to content analyzers. Routingruledefs determine which content analyzer to route the packet to when the protocol fieldsand/or protocol-states in the ruledef expression are true.
Charging Ruledefs: Charging ruledefs are used to specify what action to take based on theanalysis done by the content analyzers. Actions can include redirection, charge value, andbilling record emission.
When a ruledef is created, if the rule-application is not specified, by default the system config-ures the ruledef as a charging ruledef. Ruledefs support a priority configuration to specify theorder in which the ruledefs are examined and applied to packets. The names of the ruledefsmust be unique across the service or globally. A ruledef can be used across multiple rulebases.
Ruledef priorities control the flow of the packets through the analyzers and control the order inwhich the charging actions are applied. The ruledef with the lowest priority number invokesfirst. For routing ruledefs, it is important that lower level analyzers (such as the TCP analyzer)be invoked prior to the related analyzers in the next level (such as HTTP analyzer) as the nextlevel of analyzers may require access to resources or information from the lower level. Priori-ties are also important for charging ruledefs, as the action defined in the first matched chargingrule apply to the packet and ECS subsystem disregards the rest of the charging rules.
Group-of-Ruledefs enable grouping ruledefs into categories. When a group-of-ruledefs is con-figured in a rulebase, if any of the ruledefs within the group matches, the specified charging-action is performed, any more action instances are not processed.
Rulebases: Allows grouping one or more number of rule definitions together to define thebilling policies for individual subscribers or group of subscribers. A rulebase is a collection ofruledefs and their associated billing policy. The rulebase determines the action to be takenwhen a rule is matched.
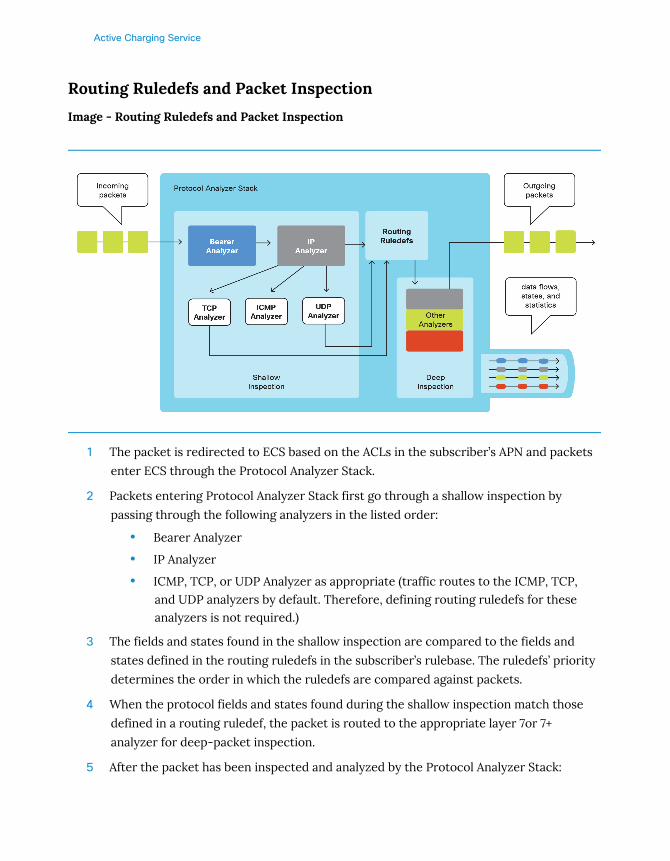
Active Charging Service
Routing Ruledefs and Packet Inspection
Image - Routing Ruledefs and Packet Inspection
1 The packet is redirected to ECS based on the ACLs in the subscriber’s APN and packets
enter ECS through the Protocol Analyzer Stack.
2 Packets entering Protocol Analyzer Stack first go through a shallow inspection by
passing through the following analyzers in the listed order:
• Bearer Analyzer
• IP Analyzer
• ICMP, TCP, or UDP Analyzer as appropriate (traffic routes to the ICMP, TCP,and UDP analyzers by default. Therefore, defining routing ruledefs for theseanalyzers is not required.)
3 The fields and states found in the shallow inspection are compared to the fields and
states defined in the routing ruledefs in the subscriber’s rulebase. The ruledefs’ priority
determines the order in which the ruledefs are compared against packets.
4 When the protocol fields and states found during the shallow inspection match those
defined in a routing ruledef, the packet is routed to the appropriate layer 7or 7+
analyzer for deep-packet inspection.
5 After the packet has been inspected and analyzed by the Protocol Analyzer Stack:
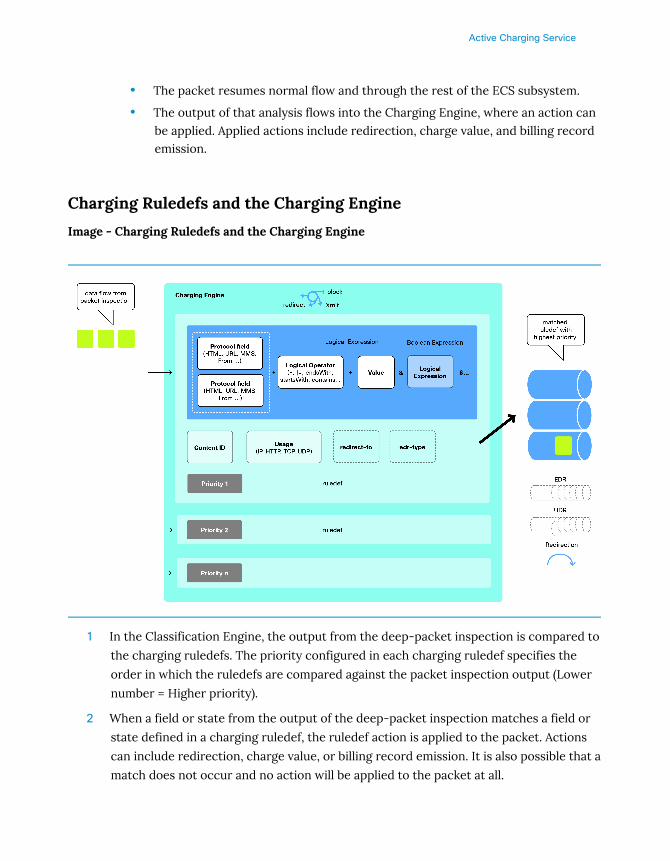
Active Charging Service
• The packet resumes normal flow and through the rest of the ECS subsystem.
• The output of that analysis flows into the Charging Engine, where an action canbe applied. Applied actions include redirection, charge value, and billing recordemission.
Charging Ruledefs and the Charging Engine
Image - Charging Ruledefs and the Charging Engine
1 In the Classification Engine, the output from the deep-packet inspection is compared to
the charging ruledefs. The priority configured in each charging ruledef specifies the
order in which the ruledefs are compared against the packet inspection output (Lower
number = Higher priority).
2 When a field or state from the output of the deep-packet inspection matches a field or
state defined in a charging ruledef, the ruledef action is applied to the packet. Actions
can include redirection, charge value, or billing record emission. It is also possible that a
match does not occur and no action will be applied to the packet at all.
Active Charging Service
ACS commands
Checking for proper functionality of ACS is typically found in two separate sections of the CLI,within the session subsystem and witin a separate active-charging subsystem.
• show subscriber full [user, imsi, msid, callid] [identifier]
Description: This command will show key information about which elements in the sys-tem config this session is bound to. These include the ACL, the rulebase, the FW/NATpolicy (defined below), the NAT realm, pool, and IP address, the NAT port chunks allo-cated to the session, and the amount of traffic sent to the ACL.
• show active-charging sessions full [user, imsi, msid, callid][identifier]
Description: This command will give detailed information on exactly what the session ishitting in the ACS. The rules being hit and how much traffic per rule is being recordedfor this session are shown. Details on any PCRF / Gx assigned rules or purely dynamicrules can also be seen here. The output of this command will also show the current stateof quota grant usage for Gy enabled rules. One key datapoint that can be pulled fromthis command is the "Session-id". It is at the very top of the output and is needed forsome of the more detailed NAT and flow commands outlined below.
• show active-charging flows full session-id [value]
Description: This command will give details on the specifics of the flows for the sessionin ACS. Keep in mind that flows come and go very quickly, so this command is only use-ful if something appears stuck or if some unexpected behavior with traffic or the ACSsubsystem is taking place. Given the quantity of flows on a busy system, it can take awhile for the output of this command to return once the command is entered.
• show active-charging rulebase statistics name [value]
Description: Running this command will give rulebase level output. Number of packets,record quantity (EDR / UDR / GCDR). Similar commands under the "show active-charg-ing" base for ruledef and charging-action also exist to further drill down on what it beinghit in the config.

Active Charging Service
ACS ruledef Optimization
Overview
Ruledef is a methodology to inspect packets or apply charging actions in ASR 5000/ASR 5500.This chapter covers optimizing techniques of ruledef.
Best Practices for Optimization
Some ruledefs are more optimized for performance than others. It's important to be aware ofthis performance impact and consider this when building the rulebase.
Generic Rule of thumb for having optimized ruledef configuration:
• In a rulebase, keep all HTTP-based rules at higher priority than non-HTTP based rules(like RTSP/RTP etc) as HTTP traffic is significant and should get evaluated quickly.
• Keep optimized rules at a higher priority than non-optimized rules so that they getevaluated earlier.
• Remove / Re-evaluate rules which show no hits: even though rule is not hit, it stillconsumes CPU for evaluation.
• Find out the frequently hit rules. Keep these rules at higher priority than others.
#show active-charging ruledef statistics all charging
Ruledef Name Packets-Down Bytes-Down Packets-Up Bytes-Up Hits Match-Bypassed
------------ ------------ ---------- ---------- -------- ---- --------------
Rule01 272431 272416148 283438 38127987 481911 0
ip_any 319352 371385357 260796 48422461 545944 0
Rule03 0 0 0 0 0 0
ICMPv6 1585 226584 36844017 3726219884 36845602 0
youtube 68653 48061177 51872 9460509 115410 0

Active Charging Service
Ways to optimize ruledef configuration
• Every ECS config line counts: keep ECS config minimal, remove un-used rules, routes,analyzers.
• Use debug CLI command for acsmgr to check which ruledefs are optimized and needoptimization.
• Check debug profiler to see if "acsmgr_rule_compare_string" is using cpu cycles. Ifyes, then the rulebase needs to be optimized. For more info on this command pleaserefer to the SW troubleshooting section.
The below CLI command requires CLI test-commands passwordconfigured in the chassis.Please use the command with caution!Many TEST commands are processor-intensive and can cause serioussystem problems if used too frequently.
This command can be run to perform an audit to determine if ruledef optimization is needed. In the below example, one rule needs to be optimized.
#debug acsmgr show rule-optimization-information
NOTE : O = Optimized, P = Partially Optimized and U = Unoptimized. N = Empty Ruledef.
RD = Ruledef, GR = Group of Ruledefs.
Rule Lines
==============================================================================================
==================
Ruledef Name 0 0 0 0 0 0 0 0 0 1 1 1 1 1 1 1 1 1 1 2 2 2 2 2 2 2 2
2 2 3 3 3 Status
1 2 3 4 5 6 7 8 9 0 1 2 3 4 5 6 7 8 9 0 1 2 3 4 5 6 7
8 9 0 1 2
==============================================================================================
==================
dns-pkts O O - - - - - - - - - - - - - - - - - - - - - - - - -
- - - - - O
ip-pkts U - - - - - - - - - - - - - - - - - - - - - - - - - -
- - - - - U
www-url-google O - - - - - - - - - - - - - - - - - - - - - - - - - -
- - - - - O
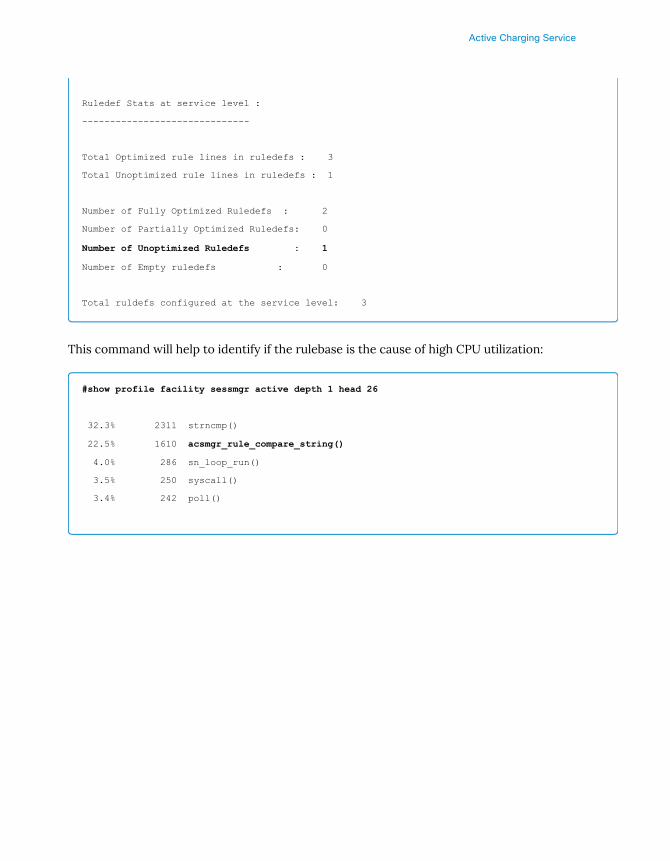
Active Charging Service
Ruledef Stats at service level :
------------------------------
Total Optimized rule lines in ruledefs : 3
Total Unoptimized rule lines in ruledefs : 1
Number of Fully Optimized Ruledefs : 2
Number of Partially Optimized Ruledefs: 0
Number of Unoptimized Ruledefs : 1
Number of Empty ruledefs : 0
Total ruldefs configured at the service level: 3
This command will help to identify if the rulebase is the cause of high CPU utilization:
#show profile facility sessmgr active depth 1 head 26
32.3% 2311 strncmp()
22.5% 1610 acsmgr_rule_compare_string()
4.0% 286 sn_loop_run()
3.5% 250 syscall()
3.4% 242 poll()

Active Charging Service
FW / NAT
Overview
This chapter provides an overview of the Network Address Translation (NAT) in-line servicewhich is part of the Active Charging Service (ACS) feature-set.
The following topics are covered in this chapter:
• NAT Overview
• NAT Mappings: 1:1 and Many-to-One
• NAT Application Level Gateway
• NAT Call Flow
• Gathering NAT Statistics
NAT Basics
NAT maps non-routable RFC 6568 defined private IP addresses to routable public IP addresses.These IPs are part of IP-pool configurations which reside in the configuration of the ASR5000/ASR 5500. There will be one or more pools in the private range(s) and separate pool(s) inthe public address space.
In typical deployments, NAT is enabled to provide for the conservation of public IP addressesrequired to communicate with external networks. It also provides some security as the IP ad-dress scheme for the internal network is masked from external hosts. Each outgoing and in-coming packet goes through the translation process.
The NAT in-line service works in conjunction with the following products:
• GGSN
• HA
• PDSN
• P-GW
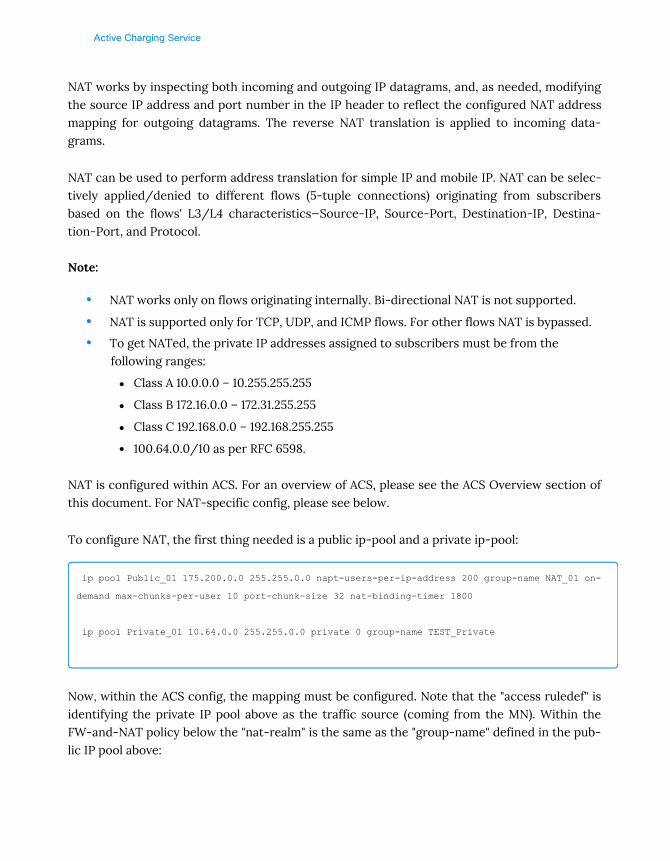
Active Charging Service
NAT works by inspecting both incoming and outgoing IP datagrams, and, as needed, modifyingthe source IP address and port number in the IP header to reflect the configured NAT addressmapping for outgoing datagrams. The reverse NAT translation is applied to incoming data-grams.
NAT can be used to perform address translation for simple IP and mobile IP. NAT can be selec-tively applied/denied to different flows (5-tuple connections) originating from subscribersbased on the flows' L3/L4 characteristics—Source-IP, Source-Port, Destination-IP, Destina-tion-Port, and Protocol.
Note:
• NAT works only on flows originating internally. Bi-directional NAT is not supported.
• NAT is supported only for TCP, UDP, and ICMP flows. For other flows NAT is bypassed.
• To get NATed, the private IP addresses assigned to subscribers must be from thefollowing ranges:
Class A 10.0.0.0 – 10.255.255.255
Class B 172.16.0.0 – 172.31.255.255
Class C 192.168.0.0 – 192.168.255.255
100.64.0.0/10 as per RFC 6598.
NAT is configured within ACS. For an overview of ACS, please see the ACS Overview section ofthis document. For NAT-specific config, please see below.
To configure NAT, the first thing needed is a public ip-pool and a private ip-pool:
ip pool Public_01 175.200.0.0 255.255.0.0 napt-users-per-ip-address 200 group-name NAT_01 on-
demand max-chunks-per-user 10 port-chunk-size 32 nat-binding-timer 1800
ip pool Private_01 10.64.0.0 255.255.0.0 private 0 group-name TEST_Private
Now, within the ACS config, the mapping must be configured. Note that the "access ruledef" isidentifying the private IP pool above as the traffic source (coming from the MN). Within theFW-and-NAT policy below the "nat-realm" is the same as the "group-name" defined in the pub-lic IP pool above:
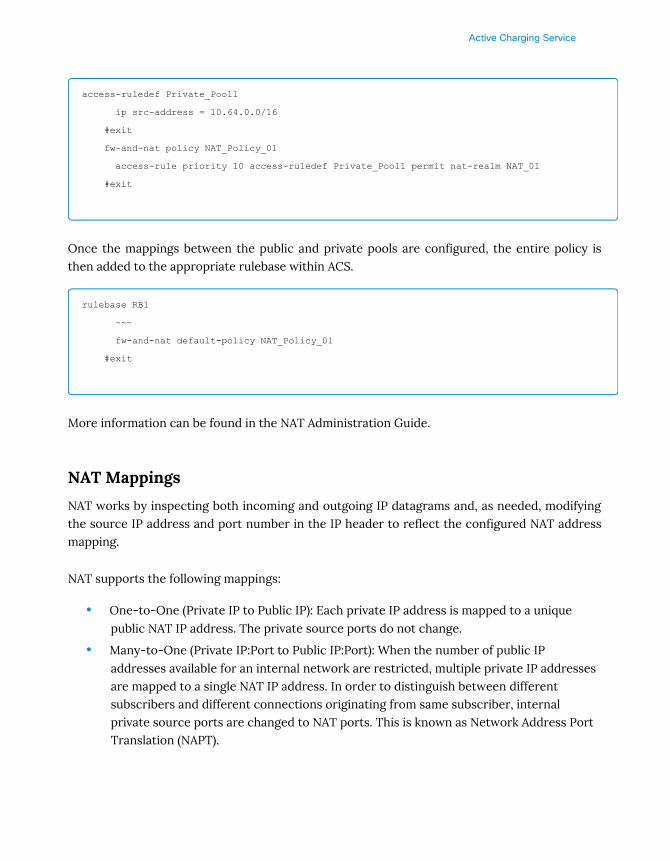
Active Charging Service
access-ruledef Private_Pool1
ip src-address = 10.64.0.0/16
#exit
fw-and-nat policy NAT_Policy_01
access-rule priority 10 access-ruledef Private_Pool1 permit nat-realm NAT_01
#exit
Once the mappings between the public and private pools are configured, the entire policy isthen added to the appropriate rulebase within ACS.
rulebase RB1
~~~
fw-and-nat default-policy NAT_Policy_01
#exit
More information can be found in the NAT Administration Guide.
NAT Mappings
NAT works by inspecting both incoming and outgoing IP datagrams and, as needed, modifyingthe source IP address and port number in the IP header to reflect the configured NAT addressmapping.
NAT supports the following mappings:
• One-to-One (Private IP to Public IP): Each private IP address is mapped to a uniquepublic NAT IP address. The private source ports do not change.
• Many-to-One (Private IP:Port to Public IP:Port): When the number of public IPaddresses available for an internal network are restricted, multiple private IP addressesare mapped to a single NAT IP address. In order to distinguish between differentsubscribers and different connections originating from same subscriber, internalprivate source ports are changed to NAT ports. This is known as Network Address PortTranslation (NAPT).

Active Charging Service
NAT Application Level Gateway
Some network applications exchange IP/port information of the host endpoints as part of thepacket payload. This information is used to create new flows, by server or client.
As part of NAT ALGs, the IP/port information is extracted and the flows allowed dynamically(pinholes). In case of NAT, IP and transport-level translations are done. However, the senderapplication may not be aware of these translations since these are transparent, so they insertthe private IP or port in the payload as usual.
Image - NAT Call Flow:
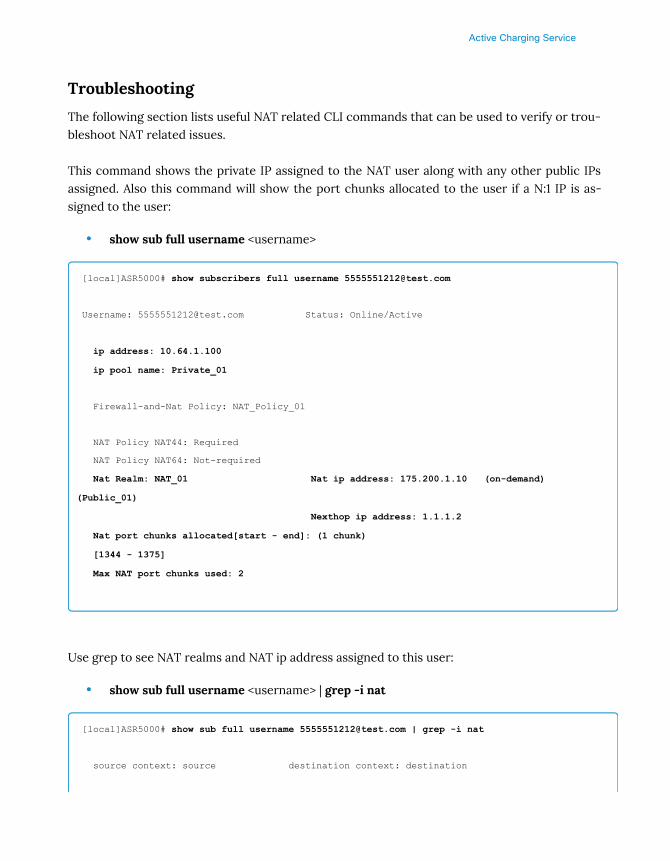
Active Charging Service
Troubleshooting
The following section lists useful NAT related CLI commands that can be used to verify or trou-bleshoot NAT related issues.
This command shows the private IP assigned to the NAT user along with any other public IPsassigned. Also this command will show the port chunks allocated to the user if a N:1 IP is as-signed to the user:
• show sub full username <username>
[local]ASR5000# show subscribers full username [email protected]
Username: [email protected] Status: Online/Active
ip address: 10.64.1.100
ip pool name: Private_01
Firewall-and-Nat Policy: NAT_Policy_01
NAT Policy NAT44: Required
NAT Policy NAT64: Not-required
Nat Realm: NAT_01 Nat ip address: 175.200.1.10 (on-demand)
(Public_01)
Nexthop ip address: 1.1.1.2
Nat port chunks allocated[start - end]: (1 chunk)
[1344 - 1375]
Max NAT port chunks used: 2
Use grep to see NAT realms and NAT ip address assigned to this user:
• show sub full username <username> | grep -i nat
[local]ASR5000# show sub full username [email protected] | grep -i nat
source context: source destination context: destination
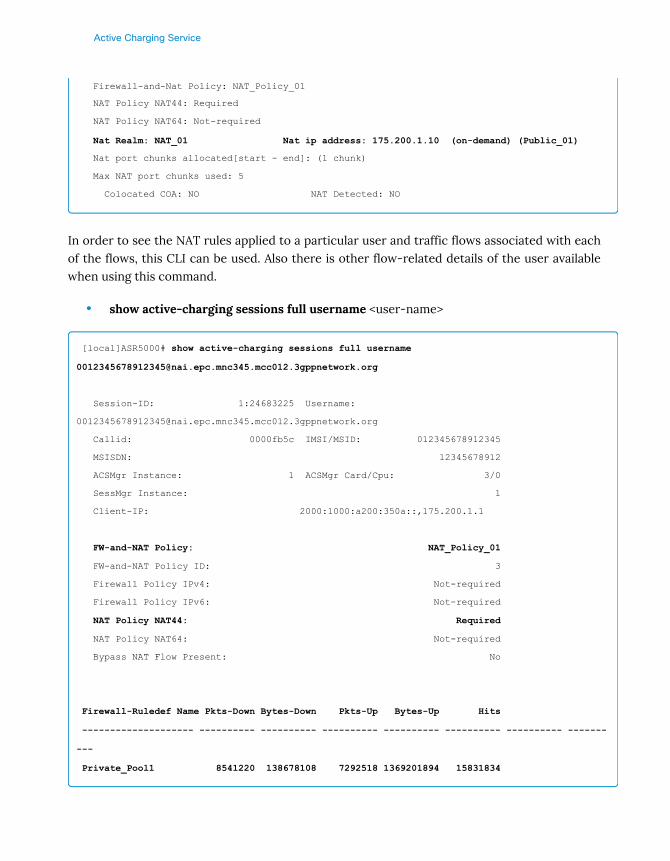
Active Charging Service
Firewall-and-Nat Policy: NAT_Policy_01
NAT Policy NAT44: Required
NAT Policy NAT64: Not-required
Nat Realm: NAT_01 Nat ip address: 175.200.1.10 (on-demand) (Public_01)
Nat port chunks allocated[start - end]: (1 chunk)
Max NAT port chunks used: 5
Colocated COA: NO NAT Detected: NO
In order to see the NAT rules applied to a particular user and traffic flows associated with eachof the flows, this CLI can be used. Also there is other flow-related details of the user availablewhen using this command.
• show active-charging sessions full username <user-name>
[local]ASR5000# show active-charging sessions full username
Session-ID: 1:24683225 Username:
Callid: 0000fb5c IMSI/MSID: 012345678912345
MSISDN: 12345678912
ACSMgr Instance: 1 ACSMgr Card/Cpu: 3/0
SessMgr Instance: 1
Client-IP: 2000:1000:a200:350a::,175.200.1.1
FW-and-NAT Policy: NAT_Policy_01
FW-and-NAT Policy ID: 3
Firewall Policy IPv4: Not-required
Firewall Policy IPv6: Not-required
NAT Policy NAT44: Required
NAT Policy NAT64: Not-required
Bypass NAT Flow Present: No
Firewall-Ruledef Name Pkts-Down Bytes-Down Pkts-Up Bytes-Up Hits
-------------------- ---------- ---------- ---------- ---------- ---------- ---------- -------
---
Private_Pool1 8541220 138678108 7292518 1369201894 15831834
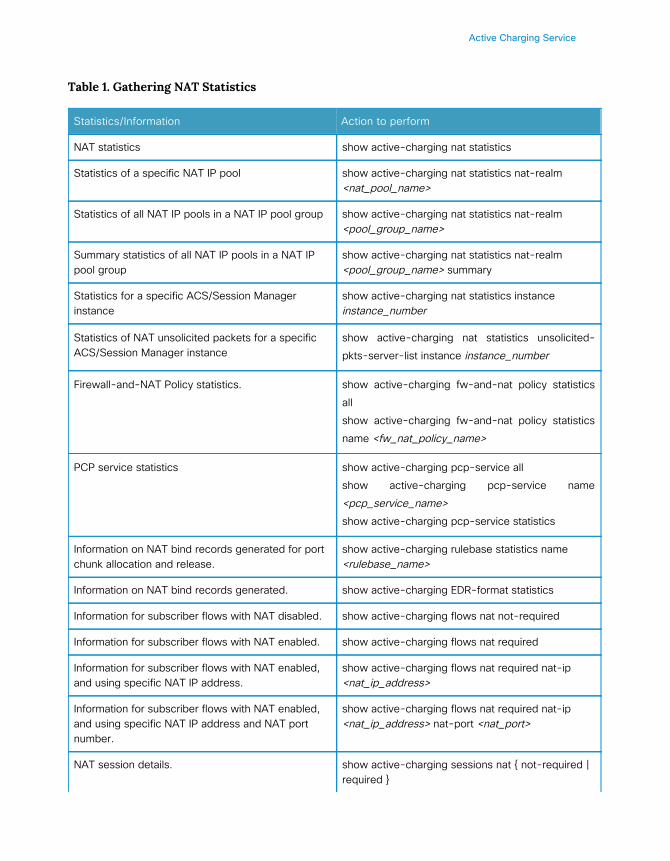
Active Charging Service
Table 1. Gathering NAT Statistics
Statistics/Information Action to perform
NAT statistics show active-charging nat statistics
Statistics of a specific NAT IP pool show active-charging nat statistics nat-realm<nat_pool_name>
Statistics of all NAT IP pools in a NAT IP pool group show active-charging nat statistics nat-realm<pool_group_name>
Summary statistics of all NAT IP pools in a NAT IPpool group
show active-charging nat statistics nat-realm<pool_group_name> summary
Statistics for a specific ACS/Session Managerinstance
show active-charging nat statistics instanceinstance_number
Statistics of NAT unsolicited packets for a specificACS/Session Manager instance
show active-charging nat statistics unsolicited-pkts-server-list instance instance_number
Firewall-and-NAT Policy statistics. show active-charging fw-and-nat policy statisticsallshow active-charging fw-and-nat policy statisticsname <fw_nat_policy_name>
PCP service statistics show active-charging pcp-service allshow active-charging pcp-service name<pcp_service_name>show active-charging pcp-service statistics
Information on NAT bind records generated for portchunk allocation and release.
show active-charging rulebase statistics name<rulebase_name>
Information on NAT bind records generated. show active-charging EDR-format statistics
Information for subscriber flows with NAT disabled. show active-charging flows nat not-required
Information for subscriber flows with NAT enabled. show active-charging flows nat required
Information for subscriber flows with NAT enabled,and using specific NAT IP address.
show active-charging flows nat required nat-ip<nat_ip_address>
Information for subscriber flows with NAT enabled,and using specific NAT IP address and NAT portnumber.
show active-charging flows nat required nat-ip<nat_ip_address> nat-port <nat_port>
NAT session details. show active-charging sessions nat { not-required |required }
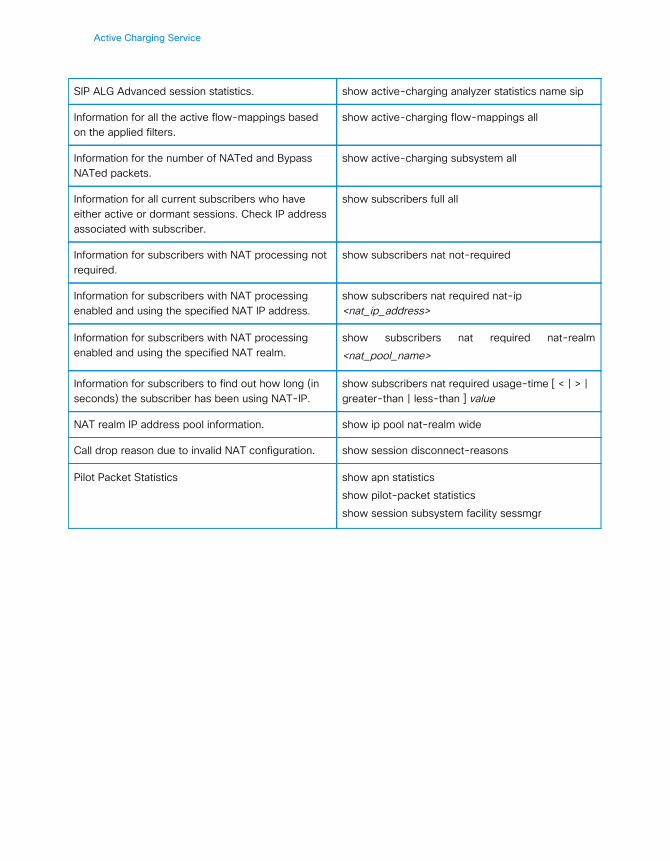
Active Charging Service
SIP ALG Advanced session statistics. show active-charging analyzer statistics name sip
Information for all the active flow-mappings basedon the applied filters.
show active-charging flow-mappings all
Information for the number of NATed and BypassNATed packets.
show active-charging subsystem all
Information for all current subscribers who haveeither active or dormant sessions. Check IP addressassociated with subscriber.
show subscribers full all
Information for subscribers with NAT processing notrequired.
show subscribers nat not-required
Information for subscribers with NAT processingenabled and using the specified NAT IP address.
show subscribers nat required nat-ip<nat_ip_address>
Information for subscribers with NAT processingenabled and using the specified NAT realm.
show subscribers nat required nat-realm<nat_pool_name>
Information for subscribers to find out how long (inseconds) the subscriber has been using NAT-IP.
show subscribers nat required usage-time [ < | > |greater-than | less-than ] value
NAT realm IP address pool information. show ip pool nat-realm wide
Call drop reason due to invalid NAT configuration. show session disconnect-reasons
Pilot Packet Statistics show apn statisticsshow pilot-packet statisticsshow session subsystem facility sessmgr
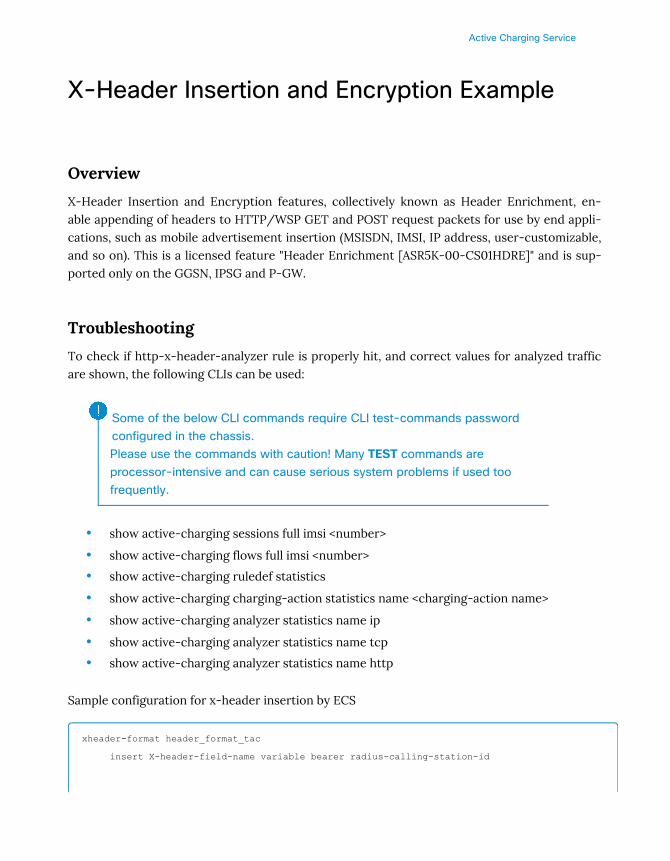
Active Charging Service
X-Header Insertion and Encryption Example
Overview
X-Header Insertion and Encryption features, collectively known as Header Enrichment, en-able appending of headers to HTTP/WSP GET and POST request packets for use by end appli-cations, such as mobile advertisement insertion (MSISDN, IMSI, IP address, user-customizable,and so on). This is a licensed feature "Header Enrichment [ASR5K-00-CS01HDRE]" and is sup-ported only on the GGSN, IPSG and P-GW.
Troubleshooting
To check if http-x-header-analyzer rule is properly hit, and correct values for analyzed trafficare shown, the following CLIs can be used:
Some of the below CLI commands require CLI test-commands passwordconfigured in the chassis.Please use the commands with caution! Many TEST commands areprocessor-intensive and can cause serious system problems if used toofrequently.
• show active-charging sessions full imsi <number>
• show active-charging flows full imsi <number>
• show active-charging ruledef statistics
• show active-charging charging-action statistics name <charging-action name>
• show active-charging analyzer statistics name ip
• show active-charging analyzer statistics name tcp
• show active-charging analyzer statistics name http
Sample configuration for x-header insertion by ECS
xheader-format header_format_tac
insert X-header-field-name variable bearer radius-calling-station-id
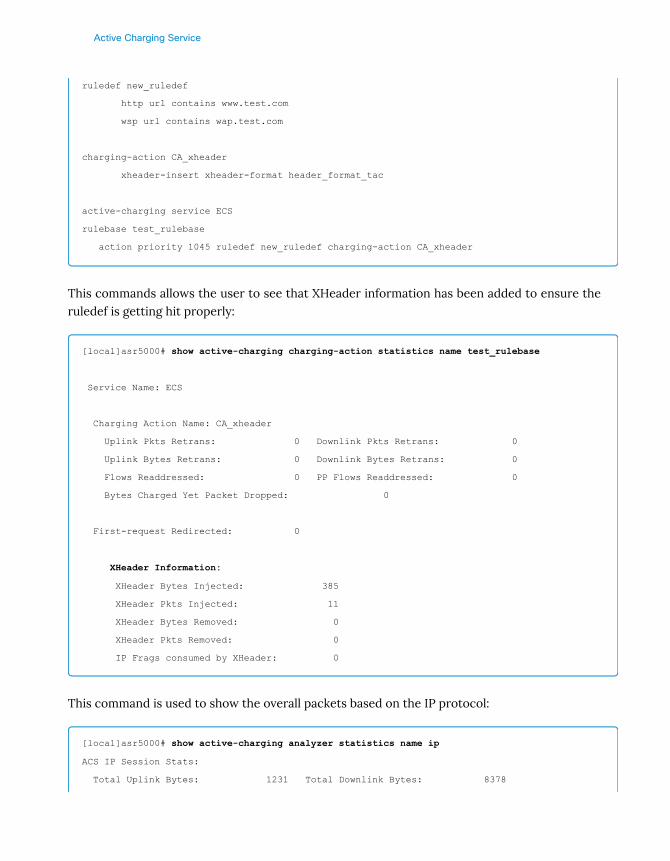
Active Charging Service
ruledef new_ruledef
http url contains www.test.com
wsp url contains wap.test.com
charging-action CA_xheader
xheader-insert xheader-format header_format_tac
active-charging service ECS
rulebase test_rulebase
action priority 1045 ruledef new_ruledef charging-action CA_xheader
This commands allows the user to see that XHeader information has been added to ensure theruledef is getting hit properly:
[local]asr5000# show active-charging charging-action statistics name test_rulebase
Service Name: ECS
Charging Action Name: CA_xheader
Uplink Pkts Retrans: 0 Downlink Pkts Retrans: 0
Uplink Bytes Retrans: 0 Downlink Bytes Retrans: 0
Flows Readdressed: 0 PP Flows Readdressed: 0
Bytes Charged Yet Packet Dropped: 0
First-request Redirected: 0
XHeader Information:
XHeader Bytes Injected: 385
XHeader Pkts Injected: 11
XHeader Bytes Removed: 0
XHeader Pkts Removed: 0
IP Frags consumed by XHeader: 0
This command is used to show the overall packets based on the IP protocol:
[local]asr5000# show active-charging analyzer statistics name ip
ACS IP Session Stats:
Total Uplink Bytes: 1231 Total Downlink Bytes: 8378
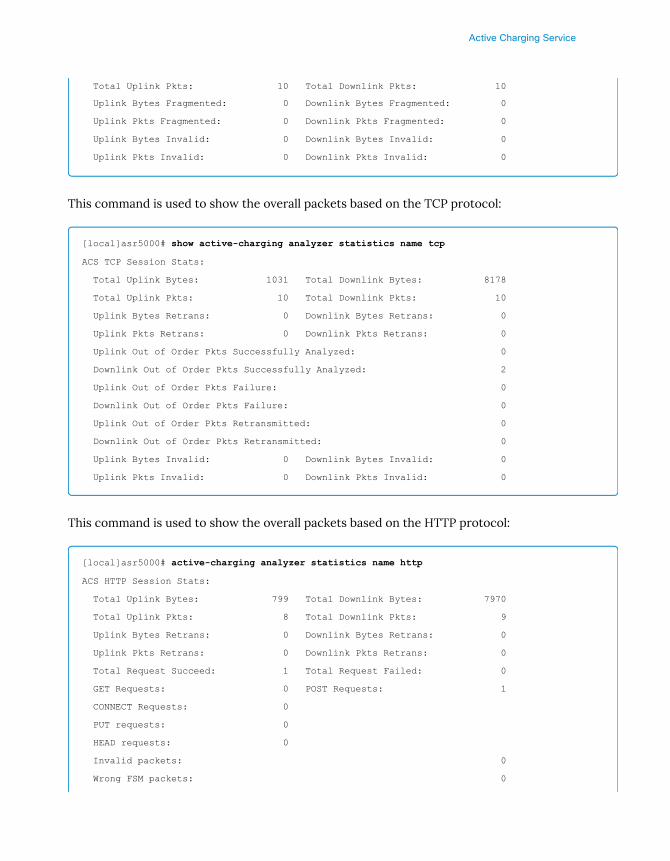
Active Charging Service
Total Uplink Pkts: 10 Total Downlink Pkts: 10
Uplink Bytes Fragmented: 0 Downlink Bytes Fragmented: 0
Uplink Pkts Fragmented: 0 Downlink Pkts Fragmented: 0
Uplink Bytes Invalid: 0 Downlink Bytes Invalid: 0
Uplink Pkts Invalid: 0 Downlink Pkts Invalid: 0
This command is used to show the overall packets based on the TCP protocol:
[local]asr5000# show active-charging analyzer statistics name tcp
ACS TCP Session Stats:
Total Uplink Bytes: 1031 Total Downlink Bytes: 8178
Total Uplink Pkts: 10 Total Downlink Pkts: 10
Uplink Bytes Retrans: 0 Downlink Bytes Retrans: 0
Uplink Pkts Retrans: 0 Downlink Pkts Retrans: 0
Uplink Out of Order Pkts Successfully Analyzed: 0
Downlink Out of Order Pkts Successfully Analyzed: 2
Uplink Out of Order Pkts Failure: 0
Downlink Out of Order Pkts Failure: 0
Uplink Out of Order Pkts Retransmitted: 0
Downlink Out of Order Pkts Retransmitted: 0
Uplink Bytes Invalid: 0 Downlink Bytes Invalid: 0
Uplink Pkts Invalid: 0 Downlink Pkts Invalid: 0
This command is used to show the overall packets based on the HTTP protocol:
[local]asr5000# active-charging analyzer statistics name http
ACS HTTP Session Stats:
Total Uplink Bytes: 799 Total Downlink Bytes: 7970
Total Uplink Pkts: 8 Total Downlink Pkts: 9
Uplink Bytes Retrans: 0 Downlink Bytes Retrans: 0
Uplink Pkts Retrans: 0 Downlink Pkts Retrans: 0
Total Request Succeed: 1 Total Request Failed: 0
GET Requests: 0 POST Requests: 1
CONNECT Requests: 0
PUT requests: 0
HEAD requests: 0
Invalid packets: 0
Wrong FSM packets: 0

Active Charging Service
Big request packets: 0
Big response packets: 0
Corrupt request packets: 0
Corrupt response packets: 0
Unhandled request packets: 0
Pipeline overflow packets: 0
Unanalyzed request packets: 0
Buffering error packets: 0
Unhandled response packets: 0
Unanalyzed response packets: 0
New requests on closed connection: 0
CLI for troubleshooting
Some of the below CLI commands require CLI test-commands passwordconfigured in the chassis.Please use the commands with caution! Many TEST commands areprocessor-intensive and can cause serious system problems if used toofrequently.
• show active-charging sessions full imsi <number>
• show active-charging flows full imsi <number>
• show active-charging ruledef statistics
• show active-charging charging-action statistics name <charging-action name>
• show active-charging analyzer statistics
• show active-charging rulebase statistics
• show active-charging charging-action statistics
• show active-charging ruledef statistics all charging
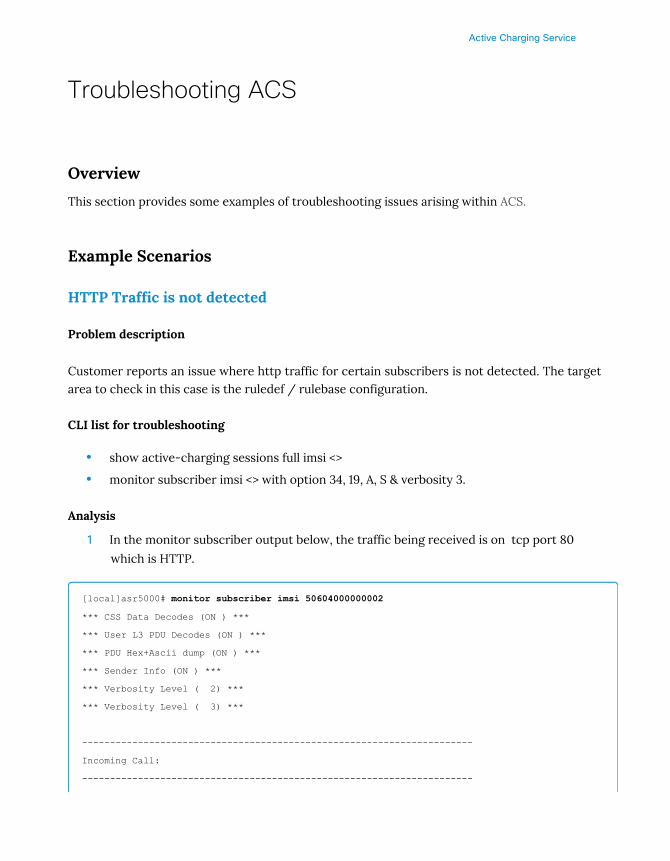
Active Charging Service
Troubleshooting ACS
Overview
This section provides some examples of troubleshooting issues arising within ACS.
Example Scenarios
HTTP Traffic is not detected
Problem description
Customer reports an issue where http traffic for certain subscribers is not detected. The targetarea to check in this case is the ruledef / rulebase configuration.
CLI list for troubleshooting
• show active-charging sessions full imsi <>
• monitor subscriber imsi <> with option 34, 19, A, S & verbosity 3.
Analysis
1 In the monitor subscriber output below, the traffic being received is on tcp port 80
which is HTTP.
[local]asr5000# monitor subscriber imsi 50604000000002
*** CSS Data Decodes (ON ) ***
*** User L3 PDU Decodes (ON ) ***
*** PDU Hex+Ascii dump (ON ) ***
*** Sender Info (ON ) ***
*** Verbosity Level ( 2) ***
*** Verbosity Level ( 3) ***
----------------------------------------------------------------------
Incoming Call:
----------------------------------------------------------------------
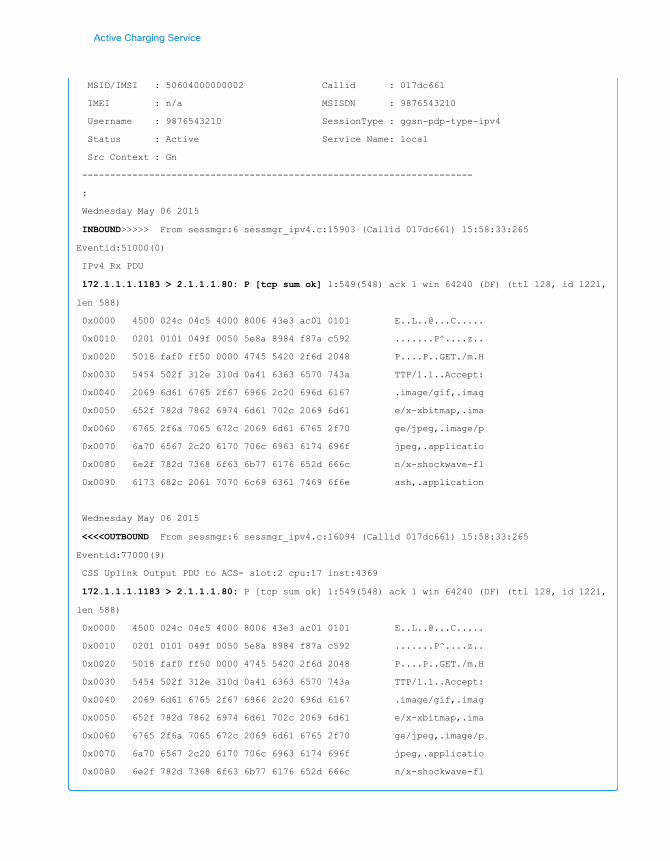
Active Charging Service
MSID/IMSI : 50604000000002 Callid : 017dc661
IMEI : n/a MSISDN : 9876543210
Username : 9876543210 SessionType : ggsn-pdp-type-ipv4
Status : Active Service Name: local
Src Context : Gn
----------------------------------------------------------------------
:
Wednesday May 06 2015
INBOUND>>>>> From sessmgr:6 sessmgr_ipv4.c:15903 (Callid 017dc661) 15:58:33:265
Eventid:51000(0)
IPv4 Rx PDU
172.1.1.1.1183 > 2.1.1.1.80: P [tcp sum ok] 1:549(548) ack 1 win 64240 (DF) (ttl 128, id 1221,
len 588)
0x0000 4500 024c 04c5 4000 8006 43e3 ac01 0101 [email protected].....
0x0010 0201 0101 049f 0050 5e8a 8984 f87a c592 .......P^....z..
0x0020 5018 faf0 ff50 0000 4745 5420 2f6d 2048 P....P..GET./m.H
0x0030 5454 502f 312e 310d 0a41 6363 6570 743a TTP/1.1..Accept:
0x0040 2069 6d61 6765 2f67 6966 2c20 696d 6167 .image/gif,.imag
0x0050 652f 782d 7862 6974 6d61 702c 2069 6d61 e/x-xbitmap,.ima
0x0060 6765 2f6a 7065 672c 2069 6d61 6765 2f70 ge/jpeg,.image/p
0x0070 6a70 6567 2c20 6170 706c 6963 6174 696f jpeg,.applicatio
0x0080 6e2f 782d 7368 6f63 6b77 6176 652d 666c n/x-shockwave-fl
0x0090 6173 682c 2061 7070 6c69 6361 7469 6f6e ash,.application
Wednesday May 06 2015
<<<<OUTBOUND From sessmgr:6 sessmgr_ipv4.c:16094 (Callid 017dc661) 15:58:33:265
Eventid:77000(9)
CSS Uplink Output PDU to ACS- slot:2 cpu:17 inst:4369
172.1.1.1.1183 > 2.1.1.1.80: P [tcp sum ok] 1:549(548) ack 1 win 64240 (DF) (ttl 128, id 1221,
len 588)
0x0000 4500 024c 04c5 4000 8006 43e3 ac01 0101 [email protected].....
0x0010 0201 0101 049f 0050 5e8a 8984 f87a c592 .......P^....z..
0x0020 5018 faf0 ff50 0000 4745 5420 2f6d 2048 P....P..GET./m.H
0x0030 5454 502f 312e 310d 0a41 6363 6570 743a TTP/1.1..Accept:
0x0040 2069 6d61 6765 2f67 6966 2c20 696d 6167 .image/gif,.imag
0x0050 652f 782d 7862 6974 6d61 702c 2069 6d61 e/x-xbitmap,.ima
0x0060 6765 2f6a 7065 672c 2069 6d61 6765 2f70 ge/jpeg,.image/p
0x0070 6a70 6567 2c20 6170 706c 6963 6174 696f jpeg,.applicatio
0x0080 6e2f 782d 7368 6f63 6b77 6176 652d 666c n/x-shockwave-fl

Active Charging Service
2 The config shows the routing ruledef for http, but no charging ruledef for classifying
http traffic:
config
active-charging service srv1
ruledef http-ports
tcp either-port = 80
rule-application routing
#exit
ruledef ip-pkts
ip any-match = TRUE
#exit
ruledef tcp-pkts
tcp any-match = TRUE
#exit
ruledef udp-pkts
udp any-match = TRUE
#exit
rulebase base1
default retransmissions-counted
billing-records egcdr
action priority 980 ruledef tcp-pkts charging-action standard
action priority 990 ruledef ip-pkts charging-action standard
route priority 80 ruledef http-ports analyzer http
flow control-handshaking charge-to-application all-packets
egcdr threshold interval 60
egcdr threshold volume total 100000
no transport-layer-checksum verify-during-packet-inspection
#exit
3 In the active charging session output, the traffic is classified as TCP instead of HTTP.
[local]asr5000# show active-charging sessions full imsi 50604000000002
Session-ID: 6:2 Username: [email protected]
Callid: 017dc661 IMSI/MSID: 50604000000002
MSISDN: 9876543210
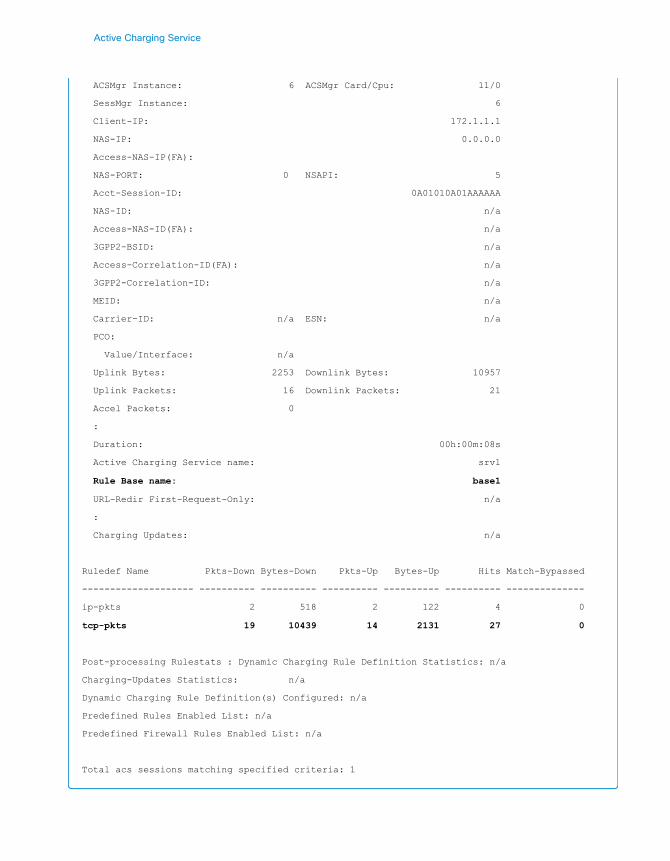
Active Charging Service
ACSMgr Instance: 6 ACSMgr Card/Cpu: 11/0
SessMgr Instance: 6
Client-IP: 172.1.1.1
NAS-IP: 0.0.0.0
Access-NAS-IP(FA):
NAS-PORT: 0 NSAPI: 5
Acct-Session-ID: 0A01010A01AAAAAA
NAS-ID: n/a
Access-NAS-ID(FA): n/a
3GPP2-BSID: n/a
Access-Correlation-ID(FA): n/a
3GPP2-Correlation-ID: n/a
MEID: n/a
Carrier-ID: n/a ESN: n/a
PCO:
Value/Interface: n/a
Uplink Bytes: 2253 Downlink Bytes: 10957
Uplink Packets: 16 Downlink Packets: 21
Accel Packets: 0
:
Duration: 00h:00m:08s
Active Charging Service name: srv1
Rule Base name: base1
URL-Redir First-Request-Only: n/a
:
Charging Updates: n/a
Ruledef Name Pkts-Down Bytes-Down Pkts-Up Bytes-Up Hits Match-Bypassed
-------------------- ---------- ---------- ---------- ---------- ---------- --------------
ip-pkts 2 518 2 122 4 0
tcp-pkts 19 10439 14 2131 27 0
Post-processing Rulestats : Dynamic Charging Rule Definition Statistics: n/a
Charging-Updates Statistics: n/a
Dynamic Charging Rule Definition(s) Configured: n/a
Predefined Rules Enabled List: n/a
Predefined Firewall Rules Enabled List: n/a
Total acs sessions matching specified criteria: 1
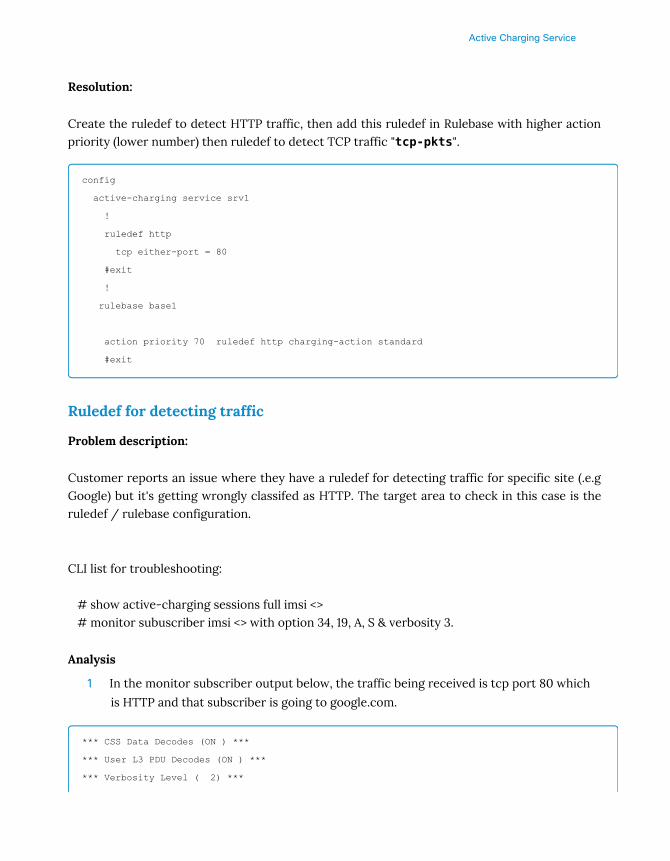
Active Charging Service
Resolution:
Create the ruledef to detect HTTP traffic, then add this ruledef in Rulebase with higher actionpriority (lower number) then ruledef to detect TCP traffic "tcp-pkts".
config
active-charging service srv1
!
ruledef http
tcp either-port = 80
#exit
!
rulebase base1
action priority 70 ruledef http charging-action standard
#exit
Ruledef for detecting traffic
Problem description:
Customer reports an issue where they have a ruledef for detecting traffic for specific site (.e.gGoogle) but it's getting wrongly classifed as HTTP. The target area to check in this case is theruledef / rulebase configuration.
CLI list for troubleshooting:
# show active-charging sessions full imsi <> # monitor subuscriber imsi <> with option 34, 19, A, S & verbosity 3.
Analysis
1 In the monitor subscriber output below, the traffic being received is tcp port 80 which
is HTTP and that subscriber is going to google.com.
*** CSS Data Decodes (ON ) ***
*** User L3 PDU Decodes (ON ) ***
*** Verbosity Level ( 2) ***

Active Charging Service
*** Verbosity Level ( 3) ***
*** Sender Info (ON ) ***
----------------------------------------------------------------------
Incoming Call:
----------------------------------------------------------------------
MSID/IMSI : 50604000000002 Callid : 017dc662
IMEI : n/a MSISDN : 9876543210
Username : 9876543210 SessionType : ggsn-pdp-type-ipv4
Status : Active Service Name: local
Src Context : Gn
----------------------------------------------------------------------
:
Wednesday May 06 2015
INBOUND>>>>> From sessmgr:6 sessmgr_ipv4.c:16113 (Callid 017dc662) 16:27:01:842
Eventid:77001(9)
CSS Uplink Input PDU from ACS- slot:3 cpu:34 inst:8738
172.1.1.1.1184 > 3.1.1.1.80: P [tcp sum ok] 1:338(337) ack 1 win 64240 (DF) (ttl 128, id 1235,
len 377)
0x0000 4500 0179 04d3 4000 8006 43a8 ac01 0101 [email protected].....
0x0010 0301 0101 04a0 0050 fad2 d78c 266a 061d .......P....&j..
0x0020 5018 faf0 ccc0 0000 4745 5420 2f6d 2f69 P.......GET./m/i
0x0030 6d61 6765 732f 6c6f 676f 5f73 6d61 6c6c mages/logo_small
0x0040 2e67 6966 2048 5454 502f 312e 310d 0a41 .gif.HTTP/1.1..A
0x0050 6363 6570 743a 202a 2f2a 0d0a 5265 6665 ccept:.*/*..Refe
0x0060 7265 723a 2068 7474 703a 2f2f 6e65 7773 rer:.http://news
0x0070 2e67 6f6f 676c 652e 636f 6d2f 6d0d 0a41 .google.com/m..A
0x0080 6363 6570 742d 4c61 6e67 7561 6765 3a20 ccept-Language:.
2 The config shows that the ruledef being matched for this traffic to Google is HTTP.
config
active-charging service srv1
ruledef http
tcp either-port = 80
#exit
ruledef http-ports
tcp either-port = 80
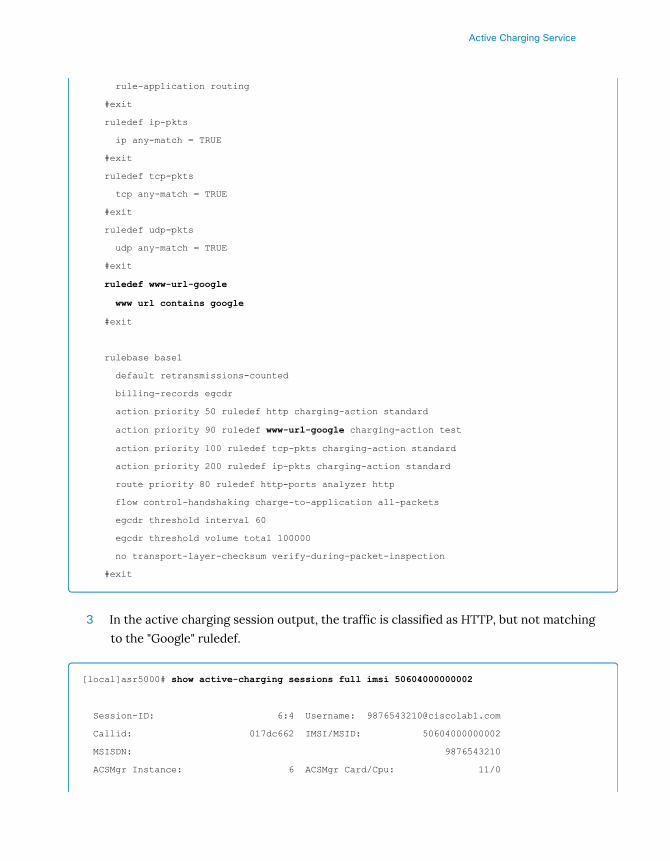
Active Charging Service
rule-application routing
#exit
ruledef ip-pkts
ip any-match = TRUE
#exit
ruledef tcp-pkts
tcp any-match = TRUE
#exit
ruledef udp-pkts
udp any-match = TRUE
#exit
ruledef www-url-google
www url contains google
#exit
rulebase base1
default retransmissions-counted
billing-records egcdr
action priority 50 ruledef http charging-action standard
action priority 90 ruledef www-url-google charging-action test
action priority 100 ruledef tcp-pkts charging-action standard
action priority 200 ruledef ip-pkts charging-action standard
route priority 80 ruledef http-ports analyzer http
flow control-handshaking charge-to-application all-packets
egcdr threshold interval 60
egcdr threshold volume total 100000
no transport-layer-checksum verify-during-packet-inspection
#exit
3 In the active charging session output, the traffic is classified as HTTP, but not matching
to the "Google" ruledef.
[local]asr5000# show active-charging sessions full imsi 50604000000002
Session-ID: 6:4 Username: [email protected]
Callid: 017dc662 IMSI/MSID: 50604000000002
MSISDN: 9876543210
ACSMgr Instance: 6 ACSMgr Card/Cpu: 11/0

Active Charging Service
SessMgr Instance: 6
Client-IP: 172.1.1.1
NAS-IP: 0.0.0.0
Access-NAS-IP(FA):
NAS-PORT: 0 NSAPI: 5
Acct-Session-ID: 0A01010A01AAAAAB
:
Duration: 00h:00m:34s
Active Charging Service name: srv1
Rule Base name: base1
:
Charging Updates: n/a
Ruledef Name Pkts-Down Bytes-Down Pkts-Up Bytes-Up Hits Match-Bypassed
-------------------- ---------- ---------- ---------- ---------- ---------- --------------
ip-pkts 2 518 2 122 4 0
http 19 10439 14 2131 27 0
Resolution:
The ruledef for catching traffic from Google needs to have higher priority then http ruledef.
rulebase base1
default retransmissions-counted
billing-records egcdr
action priority 90 ruledef www-url-google charging-action test
action priority 95 ruledef http charging-action standard
action priority 100 ruledef tcp-pkts charging-action standard
action priority 200 ruledef ip-pkts charging-action standard
route priority 80 ruledef http-ports analyzer http
flow control-handshaking charge-to-application all-packets
egcdr threshold interval 60
egcdr threshold volume total 100000
no transport-layer-checksum verify-during-packet-inspection
#exit

GTPP (CDR's)

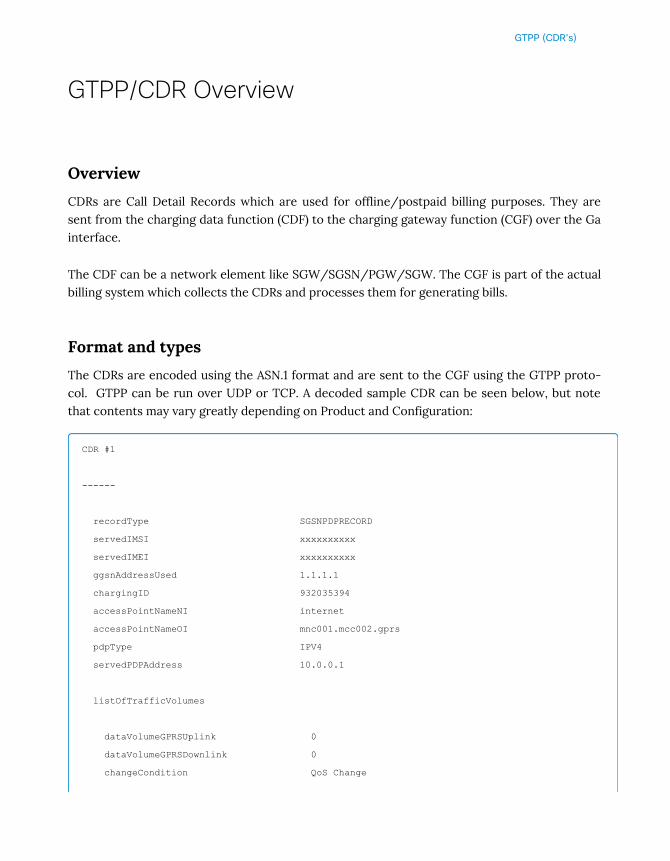
GTPP (CDR's)
GTPP/CDR Overview
Overview
CDRs are Call Detail Records which are used for offline/postpaid billing purposes. They aresent from the charging data function (CDF) to the charging gateway function (CGF) over the Gainterface.
The CDF can be a network element like SGW/SGSN/PGW/SGW. The CGF is part of the actualbilling system which collects the CDRs and processes them for generating bills.
Format and types
The CDRs are encoded using the ASN.1 format and are sent to the CGF using the GTPP proto-col. GTPP can be run over UDP or TCP. A decoded sample CDR can be seen below, but notethat contents may vary greatly depending on Product and Configuration:
CDR #1
------
recordType SGSNPDPRECORD
servedIMSI xxxxxxxxxx
servedIMEI xxxxxxxxxx
ggsnAddressUsed 1.1.1.1
chargingID 932035394
accessPointNameNI internet
accessPointNameOI mnc001.mcc002.gprs
pdpType IPV4
servedPDPAddress 10.0.0.1
listOfTrafficVolumes
dataVolumeGPRSUplink 0
dataVolumeGPRSDownlink 0
changeCondition QoS Change

GTPP (CDR's)
changeTime 140715090831
dataVolumeGPRSUplink 0
dataVolumeGPRSDownlink 0
changeCondition Record Closure
changeTime 140715090901
recordOpeningTime 140715090831
duration 30
causeForRecClosing Intra SGSN Inter System Change
sgsnAddress 2.2.2.2
msNetworkCapability e5 e0
rNCUnsentDownlinkVolume 2761
routingAreaCode 11
locationAreaCode 1f1f
cellIdentifier 3001
systmeType IuUTRAN
recordSequenceNumber 226
nodeID 1000GGSN01
Management Extensions follow
Ticket Layout Version 14
subCharacteristics 8
localSequenceNumber 26333225
apnSelectionMode MS or Network Provided and Subscription Verified
servedMSISDN xxxxxxxxxxxx
chargingCharacteristics Normal
There are several types of CDRs and some are listed below.
• Standard G-CDRs - Generated by GGSN
• eG-CDRs - Enhanced CDRs generated by GGSN. They contain more granular billinginfo for user-defined data flows (ECS aware).
• PGW-CDRs - Generated on PGW. Also contains more granular billing info (ECS aware).
• SGW-CDRs - Generated on GW
• S-CDRs - Generated on SGSN
There will be differences related to contents of the CDRs, but the same transport/configura-tion principles apply. The below diagram has a good overview of the different account-

GTPP (CDR's)
ing/billing functions of each product. Some products can use other billing mechanisms, or theycan combine several mechanism.
StarOS architecture for GTPP
To understand and troubleshoot CDRs and GTPP on StarOS Platforms, it is important to under-stand the architecture that is used.
Image: Software Architecture
Products Radius GTPP ECS-aware-CDR Diameter
GGSN Radius/Mediation G-CDR eG-CDR Gy
PGW Mediation PGW CDR Rf
SGW SGW CDR Rf
SGSN SCDR
PDSN Radius/Mediation
PMIP-PGW Rf
HA Radius/Mediation
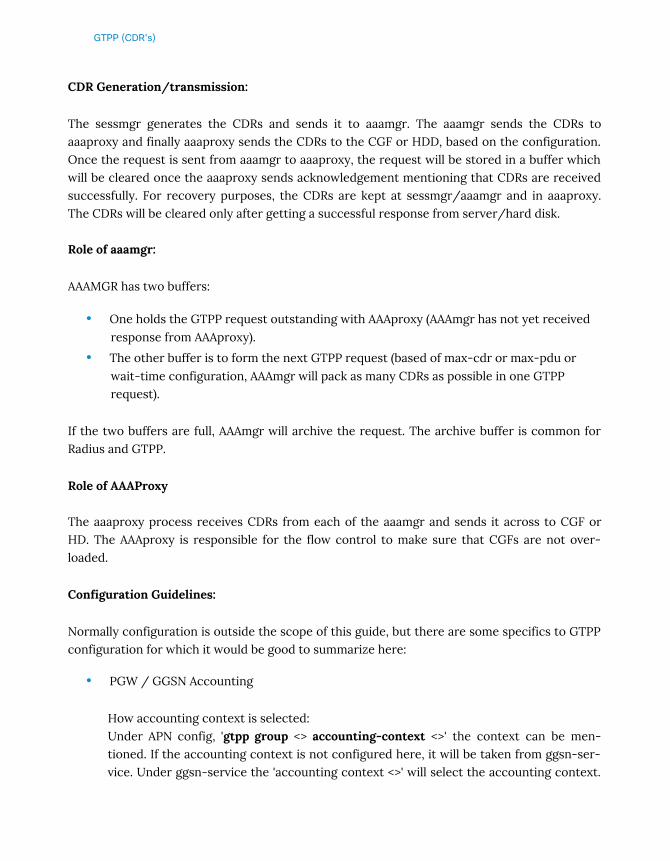
GTPP (CDR's)
CDR Generation/transmission:
The sessmgr generates the CDRs and sends it to aaamgr. The aaamgr sends the CDRs toaaaproxy and finally aaaproxy sends the CDRs to the CGF or HDD, based on the configuration.Once the request is sent from aaamgr to aaaproxy, the request will be stored in a buffer whichwill be cleared once the aaaproxy sends acknowledgement mentioning that CDRs are receivedsuccessfully. For recovery purposes, the CDRs are kept at sessmgr/aaamgr and in aaaproxy.The CDRs will be cleared only after getting a successful response from server/hard disk.
Role of aaamgr:
AAAMGR has two buffers:
• One holds the GTPP request outstanding with AAAproxy (AAAmgr has not yet receivedresponse from AAAproxy).
• The other buffer is to form the next GTPP request (based of max-cdr or max-pdu orwait-time configuration, AAAmgr will pack as many CDRs as possible in one GTPPrequest).
If the two buffers are full, AAAmgr will archive the request. The archive buffer is common forRadius and GTPP.
Role of AAAProxy
The aaaproxy process receives CDRs from each of the aaamgr and sends it across to CGF orHD. The AAAproxy is responsible for the flow control to make sure that CGFs are not over-loaded.
Configuration Guidelines:
Normally configuration is outside the scope of this guide, but there are some specifics to GTPPconfiguration for which it would be good to summarize here:
• PGW / GGSN Accounting
How accounting context is selected:Under APN config, 'gtpp group <> accounting-context <>' the context can be men-tioned. If the accounting context is not configured here, it will be taken from ggsn-ser-vice. Under ggsn-service the 'accounting context <>' will select the accounting context.

GTPP (CDR's)
If it is not configured, the context where ggsn-service is configured, will be the account-ing context.
How accounting mode is selected:Under APN, 'accounting mode radius-diameter/gtpp/none' CLI will decide the ac-counting mode. The default value of accounting mode is GTPP. If only eGCDRs needs tobe generated, then accounting mode should be none, and relevant egcdr configurationoptions should be configured under rulebase/charging-actions in the active-charging-service section).
How gtpp group is selected:Under APN, 'gtpp group <> accounting-context <>' will select the GTPP group. If it isnot configured, 'gtpp group default' will be selected.
How secondary gtpp group is selected for load balancing:Under APN, 'gtpp secondary-group <> accounting-context <>' will select the gtppgroup. If the accounting context is not configured here, it will be taken from ggsn-ser-vice. Under ggsn-service the 'accounting context <>' will select the accounting context.If it is not configured, the context where ggsn-service is configured, will be the account-ing context.
Sample config:
apn cisco.com
gtpp group group1 accounting-context Ga
• SGSN Accounting
How accounting context is selected:Under call-control-profile config, 'accounting context <> gtpp group <>' the contextcan be mentioned. If the accounting context is not configured there, it will be takenfrom sgsn-service. Under sgsn-service the 'accounting context <>' will select the ac-counting context. If it is not configured, the context where sgsn-service is config-ured will be the accounting context.
How accounting mode is selected:Under call-control-profile config, 'accounting mode gtpp' CLI will decide the account-ing mode. Default value is 'accounting mode none'.

GTPP (CDR's)
How gtpp group is selected:Under call-control-profile config, 'accounting context <> gtpp group <>' the gtpp groupcan be mentioned. If it is not configured 'gtpp group default' will be selected.
Sample config:
call-control-profile umts
accounting context ctx gtpp group sgsn
• SGW Accounting
How accounting context is selected:Under call-control-profile config, 'accounting context <> gtpp group <>' the contextcan be mentioned. If the accounting context is not configured there, it will be takenfrom sgw-service. Under sgw-service the 'accounting context <> gtpp group <>' will se-lect the accounting context. If it is not configured, the context where sgw-service isconfigured, will be the accounting context.
How accounting mode is selected:Under call-control-profile config, 'accounting mode gtpp' CLI will decide the account-ing mode. If its is not configured there, 'accounting mode gtpp' from sgw-service will beselected. If it is not configured in sgw-service, default value is 'accounting mode none'.
How gtpp group is selected:Under call-control-profile config, 'accounting context <> gtpp group <>' the gtpp groupcan be mentioned. If only 'accounting context <>' is configured in CCP, the gtpp groupwill be 'default'. If nothing is configured in CCP, the value will be taken from sgw-service'accounting context <> gtpp group <>'. If it is not configured 'gtpp group default' will beselected.
Sample config:
call-control-profile lte
accounting context ctx gtpp group sgw
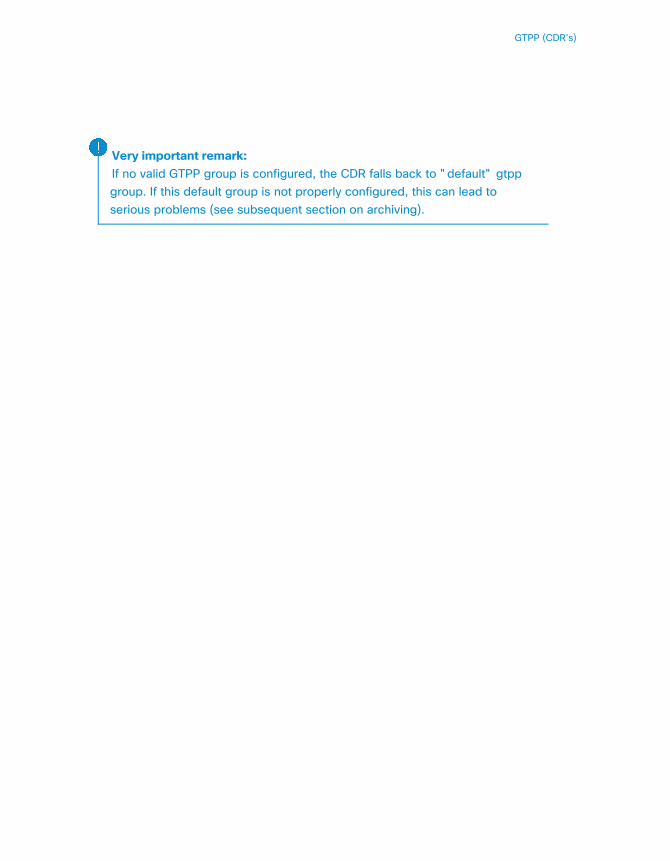
GTPP (CDR's)
Very important remark:If no valid GTPP group is configured, the CDR falls back to "default" gtppgroup. If this default group is not properly configured, this can lead toserious problems (see subsequent section on archiving).

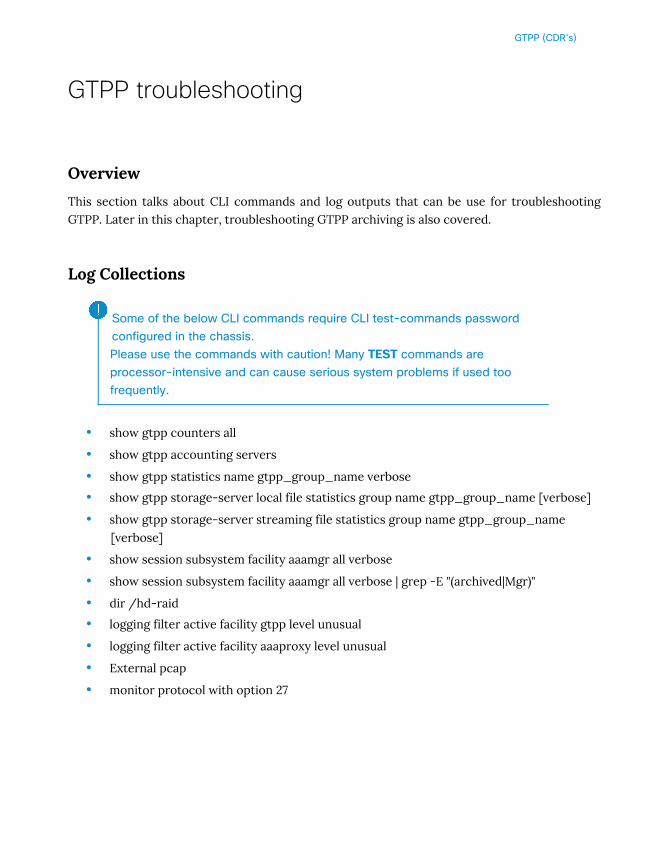
GTPP (CDR's)
GTPP troubleshooting
Overview
This section talks about CLI commands and log outputs that can be use for troubleshootingGTPP. Later in this chapter, troubleshooting GTPP archiving is also covered.
Log Collections
Some of the below CLI commands require CLI test-commands passwordconfigured in the chassis.Please use the commands with caution! Many TEST commands areprocessor-intensive and can cause serious system problems if used toofrequently.
• show gtpp counters all
• show gtpp accounting servers
• show gtpp statistics name gtpp_group_name verbose
• show gtpp storage-server local file statistics group name gtpp_group_name [verbose]
• show gtpp storage-server streaming file statistics group name gtpp_group_name[verbose]
• show session subsystem facility aaamgr all verbose
• show session subsystem facility aaamgr all verbose | grep -E "(archived|Mgr)"
• dir /hd-raid
• logging filter active facility gtpp level unusual
• logging filter active facility aaaproxy level unusual
• External pcap
• monitor protocol with option 27
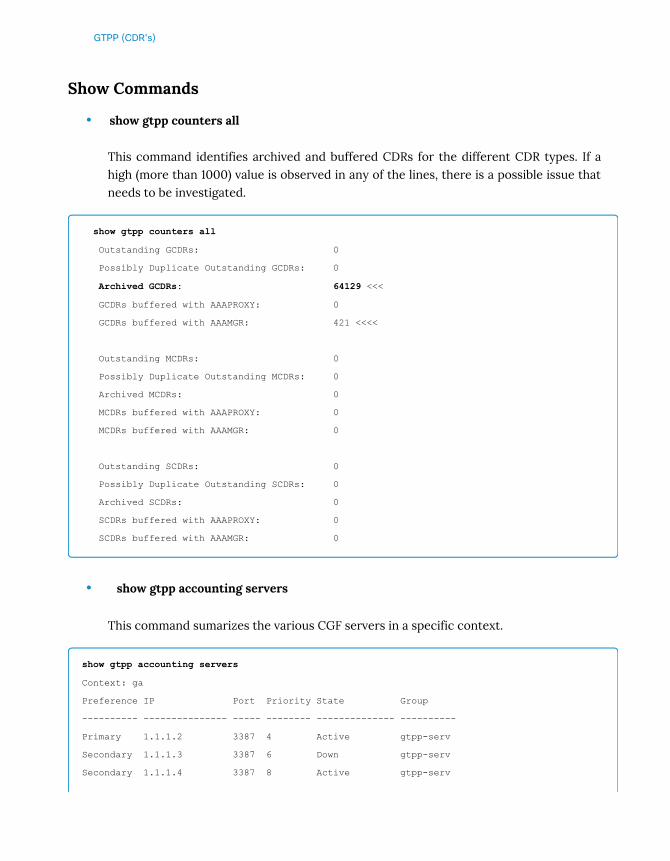
GTPP (CDR's)
Show Commands
• show gtpp counters all
This command identifies archived and buffered CDRs for the different CDR types. If ahigh (more than 1000) value is observed in any of the lines, there is a possible issue thatneeds to be investigated.
show gtpp counters all
Outstanding GCDRs: 0
Possibly Duplicate Outstanding GCDRs: 0
Archived GCDRs: 64129 <<<
GCDRs buffered with AAAPROXY: 0
GCDRs buffered with AAAMGR: 421 <<<<
Outstanding MCDRs: 0
Possibly Duplicate Outstanding MCDRs: 0
Archived MCDRs: 0
MCDRs buffered with AAAPROXY: 0
MCDRs buffered with AAAMGR: 0
Outstanding SCDRs: 0
Possibly Duplicate Outstanding SCDRs: 0
Archived SCDRs: 0
SCDRs buffered with AAAPROXY: 0
SCDRs buffered with AAAMGR: 0
• show gtpp accounting servers
This command sumarizes the various CGF servers in a specific context.
show gtpp accounting servers
Context: ga
Preference IP Port Priority State Group
---------- --------------- ----- -------- -------------- ----------
Primary 1.1.1.2 3387 4 Active gtpp-serv
Secondary 1.1.1.3 3387 6 Down gtpp-serv
Secondary 1.1.1.4 3387 8 Active gtpp-serv
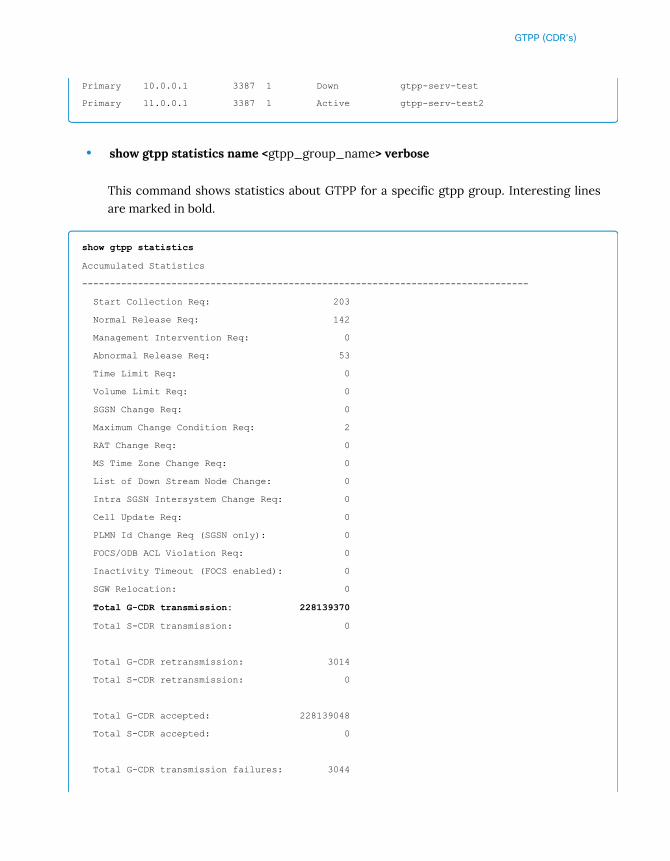
GTPP (CDR's)
Primary 10.0.0.1 3387 1 Down gtpp-serv-test
Primary 11.0.0.1 3387 1 Active gtpp-serv-test2
• show gtpp statistics name <gtpp_group_name> verbose
This command shows statistics about GTPP for a specific gtpp group. Interesting linesare marked in bold.
show gtpp statistics
Accumulated Statistics
--------------------------------------------------------------------------------
Start Collection Req: 203
Normal Release Req: 142
Management Intervention Req: 0
Abnormal Release Req: 53
Time Limit Req: 0
Volume Limit Req: 0
SGSN Change Req: 0
Maximum Change Condition Req: 2
RAT Change Req: 0
MS Time Zone Change Req: 0
List of Down Stream Node Change: 0
Intra SGSN Intersystem Change Req: 0
Cell Update Req: 0
PLMN Id Change Req (SGSN only): 0
FOCS/ODB ACL Violation Req: 0
Inactivity Timeout (FOCS enabled): 0
SGW Relocation: 0
Total G-CDR transmission: 228139370
Total S-CDR transmission: 0
Total G-CDR retransmission: 3014
Total S-CDR retransmission: 0
Total G-CDR accepted: 228139048
Total S-CDR accepted: 0
Total G-CDR transmission failures: 3044
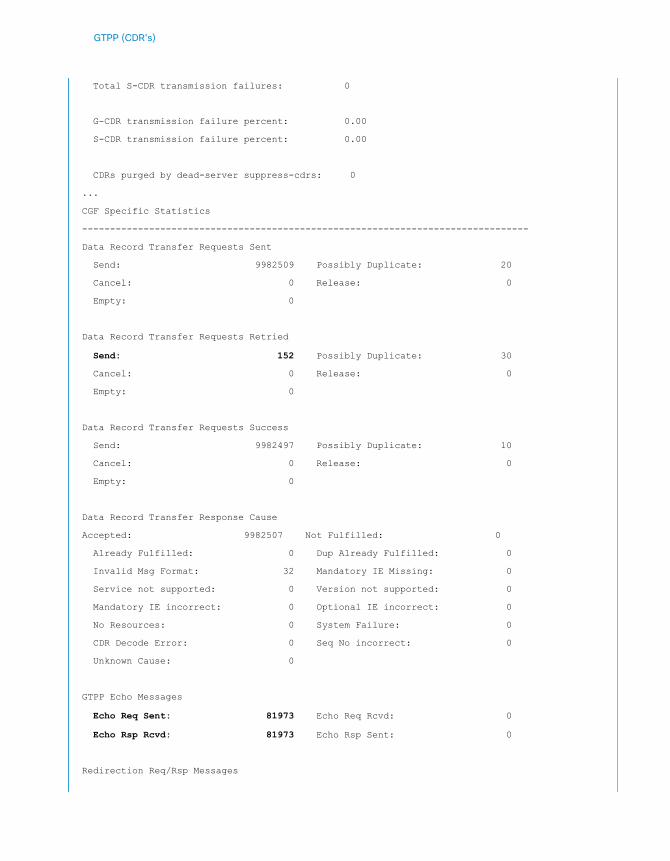
GTPP (CDR's)
Total S-CDR transmission failures: 0
G-CDR transmission failure percent: 0.00
S-CDR transmission failure percent: 0.00
CDRs purged by dead-server suppress-cdrs: 0
...
CGF Specific Statistics
--------------------------------------------------------------------------------
Data Record Transfer Requests Sent
Send: 9982509 Possibly Duplicate: 20
Cancel: 0 Release: 0
Empty: 0
Data Record Transfer Requests Retried
Send: 152 Possibly Duplicate: 30
Cancel: 0 Release: 0
Empty: 0
Data Record Transfer Requests Success
Send: 9982497 Possibly Duplicate: 10
Cancel: 0 Release: 0
Empty: 0
Data Record Transfer Response Cause
Accepted: 9982507 Not Fulfilled: 0
Already Fulfilled: 0 Dup Already Fulfilled: 0
Invalid Msg Format: 32 Mandatory IE Missing: 0
Service not supported: 0 Version not supported: 0
Mandatory IE incorrect: 0 Optional IE incorrect: 0
No Resources: 0 System Failure: 0
CDR Decode Error: 0 Seq No incorrect: 0
Unknown Cause: 0
GTPP Echo Messages
Echo Req Sent: 81973 Echo Req Rcvd: 0
Echo Rsp Rcvd: 81973 Echo Rsp Sent: 0
Redirection Req/Rsp Messages
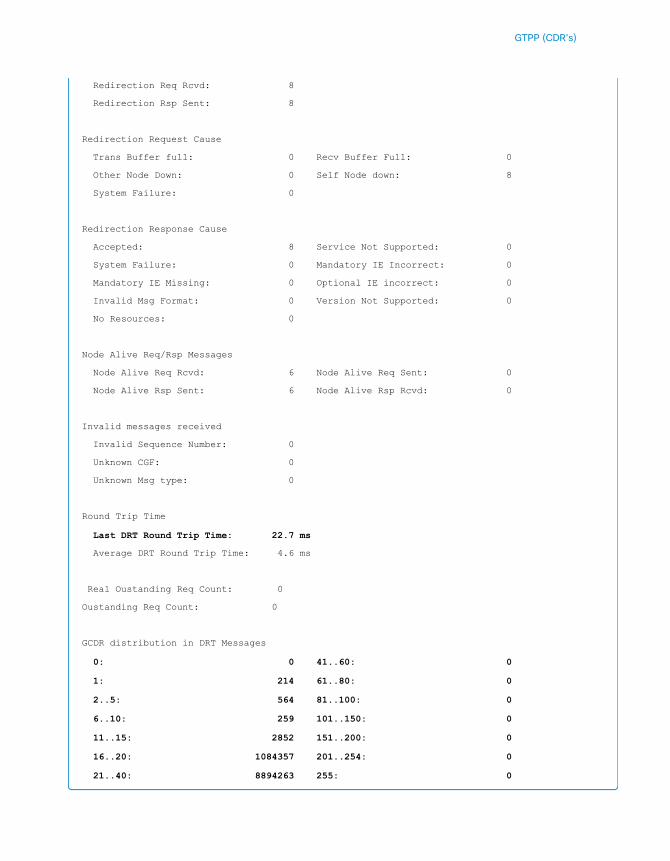
GTPP (CDR's)
Redirection Req Rcvd: 8
Redirection Rsp Sent: 8
Redirection Request Cause
Trans Buffer full: 0 Recv Buffer Full: 0
Other Node Down: 0 Self Node down: 8
System Failure: 0
Redirection Response Cause
Accepted: 8 Service Not Supported: 0
System Failure: 0 Mandatory IE Incorrect: 0
Mandatory IE Missing: 0 Optional IE incorrect: 0
Invalid Msg Format: 0 Version Not Supported: 0
No Resources: 0
Node Alive Req/Rsp Messages
Node Alive Req Rcvd: 6 Node Alive Req Sent: 0
Node Alive Rsp Sent: 6 Node Alive Rsp Rcvd: 0
Invalid messages received
Invalid Sequence Number: 0
Unknown CGF: 0
Unknown Msg type: 0
Round Trip Time
Last DRT Round Trip Time: 22.7 ms
Average DRT Round Trip Time: 4.6 ms
Real Oustanding Req Count: 0
Oustanding Req Count: 0
GCDR distribution in DRT Messages
0: 0 41..60: 0
1: 214 61..80: 0
2..5: 564 81..100: 0
6..10: 259 101..150: 0
11..15: 2852 151..200: 0
16..20: 1084357 201..254: 0
21..40: 8894263 255: 0
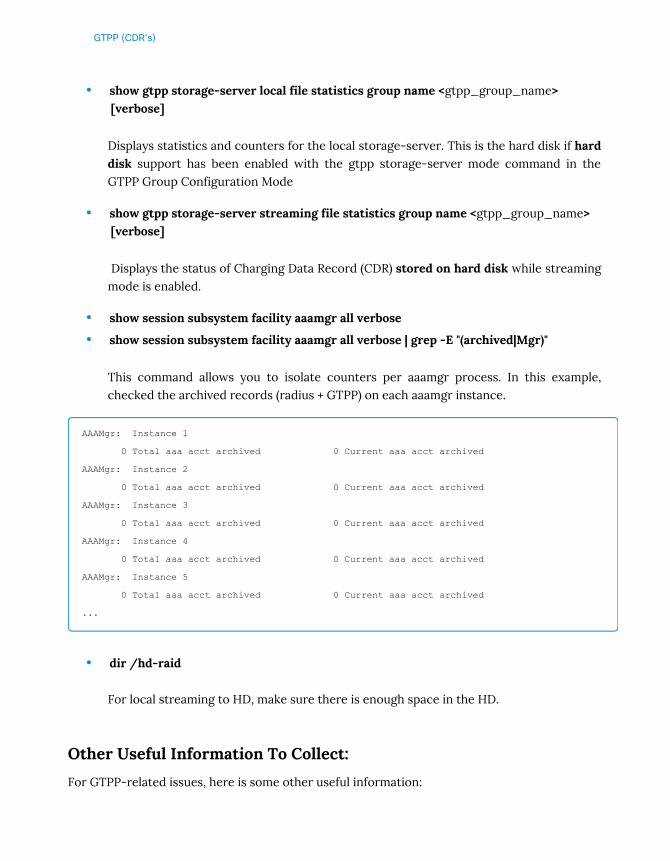
GTPP (CDR's)
• show gtpp storage-server local file statistics group name <gtpp_group_name>[verbose]
Displays statistics and counters for the local storage-server. This is the hard disk if harddisk support has been enabled with the gtpp storage-server mode command in theGTPP Group Configuration Mode
• show gtpp storage-server streaming file statistics group name <gtpp_group_name>[verbose]
Displays the status of Charging Data Record (CDR) stored on hard disk while streamingmode is enabled.
• show session subsystem facility aaamgr all verbose
• show session subsystem facility aaamgr all verbose | grep -E "(archived|Mgr)"
This command allows you to isolate counters per aaamgr process. In this example,checked the archived records (radius + GTPP) on each aaamgr instance.
AAAMgr: Instance 1
0 Total aaa acct archived 0 Current aaa acct archived
AAAMgr: Instance 2
0 Total aaa acct archived 0 Current aaa acct archived
AAAMgr: Instance 3
0 Total aaa acct archived 0 Current aaa acct archived
AAAMgr: Instance 4
0 Total aaa acct archived 0 Current aaa acct archived
AAAMgr: Instance 5
0 Total aaa acct archived 0 Current aaa acct archived
...
• dir /hd-raid
For local streaming to HD, make sure there is enough space in the HD.
Other Useful Information To Collect:
For GTPP-related issues, here is some other useful information:
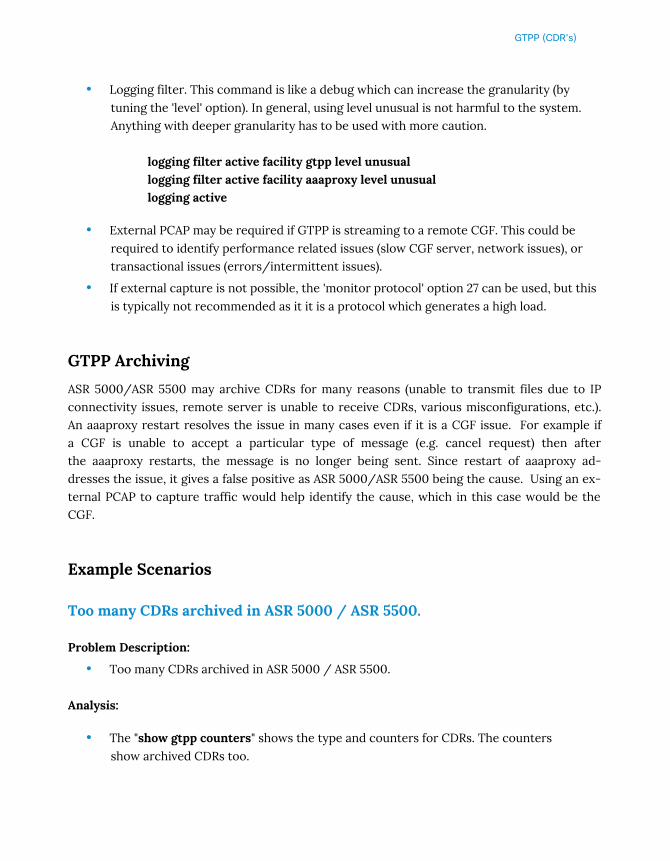
GTPP (CDR's)
• Logging filter. This command is like a debug which can increase the granularity (bytuning the 'level' option). In general, using level unusual is not harmful to the system.Anything with deeper granularity has to be used with more caution.
logging filter active facility gtpp level unusual logging filter active facility aaaproxy level unusual logging active
• External PCAP may be required if GTPP is streaming to a remote CGF. This could berequired to identify performance related issues (slow CGF server, network issues), ortransactional issues (errors/intermittent issues).
• If external capture is not possible, the 'monitor protocol' option 27 can be used, but thisis typically not recommended as it it is a protocol which generates a high load.
GTPP Archiving
ASR 5000/ASR 5500 may archive CDRs for many reasons (unable to transmit files due to IPconnectivity issues, remote server is unable to receive CDRs, various misconfigurations, etc.).An aaaproxy restart resolves the issue in many cases even if it is a CGF issue. For example ifa CGF is unable to accept a particular type of message (e.g. cancel request) then afterthe aaaproxy restarts, the message is no longer being sent. Since restart of aaaproxy ad-dresses the issue, it gives a false positive as ASR 5000/ASR 5500 being the cause. Using an ex-ternal PCAP to capture traffic would help identify the cause, which in this case would be theCGF.
Example Scenarios
Too many CDRs archived in ASR 5000 / ASR 5500.
Problem Description:
• Too many CDRs archived in ASR 5000 / ASR 5500.
Analysis:
• The "show gtpp counters" shows the type and counters for CDRs. The countersshow archived CDRs too.
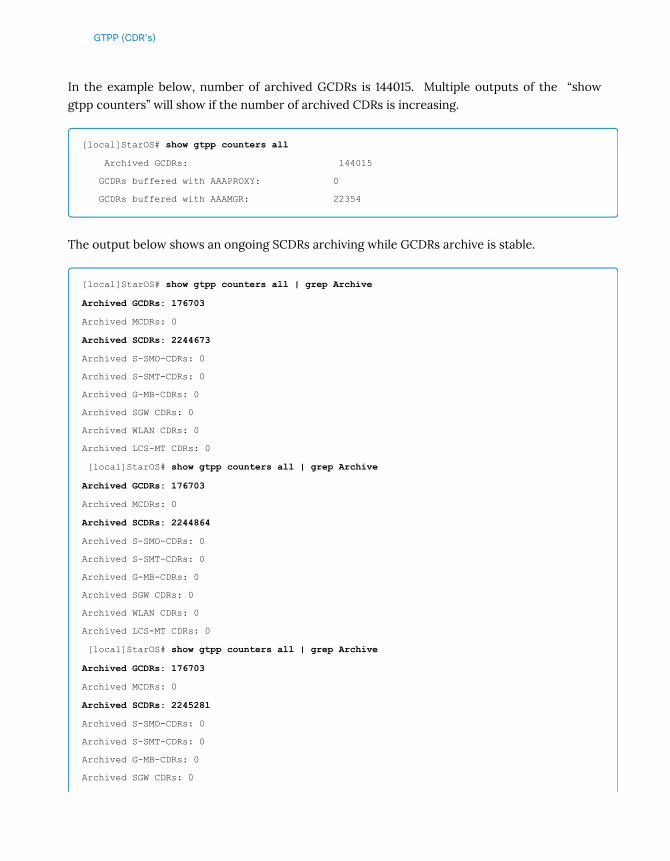
GTPP (CDR's)
In the example below, number of archived GCDRs is 144015. Multiple outputs of the “showgtpp counters” will show if the number of archived CDRs is increasing.
[local]StarOS# show gtpp counters all
Archived GCDRs: 144015
GCDRs buffered with AAAPROXY: 0
GCDRs buffered with AAAMGR: 22354
The output below shows an ongoing SCDRs archiving while GCDRs archive is stable.
[local]StarOS# show gtpp counters all | grep Archive
Archived GCDRs: 176703
Archived MCDRs: 0
Archived SCDRs: 2244673
Archived S-SMO-CDRs: 0
Archived S-SMT-CDRs: 0
Archived G-MB-CDRs: 0
Archived SGW CDRs: 0
Archived WLAN CDRs: 0
Archived LCS-MT CDRs: 0
[local]StarOS# show gtpp counters all | grep Archive
Archived GCDRs: 176703
Archived MCDRs: 0
Archived SCDRs: 2244864
Archived S-SMO-CDRs: 0
Archived S-SMT-CDRs: 0
Archived G-MB-CDRs: 0
Archived SGW CDRs: 0
Archived WLAN CDRs: 0
Archived LCS-MT CDRs: 0
[local]StarOS# show gtpp counters all | grep Archive
Archived GCDRs: 176703
Archived MCDRs: 0
Archived SCDRs: 2245281
Archived S-SMO-CDRs: 0
Archived S-SMT-CDRs: 0
Archived G-MB-CDRs: 0
Archived SGW CDRs: 0
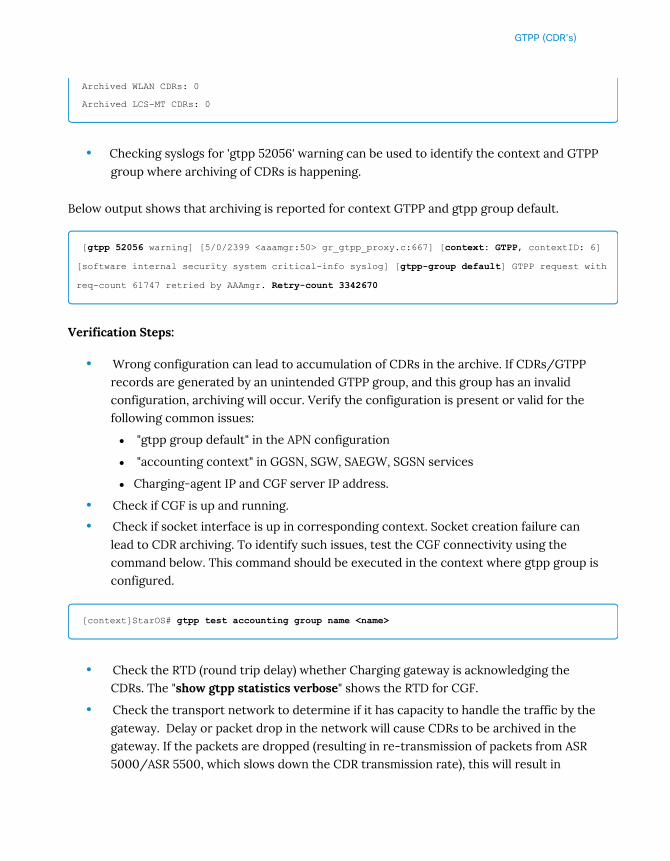
GTPP (CDR's)
Archived WLAN CDRs: 0
Archived LCS-MT CDRs: 0
• Checking syslogs for 'gtpp 52056' warning can be used to identify the context and GTPPgroup where archiving of CDRs is happening.
Below output shows that archiving is reported for context GTPP and gtpp group default.
[gtpp 52056 warning] [5/0/2399 <aaamgr:50> gr_gtpp_proxy.c:667] [context: GTPP, contextID: 6]
[software internal security system critical-info syslog] [gtpp-group default] GTPP request with
req-count 61747 retried by AAAmgr. Retry-count 3342670
Verification Steps:
• Wrong configuration can lead to accumulation of CDRs in the archive. If CDRs/GTPPrecords are generated by an unintended GTPP group, and this group has an invalidconfiguration, archiving will occur. Verify the configuration is present or valid for thefollowing common issues:
"gtpp group default" in the APN configuration
"accounting context" in GGSN, SGW, SAEGW, SGSN services
Charging-agent IP and CGF server IP address.
• Check if CGF is up and running.
• Check if socket interface is up in corresponding context. Socket creation failure canlead to CDR archiving. To identify such issues, test the CGF connectivity using thecommand below. This command should be executed in the context where gtpp group isconfigured.
[context]StarOS# gtpp test accounting group name <name>
• Check the RTD (round trip delay) whether Charging gateway is acknowledging theCDRs. The "show gtpp statistics verbose" shows the RTD for CGF.
• Check the transport network to determine if it has capacity to handle the traffic by thegateway. Delay or packet drop in the network will cause CDRs to be archived in thegateway. If the packets are dropped (resulting in re-transmission of packets from ASR5000/ASR 5500, which slows down the CDR transmission rate), this will result in
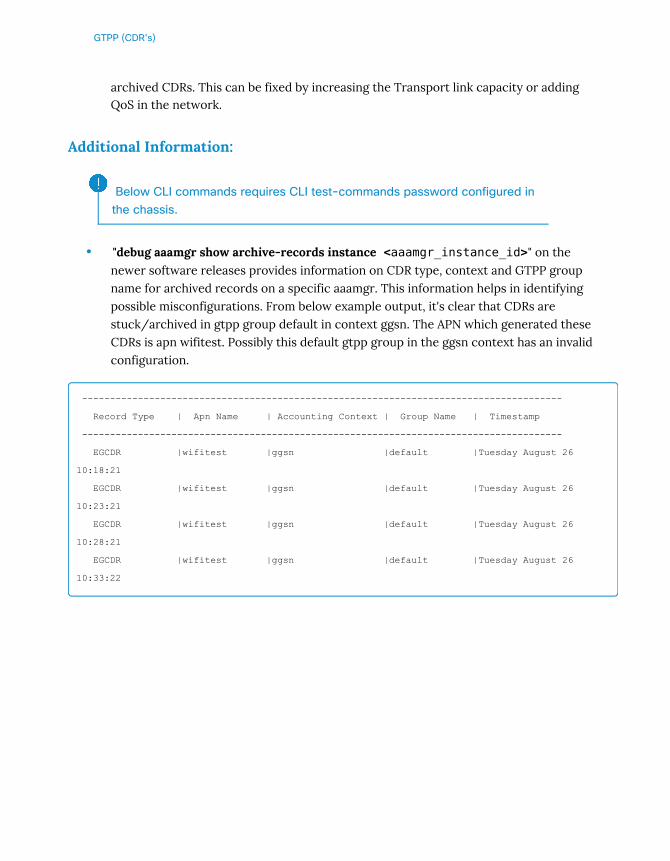
GTPP (CDR's)
archived CDRs. This can be fixed by increasing the Transport link capacity or addingQoS in the network.
Additional Information:
Below CLI commands requires CLI test-commands password configured inthe chassis.
• "debug aaamgr show archive-records instance <aaamgr_instance_id>" on thenewer software releases provides information on CDR type, context and GTPP groupname for archived records on a specific aaamgr. This information helps in identifyingpossible misconfigurations. From below example output, it's clear that CDRs arestuck/archived in gtpp group default in context ggsn. The APN which generated theseCDRs is apn wifitest. Possibly this default gtpp group in the ggsn context has an invalidconfiguration.
--------------------------------------------------------------------------------------
Record Type | Apn Name | Accounting Context | Group Name | Timestamp
--------------------------------------------------------------------------------------
EGCDR |wifitest |ggsn |default |Tuesday August 26
10:18:21
EGCDR |wifitest |ggsn |default |Tuesday August 26
10:23:21
EGCDR |wifitest |ggsn |default |Tuesday August 26
10:28:21
EGCDR |wifitest |ggsn |default |Tuesday August 26
10:33:22

Bulkstat and KPI

Bulkstat and KPI
Bulkstats
Overview
Bulkstat statistics are counters that are periodically generated when they are properly config-ured. The bulkstats are typically transferred to an external collection server where these coun-ters may be further processed (via a pre-defined mathematical formula) or simply displayed.The bulkstats can also be locally stored in the chassis as desired for later processing.
Configuration
The bulk statistics proclet runs on the SMC card for ASR 5000 and in MIO/UMIO card for ASR5500. At the start of a polling interval, the proclet will send queries to retrieve all of the data.
Typically, there are two steps needed for bulkstat configuration: the configuration of the com-munication with the collection server, and the configuration of the bulk statistic schemas.
The configuration of the communication with the collection server involves the definition ofthe time interval, IP address of the server, files and other options.
The bulk statistic schema configuration involves the name, format and counters.
Check the Bulk Statistics Configuration Mode Commands and Bulk Statistics File ConfigurationMode Commands chapters in the Command Line Interface Reference for detailed configurationassistance.
After configuring support for bulk statistics on the system, verify the settings prior to savingthem.
Follow the instructions in this section to verify bulk statistic settings. This command needs tobe executed at the root prompt of the Exec mode.
Check for collection server communication and schema settings by entering the following com-mand:
The following is an example command output:

Bulkstat and KPI
#show bulkstats schemas
Bulk Statistics Server Configuration:
Server State: Enabled
File Limit: 4000 KB
Sample Interval: 15 minutes (0D 0H 15M)
Transfer Interval: 480 minutes (0D 0H 15M)
Collection Mode: Cumulative
Receiver Mode: Secondary-on-failure
Local File Storage: None
Bulk Statistics Server Statistics:
Records awaiting transmission: 232
Bytes awaiting transmission: 84423
Total records collected: 2345788
Total bytes collected: 24124545
Total records transmitted: 34233
Total bytes transmitted: 2312323
Total records discarded: 0
Total bytes discarded: 0
Last collection time required: 2 second(s)
Last transfer time required: 0 second(s)
Last successful transfer: Tuesday November 12 10:23:44 EDT 2014
Last successful tx recs: 8754
Last successful tx bytes: 26778
Last attempted transfer: Tuesday November 12 12:23:44 EDT 2014
File 1
Remote File Format: /users/ems/server/data/testcity/bulkstat%date%%time%.txt
File Header: "testcity_test %time%"
File Footer: ""
Bulkstats Receivers:
Primary: 192.169.13.214 using FTP with username administrator
Records awaiting transmission: 0
Bytes awaiting transmission: 0
Total records collected: 0
Total bytes collected: 0
Total records transmitted: 0
Total bytes transmitted: 0
Total records discarded: 0
Total bytes discarded: 0
Last transfer time required: 0 second(s)
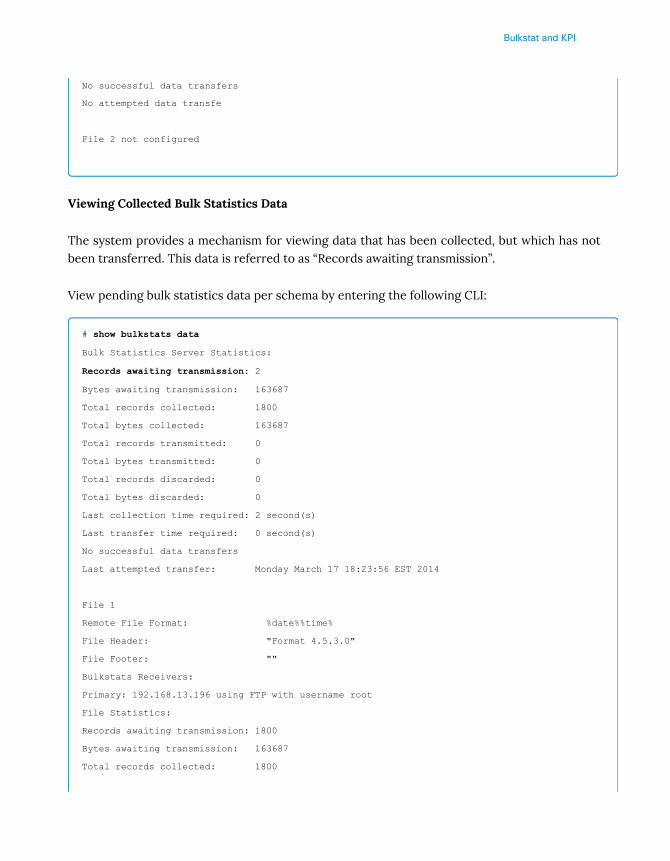
Bulkstat and KPI
No successful data transfers
No attempted data transfe
File 2 not configured
Viewing Collected Bulk Statistics Data
The system provides a mechanism for viewing data that has been collected, but which has notbeen transferred. This data is referred to as “Records awaiting transmission”.
View pending bulk statistics data per schema by entering the following CLI:
# show bulkstats data
Bulk Statistics Server Statistics:
Records awaiting transmission: 2
Bytes awaiting transmission: 163687
Total records collected: 1800
Total bytes collected: 163687
Total records transmitted: 0
Total bytes transmitted: 0
Total records discarded: 0
Total bytes discarded: 0
Last collection time required: 2 second(s)
Last transfer time required: 0 second(s)
No successful data transfers
Last attempted transfer: Monday March 17 18:23:56 EST 2014
File 1
Remote File Format: %date%%time%
File Header: "Format 4.5.3.0"
File Footer: ""
Bulkstats Receivers:
Primary: 192.168.13.196 using FTP with username root
File Statistics:
Records awaiting transmission: 1800
Bytes awaiting transmission: 163687
Total records collected: 1800
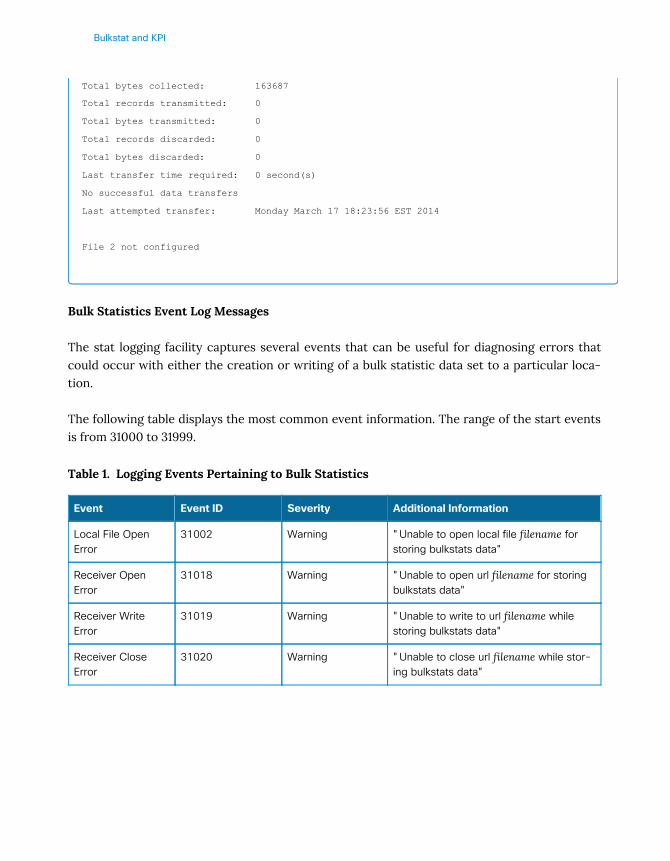
Bulkstat and KPI
Total bytes collected: 163687
Total records transmitted: 0
Total bytes transmitted: 0
Total records discarded: 0
Total bytes discarded: 0
Last transfer time required: 0 second(s)
No successful data transfers
Last attempted transfer: Monday March 17 18:23:56 EST 2014
File 2 not configured
Bulk Statistics Event Log Messages
The stat logging facility captures several events that can be useful for diagnosing errors thatcould occur with either the creation or writing of a bulk statistic data set to a particular loca-tion.
The following table displays the most common event information. The range of the start eventsis from 31000 to 31999.
Table 1. Logging Events Pertaining to Bulk Statistics
Event Event ID Severity Additional Information
Local File OpenError
31002 Warning "Unable to open local file filename forstoring bulkstats data"
Receiver OpenError
31018 Warning "Unable to open url filename for storingbulkstats data"
Receiver WriteError
31019 Warning "Unable to write to url filename whilestoring bulkstats data"
Receiver CloseError
31020 Warning "Unable to close url filename while stor-ing bulkstats data"
Bulkstat and KPI
Troubleshooting Bulkstats
Overview
This section covers how to collect Bulk Statistics and provides examples of troubleshootingBulkstats issues.
Manually Gathering and Transferring Bulk Statistics
There may be times where it is necessary to gather and transfer bulk statistics outside of thescheduled intervals. The system provides commands that can be used to manually initiate thegathering and transferring of bulk statistics.
These commands are issued from the Exec mode.
To manually initiate the gathering of bulk statistics outside of the configured sampling interval,enter the following command:
# bulkstats force gather
To manually initiate the transferring of bulk statistics prior to reaching the maximum config-ured storage limit, enter the following command:
# bulkstats force transfer
Clearing Bulk Statistics Counters and Information
It may be necessary to periodically clear counters pertaining to bulk statistics in order togather new information or to remove bulk statistics information that has already been col-lected. The following command can be used to perform either of these functions:
# clear bulkstats { counters | data }
The clear bulkstats data command clears any accumulated data that has not been transferred.
Bulkstat and KPI
This includes any "completed" files that have not been successfully transferred.
Incorrect statistics shown when a sessmgr crashes
Incorrect statistics are generated/displayed.
If there is any spike (up or down) in a particular statistic, verify if there was any sessmgr crashat around the time of spike. This can be verified with the command below:
# show crash list
Initially the Session Recovery mechanism was not designed to recover the statistics informationin case of a sessmgr crash, but in newer software releases some of the service statistics arebeen recovered.
Example Scenarios
Bulkstat file not transfered from ASR 5000/ASR 5500
Problem Description :
If bulkstat files are not being transferred from the ASR 5000/ASR 5500 to the collection server Follow these steps to identify the issue:
With the command below, check if there are records/bytes waiting transmission.
# show bulkstats
Saturday May 29 17:25:02 IST 2014
Bulk Statistics Server Configuration:
Server State: Enabled
File Limit: 10000 KB
Sample Interval: 15 minutes (0D 0H 15M)
Transfer Interval: 15 minutes (0D 0H 15M)
Receiver Mode: Secondary-on-failure
Historical Data Collection: Enabled (15 samples stored)
Bulk Statistics Server Statistics:
Bulkstat and KPI
Records awaiting transmission: 34566
Bytes awaiting transmission: 3253454
Total records collected: 12312980
Enable the following logs:
# logging filter active facility stats level debug
# logging filter active facility system level debug
# logging active
Note: The above commands in production are likely to cause high CPU andmemory usage. It's recommended to use these commands during amaintenance window.
And verify if there are errors; disable the logs with:
#no logging active
One possible error is described below:
2014-May-29+ 17:25:02.36 [stat 31018 warning] [5/0/7875 <bulkstat:0> stat_svr.c:345] [software
internal system syslog] Unable to open url ftp://root:
<password>@ipaddress/opt/ems/server/data/bulkstat20140529140000.txt for storing bulkstats data
Trobleshooting steps:
Event ID 31018 is a "Receiver Open Error".
• Perform a PCAP capture externally to the ASR 5000/ASR 5500 and verify the reasonwhy the FTP connection is terminated or not established.
• Verify that the copy command works for any file (For local FTP server). This verifiesthat the FTP process has no issue if it passes.

Bulkstat and KPI
• If test 1 passed, check the copy command to transfer a bulkstat file (For local FTPserver). This should verify if the bulkstat process is working if it passes.
• If WEM server is available in the network, verify that the copy command works for anyfile to WEM Server. This verifies that the FTP is working fine for WEM.
• Check the disk space on FTP servers.
• If above test passed, try to transfer the bulkstat file manually, but this time using thebulkstat gather and force commands.
• If above test passed, check if the automatic transfer works for bulkstats or not.
If still unable to identify the issue, open a Service Request with Cisco and provide the log-gings requested in step 2, the PCAP file and two SSDs (one before the PCAP and one afterthe PCAP).
Unable to retrieve bulkstat server information from ASR 5000/ASR 5500
Problem Description:
Bulkstat CLI shows the following failure.
[local]asr5500# show bulkstats
Tuesday Aug 18 15:00:13 EST 2014
Failure: Unable to retrieve bulkstats server information
Also bulkstat process disappears from name service (Normally there should be bulkstat processin the output) and notice there was no output in the above command.
[local]asr5500# show messenger nameservice | grep bulk
Tuesday Aug 18 15:01:09 EST 2014
[local]asr5500#

Bulkstat and KPI
When transfering a bulkstat file to a server, there is a point in the code where bulkstat processis waiting for a response from the server. If there is a issue in the network or server side andthe response is not received, bulkstat keeps waiting forever, which causes the CLI failure andthe missing in namespace.
Since bulkstat is missing from namespace, "show profile" cannot be taken for bulkstat process.While taking a core of bulkstat, see below stacktrace.
Fatal Signal 6: Aborted
PC: [f7eb4d10/X] libc.so.6/poll()
Note: User-initiated state dump w/core.
Signal from: sitmain pid=25764 uid=0
Process: card=5 cpu=0 arch=X pid=26402 cpu=~77% argv0=bulkstat
Crash time: 2014-Jul-04+08:43:11 UTC
Recent errno: 9 Bad file descriptor
Stack (15384@0xffffa000):
[f7eb4d10/X] libc.so.6/poll() sp=0xffffaf78
[084dc61f/X] error_readable() sp=0xffffafa8
[084dc6d1/X] fio_errorcheck() sp=0xffffcff8
[084db95a/X] fio_closefn() sp=0xffffd028
[f7e57df9/X] libc.so.6/_IO_cookie_close() sp=0xffffd048
[f7e5fd5c/X] libc.so.6/_IO_new_file_close_it() sp=0xffffd078
[f7e5776c/X] libc.so.6/fclose@@GLIBC_2.1() sp=0xffffd0c8
[084dd024/X] sn_mgmt_url_closesync() sp=0xffffd0f8
[02ebfe22/X] stat_svr_transfer_receiver() sp=0xffffd558
[02ec0586/X] stat_svr_transfer() sp=0xffffd5b8
[02ec1852/X] stat_svr_poll() sp=0xffffd618
[02e50bc0/X] stat_poller_cb() sp=0xffffd638
[0a2035e6/X] sn_loop_run() sp=0xffffdbc8
[0a02b3f4/X] main() sp=0xffffdc08
Solution:
Restarting bulkstat by "task kill" could restore the facility,
"task core facility bulkstat all" used before restarting bulkstat only for RCA purpose.

Bulkstat and KPI
# task kill facility bulkstat all
However, if the network or server side issue still exists, then the issue would happen again.
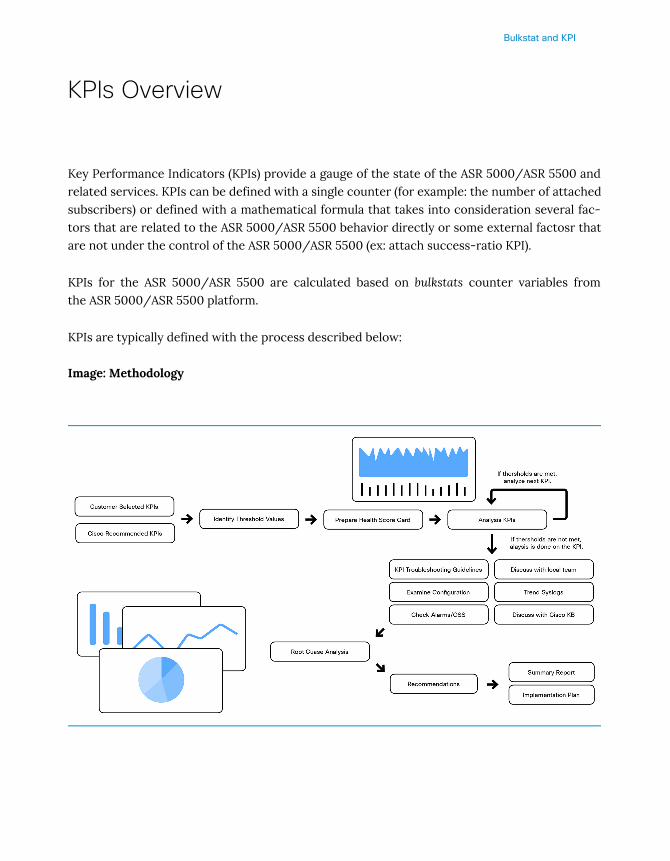
Bulkstat and KPI
KPIs Overview
Key Performance Indicators (KPIs) provide a gauge of the state of the ASR 5000/ASR 5500 andrelated services. KPIs can be defined with a single counter (for example: the number of attachedsubscribers) or defined with a mathematical formula that takes into consideration several fac-tors that are related to the ASR 5000/ASR 5500 behavior directly or some external factosr thatare not under the control of the ASR 5000/ASR 5500 (ex: attach success-ratio KPI).
KPIs for the ASR 5000/ASR 5500 are calculated based on bulkstats counter variables fromthe ASR 5000/ASR 5500 platform.
KPIs are typically defined with the process described below:
Image: Methodology
Troubleshooting KPIs

Bulkstat and KPI
Troubleshooting KPIs
There are a large number of KPIs and they vary from operator to operator; it is therefore notpossible to cover all possible KPI scenarios in this book.
To troubleshoot a KPI that has degraded, follow this general methodology:
1 Once the degraded KPI has beein identified:
• Verify the formula currently in use
• Collect an SSD and store it.
2 Generate a report (with MUR or other collection server) for the previous 60 days with
all the counters that are used in the formula.
• Verify which counter(s) is mis-behaving.
3 Generate a second SSD.
4 Verify if the behavior of the logs can be linked to an error (check logs, snmp traps,
crashes) seen in the SSDs.
5 If the counters are not seen in the SSD, capture outputs of "show" commands that are
related to the issue in question.
6 Look for any of the following
• Errors
• Crashes
• Connectivity issues
• Links down
• Alarms
• Any other factors that can be associated with this degraded KPI.
7 Try to capture monitor protocol, monitor subscriber and external PCAPs where the
issue can be seen or associated to.
Bulkstat and KPI
8 If the cause of the degraded KPI is still not clear, open a Service Request with all the
data collected:
• SSDs
• Logs
• Report with KPI counters
• External PCAP
• Monitor subscriber and/or monitor protocol
• A visual representation (print screen) of the KPI in question.