2019 Air Quality Annual Status Report (ASR) - Havant ...
192
LAQM Annual Status Report 2018 i 2019 Air Quality Annual Status Report (ASR) In fulfilment of Part IV of the Environment Act 1995 Local Air Quality Management October 2019
-
Upload
khangminh22 -
Category
Documents
-
view
0 -
download
0
Transcript of 2019 Air Quality Annual Status Report (ASR) - Havant ...

LAQM Annual Status Report 2018 i
2019 Air Quality Annual Status Report (ASR) In fulfilment of Part IV of the Environment Act 1995 Local Air Quality Management October 2019

LAQM Annual Status Report 2018 ii
Local Authority Officer
Jonathan Driver
Department Environmental Health
Address Public Service Plaza, Civic Centre Road,
Havant, Hampshire, PO9 2AX
Telephone 023 9244 6670
E-mail [email protected]
Report Reference number
ASR-1910/v2
Date 24/10/2019
Version Notes v1 [24/10/2019]: Submission Draft (Final)
v2 [02/01/2020]: Correction of typographical errors, and minor text clarifications for readability. Amendments follow receipt of DEFRA critical appraisal report issued 27/12/2019.

LAQM Annual Status Report 2018 iii
Table of Contents
Executive Summary: Air Quality in Our Area ................................................................... vi
Air Quality in Havant Borough ...................................................................................................... vi
Actions to Improve Air Quality ..................................................................................................... viii
Conclusions and Priorities ........................................................................................................... xi
Local Engagement and How to get Involved ............................................................................... xiii
1 Local Air Quality Management ................................................................................. 23
1.1.1 Timing & Content of Report ...................................................................................................... 23
1.1.2 What do we mean by Ambient Air Quality? .............................................................................. 25
1.1.3 Update on Priorities from 2018 ASR – Review of A3023 Monitoring Positions........................ 27
1.1.4 Update on Priorities from 2018 ASR – Redeployment of available monitoring resources ....... 31
2 Actions to Improve Air Quality ................................................................................. 33
2.1 Air Quality Management Areas ........................................................................................ 33
2.1.1 Local Air Quality Strategies ...................................................................................................... 33
2.2 Progress and Impact of Measures to address Air Quality in Havant Borough Council ..... 35
2.2.1 Responding to the 2017 & 2018 ASR ....................................................................................... 35
2.2.2 Seeking incremental emissions reductions and improvements in local ambient air quality ..... 35
2.2.3 PUSH low emission strategy .................................................................................................... 39
2.3 PM2.5 – Local Authority Approach to Reducing Emissions and/or Concentrations.......... 51
2.3.1 Regulatory and policy drivers ................................................................................................... 51
2.3.2 Sources ..................................................................................................................................... 53
2.3.3 Local Ambient Concentrations .................................................................................................. 53
2.3.4 PM2.5 Air Quality Standards – EU, Legislative, and WHO ........................................................ 54
2.3.5 Identifying Opportunities for Supporting Continued Compliance with PM2.5 Emissions ......... 55
2.3.6 The Local Approach to Reducing PM2.5 Emissions .................................................................. 57
2.4 The Charter for Cleaner Air ............................................................................................. 57
2.4.1 Action 1) ‘Remove the most polluting vehicles from most polluted parts of towns and
cities’ ......................................................................................................................................... 58
2.4.2 Action 2) ‘Provide greater investment in public transport, walking and cycling
infrastructure’ ............................................................................................................................ 58
2.4.3 Action 3) ‘End the sale of all new petrol and diesel cars and vans earlier than 2040’ ............. 58
2.4.4 Action 4) ‘Revise the tax regime, and provide fiscal incentives to help people and
businesses adopt cleaner vehicles’ .......................................................................................... 60
2.4.5 Action 5) ‘Invest in charging infrastructure and the supporting power network’ ....................... 60
2.4.6 Action 6) ‘Ensure fossil fuels do not generate the power used to fuel electrified vehicles’ ...... 61
2.4.7 Action 7) ‘Tighten legal limits on air pollution to match World Health Organisation
guideline levels’ ........................................................................................................................ 61
2.4.8 Action 8) ‘Improve the national monitoring and modelling of air pollution’ ............................... 61
2.4.9 Action 9) ‘Adopt a new Clean Air Act, or equivalent for 21st century and independent
watchdog with teeth’ ................................................................................................................. 62
2.4.10 Action 10) ‘Launch a national public health campaign and alert system to highlight the
dangers of air pollution’ ............................................................................................................ 62

LAQM Annual Status Report 2018 iv
2.5 Impact of National Policy ................................................................................................. 63
2.5.1 The Policy Response in within Havant Borough ....................................................................... 64
3 Air Quality Monitoring Data and Comparison with Air Quality Objectives
and National Compliance .................................................................................................. 67
3.1 Summary of Monitoring Undertaken ................................................................................ 67
3.1.1 Automatic Monitoring Sites ....................................................................................................... 67
3.1.2 Non-Automatic Monitoring Sites ............................................................................................... 67
3.2 Nitrogen Dioxide (NO2) .................................................................................................... 68
3.2.1 Monitoring Results .................................................................................................................... 68
3.2.2 Comparison of Results with NAQS Objectives ......................................................................... 68
3.2.3 Trends & Associations .............................................................................................................. 70
3.2.4 Changes to Monitoring .............................................................................................................. 73
Appendix A: Monitoring Results ...................................................................................... 76
Appendix B: Full Monthly Diffusion Tube Results for 2018 ........................................... 84
Appendix C: Supporting Technical Information / Air Quality Monitoring Data
QA/QC ................................................................................................................................. 86
Appendix D: Map(s) of Monitoring Locations (NO2) ....................................................... 99
Appendix E: Summary of Air Quality Objectives in England ....................................... 108
Appendix F: NO2 Passive Diffusion Tube Position Review .......................................... 109
Appendix G: Hampshire County Council Air Quality in Schools Project ................... 123
G.1 Hampshire County Schools Air Quality Investigation (Havant Borough, 2018); Phase 1
Summary Report & Results ...................................................................................................... 124
G.2 Hampshire County Schools Air Quality Investigation (Havant Borough, 2018/19); Phase
2 Summary Report & Results ................................................................................................... 130
G.3 Bosmere Junior School Air Quality Campaign Plan, 2018 ................................................. 135
G.4 Hart Plain Junior School Air Quality Campaign Plan, 2018 ................................................ 140
G.5 Trosnant Federation of Schools Air Quality Campaign Plan, 2018 ..................................... 144
G.6 Purbrook Junior School Air Quality Campaign Plan, 2018/19 ........................................... 148
Appendix H: List of Cycle & Pedestrian Infrastructure Improvement Project List ..... 154
Appendix I: Havant Borough Council Consultation Responses .................................. 159
I.1 Environmental Control Advisory Committee (ECAC) Joint Consultation Response on
‘Draft Revised UK Air Quality Plan for Tackling Nitrogen Dioxide’ ............................................. 160
I.2 Havant Borough Council Consultation Response on ‘NICE Draft Air Quality Standard’ ...... 165
I.3 Havant Borough Council Consultation Response on ‘Cleaner Domestic Burning of Solid
Fuels and Wood’ ................................................................................................................ 171
Appendix J: Havant Borough Council Local Plan 2036 Draft Air Quality Policy ........ 177
Glossary of Terms ........................................................................................................... 181
References ....................................................................................................................... 186

LAQM Annual Status Report 2018 v
List of Tables
Table 2.1 – Summary of Progress on Measures to Improve Air Quality .................................... 40
Table 2.2 – Commentary on Measures to Improve Air Quality .................................................. 45
Table A.1 – Details of Non-Automatic Monitoring Sites ............................................................. 76
Table A.2 – Annual Mean NO2 Monitoring Results .................................................................... 79
Table A.3 – Long Term Trends in Annual Mean NO2 Concentrations ....................................... 82
Table B.1 – NO2 Monthly Diffusion Tube Results - 2018 ........................................................... 84
Table C.1 – Statistical Methods Applied ................................................................................... 86
Table C.2 – Summary of periods of incomplete data collection ................................................. 87
Table C.3A – Summary of AURN period corrections (Annualisation – HBC Monitoring) ........... 88
Table C.4B – Summary of AURN period corrections (Annualisation, HCC Schools
Monitoring) ........................................................................................................... 89
Table C.5 – NO2 Concentration Estimates at Closest Relevant Exposure (‘Fall-Off With
Distance’ Calculations) ......................................................................................... 90
Table C.6 – Summary of Laboratory Nitrogen Dioxide Proficiency Results 2014-2018 ............. 91
Table C.7 – Laboratory Nitrogen Dioxide Proficiency Results 2014-2018 (Detailed) ................. 92
Table C.8 – Summary of Field Intercomparison results 2014-2018 (Gradko, 20% TEA in
Water); by exposure site classification ................................................................. 95
Table C.9 – Trends in Cycle Traffic Volumes, 2000 - 2018 ....................................................... 96
Table C.10 – Trends in HGV Traffic Volumes, 2000 - 2018 ...................................................... 97
Table C.11 – Trends in Annual Average Daily Traffic (AADT), 2000 - 2018 .............................. 98
Table E.1 – Air Quality Objectives in England ......................................................................... 108
Table F.10 – General Strategy for NO2 Monitoring, and summary of proposed changes
(including rationale) ............................................................................................ 119
List of Figures
Figure 1.1 – Comparison of Langstone Road Monitoring Locations, as estimated
monthly average NO2 at Regents Court ............................................................... 29
Figure A.1 – Annual Mean NO2 Monitoring Results & Estimated Mean NO2 at Nearest
Relevant Exposure (2018) .................................................................................... 81
Figure A.2 – Recent Trends in Annual Mean NO2 Concentrations ............................................ 83

LAQM Annual Status Report 2018 vi
Executive Summary: Air Quality in Our Area This report is Havant Borough Council’s 2019 Annual Status Report and forms part of the review and assessment of air quality in Havant Borough. The report has been prepared by reference to Government’s published Policy Guidance LAQM.PG(16)1 and in accordance with the Technical Guidance LAQM.TG(16)2.
Air Quality in Havant Borough
Air pollution is associated with a number of adverse health impacts. It is recognised as a contributing factor in the onset of heart disease and cancer. Poor air quality particularly affects the most vulnerable in society: children and older people, and those with pre-existing heart and lung conditions. There is also often a strong correlation with equalities issues due to a variety of social and economic factors. These factors may vary by location to a degree, but there are also some issues which are likely to be common nationwide. For example, pre-existing health conditions which can be exacerbated by air pollution include those which are related to low levels of physical activity, poor diet & obesity, smoking, and poor housing conditions. There is also some evidence to suggest that the impact of individual pollutants is greater when exposure occurs in combination with other pollutants, which might include occupational exposures associated with low-skilled manual work, skilled trades and manufacturing, or with domestic exposure associated with the use of low grade solid fuels for domestic space heating. These factors tend to be associated more strongly with less affluent social groups3,4.
The annual health cost to society of the impacts of particulate matter alone in the UK is estimated to be around £16 billion5. Previous screening assessments for the Havant Area have consistently suggested that Nitrogen Dioxide was the only pollutant likely to challenge compliance with it’s respective air quality objective. It is also recognised that few significant air quality problems are reported nationwide that are independent of problems with Nitrogen Dioxide. For these reasons, emphasis has been placed on consideration of this pollutant through both the active monitoring programme, and within the main body of this report. Air quality within the Havant Area is generally very good. This Annual Status Report shows that the air quality objectives are likely to be achieved for all pollutants at relevant locations throughout The Borough, with many residential areas likely to enjoy excellent air quality (local pollutant concentrations less than 50% of current air pollution objectives). However, concentrations may be locally elevated in areas close to congested road junctions, or where topographic features adversely affects dispersion. Transport networks are very constrained within the Borough as a result of both the historic town centre layouts, and the presence of landscape features such as strategic roads, railways and watercourses which have a limited number of crossing points. These factors tend to concentrate road traffic at key junctions, bridges and crossing points-, or at road links with relatively narrow streets and tall buildings on both sides. The national
1 Local Air Quality Management Policy Guidance (PG 16), DEFRA, April 2016. https://laqm.defra.gov.uk/documents/LAQM-PG16-April-16-v1.pdf. 2 Local Air Quality Management Technical Guidance (TG 16), DEFRA, April 2016. https://laqm.defra.gov.uk/technical-guidance/index.html 3 Environmental equity, air quality, socioeconomic status and respiratory health, 2005 4 Air quality and social deprivation in the UK: an environmental inequalities analysis, 2006 5 Defra. Abatement cost guidance for valuing changes in air quality, May 2013

LAQM Annual Status Report 2018 vii
trunk road network (A3, A27) and the ‘West Coastway’ & ‘Portsmouth Direct’ railway lines represent particular barriers to free movement of traffic, with permanently available crossing points being very limited in number. Exceedances of annual average ambient standards for Nitrogen Dioxide have been identified at the kerbside at some the busiest transport routes. Whilst the annual average air quality objectives have not been derived to apply to kerbside / footpath locations (or at bus stops, etc.), nevertheless these are places where the public may be regularly present. Kerbside exposure may contribute significantly to the total overall personal exposure of some individuals, and so some people may benefit from taking some simple steps to reduce the time they spend close to busy roads during peak travel periods. The 2017 ASR identified one Nitrogen Dioxide monitoring position as having the potential to represent a breach of the annual mean air quality objective (2016 data). A more detailed assessment showed that there were problems with siting of the monitoring point which meant that the result was likely to be unduly influenced by a direct emissions source; leading the Council to conclude that the position was unlikely to be representative of ambient conditions. The 2016 result was dismissed, and it was resolved to decommission the monitoring position. In the interests of transparency, monitoring has continued concurrently alongside a range of alternative positions which are being evaluated with a view to identifying the most representative location at which local pollution associated with this transport link may be monitored. The position shown to be exceeding objectives in 2016 has proven to be compliant in both subsequent monitoring periods (2017 & 2018), but it should be highlighted that results show a high degree of variability, and comparison with concurrent monitoring locations has shown that it is likely to be over-estimating ambient concentrations by more than +20%. This implies a reasonable margin of safety with compliance at this location, but the variability in results between years would also suggest that key transport links remain vulnerable to local exceedances during years where prevailing weather conditions favour secondary production of Nitrogen Dioxide, or where other local factors adversely influence either the volume of traffic or it’s flow on the local highway network. This can be accommodated with the air quality objectives & limits where relevant locations are not coincident, but could require a regulatory response where relevant locations are located (or are introduced) close to the carriageway of busy routes. The B2149 / A3023 transport link between Havant Town Centre and Hayling Island is considered to remain a location where the annual mean objective for Nitrogen Dioxide risks being breached. More generally; concentrations are either broadly stable or reducing across the district, with no increasing trends identified at any of the locations for which sufficient data is available to make a statistical assessment. Perhaps most notable are the statistically significant trends for declining pollutant levels (improving air quality) at the kerbside of the A3023 Havant Road on Hayling Island, and at a suburban monitoring location in Havant Town. Improvements at Suburban locations away from strong transport influences suggest that real improvements in air quality are taking hold, and that background levels of pollution are reducing. These improvements may be small (estimated to be around -1.6% per annum on average), but the trend does appear significant over a meaningful period with no significant deviation from the long-term trends over recent years. Based upon the area characteristics (density of industry & dwellings, and volumes of traffic carried on the local road network), the “worst case” particulate PM2.5 levels in the Havant area are considered likely to broadly correspond to the urban background levels measured at the

LAQM Annual Status Report 2018 viii
Portsmouth, and it is considered likely that the emissions reduction obligation is likely to have been met within the Havant Area. Havant Borough Council has not committed to specific actions to tackle PM2.5 concentrations, but is seeking the implementation of more general Air Quality (Planning) policy which will support this overall aim. It is expected that this policy will have the concurrent effect of reducing local emissions & concentrations of other atmospheric pollutants (especially PM10 & NO2), and in addition, will serve to support the achievement of carbon emissions and climate change adaptation goals.
Actions to Improve Air Quality
Havant Borough Council does not work alone in the role of managing air quality. It works with neighbouring districts and Boroughs in Hampshire to establish best practice and to develop regional-scale strategic planning which seeks appropriate development to minimise emissions growth, and where possible delivers local and regional reductions in air pollutants. This report acknowledges the NGO & Local Authority Partnership Charter for Clean Air, and provides an initial review, providing both local & general context to the proposed actions. This should serve as a starting point for any future consideration of adopting the charter, or alternatively, policy and actions which support it’s aims. 2017/18 saw the completion of a Sub-Regional air quality modelling study which covered an area of South Hampshire, covering an area between the New Forest and Emsworth, and North to Winchester and parts of East Hampshire District (the ‘PUSH region’). This study represented a major piece of work, commissioned with a view to holistically assessing the anticipated aggregate impact on local air quality of the regional development demand, and the degree to which committed and potential additional highways improvement schemes might help to mitigate that impact. The output from the partnership project will be used to inform and shape the local plans and the suite of local policy to be adopted by all contributing authorities within the study area. It will also serve to inform & guide local infrastructure spending, enabling schemes to be prioritised which not only serve to support the required level of local development, but also to alleviate existing congestion and air pollution hotspots. By underpinning these layers of strategic planning, this piece of work could ultimately lead to significant reductions in local emissions, and thus improvements in air quality. Hampshire County Council also plays a significant role in preventing, reducing & mitigating emissions from road transport though it’s devolved Local Highways, and Public Health functions, and through it’s influence in the delivery of educational services. There are opportunities for the Borough and County Councils to support each other – with the planning functions of the Borough Council in particular representing a key opportunity to support these goals. There is increasing recognition of the synergies between air pollution and climate goals, and wholistic thinking is required to achieve the co-benefits of improving local air quality, and both combating & adapting to anthropogenic climate change. For example, actions taken to improve sustainability and reduce energy demand might serve to avoid the emissions associated with power generation or increase renewable power generation capacity. Using vegetation to intercept local air pollutants can help reduce the cooling demand of buildings, and combat urban heat effects. Such actions may directly lead to local air quality improvements, or may contribute to general emissions reductions at broader scales; contributing to net reductions in national aggregate emissions.

LAQM Annual Status Report 2018 ix
The Council recognises that even micro-scale projects make a valuable contribution to these goals, with the overall effect being the product of aggregated small-scale reductions in emissions or energy use, influencing local emissions and/or regional ambient background concentrations by small amounts which will sum up to a significant overall effect. In this way, preserving and improving air quality depends upon both the wide participation of partner organisations, and the personal choices of residents. There are many ways that individuals can contribute to reducing air pollution and so improve air quality. See the ‘how to get involved’ section below for Ideas & tips to reduce personal exposure to air pollutants, and how you might contribute to reductions in local emissions. Topographic factors described in the section above (‘Air Quality in Havant Borough’) mean that bold & direct local intervention to address local air quality is often not feasible, and is often not within the direct sphere of influence of the Local Authority. As a result, the actions taken by the Local Authority to improve local air quality largely consist of a strategy of seeking to achieve incremental improvements & mitigations through the formulation of effective of planning policy, and its diligent application to secure-; ➢ Sustainable development with low energy demand, and a reduced need for local (within
borough) combustion of fuels,
➢ The implementation of travel plans which target modal shift from ‘use of the private motor car’ to sustainable and active forms of transport,
➢ Seeking high quality development in sustainable locations which reduce the need to travel & revitalises town centres, and where possible, and;
➢ innovative developments which support new vehicle technology, new vehicle access models, and incorporates Low or Zero Carbon (LZC) energy or heating solutions, and landscape features which assist with the interception and destruction of air pollutants.
Effective forward-planning through the local development framework and strategic land allocations also contributes to achieving air quality objectives, as does the deployment of funds acquired though planning gain (s106 & s278 agreements and the Community Infrastructure Levy) to fund local infrastructure improvements which aim to facilitate & encourage active travel choices, and so achieve both emissions reductions and overall public health gains. Where significant new developments have been proposed these have been accompanied by air quality assessments and where required, the Council has sought to exercise both local & national policy appropriately in order to secure the mitigation of new relevant exposures, and the mitigation or offsetting of any significant development-related increases in local emissions. This report does not present a list of such sites, nor does it present a summary of air quality assessments & outcomes. The focus of this report is the policy context as a vehicle for change, and not it’s specific application at individual development sites. Other actions taken include;
➢ Contributing to- & providing support for- a Hampshire County Education and Transport
Planning project aiming to raise awareness of air quality issues in local schools and aiming to encourage active modes of travel to & from schools through the ‘Mode Shift Stars’ Scheme.
➢ Leading by example through the Council fleet procurement process – replacing diesel powered car-derived vans used with electric models

LAQM Annual Status Report 2018 x
➢ Utilising the network of Council regulated car parks to developing the local electric vehicle charging infrastructure in the area. In partnership with a commercial network provider, with 3 new 50kW+ new rapid charging points implemented over the past 18 months, doubling the size of the local rapid charging network.
➢ Participation in the commissioning a sub-regional scale air quality modelling exercise with PUSH6 authority partners to place air quality considerations at the heart of a strategic regional planning exercise
➢ Early engagement with prospective developers of ‘catalyst’ mixed-use developments in Havant and Waterlooville Town Centres, aiming to be exemplars for policies supporting increased housing density close to public transport links, and discouraging car ownership. The Council actively seeking high-quality development which achieves excellent sustainability credentials, including innovative landscape planting and green rooves / walls to improve local air quality in exterior social spaces, incorporation of clean energy generation, and car club access to offering a low emissions fleet. An indicative draft masterplan for town centre regeneration has also been produced, and it is hoped that the approval of this scheme would serve to strengthen the quality of the town centre offering and ultimately contribute to a reductions in the need to travel by co-locating residents and the businesses and services that they use, and by providing the modern, high quality spaces and customer base needed for those businesses & services to thrive.
6 http://www.push.gov.uk/

LAQM Annual Status Report 2018 xi
Conclusions and Priorities
Conclusions;
➢ Exceedances of the annual mean objective for Nitrogen Dioxide are estimated at the kerbside of the B2149 Park Road South (Havant), B2149 New Road (Havant), A3023 Langstone Road, and are considered likely to occur at some locations on the A3, particularly in Waterlooville.
➢ Despite kerbside exceedances, no breaches of the Nitrogen Dioxide objective value have been identified at any point where the annual average exposure objective applies.
➢ Long term trends in Nitrogen Dioxide are either broadly static, or declining – with no increasing trends identified at any monitored location.
➢ The proportion of HGV traffic on the road network is not generally increasing. Only one location has been identified where there is an increasing trend both over recent years (2015-‘18) and in the longer term (18 years). The growth in HGV traffic on the A3 in recent years is likely to be due to construction activities at the Waterlooville MDA site, and it is noteworthy that absolute growth in HGV’s numbers over the past decade has only been recorded at two of the four count locations on the A3. HGV traffic growth trends are strongest on the A27 Havant bypass.
➢ Traffic growth in terms of average daily flows appears to be broadly neutral at around a half of sites over both the long term and the short term. Growth in traffic appears to be most significant & consistent the A3(M), with most of the growth occurring North of J4 / A3 London Road; with corresponding growth on the A3 since 2005. Over 60% of monitored links have shown an absolute increase in the average daily traffic carried between 2000 & 2018, a significant increase over figures presented previously, indicating that net traffic growth is occurring. Available data do not suggest that traffic growth on the local classified road network is either strong, nor unsustainable; and it does demonstrate uneven distribution of traffic. Average daily traffic volumes at some locations which are the subject of public concern-, and which correspond to locations of locally poor air quality-, continue to show sustained decline (e.g. A3023 Langstone Road & A3023 Havant Road, Hayling Island).
➢ Trends in measured Nitrogen Dioxide concentrations do not reflect recent trends in road traffic growth, suggesting that Community, National, and Local measures to mitigate the impact of traffic emissions are achieving meaningful reductions in real-world ‘per-vehicle-kilometre’ emissions, and non-road-vehicle emissions sources which also contribute to ambient concentrations.
➢ There is no need to consider any areas as potentially requiring declaration as a new AQMA
➢ No specific need has been identified to take steps to reduce local primary sources of PM2.5.
➢ The targeting of incremental reductions in emissions or air pollutants is likely to be an effective strategy for achieving aggregate improvements in ambient air quality, and so improving public health by reducing exposures at both relevant, and non-relevant locations.

LAQM Annual Status Report 2018 xii
Priorities; ➢ To Actively manage the Council’s passive monitoring network in general accordance with
the principles outlined in the 2018 ASR (Table F.10 of this Report), to broaden the Councils knowledge of local air quality across the Borough. Focus on areas not previously the subject of monitoring campaigns or at relevant locations where significant traffic growth has been identified or is expected to occur.
➢ To improve digital content & information provision for residents, to improve engagement & awareness of Local Air Quality & Sustainability issues.
➢ To deliver an adopted Local Plan that is fit for purpose and fully accounts for the principles and policy embodied by the revised NPPF & other air-quality-relevant government strategies.
➢ To pursue measures that have scope to alleviate traffic pressure on Havant and Emsworth town centres, through positive support for strategic developments which would justify national trunk road infrastructure improvements (e.g. the proposed new junction on the A27, East of Emsworth exit).
➢ To exercise both existing and emerging environmental & sustainability policies to capitalise upon opportunities to secure developments which support a shift in the proportion of trips made by conventionally-fuelled private motor car to more sustainable and active means of travel, driving forward schemes which to support delivery of the County-level active travel strategies.
➢ To exercise both existing and emerging environmental & sustainability policies to ensure that new local development avoids new exposure to locally poor air quality, mitigates it’s contribution to local emissions, and where possible provides features which contribute to incremental improvements in local background air quality.
➢ To draft and publish a Local Cycling & Walking Infrastructure Plan (LCWIP), and strategic ‘network legibility improvement plan’ for pedestrian and cycle networks – for implementation over the local plan period (to 2036).

LAQM Annual Status Report 2018 xiii
Local Engagement and How to get Involved
In other sections we provide information on the current state of air quality within the borough and the actions that the Councils are taking to achieve incremental reductions in local emissions. In this section we look at how residents and businesses can get involved. Dealing with air pollution is not something that any single organisation or individual can resolve, and many contributors to local air pollution fall outside the operational reach of the Local Authority to directly influence. It will require the combined efforts of everyone to ensure that everyone continues to breathe good quality air.
Business Business organisations can do a great deal to reduce emissions of Nitrogen Dioxide and Particulate Hydrocarbon emissions (PM10 & PM2.5). Businesses may have significant control over their own direct emissions from buildings, energy use, fixed equipment or processes. Similarly, even where business doesn’t have latitude to optimize the type of vehicles used for transportation of goods, optimal route selection for those vehicles could have a substantial influence on local air quality either by reducing unnecessary miles driven, or by avoiding areas where residents are particularly close to transport routes. Route optimization will have the biggest impact between the ‘home base’ of those vehicles or the warehousing stock which they regularly collect for transport and access to the strategic road network. Businesses also have a huge influence over the transportation choices of staff, customers and partners, as well as the environmental credentials of organisations that they choose to do business with. Consideration of travel & logistics planning can be particularly effective for service industries with high levels of staffing, and for waste or distribution industries which generate a large number of HGV trips. Businesses of all sizes can take steps to work toward reducing emissions of air pollutants, and there is an abundance of guidance and advice available to support organisations who wish to be more sustainable. Some ideas are presented below for inspiration; ➢ Introduce working arrangements that reduce the need to travel; Information &
Communications Technology is providing a wealth of solutions to enable businesses to cut travel demand – e.g.;
• Flexible working solutions: Secure access to business systems & files can be achieved from anywhere with a broadband connection, enabling businesses to introduce working practices that incorporate occasional or regular home working. This can reduce employees need to travel – with co-benefits to cost of work, emissions and wellbeing. The Chartered Institute of Personnel and Development provides advice and information about this7.
• Tele- & Video- conferencing: Enabling colleagues & partners meet face-to-face from anywhere – minimizing travel expenditure, helping to maintain business culture & increasing productivity where teams work across a variety of different locations.
• Webinar streaming services: Used to deliver or attend training, can reduce or even eliminate the need for delegates to travel.
• Cloud tools & services: Enable colleagues at different locations to work collaboratively on projects and provides access to communications and documents for mobile staff,
7 https://www.cipd.co.uk/news-views/policy-engagement/flexible-working

LAQM Annual Status Report 2018 xiv
reducing the need to return to the office, minimizing work mileage and the associated emissions. Cloud services can also minimise the need to travel for face-to-face meetings, and E-signature technology can be used to reduce the need to rely upon traditional courier services to transfer physical copies between signatories & intermediaries (agents or legal representatives), helping minimise the number of delivery vehicles on the roads
➢ Adopt a corporate ethos of environmental responsibility; A number of environmental certification schemes are available as a banner for the green-credentials your organisation – ranging from international corporate accreditation under ISO14001 or EMAS schemes, to smaller schemes run by charitable & not-for-profit organisations8. Accreditation can be important for business reputation and can help to broaden marketing appeal and strengthen bidding & tendering opportunities, for example where customers operate a sustainable procurement policy.
➢ Make sustainability a key consideration in procurement decisions; There are opportunities to reduce local emissions through the selection of clean fuels and low emission equipment, for example low-NOx Boilers & Furnaces (Gas or Oil), or electrical alternatives for space heating or industrial applications. These considerations may be more pertinent in the coming years depending on the scope of the anticipated updated Clean Air Legislation. Low Emission or Ultra Low Emission (LEV or ULEV) models can be specified as alternatives to fleet vehicles - is could be particularly cost effective for businesses operating within a low-emission or congestion charging zone, as ULEV’s are often exempt from charges & access restrictions. Grants9 for workplace and private electric vehicles are available from central government at the time of publishing this report to help businesses wishing to invest in a sustainable vehicle fleet.
➢ Run an effective maintenance programme; Particularly with fuel-consuming plant & equipment, running a tight ship on maintenance not only reduces the risk of delays & costs associated with an unplanned breakdown, it can also maximise efficiency, reducing fuel consumption, running costs, and plant emissions.
➢ Introduce a workplace travel plan; A travel plan is a package of measures aiming to discourage single occupancy vehicle journeys, and incentivise the adoption of sustainable travel choices such as walking, cycling, public transport (bus / rail, including park & ride schemes) or shared car journeys. Plans can be particularly effective where business have a large number of employees at a small portfolio of premises. The concentration of staff makes internal lift-share schemes particularly effective.
Travel plans help deliver important benefits through a reduction of the impact of car travel on the local highway network, helping to improve network efficiency (reducing delays and improving journey times) for highway users, and to reduce road transport emissions. If active modes of travel are effectively encouraged, there are health, wellbeing and productivity benefits to be gained too.
Travel planning also plays a significant role in ensuring that there is a healthy demand for sustainable public transport services, providing the customer base to support existing services, and the demand necessary to improve the quality, frequency & reach of the services offered by providers.
Good planning can contribute to the achievement of a range of benefits for the business, including assisting attainment of carbon reduction targets, and contributing toward the requirements of any environmental / sustainability business accreditation schemes which the organisation is signed up to. Travel plans aim to deliver direct benefits for both staff & customers, and contribute to benefits for the community within which the business is located.
8 http://ems.iema.net/emas; http://www.greenmark.co.uk/; https://www.iie.uk.com/ 9 https://www.gov.uk/plug-in-car-van-grants/what-youll-get

LAQM Annual Status Report 2018 xv
Hampshire County Council publishes information and advice about travel plans, and has a wealth of contacts & resources to assist businesses in setting up an effective workplace travel plan10
➢ Sign up to a sustainable travel incentive scheme; Going hand-in-hand with workplace travel planning, employers can subscribe to a scheme such as that offered by Easit11 to secure access for both the business & for employees to a range of travel discounts and benefits, including:
➢ Discounts on rail travel: Currently 15% off South West Trains for journeys within the Portsmouth Area.
➢ Discount on Electric vehicles (EV’s): In partnership with Nissan, discounts are offered on the purchase of new ultra-low emission vehicles (ULEV); and additional discounts are available on top of government administered grants for the installation of EV chargers from EO charging.
➢ Free Membership to Car Clubs; in partnership with Enterprise, and Co-Wheels, a range of low-emission, hybrid & electric vehicles are available to hire on a ‘pay-as-you-go’ basis.
➢ Access to a Carbon Reduction Car Benefit Scheme: Eligible employees can access a new low-emission vehicle (LEV) or ULEV on a ‘just-add-fuel’ basis for a mixed monthly amount taken direct from salary. Employees earn credit for their employers based on the carbon emissions saving, which employers can use to contribute to a sustainability project.
➢ Access to a range of Cycle schemes: Including local retailer & electric cycle discounts, access to loan bicycles & tax-efficient salary sacrifice purchase schemes.
➢ Green the workplace; There is growing evidence of the benefits of natural planting and air quality. Plants in leaf intercept particulate pollutants, and absorb gaseous pollutants, producing oxygen and materially improving air quality. Green boundary treatments can be extremely effective in reducing exposure to pollutants from adjacent roads, and indoor planting can help improve indoor air quality. Presence of plants is also said to significantly reduce stress levels and to improve productivity – a win-win.
➢ Consider Microgeneration; Commercial premises are often well placed to exploit the benefits of microgeneration of electricity using photovoltaic solar. Roofing of industrial buildings often feature a large surface area at shallow pitch, and buildings are tall, suffering little overshadowing. If roof surface orientation is favourable, installations can be very productive. Unlike residential installations, the energy demand of business is aligned with peak generation hours, maximising achievable savings by ensuring the generated power is used locally. Significant additional gains can be achieved by utilising sun-tracking mounting options (particularly well suited to flat roof installations). Solar can be particularly cost-effective where the business fleet includes electric road or warehouse vehicles, where charging arrangements can be made to ensure surplus energy from a local PV array always has a useful destination at the point of generation.
10 https://www.hants.gov.uk/transport/developers/travelplans 11 https://www.easit.org.uk/

LAQM Annual Status Report 2018 xvi
Residents & individuals
There is growing concern among the public about air pollution, and the media message has largely focused on the national impact of air pollution and the aggregate effect that it has on public health. Whilst most articles quote the national air quality standards as the benchmark by which air quality is judged to be either ‘good’ or ‘harmful’, it is rarely emphasised that the standards only apply to certain locations, or that most personal exposure occurs at locations where the national air quality standards do not apply – for example, at work, during travel, or within your own home. The BRE estimate12 that Europeans spend at least 90% of their time indoors, so a person’s exposure depends largely on indoor exposure. The range of potential indoor air pollutants includes many that are not encompassed by the National Air Quality Strategy (NAQS), but does also include Nitrogen Oxides & Particulate Matter. Potential sources of Particulate Matter (typically hydrocarbons, as PM2.5 & PM10) within the home include cooking, tobacco smoke, candles, scented oils & incense, aerosols, and the use of wood burners; whilst gas cooking, gas fires & wood burners are all sources of Nitrogen Oxides (both NO & NO2). Properly installed gas central heating does not release pollutants within the home, however it might represent a significant source of Nitrogen Dioxide to an immediate neighbour. Often, little information is presented on what individuals can do to reduce their own emissions, to avoid or minimise exposure to harmful air pollution, or indeed to help intercept transport emissions for the benefit of both themselves and their local area. The websites for the National Clean Air Day13 & #WeShareAir Campaign14 provides lots of practical information and advice on both reducing & avoiding air pollution, as well as how to get involved and help ensure that clean air stays on the agenda. Some of their ideas are reproduced in the sections below, along with a few of our own. ➢ Avoid harmful air pollution;
• Use quieter streets; Avoiding the busiest roads could reduce your exposure to air pollution by more than 20%. Drivers can be exposed to almost double the pollution levels that pedestrians and cyclists are exposed to on the same road, so this will help reduce exposure no matter what mode of transport you are using
• Get out of your car; This has multiple benefits – i) you create less pollution, ii) you’ll breathe in less pollution - pedestrians and cyclists are typically exposed up to half the air pollution of car drivers on the same journey, and iii) using self-propelled travel benefits for your health & fitness, reducing your risk of developing a medical condition that could be exacerbated by exposure to air pollution.
• Avoid strenuous activity when pollution is high; For almost everybody, the benefits of exercise outweigh the risks from exposure to air pollution; but strenuous activity can increase the intake of air pollution so avoiding it would normally help you get the most out of the exercise you do. Avoid going jogging busy roadsides or streets during the rush hours (usually 7am-9am, 3pm-6pm), or in any urban areas on days where the pollution index is high (you can check todays air pollution level on the UK Air Website15). Air pollution levels are usually much lower in parks and woodlands, so make use of your local green spaces and off-road walking / cycle routes.
12 https://www.bre.co.uk/page.jsp?id=720 13 15th June; https://www.cleanairday.org.uk/ 14 https://www.airweshare.co.uk/what-can-i-do 15 https://uk-air.defra.gov.uk/

LAQM Annual Status Report 2018 xvii
• Shut out pollution; Blocking out air pollution can dramatically reduce your exposure. If you live or work close to a busy road, reduce your exposure by ventilating the property using windows furthest away from the traffic, keeping those closest to the carriageway closed. Take advantage of the ‘stack effect’, and open one low window (for example at the rear of the property, away from the road) and open one high up – air taken from the façade of the property furthest from the road will be cleaner, and the slight difference in air pressure will create a natural draw of air up through the building. If you are constructing new property, or undertaking renovation work on a building close to a busy road, you could consider installing mechanical ventilation with heat recovery (MVHR) to achieve cost effective & super energy efficient whole-building ventilation without the need to open windows. If an MVHR system draws intake air from high up, and as far away from the road as is practical, you will achieve a huge improvement in indoor air quality in comparison to using vents or windows on the road side of the building. For really busy locations, filters can be incorporated to capture particulates, or even absorb Nitrogen Dioxide and Organic Hydrocarbon pollutants.
• Take a “walk on the inside”; In most cases, pollution from road vehicles dissipates very rapidly from its source (the road) – the effect is greatest closest to the source, so walking on the inside of the pavement as far away from the kerb as you can will significantly reduce your exposure. It is well known that (for a variety of reasons), children are more sensitive to air pollution – if walking with children when the roads are busy (e.g. travelling to school), keep them on the inside away from the kerb to reduce their exposure.
• Minimise your exposure when driving; Pollution exposure can be high for drivers, and pollutant levels are highest when the roads are busiest. Where possible, travelling at quieter times of day can help reduce your in-car exposure to air pollutants. If you are stuck in heavy traffic, close the windows and turn your ventilation to recirculation until the traffic starts flowing freely again to avoid the build up of exhaust emissions within the cabin of your vehicle.
➢ Reduce your transport emissions;
• Make sustainable travel choices; Whether you choose to travel by train or bus, to lift-share, use the park & ride, or to use any other active form of transportation (walking, cycling, or by skateboard, roller skates or unicycle…); by leaving your car at home, outside the town centre, or sharing the journey with someone else who would have otherwise driven by themselves - you will cut the amount of pollution you create. Active travel is ideal, as it comes with health benefits that make you less susceptible to negative impacts of exposure to air pollution.
• Switch your engine off when stationary; by turning your engine off when you find yourself in stationary traffic you will help make the air cleaner for you, your fellow road users, pedestrians, and local residents. You will make both fuel & emission savings by turning your engine off when you are likely to be stationary for around 30 seconds or more. If you are in stop/start traffic and your vehicle doesn’t have stop-start technology, take care not to stop/restart more than 4 or 5 times or you may deplete your battery.
• Remove vehicle accessories when you don’t need them; roof bars, cycle carriers, and trailers can affect your fuel efficiency by more than 10%, unnecessarily inflating your fuel costs and increasing your engine emissions.
• Choose an appropriate vehicle for your needs; With the dizzying array of propulsion options entering the market, this has never been more important. If you are changing your vehicle, consider the size, type, and emissions of the car you choose. Manufacturers quoted emissions rates & fuel economy are only part of the story – the real-world performance will depend on how you use the vehicle.

LAQM Annual Status Report 2018 xviii
o Estimates vary, but the increased purchase and servicing costs of diesel vehicles are thought not to be offset even for a used vehicle unless you would cover at least 10,000 miles per annum on average. Diesel particulate filters and SCR systems tend to perform poorly where short distance urban driving is common and engines don’t reach optimal temperatures; so even though petrol vehicles can be over 30% less fuel efficient than diesels, petrol may still be the right choice if you expect low annual mileage or mostly travel short distances.
o If buying new, consider a low emission option – LPG, hybrid, or plug-in electric options are now readily available. All fuel types have their advantages & disadvantages, so it is important to research your options carefully to select a fuel option that works for your needs.
o The weight & shape of your vehicle will also make a big difference – SUV’s are both heavy & tall, and it takes energy to carry that weight and overcome the additional wind resistance – whether it’s electric, LPG, hybrid, petrol, or diesel; energy is fuel, which is both unnecessary cost and unnecessary pollution if you don’t need a vehicle of that size.
o Research your MPG; As a rule of thumb, a high MPG tends to mean low ‘per-mile’ emissions. This can be a little more complicated for Hybrid vehicles however, where calculations may ignore the initial battery energy whilst at the same time assuming that the vehicle will be on a drive cycle where that energy will be utilised. Figures may also ignore the fuel or energy demand required to replenish the battery of a self-charging or plug-in hybrid, and the figures will refer to the vehicle ‘as new’ and won’t account for deterioration in battery performance with age or in sub-optimal weather conditions (which can impact the per-charge-energy-yield of the battery)
o Several sources now publish handy ‘true mpg’ figures16 to help you translate the manufacturers lab-test fuel efficiency figures to ‘real world’ driving conditions.
• Adopt a smooth driving style; Your driving style could make a substantial difference to your fuel costs and your pollutant emissions – and if your insurer offers a ‘black-box’ telematics device (and you are comfortable with their data policy) it could save you money on your insurance too. Smooth driving, without harsh acceleration & braking will maximise fuel efficiency and minimise emissions - maintaining a constant speed of around 60mph when travelling on national trunk roads tends to be most fuel efficient & least polluting for conventional vehicles. By contrast, driving aggressively or at excessive speed will dramatically increase your emissions, and could cut your fuel efficiency by more than half whether you are driving an electric or conventionally fuelled vehicle.
• Give your car a holiday; if you are able to, working from home just one day a week will cut your commuting emissions by 20%, no matter what car you drive. Swapping face-to face meetings with video conferencing and online enabled collaborative working will further reduce the need for work related travel and will reduce the associated emissions.
• Maintain your vehicle; Keep your tyres inflated, and your vehicle serviced to ensure that it runs as efficiently and cleanly as possible. This applies to electric vehicles and conventionally fuelled vehicles alike. Fuel & Oil additives are available to help keep combustion engines free of carbon deposits, particulate filters clean, and reduce consumption of oil through unwanted combustion.
• Share the School Run; Chat to other parents at the school gates about setting up a car-share or a walking bus to make the air cleaner for every child at school. Find out how you can cut traffic by 30% with the WOW Challenge from Living Streets17, or talk to
16 https://www.whatcar.com/truempg/mpg-calculator, https://www.honestjohn.co.uk/real-mpg/, http://www.thempg.co.uk/ 17 https://www.livingstreets.org.uk/

LAQM Annual Status Report 2018 xix
your school about setting up a ‘Park & Stride’ scheme18 to reduce school gate congestion & unnecessary emissions where children may be exposed to significant levels of pollutants.
In the home;
• Save your log-burner for the bleak midwinter; Wood burners are very popular, and it is not difficult to understand why – they are very cosy, and timber is natural & renewable carbon neutral fuel which when used well produces very little smoke & ash. However, wood burning can produce a lot of air pollutants. Minimise your contribution to air pollution by ensuring you have an properly installed flue that is in good condition and kept clean & clear. Make sure that your cowl doesn’t overly restrict air flow. Choose a DEFRA approved stove if you can, learn how to manage your fire for efficient combustion, and burn an appropriate fuel (properly seasoned hardwood with a moisture content <18%, or a DEFRA approved low smoke fuel19). Do not burn manufactured timber boards (chipboard, MDF, OSB or ply) or any painted, tarred or exterior treated timber, and only light it when you need it. There’s great advice and supplier lists on the DEFRA supported ‘Ready to Burn’ scheme20, and an excellent short tutorial video, alongside great advice on fuel selection and pollution reduction on the BurnRight industry website21
• Avoid use of flueless gas fires in closed rooms or for excessive periods. HSE research22 has shown that use of a flueless gas fire over a period of just 2 hours (in a small room with poor ventilation) can result in a Nitrogen Dioxide concentration of more than 2000 µg/m3, ten times the hourly exposure limit for ambient air. The average NO2 concentration under test conditions for a large ventilated room was 533 µg/m3, which is still more than double the ambient hourly limit.
• Use the extractor hood when cooking using gas; as for flueless gas fires, gas ovens and gas hobs are flueless combustion appliances. During cooking, gas combustion produces NO2 and releases it in to the home – estimated to increase your average weekly exposure by between 25% & 39%, depending on the season. If you have a cooker hood that vents to the outside, use this whenever you cook to extract the emissions to external air – if you have a re-circulation hood, or do not have an extractor – make sure that you ventilate the room while you are cooking (e.g. by opening a window). Cooking food in general (even with electric) can release particulate hydrocarbons from cooking oil smoke & as food chars, so if you have an externally vented extractor – use it.
• Use a HEPA Air Purifier; Home air purifier units are effective for removing pollen, bacteria, PM10 and even PM2.5. Typical filtration rates are over 90% according to consumer tests23. Some units also include activated carbon filters to remove harmful gases from the air in addition to the filtration of fine particulates.
• Check your boiler flue; modern condensing gas boilers produce as much as 24,000µg total Nitrogen Oxides (NOx) per KWH. Around 5% of this represents a direct emission of Nitrogen Dioxide (NO2), which can equate to an emission of over 26,400 µg/hr (for a 33KW unit). Flues installed in full compliance with the applicable building regulations could still cause an exceedance of the 200 µg/m3 NO2 hourly limit at neighbouring-, or even at your own- property if the boiler is flued to a relatively confined space (e.g. a gated side access). There is a risk of exposure to this pollution if there are opening windows or have ventilation inlets which open to the same space. If you think this may
18 https://www.livingstreets.org.uk/media/2035/park-and-stride-print.pdf 19 https://smokecontrol.defra.gov.uk/fuels.php 20 https://www.readytoburn.org/defra-wood-burning-guide/ 21 https://burnright.co.uk/ 22 Research Report 23, ISBN 0 7176 2567 2 (2003); Flueless gas fires – concentration of carbon monoxide, carbon dioxide, and nitrogen dioxide, and particulate level produced in use 23 https://www.quora.com/Do-air-purifiers-remove-PM2-5

LAQM Annual Status Report 2018 xx
be a risk, you could consider fitting a flue extension, diverter, or re-siting the flue for your appliance to a location where dispersion will be more effective.
• Save the Bonfires for the 5th of November; Burning your garden waste & scrap timber contributes to local air pollution (Particulates, Nitrogen Oxides, and Sulphur) as well as causing nuisance to neighbours. Your local household waste recycling centre (HWRC) will accept both green & household waste (including timber) free of charge – check the County Council web pages24 for your nearest site. Havant Borough Council also offers a green waste collection service from just £42/yr.25, saving you the trips to your local HWRC.
• Go electric; Electric vehicles are getting a lot of press at the moment, but your car is not the only item you can swap for an electrical alternative. All electrical appliances are “zero-emission at point of use”* (*- unless generated from a renewable resource or nuclear, the energy generation creates emissions of air pollutants elsewhere).
o If you are changing your cooking appliances, consider selecting an electric oven and hob (convection, ceramic or induction) to reduce your own exposure to indoor air pollution and to minimise your contribution to local Nitrogen Dioxide pollution.
o Swap your gas fire for electric to reduce your local emissions. If you swap a flueless unit you will also reduce your exposure to indoor air pollution too.
o If your property is suitable and you have both the opportunity & ability to invest; consider choosing electrical water heating, a heat pump system for space heating, or a heat recovery ventilation system (MVHR)
o Installing Solar vacuum-tube (‘Direct Solar’) hot water or photovoltaic solar power generation will not only cut your carbon footprint, but will also minimise your pollution emissions. Combining this with a thermal store could maximise your local benefit – for example, by storing the energy produced while you are not at home as heat that you can use later, avoiding the need to use your conventional gas boiler)
• “Power Down before you Power Up”; Often the most cost-effective emissions reduction measures are to avoid using the energy in the first place. Before considering a micro-generation installation (e.g. a solar array) to help meet your energy demand, consider improving the insulation in your property, increasing air tightness to minimise unwanted ventilation and heat loss, and consider low cost energy saving such as use of LED lamps. There are lots of things you can do to conserve energy (and lower your bills), The Energy Saving Trust26 has some great advice on cutting your energy bills, and remember, lower bills = lower pollution.
• Use Less, Produce Less; Solid Fuel, Oil, gas and electricity are all significant contributors to air pollution. Different fuels create different emissions – Solid Fuel may produce more fumes or ash when burned than does oil & gas, but it can be a sustainable carbon neutral alternative to the ‘cleaner combustion’ fossil fuel alternatives which are (by contrast) net emitters of Carbon to atmosphere. Electricity is zero emission at point of use, making it ideal for minimising local emissions from homes or vehicles – however electricity produced by power stations burning fossil fuels has the same result as using fossil fuels directly, and contributes substantially to national emissions, and may cause a local air pollution problem near the point of generation. This is one reason plug-in electric vehicles & electrically powered home cooking & heating appliances are only part of the solution to the air pollution problem. The less energy you use, the less pollution is produced. Even if the energy source is renewable, if you don’t waste it then that clean capacity is available for use where it is needed, reducing the need to make up the shortfall with ‘dirty’ fossil fuel alternatives or ‘pollution legacy’ options such as nuclear.
24 https://www.hants.gov.uk/wasteandrecycling/recyclingcentres 25 https://www.havant.gov.uk/garden-waste 26 https://www.energysavingtrust.org.uk/home-energy-efficiency/energy-saving-quick-wins

LAQM Annual Status Report 2018 xxi
• Choose a renewable energy tariff; Choose renewable energy tariffs for your home supply to reduce the pollution produced by power stations. Your choice of tariff sends a message to generators and will contribute to their strategic investment decisions. In terms of air pollution, nuclear power is clean, however it is not a renewable source. Spent nuclear fuel needs careful management until it can be safely reprocessed – this could take anywhere from over 100 to many 1000’s of years, and could result in a significant legacy of pollution & contamination. Investment in truly renewable sources is needed to adequately address both carbon & pollution issues. This won’t happen without consumer demand.
• Support sustainable power generation projects; Official government statistics27 show that public support for renewable energy generation is high, at 79%. Despite this, deployment has been slow and opposition at the planning stage is still prevalent when local schemes come forward. Voicing your support could improve the chances of a scheme achieving permission and contributing to our rates of clean & green energy generation.
• Go ‘green’; Plants are very effective at intercepting air pollution – they absorb & utilise nitrogen oxides (NOx & NO2), and trap particulate matter (PM10 & PM2.5) on leaf surfaces. Particulates intercepted that are not absorbed by the plant are washed to the soil by rainfall, where they are naturally broken down by soil bacteria. Plants don’t have to be close to the pollutant source to contribute to clean air in your local area, but the closer they are to the source of pollution the more effective they will be. If you live on a busy road, consider planting a hedge at the boundary closest to the road to intercept pollution. If you are building or renovating, green walls are very effective at stripping pollutants from the air, and green roofs can also make a positive contribution.
➢ Raising awareness:
• “Talk the Talk”; If you’re “walking the walk” (have made changes to reduce your emissions, minimise your exposure, or taken steps to improve the air quality in your local area) - shout about it. Use the power of social media to share your experience and to help educate others on the positive steps they can take to reduce pollution or reduce their exposure to it.
• Contact your local councillors or MP’s; If you are concerned about air pollution or if you have a great idea for reducing emissions – contact your local representatives to let them know. You can find out how to contact them by putting your home town in the search box at https://www.writetothem.com/. Politicians help shape a wide range of policy that is relevant to air pollution, and locally, could influence which projects are given support, or opposed. Keeping air quality on the agenda will make sure that air pollution is considered as an integral part of those policy, investment, and planning decisions.
• Don’t be afraid to ask; Find out what your children’s school, or your employer is doing to make our air cleaner – if they don’t know, you can share some of the ideas in this report.
• Get involved; A number of campaign groups are actively involved in air pollution, green energy and sustainability issues. Friends of the Earth are active locally to Havant, there’s some good information available on their website from their ‘Clean Air Campaign’ pages28, including the results of the member air pollutant monitoring. Greenpeace29 are also getting involved in UK air pollution issues, and 10:10 is a climate action group30 which campaigns for the renewable energy needed to support the technologies needed to tackle air quality issues. These organisations, and others, will
27 https://www.gov.uk/government/statistics/energy-and-climate-change-public-attitude-tracking-survey-wave-21 28 https://friendsoftheearth.uk/clean-air 29 https://www.greenpeace.org.uk/what-we-do/climate/airpollution/ 30 https://1010uk.org/

LAQM Annual Status Report 2018 xxii
provide wide range of opportunities to learn about air pollution or to get involved in local campaigning, national and international lobbying – so you can get as involved as you like, from keeping your ‘finger on the pulse’ to joining the campaign in a very practical way.

LAQM Annual Status Report 2018 23
1 Local Air Quality Management
This report provides an overview of air quality in Havant Borough during 2018. It fulfils the requirements of Local Air Quality Management (LAQM) as set out in Part IV of the Environment Act (1995) and the relevant Policy and Technical Guidance documents. The LAQM process places an obligation on all local authorities to regularly review and assess air quality in their areas, and to determine whether or not the air quality objectives are likely to be achieved. Where an exceedance is considered both likely to have occurred, and likely to occur in future reporting periods; the local authority must declare an Air Quality Management Area (AQMA) and prepare an Air Quality Action Plan (AQAP) which sets out the measures it intends to put in place in to achieve the relevant air quality objectives. The production of this Annual Status Report (ASR) is an routine requirement, and it aims to show the strategies employed by Havant Borough Council to improve air quality within it’s district, and any progress that has been made towards the achievement of this general aim. The statutory air quality objectives applicable to LAQM in England can be found in Table E.1 in Appendix E.
1.1.1 Timing & Content of Report
The reporting timetable requires the submission of the ASR by the 30th June of the year following the reporting period calendar year. The purpose of the ASR is not only to report on the current state of Air Quality within the Borough, but also to report on actions taken to safeguard-, or where possible to improve-, local air quality. It follows that the Local Authority is expected to be proactive in seeking emissions reductions, and in securing high quality developments & landscapes which contribute to the aggregate enhancement of the public realm through incremental change. A broad range of Local Authority services are involved in areas which affect air quality, but in general air quality is ancillary to the primary functions of those services. For example, Council services may be primarily concerned with economic development, or with public transportation, parking enforcement, encouraging uptake of low carbon technologies, safeguarding public health and protected areas (ecological or landscape), or in securing high quality and desirable uses of land to the benefit of the Borough as a whole. All of these services have potential to influence local emissions & by extension, local air quality. That potential could be either positive or negative, and so the delivery of these services represents opportunities for achieving mutual co-benefits as well as representing competing priorities which could be antagonistic to public health and air quality goals. Relatively few resources are available for the co-ordination of these functions to ensure that Air Quality forms a material consideration for all these otherwise disparate & discrete Public Service areas. Environmental Health currently provides this resource in an internal advisory capacity as a non-statutory consultee. The resources available within Environmental Health are however equally shared among the breadth of related-but-discrete functions of the service, and in addition, must serve both the ‘reporting’ and ‘proactive’ LAQM functions. The current regulatory & funding environment is challenging. There has been a period of sustained evolution of environmental and development policy since the election of the Coalition Government in 2010, resulting in a number of emerging, new & amended Statutory Instruments, Bills, and Policy documents in recent years. The pace of this evolution has not abated during this latest reporting period - driven substantially by the heightened awareness
LAQM Annual Status Report 2018 24
of Air Quality as a public health issue, by sustained and high-profile Climate Change campaign activity, and by an increasing awareness of the intrinsic synergy of action on Climate with Air Quality goals. In addition, the UK Government continues to be placed under pressure to maintain standards of environmental regulation as an integral part of the UK’s withdrawal from the European Union. The 2018-2019 Period has seen the publication of the Draft Environment (Principles & governance) Bill31 and it’s accompanying summer policy statement32, the Road to Zero Strategy33 and revised versions of the UK Clean Air Strategy34, and Future Framework for Heat in Buildings35, and the 25-Year Plan to Improve the Environment36. In addition, DEFRA has run a consultation on Domestic Solid Fuel Burning37, NICE has consulted on it’s Draft Quality Standard for Air Quality38, the HSE has published a series of Air Pollution Factsheets, and the Royal Town Planning Institute has published it’s guide for Local Authorities on Planning for Climate Change39 which recognises the interaction between air quality and climate-altering emissions, and the role of planning in effecting change. Revised National Planning Policy Framework (NPPF) documents were also published in both July 2018 & February 201940, with the 2018 publication coinciding with the undertaking of a comprehensive review of local policies at Havant, integral to the making of the Councils’ Local Plan (2036). This process was at an advanced stage at the time of NPPF publication, and it was necessary to consider the implications of the national direction on the approach taken in deriving local policy. Whilst there had been no amendment of legislation governing the LAQM regime, the Government strategies, policy and programme of legislative reform collectively represent a direction to Local Authorities to shift the approach to LAQM from the assessment of air quality against a threshold standard (a limit or objective), to an approach where incremental improvements are sought in support of wider public health goals irrespective of the current state of air quality relative to these standards. In order to avoid the adoption an 18-year local plan which failed to respond to the objectives embodied within the collection of Government Strategies and emerging programme of Legislative reform, the Council recognised that priority needed to be given to responding to the signalled change in approach to local air quality, and the anticipated changes in the approach to tackling climate change issues. Given finite resources available, this need was in direct competition with the requirements to continue to implement and exercise it’s existing policies (to achieve air local emissions reductions), to continue monitoring and assessing Air Quality, and to report upon it’s work in line with the ASR reporting calendar, and had led to the 2018 ASR (due June 2018) being delayed by 8 months, being published in March 2019.
31 Draft Environment (Principles and Governance) Bill, DEFRA, December 2018 https://www.gov.uk/government/publications/draft-environment-principles-and-governance-bill-2018 32 Environment Bill summer policy statement: July 2019, DEFRA https://www.gov.uk/government/publications/draft-environment-principles-and-governance-bill-2018/environment-bill-summer-policy-statement-july-2019 33 Reducing Emissions from Road Transport: Road to Zero Strategy (July 2018); https://www.gov.uk/government/publications/reducing-emissions-from-road-transport-road-to-zero-strategy 34 Clean Air Strategy 2019, DEFRA, Jan 2019; https://consult.defra.gov.uk/environmental-quality/clean-air-strategy-consultation/user_uploads/clean-air-strategy-2018-consultation.pdf 35 A Future Framework for Heat in Buildings (Call for Evidence) (December 2018); https://www.gov.uk/government/consultations/a-future-framework-for-heat-in-buildings-call-for-evidence 36 A green future: our 25 year Plan to Improve the Environment, HM Government, Jan 2018 https://www.gov.uk/government/publications/25-year-environment-plan 37 Consultation on cleaner domestic burning of solid fuels and wood (Aug 2018); https://consult.defra.gov.uk/airquality/domestic-solid-fuel-regulations/ 38 Air Pollution: Outdoor air quality and health. NICE quality standard (Sept 2018); https://www.nice.org.uk/guidance/GID-QS10067/documents/draft-quality-standard 39 Planning For Climate Change (A Guide for Local Authorities) (May 2018) https://www.rtpi.org.uk/media/3152143/Rising%20to%20the%20Climate%20Crisis.pdf 40 https://www.gov.uk/government/collections/revised-national-planning-policy-framework

LAQM Annual Status Report 2018 25
These local pressures have not fully abated following finalisation of the pre-submission draft of the Local Plan 2036. The publication of development-land allocations contained within the draft local plan has led to several major developments coming forward early; at a time where there is a lack of clarity on the weight that should be given to emerging policy and where the detail required to underpin delivery of these policies has not yet been agreed. The Council has been cautious not to consent developments which take advantage of the land allocations (which are made on the assumption of their being subject to the full breadth of policy contained within the local plan-) without also accounting for the wider suite of policies. As a result, the ‘flush’ of major applications received during 2019 has been subject to a more active / collaborative planning process than would be expected under a planning environment governed by a single / up-to-date plan with adopted status. The need for this collaborative work is driven by the same factors as for the plan development, and is time-sensitive in the sense that there is a finite window of opportunity to set the benchmark for what is considered necessary to make the principle of development acceptable in planning terms – i.e. to ensure that consented-in-principle development is “environmentally sustainable development”. This has involved the active seeking of development features which serve to mitigate the air pollution impact of development, and the travel demand associated with it. The focus of this work has generally been strategic developments associated with urban regeneration policies, and other significant residential developments of over 200 dwellings. As within the previous period, work targeting reductions in emissions of air pollutants has been prioritised over reporting activity on the basis that failing to do so would have a material detrimental effect on air quality over the medium-to-long term, whereas (in the absence of any identified likely breaches of NAQS objectives-), a reporting delay does not have the same potential for material impact. The result of prioritising tasks in this way is a delay to the submission and publication of the 2019 ASR. It should be noted that the delayed 2018 ASR included content relevant beyond it’s due date, and so directly relevant to the 2019 ASR reporting period. Due to this, and the relatively short period of time between the publication of the 2018 ASR, and the publication date for the 2019 ASR, there is a substantial ‘overlap’ in content between these two reports. Some sections are reproduced without modification.
1.1.2 What do we mean by Ambient Air Quality?
The term ‘Air Quality’ is a synonym for the whole body of Regulation & Guidance made under the European Communities41 & Environment42 Acts pursuant to the transposition & implementation of 96/62/EC43, it’s daughter directives and 2008/50/EC44. The meaning of the term will vary slightly depending upon context. Within this report, the Term ‘Air Quality’ refers to the LAQM regime under the Environment Act 1995, it’s current Technical Guidance (LAQM.TG(16)45), and the Air Quality Objectives under the Air Quality (England) Regulations 2000 (SI 92846); when measured in accordance with Schedule 1 to the Air Quality Standards Regulations 2010, (SI 1001)47.
41 European Communities Act 1972 c.68 42 Environment Act 1995 c.25 43 Council Directive 96/62/EC of 27 September 1996 on ambient air quality assessment and management (repealed by 2008/50/EC) 44 Directive 2008/50/EC of the European Parliament and of the Council of 21 May 2008 on ambient air quality and cleaner air for Europe 45 Local Air Quality Management Technical Guidance (TG 16), DEFRA, April 2016. https://laqm.defra.gov.uk/technical-guidance/index.html 46 The Air Quality (England) Regulations 2000 SI 928; http://www.legislation.gov.uk/uksi/2000/928/contents/made 47 The Air Quality Standards Regulations 2010 SI 1001; http://www.legislation.gov.uk/uksi/2010/1001/contents/made
LAQM Annual Status Report 2018 26
References to air quality standards in this report will typically be to NAQS ‘objectives’ (reflecting language used within SI 928, which apply to the LAQM regime). Any references to NAQS ‘limits’ or ‘limit values’ will refer to standards under SI 1001, which apply to national assessment of compliance with 2008/50/EC which is a duty of the Secretary of State. Whilst the relevant averaging areas under SI 928 & SI1001 differ, in most cases the volumetric concentrations and averaging periods are the same. Air quality is directly related to the emission of pollutants, but differs in that it is considered within a defined framework (referenced above). That framework accounts for both the location of exposure, and the average concentration over specific durations. Personal exposures to air pollutants occur at places where the standards apply (‘locations of representative relevant exposure’), and locations where they do not. The personal health impact of an hour of exposure to poor air quality at a location where the ambient air quality standards do not apply would be equivalent to that arising from exposure at a relevant location; the distinction between ‘relevant’ and ‘non-relevant’ locations is not explicitly based upon a ‘risk of harm’ judgement. Considering the balance of average durations and intensities of personal exposures at relevant and non-relevant locations, the public health impact of exposure at ‘non-relevant’ locations is likely to approximate-, and is arguably likely to exceed- that which arises from exposure at locations where the current air quality standards apply. In this way, the LAQM regime cannot in isolation serve to reduce personal exposures below thresholds of harm, as LAQM disregards a significant portion of the aggregate total personal exposure. Achieving full national compliance with ambient standards would therefore not eliminate the occurrence of adverse air-pollution-related health outcomes, due to personal exposure acquired at non-relevant locations-, or to emissions arising from non-relevant sources-; for example: ➢ When Travelling – exposures occurring at at/on footways, cycleways, at the kerbside,
within the carriageway (e.g. cyclists on roads), or within the cabin of any vehicle (whether road or rail, private or public) are not considered relevant in terms of the current air quality standards.
➢ At Work – workplace exposure limits apply at work, whether the employment is within an industrial setting or at an office or service sector location, and so these locations are exempt from any need to meet ambient air quality standards.
➢ When accessing Services – exposures occurring at commercial locations (where any volunteers work, or staff are employed and where workplace exposure standards apply) are not considered relevant to NAQS objective values, even for customers or visitors. There are some exceptions (e.g. accessing medical or education services), but standards to not apply at the majority of public service, retail and leisure premises.
➢ Within the Public Realm – public spaces, for example play areas, parks or pedestrianised shopping areas etc. are not considered relevant to annual limits (hourly limits do apply).
➢ From industrial, commercial or domestic point sources – Concentrations at locations relevant to the current ambient air quality standards (e.g. residential, educational or clinical) may still exceed those standards where concentrations only exceed the standard as a direct result of a localised emission source. For example, a commercial kitchen extract, woodburner or gas boiler flue close to the window of a residential dwelling may cause the air quality at that dwelling to exceed the ambient standard, without representing a breach of that standard.

LAQM Annual Status Report 2018 27
➢ From sources within the Home – Exposure to pollutants that are emitted from a source within the home are not considered relevant to the current air quality standards. Exposures within the home can exceed permissible ambient exposures by many times simply by using common household products and appliances.
In order to eliminate harm caused by NAQS pollutants it would be necessary to address exposures falling outside the current framework for maintaining compliance with NAQS objectives & limits (including, but not necessarily limited to- those listed above). Addressing such exposures would be administratively and politically complex; as it would necessitate encroachment upon personal choice – choices such as where to work, which products to purchase or use, how to heat or use your home, or what methods are chosen for cooking of food. The ambient air quality standards implicitly accept that average personal exposures may significantly exceed the air quality limits as a direct result of exposure at locations listed above. The objective of the ambient standards is specifically to address the contribution of average, background air pollution (whether avoidable or not) to the overall aggregate personal exposures. The air quality standards are not intended to represent a threshold between ‘harmful’ and ‘safe’ concentrations considered against an acute or short-term exposure. Even where short term (e.g. hourly) standards are defined, these apply to permissible regular hourly peak exposures over a minimum period of 12 months. Peak hourly exposures must be considered within & alongside the over-arching annual average limit, which serves as a ‘ceiling’ to the frequency of occurrence of concentrations close to, but not exceeding the hourly limit. In this way, hourly limits for air quality do not represent a threshold of harm for an ad-hoc (e.g. one off) exposure to an emission, even where the ad hoc exposure occurs at an equivalent concentration, over an equivalent time-period.
1.1.3 Update on Priorities from 2018 ASR – Review of A3023 Monitoring Positions
In line with 1.1.1 above, incomplete or ‘in progress’ priorities reported in the 2018 ASR are carried forward in this report. The 2018 ASR contained the following priority task; “Monitoring: To review results from additional monitoring at the East side of the A3023 Langstone Road to verify previous conclusions & to select a long-term monitoring location which is generally representative of emissions at the100m street segment of the A3023 in the vicinity of no’s 9-11 Regents Court.” Position 19B (originally 19, Langstone Road East) was established to assess representitive ambient air quality at the east- (‘down-prevailing-wind’-) side a 200m section of Langstone Road of a where there are multiple-lanes, and lane-merging in a Southbound direction. Position 19 provided results considered representitive of this road link source, but lamp-column replacement in 2014 destroyed the original mounting position and necessitated moving the monitoring tube to the next available column, located 54m south. The new position (19B) returned substantially elevated results, which were subsequently identified as likely to be unduly influenced by bus emissions from the adjacent bus-stop lay-by, specifically when accelerating to re-join traffic on the carriageway of Langstone Road (see Figure A.2 and Section 3.2.2 of the 2017 ASR48).
48 2017 Air Quality Annual Status Report, Havant Borough Council, Ref: ASR-1701/v1 13/06/2017 (not available on line at time of writing, available on request)

LAQM Annual Status Report 2018 28
Multiple monitoring locations have been established from late 2017, with the overall aim of verifying this initial assessment, and of selecting a single representitive position from which worst case ambient concentrations may be monitored going forward. The location selected must be considered sufficiently compliant with the monitoring requirements, to form a valid basis for estimates of representitive exposures which can in turn can be compared with the NAQS objectives. In order to guard-against any perception of ‘inconvenient’ results being omitted from the monitoring dataset, monitoring has been undertaken concurrently in the interests of transparency. Available results from monitoring positions 19B-E have been used to estimate monthly concentrations at the worst-case point of relevant exposure on Langstone Road (a residence at Regents Court), and comparisons have been made against the suspected ‘unrepresentative’
position 19B as a baseline (note, Figure 1.1 uses ‘raw’ data, not corrected for bias). The aim of this comparison is to establish the relative consistency of estimates, and to judge which monitoring location is likely to be most representitive to retain. The results from this exercise show a broadly consistent negative bias in estimates at the receptor, relative to those made using data from position 19B. This is regarded as supporting the conclusion the that 19B should not be regarded to be generally representitive of the road segment that it was established to assess. The substantially elevated results from Position 19C were discussed in section 3.2.4 of the 2018 ASR. No cause was determined for the similarity of results between positions 19C & 19B over November 2017-January 2018, and this (local unexplained volatility in concentrations) remains a factor weighing against use of this location, however it is noted from the available data to be an exception to the general trend. Subsequent monitoring has consistently shown a substantial differential between the two locations, averaging around -26%. The only consistent way to compare these separate monitoring points is to use the data to calculate the air quality at a fixed conceptual distance from the road link source being assessed. This suppresses the component of difference at the point of measurement that derives from the rate of dispersion from the point of emission. The comparison has shown position numbers 19E & 19C to be relatively consistent with one another, with 19E showing slightly more pronounced negative bias. 19D (Regents Court) is positioned at the greatest distance from the carriageway of Langstone Road, with more than 10m between the receptor and the point of measurement. This results in a ‘caution’ message from the Bureau Veritas ‘fall-off with distance’ calculator, and makes the position more sensitive to the ‘natural’ variation associated with measurement and analysis uncertainty. As a result, the pattern of estimates has a somewhat broader overall range (-44% to +15%) and reduced consistency.
In comparison, 19E has a similar maximum negative bias (to 19D), but a narrower range (of -44% to -6%). This position returns more consistent data than does 19C (relative to
concentrations at 19B in terms of ‘magnitude of range’), which as Figure 1.1 illustrates, is subject to a more neutral bias range of -39% to +20% for the available period of monitoring.

LAQM Annual Status Report 2018 29
Figure 1.1 – Comparison of Langstone Road Monitoring Locations, as
estimated monthly average NO2 at Regents Court
Position 19E also has physical characteristics which are most closely aligned with the monitoring criteria of 2008/50/EC Annex III & Schedule 1 to SI 1001. The position is more open in character than 19C, lacking the overhanging vegetation associated with 19C, and whilst the position is closer to a physical barrier (boundary wall), the barrier is of lower height than the 1.8m close-board fence present within 4m of position 19C, and so is less likely to influence concentration gradients at the height of measurement. On the basis of the available results & the character of the built environment, it would be reasonable to conclude that position 19E is the best position to retain. There are however some factors weighing against – 19E has suffered from poor sample recovery rates in 2019, which has resulted in fewer measurements being available for the assessment. This might mask some measurement variability that may have become apparent from a larger dataset. It is also relevant that 19E is positioned at the southern end of the target road segment, where southbound carriageways are tapering to significantly reduced width (approx. 1.25x single carriageway) where traffic merging is likely to have already occurred. For this reason, the position is not necessarily representative of the gap-seeking / lane changing driver behaviour that is the target of monitoring, and this may be a material component of the relative stability of measurements from this location. Position 19C is in contrast approximately central to the target road segment, and is positioned a sufficient distance from the kerbside to avoid the estimate-sensitivity associated with the exponential decay rates built in to the ‘fall off with distance’ calculator. The presence of a physical barrier & tree canopy weighs against, as does the unexplained elevated results evident at the beginning of the monitoring period.
10.00
20.00
30.00
40.00
50.00
60.00
70.00
Jul Aug Sept Oct Nov Dec Jan Feb Mar Apr May Jun Jul Aug Sept Oct Nov Dec Jan Feb Mar Apr May Jun Jul Aug Sept Oct Nov
2018 2019
+/-15% (19B) 19B - Langstone Rd. East 19C - Langstone Rd (Woodbury)
19D - Regents Court 19E - Langstone Rd (11A)

LAQM Annual Status Report 2018 30
In terms of alternatives, other available mounting positions are either located <0.5m from kerb, or suffer unacceptably from the proximity to adjacent vegetation. An alternative position is available within Woodbury Avenue, but it’s perpendicular distance slightly exceeds that of trial position 19D, and so is likely to yield a similarly sensitive dataset for the purpose of back-calculating concentration estimates at a receptor located substantially closer to the principal source than the measurement position. It is considered that the best available publicly accessible monitoring positions have been included in the above reported assessment. The degree of variability noted at the different monitoring positions assessed is considered likely to be driven by different factors – ➢ 19C is positioned with a ‘perpendicular distance from kerbside’ great enough to protect
it from the influence of traffic related turbulence, and is as closely aligned as possible with the target receptor position. Only 1m differential between point of measurement and point of exposure means that corrections are of very small magnitude, increasing confidence in the representativeness of results, but equally resulting in an estimate at the point of exposure that is likely to be more variable. The monitoring position is also located close to a point where both vehicle turning movements and ‘gap seeking’ occurs, and so is likely to be more sensitive to variations in traffic flow characteristics than would be expected of either 19D or 19E. This location is also positioned with the shortest linear distance between the point of measurement and the point of exposure, by definition making it more representitive of conditions at the target receptor than more distant surrogates.
➢ Variation at 19D is likely to result from measurement & analysis uncertainty, amplified by the magnitude of ‘fall-off-with-distance’ correction required to produce an estimate at the target point of exposure (being a product of the relatively large distance between the measurement point and point of relevant exposure).
➢ 19E is likely to yield the most stable results due to it’s ‘perpendicular distance from kerbside’ being great enough to be protected from traffic related turbulence, whilst also being sufficiently closely aligned with the target receptor position so as to be subject to corrections of relatively small magnitude to produce concentration estimates at the receptor (minimising amplification of measurement & analysis uncertainty). The measurements are also likely to be less sensitive to variability in traffic conditions, due to the physical location at the southernmost end of the traffic merging zone, a point at which aggressive merging manoeuvres are likely occur (than might be expected at positions north of position 19E)
It is considered reasonable to reject position 19D on the basis of it’s position being greater than 10m from the target point of exposure, and therefore subject to unacceptable amplification of ‘natural’ variability for the method. It is also less certain that the position is capturing principally the emissions from Langstone Road. It is considered to be similarly reasonable to reject position 19E on the basis that (while it is likely to produce the most consistent results, and so be most representitive of ‘ambient’ conditions-) it is unlikely to be fully representitive of the traffic conditions on the target road segment. It’s poor sample recovery is also a relevant factor, which suggests that it is either ‘too visible’, or that it is being systematically removed by local residents. Data consistency is important, and poor collection will reduce the value of conclusions drawn from this position in the absence of contextual data from other positions on the east side of Langstone Road. On balance therefore, whilst there are factors weighing against selection of position 19C, it is considered that 19C represents the most representitive location for long-term monitoring of

LAQM Annual Status Report 2018 31
worst-case exposure at this ‘at risk’ road segment. It must be recognised however that the position is likely to be vulnerable to variability associated with management of the nearby trees, and could over-represent the general ambient concentration by measuring elevated concentrations of road emissions at a location with poor (and unrepresentative-) dispersion arising from it’s position on the ‘positive-prevailing-wind-pressure’ side of a tall physical barrier, and overhanging tree canopy (currently at height, but subject to change). For these reasons, this position is expected to represent a slightly ‘conservative’ measurement, and exceedances estimated from this position should be treated with a degree of caution. Careful consideration should be given to likely causes of exceedances at this location before regarding the exposure estimate as adequate justification for a regulatory response. The best available position in the vicinity is likely to be a private site within the curtilage of no.8 Langstone Road, located adjacent to Woodbury Avenue. This property has a freestanding post positioned approximately 10m from the kerbside of Langstone Road. There would be a low solid barrier (~1.0m) & a narrow line of medium-dense foliage of approx. 1.8m height between the kerb and the potential measurement position, but this is typical (representitive) of the area. The position lacks any directly overhanging vegetation and meets all other location criteria, subject to the winter idling / warming up practices of the owners. It is not considered ideal to rely upon private residential monitoring positions for long-term monitoring purposes, but this is a location which (subject to securing agreement) could reasonably serve a short-term data verification campaign to ‘benchmark’ any exposure exceedances that may in future be estimated from results obtained at position 19C. On the basis of the above it is concluded; ➢ that positions 19B, 19D, and 19E should be decommissioned in favour of continued
monitoring at position 19C only.
➢ that the tubes currently deployed at these positions should be redeployed in accordance with the priorities reported in the 2018 ASR.
If in future it becomes apparent that unfavourable results are being returned from position 19C on a sustained basis (3 months or more), without waiting the conclusion of an Air Quality reporting period the Council should; ➢ review of the current physical characteristics of the monitoring position and;
➢ the Council should seek agreement from the present occupant of the potential private monitoring position (identified above) to establish a measurement position for a defined-period concurrent monitoring campaign (3-6 months) to provide additional context for judgement of the results from 19C.
1.1.4 Update on Priorities from 2018 ASR – Redeployment of available monitoring resources
In line with 1.1.1 above, incomplete or ‘in progress’ priorities reported in the 2018 ASR are carried forward in this report. The 2018 ASR contained the following priority task; “To redeploy available monitoring resources in general accordance with the proposed principles, in order to broaden the Councils knowledge of local air quality across the Borough, particularly in areas not previously the subject of monitoring campaigns”

LAQM Annual Status Report 2018 32
Table F.29 (‘General Strategy for NO2 Monitoring’) of the 2008 ASR reported on progress toward this priority action, and outlines remaining tasks. 1.1.3 above reports on progress toward Table F.29 Item 2) & item 4) vii). Actions taken have freed some monitoring resources and made them available to further the strategic monitoring goals outlined at Table F.29 item 5), and 6). During the 2018/19 reporting period, Havant Borough Council has; ➢ Supported short period monitoring at 3 additional educational sites, St. Peters Primary-
and Mengham & Purbrook Junior- Schools, ➢ Established a short-period monitoring point at Bedhampton Hill to ‘ground truth’ a
modelled exceedance of the NAQS for Nitrogen Dioxide at this location, and satisfying several priority actions under ASR 2008 Table F.29 item 5).]
➢ Established a short-period monitoring point at The Limes to ‘ground truth’ a modelled exceedance of the NAQS for Nitrogen Dioxide at this location emerging from the PUSH strategic Air Quality Assessment subject of action UK0012-HBC_18 from Table 2.1 (this report)
➢ Established a short-period monitoring point at Dunsbury Way, Leigh park – in response to customer concerns about emissions from public transport (bus) stops at this location, and in line with the aims of the ASR 2008 Table F.29 item 6).
➢ Established two monitoring positions at the locally strategic (unclassified) road link between Havant Town and Emsworth.
Table F.10 provides an updated of ASR 2018 Table F.29, Appendix F contains location compliance assessments, Appendix D provides maps of current monitoring positions, and Tables Table A.2 & Table A.3 report results. Section 3.2.4 reports on the rationale for changes to the monitoring network that have already been undertaken. Implementation of the recommendations of 1.1.3 will free additional resources which will become available for deployment in general accordance with the principles outlined in Table F.10 items 5) & 6). Section 3.2.4 provides an overview of priority locations to target for new / future deployments.

LAQM Annual Status Report 2018 33
2 Actions to Improve Air Quality
2.1 Air Quality Management Areas
Air Quality Management Areas (AQMAs) are declared when there is an exceedance or likely exceedance of an air quality objective at a representative relevant location. After declaration, the authority must prepare an Air Quality Action Plan (AQAP) within 12-18 months setting out measures it intends to put in place in pursuit of compliance with the objectives. Havant Borough Council currently does not have any AQMAs. For reference, maps showing the current monitoring locations maintained by Havant Borough Council is available in Appendix D.
2.1.1 Local Air Quality Strategies
DEFRA PG16 recommends that authorities should consider having a local air quality strategy where local air quality in areas within the administrative district is close to the NAQS objectives. With the exception of some localised sections on the main route between Havant Town Centre and Hayling Island, comprising the B2149 Park Road South & A3023 Langstone Road (the ‘Park Road Corridor’); Havant Borough Council does not have any areas where levels of ambient air pollution are currently thought to be approaching the air quality objectives. A significant proportion of traffic using the Park Road Corridor is ‘through’ traffic whose destination is not the Town Centre. This is exacerbated by several other factors, for example; ➢ An access point to the strategic road network exists just South of Havant Town Centre,
at a mid-point in the B2149 to A3023 route.
➢ One of only two permanently-passable rail crossings on the local road network is located immediately North of Havant Town Centre,
➢ The historic town centre layout, characterized by the pedestrianised shopping frontage of West Street (East of Park Road South) and narrow streets (e.g. North, South, East & West Streets), constrains local routing options, and
➢ The A27 Havant Bypass junction is located on the axis of a strongly tidal North/South traffic flow associated with commuter trips from residential areas of Hayling Island to mainland employment. This route is also heavily used for Hayling Island residents to access retail and services not available on the island, and avoidance of this junction is only possible for motor vehicles by routing via the Langstone Technology Park (not a public route), or for pedestrians / cyclists via the Hayling Billy footpath.
Considered alongside the poor routing options to destinations North of the A27 Emsworth Junction, these factors mean that the A27 Havant Junction represents a natural exit/entry point to the Strategic Road Network for both local & out-of-district journeys whose destination (or origin) is north of the A27, where the trip origin (or destination) is sufficiently east of the A3(M) as to render the Havant exit closer. Havant Borough Council sees little opportunity to address such fundamental issues short of substantial investment in strategic road network improvements, or in new road links, junctions, or rail crossings which provide alternative routing options. Every opportunity to address these issues is being explored where it arises, however under the current & foreseeable funding environment opportunities to secure such investment are only likely to arise in connection with large scale local development.

LAQM Annual Status Report 2018 34
For these reasons, Havant Borough Council has not to date resolved to pursue a voluntary and proactive local air quality strategy. However, the PUSH area detailed air quality modelling report authors made a notable recommendation that consideration should be given to the adoption of a broader, regional-scale Low Emission Strategy. It was suggested that such a strategy could be modelled on an exemplar strategy already adopted in West Yorkshire in 201649, and could serve as a ‘link’ between otherwise disparate strategies which are critical to the achievement of air quality goals, but principally concern separate priorities. These might include Economic Development Strategies, Strategic Transport Planning, plans for meeting Energy needs and Climate Change & Sustainability goals, and strategies for effective adoption of new technologies to assist in meeting these strategic aims. A regional Electric Vehicle Strategy is identified as having the potential to be a particularly fruitful area for exploration, with several policy suggestions made in relation to investment in- and/or the promotion or facilitation of- a comprehensive regional infrastructure to provide practical support for the use ULEV’s. The final draft of the PUSH area study was issued in September 2018, and it’s conclusions have resulted in some authorities commissioning more detailed follow up assessment work. A coherent regional policy response will take some time to formulate, draft & adopt, assuming that it is possible to achieve agreement across the region. Given the structural constraints described above around the ‘Park Road Corridor’ in Havant; it is considered that providing support for a more rapid change in the nature of vehicles using the local road network (e.g. seeking to increase the proportion of vehicles using ‘zero NOx propulsion’ whilst travelling on the ‘Park Road Corridor’), would represent a realistic prospect of improving local NO2 compliance from a status of ‘borderline, stable’ to ‘comfortably complaint (negligible risk of future exceedance)’. Only a small sustained shift is likely to be necessary to achieve this. It is considered that such a strategy would have a significantly increased chance of success if implemented more widely than a ‘Borough-only’ basis. Strategic local partners for a sub-regional implementation would be those which represent a significant commuter draw for Havant residents – particularly Portsmouth, which represents either the source or destination of around 78% of the 24,000 daily commuter trips between Havant and nearby urban centres. Consideration of adoption of such a strategy is at present at the very early stages, but there is significant ‘in principle’ support at officer level across Strategic Planning, Health, and Transport functions within partner authorities. Following some preliminary discussion on the merits of a regional clean air strategy, where the Partnership has expressed some appetite to explore the merits of implementing such a strategy, little progress has been made in 2019. The item remains on the agenda at the time of writing, and it is expected that the 2020 ASR will be able to provide an update. Adoption of such a regional strategy would require support from the political leadership of partner organisations. Implementation will remain uncertain until the strategic concept &
principles have been sufficiently developed, and support has been secured.
49 West Yorkshire Low Emissions Strategy 2016-2021, December 2016 (https://www.bradford.gov.uk/media/3590/west-yorkshire-low-emissions-strategy.pdf)

LAQM Annual Status Report 2018 35
2.2 Progress and Impact of Measures to address Air Quality in Havant Borough Council
2.2.1 Responding to the 2017 & 2018 ASR
The 2017 ASR identified a measured exceedance at the kerbside of Langstone Road, but concluded that it was likely to be influenced by a local point source (adjacent local bus stop). The position was considered unlikely to representative of ambient Air Quality, and therefore it was concluded that it would be inappropriate to compare results from this location to the NAQS objective. The report recommended additional measurements be undertaken in the locality to confirm whether the anomalous measurement could be substantiated as unrepresentative (or not). DEFRA’s appraisal of the report agreed that the dismissal of the result was justifiable, and it was recommended that monitoring at the position in question (19B) cease, and that the tube be redeployed to a position as close as possible to relevant exposure to this location. Concurrent monitoring has now been undertaken. Results are reported in Appendix A, and an assessment of the relative performance and value of the alternative monitoring positions is presented in section 1.1.3 above. Section 1.1.3 also makes recommendations for amendments to monitoring positions in the vicinity of Langstone Road. A critical appraisal of the 2018 ASR was not undertaken by DEFRA due to the timing of it’s submission. Submission of report was acknowledged, as was it’s content and the explanation for the delay in it’s production. As a result, there are no comments from DEFRA which require a response.
2.2.2 Seeking incremental emissions reductions and improvements in local ambient air quality
Despite not having any air quality management areas, Havant Borough Council and Hampshire County Council have continued to take forward a number of general measures during the 2017/18 reporting year that aim to positively & incrementally improve local air quality within the borough in a direct way; or to inform policy, projects & investment decisions which are capable of contributing towards this same goal. Details of all measures completed, in progress or planned are set out in Table 2.1. Key actions taken / milestones reached this period: ➢ Together with our PUSH area Authority Partners, Havant Borough Council has taken a lead
role in the commissioning and project management for the sub-regional scale air quality assessment, and has provided technical input to ensure that the results meet the project brief & the modelling uncertainties are well understood. The report considers source emissions from the entire sub-regional classified road network, accounting for all allocated development within the respective Local Authority Local Plans. Whilst experiencing some production delays, the project is now complete, and a final draft is now available50. Some follow up work has been identified as a result of that report, but this is largely in connection with sensitive ecological sites. Results are discussed in more detail in the sections below.
➢ Three of the planned Four 50KW+ Electric Vehicle Charge points have now been commissioned, and are public at Council owned regulated Car parks in Emsworth, Leigh Park, Waterlooville51. These have been installed in partnership with ChargePoint Services (part of the Geniepoint network), and chargers are capable of charging all EV types currently on the market.
50 Partnership for Urban South Hampshire: Air Quality Impact Assessment Ref: ED 10415100 51 https://www.havant.gov.uk/electric-vehicles

LAQM Annual Status Report 2018 36
➢ Havant Council has begun the procurement process to replace 3 no. diesel powered vans currently in use for community and animal welfare services with modern, clean electric vehicles. Pilot procurement for one vehicle has been delivered, with this vehicle in active service since Spring 2019. Capital funding for up to four 22kw charging bays at the Public Service Plaza has been secured on an ‘in principle basis’, but the project has not yet been committed.
➢ The South East Hants Rapid Transit (SEHRT) Board joint bid to the ‘Transforming Cities’ fund was made in June 2018, seeking funds for the development of a rapid transit network linking Portsmouth to Fareham, Gosport, Havant and Waterlooville52. £4 Million has been awarded from the ‘quick win; fund, of which £2.6 Mission it so be spent on Junction improvements and the provision of real-time bus service information in the Havant & Waterlooville areas. The South East Hants Rapid Transit (SEHRT) Board comprises the Local Transport Authorities (county & unitary), and public transport operators First, and Stagecoach. Havant Council has not (therefore) been able to take a lead on this project, but has lent operational and political support to the project where possible. Both the leader of the Council and the local MP have submitted formal letters of support for the application.
➢ Phase two of the Langstone Road Cycle Link to Hayling Billy off-road cycle route was completed in October 2018, linking the Northern end of Langstone Road with National Cycle Network Route 22
➢ The Final Draft of the Air Quality Impact Assessment Ref: ED 10415100 has been published, and is publicly available. This report presents monitoring data from position ‘T2’, The Limes, which serves to quantify the real-world Nitrogen Dioxide concentrations at the location where the model predicted an exceedance of NAQS objective for Nitrogen Dioxide where relevant exposure was present.
➢ Havant Borough Council has now created an air quality ‘landing’ page on the Councils Web Pages, which outline some basic information and provides the required link to the latest ASR. Work remains to be done to shape this into a relevant and valuable resource for residents of the borough, but it is a necessary first step.
Havant Borough Council expects the following measures to be completed over the course of the next reporting year:
➢ An erratum to the Final Draft of the Air Quality Impact Assessment Ref: ED 10415100 iss3 is expected to be published, explaining the impact of minor data verification errors within the Havant Area.
➢ The commitment of funds for the planned 22kW charge points at Havant Public Service Plaza to support the Council’s expansion of it’s electric vehicle fleet, and commencement of procurement process.
➢ The purchase and commissioning of the remaining two planned electric vehicles, with these vehicles meeting the full travel requirements of the Community and Animal Welfare Teams without the need to contingency measures to maintain operational standards.
➢ SEHT bids for Tranche 2 funding from the Transforming Cities fund are expected to be submitted in November 2019.
Havant Borough Council’s priorities for the coming year are: ➢ To Actively manage the Council’s passive monitoring network in general accordance with
the principles outlined in the 2018 ASR (Table F.10 of this Report), to broaden the Councils knowledge of local air quality across the Borough. Focus on areas not previously
52 https://www.hants.gov.uk/transport/strategies/fundingbids (Jun 2018)

LAQM Annual Status Report 2018 37
the subject of monitoring campaigns or at relevant locations where significant traffic growth has been identified or is expected to occur.
➢ To improve digital content & information provision for residents, to improve engagement & awareness of Local Air Quality & Sustainability issues.
➢ To deliver an adopted Local Plan that is fit for purpose and fully accounts for the principles and policy embodied by the revised NPPF & other air-quality-relevant government strategies, and which includes a specific policy for air quality that aims to ensure that all new major development contributes proportionately to the mitigation of local emissions.
➢ To exercise environmental & sustainability policies to capitalise upon opportunities to secure improvement of key infrastructure that is critical in supporting a shift in the proportion of trips made by conventionally-fuelled private motor car to more sustainable and active means of travel.
➢ To continue to drive forward schemes to support delivery of the Hampshire active travel strategies53,54,55, especially those already underway, and those on Hayling Island where funding sources have already been identified.
➢ To draft and publish a Local Cycling & Walking Infrastructure Plan (LCWIP), and strategic ‘network legibility improvement plan’ for pedestrian and cycle networks – for implementation over the local plan period (to 2036).
➢ To pursue measures that have scope to alleviate traffic pressure on Havant and Emsworth town centres, through positive support for strategic developments which would justify national trunk road infrastructure improvements (e.g. the proposed new junction on the A27, East of Emsworth exit).
➢ To ensure that developers continue to optimise the design & specification of buildings to minimise energy consumption and incorporate low emission technologies; particularly those which replace a local combustion appliance with a ‘zero emission at point of use’ alternative.
➢ To ensure protections are secured for the occupants of new residential conversions within town centre locations adjacent to busy transportation routes, or where monitoring suggests pollutant concentrations are within 5% of NAQS objective values.
The ability to progress Council-led capital projects such as the District Heat & CHP56 is subject to both the prevailing funding conditions, and to a significant extent the prevailing economic outlook. Economic conditions could affect both the costs & feasibility of borrowing to deliver such projects, as well as influencing the scale of rewards from implementation (e.g. the operational costs, achievable income from exporting energy, and the local demand). In this way, projects of this type could be subject to a certain degree of ‘fluidity’ in feasibility, which could make the difference between choosing to progress, or to wait for more favourable economic conditions. At the time of writing, no viable funding source has been identified to progress the new Lane / Civic Campus District Heat & CHP project, and so this action has been removed from the ‘priorities for next reporting period’ list. In March 2018 Homes England approved £3.4Million in funding to accelerate delivery of at least 121 innovative & sustainable new apartments on the Civic Campus site, and the masterplanning process is underway. This scheme provides a potential ‘ready market’ for the District Heat scheme and may provide a catalyst for it’s progression. If the Civic Campus Regeneration project does not ‘design in’ connectivity for the District Heat scheme, it could prove to a decisive factor for the future viability of the project.
53 Hampshire sustainable modes of travel for children and young people strategy – supporting healthy and safe movement for all (HCC, Jan 2013) 54 Hampshire County Council Walking Strategy (2015-2025; HCC Jan 2016) 55 Hampshire County Council Cycling Strategy (2015-2025; HCC Sept 2015) 56 Havant borough heat demand mapping and energy masterplanning (Prosperity Havant, Havant Borough Council, 2016)

LAQM Annual Status Report 2018 38
Funding has been identified to support various active travel projects identified under the County-Level Travel Strategies, and under the Hayling Island Cycling and Pedestrian Improvements Feasibility Report, for completion over the next 1-2 years. Opportunities to secure delivery of additional highway & transport infrastructure schemes to support sustainable travel choices are similarly tied to the economic outlook, as these are often heavily dependent on developer contributions, or are development led. Local developments, especially flagship developments such as the Market Parade tower or Hambledon Road Build-to-Rent ‘regeneration catalyst’ schemes, are extremely sensitive to the economic outlook over the next 2-3 years, and to a large extent are outside of the control of Havant Borough Council to secure delivery once consents have been granted. Havant Borough Council anticipates that the measures stated above, in Table 2.1 and in
Appendix H will collectively support sustained compliance within the Park Road Corridor, and elsewhere within the Borough. In addition to those measures targeting measures capable of contributing to physical improvements in local air quality, Havant Borough Council has also; ➢ Responded to the government consultation on Domestic Solid Fuel Burning. A copy of the
response is provided at Appendix I.
➢ Responded to the National Institute for Health and Care Excellence (NICE) consultation on it’s draft Quality Standard for Air Pollution: Outdoor Air Quality and Health. A copy of the response is provided at Appendix I.
➢ Contributed towards a Hampshire County Council Education & Transport Planning project aiming to raise awareness of air quality issues at local schools. The project aims to encourage active modes of travel for journeys to & from schools through the ‘Mode Shift Stars’ Scheme, getting pupils involved in producing their own air quality campaigns & local air quality action plans. 2017 participants were Barncroft Primary, Bosmere, Trosnant & Hart Plain Junior Schools. Indicative results are presented in Appendix G, alongside an example Air Quality Campaign Plan.
➢ Committed to an ambitious strategic development area between Denvilles & Emsworth though a formal allocation within the pre-submission local plan 2036 under policy KS5. The proposed new access for the A27 (East of the Emsworth exit) is provided for at KS5(x), but is made subject to the outcome of a technical assessment of the cumulative transport impact of providing over 2000 new homes in this location. KS5(xi – xv) also seeks to secure additional infrastructure improvements, including reducing queuing at congested local road junctions, the provision of new bus services to serve the development, and the delivery of strategic cycling & pedestrian facilities designed to ensure that active travel choices are supported for journeys to key leisure, employment and service destinations. Together, these schemes are considered to have considerable scope to mitigate travel demand of this development, and could potentially reduce traffic flows within Havant Town Centre against current levels (resulting in net improvement in air quality).
Barriers to implementation of previously reported actions & priorities:
➢ No update is available on the performance of the pilot vehicle, or the timetable for progressing the initial ‘tranche’ of planned vehicle replacement. The lack of charging facilities local to the Civic Campus represents a barrier to completion of the planned procurement, and a lack of meaningful performance monitoring is likely to undermine the ability to demonstrate the competitiveness of ULEV’s for delivery of Council services.
➢ See Table 2.2 for a general commentary on progress toward delivery of planned actions outlined in Table 2.1, including barriers to implementation.

LAQM Annual Status Report 2018 39
2.2.3 PUSH low emission strategy
In order to materially improve air quality, it is necessary to address issues at all levels; from the highly local to the macro-scale. National and international governments are well placed to manage the legislative and regulatory environment governing permissible emissions from industry, vehicles, plant & appliances (in terms of aggregate total mass, and/or in terms of emissions rates). Local government (Borough & County) is well placed to manage highly localised issues at air pollution ‘hot-spots’, particularly those relating to traffic flow at individual junctions, and the avoidance of problems associated with introducing sensitive relevant landuses at locations with poor air quality. Falling between the macro-scale and micro-scale issues described above is a range of contributors to the local ‘background’ concentrations air pollutants, and an equally diverse range of opportunities to intercept and remove air pollutants from the atmosphere, which have to date received relatively little attention in the absence of any relevant exceedance of NAQS objectives. It is increasingly recognised that strategies aiming to improve local air quality need to look beyond the specific area where NAQS objectives are being breached, to measures which seek to; ➢ manage aggregate emissions from all sources, particularly those associated with new
development, new transport demand, new energy demand & combustion activity, and;
➢ maximise interception and deposition (to vegetation, land and surface waters) of air pollutants already released to atmosphere, especially where these may be sustainably ‘fixed’ without adverse impact upon sensitive habitats, and;
➢ minimise the trans-administrative-boundary effects of new emissions sources within the region, particularly in urban centres which attract significant visitation from adjacent areas to access retail, leisure or employment destinations.
Supported by robust & complementary local policy, a sub-regional strategy could serve to plug the gap between government efforts to regulate primary emissions, and local efforts to tackle air pollution hot-spots. A regional strategy would be uniquely placed to seek to mitigate growth of emissions through co-ordination of transport planning & strategic infrastructure development, and potentially allowing deployment of funds across boundaries so that developer contributions sought to mitigate the impacts of travel demand can be most effectively utilised. Consideration of the need for a sub-regional low emission strategy is at an early stage, but individual authorities within the PUSH group are already independently producing local strategies which might be adapted to a framework strategy which can be agreed across the PUSH region. Progress will be reported in future ASR’s.

LAQM Annual Status Report 2018 40
Table 2.1 – Summary of Progress on Measures to Improve Air Quality
Me
asu
re N
o.
Measure E
U C
ate
go
ry
EU
Cla
ssif
icati
on
Org
an
isati
on
s
inv
olv
ed
an
d
Fu
nd
ing
So
urc
e
Pla
nn
ing
Ph
ase
Imp
lem
en
tati
on
Ph
ase
Key Performance Indicator
Red
uc
tio
n i
n
Po
llu
tan
t /
Em
issio
n f
rom
Me
asu
re
Progress to Date
Esti
mate
d / A
ctu
al
Co
mp
leti
on
Date
Co
mm
en
ts /
Barr
iers
to
imp
lem
en
tati
on
UK
0012-H
BC
_3
MATiSSE smarter working
project Other Other
HBC, HCC, & Partners
2006 Ongoing
Home working, traffic management; 1) Rollout of ICT arrangements to HBC Staff 2) Progressive Rollout to Hampshire Public Services
Not Set
• Ongoing Provision Interrupted at HBC 2017/18
• Alternative provision agreed by HBC 2019
• Corporate roll-out implemented Summer 2019
2007- See Table
2.2
UK
0012-H
BC
_4B
Havant Borough Local Cycling &
Walking Infrastructure Plan (LCWIP)
Promoting Travel
Alternatives
Promotion of walking
HBC, HCC & Partners
2018/19 2020-2023
Develop Sustainable travel infrastructure and Encourage zero emissions transport; 1) KPI's as UK0012-HBC_5B for Walking Infrastructure enhancements delivered as shared-surface active travel links, or secured via s106 & s278 agreements 2) Actively Promote Walking; Active Travel /' Public Health schemes, and walking as a leisure activity.
Not Set
• Continued promotion of the 'Walking for Health' scheme
within the borough • 'Get up & Go' physical activity
scheme for over 55's successfully piloted in 2018, with
a 2019 programme underway (includes guided walking)
2025-2036
See Table 2.2
UK
0012-H
BC
_5B
Havant Borough Local Cycling &
Walking Infrastructure Plan (LCWIP)
Transport Planning and Infrastructure
Cycle network HBC, HCC, & Partners
2018/19 2020-2025
1) Publish Aspirational Cycle Network Map for the local plan 2036 period 2) Produce & Publish a local LCWIP 3) Submit a Transforming Cities Fund Bid to support strategic implementation (Autumn 2019) 4) Publish a 'network legibility improvement plan' 5) Use the plans (1, 2 & 4 ) to help secure s106 & s278 funding to support implementation of secondary & feeder routes not covered by the Transforming Cities Bid. 6) Development of local & National Cycle network, in accordance with the Hayling Island improvement feasibility report, and as identified during the course of the County Cycling Strategy (2015-25)
Not Set • Aspirational 2036 Cycle Network Map Published
2025-2036
See Table 2.2

LAQM Annual Status Report 2018 41
Table 2.1 Continued…
UK
0012
-HB
C_12
Transportation Assessment and
seeking developer contributions for
traffic impact mitigation (Policy)
Policy Guidance and Development
Control
Low Emissions Strategy
HBC 2011 Ongoing
1) Adopt policy framework which: • Secures assessment of the transport impacts of all new major development • Requires efficient use of existing infrastructure • Requires effective mitigation 2) Exercise local policy to achieve effective change
Not Set
• Completed for 2010 plan-making phase
• Delivery maintained to date • Comprehensive review
completed for 2018 plan-making phase
• Policies Updated 2017/18, at pre-submission draft
stage.
Ongoing See
Table 2.2
UK
0012-H
BC
_13
Forward Planning Policy Guidance
and Development Control
Air Quality Planning and
Policy Guidance HBC 2011 Ongoing
1) Adopt policy framework which: • Encourages development in sustainable locations • Minimises the need for travel • Facilitates sustainable and active travel choices • Promotes linked trips • Provides for parking allocation to respond to local context & provision of alternative transport options. 2) Exercise local policy to achieve effective change.
Not Set • As UK0012-HBC_12 Ongoing See
Table 2.2
UK
0012-H
BC
_14
Seek mitigation of emissions
associated with new
development on an 'all-sources'
basis
Policy Guidance and Development
Control
Air Quality Planning and
Policy Guidance HBC 2018 2018-2036
1) Adopt policy framework which seeks: • mitigation of development emissions at source, • promotes interception & deposition of air pollutants, and • provides for off-site mitigation where appropriate 2) Exercise local policy to achieve effective change.
Not Set
• Draft policy wording agreed for 2018 plan-making phase
• Policy retained within 2017/18 pre-submission draft.
Ongoing See
Table 2.2
UK
0012-H
BC
_15
Supporting Local Shopping
Policy Guidance and Development
Control
Low Emissions Strategy
HBC 2010 Ongoing
1) Adopt policy framework which discourages restrictive private (e.g. retail) parking policies that discourage linked trips. 2) Discourage restrictive private parking policy through: • Economic development & regeneration • Planning System
Not Set • As UK0012-HBC_12
• Indirect enhancement to previous provision
Ongoing See
Table 2.2

LAQM Annual Status Report 2018 42
Table 2.1 Continued…
UK
0012
-HB
C_16
Parking Service Policy
Traffic Management
Workplace Parking Levy,
Parking Enforcement on
highway
HBC 2010 Ongoing 1) Manage Parking Provision 2) Reduce the demand for parking 3) Set appropriate charges
Not Set
• 1) -3) Complete. • Achieved, in Delivery /
Maintenance Phase • Partial Update of Parking SPD
published Autumn 2019
Ongoing See
Table 2.2
UK
0012-H
BC
_17
Development of SE Hampshire
Integrated Rapid Transit Network
Transport Planning and Infrastructure
Bus route improvements
PCC, HCC, & Partners (HBC,
as member SEHRT Board).
DfT Funding
2015-2019 2019-2027
1) Improve sustainable travel offering for commuter trips between HBC & PCC Areas 2) Reduce the commuter mode share of private motor car 3) Secure fare reductions to incentivise public transport 4) Reduction in Journey Times between urban centres 5) Deliver complementary active travel routes to widen SEHRT network catchment.
Not Set
• Project objectives1)-5) subject to funding
• The 2018 Transforming Cities Funding application was
successful in securing the full bid for 'Tranche 1' funds
• The Havant Area will benefit from £2.6 Million investment from
the 2018 'Tranche 1' Award. • 'Tranche 2' Funding bids are on
track for submission in November 2019
Ongoing See
Table 2.2
UK
0012-H
BC
_18
PUSH Area Air Quality Assessment
Policy Guidance and Development
Control Other policy
HBC Lead, for PUSH
2016-2017 2017-2018
1) Complete Assessment: Secure funding, agree scope, commission report, review draft, consult PUSH authorities, agree final draft. 2) Use assessment to support the sustainable delivery of the objectively assessed level of housing need in the Havant area. 3) Consider need for a coherent regional low emissions strategy
Not Set
• 1) Complete. Final draft issued September 2018
• Report has informed the Local Plan 2036
• Assessment supports UK0012-HBC_13,14 & 19 • Report Erratum expected Autumn 2019. Errors not material to Conclusions.
Autumn 2018
See Table 2.2
UK
0012-H
BC
_19
PUSH Area Low Emission Strategy
Policy Guidance and Development
Control
Low Emissions Strategy
PUSH (HBC Member)
2018-2019 TBC
1) Agree the need for a LES at the sub-regional level, and draft a supporting business case 2) Achieve political support for a sub-regional LES 3) Agree common framework and benchmarks 4) Adopt the sub-regional framework at Borough Level, and adapt to local context. 5) Implement changes in line with Local LES 6) Report on key performance indicators as required by the adopted LES 7) Continued compliance with air quality objectives
TBC • Early Stage - 1) under
discussion. 2019-2020
See Table 2.2

LAQM Annual Status Report 2018 43
Table 2.1 Continued…
UK
0012
-HB
C_20
Safer Routes to School; School Travel Planning
Promoting Travel Alternatives
School Travel Plans
HBC, HCC 2017 2019(-TBC)
1) Provide proportionate support for HCC Schools AQ 3) Production of a school travel & air quality action plan at each participating school. 4) Participating schools achieving a new 'mode-shift stars' award, an upgraded award standard, or maintain a 'gold level' award. 5) Seek to repeat success of 2018 programme, and to achieve goals 3) & 4) for participating schools in 2019 & beyond.
Not Set
• Phase 1 & 2 Completed, with 7 schools having completed their
monitoring and travel planning at the time of writing
• Trosnant Federation of School's received it's Modeshift
Stars Silver Accreditation in Spring 2019
• Funding & Support to continue the project over the winter term 2019/20 has been agreed, and
three new local schools recruited to participate
2020 See
Table 2.2
UK
0012
-HB
C_21
Strategic Road Transport
Assessment
Transport Planning and Infrastructure
Other HBC, HCC 2017-2020 TBC
1) Define Scope of assessment & commission, consult internally & with Highway Authority, agree final draft 2) Publication of a Mainland Transport Assessment 3) Publication of a Hayling Island Transport Assessment
TBC
• Hampshire Services commissioned to deliver the Mainland Assessment (2017)
• Campbell-Reith & Systra commissioned to deliver Hayling
Island Assessment (2017) • Publication Delayed
2019 See
Table 2.2
UK
0012-H
BC
_22
New A27 Access & Link Road
Transport Planning and Infrastructure
Other HBC, HCC, Highways England
2017-2020 TBC
1) Adopt policy framework which: • Supports assessment of need • Requires assessment of air quality impact of scheme, • Safeguards land required, and co-ordination of strategic local development to avoid prejudicing delivery. 2) Derive conceptual design options 3) Model function and impact of leading design options 4) Seek & obtain funding 5) Deliver preferred scheme
TBC
• Policy Framework included in Local Plan 2036 pre-submission
draft • Two Layout Options Derived • Highway Impact Testing in
Progress
TBC See
Table 2.2
UK
0012-H
BC
_23
District Heat Network
Promoting Low Emission Plant
Emission control
equipment for small and
medium sized stationary
combustion sources /
replacement of combustion
sources
HBC 2016-2020 TBC
1) Undertake Heat Demand Mapping exercise, and publish an Energy Masterplanning report 2) Undertake and publish a Heat Network Feasibility Study 3) Identify funding opportunities, and secure funding for delivery 4) Adopt policy framework which supports delivery of Urban Heat Networks.
TBC
• Demand Mapping Published Autumn 2016
• Heat Network Feasibility Study Completed Spring 2017, Published Summer 2018.
• Policy Framework included in Local Plan 2036 pre-submission
draft
TBC See
Table 2.2

LAQM Annual Status Report 2018 44
Table 2.1 Continued…
UK
0012
-HB
C_24
Invest in Public Rapid Charging
Network
Promoting Low Emission Transport
Procuring alternative Refuelling
infrastructure to promote Low
Emission Vehicles, EV
recharging, Gas fuel recharging
HBC, ChargePoint
2017 2018-19
1) Install four 48kw universal rapid chargers at Public Owned Car Park locations 2) Monitor & report on initial usage 3) Adopt policy framework which adequately provides for Plug-in EV charging points at all new residential development
TBC
• Two 50KW+ Chargers Installed (2018), Third now operational in Waterlooville (2019) following
initial delays • A capital bid has been
approved in principal for Two further charge bays at the Civic
Campus. • Policy Framework included in
Local Plan 2036 pre-submission draft
2019 See
Table 2.2
UK
0012
-HB
C_25
Prioritise LEV & ULEV in public
sector procurement
Promoting Low Emission Transport
Company Vehicle
Procurement -Prioritising
uptake of low emission vehicles
HBC 2018 2018-2020
1) Replacement of minimum 3 Diesel Fuelled LDV service vehicles by summer 2019 2) Collection of key cost & performance metrics 3) Derive & Adopt corporate procurement policy / criteria for fleet replacements 4) Install one intermediate-duty (22KW) fleet charging facility at all public service premises serving as an EV fleet vehicle 'home base'.
TBC
• First Vehicle in service Spring 2019
• A capital bid approved in principal for one additional
electric vehicle - not on order at time of writing
• No Funding allocated for planned third vehicle
• Performance metrics not available, undermining business
case for progressing procurement
2020 See
Table 2.2
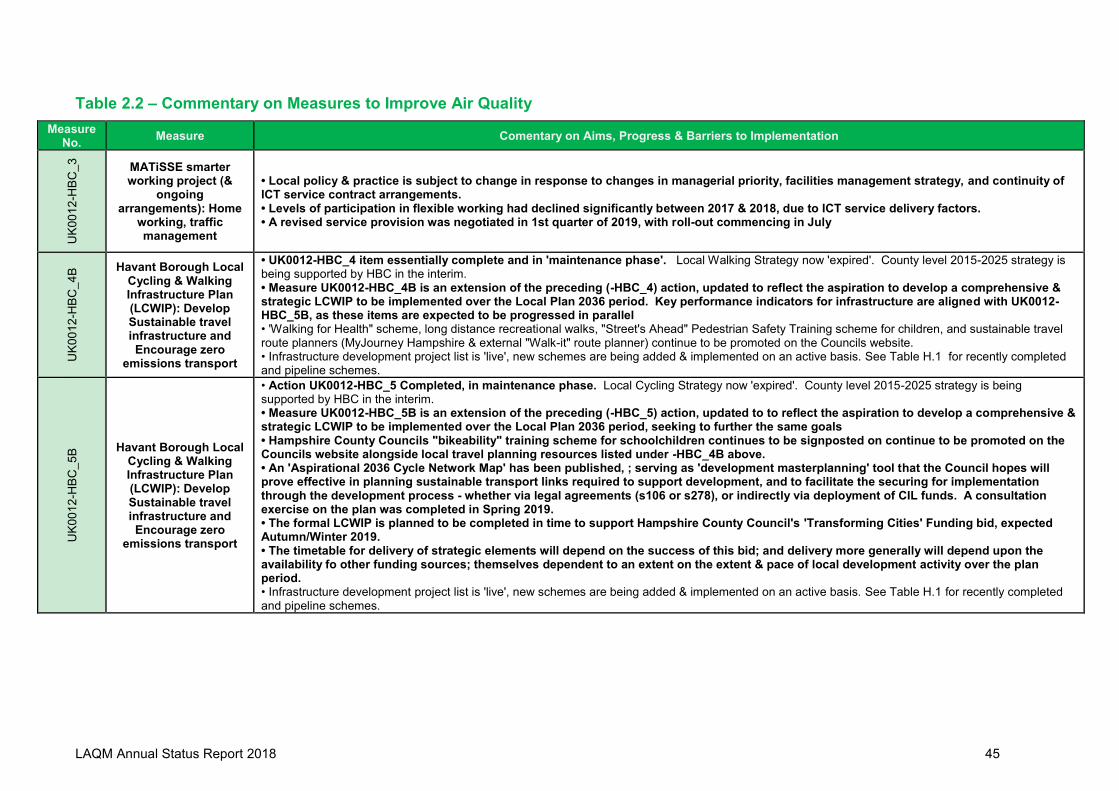
LAQM Annual Status Report 2018 45
Table 2.2 – Commentary on Measures to Improve Air Quality
Measure No.
Measure Comentary on Aims, Progress & Barriers to Implementation
UK
00
12
-HB
C_
3
MATiSSE smarter working project (&
ongoing arrangements): Home
working, traffic management
• Local policy & practice is subject to change in response to changes in managerial priority, facilities management strategy, and continuity of ICT service contract arrangements. • Levels of participation in flexible working had declined significantly between 2017 & 2018, due to ICT service delivery factors. • A revised service provision was negotiated in 1st quarter of 2019, with roll-out commencing in July
UK
00
12
-HB
C_
4B
Havant Borough Local Cycling & Walking Infrastructure Plan (LCWIP): Develop Sustainable travel infrastructure and Encourage zero
emissions transport
• UK0012-HBC_4 item essentially complete and in 'maintenance phase'. Local Walking Strategy now 'expired'. County level 2015-2025 strategy is being supported by HBC in the interim. • Measure UK0012-HBC_4B is an extension of the preceding (-HBC_4) action, updated to reflect the aspiration to develop a comprehensive & strategic LCWIP to be implemented over the Local Plan 2036 period. Key performance indicators for infrastructure are aligned with UK0012-HBC_5B, as these items are expected to be progressed in parallel • 'Walking for Health" scheme, long distance recreational walks, "Street's Ahead" Pedestrian Safety Training scheme for children, and sustainable travel route planners (MyJourney Hampshire & external "Walk-it" route planner) continue to be promoted on the Councils website. • Infrastructure development project list is 'live', new schemes are being added & implemented on an active basis. See Table H.1 for recently completed and pipeline schemes.
UK
00
12
-HB
C_
5B
Havant Borough Local Cycling & Walking Infrastructure Plan (LCWIP): Develop Sustainable travel infrastructure and Encourage zero
emissions transport
• Action UK0012-HBC_5 Completed, in maintenance phase. Local Cycling Strategy now 'expired'. County level 2015-2025 strategy is being supported by HBC in the interim. • Measure UK0012-HBC_5B is an extension of the preceding (-HBC_5) action, updated to to reflect the aspiration to develop a comprehensive & strategic LCWIP to be implemented over the Local Plan 2036 period, seeking to further the same goals • Hampshire County Councils "bikeability" training scheme for schoolchildren continues to be signposted on continue to be promoted on the Councils website alongside local travel planning resources listed under -HBC_4B above. • An 'Aspirational 2036 Cycle Network Map' has been published, ; serving as 'development masterplanning' tool that the Council hopes will prove effective in planning sustainable transport links required to support development, and to facilitate the securing for implementation through the development process - whether via legal agreements (s106 or s278), or indirectly via deployment of CIL funds. A consultation exercise on the plan was completed in Spring 2019. • The formal LCWIP is planned to be completed in time to support Hampshire County Council's 'Transforming Cities' Funding bid, expected Autumn/Winter 2019. • The timetable for delivery of strategic elements will depend on the success of this bid; and delivery more generally will depend upon the availability fo other funding sources; themselves dependent to an extent on the extent & pace of local development activity over the plan period. • Infrastructure development project list is 'live', new schemes are being added & implemented on an active basis. See Table H.1 for recently completed and pipeline schemes.
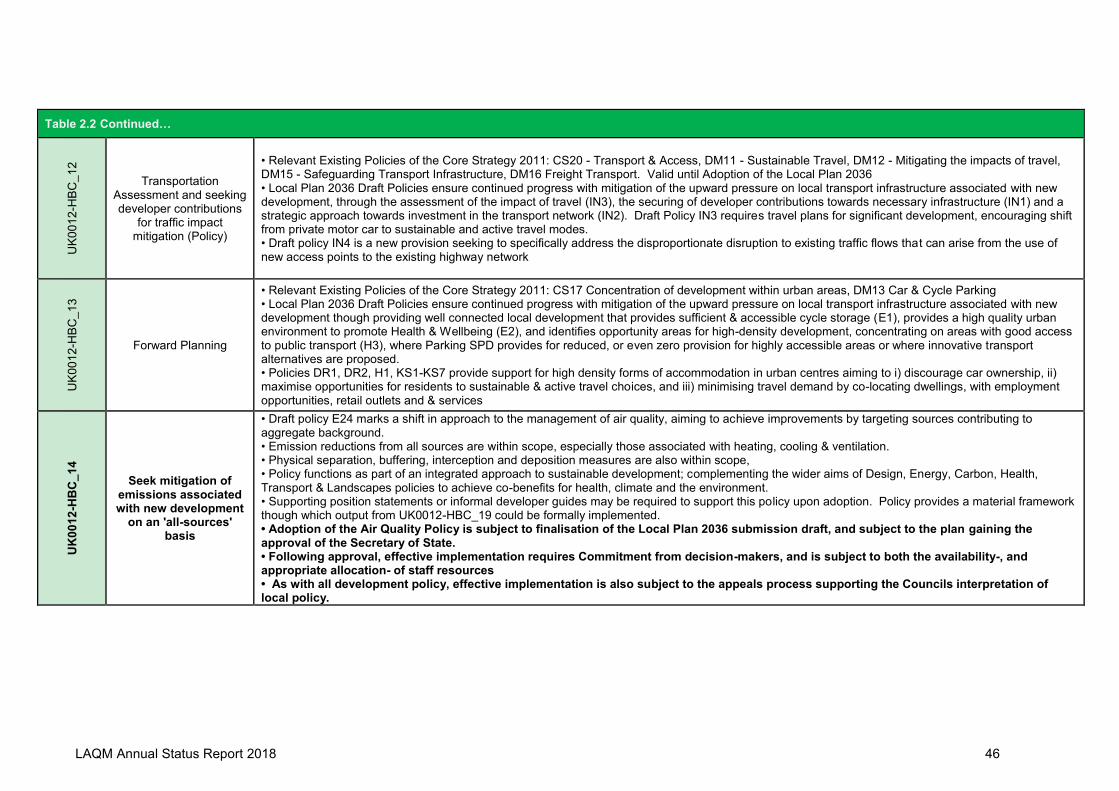
LAQM Annual Status Report 2018 46
Table 2.2 Continued…
UK
00
12
-HB
C_
12
Transportation Assessment and seeking developer contributions
for traffic impact mitigation (Policy)
• Relevant Existing Policies of the Core Strategy 2011: CS20 - Transport & Access, DM11 - Sustainable Travel, DM12 - Mitigating the impacts of travel, DM15 - Safeguarding Transport Infrastructure, DM16 Freight Transport. Valid until Adoption of the Local Plan 2036 • Local Plan 2036 Draft Policies ensure continued progress with mitigation of the upward pressure on local transport infrastructure associated with new development, through the assessment of the impact of travel (IN3), the securing of developer contributions towards necessary infrastructure (IN1) and a strategic approach towards investment in the transport network (IN2). Draft Policy IN3 requires travel plans for significant development, encouraging shift from private motor car to sustainable and active travel modes. • Draft policy IN4 is a new provision seeking to specifically address the disproportionate disruption to existing traffic flows that can arise from the use of new access points to the existing highway network
UK
00
12
-HB
C_
13
Forward Planning
• Relevant Existing Policies of the Core Strategy 2011: CS17 Concentration of development within urban areas, DM13 Car & Cycle Parking • Local Plan 2036 Draft Policies ensure continued progress with mitigation of the upward pressure on local transport infrastructure associated with new development though providing well connected local development that provides sufficient & accessible cycle storage (E1), provides a high quality urban environment to promote Health & Wellbeing (E2), and identifies opportunity areas for high-density development, concentrating on areas with good access to public transport (H3), where Parking SPD provides for reduced, or even zero provision for highly accessible areas or where innovative transport alternatives are proposed. • Policies DR1, DR2, H1, KS1-KS7 provide support for high density forms of accommodation in urban centres aiming to i) discourage car ownership, ii) maximise opportunities for residents to sustainable & active travel choices, and iii) minimising travel demand by co-locating dwellings, with employment opportunities, retail outlets and & services
UK
00
12
-HB
C_1
4
Seek mitigation of emissions associated with new development
on an 'all-sources' basis
• Draft policy E24 marks a shift in approach to the management of air quality, aiming to achieve improvements by targeting sources contributing to aggregate background. • Emission reductions from all sources are within scope, especially those associated with heating, cooling & ventilation. • Physical separation, buffering, interception and deposition measures are also within scope, • Policy functions as part of an integrated approach to sustainable development; complementing the wider aims of Design, Energy, Carbon, Health, Transport & Landscapes policies to achieve co-benefits for health, climate and the environment. • Supporting position statements or informal developer guides may be required to support this policy upon adoption. Policy provides a material framework though which output from UK0012-HBC_19 could be formally implemented. • Adoption of the Air Quality Policy is subject to finalisation of the Local Plan 2036 submission draft, and subject to the plan gaining the approval of the Secretary of State. • Following approval, effective implementation requires Commitment from decision-makers, and is subject to both the availability-, and appropriate allocation- of staff resources • As with all development policy, effective implementation is also subject to the appeals process supporting the Councils interpretation of local policy.

LAQM Annual Status Report 2018 47
Table 2.2 Continued…
UK
00
12
-HB
C_
15
Supporting Local Shopping
• Havant Borough Council continues to seek to exercise Planning Policy to avoid restrictive private parking policies which discourage the making of linked and combined trips. • Neither the 2016 Local Parking SPD, nor the Local Plan 2036 Draft Policies place any specific requirements on developments to adopt permissive parking enforcement policies. • Following adoption (of the Local Plan), the Council will be reliant upon negotiating voluntary solutions, NPPF provisions 102 e) & 106, and Local Policy E2 b) under the banner of 'good urban design'. • Policies KP1 & KP2 continue to embody the principles of existing policy CS16 (High Quality Design) and CS17 (Concentration and Distribution of Development within the Urban Areas), seeking to accommodate housing demand within town centre locations to ensure that they thrive. Co-locating residents with employment & retail opportunities, with convenient sustainable transport, and with the businesses and services that they need, is expected to reduce travel demand, reduce car ownership rates, and increase local economic activity.
UK
00
12
-HB
C_
16
Parking Service Policy
• Parking service is active in securing funds for on-road parking restrictions through planning where risks of 'overspill parking' exist, and using those funds to actively manage local traffic orders • An updated version of the 2016 parking SPD was published in September 2019. The standards respond to the experience of schemes approved under the preceding guidance - with allocation responding more robustly to the accessibility of the development, allowing increased levels of residential parking in inaccessible areas to avoid street parking conflicting with highway traffic &/or pedestrians • Anecdotally, implementation is successful, with <SPD allocations supported for accessible sites, with few examples of problems arising.
UK
00
12
-HB
C_
17
Development of SE Hampshire Integrated Rapid Transit Network
• SEHRT is expected to support economic growth within the region, and improve the sustainable travel opportunities for the 18,000 workers who commute daily between the HBC & PCC areas, and help reduce the "single occupancy motor vehicle" mode share from it's current level of 73%. • The project also aims to support delivery of the objectively assessed level of housing need within the Havant Area • Supporting studies to accurately quantify baseline conditions have been completed • Strategic modelling of SEHRT has been completed, forecasting an additional 10500 trips, and a +12% increase in peak trip generation by 2036; concluding that SEHRT development would facilitate this more intensive trip generation, which cannot be sustainably accommodated on the existing Strategic Road Network. • Proposals amounting to an investment of >£90m have been proactively developed to an advanced stage (specific scheme design currently has 'confidential' status), with a ratio of benefit:cost expected to exceed 2:1. • A Funding bid was made to the DfT Transforming Cities Fund in June 2018 for further development and support for implementation of the SEHRT project proposals; Securing it's full ask of £4million from the 'quick win' fund. • The Havant & Waterlooville areas will benefit from a share of a £2.6million investment in Junction Improvements and the implementation of Real-Time service information for customers • Details can be found at the following link: https://www.hants.gov.uk/transport/strategies/fundingbids

LAQM Annual Status Report 2018 48
Table 2.2 Continued…
UK
00
12
-HB
C_
18
PUSH Area Air Quality Assessment
The output from the sub-regional air strategic Air Quality assessment-; • Has informed the development of all Local Plan polices where Air Quality is a material consideration; placing air quality as a central component of landuse, transport & infrastructure planning, alongside policy relating to design, landscapes, sustainability, and environmental quality (health and ecology) • Has informed the approach to a draft primary planning policy to address air quality issues in the Havant Area • Will help guide strategic infrastructure investment; and • Has assisted in identifying sensitive ecology already affected by poor air quality where action may be needed to reduce emissions from existing sources (this is subject to further detailed assessment work which builds upon the conclusions of the Air Quality Assessment) • Final technical comments were collated Summer 2018, following which some minor revisions were made. • A Final version was published September 2018, available from the Havant Borough Council Web Pages [See references] • Some technical errors have been noted by Friends of the Earth, relating to the use of Verification (air quality monitoring) data for the Havant area. The impact of the error on conclusions is negligible, and Ricardo are producing an erratum note for the final draft; expected Late-Autumn 2019.
UK
00
12
-HB
C_
19
PUSH Area Low Emission Strategy
It is expected that a sub-regional strategy could serve to; • Support the sustainable delivery of the objectively assessed level of housing need within the Whole-Sub-Region, including the Havant Area • Ensure continued compliance with air quality objectives in the long term to minimise the health impacts of NOx/NO2, PM10 & PM2.5 in particular. • To reduce air pollution impacts of airborne NOx, & Ammonia, and Nutrient Nitrogen deposition upon protected habitats, and; • Support transport planning initiatives which deliver co-benefits including reductions in congestion and pollution • Consideration of a Low Emissions Strategy was a direct recommendation of the PUSH AQ study (UK0012-HBC_18) • PUSH Partnership is exploring feasibility of a coherent sub-regional strategy ahead of the issue of the final draft of the ED 10415100 PUSH Air Quality Impact Assessment • Southampton City Council is taking a lead on development of Air Quality SPG in connection with it's Air Quality Action Plan, and it's additional duties under the Air Quality Plan for NO2 in the UK & under the Air Quality Direction 2018, and Havant Borough Council will contribute through the PUSH group.
UK
00
12
-HB
C_
20
Safer Routes to School; School Travel
Planning
Support HCC Schools AQ Campaign through provision of NO2 passive diffusion tubes, and technical advice. • Seven Schools participated in 2017/18 & 2018/19 winter terms (Phases 1 & 2), including Barncroft and St. Peters Primary Schools, and Bosmere, Hart Plan, Trosnant, Mengham & Purbrook Juniors. • Annualised & Corrected results are reported alongside HBC monitoring in this ASR (See Table B.1 for results from current reporting period)
• See Appendix G for HCC monitoring report and schools Air Quality campaign plans for encouraging travel mode shift from private motor car to
sustainable modes of travel • Where schools have not already been achieved a 'mode-shift stars'* (Sustainable School Travel) award, it is a primary goal to achieve at lease a 'bronze' award in the year following the production of the campaign plan. • Where schools already have a mode-shift stars* award, it is hoped that the campaign plan will qualify the school for an upgraded award standard (silver or gold), or that an existing 'gold level' award will be maintained. (* - https://www.modeshiftstars.org/) • Hart Plain Juniors (Bronze) and Mengham Juniors (Silver) have each maintained their current Star's award status, and continue to actively promote sustainable travel to school. • Trosnant Federation has achieved a Silver award in Spring 2019. • Hampshire County Council continue to work proactively with local schools to encourage a meaningful legacy of sustainable travel from all schools participating in the scheme.

LAQM Annual Status Report 2018 49
Table 2.2 Continued…
UK
00
12
-HB
C_
21
Strategic Road Transport Assessment
• Together, these Transport Assessments aim to fully explore the strategic transport constraints and issues facing the Borough, and seek to determine whether there is scope for development proposals to mitigate constraints. • Access to Hayling Island is considered to require special attention, given the single strategic link to the mainland (A3023, Langstone Bridge). Assessment is to include a 'micro-simulation' model & more robust scenario testing. • Publication was anticipated autumn 2017, however there have been considerable delays. The earliest that this document is now expected to be published is autumn/winter 2018. • Havant Borough Council has published it's draft Local Plan 2036 without fully understanding the transport capacity of the Borough, particularly with respect to Hayling Island. • The Pre-Submission draft of the Local Plan 2036 is expected to be fully informed by the borough-wide Transport Assessment and the Hayling Island Highway and Transport Infrastructure Assessment.
UK
00
12
-HB
C_
22
New A27 Access & Link Road
• A new or (substantially improved) access to the A27 at Emsworth is being considered to support of strategic development at Southleigh. Subject to junction design adopted, this has the potential to impact Havant TC congestion substantially. • Modelling is in progress to inform optimal layout selection. Currently 'optimal' is defined in highways terms (and not in air quality impact terms) • The purpose of design & testing work is to inform decision-making only; there are no plans to publish. • Funding for detailed design / delivery will be subject to Highways England bid processes. • Air quality assessments will follow in due course, once the scheme has gained in principal approval. • Draft policy Framework is in place within the pre-submission Local Plan 2036. KS5 provides for assessment of need. H9, H10, H15, C9, IN2 i) provide for the safeguarding of land and the co-ordination of allocated strategic development. KS5 & IN2 provide for delivery. E23 provides for assessment of Air Quality to ensure continued compliance with NAQS objectives.
UK
00
12
-HB
C_
23
District Heat Network
• Demand Mapping identified a number of areas which met the DECC minimum requirements for a Urban Heat Network viability, including the 'Civic Campus', 'New Lane' & 'Brockhampton' Industrial Areas. • Civic Campus is regarded as the most viable location, due to the Public land ownership and the ability of the leisure centre to act as an energy demand 'anchor' for the scheme. • Feasibility Study Concluded that a Heat Network was feasible in principle within the 'Civic Campus', with potential to extend to other areas with favourable viability following establishment of the core of the network. • No specific funding source has been identified to facilitate detailed design or delivery. • Draft Local Plan Policies DR1, KS1 & E12 provide a policy framework which supports delivery of a scheme in the Civic Campus Area, with District Heat core network delivery funding becoming more feasible as a part of wider strategic redevelopment.

LAQM Annual Status Report 2018 50
Table 2.2 Continued…
UK
00
12
-HB
C_
24
Invest in Public Rapid Charging Network
• Rapid Chargers are to be provided on a 'space-lease' basis to a commercial network provider (Geniepoint network) • Rapid Chargers have been installed at South Street Emsworth, and Tidworth Road, Leigh Park. • A lack of sub-station capacity initially delayed commissioning of a dual bay rapid charger at Wellington Way, Waterlooville. This has highlighted some cost issues associated with developing the charging network where redundant network capacity is not available. • Works were completed at Wellington Way in 2019 and the charge points are now available for public use. • Plans for a Fourth 50kw+ charger at Beachlands have been postponed pending completion of a regeneration project masterplanning exercise. This delay has caused the phase 1 installation partner to rule themselves out for this planned facility, and this may prejudice future delivery unless strong demand can be demonstrated. Havant Borough Council remains committed to delivery if a suitable partner can be found. • Draft Local Plan Policy IN3 provides for home EV chargers to be provided at all new residential development (for visitors and private use) • Draft local plan will need to pass consultation and inspection before policy becomes exercisable • Expansion of the public charging network will be subject to the success of the chargers reported here, the availability of suitable locations, and the capacity of the local power network to support the power demand of rapid chargers. • Havant Borough Council ChargePoint usage statistics were requested for inclusion in the 2019 ASR, but were unavailable at the time of writing
UK
00
12
-HB
C_
25
Prioritise LEV & ULEV in public sector
procurement
• Target completion date stages; i) initial / pilot procurement anticipated by 2018/19; ii) collection of key metrics / consideration of lessons learned 2019/2020, iii) development of fleet replacement policy 2020. • Retention of UK0012-HBC_25 on an 'ongoing' basis beyond 2020, will be dependent upon favourable performance metrics demonstrating the capability of available EV's to meet the operational requirements (duty cycle) • Specific targets / criteria are expected to arise from the review of the pilot procurement, but the scope of the policy will depend upon performance metrics returned. • Vehicle Performance metrics were requested for inclusion in the 2019 ASR, but were unavailable at the time of writing. • Anecdotally, the lack of charging facilities local to the Civic Campus is presenting a challenge to the business case for replacement of conventionally fuelled vehicles with ULEV • Capital bid for 'Civic Campus' Charge Points are on an in-principal basis only, for up to 4 bays. Specification unconfirmed, likely to be <50kw to serve Council Fleet, but with an aspiration to make the points publicly available (subject to meeting the operational needs of the Council).

LAQM Annual Status Report 2018 51
2.3 PM2.5 – Local Authority Approach to Reducing Emissions and/or Concentrations
There is clear evidence that PM2.5 has a significant impact on human health, including premature mortality, allergic reactions, and cardiovascular diseases. This has a direct link to the Public Health Outcomes Framework (PHOF) indicator "3.01 Fraction of all-cause adult mortality attributable to anthropogenic particulate air pollution (measured as fine particulate matter, PM2.5)", albeit that this indicator is currently recognised within the framework as being relatively poor at distinguishing the influence of ambient levels of PM2.5 from other lifestyle factors such as occupational exposures, smoking and obesity; all of which contribute to mortality by similar conditions. PM2.5 is an aggregate term representing a broad range of potential pollutants, grouped by their physical size (aerodynamic diameter). Particles of <2.5µm size are sufficiently small as to be capable of being drawn deep into the lungs, to the alveoli, where a proportion is able to cross into the bloodstream via the lung capillaries. The commonality of pollutants falling within this group is the mode of exposure, namely the ability of the solid-phase pollutant to enter the cardiovascular system. The associated health impact is however a function of the chemical compound which the particulate pollutant represents, and the range of chemical compounds which might fall into this category can be quite diverse. Both PM2.5 & PM10 fractions are ‘indicator metrics’ for air pollution and risk of harm. The grouping includes much smaller particles, and in practice represents any particle with a size greater than 0.0 microns (µm) and less than 2.5µm or 10.0µm respectively. Notably, emerging research is beginning to associate the observed health impacts more strongly with the >1µm fraction of this group, and recent articles reporting on the need for an update of the current WHO air quality guidelines57 suggest that ultrafine particles <0.1 µm size (PM0.1), black carbon, or ‘oxidative potential’ may represent more informative public health metrics which better represent the mechanisms through which this group of pollutants (PM2.5, or PM10) is thought to cause harm58. PM2.5 is derived from both natural sources and man-made sources. Natural sources, such as sea-salt (representing as much as 7% of PM2.5) are thought likely to cause negligible harm, whereas organic compounds associated with combustion (e.g. black carbon) are conversely fat-soluble, chemically persistent, and bioactive – accumulating in body tissues and capable of causing both short-term- (e.g. inflammatory immune response) and long-term- harm (e.g. cancer). In this way, the absolute concentration of particulates is less important for health than is the origin.
2.3.1 Regulatory and policy drivers
There is no regulatory standard to the role of Local Authorities in England in taking action to reduce emissions or concentrations of fine particulate (PM2.5) air pollution. The duty to meet the objectives and standards of the Air Quality directive (2008/50/EC) applies at the macro-scale, and rests with the Secretary of State under the Air Quality Standards Regulations (2010).
57 WHO Air quality guidelines for particulate matter, ozone, nitrogen dioxide and sulfur dioxide, Summary of Risk Assessment; Global Update WHO/SDE/PHE/OEH/06.02 (World Health Organisation, 2005) 58 https://airqualitynews.com/2019/10/29/a-revision-to-the-whos-air-quality-guidelines-is-long-overdue/

LAQM Annual Status Report 2018 52
Harm caused by this group of pollutants is nevertheless recognised to be ‘non-threshold’, where any level of exposure represents an incremental contribution towards an overall ‘pollutant burden’ which both cumulatively and in combination with other lifestyle factors leads to poor health outcomes. As a result, any action taken to reduce levels of particulate pollutants will contribute incrementally to overall public health, whether or not resulting in a material reduction at locations of relevant exposure, and notwithstanding that the direct impact would not be readily distinguishable from health data currently collected. Policy Guidance LAQM.PG16 (Chapter 7) recognises the value of securing incremental change, making clear that Local Authorities are expected to work towards reducing emissions and/or concentrations of PM2.5 in their local area, as practicable59. The National Planning Policy Framework (NPPF)60 reinforces this guidance by requiring Local Authorities actively manage growth patterns and ensure that local policy serves to sustain compliance with relevant limit values and contributes towards securing improvements in air quality. Directive 2008/50/EC defines ‘practicable’ as not entailing ‘excessive cost’. The directive does not define where relevant costs may fall, and it could reasonably be interpreted to extend to ‘the community served’ (i.e. the local economy). Preventing new development or economic activity from contributing to increasing levels of particulate pollution in an in an economically neutral way represents a significant challenge. Seeking to achieve net emissions reductions can be even more challenging, and the cost-per-unit reduction is subject to a ‘law of diminishing returns’. There is an inherent conflict between economic and development aspirations (in some cases driven by National requirements, such as the requirement to meet the objectively assessed housing need, OAN), the economic cost associated with achieving air quality improvements, and the concept of ‘proportionality’ (as it relates to ‘excessive’ in the consideration of ‘excessive cost’). Nevertheless, the legislative programme central government promises air quality reforms that include ‘binding targets’ under the Environment Bill 2019/2061 to underpin key measures of the 25 Year Plan62 & Clean Air Strategy63. Policy papers indicate that some form of binding target for PM2.5 based upon WHO recommendations will be introduced, alongside an expanded general principal of ‘environmental net gain’ which is to apply to air quality. It is not yet clear how the aspirational policy statements will translate into practical policy, or how the impact on economic aspirations will be managed. It is recognised that there are economic benefits to the improvements in public health that would result from such action, but as is outlined in the section above it is difficult to quantitatively demonstrate the benefits. Air quality impacts are associated with socio-economic factors, and as a result the Council must be mindful of reciprocal public health harms associated with unemployment, low wages, or poor-quality employment opportunities that might result from taking a more precautionary approach to the management of air quality which disproportionately impacts local business and levels of development &/or employment, relative to the achieved benefits. The current regulatory environment therefore requires a balance be struck between the costs and benefits of taking steps to reduce emissions, with the overall goal to improve public health outcomes. This applies at the local scale as it does at the national level.
59 LAQM PG(16) available at https://laqm.defra.gov.uk/documents/LAQM-PG16-April-16-v1.pdf 60 Available from https://www.gov.uk/housing-local-and-community/planning-system 61 Environment Bill: Summer Policy Statement, DEFRA, Jul 2019; https://www.gov.uk/government/publications/draft-environment-principles-and-governance-bill-2018/environment-bill-summer-policy-statement-july-2019#improving-the-air-we-breathe 62 A Green Future: Our 25 year Plan to Improve the Environment, HM Government, Jan 2018; https://www.gov.uk/government/publications/25-year-environment-plan 63 Clean Air Strategy 2019, DEFRA, Jan 2019; https://www.gov.uk/government/publications/clean-air-strategy-2019

LAQM Annual Status Report 2018 53
2.3.2 Sources
According to a report published by the Air Quality Expert Group (AQEG)64, between 50 and 55% of UK PM2.5 originates from within the UK, with the remainder being a result of transboundary air pollution and natural sources of particulate matter, such as sea salt & green -leaf volatiles. Natural sources (sea salt in particular-) may be particularly important within Havant Borough, due to the length of shoreline and the proximity of urban areas to coastal waters. Between 5 & 7% of atmospheric PM2.5 is thought to derive from this source on average, but this proportion is likely to be greater at some locations, especially in rural areas where local anthropogenic (direct) emissions are relatively low, and natural sources likely to be high, such as Hayling Island. Recent studies have shown that as much as 40% of direct local emissions in the UK may derive from domestic solid fuel combustion, with industrial and transport contributions comprising 17% & 13% respectively, according to figures recognised by the UK government65. These estimates are concerned with primary emissions only, and are heavily influenced by research focussed upon affluent Metropolitan Areas66. There is likely to be wide variation in contributions nationally, and the balance of proportional contributions would likely differ significantly if secondary atmospheric production of PM2.5 were also considered. European transboundary emissions contribute as much as 20-30% towards the total atmospheric PM2.5 within the UK. Of this, Sulphate and Nitrate aerosol together make up around 75% of imported PM2.5. The greatest import of PM2.5 from Mainland Europe has been shown to occur in Southern England, and due to it’s location, levels in Havant are expected to be significantly influenced by transboundary anthropogenic emissions. Shipping emissions also contribute significantly to concentrations in Southern England, estimated at around 5-10% of the total PM2.5 within the region. Being located Northeast (down-prevailing-wind) of both Portsmouth Docks and the busy Isle of Wight shipping routes, PM2.5 within the Havant area is likely to include a significant proportional contribution from shipping. This source is not unlikely to be a significant contributor towards the estimated all-cause mortality attributable to Particulate Air Pollution (PHOF 3.01) being consistently higher for the Portsmouth area when compared either the Hampshire or National averages (England 5.1%, Hampshire 5.6%, Portsmouth 6.3% mortality)67. The Energy from waste (municipal waste incineration) facility at Portsmouth is also likely to contribute to local emissions peaks in the area – the likely level of contribution is unclear as particulate emissions from the facility are reported as PM10 (10µm diameter fine dust, comprising total particulates in the range 0-10µm in size, i.e. including the PM2.5 fraction.).
2.3.3 Local Ambient Concentrations
The National Average Exposure Indicator (AEI) for PM2.5 was 10 µg/m3 in 2016, and the Portsmouth Urban Agglomeration (UK0012, within which falls parts of Havant, Widley & Bedhampton), was assessed to comply with both the Stage 1 (25 µg/m3, from 2015) and Stage 2 (20 µg/m3, by 2020) limit values68. These figures also show that the UK has already met it’s 2020 National Exposure Reduction Target (NERT) of 15% (from a baseline of 13 µg/m3).
64 ‘Mitigation of United Kingdom PM2.5 Concentrations’, Air Quality Expert Group Report Ref: PB14161, 2013. Available here: https://uk-air.defra.gov.uk/assets/documents/reports/cat11/1508060903_DEF-PB14161_Mitigation_of_UK_PM25.pdf 65 http://naei.beis.gov.uk/data/ 66 http://ec.europa.eu/environment/integration/research/newsalert/pdf/373na2_en.pdf. Fuller, G. W., Tremper, A. H., Baker, T. D. et al. (2014) “Contribution of wood burning to PM10 in London”. Atmospheric Environment. 87: 87–94. DOI:10.1016/j.atmosen v.2013.12.037 67 Public Health Outcomes Framework Data included in 1st May 2018 Publication, PHE Publications, available from: http://www.phoutcomes.info/public-health-outcomes-framework#gid/1000043 68 Air Pollution in the UK 2018, available from https://uk-air.defra.gov.uk

LAQM Annual Status Report 2018 54
It should be noted that the target and reduction values apply to a specific assessment protocol which considers the ‘general ambient background’. Local concentrations at Urban, Industrial and Roadside locations may be substantially higher, though this should not be taken to necessarily represent a significant health concern - the limit values have been derived on the basis of underlying exposures and were not designed to apply to locally elevated concentrations over short periods of exposure. Recently modelled background concentrations of PM2.5 within Havant Borough range between the minimum values returned across the South of Hayling Island of 8.15 - 8.72 µg/m3, to the maximum values of 11.6 - 12.05 µg/m3 clustered around the Leigh Park & West Leigh residential areas of Havant. It is unclear whether the association with these residential locations is associated with expected rates of domestic solid fuel burning, or is a function of prevailing wind conditions and distance from the national strategic road network. The industrial area of New Lane remains one of the areas of highest background PM2.5, with 11.99 µg/m3 predicted. As for the National AEI, these values refer to ‘local annual average background contribution to total local ambient’ averaged over 1sq.km. Concentrations may vary widely on an annual average basis at specific locations within this area, at both shorter timescales and at different heights within the urban environment at any given location. Measurements taken in Portsmouth (at a height of 3.5m) in an Urban Background location are illustrative; ranging between 0.0 & 71.1 µg/m3, 1.72 & 38.54 µg/m3, and 7.93 & 16.05 µg/m3 on an hourly, daily, and monthly basis respectively, against a calculated annual average concentration of 12.38 µg/m3 in 2018. Average ratios of ‘non-volatile’ to ‘volatile’ within the total PM2.5 appear to be around 2:1. No data is available from the Portsmouth Roadside AURN site for PM2.5 for comparison with background levels, but is expected that concentrations adjacent to sources and within the ‘breathing zone’ (below 1.8m) are likely to vary more widely and may return volatile composition ratios which are more biased toward particulates composed of volatile compounds (associated with proximity to direct emissions from combustion sources). Based upon the area characteristics (density of industry & dwellings, and volumes of traffic carried on the local road network), the “worst case” particulate PM2.5 levels in the Havant area are considered likely to broadly correspond to the urban background levels measured at the Portsmouth AURN site.
2.3.4 PM2.5 Air Quality Standards – EU, Legislative, and WHO
The binding standards originate from the Air Quality Directive 2008/50/EC. These are transposed into UK legislation as Schedule 3 to the Air Quality Standards Regulations 2010, setting a limit of 25µg/m3 to apply to annual average ambient concentrations, to be achieved by the 1st of January 2015. Schedule 7 sets out the National Exposure reduction targets for this pollutant vary between 0% & 20% as a sliding scale which responds to the calculated AEI for the base year of 2010. An absolute target of 18µg/m3 is set for areas where the calculated AEI exceeds 22µg/m3 for the base year. 2020 reduction targets have already been met Nationally, and within the Portsmouth Agglomeration area. With reference to monitoring data at AURN sites within the Portsmouth Area, it is considered probable that the emissions reduction obligation has also been met within the Havant Area. It is evident from the figures quoted for Portsmouth in section 2.3.3 that the way in which comparisons are made to the reference standards may be more significant determinants of compliance (or non-compliance) than is the standard itself. For example, which analyte(s) or indicator-, what measurement locations-, or which averaging areas- are considered suitable

LAQM Annual Status Report 2018 55
for direct comparison to standards will have significant implications for the extent of intervention required to meet the standard, and the approach to actions to reduce emissions. It is notable that measurements at ‘Portsmouth Centre’ (UK00421) were compliant with the WHO suggested daily limit (25µg/m3 as 24-hour average) for 92.5% of days for which data is available in 2018, whilst the annual limit (10 µg./m3) is exceeded by more than +20%. PM2.5 has been a high-profile media topic over recent years, with significant focus on comparison of UK PM2.5 data with the WHO recommendation for a 10 µg/m3 annual mean- and 25 µg/m3 daily- limit value; and whether these standards should be locally adopted. As is noted in section 2.3 above, the WHO recommendation dates from a 2005 publication, and there has been recent calls for the recommendations to be reviewed in light of developments in scientific knowledge in the intervening 15 year period. The 2005 WHO standards were calculated using a different set of considerations, assumptions and aims than did the formulation of the binding EU standards (which accounted for the WHO recommendations). It does not necessarily follow that measured levels which exceed the WHO standard should be taken to justify directed action to reduce concentrations. However, the publication of the Clean Air Strategy 2019 earlier this year brought the issue of fine particulates (PM2.5) to the fore and out of the shadow of compliance with the annual mean EU limit value for nitrogen dioxide. The 2019 Strategy pledges to put measures in place to progressively cut PM2.5 concentrations across the UK (beyond the current NERT), and to halve the number of people living in locations above the WHO guideline level of 10µg/m3 by 2025. A subsequent pronouncement by the Environment Secretary that the government’s Environment Bill would include a legally binding commitment to meet the WHO guideline values for PM2.5 further raised expectations of robust reform. It is not the role of the Local Authority to decide on the technical merits of any particular air pollution benchmark – the calculation of which must necessarily balance the health benefits against what is both technically feasible and economically desirable, accounting the factors described at 2.3.1 (above). For this reason, and in the context of both the developing policy environment & anticipated legislative programme; the question of whether to adopt-, and if so, how to apply- the WHO limit is considered to be outside the scope of Local Authority Duties. It is considered that a reasonable interim approach is to instead use the indicators of the regulatory ‘direction of travel’ emerging from central government to bolster the case for making general improvements in local air quality though broad measures (e.g. those with mitigate travel demand, etc.), and to await a national response to the growing pressure to take bolder action on particulate emissions.
2.3.5 Identifying Opportunities for Supporting Continued Compliance with PM2.5 Emissions
The AQEG report referenced at 2.3.2 identified a non-linear relationship between PM2.5 precursor chemicals and PM2.5 concentrations down-wind of source areas. This suggests that the reduction in PM2.5 mass which could be achieved by seeking to reduce emissions of precursor pollutants is relatively limited. Conversely, reducing primary combustion emissions at urban scales has been shown to result in concentration reductions broadly proportional to the primary combustion component

LAQM Annual Status Report 2018 56
of total PM2.5 (as might be expected). A similar proportional relationship can be inferred for other direct emission sources. Ammonia has also been identified as having a reasonably strong proportional result relative to the other precursor pollutants, and it is concluded that ammonia reduction strategies may also have some value in addressing elevated ambient PM2.5 concentrations. These conclusions suggest that measures aiming to reduce urban exposure to PM2.5 should primarily focus on the reduction of primary emissions derived from transportation and combustion, but that measures to reduce agricultural & municipal emissions of ammonia could helpfully support efforts to reduce urban PM2.5. Transport emissions include a variety of distinct sources;
➢ Combustion of conventional fuel (petrol and diesel),
➢ Releases of unconsumed ammonia & ammonium sulphates from diesel Selective Catalytic Reduction (SCR), and
➢ Direct particulate emissions from tyre & brake pad wear.
In the case of the latter, it is noted that the regenerative braking used on electric & hybrid vehicles, the additional vehicle mass associated with plug-in electric vehicles in particular, can produce greater concentrations of non-combustion related particulates, as a result of increased levels of tyre wear. In this way, expected changes in the vehicle fleet composition on the road network is not likely to yield equivalent reductions in particulates (PM10 & PM2.5) as is expected in Nitrogen Dioxide.
Other combustion-related sources of PM2.5 in the urban environment arise from industrial and commercial landuses (including cooking processes), and domestic solid fuel burning. Use of oil as a domestic fuel does represent a source, but this is more common at isolated properties rural settings where fewer local sources will be present. The Borough is not subject to particularly high levels of domestic solid fuel or oil burning, and residential property has good levels of access to mains gas. The Council also recognises the relative difficulty in exerting local controls on emissions from road legal vehicles, or from commercial & industrial sources not subject to regulation under the Environmental Permitting Regulations69. Policy Guidance LAQM.PG(16) makes clear that policy measures should focus on the negative health impacts associated with exposure to PM2.5, and not simply on emissions reduction. Given this, and the factors above, the most successful measures are likely to be those which deliver co-benefits of emissions reductions, quality of place, environmental sustainability, and which increase rates of physical activity of all types - for example; ➢ Policy which seeks to promote personal health and to reduce emissions by facilitating
‘mode shift’ from a polluting means of travel (e.g. single occupancy car journeys) to a zero-emission active travel mode such as walking or cycling. Active travel can be very effective in improving health outcomes, and can be supported by ensuring the choice to travel by active means is as safe and convenient as possible. Travel to school is particularly important both because infants and children are more sensitive to pollution exposures, and because of the opportunity to encourage healthy lifestyle & attitudes at this formative stage which will be carried into adulthood.
➢ Policy which seeks to limit the number of hot food takeaways in urban centres and close to schools. This would reduce a direct urban source of PM2.5 (& PM10), and would
69 The Environmental Permitting (England & Wales) Regulations 2016, SI. 1154

LAQM Annual Status Report 2018 57
support public health efforts to tackle lifestyle factors which serve to exacerbates harm arising from exposure to air pollution, leading to poor health outcomes.
➢ Policy which supports a three-dimensional green landscape in urban areas which serves to intercept pollutants from the air, and to either treat these by adsorption, or to allow pollutants to be washed away with rainfall. Well-designed, such features can provide co-benefits for ecology, flooding, fitness & wellbeing, in addition to providing an air pollution reduction service.
➢ Measures to make the choice to switch to an EV or LEV as easy & convenient as possible – developing the local charging network or facilitating electricity infrastructure which will support the adoption of this burgeoning technology.
2.3.6 The Local Approach to Reducing PM2.5 Emissions
Havant Borough Council has not set any specific proportional reduction target for PM2.5. It is recognised that the Stage 2 national reduction target has already been met in the area, and that it would be difficult to justify specific targeted measures to reduce already compliant concentrations of this pollutant. It is considered that the most proportionate way to meet the policy obligation to work toward reductions in PM2.5 emissions is to seek to achieve reductions as an ancillary benefit to actions which are justified by other environmental and strategic policy objectives. Planning Policy and strategic regeneration can play an important role in achieving the kind of synergistic benefits described in the sections above. Air quality forms an integral component of the general concept of ‘sustainable development’ which is enshrined within the National Planning Policy Framework alongside carbon reduction, mitigation of- and adaption to- climate change, convenient access to healthy & sustainable forms of transport, provision of green infrastructure and the creation of quality landscapes which support local ecology and promote a healthy water environment. Section 2.5.1 outlines the local approach to strategic planning policy in order to achieve these aims. In addition, Havant Borough Council is also actively considering a change to it’s enforcement policy which will formalise the procedure for exercising powers conferred upon Local Authorities under the Anti-social Behaviour, Crime & Policing Act 2014. This may be used to more effectively control acute problems with smoke which fall outside existing legislative provisions (e.g. the Control of Pollution Act 1974, Environmental Protection Act 1990, Clean Air Act 1993, or Environment Act 1995), and could contribute to local reductions in emissions of Particulate Matter through tacking poor practice in domestic solid fuel use.
2.4 The Charter for Cleaner Air
In partnership with Greenpeace UK and Friends of the Earth, Oxford City Council has launched a charter for cleaner air, calling upon central Government to place the health of communities first, and to equip local authorities with the necessary tools and resources to meet the challenge of meeting local air quality objectives. The charter invites other local authorities to sign up in support, and in 2018, Southampton City Council was the first authority to formally announce support for the charter, with Nottingham and Cambridge following suit in December 2018 & February 2019 respectively. Havant Borough Council has not to date formally considered adoption of the charter. The sections below provide a brief consideration of the ten key actions that form the substance of the charter. This is presented with a view to providing some local context, to inform any future

LAQM Annual Status Report 2018 58
debate on adoption of the charter by Havant Borough Council, or any other commitment to local actions & initiatives which support elements of the charter.
2.4.1 Action 1) ‘Remove the most polluting vehicles from most polluted parts of towns and cities’
It is acknowledged that road transport is a major source of harmful levels of air pollution. National leadership in the development of Clean Air and Zero Emission Zones across the UK and in support for private individuals & businesses to move to cleaner forms of transport could be instrumental in solving acute problems in densely populated metropolitan areas. Clean Air or Zero-emission zones are however unlikely to be necessary in less densely populated areas, or necessarily represent an appropriate or proportionate solution for managing a highly localised air quality problem. This concept might most appropriately be adopted within Havant Borough in the form of actions and initiatives aimed at reducing travel demand, and at making active & sustainable travel choices easy & convenient. When coupled with policies which allow low-to-zero parking allocations at highly accessible locations (or where innovative transport-access schemes are provided), high density residential development can also contribute to discouraging vehicle ownership, and to supporting public transport by ensuring local customer demand.
2.4.2 Action 2) ‘Provide greater investment in public transport, walking and cycling infrastructure’
Fewer, and cleaner vehicles on the local road network will not only help reduce air pollution, but also help to tackle congestion and make our towns and cities healthier, safer and better places to live and work. This concept holds true at all urban scales, due to the strong links to ‘quality of place’ and to the public health benefits of engaging in active modes of travel. A high-quality public realm will help to make walking and cycling safer and more convenient, making sustainable travel an easier and genuinely viable choice for local residents’. Use of the local pedestrian footway & cycle path network needs to be supported by ‘permeable’ developments to facilitate efficient journeys, and by convenient, safe & secure cycle parking (especially at public transport hubs). Investment should focus should upon frequent journeys – particularly those to schools & colleges, and to common commuter destinations.
2.4.3 Action 3) ‘End the sale of all new petrol and diesel cars and vans earlier than 2040’
The need to make alternatively fuelled vehicles more affordable & accessible is acknowledged. It is less clear that there needs to be an imposed ban on conventionally powered vehicles (petrol & diesel internal combustion / compression ignition engines). The effective implementation of aim 1) would serve to address the urban air quality problem, and with respect to elsewhere, it would only be necessary to shift the proportion of conventionally fuelled petrol & diesel vehicles on the local road network by a few percentage points to make a sustained and material improvement to local air quality, and to sustain compliance with the National objectives and European limit values. It must be acknowledged that alternative fuels are relatively unproven in under ‘real-world’ conditions across the range of consumer and commercial duty cycles that may be required, and electric options are similarly unproven under mass market charging demand. There are several consumer barriers to ‘mass market’ adoption of electric vehicles which need to be solved, and the use of electric vehicles needs to be supported by clean energy and

LAQM Annual Status Report 2018 59
an appropriately robust power distribution network for it to deliver real (national aggregate) emissions reductions. Power network capacity forecasts are presently unfavourable. Future availability is also in question following the abandonment of Nuclear generation plans at Moorside, and the recent stalling of the Anglesey Nuclear Power Project, both arising from funding problems which are inherent with this type of infrastructure. Any shortfall of baseline network generation capacity could result in increased use of local ‘short term operating reserve’ (STOR) generators. These are typically network-embedded plant (local to the demand) which generate power from fossil fuel (natural gas or diesel), and so contribute to both national (net, aggregate-) and local/urban emissions. These plant are comparatively cheap to bring online, albeit that the generated power is expensive; and so could prove to be a popular option to plug short term supply problems such as those that could arise by the electric vehicle market outpacing the co-development of power infrastructure. The Havant area currently has 40MW of STOR capacity, 50% of which is diesel fuelled. There are also several additional environmental concerns with a market-wide adoption of alternative vehicles, for example; ➢ Additional weight increases acceleration energy requirement*; A Tesla Model S is
around 40% heavier than an equivalently sized petrol vehicle (e.g. VW Passat), increasing average per-km energy consumption by around +29% before regenerative braking is accounted for. Examples of vehicles currently offering both pure internal combustion and hybrid versions show that hybrid versions may typically be +15% heavier, corresponding to around +13% energy consumption. (*additional ‘per-additional-kg’ energy is also required to overcome rolling & wind resistance, but this is less significant). It is also notable that the ‘performance’ & ‘premium’ vehicle market is being targeted, taking advantage of the high torque properties of electric vehicle propulsion. This could be argued to encourage poor driving technique which may have a greater impact in an electric vehicle than a vehicle powered by an internal combustion engine, due to increased acceleration energy demands (additional weight), and through loss of regenerative braking gains (when using brakes to slow the vehicle rapidly).
➢ Self-charging hybrids don’t reduce overall emissions; Hybrids vehicles are effective in reducing emissions for short-journeys in urban areas, but the electrical power is generated from combustion of fossil fuel. Whilst self-charging hybrids can optimise use of the combustion engine to maximise the efficiency of the fuel>electricity conversion rate, the actual energy consumed to achieve propulsion is increased as a result of the additional battery / system weight, and is still affected by poor driving styles.
➢ Full electric vehicles only deliver total emissions reductions if the energy used for charging is low or zero emission; this relates to aggregate / national emissions – disproportionately affecting areas hosting power generation facilities (whether principal generators or embedded STOR facilities)
Air quality is a local problem, generally limited to relatively small areas of densely populated urban areas. Given the potential for increased per-km energy demand, electric vehicles could represent relatively poor energy efficiency if used inappropriately, or used for an inappropriate duty cycle, and mass market adoption could on aggregate work significantly counter to climate change objectives. Conversely, vehicles fuelled by internal combustion engines could represent the most energy- (and carbon-) efficient propulsion option for certain purposes, duty cycles, or regions. For example, freight transport and intra-urban commercial distribution journeys are unlikely to be suitable for electric propulsion as the required battery mass & charge times are prohibitive

LAQM Annual Status Report 2018 60
given currently available technologies. Similarly, rural areas are typically fully compliant with air quality objectives and limits, and refuelling and charging opportunities are relatively poor. In these areas, range considerations & overall efficiency should be the most appropriate factors for fuel choice, in principle favouring internal combustion engine propulsion options over electric. Whilst air quality is an important issue, it is not necessarily defensible to seek to address the problem at the expense of overall energy efficiency, or at the expense of aggregate total carbon emissions. The EU ‘clean air for all’ factsheet lists air pollution at the second biggest environmental concern after climate change. It follows that the solution to air pollution should not be detrimental to efforts to tackle a super-ordinate risk. The 2040 target for phasing out of internal combustion engine vehicles allows industry time to develop technologies which achieve benefits to local air quality without detriment to aggregate carbon emissions. It could be argued that bringing forward the target date should only be considered where viable options have been brought to market which are likely to prove net beneficial in emissions, energy and carbon terms, and which permit widespread uptake (i.e. are affordable).
2.4.4 Action 4) ‘Revise the tax regime, and provide fiscal incentives to help people and businesses adopt cleaner vehicles’
The charter advocates use of taxation & subsidy to encourage the take up of cleaner vehicles, including electric bicycles, and targeted diesel scrappage and retrofit schemes to help people on low-incomes and small businesses access cleaner vehicles, public transport season tickets and car clubs. As with action 3) (2.4.3) above, these schemes should not prejudice efforts to tackle climate change. For example, any diesel scrappage scheme devised should be designed so as not to unnecessarily waste the vehicle embodied energy (energy used to manufacture the vehicle) by scrapping the vehicle before it has served a significant proportion of it’s design-life. It is also important to recognise that a significant shift away from petroleum as a transport fuel will reduce the tax-receipts from this highly-taxed commodity. Tax reforms should avoid crude electricity taxation which brings domestic use within scope – otherwise zero-emission-at-point-of-use domestic technologies could be inadvertently discouraged.
2.4.5 Action 5) ‘Invest in charging infrastructure and the supporting power network’
The UK’s power network must be ready to support the growing number of electrified vehicles on the road network - ensuring security of supply, availability of capacity, and appropriate fee structures which account for the new demands being placed upon the network (e.g. to ensure the customer-funding model sustains network & capacity development). The overall aim of increasing the availability of charging infrastructure to support people and business in adopting cleaner propulsion technologies is supported. It is however also recognised that achieving this will require more than simply the provision of charging points. Joined-up policy and regulation is required to ensure that funding and purchase models do not fragment the network for customers, that the network is served by clean energy sources, and that areas with smaller markets (e.g. rural areas) are adequately served without a significant price penalty.

LAQM Annual Status Report 2018 61
2.4.6 Action 6) ‘Ensure fossil fuels do not generate the power used to fuel electrified vehicles’
No air quality or gains or carbon reductions will be achieved if the energy for electric vehicles is provided by fossil fuels; especially if electric and hybrid vehicles ‘per-km-total-energy-consumption’ remains proportionally higher than that for traditionally fuelled vehicles.
2.4.7 Action 7) ‘Tighten legal limits on air pollution to match World Health Organisation guideline levels’
The charter highlights that current legal limits for PM2.5 & PM10 are twice as high as World Health Organisation (WHO) guideline levels, and calls for UK air quality law to i) reflect the latest scientific consensus to better protect people’s health and ii) adopt WHO guideline levels for particulate matter, and to commit to achieve these by 2030. It should be noted that the WHO guideline levels for PM10 (& PM2.5) are set at the current ‘lowest observable effect level’, derived without regard to any macro-economic cost / benefit calculation (e.g. to compare the costs of achieving the standard and the quantified health benefits of achieving it; or the expected benefits from allocating a value equivalent to the cost to other public health programmes). The WHO standards are recommended as a guideline (only), and it does not logically follow that their adoption would in all cases represent a rational public health decision against a backdrop of finite resources being available to achieve them, when considered against alternative resource allocation. Adoption of tighter standards should be supported where a genuine public health benefit is likely to be achieved in a way which represents good value relative to the source control effort required. Where it appears that lowering standards for particulates is likely to achieve marginal public health gains relative to cost, and/or where substantially greater public health benefits could be achieved in other areas at equivalent cost; it may be more productive to consider control of specific precursors or investment in alternative public health initiative (instead).
2.4.8 Action 8) ‘Improve the national monitoring and modelling of air pollution’
The Charter raises concerns about disparity between data collected locally, and the data used to inform the UK’s national plan – highlighting that the current national system overlooks known local pollution hotspots (which then do not receive targeted national support). Calls are made for all appropriate local authority data to be taken into account in national policy formulation. This aim appears to fail to recognise that;
➢ the National and Local Monitoring systems are governed under separate domestic regulations, and;
➢ the assessment procedures at local and national scales are for different purposes, being specifically laid out in the European regulations
2008/50/EC sets out the requirements for macro (National) and Micro-scale (Local) assessment. The National Limit Values are ‘regional, ambient’ standards which aim to set a standard of general exposure of the population over a large averaging area, and are for this reason required to ignore local pollution hot-spots. Whist it is recognised that the Government could, and possibly should, take account of local authority data when making domestic resourcing decisions – local authority data should only be used for reporting National
LAQM Annual Status Report 2018 62
Compliance where it is necessary to meet the required sampling resolution (averaging area), and the location is appropriate to measure macro-scale ambient air quality. It is worth highlighting here that the PUSH region study output returned results indicating that levels within several South Hampshire AQMA’s were likely already compliant with the NAQS objectives for which they were derived, and similarly identified likely exceedances of NAQS objectives where local measurements would indicate compliant air quality. Modelling can present an illusion of precision, but could perhaps be more reasonably be described as a ‘high-resolution best-estimate’; with results displaying a reasonably broad range of both precision & accuracy depending on local characteristics. Regional-scale modelling is always relatively poor at accounting for highly local factors – due principally to the need to simplify the data for consistency, and to make calculations feasible. This is particularly true for traffic flow models (which would typically underpin an air pollution model). Even at the junction scale, models are relatively poor at predicting driver response to congestion. Whilst striving for improved modelling is desirable, it is only as good as the available input data and must be verified by good monitoring. It is not clear at this stage that significant investment in ‘accurate’ regional-scale modelling which better accounts for local hot-spots is either feasible, desirable or necessary.
2.4.9 Action 9) ‘Adopt a new Clean Air Act, or equivalent for 21st century and independent watchdog with teeth’
This action calls for a new Clean Air Act to tackle our modern pollution problem and safeguard our right to breathe clean air. It is understood that the Government has this on the legislative agenda, and is looking to control domestic fuel use in particular as a key measure to achieve reductions in urban particulate emissions. Unless agricultural sources are included in the revised Act, it’s impact is expected to be relatively limited to metropolitan areas. Proposed new controls and restrictions on domestic fuel combustion are unlikely to solve local nuisance issues, and are unlikely to be invoked by Local Authorities where there are no pre-existing air pollution problems. Where invoked, it is anticipated that sources will be ‘limited’ and not ‘prohibited’, so readers should not over-estimate the likely impact of this forthcoming legislation, either in general, or specifically within Havant Borough. The need for post-Brexit governance arrangements for air quality (and all environmental matters presently governed by the ECJ) is acknowledged.
2.4.10 Action 10) ‘Launch a national public health campaign and alert system to highlight the dangers of air pollution’
This point of the charter highlights the need for the public to understand how dirty air affects their health and that of their families, as well as how they can be part of the solution. This need is acknowledged. It could also be argued that such a public health campaign should have broader scope than ‘dirty-ambient-air’, to include the contribution of indoor air pollution and occupational exposures on personal pollutant exposure, empowering people to make informed decisions about their own personal health and that of their family.

LAQM Annual Status Report 2018 63
2.5 Impact of National Policy
The National Planning Policy Framework (NPPF) was originally published by the UK's Department of Communities and Local Government in March 2012, consolidating the previous canon of English planning guidance (Planning Policy Statements [PPS], and Planning Policy Guidance Notes [PPG]). The Ministerial Foreword made sustainable development a central theme of the NPPF, defined as a concept of ‘positive growth’ (the making economic, social and environmental progress for both current & future generations). This significant reform of the planning system sought to position planning as a key tool for the delivery of positive economic growth. The three distinct roles of planning were further defined under Paragraph 7 (8 of the 2019 revision); ➢ Economic: to contribute to the building of a strong & competitive economy, by
ensuring strategic availability of land to support growth & innovation, by identifying development requirements, and coordinating the provision of infrastructure
➢ Social: to support strong, vibrant and healthy communities, by providing the supply of housing required to meet the needs of present and future generations; and by creating a high-quality built environment which reflects the community’s needs and support its health, social and cultural well-being; and
➢ Environmental: to protect and enhance our natural, built and historic environment; to help improve biodiversity, to use natural resources prudently, minimise waste & pollution, and to mitigate and adapt to climate change and to facilitate the transition to a low carbon economy.
The policy stresses that these roles are mutually dependent, and that to achieve economic, social (public health) and environmental gains, all three roles should be exercised jointly, simultaneously, and in a balanced way– with the planning system playing an active role in guiding private development to sustainable solutions which serve the public interest. A recent report published by the Royal Town Planning Institute (RTPI)70 reports on the effect that these planning reforms to date, highlighting that despite the wholistic concept of sustainable development embodied within the NPPF, the pursuit of a ‘pro-housing, pro-growth’ agenda has led to a systemic bias toward the economic role. It has also led to a narrow interpretation of the social role as predominantly comprising the ‘supply of housing’ (meeting the housing need), and less [to support] ‘the health, social and cultural well-being’ of the community. This is to some extent reflected by the OAN technical Guidance note71 which sees the key objective of the framework as being to ‘boost significantly the supply of housing’, in line with para. 47 of the NPPF 2012 (para.49 NPPF 2019). The RTPI report also argues that this bias has come at the expense of important environmental agendas, and that the effect of this ‘policy drift’ has been exacerbated by both deregulatory planning reforms over this period (16 amendments to the English GPDO, and it’s remaking in 2015), and almost a decade of UK-wide austerity. This has caused significant harm to the ability of local authorities to exercise the policy levers provided by the National Framework in the public interest, to achieve environmental and public health gains.
70 ‘Serving the Public Interest? The reorganisation of UK planning services in an era of reluctant outsourcing’ Royal Town Planning Institute, 2019. Available here: https://www.rtpi.org.uk/witpi 71 Objectively Assessed Need and Housing Targets Technical advice note, Second edition. Planning Advisory Service, July 2015; available here: https://www.local.gov.uk/sites/default/files/documents/objectively-assessed-need-9fb.pdf
LAQM Annual Status Report 2018 64
The 2018 revision of the NPPF recognised that the balance of planning roles was not well met by the 2012 policy – strengthening the existing environmental and public health provisions. Despite this, the RTPI report which (post-dates the 2018 NPPF revision), points to the continued rise of “proceduralism”, driven by both economic pressures, and the growth agenda, as having restricted the latitude that planners had traditionally enjoyed to exercise professional discretion and proactive planning; making it harder to undertake the kind of long-term strategic thinking required to deliver a built environment which serves the goal of truly sustainable development. It is noted that the 2019 revision of the NPPF has not sought to address these concerns. Austerity, under-resourcing, and restructuring are blamed for creating an environment where the private sector becomes a more attractive prospect for planning professionals, reducing the numbers of experienced senior planners in the public sector. The longer-term consequences of these shifts – in funding, outsourcing, leadership, and practice – is an erosion of the ability to plan effectively in the public interest. Air quality is an issue which cuts across many areas of planning policy, including; ➢ the strategic delivery of transport infrastructure, influencing existing traffic flows on the
local & strategic road network.
➢ the relative locations of employees to quality employers, residents to services, retail and leisure opportunities, and housing to public transport hubs (etc.)
➢ delivery of high-quality & energy-efficient development which minimises overall carbon emissions and the need for local fuel combustion,
➢ delivery of strategic measures to facilitate transition to low-carbon & low-emission transportation,
➢ achieving ecological, public health co-benefits from quality landscapes, green infrastructure,
➢ measures to ensure that the energy demands of the local area are met in a clean and efficient way,
➢ mitigation of exposure of both people & sensitive landscapes to air pollution, and;
➢ Improving public health
All of these policy areas require a wholistic, joined-up & strategic approach to planning, and so are all areas at risk from the current funding environment for Local Authorities, and the centrally driven development agenda. If, in the consideration of planning ‘balance’, these areas continue to be regarded as subordinate to economic development needs, the ability of the planning system to contribute to continuing air quality gains will be diminished. The RTPI is campaigning for local authorities to “put planning back at the top-table of corporate decision-making” and will continue to make the case for better resourcing.
2.5.1 The Policy Response in within Havant Borough
Havant Borough Council recognises that Air Quality forms an integral component of the general concept of ‘sustainable development’, falling within both the ‘social’ and ‘environmental’ roles that the planning system is required to serve. The Havant Borough Council Local Plan 2036 was at an advanced stage of development when the 2018 revised NPPF was published in July 2018. It was recognised that the 2018 revision contained some key amendments with respect to environmental policy, particularly in respect of sustainable transport & air quality.

LAQM Annual Status Report 2018 65
Key NPPF policy changes can be summarised briefly (all are retained in the 2019 revision); ➢ Para. 102 requires transport issues to be considered at the earliest stages of both
strategic plan making, and development proposals. This is not a new concept, but the sub-sections to this paragraph give this requirement some substance; requiring the development impacts to be quantified & mitigated (a, d), that the transition to LZC transport (ULEV & EV) is supported (b), opportunities to develop sustainable transport networks & infrastructure are secured (c), and that opportunities to achieve net environmental (air quality) gains are considered, and secured where possible (d).
➢ Para. 103 expands on the NPPF’12 para. 30, relating the pattern of development to supporting the objectives of para. 102, minimising the need for travel, and promoting sustainable and active travel modes to ‘improve air quality and public health’
➢ Para. 170 e) re-states NPPF’12 para. 109, but introduces a requirement for development to contribute towards improving the local environmental conditions, specifically air & water quality.
➢ Para. 180 is a development NPPF’12 para. 120, requiring the local policy and individual planning decisions ensure that development is suitable for it’s location, accounting for the cumulative effects of pollution (including air pollution) on health, living conditions and the natural environment.
➢ Para. 181 specifically relates to air quality, and retains all of the wording from NPPF’12 para 124, but extends the provisions to individual planning decisions. Additions under this paragraph include a requirement to identify opportunities to improve air quality, mitigate the impacts of development and to take a strategic approach to these requirements at the plan-making stage.
It was considered that together with the collection of recent strategies, policy reforms, guidance and assessment referenced in section 1.1.1, the above revisions to the NPPF justified consideration of a different approach to air quality through the planning system, to ensure that the 2036 local plan provisions are ‘fit for future’. The policy response recognises that all new development has the potential to impact local air quality, and that even where ambient concentrations are compliant, reducing local air pollution will achieve public health benefits. The policy represents a non-targeted, ‘general emissions offsetting’ approach which does not have specific regard for existing air quality. This avoids the need to quantify existing environmental concentrations, estimate the development condition & magnitude of change, and the need to establish a threshold between ‘negligible’ and ‘significant’ change. The aim of the draft policy is to make air quality a core design consideration, seeking ‘low-emission-design by default’ considering all aspects of development including; ➢ the emissions related to it’s transport demand,
➢ it’s contribution toward mode-shift from conventionally fuelled private motor car(s) to sustainable and active modes of travel,
➢ the local emissions related to local combustion (for space & water heating) and their avoidance through use of ‘zero-emission-at-point-of-use’ alternatives, heat recovery or LZC options,
➢ the non-local emissions related to meeting the energy demand of the development (i.e. development energy efficiency and micro-generation),
➢ the contribution of the development to interception, dispersal and/or destruction (or phase shift) of air pollutants, for example layout, height and massing, landscaping & planting, and the use of green walls and roofs.

LAQM Annual Status Report 2018 66
The draft policy also retains a threshold-based assessment which serves to quantify the air pollution impact of development where an adverse impact is considered to be possible – and where identified, enhanced mitigation would be required to make proposed development acceptable in planning terms. The Air Quality policy does not seek to duplicate the controls under other policy, rather it is intended to complement a suite of air quality and environmental sustainability policy and to reinforce the need for a wholistic design approach which secures synergistic environmental and public health benefits without stifling local development. Consultation drafts of the air quality policies are provided in Appendix J. It should be noted that the plan is subject to amendment following consultation, and until the plan passes inspection and is formally adopted, policies may be subject to significant amendment or deletion. Table 2.2 provides an overview of some of the broader air quality relevant policies included in the pre-submission draft, linked to the local measures to improve air quality.

LAQM Annual Status Report 2018 67
3 Air Quality Monitoring Data and Comparison with Air Quality Objectives and National Compliance
3.1 Summary of Monitoring Undertaken
3.1.1 Automatic Monitoring Sites
Havant Borough Council did not undertake any automatic (continuous) monitoring during 2018. Data from Automatic Urban & Rural Network (AURN) monitoring sites are available from DEFRA’s online “data selector” tool72, and information about the context of the monitoring sites & pollutants monitored can be found at the AURN home-page73 (see the ‘site selector’ under the heading “Current and Closed AURN monitoring sites”, towards the bottom of the web page). There are 14 ARUN monitoring sites within a 50 mile radius of Havant Borough, with the closest network monitoring sites to Havant being those located at Portsmouth (Urban Background, Ref: UKA00421, 3 miles), and Southampton Centre (Urban Background, Ref: UKA00235, 17 miles). Non-network automatic monitoring sites are also maintained by neighbouring Chichester District Council, with two monitored located with Chichester town & one adjacent to the A27 Chichester Bypass (all within 8 miles of the boundary of Havant Borough). Data for Chichester Monitoring sites are available on the Sussex Air web pages74 Data from urban background AURN sites at Reading, Brighton, Bournemouth, Chilbolton, Southampton and Portsmouth have been used for calculating annualisation factors for local passive monitoring, and have not been specifically considered as an indicative proxy for Diurnal concentration patterns for Nitrogen Dioxide concentrations. The sections below may make anecdotal reference to typical annual concentration patterns from the above locations, where helpful to the context of local results or estimates (e.g. as in 2.3.2 to illustrate the range of PM2.5 concentrations).
3.1.2 Non-Automatic Monitoring Sites
Havant Borough Council undertook or supported non-automatic (passive) monitoring of Nitrogen Dioxide (NO2) at 37 locations during 2018. Not all of these locations were monitored concurrently, and the total includes locations that were decommissioned within the 2018 monitoring year, new locations established within the same period, and locations monitored over a limited period for indicative purposes. ➢ Table A.1 in Appendix A presents details all locations monitored during 2018.
➢ Appendix F includes an assessment of new tube positions against regulatory requirements, as well the positions subject of the Langstone Road review presented at 1.1.3. No assessment was undertaken for tubes deployed at local schools, as their purpose was educational & general interest only and was not intended (or anticipated) to be critical to consideration of NAQS compliance.
➢ Appendix F also set out guiding principles for selection of future monitoring locations, alongside a position assessment & classification for newly established locations (Table F.10).
72 https://uk-air.defra.gov.uk/data/data_selector 73 https://uk-air.defra.gov.uk/networks/network-info?view=aurn 74 http://www.sussex-air.net/Default.aspx

LAQM Annual Status Report 2018 68
➢ Maps showing the location of the monitoring sites are provided in Appendix D
➢ Further details on statistical corrections & adjustments to raw monitoring data are included in Appendix C, including corrections for Bias, Annualisation, and Dispersion (‘fall-off with distance’, FOWD) adjustments.
➢ Diffusion Tube Quality Assurance/Quality Control (QA/QC) information is included in Appendix C.
No monitoring has been undertaken for PM10, PM2.5, or SO2.
3.2 Nitrogen Dioxide (NO2)
The air quality monitoring results presented in this section are, where relevant, adjusted for bias, “annualisation” and distance correction. Further details on adjustments are provided in Appendix C.
3.2.1 Monitoring Results
Monitoring results for Nitrogen Dioxide are presented in Appendix A, and Appendix B. ➢ See Table A.1for a brief description of monitoring sites, and Appendix D for location
maps.
➢ Table B.1 presents monitoring data at a monthly resolution. Monthly results are not corrected for bias. An uncorrected annual mean is presented, alongside an annual mean value which is corrected both for bias, and for any missing periods of data collection (i.e. an annualised mean). Estimated concentrations at the nearest point of relevant exposure to the measurement point are also presented.
➢ Table A.2 presents ‘point of measurement’ annual mean monitoring results for the past 5 years (2014 – 2018). All figures are bias corrected & annualised.
➢ Figure A.1 presents the information from Table A.2 & A.3 graphically, including an indicative estimate of measurement uncertainty.
➢ Table C.1 summarises the statistical corrections applied, and estimates made.
➢ Table C.2 provides details of incomplete monitoring periods (usually resulting from tube theft, or weather-related damage, but also used where locations are established part-way through the reporting year or where problems arise with tube supply or analysis).
➢ Table C.3 summarises the annualisation calculations & correction factors for each period of incomplete monitoring identified in Table C.2.
3.2.2 Comparison of Results with NAQS Objectives
Section 1.1.2 describes the legislative background to the current air quality objective values, and the context of their derivation and application. It is important to note that in application, there is a difference between an ‘exceedance’ of-, and the ‘breach’ of-, an air quality standard. An ‘exceedance’ of an air quality standard would refer to any measured concentration that is greater than the objective value, irrespective of it’s local context, averaging period or the frequency of occurrence. An exceedance may or may not also represent a breach of an air quality standard.

LAQM Annual Status Report 2018 69
A ‘breach’ of an air quality standard would refer to a measured concentration that-;
i) Has been made at locations compliant with the relevant legislative provisions (i.e. at places where the air quality standard is applicable, termed locations where there is ‘relevant exposure’), and which meet the requirements for results to be compared with NAQS objectives (i.e. measuring ‘ambient’ conditions, and not local point-sources),
ii) Has been obtained using monitoring methods- and standards of analysis- that are compliant with the legislative requirements
iii) Has been averaged over a relevant period, and;
iv) (Where the applicable averaging period for the air quality standard is less than a calendar year;) -the exceedance has been recorded on a greater number of occasions than the permitted number of exceedances.
In this way, an exceedance that does not represent a breach is both permitted by- and is complaint with- the relevant legislative regime. It is however recognised that the health impacts from exposure to air pollutants is often non-threshold (whereby any increase in exposure in principle represents an increase in the risk of- or degree of- harm), and that the effects on individuals will vary. It is taken as a base assumption that these factors have been taken in to account in the derivation of the air quality standards at the Community Level, alongside a specific set of assumptions which relate to the nature, duration and frequency of exposure. The standards should therefore be regarded as the level below which ‘the degree of harm caused is deemed to be acceptable’, and not to a level at which ‘the concentration of the air pollutant is either ‘safe’ or ‘harmless’. Individuals will be subject to a greater degree of harm where they are exposed at a frequency or duration that falls outside the parameters of the assumptions of the toxicological assessment that underpins the air quality standards. Similarly, persons with pre-existing health conditions that could be exacerbated by exposure to poor air quality may well be subject to a degree of harm associated from exposure to levels of air pollution that are complaint with the air quality standards. Havant Borough Council is acutely aware of the high profile that air quality currently receives within mainstream reporting, but notes that little (if any) attention is paid to the technical difference between ‘exceedance’ & ‘breach’ of air quality standards – with exceedances often reported as representing ‘illegal air pollution’. Media campaigns from non-governmental bodies, individuals & businesses to encourage emissions reductions or the uptake of low pollution technologies (etc.) are legitimate in their aim to achieve public health benefits from general exposure reductions, however in discharging LAQM duties Local Authorities must consider the data within the narrow framework of interpretation as laid out under the legislative regime. Annex III of 2008/50/EC sets out the sampling requirements for making comparisons with the air quality standards. SI No. 1001 (Schedule 1) transposes these requirements to domestic law in full, albeit with slightly amended wording to improve readability. There is no similar stipulation under either the Environment Act 1995 (c.25)75 or SI 92876, however the principles outlined in Annex III to 2008/50/EC have been incorporated within the LAQM technical guidance (TG(16)). 75 http://www.legislation.gov.uk/ukpga/1995/25 76 The Air Quality (England) Regulations 2000 SI 928, http://www.legislation.gov.uk/uksi/2000/928/contents/made
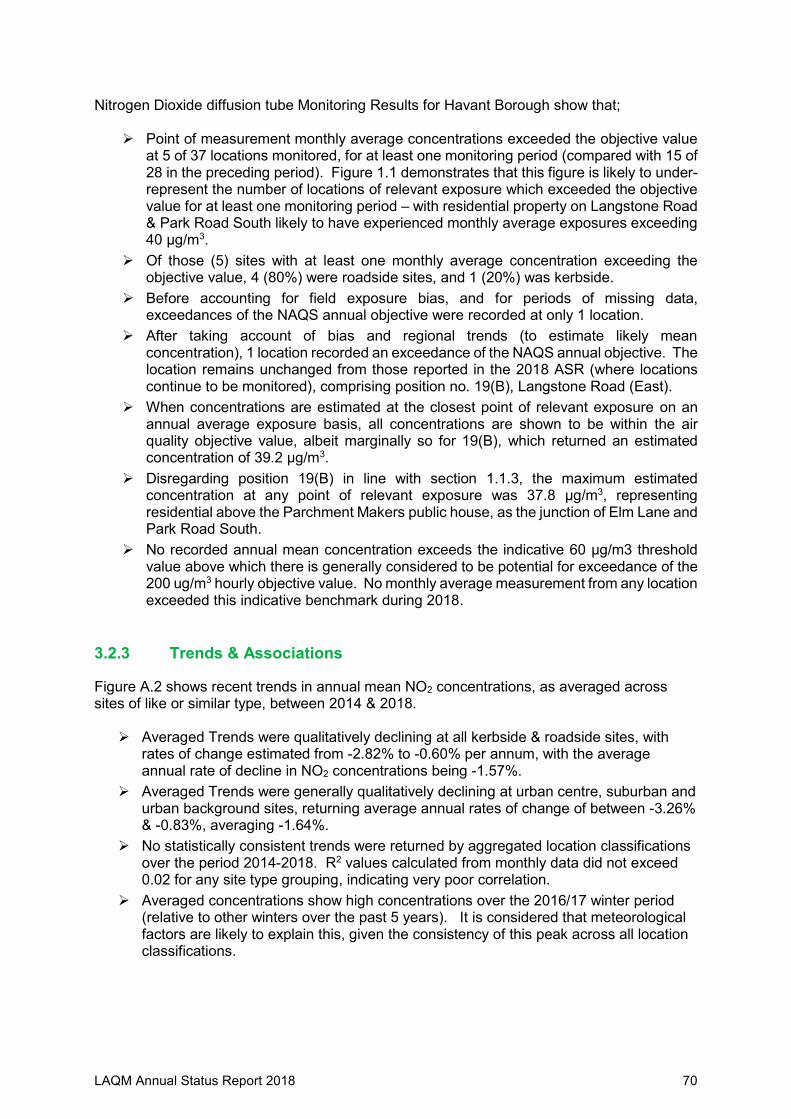
LAQM Annual Status Report 2018 70
Nitrogen Dioxide diffusion tube Monitoring Results for Havant Borough show that; ➢ Point of measurement monthly average concentrations exceeded the objective value
at 5 of 37 locations monitored, for at least one monitoring period (compared with 15 of 28 in the preceding period). Figure 1.1 demonstrates that this figure is likely to under-represent the number of locations of relevant exposure which exceeded the objective value for at least one monitoring period – with residential property on Langstone Road & Park Road South likely to have experienced monthly average exposures exceeding 40 µg/m3.
➢ Of those (5) sites with at least one monthly average concentration exceeding the objective value, 4 (80%) were roadside sites, and 1 (20%) was kerbside.
➢ Before accounting for field exposure bias, and for periods of missing data, exceedances of the NAQS annual objective were recorded at only 1 location.
➢ After taking account of bias and regional trends (to estimate likely mean concentration), 1 location recorded an exceedance of the NAQS annual objective. The location remains unchanged from those reported in the 2018 ASR (where locations continue to be monitored), comprising position no. 19(B), Langstone Road (East).
➢ When concentrations are estimated at the closest point of relevant exposure on an annual average exposure basis, all concentrations are shown to be within the air quality objective value, albeit marginally so for 19(B), which returned an estimated concentration of 39.2 µg/m3.
➢ Disregarding position 19(B) in line with section 1.1.3, the maximum estimated concentration at any point of relevant exposure was 37.8 µg/m3, representing residential above the Parchment Makers public house, as the junction of Elm Lane and Park Road South.
➢ No recorded annual mean concentration exceeds the indicative 60 µg/m3 threshold value above which there is generally considered to be potential for exceedance of the 200 ug/m3 hourly objective value. No monthly average measurement from any location exceeded this indicative benchmark during 2018.
3.2.3 Trends & Associations
Figure A.2 shows recent trends in annual mean NO2 concentrations, as averaged across sites of like or similar type, between 2014 & 2018. ➢ Averaged Trends were qualitatively declining at all kerbside & roadside sites, with
rates of change estimated from -2.82% to -0.60% per annum, with the average annual rate of decline in NO2 concentrations being -1.57%.
➢ Averaged Trends were generally qualitatively declining at urban centre, suburban and urban background sites, returning average annual rates of change of between -3.26% & -0.83%, averaging -1.64%.
➢ No statistically consistent trends were returned by aggregated location classifications over the period 2014-2018. R2 values calculated from monthly data did not exceed 0.02 for any site type grouping, indicating very poor correlation.
➢ Averaged concentrations show high concentrations over the 2016/17 winter period (relative to other winters over the past 5 years). It is considered that meteorological factors are likely to explain this, given the consistency of this peak across all location classifications.

LAQM Annual Status Report 2018 71
Table A.3 presents a summary of long-term trends in annual mean NO2 concentrations for individual monitoring sites, between 2004 & 2018. Sites are excluded where less than 5 years data are available. ➢ The qualitative trend in ambient Nitrogen Dioxide concentrations is declining at 13 of
the 14 current monitoring locations monitored for which sufficient data is available to calculate a trend.
➢ The remaining location is an urban background site in the Waterlooville area, where the long-term trend is not sufficiently strong as to be regarded as anything other than ‘static’ (indicating neither improvement nor deterioration of average ambient air quality). It’s average rate of change over the total monitoring period is -0.24% per annum.
➢ Of the 13 qualitatively declining trends (i.e. qualitatively improving air quality), 9 (69%) display a non-negligible strength of association, of which 7 are either moderate or strong (R2 0.6-0.8).
➢ Tests for the statistical significance of trends (calculated over a 10-year period on an ‘individual location basis’, from annual means), returned statistically significant ‘moderate’ or ‘strong’ declining trends at 7 locations. Significant relationships were evident at a number of other locations, but these generally displayed a poor trend association (R2 <0.5), and so are not regarded as reliable.
Error! Reference source not found.summarises the available information on the cycle traffic from a number of DfT classified traffic monitoring positions. This data shows there appears to have been an anecdotal increase in the number of trips made by pedal cycle over the past decade, but levels of growth and trend correlations at different locations are disparate, and it is not clear that there has an significant absolute increase is evident across the monitored locations as a whole. ➢ Levels of Pedal Cycle Traffic on monitored unclassified (local strategic, urban-) & B-
Class- roads has either increased or remained broadly static, since 2008. ➢ Trends on unclassified and B class roads are however not strong, suggesting broad
variability between monitoring years, as well as between different road links. ➢ Results are also mixed for A-Class roads, with a strong increase on the A3023
Langstone Road, with very strong correlation (growth with time) and estimated annual growth rates of over +20% per annum. Conversely the A3 Portsmouth Rd. has a similarly strong correlations for declines of -4% per annum, and more than 50% decline in cycling rates since 2000.
➢ The trend pattern does not appear to be related to the overall traffic rates on the monitored road links, as significant increases are noted on some of the busiest roads (e.g. A3 Maurepas Way) and strong declines of up to -70% on relatively lightly trafficked A Class Roads (e.g. A3023 Manor Road).
➢ The stark difference between trends and rates on the A3 may reflect an increase in the number of residents to the West of the London Road section as a result of the MDA development, offsetting a generally static or declining trend on busy routes, which is evident in areas without equivalent population growth (e.g. on the A3 in the Cowplain area). Alternatively, the growth in cycling could reflect the success of the shared bus lane / cycle surfaces on the A3 London Road / Maurepas Way area in making cycling a safer and more convenient choice for local residents.
➢ Strong Growth on the A3023 in North Hayling, and on Langstone Road is expected to be sustained & supported by development of the shared surface / off-road cycle links in this area.

LAQM Annual Status Report 2018 72
Table C.10 summarises information on the proportion of HGV traffic in the vehicle mix at a number of DfT monitoring sites (predominantly representing the strategic / classified road network), between 2000 & 2018. ➢ Recent period trends (2015-2018) show an increase in the proportion of HGV traffic at
around 40% of monitored sites, with estimated annual increases ranging from +1% to +26% (Note, percentages relate to an increase in proportion, i.e. +10% would relate to a change from 1% AADT as HGV’s to 1.1% AADT as HGV’s)
➢ 50% monitored sites show a declining trend (recent) in the proportion of HGV traffic, with estimated annual reductions ranging from -1.4% to -17.3%, suggesting a recent change in traffic distribution patterns on some road links (especially the A2030).
➢ Around a third of sites displayed negligible trend (recent), with proportions remaining either broadly static, or displaying wide variability between traffic counts with inconsistent direction & magnitude of change.
➢ 40% of monitored locations displayed any material increase in the proportion of HGV traffic between 2000 & 2018, representing an increase over the levels of absolute long-term growth reported in the 2018 ASR, suggesting that where there is an increasing trend, this is entrenched and beginning to surpass historic levels of HGV traffic.
➢ Summary figures for long term trends (2000-2018, not shown in Table C.10) return 21% increasing, 53% declining, and 24% static, with rates of change ranging from -29.5% to +20.5% per annum. These links appear to reflect a change in the most common destination for HGV trips, representing a decline in Westbound & increase in Eastbound traffic accessing the A27 from the local road network in Havant.
➢ Figures seem to indicate that there is also a sustained increase in HGV traffic on the A3(M) South of J4, suggesting a sustained increase on the (unmonitored) Purbrook Way, and possibly A3 London Road (Widley).
➢ It is concluded that data would not support a conclusion that increasing proportion of HGV traffic on the local roads is likely to be of material concern as a driver for increasing levels of ambient Nitrogen Dioxide (or Particulate) pollution.
Table C.11 summarises information on the total traffic flows at a number of DfT monitoring sites (predominantly representing the strategic / classified road network), as annual average daily flow (AADT) between 2000 & 2018. ➢ Recent period trends (2015-2018) show an increase in AADT flows at around 40% of
monitored sites, with estimated annual increases ranging from +1% to +32%, with the maximum annual increase relating to the A27 Eastbound on-slip at the A3(M). Despite only recent data being available (from 2012) for this location, there does appear to be a ‘step change’ between from the 2012-2015 AADT average (4154) to the 2016-2018 AADT average (10608).
➢ Around 40% monitored sites show a declining (recent) trend in AADT flows, with estimated annual reductions ranging from -1% to -12%. The strongest reduction is on the A27 Westbound off-slip east of at the A3(M). A similar reduction is evident in HGV traffic, and a similar step-change’ to that in the traffic accessing the eastbound A27 is evident, suggesting a fundamental and fairly broad influence on the travel demand from East of this location (origins or destinations in Havant, Emsworth, Chichester or beyond).
➢ 18% of sites displayed no meaningful trend (recent), with flows remaining broadly static (+/-<1%).
➢ Around half of monitored locations (for which sufficient data were available) displayed a material increase traffic flows over the past decade

LAQM Annual Status Report 2018 73
➢ Increasing trends associated with the A3(M) have a notably strong statistical association that is broadly consistent across the entire road link, with few exceptions.
➢ Traffic growth patterns on the A27 are broadly consistent with the increase in A3(M) traffic, with qualitative declines on exit & entry points. This suggests that there is increasing bias for transient travel (where both origins and destinations are outside of the Borough).
➢ Summary figures for long term trends (2000-2018, not shown in Table C.11) return 29% increasing, 21% declining, and 50% static. The most notable trends are on the A3023, returning an average annual growth of -0.13% at Langstone Road, and zero net increase over the past 19 years. Similar negative trends are also evident across 4 locations on the A3, with annual growth rates of -0.3% - 2.3%, and a reduction in daily traffic of up to 3100 vehicles over the monitoring period. Conversely, strong growth of up to +35% (+23000 vehicles / day) is evident on the A3(M) over the same period.
➢ It is concluded that data support a broad conclusion that traffic growth is generally concentrated on the strategic road network, and that there is not strong evidence to suggest that traffic growth on local roads is unsustainable – with particular reference to local strategic routes, such as the A3023 (Langstone Road, Manor Road), A2030 (Havant Road), and A259 (Havant Road).
➢ It is also notable that the growth in volumes of road traffic on the Strategic Road Network is not reflected in the concentration of Nitrogen Dioxide pollution at the roadside – suggesting that the tightening of vehicle emissions standards is having a material effect, both compensating for the current levels, and contributing to statistically significant reductions of concentrations of Nitrogen Dioxide in ambient air.
3.2.4 Changes to Monitoring
As regards the changes to monitoring positions arising from the comprehensive review of the characteristics of the current monitoring network positions, the following changes were made during the 2017 & 2018 monitoring periods: ➢ Monitoring at locations which were not classifiable under TG(16) criteria has been
ceased. This has resulted in the decommissioning of location no’s 21, 23, 9 & 26. The reason for these positions not being directly comparable to ambient standards is their proximity to localised emission sources, and these are (therefore) largely positions which returned elevated results.
➢ Monitoring at locations which are not particularly useful for demonstrating long-term trends, where there is high confidence in the continued compliance, where there are data consistency problems, or where monitoring is duplicated within the conceptual ‘represented road length’ was not considered to represent good value. This has resulted in the decommissioning of location no’s 1B, 5, 13, & 15.
➢ The decommissioning of monitoring locations has freed resources for more informative deployment, allowing the establishment of useful long-term monitoring sites in the urban centres within the Borough, and to plug ‘knowledge gaps’ through short term deployments in areas of the Borough not previously monitored.
➢ One new monitoring position has been established on the East side of Park Road South, aiming to replicate the ‘reason’ for monitoring at position no’s 21 & 23 (23 in particular) without the location issues that affected the applicability of data from the aforementioned positions. The new position (28) is generally well sited, but is only compliant if it is accepted that the signal-controlled pedestrian crossing (interrupting traffic flows on the principle route estimated to exceed 25K AADT) does not meet the definition of ‘busy road junction’. It is acknowledged that traffic at this point is not free-flowing, and is instead ‘stop-start’, with vehicles accelerating away from a ‘stop-line’

LAQM Annual Status Report 2018 74
from stationary. The monitoring position is located within the acceleration zone, and so could be regarded as being unrepresentative. It is however the best available position, and serves as a more representative ‘worst case’. It’s results should however be regarded with some caution, as they are likely to over-state ‘ambient’ concentrations.
➢ Urban Background and Centre sites have been established in Emsworth and Havant Town Centres, with a view to the future monitoring of long-term trends.
➢ A monitoring position has been established at Orchard Road, in order to replicate the reason for monitoring at position no. 13 (representative of a residential area down-prevailing-wind of the A27 carriageway), but aiming to better capture ‘worst case’ concentrations.
The 2017 ASR demonstrated a likelihood that monitoring position 19B is not compatible with the requirements of LAQM, and recommended that alternative representative locations be established for comparison. Section 1.1.3 presents the results of that review, which recommends the decommissioning of several positions currently monitored. It is considered that sufficient information is now available from temporary position T2 (the Limes) to demonstrate that the PUSH area modelled exceedance at this location is unlikely to be representitive of real-world concentrations. As available results show that concentrations are not >75% of the NAQS objective, there is not considered to be any compelling reason to maintain the monitoring position on private land, and so it is recommended that it be decommissioned. Summary of changes recommended: ➢ Decommission position no’s 19B, 19D, 19E following review of air quality in the vicinity
of the A3023 Langstone Road ➢ Decommission position no T2, following completion of a 12-month monitoring period.
Summary of changes completed between Jun 2018 & Jun 2019: ➢ Temporary position no. T1 was decommissioned following a two-month monitoring
period which returned the expected favourable results. ➢ Temporary Position no. T3 was decommissioned following a five-month monitoring
period returning favourable results, demonstrating that a previously modelled exceedance of the NAQS objective at this location is unlikely to be representitive of real-world concentrations.
➢ Position 19D has been decommissioned ➢ Monitoring resources released (from positions T3 & 19D) have been redeployed in
accordance with the monitoring strategy at Table F.10, targeting a key location expected to experience traffic growth as a result of the STR1 strategic development allocation, and planned residential developments East of Castle Avenue. Monitoring positions have been established both North & South of Emsworth Road, with a view to determining which best represents ‘worst case, representitive’ air quality. It is intended to retain one monitoring in the short-medium term; depending upon results. Position assessments are presented as Table F.5 & Table F.6.
Summary of changes expected between Jun 2019 & Jun 2020; ➢ Redeployment of monitoring resources freed by the recommended changes above,
and expected decommissioning of either position no. 31 or no. 32. ➢ It is anticipated that two locations will be established to assess air quality in the vicinity
of the Southleigh Road Denvilles level crossing, deployed as a pair to determine whether there is a significant difference between air quality north & south of the

LAQM Annual Status Report 2018 75
crossing due to the directional bias of traffic flows, or influence of prevailing meteorological conditions.
➢ It is also hoped that a location may be established at the junction of the A3 Maurepas Way / London Road / B2150 Hulbert Road. Kerbside exceedances were previously recorded at this location at a monitoring position which was not compliant with monitoring requirements. Relevant exposure does however exist within 9m of this busy road junction, and so the location remains of concern. The freehold owner of the recently completed Apsley Lodge Retirement Apartments will be approached with a view to establishing a short-term monitoring position at a compliant location, 25 m from the kerbside of the junction. If this is not possible to secure, an alternative position has been identified in Freshfield Gardens, which should be broadly representitive, notwithstanding that Maurepas Way is expected to carry around +10,000 vehicles per day, relative to the A3 London Road, north of this junction.
➢ A location adjacent to the B2150 Hambledon Road / Milton Road / Elettra Avenue Road junction is recommended to be targeted. This position is in line with strategic target location 5) h) (Table F.10), and will allow assessment of worst-case relevant exposure in the vicinity. This position will also respond to concerns raised by local residents about air quality at this location.

LAQM Annual Status Report 2018 76
Appendix A: Monitoring Results
Table A.1 – Details of Non-Automatic Monitoring Sites
Site ID Site Name Site Type X OS Grid
Ref Y OS Grid
Ref Pollutants Monitored
In AQMA?
Distance to Relevant Exposure
(m) (1)
Distance to kerb of nearest road (m)
(2,3)
Tube collocated
with a Continuous Analyser?
Height (m)
1(B) Langstone Road
(West) Roadside (SU) 71610 05592 NO2 NO 13 2.75 NO 2.5
2 Rectory Road Suburban (SU) 71742 05794 NO2 NO 7 11 NO 2.8
3 Havant Road Kerbside (SU) 72198 02048 NO2 NO 2 1 NO 2.6
4 New Brighton Road Suburban (SU) 74866 06425 NO2 NO 13 2.5 NO 2.65
5 South Street Urban Centre (SU) 71789 06205 NO2 NO 17 1.5 NO 3.05
6(B) Park Road South
(West Street) Roadside (SU) 71555 06298 NO2 NO 24 4.25 NO 2.7
7(B) Brockhampton Lane Urban Centre (SU) 71180 06063 NO2 NO 11 8 NO 2.65
8 London Road
(Purbrook) Roadside (SU) 67322 07976 NO2 NO 15 2 NO 2.7
9(B) London Road (Waterlooville)
Other (SU) 68305 09548 NO2 NO 9 2.5 NO 2.8
10 Ramblers Way Suburban (SU) 70032 10043 NO2 NO 5 43.5 NO 2.7
12(B) Xyratex Roadside (SU) 71611 05680 NO2 NO 12 2.75 NO 2.45
13 Grove Road Suburban (SU) 71988 06076 NO2 NO 8.5 2 NO 2.5
14 Elm Park Road Suburban (SU) 71777 06759 NO2 NO 8.5 1.75 NO 2.65
15 Front Lawn Junior,
Broadmere Av. Urban Background (SU) 71894 08403 NO2 NO 0 27 NO 2.45
18 Waterlooville
Precinct Urban Background (SU) 68264 09415 NO2 NO 0 120 NO 2.45

LAQM Annual Status Report 2018 77
Table A.1 Cont’d…
19(B) Langstone Road (East, Bus Stop)
Kerbside (SU) 71640 05794 NO2 NO 7 1 NO 2.55
19(C) Langstone Road East (Woodbury)
Roadside (SU) 71637 05686 NO2 NO 21 3.75 NO 2.5
19 (D) Regents Court Roadside (SU) 71665 05756 NO2 NO 9.75 28 NO 2.5
19 (E) Langstone Road
East (11A) Roadside (SU) 71631 05613 NO2 NO 21 2.9 NO 2.5
20 Bosmere Junior Urban Centre (SU) 71693 05920 NO2 NO 0 35 NO 2.35
21 Park Road South
(Solent Road) Other (SU) 71589 06132 NO2 NO 7 2 NO 3
22 Park Road South (Bulbeck Road)
Roadside (SU) 71573 06200 NO2 NO 50 2 NO 3.1
23 Park Road South
(Elm Lane) Other (SU) 71571 06374 NO2 NO 3.75 0.25 NO 3
25(B) Stakes Road Roadside (SU) 68479 07721 NO2 NO 24 4.5 NO 2.55
26 Ladybridge Road Other (SU) 67228 07849 NO2 NO 35 2 NO 2.65
27 Havant Precinct Urban Background (SU) 71654 06287 NO2 NO 71 82 NO 2.5
28 Park Road South
(West Street) Roadside (SU) 71577 06280 NO2 NO 28 4.75 NO 2.75
29 Orchard Road Suburban (SU) 72019 05800 NO2 NO 5.7 31 NO 2.5
30 St. Peters Square,
Emsworth Urban Centre (SU) 74957 05731 NO2 NO 0 2.75 NO 2.7
W10 Compton Court Roadside (SU) 71368 06805 NO2 NO 0 12.5 NO 2.35
T1 Dunsbury Way Urban Centre (SU) 71411 07933 NO2 NO 1.85 10 NO 2.5
T2 The Limes Not Classifiable (SU) 71683 05809 NO2 NO 0 17.3 NO 2.7
T3 Bedhampton Hill Suburban (SU) 69564 06136 NO2 NO 14.4 25.75 NO 2.4

LAQM Annual Status Report 2018 78
Table A.1 Cont’d…
S1 Tronsnant (Field) Urban Background (SU) 71473 07193 NO2 NO 0 N/A NO 2.25
S2 Trosnant (Entrance) Suburban (SU) 71363 07227 NO2 NO 10 50 NO 2.4
S3 Bosmere Junior Sch.
(Sand-Pit) Urban Background (SU) 71709 06070 NO2 NO 0 N/A NO 1.95
S4 Bosmere Junior Sch.
(Car Park) Suburban (SU) 71691 05967 NO2 NO 0 28.4 NO 1.95
S5 Hart Plain (Milton
Rd.) Suburban (SU) 68151 10708 NO2 NO 0 10.5 NO 2.25
S6 Hart Plain (Back
Playground) Urban Background (SU) 68224 10633 NO2 NO 0 N/A NO 2.4
S7 Barncroft (Car Park) Suburban (SU) 70483 07531 NO2 NO 31 5.25 NO 2.4
S8 Barncroft
(Woodland) Urban Background (SU) 70608 07457 NO2 NO 0 N/A NO 2.1
S9 St. Peter's Primary
Sch. (Prayer Garden)
Urban Background (SU) 68861 08173 NO2 NO 0 N/A NO [Not
Recorded]
S10 St. Peter's Primary
Sch. (Car Park) Suburban (SU) 67719 08195 NO2 NO 19.25 80 NO
[Not Recorded]
S11 Mengham Junior
Sch. (Maple Gardens)
Urban Background (SZ) 72405 99581 NO2 NO 1 6 NO [Not
Recorded]
S12 Mengham Junior Sch. (Elm Grove)
Suburban (SZ) 72212 99265 NO2 NO 0 N/A NO [Not
Recorded]
Notes:
(1) 0m if the monitoring site is at a location of exposure (e.g. installed on/adjacent to the façade of a residential property, Background or Urban Centre Location).
(2) N/A if not applicable.
(3) Values may differ from previous reports – re-calibrated to ‘nearest busy road’ (source target road), not ‘nearest road’
Note; other values may differ from those previously reported. Unless stated otherwise these result either from simple corrections of prior errors, kerb re-alignments, new/newly identified relevant exposure, or re-consideration of location against TG(16) wording, and does not represent a physical change of sample location unless stated.

LAQM Annual Status Report 2018 79
Table A.2 – Annual Mean NO2 Monitoring Results
Site ID Site Type (4) Monitoring Type
Valid Data Capture for Monitoring
Period (%) (1)
Valid Data Capture
2018 (%) (2)
NO2 Annual Mean Concentration (µg/m3) (3)
2014 2015 2016 2017 2018
1(B) Roadside Diffusion Tube 100.00% 83.30% 32.386 33.587 38.470 34.384
2 Suburban Diffusion Tube 100.00% 100.00% 26.644 24.337 27.998 25.630 25.815
3 Kerbside Diffusion Tube 100.00% 100.00% 32.678 28.722 33.379 32.166 31.554
4 Suburban Diffusion Tube 100.00% 100.00% 23.181 19.683 23.524 20.823 21.135
5 Urban Centre Diffusion Tube 58.30% 58.30% 24.822 22.293 25.936 20.977 20.780
6(B) Urban Centre Diffusion Tube 100.00% 83.30% 35.295 31.534 33.755 31.901
7(B) Urban Centre Diffusion Tube 100.00% 100.00% 26.425 25.281 28.109 26.679 25.281
8 Roadside Diffusion Tube 83.30% 83.30% 26.533 23.473 26.800 26.281 23.473
9(B) Other Diffusion Tube 100.00% 83.30% 38.867 36.091 39.713 37.855
10 Suburban Diffusion Tube 100.00% 100.00% 22.837 19.601 22.935 20.125 21.356
12(B) Roadside Diffusion Tube 100.00% 100.00% 39.587 29.802 34.205 30.257 30.468
13 Suburban Diffusion Tube 30.00% 25.00% 20.251 18.843 19.803 19.211
14 Suburban Diffusion Tube 91.60% 91.60% 21.029 18.586 20.843 20.608 20.298
15 Urban Background Diffusion Tube 100.00% 83.30% 14.943 13.514 14.712 14.052
18 Urban Background Diffusion Tube 100.00% 100.00% 22.426 17.813 20.665 19.950 20.555
19(B) Kerbside Diffusion Tube 100.00% 100.00% 41.798 43.366 56.321 46.050 47.705
19(C) Roadside Diffusion Tube 16.60% 16.60% 37.327 34.832
19(D) Roadside Diffusion Tube 60.00% 50.00% 26.076
19 (E) Suburban Diffusion Tube 70.00% 58.33% 33.599
20 Urban Centre Diffusion Tube 83.30% 83.30% 29.216 26.052 28.866 30.743 27.088
21 Other Diffusion Tube 90.00% 75.00% 42.465 38.465 40.943 40.356
22 Roadside Diffusion Tube 100.00% 100.00% 34.665 29.672 35.751 31.419 32.954
23 Other Diffusion Tube 100.00% 83.30% 45.789 40.046 43.313 41.776
25(B) Roadside Diffusion Tube 83.30% 83.30% 25.978 22.361 24.444 24.117 26.823
26 Other Diffusion Tube 100.00% 83.30% 24.890 21.595 24.903 25.076
27 Urban Background Diffusion Tube 100.00% 16.60% 25.749 25.186

LAQM Annual Status Report 2018 80
Table A.2 Cont’d…
28 Roadside Diffusion Tube 100.00% 16.60% 30.641 34.897
29 Suburban Diffusion Tube 100.00% 16.60% 24.161 24.945
30 Urban Centre Diffusion Tube 100.00% 16.60% 19.449 18.400
W10 Roadside Diffusion Tube 91.60% 91.60% 30.680 26.386 30.098 27.756 29.141
T1 Urban Centre Diffusion Tube 16.60% 16.60% 22.466
T2 Other Diffusion Tube 100.00% 16.60% 25.255
T3 Suburban Diffusion Tube 100.00% 16.60% 22.925
S1 Other Diffusion Tube 100.00% 16.60% 22.045
S2 Other Diffusion Tube 100.00% 16.60% 23.948
S3 Other Diffusion Tube 100.00% 16.60% 24.583
S4 Other Diffusion Tube 100.00% 16.60% 31.484
S5 Other Diffusion Tube 100.00% 16.60% 20.609
S6 Other Diffusion Tube 100.00% 16.60% 19.700
S7 Other Diffusion Tube 100.00% 16.60% 31.622
S8 Other Diffusion Tube 100.00% 16.60% 19.577
S9 Other Diffusion Tube 100.00% 16.60% 19.251
S10 Other Diffusion Tube 100.00% 16.60% 21.757
S11 Other Diffusion Tube 100.00% 16.60% 12.705
S12 Other Diffusion Tube 100.00% 16.60% 26.113
☒ Diffusion tube data has been bias corrected
☒ Annualisation has been conducted where <12 months data are available
Notes:
Exceedances of the NO2 annual mean objective of 40µg/m3 are shown in highlighted pink, in bold NO2 annual means exceeding 60µg/m3, indicating a potential exceedance of the NO2 1-hour mean objective are shown Highlighted Red, in bold and underlined. (1) Data capture for the monitoring period, in cases where monitoring was only carried out for part of the year (figures presented related to 2016). (2) Data capture for the full calendar year (e.g. if monitoring was carried out for 6 months, the maximum data capture for the full calendar year is 50%). (3) Means for diffusion tubes have been corrected for bias. All means have been “annualised” as per Boxes 7.9 and 7.10 in LAQM.TG16 if valid data capture for the full calendar year is less than 100%. See Appendix C for details. (4) Sites classified as ‘Other’ do not meet any TG(16) site classification criteria, and may not meet ED48673043 Issue 1a or 2008/50/EC requirements for direct comparison of measurement to ambient quality standards.

LAQM Annual Status Report 2018 81
10.00
20.00
30.00
40.00
50.00
60.00
70.00
10.00
20.00
30.00
40.00
50.00
60.00
70.00
tota
l e
sti
ma
ted
NO
2 (
ad
jus
ted
) a
s u
g/m
3
Receptor Description
NO2 (Measured)
NO2 (Estimated at nearest relevant exosure)
Measured Value or Uncertainty Estimate Exceeds NAQS Objective
Estimated of NO2 at nearest relevant exosure Exceeds NAQS Objective
NAQS Annual Mean Objective
Indicative level where exceedance of NAQS Hourly Mean objective (200 ug/m3) should be considered.
Figure A.1 – Annual Mean NO2 Monitoring Results & Estimated Mean NO2 at Nearest Relevant Exposure (2018)

LAQM Annual Status Report 2018 82
Table A.3 – Long Term Trends in Annual Mean NO2 Concentrations
Site ID
Period [yrs]
Qualitative Trend
R2 Est. Rate of Change
(% p.a)
Strength of
association*
Chi Sq. Test T-Test
Confidence Data Valid?
Result Significance
level (p-value)
Data Valid?
Result Significance
level (p-value)
2
2004-2018 [15 Years]
declining 0.661 -1.737% Moderate Yes Significant - Yes Significant <0.01 High
3 declining 0.683 -0.600% Moderate Yes Significant <0.001 Yes Significant <0.001 Very High
4 declining 0.751 -1.945% Strong Yes Significant <0.001 Yes Significant <0.001 Very High
5 declining 0.550 -3.258% Weak No - - No - - -
7B declining 0.643 -1.295% Moderate Yes Significant <0.05 Yes Significant <0.01 High
8 declining 0.258 -1.093% No Clear Association Yes Significant <0.001 Yes Significant <0.05 Uncertain
10 declining 0.622 -1.329% Moderate Yes Significant <0.001 Yes Significant <0.01 High
12A & 12B^ declining 0.653 -1.289% Moderate Yes Significant <0.05 Yes Significant <0.001 High
14 declining 0.793 -2.475% Strong Yes Significant <0.001 Yes Significant <0.001 Very High
18B 2005-2018 [14 Years]
static 0.016 -0.243% No Clear Association No - - No - - -
20 2007-2018 [12 Years]
declining 0.140 -0.83% No Clear Association Yes Not Significant - Yes Significant <0.05 -
21 declining 0.320 -1.58% No Clear Association Yes Significant <0.001 Yes Significant <0.01 Uncertain
22 declining 0.361 -2.05% No Clear Association No - - No - - -
W10 2011-2018 [8 Years]
declining 0.571 -2.82% Weak Yes Significant <0.01 Yes Significant <0.05 Good
* - Very
Weak = R2 0.5-0.6 Strong = R2 0.7-0.8
Weak = R2 0.6-0.7 Very Strong = R2 >0.8
^ - Two separate, proximal locations represented for each of position no. 1 & position no. 12. ‘B’ positions (2014-2016) have been distance corrected to estimate representative concentrations at the former ‘A’ position (2007-2014) , in order to derive a contiguous dataset from which an illustrative trend can calculated.

LAQM Annual Status Report 2018 83
Figure A.2 – Recent Trends in Annual Mean NO2 Concentrations
10.00
20.00
30.00
40.00
50.00
60.00
Jan
Feb
Mar
Ap
r
May Jun
Jul
Au
g
Sep
t
Oct
No
v
De
c
Jan
Feb
Mar
Ap
r
May Jun
Jul
Au
g
Sep
t
Oct
No
vD
ec
Jan
Feb
Mar
Ap
r
May Jun
Jul
Au
g
Sep
t
Oct
No
v
De
c
Jan
Feb
Mar
Ap
r
May Jun
Jul
Au
g
Sep
t
Oct
No
v
De
c
Jan
Feb
Mar
Ap
r
May Jun
Jul
Au
g
Sep
t
Oct
No
v
De
c
2014 2015 2016 2017 2018
Nitrogen Dioxide (Kerbside & Urban Background Averages) 2014-2018
Kerbside Sites (Month Averages) Kerbside Sites (Ann. Averages) Urban Background (Month Averages) Urban Background (Ann. Averages)
10.00
20.00
30.00
40.00
50.00
60.00
Jan
Feb
Mar
Ap
rM
ay Jun
Jul
Au
gSe
pt
Oct
No
vD
ec
Jan
Feb
Mar
Ap
rM
ay Jun
Jul
Au
gSe
pt
Oct
No
vD
ec
Jan
Feb
Mar
Ap
rM
ay Jun
Jul
Au
gSe
pt
Oct
No
vD
ec
Jan
Feb
Mar
Ap
rM
ay Jun
Jul
Au
gSe
pt
Oct
No
vD
ec
Jan
Feb
Mar
Ap
rM
ay Jun
Jul
Au
gSe
pt
Oct
No
vD
ec
2014 2015 2016 2017 2018
Nitrogen Dioxide (Roadside & Urban Centre Averages) 2014-2018
Roadside Sites (Month Averages) Roadside Sites (Ann. Averages) Urban Centre (Month Averages) Urban Centre (Ann. Averages)

LAQM Annual Status Report 2018 84
Appendix B: Full Monthly Diffusion Tube Results for 2018
Table B.1 – NO2 Monthly Diffusion Tube Results - 2018
Site ID
NO2 Mean Concentrations (µg/m3)
Jan Feb Mar Apr May Jun Jul Aug Sep Oct Nov Dec
Annual Mean
Raw Data
Bias Adjusted (0.87) and
Annualised (1)
Distance Corrected
to Nearest
Exposure (2)
2 28.88 32.45 24.72 - - - 20.56 22.89 29.28 32.22 27.98 33.84 28.09 25.82 26.30
3 35.89 33.70 35.71 - - - 33.87 35.91 35.64 39.31 27.90 34.14 34.67 31.55 31.55
4 24.71 27.24 21.24 - - - 21.86 18.09 20.53 25.22 25.62 23.79 23.14 21.13 21.13
5 30.14 28.48 21.29 - - - - - - - - - 26.64 20.78 20.90
7(B) 29.23 31.35 30.53 - - - 23.21 25.42 30.25 30.13 35.59 28.04 29.31 27.02 29.80
8 36.62 29.15 30.12 - - - 27.87 28.67 28.42 26.46 34.42 30.22 27.84 28.50
10 23.78 29.64 22.88 - - - 22.13 20.13 20.01 29.91 19.92 23.33 23.53 21.36 23.40
12(B) 34.81 37.85 35.65 - - - 24.82 28.64 31.49 39.09 31.17 35.30 33.20 30.47 28.50
14 26.68 24.88 20.14 - - - 18.35 16.35 21.13 22.81 26.62 22.24 22.13 20.30 20.30
18 27.59 27.93 22.74 - - - 16.36 17.39 18.39 25.37 24.27 21.69 22.42 20.56 20.56
19(B) 49.81 54.96 54.03 - - - 54.51 49.15 54.77 50.98 50.55 51.99 52.31 47.70 39.20
19(C) 51.53 38.24 30.49 - - - 33.47 34.48 40.99 40.68 34.62 39.94 38.27 34.83 33.90
19(D) - - 26.44 - - - 23.00 24.08 28.89 - 25.40 27.37 25.86 26.08 30.60
19 (E) - - 29.83 - - - 32.83 30.91 36.55 41.20 33.74 36.19 34.46 33.60 32.00
20 32.38 30.76 27.39 - - - 30.33 27.21 28.39 28.04 30.90 31.60 29.67 27.09 29.80
22 35.87 40.90 33.15 - - - 40.87 29.23 34.43 36.91 42.24 32.63 36.25 32.95 32.95
25(B) 33.24 31.67 29.32 - - - 27.21 23.44 24.95 29.16 33.31 31.17 29.27 26.82 26.20
27 31.18 24.82 25.57 - - - 25.01 22.57 27.89 25.05 32.74 31.63 27.38 25.19 25.19
28 40.07 40.03 37.37 - - - 42.59 35.10 - 43.26 39.64 36.60 39.33 34.90 37.80

LAQM Annual Status Report 2018 85
Table B.1 Cont’d…
29 33.10 28.47 27.58 - - - 22.97 21.48 25.02 27.29 28.99 29.90 27.20 24.95 27.90
30 23.09 23.33 18.17 - - - 17.01 16.34 17.60 23.23 19.86 22.56 20.13 18.40 18.40
W10 34.21 32.55 29.87 - - - 32.40 28.06 30.08 35.28 35.42 29.81 31.96 29.14 29.14
T1 - - - - - - - - 22.06 24.28 - - 23.17 22.47 22.47
T2 - - - - - - - - - - 29.11 31.18 30.14 25.25 25.25
T3 - - - - - - - - - - 28.91 25.67 27.29 22.93 23.50
S1 - 22.81 20.89 - - - - - - - - - 21.85 22.05 22.05
S2 - 23.85 23.51 - - - - - - - - - 23.68 23.95 23.95
S3 - 23.87 29.11 - - - - - - - - - 26.49 24.58 24.58
S4 - 30.89 37.00 - - - - - - - - - 33.95 31.48 31.48
S5 - 16.73 22.04 - - - - - - - - - 19.39 20.61 20.61
S6 - 24.08 13.96 - - - - - - - - - 19.02 19.70 19.70
S7 - 26.15 28.58 - - - - - - - - - 27.37 31.62 31.62
S8 - 22.19 12.42 - - - - - - - - - 17.31 19.58 19.58
S9 - - - - - - - - - - 20.57 18.75 19.66 19.25 19.25
S10 - - - - - - - - - - 24.08 20.31 22.20 21.76 21.76
S11 - - - - - - - - - - 13.37 15.13 14.25 12.71 12.71
S12 - - - - - - - - - - 27.89 30.66 29.28 26.11 26.11
☐ Local bias adjustment factor used
☒ National bias adjustment factor used
☒ Annualisation has been conducted where data capture is <100%
☒ Data has been distance corrected for relevant exposure, where appropriate, and where indicated by column header
Notes:
Exceedances of the NO2 annual mean objective of 40µg/m3 are shown in highlighted pink, in bold
NO2 annual means exceeding 60µg/m3, indicating a potential exceedance of the NO2 1-hour mean objective are shown Highlighted Red, in bold and underlined.
Cells marked “- “ indicate data not available (tube damaged, missing, or position established part-way through monitoring year)
(1) Annual Means for diffusion tubes have been corrected for bias using the average correction factor from National Bias Adjustment Correction Data (v0618). All means have been “annualised” as per Boxes 7.9 and 7.10 in LAQM.TG16 if valid data capture for the full calendar year is less than 100%. See Appendix C for details.
(2) Distance corrected to nearest relevant public exposure using the Bureau Veritas Calculator v4.2 (March 2018)
(3) Exposure Periods did not strictly follow the LAQM suggested calendar, annual averages calculated using time weighted average method.

LAQM Annual Status Report 2018 86
Appendix C: Supporting Technical Information / Air Quality Monitoring Data QA/QC
Table C.1 – Statistical Methods Applied
Statistical Method /
Adjustment
Applied to:
Description & Justification
Adjustment
Factor Derived
from local co-
location study
[none]
Comparison of a Triplicate diffusion tube monitoring at a single site with a chemiluminescent analyser
reference concentration from the same location. Used to derive a statistical factor to indicate performance
(accuracy) of diffusion tube measurements for the sample media / tube preparation used. Havant Borough
Council did not undertake Triplicate monitoring against a reference concentration from an automatic
analyser. No local factor has been therefore derived, or applied.
Generic
Measurement
Bias
Adjustment
Factor
All Tubes
The University of West England provide a collated Table of all local co-location (field inter-comparison)
studies undertaken by UK authorities. In the absence of a local co-location study (described above), this
database can be used to find all studies relating to a specific laboratory, tube preparation, exposure type &
year. From this an indicative statistic can be derived to estimate tube performance (accuracy). The mean
value for all available studies is then used to adjust monitoring data to account for any inaccuracy identified
by the component studies. This value is applied as a generic adjustment factor to all local diffusion tubes,
though values other than the overall aggregate factor could be more appropriate (e.g. to suit location type;
see Table C.7). Bias adjustment factor derived from all available inter-comparison studies was
applied, with no amendment to account for location type. Factors applied are as follows: x0.92
(2014), x0.87 (2015) & x0.94 (2016), x0.87 (2017) & x0.93 (2018). All diffusion tubes are subject to
some form of measurement bias, and although generic (i.e. not local), the results of appropriately
adjusted measurements are considered more representative than raw results.
Seasonal Bias
Adjustment
Factors
('AURN Trend',
‘Annualisation’)
As
indicated
in Table
C.2 &
C.3
Statistical method whereby the regional seasonal trend (derived from nearby automatic monitoring locations)
is used to estimate a representative annual mean from an incomplete dataset. All NO2 measurements are
subject to seasonal variation, and this method is necessary to reduce the skewing of data from periods
where no data is available. This correction must be undertaken where <9 months data are available (see
box. 7.10, p. 7-56 TG(16)), however the principle holds for the correction of any data set where results are
available for <100% sampled periods. For consistency, and to adequately account for seasonal
variability for any period of missing data, factors have been calculated & applied to the results of all
tubes where <12 months data were available. See Table C.2, & C.3 for details.
Measurement
Uncertainty
(MU)
All Tubes
The analysing laboratory reports an estimate of the accuracy of their results on a monthly basis. Laboratory
mean MU values range between 5.30% & 9.32% (2013-'17) for tubes prepared using 20% TEA in Water.
Values are applied to annual means on a +/- basis to give an indication of the probable range within which
the true result falls due to laboratory factors (i.e. laboratory MU relates to the accuracy of measurement of
Nitrite on sample media - environmental factors influencing the absorption of Nitrogen to the sample media
are accounted for as bias). Values are applied for illustrative purposes – see Figure A.1.
Concentrations estimated using the fall-off with distance method (see 7.77 – 7.79, p. 7-4 TG()) are subject
to additional uncertainty. Indicative uncertainty rates have been calculated using validation monitoring
undertaken during 2011-2012 (as outlined in the 2015 USA Report for Havant Borough). Uncertainty
estimates were asymmetric, -9.9% & +0.87% (0.901 & 1.009, respectively).
Fall-Off With
Distance
As
indicated
in Table
C.4
The analysing laboratory reports an estimate of the accuracy of their results on a monthly basis. Laboratory
mean MU values range between 5.30% & 9.32% (2013-'18) for tubes prepared using 20% TEA in Water.
Values are applied to annual means on a +/- basis to give an indication of the probable range within which
the true result falls due to laboratory factors (i.e. laboratory MU relates to the accuracy of measurement of
Nitrite on sample media - environmental factors influencing the absorption of Nitrogen to the sample media
are accounted for as bias). Values are applied for illustrative purposes (see error bars, Figure A.1).
Concentrations estimated using the fall-off with distance method (see 7.77 – 7.79, p. 7-4 TG()) are subject
to additional uncertainty. Indicative uncertainty rates have been calculated using validation monitoring
undertaken during 2011-2012 (as outlined in the 2015 USA Report for Havant Borough). Uncertainty
estimates were asymmetric, -9.9% & +0.87% (0.901 & 1.009, respectively). These values are additional to
Laboratory MU, but have only been applied where measurement & estimated concentrations broadly
conform to the scenario from which these factors were derived (concentrations 10% of the objective value
[>36 ug/m3] and the receptor location is further from the kerbside than the measurement location). Where
these conditions do not apply, only Laboratory MU is shown.

LAQM Annual Status Report 2018 87
Table C.2 – Summary of periods of incomplete data collection
Year Period
No.
absent data* No. Days Absent
Data
Tube Locations to Which Missing Period Applies
[Loc. Ref]**
1 2 3
from To from to from to
2018
1 10/04/18 11/07/18 92 Any Location Not Specified in Periods
2 - 14 Below
2 10/04/18 11/01/19 276 South Street (5)
3 10/04/18 11/07/18 01/11/18 07/12/18 128 London Road (Purbrook) [8]
4 10/01/18 08/03/18 10/04/18 11/07/18 04/10/18 01/11/18 177 Regents Court [19D]
5 10/01/18 08/03/18 10/04/18 11/07/18 149 Langstone Road (11A) [19E]
6 10/04/18 11/07/18 04/09/18 04/10/18 122 Park Road South (West Street) [28]
7 10/01/18 04/09/18 01/11/18 10/01/19 307 Dunsbury Way [T1]
8 10/01/18 01/11/18 295 The Limes [T2]
9 10/01/17 07/11/17 - - - - 301 Bedhampton Hill [T3]
9 01/01/18 29/01/18 26/03/18 31/12/18 308 Trosnant Federation of Schools
(Field & Entrance) [S1] & [S2]
10 01/01/18 01/02/18 26/03/18 31/12/18 311 Bosmere Junior School
(Sand-Pit & Car Park) [S3] & [S4]
11 01/01/18 31/01/18 26/03/18 31/12/18 310 Mart Plain Junior School
(Milton Road & Back Playground) [S5] & [S6]
12 01/01/18 09/02/18 26/03/18 31/12/18 319 Barncroft Primary School
(Car Park & Woodland) [S7] & [S8]
13 01/01/18 29/10/18 301 St. Peters Primary School
(Prayer Garden & Car Park) [S9] & [S10]
* - data for multiple absent periods were aggregated, and a single correction factor (CF) calculated & applied. ** - See Table A.1 for Diffusion Tube monitoring site descriptions

LAQM Annual Status Report 2018 88
Table C.3A – Summary of AURN period corrections (Annualisation – HBC Monitoring)
Brighton Preston Park (UKA00483; Urban B/G)
Reading New Town(UKA00462;
Urban B/G)
Portsmouth (UKA00421; Urban B/G)
Bournemouth (UKA00429; Urban B/G)
Southampton Centre
(UKA00235; Urban B/G)
Chilbolton Observatory (UKA00614); Rural B/G)
Notes
On Off B1
Capture (%)
B2 Capture
(%) B3
Capture (%)
B4 Capture
(%) B5
Capture (%)
B6 Capture
(%)
Annual (Am) 10/01/2018 10/01/2019 16.69 99.08% 26.07 99.26% 19.00 99.50% 11.82 96.10% 29.06 94.58% 9.64 98.58%
January 10/01/2018 07/02/2018 19.23 95.98% 33.98 96.26% 23.46 100.00% 14.69 99.86% 34.14 99.86% 11.54 96.12%
UKA00429 Rejected for periods 2, 7 & 8 due to low average period capture (Jul, <70%). UKA00235 Rejected for (Periods 2, 7 & 8 due to low average period capture (Jul, <40%).
February 07/02/2018 08/03/2018 18.55 99.57% 36.08 99.86% 25.03 95.55% 13.63 82.47% 33.29 94.25% 14.82 99.86%
March 08/03/2018 10/04/2018 16.91 99.49% 29.69 100.00% 19.42 99.62% 11.44 99.87% 30.79 93.94% 11.33 99.75%
April 10/04/2018 11/07/2018 15.32 99.55% 23.53 99.77% 17.10 99.86% 10.33 99.59% 26.52 99.77% 9.73 98.73%
May 10/04/2018 11/07/2018 15.32 99.55% 23.54 99.77% 17.10 99.86% 10.33 99.59% 26.52 99.77% 9.74 98.73%
June 10/04/2018 11/07/2018 15.32 99.55% 23.54 99.77% 17.10 99.86% 10.33 99.59% 26.52 99.77% 9.74 98.73%
July 11/07/2018 02/08/2018 13.35 94.70% 17.16 95.08% 12.91 100.00% 8.50 68.75% 24.13 36.17% 6.16 93.94%
August 02/08/2018 04/09/2018 15.39 99.87% 18.02 99.87% 13.96 99.24% 7.14 96.72% 24.25 98.74% 5.70 99.75%
September 04/09/2018 04/10/2018 14.91 99.58% 20.96 99.86% 16.47 100.00% 9.74 97.50% 26.48 95.97% 6.55 100.00%
October 04/10/2018 01/11/2018 18.93 99.70% 25.39 99.85% 22.87 99.85% 15.05 99.85% 30.88 99.70% 9.22 96.28%
November 01/11/2018 07/12/2018 15.95 99.77% 26.04 99.88% 19.68 100.00% 13.52 100.00% 30.11 99.77% 10.94 99.88%
December 07/12/2018 10/01/2019 20.33 100.00% 32.74 99.63% 22.12 100.00% 15.68 100.00% 31.97 99.75% 9.38 99.14%
Period (see Table C.2)
Pm Am/Pm (Ratio)
Pm Am/Pm (Ratio)
Pm Am/Pm (Ratio)
Pm Am/Pm (Ratio)
Pm Am/Pm (Ratio)
Pm Am/Pm (Ratio)
Av. Am/Pm Ratio (Excluding Rejected)
Period 1 17.06 0.98 26.67 0.98 19.55 0.97 12.15 0.97 29.56 0.98 9.51 1.01 0.98
Period 2 18.23 0.92 33.25 0.78 22.63 0.84 13.25 0.89 32.74 0.89 12.56 0.77 0.83
Period 3 17.20 0.97 26.75 0.97 19.53 0.97 11.98 0.99 29.49 0.99 9.34 1.03 0.99
Period 4 16.14 1.03 24.10 1.08 17.43 1.09 11.00 1.07 27.96 1.04 8.34 1.16 1.08
Period 5 16.54 1.01 24.29 1.07 18.20 1.04 11.58 1.02 28.37 1.02 8.47 1.14 1.05
Period 6 17.33 0.96 27.39 0.95 19.93 0.95 12.46 0.95 29.95 0.97 9.88 0.97 0.96
Period 7 16.92 0.99 23.18 1.12 19.67 0.97 12.39 0.95 28.68 1.01 7.88 1.22 1.07
Period 8 18.14 0.92 29.39 0.89 20.90 0.91 14.60 0.81 31.04 0.94 10.16 0.95 0.92

LAQM Annual Status Report 2018 89
Table C.4B – Summary of AURN period corrections (Annualisation, HCC Schools Monitoring)
Brighton Preston Park (UKA00483; Urban B/G)
Reading New Town(UKA00462;
Urban B/G)
Portsmouth (UKA00421; Urban B/G)
Bournemouth (UKA00429; Urban B/G)
Southampton Centre
(UKA00235; Urban B/G)
Chilbolton Observatory (UKA00614); Rural B/G)
Notes
On Off B1
Capture (%)
B2 Capture
(%) B3
Capture (%)
B4 Capture
(%) B5
Capture (%)
B6 Capture
(%)
Annual 01/01/2018 09/01/2019 16.54 99.10% 26.07 99.22% 18.89 99.51% 11.75 96.18% 29.05 94.67% 9.58 98.56% Trosnant Feb 29/01/2018 26/02/2018 19.18 96.28% 35.39 99.85% 25.97 95.39% 14.82 99.70% 32.78 97.47% 13.97 100.00%
[None]
Trosnant Mar 26/02/2018 26/03/2018 18.66 99.85% 33.84 99.85% 22.45 99.85% 12.44 81.99% 32.43 96.43% 12.44 99.85%
Bosmere Feb 01/02/2018 06/03/2018 19.17 98.53% 36.54 100.00% 26.61 96.20% 14.61 85.05% 32.82 95.10% 14.89 99.88%
Bosmere Mar 06/03/2018 26/03/2018 18.07 99.79% 31.57 99.79% 20.16 99.79% 12.34 99.79% 31.66 99.79% 10.61 100.00%
Hart Feb 31/01/2018 06/03/2018 19.17 98.53% 36.54 100.00% 26.61 96.20% 14.61 85.05% 32.82 95.10% 14.89 99.88%
Hart Mar 06/03/2018 26/03/2018 18.07 99.79% 31.57 99.79% 20.16 99.79% 12.34 99.79% 31.66 99.79% 10.61 100.00%
Barncroft Feb 09/02/2018 06/03/2018 18.80 99.67% 36.42 100.00% 25.04 94.83% 13.76 79.67% 33.07 93.33% 15.48 99.83%
Barncroft Mar 06/03/2018 26/03/2018 18.07 99.79% 31.57 99.79% 20.16 99.79% 12.34 99.79% 31.66 99.79% 10.61 100.00%
St. Peters Nov 29/10/2018 05/12/2018 16.71 99.83% 28.29 99.83% 20.60 100.00% 13.91 100.00% 30.56 99.83% 10.82 99.83%
St. Peters Dec 05/12/2018 07/01/2019 20.17 100.00% 31.40 99.81% 21.72 100.00% 15.95 100.00% 32.69 99.61% 8.36 99.61%
Mengham Nov 31/10/2018 05/12/2018 16.46 99.82% 28.16 99.91% 20.30 100.00% 13.51 100.00% 30.26 99.82% 10.75 99.82%
Mengham Dec 05/12/2018 09/01/2019 20.50 100.00% 31.07 99.47% 22.05 100.00% 16.20 100.00% 32.48 99.65% 8.64 98.94%
Period (see Table C.2)
Pm Am/Pm (Ratio)
Pm Am/Pm (Ratio)
Pm Am/Pm (Ratio)
Pm Am/Pm (Ratio)
Pm Am/Pm (Ratio)
Pm Am/Pm (Ratio)
Av. Am/Pm Ratio (Excluding Rejected)
Period 9 17.06 0.98 26.67 0.98 19.55 0.97 12.15 0.97 29.56 0.98 9.51 1.01 0.98
Period 10 18.23 0.92 33.25 0.78 22.63 0.84 13.25 0.89 32.74 0.89 12.56 0.77 0.85
Period 11 17.20 0.97 26.75 0.97 19.53 0.97 11.98 0.99 29.49 0.99 9.34 1.03 0.99
Period 12 16.14 1.03 24.10 1.08 17.43 1.09 11.00 1.07 27.96 1.04 8.34 1.16 1.08
Period 13 16.54 1.01 24.29 1.07 18.20 1.04 11.58 1.02 28.37 1.02 8.47 1.14 1.05
Period 14 17.33 0.96 27.39 0.95 19.93 0.95 12.46 0.95 29.95 0.97 9.88 0.97 0.96

LAQM Annual Status Report 2018 90
Table C.5 – NO2 Concentration Estimates at Closest Relevant Exposure (‘Fall-
Off With Distance’ Calculations)
Year D
ista
nc
e
be
twe
en
me
as
ure
me
nt
& K
ER
B
(Me
tres)
Dis
tan
ce
be
twe
en
rec
ep
tor
& K
ER
B
(Me
tres)
Lo
ca
l a
nn
ual
mea
n
ba
ck
gro
un
d N
O2
(mg
/m3)
Me
asu
red
an
nu
al m
ean
NO
2
(co
rre
cte
d, a
nn
ua
lise
d)
(mg
/m3)
pre
dic
ted
an
nu
al
me
an
NO
2 a
t re
ce
pto
r
(mg
/m3
)
[Re
jecte
d E
stim
ate
]
Us
e M
ea
su
red
(M
) o
r U
se
Ca
lcu
late
d (
C )
Notes
Rectory Rd. (2) 2018 11 8.75 20.78 25.815 26.30 C
Havant Rd. Hayling Island (3)
2018 1 1.75 11.82 31.554 29.30 M
New Brighton Rd. Emsworth (4)
2018 2.5 8.7 16.73 21.135 19.80 M See Notes B & C
South St., Havant (5)
2018 1.5 0.9 19.54 20.780 20.90 C
Brockhampton Lane (7B)
2018 8 2.75 19.54 27.017 29.80 C
London Rd. Purbrook (8)
2018 2 1.6 15.66 27.837 28.50 C See Notes B & C
Ramblers Wy. (10)
2018 43.5 28 15.78 21.356 23.40 C
See Note B. Monitor >10m further from kerb
than receptor, treat FOWD result with caution
Xyratex (Langstone Rd.) (12B)
2018 2.75 6.05 20.78 30.468 28.50 C See Note B
Elm Park Rd. (14) 2018 1.75 6.75 19.54 20.298 20.10 M See Note A
Waterlooville Pedestrianised
Precinct (18) 2018 120 120 15.86 20.555 20.56 M See Note A
Langstone Rd. (East) (19B)
2018 1 4.75 20.78 47.705 39.20 C See Note B
Langstone Road (East, Woodbury)
(19C) 2018 3.75 4.75 20.78 34.832 33.90 C See Notes B
Langstone Road (Regents Court)
(19D) 2018 28 7 20.78 26.076 30.60 C
Monitor >10m further from kerb than receptor, treat
FOWD result with caution
Langstone Road East (11A)
2018 2.9 4.75 20.78 33.599 32.00 C
Bosmere Junior (South St., Havant)
(20) 2018 35 19.25 20.78 27.088 29.80 C
See Notes B & C. Monitor >10m further from kerb than receptor, treat
FOWD result with caution
Park Rd. South (Bulbeck Rd.) (22)
2018 2 9 19.54 32.954 28.20 M
Stakes Road Purbrook (25B)
2018 4.5 5.5 16.57 26.823 26.20 C See Notes B & C
Havant Precinct (27) 2018 82 82 19.54 25.186 25.19 M See Note A
Park Road South (West Street) (28)
2018 4.75 2.5 19.54 34.897 37.80 C

LAQM Annual Status Report 2018 91
Table C.5 Cont’d…
Orchard Road (29) 2018 31 17.5 16.94 24.945 27.90 C
See Notes B & C. Monitor >10m further from kerb than receptor, treat FOWD result with caution
St. Peters Square, Emsworth (30)
2018 2.75 2.75 13.76 18.400 18.40 M See Note A
Compton Court Flats (W10)
2018 12.5 12.5 19.54 29.141 29.10 M Measurement at receptor
Dunsbury Way (T1) 2018 10.1 10.5 17.45 22.466 22.40 M Measurement at receptor
The Limes (T2) 2018 17.3 7 20.78 25.255 27.20 M
Measurement at receptor. Result influenced by 3 separate road links. Worst case equiv. dist. Calculated. Monitor >10m further from kerb than receptor, treat FOWD result with caution
Bedhampton Hill (T3) 2018 25.7 16.9 20.58 22.925 23.50 C See Note C
Note A: Sites represent general exposure (Background / Urban / Suburban). Fall-off-with-distance not appropriate as sources are diffuse / non-directional.
Note B: Receptor kerb distances may differ from previous reports. FOWD calculations re-calibrated to the receptor representing worst case exposure on the road segment for which the measurement is considered to be representitive. Equivalent distance from source measured perpendicular to carriageway kerbside. Receptor may be some distance from measurement location where traffic conditions on the road link are considered conceptually equivalent (in terms of traffic volume, flow conditions and local topographic character)
Note C: Calculated Value representitive of "worst case", not "closest", receptor. Measured value, or alternative calculated value may be more appropriate for topographically "nearest" relevant exposure.
Table C.6 – Summary of Laboratory Nitrogen Dioxide Proficiency Results 2014-
2018
Scheme
Rounds [Year] Method^ Z-Statistic* % Error^^ Rating
(S/C/NS)* Max Min Average Max Min Average
R124(1) - R124(4) [2014] GLM7 0.4 0.1 0.2 3.3 0.4 1.3 S
GLM9 0.5 0.1 0.3 4.0 1.1 2.6 S
AIR
-PT
R1(1) - R4(4) [2014] GLM7 0.8 -0.3 0.1 5.9 -2.1 0.4 S
GLM9 0.4 0.0 0.2 2.9 0.0 1.6 S
R6(1) - R10(4) [2015] GLM7 1.2 -0.4 0.1 9.0 -3.3 1.0 S
GLM9 0.7 0.1 0.4 5.3 0.8 3.2 S
R12(1) - R16(4) [2016] GLM7 0.1 -1.2 -0.5 0.9 -9.1 -3.4 S
GLM9 0.7 0.1 0.3 5.1 0.8 2.4 S
R18(1) - R21(4) [2017] GLM7 0.5 -1.3 -0.2 0.0 -0.1 0.0 S
GLM9 1.5 -0.2 0.3 0.1 0.0 0.0 S
R24(1) - R22(4)** [2018] GLM7 0.6 -1.4 -0.2 8.5 -10.1 -1.1 S
GLM9 - - - - - - -
^ - GLM7 = Camspec M550 (UV/Visible Light spectrophotometry); GLM9 = QuAAtro (Continuous flow gas analysis) ^^ - As % Measured Concentration cf. Calibrated Reference Sample (NO2- Nitrite, µg) * - z-Statistic [ z= (Xlab - Xref) / (Xref*0.075)]; Rating cl93-96assified as [z = +/-2.00] S = Satisfactory; [z = > +/-2.00 & < +/-3.00] C =
"Caution"; [z = > +/- 3.00] NS = Not Satisfactory. ** - Reported R(x) numbers not sequential

LAQM Annual Status Report 2018 92
Table C.7 – Laboratory Nitrogen Dioxide Proficiency Results 2014-2018 (Detailed)
GLM7 - Camspec M550 Spectrophotometer GLM 9 – QuAAtro Continuous Flow analyser
Round No. (Month, Yr.) Reference
Value (NO2- ug)
Measured Value
(NO2- ug)
Z-Score*
Rating (S/C/NS)*
Error^^ (%)
Reference Value
(NO2- ug)
Measured Value
(NO2- ug)
Z-Score*
Rating (S/C/NS)*
Error^^ (%)
WA
SP
R124 (1-4) (February, 2014)
0.9 0.91 0.15 S 1.1 0.9 0.91 0.1 S 1.1
2.24 2.25 0.06 S 0.4 2.24 2.31 0.4 S 3.1
2.24 2.25 0.06 S 0.4 2.24 2.33 0.5 S 4.0
0.9 0.93 0.44 S 3.3 0.9 0.92 0.3 S 2.2
AIR
-PT
R1 (1-4) (May, 2014)
1.39 1.44 0.48 S 3.6 1.39 1.43 0.4 S 2.9
1.36 1.44 0.78 S 5.9 1.36 1.4 0.4 S 2.9
0.97 0.95 -0.27 S -2.1 0.97 0.98 0.1 S 1.0
0.99 0.97 -0.27 S -2.0 0.99 0.99 0.0 S 0.0
R3 (1-4) (August, 2014)
1.84 1.84 0.00 S 0.0 1.84 1.87 0.2 S 1.6
1.71 1.71 0.00 S 0.0 1.71 1.72 0.1 S 0.6
1.66 1.65 -0.08 S -0.6 1.66 1.69 0.2 S 1.8
1.83 1.87 0.29 S 2.2 1.83 1.88 0.4 S 2.7
R4 (1-4) (November, 2014)
2 1.99 -0.07 S -0.5 2 2.05 0.3 S 2.5
1.98 1.95 -0.20 S -1.5 1.98 2.01 0.2 S 1.5
1.15 1.15 0.00 S 0.0 1.15 1.16 0.1 S 0.9
1.14 1.14 0.00 S 0.0 1.14 1.15 0.1 S 0.9
AIR
-PT
R6 (1-4) (February, 2015)
0.88 0.9 0.30 S 2.3 0.88 0.91 0.5 S 3.4
2.02 2.09 0.46 S 3.5 2.02 2.12 0.7 S 5.0
0.89 0.97 1.20 S 9.0 0.89 0.9 0.1 S 1.1
2.09 2.09 0.00 S 0.0 2.09 2.12 0.2 S 1.4
R7 (1-4) (May, 2015)
1.3 1.29 -0.10 S -0.8 1.3 1.34 0.4 S 3.1
0.96 0.98 0.28 S 2.1 0.96 0.99 0.4 S 3.1
0.96 0.98 0.28 S 2.1 0.96 0.99 0.4 S 3.1
1.3 1.29 -0.10 S -0.8 1.3 1.31 0.1 S 0.8
R9 (1-4) (August, 2015)
1.5 1.54 0.36 S 2.7 1.5 1.58 0.7 S 5.3
1.26 1.27 0.11 S 0.8 1.26 1.29 0.3 S 2.4
1.49 1.52 0.27 S 2.0 1.49 1.55 0.5 S 4.0
1.25 1.24 -0.11 S -0.8 1.25 1.29 0.4 S 3.2

LAQM Annual Status Report 2018 93
Table C.7 Cont’d…
AIR
-PT
R10 (1-4) (November, 2015)
1.91 1.89 -0.14 S -1.0 1.91 2.01 0.7 S 5.2
2.09 2.02 -0.45 S -3.3 2.09 2.17 0.5 S 3.8
2.1 2.05 -0.32 S -2.4 2.1 2.17 0.4 S 3.3
1.92 1.92 0.00 S 0.0 1.92 1.98 0.4 S 3.1
AIR
-PT
R12 (1-4) (February, 2016)
0.97 0.95 -0.27 S -2.1 0.97 0.98 0.14 S 1.03
0.98 0.94 -0.54 S -4.1 0.98 1 0.27 S 2.04
1.58 1.55 -0.25 S -1.9 1.58 1.66 0.68 S 5.06
1.57 1.53 -0.34 S -2.5 1.57 1.64 0.59 S 4.46
R13 (1-4) (May, 2016)
1.72 1.67 -0.39 S -2.9 1.72 1.76 0.31 S 2.33
1.17 1.11 -0.68 S -5.1 1.17 1.19 0.23 S 1.71
1.19 1.14 -0.56 S -4.2 1.19 1.2 0.11 S 0.84
1.73 1.63 -0.77 S -5.8 1.73 1.78 0.39 S 2.89
R15 (1-4) (August, 2016)
0.89 0.86 -0.45 S -3.4 0.89 0.9 0.15 S 1.12
1.32 1.2 -1.21 S -9.1 1.32 1.37 0.51 S 3.79
0.89 0.83 -0.90 S -6.7 0.89 0.9 0.15 S 1.12
1.32 1.2 -1.21 S -9.1 1.32 1.36 0.40 S 3.03
R16 (1-4) (October, 2016)
2.03 2.04 0.07 S 0.5 2.03 2.07 0.26 S 1.97
2.28 2.3 0.12 S 0.9 2.28 2.31 0.18 S 1.32
2.24 2.26 0.12 S 0.9 2.24 2.33 0.54 S 4.02
2.05 2.05 0.00 S 0.0 2.05 2.1 0.33 S 2.44
AIR
-PT
R18 (1-4) (February, 2017)
0.87 0.88 0.15 S 0.0 0.87 0.86 -0.15 S -0.01
1.13 1.12 -0.12 S 0.0 1.13 1.12 -0.12 S -0.01
1.14 1.11 -0.35 S 0.0 1.14 1.13 -0.12 S -0.01
0.88 0.87 -0.15 S 0.0 0.88 0.87 -0.15 S -0.01
R19 (1-4) (May, 2017)
0.55 0.57 0.49 S 0.0 0.55 0.61 1.46 S 0.11
0.56 0.58 0.48 S 0.0 0.56 0.61 1.19 S 0.09
1.15 1.18 0.35 S 0.0 1.15 1.2 0.58 S 0.04
1.13 1.16 0.34 S 0.0 1.13 1.21 0.90 S 0.07
R20 (1-4) (August, 2017)
1.55 1.49 -0.49 S 0.0 1.55 1.6 0.41 S 0.03
2.02 1.9 -0.79 S -0.1 2.02 2.09 0.46 S 0.04
2.04 1.83 -1.28 S -0.1 2.04 2.07 0.18 S 0.02
1.57 1.41 -1.29 S -0.1 1.57 1.62 0.40 S 0.03
R21 (1-4) (October, 2017)
0.92 0.91 -0.14 S 0.0 0.92 0.91 -0.14 S -0.01
0.91 0.9 -0.15 S 0.0 0.91 0.91 0.00 S 0.00
1.02 1.02 0.00 S 0.0 1.02 1.02 0.00 S 0.00
1.01 1.01 0.00 S 0.0 1.01 1.01 0.00 S 0.00

LAQM Annual Status Report 2018 94
Table C.7 Cont’d…
AIR
-PT
R24 (1-4) (February, 2018)
2.09 1.94 -0.91 S -7.2 - - - - -
1.63 1.64 0.08 S 0.6 - - - - -
1.63 1.63 0.00 S 0.0 - - - - -
2.05 1.94 -0.72 S -5.4 - - - - -
R25 (1-4) (May, 2018)
1.02 1.05 0.39 S 2.9 - - - - -
1.02 1.04 0.26 S 2.0 - - - - -
1.47 1.45 -0.09 S -1.4 - - - - -
1.5 1.45 -0.44 S -3.3 - - - - -
R27 (1-4) (August, 2018)
1.21 1.21 0.00 S 0.0 - - - - -
1.22 1.13 -0.99 S -7.4 - - - - -
1.99 1.94 -0.34 S -2.5 - - - - -
1.98 2.07 0.60 S 4.5 - - - - -
R22 (1-4) (October, 2018)
2.47 2.22 -1.35 S -10.1 - - - - -
2.51 2.56 0.27 S 2.0 - - - - -
1.41 1.53 0.18 S 8.5 - - - - -
1.5 1.49 -0.10 S -0.7 - - - - -
^ - GLM7 = Camspec M550 (UV/Visible Light spectrophotometry); GLM9 = QuAAtro (Continuous flow gas analysis) ^^ - As % Measured Concentration cf. Calibrated Reference Sample (NO2- Nitrite, µg)
* - z-Statistic [ z= (Xlab - Xref) / (Xref*0.075)]; Rating classified as [z = +/-2.00] S = Satisfactory; [z = > +/-2.00 & < +/-3.00] C = "Caution"; [z = > +/- 3.00] NS = Not Satisfactory.

LAQM Annual Status Report 2018 95
Table C.8 – Summary of Field Intercomparison results 2014-2018 (Gradko, 20% TEA in Water); by exposure site
classification
Location Type
Year No. of Studies
Max Reference Concentration
(ug/m3)
Max. Positive
Bias (%*)
Max. Negative
Bias (% *)
Studies reporting
positive bias*
No. [%]
Studies reporting
negative bias*
No. [%]
Average Reported Bias (%)*
Average Bias
Correction (Factor)^
All Studies Bias
Correction (Factor)^^
Average Site Type
Performance**
All Types (Aggregate)
2014 22 80.25 42.77% -12.61% 16 [73 %] 6 [27 %] 9.72% 0.92 0.92
- 2015 30 81.04 48.62% -8.99% 24 [80%] 6 [20 %] 14.98% 0.88 0.88
2016 21 79.28 25.17% -22.01% 15 [71%] 6 [29%] 6.48% 0.95 0.95
2017 39 78.70 59.25% -7.86% 32 [85%] 7 [15%] 14.26% 0.89 0.87
2018 30 85.06 32.10% -17.47% 24 [80%] 6 [20%] 8.30% 0.93 0.93
Background
2014 0 - - - - - - - 0.92
Poor 2015 1 2.70 36.73% - 1 [100 %] - 36.73% 0.73 0.88
2016 1 29.92 2.30% - 1 [100 %] - 2.30% 0.98 0.95
2017 2 33.33 14.88% -6.04% 1 [50 %] 1 [50 %] 4.42% 0.97 0.87
2018 0 - - - - - - - 0.93
Urban Centre
2014 2 31.63 5.59% - 1 [50 %] 1 [50 %] 4.53% 0.96 2014
Poor 2015 2 29.39 1.45% -3.52% 1 [50 %] 1 [50 %] -1.03% 1.01 2015
2016 0 - - - - - - - 2016
2017 2 25.04 27.50% - 2 [100%] 0 [0%] 16.41% 0.87 2017
2018 0 - - - - - - - 2018
Urban Background
2014 2 37.13 11.17% -3.97% 1 [50 %] 1 [50 %] 3.60% 0.97 2014
Excellent 2015 2 22.30 20.93% -8.99% 1 [50 %] 1 [50 %] 5.97% 0.96 2015
2016 2 30.05 18.61% -4.66% 1 [50 %] 1 [50 %] 6.97% 0.95 2016
2017 4 27.81 26.62% - 4 [100%] 0 [0 %] 18.22% 0.85 2017
2018 3 28.33 26.80% -4.40% 2% [66%] 1 [33%] 10.53% 0.92 2018
Roadside
2014 17 59.63 37.74% -12.61% 12 [71 %] 5 [29 %] 9.11% 0.93 2014
Good
2015 23 53.67 48.62% -5.89% 19 [83 %] 4 [17 %] 15.02% 0.88 2015
2016 17 54.46 18.98% -22.01% 12 [71 %] 5 [29 %] 5.57% 0.96 2016
2017 29 53.53 59.25% -7.86% 24 [83%] 5 [17 %] 14.28% 0.89 2017
2018 26 52.01 32.10% -17.47% 21 [81%] 5 [19%] 9.33% 0.94 2018
Kerbside
2014 1 80.25 42.77% - 1 [100 %] 0 [0 %] 42.77% 0.70 2014
Excellent 2015 1 81.04 31.11% - 1 [100 %] 0 [0 %] 28.64% 0.78 2015
2016 1 79.28 25.17% - 1 [100 %] 0 [0 %] 25.17% 0.80 2016
2017 1 78.70 28.62% - 1 [100 %] 0 [0 %] 28.62% 0.78 2017
2018 1 85.06 9.33% 9.33% 1 [100 %] 0 [0 %] 9.33% 0.91 2018
'* - as compared with reference value, derived from local automatic chemiluminescent monitor where data capture for period exceeds 75% (a). Negative figures indicate an under-estimate, positive figures indicate an over-estimate. '** - (against All-Studies factor), Excellent = +/- (<)2.5%, Good -= +/- (>2.5-)5%, Poor +/- >5%. '^ - calculated arithmetically from reported values. May be subject to marginal rounding error. '^^ - accuracy with 95% CI, by orthogonal regression (b). '(a) Study average for Local authority field intercomparisons, by tube for Gradko (Laboratory) field intercomparisons. '(b) as reported National Diffusion Tube Bias Adjustment Factor Spreadsheet v09/15 for Local authority field intercomparisons, as reported by Gradko for Laboratory field intercomparisons.
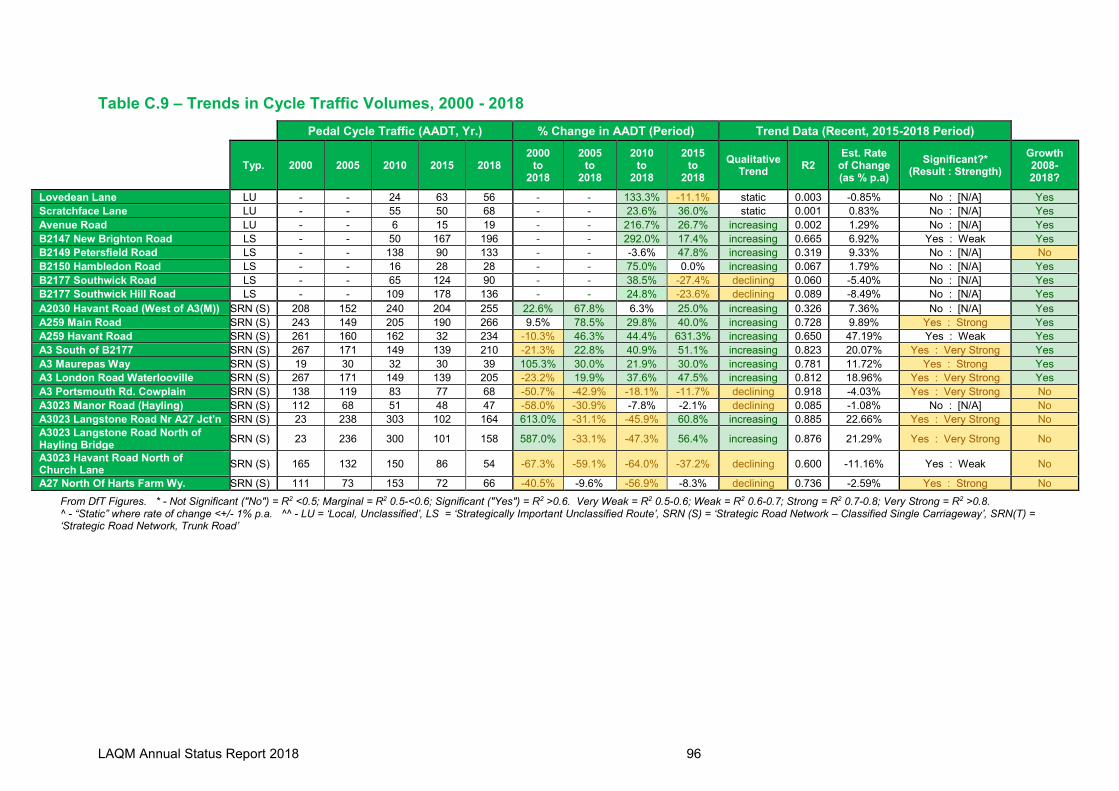
LAQM Annual Status Report 2018 96
Table C.9 – Trends in Cycle Traffic Volumes, 2000 - 2018
Pedal Cycle Traffic (AADT, Yr.) % Change in AADT (Period) Trend Data (Recent, 2015-2018 Period)
Typ. 2000 2005 2010 2015 2018 2000
to 2018
2005 to
2018
2010 to
2018
2015 to
2018
Qualitative Trend
R2 Est. Rate
of Change (as % p.a)
Significant?* (Result : Strength)
Growth 2008-2018?
Lovedean Lane LU - - 24 63 56 - - 133.3% -11.1% static 0.003 -0.85% No : [N/A] Yes
Scratchface Lane LU - - 55 50 68 - - 23.6% 36.0% static 0.001 0.83% No : [N/A] Yes
Avenue Road LU - - 6 15 19 - - 216.7% 26.7% increasing 0.002 1.29% No : [N/A] Yes
B2147 New Brighton Road LS - - 50 167 196 - - 292.0% 17.4% increasing 0.665 6.92% Yes : Weak Yes
B2149 Petersfield Road LS - - 138 90 133 - - -3.6% 47.8% increasing 0.319 9.33% No : [N/A] No
B2150 Hambledon Road LS - - 16 28 28 - - 75.0% 0.0% increasing 0.067 1.79% No : [N/A] Yes
B2177 Southwick Road LS - - 65 124 90 - - 38.5% -27.4% declining 0.060 -5.40% No : [N/A] Yes
B2177 Southwick Hill Road LS - - 109 178 136 - - 24.8% -23.6% declining 0.089 -8.49% No : [N/A] Yes
A2030 Havant Road (West of A3(M)) SRN (S) 208 152 240 204 255 22.6% 67.8% 6.3% 25.0% increasing 0.326 7.36% No : [N/A] Yes
A259 Main Road SRN (S) 243 149 205 190 266 9.5% 78.5% 29.8% 40.0% increasing 0.728 9.89% Yes : Strong Yes
A259 Havant Road SRN (S) 261 160 162 32 234 -10.3% 46.3% 44.4% 631.3% increasing 0.650 47.19% Yes : Weak Yes
A3 South of B2177 SRN (S) 267 171 149 139 210 -21.3% 22.8% 40.9% 51.1% increasing 0.823 20.07% Yes : Very Strong Yes
A3 Maurepas Way SRN (S) 19 30 32 30 39 105.3% 30.0% 21.9% 30.0% increasing 0.781 11.72% Yes : Strong Yes
A3 London Road Waterlooville SRN (S) 267 171 149 139 205 -23.2% 19.9% 37.6% 47.5% increasing 0.812 18.96% Yes : Very Strong Yes
A3 Portsmouth Rd. Cowplain SRN (S) 138 119 83 77 68 -50.7% -42.9% -18.1% -11.7% declining 0.918 -4.03% Yes : Very Strong No
A3023 Manor Road (Hayling) SRN (S) 112 68 51 48 47 -58.0% -30.9% -7.8% -2.1% declining 0.085 -1.08% No : [N/A] No
A3023 Langstone Road Nr A27 Jct'n SRN (S) 23 238 303 102 164 613.0% -31.1% -45.9% 60.8% increasing 0.885 22.66% Yes : Very Strong No
A3023 Langstone Road North of Hayling Bridge
SRN (S) 23 236 300 101 158 587.0% -33.1% -47.3% 56.4% increasing 0.876 21.29% Yes : Very Strong No
A3023 Havant Road North of Church Lane
SRN (S) 165 132 150 86 54 -67.3% -59.1% -64.0% -37.2% declining 0.600 -11.16% Yes : Weak No
A27 North Of Harts Farm Wy. SRN (S) 111 73 153 72 66 -40.5% -9.6% -56.9% -8.3% declining 0.736 -2.59% Yes : Strong No
From DfT Figures. * - Not Significant ("No") = R2 <0.5; Marginal = R2 0.5-<0.6; Significant ("Yes") = R2 >0.6. Very Weak = R2 0.5-0.6; Weak = R2 0.6-0.7; Strong = R2 0.7-0.8; Very Strong = R2 >0.8. ^ - “Static” where rate of change <+/- 1% p.a. ^^ - LU = ‘Local, Unclassified’, LS = ‘Strategically Important Unclassified Route’, SRN (S) = ‘Strategic Road Network – Classified Single Carriageway’, SRN(T) = ‘Strategic Road Network, Trunk Road’

LAQM Annual Status Report 2018 97
Table C.10 – Trends in HGV Traffic Volumes, 2000 - 2018
HGV Traffic (AADT, Yr) % Change in HGV Flow (Period) Trend Data (Recent, 2015-2018 Period)
Typ. 2000 2005 2010 2015 2018 2000
to 2018
2005 to
2018
2010 to
2018
2015 to
2018
Qualitative Trend
R2 Est. Rate
of Change (as % p.a)
Significant?* (Result : Strength)
HGV Growth 2008-2018?
Lovedean Lane LU - - 23 59 37 - - 60.9% -37.3% declining 0.267 -12.07% No : [N/A] No
Scratchface Lane LU - - 7 8 4 - - -42.9% -50.0% declining 0.455 -15.79% No : [N/A] Yes
B2147 New Brighton Road LS - - 25 49 27 - - 8.0% -44.9% declining 0.665 -18.64% Yes : Weak No
B2149 Petersfield Road LS - - 402 558 322 - - -19.9% -42.3% declining 0.763 -13.95% Yes : Strong No
B2150 Hambledon Road LS - - 42 57 49 - - 16.7% -14.0% declining 0.498 -4.31% Yes : Very Strong No
B2177 Southwick Road LS - - 121 112 123 - - 1.7% 9.8% increasing 0.194 4.53% No : [N/A] No
B2177 Southwick Hill Road LS - - 48 35 34 - - -29.2% -2.9% increasing 0.053 3.33% No : [N/A] No
A2030 Havant Road (West of A3(M)) SRN (S) 605 1210 731 999 415 -31.4% -65.7% -43.2% -58.5% declining 0.572 -17.34% Yes : Weak No
A259 Main Road SRN (S) 345 412 350 384 249 -27.8% -39.6% -28.9% -35.2% declining 0.582 -12.79% Marginal : Very Weak No
A259 Havant Road SRN (S) 683 764 587 452 264 -61.3% -65.4% -55.0% -41.6% declining 0.587 -15.79% Marginal : Very Weak No
A3 South of B2177 SRN (S) 353 310 147 163 172 -51.3% -44.5% 17.0% 5.5% increasing 0.898 1.94% No : [N/A] Yes
A3 Maurepas Way SRN (S) 499 552 450 413 476 -4.6% -13.8% 5.8% 15.3% increasing 0.845 5.91% Yes : Strong No
A3 London Road Waterlooville SRN (S) 353 310 147 163 172 -51.3% -44.5% 17.0% 5.5% increasing 0.898 1.94% No : [N/A] Yes
A3 Portsmouth Rd. Cowplain SRN (S) 195 153 133 146 72 -63.1% -52.9% -45.9% -50.7% declining 0.579 -15.10% Yes : Weak No
A3023 Manor Road (Hayling) SRN (S) 156 189 159 172 105 -32.7% -44.4% -34.0% -39.0% declining 0.588 -14.49% Marginal : Very Weak No
A3023 Langstone Road Nr A27 Jct'n SRN (S) 614 421 566 517 331 -46.1% -21.4% -41.5% -36.0% declining 0.732 -14.58% Yes : Strong No
A3023 Langstone Road North of Hayling Bridge
SRN (S) 608 416 563 512 327 -46.2% -21.4% -41.9% -36.1% declining 0.733 -14.62% Yes : Strong No
A3023 Havant Road North of Church Lane
SRN (S) 378 430 416 467 308 -18.5% -28.4% -26.0% -34.0% declining 0.482 -9.81% Marginal : Very Weak No
A27 North Of Harts Farm Wy. SRN (S) 927 998 756 919 988 6.6% -1.0% 30.7% 7.5% increasing 0.996 2.52% Yes : Very Strong Yes
A27 East of Emsworth Junction SRN (T) 2936 3138 2445 2623 2833 -3.5% -9.7% 15.9% 8.0% increasing 0.891 2.72% Yes : Strong Yes
A27 East of Havant Jct'n SRN (T) 3011 3284 2856 2355 3070 2.0% -6.5% 7.5% 30.4% increasing 0.866 11.48% Yes : Strong Yes
A27 West of Havant Jct'n SRN (T) 3734 4014 2718 3002 3117 -16.5% -22.3% 14.7% 3.8% increasing 0.647 1.04% Yes : Very Strong No
A27 at A3(M) J5 SRN (T) 831 3442 2658 2961 2955 255.6% -14.1% 11.2% -0.2% static 0.068 -0.51% Yes : Very Strong No
A27 WB Offslip at A3(M) SRN (T) - - - 616 413 - - - -33.0% declining 0.524 -11.79% Yes : Very Strong ND
A27 EB Onslip at A3(M) SRN (T) - - - 189 401 - - - 112.2% increasing 0.828 26.48% No : [N/A] ND
A27 WB Onslip from A2030 SRN (T) - - - 310 304 - - - -1.9% declining 0.243 -1.45% Yes : Very Strong ND
A27 West of A3(M) SRN (T) 5637 6448 5164 6190 5629 -0.1% -12.7% 9.0% -9.1% declining 0.578 -4.11% Yes : Strong Yes
A3(M) North of J2 SRN (T) 2264 2328 2245 2299 2607 15.2% 12.0% 16.1% 13.4% increasing 0.685 3.75% Yes : Very Strong Yes
A3(M) North of J3 SRN (T) 2330 2521 2082 2551 2541 9.1% 0.8% 22.0% -0.4% static 0.083 -0.35% Marginal : Very Weak Yes
A3(M) North of J4 (S of J3) SRN (T) 2862 2756 2449 2779 2770 -3.2% 0.5% 13.1% -0.3% static 0.076 -0.20% No : [N/A] Yes
A3(M) North of J5 SRN (T) 2281 3376 3035 2915 3268 43.3% -3.2% 7.7% 12.1% increasing 0.233 2.52% No : [N/A] Yes
A3(M) South of J5 (A3(M)>A27 Link) SRN (T) 1825 2701 2426 2332 2615 43.3% -3.2% 7.8% 12.1% increasing 0.325 3.49% No : [N/A] Yes
From DfT Figures. * - Not Significant ("No") = R2 <0.5; Marginal = R2 0.5-<0.6; Significant ("Yes") = R2 >0.6. Very Weak = R2 0.5-0.6; Weak = R2 0.6-0.7; Strong = R2 0.7-0.8; Very Strong = R2 >0.8. ^ - “Static” where rate of change <+/- 1% p.a. ^^ - LU = ‘Local, Unclassified’, LS = ‘Strategically Important Unclassified Route’, SRN (S) = ‘Strategic Road Network – Classified Single Carriageway’, SRN(T) = ‘Strategic Road Network, Trunk Road’

LAQM Annual Status Report 2018 98
Table C.11 – Trends in Annual Average Daily Traffic (AADT), 2000 - 2018
All Motor Vehicle Traffic (AADT, Yr.) % Change in AADT (Period) Trend Data (Recent, 2015-2018 Period)
Typ. 2000 2005 2010 2015 2018 2000
to 2018
2005 to
2018
2010 to
2018
2015 to
2018
Qualitative Trend
R2 Est. Rate
of Change (as % p.a)
Significant?* (Result : Strength)
Traffic Growth
2008-2018?
Lovedean Lane LU - - 4333 5965 5241 - - 21.0% -12.1% declining 0.479 -3.47% No : [N/A] Yes
Scratchface Lane LU - - 1286 1173 962 - - -25.2% -18.0% declining 0.964 -5.87% Yes : Very Strong No
B2147 New Brighton Road LS - - 5151 6282 6234 - - 21.0% -0.8% static 0.040 -0.28% No : [N/A] Yes
B2149 Petersfield Road LS - - 16877 18714 17259 - - 2.3% -7.8% declining 0.565 -2.30% Marginal : Very Weak No
B2150 Hambledon Road LS - - 3991 2691 3896 - - -2.4% 44.8% increasing 0.907 16.29% Yes : Very Strong Yes
B2177 Southwick Road LS - - 6525 6277 6655 - - 2.0% 6.0% increasing 0.401 2.63% No : [N/A] Yes
B2177 Southwick Hill Road LS - - 6654 6716 6852 - - 3.0% 2.0% static 0.014 0.22% No : [N/A] Yes
A2030 Havant Road (West of A3(M)) SRN (S) 21332 21274 22318 22848 20829 -2.4% -2.1% -6.7% -8.8% declining 0.337 -2.55% No : [N/A] No
A259 Main Road SRN (S) 12898 12466 11858 12530 13884 7.6% 11.4% 17.1% 10.8% increasing 0.553 3.00% Marginal : Very Weak Yes
A259 Havant Road SRN (S) 18704 17923 20306 21519 19493 4.2% 8.8% -4.0% -9.4% declining 0.652 -2.95% Yes : Weak No
A3 South of B2177 SRN (S) 21323 17231 16938 17964 18899 -11.4% 9.7% 11.6% 5.2% increasing 0.807 1.85% Yes : Very Strong Yes
A3 Maurepas Way SRN (S) 36402 29316 28928 29260 30869 -15.2% 5.3% 6.7% 5.5% increasing 0.823 1.99% Yes : Very Strong Yes
A3 London Road Waterlooville SRN (S) 21323 17231 16938 17964 18899 -11.4% 9.7% 11.6% 5.2% increasing 0.807 1.85% Yes : Very Strong Yes
A3 Portsmouth Rd. Cowplain SRN (S) 11003 11118 7438 7836 8490 -22.8% -23.6% 14.1% 8.3% increasing 0.825 2.48% Yes : Very Strong Yes
A3023 Manor Road (Hayling) SRN (S) 5430 5240 7306 7647 5643 3.9% 7.7% -22.8% -26.2% declining 0.615 -9.02% Yes : Weak No
A3023 Langstone Road Nr A27 Jct'n SRN (S) 28075 25645 25630 26343 24424 -13.0% -4.8% -4.7% -7.3% declining 0.700 -3.03% Yes : Strong No
A3023 Langstone Road North of Hayling Bridge
SRN (S) 27798 25391 25379 26082 24182 -13.0% -4.8% -4.7% -7.3% declining 0.835 -2.85% Yes : Very Strong No
A3023 Havant Road North of Church Lane
SRN (S) 17145 19291 18988 19714 18181 6.0% -5.8% -4.3% -7.8% declining 0.353 -2.23% No : [N/A] No
A27 North of Harts Farm Wy. SRN (S) 25026 26534 28012 32167 33583 34.2% 26.6% 19.9% 4.4% increasing 0.849 1.70% Yes : Very Strong Yes
A27 East of Emsworth Junction SRN (T) 38787 46269 44502 51236 49263 27.0% 6.5% 10.7% -3.9% declining 0.115 -1.02% No : [N/A] Yes
A27 East of Havant Jct'n SRN (T) 63543 65148 60087 61003 69911 10.0% 7.3% 16.3% 14.6% increasing 0.906 5.30% Yes : Very Strong Yes
A27 West of Havant Jct'n SRN (T) 71311 80857 80257 79786 78868 10.6% -2.5% -1.7% -1.2% static 0.220 -0.87% No : [N/A] No
A27 at A3(M) J5 SRN (T) 60745 64469 59421 66365 62866 3.5% -2.5% 5.8% -5.3% declining 0.897 -1.93% Yes : Very Strong Yes
A27 WB Offslip at A3(M) SRN (T) - - - 18072 11683 - - - -35.4% declining 0.574 -12.88% Marginal : Very Weak ND
A27 EB Onslip at A3(M) SRN (T) - - - 4199 11128 - - - 165.0% increasing 0.765 32.04% Yes : Strong ND
A27 WB Onslip from A2030 SRN (T) - - - 6430 5958 - - - -7.3% declining 0.733 -3.05% Yes : Strong ND
A27 West of A3(M) SRN (T) 119351 129092 118079 139716 145665 22.0% 12.8% 23.4% 4.3% increasing 0.683 1.24% Yes : Weak Yes
A3(M) North of J2 SRN (T) 39082 43744 43139 54317 56302 44.1% 28.7% 30.5% 3.7% increasing 0.794 1.47% Yes : Strong Yes
A3(M) North of J3 SRN (T) 47518 53613 48464 60559 62941 32.5% 17.4% 29.9% 3.9% increasing 0.472 1.94% No : [N/A] Yes
A3(M) North of J4 (S of J3) SRN (T) 55877 63043 64568 70308 73565 31.7% 16.7% 13.9% 4.6% increasing 0.342 2.73% No : [N/A] Yes
A3(M) North of J5 SRN (T) 68032 84045 78071 94009 91845 35.0% 9.3% 17.6% -2.3% static 0.001 0.09% No : [N/A] Yes
A3(M) South of J5 (A3(M)>A27 Link) SRN (T) 54427 67235 62454 75207 73476 35.0% 9.3% 17.6% -2.3% declining 0.216 -1.67% No : [N/A] Yes
From DfT Figures. * - Not Significant ("No") = R2 <0.5; Marginal = R2 0.5-<0.6; Significant ("Yes") = R2 >0.6. Very Weak = R2 0.5-0.6; Weak = R2 0.6-0.7; Strong = R2 0.7-0.8; Very Strong = R2 >0.8. ^ - “Static” where rate of change <+/- 1% p.a. ^^ - LU = ‘Local, Unclassified’, LS = ‘Strategically Important Unclassified Route’, SRN (S) = ‘Strategic Road Network – Classified Single Carriageway’, SRN(T) = ‘Strategic Road Network, Trunk Road’

LAQM Annual Status Report 2018 99
Appendix D: Map(s) of Monitoring Locations (NO2)
(D.1) A27 / A3023 / B2149 Junction: 2 – Rectory Rd.; 12 – Xyratex; 19(B) – Langstone Rd. East; 19(C) – Woodbury Ave.; 19(D) – Regents Court; 19(E) – Langstone Rd. (11A); T2 – The Limes; 20 – Bosmere Junior School

LAQM Annual Status Report 2018 100
(D.2) A27 Havant Bypass: 29 – Orchard Road
(D.3) A3023 (Hayling Island): 3 – Havant Road

LAQM Annual Status Report 2018 101
(D.4) A27 Havant Bypass: 4 – New Brighton Road
(D.5) Havant Centre (Solent Road Area): 7(B) – Brockhampton Lane

LAQM Annual Status Report 2018 102
(D.6) A3 (Purbrook): 8 – London Road
(D.7) A3(M) Trunk Road (Waterlooville): 10 – Ramblers Way.

LAQM Annual Status Report 2018 103
(D.8) Havant Centre (Civic Campus Area): 14 – Elm Park Road
(D.9) Waterlooville Centre: 18– London Road Precinct (Urban Background)

LAQM Annual Status Report 2018 104
(D.10) Crookhorn: 25 – Stakes Road
(D.11) Havant Centre: 22 – Park Road South (Bulbeck Road), 27 – Havant Precinct (Urban Background), 28 – Park Road South (East)

LAQM Annual Status Report 2018 105
(D.12) Havant Centre B2149 (Civic Campus Area): W10 – Compton Court
(D.13) Emsworth Centre: 30– St. Peters Square (Urban Centre)

LAQM Annual Status Report 2018 106
(D.14) Leigh Park Centre: T1 – Dunsbury Wy
(D.15) Bedhampton, A3(M): T3 – Bedhampton Hill

LAQM Annual Status Report 2018 107
(D.16) East Havant: Emsworth Road (31 – North & 32 – South)

LAQM Annual Status Report 2018 108
Appendix E: Summary of Air Quality Objectives in England
Table E.1 – Air Quality Objectives in England
Pollutant Air Quality Objective77
Concentration Measured as
Nitrogen Dioxide (NO2)
200 µg/m3 not to be exceeded more than 18 times a year
1-hour mean
40 µg/m3 Annual mean
Particulate Matter (PM10)
50 µg/m3, not to be exceeded more than 35 times a year
24-hour mean
40 µg/m3 Annual mean
Sulphur Dioxide (SO2)
350 µg/m3, not to be exceeded more than 24 times a year
1-hour mean
125 µg/m3, not to be exceeded more than 3 times a year
24-hour mean
266 µg/m3, not to be exceeded more than 35 times a year
15-minute mean
77 The units are in microgrammes of pollutant per cubic metre of air (µg/m3).

LAQM Annual Status Report 2018 109
Appendix F: NO2 Passive Diffusion Tube Position Review
The following footnotes apply to table F.1 – F.10
(1) “Within carriageway of road” includes the vehicular running surface, traffic islands, verges and
pedestrian refuges located between carriageways
(2) “Micro-Environment” refers to the physical characteristics in the immediate and general vicinity
of the sample tube. This requirement is generally satisfied where overhanging elements of
buildings, building corners, or trees are not present within 5m of measurement point. Kerbside
monitoring points on roads with a speed limit exceeding 40MPH would generally be regarded
as influenced by a micro-environment due to vehicular turbulence.
(3) “unrestricted arc” would generally apply to the area in the near vicinity of the sample tube inlet
– generally considered to be met where no overhanging obstructions to air flow are present
within 5m. Tube positions on building facades are acceptable where the free arc is at least
180o.
(4) Annex III C defines the requirement to mount a tube >0.5m from the façade of the nearest
building to include measurements aiming to measure air quality at the building façade. This
requirement is consistent with the requirements of SI 1001 2010 (as amended by SI 1184
2016), but conflicts with the DEFREA / AEAT ‘practical guidance’ for diffusion tubes78, which
allows placement on a façade at a minimum distance of 0.1m. Guidance has lesser status
than the legislative provisions, as the guidance hasn’t been withdrawn following 2016
amendment, would suggest that in practice ‘caution is appropriate’ where >500mm cannot be
achieved, rather than the use of such monitoring positions being considered entirely
inappropriate.
(5) Busy junction would generally be taken to mean a junction carrying > 25,000 vehicles on an
AADT basis, or a junction carrying less traffic which is subject to heavy congestion at peak
periods. A ‘Junction’ refers to any feature where traffic flow is interrupted and emissions (due
to vehicles stopping and starting) differ from sections of the road characterised by free-flowing
traffic. Busy road is generally taken to mean a road carrying > 10,000 AADT on an AADT
basis, or a road subject to heavy congestion at peak periods
(6) Urban Background / Urban Centre sites are listed as 0m to nearest receptor, as the
measurement is targeting general ambient concentrations. Generally, the annual objective
does not directly apply at these locations, and at or exceeding the 40µg/m3 limit may not be
regarded as an indication that an AQMA is necessary (without further consideration)
78 Diffusion Tubes for Ambient NO2 Monitoring: Practical Guidance, Ref ED48673043 Iss. 1a, DEFRA, 2008,

LAQM Annual Status Report 2018 110
Table F.1 Location 19(B)
Requirement Ref: Met? Assessment Notes
Site Type (as reported in ASR2017) - - Kerbside
Monitoring Target - - Worst Case Residential Exposure East Side of Langstone Road,
Close Havant Bypass Junction, known congested route, key transport link to H.I
Distance from Kerb - - 1.0m
Distance to Relevant Receptor - - 7.0m
Equivalent distance to Relevant Receptor - 7.0m
Period of Available Data - - 24 months
Public access to monitoring location, or at location of fixed habitation
Annex III A.2 (a)
Yes Members of the public have access, footpath on route to town centre footway link. Adjacent public Bus Stop, residential property adjacent.
Not a location where Health & Safety at Work provisions apply
Annex III A.2 (b)
Yes As above.
Location is not within road carriageway(1) Annex III A.2 (c)
Yes Within the limits of the highway, but not within the vehicular running surface.
Area where highest concentrations occur, where the population is likely to be exposed over an averaging period applicable to the air quality standard.
Annex III B.1 (a)
Proxy
Location is positioned where highest concentrations are likely to occur, but the measurement method is not capable of sufficient resolution for application to an averaging period relevant to the public exposure at the point of point of measurement. Point of estimation does comply with this requirement.
Area representative of exposure of the general population
No See notes below
Sampling location avoids 'micro-environment'(2), and is representative of a street segment of at least 100m
Annex III B.1 (b)
No
Unlikely to represent a micro-environment owing to the width of the road, height / massing / building line of property fronting London Road. Positioned 'downstream' of junction with respect to NB traffic, and at the foot of an inclined section of the A3. May be subject to locally elevated levels due to acceleration away from junction (Local Source). Tube overhung by trees, though substantially taller canopy than the lamp column. Proximity to junction limits direct representativeness to other locations.
Sampling location representative of similar locations not in the immediate vicinity
Annex III B.1 (f)
No
Unclear. With reference to the notes above, and to previous results from locations 19(A), and 2016 results from locations 1(B) & 12(B) (both taken from within 150m of location 19(B), on the same road); it would appear that there is a specific local influence upon 19(B), and it is therefore unlikely to represent similar locations at an equivalent distance from the carriageway.
Tube positioned with min. 270o unrestricted arc free of obstructions that might affect air flow(3)
Annex III C
Yes Tube is located on a free-standing pole, held 100mm from the pole surface.
Tube mounted >0.5m from nearest building(4)
Yes
Tube height between 1.5m & 4.0m Yes Tube located at 2.55m height from the footpath surface.
Tube position avoids local point sources No
Unclear. It is possible that location 19(B) is located in a position that directly sample emissions from idling busses serving the stop to which it is adjacent, without adequate mixing with the air so as to be regarded as being representative of 'ambient' air (to which the NAQS objectives apply).
Tube position at least 25m from busy junction(5) , no more than 10m from the line of free-flowing traffic on a busy road
Yes Located ~70m from A2149/A3023/A27 junction give-way lines
Trend Assessment - -
2014 position change has resulted in substantially & materially elevated average concentrations. Short available monitoring
history at present location, no specific value for assessment of long term trends.
Other - -
Objectively reassessed Classification - - Kerbside

LAQM Annual Status Report 2018 111
Table F.2 Location 19 (C) - Langstone Rd. East
Requirement Ref: Met? Assessment Notes
Site Type - - Roadside
Monitoring Target - -
Worst Case Residential Exposure East Side of Langstone Road, Close Havant Bypass Junction, known congested route, key transport link to H.I; Ensuring that results can be regarded as representative of ambient, and nearest residential receptors.
Distance from Kerb - - 3.75m
Tube Height 2.5m
Distance to Relevant Receptor - - 21.0m
Equivalent distance to Relevant Receptor - 3.75m
Period of Available Data - - N/A
Public access to monitoring location, or at location of fixed habitation
Annex III A.2 (a)
Yes Members of the public have access, footpath on route to town centre footway link. Adjacent public Bus Stop, residential property adjacent.
Not a location where Health & Safety at Work provisions apply
Annex III A.2 (b)
Yes As above.
Location is not within road carriageway(1) Annex
III A.2 (c) Yes
Within the limits of the highway, but not within the vehicular running surface.
Area where highest concentrations occur, where the population is likely to be exposed over an averaging period applicable to the air quality standard.
Annex III B.1 (a)
Proxy
Location to be positioned as close as reasonably practicable to a busy road junction (exceeding at the kerbside) and for measurement to be considered representative of ambient. Not within building line, so not directly representative of annual mean exposures at relevant locations. Measurement method not capable of sufficient resolution for application to an averaging period relevant to the public exposure at the point of point of measurement (i.e. hourly). Relevant to target receptor(s) by estimation only. Suitable for comparison to hourly objective by benchmarking only.
Area representative of exposure of the general population
Yes Interpreting 'general population' to mean 'residents of Regents Court & Woodbury Avenue)
Sampling location avoids 'micro-environment'(2), and is representative of a street segment of at least 100m
Annex III B.1 (b)
Yes
Closest Mature Tree @ approx. 5m. Sample located at mid-point between kerbside (carriageway running surface) and building line, adjacent to a minor junction. SB RH turn obstruction is possible at Xyratex / Havant International access road, but this represents the furthest one of 3 SB lanes on this segment of the A3023. Sample located 40 from merging zone (remaining two SB lanes combining to one). Free flowing conditions anticipated on Langstone Road at monitoring point.
Sampling location representative of similar locations not in the immediate vicinity
Annex III B.1 (f)
Yes At an equivalent distance from the East side of the A3023 carriageway; should be broadly representative of >1km segment, broadly from A27 junction to Langstone Bridge.
Tube positioned with min. 270o unrestricted arc free of obstructions that might affect air flow(3)
Annex III C
Yes Tube to be located on a free-standing pole, held 100mm from the pole surface.
Tube mounted >0.5m from nearest building(4)
Yes 21m from nearest building.
Tube position between 1.5m & 4.0m height
Yes Tube to be located at approximately 2.5m height from the footpath surface.
Tube position avoids local point sources Yes Deceleration zone for SB LH turn. WB traffic exiting Woodbury & waiting at give way will be located approx. 10m from monitor. Nearest residential building ~20m.
Tube position at least 25m from busy junction(5), no more than 10m from the line of free-flowing traffic on a busy road(5)
Yes Located ~130m from A2149/A3023/A27 junction give-way lines
Trend Assessment - - N/A
Other - - N/A

LAQM Annual Status Report 2018 112
Table F.3 Location 19(D) - Langstone Road East (Regents Court)
Requirement Ref: Met? Assessment Notes
Site Type - - Suburban
Monitoring Target - -
Receptors at no's 8-11 Regents Court. For practical reasons, positioned at the front, and not at the rear façade (no rear access). Local sources prevented positioning on front building façade. One
of several positions monitored concurrently in order to identify a location that can be regarded as 'most representitive' of ambient
AQ at this location
Distance from Kerb - - 28.0m [0m]
Tube Height 2.5m
Distance to Relevant Receptor - - 9.75m
Equivalent distance to Relevant Receptor - -21.0m
Period of Available Data - - N/A
Public access to monitoring location, or at location of fixed habitation
Annex III A.2 (a)
Yes Members of the public have access to Regents Court, but being a cul-de-sac, the road serves only residents of no's. 5-11
Not a location where Health & Safety at Work provisions apply
Annex III A.2 (b)
Yes As above.
Location is not within road carriageway(1) Annex
III A.2 (c) Yes
Prevented from placing on residential road. On shared surface, but vehicular movements <50 AADT, so disregarded.
Area where highest concentrations occur, where the population is likely to be exposed over an averaging period applicable to the air quality standard.
Annex III B.1 (a)
No
Position likely to be available only for property frontage to Regents Court, Elevated concentrations to rear façade might be anticipated. Relevant to rear façade by estimation only. Achieved distance returns 'caution' for estimation tool. As sense check to monitoring @ 19B, this is acceptable. In terms of residential units, this property does represent a worst-case exposure location, though the measurement location does not. Alternative position at the Limes may need to be considered.
Area representative of exposure of the general population
Yes Interpreting 'general population' to mean 'residents of Regents Court & Woodbury Avenue)
Sampling location avoids 'micro-environment'(2), and is representative of a street segment of at least 100m
Annex III B.1 (b)
Yes
Location likely to be sheltered from turbulent conditions. Location should be representitive of suburban exposure at an equivalent distance from the western side of the A3023 over an approximate 1.25km segment (this being at the upper end of concentrations over that segment).
Sampling location representative of similar locations not in the immediate vicinity
Annex III B.1 (f)
Yes As above.
Tube positioned with min. 270o unrestricted arc free of obstructions that might affect air flow(3)
Annex III C
Yes Tube to be mounted on freestanding lamp column, distanced approximately 9m from the building façade.
Tube mounted >0.5m from nearest building(4)
Yes
Tube position between 1.5m & 4.0m height
Yes Tube to be located at approximately 2.5m height from the footpath surface.
Tube position avoids local point sources Yes Position will be rejected if within 5m of boiler flue.
Tube position at least 25m from busy junction(5), no more than 10m from the line of free-flowing traffic on a busy road(5)
Yes approx. 60m from (the SB equivalent) of the give way line to the A27/B2149/A3023 junction
Trend Assessment - - N/A
Other - - N/A
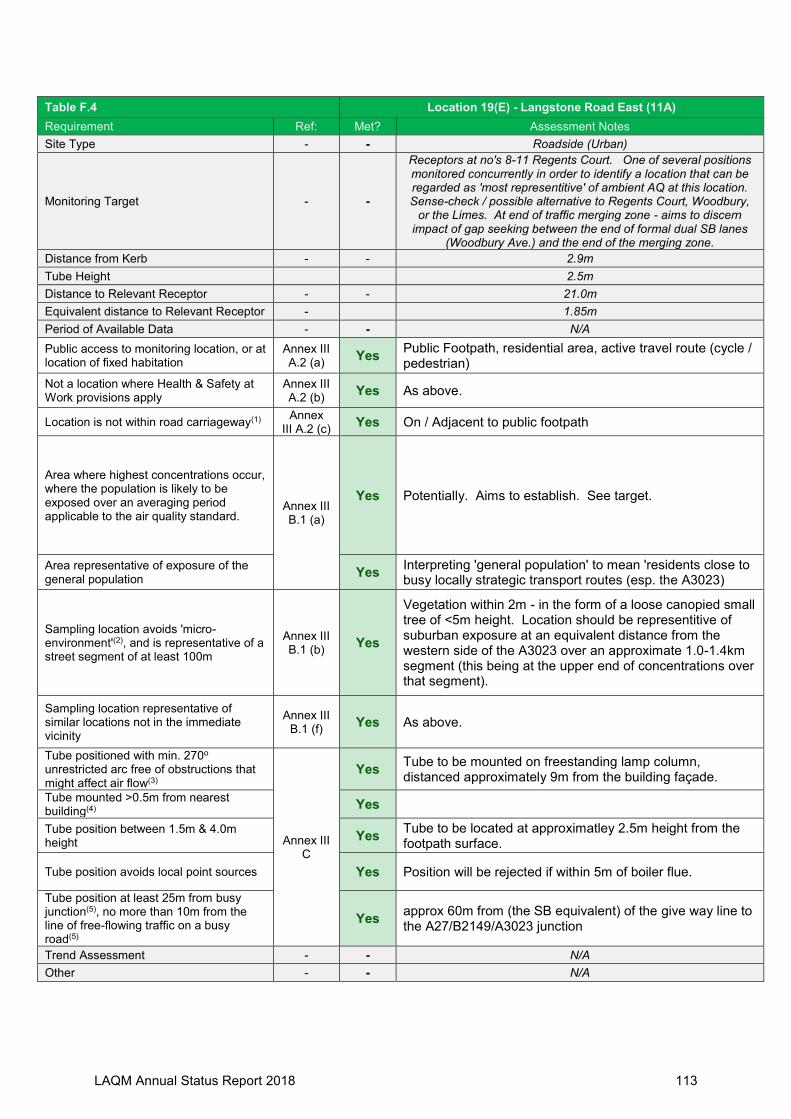
LAQM Annual Status Report 2018 113
Table F.4 Location 19(E) - Langstone Road East (11A)
Requirement Ref: Met? Assessment Notes
Site Type - - Roadside (Urban)
Monitoring Target - -
Receptors at no's 8-11 Regents Court. One of several positions monitored concurrently in order to identify a location that can be regarded as 'most representitive' of ambient AQ at this location. Sense-check / possible alternative to Regents Court, Woodbury,
or the Limes. At end of traffic merging zone - aims to discern impact of gap seeking between the end of formal dual SB lanes
(Woodbury Ave.) and the end of the merging zone.
Distance from Kerb - - 2.9m
Tube Height 2.5m
Distance to Relevant Receptor - - 21.0m
Equivalent distance to Relevant Receptor - 1.85m
Period of Available Data - - N/A
Public access to monitoring location, or at location of fixed habitation
Annex III A.2 (a)
Yes Public Footpath, residential area, active travel route (cycle / pedestrian)
Not a location where Health & Safety at Work provisions apply
Annex III A.2 (b)
Yes As above.
Location is not within road carriageway(1) Annex
III A.2 (c) Yes On / Adjacent to public footpath
Area where highest concentrations occur, where the population is likely to be exposed over an averaging period applicable to the air quality standard.
Annex III B.1 (a)
Yes Potentially. Aims to establish. See target.
Area representative of exposure of the general population
Yes Interpreting 'general population' to mean 'residents close to busy locally strategic transport routes (esp. the A3023)
Sampling location avoids 'micro-environment'(2), and is representative of a street segment of at least 100m
Annex III B.1 (b)
Yes
Vegetation within 2m - in the form of a loose canopied small tree of <5m height. Location should be representitive of suburban exposure at an equivalent distance from the western side of the A3023 over an approximate 1.0-1.4km segment (this being at the upper end of concentrations over that segment).
Sampling location representative of similar locations not in the immediate vicinity
Annex III B.1 (f)
Yes As above.
Tube positioned with min. 270o unrestricted arc free of obstructions that might affect air flow(3)
Annex III C
Yes Tube to be mounted on freestanding lamp column, distanced approximately 9m from the building façade.
Tube mounted >0.5m from nearest building(4)
Yes
Tube position between 1.5m & 4.0m height
Yes Tube to be located at approximatley 2.5m height from the footpath surface.
Tube position avoids local point sources Yes Position will be rejected if within 5m of boiler flue.
Tube position at least 25m from busy junction(5), no more than 10m from the line of free-flowing traffic on a busy road(5)
Yes approx 60m from (the SB equivalent) of the give way line to the A27/B2149/A3023 junction
Trend Assessment - - N/A
Other - - N/A

LAQM Annual Status Report 2018 114
Table F.5 Location 31 Emsworth Road (North)
Requirement Ref: Met? Assessment Notes
Site Type - - Roadside (Suburban)
Monitoring Target - - Targeting worst case exposure near key junctions for travel
associated with new strategic development allocations
Distance from Kerb - - 2.3m (5.1m)
Tube Height - 2.5m
Distance to Relevant Receptor - - 16m
Equivalent distance to Relevant Receptor
- - -1.55m
Period of Available Data - - N/A
Public access to monitoring location, or at location of fixed habitation
Annex III A.2 (a)
Yes Members of the public have access (public footpath). Location targets traffic on local strategic road network, and exposure near A27 junction.
Not a location where Health & Safety at Work provisions apply
Annex III A.2 (b)
Yes Public Realm Monitoring
Location is not within road carriageway(1)
Annex III A.2 (c)
Yes On / Within footpath, with subordinate access road lane as 'buffer' between monitor and road traffic on principle route
Area where highest concentrations occur, where the population is likely to be exposed over an averaging period applicable to the air quality standard.
Annex III B.1 (a)
Yes Yes, location is between busy road junction and nearest relevant exposure.
Area representative of exposure of the general population
Yes Position is directly analogous to relevant exposure at nearby worst case locations (3 residences)
Sampling location avoids 'micro-environment'(2), and is representative of a street segment of at least 100m
Annex III B.1 (b)
Yes
No overhangs. 6' Fence to north, trees behind (not overhanging). Positioned on freestanding pole >0.5m from nearest structure. Representitive of worst case along a street segment of approx. 850m .
Sampling location representative of similar locations not in the immediate vicinity
Annex III B.1 (f)
Yes Yes. Representitive of worst case along a street segment of approx. 850m.
Building Line Monitoring Only: Unrestricted arc of 180 degrees (free of obstacles / buildings within 10m)
SI1001, schd.1, Pt3
N/A N/A
Tube positioned with min. 270o unrestricted arc free of obstructions that might affect air flow(3)
Annex III C
Yes Tube is located on a free-standing pole, held 100mm from the pole surface.
Tube mounted >0.5m from nearest building(4)
Yes As above.
Tube position between 1.5m & 4.0m height
Yes Tube to be located at around 2.5m height from the footpath surface.
Tube position avoids local point sources Yes As above.
Tube position at least 25m from busy junction(5), no more than 10m from the line of free-flowing traffic on a busy road(5)
Yes Yes, 48m from 'give way' line of A27 Junction (Roundabout)
Trend Assessment - - N/A
Other - - N/A

LAQM Annual Status Report 2018 115
Table F.6 Location 32 Emsworth Road (South)
Requirement Ref: Met? Assessment Notes
Site Type - - Roadside (Suburban)
Monitoring Target - -
Targeting worst case exposure near key junctions for travel associated with new strategic development allocations. Co-monitoring with north-side, to determine best representitive
sampling for worst case exposure.
Distance from Kerb - - 2.6m (5.4m)
Tube Height - 2.5m
Distance to Relevant Receptor - - 18m
Equivalent distance to Relevant Receptor
- - -2.35m
Period of Available Data - - N/A
Public access to monitoring location, or at location of fixed habitation
Annex III A.2 (a)
Yes Members of the public have access (public footpath). Location targets traffic on local strategic road network, and exposure near A27 junction.
Not a location where Health & Safety at Work provisions apply
Annex III A.2 (b)
Yes Public Realm Monitoring
Location is not within road carriageway(1)
Annex III A.2 (c)
Yes On / Within footpath, with subordinate access road lane as 'buffer' between monitor and road traffic on principle route
Area where highest concentrations occur, where the population is likely to be exposed over an averaging period applicable to the air quality standard.
Annex III B.1 (a)
Yes Yes, location is between busy road junction and nearest relevant exposure.
Area representative of exposure of the general population
Yes Position is directly analogous to relevant exposure at nearby worst case locations (3 residences)
Sampling location avoids 'micro-environment'(2), and is representative of a street segment of at least 100m
Annex III B.1 (b)
Yes
No overhangs or adjacent structures. Trees ~3m to South (not overhanging). Positioned on freestanding pole >5.0m from nearest structure. Representitive of worst case along a street segment of approx 850m .
Sampling location representative of similar locations not in the immediate vicinity
Annex III B.1 (f)
Yes Yes. Representitive of worst case along a street segment of approx 850m .
Building Line Monitoring Only: Unrestricted arc of 180 degrees (free of obstacles / buildings within 10m)
SI1001, schd.1, Pt3
N/A N/A
Tube positioned with min. 270o unrestricted arc free of obstructions that might affect air flow(3)
Annex III C
Yes Tube is located on a free-standing pole, held 100mm from the pole surface.
Tube mounted >0.5m from nearest building(4)
Yes As above.
Tube position between 1.5m & 4.0m height
Yes Tube to be located at around 2.5m height from the footpath surface.
Tube position avoids local point sources Yes As above.
Tube position at least 25m from busy junction(5), no more than 10m from the line of free-flowing traffic on a busy road(5)
Yes Yes, 60m from 'give way' line of A27 Junction (Roundabout)
Trend Assessment - - N/A
Other - - N/A

LAQM Annual Status Report 2018 116
Table F.7 Location T1 Dunsbury Way
Requirement Ref: Met? Assessment Notes
Site Type - - Urban Centre
Monitoring Target - - Residential adj. PSV Stops
Distance from Kerb - - 10.1m
Tube Height - 2.5m
Distance to Relevant Receptor - - 1.85m
Equivalent distance to Relevant Receptor
- - 0m
Period of Available Data - - N/A
Public access to monitoring location, or at location of fixed habitation
Annex III A.2 (a)
Yes Within Curtilage of Residential Property
Not a location where Health & Safety at Work provisions apply
Annex III A.2 (b)
Yes Domestic Setting
Location is not within road carriageway(1)
Annex III A.2 (c)
Yes
Area where highest concentrations occur, where the population is likely to be exposed over an averaging period applicable to the air quality standard.
Annex III B.1 (a)
Yes Forward of Building line, located adjacent to 2 no. busy bus stops with 4/hr freq. (each).
Area representative of exposure of the general population
Yes
Sampling location avoids 'micro-environment'(2), and is representative of a street segment of at least 100m
Annex III B.1 (b)
Yes No on plot parking. No flues / extract outlets. Occupant Smokes, ash-tray evident within 2.5m of position.
Sampling location representative of similar locations not in the immediate vicinity
Annex III B.1 (f)
Yes Representitive of entire length of Dunsbury Wy.
Building Line Monitoring Only: Unrestricted arc of 180 degrees (free of obstacles / buildings within 10m)
SI1001, schd.1, Pt3
N/A N/A
Tube positioned with min. 270o unrestricted arc free of obstructions that might affect air flow(3)
Annex III C
Yes Tube is held 100mm from the surface of a free-standing pole.
Tube mounted >0.5m from nearest building(4)
Yes
Tube position between 1.5m & 4.0m height
Yes Tube to be located at around 2.5m height from the footpath surface.
Tube position avoids local point sources Yes
Tube position at least 25m from busy junction(5), no more than 10m from the line of free-flowing traffic on a busy road(5)
Yes 76m from nearest major junction. Flows unknown.
Trend Assessment - - N/A
Other - - N/A

LAQM Annual Status Report 2018 117
Table F.8 Location T2 The Limes
Requirement Ref: Met? Assessment Notes
Site Type - - Non-Classifiable
Monitoring Target - - (Modelled exceedance of NAQS Obj. at) Residential adj. NTR
Network
Distance from Kerb - - 17.3m (to Jct'n Off-Slip)
Tube Height - 2.7
Distance to Relevant Receptor - - 0m
Equivalent distance to Relevant Receptor
- - -10.3m*
Period of Available Data - - N/A
Public access to monitoring location, or at location of fixed habitation
Annex III A.2 (a)
Yes Within Curtilage of Residential Property
Not a location where Health & Safety at Work provisions apply
Annex III A.2 (b)
Yes Domestic Setting
Location is not within road carriageway(1)
Annex III A.2 (c)
Yes
Area where highest concentrations occur, where the population is likely to be exposed over an averaging period applicable to the air quality standard.
Annex III B.1 (a)
Yes
Within 25m of road junction kerbside (18m). Junction estimated to carry 45K AADT. Flyover estimated to carry (additional) 45K AADT. Parts of building façade are closer to offslip, but offslip flow estimated <5K AADT. Closest part of building façade to junction kerbside is at equivalent dist. (~18m).
Area representative of exposure of the general population
Yes Limited, representative of approx. 16 no. properties.
Sampling location avoids 'micro-environment'(2), and is representative of a street segment of at least 100m
Annex III B.1 (b)
Yes No Flues, kitchen extracts, or parking spaces within 5m of position.
Sampling location representative of similar locations not in the immediate vicinity
Annex III B.1 (f)
Yes Limited, representative of approx. 16 no. properties.
Building Line Monitoring Only: Unrestricted arc of 180 degrees (free of obstacles / buildings within 10m)
SI1001, schd.1, Pt3
Yes Building Line Monitoring. Façade not 'unbroken', but monitor not positioned within set-back section
Tube positioned with min. 270o unrestricted arc free of obstructions that might affect air flow(3)
Annex III C
No
Yes on micro scale; to 270mm. No if projected. Tube is held 190mm from the façade, 10m from any projection of obstruction in either direction (i.e. along either 0deg or 180deg); projecting into free space. Not in strict compliance with AIIIC, but in line with DEFRA Guide
Tube mounted >0.5m from nearest building(4)
No No. See above. Not in strict compliance with AIIIC, but in line with DEFRA Guide
Tube position between 1.5m & 4.0m height
Yes Tube to be located at around 2.7m height from lawn
Tube position avoids local point sources Yes
Tube position at least 25m from busy junction(5), no more than 10m from the line of free-flowing traffic on a busy road(5)
No
Location is furthest equivalent distance from junction kerbside for which consent was possible to obtain for monitoring. Approx. 80% of the building is within 25m of the road junction, and around 95% is > 10m from the kerbside. Not possible to target receptor direction whilst meeting both criteria. Tube is targeting modelled exceedance at North facade.
Trend Assessment - - N/A
Other - - N/A

LAQM Annual Status Report 2018 118
Table F.9 Location T3 Bedhampton Hill
Requirement Ref: Met? Assessment Notes
Site Type - - Suburban
Monitoring Target - - (Modelled exceedance of NAQS Obj. at) Residential adj. NTR
Network
Distance from Kerb - - 25.7m (to Jct'n Slip)
Tube Height - 2.4m
Distance to Relevant Receptor - - 14.4m
Equivalent distance to Relevant Receptor
- - -8.8m
Period of Available Data - - N/A
Public access to monitoring location, or at location of fixed habitation
Annex III A.2 (a)
Yes Within Curtilage of Residential Property
Not a location where Health & Safety at Work provisions apply
Annex III A.2 (b)
Yes Domestic Setting
Location is not within road carriageway(1)
Annex III A.2 (c)
Yes
Area where highest concentrations occur, where the population is likely to be exposed over an averaging period applicable to the air quality standard.
Annex III B.1 (a)
Unclear
Location is closest possible equivalent distance to predicted exceedance of NAQS Objective (modelled) for which consent was possible to obtain for monitoring. Position is +20m from closest NTR carriageway (elevated), and +7m from closest on-slip (relative to worst case exposure position); however, the position is -6m to nearest junction, and -30m, and -35m (down-prevailing-wind) to A2030 & A27 NTR carriageway respectively (i.e. closer, relative to residence of modelled exceedance)
Area representative of exposure of the general population
Yes Broadly speaking (with the exception of a single dwelling) position is 'worst case' residential-exposure for local area.
Sampling location avoids 'micro-environment'(2), and is representative of a street segment of at least 100m
Annex III B.1 (b)
No
It was not possible to avoid building corners - all mounting options within potential micro-environment - either external corners subject to increased turbulence, or sheltered internal corners where materials absorption and stagnant air may be influence. Position selected is as close to 'free-air' deployment as was possible, being spaced 0.35m from facade.
Sampling location representative of similar locations not in the immediate vicinity
Annex III B.1 (f)
Yes Representitive of approx. 12 dwellings, and anticipated 'worst case' relevant to >50 dwells
Building Line Monitoring Only: Unrestricted arc of 180 degrees (free of obstacles / buildings within 10m)
SI1001, schd.1, Pt3
Yes Building line monitoring, but placed on corner, meso0scale unrestricted arc exceeds 180 for >5m from monitor
Tube positioned with min. 270o unrestricted arc free of obstructions that might affect air flow(3)
Annex III C
Yes Tube is held 350mm from the façade of the building, 300mm from the corner, projecting in to free space.
Tube mounted >0.5m from nearest building(4)
No Not possible to achieve. Position is not strictly in line with AIIIC, but is in line with DEFRA guide.
Tube position between 1.5m & 4.0m height
Yes Tube to be located at around 2.4m height from the footpath surface.
Tube position avoids local point sources Unclear
Mounted on principle façade of garage. Vehicle idling is potential local source, depending upon garage use, and driver behaviour (v/v warming engine). Driveway is large, vehicles not stored in garage at time of positioning. Significant Influence considered unlikely.
Tube position at least 25m from busy junction(5), no more than 10m from the line of free-flowing traffic on a busy road(5)
Yes
Tube has been purposely positioned as close as possible to the nearest road junction whilst meeting this criteria. 25.7m from kerbside of nearest junction. Junction flows estimated as 58K AADT.
Trend Assessment - - N/A
Other - - N/A

LAQM Annual Status Report 2018 119
Table F.10 – General Strategy for NO2 Monitoring, and summary of proposed changes (including rationale)
Aim Notes Conclusions/Options Status
1) Decommission all monitoring locations which are not fully compliant with site classification criteria, or with mandatory directive monitoring location criteria for consideration as 'ambient'
• Tube Position no's 9, 21, 23 & 26 are not classifiable as they fail the requirement to be at least 25m from a major road junction. By definition, monitoring data from non-classifiable locations is not directly comparable to the ambient objective standards.
Cease Monitoring: i) Park Road South Solent Road (21),
ii) Park Road South Elm Lane (23),
iii) London Road Waterlooville (9), and
iv) Ladybridge Road (26)
Completed / Implemented
2) Undertake Concurrent Monitoring in the vicinity of tube no. 19B to verify assessment put forward in the 2017 ASR (micro-env.), and replace 19B with more representative location.
• Assessed position 19C on corner of A3023 / Woodbury for possible permanent / long term site.
• No suitable street furniture exists upon which to mount a temporary / short-term tube position for the purpose of verifying 19B as unrepresentative. Closest residences are terraced, with no rear access possible without entering dwelling. No suitable street furniture at property frontage.
• Tube assessed as 19D (Mounting on property frontage, at regents court). Boiler flue outlets to front, within 5m of all potential mounting positions
• Alternative position 19D assessed (Public realm). Not ideal, but useful for context
• Alternative Permanent position 19E assessed
i) Establish new tube position on corner of Woodbury immediately.
ii) write to occupants of no's 9-11 Regents Court seeking permission to site a tube short term (18 months max.)
iii) Establish alternative Monitoring location at roadside of A3023 (East
side) for comparative purposes
iv) Continue to monitor unrepresentative position 19B in the interests
of transparency.
v) Review results at 2019 ASR, select representative permanent location, decommission all interims.
i) - v) Completed / Implemented
3) Establish essentially permanent Urban monitoring within all principal urban centres, generally indicative of public exposure.
• Waterlooville position 18 already in place. Only negative siting criteria result is inherent in all background monitoring (i.e. not targeting highest concentrations per-se). Relocation would enhance value of position in that it would represent a worst case Urban background location, but this would break data continuity with respect to trend tracking. R2 poor at this location, so loss may be negligible.
Options – i) Retain existing, for purpose of identifying an emerging pattern from
static trend. Rejected
ii) Move 18 to Northern end of Ped Frontage, to ensure 'worst case B/G Conditions are being monitored. Accepted
iii) Decommission the B/G site in favour of an Urb. Centre location, which could be marginally (~5m) closer to the A3 than would be an urban B/G site.] Dismissed, on basis that it has few practical
benefits over option ii).
Not implemented
to date
• Havant pedestrianised centre - not previously monitored. Meeting all relevant criteria is possible if mounted at the Western End of the pedestrianised frontage on West St, would represent 'highest possible typical / ambient conditions (for area)'.
Site new tube on Western end of the pedestrianised West Completed / Implemented
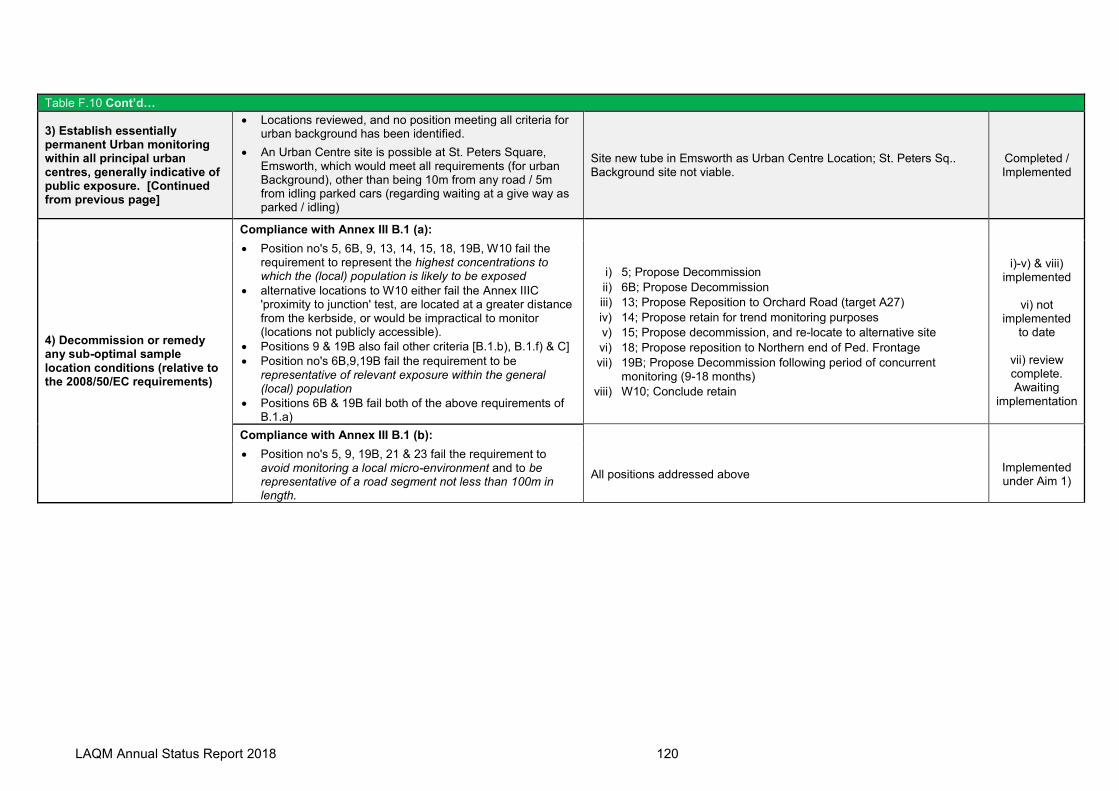
LAQM Annual Status Report 2018 120
Table F.10 Cont’d…
3) Establish essentially permanent Urban monitoring within all principal urban centres, generally indicative of public exposure. [Continued from previous page]
• Locations reviewed, and no position meeting all criteria for urban background has been identified.
• An Urban Centre site is possible at St. Peters Square, Emsworth, which would meet all requirements (for urban Background), other than being 10m from any road / 5m from idling parked cars (regarding waiting at a give way as parked / idling)
Site new tube in Emsworth as Urban Centre Location; St. Peters Sq.. Background site not viable.
Completed / Implemented
4) Decommission or remedy any sub-optimal sample location conditions (relative to the 2008/50/EC requirements)
Compliance with Annex III B.1 (a):
• Position no's 5, 6B, 9, 13, 14, 15, 18, 19B, W10 fail the requirement to represent the highest concentrations to which the (local) population is likely to be exposed
• alternative locations to W10 either fail the Annex IIIC 'proximity to junction' test, are located at a greater distance from the kerbside, or would be impractical to monitor (locations not publicly accessible).
• Positions 9 & 19B also fail other criteria [B.1.b), B.1.f) & C]
• Position no's 6B,9,19B fail the requirement to be representative of relevant exposure within the general (local) population
• Positions 6B & 19B fail both of the above requirements of B.1.a)
i) 5; Propose Decommission
ii) 6B; Propose Decommission
iii) 13; Propose Reposition to Orchard Road (target A27)
iv) 14; Propose retain for trend monitoring purposes
v) 15; Propose decommission, and re-locate to alternative site
vi) 18; Propose reposition to Northern end of Ped. Frontage
vii) 19B; Propose Decommission following period of concurrent monitoring (9-18 months)
viii) W10; Conclude retain
i)-v) & viii) implemented
vi) not
implemented to date
vii) review complete. Awaiting
implementation
Compliance with Annex III B.1 (b):
• Position no's 5, 9, 19B, 21 & 23 fail the requirement to avoid monitoring a local micro-environment and to be representative of a road segment not less than 100m in length.
All positions addressed above Implemented under Aim 1)

LAQM Annual Status Report 2018 121
Table F.10 Cont’d…
4) Decommission or remedy any sub-optimal sample location conditions (relative to the 2008/50/EC requirements) [Continued from previous page]
Compliance with Annex III B.1 (f):
• Position no's 1B, 7B, 9, 12, 19B, 21, 22 & 23 fail the requirement to be representative of similar locations not in the immediate vicinity.
• Neither position 12B or 1B have particular value v/v trends, 3 yr. average are comparable. Retention of both positions is unnecessarily duplication of sampling effort.
• Position 7B is within zone modelled to be impacted by consented STOR development. Retention helpful for impact quantification.
• Position 22 is one of few Park Road South locations >25m from busy junctions.
All positions addressed above, except 1B, 12, 7B and 22.
ix) Propose retain 12B, helpful to establish differences in east side / west side due to traffic flow imbalance &/or effect of prevailing wind;
x) Propose Retain 7B to monitor impact of industrial NO2 Source xi) Propose Retain 22 as general roadside exposures, and for
continuity transitioning to new monitoring locations. Reconsider need in 24 months.
ix) - xi) implemented
Compliance with Annex III C:
• Position no's W10, 9, 19B, 21, 23 & 26 fail at least one Annex IIIC Requirement
All positions addressed above N/A
5) Establish new monitoring positions, targeting locations not previously monitored, using objective criteria & clearly defined monitoring aims.
General Principals (select locations;)
• Where relevant exposure is within 7.5m of kerbside,
• Where roads are anecdotally busy, or flows >10K AADT
• To establish an AQ baseline ahead of a significant anticipated change in traffic flows or emissions
• That are fully compliant with the monitoring requirements, avoiding where possible 'proxy' locations, to ensure that measured result is broadly applicable without requiring FOWD estimates to be made. (aspirational)
Potential Target Locations: a) Emsworth STR1 Allocation (neither B2148 nor Denvilles level X-
ing previously considered) b) Leigh Park; large residential area on busy route c) West Leigh residential area, down-prev.-wind of B2149, Industry
to the East - relatively high B/G estimate. d) Glebe Park / Bedhampton Hill, residents complain of cut through /
rat-run; large development East College Rd. may exacerbate. e) Residential area East of Farlington (Fortunes Wy / Penk Rdg. /
Auriol Drive); high B/G estimate, down-prevailing wind of Portsmouth, A27 & A2030
f) A3 Maurepas Way Waterlooville (Adjacent residential & surgery), previously modelled, not ‘ground truthed’.
g) A3 Widley (Dwellings adjacent) h) B2150 Hambledon Road Waterlooville - >35K AADT, Industrial,
retail & leisure uses nearby, significant residential development to the West.
i) Wecock residential area j) Lovedean residential area
a) locations established to assess baseline for STR1 traffic impact (31, 32) b) short-term monitoring at position T1 d) short-term monitoring at position T3
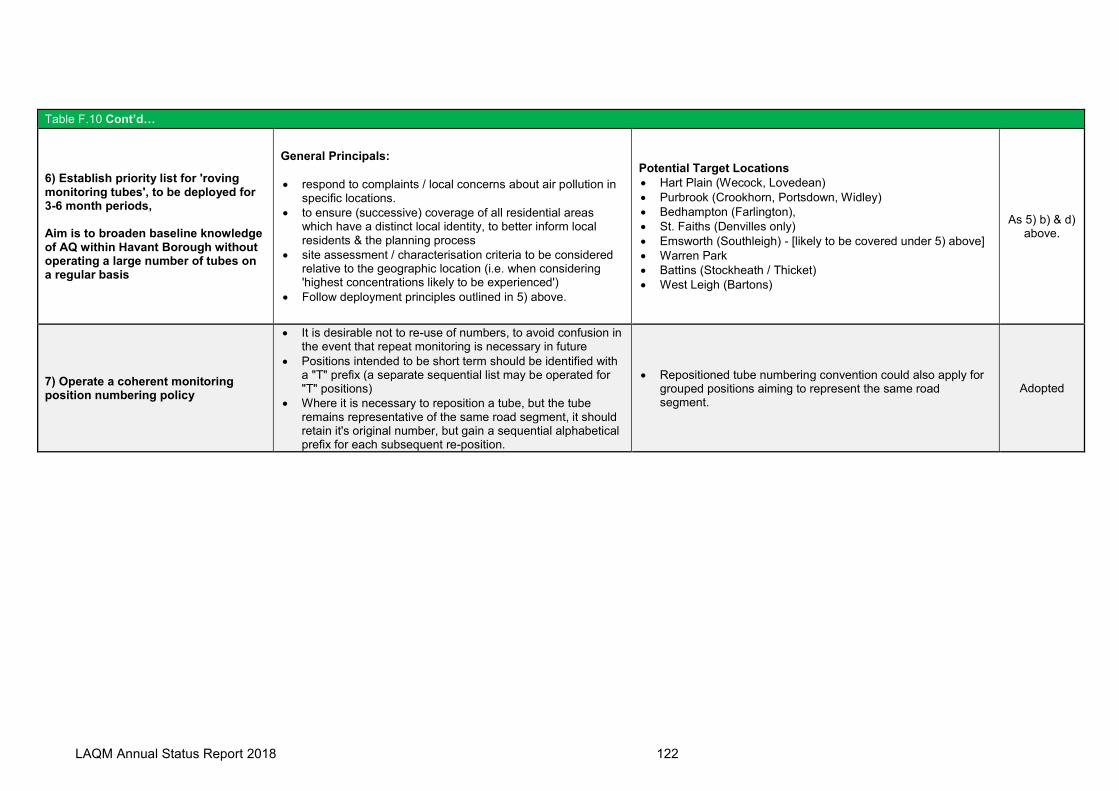
LAQM Annual Status Report 2018 122
Table F.10 Cont’d…
6) Establish priority list for 'roving monitoring tubes', to be deployed for 3-6 month periods, Aim is to broaden baseline knowledge of AQ within Havant Borough without operating a large number of tubes on a regular basis
General Principals:
• respond to complaints / local concerns about air pollution in specific locations.
• to ensure (successive) coverage of all residential areas which have a distinct local identity, to better inform local residents & the planning process
• site assessment / characterisation criteria to be considered relative to the geographic location (i.e. when considering 'highest concentrations likely to be experienced')
• Follow deployment principles outlined in 5) above.
Potential Target Locations
• Hart Plain (Wecock, Lovedean)
• Purbrook (Crookhorn, Portsdown, Widley)
• Bedhampton (Farlington),
• St. Faiths (Denvilles only)
• Emsworth (Southleigh) - [likely to be covered under 5) above]
• Warren Park
• Battins (Stockheath / Thicket)
• West Leigh (Bartons)
As 5) b) & d) above.
7) Operate a coherent monitoring position numbering policy
• It is desirable not to re-use of numbers, to avoid confusion in the event that repeat monitoring is necessary in future
• Positions intended to be short term should be identified with a "T" prefix (a separate sequential list may be operated for "T" positions)
• Where it is necessary to reposition a tube, but the tube remains representative of the same road segment, it should retain it's original number, but gain a sequential alphabetical prefix for each subsequent re-position.
• Repositioned tube numbering convention could also apply for grouped positions aiming to represent the same road segment.
Adopted

LAQM Annual Status Report 2018 123
Appendix G: Hampshire County Council Air Quality in Schools Project
G.1 Hampshire County Schools Air Quality Investigation (Havant Borough, 2018); Phase 1 Summary Report & Results
G.2 Hampshire County Schools Air Quality Investigation (Havant Borough, 2018/19); Phase 2 Summary Report & Results
G.3 Bosmere Junior School Air Quality Campaign Plan, 2018
G.4 Hart Plain Junior School Air Quality Campaign Plan, 2018
G.5 Trosnant Federation of Schools Air Quality Campaign Plan, 2018
G.6 Purbrook Junior School Air Quality Campaign Plan, 2018/19

LAQM Annual Status Report 2018 124
G.1 Hampshire County Schools Air Quality Investigation (Havant Borough, 2018); Phase 1 Summary Report & Results
A report outlining maps showing the location of diffusion tubes and the levels of nitrogen dioxide measured
in the Havant Borough Schools Air Quality Investigation, 2018.
This report shows where diffusion tubes were located to measure the average level of nitrogen dioxide over a month. The EU annual mean air quality standard for NO2
is 40 µg/m3. Our results are for a monthly average so are not directly comparable to the statutory limit. However the results will indicate the following about air quality:
• Less than 30 µg/m3 - good,
• 30-35 µg/m3 – average
• 36-40 µg/m3 - risks exceeding annual standard
• More than 41 µg/m3 - likely to exceed annual standard
All the results shown have been adjusted using a local bias adjustment factor of 0.92 and had the laboratory blank subtracted. Blue results are for a sampling period that includes a school holiday and green results for a sampling period that covered only term time. I have taken into consideration the snow days in March.

LAQM Annual Status Report 2018 125
Table of nitrogen dioxide results for Havant Borough Council Schools Spring 2018
School Location Date Tubes Deployed
Total number of days school days/ sampling
period including half
term break
Average level of
nitrogen dioxide µg/m3
Date Tubes Deployed
Total number of school days/
sampling period over term time.
Average level of nitrogen dioxide
µg/m3
Barncroft Primary School
School Car Park
9/2/2018 10/25
23.8
6/3/2018 14/20
26.1
By entrance to woodland area.
20.2 11.2
Bosmere Junior School
On fence by sandpit.
1/2/2018 16/33
21.8
6/3/2018 14/20
26.6
On fence near school entrance.
28.2 33.8
Hart Plain Junior School
By Milton Road 31/1/2018 20/32
21.9 6/3/2018 14/20
20.1
On back of school building.
15.2 12.6
Trosnant Junior School
In playing field at back of school
29/1/2018 15/28
20.8
26/2/2018 19/28
19.1
Beside car park at entrance to school grounds.
21.8 21.5

LAQM Annual Status Report 2018 126
Location of nitrogen dioxide diffusion tubes at Hart Plain Junior School, Waterlooville. Spring Term 2018
Diffusion tube placed 2.25m high and about 7.5m from Milton Road.
Feb: 21.9µgNO2/m3
Mar: 20.1µgNO2/m3
Diffusion tube placed 2.4m high. Feb: 15.2µgNO2/m3
Mar: 12.6µgNO2/m3

LAQM Annual Status Report 2018 127
Location of nitrogen dioxide diffusion tubes at Trosnant Junior School, Havant. Spring Term 2018
Diffusion tube placed 2.4m high and about 3.9m from road into school and 46m from Stockheath Lane. Feb: 21.8µgNO2/m3
Mar: 21.5µgNO2/m3
Diffusion tube placed 2.25m high and about 95m from the school buildings. Feb: 20.8 µgNO2/m3
Mar: 19.1µgNO2/m3

LAQM Annual Status Report 2018 128
Location of nitrogen dioxide diffusion tubes at Bosmere Junior School, Havant. Spring Term 2018
Diffusion tube placed 1.97m high and about 84m from the B2149 Feb: 21.8µgNO2/m3
Mar: 26.6µgNO2/m3
Diffusion tube placed 1.94m high and about 25m from the slip road to A27. Feb: 28.2µgNO2/m3
Mar: 33.8µgNO2/m3

LAQM Annual Status Report 2018 129
Location of nitrogen dioxide diffusion tubes at Barncroft Primary School, Leigh Park. Spring Term 2018
Diffusion tube placed 2.07m high. Feb: 11.2µgNO2/m3
Mar: 20.2µgNO2/m3
Diffusion tube placed 2.41m high and about 6m from Park Lane. Feb: 26.1µgNO2/m3
Mar: 23.8µgNO2/m3

LAQM Annual Status Report 2018 130
G.2 Hampshire County Schools Air Quality Investigation (Havant Borough, 2018/19); Phase 2 Summary Report & Results

LAQM Annual Status Report 2018 131
Havant schools air quality investigation, nitrogen dioxide results Autumn 2018
School Location on school
grounds Date tubes deployed
Number of
school days
Average level of NO2 µg/m3
(adjusted)
Date tubes deployed
Number of school days
Average level of NO2 µg/m3
(adjusted)
St Peters RC Primary
School
Prayer garden in school
(2.10m high) 29/10/2018
27
19.1
5/12/2018 13
17.4
In School Car Park (2.41m high
0.95m from kerb) 22.3 18.8
Mengham Junior School
Maple Gardens in school
(2.11m high) 31/10/2018
25
12.4
5/12/2018 15
14.1
On Elm Grove (2.48m high and 2.36m from kerb)
25.9 28.5
Purbrook Junior School
Outside class 3LG (2.57m high)
7/2/2019 14
23.0
6/3/2019 20
Awaiting results
Woodlands Grove (2.49m high and 3.05m from kerb)
26.1 Awaiting results
These results have been adjusted using a Local bias Adjustment Factor of 0.93 and the laboratory blank subtracted. The EU annual mean air quality standard for NO2 is 40 µg/m3. Our results are for a monthly average so not directly comparable to the statutory limit. However, the results will indicate the following about air quality:
• Less than 30 µg/m3 - good,
• 30-35 µg/m3 – average
• 36-40 µg/m3 - risks exceeding annual standard
• More than 41 µg/m3 - likely to exceed annual standard.

LAQM Annual Status Report 2018 132
St Peter’s RC Primary School: Position of nitrogen dioxide diffusion tubes and nitrogen dioxide results, Autumn Term 2018
In school car park: Nov: 22.3µgm3
Dec: 18.8µgm3
In Prayer Garden: Nov: 19.1µgm3
Dec: 17.4µgm3

LAQM Annual Status Report 2018 133
Mengham Junior School: Position of nitrogen dioxide diffusion tubes and nitrogen dioxide results Autumn term 2018
Maple Gardens: Nov: 12.4 µgm3 Dec: 14.1 µgm3
Elm Grove Nov: 25.9 µgm3 Dec: 28.5 µgm3

LAQM Annual Status Report 2018 134
Map showing position of diffusion tubes at Purbrook Junior School and nitrogen dioxide results collected over spring term 2019.
#
Woodlands Grove: Feb: 26.1 µgm3
Side of Class 3LG: Feb: 23.0 µgm3

LAQM Annual Status Report 2018 135
G.3 Bosmere Junior School Air Quality Campaign Plan, 2018

Air Quality 1. Name of School
BOSMERE JUNIOR
2. Name of Team Leader:
Position of Team leader at School
SCHOOL GOVERNOR
3. What are the goals* of your air quality campaign* (*see Glossary at end
of the form) and why? E.g. To get fewer cars driving to the school/college.
To increase the awareness of this growing issue. To clean the air that we breathe. Encourage more pupils to walk or walk and stride. Reduce the number of cars in the vicinity of the school. By reducing pollution this will have a positive on those who suffer from breathing complaints. Highlight the benefits of walking e.g.: greater fitness levels.
4. For how long and when will you run your campaign?
We envisage running this over a two term period Winter/Summer
5. Who will be your target audience* for your campaign?

Air Quality Parents, children car drivers and the general community.
6. What actions* are you planning to do to make the air cleaner around your school
Action Responsibility Timescale
Posters
Two terms
Open debate on the issue
One term
Switch that engine off!
Ongoing
Survey the parents
One term
Facebook campaign
One term
7. What resources* will you need for your campaign? How will you get these things?
There may be a local business or company who might be interested in sponsoring* or supporting your campaign?

Air Quality I.T. Gather evidence to present to the children/parents. Organise fund raising events to finance the project. Contact local retailers both for sponsorship and support with a walk to work scheme. Work with other schools in our cluster to create a wider awareness and work together on a strategy to tackle this increasing problem. Walking to school stickers to identify the walkers.
8. How will you measure the success of your campaign?
E.g. Measure change in number of cars that idle their engines outside school/college.
Organise a car survey both at the commencement and conclusion of the project, measure the drop in vehicles. Publish our findings encourage feedback. Number of children walking by the number of stickers issued.
Glossary
Actions Things that you plan to do

Air Quality Campaign A set of actions or things that you plan to do with
a common aim
Goal Something that the team wants to succeed in doing
Resources Things that you will need for your campaign and/or money to buy the things that you will need
Sponsoring A local company may be happy to help you with your campaign by giving money, equipment, food, space for putting up posters or other help that you might need.
Target audience People that you want to hear your messages and to change how they behave e.g. how they travel

LAQM Annual Status Report 2018 140
G.4 Hart Plain Junior School Air Quality Campaign Plan, 2018

Air Quality 1. Name of School/College:
Hart Plain Junior School
2. Name of Team Leader:
Position of Team leader at School/College:
Mrs Class Teacher & Head of School Council
3. Names of team members:
4. What are the goals* of your air quality campaign* (*see Glossary at end
of the form) and why? E.g. To get fewer cars driving to the school/college.
Our main aim is to get more people to walk, scoot or cycle to school. We noticed that lots of people still drive to school, and hardly any children scoot or cycle.
5. For how long and when will you run your campaign?
We’re going to run it throughout the second half of summer term.

Air Quality 6. Who will be your target audience* for your campaign?
We want to target all of the children of the school, plus parents.
7. What actions* are you planning to do to make the air cleaner around your school/college?
Action Responsibility Timescale
Put posters around the school encouraging people to leave their cars at home (scoot from the boot, park & stride, walk, scoot or cycle.
School Council and JRSOs to make a put up.
Next 2 weeks.
Have a fancy dress day where children can come to school dressed as brightly as possible. Give a prize for the two best dressed people at the end of the day.
to advertise.
Have day in July – Summer fair day?
Go on the playground after school to give more pledge cards out to try to get more returned (we only had two back).
& JRSOs.
Up until end of June.
Create a park and stride area – paint pebbles on Clean Air Day and arrange them in a chosen Park & Stride area.
JRSOs & School Council
National Clean Air Day (June)
Interview members of the public to find out where they think a good Park & Stride area would be – parents and members of the general public.
JRSOs & School Council
By the end of June.
8. What resources* will you need for your campaign? How will you get these things?
There may be a local business or company who might be interested in sponsoring* or supporting your campaign?

Air Quality We will need prizes to give out to the fancy dress competition winners. We will approach the local Co-op (over the road) and ask them to provide a little treat we can give to parents and children on the playground when they take a pledge card.
9. How will you measure the success of your campaign?
E.g. Measure change in number of cars that idle their engines outside school/college.
We will complete a hands up survey next week to see how many people walk to school at the moment. We will complete another survey in July to see if there has been a change. Interview members of the public afterwards, to see how they feel the response has been – is their road clearer at key times of the day?

LAQM Annual Status Report 2018 144
G.5 Trosnant Federation of Schools Air Quality Campaign Plan, 2018

Air Quality 1. Name of School/College:
Trosnant Federation of schools
2. Name of Team Leader:
Position of Team leader at School/College:
Lead Head of School
Y6 Pupil leader Y6 Pupil leader
3. Number of pupils in the team:
8 pupils
4. What are the goals* of your air quality campaign* (*see Glossary at end
of the form) and why? E.g. To get fewer cars driving to the school/college.
To know how air pollution is effecting the world and what could occur in the future if we do not make changes. Pupils and parents to know what part they can play in reducing the amount of air pollution. Increase the number of families who walk, ride or scoot to school. To reduce the number of parents who sit in their cars with the engine running. To support other schools and site users to reduce the amount of air pollution
5. For how long and when will you run your campaign?
A half term focus continuing in September as required

Air Quality 6. Who will be your target audience* for your campaign?
Pupils to be aware of the dangers of poor air quality and how to make a positive impact
Parents and guardians to have information to enable to make positive
choices.
7. What actions* are you planning to do to make the air cleaner around your school/college?
Action Responsibility Timescale
Change-maker assembly 1 to introduce the issues with air pollution and how we can make a difference
Change-makers and
April 2018
Change-maker assembly 2 to re-visit the issues with air pollution. Focus on how dangerous things could be in the near future and how we can make a difference
Change-makers and
May 2018
Change makers to write a weekly paragraph for the schools’ newsletter, the Friday flier.
Change-makers and
May 2018 onwards
Change makers to run a poster competition across KS2 that uses all the information shared via assemblies.
Change-makers
June 2018
Winning Posters to be displayed around school and near parking areas.
Change-makers
June 2018 onwards
Promote walk to school week and encourage to use bikes, scooters and Park and Walk initiatives across the warm summer months (and beyond).
Change-makers and
May 2018 onwards
To visit other site user (Nursery, Builders and the Infant School) to share the message and provide them
Change-makers
June 2018 onwards

Air Quality with posters to display.
8. What resources* will you need for your campaign? How will you get these things?
There may be a local business or company who might be interested in sponsoring* or supporting your campaign?
Time out of class ICT resources Prizes for competition Art resources Time with SLT to write newsletters
9. How will you measure the success of your campaign?
E.g. Measure change in number of cars that idle their engines outside school/college.
Identify the number of children taking part Increase in knowledge of children and families Newsletter Reminding everyone about air pollution and idling cars The competition The benefits of walking to school better health, saving money better fitness study better Park and Stride Car sharing Car free day Saving energy

LAQM Annual Status Report 2018 148
G.6 Purbrook Junior School Air Quality Campaign Plan, 2018/19

Air Quality
1. Name of School/College:
Purbrook Junior School
2. Name of Team Leader:
Position of Team leader at School/College:
Head of Year 4
3. Number of pupils in the team:
13
4. What are the goals* of your air quality campaign* (*see Glossary at end of the
form) and why? E.g. To get fewer cars driving to the school/college.
- To reduce air pollution around the school and the Purbrook and Waterlooville area. - To have less car park close to the school:
By finding possible Park and Stride sites. By making a car free zone shown on a map. By increasing the number of people who walk, scoot and cycle to
school. Promoting car share amongst the staff.
- Remind drivers to switch their engines off whenever possible and safe to do so. - Ask drivers to travel actively and by public transport whenever possible.
5. For how long and when will you run your campaign?

Air Quality
Two years (this year is in Year 4).
6. Who will be your target audience* for your campaign?
Parents of infants and juniors and the pupils. Students of secondary schools. Local residents and drivers.
7. What actions* are you planning to do to make the air cleaner around your
school/college?
Target audience
Action Responsibility Timescale
Parents at
school.
Purbrook Post. Letters home
to parent. Instagram, Twitter,
Website, Social Media.
Sports day. Clean air day 20th
June.
Park and Stride site/map.
+
campaigners
+
20th June
2019
Pupils Clean air day.
Assembly.
Walk to school week, May.
+
campaigners
20-24th May
2019
Local
residents
Posters in shops, community. campaigners July 2019
Local
businesses
Ask ‘Drive-Thru’ businesses
to show switch off posters.
Ask Gabby’s stepdad for help
with clean air signs.
Campaigners
July 2019

Air Quality
Pupils Competition for best poster,
slogan.
Launch in
Sep 2019
8. What resources* will you need for your campaign? How will you get these
things?
There may be a local business or company who might be interested in sponsoring* or
supporting your campaign?
Purbrook post access, paper pens, access to PJS social media – ask (PJS technician) to upload, powerpoint access on laptops, contact with Gabby’s stepdad. Contact the local businesses about displaying posters. Keep campaign low cost.

Air Quality
9. How will you measure the success of your campaign?
E.g. Measure change in number of cars that idle their engines outside school/college.
Modeshift STARS – hands up survey to measure how people get to school.
Glossary
Actions Things that you plan to do.
Campaign A set of actions or things that you plan to do with a
common aim.
Goal Something that the team wants to succeed in doing.
Pledge A promise to do something ‘pinkie promise’.
Resources Things that you will need for your campaign and/or
money to buy the things that you will need.

Air Quality
Sponsoring A local company may be happy to help you with your
campaign by giving money, equipment, food, space for
putting up posters or other help that you might need.
Target audience People that you want to hear your messages and to
change how they behave e.g. how they travel, e.g.
parents, teachers, classmates and neighbours,

LAQM Annual Status Report 2018 154
Appendix H: List of Cycle & Pedestrian Infrastructure Improvement Project List
Table H.1 – Pedestrian & Cycle Infrastructure Improvement Projects
Scheme Name (Ref)
Infrastructure
Organisations involved & Funding Source
Overview Indicative
Value (Ref; £K)
Status
Lovedean Ln. Crossing Improvements
Pedestrian HCC, Rocon Contractors
Ltd.
To improve safety at a popular crossing point near Lovedean Village Hall, and to improve the public realm for pedestrians. • Construct pedestrian refuge island • Carriage Widening to accommodate refuge, and; • Footway improvements, and tactile paving for legibility
[No Cost Info]
• Designs Approved • Contractors Appointed • Scheduled for Completion by December 2019
Tournerbury Lane (9.1a) & St Marys Road (9.1.b) junction crossing improvements (Hayling Island)
Pedestrian HBC, HCC,
Colas
The speed at which southbound enters Tournerbury Lane as a result of junction configuration affects the ability of pedestrians to cross. There is also insufficient provision at St. Marys Road at the junction. Crossing here is important for access to local schools by active modes of travel. Proposed to: • Use available s106 funds for junction realignment to tighten the radii at the Tournerbury Lane bellmouth to reduce turning speeds. • Undertake detailed design for a pedestrian refuge island at St Marys Road junction to improve safety. • Explore opportunities to secure implementation of St. Mary's Road improvements via s278 agreement in connection with development.
9.1a; 40
9.1b; 60
• Designs Approved • Contractors Appointed • Scheduled for Completion in October 2019
Elm Grove Crossing Upgrade (9.2b, North of Selsmore)
Pedestrian HBC, HCC,
Colas
Current rate of PIAs is around 3 x average, and the crossing is important for access to local schools by active modes of travel. • Implement a new Puffin crossing north of Hollow Lane and remove the existing Zebra crossing, to improve safety
9.2b; 60
• Designs Approved • Contractors Appointed • Scheduled for Completion in October 2019
Trosnant Schools Footpath Upgrade
Pedestrian, Cycle
HCC
Widening of the existing footpath between Holybourne Road and Petersfield Road to allow shared pedestrian and cycle use, to encourage active modes of travel to schools.
[No Cost Info]
• Works Completed December 2018

LAQM Annual Status Report 2018 155
Table H.1 Continued…
Upgrade of Bus Service Facilities, Mengham (9.3 alt)
Public Transport
HBC, HCC
Stops serving Mengham shops are among the busiest on Hayling Island, being important for local access to services, and for visitor & tourist access to the seafront. Proposed to: • Upgrade the specification of the bus stop to reflect it's status, to SEHRT BRT standard. • Remove Bus Lay-by to improve pedestrian circulation. • Create a 'bike hub' to facilitate access to this public transport node (and so the wider network via bus / rail stations in Havant-) by sustainable means • Consider provision of real-time bus service information (RTPI)
9.3; 45
Resolved to: • Reject 9.3 • Implement 9.3 alt • Hold on RTPI pending s106 negotiations
Upgrade Footpath (FP) 102 (9.4)
Pedestrian, Cycle
HBC, HCC
Important public right of way for access to services and for leisure, and for safe access to schools. Proposed; • Upgrade FP102 south of FP101, to Rails Lane • Upgrade Sections of Footway in Rails Lane to create a 3m off road shared cycle track • Signpost 'quiet road alternative routes' where footway upgrade is not feasible
9.4a; 3 9.4b;3
9.4c ;34 9.4d; 85
• Funding approved to Implement • 9.4a-c medium term • 9.4d short-to-medium term delivery timeframe
Improved Pedestrian & Cycle Access to Schools (9.5)
Pedestrian, Cycle
HBC, HCC
Each of the four schools in the study area has a travel plan identifying opportunities for a modal shift from motor-car to walking & cycling, but progress has fallen below expectation. Both the quality of infrastructure and the safety of routes to schools are both considered to be significant contributory factors. Proposed; • Improve northern access to Mengham Junior School (FP101) • Minor improvements to FP88. • Encourage take-up of ‘park and stride’ etc. arrangements in association with input from the Safe Routes to School team.
9.5a; 50 9.5d; 2
Resolved to: • Proceed to detailed design (9.5a) • Implement 9.5a • Implement 9.5d deferred • No feasible improvements identified at Mengham Infants or Hayling College (9.5b,c)
Upgrade East/West Cycle Route (9.6)
Cycle HBC, HCC,
Cycle Hayling
The existing east/west route (FP89 and FP521) is not well waymarked, and many local people remain unaware of its existence. A significant barrier to this route is the crossing of Manor Road (A3023, 40mph limit). For the purposes of the assessment, the route was divided in to 5 sections, and a sixth alternative (FP's 92, 93 & 94) was also assessed. Proposed; • Improve Churchyard Path due to volume of cyclists using route • Surfacing upgrades on Right of Way though Parkdean Holiday Park, to 2.5m all weather 'bound surface'. • Improve crossing at Manor Road, kerb alignment and markings to reduce approach speed improve safety to accommodate expected growth in usage. • Widen footway on Brights Lane, to create shared surface. • Complete rebuild of FP521 (Denhill Close. to Hayling Billy) (9.6e)
9.6a; 4 9.6b; 40 9.6c; 50 9.6d; 27 9.6e; 16
Resolved to: • Proceed with 9.6a, b • Defer 9.6c, d, f • Assess Ecological Impact of Designs for 9.6e • £16K CIL funding awarded to deliver 9.6e • Cost & RoW amendment issues have delayed implementation. • Ecological Impact status unclear. • Work Expected to start Spring 2020

LAQM Annual Status Report 2018 156
Table H.1 Continued …
Crossing for Hayling Park and Beach Road (9.7)
Pedestrian, Cycle
HBC, HCC
Important crossing point for access to the West Town Shopping area, and leisure facility of Hayling Park. Also an important for access to local schools from new developments on Station Road by active modes of travel. • Two Beach Road crossing options considered, with shared surfacing (9.7a) • Improve Links to residential areas through Hayling Park (9.7b)
9.7b; 60
Resolved to: • Partially Implement 9.7b • Defer 9.7a (to follow improvements on St. Mary's Rd.)
St Margarets Road (9.8)
Pedestrian, Cycle
HBC, HCC
St. Margarets Road connects to Mengham Lane for onward travel to the sea front, shops & community centre, and for services to the mainland. However, the connection is via a section of private road which lacks a footway and adequate lighting. Proposed: • Establish a public right of way on private section • Create shared-use footway to join adopted routes on St Leonards Ave. & St. Margarets Road.
9.8; 35
Resolved to: • Commence PRoW Legal Proceedings
Mill Rythe to Copse Lane (9.9)
Pedestrian, Cycle
HBC, HCC, Cycle
Hayling, Natural England
Footway on the east side of Havant Road is narrow at this section (<1m), and despite a recent reduction in speed limit on the A3023, a perception persists that driving style remains aggressive, and that traffic passes too close to pedestrians at ‘high’ speed. Cyclists use the footway in preference to the busy road (19000 AADT), increasing safety risk. An Informal permissive route established to allow cyclists to travel off-road in safety. Proposed: • Complete the off-road permissive route as far north as Mill Rythe Lane • Investigate possibility of upgrading the England Coast Path (once open) to allow use by cyclists.
[Not Costed]
Long-Term delivery Timeframe. Resolved to: • Work with Natural England to ensure co-benefits of the ECP
Sea Front Hayling Island; Solent Way to A3023. (No Ref)
Cycle
HCC, HBC, Lockhams
Construction Ltd
• This project aims complete a missing link within the existing cycle network, to provide continuous off-road cycle use along the sea front area of Hayling Island. • Footway widening into the carriageway on the south side of Sea Front is planned between the junctions with Solent Drive and A3023 Beach Road. This will create a shared use footway/cycleway linking to the existing shared use route along the sea front. Resurfacing of existing footway adjacent to match the new footway. • The existing Zebra crossing will be upgraded to a Tiger crossing. • Planned works have been suspended due to issues beyond the Council's control. • Quotations are being sought from alternative contractors to complete the project as soon as possible.
[No Cost Info]
• Detailed design completed, • funding allocated. • Delivery Delayed.

LAQM Annual Status Report 2018 157
Table H.1 Continued …
Langstone Road Cycle Link - Phase 3; Technology Park Access to NCR22
Cycle Highways England,
HCC, HBC
A third stage of the Langstone Road project will infill the gap between the Langstone Technology Park access road and National Cycle Route 22 at the A27 subway by converting the footway alongside Langstone Road and the A27 slip road into a shared cycle track, which will complete the staged build of this important cycle network link.
[No Cost Info]
• Under discussion. • Funding not secured, detailed design not yet complete.
Barncroft Way and New Road, pedestrian and cycle improvements (No Ref)
Pedestrian & Cycle
HCC, HBC, Rocon
Contractors Ltd.
The new route will join an existing shared use path on Park Road North/South, and will further enhance connectivity within the local-, and wider-, cycle network for Havant and Bedhampton; increasing opportunities to access local schools and the joined Havant South downs colleges by active modes of travel. Proposed; • Footway Widening • Upgrade of Pelican Crossing to Toucan Crossing • Create shared use path between Havant College Entrance to Hermitage Stream Cycleway Link.
[No Cost Info]
• Funding Approved • Contractors Appointed 2018 • Works Completed Jan 2019
Harts Farm Way/Southmoor Lane Junction Improvements
Road Vehicles,
Pedestrians, Cycle
HCC, HBC, Colas
Junction congestion occurs on the Brockhampton Road approach during on the morning peak, and along Southmoor Lane in the evening peak, with significant queuing. Proposed: • Replace existing mini roundabout with 'full' roundabout to improve traffic flows and reduce vehicle speed • Introduce kerbed refuge islands on all approaches • Revise road & footway alignment to control vehicle speed and improve lane discipline. • Realign road, providing 2 northbound lanes to increase junction capacity • Provide additional on- & off- road cycle facilities on Brookside Road approach to improve the east-west route NCN2, improving safety for both pedestrians and cyclists.
[No Cost Info]
• Works Completed (2018)
Langstone Road Cycle Link - Phase 2; Mill Lane North to the Technology Park Access
Pedestrian & Cycle
HBC, HCC, Lockhams
Construction Ltd
•Widen the footway on the approach to Langbrook Close to 3m and remove the northbound entry flare to reduce crossing distance and to improve safety. •Upgrade the Langstone Technology Park crossing point to modern standards to improve safety. •Provide local improvements at The Mallards and Mill Lane to clarify the crossing and access points to improve inter-visibility between pedestrians, cyclists and vehicles.
[No Cost Info]
• Works Completed (October 2018)

LAQM Annual Status Report 2018 158
Table H.1 Continued …
Stakes Hill Road, Waterlooville Pedestrian and Cycle Improvements
Pedestrian, Cycle, Bus
HCC
Facilities along this route are important for access to local schools by active modes of travel. Proposed to: • Extend the existing off road shared use cycleway (part of NCN222), to provide a safer cycle route between Purbrook & Waterlooville, and to directly serve Oaklands & St. Peters Catholic Schools, Springwood Junior, and Crookhorn College. • Widen existing footway sections both sides of Stakes Hill Road to create a new shared use facility • Reconfigure the Southbound Bus lay-by at Oaklands to improve access and safety • Up-grade the existing Toucan Crossing to a Pelican crossing • Provide reflective bollards to enhance visibility of existing school crossing patrol crossing locations
[No Cost Info]
• Works Completed (Summer 2018)
Langstone Road Cycle Link - Phase 1; Langbrook Close to the Technology Park entrance
Pedestrian, Cycle, Bus
HBC, HCC, Rocon
Contractors Ltd
• Footway widening to minimum of 3m to allow future designation as a shared cycle track. New kerb alignment & carriageway width reduction designed to assist accessibility for bus passengers. • Provision of bus shelter to improve conditions for waiting passengers. • Upgrade of Langbrook Close crossing to meet modern standards to improve safety. The route will be designated as a cycle track following completion of construction of future planned stages.
[No Cost Info]
• Works Completed (2017)
Emsworth cycling and crossing improvements
Pedestrian & Cycle
HCC, HBC
General scheme of improvements to improve the public realm and increase opportunities to access local schools by active modes of travel. Proposed; • Provision of a new toucan crossing on Horndean Road, directly benefitting St. James's school. • Provision of a signed and marked cycle route (Christopher Way) • Upgrade existing footways to shared use surface (New Brighton Road) • Provision of a new pedestrian link (New Brighton Rd. to Washington Rd.)
[No Cost Info]
• Works Completed (2017)
(note, works completed more than 2 years prior to reporting date are not included in the table)

LAQM Annual Status Report 2018 159
Appendix I: Havant Borough Council Consultation Responses
I.1 Environmental Control Advisory Committee (ECAC) Joint Consultation Response on ‘Draft Revised UK Air Quality Plan for Tackling Nitrogen Dioxide’
I.2 Havant Borough Council Consultation Response on ‘NICE Draft Air Quality Standard’
I.3 Havant Borough Council Consultation Response on ‘Cleaner Domestic Burning of Solid Fuels and Wood’

LAQM Annual Status Report 2018 160
I.1 Environmental Control Advisory Committee (ECAC) Joint Consultation Response on ‘Draft Revised UK Air Quality Plan for Tackling Nitrogen Dioxide’
HIOW ECAC AQ sub Group Joint Response
Consultation on a draft revised UK Air Quality Plan for tackling nitrogen dioxide I am responding to the consultation on behalf of the Hampshire and Isle of Wight, HIOW, Environmental Control and Advisory Committee, ECAC, which is a group representing the Local Authority Environmental Protection Officers in Hampshire and the Isle of Wight. The Hampshire and Isle of Wight Environmental Control and Advisory Committee comprises: Basingstoke And Deane Borough Council East Hampshire District Council Eastleigh Borough Council Fareham Borough Council Gosport Borough Council Hart District Council Havant Borough Council New Forest District Council Portsmouth City Council Rushmoor District Council Southampton City Council Test Valley Borough Council Winchester City Council Neil Scott Secretary HIOW ECAC.
Questions for consultation
1. How satisfied are you that the proposed measures set out in this consultation will address the problem of nitrogen dioxide as quickly as possible? We are not satisfied that the plan as it stands will meet the objectives in the shortest time. This is because by the plans own modelling the most effective measure, CAZ, are the option of last resort and only to be implemented with Defra approval, this is effectively a hurdle to the use of the most effective measure. The approach to modelling the effectiveness of measures and consequently of the plan are hampered by the model used and approach to modelling taken. For example the requirement to reduce air pollution as quickly as possible (and consequently the effectiveness of measures) cannot be assessed by the use of a model which only looks at 5 year windows. We are also concerned at the veracity of the modelling outputs. Many of the measures other than CAZs are already contained within existing AQAP’s, the difficulty in implementing these measures have contributed to the current lack of compliance with national target values. LAs should be given the necessary powers to require compliance with Action Plans

LAQM Annual Status Report 2018 161
Funding for the implementation of measures needs to be made more widely and more readily available to LAs with AQMAs and not just to those identified by the modelling contained in the plan. Discussions amongst our group have shown that some LAs identified in the plan do not have relevant receptors within the zones identified by modelling, whilst others with ongoing failures of national targets in existing AQMA are not included in the plan. This reinforces our view that the model is not fit for purpose and that an action plan developed on the back of the modelling will consequently also be flawed. There appears to be no mention of actions taken or could be taken at a national level which would impact on nitrogen dioxide (and Carbon dioxide) levels, e.g. vehicle fuel duty, diesel scrappage, uptake of ULEVs. The plan delegates much responsibility to LAs to implement the necessary actions, however it is silent in terms of how this will be resourced and how LAs will overcome the limitations of existing powers to require other bodies to take action.
2. What do you consider to be the most appropriate way for local authorities in England to determine the arrangements for a Clean Air Zone, and the measures that should apply within it? Given the central role that Defra has played over time with air quality management, and in terms of funding projects and research, we would expect a strong lead from Defra in terms of a package of measures, and relevant guidance and tools, which are in effect ‘turnkey’ to allow LAs to determine the most effective measures for their locality and to implant them quickly and effectively. Without clear leadership and guidance from Defra it is likely that there will be significant variation in the measures implemented nationally, and locally, which could lead to unnecessary burdens on the public and business, and to unintended consequences where neighbouring LAs take different approaches. There needs to be regional support and guidance to ensure plans are implemented consistently and coherently across conurbations . There is also some confusion as to whether the plan is requiring LAs to implement a CAZ or not, especially in those districts which previously did not require one, and which may not need to have a future CAZ due to infrastructure projects which are being considered. The approach these LAs should take is unclear. What factors should local authorities consider when assessing impacts on businesses? The assessment should follow normal Cost/Benefit approaches

LAQM Annual Status Report 2018 162
3. How can Government best target any funding to support local communities to cut air pollution? What options should the Government consider further, and what criteria should it use to assess them? The Government should consider simple to access funding streams for local scrappage, ULEV schemes etc. Are there other measures which could be implemented at a local level, represent value for money, and that could have a direct and rapid impact on air quality? Examples could include targeted investment in local infrastructure projects. See above How can Government best target any funding to mitigate the impact of certain measures to improve air quality, on local businesses, residents and those travelling into towns and cities to work? Examples could include targeted scrappage schemes, for both cars and vans, as well as support for retrofitting initiatives. How could mitigation schemes be designed in order to maximise value for
money, target support where it is most needed, reduce complexity and minimise scope for fraud? The Government should be leading on this, we would expect that the knowledge gained by them on previous schemes and from grant winning projects should inform guidance and schemes for LAs. This should provide Local authorities with a clear framework for implementing the most efficacious actions.
4. How best can governments work with local communities to monitor local interventions and evaluate their impact? Existing modelling and assessment tools need to be updated to include most up to date technical and scientific information, e.g. emission factors updated to COPERT 5. Support for monitoring of air pollutants to verify action effectiveness, recent years have seen funds withdrawn from LAs. Support for mobile monitoring. Guidance on how LAs are to assess the impacts of interventions, allowing for multiple interventions being implemented at the same time, this is the reality of schemes currently being implemented as a result of the proposed actions contained in the National Action Plan ie “The Government and the devolved administrations are committed to an evidence-based approach to policy delivery and will closely monitor the implementation of the plan and evaluate the progress on delivering its objective. “

LAQM Annual Status Report 2018 163
5. Which vehicles should be prioritised for government-funded retrofit schemes? The oldest most polluting vehicles should be targeted, prioritising diesel replacement. Support for upgrading of lorry and bus fleets to Euro 6 / ULEV. Measures to target local delivery vans. We welcome views from stakeholders as to how a future scheme could support new technologies and innovative solutions for other vehicle types, and would welcome evidence from stakeholders on emerging technologies. We currently anticipate that this funding could support modifications to buses, coaches, HGVs, vans and black cabs. Focus should be on upgrading fleet to newest standards and not on retrofit.
6. What type of environmental and other information should be made available to help consumers choose which cars to buy? Real world fuel efficiency and emissions data.
7. How could the Government further support innovative technological solutions and localised measures to improve air quality? Simplifying the application process for grants, improving / increasing the funding available, providing longer term financial certainty to those involved in R&D.
8. Do you have any other comments on the draft UK Air Quality Plan for tackling nitrogen dioxide? We are concerned that the modelling used to determine areas for intervention is not fit for purpose, for the reasons highlighted above it has identified locations with no relevant receptor for action, and ignores existing AQMAs (or worse shows locations as compliant which are not). This undermines confidence in the strategy and raises concerns that resources will be mis-directed away from areas where resources are required. Further, we require tools to allow the effectiveness of measures to be assessed over shorter time frames than those used in the modelling for the consultation. Effective action measures will likely need to be implemented beyond district, county or agglomeration boundaries, there appear to be no plans or guidance on how LAs should proceed in these circumstances and how a ‘joined up’ approach is best achieved. Defra must be resourced to ensure a greater “hands on” approach going forward to ensure a consistency of approach is taken. The choice of model and data input assumptions are a particular key issue for greater control. There is a case for a centralised approved model to be made available and

LAQM Annual Status Report 2018 164
staffed to allow Local Authorities to use such expertise at a subsidised cost. This will prevent the continuous “reinventing of the wheel“ that is currently taking place within close geographic locations which are in different Local Authority areas. There is no detail on how LAs are proceed where they have to implement a CAZ but already have existing AQAP’s with commitment to other solutions for compliance?

LAQM Annual Status Report 2018 165
I.2 Havant Borough Council Consultation Response on ‘NICE Draft Air Quality Standard’
Air pollution: outdoor air quality and health
Consultation on draft quality standard – deadline for comments 5pm on 19/10/18 email: [email protected]
Organisation name – stakeholder or respondent (if you are responding as an individual rather than a registered stakeholder please leave blank):
Jonathan Driver [Havant Borough Council, Environmental Health (following consultation with Planning Policy & Urban Design)]
Disclosure
Please disclose any past or current, direct or indirect links to, or funding from, the tobacco industry.
No professional or personal links with the tobacco industry.
Name of commentator person completing form:
Jonathan Driver
Supporting the quality standard - Would your organisation like to express an interest in formally supporting this quality standard? More information.
No (it is understood that Local Authorities are not target supporters)
Type [office use only]
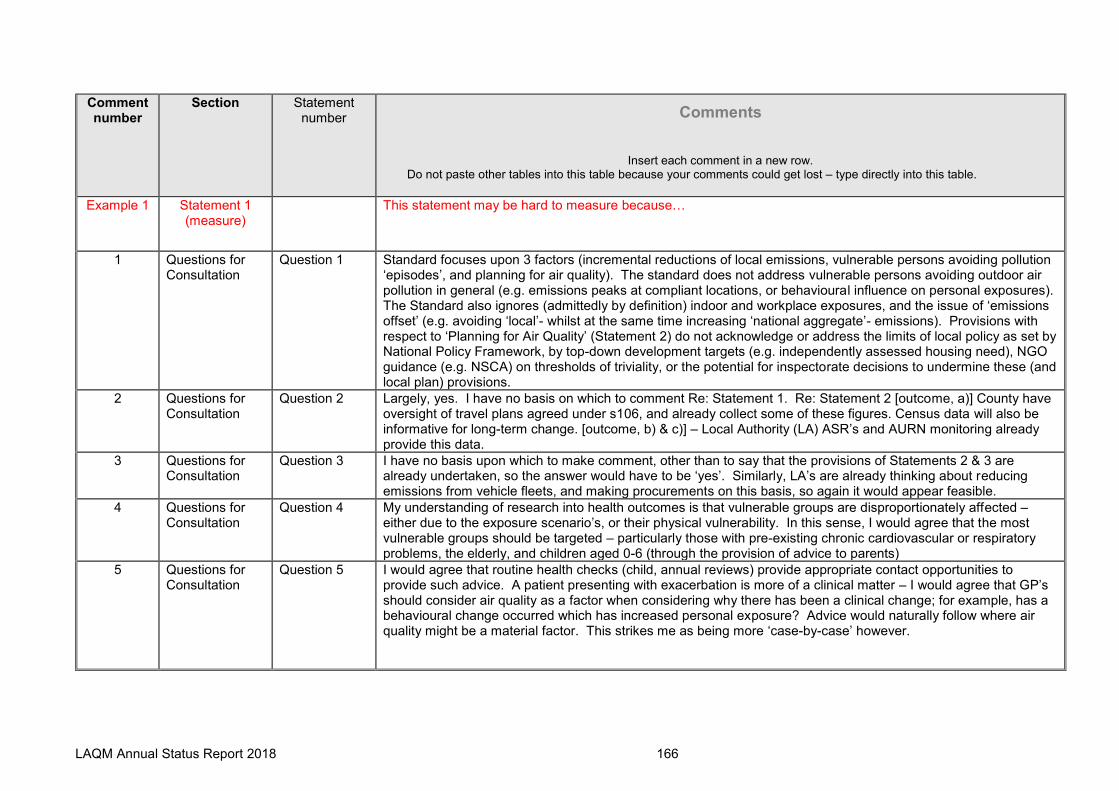
LAQM Annual Status Report 2018 166
Comment number
Section
Statement number
Comments
Insert each comment in a new row.
Do not paste other tables into this table because your comments could get lost – type directly into this table.
Example 1 Statement 1 (measure)
This statement may be hard to measure because…
1 Questions for Consultation
Question 1 Standard focuses upon 3 factors (incremental reductions of local emissions, vulnerable persons avoiding pollution ‘episodes’, and planning for air quality). The standard does not address vulnerable persons avoiding outdoor air pollution in general (e.g. emissions peaks at compliant locations, or behavioural influence on personal exposures). The Standard also ignores (admittedly by definition) indoor and workplace exposures, and the issue of ‘emissions offset’ (e.g. avoiding ‘local’- whilst at the same time increasing ‘national aggregate’- emissions). Provisions with respect to ‘Planning for Air Quality’ (Statement 2) do not acknowledge or address the limits of local policy as set by National Policy Framework, by top-down development targets (e.g. independently assessed housing need), NGO guidance (e.g. NSCA) on thresholds of triviality, or the potential for inspectorate decisions to undermine these (and local plan) provisions.
2 Questions for Consultation
Question 2 Largely, yes. I have no basis on which to comment Re: Statement 1. Re: Statement 2 [outcome, a)] County have oversight of travel plans agreed under s106, and already collect some of these figures. Census data will also be informative for long-term change. [outcome, b) & c)] – Local Authority (LA) ASR’s and AURN monitoring already provide this data.
3 Questions for Consultation
Question 3 I have no basis upon which to make comment, other than to say that the provisions of Statements 2 & 3 are already undertaken, so the answer would have to be ‘yes’. Similarly, LA’s are already thinking about reducing emissions from vehicle fleets, and making procurements on this basis, so again it would appear feasible.
4 Questions for Consultation
Question 4 My understanding of research into health outcomes is that vulnerable groups are disproportionately affected – either due to the exposure scenario’s, or their physical vulnerability. In this sense, I would agree that the most vulnerable groups should be targeted – particularly those with pre-existing chronic cardiovascular or respiratory problems, the elderly, and children aged 0-6 (through the provision of advice to parents)
5 Questions for Consultation
Question 5 I would agree that routine health checks (child, annual reviews) provide appropriate contact opportunities to provide such advice. A patient presenting with exacerbation is more of a clinical matter – I would agree that GP’s should consider air quality as a factor when considering why there has been a clinical change; for example, has a behavioural change occurred which has increased personal exposure? Advice would naturally follow where air quality might be a material factor. This strikes me as being more ‘case-by-case’ however.

LAQM Annual Status Report 2018 167
6 Quality Statement 1
Rationale I do not see the relevance of only providing advice to vulnerable groups on days of high ambient or transboundary pollution. This may serve to limit resource requirements, but equally limits achievable outcomes. Personal exposures can be dramatically improved by minor behavioural change, and being a chronic (as well as acute) harm, overall improvements in outcomes (over and above those achievable under the draft Quality Standard) will be possible if all priority vulnerable groups are routinely targeted for provision of advice. This would dispense with the need for a system of notification and serve to embed this element as routine clinical care.
7 Quality Statement 2
Quality Statement
I have been involved with the development of Local Plan policy, with specific regard to air quality & pollution. The current reality of policy development is that it is framed by the ‘presumption in favour of sustainable development’; defined in loose terms under national policy, but specifically requiring positive determination (of an individual application, or of a plan against the objectively assessed housing need) unless the impacts of development would ‘significantly and demonstrably outweigh the benefits’ (benefits in this context having a broad interpretation including economic- & social-, and not construed simply in environmental- or health- terms) (para.11 b)ii) & d) ii) NPPF 2018). Coupled with the need for a robust evidence base for any adopted local policy provision, and perhaps more critically-, with the requirement for any policy measure to be ‘reasonable’ (in particular, that it cannot be expected to solve existing problems), these factors conspire to significantly limit the ability of the LPA to impose strict local policy controls. Whilst it is recognised that the local plan forms the ‘starting point’ for decision-making, the plan-making requirements mean that to seek to impose strict local policy controls (e.g. policy which does require development to deliver net benefits to an existing problem-) would necessitate an evidence-based challenge to either or both the National Policy, and NGO guidance, which currently restricts the drafting & interpretation of local policy. This would obviously be outside the scope of the resources available to most Local Authorities, and would only be justifiable at the local level where severe local issues exist (in line with para. 11, NPPF). The result is a drive for ‘positively framed’ policy which necessarily uses ‘soft’ language, such as ‘would favour’, and ‘encourage’; rather than more direct provisions such as ‘must’, or ‘will be refused unless…’ – whilst not universal, this is certainly true where there lacks a strong legislative- or national policy- basis upon which to take a less permissive stance (as currently in the case of air quality). This language allows a significant degree of leeway for applicants to seek to minimise development provisions for mitigating emissions or for delivering incremental improvements to local air quality (the offering) against the policies that are in place. Lacking a strong (policy-, legislative-, or evidential-) basis upon which to determine that the sustainability credentials or air pollution provisions (particularly with respect of design) are inadequate, the LPA is in a weak position to challenge this. This limits application-, and therefore success- of local policy. It is also true that to tackle air quality effectively through planning requires a coordinated suite of policy covering energy, transport, employment, housing, quality design, landscapes, pollution and health. It has proven extremely difficult to make specific air quality provisions, and I have encountered significant resistance to making design or policy stipulations for air quality purposes. The need for such policy is easy to argue for on a qualitative basis, but extremely difficult to quantitatively justify (thus falling at the ‘evidence base’ hurdle). The breadth of influences

LAQM Annual Status Report 2018 168
upon local air quality means that in order to mobilise all local planning authorities to achieve marginal, incremental and cumulative emissions reductions which stand a realistic prospect of translating into the hoped-for demonstrable real-world improvement in local Air Quality; Air Quality needs to be made a central theme to the development of local plans. A strong stance in National Policy (or additional freedom given to LPA’s in plan-making) is required to achieve this, and it may require re-defining fundamental principles of central policy, e.g. re-defining “sustainable development” from something which permits environmental and health harms to be balanced by social gains, to something which requires the balancing of environmental (or health) harms against environmental (or health) gains.
8 Quality Statement 2
Rationale (“…Strategies and plans should include enabling zero- and low-emission travel…and how to design buildings and spaces to improve air quality…”). Strategies and plans are appropriate documents within which to set out aspirations. Application in practice (through the planning system, as implied by Quality Statement 3, would require the LPA to be willing (enabled / empowered) to either refuse an otherwise acceptable development on grounds that the design for air quality could be ‘improved’ (even where it meets all building regulations and design code standards - manual for streets etc.), or to deem it to be unacceptable in planning terms without the imposition of conditions dictating certain aspects of design, or requiting the delivery of certain features, provisions, or mitigation - principally or exclusively for the purpose of improving air quality. This is difficult where the planning system is geared towards thresholds of ‘unacceptability’, especially where the Government’s focus on housing delivery and the need to ‘significantly boost housing supply’ (as an economic and social benefit) frequently outweighs all other considerations unless constrained by one of the policies in footnote 6 of the NPPF (e.g. SSSI, Green Belt, AONB, national park, designated heritage assets etc.). Within this context, a development which offers ‘something’ which contributes towards air quality goals (but could, at the expense of the available margin of profit deliver substantially greater contributions to emissions reductions) is very difficult to deem ‘unacceptable’ unless it fails to meet the broad definition of ‘sustainable development’, or exceeds some other threshold (e.g. NSCA ‘planning for air quality’ significance criteria, which essentially screens out all but the most substantial development projects). In order to secure an improved scheme – whether the LPA is seeking to impose a planning condition or is seeking a fundamental amendment to design - a development is required to be deemed ‘unacceptable without improvement’. Even if appropriate policy is in place (which it largely is, and has been for some time), and an LPA is willing to treat it as a ‘hard’ requirement; planning decisions could still be frustrated by the planning appeals process, competing NGO and industry guidance, and the National Policy standards which are often taken to override local policy (by providing the framework against the local policy wording & phraseology is interpreted). National provisions may also explicitly override local policy where (for example) the objectively assessed housing need determines a 5-year housing supply requirement in excess of that provided for in the local plan, thus invalidating the plan and defaulting to National Policy the determination of applications. In this sense, I would say that as an extension to this Quality Statement (2), the provisions need to call for these principles to be embedded at the heart of the NPPF if they are to stand a realistic prospect of achieving substantial aggregate improvements.

LAQM Annual Status Report 2018 169
9 Quality Statement 2
Equality and Diversity Considerations
This section states that LA’s should identify areas where air pollution is ‘highest’. National policy is loosely leaning toward a strategy of ‘cumulative incremental improvements’, making this Statement provision relevant in theory. In practice however, NGO & Industry guidance commonly referred to sets a high bar for ‘significance’, and National Air Quality Limits / Objectives (as laid out in EU and Domestic instruments) have explicitly limited application. Generally speaking, ‘compliant’ areas (albeit that these may be areas of the ‘highest’ air pollution, may materially contribute to poor health outcomes, and may exceed National standards without breaching them-) are treated as being below the threshold of triviality. This makes it difficult for Planning Authorities to evidence the need for interventions within the local plan process, and thus limits the ability to adopt robust policy. If such policy is not adopted, it cannot be implemented. Even where a LA does not recognise those thresholds of triviality and seeks to unilaterally exercise local policy controls (e.g. to seek air quality improvement within a compliant area); an appeal inspector is nevertheless likely to be sympathetic to such arguments and the LA is consequentially unlikely to be successful at appeal. In line with the comment at 8 above, if national policy incorporated tougher requirements then Planning Authorities would be empowered to be stronger both in the plan-making process, and in determining individual applications.
10 Quality Statement 3
Rationale This rationale is reliant upon the provisions of Quality Statement 2 having been implemented. The right policy needs to be in place for LA’s to exercise. Comments above under 8 & 9 above largely apply. Given the breadth of factors influencing local air quality, exercisable local policy is generally already in place, and LPA’s already seek to implement it (albeit for purposes to which air quality is a subordinate, but relevant, factor). In general terms, the provisions of this statement are (therefore) likely to achieve better recording of this activity, but are unlikely to deliver air quality improvements over & above those already being achieved.
11 Quality Statement 4
Rationale The rationale uses the phrase “…to address air pollution”, but does not indicate whether this should be taken to mean “local air pollution in busy urban centres where national limits may be exceeded”, or “aggregate emissions to air on a national basis”. This is important, as some LEV types may actually use more energy per-average-km than the equivalent conventionally fuelled vehicle. When considering either plug-in-hybrid or electric vehicles, the source of energy is also important, as if this is not an entirely renewable (or low atmospheric pollution option such as nuclear) the emissions are simply offset from one place to another and no overall (national, aggregate) benefit is achieved. It would help guide authorities & NHS fleet emissions strategies if the goal is clear (the goal may of course be both these things, requiring competing requirements be appropriately weighed / balanced; but this should be made clear)
12 Quality Statement 4
Quality Statement, Structure, b), Data Source
Refers to Commissioning Specifications – it might be helpful to expand this concept to make clear that the commissioning specification should respond to vehicle duty & drive cycle, and that organisations should not select a ‘one size fits all’ specification. The one size option would likely deliver benefits in some circumstances but could represent an increase in emissions (relative to the use of conventional vehicles) in others.
13 Quality Statement 4
Quality Statement, Outcome , b),
Refers to “overall fuel consumption”. Care should be taken to ensure that this is representative. There are well documented problems with fuel consumption figures with hybrid & electric vehicles which suit marketing purposes but have little relevance to real world performance. I would recommend that the word “Fuel” be substituted for

LAQM Annual Status Report 2018 170
“Energy”, as both petroleum fuel and electrical power can be expressed in terms of ‘energy per km’. By extension, fleet energy use may be aggregated on this common basis over a given time period and compared on an equivalent basis to previous periods (irrespective of the composition of the fleet in terms of power plant / drivetrain / end-of-pipe abatement).
Insert extra rows as needed
Checklist for submitting comments • Use this comment form and submit it as a Word document (not a PDF). • Complete the disclosure about links with, or funding from, the tobacco industry. • Include section number of the text each comment is about e.g. introduction; quality statement 1; quality statement 2 (measure).
• If commenting on a specific quality statement, please indicate the particular sub-section (for example, statement, measure or audience descriptor).
• Combine all comments from your organisation into 1 response. We cannot accept more than 1 response from each organisation. • Do not paste other tables into this table – type directly into the table. • Underline and highlight any confidential information or other material that you do not wish to be made public. • Do not include medical information about yourself or another person from which you or the person could be identified. • Spell out any abbreviations you use • For copyright reasons, comment forms do not include attachments such as research articles, letters or leaflets (for copyright
reasons).We return comments forms that have attachments without reading them. The stakeholder may resubmit the form without attachments, but it must be received by the deadline.
You can see any guidance and quality standards that we have produced on topics related to this quality standard by checking NICE Pathways.
Note: We reserve the right to summarise and edit comments received during consultations, or not to publish them at all, if we consider the comments are too long, or publication would be unlawful or otherwise inappropriate.
Comments received from registered stakeholders and respondents during our consultations are published in the interests of openness and transparency, and to promote understanding of how recommendations are developed. The comments are published as a record of the comments we received, and are not endorsed by NICE, its officers or advisory Committees.
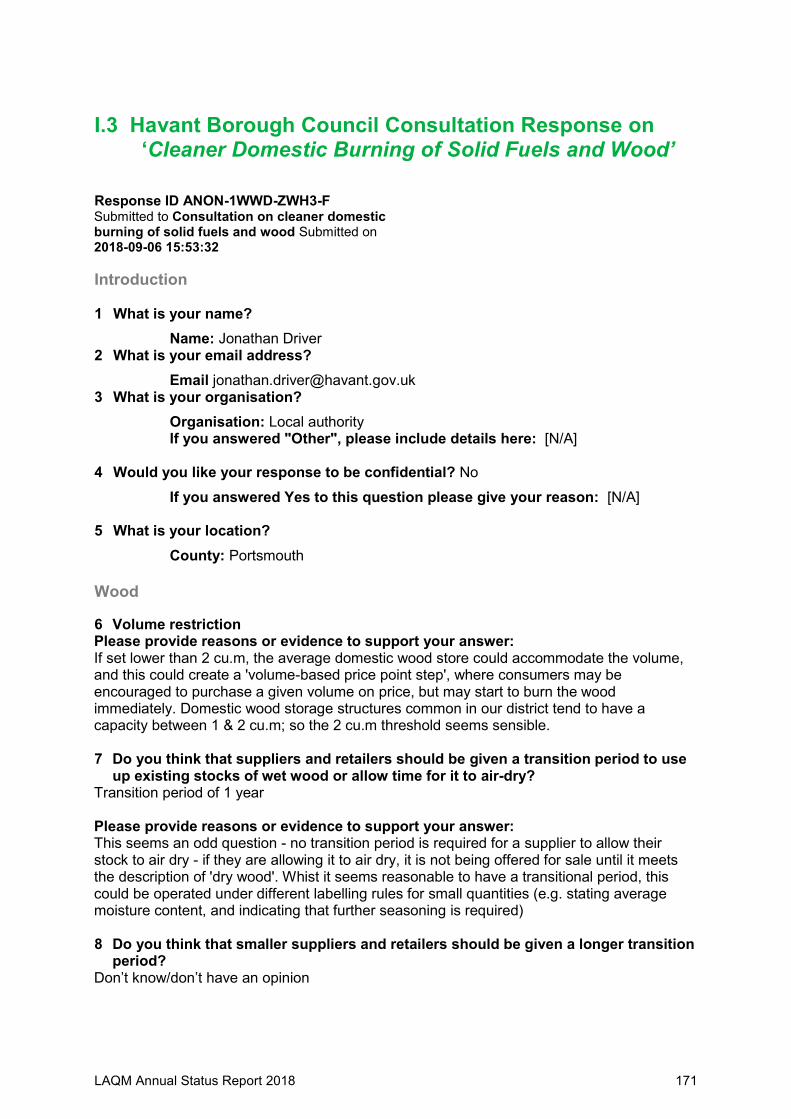
LAQM Annual Status Report 2018 171
I.3 Havant Borough Council Consultation Response on ‘Cleaner Domestic Burning of Solid Fuels and Wood’
Response ID ANON-1WWD-ZWH3-F Submitted to Consultation on cleaner domestic burning of solid fuels and wood Submitted on 2018-09-06 15:53:32
Introduction 1 What is your name?
Name: Jonathan Driver 2 What is your email address?
Email [email protected] 3 What is your organisation?
Organisation: Local authority If you answered "Other", please include details here: [N/A]
4 Would you like your response to be confidential? No
If you answered Yes to this question please give your reason: [N/A]
5 What is your location?
County: Portsmouth
Wood
6 Volume restriction Please provide reasons or evidence to support your answer: If set lower than 2 cu.m, the average domestic wood store could accommodate the volume, and this could create a 'volume-based price point step', where consumers may be encouraged to purchase a given volume on price, but may start to burn the wood immediately. Domestic wood storage structures common in our district tend to have a capacity between 1 & 2 cu.m; so the 2 cu.m threshold seems sensible. 7 Do you think that suppliers and retailers should be given a transition period to use
up existing stocks of wet wood or allow time for it to air-dry? Transition period of 1 year Please provide reasons or evidence to support your answer: This seems an odd question - no transition period is required for a supplier to allow their stock to air dry - if they are allowing it to air dry, it is not being offered for sale until it meets the description of 'dry wood'. Whist it seems reasonable to have a transitional period, this could be operated under different labelling rules for small quantities (e.g. stating average moisture content, and indicating that further seasoning is required) 8 Do you think that smaller suppliers and retailers should be given a longer transition
period? Don’t know/don’t have an opinion

LAQM Annual Status Report 2018 172
9 Seasoning instructions Agree
10 Do you agree or disagree that wood fuel suppliers should be required to be members of a certification scheme that provides assurance(via testing and auditing) that the wood is of a moisture content of 20% or less?
Disagree
11 Do you agree or disagree that retailers selling wood should be legally required to store the wood in such a way that it will not becomewet?
Yes
12 In order to comply with the proposal to require all businesses selling wood in volumes under 2m3 to ensure that it is dried to below 20% moisture, what adjustments, if any, would your business need to make?
Other (please specify) Other:: Not applicable (not a business respondent)
13 Would you like to provide any further comments or evidence on our proposals or the questions in this section?
Further comments or evidence on our proposals: Q10 - should be a trading standards function, similar to petrol retail dispensing checks. Q11 - depends on state of wood - unsplit logs will season without cover to a point, split logs (ready for use without further size reduction) will be more susceptible to moisture fluctuation in line with storage conditions. The legal requirement should probably only apply to split logs (e.g. sized for direct use)
Coal
14 Do you agree or disagree that government should phase out the use of traditional house coal for domestic combustion?
Disagree 15 If you agree, what would be the most appropriate end date for phasing out the use
of traditional house coal for domestic combustion? Other Please provide reasons or evidence to support your answer: [N/A]
16 In phasing out the use of traditional house coal as a domestic fuel, what do you consider is a reasonable transition period to allowindustry and householders to use up existing stocks?
Don’t know/don’t have an opinion
17 Do you agree or disagree that this policy should apply to all businesses? Neither agree nor disagree
18 If you disagree, which of the following should apply? Please provide details of which businesses should be exempt and your reasoning.: [N/A]
19 In phasing out traditional house coal as a domestic fuel, government is minded to apply the phase-out nationwide across England. Do you agree or disagree?
- Disagree

LAQM Annual Status Report 2018 173
- Coal sales to be phased out in urban areas only
20 Would you like to provide any further comments or evidence on our proposals or the questions in this section?
Extra comments coal: Q14 - the preamble appears to be confusing the issue of high carbon fuel, and 'polluting' fuel. Anthracite is low smoke because it is high carbon density/purity. If the goal is carbon reduction, then the Government should look at efficiency (as CO2 emission/BTU), and act accordingly. If the goal is to improve Air Quality, then there is a reduced impetus to restrict use of house coal in rural areas, where background / local ambient levels of air pollution are much lower. Q19 - see rationale above. If reduction of air pollution is the principle aim, then measures should focus on urban areas where air quality is poorest, and measures will have the greatest beneficial effect.
Manufactured solid fuels
21 Do you agree or disagree that government should introduce a standard for all manufactured solid fuels which confirms they are below 2% sulphur and meet a smoke emission limit of 5g /hr?
Neither agree nor disagree 22 In introducing a sulphur and smoke emission standard, do you consider that there
should be a transition period for suppliers and retailers? Transition period of 1 year Please provide reasons or evidence to support your answer: All businesses need time to adjust to a changed regulatory environment, but this should be reasonably limited, so as not to unduly delay realisation of emissions benefits. 23 Do you agree or disagree that, over time, the 2% sulphur limit should be further
reduced to 1% sulphur? Agree – some other percentage (please state below) Other:: Should avoid setting standards that are so technically challenging to achieve as to be cost prohibitive, as this will directly impact those in fuel poverty who rely upon solid fuels. 24 Do you agree or disagree that government should introduce a clear labelling
requirement to demonstrate that fuels meet the standard? Agree 25 In order to comply with the proposal to phase out traditional house coal and apply
sulphur and smoke emissions standards to all solid fuels, what adjustment, if any, would your business need to make?
Other (please specify) Other:: Not applicable (not a business respondent)

LAQM Annual Status Report 2018 174
26 Would you like to provide any further comments or evidence on our proposals or
the questions in this section? Extra comments MSF: Q21 - Proposals are to apply standards to "all solid fuels". How does <20% moisture content wood perform on the smoke test? Unless of a materially different character, smoke emission standards should not create a conceptual 'disparity' between permitted emissions from different fuel types. Clear labelling could allow manufactured fuels to compete on low-smoke as a mark of quality (i.e. leg'n sets min. standard to be achieved [max. smoke], and the market competes on product offerings that better that standard). Q23 - transition for manufacturers must necessarily be harmonised with, or shorter than that given to retailers, otherwise a situation will be created where there will be a mis-match between permitted production and banned sales (in this market). Longer transition for manufacturers may work if there is export demand.
Carbon reductions
27 Do you agree or disagree that government should, over the longer term, introduce a requirement that all manufactured solid fuels havea minimum 30% biomass content?
Agree – please stage percentage below Suggested percentage: Unsure as to % - dependent on technical feasibility and availability of suitable biomass feedstock.
28 For businesses: If government mandated a biomass content how long would it take you to adjust?
Not Answered
29 Would you like to provide any further comments or evidence on our proposals or the questions in this section?
Extra comments biomass: Support minimum % biomass content for solid fuels; though would be cautious about being too prescriptive if this might discourage manufacturers from bettering that standard, or consumers from purchasing fuels with a greater %biomass. Carbon tax works as a sliding scale, providing an offset to higher manufacturing costs for high biomass products, in comparison to those produced with a greater proportion of cheaper pet-refinery by-products. This suggests that taxation is a suitable, and more flexible means of incentivising innovation.
Exemptions
30 We are interested in your views on how government should support those in fuel poverty with this transition away from high-carbon fossil fuels
Fuel poverty: Ultimately, I believe that grants for replacement of old / inefficient / dangerous / polluting appliances are likely to be required. Grants should be available to landlords (or installation within tenanted property), and eligible appliances should not include technologies inappropriate to the property (e.g. low output electrical appliances such as air source heat pumps)

LAQM Annual Status Report 2018 175
31 Would you like to provide any further comments or evidence on this section?
Extra comments exemptions: Those on low incomes with solid fuel appliances are likely to be burning not only fuels, but also waste. They are also less likely to be in well maintained properties, where chimneys structures are more likely to be defective / compromised, and less likely to be regularly swept. Use of a variety of poor quality fuels (incl. wastes) will exacerbate this. Users in fuel poverty may well be at greater personal risk - and on this basis I would expect that accelerating / facilitating the transition would be preferable to providing exemptions which would serve to delay it. Implementation
32 What do you think would be an appropriate level of fixed penalty related to the sale of domestic burning products?
Other (please specify) Other:: Businesses engaged in such retail activity are likely to be 'micro scale' & / or opportunistic in nature (e.g. traders of diverse product range), and may (therefore) have poor technical knowledge in this area, and may 'inadvertently' contravene regulations. Given this, FPN should be a deterrent but not ruinous (e.g. if unable to pay, significant inflation could occur through debt collection proceedings). Perhaps £250?
33 Do you think that local authorities should be required to use any funds from this for a specific purpose?
No Please specify:: I would expect the amount of revenue to be low, so ring-fencing likely ineffective (unless permitted expenditure is for inexpensive items, procurable to a value < the value of 1 no. FPN. 34 Do you agree or disagree that this will deliver our objective of establishing a clear
and straightforward enforcement policy, minimising burdens for Local Authorities?
Yes Please suggest any alternative proposal that you consider to be more effective in delivering our objectives: Yes insofar as retail sale. I would consider that steps should be taken to improve enforcement of fuel 'use', complementary to those outlined for fuel 'retail' 35 Government will provide advice and guidance to retailers selling domestic burning products. What format should this take? Information provided with the product Other:: Probably all of the above, but on the retail packaging of manufactered fuels means the informaiton will be available everywhere that fuel is offered for sale.

LAQM Annual Status Report 2018 176
Information
36 What information do you think would be helpful to enable householders to reduce their impact from domestic burning?
Impact reduction information: - The advice given in the Burn Right video tutorial is not in the leaflet - this could helpfully
be added. - Some basic information on fuel species would also be helpful - e.g. avoid oak, horse
chestnut and lime as energy yield/volume is poor, woods are smoky, or tend to self extinguish at low temperatures. Could also provide advice on woods that are potentially harmful to chimney linings due to sap content or tendency to produce smut.
37 What do you think would be the most effective way of communicating information
to householders? - Through retailers, Appliance manufacturers, Fuel suppliers, - Chimney sweeps, Social media, Doctors surgeries Other: [N/A]
38 For householders: Where do you buy your fuel? Other::
Additional suggestions
39 Do you have any additional comments/views that you wish to provide on the content of this consultation?
Consultation feedback: 1) Air pollution reduction measures should be targeted at locations where air pollution is a problem - e.g. domestic fuel burning in densely populated urban environments, and not in sparsely populated rural locations where the net actual impact of domestic solid fuel is substantially less (albeit that it may make a high proportional contribution to very low levels of local emissions) 2) Measures should be compatible with climate change carbon reduction targets - I would not wish carbon neutral fuels to be pushed out of the market, or discouraged from entry, on the basis of marginal failure to meet an inflexible emissions performance standard (which may ignore non-pollutant benefits, such as diverting waste from landfill, neutral carbon, local source etc.). This consultation places air quality as the primary risk to human health, but it should be acknowledged the EU recognises Climate Change to be a superlative concern - in terms of it's impact on health, the environment, property and the economy. The harmful impact of climate change could dwarf the harms of locally poor ambient air quality. 3) This consultation does not address the users of fuel. Revised nuisance guidance (for example) could serve to empower local authorities to act more decisively in response to a problem caused by inappropriate use of a solid fuel appliance, where the fuel may be compliant.

LAQM Annual Status Report 2018 177
Appendix J: Havant Borough Council Local Plan 2036 Draft Air Quality Policy
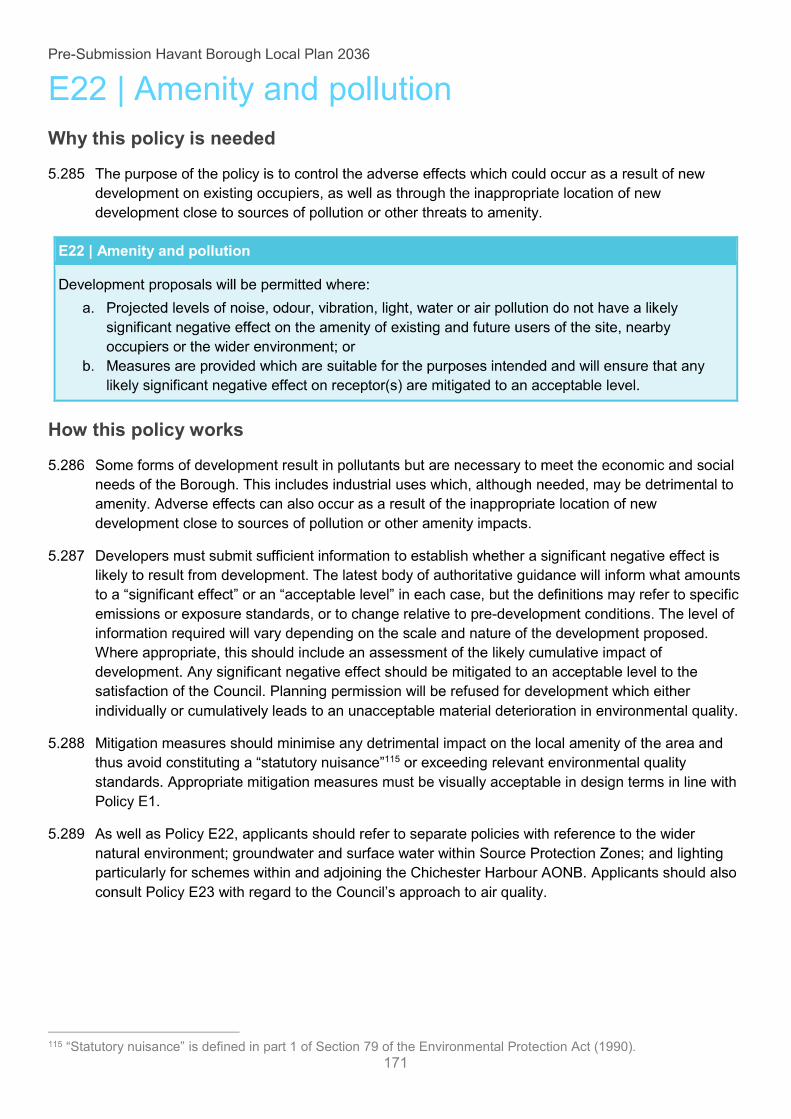
Why this policy is needed
How this policy works
“ ” “ ” cific
constituting a “statutory nuisance”
the Council’s approach to air quality.
“Statutory nuisance” is defined in part 1 of Section 79 of the Environmental Protection Act (1990).

Why this policy is needed
its

How this policy works
The Council’s
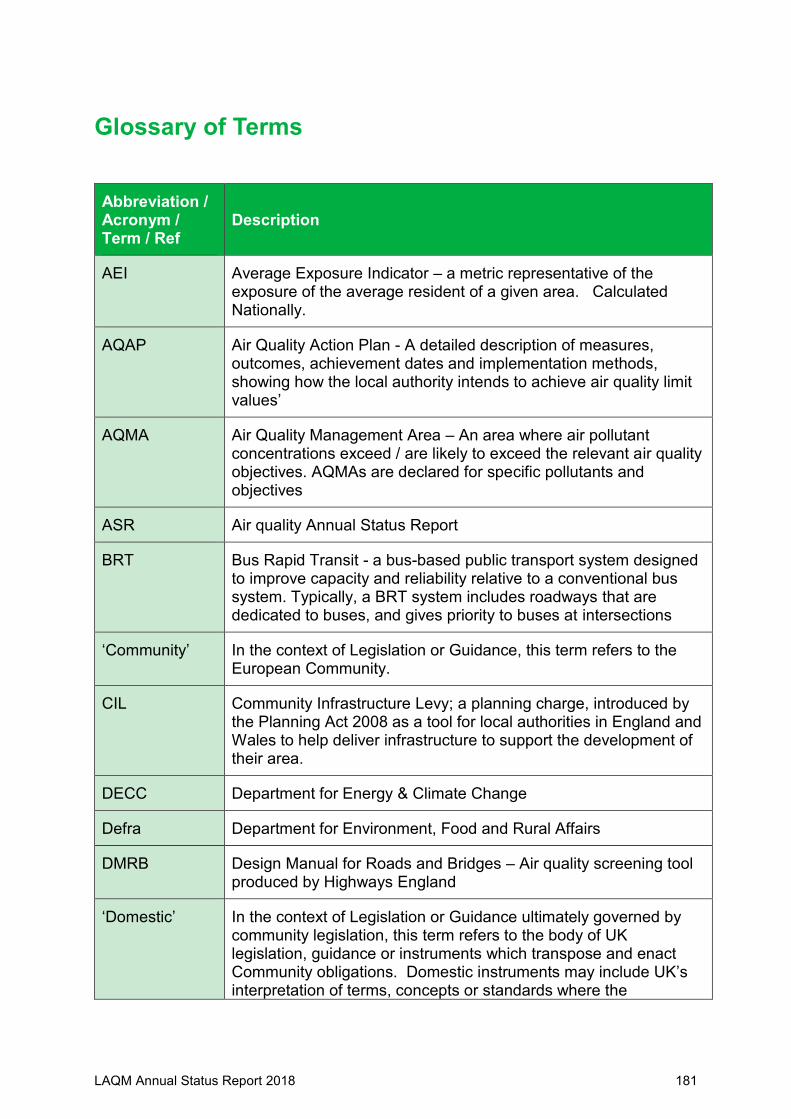
LAQM Annual Status Report 2018 181
Glossary of Terms
Abbreviation / Acronym / Term / Ref
Description
AEI Average Exposure Indicator – a metric representative of the exposure of the average resident of a given area. Calculated Nationally.
AQAP Air Quality Action Plan - A detailed description of measures, outcomes, achievement dates and implementation methods, showing how the local authority intends to achieve air quality limit values’
AQMA Air Quality Management Area – An area where air pollutant concentrations exceed / are likely to exceed the relevant air quality objectives. AQMAs are declared for specific pollutants and objectives
ASR Air quality Annual Status Report
BRT Bus Rapid Transit - a bus-based public transport system designed to improve capacity and reliability relative to a conventional bus system. Typically, a BRT system includes roadways that are dedicated to buses, and gives priority to buses at intersections
‘Community’ In the context of Legislation or Guidance, this term refers to the European Community.
CIL Community Infrastructure Levy; a planning charge, introduced by the Planning Act 2008 as a tool for local authorities in England and Wales to help deliver infrastructure to support the development of their area.
DECC Department for Energy & Climate Change
Defra Department for Environment, Food and Rural Affairs
DMRB Design Manual for Roads and Bridges – Air quality screening tool produced by Highways England
‘Domestic’ In the context of Legislation or Guidance ultimately governed by community legislation, this term refers to the body of UK legislation, guidance or instruments which transpose and enact Community obligations. Domestic instruments may include UK’s interpretation of terms, concepts or standards where the

LAQM Annual Status Report 2018 182
Community instrument is either not explicit, or devolves decision-making / interpretation.
ECJ European Court of Justice
ECP England Coastal Path
EU European Union
FDMS Filter Dynamics Measurement System
GPDO General Permitted Development Order (England); legislation governing deemed consent for certain types of development. 1995 (SI No. 418), and 2015 (SI No. 596), as amended.
HBC Havant Borough Council
LAQM Local Air Quality Management
LES / LEZ Low Emission Strategy / Low Emission Zone
LEV / ULEV (EV)
Low Emission Vehicle / Ultra-Low Emission Vehicle (Electric Vehicle). ULEV may refer to electric vehicles or other vehicles with alternative power-trains, EV refers to vehicles with 100% electric motor propulsion (battery or Hydrogen)
LEP / Solent LEP
Local Enterprise Partnership. The Solent LEP is a partnership between the business community, Further & Higher Education Providers and Local Authorities. It’s priority interests are in promoting skills, business support, innovation, infrastructure, strategic sectors and inward investment.
Linked Trip(s) Refers to a journey taken by any travel mode (but usually referring to journeys by private motor car) where more than one reason for travel (purpose) may be conveniently accommodated at the destination. With reference to journeys by car, a trip is ‘linked’ if at least two trip purposes may be served without the need to move the vehicle from the initial parking location. If the vehicle needs to be moved, access to the secondary destination is a ‘pass-by’ trip. Referred to in the context of parking policy, and co-location of facilities & services.
LZC Low or Zero Carbon (energy source / generation, or ‘low energy demand’ technology relative to conventional technology)
MDA ‘Major Development Area’ – in Waterlooville, referring to the land West of the A3 London Road, falling within both the Havant and Winchester administrative areas, where over 2500 new dwellings are under construction.
NCN National Cycle Network

LAQM Annual Status Report 2018 183
NERT National Exposure Reduction Target - concentration reduction target, relative to concentrations for a specific base year.
NO2 Nitrogen Dioxide
NOx Nitrogen Oxides
NPPF National Planning Policy Framework – Central Government policy framework which guides formulation of the local plan and the interpretation of terms used in local planning policy.
OAN Objectively Assessed Need (Housing Target)
PCC Portsmouth City Council
Personal Health The health of an individual within the population
PIA Personal Injury Accident – the levels of recorded PIA’s is relevant to the need for transport infrastructure upgrades
PM10 Airborne particulate matter with an aerodynamic diameter of 10µm (micrometres or microns) or less
PM2.5 Airborne particulate matter with an aerodynamic diameter of 2.5µm or less
‘Volatile’ PM2.5 refers to solids characterised by high vapour pressure & rapid evaporation – typically organic compounds of Carbon & Hydrogen only (Hydrocarbons) or Carbon, Hydrogen & other elements or groups (Volatile Organic Carbon) produced by incomplete combustion of hydrocarbon fuels. Organic compounds from non-combustion sources may also contribute to the total mass of Volatile PM2.5, and some volatile components may be inorganic in nature (e.g. mercury).
‘Non-Volatile’ PM2.5 in contrast refers to solids characterised by low vapour-pressure, typically requiring significant input of external energy to drive a phase-change to a either a vapourous- or gaseous- state. These compounds tend to be more persistent, but may still be reactive in the environment.
PRoW Public Right of Way
‘Public Health’ /
‘Public Health Efffect’
‘Public Health’ refers to the health of a population-group (in this report, typically referring to the residents of the Borough), as an aggregate of average personal health.
‘Public Health effect’ would refer the overall effect within a population against a population level health or cost metric – e.g. population level excess mortality, or the aggregate cost associated with treating arising minor health impacts upon individuals.

LAQM Annual Status Report 2018 184
PfSH Partnership for South Hampshire (formerly the Partnership for Urban South Hampshire, ‘PUSH’). A group comprising 11 Local Authorities, the group has a remit for working collaboratively across the region to sustainably grow the local economy – engaging with private sector businesses, universities and the voluntary sector through the Solent LEP in a concerted effort to identify and align business priorities, local policies and infrastructure investment.
QA/QC Quality Assurance and Quality Control
‘Relevant Exposure’
or
‘Relevant Location’
Relevant Exposure is an undefined term used extensively within the Statutory Guidance to The Environment Act 1995 refer to locations where the Ambient Air Quality Objectives (SI 928, 2000) and/or Limit Values (SI1001, 2010) directly apply – for example, at schools, or residential properties.
‘Non-relevant exposure’ may refer to exposure of persons to air pollutants-:
• at places where the standards do not apply – for example, at places of work, on the highway/footpaths, or;
• where measured pollutants do not represent ambient concentrations – e.g. emissions from a point source, pollutants released within a building, or at locations adjacent to a busy road junction
Non-relevant exposure may include exposure of persons to levels of air pollutants in excess of ambient objective or limit standards, and so may contribute to, or cause harm to the health of individuals or more generally to the local population.
‘Relevant-’, or ‘Non-Relevant-’, Locations refer to places where the ambient objective or limit standards either do, or do not apply (respectively - i.e. the location criteria where ‘relevant exposure’ may or may not be said to occur)
RTPI Royal Town Planning Institute
SEHRT The South East Hants Rapid Transit Board - comprising the Local Transport Authorities (county & unitary), and public transport operators First, and Stagecoach.
S106 Refers to Section 106 of the Town & Country Planning Act 1990 c.8 (as amended). S106 agreements are a mechanism which make a development proposal acceptable in planning terms, that would not otherwise be acceptable. They are focused on site specific mitigation of the impact of development.
S278 Refers to Section 278 of the Highways Act 1980 c.66 (as amended). S278 provides a mechanism for developers to enter into a legal agreement with the council to make alterations or

LAQM Annual Status Report 2018 185
improvements to a public highway, as part of a planning application.
SO2 Sulphur Dioxide
SPD Supplementary Planning Document
SPG Supplementary Planning Guidance (Document)
STOR “Short Term Operating Reserve” power generation – small power plants (typically containerised generator sets) that can be quickly brought on-line to manage peak local power demands, and plug shortfalls caused by unreliable renewable power inputs to the local grid.
Tiger Crossing Like a zebra crossing, but with cycling permitted.

LAQM Annual Status Report 2018 186
References LAQM Policy, Procedural Guidance, Plans, Tools & Data Resources Abatement cost guidance for valuing changes in air quality, DEFRA, May 2013 (https://www.gov.uk/government/uploads/system/uploads/attachment_data/file/197898/pb13912-airquality-abatement-cost-guide.pdf) Air Pollution Alert Service (DEFRA, Met Office) (https://uk-air.defra.gov.uk/) Air Quality Plan for the achievement of EU air quality limit value for nitrogen dioxide (NO2) in Portsmouth Urban Area (UK0012), DEFRA. 2015 [Withdrawn] (https://www.gov.uk/government/publications/air-quality-plan-for-nitrogen-dioxide-no2-in-uk-2015-zone-plans) Air Quality Plan for the achievement of EU air quality limit value for nitrogen dioxide (NO2) in SouthEast (UK0031), DEFRA. 2015 [Withdrawn] (https://www.gov.uk/government/publications/air-quality-plan-for-nitrogen-dioxide-no2-in-uk-2015-zone-plans) Air quality plan for nitrogen dioxide (NO2) in UK (Overview, Detailed, Technical) (DEFRA, DfT, July 2017) (https://www.gov.uk/government/publications/air-quality-plan-for-nitrogen-dioxide-no2-in-uk-2017) Draft Clean Air Strategy 2018 (https://consult.defra.gov.uk/environmental-quality/clean-air-strategy-consultation/) Supplement to the UK plan for tackling roadside nitrogen dioxide concentrations (DEFRA, DfT, Oct 2018) (https://assets.publishing.service.gov.uk/government/uploads/system/uploads/attachment_data/file/746100/air-quality-no2-plan-supplement.pdf) Automatic Urban & Rural Network Data Downloads (DEFRA, Web Resource) (https://uk-air.defra.gov.uk/data/data_selector) Automatic Urban & Rural Network Monitoring Location Context / Details Search Tool (DEFRA, Web Resource) (https://uk-air.defra.gov.uk/networks/network-info?view=aurn) Local Air Quality Management Policy Guidance (PG 16), DEFRA, April 2016 (https://laqm.defra.gov.uk/documents/LAQM-PG16-April-16-v1.pdf) Local Air Quality Management Technical Guidance (TG 16), DEFRA, April 2016 (https://laqm.defra.gov.uk/technical-guidance/index.html) National Atmospheric Emissions Inventory (Website) (http://naei.beis.gov.uk/) National Modelled Background Ambient Air Pollution (DEFRA) (https://laqm.defra.gov.uk/review-and-assessment/tools/background-maps.html) Non-Network Automatic Air Pollution Data Downloads (Sussex Area, Website) (http://www.sussex-air.net/Default.aspx) Environment Bill: Policy Paper, DEFRA, Dec 2018 (https://www.gov.uk/government/publications/draft-environment-principles-and-governance-bill-2018/environment-bill-policy-paper)

LAQM Annual Status Report 2018 187
Environment Bill: Summer Policy Statement, DEFRA, Jul 2019 (https://www.gov.uk/government/publications/draft-environment-principles-and-governance-bill-2018/environment-bill-summer-policy-statement-july-2019#improving-the-air-we-breathe)
Environmental Accreditation Schemes for Business Carbon Architecture ‘Green Mark’ Scheme for Businesses (Website) (http://www.greenmark.co.uk/) Institute of Environmental Management & Assessment Eco-Management and Audit Scheme (EMAS, Website) (http://ems.iema.net/emas) Investors in the Environment Accreditation Scheme & Green Business Directory (iiE, Website) (https://www.iie.uk.com/)
Air Quality Campaign Information 10:10 Climate Action environmental protection NGO (Third Party Website) (https://1010uk.org/) Friends of the Earth - environmental protection NGO (Third Party Website) (https://friendsoftheearth.uk/clean-air) Global Action Plan National Clean Air Day; 21st June (Third Party Website) (https://www.cleanairday.org.uk/) Global Action Plan Clean Air Day 2018 Impact Report (https://www.cleanairday.org.uk/Handlers/Download.ashx?IDMF=88367ca5-e3df-45a6-86bf-9d9f62496f3e) Greenpeace - environmental protection NGO (Third Party Website) (https://www.greenpeace.org.uk/what-we-do/climate/airpollution/) Living Streets, Charity for Everyday Walking; information, tips & resources for residents and campaigners (Third Party Website) (https://www.livingstreets.org.uk/) UKGBC Open Letter to Secretaries of State for HCLG, and BEIS (UK Green Building Council, Mar 2018) (https://www.ukgbc.org/wp-content/uploads/2018/03/Letter-to-Secretaries-of-State.pdf) #AirWeShare, Kings College London & Hubbub (Charity) campaign, personal exposure focus (Third Party Website) (https://www.airweshare.co.uk/) The Air Team, volunteer-led Parents air-quality campaign group (Third Party Website) (https://airteam.uk/)
Product Information for Consumers, Grant Schemes & Other Information for Local Residents & Businesses Authorised Fuels for Solid Fuel Appliances (Government Web Publication) (https://smokecontrol.defra.gov.uk/fuels.php) Burnright - consumer information on fuel and woodburner use (Third-Party Web Resource) (https://burnright.co.uk/) Chartered Institute of Personnel and Development (Third-Party Website)

LAQM Annual Status Report 2018 188
(https://www.cipd.co.uk/news-views/policy-engagement/flexible-working) Energy Saving Trust, energy-saving tips (Third-Party Web Resource) (https://www.energysavingtrust.org.uk/home-energy-efficiency/energy-saving-quick-wins) Hampshire County Council Recycling Centre Locator (Local Authority Web Publication) (https://www.hants.gov.uk/wasteandrecycling/recyclingcentres) Havant Borough Council Green Waste Collection Service (Local Authority Web Publication) (https://www.havant.gov.uk/garden-waste) Low Emission Vehicles ‘Plug-in’ grant information (Government Web Publication) (https://www.gov.uk/plug-in-car-van-grants/what-youll-get) Quora Consumer Information Report / Article – Indoor Air Purifiers (Third-Party Web Resource) (https://www.quora.com/Do-air-purifiers-remove-PM2-5) Ready to Burn - consumer information on fuel and woodburner use (Third-Party Web Resource) (https://www.readytoburn.org/defra-wood-burning-guide/) WhatCar? Consumer Information Database (Third-Party Web Resource) (https://www.whatcar.com/truempg/mpg-calculator) Honest John; Motor Car Specific Consumer Information Database (Third-Party Web Resource) (https://www.honestjohn.co.uk/real-mpg/) The MPG; Motor Car Specific Consumer Information Database (Third-Party Web Resource) http://www.thempg.co.uk/ Woodsure ‘Ready to Burn’ accreditation scheme for domestic fuel (wood) (Third-Party Web Resource) (https://www.readytoburn.org/)
Travel Planning Information & Sustainable Travel Discount Schemes CycleStreets Cycle Network Journey Planner – with Distance, Journey Time and Elevation Profiles, CO2 Savings & Calorie Calculator (Third Party Web Resource) (https://www.cyclestreets.net/) Hampshire County Council Travel Planning Information for Businesses (Local Authority Web Publication) (https://www.hants.gov.uk/transport/developers/travelplans) Living Streets Park & Stride Scheme (https://www.livingstreets.org.uk/media/2035/park-and-stride-print.pdf) Modeshift Stars – Best Practice in Sustainable School Travel (Local Authority Supported Web Resource) (https://www.modeshiftstars.org/) MyJourney Hampshire – Multi-Modal Travel Information and Journey Planner –with Distance, Journey Time, Cost, Calorie, and CO2 calculator (walking, cycling, bus, rail, ferry & car) (Local Authority Supported Web Resource) (https://myjourneyhampshire.com/) National Rail Journey Planner & Engineering Works Checker (Third Party Web Resources) (http://www.nationalrail.co.uk/service_disruptions/currentAndFuture.aspx) Travel Green Network Easit Travel Discount Scheme for Businesses (Third Party Website)

LAQM Annual Status Report 2018 189
(https://www.easit.org.uk/)
Other Technical Reports, Air quality and social deprivation in the UK: an environmental inequalities analysis, DEFRA, June 2006 (Ref; AEAT/ENV/R/2170) (Research Report) (https://uk-air.defra.gov.uk/assets/documents/reports/cat09/0701110944_AQinequalitiesFNL_AEAT_0506.pdf) Air Quality Expert Group – Mitigation of United Kingdom PM2.5 Concentrations (Ref: PM14161), For DEFRA, 2013 (https://uk-air.defra.gov.uk/assets/documents/reports/cat11/1508060903_DEF-PB14161_Mitigation_of_UK_PM25.pdf) “Contribution of wood burning to PM10 in London”. Atmospheric Environment. 87: 87–94. DOI:10.1016/j.atmosen v.2013.12.037 (Fuller, G. W., Tremper, A. H., Baker, T. D. et al, for the European Commission, May 2014) (http://ec.europa.eu/environment/integration/research/newsalert/pdf/373na2_en.pdf) CMS2590: HAYLING ISLAND CYCLING AND PEDESTRIAN IMPROVEMENTS FEASIBILITY REPORT v2.1, Feb 2017 (Technical Report) (https://www.havant.gov.uk/hayling-island-pedestrian-cycle-and-access-improvements) Diffusion Tubes for Ambient NO2 Monitoring: Practical Guidance (A Report to DEFRA and the Devolved Administrations), AEA Technologies (Ref ED48673043 Issue 1a), Feburary 2008 (Research Report) (https://laqm.defra.gov.uk/documents/0802141004_NO2_WG_PracticalGuidance_Issue1a.pdf) Energy and Climate Change Public Attitudes Tracker: Wave 21 (Official Government Statistics) (https://www.gov.uk/government/statistics/energy-and-climate-change-public-attitude-tracking-survey-wave-21) Environmental equity, air quality, socioeconomic status and respiratory health: a linkage analysis of routine data from the Health Survey for England (Benedict W Wheeler, Yoav Ben-Shlomo; Research Report; 2010) (http://jech.bmj.com/content/59/11/948) Havant Borough Sustainability & Energy Information (Local Authority Web Resource) (https://www.havant.gov.uk/sustainability-and-energy) Havant Masterplan, Denvilles & Emsworth Strategic Development Website (Includes outcomes from Design Workshops) (https://denvillesemsworth.commonplace.is/schemes/denvillesemsworth/overview/details) NO2 Diffusion Tubes for LAQM: Guidance Note for Local Authorities (A Report to DEFRA and the Devolved Administrations), AEA Technologies (Ref AEAT/ENV/R/2140 issue1), March 2006 (Research Report) (https://uk-air.defra.gov.uk/library/reports?report_id=399) Public Health England; Public Health Outcomes Framework (Official Statistics; September 2019) (http://www.phoutcomes.info/public-health-outcomes-framework#gid/1000043) Partnership for Urban South Hampshire: Air Quality Impact Assessment Ref: ED 10415100 Iss.3 (PUSH Authorities, Ricardo-AEA Ltd., Sept 2018) (Available from landing page at: https://www.havant.gov.uk/localplan/evidence-base) Research Report 23, ISBN 0 7176 2567 2 (2003); Flueless gas fires – concentration of carbon monoxide, carbon dioxide, and nitrogen dioxide, and particulate level produced in use, HSE, 2004 (Research Report)
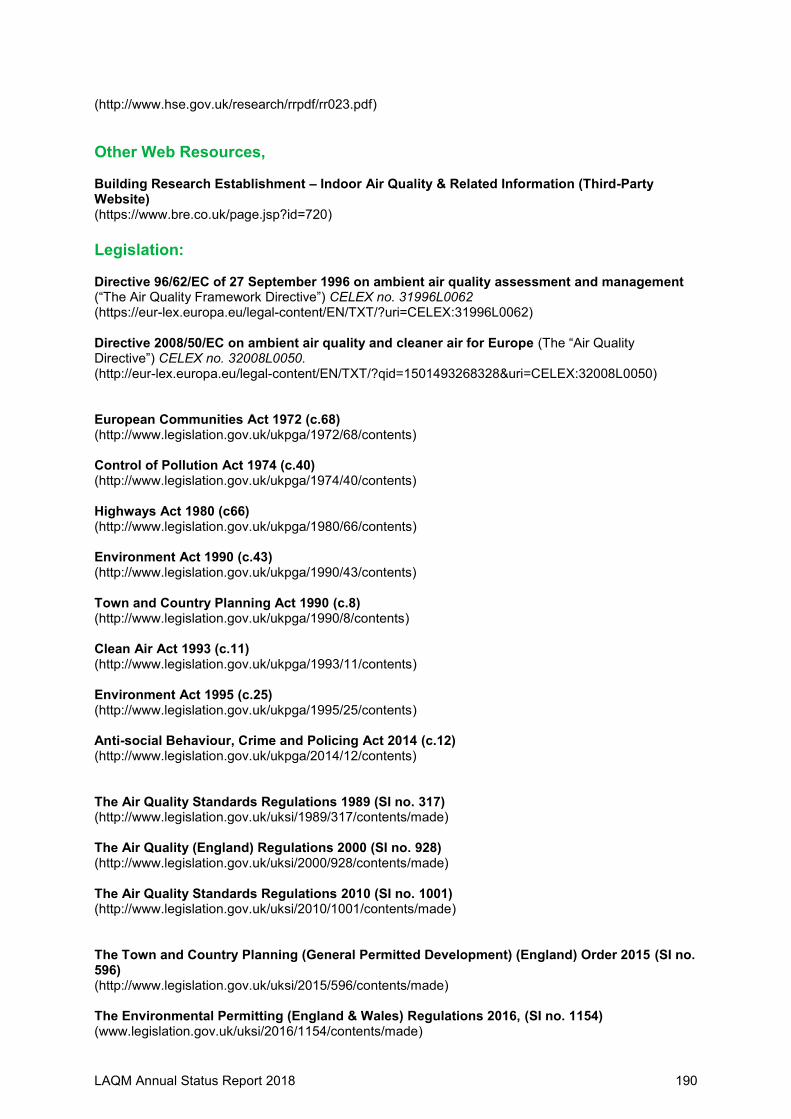
LAQM Annual Status Report 2018 190
(http://www.hse.gov.uk/research/rrpdf/rr023.pdf)
Other Web Resources, Building Research Establishment – Indoor Air Quality & Related Information (Third-Party Website) (https://www.bre.co.uk/page.jsp?id=720)
Legislation: Directive 96/62/EC of 27 September 1996 on ambient air quality assessment and management (“The Air Quality Framework Directive”) CELEX no. 31996L0062 (https://eur-lex.europa.eu/legal-content/EN/TXT/?uri=CELEX:31996L0062) Directive 2008/50/EC on ambient air quality and cleaner air for Europe (The “Air Quality Directive”) CELEX no. 32008L0050. (http://eur-lex.europa.eu/legal-content/EN/TXT/?qid=1501493268328&uri=CELEX:32008L0050) European Communities Act 1972 (c.68) (http://www.legislation.gov.uk/ukpga/1972/68/contents) Control of Pollution Act 1974 (c.40) (http://www.legislation.gov.uk/ukpga/1974/40/contents) Highways Act 1980 (c66) (http://www.legislation.gov.uk/ukpga/1980/66/contents) Environment Act 1990 (c.43) (http://www.legislation.gov.uk/ukpga/1990/43/contents) Town and Country Planning Act 1990 (c.8) (http://www.legislation.gov.uk/ukpga/1990/8/contents) Clean Air Act 1993 (c.11) (http://www.legislation.gov.uk/ukpga/1993/11/contents) Environment Act 1995 (c.25) (http://www.legislation.gov.uk/ukpga/1995/25/contents) Anti-social Behaviour, Crime and Policing Act 2014 (c.12) (http://www.legislation.gov.uk/ukpga/2014/12/contents) The Air Quality Standards Regulations 1989 (SI no. 317) (http://www.legislation.gov.uk/uksi/1989/317/contents/made) The Air Quality (England) Regulations 2000 (SI no. 928) (http://www.legislation.gov.uk/uksi/2000/928/contents/made) The Air Quality Standards Regulations 2010 (SI no. 1001) (http://www.legislation.gov.uk/uksi/2010/1001/contents/made) The Town and Country Planning (General Permitted Development) (England) Order 2015 (SI no. 596) (http://www.legislation.gov.uk/uksi/2015/596/contents/made) The Environmental Permitting (England & Wales) Regulations 2016, (SI no. 1154) (www.legislation.gov.uk/uksi/2016/1154/contents/made)

LAQM Annual Status Report 2018 191
Draft Environment (Principles and Governance) Bill (Cm9751); Dec 2018 (https://assets.publishing.service.gov.uk/government/uploads/system/uploads/attachment_data/file/766849/draft-environment-bill-governance-principles.pdf)
Other Government Policy, Briefings, Guidance, Advice Notes, Strategy, and Consultation Documents A Future Framework for Heat in Buildings (Call for Evidence) (Mar 2018);(BEIS, 2018) (https://www.gov.uk/government/consultations/a-future-framework-for-heat-in-buildings-call-for-evidence) Air Pollution in the UK 2017 (DEFRA, Sept 2018) (https://uk-air.defra.gov.uk/assets/documents/annualreport/air_pollution_uk_2017_issue_1.pdf) Air Pollution in the UK 2018 (DEFRA, Sept 2019) (https://uk-air.defra.gov.uk/assets/documents/annualreport/air_pollution_uk_2018_issue_1.pdf) Consultation on cleaner domestic burning of solid fuels and wood (DEFRA, Aug 2018) (https://assets.publishing.service.gov.uk/government/uploads/system/uploads/attachment_data/file/734636/domestic-burning-consultation-document.pdf) Draft Havant Borough Local Plan 2036 (Havant Borough Council, Jan 2018) (http://www.havant.gov.uk/localplan) Havant Energy Strategy 2016-2020 (Havant Borough Council, Feb 2016) (https://www.havant.gov.uk/sites/default/files/documents/Havant%20Energy%20Strategy%202016-2020_0.pdf) Havant borough heat demand mapping and energy masterplanning (‘Prosperity Havant’, Havant Borough Council, 2016) (https://www.havant.gov.uk/sites/default/files/documents/Havant%20Borough%20Heat%20demand%20mapping%20and%20masterplanning%20FINAL.pdf) Hampshire sustainable modes of travel for children and young people strategy – supporting healthy and safe movement for all (Hampshire County Council, Jan 2013) (https://documents.hants.gov.uk/childrens-services/Hampshire-sustainable-modes-of-transport-cyp-web.pdf) Hampshire County Council Walking Strategy (2015-2025; Published Jan 2016) (https://documents.hants.gov.uk/transport-strategy-documents/HampshireWalkingStrategy.pdf) Hampshire County Council Cycling Strategy (2015-2025; Published Sept 2015) (https://documents.hants.gov.uk/transport-strategy-documents/HampshireCyclingStrategy.pdf) Electricity Demand Reduction: Consultation on options to encourage permanent reductions in electricity use (Cm 8468, URN 12D/403 DECC, Nov 2012) (https://www.gov.uk/government/consultations/options-to-encourage-permanent-reductions-in-electricity-use-electricity-demand-reduction) National Audit Office Report on Air Quality: Policy Briefing (LgiU, Dec 2017) (https://www.lgiu.org.uk/briefing/national-audit-office-report-on-air-quality/) National Planning Policy Framework, HCLG 2012, 2018, 2019) (https://www.gov.uk/government/publications/national-planning-policy-framework--2) Objectively Assessed Need and Housing Targets: Technical advice note (2nd Ed.) (Planning Advisory Service, Peter Brett Associates, Jul 2015) (https://www.local.gov.uk/sites/default/files/documents/objectively-assessed-need-9fb.pdf)

LAQM Annual Status Report 2018 192
The Clean Growth Strategy: Leading the way to a low carbon future (BEIS, Oct 2017/Apr 2018) (https://www.gov.uk/government/publications/clean-growth-strategy) The Road to Zero: Next steps towards cleaner road transport and delivering our Industrial Strategy (DfT, July 2018) https://assets.publishing.service.gov.uk/government/uploads/system/uploads/attachment_data/file/739460/road-to-zero.pdf The State of the Environment: Air Quality (Environment Agency, July 2018) (https://assets.publishing.service.gov.uk/government/uploads/system/uploads/attachment_data/file/729820/State_of_the_environment_air_quality_report.pdf) Transport Energy Model Report: Moving Britain Ahead (DfT, 2018) https://assets.publishing.service.gov.uk/government/uploads/system/uploads/attachment_data/file/739462/transport-energy-model.pdf
Non-Government Standards, Guidance, Strategies & Reports WHO Air quality guidelines for particulate matter, ozone, nitrogen dioxide and sulfur dioxide, Summary of risk assessment, Global update WHO/SDE/PHE/OEH/06.02 (2005) (https://apps.who.int/iris/bitstream/handle/10665/69477/WHO_SDE_PHE_OEH_06.02_eng.pdf;jsessionid=E0718B13DA944C214CF1ACEB51268457?sequence=1) WHO Air Pollution Information (Third Party Web Resource) (https://www.who.int/airpollution/en/) Air Pollution: Outdoor air quality and health. NICE quality standard (Sept 2018) (https://www.nice.org.uk/guidance/GID-QS10067/documents/draft-quality-standard) “Clean Air for All” Factsheet (European Commission, Sept. 2016) (https://ec.europa.eu/info/publications/clean-air-all-factsheet_en) Rising to the Climate Crisis: A Guide for Local Authorities on Planning for Climate Change (TCPA, RTPI, May 2018) (https://www.rtpi.org.uk/media/3152143/Rising%20to%20the%20Climate%20Crisis.pdf) ‘Serving the Public Interest? The re-organisation of UK planning services in an era of reluctant outsourcing’ Royal Town Planning Institute (2019) (https://www.rtpi.org.uk/witpi) West Yorkshire Low Emissions Strategy 2016-2021(City of Bradford MDC, Calderdale-, Kirklees-, Wakefield-, Leeds City- Councils and West Yorkshire Combined Authority; Dec2016) (https://www.bradford.gov.uk/media/3590/west-yorkshire-low-emissions-strategy.pdf)