CICS TS for z/OS: Troubleshooting CICS - IBM
408
CICS Transaction Server for z/OS 5.6 Troubleshooting CICS IBM
-
Upload
khangminh22 -
Category
Documents
-
view
2 -
download
0
Transcript of CICS TS for z/OS: Troubleshooting CICS - IBM
CICS Transaction Server for z/OS5.6
Troubleshooting CICS
IBM
Note
Before using this information and the product it supports, read the information in Product Legal Notices.
This edition applies to the IBM® CICS® Transaction Server for z/OS®, Version 5 Release 6 (product number 5655-Y305655-BTA ) and to all subsequent releases and modifications until otherwise indicated in new editions.© Copyright International Business Machines Corporation 1974, 2021.US Government Users Restricted Rights – Use, duplication or disclosure restricted by GSA ADP Schedule Contract withIBM Corp.
Contents
About this PDF......................................................................................................ix
Chapter 1. Preliminary checks............................................................................... 1
Chapter 2. Classifying the problem.........................................................................5Using symptom keywords to classify problems..........................................................................................5Using the symptoms to classify the problem.............................................................................................. 6
CICS has stopped running......................................................................................................................6CICS is running slowly............................................................................................................................ 7A task fails to start..................................................................................................................................7A task is running slowly.......................................................................................................................... 7A task stops running at a terminal......................................................................................................... 8A transaction has abended.....................................................................................................................8You have obtained some incorrect output.............................................................................................8A storage violation has occurred............................................................................................................9
Chapter 3. Distinguishing between waits, loops, and poor performance................ 11Waits...........................................................................................................................................................11Loops.......................................................................................................................................................... 12Poor performance...................................................................................................................................... 13Poor application design............................................................................................................................. 13
Chapter 4. Classifying problems by functional area...............................................15
Chapter 5. Diagnostic tools and information......................................................... 17Documentation.......................................................................................................................................... 17Source listings and link-edit maps............................................................................................................ 17Abend codes and error messages............................................................................................................. 17Symptom strings........................................................................................................................................ 18Change log..................................................................................................................................................18Dumps........................................................................................................................................................ 18
Setting up the dumping environment.................................................................................................. 19Taking CICS transaction dumps...........................................................................................................21Taking CICS system dumps..................................................................................................................23Taking SLIP dumps...............................................................................................................................26Where dumps are written.....................................................................................................................27The occasions when CICS requests a dump....................................................................................... 28CICS dumps in a sysplex...................................................................................................................... 28Dump table statistics........................................................................................................................... 35Dumping a CFDT list structure ............................................................................................................ 40Dumping a named counter list structure............................................................................................. 40Dumping a shared temporary storage list structure ...........................................................................41Formatting and interpreting dumps.....................................................................................................42
Statistics.....................................................................................................................................................66Monitoring.................................................................................................................................................. 67Transaction inputs and outputs.................................................................................................................67
Terminal data........................................................................................................................................67Transient data and temporary storage................................................................................................ 68Passed information.............................................................................................................................. 68Files and databases..............................................................................................................................68
iii
Trace...........................................................................................................................................................68Quickstart for trace...............................................................................................................................69Trace levels...........................................................................................................................................76Trace entry points.................................................................................................................................77Trace destinations................................................................................................................................ 78CICS exception tracing.........................................................................................................................80Program check and abend tracing....................................................................................................... 81z/OS Communications Server exit tracing........................................................................................... 81z/OS Communications Server buffer tracing....................................................................................... 82Selecting tracing by transaction.......................................................................................................... 83Selecting tracing by component.......................................................................................................... 86Setting trace destinations and tracing status......................................................................................89Formatting and interpreting trace entries........................................................................................... 91Removing sensitive data from CICS trace using CONFDATA.............................................................. 99
Chapter 6. Dealing with the problem.................................................................. 103Dealing with transaction abend codes....................................................................................................103
Collecting the evidence......................................................................................................................103What the abend code can tell you..................................................................................................... 104Transaction abend codes: AEYD, AICA, ASRA, ASRB, and ASRD..................................................... 104Finding where a program check occurred......................................................................................... 105What type of program check occurred?.............................................................................................108Dealing with arithmetic exceptions................................................................................................... 110Dealing with protection exceptions................................................................................................... 111Causes of protection exceptions....................................................................................................... 111Analyzing the problem further........................................................................................................... 114Abends when CICS is using the DBCTL interface..............................................................................114Worksheet for transaction abends.................................................................................................... 114FEPI abends....................................................................................................................................... 115
Dealing with CICS system abends...........................................................................................................115The documentation you need............................................................................................................ 116Interpreting the evidence.................................................................................................................. 116Looking at the kernel domain storage areas..................................................................................... 118Using the linkage stack to identify the failing module...................................................................... 126
Dealing with waits....................................................................................................................................128Techniques for investigating waits.................................................................................................... 129Investigating terminal waits.............................................................................................................. 136Investigating storage waits................................................................................................................146Investigating temporary storage waits..............................................................................................147Investigating enqueue waits..............................................................................................................149Investigating interval control waits................................................................................................... 152Investigating file control waits...........................................................................................................158Investigating loader waits..................................................................................................................169Investigating lock manager waits...................................................................................................... 170Investigating transaction manager waits.......................................................................................... 172Resolving deadlocks in a CICS region................................................................................................176Resolving deadlocks in a sysplex.......................................................................................................179Resolving indoubt and resynchronization failures............................................................................ 179What to do if CICS has stalled........................................................................................................... 179
How tasks are made to wait.................................................................................................................... 183The resources that CICS tasks can wait for.......................................................................................183Asynchronous services waits.............................................................................................................200Dispatcher waits.................................................................................................................................201CICS Db2 waits...................................................................................................................................203IBM MQ waits..................................................................................................................................... 204DBCTL waits....................................................................................................................................... 204EDF waits............................................................................................................................................205
iv
Log manager waits............................................................................................................................. 205RRMS waits.........................................................................................................................................206Task control waits.............................................................................................................................. 206SNA LU control waits..........................................................................................................................208Interregion and intersystem communication waits.......................................................................... 210Transient data waits...........................................................................................................................210CICS system task waits......................................................................................................................213FEPI waits...........................................................................................................................................213Recovery manager waits....................................................................................................................214Waiting to call ESM.............................................................................................................................214Region Status server waits.................................................................................................................215
Dealing with loops................................................................................................................................... 215What sort of loop is indicated by the symptoms?............................................................................. 215Investigating loops that cause transactions to abend with abend code AICA.................................217Investigating loops that are not detected by CICS........................................................................... 220What to do if you cannot find the reason for a loop.......................................................................... 222
Dealing with performance problems.......................................................................................................222Finding the bottleneck....................................................................................................................... 223Why tasks fail to get attached to the transaction manager.............................................................. 224Why tasks fail to get attached to the dispatcher...............................................................................224Why tasks fail to get an initial dispatch............................................................................................. 226Why tasks take a long time to complete............................................................................................228A summary of performance bottlenecks, symptoms, and causes....................................................228
Dealing with incorrect output..................................................................................................................229Trace output is incorrect.................................................................................................................... 229Dump output is incorrect................................................................................................................... 233Incorrect data is displayed on a terminal..........................................................................................236Specific types of incorrect output for terminals................................................................................237Incorrect data is present on a VSAM data set...................................................................................241An application does not work as expected........................................................................................241Your transaction produces no output at all....................................................................................... 242Your transaction produces some output, but it is wrong.................................................................. 247
Dealing with storage violations............................................................................................................... 249Protecting against storage violations................................................................................................ 250Two kinds of storage violation........................................................................................................... 251CICS has detected a storage violation...............................................................................................252Storage violations that affect innocent transactions........................................................................ 256Programming errors that can cause storage violations.................................................................... 257Storage recovery................................................................................................................................ 257
Dealing with external CICS interface (EXCI) problems.......................................................................... 258Dealing with TCP/IP connectivity problems............................................................................................258Dealing with log manager problems....................................................................................................... 261
Categories of problem........................................................................................................................261Exceeding the capacity of a log stream............................................................................................. 262How CICS checks for the availability of the MVS logger................................................................... 262Some conditions that cause CICS log manager error messages...................................................... 263Restarting CICS after a system log failure.........................................................................................266Diagnosing problems in the MVS logger............................................................................................267Dealing with a corrupt system log..................................................................................................... 273
Chapter 7. Working with IBM to solve your problem............................................ 277Collecting CICS troubleshooting data (CICS MustGather) for IBM Support..........................................277
Abend 878 or 80A.............................................................................................................................. 278Ansible IBM z/OS CICS collection..................................................................................................... 279CICS-MQ adapter and CICS-MQ bridge.............................................................................................280CICSPlex SM.......................................................................................................................................281CMCI JVM server................................................................................................................................282
v
Coupling facility data table server..................................................................................................... 283Db2..................................................................................................................................................... 284Dynamic Scripting for CICS TS 5.1 or later........................................................................................285Dynamic Scripting for CICS TS Version 4.......................................................................................... 286Event processing................................................................................................................................ 287Explorer errors................................................................................................................................... 287Explorer UI......................................................................................................................................... 288File control (non-RLS)........................................................................................................................ 289File control (RLS)................................................................................................................................ 290IMS......................................................................................................................................................291IBM Documentation........................................................................................................................... 292ISC...................................................................................................................................................... 293IPIC.....................................................................................................................................................294JVM server..........................................................................................................................................294Logger................................................................................................................................................. 297Language Environment (LE) abend....................................................................................................298LIBRARY management.......................................................................................................................300Mobile Extensions.............................................................................................................................. 301MRO.................................................................................................................................................... 302Node.js................................................................................................................................................302Performance.......................................................................................................................................303Policies............................................................................................................................................... 305Program checks or abends................................................................................................................ 305Service Flow Runtime........................................................................................................................ 306Shared data table............................................................................................................................... 307Short on storage (SOS).......................................................................................................................308Storage violation................................................................................................................................ 308Terminal hang.....................................................................................................................................309Temporary storage servers................................................................................................................ 310Waits or loops.....................................................................................................................................311Web services, XML, and JSON transformation..................................................................................312
The global trap exit DFHTRAP.................................................................................................................313Installing and controlling the DFHTRAP exit.....................................................................................313Information passed to the DFHTRAP exit......................................................................................... 314Actions the DFHTRAP exit can take...................................................................................................315Coding the DFHTRAP exit.................................................................................................................. 315
Chapter 8. Troubleshooting EXCI........................................................................317Trace.........................................................................................................................................................317
Formatting GTF trace......................................................................................................................... 317Using System dumps............................................................................................................................... 317
Formatting system dumps................................................................................................................. 317Capturing SYSMDUMPs...................................................................................................................... 318Using the MVS DUMP command at the console for dumps.............................................................. 318
The EXCI service trap, DFHXCTRA.......................................................................................................... 318Problem determination with RRMS.........................................................................................................319EXCI trace entry points............................................................................................................................319
Chapter 9. Troubleshooting ONC........................................................................ 333CICS ONC RPC recovery procedures.......................................................................................................333CICS ONC RPC operational considerations.............................................................................................333
MVS task control blocks (TCBs) used by ONC RPC........................................................................... 334ONC RPC task-related user exit (TRUE).............................................................................................334
Troubleshooting CICS ONC/RPC............................................................................................................. 334Defining the problem......................................................................................................................... 334Documentation about the problem................................................................................................... 335
Using messages and codes for ONC RPC................................................................................................335
vi
CMAC (online help facility for messages and codes)........................................................................ 335CICS ONC RPC trace information............................................................................................................ 336
Feature trace points........................................................................................................................... 336Numeric values of response and reason codes.................................................................................336
ONC RPC dump and trace formatting......................................................................................................336Debugging the ONC RPC user-replaceable programs............................................................................ 337
XDR routines.......................................................................................................................................337Converter and resource checker........................................................................................................337
Chapter 10. SDUMP contents and IPCS CICS VERBEXIT keywords...................... 339Keyword to control block map................................................................................................................ 339Control block to keyword map................................................................................................................ 352Summary data for PG and US keywords................................................................................................. 363
PG keyword........................................................................................................................................ 363US keyword.........................................................................................................................................368
Notices..............................................................................................................371
Index................................................................................................................ 377
vii

viii
About this PDF
This PDF describes the facilities and methods for determining the cause of problems in a system that usesCICS. Other PDFs, listed below, describe how to address problems with certain areas of CICS and youmight need to refer to those as well as this PDF. (In IBM Documentation, all this information is under onesection called "Troubleshooting".) Before CICS TS V5.4, this PDF was called Problem Determination Guide.
Troubleshooting information for areas of CICS is in the following PDFs:
• SOAP and JSON is in Web Services Guide .• ONC/RPC interface is in the External Interfaces Guide .• EXCI is in Using EXCI with CICS.• Java™ and Liberty are in Java Applications in CICS.• Front End Programming Interface is in the Front End Programming Interface User's Guide.• Db2® is in Db2 Guide.• DBCTL is in the IMS DB Control Guide.• Shared data tables are in the Shared Data Tables Guide.• CICSPlex® SM is in CICSPlex SM Administration.• BTS is in Business Transaction Services
For details of the terms and notation used in this book, see Conventions and terminology used in the CICSdocumentation in IBM Documentation.
Date of this PDFThis PDF was created on 2022-03-26 (Year-Month-Date).
© Copyright IBM Corp. 1974, 2021 ix

x CICS TS for z/OS: Troubleshooting CICS
Chapter 1. Preliminary checksBefore you go further into looking for the cause of the problem, run through the following preliminarychecks. These checks might highlight a simple cause or, at least, narrow the range of possible causes.
About this taskAs you go through the questions, make a note of anything that might be relevant to the problem. Even ifthe observations you record do not at first suggest a cause, they might be useful to you later if you mustcarry out systematic problem determination.
Procedure1. Has the CICS system run successfully before?
If the CICS system has not run successfully before, it is possible that you have not yet set itup correctly. You can check that CICS installed correctly by running batch or online verificationprocedures. For more information, see Verifying the CICS installation in Installing. If CICS did installsuccessfully, check the appropriate Upgrading information set for any possible impacts to yoursystem. If you are currently upgrading to, CICS Transaction Server for z/OS, Version 5 Release 6ensure that you are aware of all the changes that were made for this release. For details, see What'sNew and Upgrading for the release from which you are upgrading.
2. Are there any messages explaining the failure?If a transaction abends, and the task terminates abnormally, CICS sends a message reporting the factto the CSMT log (or your site replacement). If you find a message there, it might immediately suggesta reason for the failure. Were there any unusual messages associated with CICS startup, or while thesystem was running before the error occurred? These messages might indicate some system problemthat prevented your transaction from running successfully. If you see any messages that you do notunderstand, use the CICS messages transaction, CMAC, for online message information. If you do nothave access to a CICS system to run the CMAC transaction, look in CICS messages for an explanation.A suggested course of action that you can take to resolve the problem might also be included with theexplanation.
3. Can you reproduce the error?a) Can you identify any application that is always in the system when the problem occurs?
• Check for application coding errors.• Check that you sufficient resources are defined for the application, such as VSAM file strings.
Typically, if the resources defined are not sufficient, you would find that the problem is related tothe number of users of the application.
b) Are you using exit programming interface (XPI) calls?If so, be sure to observe the XPI protocols and restrictions exactly. For programming informationabout the XPI, see The user exit programming interface (XPI). The exit programming interface isused to start a domain and enter its environment directly; using it incorrectly can cause severeCICS system problems. Here are some particular points for your attention:
• Are the input parameters correct? If their format is not valid, they are rejected by the calleddomain, and an exception trace is made. If their values are acceptable to the domain butinappropriate for the system, they can cause unpredictable effects.
• You cannot use some XPI calls within some of the user exits. If you do, the results can beunpredictable, and can cause CICS to stall or abend. See Global user exit programs for details onwhich exits can use XPI calls and which cannot.
c) Consider your CICS system definition parameters if the problem is not related to any particularapplication.Poorly defined parameters can be the cause of problems in your system. You can find guidanceabout setting up your CICS system in, Specifying CICS system initialization parameters
© Copyright IBM Corp. 1974, 2021 1
d) Does the problem seem to be related to system loading?If so, the system might be running near its maximum capacity, or it might be in need of tuning. Forguidance about dealing with this problem, see Improving the performance of a CICS system.
4. Does the failure occur at specific times of day?If the failure occurs at specific times of day, it can be dependent on system loading. Typically,peak system loading is at mid-morning and mid-afternoon, so those times are when load-dependentfailures are most likely to happen. If your CICS network extends across more than one time zone,peak system loading might seem to you to occur at some other time of day.
5. Is the failure intermittent?If an error is intermittent, particularly if it does not show the same symptoms, the problem mightbe more difficult to resolve. An intermittent failure can be caused by a “random” storage overlay.Furthermore, the transaction that caused the error might be deleted from the system long before thesymptoms are seen. A method you can use to investigate random overlays is described in. “Dealingwith storage violations” on page 249
6. Have you made any service changes since the last successful run?a) Have you applied a PTF to CICS?
b) Did it install successfully or did you get an error message during installation? If you installed itsuccessfully, check with IBM for any PTF error.
c) Have any patches applied to any other program affected the way CICS interfaces with theprogram?
7. Have you made any hardware changes since the last successful run?8. Have you made any software changes since the last successful run?
If you installed a new or modified application, check for error messages in the output from the:
• Translator• Compiler• Assembler• Linkage editor
9. Have you made any administrative changes since the last successful run?a) Have you changed your initialization procedure, for example by JCL, CICS system initialization or
override parameters, or z/OS Communications Server CONFIG/LIST?b) Has CICS generated any error messages during initialization?c) Have you installed any resource definitions defined using CEDA?
If the definitions were made but not installed when CICS was last terminated, they might not bepreserved over the termination and subsequent startup. In general, changes made to the CICSsystem definition file (CSD) but not installed are not visible when the CICS system is warm started.However, if the change was in a group in the GRPLIST specified on a cold start, it is effectivelyinstalled during startup. (Changes which were installed are not visible after a cold start unless theywere made to a group in the GRPLIST.)If START=AUTO was specified in the system initializationtable, or as an override, you must examine the job log to find out how the CICS system last cameup.
d) Have you changed the configuration or the status of installed resources in CICS?
The CICS configuration might have changed. Installed resources might be disabled or closed. Forexample, a file or program might be disabled. These changes are made using CEMT transactions,the Web User Interface, CICS explorer, or CICS applications. CICS provides a function to auditthese changes by writing a message to the job log when these commands are issued. Themessage DFHAP1900 contains the date, time, transaction id, netname, user ID, and detail ofthe command. A system administrator, or anyone wanting to review audit records, can read theaudit messages in the CICS job log to find any changes that were made to this CICS region.For commands using generic parameters, each individual command is audited, so a search for aspecific file name, for example, would succeed in finding that file.
2 CICS TS for z/OS: Troubleshooting CICS
10. Are specific parts of the network affected by the problem?a) Can you identify specific parts of the network that the problem affects? If you can, look for any
explanatory message from the access method. Even if no message was sent to the console, youmight find one in the CSNE log.
b) Have you made any network-related changes?c) If the problem affects a single terminal, are your terminal definitions correct? Consider both the
TERMINAL definition, and the TYPETERM definition it uses.d) If the problem affects a number of terminals, can you identify a factor that is common to all of
them? For example:
• Do they use the same TYPETERM definition? If so, it is likely that there is an error in thatTYPETERM definition.
• Is the whole network affected? If so, CICS might have stalled. See “What to do if CICS hasstalled” on page 179 for advice about dealing with CICS system stalls.
11. Has the application run successfully before?a) Have any changes been made to the application since it last ran successfully? Examine the new or
modified part of the application.b) Have you used RDO to create or alter a transaction, program, or map set? You must install these
definitions before the resources are available to the running CICS region.c) If you changed any maps, have you created both a new phase (TYPE=MAP) and a new DSECT
(TYPE=DSECT), and then recompiled every program using the new DSECT? Use the CEMTcommands:
CEMT SET PROGRAM(mapset) NEWCOPY CEMT SET PROGRAM(all programs) NEWCOPY
.d) Have all the functions of the application been fully exercised before?
Establish what the program was doing when the error occurred, and check the source code inthat part of the program. If a program ran successfully on many previous occasions, examine thecontents of any records, screen data, and files that were being processed when the error occurred.They might contain some unusual data value that causes a rarely used path in the program to beinvoked.
e) Check that the application successfully retrieved the records that it required at the time of theerror.
f) Check that all fields within the records at the time of the error contain data in a format acceptableto the program. Use CICS dump to do this.If you can reproduce the problem in a test system, you can use programming language debugtools and the CEDF transaction to check the data and solve the problem.
12. The application has not run successfully beforeIf your application has not yet run successfully, examine it carefully for any errors.a) Check the output from the translator, the compiler, and the linkage editor, for any reported errors.
If your application fails to translate, compile or assemble, or link-edit cleanly into the correctphase library, it will also fail to run if you attempt to invoke it.
b) Check the coding logic of the application. Do the symptoms of the failure indicate the function thatis failing and, therefore, the piece of code in error?
c) The following is a list of some programming errors commonly found in applications:
• CICS areas are addressed incorrectly.• The rules for quasi-reentrancy are not followed.• Transient data is managed incorrectly.• File resources are not released.
Chapter 1. Preliminary checks 3
• Storage is corrupted by the program.• Return codes from CICS requests are ignored.
4 CICS TS for z/OS: Troubleshooting CICS
Chapter 2. Classifying the problemThe purpose of this section is to help you classify your problem into one of the categories used by theIBM Support Center for its service procedures. IBM Support Center staff have found that classifying theproblem first is a good approach to problem determination.
It contains the following topics:
• “Using symptom keywords to classify problems” on page 5• “Using the symptoms to classify the problem” on page 6• Chapter 3, “Distinguishing between waits, loops, and poor performance,” on page 11• Chapter 4, “Classifying problems by functional area,” on page 15
Using symptom keywords to classify problemsIBM keeps records of all known problems with its licensed programs on the RETAIN database. IBMSupport Center staff continually update the database as new problems are reported, and they regularlysearch the database to see if problems they are told about are already known.
About this taskIf you have the IBM INFORMATION/ACCESS licensed program, 5665-266, you can look on the RETAINdatabase yourself. Each problem in the database has a classification type.
Procedure• Classify your problem using one of the following software categories from RETAIN.
Use the appropriate reference to get further information on how to diagnose each category of problem.
– ABEND (for transaction abends, see “Dealing with transaction abend codes” on page 103; forsystem abends, see “Dealing with CICS system abends” on page 115)
– WAIT (see “Dealing with waits” on page 128)– LOOP (see “Dealing with loops” on page 215)– POOR PERFORMANCE, or PERFM (see “Dealing with performance problems” on page 222)– INCORRECT OUTPUT, or INCORROUT (see “Dealing with incorrect output” on page 229)– MESSAGE
All theses categories are considered in the information on problem determination, except for theMESSAGE category. If a CICS error message is issued, you can use the CICS message transaction,CMAC, for online message information. See CMAC - messages and codes display. If you do not haveaccess to a running CICS system, see CICS messages for an explanation. If you get a message fromanother IBM program, or from the operating system, see the messages and codes information for theappropriate product for an explanation of that message.
CICS messages might provide enough information to solve the problem quickly, or it might redirectyou to other information sources for further guidance. If you cannot deal with the message, you mighteventually need to contact the IBM Support Center for help.
One type of problem that might result in a number of symptoms, usually ill-defined, is that of poorapplication design. Checking the design of an application is beyond the scope of this information.However, for an example of how poor design can result in application problems, see “Poor applicationdesign” on page 13.
© Copyright IBM Corp. 1974, 2021 5
Using the symptoms to classify the problemYou can classify the problem on the basis of the symptoms you observe. Sometimes, the symptomsenable you to classify the problem correctly at once, but sometimes classification is less straightforward.You might need to consider the evidence carefully before making your decision. You might need to make a"best guess", and then reconsider later on the basis of further evidence.
About this taskFind the section heading that describes the symptoms most closely, then follow the advice given there.
CICS has stopped runningThere are three main reasons why CICS might unexpectedly stop running:
1. There could be a CICS system abend.2. CICS could be in a wait state. In other words, it could have stalled.3. A program could be in a tight loop.
Consider, too, the possibility that CICS might still be running, but only slowly. Be certain that there is noactivity at all before carrying out the checks in this section. If CICS is running slowly, you probably have aperformance problem. If so, read “CICS is running slowly” on page 7 to confirm this before going on to“Dealing with performance problems” on page 222 for advice about what to do next.
If CICS has stopped running, look for any message that might explain the situation. The message mightappear in either of the following places:
• The MVS™ console. Look for any message saying that the CICS job has abnormally terminated. If youfind one, it means that a CICS system abend has occurred and that CICS is no longer running. In sucha case, you need to examine the CSMT log (see below) to see which abend message has been writtenthere.
If you do not find any explanatory message on the MVS console, check in the CSMT log to see if anythinghas been written there.
• The CSMT log. CSMT is the transient data destination to which abend messages are written. If you finda message there, use the CMAC transaction or look in CICS messages to make sure there has been aCICS system abend.
If you see only a transaction abend message in the CSMT log, that will not account for CICS itself notrunning, and you should not classify the problem as an abend. A faulty transaction could hold CICS up,perhaps indefinitely, but CICS would resume work again if the transaction abended.
Here are two examples of messages that might accompany CICS system abends, and which you wouldfind on the CSMT log:
DFHST0001 applid An abend (code aaa/bbbb) has occurred at offset X'offset' in module modname.
DFHSR0601 Program interrupt occurred with system task taskid in control
If you get either of these messages, or any others for which the system action is to terminate CICS, turn to“Dealing with CICS system abends” on page 115 for advice on what to do next.
If you can find no message saying that CICS has terminated, it is likely that the CICS system is in a waitstate, or that some program is in a tight loop and not returning control to CICS. These two possibilities aredealt with in “Dealing with waits” on page 128 and “Dealing with loops” on page 215, respectively.
6 CICS TS for z/OS: Troubleshooting CICS
CICS is running slowlyIf CICS is running slowly, it is likely that you have a performance problem. It could be because yoursystem is badly tuned, or because it is operating near the limits of its capacity.
You will probably notice that the problem is worst at peak system load times, typically at mid-morningand mid-afternoon. If your network extends across more than one time zone, peak system load mightseem to you to occur at some other time.
If you find that performance degradation is not dependent on system loading, but happens sometimeswhen the system is lightly loaded, a poorly designed transaction could be the cause. You might classifythe problem initially as “poor performance”, but be prepared to reconsider your classification later.
The following are some individual symptoms that could contribute to your perception that CICS is runningslowly:
• Tasks take a long time to start running. • Some low priority tasks will not run at all. • Tasks start running, but take a long time to complete. • Some tasks start running, but do not complete. • No output is obtained. • Terminal activity is reduced, or has ceased.
Some of these symptoms do not, in isolation, necessarily mean that you have got a performance problem.They could indicate that some task is in a loop, or is waiting on a resource that is not available. Onlyyou can judge whether what you see should be classified as “poor performance”, in the light of all theevidence you have.
You might be able to gather more detailed evidence by using the tools and techniques that CICS providesfor collecting performance data. The following is a summary of what is available:
• CICS statistics. You can use these to gather information about the CICS system as a whole, withoutregard to tasks.
• CICS monitoring. You can use this facility to collect information about CICS tasks.• CICS tracing. This is not a specific tool for collecting performance data, but you can use it to gather
detailed information about performance problems.
For guidance about using these tools and techniques, and advice about performance and system tuning ingeneral, seeWhat to investigate when analyzing performance.
You can find guidance about identifying specific performance bottlenecks in your CICS system in “Dealingwith performance problems” on page 222.
A task fails to startIf a task fails to start, look first in the CSMT and CSNE logs for any explanatory message. If you do not findone, the task is possibly being prevented from starting because either the system is running at the MXTlimit, the transaction is queuing for admittance to a transaction class, or for other performance reasons.
Classify the problem tentatively as "poor performance", and turn to “Dealing with performance problems”on page 222 for further guidance.
A task is running slowlyIf just one task is running slowly, it is likely that the explanation lies with the task itself. It could be ina loop, or it could periodically be entering a wait state. You need to decide which of these possibilitiesis the most likely before starting systematic problem determination. The ways that you might distinguishbetween waits and loops are described in Chapter 3, “Distinguishing between waits, loops, and poorperformance,” on page 11.
Chapter 2. Classifying the problem 7
Note: Do not overlook the possibility that the task might be doing unnecessary work that does not changethe final result—for example, starting a skip sequential browse with large gaps between the keys, or failingto finish one because it is holding on to resources.
A task stops running at a terminalWhen a task stops running at a terminal, you will notice either or both of these symptoms:
• No output is obtained at the terminal• The terminal accepts no input
First, make sure that the task is still in the system. Use CEMT INQ TASK to check its status, and makesure that it has not ended without writing back to the terminal.
If the terminal has a display unit, check to see whether a special symbol has been displayed in theoperator information area that could explain the fault. If the operator information area is clear, next checkto see that no message has been sent to any of the transient data destinations used for error messages,for example:
• CDBC, the destination for DBCTL related messages • CSMT, the destination for terminal error and abend messages • CSTL, the destination for terminal I/O error messages• CSNE, the destination for error messages written by DFHZNAC and DFHZNEP
For details of the destinations used by CICS, see Setting up data sets for transient data. If you can find noexplanation for the problem, the fault is probably associated with the task running at the terminal. Theseare the possibilities:
• The task is in a wait state.• The task is in a loop.• There is a performance problem.
Read Chapter 3, “Distinguishing between waits, loops, and poor performance,” on page 11 to find outwhich of these is the most likely explanation. You can then read to the appropriate section for adviceabout dealing with the problem.
A transaction has abendedIf the transaction abended when you ran your application, CICS gives you an error message on yourscreen as well as a message on the CSMT log.
Use the CMAC transaction or look in CICS messages for an explanation of the message, and, perhaps,advice about what you should do to solve the problem. If the code is not there, or the explanation oradvice given is not sufficient for you to solve the problem, turn to “Dealing with transaction abend codes”on page 103.
You have obtained some incorrect outputIncorrect output might be regarded as any sort of output that you were not expecting. However, use theterm with care in the context of problem determination, because it might be a secondary effect of someother type of error. For example, looping could be occurring if you get any sort of repetitive output, eventhough that output is not what you had expected.
Also, CICS responds to many errors that it detects by sending messages. You might regard the messagesas “incorrect output”, but they are only symptoms of another type of problem.
If you have received an unexpected message, and its meaning is not at first clear, use the CMACtransaction or look in CICS messages for an explanation. It might suggest a simple response that youcan make to the message, or it might direct you to other sources of information for further guidance.
These are the types of incorrect output that are dealt with in this information:
8 CICS TS for z/OS: Troubleshooting CICS
• Incorrect trace or dump data:
– Wrong destination– Wrong type of data captured– Correct type of data captured, but the data values were unexpected
• Wrong data displayed on the terminal.
You can find advice about investigating the cause of any of these types of incorrect output in “Dealing withincorrect output” on page 229.
A storage violation has occurredWhen CICS detects that storage has been corrupted, this message is sent to the console:
DFHSM0102 applid A storage violation (code X'code') has been detected by module modname.
If you see this message, or you know (through other means) that a storage violation has occurred, turn to“Dealing with storage violations” on page 249 for advice about dealing with the problem.
In many cases, storage violations go undetected by CICS, and you only find out that they have occurredwhen something else goes wrong as a result of the overlay. You could, for example, get a program checkbecause code or data has been overlaid. You might suspect some other type of problem at first, and onlyafter starting your investigation find that a storage violation has occurred.
You can avoid many storage violations by enabling transaction isolation, storage protection, andcommand storage protection.
Chapter 2. Classifying the problem 9

10 CICS TS for z/OS: Troubleshooting CICS
Chapter 3. Distinguishing between waits, loops, andpoor performance
Waits, loops, and poor performance can be quite difficult to distinguish, and in some cases you needto carry out quite a detailed investigation before deciding which classification is the right one for yourproblem.
About this taskAny of the following symptoms could be caused by a wait, a loop, a badly tuned or overloaded system:
• One or more user tasks in your CICS system fails to start. • One or more tasks stays suspended. • One or more tasks fails to complete. • No output is obtained. • Terminal activity is reduced, or has ceased.• The performance of your system is poor.
Because it can be difficult to make a correct classification, consider the evidence carefully beforeadopting a problem solving strategy.
This section gives you guidance about choosing the best classification. However, note that in some casesyour initial classification could be wrong, and you will then need to reappraise the problem.
WaitsFor the purpose of problem determination, a wait state is regarded as a state in which the executionof a task has been suspended. That is, the task has started to run, but it has been suspended withoutcompleting and has subsequently failed to resume.
The task might typically be waiting for a resource that is unavailable, or it might be waiting for an ECB tobe posted. A wait might affect just a single task, or a group of tasks that may be related in some way. Ifnone of the tasks in a CICS region is running, CICS is in a wait state. The way to handle that situation isdealt with in “What to do if CICS has stalled” on page 179.
If you are authorized to use the CEMT transaction, you can find out which user tasks or CICS-suppliedtransactions are currently suspended in a running CICS system using CEMT INQ TASK. Use thetransaction several times, perhaps repeating the sequence after a few minutes, to see if any task stayssuspended. If you do find such a task, look at the resource type that it is waiting on (the value shown forthe HTYPE option). Is it unreasonable that there should be an extended wait on the resource? Does theresource type suggest possible causes of the problem?
You can use EXEC CICS INQUIRE TASK or EXEC CICS INQUIRE TASK LIST as alternatives to the CEMTtransaction. You can execute these commands under CECI, or in a user program.
Use INQUIRE TASK LIST to find the task numbers of all SUSPENDED, READY, and RUNNING user tasks. Ifyou use this command repeatedly, you can see which tasks stay suspended. You may also be able to findsome relationship between several suspended tasks, perhaps indicating the cause of the wait.
If it seems fairly certain that your problem is correctly classified as a wait, and the cause is not yetapparent, turn to “Dealing with waits” on page 128 for guidance about solving the problem.
However, you should allow for the possibility that a task may stay suspended because of an underlyingperformance problem, or because some other task may be looping.
If you can find no evidence that a task is waiting for a specific resource, you should not regard this as await problem. Consider instead whether it is a loop or a performance problem.
© Copyright IBM Corp. 1974, 2021 11
LoopsA loop is the repeated execution of some code. If you have not planned the loop, or if you have designedit into your application but for some reason it fails to terminate, you get a set of symptoms that varydepending on what the code is doing. In some cases, a loop may at first be diagnosed as a wait or aperformance problem, because the looping task competes for system resources with other tasks that arenot involved in the loop.
The following are some characteristic symptoms of loops:
• The ‘system busy’ symbol is permanently displayed in the operator information area of a display unit,or stays displayed for long periods.
• The transaction abends with abend code AICA. • CPU usage is very high, perhaps approaching 100%, yet some tasks stay suspended or ready, but not
running, for a long time.
You can check what the CPU usage is for any MVS job by using the DISPLAY ACTIVE command at theMVS console to display the active users.
• There is reduced activity at terminals, or possibly no activity at all. • One or more CICS regions appear to be stalled, or to be continuing only slowly. • No CICS messages are written to any destination, when they are expected.• No new tasks can be started.• Existing tasks remain suspended.• The CEMT transaction cannot be used.• Repetitive output obtained. Try looking in these areas:
– Terminals, and the system console.– Temporary storage queues. You can use CEBR to browse them online.– Data files and CICS journals.– Trace tables, but remember that some loops are intentional—some CICS system tasks use them, for
example, to see if there is any work to be done.
• Excessive demand for storage. If the loop contains a GETMAIN request, storage is acquired each timethis point in the loop is passed, as long as sufficient storage to satisfy the request remains available. Ifstorage is not also freed in the loop, CICS eventually goes short on storage (SOS) in one of the DSAs. Youthen get a message reporting that CICS is under stress in one of these areas.
One further effect is that tasks issuing unconditional GETMAIN requests are suspended more often asthe loop continues and storage is progressively used up. Tasks making storage requests do not need tobe in the loop to be affected in this way.
• Statistics show a large number of automatically initiated tasks. • Large numbers of file accesses are shown for an individual task.
Some loops can be made to give some sort of repetitive output. Waits and performance problems nevergive repetitive output. If the loop produces no output, a repeating pattern can sometimes be obtained byusing trace. A procedure for doing this is described in “Dealing with loops” on page 215.
If you are able to use the CEMT transaction, try issuing CEMT INQ TASK repeatedly. If the sametransaction is shown to be running each time, this is a further indication that the task is looping. However,note that the CEMT transaction is always running when you use it to inquire on tasks.
If different transactions are seen to be running, this could still indicate a loop, but one that involves morethan just a single transaction.
12 CICS TS for z/OS: Troubleshooting CICS
If you are unable to use the CEMT transaction, it may be because a task is looping and not allowing CICSto regain control. A procedure for investigating this type of situation is described in “What to do if CICShas stalled” on page 179.
Consider the evidence you have so far. Does it indicate a loop? If so, turn to “Dealing with loops” on page215, where there are procedures for defining the limits of the loop.
Poor performanceA performance problem is one in which system performance is perceptibly degraded, either becausetasks fail to start running at all, or because tasks take a long time to complete after they start.
In extreme cases, some low priority tasks might be attached but then fail to be dispatched, or some tasksmight be suspended and fail to resume. The problem might then initially be regarded as a wait.
If you get many messages that state that CICS is under stress, this can indicate that either the system isoperating near its maximum capacity, or a task in error has used up a large amount of storage, possiblybecause it is looping. The messages are as follows:
• DFHSM0131 applid CICS is under stress (short on storage below 16 MB)
CICS is under stress in one of the dynamic storage areas (DSAs) in 24-bit storage.• DFHSM0133 applid CICS is under stress (short on storage above 16 MB)
CICS is under stress in one of the DSAs in 31-bit storage.• DFHSM0606 applid The amount of MVS above-the-bar storage available to CICS is critically low.
CICS is under stress in 64-bit storage.
You can also use CICS storage manager statistics to identify the situation. See Short-on-storageconditions in dynamic storage areas.
If there is no such indication, see “Dealing with performance problems” on page 222 for advice oninvestigating the problem. However, before doing so, be as sure as you can that this is best classified as aperformance problem, rather than a wait or a loop.
Poor application designIf you have only a poorly defined set of symptoms that might indicate a loop, or a wait, or possibly aperformance problem with an individual transaction, consider the possibility that poor design might be toblame.
An example of poor application design is given here, to show how this can give rise to symptoms whichwere at first thought to indicate a loop.
Environment:CICS and DL/I using secondary indexes. The programmer had made changes to the application toprovide better function.
Symptoms:The transaction ran and completed successfully, but response was erratic and seemed to deteriorateas the month passed. Towards the end of the month, the transaction was suspected of looping andwas canceled. No other evidence of looping could be found, except that statistics showed a highnumber of I/Os.
Explanation:The programmer had modified the program to allow the user to compare on the last name of a recordinstead of the personnel number, which it had done in the past. The database was the type that grewthrough the month as activity was processed against it.
It was discovered that in making the change, the program was no longer comparing on a field that waspart of the key for the secondary index. This meant that instead of searching the index for the key andthen going directly for the record, every record in the file had to be read and the field compared. Thestructure of the source program had not changed significantly; the number of database calls from the
Chapter 3. Distinguishing between waits, loops, and poor performance 13
program was the same, but the number of I/Os grew from a few to many thousands at the end of themonth.
Note that these symptoms might equally well have pointed to a performance problem, althoughperformance problems are usually due to poorly tuned or overloaded systems, and affect more thanjust one transaction. Performance problems tend to have system wide effects.
14 CICS TS for z/OS: Troubleshooting CICS
Chapter 4. Classifying problems by functional area
About this taskIn addition to the RETAIN classifications used by the IBM Support Centers, the following types of problemalso belong in classes of their own:
• EXCI problems - see “Dealing with external CICS interface (EXCI) problems” on page 258• MRO problems• Log manager problems - see “Dealing with log manager problems” on page 261• Java problems - see Troubleshooting Java applications• Storage violations - see “Dealing with storage violations” on page 249
Whereas EXCI and MRO errors can easily be classified in a straightforward way, confirming that you have astorage violation can be difficult. Unless you get a CICS message stating explicitly that you have a storageviolation, you could get almost any symptom, depending on what has been overlaid. You might, therefore,classify it initially as one of the RETAIN symptom types described in “Using symptom keywords to classifyproblems” on page 5.
© Copyright IBM Corp. 1974, 2021 15

16 CICS TS for z/OS: Troubleshooting CICS
Chapter 5. Diagnostic tools and informationYou should find some of the following sources of information useful in problem determination.
• “Documentation” on page 17• “Source listings and link-edit maps” on page 17• “Abend codes and error messages” on page 17• “Symptom strings” on page 18• “Change log” on page 18• “Statistics” on page 66• “Monitoring” on page 67• “Transaction inputs and outputs” on page 67
Documentation“Your own documentation” is the collection of information produced by your organization about what yoursystem and applications do and how they do it. Product documentation is supplied by IBM.
About this taskHow much of this kind of information you need depends on how familiar you are with the system orapplication, and could include:
• Program descriptions or functional specifications• Record layouts and file descriptions• Flowcharts or other descriptions of the flow of activity in a system• Statement of inputs and outputs• Change history of a program• Change history of your installation• Auxiliary trace profile for your transaction• Statistical and monitoring profile showing average inputs, outputs, and response times.
Source listings and link-edit mapsInclude the source listings of any applications written at your installation with your set of documentation.They often form the largest single element of documentation. Large installations with thousands ofprograms might prefer to keep such listings on CD-ROM.
Make sure you include the relevant linkage-editor output with your source listings to avoid wasting timetrying to find your way through a load module with an out-of-date link map. Be sure to include the JCL atthe beginning of your listings, to show the libraries that were used and the load library in which the loadmodule was placed.
Abend codes and error messagesMessages are sent to several transient data destinations.
For example:
• CSMT for terminal error and abend messages• CSNE for messages issued by DFHZNAC• CSTL for terminal I/O error messages
© Copyright IBM Corp. 1974, 2021 17
• CDBC for messages concerning DBCTL• CSFL for file control messages.
For a list of the destinations used by CICS, see Setting up data sets for transient data. Use a copy ofthe appropriate messages and codes documentation to look up any messages whose meaning you donot know. All CICS messages and codes are documented in CICS messages. Make sure that you alsohave some documentation of application messages and codes for programs that were written at yourinstallation.
Symptom stringsCICS produces symptom strings in CICS system and transaction dumps and in message DFHME0116.
The symptom string provides a number of keywords that can be directly typed in and used to search theRETAIN database. If your installation has access to the IBM INFORMATION/ACCESS licensed program,5665-266, you can search the RETAIN database yourself. If you report a problem to the IBM SupportCenter, you are often asked to quote the symptom string.
Although the symptom string is designed to provide keywords for searching the RETAIN database, it canalso give you significant information about what was happening at the time the error occurred, and itmight suggest an obvious cause or a likely area in which to start your investigation.
Change logThe information in the change log can tell you of changes made in the data processing environment thatmay have caused problems with your application program.
To make your change log most useful, include the data concerning hardware changes, system software(such as MVS and CICS) changes, application changes, and any modifications made to operatingprocedures.
Using dumps in problem determinationYou have the choice of two different types of CICS dump to help you with problem determination. Theyare the CICS transaction dump, of transaction-related storage areas, and the CICS system dump, of theentire CICS region. The type of dump to use for problem determination depends on the nature of theproblem. In practice, the system dump is often more useful, because it contains more information thanthe transaction dump.
CICS system abends, CICS transaction abends, and explicit user requests for dumps can cause dumps tobe taken, if the dumping environment allows dumping under the circumstances.
You can issue an explicit request for a dump by using the CEMT transaction, by using an EXEC CICScommand, or by using an exit programming interface (XPI) call. For detailed instructions, see “TakingCICS transaction dumps” on page 21 and “Taking CICS system dumps” on page 23.
On most occasions when dumps are requested, CICS references a dump code that is specified eitherimplicitly or explicitly to determine what action should be taken. For information about defining actionsfor dump codes, see “The dump code options you can specify” on page 19. Dump codes are held in twodump tables, the transaction dump table and the system dump table.
You can set up the dumping environment so that the appropriate dump action is taken automaticallywhen circumstances arise that might cause a dump to be taken. For details, see “Setting up the dumpingenvironment” on page 19.
For information about using dumps to solve FEPI problems, see FEPI dump.
IBM Support: SLIP dumps can be taken under guidance from IBM Support for specific problemdetermination purposes, particularly when the existing first-failure data capture (FFDC) cannot gatherthe level of detail required for specific problems. For detailed instructions, see “Taking SLIP dumps” onpage 26.
18 CICS TS for z/OS: Troubleshooting CICS
Setting up the dumping environmentThere are several levels at which the dumping environment can be set up so that the appropriate dumpaction is taken when circumstances arise that might cause a dump to be taken.
Procedure• To globally suppress or enable system dumps at system initialization, use the DUMP system
initialization parameter.This does not apply to CICS kernel domain dumps.
• DUMP=NO will suppress all system dumps.• DUMP=TABLEONLY will suppress all system dumps except for those dump codes that have an entry
in the dump table which allows dumps to be taken.• DUMP=YES allows system dumps to be taken unless an entry in the dump table suppresses it.
• To globally suppress or enable system dumps dynamically, use the EXEC CICS SET SYSTEMDUMPING command specifying NOSYSDUMP, TABLEONLY or SYSDUMP.This does not apply to CICS kernel domain dumps.
• To enable or suppress transaction dumps for individual transactions, use one of the following options:
• EXEC CICS SET TRANSACTION DUMPING system programming command• CEMT SET TRDUMPCODE command• DUMP attribute of the RDO definition for the transaction
• To suppress specific dump codes from a dump domain, use the XDUREQ global user exit program.This does not apply to CICS kernel domain dumps.
• To suppress or enable system dumps (apart from CICS kernel domain dumps), and specify otherdumping requirements, use dump codes.
A dump code defines what action CICS is to take under any of the circumstances in which a dumpmight be required. You can specify what dump action CICS will take for each individual dump code. Fordetails, see “The dump code options you can specify” on page 19.
Dump codes are kept in one of two dump tables, one for transaction dump codes and the other forsystem dump codes. For more information, see “The transaction dump table” on page 37 and “Thesystem dump table” on page 39.
• To enable dumps of the builder parameter at specific stages in the build process of terminal orconnection definitions, use the CSFE ZCQTRACE facility.For details, see “The CSFE ZCQTRACE facility” on page 21.
The dump code options you can specifyYou can specify what dump action CICS will take for each individual dump code, by defining and installinga DUMPCODE through the resource definition online (RDO) interface, by using the CEMT transaction, or byusing a system programming command.
The options you can specify differ slightly, depending on whether you are defining the action for atransaction dump code or for a system dump code.For a transaction dump code:
You can specify the following options:
• Whether a transaction dump is to be taken. • Whether a system dump is to be taken, with or without a transaction dump. • Whether a system dump is to be taken on every CICS region in the sysplex related to the CICS region
on which the transaction dump is taken. A related CICS region is one on which the unit of workidentifiers, in the form of APPC tokens, of one or more tasks match those in the CICS region thattakes the transaction dump.
Chapter 5. Diagnostic tools and information 19
• Whether CICS is to be terminated. • The maximum number of times the transaction dump code action can be taken during the current
run of CICS, or before the count is reset.
Tip: You can specify the areas you want written to a transaction dump when you use the EXEC CICSDUMP TRANSACTION command to get a transaction dump.
You cannot specify in the dump table which areas are to be written to the transaction dumpfor particular transaction dump codes. You always get a complete transaction dump whenever atransaction abend occurs, if the dump code requires a transaction dump to be taken.
For a system dump code:You can specify the following options:
• Whether a system dump is to be taken. • Whether a system dump is to be taken on every CICS region in the sysplex related to the CICS
region on which the system dump is taken. A related CICS region is one on which the unit of workidentifiers, in the form of APPC tokens, of one or more tasks match those in the CICS region thattakes the system dump.
• Whether CICS is to be terminated. • The maximum number of times the system dump code action can be taken during the current run of
CICS, or before the count is reset.• Whether the system dump is eligible for suppression by DAE.
Note:
1. Only a transaction dump code can cause both a transaction dump and a system dump to be taken.2. If a severe error is detected, the system can terminate CICS even if you specify that CICS is not to be
terminated.3. Values of 0–998 for “maximum times dump code action can be taken” are literal, but a value of 999
(the default) means there is no limit.4. You cannot suppress CICS kernel domain dumps.
How dump code options are preservedAll the options you specify are recorded in the appropriate dump table, and written in the CICS globalcatalog. Any dump table entries you have changed or created during a CICS run are preserved whenCICS is subsequently shut down. They are available during the next run unless a cold start of CICS isperformed, in which case they are deleted from the global catalog.
Note however you have the option of installing dump codes afresh on a cold start using RDO-definedDUMPCODEs in a group that is installed as part of the GRPLIST.
Dump table additions and changes are lost in the following circumstances:
• When a cold start of CICS is performed and dumpcodes are not re-installed as part of RDO GRPLISTinstallation.
• When the CICS global catalog is redefined, although this is likely to be done only in exceptionalcircumstances.
• When CICS creates a temporary dump table entry for you, because you have asked for a dump for whichthere is no dump code in the dump table.
20 CICS TS for z/OS: Troubleshooting CICS
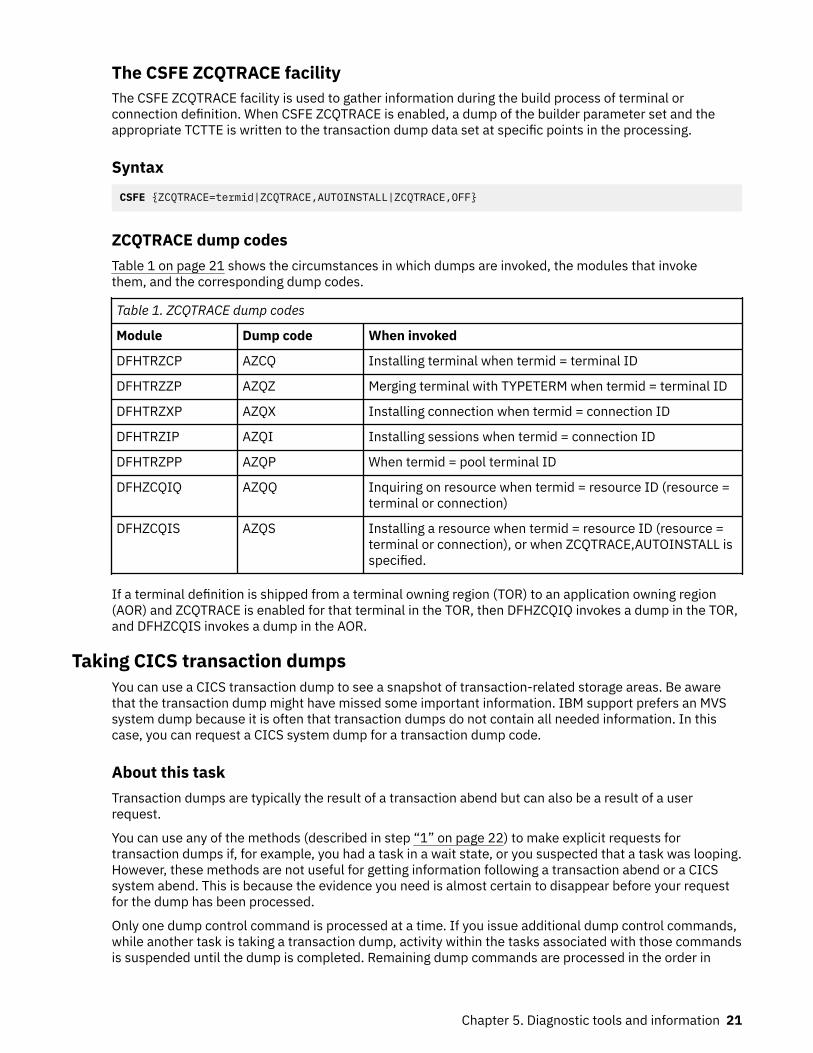
The CSFE ZCQTRACE facilityThe CSFE ZCQTRACE facility is used to gather information during the build process of terminal orconnection definition. When CSFE ZCQTRACE is enabled, a dump of the builder parameter set and theappropriate TCTTE is written to the transaction dump data set at specific points in the processing.
SyntaxCSFE {ZCQTRACE=termid|ZCQTRACE,AUTOINSTALL|ZCQTRACE,OFF}
ZCQTRACE dump codesTable 1 on page 21 shows the circumstances in which dumps are invoked, the modules that invokethem, and the corresponding dump codes.
Table 1. ZCQTRACE dump codes
Module Dump code When invoked
DFHTRZCP AZCQ Installing terminal when termid = terminal ID
DFHTRZZP AZQZ Merging terminal with TYPETERM when termid = terminal ID
DFHTRZXP AZQX Installing connection when termid = connection ID
DFHTRZIP AZQI Installing sessions when termid = connection ID
DFHTRZPP AZQP When termid = pool terminal ID
DFHZCQIQ AZQQ Inquiring on resource when termid = resource ID (resource =terminal or connection)
DFHZCQIS AZQS Installing a resource when termid = resource ID (resource =terminal or connection), or when ZCQTRACE,AUTOINSTALL isspecified.
If a terminal definition is shipped from a terminal owning region (TOR) to an application owning region(AOR) and ZCQTRACE is enabled for that terminal in the TOR, then DFHZCQIQ invokes a dump in the TOR,and DFHZCQIS invokes a dump in the AOR.
Taking CICS transaction dumpsYou can use a CICS transaction dump to see a snapshot of transaction-related storage areas. Be awarethat the transaction dump might have missed some important information. IBM support prefers an MVSsystem dump because it is often that transaction dumps do not contain all needed information. In thiscase, you can request a CICS system dump for a transaction dump code.
About this taskTransaction dumps are typically the result of a transaction abend but can also be a result of a userrequest.
You can use any of the methods (described in step “1” on page 22) to make explicit requests fortransaction dumps if, for example, you had a task in a wait state, or you suspected that a task was looping.However, these methods are not useful for getting information following a transaction abend or a CICSsystem abend. This is because the evidence you need is almost certain to disappear before your requestfor the dump has been processed.
Only one dump control command is processed at a time. If you issue additional dump control commands,while another task is taking a transaction dump, activity within the tasks associated with those commandsis suspended until the dump is completed. Remaining dump commands are processed in the order in
Chapter 5. Diagnostic tools and information 21
which they are made. Using the DUMP TRANSACTION command causes some fields (for example, EIBFNand EIBRCODE) in the EIB and the TCA to be overwritten.
Note: Due to the circumstances under which they are called, the following abends might not alwaysproduce a transaction dump:
ASPFASPNASPO
ASPPASPQASPR
ASP1ASP2ASP3
ASP7ASP8
Procedure1. If you want to make an explicit request for a transaction dump, use one of the following methods:
• You can use EXEC CICS DUMP TRANSACTION to get a transaction dump, even if dumping hasbeen suppressed for the transaction that you identify on the command.
You must specify a transaction dump code when you use this command, and it must be a maximumof 4 characters in length (for example, TD01).
• You can make a TRANSACTION_DUMP XPI call from an exit program to request a transactiondump. For programming information about this exit, see Global user exit programs.
Tip:
• You can specify the areas you want written to a transaction dump when you use the EXEC CICSDUMP TRANSACTION command to get a transaction dump.
It's possible to dump the following areas of main storage in various combinations:
Task-related storage areas: selected main storage areas related to the requesting task. Youwould normally use a dump of these areas to test and debug your application program. (CICSautomatically provides this service if the related task is terminated abnormally.)CICS control tables: lists of the CICS system initialization parameters and the FILE, PROGRAM,TRANSACTION and TERMINAL resource definitions in the CICS system. A dump of these tablesis typically the first dump taken in a test in which the base of the test must be established;subsequent dumps are usually of the task-related storage type.It is sometimes appropriate during execution of a task to have a dump of both task-relatedstorage areas and CICS control tables. Specifying one CICS control tables dump and a numberof task-related storage dumps is generally more efficient than specifying a comparable numberof complete dumps. However, you should not use this facility excessively because CICS controltables are primarily static areas.In addition, the DUMP TRANSACTION command used with the three options, SEGMENTLIST,LENGTHLIST, and NUMSEGMENTS, allows you to dump a series of task-related storage areassimultaneously.
You cannot specify in the dump table which areas are to be written to the transaction dumpfor particular transaction dump codes. You always get a complete transaction dump whenever atransaction abend occurs, if the dump code requires a transaction dump to be taken.
• If you do not get a dump when an abend occurs, make sure that the transaction definition specifiesDUMP=YES.
Transaction dumps are written to either DFHDMPA or DFHDMPB. Enter CEMT I DUMPDS to displayinformation about the dump data sets. For details, see “Where dumps are written” on page 27.
Note: Program storage is not dumped for programs defined with the attribute RELOAD(YES).2. Format transaction dumps offline using the CICS dump utility program, DFHDU730.
You can get a list of the CICS nucleus modules and active programs, indexed by address, at the end ofthe printed dump.
3. Interpret transaction dumps.
22 CICS TS for z/OS: Troubleshooting CICS
Read this topic to learn about the contents of a transaction dump and the guidance on locatinginformation that is useful for debugging transactions.
What to do nextIf a transaction dump is not enough, you can request a CICS system dump by entering CEMT SETTRD(code) SYS MAX(1) ADD where code is the transaction abend code. Ensure that MAX is 1 greaterthan CUR to capture a dump; check this by entering CEMT INQ TRD(code).
Taking CICS system dumpsYou can use an MVS system dump of CICS to see the entire CICS region and other related address spaceswhen needed. You can be reasonably confident that the system dump has captured all the evidenceyou need to solve your problem. That's why IBM Support prefers an MVS system dump over a CICStransaction dump. The amount of CICS system dump data that you could get is potentially very large, butthat is not a problem. You can leave the data on the system dump data set, or keep a copy of it, andformat it selectively as you require.
About this taskYou can use any of the methods (described in steps “1” on page 23 and “2” on page 23) to makeexplicit requests for system dumps if, for example, you had a task in a wait state, or you suspected thata task was looping. However, these methods are not useful for getting information following a transactionabend or a CICS system abend. This is because the evidence you need is almost certain to disappearbefore your request for the dump has been processed.
Only one dump control command is processed at a time. If you issue additional dump control commands,while another task is taking a system dump, activity within the tasks associated with those commandsis suspended until the dump is completed. Remaining dump commands are processed in the order inwhich they are made. Using the PERFORM SNAP command causes some fields (for example, EIBFN andEIBRCODE) in the EIB and the TCA to be overwritten.
Procedure1. If you want to make an explicit request for a system dump, use one of the following methods:
• You can request a system dump at any time by entering MVS command DUMP COMM=(dumpname)followed by a reply of R yy,JOBNAME=(cicsjob) where yy is the number of the message.
• You can request a CICS system dump from the main terminal by using CEMT PERFORM [DUMP|SNAP], if system dumping has not been globally suppressed. The system dump code that is neededis supplied by CICS, and it has a specific value of MT0001.
• You can issue EXEC CICS PERFORM DUMP to get a CICS system dump, if system dumping is notglobally suppressed. You must specify a system dump code when you use this command and it mustbe a maximum of 8 characters in length.
• You can make a SYSTEM_DUMP XPI call from an exit program to request a system dump. Forprogramming information about this exit, see Global user exit programs.
2. When re-creating a problem, you can request a system dump for a transaction abend code or for aCICS message.
To request a system dump for a transaction abend:
a. Enter CEMT SET TRD(code) SYS MAX(1) ADD where code is the transaction abend code.Ensure that MAX is 1 greater than CUR to capture a dump; check this by entering CEMT INQTRD(code).
b. Re-create the problem or wait for it to occur.
Chapter 5. Diagnostic tools and information 23
To request a system dump for a CICS message:
a. Enter CEMT SET SYD(nnnnn) SYS MAX(1) ADD where nnnnn is the CICS message withoutthe DFH prefix.
b. Re-create the problem or wait for it to occur.
For detailed instructions, see “Enabling system dumps for some CICS messages” on page 24.3. CICS system dumps are written to MVS dump data sets. Check the MVS console for message IEA611I
or IEA911E to determine the dump data set name and whether the dump is complete or partial.
Tip:
If you receive a partial dump or if the dump does not contain all the areas you expect, troubleshootwith these steps:
a. Ensure that the SDUMP options needed to support the CICS dump exit are in force at the time thedump is written. See “Setting up the dumping environment” on page 19. If the options are not setcorrectly, you can do one of the following:
• Enter the MVS change dump command:
CD SET, SDUMP=(ALLPSA,SQA,SUMDUMP,NUC,RGN,LPA,TRT,CSA,GRSQ),ADD
• Update member IEACMDxx in the SYS1.PARMLIB.b. Ensure that the dump data sets are large enough. Start with a minimum of 300 cylinders.
If you do not get a dump when an abend occurs, troubleshoot with these steps:
a. Make sure the CICS region is started with the DUMP=YES SIT parameter. When CICS is up, you canenter CEMT I SYS to display the value of the DUMP option:
Dumping( Sysdump ) displays if DUMP=YES is in effect.Dumping( Nosysdump ) displays if DUMP=NO is in effect.
b. Make sure the SYS1.DUMP data sets are available. As an alternative, use the dynamic allocationfacility to have MVS dynamically allocate data sets containing the dump with the type of nameDUMP.SYS1.CICSRGN.D070910.T191701.S00001.
4. Format the dump using IPCS and the CICS print dump exit DFHPDxxx, where xxx is the version of CICSthat you used to create the dump.For detailed instructions, see “Formatting system dumps” on page 42.
5. Interpret and analyze system dumps.For more information, see Analyzing an SVC Dump in the z/OS MVS Diagnosis: Tools and Service Aids.The MVS manuals do not contain an explanation of the output from the CICS verb exit. CICS supportwill assist you with the interpretation of the CICS control blocks.
Enabling system dumps for some CICS messagesThere are occasions when you might need diagnostic information for an event that causes a message tobe sent, but does not normally cause CICS to take a system dump. You can enable system dumping forsome CICS messages that do not normally cause CICS to take a system dump.
Before you beginTo determine which messages you can do this for, look in CICS messages. If the message you areinterested in has a 2-character alphabetic component ID after the DFH prefix, and it has either XMEOUTglobal user exit parameters, or a destination of "Terminal User", you can use it to construct a systemdump code to add to the dump table.
About this taskYou cannot enable dumping for messages that do not have the characteristics described earlier. Forexample, some messages that are issued early during initialization cannot be used to cause CICS to take
24 CICS TS for z/OS: Troubleshooting CICS
a system dump, because the mechanisms that control dumping might not be initialized at that time. Also,you cannot enable dumping for the message domain's own messages (they are prefixed by DFHME) wherethey do not normally cause CICS to take a system dump.
Procedure1. Add the dump code (constructed by removing the DFH prefix from the message number) to the system
dump table.Use CEMT SET SYD(xxxxxx) SYS MAX(1) ADD where xxxxxx is the CICS message number withoutthe DFH prefix. For example, if you are receiving a DFHWB0100 message, you can add this to thesystem dump table by specifying WB0100.
2. Specify the SYSDUMP option.
ResultsCICS then causes a system dump to be taken when the message is issued.
System dump actions with messages DFHAP0001 and DFHSR0001In the event of a program check or MVS abend in the AP domain or in a user application program, CICSmay issue either message DFHAP0001 or DFHSR0001.
Message DFHSR0001 is issued by CICS only when storage protection is active; that is, the systeminitialization parameter STGPROT=YES is specified or allowed to default. CICS determines which of thesemessages to issue depending on whether or not the program check or MVS abend occurs in code runningin user key.
• If the code had been running in user key at the time of the program check or MVS abend, CICS issuesmessage DFHSR0001 and takes a system dump with dump code SR0001. Only application programsdefined with EXECKEY(USER) run in user key.
• If the code had not been running in user key at the time of the program check or MVS abend, CICSissues message DFHAP0001 and takes a system dump with dump code AP0001.
So, if CICS storage protection is active, this mechanism enables you to suppress the system dumpscaused by errors in application programs, while still allowing dumps caused by errors in CICS code tobe taken. To achieve this, use either a CEMT SET SYDUMPCODE or an EXEC CICS SET SYSDUMPCODEcommand to suppress system dumps for system dumpcode SR0001:
CEMT SET SYDUMPCODE(SR0001) ADD NOSYSDUMP
If storage protection is not active, the dumps may be suppressed by a suppression of dumpcode AP0001.Note, however, that this suppresses dumps for errors in both application and CICS code. The XDUREQglobal user exit can be used to distinguish between AP0001 situations in application and nonapplicationcode.
You cannot control AP0001 and SR0001 system dumps by using the DUMP parameter of theTRANSACTION resource definition. The DUMP parameter of the TRANSACTION resource definitioncontrols only transaction dumps.
Usually, program checks, or MVS abends caused by an application program, are also followed by an ASRA,ASRB or ASRD transaction abend and a transaction dump. If, in some instances, you want the SDUMPfor one of these transaction abends but not the other, specify the one you want by using either a CEMTTRDUMPCODE or an EXEC CICS TRANDUMPCODE command. For example, specifying:
CEMT SET TRDUMPCODE(ASRB) ADD SYSDUMP
adds an entry to the dump table and ensures that SDUMPs are taken for ASRB abends. However, note thatthe SDUMP in this instance is taken at a later point than the SDUMP normally taken for system dump codeAP0001 or SR0001.
Chapter 5. Diagnostic tools and information 25
Detecting and avoiding duplicate system dumpsWhen more than one CICS system runs under one instance of the MVS operating system, two CICSsystems can take duplicate system dumps.
Each CICS system dump header includes a symptom string. The symptom string will be created onlyif the system dump code has the DAE option specified in the dump table entry. The default action isthat symptom strings are not produced. This can, however, be altered by means of the DAE systeminitialization parameter.
The symptom strings provide sufficient information to enable the detection of duplicate dumps. You cantake advantage of this in either of two ways:
1. Use MVS Dump Analysis Elimination (DAE) to detect and suppress duplicate dumps. (If the symptomstring has been suppressed by the dump table option, DAE will not suppress the system dump.)
You can control DAE with an ADYSETxx parmlib member. For information about DAE, see z/OS MVSDiagnosis: Tools and Service Aids.
2. Manually compare the headers of system dumps, so that you are aware that you have duplicatedumps. Doing it this way, you avoid repeating the same analysis, but still have a separate dump listingfor each CICS system.
Taking SLIP dumpsUse an MVS serviceability level indication processing (SLIP) trap to get a SLIP dump when specified eventoccurs. SLIP dumps can be taken under guidance from IBM Support for specific problem determinationpurposes, particularly when the existing first-failure data capture (FFDC) cannot gather the level of detailrequired for specific problems. SLIP dumps are written to the MVS dump data sets and have a title ofSLIP ID=xxxx.
Procedure1. Use the SLIP command to set a SLIP trap.
For example, the following command defines a trap that will cause an SVC dump to be taken when anabend S878 occurs:
SLIP SET,COMP=878,JOBNAME=xxxxxxxx,A=SVCD, SDATA=(ALLPSA,CSA,GRSQ,LPA,NUC,RGN,SQA,TRT,SUMDUMP),END
where xxxxxxxx is your CICS job name and a MATCHLIM (ML=) is set to 1 by default. After thematch-limit is reached, the SLIP trap will be disabled. You can specify a higher match-limit when youset the SLIP by coding a value with option ML. For example, ML=5 will result in up to five dumps.
2. Use the following MVS commands when working with traps:
Command Description
D SLIP Display all SLIP traps in the system.
D SLIP=idid Display the details about a specific trap.
SLIP MOD,ID=idid,ENABLE Activate the slip trap.
SLIP MOD,ID=idid,DISABLE Disable the slip trap.
SLIP DEL,ID=idid Delete the slip trap.
3. Format the dump using IPCS.IPCS provides you with an interactive facility for diagnosing software failures. You can either view thedumps at your terminal or print them. For example, you could enter the following when using IPCS:
a. Enter 0 to display the Defaults panel.b. Enter the dump dataset name:
26 CICS TS for z/OS: Troubleshooting CICS
Source ==> DSNAME('dump.dataset.name')
c. Enter =6 to display the Command panel.d. Enter one of the following commands:
To display the time and the program producing the dump, SLIPDUMP:
==> ST SYS
To display the SLIP trap producing the dump:
==> L SLIPTRAP
To display PSW and general purpose registers:
==> ST CPU REGS
e. Enter N in response to the following message:BLS18160D May summary dump data be used by dump access?
4. Interpret the dump.For details, see Analyzing an SVC Dump in the z/OS MVS Diagnosis: Tools and Service Aids.
Where dumps are writtenTransaction dumps and system dumps are written to different destinations.
Transaction dumpsTransaction dumps go to a pair of CICS BSAM data sets, with DD names DFHDMPA and DFHDMPB. Someof the attributes of these data sets can be set by system initialization parameters, some can be setdynamically using CEMT SET DUMPDS or EXEC CICS SET DUMPDS, and all can be inquired on by usingCEMT INQ DUMPDS or EXEC CICS INQUIRE DUMPDS. DFHDMPA and DFHDMPB have the followingattributes:CURRENTDDS status
This tells you the data set that is currently active, which is the one where transaction dumps arecurrently written.
You can use the system initialization parameter DUMPDS to specify the transaction dump data setthat is to be opened during initialization. You can use the CEMT SET DUMPDS transaction or an EXECCICS SET command to switch the dump data sets.
One of the statuses OPEN or CLOSEDA transaction dump data set must be OPEN if it is to be written to.
One of the statuses NOAUTOSWITCH, AUTOSWITCH, or ALLThe current data set has one of the statuses NOAUTOSWITCH, AUTOSWITCH, or ALL. You can set thestatus during system initialization using the DUMPSW system initialization parameter, and you can set itdynamically using the CEMT transaction or an EXEC CICS SET command.
If the status is AUTOSWITCH, a switch is made automatically to the other dump data set when thecurrent one becomes full, and subsequent transaction dumps are written to the new dump data set.The overflowing transaction dump is written in its entirety to the new dump data set.
The dump data set being switched to does not inherit the AUTOSWITCH status, to prevent data in thefirst dump data set from being overwritten by another switch. You need to reset the AUTOSWITCHstatus explicitly, if you want it, or set the switch status to ALL. A value of ALL means the data sets willcontinually switch when they are full.
If the status is NOAUTOSWITCH, a switch is not made when the current dump data set becomes full,so no more transaction dumps can be written.
Chapter 5. Diagnostic tools and information 27
CICS system dumpsCICS system dumps are written to MVS dump data sets. CICS can write only one system dump to anyindividual dump data set.
If another address space is already taking an SDUMP when CICS issues the SDUMP macro, the requestfails but is automatically retried. You can use the DURETRY system initialization parameter to define thetotal time that CICS is to continue trying to take an SDUMP.
If CICS tries to take an SDUMP when all the dump data sets are full, the dump is lost. Because of this, it isadvisable to monitor the number of full data sets, and to take copies of dumps before processing them, sothat you can free the dump data sets for reuse.
The occasions when CICS requests a dumpIn general, CICS requests a dump when a transaction or CICS system abend occurs. The dumpingenvironment determines whether or not a dump is taken.
CICS does not take a transaction dump if a HANDLE ABEND is active at the current logical level. Thisis called an implicit HANDLE ABEND and causes the suppression of transaction dumps. To make PL/Iwork on units, PL/I library routines can issue HANDLE ABEND. The NODUMP option on an EXECS CICSABEND command, an internal call, or the transaction definition, prevents the taking of a transaction dump.
The following are the occasions when CICS requests a dump:
• CICS requests a transaction dump, and perhaps a system dump, after a transaction abend occurs. Thereare two cases:
– You can include the command EXEC CICS ABEND in one of your applications, causing it to abendwhen some condition occurs. You must specify a four-character transaction abend code on thiscommand, and this is used as the transaction dump code. It could, for example, be ‘MYAB’.
– CICS might cause a transaction to abend, for any of the reasons described in CICS messages. In thiscase, the four-character CICS transaction abend code is used as the transaction dump code. It might,for example, be ASRA.
• A CICS system dump could be taken following a CICS system abend. In this situation, the system dumpcode is often equal to the abend message ID, with the leading letters “DFH” stripped off. In the case ofmessage DFHST0001, for example, the system dump code would be “ST0001”. However, in some casesthe system dump code cannot be directly related to a CICS message, either because it does not closelyresemble the message, or because no message accompanies the event causing the dump to be invoked.For details of these system dump codes, see CICS messages.
• When a transaction dump or system dump is taken, and the dump code includes the RELATED attributeon the DUMPSCOPE option, system dumps are taken of all CICS regions in the sysplex which are relatedto the CICS region on which this transaction dump or system dump is taken. A related CICS regionis one in which the unit of work identifiers, in the form of APPC tokens, of one or more tasks matchthose in the CICS region that issued the dump request. Typically, these may be regions in a distributedtransaction processing environment.
• A CICS system dump can be requested from within the Node Error Program (NEP) when a terminal erroris processed for a terminal with no task attached. For information about using NEPs to handle terminalerrors, read message DFHZC3496 and the programming information on NEPs in Writing a node errorprogram.
• A CICS system dump can also be requested from the global trap/trace exit. In this case, the systemdump code is TR1003.
CICS dumps in a sysplexYou can capture simultaneous dump data from multiple CICS regions across a sysplex. This facility helpswith problem determination in XCF/MRO environments where many CICS regions are running.
Capturing dump data in this way is useful in the following situations:
28 CICS TS for z/OS: Troubleshooting CICS
• A task involves multiple CICS regions in a sysplex and one region issues a dump, typically in response toan error.
To fully diagnose and solve the problem, dump data from all CICS regions related to the region thatissues the dump request is usually required. This dump data must be captured at the same time as thedump taken on the region that issues the dump.
• A MVS console operator needs to capture, simultaneously, dump data from multiple CICS regions in thesysplex.
To collect dump data in this way, you need MVS/ESA 5.1, the z/OS Workload Manager (WLM), and the XCFfacility. The z/OS images in the sysplex must be connected through XCF. The CICS regions must be usingMRO that is supported by the CICS TS 5.6 interregion communication program, DFHIRP.
Automatic dump data capture from related CICS regionsIt is possible to collect dump data simultaneously from all related CICS regions in a sysplex. Related CICSregions are those containing one or more tasks which have unit of work identifiers, in the form of APPCtokens, that match the unit of work identifiers in the CICS region which initially issued the dump request.
The CICS regions must be connected via XCF/MRO. Connections using thez/OS Communications Server(SNA) ISC are not eligible to use the related dump facility.
The function is controlled by the DUMPSCOPE option on each CICS dump table entry. You can set thisoption to have either of the following values:
• RELATED - take dumps for all related CICS regions across the sysplex.• LOCAL - take dumps for the requesting CICS region only. This is the default.
The DUMPSCOPE option is available on the following main terminal and system programming commands:
• EXEC CICS INQUIRE SYSDUMPCODE• EXEC CICS SET SYSDUMPCODE• EXEC CICS INQUIRE TRANDUMPCODE• EXEC CICS SET TRANDUMPCODE• CEMT INQUIRE SYDUMPCODE• CEMT SET SYDUMPCODE• CEMT INQUIRE TRDUMPCODE• CEMT SET TRDUMPCODE
If the DUMPSCOPE option is set to RELATED in the CICS region issuing the dump request, a request for asystem dump is sent to all MVS images in the sysplex that run related CICS regions.
The local MVS image running the CICS region that initiated the dump request has two dumps - one ofthe originating CICS region, the other containing the originating CICS region and up to fourteen additionalrelated CICS regions from the local MVS image.
When a dump is requested, the DUMPSCOPE option is tested only in the CICS region issuing the originaldump request. If the requesting CICS region has DUMPSCOPE defined as RELATED for the dump code,then all related CICS regions are dumped even if they have DUMPSCOPE defined as LOCAL for the dumpcode.
There is a maximum of fifteen address spaces in an SDUMP. If there are more than fifteen related CICSregions on an MVS image, then not all of them will be dumped. Related CICS regions may also fail to bedumped if they are swapped out when the dump request is issued. You should consider whether to makecertain CICS regions non-swappable as a result.
Chapter 5. Diagnostic tools and information 29
Operator-requested simultaneous dump data captureThe MVS console operator might want to issue a dump request simultaneously to several CICS regions inthe sysplex. There might be a problem in the sysplex where one or more CICS regions is hanging and, tofully diagnose and solve the problem, dump data captured at the same time is required.
Without this facility, such simultaneous dump data capture across multiple CICS regions in the sysplex isimpossible.
Use the following command at the console:
DUMP COMM=()R x,REMOTE=(SYSLIST=*),PROBDESC=(SYSDCOND,SYSDLOCL,(DFHJOBN,jobnames))
where:
• REMOTE controls the issuing of dumps on remote systems.• SYSLIST=* means the request is to be routed to all remote systems.• PROBDESC is problem description information, as follows:
– SYSDCOND is an MVS keyword that specifies that a dump is to be taken on remote MVS imagesif the IEASDUMP.QUERY exit responds with return code 0. CICS supplies DFHDUMPX as theIEASDUMP.QUERY exit.
– SYSDLOCL is an MVS keyword that drives the IEASDUMP.QUERY exit on the local and remote MVSimages. This allows the CICS regions on the local MVS region to be dumped.
– DFHJOBN is a CICS keyword. The operator should include the generic job name. This is used byDFHDUMPX to determine which address spaces to dump.
For a description of all command options, see z/OS MVS System Commands.
If you adopt a suitable naming convention for your CICS regions, this can be used to define suitablegeneric job names to determine which CICS regions to dump. For example, the generic job name for allCICS regions in the sysplex might be CICS*.
Requesting dumps to resolve SMSVSAM problemsYou may sometimes encounter a CICS problem that involves SMSVSAM. If you need to submit such aproblem to IBM, in particular where CICS or a CICS transaction is in a hung state while accessing VSAMdata sets in RLS mode, include a dump of the following items.
• All the SMSVSAM server address spaces in the sysplex, together with their associated data spaces• The address space of the CICS region that is hanging• The GRS address space• The VSAM CATALOG address space.
You can obtain such a dump by using the following command:
/DUMP COMM=(comment to describe the problem)
When MVS responds, reply to WTOR number nn with the following:
/R nn,JOBNAME=(CICS-job-name,SMSVSAM,CATALOG,GRS),DSPNAME='SMSVSAM'.*, REMOTE=(SYSLIST=*('SMSVSAM','CATALOG','GRS'),DSPNAME,SDATA, END
Note: You can use the CONT option to split this command into parts, as follows:
/R nn,JOBNAME=(CICS-job-name,SMSVSAM,CATALOG,GRS), CONT/R nn,DSPNAME='SMSVSAM'.*,REMOTE=(SYSLIST=*('SMSVSAM', CONT/R nn,'CATALOG','GRS'),DSPNAME,SDATA, END
30 CICS TS for z/OS: Troubleshooting CICS
Useful CICS main terminal and MVS console commands in a sysplexMVS support for remote SDUMPs is available only for images running MVS/ESA 5.1 or later and which areconnected by XCF. Related CICS SDUMPs are produced only for CICS regions which are MRO connectedusing XCF.
DFHIRP must be at CICS TS 5.6 level. Connections using z/OS Communications Server ISC are not eligibleto use the related dump facility.
If you are unable to produce related system dumps when there are related CICS regions across MVSimages, ensure that the regions are MRO connected.
Use the command CEMT I IRC to ensure that interregion communication is available. If IRC is notavailable it may be started using the CEMT S IRC OPEN command. Failure to start IRC results inDFHIRxxx messages which may be used to identify the source of the problem.
During IRC start processing, CICS attempts to join XCF group DFHIR000. If this fails, return code yyy isgiven in the DFHIR3777 message.
The following MVS console commands may be used to monitor activity in the sysplex:
• D XCF - to identify the MVS sysplex and list the name of each MVS image in the sysplex.
An example of a response to this command looks like this:
08.14.16 DEV5 d xcf 08.14.16 DEV5 IXC334I 08.14.16 DISPLAY XCF 602 SYSPLEX DEVPLEX5: DEV5
This response tells you that MVS image DEV5 has joined sysplex DEVPLEX5.• D XCF,GROUP - to list active XCF groups by name and size (note that CICS, group DFHIR000, is missing
from the following example response).
16.21.36 DEV5 d xcf,group 16.21.36 DEV5 IXC331I 16.21.36 DISPLAY XCF 877 GROUPS(SIZE): COFVLFNO(1) SYSDAE(2) SYSGRS(1) SYSIGW00(1) SYSIGW01(1) SYSIKJBC(1) SYSMCS(6) SYSMCS2(3) SYSWLM(1) WINMVSG(1)
• D XCF,COUPLE - to list details about the XCF coupling data set and its definitions. In the followingexample response, the data set has a MAXGROUP of 10 and a peak of 10. The response to XCF,GROUPindicates there are currently 10 active groups. If CICS now attempts to join XCF group DFHIR000, it willbe rejected and the IRC start will fail with message DFHIR3777.
16.30.45 DEV5 d xcf,couple 16.30.45 DEV5 IXC357I 16.30.45 DISPLAY XCF 883 SYSTEM DEV5 DATA INTERVAL OPNOTIFY MAXMSG CLEANUP RETRY CLASSLEN 42 45 500 60 10 956 SSUM ACTION SSUM INTERVAL WEIGHT N/A N/A N/A SYSPLEX COUPLE DATA SETS PRIMARY DSN: SYS1.XCFDEV5.PXCF VOLSER: SYS001 DEVN: 0F0E FORMAT TOD MAXSYSTEM MAXGROUP(PEAK) MAXMEMBER(PEAK) 08/16/93 08:05:39 8 10 (10) 87 (6) ALTERNATE DSN: SYS1.XCFDEV5.AXCF VOLSER: SYS001 DEVN: 0F0E FORMAT TOD MAXSYSTEM MAXGROUP MAXMEMBER 08/16/93 08:05:41 8 10 87
This example also indicates that the primary and alternate data sets are on the same volume, therebygiving rise to a single point of failure.
Chapter 5. Diagnostic tools and information 31
Use the command CEMT I CONNECTION to display the status of the connections. ‘XCF' is displayed forevery acquired connection using MRO/XCF for communications.
I CONNECTION STATUS: RESULTS - OVERTYPE TO MODIFY Con(FORD) Net(IYAHZCES) Ins Acq Xcf Con(F100) Net(IYAHZCEC) Ins Acq Irc Con(F150) Net(IYAHZCED) Ins Acq Irc Con(GEO ) Net(IYAHZCEG) Ins Acq Xcf Con(GMC ) Net(IYAHZCEB) Ins Acq Xcf Con(JIM ) Net(IYAHZCEJ) Ins Acq Xcf Con(MARY) Net(IYAHZCEM) Ins Acq Xcf Con(MIKE) Net(IYAHZCEI) Ins Acq Xcf + Con(RAMB) Net(IYAHZCEE) Ins Acq Xcf SYSID=CHEV APPLID=IYAHZCET RESPONSE: NORMAL TIME: 01.28.59 DATE: 06.11.94 PF 1 HELP 3 END 7 SBH 8 SFH 9 MSG 10 SB 11 SF
CICS initialization issues an MVS CSVDYNEX request to add DFHDUMPX as an MVS IEASDUMP.QUERYexit. If you need to change the status of the exit, use the MVS console command SETPROG EXIT.
If you have determined that XCF communication is in use, you can verify that the CICS SDUMP exit hasbeen established using the following MVS commands:
D PROG,EXIT,MODNAME=DFHDUMPX 08.16.04 DEV5 CSV463I MODULE DFHDUMPX IS NOT ASSOCIATED ANY EXIT
D PROG,EXIT,EN=IEASDUMP.QUERY 08.17.44 DEV5 CSV463I NO MODULES ARE ASSOCIATED WITH EXIT IEASDUMP.QUERY
This example indicates that the exit has not been established.
The following displays indicate that DFHDUMPX is active as an IEASDUMP exit with one CICS TS 5.6region active in one MVS image.
D PROG,EXIT,MODNAME=DFHDUMPX 01.19.16 DEV5 CSV461I 01.19.16 PROG,EXIT DISPLAY 993 EXIT MODULE STATE MODULE STATE MODULE STATE IEASDUMP.QUERY DFHDUMPX A D PROG,EXIT,EN=IEASDUMP.QUERY 01.19.46 DEV5 CSV462I 01.19.46 PROG,EXIT DISPLAY 996 MODULE DFHDUMPX EXIT(S) IEASDUMP.QUERY
You may issue MVS dump commands from the console to verify that remote dumping is available withinthe MVS image, without an active CICS region.
11.29.59 DEV5 dump comm=(NO CICS) 11.29.59 DEV5 *03 IEE094D SPECIFY OPERAND(S) FOR DUMP COMMAND 11.36.49 DEV5 r 03,remote=(syslist=*),probdesc=(sysdcond, sysdlocl,(dfhjobn,iyahzcet)) 11.36.49 DEV5 IEE600I REPLY TO 03 IS;REMOTE=(SYSLIST=*), PROBDESC=(SYSDCOND,SYSDL 11.36.52 DEV5 IEA794I SVC DUMP HAS CAPTURED: DUMPID=001 REQUESTED BY JOB (*MAIN*) DUMP TITLE=NO CICS
In the next example, the messages from SDUMP indicate that one dump of the main address space hasbeen taken.
32 CICS TS for z/OS: Troubleshooting CICS
*11.37.03 DEV5 *IEA911E COMPLETE DUMP ON SYS1.DUMP03 *DUMPID=001 REQUESTED BY JOB (*MAIN*) *FOR ASID (0001) *REMOTE DUMPS REQUESTED *INCIDENT TOKEN: DEVPLEX5 DEV5 06/28/1994 11:36:49
Another test is to issue the dump command specifying the CICS XCF group.
11.42.33 DEV5 dump comm=(STILL NO CICS) 11.42.33 DEV5 *05 IEE094D SPECIFY OPERAND(S) FOR DUMP COMMAND 11.43.27 DEV5 r 05,remote=(grplist=dfhir000(*)), probdesc=(sysdcond,sysdlocl,(dfhjobn,iyahzcet)) 11.43.28 DEV5 IEE600I REPLY TO 05 IS;REMOTE=(GRPLIST=DFHIR000(*)),PROBDESC=(SYSD 11.43.31 DEV5 IEA794I SVC DUMP HAS CAPTURED: DUMPID=002 REQUESTED BY JOB (*MAIN*) DUMP TITLE=STILL NO CICS
The messages from SDUMP indicate that one dump of the main address space has been taken.
*11.43.42 DEV5 *IEA911E COMPLETE DUMP ON SYS1.DUMP03 *DUMPID=002 REQUESTED BY JOB (*MAIN*) *FOR ASID (0001) *REMOTE DUMPS REQUESTED *INCIDENT TOKEN: DEVPLEX5 DEV5 06/28/1994 11:43:28
To verify that the remote dumping function works on the local system, use the following commands:
11.45.57 DEV5 dump comm=(TEST REMOTE FUNCTION ON LOCAL SYSTEM 11.45.57 DEV5 *06 IEE094D SPECIFY OPERAND(S) FOR DUMP COMMAND 11.46.57 DEV5 r 06,remote=(grplist=*(*)),probdesc=(sysdlocl) 11.46.59 DEV5 IEE600I REPLY TO 06 IS;REMOTE=(GRPLIST=*(*)), PROBDESC=(SYSDLOCL) 11.47.00 DEV5 IEA794I SVC DUMP HAS CAPTURED: DUMPID=003 REQUESTED BY JOB (*MAIN*) DUMP TITLE=TEST REMOTE FUNCTION ON LOCAL SYSTEM 11.47.17 DEV5 IEA794I SVC DUMP HAS CAPTURED: DUMPID=004 REQUESTED BY JOB (DUMPSRV ) DUMP TITLE=TEST REMOTE FUNCTION ON LOCAL SYSTEM
The messages from SDUMP indicate two dumps were taken, one for the main address space and a secondwhich contains ASIDs 0101, 0012, 0001, 0005, 000B, 000A, 0008, 0007. Note that the same incidenttoken is used for both dumps.
*11.47.39 DEV5 *IEA911E COMPLETE DUMP ON SYS1.DUMP03 *DUMPID=003 REQUESTED BY JOB (*MAIN*) *FOR ASID (0001) *REMOTE DUMPS REQUESTED *INCIDENT TOKEN: DEVPLEX5 DEV5 06/28/1994 11:46:57 *11.47.59 DEV5 *IEA911E COMPLETE DUMP ON SYS1.DUMP04 *DUMPID=004 REQUESTED BY JOB (DUMPSRV ) *FOR ASIDS(0101,0012,0005,0001,000A,000B,0008,0007) *REMOTE DUMP FOR SYSNAME: DEV5 *INCIDENT TOKEN: DEVPLEX5 DEV5 06/28/1994 11:46:57
The following example lists the MVS console messages received when the CICS main terminal commandCEMT P DUMP is issued from CICS APPLID IYAHZCET executing in ASID 19 on MVS image DEV6.IYAHZCET has at least one related task in the CICS region executing in ASID 1B on MVS DEV6 andASIDS 001A, 001C, 001B, 001E, 001F, 0020, 001D, 0022, 0024, 0021, 0023, 0028, 0025, 0029, 0026on MVS image DEV7.
Chapter 5. Diagnostic tools and information 33
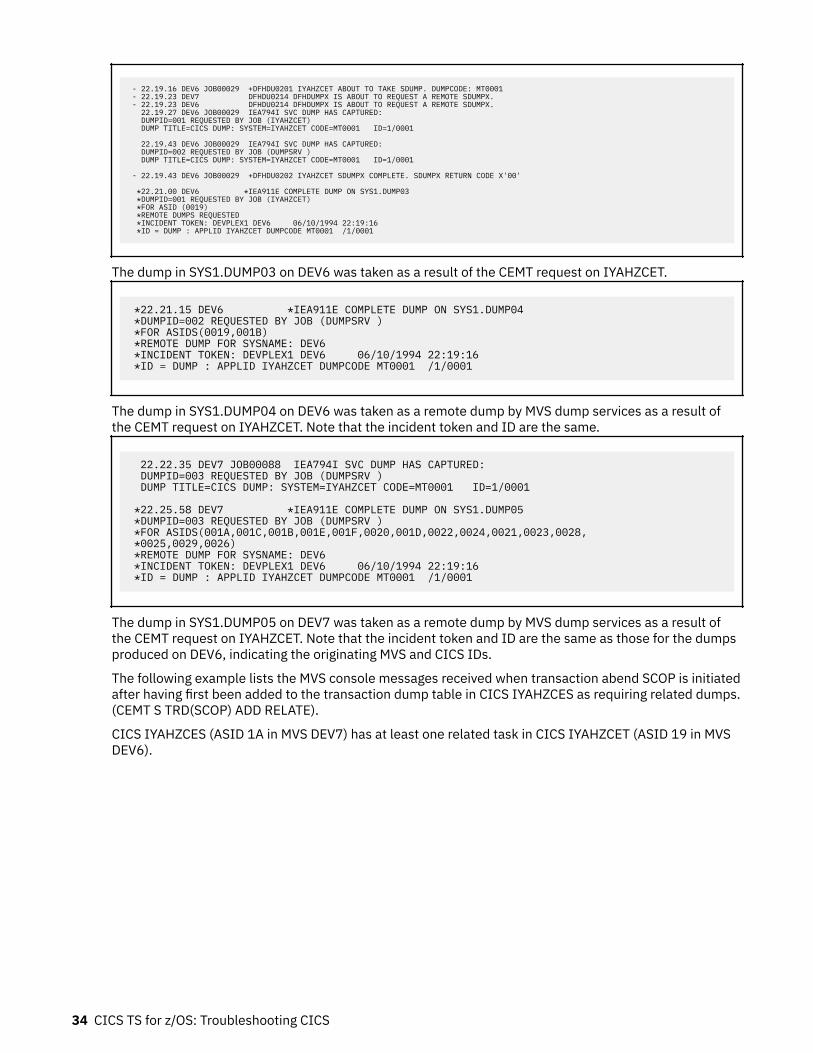
- 22.19.16 DEV6 JOB00029 +DFHDU0201 IYAHZCET ABOUT TO TAKE SDUMP. DUMPCODE: MT0001 - 22.19.23 DEV7 DFHDU0214 DFHDUMPX IS ABOUT TO REQUEST A REMOTE SDUMPX. - 22.19.23 DEV6 DFHDU0214 DFHDUMPX IS ABOUT TO REQUEST A REMOTE SDUMPX. 22.19.27 DEV6 JOB00029 IEA794I SVC DUMP HAS CAPTURED: DUMPID=001 REQUESTED BY JOB (IYAHZCET) DUMP TITLE=CICS DUMP: SYSTEM=IYAHZCET CODE=MT0001 ID=1/0001 22.19.43 DEV6 JOB00029 IEA794I SVC DUMP HAS CAPTURED: DUMPID=002 REQUESTED BY JOB (DUMPSRV ) DUMP TITLE=CICS DUMP: SYSTEM=IYAHZCET CODE=MT0001 ID=1/0001 - 22.19.43 DEV6 JOB00029 +DFHDU0202 IYAHZCET SDUMPX COMPLETE. SDUMPX RETURN CODE X'00' *22.21.00 DEV6 *IEA911E COMPLETE DUMP ON SYS1.DUMP03 *DUMPID=001 REQUESTED BY JOB (IYAHZCET) *FOR ASID (0019) *REMOTE DUMPS REQUESTED *INCIDENT TOKEN: DEVPLEX1 DEV6 06/10/1994 22:19:16 *ID = DUMP : APPLID IYAHZCET DUMPCODE MT0001 /1/0001
The dump in SYS1.DUMP03 on DEV6 was taken as a result of the CEMT request on IYAHZCET.
*22.21.15 DEV6 *IEA911E COMPLETE DUMP ON SYS1.DUMP04 *DUMPID=002 REQUESTED BY JOB (DUMPSRV ) *FOR ASIDS(0019,001B) *REMOTE DUMP FOR SYSNAME: DEV6 *INCIDENT TOKEN: DEVPLEX1 DEV6 06/10/1994 22:19:16 *ID = DUMP : APPLID IYAHZCET DUMPCODE MT0001 /1/0001
The dump in SYS1.DUMP04 on DEV6 was taken as a remote dump by MVS dump services as a result ofthe CEMT request on IYAHZCET. Note that the incident token and ID are the same.
22.22.35 DEV7 JOB00088 IEA794I SVC DUMP HAS CAPTURED: DUMPID=003 REQUESTED BY JOB (DUMPSRV ) DUMP TITLE=CICS DUMP: SYSTEM=IYAHZCET CODE=MT0001 ID=1/0001 *22.25.58 DEV7 *IEA911E COMPLETE DUMP ON SYS1.DUMP05 *DUMPID=003 REQUESTED BY JOB (DUMPSRV ) *FOR ASIDS(001A,001C,001B,001E,001F,0020,001D,0022,0024,0021,0023,0028, *0025,0029,0026) *REMOTE DUMP FOR SYSNAME: DEV6 *INCIDENT TOKEN: DEVPLEX1 DEV6 06/10/1994 22:19:16 *ID = DUMP : APPLID IYAHZCET DUMPCODE MT0001 /1/0001
The dump in SYS1.DUMP05 on DEV7 was taken as a remote dump by MVS dump services as a result ofthe CEMT request on IYAHZCET. Note that the incident token and ID are the same as those for the dumpsproduced on DEV6, indicating the originating MVS and CICS IDs.
The following example lists the MVS console messages received when transaction abend SCOP is initiatedafter having first been added to the transaction dump table in CICS IYAHZCES as requiring related dumps.(CEMT S TRD(SCOP) ADD RELATE).
CICS IYAHZCES (ASID 1A in MVS DEV7) has at least one related task in CICS IYAHZCET (ASID 19 in MVSDEV6).
34 CICS TS for z/OS: Troubleshooting CICS
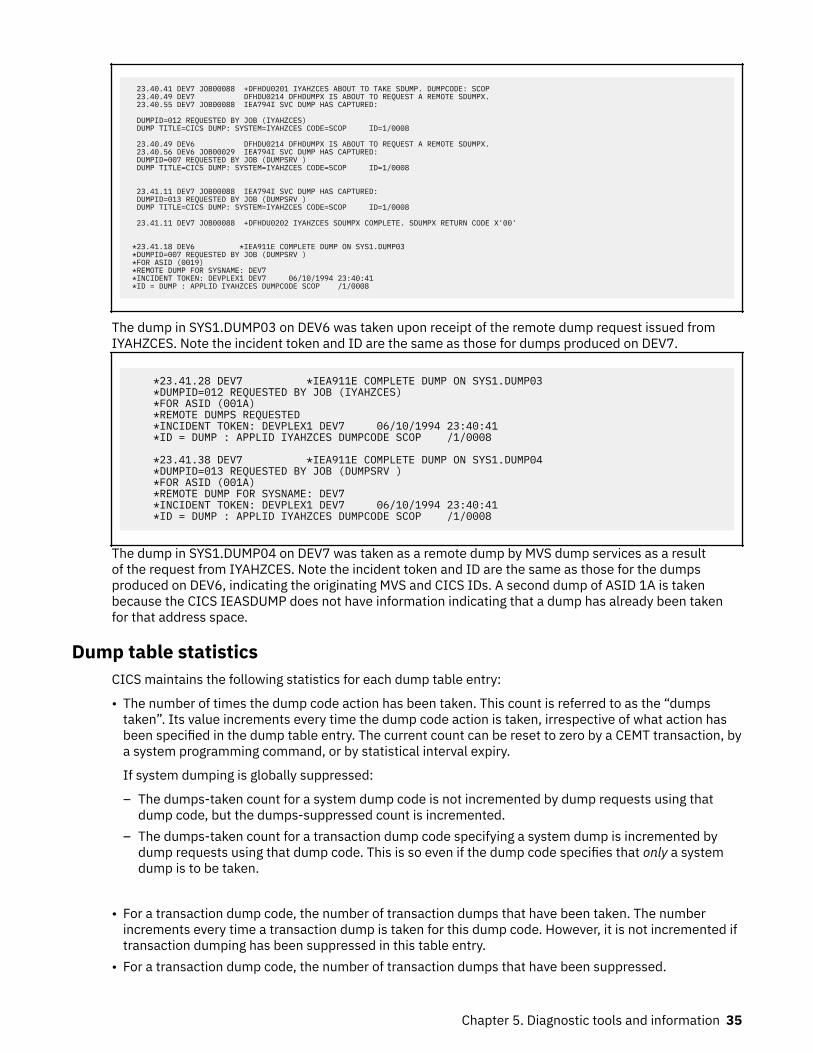
23.40.41 DEV7 JOB00088 +DFHDU0201 IYAHZCES ABOUT TO TAKE SDUMP. DUMPCODE: SCOP 23.40.49 DEV7 DFHDU0214 DFHDUMPX IS ABOUT TO REQUEST A REMOTE SDUMPX. 23.40.55 DEV7 JOB00088 IEA794I SVC DUMP HAS CAPTURED: DUMPID=012 REQUESTED BY JOB (IYAHZCES) DUMP TITLE=CICS DUMP: SYSTEM=IYAHZCES CODE=SCOP ID=1/0008 23.40.49 DEV6 DFHDU0214 DFHDUMPX IS ABOUT TO REQUEST A REMOTE SDUMPX. 23.40.56 DEV6 JOB00029 IEA794I SVC DUMP HAS CAPTURED: DUMPID=007 REQUESTED BY JOB (DUMPSRV ) DUMP TITLE=CICS DUMP: SYSTEM=IYAHZCES CODE=SCOP ID=1/0008 23.41.11 DEV7 JOB00088 IEA794I SVC DUMP HAS CAPTURED: DUMPID=013 REQUESTED BY JOB (DUMPSRV ) DUMP TITLE=CICS DUMP: SYSTEM=IYAHZCES CODE=SCOP ID=1/0008 23.41.11 DEV7 JOB00088 +DFHDU0202 IYAHZCES SDUMPX COMPLETE. SDUMPX RETURN CODE X'00' *23.41.18 DEV6 *IEA911E COMPLETE DUMP ON SYS1.DUMP03 *DUMPID=007 REQUESTED BY JOB (DUMPSRV ) *FOR ASID (0019) *REMOTE DUMP FOR SYSNAME: DEV7 *INCIDENT TOKEN: DEVPLEX1 DEV7 06/10/1994 23:40:41 *ID = DUMP : APPLID IYAHZCES DUMPCODE SCOP /1/0008
The dump in SYS1.DUMP03 on DEV6 was taken upon receipt of the remote dump request issued fromIYAHZCES. Note the incident token and ID are the same as those for dumps produced on DEV7.
*23.41.28 DEV7 *IEA911E COMPLETE DUMP ON SYS1.DUMP03 *DUMPID=012 REQUESTED BY JOB (IYAHZCES) *FOR ASID (001A) *REMOTE DUMPS REQUESTED *INCIDENT TOKEN: DEVPLEX1 DEV7 06/10/1994 23:40:41 *ID = DUMP : APPLID IYAHZCES DUMPCODE SCOP /1/0008 *23.41.38 DEV7 *IEA911E COMPLETE DUMP ON SYS1.DUMP04 *DUMPID=013 REQUESTED BY JOB (DUMPSRV ) *FOR ASID (001A) *REMOTE DUMP FOR SYSNAME: DEV7 *INCIDENT TOKEN: DEVPLEX1 DEV7 06/10/1994 23:40:41 *ID = DUMP : APPLID IYAHZCES DUMPCODE SCOP /1/0008
The dump in SYS1.DUMP04 on DEV7 was taken as a remote dump by MVS dump services as a resultof the request from IYAHZCES. Note the incident token and ID are the same as those for the dumpsproduced on DEV6, indicating the originating MVS and CICS IDs. A second dump of ASID 1A is takenbecause the CICS IEASDUMP does not have information indicating that a dump has already been takenfor that address space.
Dump table statisticsCICS maintains the following statistics for each dump table entry:
• The number of times the dump code action has been taken. This count is referred to as the “dumpstaken”. Its value increments every time the dump code action is taken, irrespective of what action hasbeen specified in the dump table entry. The current count can be reset to zero by a CEMT transaction, bya system programming command, or by statistical interval expiry.
If system dumping is globally suppressed:
– The dumps-taken count for a system dump code is not incremented by dump requests using thatdump code, but the dumps-suppressed count is incremented.
– The dumps-taken count for a transaction dump code specifying a system dump is incremented bydump requests using that dump code. This is so even if the dump code specifies that only a systemdump is to be taken.
• For a transaction dump code, the number of transaction dumps that have been taken. The numberincrements every time a transaction dump is taken for this dump code. However, it is not incremented iftransaction dumping has been suppressed in this table entry.
• For a transaction dump code, the number of transaction dumps that have been suppressed.
Chapter 5. Diagnostic tools and information 35
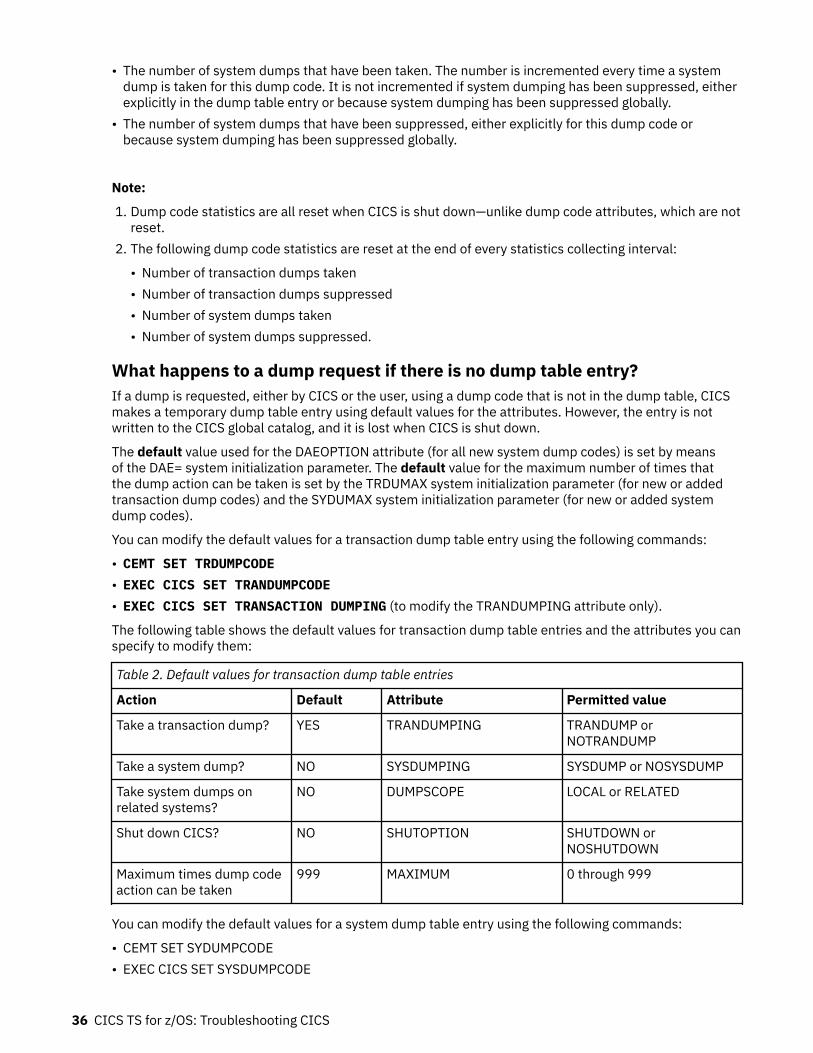
• The number of system dumps that have been taken. The number is incremented every time a systemdump is taken for this dump code. It is not incremented if system dumping has been suppressed, eitherexplicitly in the dump table entry or because system dumping has been suppressed globally.
• The number of system dumps that have been suppressed, either explicitly for this dump code orbecause system dumping has been suppressed globally.
Note:
1. Dump code statistics are all reset when CICS is shut down—unlike dump code attributes, which are notreset.
2. The following dump code statistics are reset at the end of every statistics collecting interval:
• Number of transaction dumps taken• Number of transaction dumps suppressed• Number of system dumps taken• Number of system dumps suppressed.
What happens to a dump request if there is no dump table entry?If a dump is requested, either by CICS or the user, using a dump code that is not in the dump table, CICSmakes a temporary dump table entry using default values for the attributes. However, the entry is notwritten to the CICS global catalog, and it is lost when CICS is shut down.
The default value used for the DAEOPTION attribute (for all new system dump codes) is set by meansof the DAE= system initialization parameter. The default value for the maximum number of times thatthe dump action can be taken is set by the TRDUMAX system initialization parameter (for new or addedtransaction dump codes) and the SYDUMAX system initialization parameter (for new or added systemdump codes).
You can modify the default values for a transaction dump table entry using the following commands:
• CEMT SET TRDUMPCODE• EXEC CICS SET TRANDUMPCODE• EXEC CICS SET TRANSACTION DUMPING (to modify the TRANDUMPING attribute only).
The following table shows the default values for transaction dump table entries and the attributes you canspecify to modify them:
Table 2. Default values for transaction dump table entries
Action Default Attribute Permitted value
Take a transaction dump? YES TRANDUMPING TRANDUMP orNOTRANDUMP
Take a system dump? NO SYSDUMPING SYSDUMP or NOSYSDUMP
Take system dumps onrelated systems?
NO DUMPSCOPE LOCAL or RELATED
Shut down CICS? NO SHUTOPTION SHUTDOWN orNOSHUTDOWN
Maximum times dump codeaction can be taken
999 MAXIMUM 0 through 999
You can modify the default values for a system dump table entry using the following commands:
• CEMT SET SYDUMPCODE• EXEC CICS SET SYSDUMPCODE
36 CICS TS for z/OS: Troubleshooting CICS
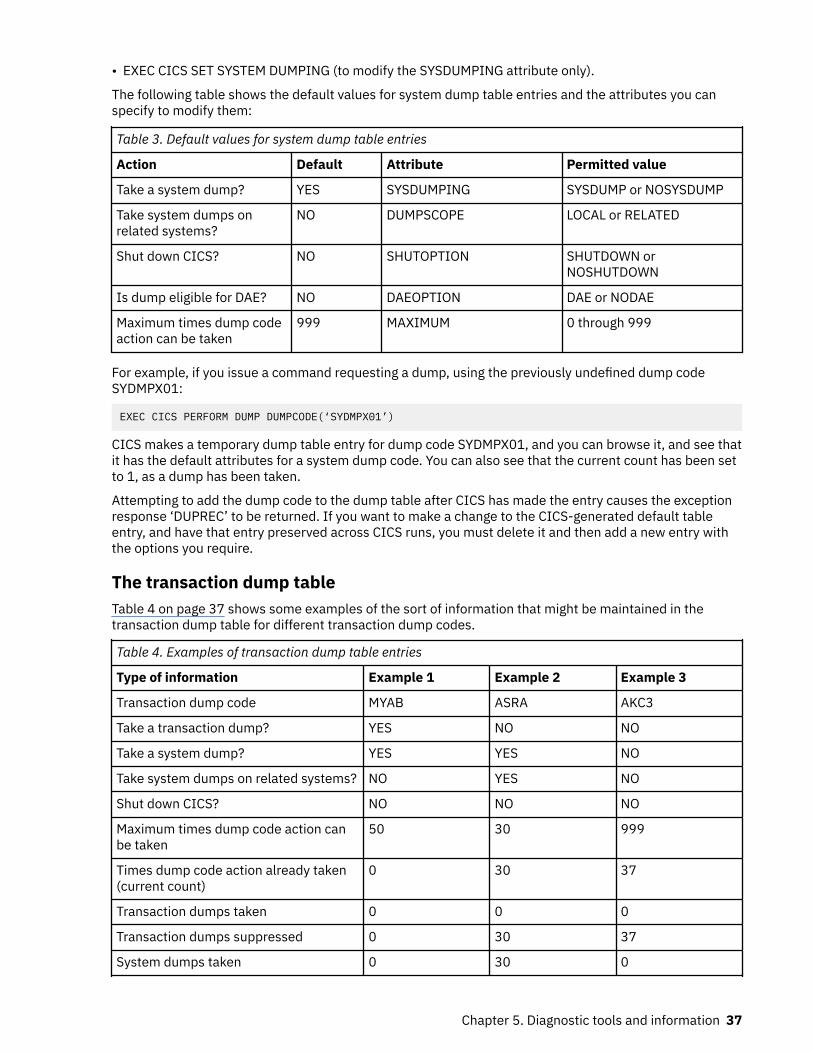
• EXEC CICS SET SYSTEM DUMPING (to modify the SYSDUMPING attribute only).
The following table shows the default values for system dump table entries and the attributes you canspecify to modify them:
Table 3. Default values for system dump table entries
Action Default Attribute Permitted value
Take a system dump? YES SYSDUMPING SYSDUMP or NOSYSDUMP
Take system dumps onrelated systems?
NO DUMPSCOPE LOCAL or RELATED
Shut down CICS? NO SHUTOPTION SHUTDOWN orNOSHUTDOWN
Is dump eligible for DAE? NO DAEOPTION DAE or NODAE
Maximum times dump codeaction can be taken
999 MAXIMUM 0 through 999
For example, if you issue a command requesting a dump, using the previously undefined dump codeSYDMPX01:
EXEC CICS PERFORM DUMP DUMPCODE(‘SYDMPX01’)
CICS makes a temporary dump table entry for dump code SYDMPX01, and you can browse it, and see thatit has the default attributes for a system dump code. You can also see that the current count has been setto 1, as a dump has been taken.
Attempting to add the dump code to the dump table after CICS has made the entry causes the exceptionresponse ‘DUPREC’ to be returned. If you want to make a change to the CICS-generated default tableentry, and have that entry preserved across CICS runs, you must delete it and then add a new entry withthe options you require.
The transaction dump tableTable 4 on page 37 shows some examples of the sort of information that might be maintained in thetransaction dump table for different transaction dump codes.
Table 4. Examples of transaction dump table entries
Type of information Example 1 Example 2 Example 3
Transaction dump code MYAB ASRA AKC3
Take a transaction dump? YES NO NO
Take a system dump? YES YES NO
Take system dumps on related systems? NO YES NO
Shut down CICS? NO NO NO
Maximum times dump code action canbe taken
50 30 999
Times dump code action already taken(current count)
0 30 37
Transaction dumps taken 0 0 0
Transaction dumps suppressed 0 30 37
System dumps taken 0 30 0
Chapter 5. Diagnostic tools and information 37
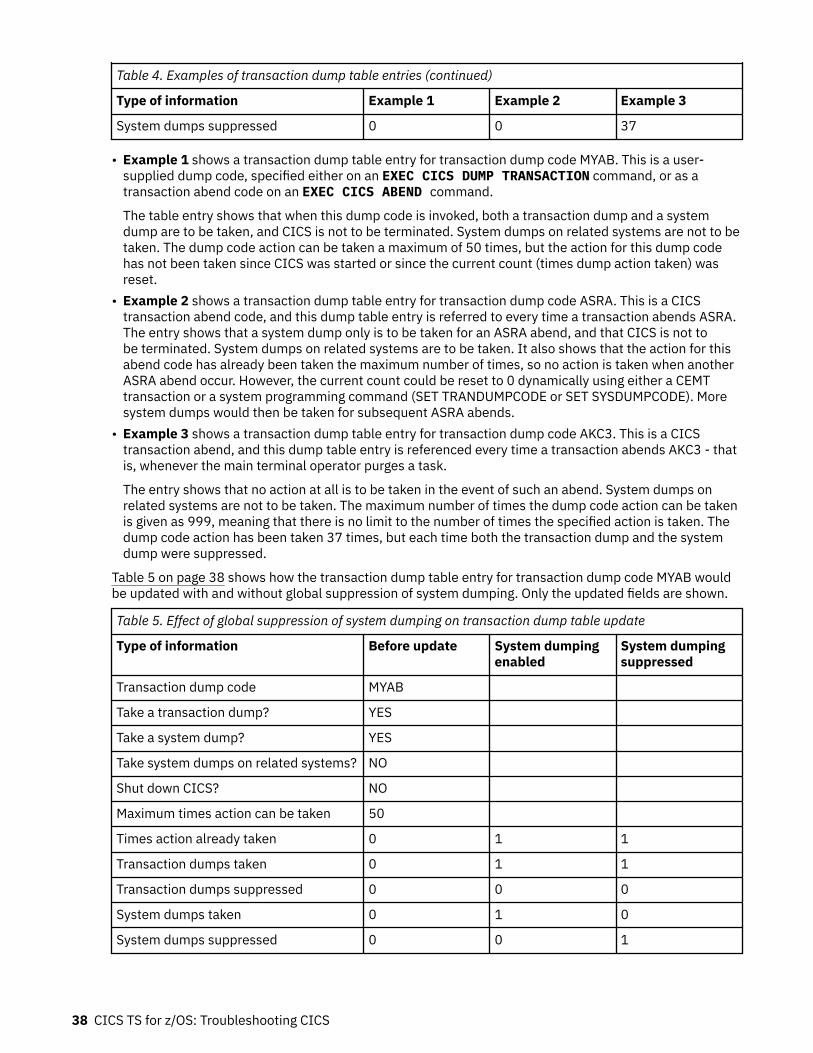
Table 4. Examples of transaction dump table entries (continued)
Type of information Example 1 Example 2 Example 3
System dumps suppressed 0 0 37
• Example 1 shows a transaction dump table entry for transaction dump code MYAB. This is a user-supplied dump code, specified either on an EXEC CICS DUMP TRANSACTION command, or as atransaction abend code on an EXEC CICS ABEND command.
The table entry shows that when this dump code is invoked, both a transaction dump and a systemdump are to be taken, and CICS is not to be terminated. System dumps on related systems are not to betaken. The dump code action can be taken a maximum of 50 times, but the action for this dump codehas not been taken since CICS was started or since the current count (times dump action taken) wasreset.
• Example 2 shows a transaction dump table entry for transaction dump code ASRA. This is a CICStransaction abend code, and this dump table entry is referred to every time a transaction abends ASRA.The entry shows that a system dump only is to be taken for an ASRA abend, and that CICS is not tobe terminated. System dumps on related systems are to be taken. It also shows that the action for thisabend code has already been taken the maximum number of times, so no action is taken when anotherASRA abend occur. However, the current count could be reset to 0 dynamically using either a CEMTtransaction or a system programming command (SET TRANDUMPCODE or SET SYSDUMPCODE). Moresystem dumps would then be taken for subsequent ASRA abends.
• Example 3 shows a transaction dump table entry for transaction dump code AKC3. This is a CICStransaction abend, and this dump table entry is referenced every time a transaction abends AKC3 - thatis, whenever the main terminal operator purges a task.
The entry shows that no action at all is to be taken in the event of such an abend. System dumps onrelated systems are not to be taken. The maximum number of times the dump code action can be takenis given as 999, meaning that there is no limit to the number of times the specified action is taken. Thedump code action has been taken 37 times, but each time both the transaction dump and the systemdump were suppressed.
Table 5 on page 38 shows how the transaction dump table entry for transaction dump code MYAB wouldbe updated with and without global suppression of system dumping. Only the updated fields are shown.
Table 5. Effect of global suppression of system dumping on transaction dump table update
Type of information Before update System dumpingenabled
System dumpingsuppressed
Transaction dump code MYAB
Take a transaction dump? YES
Take a system dump? YES
Take system dumps on related systems? NO
Shut down CICS? NO
Maximum times action can be taken 50
Times action already taken 0 1 1
Transaction dumps taken 0 1 1
Transaction dumps suppressed 0 0 0
System dumps taken 0 1 0
System dumps suppressed 0 0 1
38 CICS TS for z/OS: Troubleshooting CICS
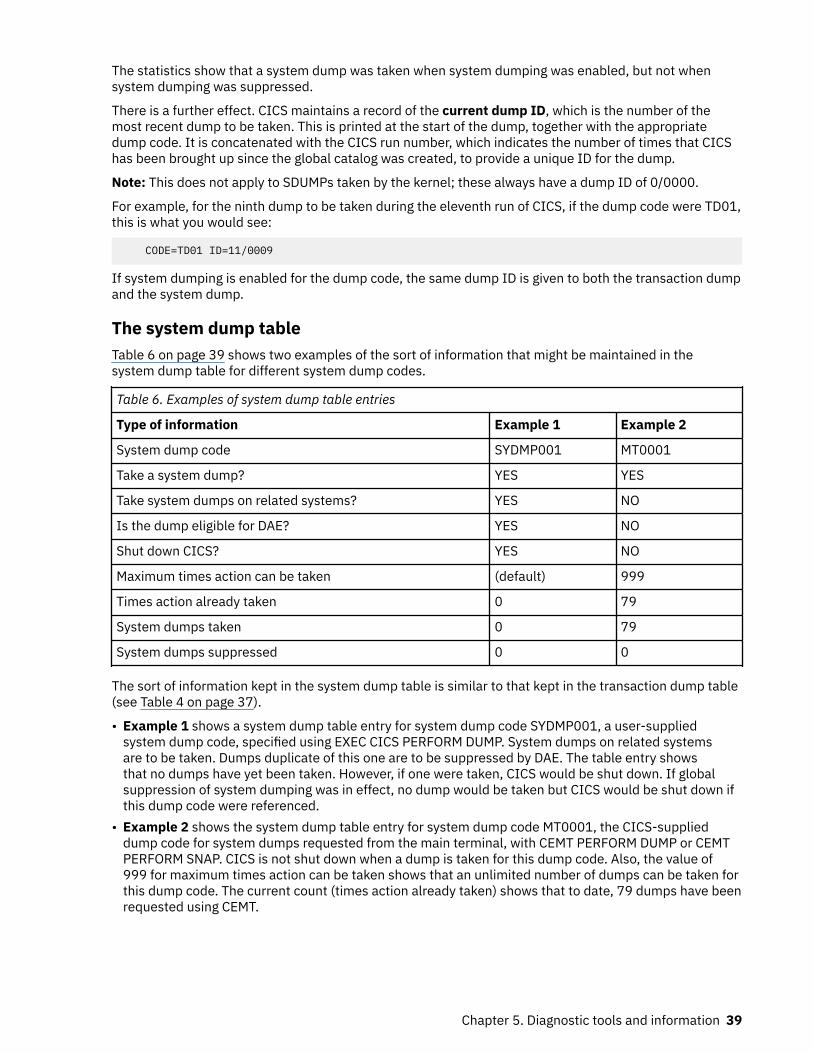
The statistics show that a system dump was taken when system dumping was enabled, but not whensystem dumping was suppressed.
There is a further effect. CICS maintains a record of the current dump ID, which is the number of themost recent dump to be taken. This is printed at the start of the dump, together with the appropriatedump code. It is concatenated with the CICS run number, which indicates the number of times that CICShas been brought up since the global catalog was created, to provide a unique ID for the dump.
Note: This does not apply to SDUMPs taken by the kernel; these always have a dump ID of 0/0000.
For example, for the ninth dump to be taken during the eleventh run of CICS, if the dump code were TD01,this is what you would see:
CODE=TD01 ID=11/0009
If system dumping is enabled for the dump code, the same dump ID is given to both the transaction dumpand the system dump.
The system dump tableTable 6 on page 39 shows two examples of the sort of information that might be maintained in thesystem dump table for different system dump codes.
Table 6. Examples of system dump table entries
Type of information Example 1 Example 2
System dump code SYDMP001 MT0001
Take a system dump? YES YES
Take system dumps on related systems? YES NO
Is the dump eligible for DAE? YES NO
Shut down CICS? YES NO
Maximum times action can be taken (default) 999
Times action already taken 0 79
System dumps taken 0 79
System dumps suppressed 0 0
The sort of information kept in the system dump table is similar to that kept in the transaction dump table(see Table 4 on page 37).
• Example 1 shows a system dump table entry for system dump code SYDMP001, a user-suppliedsystem dump code, specified using EXEC CICS PERFORM DUMP. System dumps on related systemsare to be taken. Dumps duplicate of this one are to be suppressed by DAE. The table entry showsthat no dumps have yet been taken. However, if one were taken, CICS would be shut down. If globalsuppression of system dumping was in effect, no dump would be taken but CICS would be shut down ifthis dump code were referenced.
• Example 2 shows the system dump table entry for system dump code MT0001, the CICS-supplieddump code for system dumps requested from the main terminal, with CEMT PERFORM DUMP or CEMTPERFORM SNAP. CICS is not shut down when a dump is taken for this dump code. Also, the value of999 for maximum times action can be taken shows that an unlimited number of dumps can be taken forthis dump code. The current count (times action already taken) shows that to date, 79 dumps have beenrequested using CEMT.
Chapter 5. Diagnostic tools and information 39
Dumping a CFDT list structureYou can use the MVS DUMP command to obtain a dump of the coupling facility list structure for a couplingfacility data table pool.
Before you beginIn order to obtain a dump of a coupling facility list structure, you must specify a value for the DUMPSPACEparameter in the CFRM policy for the coupling facility. The recommended value is 5% of the space in thecoupling facility. For more information, see z/OS MVS Setting Up a Sysplex.
About this task
Procedure1. Enter the following command at the console:
DUMP COMM=(cfdt_poolname)
In response to the DUMP command, the system prompts you with a reply number for the dumpoptions you want to specify.
2. Enter the reply:
REPLY nn,STRLIST=(STRNAME=DFHCFLS_poolname,ACCESSTIME=NOLIMIT, (LISTNUM=ALL,ADJUNCT=DIRECTIO,ENTRYDATA=UNSERIALIZE)),END
If you want to use abbreviations for the keywords, enter:
R nn,STL=(STRNAME=DFHCFLS_poolname,ACC=NOLIM, (LNUM=ALL,ADJ=DIO,EDATA=UNSER)),END
The parameter ACCESSTIME=NOLIMIT allows XES to override server access time limits, to obtainserialization to take the dump. Without this parameter, no dump is taken if any server is active.
The parameters ADJUNCT=DIRECTIO and ENTRYDATA=UNSERIALIZE notify XES not to keep theserialization while dumping adjunct areas and entry data. If servers are currently active but it isconsidered important to obtain a serialized dump, to show the structure at a moment in time, replacethese parameters with ADJUNCT=CAPTURE and ENTRYDATA=SERIALIZE. Note that this will lock outserver access to the structure until the dump is complete.
If system-managed structure duplexing is available, then both instances of the structure will bedumped.
What to do nextFor more information about the MVS DUMP command, see z/OS MVS System Commands.
Dumping a named counter list structureYou can use the MVS DUMP command to obtain a dump of the coupling facility list structure for a namedcounter pool.
Before you beginIn order to obtain a dump of a coupling facility list structure, you must specify a value for the DUMPSPACEparameter in the CFRM policy for the coupling facility. The recommended value is 5% of the space in thecoupling facility. For more information, see z/OS MVS Setting Up a Sysplex.
About this task
40 CICS TS for z/OS: Troubleshooting CICS
Procedure1. Enter the following command at the console:
DUMP COMM=(named_counter_poolname)
2. In response to the DUMP command, the system prompts you with a reply number for the dumpoptions you want to specify. Enter the reply:
REPLY nn,STRLIST=(STRNAME=DFHNCLS_poolname,ACCESSTIME=NOLIMIT, (LISTNUM=ALL,ADJUNCT=DIRECTIO)),END
Using abbreviations for the keywords, this reply can be entered as:
R nn,STL=(STRNAME=DFHNCLS_poolname,ACC=NOLIM,(LNUM=ALL,ADJ=DIO)),END
The parameter ACCESSTIME=NOLIMIT allows XES to override server access time limits, to obtainserialization to take the dump. Without this parameter, no dump is taken if any server is active.
The parameter ADJUNCT=DIRECTIO notifies XES not to keep the serialization while dumping adjunctareas. If servers are currently active but it is considered important to obtain a serialized dump, to showthe structure at a moment in time, replace this parameter with ADJUNCT=CAPTURE. Note that this willlock out server access to the structure until the dump is complete.
If system-managed structure duplexing is available, then both instances of the structure will bedumped.
What to do nextFor more information about the MVS DUMP command, see z/OS MVS System Commands.
Dumping a shared temporary storage list structure
Before you beginIn order to obtain a dump of a coupling facility list structure, you must specify a value for the DUMPSPACEparameter in the CFRM policy for the coupling facility. The recommended value is 5% of the space in thecoupling facility. For more information, see z/OS MVS Setting Up a Sysplex.
About this task
Procedure1. You can use the MVS DUMP command to obtain a dump of the coupling facility list structure for the
shared temporary storage pool.
You can use the MVS DUMP command to obtain a dump of the coupling facility list structure for theshared temporary storage pool. For example, enter the following command at the console:
DUMP COMM=(sharedts_poolname)
In response to the DUMP command, the system prompts you with a reply number for the dumpoptions you want to specify.
2. When prompted, enter the reply:
REPLY nn,STRLIST=(STRNAME=DFHXQLS_poolname,ACCESSTIME=NOLIMIT, (LISTNUM=ALL,ADJUNCT=DIRECTIO,ENTRYDATA=UNSERIALIZE)),END
Using abbreviations for the keywords, this reply can be entered as:
R nn,STL=(STRNAME=DFHXQLS_poolname,ACC=NOLIM, (LNUM=ALL,ADJ=DIO,EDATA=UNSER)),END
Chapter 5. Diagnostic tools and information 41
The parameter ACCESSTIME=NOLIMIT allows XES to override server access time limits, to obtainserialization to take the dump. Without this parameter, no dump is taken if any server is active.
The parameters ADJUNCT=DIRECTIO and ENTRYDATA=UNSERIALIZE notify XES not to keep theserialization while dumping adjunct areas and entry data. If servers are currently active but it isconsidered important to obtain a serialized dump, to show the structure at a moment in time, replacethese parameters with ADJUNCT=CAPTURE and ENTRYDATA=SERIALIZE. Note that this will lock outserver access to the structure until the dump is complete.
If system-managed structure duplexing is available, then both instances of the structure will bedumped.
What to do nextFor more information about the MVS DUMP command, see z/OS MVS System Commands.
Formatting and interpreting dumpsCICS system dumps and transaction dumps are written unformatted to the appropriate dump data set. Inother words, they are memory dumps of all or part of the CICS address space.
Unformatted dumps are not easy to interpret, and you are recommended not to use them for debugging.CICS provides utilities for formatting transaction dumps and CICS system dumps, and you should alwaysuse them before you attempt to read any dump. You can quickly locate areas of storage that interest youin a formatted dump, either by browsing it online, or by printing it and looking at the hard copy.
The formatting options that are available for transaction dumps and system dumps are described in“Formatting transaction dumps” on page 42 and “Formatting system dumps” on page 42, respectively.
Formatting transaction dumpsYou can format transaction dumps offline using the CICS dump utility program, DFHDU730. Individualtransaction dumps must be formatted in their entirety, but you can control which dumps are formattedfrom the dump data set.
About this taskYou can select dumps to be formatted as follows:
• Those taken in a specific period of time• Those associated with a specific transaction identifier• Those taken for a specific transaction dump code• Those having specific dump ID - that is, those for specific CICS runs and dump count values.
You can also use the SCAN option with the dump utility program, to get a list of the transaction dumpsrecorded on the specified dump data set.
For information about using DFHDU730 to format transaction dumps, see Dump utilities (DFHDUnnn andDFHPDnnn).
Formatting system dumpsYou can process system dumps from the dump data set by invoking the interactive problem controlsystem (IPCS).
About this taskThe CICS formatting routine for use under the MVS interactive problem control system (IPCS) is suppliedas DFHPDX. This standard name is not suitable for those users running more than one release of CICS,because the dump formatting process in each version of DFHPDX is release-specific, and you must usethe correct version for the system dump you are formatting. The module is named with the release
42 CICS TS for z/OS: Troubleshooting CICS
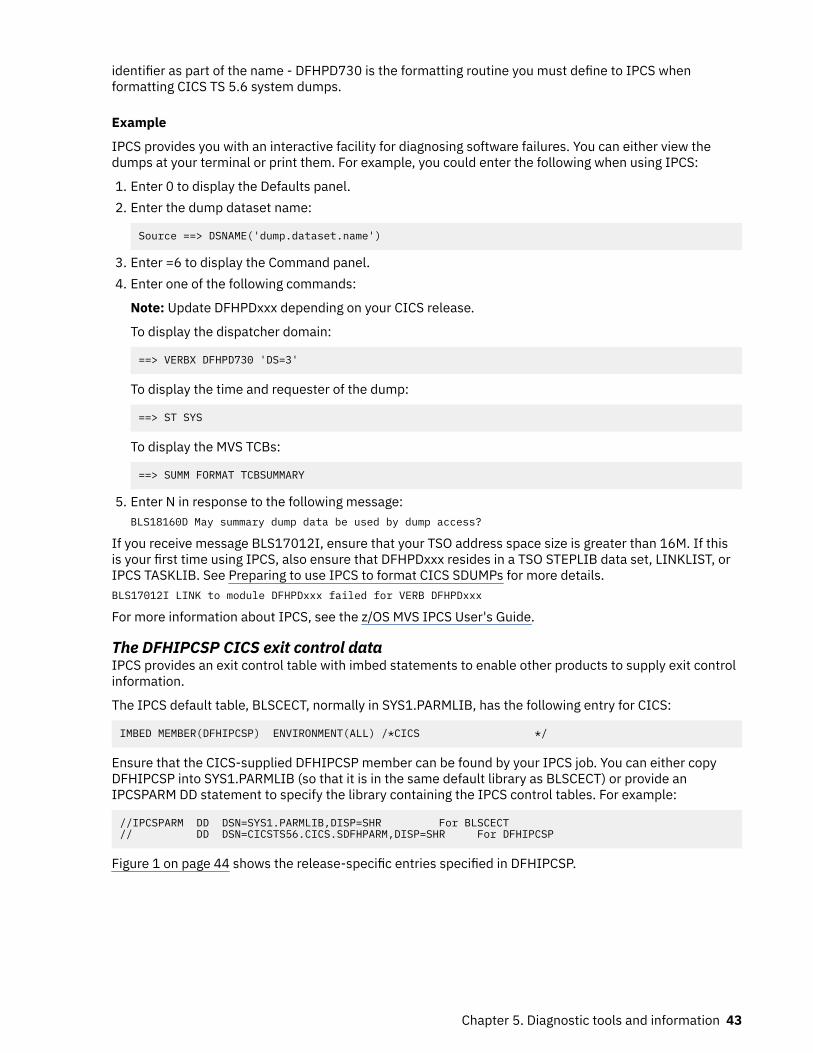
identifier as part of the name - DFHPD730 is the formatting routine you must define to IPCS whenformatting CICS TS 5.6 system dumps.
Example
IPCS provides you with an interactive facility for diagnosing software failures. You can either view thedumps at your terminal or print them. For example, you could enter the following when using IPCS:
1. Enter 0 to display the Defaults panel.2. Enter the dump dataset name:
Source ==> DSNAME('dump.dataset.name')
3. Enter =6 to display the Command panel.4. Enter one of the following commands:
Note: Update DFHPDxxx depending on your CICS release.
To display the dispatcher domain:
==> VERBX DFHPD730 'DS=3'
To display the time and requester of the dump:
==> ST SYS
To display the MVS TCBs:
==> SUMM FORMAT TCBSUMMARY
5. Enter N in response to the following message:BLS18160D May summary dump data be used by dump access?
If you receive message BLS17012I, ensure that your TSO address space size is greater than 16M. If thisis your first time using IPCS, also ensure that DFHPDxxx resides in a TSO STEPLIB data set, LINKLIST, orIPCS TASKLIB. See Preparing to use IPCS to format CICS SDUMPs for more details.BLS17012I LINK to module DFHPDxxx failed for VERB DFHPDxxx
For more information about IPCS, see the z/OS MVS IPCS User's Guide.
The DFHIPCSP CICS exit control dataIPCS provides an exit control table with imbed statements to enable other products to supply exit controlinformation.
The IPCS default table, BLSCECT, normally in SYS1.PARMLIB, has the following entry for CICS:
IMBED MEMBER(DFHIPCSP) ENVIRONMENT(ALL) /*CICS */
Ensure that the CICS-supplied DFHIPCSP member can be found by your IPCS job. You can either copyDFHIPCSP into SYS1.PARMLIB (so that it is in the same default library as BLSCECT) or provide anIPCSPARM DD statement to specify the library containing the IPCS control tables. For example:
//IPCSPARM DD DSN=SYS1.PARMLIB,DISP=SHR For BLSCECT// DD DSN=CICSTS56.CICS.SDFHPARM,DISP=SHR For DFHIPCSP
Figure 1 on page 44 shows the release-specific entries specified in DFHIPCSP.
Chapter 5. Diagnostic tools and information 43
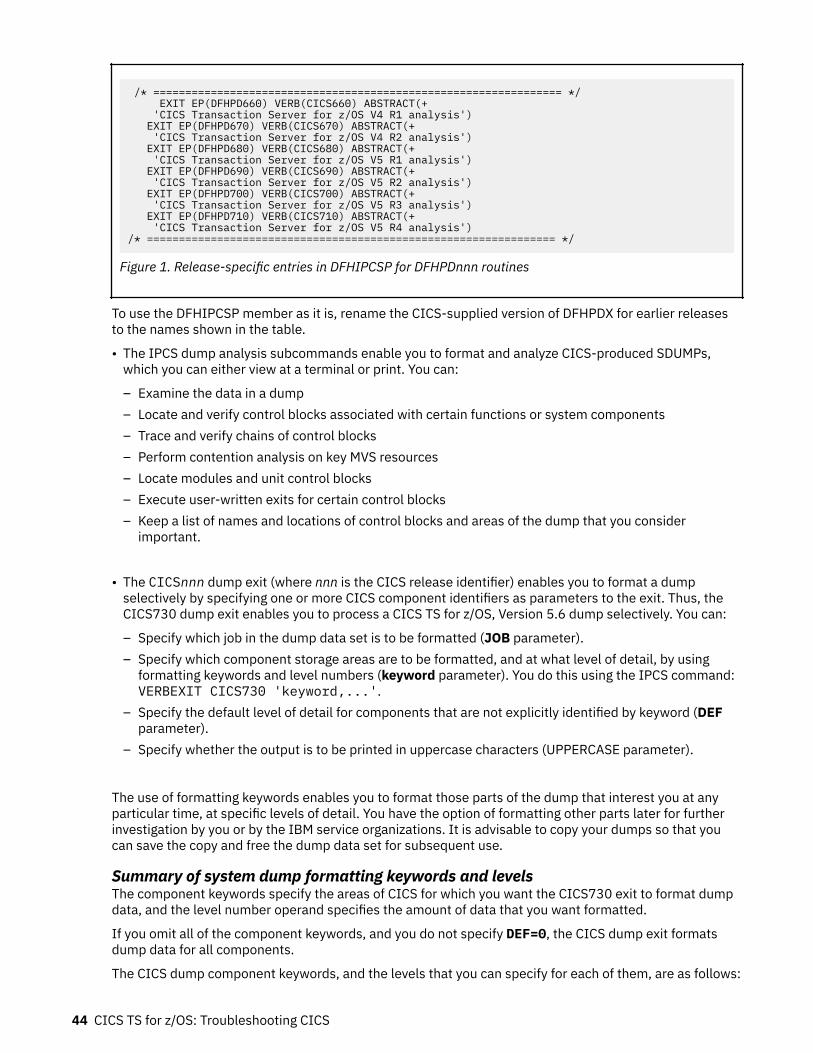
/* ================================================================ */ EXIT EP(DFHPD660) VERB(CICS660) ABSTRACT(+ 'CICS Transaction Server for z/OS V4 R1 analysis') EXIT EP(DFHPD670) VERB(CICS670) ABSTRACT(+ 'CICS Transaction Server for z/OS V4 R2 analysis') EXIT EP(DFHPD680) VERB(CICS680) ABSTRACT(+ 'CICS Transaction Server for z/OS V5 R1 analysis') EXIT EP(DFHPD690) VERB(CICS690) ABSTRACT(+ 'CICS Transaction Server for z/OS V5 R2 analysis') EXIT EP(DFHPD700) VERB(CICS700) ABSTRACT(+ 'CICS Transaction Server for z/OS V5 R3 analysis') EXIT EP(DFHPD710) VERB(CICS710) ABSTRACT(+ 'CICS Transaction Server for z/OS V5 R4 analysis') /* ================================================================ */
Figure 1. Release-specific entries in DFHIPCSP for DFHPDnnn routines
To use the DFHIPCSP member as it is, rename the CICS-supplied version of DFHPDX for earlier releasesto the names shown in the table.
• The IPCS dump analysis subcommands enable you to format and analyze CICS-produced SDUMPs,which you can either view at a terminal or print. You can:
– Examine the data in a dump– Locate and verify control blocks associated with certain functions or system components– Trace and verify chains of control blocks– Perform contention analysis on key MVS resources– Locate modules and unit control blocks– Execute user-written exits for certain control blocks– Keep a list of names and locations of control blocks and areas of the dump that you consider
important.
• The CICSnnn dump exit (where nnn is the CICS release identifier) enables you to format a dumpselectively by specifying one or more CICS component identifiers as parameters to the exit. Thus, theCICS730 dump exit enables you to process a CICS TS for z/OS, Version 5.6 dump selectively. You can:
– Specify which job in the dump data set is to be formatted (JOB parameter). – Specify which component storage areas are to be formatted, and at what level of detail, by using
formatting keywords and level numbers (keyword parameter). You do this using the IPCS command:VERBEXIT CICS730 'keyword,...'.
– Specify the default level of detail for components that are not explicitly identified by keyword (DEFparameter).
– Specify whether the output is to be printed in uppercase characters (UPPERCASE parameter).
The use of formatting keywords enables you to format those parts of the dump that interest you at anyparticular time, at specific levels of detail. You have the option of formatting other parts later for furtherinvestigation by you or by the IBM service organizations. It is advisable to copy your dumps so that youcan save the copy and free the dump data set for subsequent use.
Summary of system dump formatting keywords and levelsThe component keywords specify the areas of CICS for which you want the CICS730 exit to format dumpdata, and the level number operand specifies the amount of data that you want formatted.
If you omit all of the component keywords, and you do not specify DEF=0, the CICS dump exit formatsdump data for all components.
The CICS dump component keywords, and the levels that you can specify for each of them, are as follows:
44 CICS TS for z/OS: Troubleshooting CICS
AI [={0|2}]Autoinstall model manager.AI=0
Suppress formatting of AI control blocks.AI=2
Format AI control blocks.AP [={0|1|2|3}]
Application domain.AP=0
Suppress formatting of AP control blocks.AP=1
Format a summary of addresses of the AP control blocks for each active transaction.AP=2
Format the contents of the AP control blocks for each active transaction.AP=3
Format level-1 and level-2 data.APS=<TASKID=Task identifier>
Application selection. The APS component keyword allows you to limit the formatting of systemdumps to only those storage areas relating to the task identifier specified. Contents of theapplication domain control blocks for the specified transaction will be listed along with languageenvironment storage areas for the same transaction. You must use angled brackets around thespecified parameter.
AS [={0|1|2|3}]Asynchronous services domain.AS=0
Suppress formatting of asynchronous services domain control blocks.AS=1
Format a summary of addresses of the AS control blocks for each active transaction.AS=2
Format the contents of the AS control blocks for each active transaction.AS=3
Format level-1 and level-2 data.BA [={0|1|2|3}]
Business application manager domain.BA=0
Suppress formatting of business application manager domain control blocks.BA=1
Format the BA unit of work context (BAUW) and BA activity (BAACT) summaries.BA=2
Format the anchor block (BADMANC), BA unit of work context (BAUW), and BA activities (BAACT).BA=3
Format level-1 and level-2 data.BR [={0|1|2|3}]
The 3270 bridge domainBR=0
Suppress formatting of bridge domain control blocks.BR=1
Format bridge facility summary information.
Chapter 5. Diagnostic tools and information 45
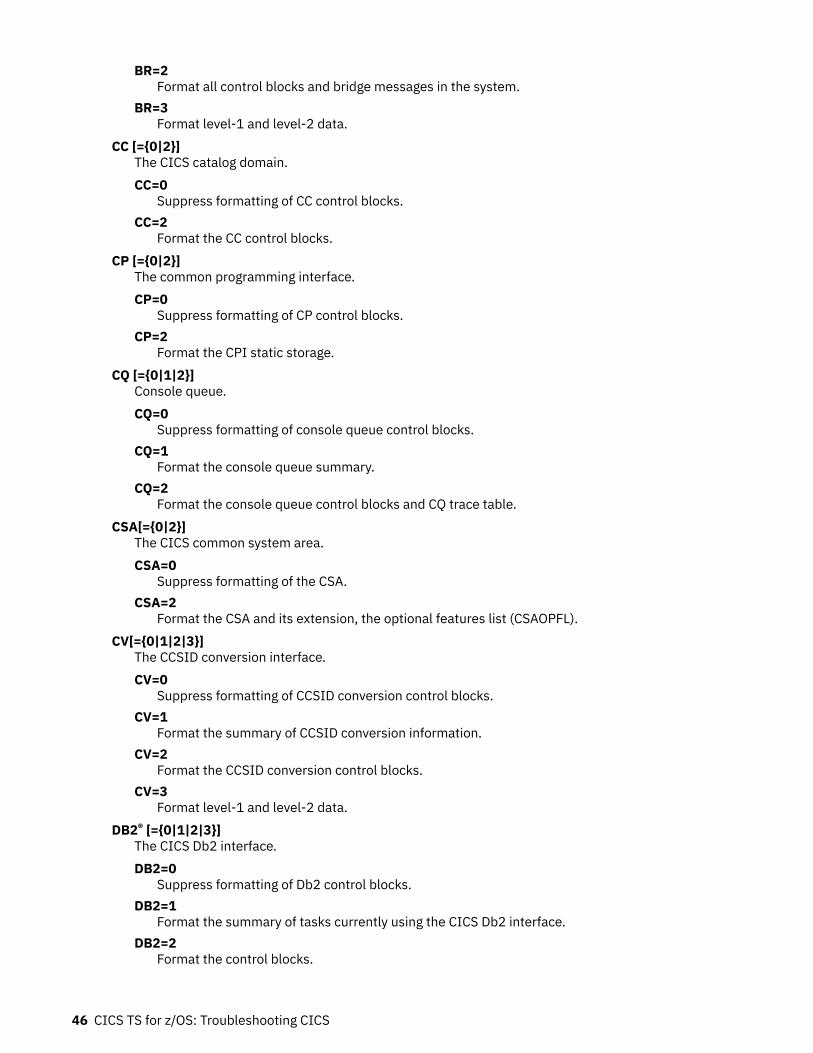
BR=2Format all control blocks and bridge messages in the system.
BR=3Format level-1 and level-2 data.
CC [={0|2}]The CICS catalog domain.CC=0
Suppress formatting of CC control blocks.CC=2
Format the CC control blocks.CP [={0|2}]
The common programming interface.CP=0
Suppress formatting of CP control blocks.CP=2
Format the CPI static storage.CQ [={0|1|2}]
Console queue.CQ=0
Suppress formatting of console queue control blocks.CQ=1
Format the console queue summary.CQ=2
Format the console queue control blocks and CQ trace table.CSA[={0|2}]
The CICS common system area.CSA=0
Suppress formatting of the CSA.CSA=2
Format the CSA and its extension, the optional features list (CSAOPFL).CV[={0|1|2|3}]
The CCSID conversion interface.CV=0
Suppress formatting of CCSID conversion control blocks.CV=1
Format the summary of CCSID conversion information.CV=2
Format the CCSID conversion control blocks.CV=3
Format level-1 and level-2 data.DB2® [={0|1|2|3}]
The CICS Db2 interface.DB2=0
Suppress formatting of Db2 control blocks.DB2=1
Format the summary of tasks currently using the CICS Db2 interface.DB2=2
Format the control blocks.
46 CICS TS for z/OS: Troubleshooting CICS
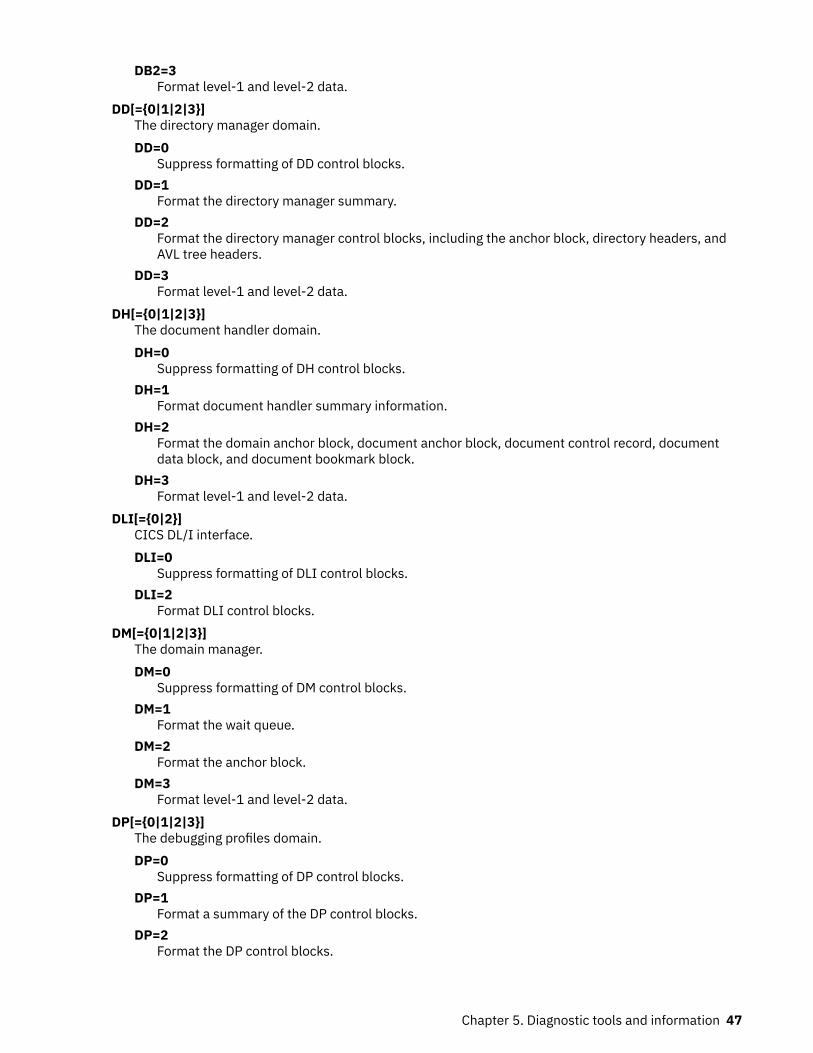
DB2=3Format level-1 and level-2 data.
DD[={0|1|2|3}]The directory manager domain.DD=0
Suppress formatting of DD control blocks.DD=1
Format the directory manager summary.DD=2
Format the directory manager control blocks, including the anchor block, directory headers, andAVL tree headers.
DD=3Format level-1 and level-2 data.
DH[={0|1|2|3}]The document handler domain.DH=0
Suppress formatting of DH control blocks.DH=1
Format document handler summary information.DH=2
Format the domain anchor block, document anchor block, document control record, documentdata block, and document bookmark block.
DH=3Format level-1 and level-2 data.
DLI[={0|2}]CICS DL/I interface.DLI=0
Suppress formatting of DLI control blocks.DLI=2
Format DLI control blocks.DM[={0|1|2|3}]
The domain manager.DM=0
Suppress formatting of DM control blocks.DM=1
Format the wait queue.DM=2
Format the anchor block.DM=3
Format level-1 and level-2 data.DP[={0|1|2|3}]
The debugging profiles domain.DP=0
Suppress formatting of DP control blocks.DP=1
Format a summary of the DP control blocks.DP=2
Format the DP control blocks.
Chapter 5. Diagnostic tools and information 47
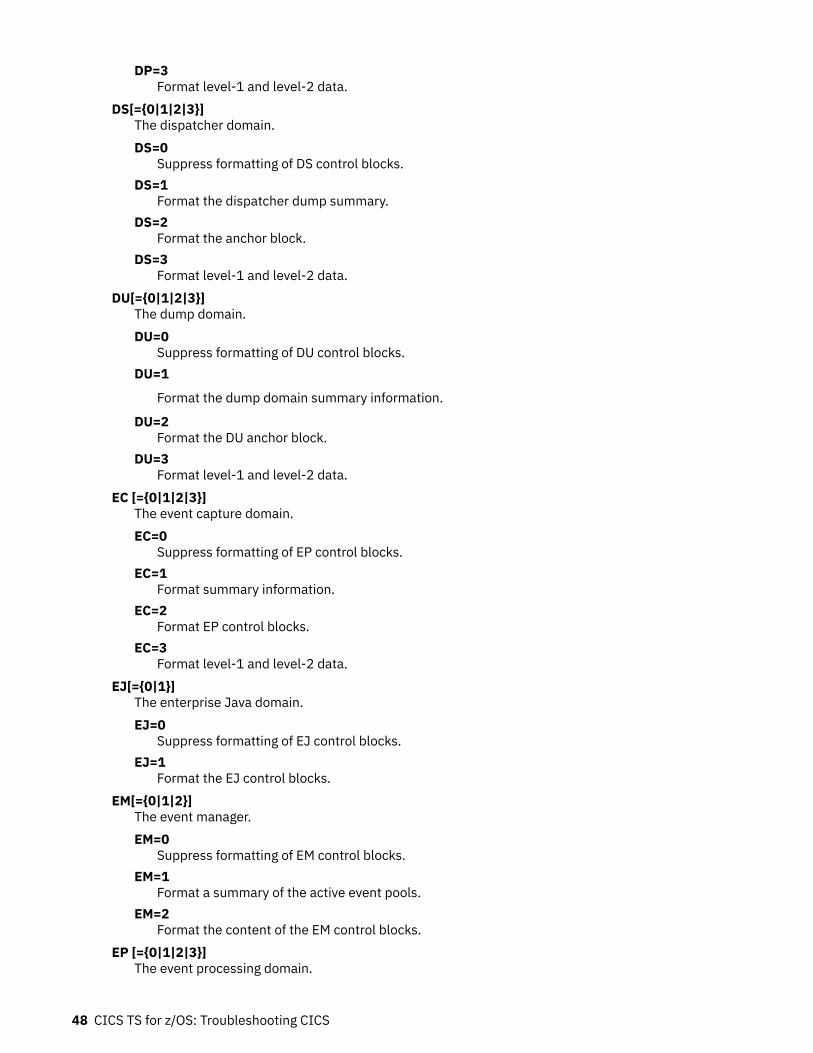
DP=3Format level-1 and level-2 data.
DS[={0|1|2|3}]The dispatcher domain.DS=0
Suppress formatting of DS control blocks.DS=1
Format the dispatcher dump summary.DS=2
Format the anchor block.DS=3
Format level-1 and level-2 data.DU[={0|1|2|3}]
The dump domain.DU=0
Suppress formatting of DU control blocks.DU=1
Format the dump domain summary information.
DU=2Format the DU anchor block.
DU=3Format level-1 and level-2 data.
EC [={0|1|2|3}]The event capture domain.EC=0
Suppress formatting of EP control blocks.EC=1
Format summary information.EC=2
Format EP control blocks.EC=3
Format level-1 and level-2 data.EJ[={0|1}]
The enterprise Java domain.EJ=0
Suppress formatting of EJ control blocks.EJ=1
Format the EJ control blocks.EM[={0|1|2}]
The event manager.EM=0
Suppress formatting of EM control blocks.EM=1
Format a summary of the active event pools.EM=2
Format the content of the EM control blocks.EP [={0|1|2|3}]
The event processing domain.
48 CICS TS for z/OS: Troubleshooting CICS
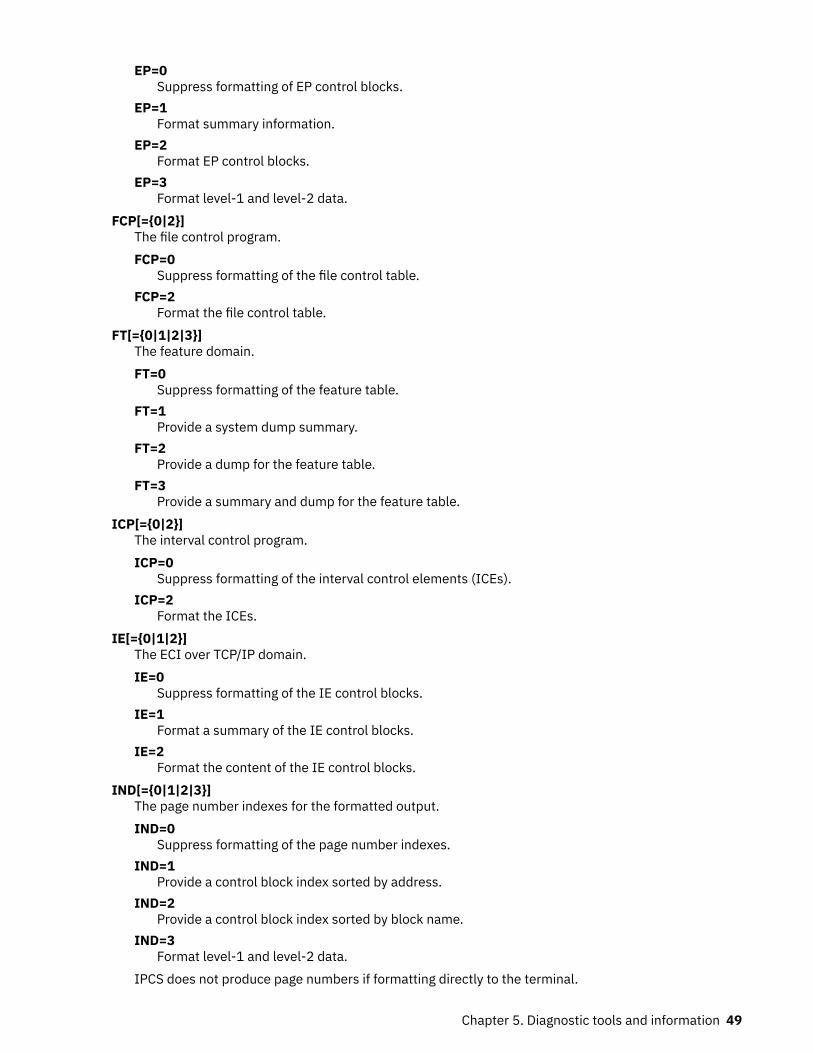
EP=0Suppress formatting of EP control blocks.
EP=1Format summary information.
EP=2Format EP control blocks.
EP=3Format level-1 and level-2 data.
FCP[={0|2}]The file control program.FCP=0
Suppress formatting of the file control table.FCP=2
Format the file control table.FT[={0|1|2|3}]
The feature domain.FT=0
Suppress formatting of the feature table.FT=1
Provide a system dump summary.FT=2
Provide a dump for the feature table.FT=3
Provide a summary and dump for the feature table.ICP[={0|2}]
The interval control program.ICP=0
Suppress formatting of the interval control elements (ICEs).ICP=2
Format the ICEs.IE[={0|1|2}]
The ECI over TCP/IP domain.IE=0
Suppress formatting of the IE control blocks.IE=1
Format a summary of the IE control blocks.IE=2
Format the content of the IE control blocks.IND[={0|1|2|3}]
The page number indexes for the formatted output.IND=0
Suppress formatting of the page number indexes.IND=1
Provide a control block index sorted by address.IND=2
Provide a control block index sorted by block name.IND=3
Format level-1 and level-2 data.IPCS does not produce page numbers if formatting directly to the terminal.
Chapter 5. Diagnostic tools and information 49
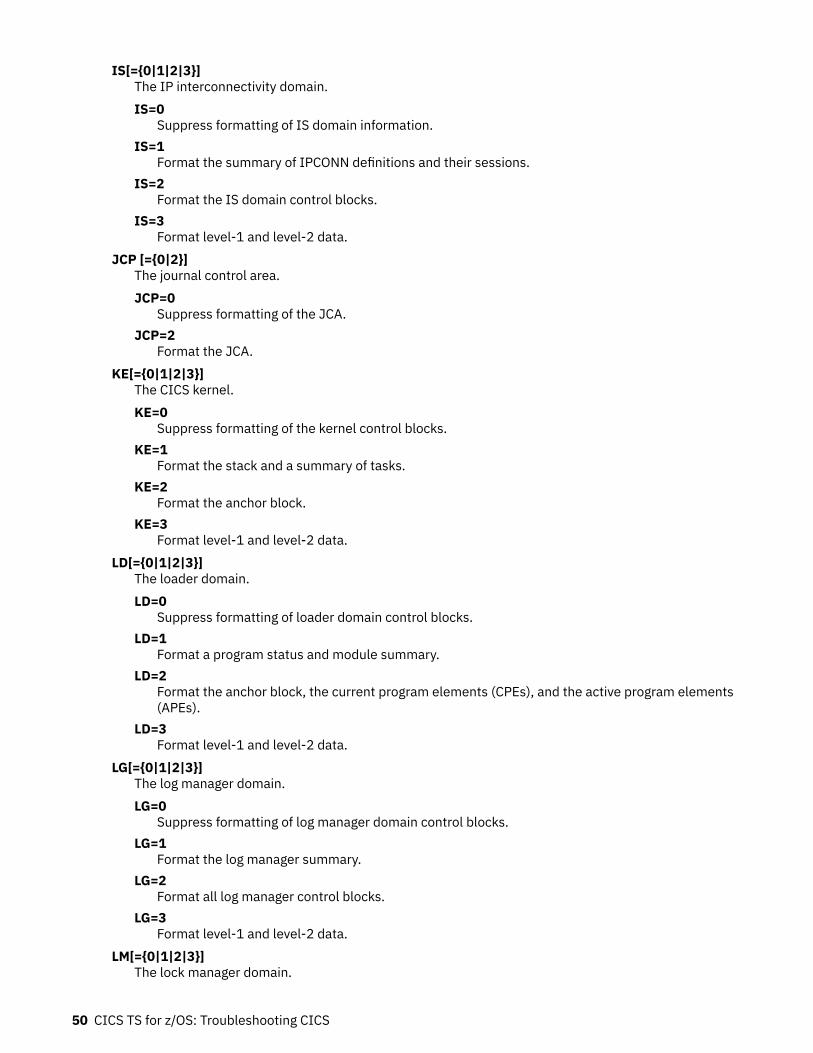
IS[={0|1|2|3}]The IP interconnectivity domain.IS=0
Suppress formatting of IS domain information.IS=1
Format the summary of IPCONN definitions and their sessions.IS=2
Format the IS domain control blocks.IS=3
Format level-1 and level-2 data.JCP [={0|2}]
The journal control area.JCP=0
Suppress formatting of the JCA.JCP=2
Format the JCA.KE[={0|1|2|3}]
The CICS kernel.KE=0
Suppress formatting of the kernel control blocks.KE=1
Format the stack and a summary of tasks.KE=2
Format the anchor block.KE=3
Format level-1 and level-2 data.LD[={0|1|2|3}]
The loader domain.LD=0
Suppress formatting of loader domain control blocks.LD=1
Format a program status and module summary.LD=2
Format the anchor block, the current program elements (CPEs), and the active program elements(APEs).
LD=3Format level-1 and level-2 data.
LG[={0|1|2|3}]The log manager domain.LG=0
Suppress formatting of log manager domain control blocks.LG=1
Format the log manager summary.LG=2
Format all log manager control blocks.LG=3
Format level-1 and level-2 data.LM[={0|1|2|3}]
The lock manager domain.
50 CICS TS for z/OS: Troubleshooting CICS
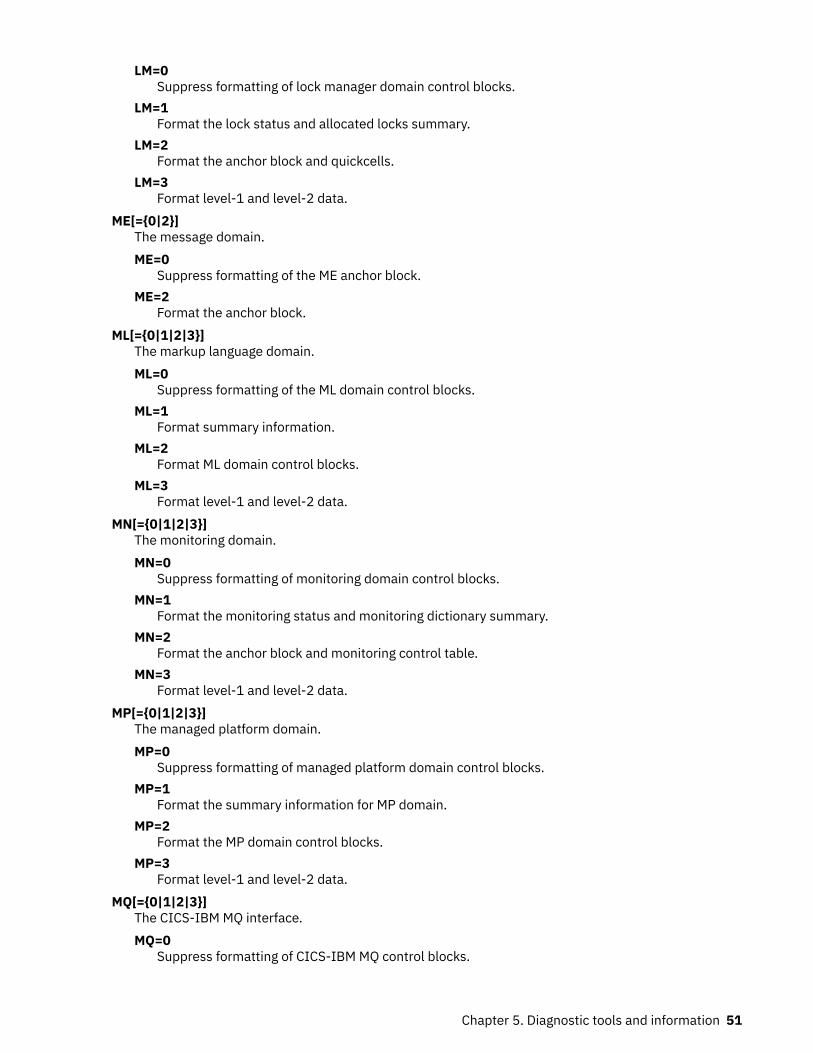
LM=0Suppress formatting of lock manager domain control blocks.
LM=1Format the lock status and allocated locks summary.
LM=2Format the anchor block and quickcells.
LM=3Format level-1 and level-2 data.
ME[={0|2}]The message domain.ME=0
Suppress formatting of the ME anchor block.ME=2
Format the anchor block.ML[={0|1|2|3}]
The markup language domain.ML=0
Suppress formatting of the ML domain control blocks.ML=1
Format summary information.ML=2
Format ML domain control blocks.ML=3
Format level-1 and level-2 data.MN[={0|1|2|3}]
The monitoring domain.MN=0
Suppress formatting of monitoring domain control blocks.MN=1
Format the monitoring status and monitoring dictionary summary.MN=2
Format the anchor block and monitoring control table.MN=3
Format level-1 and level-2 data.MP[={0|1|2|3}]
The managed platform domain.MP=0
Suppress formatting of managed platform domain control blocks.MP=1
Format the summary information for MP domain.MP=2
Format the MP domain control blocks.MP=3
Format level-1 and level-2 data.MQ[={0|1|2|3}]
The CICS-IBM MQ interface.MQ=0
Suppress formatting of CICS-IBM MQ control blocks.
Chapter 5. Diagnostic tools and information 51
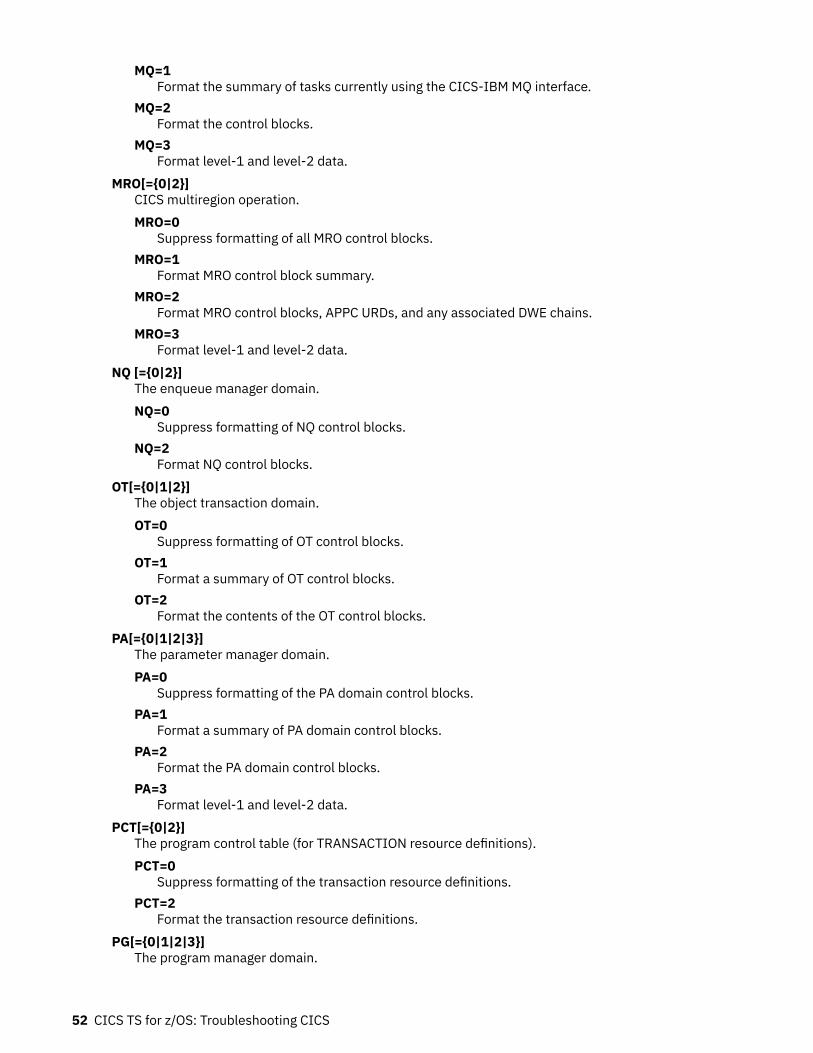
MQ=1Format the summary of tasks currently using the CICS-IBM MQ interface.
MQ=2Format the control blocks.
MQ=3Format level-1 and level-2 data.
MRO[={0|2}]CICS multiregion operation.MRO=0
Suppress formatting of all MRO control blocks.MRO=1
Format MRO control block summary.MRO=2
Format MRO control blocks, APPC URDs, and any associated DWE chains.MRO=3
Format level-1 and level-2 data.NQ [={0|2}]
The enqueue manager domain.NQ=0
Suppress formatting of NQ control blocks.NQ=2
Format NQ control blocks.OT[={0|1|2}]
The object transaction domain.OT=0
Suppress formatting of OT control blocks.OT=1
Format a summary of OT control blocks.OT=2
Format the contents of the OT control blocks.PA[={0|1|2|3}]
The parameter manager domain.PA=0
Suppress formatting of the PA domain control blocks.PA=1
Format a summary of PA domain control blocks.PA=2
Format the PA domain control blocks.PA=3
Format level-1 and level-2 data.PCT[={0|2}]
The program control table (for TRANSACTION resource definitions).PCT=0
Suppress formatting of the transaction resource definitions.PCT=2
Format the transaction resource definitions.PG[={0|1|2|3}]
The program manager domain.
52 CICS TS for z/OS: Troubleshooting CICS
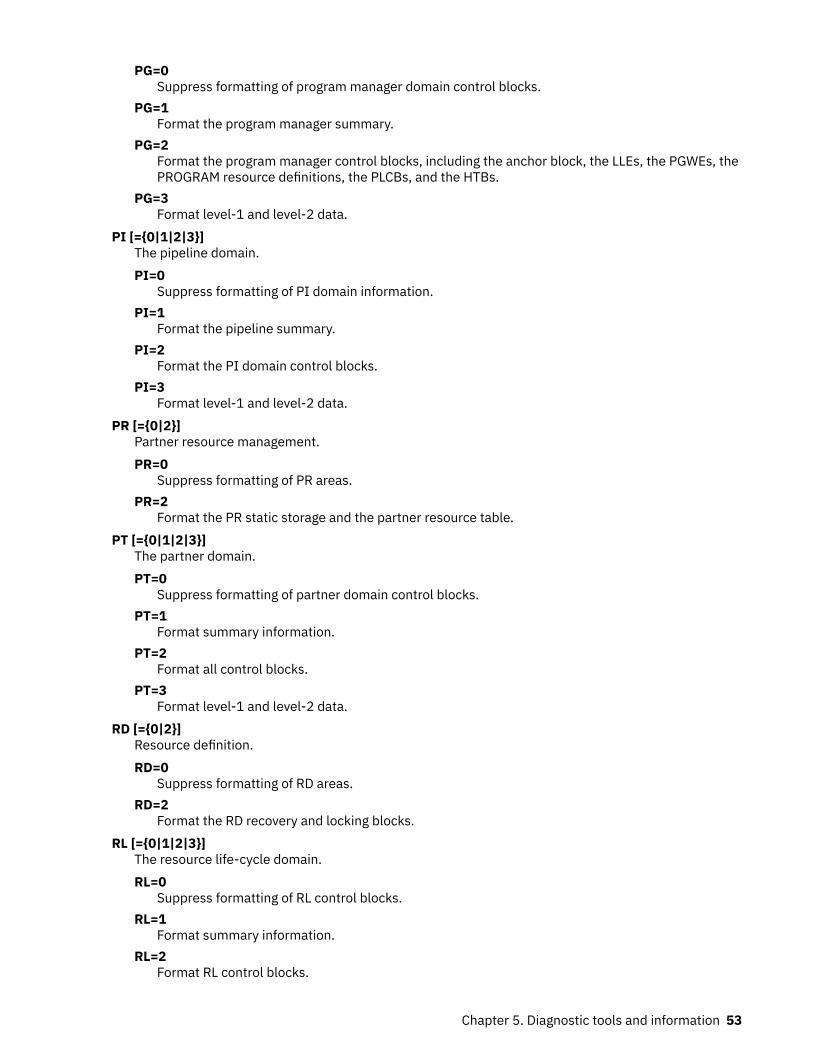
PG=0Suppress formatting of program manager domain control blocks.
PG=1Format the program manager summary.
PG=2Format the program manager control blocks, including the anchor block, the LLEs, the PGWEs, thePROGRAM resource definitions, the PLCBs, and the HTBs.
PG=3Format level-1 and level-2 data.
PI [={0|1|2|3}]The pipeline domain.PI=0
Suppress formatting of PI domain information.PI=1
Format the pipeline summary.PI=2
Format the PI domain control blocks.PI=3
Format level-1 and level-2 data.PR [={0|2}]
Partner resource management.PR=0
Suppress formatting of PR areas.PR=2
Format the PR static storage and the partner resource table.PT [={0|1|2|3}]
The partner domain.PT=0
Suppress formatting of partner domain control blocks.PT=1
Format summary information.PT=2
Format all control blocks.PT=3
Format level-1 and level-2 data.RD [={0|2}]
Resource definition.RD=0
Suppress formatting of RD areas.RD=2
Format the RD recovery and locking blocks.RL [={0|1|2|3}]
The resource life-cycle domain.RL=0
Suppress formatting of RL control blocks.RL=1
Format summary information.RL=2
Format RL control blocks.
Chapter 5. Diagnostic tools and information 53
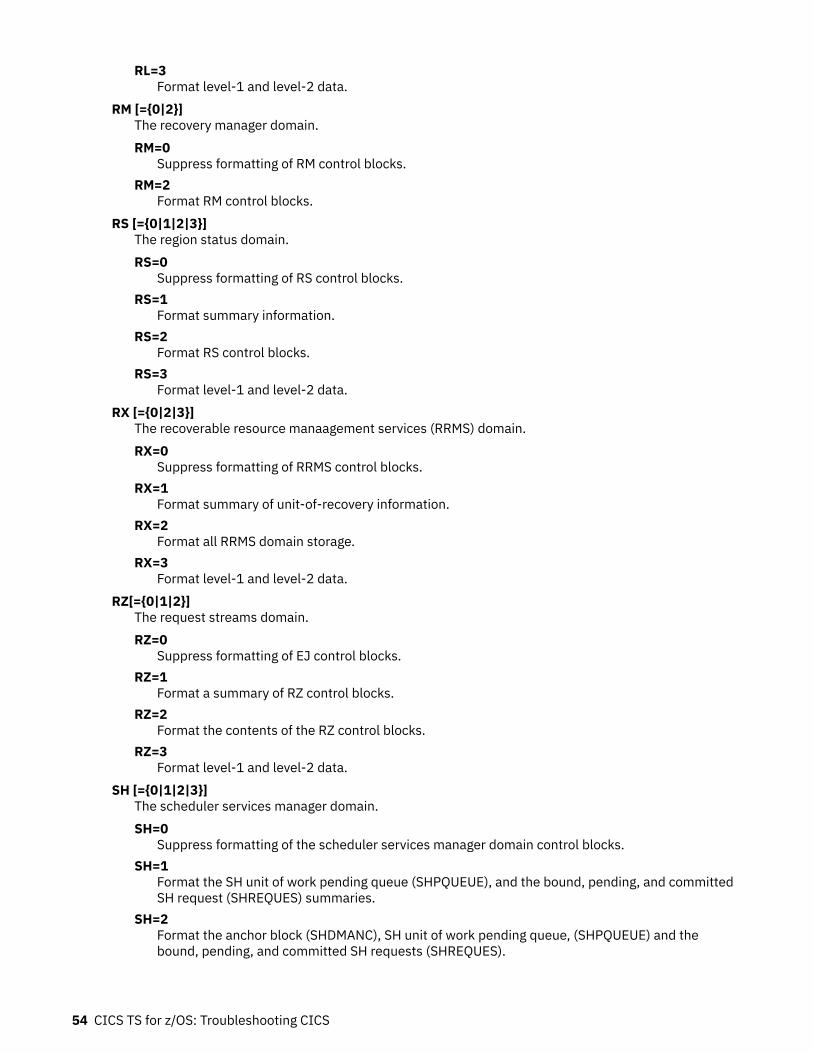
RL=3Format level-1 and level-2 data.
RM [={0|2}]The recovery manager domain.RM=0
Suppress formatting of RM control blocks.RM=2
Format RM control blocks.RS [={0|1|2|3}]
The region status domain.RS=0
Suppress formatting of RS control blocks.RS=1
Format summary information.RS=2
Format RS control blocks.RS=3
Format level-1 and level-2 data.RX [={0|2|3}]
The recoverable resource manaagement services (RRMS) domain.RX=0
Suppress formatting of RRMS control blocks.RX=1
Format summary of unit-of-recovery information.RX=2
Format all RRMS domain storage.RX=3
Format level-1 and level-2 data.RZ[={0|1|2}]
The request streams domain.RZ=0
Suppress formatting of EJ control blocks.RZ=1
Format a summary of RZ control blocks.RZ=2
Format the contents of the RZ control blocks.RZ=3
Format level-1 and level-2 data.SH [={0|1|2|3}]
The scheduler services manager domain.SH=0
Suppress formatting of the scheduler services manager domain control blocks.SH=1
Format the SH unit of work pending queue (SHPQUEUE), and the bound, pending, and committedSH request (SHREQUES) summaries.
SH=2Format the anchor block (SHDMANC), SH unit of work pending queue, (SHPQUEUE) and thebound, pending, and committed SH requests (SHREQUES).
54 CICS TS for z/OS: Troubleshooting CICS
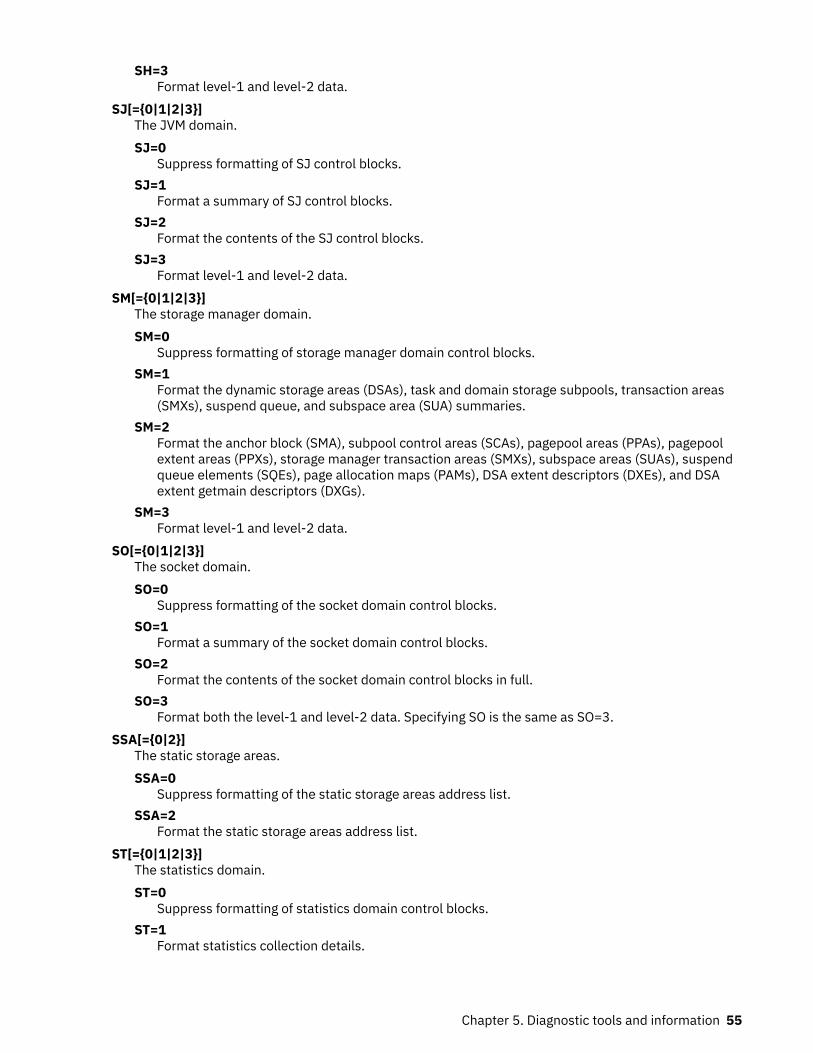
SH=3Format level-1 and level-2 data.
SJ[={0|1|2|3}]The JVM domain.SJ=0
Suppress formatting of SJ control blocks.SJ=1
Format a summary of SJ control blocks.SJ=2
Format the contents of the SJ control blocks.SJ=3
Format level-1 and level-2 data.SM[={0|1|2|3}]
The storage manager domain.SM=0
Suppress formatting of storage manager domain control blocks.SM=1
Format the dynamic storage areas (DSAs), task and domain storage subpools, transaction areas(SMXs), suspend queue, and subspace area (SUA) summaries.
SM=2Format the anchor block (SMA), subpool control areas (SCAs), pagepool areas (PPAs), pagepoolextent areas (PPXs), storage manager transaction areas (SMXs), subspace areas (SUAs), suspendqueue elements (SQEs), page allocation maps (PAMs), DSA extent descriptors (DXEs), and DSAextent getmain descriptors (DXGs).
SM=3Format level-1 and level-2 data.
SO[={0|1|2|3}]The socket domain.SO=0
Suppress formatting of the socket domain control blocks.SO=1
Format a summary of the socket domain control blocks.SO=2
Format the contents of the socket domain control blocks in full.SO=3
Format both the level-1 and level-2 data. Specifying SO is the same as SO=3.SSA[={0|2}]
The static storage areas.SSA=0
Suppress formatting of the static storage areas address list.SSA=2
Format the static storage areas address list.ST[={0|1|2|3}]
The statistics domain.ST=0
Suppress formatting of statistics domain control blocks.ST=1
Format statistics collection details.
Chapter 5. Diagnostic tools and information 55
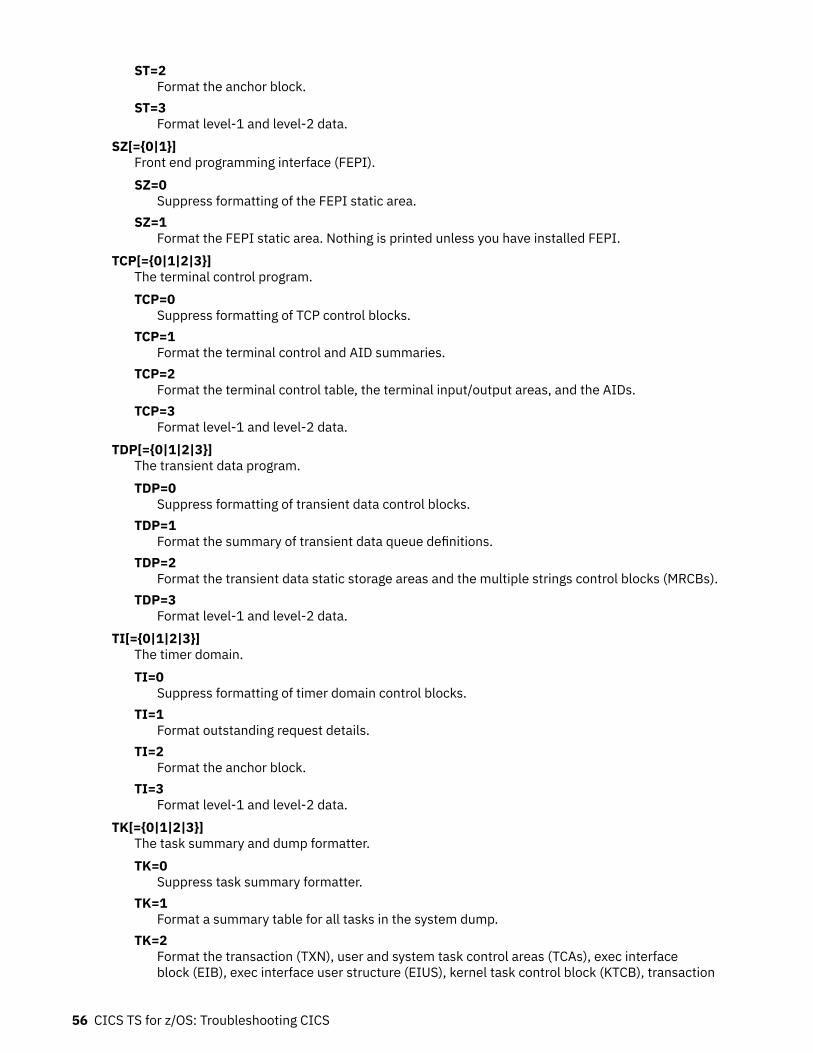
ST=2Format the anchor block.
ST=3Format level-1 and level-2 data.
SZ[={0|1}]Front end programming interface (FEPI). SZ=0
Suppress formatting of the FEPI static area.SZ=1
Format the FEPI static area. Nothing is printed unless you have installed FEPI.TCP[={0|1|2|3}]
The terminal control program.TCP=0
Suppress formatting of TCP control blocks.TCP=1
Format the terminal control and AID summaries.TCP=2
Format the terminal control table, the terminal input/output areas, and the AIDs.TCP=3
Format level-1 and level-2 data.TDP[={0|1|2|3}]
The transient data program.TDP=0
Suppress formatting of transient data control blocks.TDP=1
Format the summary of transient data queue definitions.TDP=2
Format the transient data static storage areas and the multiple strings control blocks (MRCBs).TDP=3
Format level-1 and level-2 data.TI[={0|1|2|3}]
The timer domain.TI=0
Suppress formatting of timer domain control blocks.TI=1
Format outstanding request details.TI=2
Format the anchor block.TI=3
Format level-1 and level-2 data.TK[={0|1|2|3}]
The task summary and dump formatter.TK=0
Suppress task summary formatter.TK=1
Format a summary table for all tasks in the system dump.TK=2
Format the transaction (TXN), user and system task control areas (TCAs), exec interfaceblock (EIB), exec interface user structure (EIUS), kernel task control block (KTCB), transaction
56 CICS TS for z/OS: Troubleshooting CICS
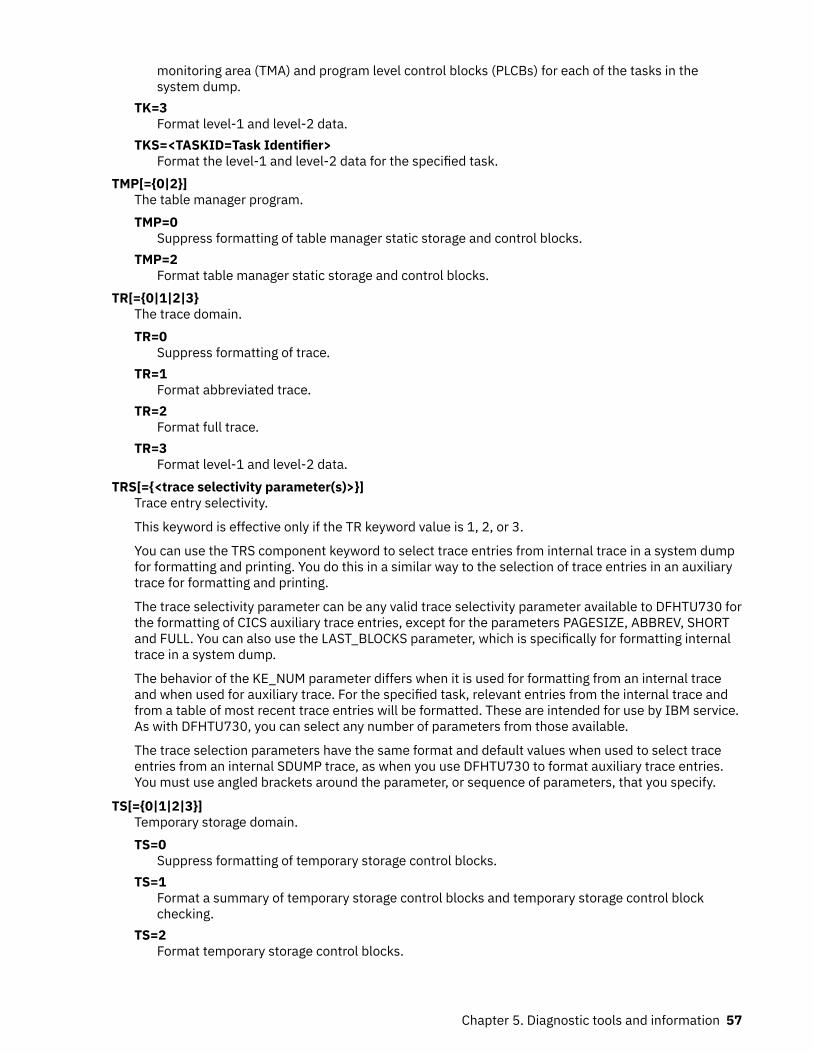
monitoring area (TMA) and program level control blocks (PLCBs) for each of the tasks in thesystem dump.
TK=3Format level-1 and level-2 data.
TKS=<TASKID=Task Identifier>Format the level-1 and level-2 data for the specified task.
TMP[={0|2}]The table manager program.TMP=0
Suppress formatting of table manager static storage and control blocks.TMP=2
Format table manager static storage and control blocks.TR[={0|1|2|3}
The trace domain.TR=0
Suppress formatting of trace.TR=1
Format abbreviated trace.TR=2
Format full trace.TR=3
Format level-1 and level-2 data.TRS[={<trace selectivity parameter(s)>}]
Trace entry selectivity.
This keyword is effective only if the TR keyword value is 1, 2, or 3.
You can use the TRS component keyword to select trace entries from internal trace in a system dumpfor formatting and printing. You do this in a similar way to the selection of trace entries in an auxiliarytrace for formatting and printing.
The trace selectivity parameter can be any valid trace selectivity parameter available to DFHTU730 forthe formatting of CICS auxiliary trace entries, except for the parameters PAGESIZE, ABBREV, SHORTand FULL. You can also use the LAST_BLOCKS parameter, which is specifically for formatting internaltrace in a system dump.
The behavior of the KE_NUM parameter differs when it is used for formatting from an internal traceand when used for auxiliary trace. For the specified task, relevant entries from the internal trace andfrom a table of most recent trace entries will be formatted. These are intended for use by IBM service.As with DFHTU730, you can select any number of parameters from those available.
The trace selection parameters have the same format and default values when used to select traceentries from an internal SDUMP trace, as when you use DFHTU730 to format auxiliary trace entries.You must use angled brackets around the parameter, or sequence of parameters, that you specify.
TS[={0|1|2|3}]Temporary storage domain.TS=0
Suppress formatting of temporary storage control blocks.TS=1
Format a summary of temporary storage control blocks and temporary storage control blockchecking.
TS=2Format temporary storage control blocks.
Chapter 5. Diagnostic tools and information 57
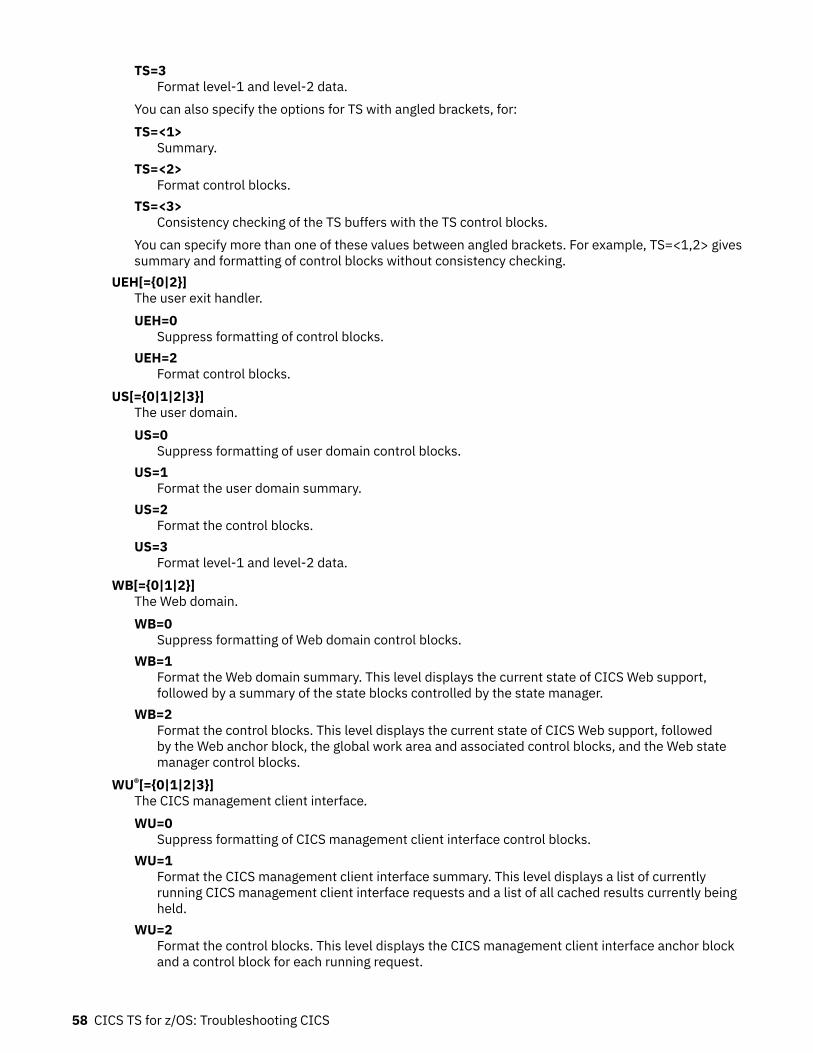
TS=3Format level-1 and level-2 data.
You can also specify the options for TS with angled brackets, for:TS=<1>
Summary.TS=<2>
Format control blocks.TS=<3>
Consistency checking of the TS buffers with the TS control blocks.You can specify more than one of these values between angled brackets. For example, TS=<1,2> givessummary and formatting of control blocks without consistency checking.
UEH[={0|2}]The user exit handler.UEH=0
Suppress formatting of control blocks.UEH=2
Format control blocks.US[={0|1|2|3}]
The user domain.US=0
Suppress formatting of user domain control blocks.US=1
Format the user domain summary.US=2
Format the control blocks.US=3
Format level-1 and level-2 data.WB[={0|1|2}]
The Web domain.WB=0
Suppress formatting of Web domain control blocks.WB=1
Format the Web domain summary. This level displays the current state of CICS Web support,followed by a summary of the state blocks controlled by the state manager.
WB=2Format the control blocks. This level displays the current state of CICS Web support, followedby the Web anchor block, the global work area and associated control blocks, and the Web statemanager control blocks.
WU®[={0|1|2|3}]The CICS management client interface.WU=0
Suppress formatting of CICS management client interface control blocks.WU=1
Format the CICS management client interface summary. This level displays a list of currentlyrunning CICS management client interface requests and a list of all cached results currently beingheld.
WU=2Format the control blocks. This level displays the CICS management client interface anchor blockand a control block for each running request.
58 CICS TS for z/OS: Troubleshooting CICS
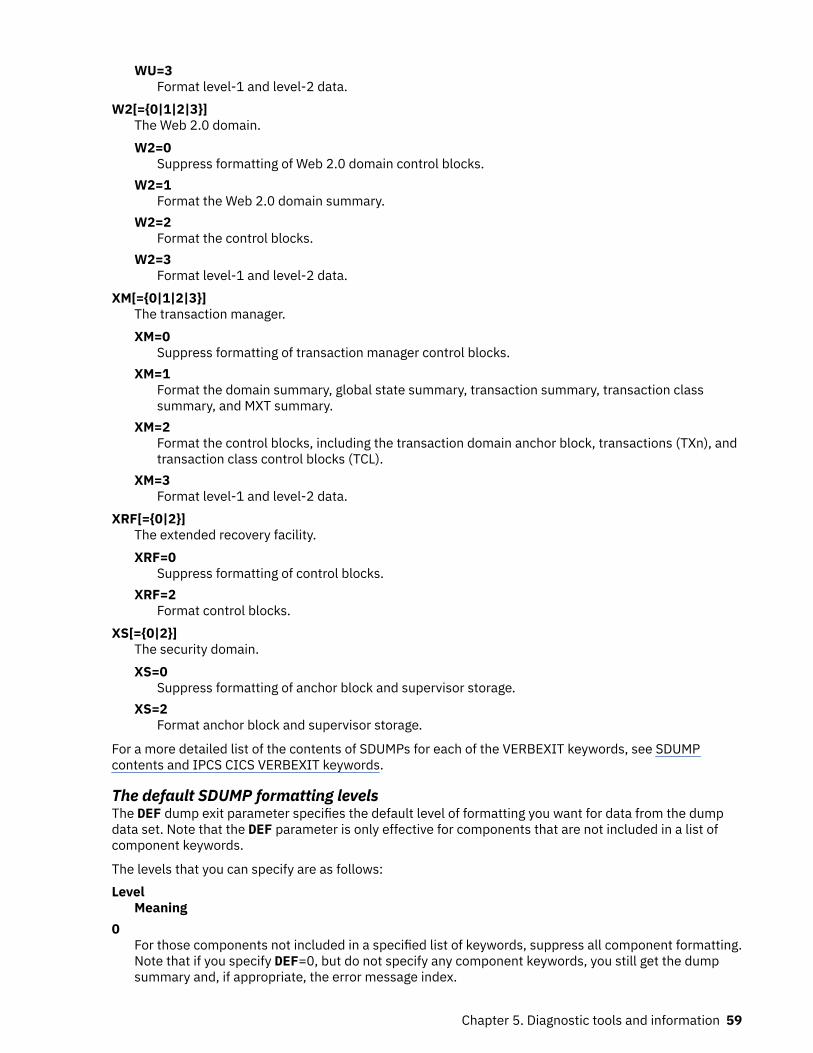
WU=3Format level-1 and level-2 data.
W2[={0|1|2|3}]The Web 2.0 domain.W2=0
Suppress formatting of Web 2.0 domain control blocks.W2=1
Format the Web 2.0 domain summary.W2=2
Format the control blocks.W2=3
Format level-1 and level-2 data.XM[={0|1|2|3}]
The transaction manager.XM=0
Suppress formatting of transaction manager control blocks.XM=1
Format the domain summary, global state summary, transaction summary, transaction classsummary, and MXT summary.
XM=2Format the control blocks, including the transaction domain anchor block, transactions (TXn), andtransaction class control blocks (TCL).
XM=3Format level-1 and level-2 data.
XRF[={0|2}]The extended recovery facility.XRF=0
Suppress formatting of control blocks.XRF=2
Format control blocks.XS[={0|2}]
The security domain.XS=0
Suppress formatting of anchor block and supervisor storage.XS=2
Format anchor block and supervisor storage.
For a more detailed list of the contents of SDUMPs for each of the VERBEXIT keywords, see SDUMPcontents and IPCS CICS VERBEXIT keywords.
The default SDUMP formatting levelsThe DEF dump exit parameter specifies the default level of formatting you want for data from the dumpdata set. Note that the DEF parameter is only effective for components that are not included in a list ofcomponent keywords.
The levels that you can specify are as follows:Level
Meaning0
For those components not included in a specified list of keywords, suppress all component formatting.Note that if you specify DEF=0, but do not specify any component keywords, you still get the dumpsummary and, if appropriate, the error message index.
Chapter 5. Diagnostic tools and information 59
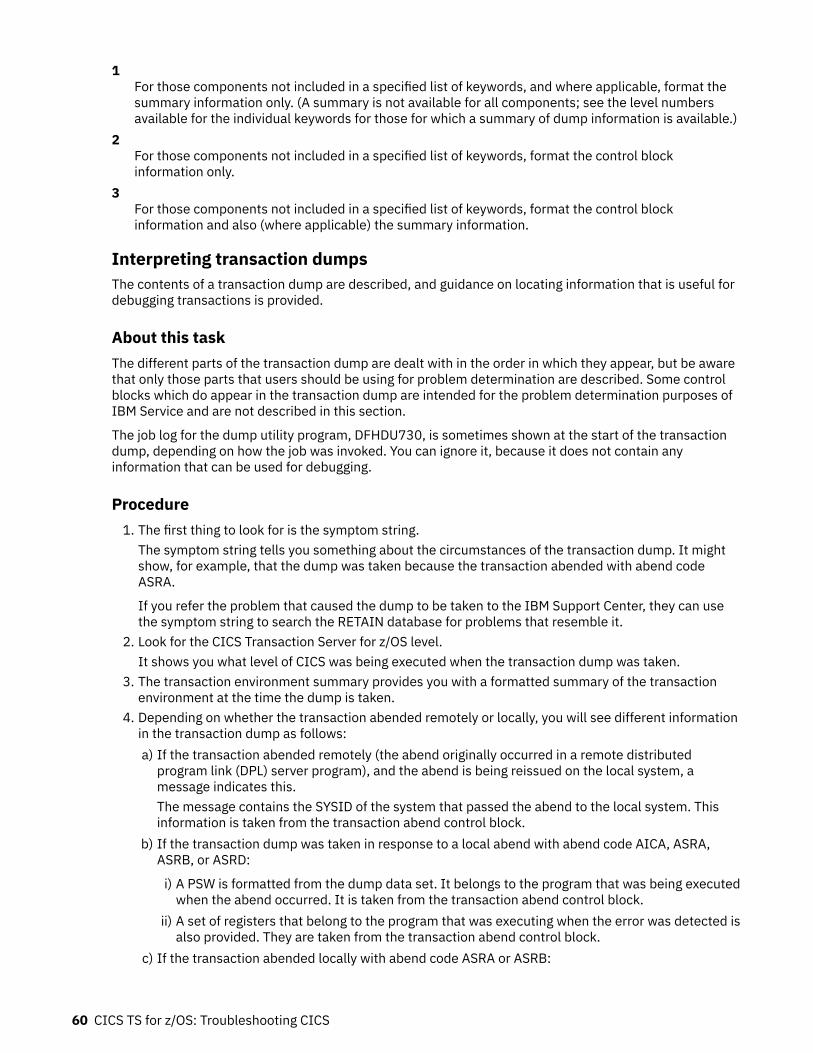
1For those components not included in a specified list of keywords, and where applicable, format thesummary information only. (A summary is not available for all components; see the level numbersavailable for the individual keywords for those for which a summary of dump information is available.)
2For those components not included in a specified list of keywords, format the control blockinformation only.
3For those components not included in a specified list of keywords, format the control blockinformation and also (where applicable) the summary information.
Interpreting transaction dumpsThe contents of a transaction dump are described, and guidance on locating information that is useful fordebugging transactions is provided.
About this taskThe different parts of the transaction dump are dealt with in the order in which they appear, but be awarethat only those parts that users should be using for problem determination are described. Some controlblocks which do appear in the transaction dump are intended for the problem determination purposes ofIBM Service and are not described in this section.
The job log for the dump utility program, DFHDU730, is sometimes shown at the start of the transactiondump, depending on how the job was invoked. You can ignore it, because it does not contain anyinformation that can be used for debugging.
Procedure1. The first thing to look for is the symptom string.
The symptom string tells you something about the circumstances of the transaction dump. It mightshow, for example, that the dump was taken because the transaction abended with abend codeASRA.
If you refer the problem that caused the dump to be taken to the IBM Support Center, they can usethe symptom string to search the RETAIN database for problems that resemble it.
2. Look for the CICS Transaction Server for z/OS level.It shows you what level of CICS was being executed when the transaction dump was taken.
3. The transaction environment summary provides you with a formatted summary of the transactionenvironment at the time the dump is taken.
4. Depending on whether the transaction abended remotely or locally, you will see different informationin the transaction dump as follows:a) If the transaction abended remotely (the abend originally occurred in a remote distributed
program link (DPL) server program), and the abend is being reissued on the local system, amessage indicates this.The message contains the SYSID of the system that passed the abend to the local system. Thisinformation is taken from the transaction abend control block.
b) If the transaction dump was taken in response to a local abend with abend code AICA, ASRA,ASRB, or ASRD:
i) A PSW is formatted from the dump data set. It belongs to the program that was being executedwhen the abend occurred. It is taken from the transaction abend control block.
ii) A set of registers that belong to the program that was executing when the error was detected isalso provided. They are taken from the transaction abend control block.
c) If the transaction abended locally with abend code ASRA or ASRB:
60 CICS TS for z/OS: Troubleshooting CICS
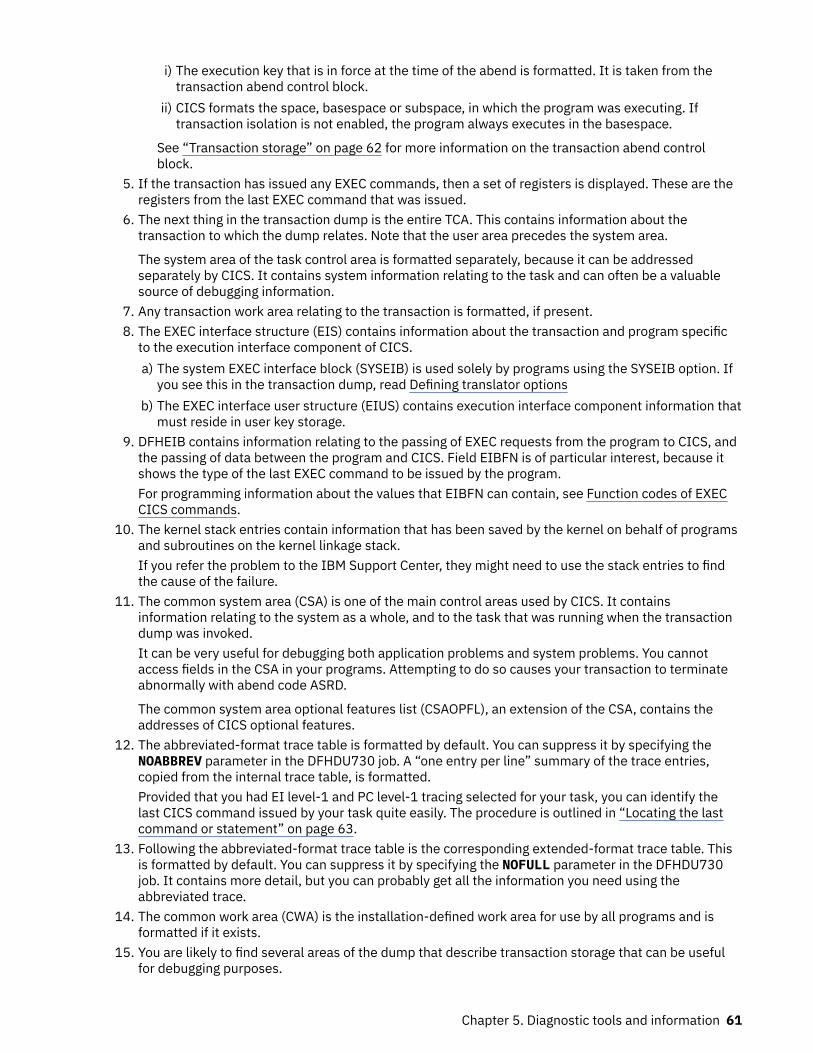
i) The execution key that is in force at the time of the abend is formatted. It is taken from thetransaction abend control block.
ii) CICS formats the space, basespace or subspace, in which the program was executing. Iftransaction isolation is not enabled, the program always executes in the basespace.
See “Transaction storage” on page 62 for more information on the transaction abend controlblock.
5. If the transaction has issued any EXEC commands, then a set of registers is displayed. These are theregisters from the last EXEC command that was issued.
6. The next thing in the transaction dump is the entire TCA. This contains information about thetransaction to which the dump relates. Note that the user area precedes the system area.
The system area of the task control area is formatted separately, because it can be addressedseparately by CICS. It contains system information relating to the task and can often be a valuablesource of debugging information.
7. Any transaction work area relating to the transaction is formatted, if present.8. The EXEC interface structure (EIS) contains information about the transaction and program specific
to the execution interface component of CICS.a) The system EXEC interface block (SYSEIB) is used solely by programs using the SYSEIB option. If
you see this in the transaction dump, read Defining translator optionsb) The EXEC interface user structure (EIUS) contains execution interface component information that
must reside in user key storage.9. DFHEIB contains information relating to the passing of EXEC requests from the program to CICS, and
the passing of data between the program and CICS. Field EIBFN is of particular interest, because itshows the type of the last EXEC command to be issued by the program.For programming information about the values that EIBFN can contain, see Function codes of EXECCICS commands.
10. The kernel stack entries contain information that has been saved by the kernel on behalf of programsand subroutines on the kernel linkage stack.If you refer the problem to the IBM Support Center, they might need to use the stack entries to findthe cause of the failure.
11. The common system area (CSA) is one of the main control areas used by CICS. It containsinformation relating to the system as a whole, and to the task that was running when the transactiondump was invoked.It can be very useful for debugging both application problems and system problems. You cannotaccess fields in the CSA in your programs. Attempting to do so causes your transaction to terminateabnormally with abend code ASRD.
The common system area optional features list (CSAOPFL), an extension of the CSA, contains theaddresses of CICS optional features.
12. The abbreviated-format trace table is formatted by default. You can suppress it by specifying theNOABBREV parameter in the DFHDU730 job. A “one entry per line” summary of the trace entries,copied from the internal trace table, is formatted.Provided that you had EI level-1 and PC level-1 tracing selected for your task, you can identify thelast CICS command issued by your task quite easily. The procedure is outlined in “Locating the lastcommand or statement” on page 63.
13. Following the abbreviated-format trace table is the corresponding extended-format trace table. Thisis formatted by default. You can suppress it by specifying the NOFULL parameter in the DFHDU730job. It contains more detail, but you can probably get all the information you need using theabbreviated trace.
14. The common work area (CWA) is the installation-defined work area for use by all programs and isformatted if it exists.
15. You are likely to find several areas of the dump that describe transaction storage that can be usefulfor debugging purposes.
Chapter 5. Diagnostic tools and information 61
For information on what to look for, see “Transaction storage” on page 62.16. The TCTTE (terminal control table terminal entry) contains information about the terminal that is the
principal facility of the transaction. You usually find one TCTTE for the transaction if the transaction isterminal oriented. For “daisy chained” transactions, you might find more than one.To look at the TIOA for the task, find the address in field TCTTEDA of the TCTTE.
17. Program information for the current transaction shows summary information for all linked programsfor the transaction that have not yet returned, including load point, entry point, and length. Thisis followed by the program storage for each of these programs. This is where you can find theinstructions addressed by register 14 and by the PSW, and hence the point of failure in your program.For details of how you do this, see “Locating the last command or statement” on page 63.
Other program manager control blocks are shown too, including resource definition informationfor active programs, and load list elements and program storage for any programs loaded by thistransaction but not yet released.
For each program level you can find the current channel (if any), other channels created by the linklevel, and all their containers. Up to 32K of each container's data is also displayed. Note that this is acopy of the data rather than the actual address of the data.
For each task you can find the transaction channel (if any), and all its containers. Up to 32K of eachcontainer's data is also displayed. Note that this is a copy of the data rather than the actual addressof the data.
18. The final item that you find in the transaction dump is the module index. This shows you all themodules that were in storage when the error was detected, and their addresses.
Transaction storageTransaction storage is storage that is either obtained by CICS to store information about a transaction, orobtained explicitly by the transaction, by using a GETMAIN request, for its own purposes.
The dump might contain several such areas, each introduced by a header that describes it as transactionstorage of a particular class, for example:
USER24USER31USER64CICS24CICS31CICS64
Transaction storage class CICS31 contains, among other things, the transaction abend control block(TACB). To find it, look for the eye-catcher DFHTACB. DFHTACB contains the following useful valuableinformation that relates to the abend:
• The program status word (PSW) and general purpose registers of the program executing at the timeof the abend (for local AICA, ASRA, ASRB and ASRD abends only. However, for some AICA abends,only the "next sequential instruction" part of the PSW and the registers are present.) Registers 12 and13 contain the addresses of the TCA and CSA, respectively, in all abends except for ASRA and ASRBabends. For ASRA and ASRB abends, these registers contain data as at the time of the abend.
• The name of the failing program.• The offset in the failing program at which the abend occurred (for local ASRA, ASRB and ASRD abends
only).• The execution key at the time of the abend (for local ASRA and ASRB abends only).• Whether the abend was caused by an attempt to overwrite a protected CICS DSA (local ASRA abends
only).• Whether the program is executing in a subspace or the basespace.• The subspace STOKEN.• The subspace’s associated ALET.
62 CICS TS for z/OS: Troubleshooting CICS
If the abend originally occurred in a remote DPL server program, an eye-catcher *REMOTE* is present,and the registers and PSW are not present.
Locating the last command or statementThe easiest way of locating the last command issued by your application before the abend is to use theinternal trace table.
Before you beginYou must have had internal trace running, and you need to have captured entries from the EI level-1 andPC level-1 trace points for your task. The way you can find the last command using trace is described in“Last command identification” on page 63.
About this taskIf you did not have trace running, you need to rely on values in registers belonging to your programs, andtry to relate these to your source statements. That might lead you to an EXEC CICS command, or toanother type of statement in your program. The procedure is outlined in “Last statement identification” onpage 63.
Last command identificationThis process for identifying the last command applies to system dumps, in which it is necessary to identifythe abending task.
Step 2 is relevant to transaction dumps.
1. If the abend was a local AICA, ASRA, ASRB, or ASRD, find the last entry in the table and work backuntil you find an entry for trace point ID AP 1942. If you cannot find AP 1942, then search for anyone of the following: AP 0790, AP 0791, or AP 0792. The trace entry for AP 1942 is made on entry toAPLI's recovery routine. The entries for AP 0790, AP 0791, and AP 0792 are made by DFHSRP, the APdomain recovery routine that deals with program checks, operating system abends, and runaway taskconditions. The task number for your task is shown in the entry.
If the abend was none of those mentioned above, find the last entry in the table and work back untilyou find an entry for trace point ID AP 00F2 (PCP abend) that references the abend code. The tasknumber of your task is shown in the entry.
2. Now go back until you find the last trace entry showing your task number that was made from tracepoint ID AP 00E1. The trace entry is located in the EXEC interface program, DFHEIP. The data in thetrace entry includes the value of EIBFN, which tells you the specific command your program issuedbefore the abend. For programming information about the possible values that EIBFN can take, andtheir meanings, see Function codes of EXEC CICS commands. The AP 00E1 trace point also includesthe value of register 14 in the RET= field. Register 14 is the return address of the calling routine. See“Formatting and interpreting trace entries” on page 91.
3. You might now be able to identify the program that was being run when the abend occurred, fromknowing the structure of the application. If not, you can identify the program by using the informationin the" program information for the current transaction" section of the dump. The failing program isthe one most recently linked to (the first program printed in this section). The summary informationincludes the name of the program, and its load point, entry point, and length.
4. You should by now have found the program containing the last EXEC command that was issuedbefore the abend. You next need to locate the EXEC command in that program. If you cannot do it byinspection, use the techniques described in the next section.
Last statement identification1. Locate the CICS transaction storage areas of the transaction dump. These areas are maintained by
CICS, and they relate to the transaction that was running when the abend occurred. Find the eye-catcher DFHTACB in at least one of the areas. This eye-catcher signifies the start of the transactionabend control block and it contains the registers and PSW belonging to the program that was running
Chapter 5. Diagnostic tools and information 63
when the abend occurred. If there is more than one area containing this eye-catcher, it means that twoor more successive abends occurred. Find the first occurrence, because that relates to the abend thatstarted the sequence.
2. Locate the PSW for the program in the TACB and make a note of the next sequential instructionaddress. The PSW for the program is present if the abend is AICA, ASRA, ASRB or ASRD. Alternatively,obtain the offset of the abend within the failing program load module from the TACB. The offset ispresent if the abend is ASRA, ASRB or ASRD and is valid if not X'FFFFFFFF'. Note the value of register14, too.
3. Use the “program information for the current transaction” section of the dump to obtain the name andentry point of the failing program. Alternatively, obtain the name of the failing program from the TACB.
4. The offset or PSW should point to an instruction in the program. If it does not, register 14 shows areturn address into your program. Either way, correlate the address with a statement in the sourcecode for the program.
If the source language is Assembler, the instruction where the abend occurred is apparent from theprogram storage in the dump. If the source language is COBOL, PL/I, or C, refer to a compiler outputmapping source statements onto the object code.
Locating program dataYou might want to look at the data that your application program has in its storage areas.
You must refer to the appropriate programming language information for details of the structure of theacquired storage of the program.
CICS maintains a pointer to the chain of dynamic storage that an assembler program uses in fieldTCAPCDSA of the system area of the TCA.
Dumps for C/370 programsThe use of the relevant C/370 registers is as follows:
Register Use
3 In most circumstances, this is the base register
12 Holds the address of the CICS TCA for the C/370 program
13 Holds the address of the register save area
Location of COBOL dumped areasThe dumped COBOL program is in the "program information for the current transaction" section of thedump, and is addressed by the LOAD_POINT parameter on the appropriate LDLD ACQUIRE_PROGRAMexit trace entry.
The register save area INIT1+X'48' (covering registers 0 through 14) should have register 12 pointing tothe program global table (PGT), register 13 pointing to the task global table (TGT), and some others tolocations in the data area and compiled code of the program storage. If not, a CICS error is indicated.
For each invocation of the COBOL program, CICS copies the static TGT from program storage into CICSdynamic storage (the COBOL area) and uses the dynamic copy instead of the static one. CICS also copiesworking storage from program storage to the COBOL area, above the TGT. Task-related COBOL areas thusenable the single copy of a COBOL program to multithread as if it were truly reentrant.
The dumped COBOL areaThe COBOL area contains the following:
• The COBOL working storage for the task• A copy of the TGT
64 CICS TS for z/OS: Troubleshooting CICS
The TGT is addressed by TCAPCHS in the system part of the TCA. The TGT is used to hold intermediatevalues set at various stages during program execution. The first 18 words of the TGT constitute a standardsave area, in which the current registers of the program are stored on any request for CICS service.
Storage freezeCertain classes of CICS storage that are normally freed during the processing of a transaction can,optionally, be kept intact and freed only at the end of the transaction.
Then, in the event of an abend, the dump contains a record of the storage that would otherwise have beenlost, including the storage used by CICS service modules. The classes of storage that can be frozen in thisway are those in the teleprocessing and task subpools, and in terminal-related storage (TIOAs).
The storage freeze function is invoked by the CSFE transaction. For information about using CSFE, seeCSFE - terminal and system test.
Formatting a coupling facility data table pool dump
About this task
Procedure1. To format a coupling facility data table structure dump, use the IPCS STRDATA subcommand.2. To display the table index list, use the STRDATA subcommand as follows:
STRDATA DETAIL LISTNUM(2) ENTRYPOS(ALL)
The key of each entry in this list is the table name, and the first word of the adjunct area isthe corresponding data list number. If the table is open, entry data is present containing a list ofinformation about the current table users (regions that have the table open). Each one is identified byits MVS system name and CICS APPLID. The number of users is at +X'14' in the adjunct area. After anyvalid table user elements, the rest of the data area is uninitialized and can contain residual data up tothe next 256-byte boundary.
3. To display the table data, convert the data list number to decimal and specifying it on anotherSTRDATA subcommand.For example, if the first word of the adjunct area is X'00000027', the command to display the tabledata is as follows:
STRDATA DETAIL LISTNUM(39) ENTRYPOS(ALL)
In the data list, the key of each entry is the record key, and the data portion contains the user data witha 2-byte length prefix (or a 1-byte X'80' prefix if the data length is 32767 bytes). The rest of any dataarea is uninitialized and can contain residual data up to the next 256-byte boundary. The entry versioncontains the time stamp at the time the record was last modified or created.
The adjunct area contains information for locking and recovery. It contains null values (binary zeros) ifthe record is not locked. When the record is locked, the lock owner APPLID and UOWID appear in thisarea.
If a record has a recoverable rewrite pending, there are two entries with the same key, where thesecond entry is the before-image.
What to do nextFor information about the STRDATA subcommand and its options, see z/OS MVS IPCS User's Guide.
Formatting a named counter pool dump
About this task
Chapter 5. Diagnostic tools and information 65
ProcedureTo format a named counter structure dump, use the IPCS STRDATA subcommand as follows:
STRDATA DETAIL LISTNUM(0) ENTRYPOS(ALL)
ResultsThe key of each entry in this list is the counter name. The version field contains the counter value minusits maximum value minus 3 (in twos complement form) which has the effect that all counters have a valueof -2 when they have reached their limit (and the value of -1, equal to all high values, never occurs).The start of the adjunct area contains the 8-byte minimum and maximum limit values that apply to thecounter.
What to do nextFor information about the STRDATA subcommand and its options, see z/OS MVS IPCS User's Guide.
Formatting a shared temporary storage pool dump
Procedure1. To format a shared temporary storage pool dump, use the IPCS STRDATA subcommand.2. To display the queue index list, use the STRDATA subcommand as follows:
STRDATA DETAIL LISTNUM(2) ENTRYPOS(ALL)
The key of each entry in this list is the queue name. For a small queue, the first word of the adjunctarea is the total length of queue data which is included in the queue index entry; for a queue that hasbeen converted to the large format, the first word contains zero. The second word of the adjunct area isthe number of the corresponding data list if the queue has been converted to the large format, or zerootherwise.
For a small queue, the queue data is stored as the data portion of the queue index entry, with a 2-bytelength prefix preceding each item.
3. To display the queue data for a large queue, convert the data list number to decimal and specifying iton another STRDATA subcommandFor example if the second word of the adjunct area is X'0000000A', the command to display the queuedata is:
STRDATA DETAIL LISTNUM(10) ENTRYPOS(ALL)
In the data list, the key of each entry is the item number, and the data portion contains the item datawith a 2-byte length prefix. The rest of any data area is uninitialized and may contain residual data upto the next 256-byte boundary.
What to do nextFor information about the STRDATA subcommand and its options, see z/OS MVS IPCS User's Guide.
StatisticsStatistics are often overlooked as a source of debugging information, but statistics that relate to anapplication program can help solve problems.
It is useful to have a statistical profile (as mentioned in “Documentation” on page 17) to use for problemdetermination. If you compare the information in the profile with the statistical information produced byCICS, any differences you find might indicate the source of a problem.
Statistics are most often used in system tuning and diagnosis, but they also contain information that canindicate problems with the way your application handles resources. For example, you might notice from
66 CICS TS for z/OS: Troubleshooting CICS
these statistics that tables are being loaded, or programs are being linked, for which there is no knownrequirement.
You can also use statistics to check terminals, files, queues, and other resources, for irregularities in theiractivity. For example, if a terminal has a number of errors that are recorded for a particular transactionthat equal the number of times that transaction was run, this might indicate that an incorrect data streamis being sent to that terminal. For more information about statistics, see Introduction to CICS statistics.
MonitoringYou can use CICS monitoring to provide information for debugging applications. In addition to the system-defined event monitoring points (EMPs) that already exist in CICS code itself, you can define user eventmonitoring points in your own application programs by using the MONITOR POINT command.
At a user EMP, you can add your own data (up to 256 counters, up to 256 clocks, and a single characterstring of up to 8192 bytes) to fields reserved for you in performance class monitoring data records. Youcould use these extra EMPs to count how many times a certain event happens, or to time the intervalbetween two events. Your definitions in the Monitoring Control Table (MCT) specify the type and numberof fields that are available for your use within each task's performance record. For further informationabout the MCT, see Monitoring control table (MCT). For programming information about the MONITORPOINT command, see MONITOR.
For guidance about choosing performance tools, see Performance measurement tools. For informationabout the transactions needed to invoke these tools, see CEMT - main terminal.
Transaction inputs and outputsTransaction inputs and outputs can be divided into the following areas:
• Terminal data• Transient data and temporary storage• Passed information• Files and databases
Terminal dataTerminal data is important in solving problems, because it can help you determine what data was enteredjust before the transaction failed, and if there is any output.
The more you know about the information that was input at the terminal on which the transaction failed,the better your chance of duplicating the problem in a test environment. However, this information mightnot be precise, especially if there are many fields on the input screen. You are recommended to provide aquick and easy way for terminal operators to report problems, so that they can report the error while theycan still see the data on the screen (or at least remember more clearly what it was).
The output from a transaction is sometimes easier to capture. If you have a locally attached printer, youcan make a copy. (The problem might be that the printer output is incorrect.)
The items to look for on the input side are:
• Were all necessary input fields entered?• Were the contents of the input fields correct?• Which transmit key was used, (that is ENTER, a function key, or a PA key) ?
On the output screen, check the following points:
1. Do all the required fields contain data?2. Is the data correct?3. Is the screen format as it was designed?4. Are there any non-display fields used to pass data that might not be protected?
Chapter 5. Diagnostic tools and information 67
Transient data and temporary storageIf the program explicitly uses any transient data or temporary storage queues, inspect them to see iftheir content is what you expect. You can use the CICS-supplied transaction, CEBR, to inspect temporarystorage queues in some detail.
See CEBR - temporary storage browse for information about this transaction.
Even if the program does not use queues, look at the system queues for CEMT (or your site replacement)and CSTL (and CDBC if you use DBCTL) to see if there are any relevant messages.
The things you might want to look for in the queues are:
1. Are the required entries there?2. Are the entries in the correct order?3. Is the queue being written the same one that is being read?
Passed informationBe particularly careful when you are using the common work area (CWA) because you only have one areafor the entire system. A transaction may depend on a certain sequence of transactions and some otherprogram may change that sequence.
If you are using the CWA, you must also know if your CICS is split into multiple MRO regions becausethere is an independent CWA for each MRO region.
Terminal user areas can have problems because the area is associated with a terminal and not aparticular transaction.
If you are using tables in the CWA, remember that there is no recovery; if a transaction updates the tableand then abends, the transaction is backed out but the change is not.
Files and databasesFiles and databases are often the main source of transaction input and output; you should alwaysinvestigate both these areas whenever a program is having problems.
To do this, you need to use the appropriate utilities and diagnostic tools for the data access methods thatyou have at your installation.
Check the various indexes in files and databases. If you have more than one method of accessinginformation, one path may be working well but another path may be causing problems.
When looking through the data in files, pay particular attention to the record layout. The program may beusing an out-of-date record description.
Using CICS traceCICS trace is a debugging aid for application programmers, system programmers, and IBM fieldengineers. General CICS tracing is handled by the CICS trace domain. It traces the flow of executionthrough CICS code, and through your applications as well. You can see what functions are beingperformed, which parameters are being passed, and the values of important data fields at the time tracecalls are made. This type of tracing is also useful in first failure data capture, if an exception condition isdetected by CICS.
Trace points are included at specific points in CICS code. From these points, trace entries can be writtento any currently selected trace destination. Some trace points are used to make exception traces whenexception conditions occur, and some are used to trace the mainline execution of CICS code.
CICS provides different levels of tracing to assist with problem determination. Standard trace level 1 isthe default setting for each component to be traced within CICS. The user can use CETR to specify whattrace levels are set for each component of CICS. By default, INTTR, SYSTR, and USERTR are set ON. Thismeans the main system and user trace flags default to be set on, and internal tracing is active. STNTR
68 CICS TS for z/OS: Troubleshooting CICS
defaults to 1, as do all the STNTRxx values, and as a result standard trace component tracing defaults tolevel 1 for all CICS trace components. The consequence of this is that by default a CICS system incurs theCPU usage to provide this level of internal CICS trace data.
There is a trade-off between the CPU cost in capturing trace data for problem determination, set againstthe ability to diagnose problems if they occur. Some customers elect to run with limited levels of tracingactive on their system. While choosing to use CICS trace does increase processing requirements, notusing CICS tracing reduces the amount of problem determination information that is available for theCICS region.
Note: CICS always performs exception tracing when it detects an exception condition, so a minimum offirst failure data capture is provided regardless of your CICS trace setting. However, exception tracingby its nature is limited in what diagnostic data it can provide. It is difficult to perform initial problemdetermination without CICS tracing being active and all components capturing their trace data, as it is thetrace information that helps to identify the flow of system activity, and the events in chronological order,leading up to a failure. For this reason, to assist with problem determination it is recommended that thedefault settings of all CICS domains and components is used when tracing is active. This is standard tracelevel 1 tracing.
All CICS trace points are listed in alphabetical sequence in Trace entries.
Quickstart for traceFollow the instructions below to start, stop, and format different types of traces for CICS problemdetermination.
• “CICS auxiliary trace” on page 69• “CICS internal trace” on page 70• “CICSPlex SM WLM trace” on page 71• “GTF trace” on page 73• “Language Environment feature trace” on page 74• “Language Environment traceback” on page 75• “Main Trace (MTRACE)” on page 75• “MVS system trace” on page 76• “z/OS Communications Server buffer tracing” on page 82• “z/OS Communications Server exit tracing” on page 81
CICS auxiliary traceUse CICS auxiliary trace to collect large amounts of trace data or to get a trace of CICS activity in whichtrace entries are not overwritten.
Start CICS auxiliary traceIf your problem is occurring at CICS startup, set the tracing status at CICS initialization using thefollowing system initialization table (SIT) parameters:
SYSTR=ONAUXTR=ONAUXTRSW=NOSTNTR=1 to turn level 1 tracing on for all CICS componentsSTNTRxx=1 where xx is a specific component abbreviation
If your problem is occurring after CICS startup, use CETR to control trace. Enter the following valueson the initial CETR screen:
Chapter 5. Diagnostic tools and information 69
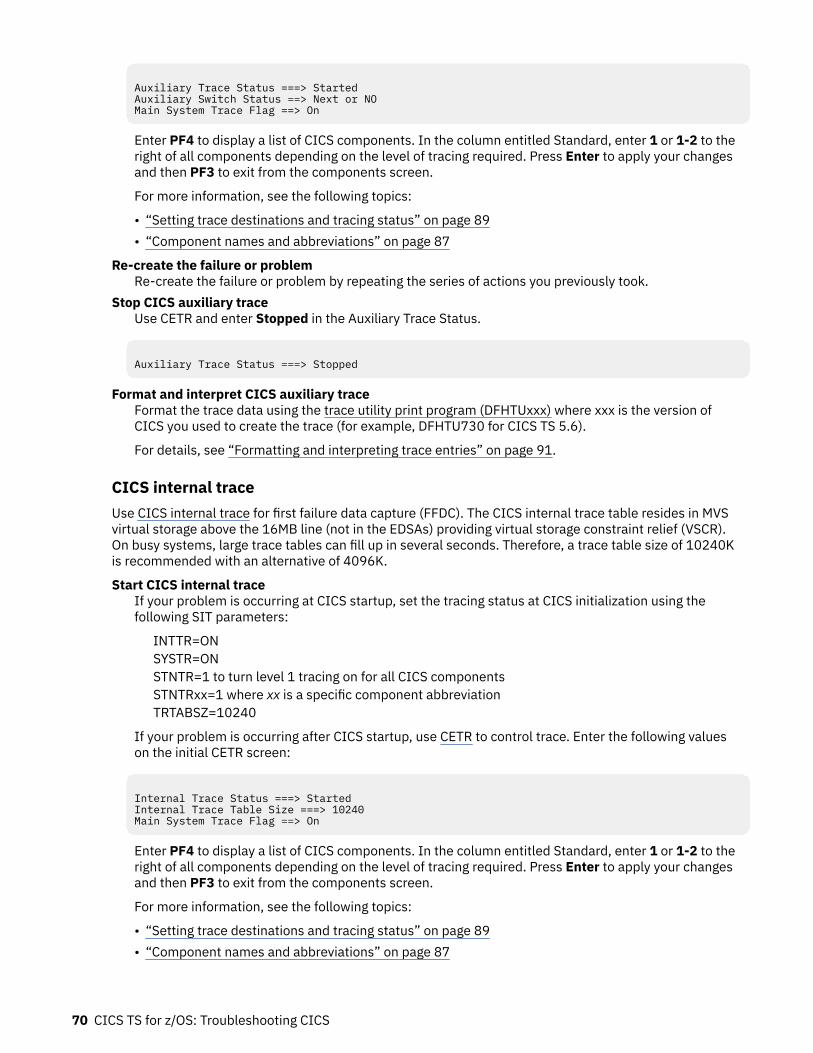
Auxiliary Trace Status ===> StartedAuxiliary Switch Status ==> Next or NOMain System Trace Flag ==> On
Enter PF4 to display a list of CICS components. In the column entitled Standard, enter 1 or 1-2 to theright of all components depending on the level of tracing required. Press Enter to apply your changesand then PF3 to exit from the components screen.
For more information, see the following topics:
• “Setting trace destinations and tracing status” on page 89• “Component names and abbreviations” on page 87
Re-create the failure or problemRe-create the failure or problem by repeating the series of actions you previously took.
Stop CICS auxiliary traceUse CETR and enter Stopped in the Auxiliary Trace Status.
Auxiliary Trace Status ===> Stopped
Format and interpret CICS auxiliary traceFormat the trace data using the trace utility print program (DFHTUxxx) where xxx is the version ofCICS you used to create the trace (for example, DFHTU730 for CICS TS 5.6).
For details, see “Formatting and interpreting trace entries” on page 91.
CICS internal traceUse CICS internal trace for first failure data capture (FFDC). The CICS internal trace table resides in MVSvirtual storage above the 16MB line (not in the EDSAs) providing virtual storage constraint relief (VSCR).On busy systems, large trace tables can fill up in several seconds. Therefore, a trace table size of 10240Kis recommended with an alternative of 4096K.
Start CICS internal traceIf your problem is occurring at CICS startup, set the tracing status at CICS initialization using thefollowing SIT parameters:
INTTR=ONSYSTR=ONSTNTR=1 to turn level 1 tracing on for all CICS componentsSTNTRxx=1 where xx is a specific component abbreviationTRTABSZ=10240
If your problem is occurring after CICS startup, use CETR to control trace. Enter the following valueson the initial CETR screen:
Internal Trace Status ===> StartedInternal Trace Table Size ===> 10240Main System Trace Flag ==> On
Enter PF4 to display a list of CICS components. In the column entitled Standard, enter 1 or 1-2 to theright of all components depending on the level of tracing required. Press Enter to apply your changesand then PF3 to exit from the components screen.
For more information, see the following topics:
• “Setting trace destinations and tracing status” on page 89• “Component names and abbreviations” on page 87
70 CICS TS for z/OS: Troubleshooting CICS
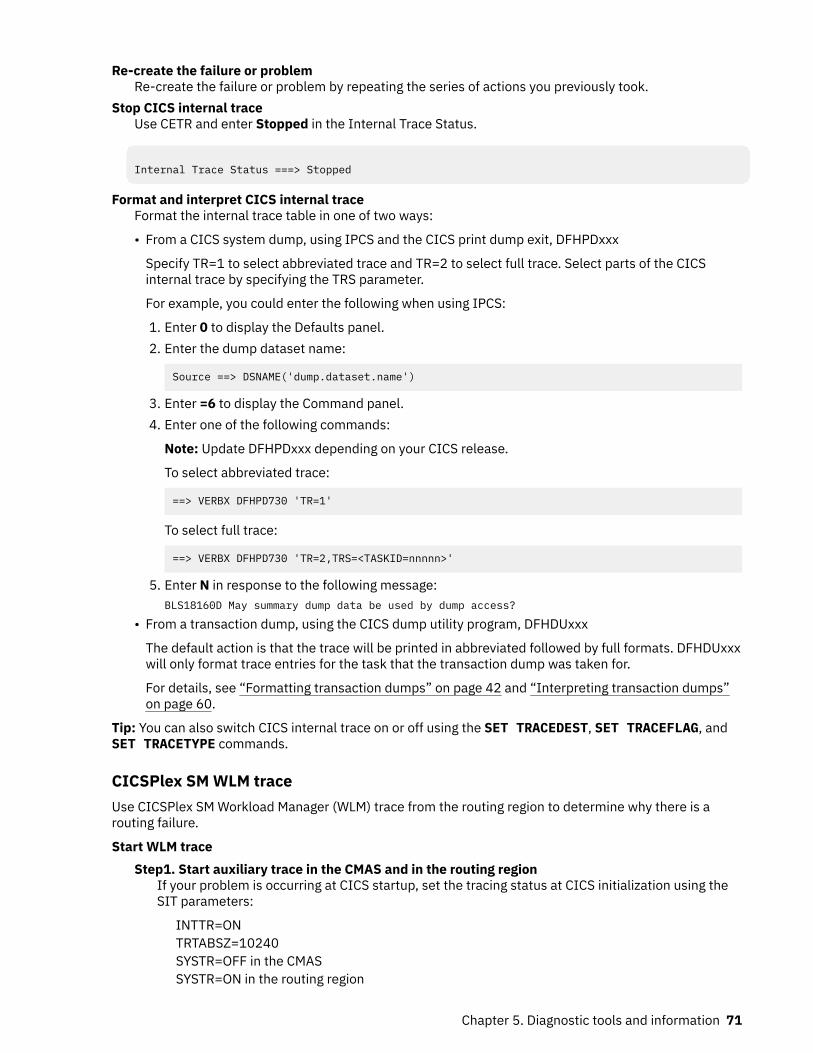
Re-create the failure or problemRe-create the failure or problem by repeating the series of actions you previously took.
Stop CICS internal traceUse CETR and enter Stopped in the Internal Trace Status.
Internal Trace Status ===> Stopped
Format and interpret CICS internal traceFormat the internal trace table in one of two ways:
• From a CICS system dump, using IPCS and the CICS print dump exit, DFHPDxxx
Specify TR=1 to select abbreviated trace and TR=2 to select full trace. Select parts of the CICSinternal trace by specifying the TRS parameter.
For example, you could enter the following when using IPCS:
1. Enter 0 to display the Defaults panel.2. Enter the dump dataset name:
Source ==> DSNAME('dump.dataset.name')
3. Enter =6 to display the Command panel.4. Enter one of the following commands:
Note: Update DFHPDxxx depending on your CICS release.
To select abbreviated trace:
==> VERBX DFHPD730 'TR=1'
To select full trace:
==> VERBX DFHPD730 'TR=2,TRS=<TASKID=nnnnn>'
5. Enter N in response to the following message:BLS18160D May summary dump data be used by dump access?
• From a transaction dump, using the CICS dump utility program, DFHDUxxx
The default action is that the trace will be printed in abbreviated followed by full formats. DFHDUxxxwill only format trace entries for the task that the transaction dump was taken for.
For details, see “Formatting transaction dumps” on page 42 and “Interpreting transaction dumps”on page 60.
Tip: You can also switch CICS internal trace on or off using the SET TRACEDEST, SET TRACEFLAG, andSET TRACETYPE commands.
CICSPlex SM WLM traceUse CICSPlex SM Workload Manager (WLM) trace from the routing region to determine why there is arouting failure.
Start WLM traceStep1. Start auxiliary trace in the CMAS and in the routing region
If your problem is occurring at CICS startup, set the tracing status at CICS initialization using theSIT parameters:
INTTR=ONTRTABSZ=10240SYSTR=OFF in the CMASSYSTR=ON in the routing region
Chapter 5. Diagnostic tools and information 71
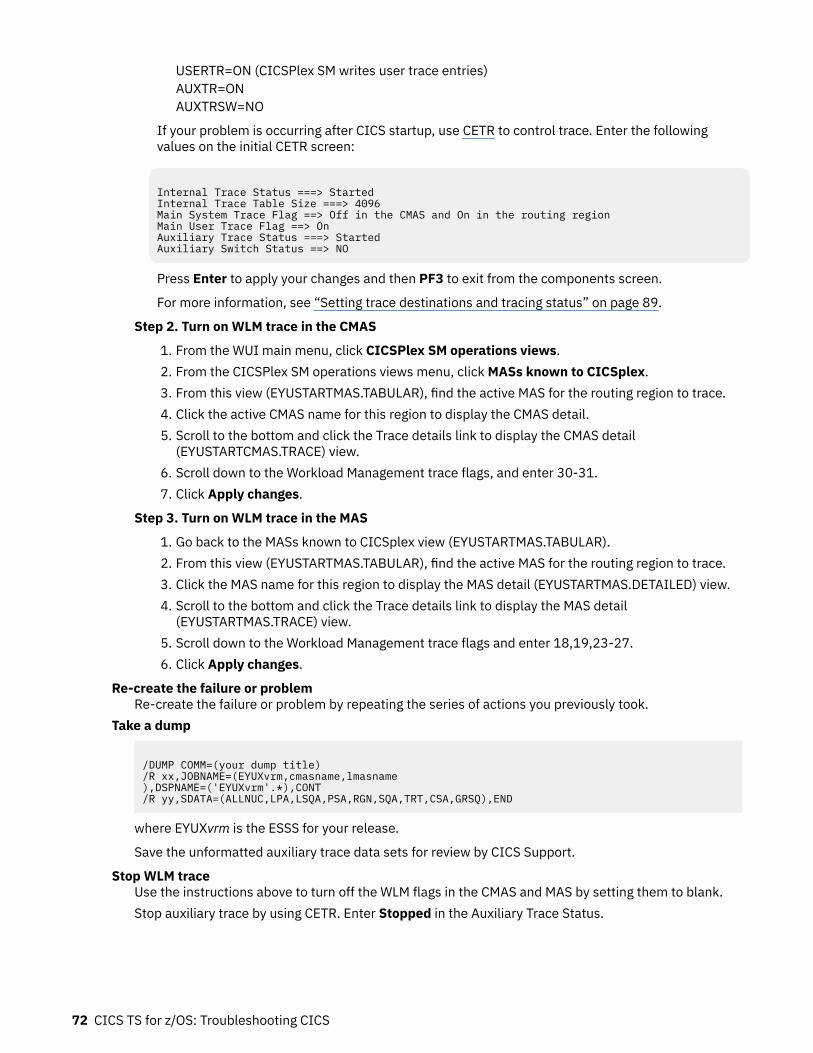
USERTR=ON (CICSPlex SM writes user trace entries)AUXTR=ONAUXTRSW=NO
If your problem is occurring after CICS startup, use CETR to control trace. Enter the followingvalues on the initial CETR screen:
Internal Trace Status ===> StartedInternal Trace Table Size ===> 4096Main System Trace Flag ==> Off in the CMAS and On in the routing regionMain User Trace Flag ==> OnAuxiliary Trace Status ===> StartedAuxiliary Switch Status ==> NO
Press Enter to apply your changes and then PF3 to exit from the components screen.
For more information, see “Setting trace destinations and tracing status” on page 89.
Step 2. Turn on WLM trace in the CMAS
1. From the WUI main menu, click CICSPlex SM operations views.2. From the CICSPlex SM operations views menu, click MASs known to CICSplex.3. From this view (EYUSTARTMAS.TABULAR), find the active MAS for the routing region to trace.4. Click the active CMAS name for this region to display the CMAS detail.5. Scroll to the bottom and click the Trace details link to display the CMAS detail
(EYUSTARTCMAS.TRACE) view.6. Scroll down to the Workload Management trace flags, and enter 30-31.7. Click Apply changes.
Step 3. Turn on WLM trace in the MAS
1. Go back to the MASs known to CICSplex view (EYUSTARTMAS.TABULAR).2. From this view (EYUSTARTMAS.TABULAR), find the active MAS for the routing region to trace.3. Click the MAS name for this region to display the MAS detail (EYUSTARTMAS.DETAILED) view.4. Scroll to the bottom and click the Trace details link to display the MAS detail
(EYUSTARTMAS.TRACE) view.5. Scroll down to the Workload Management trace flags and enter 18,19,23-27.6. Click Apply changes.
Re-create the failure or problemRe-create the failure or problem by repeating the series of actions you previously took.
Take a dump
/DUMP COMM=(your dump title)/R xx,JOBNAME=(EYUXvrm,cmasname,lmasname),DSPNAME=('EYUXvrm'.*),CONT/R yy,SDATA=(ALLNUC,LPA,LSQA,PSA,RGN,SQA,TRT,CSA,GRSQ),END
where EYUXvrm is the ESSS for your release.
Save the unformatted auxiliary trace data sets for review by CICS Support.
Stop WLM traceUse the instructions above to turn off the WLM flags in the CMAS and MAS by setting them to blank.Stop auxiliary trace by using CETR. Enter Stopped in the Auxiliary Trace Status.
72 CICS TS for z/OS: Troubleshooting CICS
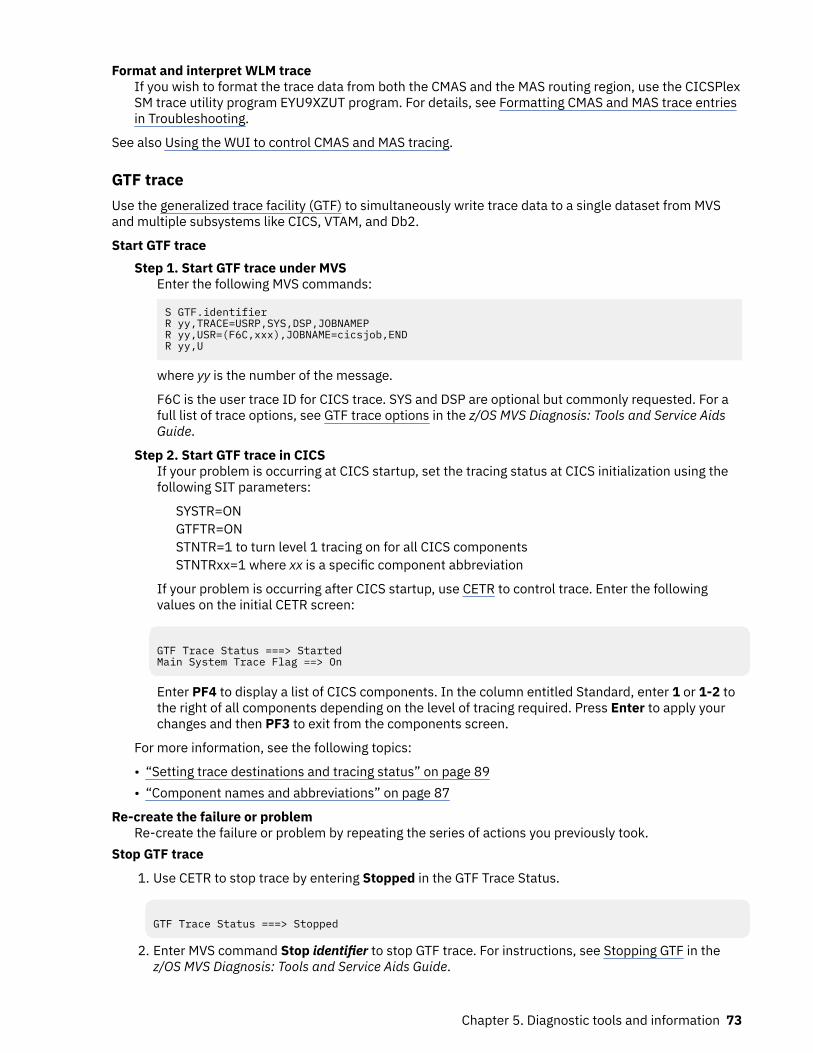
Format and interpret WLM traceIf you wish to format the trace data from both the CMAS and the MAS routing region, use the CICSPlexSM trace utility program EYU9XZUT program. For details, see Formatting CMAS and MAS trace entriesin Troubleshooting.
See also Using the WUI to control CMAS and MAS tracing.
GTF traceUse the generalized trace facility (GTF) to simultaneously write trace data to a single dataset from MVSand multiple subsystems like CICS, VTAM, and Db2.
Start GTF traceStep 1. Start GTF trace under MVS
Enter the following MVS commands:
S GTF.identifierR yy,TRACE=USRP,SYS,DSP,JOBNAMEPR yy,USR=(F6C,xxx),JOBNAME=cicsjob,ENDR yy,U
where yy is the number of the message.
F6C is the user trace ID for CICS trace. SYS and DSP are optional but commonly requested. For afull list of trace options, see GTF trace options in the z/OS MVS Diagnosis: Tools and Service AidsGuide.
Step 2. Start GTF trace in CICSIf your problem is occurring at CICS startup, set the tracing status at CICS initialization using thefollowing SIT parameters:
SYSTR=ONGTFTR=ONSTNTR=1 to turn level 1 tracing on for all CICS componentsSTNTRxx=1 where xx is a specific component abbreviation
If your problem is occurring after CICS startup, use CETR to control trace. Enter the followingvalues on the initial CETR screen:
GTF Trace Status ===> StartedMain System Trace Flag ==> On
Enter PF4 to display a list of CICS components. In the column entitled Standard, enter 1 or 1-2 tothe right of all components depending on the level of tracing required. Press Enter to apply yourchanges and then PF3 to exit from the components screen.
For more information, see the following topics:
• “Setting trace destinations and tracing status” on page 89• “Component names and abbreviations” on page 87
Re-create the failure or problemRe-create the failure or problem by repeating the series of actions you previously took.
Stop GTF trace
1. Use CETR to stop trace by entering Stopped in the GTF Trace Status.
GTF Trace Status ===> Stopped
2. Enter MVS command Stop identifier to stop GTF trace. For instructions, see Stopping GTF in thez/OS MVS Diagnosis: Tools and Service Aids Guide.
Chapter 5. Diagnostic tools and information 73
Format and interpret GTF traceUse IPCS to format GTF trace with the GTFTRACE subcommand. For instructions, see Using IPCS toprint trace records written to GTF.
For example, you can view the trace using TSO, and you could enter the following commands:
1. Enter 0 to display the Defaults panel.2. Enter the trace dataset name:
Source ==> DSNAME('trace.dataset.name')
3. Enter =6 to display the Command panel.4. Enter one of the following commands:
==> GTFTRACE USR(ALL)==> GTFTRACE JOBNAME(cicsjob) USR(F6C)==> GTFTRACE USR(F6C) sys dsp
Alternatively, you can format the trace as a batch program.
Read the GTF trace. See Reading GTF output in the z/OS MVS Diagnosis: Tools and Service Aids Guide.
Language Environment feature traceUse Language Environment (LE) Feature Trace (FT) to see trace entries for important LE events during thelife of a CICS transaction. FT adds trace points inside LE at Event Handle and Set anchor points. It alsoprovides register 13 and parameters before the LE call.
Start LE feature traceStart trace using the instructions for starting CICS auxiliary trace, CICS internal trace, or GTF tracedepending on the destination you choose. Start FT trace by turning on level 2 tracing for the CICSapplication domain (AP=1-2):
• If your problem is occurring at CICS startup, set the tracing status at CICS initialization using thefollowing SIT parameters:
SYSTR=ONSTNTRAP=(1,2)
• If your problem is occurring after CICS startup, use CETR to control trace. Enter the following valueson the initial CETR screen:
Main System Trace Flag ==> On
Enter PF4 to display a list of CICS components. In the column entitled Standard, enter 1-2 tothe right of the AP component. Press Enter to apply your changes and then PF3 to exit from thecomponents screen.
Re-create the failure or problemRe-create the failure or problem by repeating the series of actions you previously took.
Stop LE feature traceUse CETR:
1. From the initial CETR screen, enter PF4.2. Enter 1 or OFF to the right of the AP component.3. Press Enter to apply your changes and then PF3 to exit from the components screen.
Format and interpret LE feature traceFormat FT using the instructions for formatting CICS auxiliary trace, CICS internal trace, or GTFtrace depending on the destination you choose. Ensure that CEL4TFMT is in the STEPLIB beforeformatting the LE trace entries. Otherwise, you will receive message DFHTR5002 stating that thefeature formatting program has failed.
74 CICS TS for z/OS: Troubleshooting CICS
Feature trace entries contain a domain identifier of FT. The format of these entries is slightly differentfrom standard trace points. The module identifier contains the short name of the feature and a fullmodule name. Data areas contain the following:
• Event Handler Data Areas:
Data Area 1 contains register 13 and Event Handler ID in the first two full words. The rest of DataArea 1 consists of 4-byte integers representing each parameter that is passed in the call. This isusually the value passed, but may be the address of the structure passed.
Data Area 2 (Trace entry 1018) contains EICB.• Set Anchor Data Areas:
Data Area 1 contains register 13 (first word), CAA address of this run unit (2nd word), andCEEEDB_CREATOR_RINI which equates to identify creator of an enclave (3rd word).
See also Activating Language Environment feature trace records under CICS in the z/OS LanguageEnvironment Debugging Guide.
Language Environment tracebackUse Language Environment (LE) traceback to see a sequential list of all active routines and the routinenames, statement numbers, and offsets where the exception occurred.
1. Use LE option TERMTHDACT to determine level of information that LE produces when a failure occursand the destination of the information.
For the best performance, specify TERMTHDACT=(MSG) when traceback is not needed. If thetraceback is required, specify TERMTHDACT=(TRACE,CICSDDS). The CICSDDS option directs the LEdiagnostic output to the CICS dump dataset, rather than to the CESE transient data queue.
Note: Java applications in CICS use MVS LE services rather than CICS LE services. As a result,CICSDDS is not an option and LE writes the traceback information to CEEDUMP.
2. Format LE storage areas and the AP domain for a task by entering IPCS command VERBX DFHPDxxx'APS=<taskid=nnnnn>' where nnnnn is the task number.
• CICS routines call the LE verb exit and produce the same output as VERBX CEEERRIP ASID(00nn)CAA(xxxxxxxx) DSA(xxxxxxxx) ALL.
• This eliminates the need to determine the DSA address (register 13) and the CAA address (register12).
• This formats the LE traceback, CAA, PCB, MEML, RCB, EDB, Runtime options, Heap control blocks,Stack storage control blocks (User and Lib), DSA, and Condition Management control blocks.
For an explanation of the fields in traceback, see item 7 (Traceback) under sections of the LanguageEnvironment dump in the z/OS Language Environment Debugging Guide.
Main Trace (MTRACE)Use Main Trace (MTRACE) to view all recent system messages, including CICS messages that are writtento the MVS console. MTRACE is activated automatically at MVS system initialization.
When a system dump is taken, the main address space which MTRACE is part of is always dumped. IfMTRACE is not included, ensure that the SDUMP option TRT is in force at the time the dump is written. Forinstructions, see Preparing to use IPCS to format CICS SDUMPs. Write MTRACE to a system dump datasetby entering one of the following:
• CICS transaction CEMT PER SNAP• MVS command DUMP COMM=(dumpname) followed by a reply of R yy,JOBNAME=(cicsjob) where yy is
the number of the message
Format MTRACE data from a system dump by entering the IPCS command VERBX MTRACE or using theIPCS Trace Processing selection panel. For more information:
Chapter 5. Diagnostic tools and information 75
• See z/OS MVS IPCS Commands for information about the MTRACE subcommand.• See z/OS MVS IPCS User's Guide for the panel.
Read the main trace data. See Reading main trace data in the z/OS MVS Diagnosis: Tools and Service AidsGuide.
MVS system traceUse the MVS System Trace to view an ongoing record of hardware and software events occurring duringsystem initialization and operation.
The system activates system tracing at initialization and the tracing runs continuously, unless yourinstallation has changed the IBM-supplied system tracing.
Enter MVS command TRACE STATUS to check the size of the internal trace table. Message IEE839Iwill display. For example, if ST=(ON,0256K,00512K) displays, this indicates that trace is on and has thedefault size of 256K. You can change the trace table size or add trace branch instructions by using theTRACE command to customize system trace. For detailed instructions, see Customizing system tracing inthe z/OS MVS Diagnosis: Tools and Service Aids Guide.
When a system dump is taken, the main address space which MVS system trace is part of is alwaysdumped. If MVS system trace is not included, ensure that the SDUMP option TRT is in force at the time thedump is written. For instructions, see Preparing to use IPCS to format CICS SDUMPs. Write MVS systemtrace to a system dump dataset by entering one of the following:
• CICS transaction CEMT PER SNAP• MVS command DUMP COMM=(dumpname) followed by a reply of R yy,JOBNAME=(cicsjob) where yy is
the number of the message
Use the IPCS subcommand SYSTRACE to view the trace in a system dump. For example:
1. Enter 0 to display the Defaults panel.2. Enter the dump dataset name:
Source ==> DSNAME('dump.dataset.name')
3. Enter =6 to display the Command panel.4. Enter one of the following commands:
• To display the local time with each trace entry for the ASID the dump was taken for:
==> SYSTRACE TIME(LOCAL)
• To display trace entries for all ASIDs in the system:
==> SYSTRACE ALL
• To display trace entries for a specific four digit ASID:
==> SYSTRACE ASID('nnnn')
This is helpful when trace entries for the CICS ASID do not display.
See Reading system trace output for a description of the system trace table entries.
Trace levelsApart from exception trace points, all trace points in CICS have an associated level attribute. The level of atrace point indicates the depth of information that the trace point provides.
Trace levels 1–32 are available in CICS, but in practice nearly all mainline trace points have a trace levelof 1 or 2.
76 CICS TS for z/OS: Troubleshooting CICS
You can use the trace levels to specify the level of CICS system tracing that you require for the CICSregion, or for an individual component or task.
Level-1 trace pointsLevel-1 trace points are designed to give you enough diagnostic information to fix errors caused byuser applications or user actions. CICS provides level-1 trace points in the following situations:
• Entry to, and exit from, every CICS domain. The information includes the domain call parameterlist, and the address of any data that is useful for a high-level understanding of the function to beperformed.
• Entry to, and exit from, major internal domain functions. The information includes parameterspassed on the call, and any output from the function.
• Before and after calls to other programs, such as the z/OS Communications Server. The informationincludes the request that is to be made, the input parameters on the request, and the result of thecall.
Level-2 trace pointsLevel-2 trace points are situated between the level-1 trace points, and they provide information thatis likely to be more useful for fixing errors within CICS code. You probably will not want to use level-2trace points yourself, unless you are requested to do so by IBM support staff after you have referred aproblem to them.
Level-3 trace pointsTrace points at level 3 and above are reserved for special cases. Very few components have tracepoints higher than level 2, and they are only likely to be of use by IBM support staff.
Trace entry pointsThe points at which trace entries are produced during CICS operation are of four types: system trace entrypoints, user trace entry points, exception trace entry points, and user exception trace entry points.
System trace entry pointsThese are points within CICS at which trace control requests are made. The most important system traceentry points for application programmers are for the EXEC interface program. These produce entries inthe trace table whenever a CICS command is processed.
Two trace entries are made: the first when the command is issued, and the second when CICS hasperformed the required function and is about to return control to your application program. Betweenthem, these two trace entries allow you to trace the flow of control through an application, and to checkwhich exception conditions, if any, occurred during its execution. The ABEND, RETURN, TRACEFLAG, andXCTL commands produce single entries only.
User trace entry pointsThese are additional points within your application program that you can include in the trace tableto allow complete program debugging. For example, you could specify an entry for a program loopcontaining a counter value showing the number of times that the loop had been entered.
A trace entry is produced wherever the ENTER TRACENUM command is run. Each trace entry request,which can be given a unique identifier, causes data to be placed in the trace table.
Exception trace entry pointsThese are additional points where CICS has detected an exception condition. These are made fromspecific points in the CICS code, and data is taken from areas that might provide some information aboutthe cause. Exception trace entry points do not have an associated "level" attribute; trace calls are onlyever made from them when exception conditions occur.
Chapter 5. Diagnostic tools and information 77
User exception trace entry pointsThese are trace entries that are always written to the internal trace table (even if internal tracing is setoff), but are written to other destinations only if they are active. You can identify them by the characterstring *EXCU in any formatted trace output produced by the CICS utility programs. See User exceptiontrace entries for general information about user exception trace entry points; programming information isin Making trace entries .
Trace destinationsYou can choose from any number of the destinations for the trace entries produced by CICS. Anycombination of these destinations can be active at any time.
• The internal trace table in main storage• The CICS auxiliary trace data sets• The MVS generalized trace facility (GTF) data sets• The JVM server trace file in z/OS Unix System Services
You can choose the most appropriate trace destinations based on their characteristics, the amount oftrace data that you need to capture, and whether you want to integrate CICS tracing with tracing done byother programs. The JVM server trace file is unique to each JVM server. For more information on this tracefile, see Troubleshooting Java applications.
You can control the status and certain other attributes of the trace destinations either while CICS isrunning, or by specifying system initialization parameters at CICS startup. For instructions to control thetrace destinations, see “Setting trace destinations and tracing status” on page 89.
Internal trace tableThe CICS internal trace table is held in storage in the CICS region. It is allocated at an early stage duringCICS initialization, and it exists for the whole of the CICS run.
You use the TRTABSZ system initialization parameter to specify the size of the internal trace table at CICSstartup. Its minimum size is 1024 KB, and its maximum size is 1 GB. The default size is 12288 KB (12MB).
Every CICS region always has an internal trace table. Even if internal tracing has not been started for theCICS region, the internal trace table is used as a buffer for the other trace destinations. Trace entries arebuilt there and copied to the auxiliary trace data sets or to GTF trace if those destinations are started.
In addition, exception trace entries are always written to the internal trace table, even if no tracedestinations are currently started. Other trace destinations that are currently started get the exceptiontrace entry as well, but the entry always goes to the internal trace table even if you have turned tracing offcompletely. This function provides first failure data capture.
The internal trace table wraps when it is full. When the end of the table is reached, the next trace entryto be directed to the internal trace table goes to the start, and overlays the trace entry that was formerlythere. You can increase or decrease the size of the internal trace table while CICS is running, but if you doso you lose all of the trace data that was present in the table at the time of the change.
For a transaction dump, CICS copies the current internal trace table to produce the transaction dumptrace table. You use the TRTRANSZ system initialization parameter to specify the size of the transactiondump trace table, which is created in MVS storage in 64-bit (above-the-bar) storage.
The internal trace table is most useful for background tracing or when you do not need to capture anextensive set of trace entries. If you need to trace CICS system activity over a long period, or if you needmany trace entries over a short period, one of the other trace destinations is likely to be more appropriate.
You can format the internal trace table in two ways:
• From a CICS system dump, using the CICS print dump exit, DFHPD730.
78 CICS TS for z/OS: Troubleshooting CICS
If the internal trace table is large, you can use trace selection parameters to reduce the number of traceentries that are formatted. See Selecting parts of the CICS internal trace table.
• From a transaction dump, using the CICS dump utility program, DFHDU730.
Auxiliary trace data setsThe auxiliary trace data sets are CICS-owned BSAM data sets named DFHAUXT and DFHBUXT. If youwant to use auxiliary trace, you must create one or both of these data sets before you start CICS; youcannot create them while CICS is running.
For instructions to set up the auxiliary trace data sets, see Setting up auxiliary trace data sets. Theauxiliary trace data sets require two 4 KB data buffers in the CICS region's storage.
When you first start CICS auxiliary trace, any trace entries are directed to the initial auxiliary trace dataset. If CICS terminated normally when auxiliary trace was last active, this is the auxiliary trace data setthat was not being used at the time. Otherwise, it is the DFHAUXT data set. If you initialize CICS withauxiliary trace started, DFHAUXT is used as the initial auxiliary trace data set.
When you have two auxiliary trace data sets, you can choose from the following actions for CICS to takewhen one data set is full. You specify your chosen action using the auxiliary switch, which you can setusing the AUXTRSW system initialization parameter or the CEMT transaction:
• When the initial data set is full, no more trace entries are directed to the auxiliary trace data sets.(AUXTRSW=NO)
• When the initial data set is full, then the other data set receives the next trace entries. When that one isfull, no more trace entries are directed to the auxiliary trace data sets. (AUXTRSW=NEXT)
• Auxiliary trace data is written alternately to each data set, and CICS switches from one to the otherevery time the current one becomes full. With this action selected, trace entries are eventuallyoverwritten, as they are in the internal trace table. (AUXTRSW=ALL)
When auxiliary tracing is started or when it is paused, the auxiliary trace data set that is currently in use isopen. When auxiliary tracing is stopped, the auxiliary trace data set is closed.
You can use auxiliary trace data sets to collect large amounts of trace data, provided that you initiallydefine large enough data sets. For example, you might want to use auxiliary trace to track system activityover a long period of time, perhaps to solve an unpredictable storage violation problem. Auxiliary tracecan be particularly useful if you are using CICS trace during startup, because of the high volume of traceentries that are written when CICS is initializing.
CICS provides a trace utility program, DFHTU730, that you can use to extract all or selected trace entriesfrom auxiliary trace data sets, and format and print the data. You can select the trace entries based on thetime when they were written, and the reports from the trace utility program include time stamps to helpyou match external events with a particular area of the trace.
Generalized Trace Facility (GTF)The generalized trace facility (GTF) in z/OS is a service aid that is part of the MVS system product. CICSissues an MVS GTRACE macro to write trace entries to GTF. GTF must be started with the TRACE=USRoption in MVS before you start CICS GTF trace.
GTF stores trace entries in a trace table in MVS main storage, or in up to 16 data sets on tape or disk.
If the storage available to GTF becomes full, the next trace entries go to the start, and overlay the traceentries that were formerly there. For more information about setting up GTF in z/OS, see The GeneralizedTrace Facility (GTF) in z/OS MVS Diagnosis: Tools and Service Aids.
GTF is most useful when you want to integrate trace entries from a CICS region with those from otherCICS regions or other programs. GTF can record trace entries from all supported CICS releases, and itcan be used by other programs besides CICS, such as the z/OS Communications Server (for SNA). Youcan relate CICS trace entries to those from the Communications Server using the task identifier in thetrace header. However, because different products might run asynchronously, be cautious about using thesequence of trace entries in the GTF trace data set as evidence when you investigate problems.
Chapter 5. Diagnostic tools and information 79
To extract and format trace entries from GTF, you use the GTFTRACE subcommand in the interactiveproblem control system (IPCS). IPCS calls the CICS-supplied formatting routines DFHTG730 andDFHTR730. You can select the trace entries by specifying options on the USR parameter of the GTFTRACEsubcommand for IPCS to select the trace entries, or by specifying options on the CICS parameterGTFTRACE subcommand for IPCS to pass to DFHTR730.
CICS exception tracingCICS exception tracing is always done by CICS when it detects an exception condition. The sorts ofexception that might be detected include bad parameters on a domain call, and any abnormal responsefrom a called routine. The aim is “first failure data capture”, to record data that might be relevant to theexception as soon as possible after it has been detected.
CICS uses a similar mechanism for both exception tracing and “normal” tracing. Exception trace entriesare made from specific points in CICS code, and data is taken from areas that might provide informationabout the cause of the exception. The first data field in the trace entry is usually the parameter list fromthe last domain call, because this can indicate the reason for the exception.
The exception trace points do not have an associated “level” attribute, and trace calls are only ever madefrom them when exception conditions occur.
Exception trace entries are always written to the internal trace table, even if no trace destinations atall are currently STARTED. That is why there is always an internal trace table in every CICS region, tomake sure there is always somewhere to write exception trace entries. If the other trace destinations areSTARTED, the exception trace entries are written there, as well.
You can select tracing options so that exception traces only are made to an auxiliary trace data set. This islikely to be useful for production regions, because it enables you to preserve exception traces in auxiliarystorage without incurring any general tracing overhead. You need to disable all standard and special tasktracing, and enable auxiliary trace:
1. Ensure that special tracing has not been specified for any task.2. Set the main system trace flag off.3. Set the auxiliary trace status to STARTED, and the auxiliary trace data set and the auxiliary switch
status to whatever values you want.
Exception traces are now made to an auxiliary trace data set, but there is no other tracing overhead.
The format of an exception trace entry is almost identical to that of a normal trace entry. However, you canidentify it by the eye-catcher *EXC* in the header.
Note: Exception conditions that are detected by MVS, for example, operation exception, protectionexception, or data exception, do not cause a CICS exception trace entry to be made directly. However,they do cause a CICS recovery routine to be invoked, and that, in turn, causes a “recovery” exceptiontrace entry to be made.
User exception trace entriesThe EXCEPTION option on the EXEC CICS ENTER TRACENUM command enables user programs to writea trace entry to the trace destinations, even when the main user trace flag is off. User exception traceentries are always written to the internal trace table (even if internal tracing is set off), but are written toother destinations only if they are active.
The user exception trace entries CICS writes are identified by the character string *EXCU in any formattedtrace output produced by CICS utility programs. For example, an application program exception traceentry generated by an EXEC CICS ENTER TRACENUM() EXCEPTION command appears in formatted traceoutput as:
USER *EXCU - APPLICATION-PROGRAM-EXCEPTION
If you use the exit programming interface (XPI) trace control function to write user trace entries, you canuse the DATA1 block descriptor to indicate whether the entry is an exception trace entry. Enter the literal
80 CICS TS for z/OS: Troubleshooting CICS
‘USEREXC’ in the DATA1 field on the DFHTRPTX TRACE_PUT call to identify an exception trace entry. Thisis interpreted by the trace formatting utility program as follows:
USER *EXCU - USER-EXIT-PROGRAM-EXCEPTION
See The user exit programming interface (XPI) for programming information about XPI trace controlfunction.
Program check and abend tracingProgram check and abend tracing is carried out by kernel domain. The kernel records information aboutprogram checks and abends, including details of the registers and the PSW at the time of failure.
You cannot format the program check and abend trace information directly, but you get a summaryof its contents in a formatted CICS system dump when you specify dump formatting keyword KE. Theinformation is provided in the form of a storage report for each task that has had a program check or anabend during the current run of CICS.
An example of such a storage report is given in Figure 15 on page 121.
z/OS Communications Server exit tracingz/OS Communications Server SNA exit tracing gives you a way of tracing SNA requests made from CICS.
You can control it online, using transaction CETR. See Figure 2 on page 85 for an illustration of thescreen you need to use.
When CICS issues an SNA request, SNA services the request asynchronously and CICS continuesexecuting. When SNA has finished with the request, it returns control to CICS by driving a CICS SNAexit. Every such exit contains a trace point, and if CICS SNA exit tracing is active, a trace entry is written tothe GTF trace data set. GTF tracing must be active, but you do not need to start it explicitly from CICS. It isenough to start SNA exit tracing from the CETR transaction and terminal trace panel.
Note: The GTF trace data set can receive trace entries from a variety of jobs running in different addressspaces. You need to identify the trace entries that have been made from the CICS region that interestsyou. You can do this by looking at the job name that precedes every trace entry in the formatted output.
You can use this type of tracing in any of the cases where you might want to use SNA buffer tracing, butit has the advantage of being part of CICS and, therefore, controllable from CICS. This means that you donot need a good understanding of SNA system programming to be able to use it. CICS SNA exit tracingalso has the advantage of tracing some important CICS data areas relating to SNA requests, which mightbe useful for diagnosing problems.
Controlling CICS z/OS Communications Server exit tracingYou can turn CICS z/OS Communications Server SNA exit tracing on and off using the CETR transaction.You can specify tracing for just a single terminal, or for all the terminals in the SNA network. However, youcannot select which CICS exits are to be traced. Whenever CICS Communications Server exit tracing isrunning, you get a trace entry every time a CICS exit is driven by Communications Server.
If you select “normal” CICS tracing for the affected terminals at the same time as you have CICSCommunications Server exit tracing running, you can then correlate CICS activities more easily with theasynchronous processing done by Communications Server.
If you must turn on CICS Communications Server exit tracing in an application owning region (AOR) whileyou are signed-on to a terminal in a terminal owning region (TOR), follow these steps:
1. Invoke CETR on the AOR.2. Press PF5 to call up the CETR transaction and terminal trace screen.3. Enter the APPLID of the TOR in the NETNAME field.4. Complete other fields as required.
Chapter 5. Diagnostic tools and information 81
5. Press Enter.
CICS Communications Server trace entries are always written to the GTF trace data set, and you canformat them in the usual way. See “Formatting and interpreting trace entries” on page 91 for moreinformation. Direct all “normal” CICS tracing to the GTF trace destination as well, so you get the regulartrace entries and the CICS Communications Server exit trace entries in sequence in a single data set. Ifyou send the normal tracing to another destination, you get only the isolated traces from the exit moduleswith no idea of related CICS activity.
Interpreting CICS z/OS Communications Server exit trace entriesCICS z/OS Communications Server exit trace entries can be identified by their trace point IDs, which are inthe range AP FC00 through AP FCFF. Not all the values in the range are used.
The format of the trace entries is similar to that shown in “Interpreting extended-format CICS systemtrace entries” on page 92. The interpretation string contains the netname of the terminal to whichthe trace entry relates, if the trace entry was made from a terminal-specific trace point. This makes iteasy to identify the terminal associated with the Communications Server request. The trace entries alsocontain data from one or more selected CICS data fields, for example from the TCTTE. For guidance oninterpreting the data values you might find there, see Trace entries overview.
z/OS Communications Server buffer tracingUse z/OS Communications Server (VTAM) buffer trace to investigate terminal incorrect output errors in aVTAM environment. For example, z/OS Communications Server SNA buffer tracing enables you to look atall the data that is passed between logical units on an SNA communication link. The trace entries, whichinclude the netname of the terminal to which they relate, are made to the GTF trace data set. If you wantto send “normal” CICS trace entries there, you can rationalize the activities of CICS with the asynchronousactivities of SNA.Starting trace
Step 1. Start GTF trace under MVSEnter the following MVS commands:
S GTF.identifierR yy,TRACE=USRP,JOBNAMEPR yy,USR=(F6C,FF1,FE1,FEF),JOBNAME=cicsjob,ENDR yy,U
where yy is the number of the message.
User trace ID F6C is for CICS trace, FF1 is for VTAM buffer trace (user or API component), FE1 isfor VTAM internal trace, and FEF is for VTAM buffer trace (TSC component). For a full list of traceoptions, see GTF trace options in the z/OS MVS Diagnosis: Tools and Service Aids guide.
Step 2. Turn on VTAM buffer trace and VTAM internal traceEnter the following MVS command:
F NET,TRACE,TYPE=BUF,ID=applid,AMT=FULL,E F NET,TRACE,TYPE=VTAM,MODE=EXT,OPT=(API,PIU,MSG,SSCP)
where applid is the CICS applid.
Re-create the failure or problem.
Stopping trace
1. Enter the following MVS commands to turn off VTAM trace:
F NET,NOTRACE,TYPE=VTAM,OPT=ENDF NET,NOTRACE,TYPE=BUF,ID=applid
2. Enter MVS command Stop identifier to stop GTF trace. For instructions, see Stopping GTF in thez/OS MVS Diagnosis: Tools and Service Aids Guide.
82 CICS TS for z/OS: Troubleshooting CICS
Formatting traceUse IPCS with the GTFTRACE option to format the trace. For example, enter the following from IPCS:
1. Enter 0 to display the Defaults panel.2. Enter the trace dataset name:
Source ==> DSNAME('trace.dataset.name')
3. Enter =6 to display the Command panel.4. Enter one of the following commands:
• To format all trace:
==> GTFTRACE USR(ALL)
• ==> GTFTRACE JOBNAME(cicsjob) USR(F6C)
• ==> GTFTRACE USR(F6C,FF1,FE1,FEF)
• To format VTAM TSC trace:
==> GTFTRACE USR(TPIO)
Interpreting traceSee VTAM trace record formats for help.
Selecting tracing by transactionFor each transaction, you can specify whether standard tracing or special tracing is to be done, or whethertracing is to be suppressed for that transaction altogether.
About this taskFor each component, you can specify two sets of trace level attributes. The trace level attributes definethe trace point IDs to be traced for that component when standard task tracing is being done and whenspecial task tracing is being done, respectively.
If you are running a test region, you probably have background tracing most of the time. In this case, thedefault tracing options (standard tracing for all transactions, and level-1 trace points only in the standardset for all components) probably suffice. All you need do is to enable the required trace destinations andset up any related tracing options. Details are given in “Setting trace destinations and tracing status” onpage 89.
For a production system, background tracing might incur an unacceptable processing overhead. If youfind this to be so, you are recommended to set up tracing so that exception traces only are recorded on anauxiliary trace data set. There need be no other tracing overhead, and you can be sure that the exceptiontrace will be preserved even when the event invoking the trace does not cause a system dump to betaken. For details, see “CICS exception tracing” on page 80.
When specific problems arise, you can set up special tracing so you can focus on just the relevant tasksand components. Use this procedure to specify the tracing you need:
Procedure1. If you believe that specific tasks are involved in the problem, use special tracing:
• When the problem is associated with a non-terminal task, or is associated with particulartransactions, select special tracing for each suspect transaction.
• When the problem is associated with particular terminals, select special tracing for each suspectterminal.
2. If you believe that specific components are implicated in the problem:
Chapter 5. Diagnostic tools and information 83
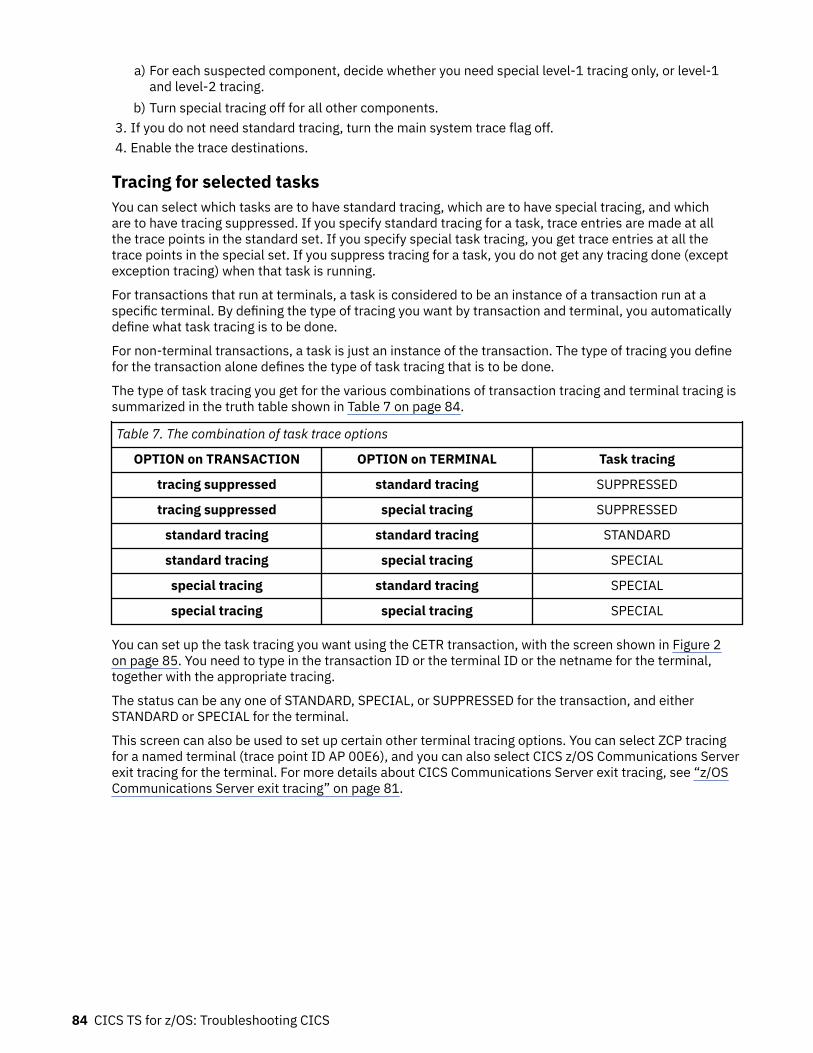
a) For each suspected component, decide whether you need special level-1 tracing only, or level-1and level-2 tracing.
b) Turn special tracing off for all other components.3. If you do not need standard tracing, turn the main system trace flag off.4. Enable the trace destinations.
Tracing for selected tasksYou can select which tasks are to have standard tracing, which are to have special tracing, and whichare to have tracing suppressed. If you specify standard tracing for a task, trace entries are made at allthe trace points in the standard set. If you specify special task tracing, you get trace entries at all thetrace points in the special set. If you suppress tracing for a task, you do not get any tracing done (exceptexception tracing) when that task is running.
For transactions that run at terminals, a task is considered to be an instance of a transaction run at aspecific terminal. By defining the type of tracing you want by transaction and terminal, you automaticallydefine what task tracing is to be done.
For non-terminal transactions, a task is just an instance of the transaction. The type of tracing you definefor the transaction alone defines the type of task tracing that is to be done.
The type of task tracing you get for the various combinations of transaction tracing and terminal tracing issummarized in the truth table shown in Table 7 on page 84.
Table 7. The combination of task trace options
OPTION on TRANSACTION OPTION on TERMINAL Task tracing
tracing suppressed standard tracing SUPPRESSED
tracing suppressed special tracing SUPPRESSED
standard tracing standard tracing STANDARD
standard tracing special tracing SPECIAL
special tracing standard tracing SPECIAL
special tracing special tracing SPECIAL
You can set up the task tracing you want using the CETR transaction, with the screen shown in Figure 2on page 85. You need to type in the transaction ID or the terminal ID or the netname for the terminal,together with the appropriate tracing.
The status can be any one of STANDARD, SPECIAL, or SUPPRESSED for the transaction, and eitherSTANDARD or SPECIAL for the terminal.
This screen can also be used to set up certain other terminal tracing options. You can select ZCP tracingfor a named terminal (trace point ID AP 00E6), and you can also select CICS z/OS Communications Serverexit tracing for the terminal. For more details about CICS Communications Server exit tracing, see “z/OSCommunications Server exit tracing” on page 81.
84 CICS TS for z/OS: Troubleshooting CICS
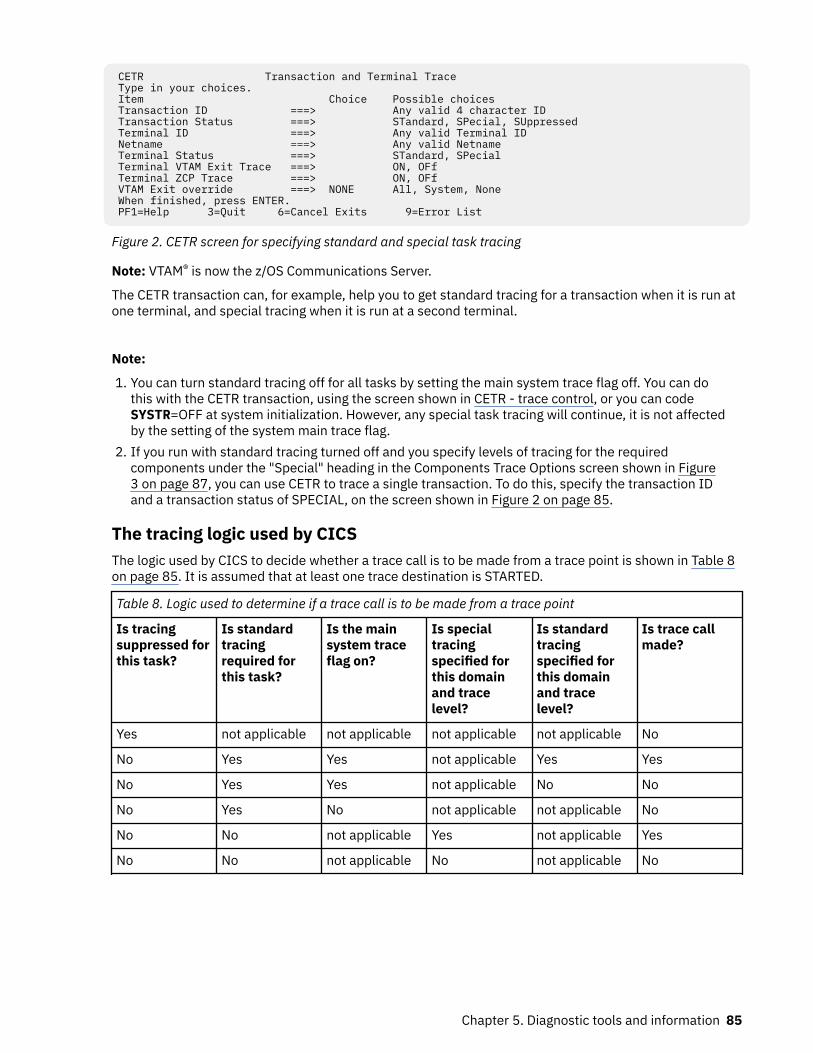
CETR Transaction and Terminal Trace Type in your choices. Item Choice Possible choices Transaction ID ===> Any valid 4 character ID Transaction Status ===> STandard, SPecial, SUppressed Terminal ID ===> Any valid Terminal ID Netname ===> Any valid Netname Terminal Status ===> STandard, SPecial Terminal VTAM Exit Trace ===> ON, OFf Terminal ZCP Trace ===> ON, OFf VTAM Exit override ===> NONE All, System, None When finished, press ENTER. PF1=Help 3=Quit 6=Cancel Exits 9=Error List
Figure 2. CETR screen for specifying standard and special task tracing
Note: VTAM® is now the z/OS Communications Server.
The CETR transaction can, for example, help you to get standard tracing for a transaction when it is run atone terminal, and special tracing when it is run at a second terminal.
Note:
1. You can turn standard tracing off for all tasks by setting the main system trace flag off. You can dothis with the CETR transaction, using the screen shown in CETR - trace control, or you can codeSYSTR=OFF at system initialization. However, any special task tracing will continue, it is not affectedby the setting of the system main trace flag.
2. If you run with standard tracing turned off and you specify levels of tracing for the requiredcomponents under the "Special" heading in the Components Trace Options screen shown in Figure3 on page 87, you can use CETR to trace a single transaction. To do this, specify the transaction IDand a transaction status of SPECIAL, on the screen shown in Figure 2 on page 85.
The tracing logic used by CICSThe logic used by CICS to decide whether a trace call is to be made from a trace point is shown in Table 8on page 85. It is assumed that at least one trace destination is STARTED.
Table 8. Logic used to determine if a trace call is to be made from a trace point
Is tracingsuppressed forthis task?
Is standardtracingrequired forthis task?
Is the mainsystem traceflag on?
Is specialtracingspecified forthis domainand tracelevel?
Is standardtracingspecified forthis domainand tracelevel?
Is trace callmade?
Yes not applicable not applicable not applicable not applicable No
No Yes Yes not applicable Yes Yes
No Yes Yes not applicable No No
No Yes No not applicable not applicable No
No No not applicable Yes not applicable Yes
No No not applicable No not applicable No
Chapter 5. Diagnostic tools and information 85
Selecting tracing by componentYou need to decide for each component the trace levels to be used for both standard and special tracing.You can define this either during system initialization or online using the CETR transaction.
About this task“Component names and abbreviations” on page 87 lists the components for which you can select tracelevels for standard and special tracing. You can reference this list online through CETR, by pressing PF1on the component screen (see Figure 3 on page 87).
There are special considerations for the following CICS domains and their corresponding componentcodes:AP (Application domain)
The component codes BF, BM, BR, CP, DC, DI, EC, EI, FC, IC, IS, KC, PC, RI, SC, SZ, TC, TD, TS, UE,WB, and WU are either entirely or partly subcomponents of the AP domain. The corresponding traceentries are produced with a point ID of AP nnnn. For example, trace point AP 0471 is a file controllevel-1 trace point and AP 0472 is a file control level-2 trace point. These trace points are producedonly if the trace setting for the FC component is “(1,2)” or “ALL”. The component code AP is used fortrace points from the AP domain that do not fall into any of the subcomponent areas listed above.
MP (Managed platform domain)In the Managed platform component (MP), one level of tracing, level 3, is intended for IBM fieldengineering staff. This trace level modifies the internal MP operation as follows:MP level 3 trace
All updates to CICS Policy threshold counters are traced.A significant performance overhead is introduced into your CICS system if this managed platformtrace level is selected. Specifying MP =ALL activates MP trace levels 1, 2, and 3.
SM (Storage manager domain)In the storage manager component (SM), two levels of tracing, level 3 and level 4, are intended forIBM field engineering staff. These trace levels take effect only if specified in system initializationparameters and modify the internal SM operation for CICS subpools as follows:SM level 3 trace
The quickcell mechanism is deactivated. Every CICS subpool, regardless of quickcellingrequirements, will issue domain calls for getmain and freemain services, and these calls will betraced.
SM level 4 traceSubpool element chaining on every CICS subpool is forced. Every CICS subpool, regardless ofelement chaining requirements, will use element chaining.
A significant performance overhead is introduced into your CICS system if these storage managertrace levels are selected. Specifying SM=ALL activates SM trace levels 1, 2, 3, and 4.
Defining component tracing at system initializationYou can code any of the following parameters to define component tracing at CICS system initializationtime:
• SPCTR system initialization parameter, to indicate the level of special tracing required for CICS as awhole.
• SPCTRxx, where xx is one of the two-character component identifiers that specify the level of specialtracing you require for a particular CICS component (see Component names and abbreviations).
• STNTR system initialization parameter, to indicate the level of standard tracing required for CICS as awhole.
• STNTRxx system initialization parameter, where xx is one of the two-character component identifiersthat specify the level of standard tracing you require for a particular CICS component (see Componentnames and abbreviations).
86 CICS TS for z/OS: Troubleshooting CICS
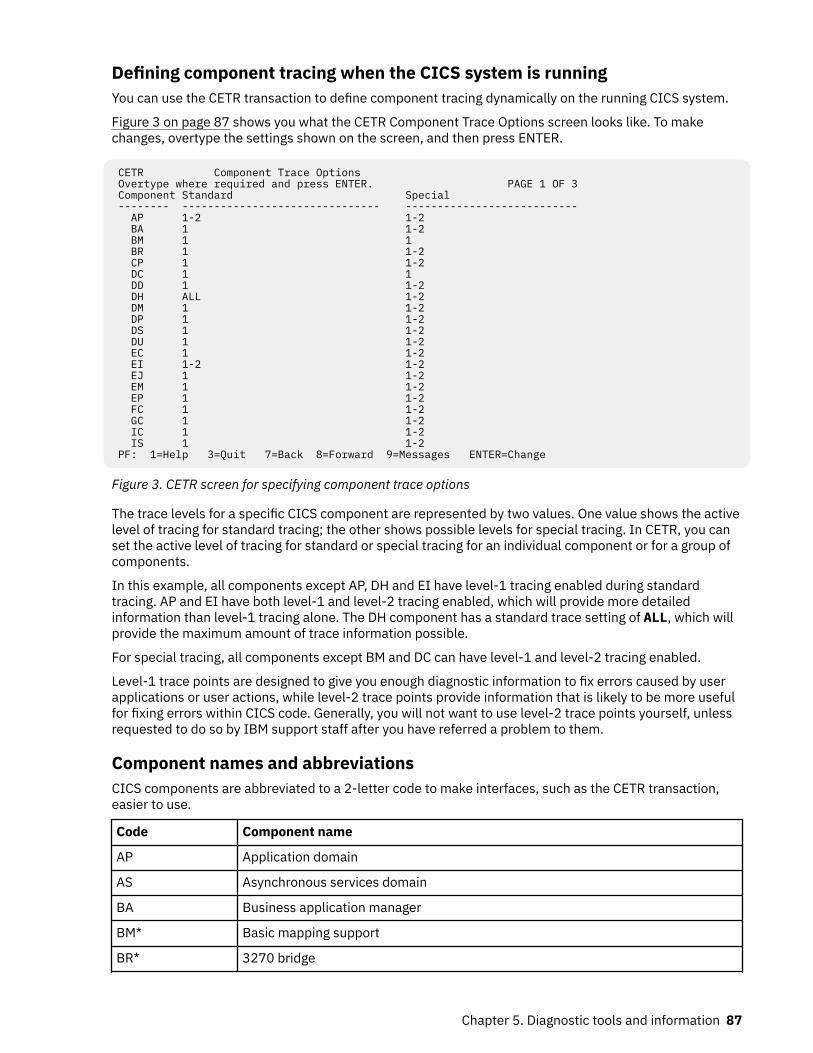
Defining component tracing when the CICS system is runningYou can use the CETR transaction to define component tracing dynamically on the running CICS system.
Figure 3 on page 87 shows you what the CETR Component Trace Options screen looks like. To makechanges, overtype the settings shown on the screen, and then press ENTER.
CETR Component Trace Options Overtype where required and press ENTER. PAGE 1 OF 3 Component Standard Special -------- ------------------------------- --------------------------- AP 1-2 1-2 BA 1 1-2 BM 1 1 BR 1 1-2 CP 1 1-2 DC 1 1 DD 1 1-2 DH ALL 1-2 DM 1 1-2 DP 1 1-2 DS 1 1-2 DU 1 1-2 EC 1 1-2 EI 1-2 1-2 EJ 1 1-2 EM 1 1-2 EP 1 1-2 FC 1 1-2 GC 1 1-2 IC 1 1-2 IS 1 1-2 PF: 1=Help 3=Quit 7=Back 8=Forward 9=Messages ENTER=Change
Figure 3. CETR screen for specifying component trace options
The trace levels for a specific CICS component are represented by two values. One value shows the activelevel of tracing for standard tracing; the other shows possible levels for special tracing. In CETR, you canset the active level of tracing for standard or special tracing for an individual component or for a group ofcomponents.
In this example, all components except AP, DH and EI have level-1 tracing enabled during standardtracing. AP and EI have both level-1 and level-2 tracing enabled, which will provide more detailedinformation than level-1 tracing alone. The DH component has a standard trace setting of ALL, which willprovide the maximum amount of trace information possible.
For special tracing, all components except BM and DC can have level-1 and level-2 tracing enabled.
Level-1 trace points are designed to give you enough diagnostic information to fix errors caused by userapplications or user actions, while level-2 trace points provide information that is likely to be more usefulfor fixing errors within CICS code. Generally, you will not want to use level-2 trace points yourself, unlessrequested to do so by IBM support staff after you have referred a problem to them.
Component names and abbreviationsCICS components are abbreviated to a 2-letter code to make interfaces, such as the CETR transaction,easier to use.
Code Component name
AP Application domain
AS Asynchronous services domain
BA Business application manager
BM* Basic mapping support
BR* 3270 bridge
Chapter 5. Diagnostic tools and information 87
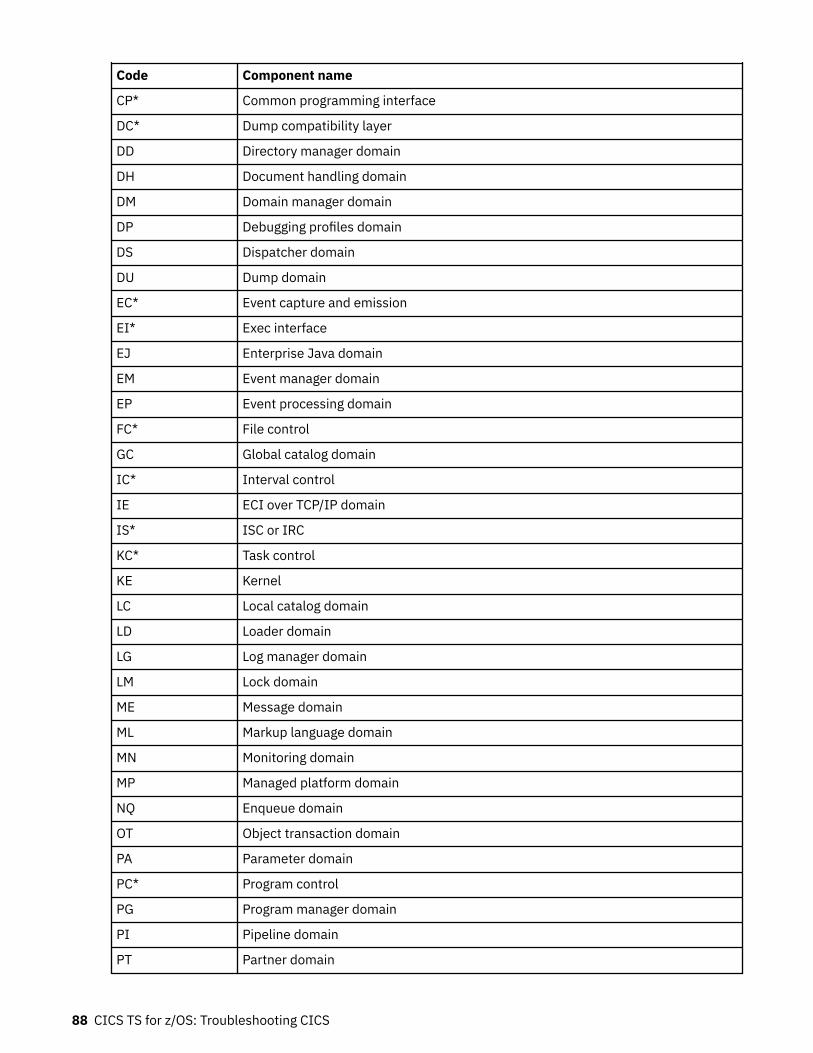
Code Component name
CP* Common programming interface
DC* Dump compatibility layer
DD Directory manager domain
DH Document handling domain
DM Domain manager domain
DP Debugging profiles domain
DS Dispatcher domain
DU Dump domain
EC* Event capture and emission
EI* Exec interface
EJ Enterprise Java domain
EM Event manager domain
EP Event processing domain
FC* File control
GC Global catalog domain
IC* Interval control
IE ECI over TCP/IP domain
IS* ISC or IRC
KC* Task control
KE Kernel
LC Local catalog domain
LD Loader domain
LG Log manager domain
LM Lock domain
ME Message domain
ML Markup language domain
MN Monitoring domain
MP Managed platform domain
NQ Enqueue domain
OT Object transaction domain
PA Parameter domain
PC* Program control
PG Program manager domain
PI Pipeline domain
PT Partner domain
88 CICS TS for z/OS: Troubleshooting CICS
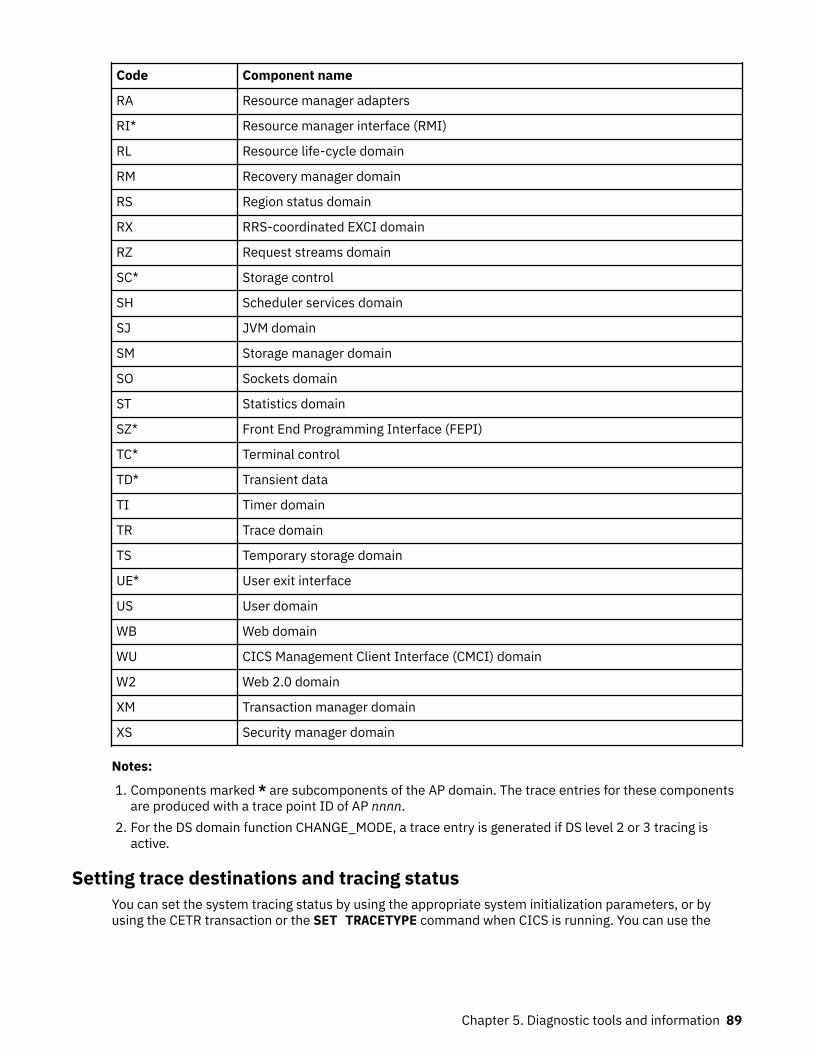
Code Component name
RA Resource manager adapters
RI* Resource manager interface (RMI)
RL Resource life-cycle domain
RM Recovery manager domain
RS Region status domain
RX RRS-coordinated EXCI domain
RZ Request streams domain
SC* Storage control
SH Scheduler services domain
SJ JVM domain
SM Storage manager domain
SO Sockets domain
ST Statistics domain
SZ* Front End Programming Interface (FEPI)
TC* Terminal control
TD* Transient data
TI Timer domain
TR Trace domain
TS Temporary storage domain
UE* User exit interface
US User domain
WB Web domain
WU CICS Management Client Interface (CMCI) domain
W2 Web 2.0 domain
XM Transaction manager domain
XS Security manager domain
Notes:
1. Components marked * are subcomponents of the AP domain. The trace entries for these componentsare produced with a trace point ID of AP nnnn.
2. For the DS domain function CHANGE_MODE, a trace entry is generated if DS level 2 or 3 tracing isactive.
Setting trace destinations and tracing statusYou can set the system tracing status by using the appropriate system initialization parameters, or byusing the CETR transaction or the SET TRACETYPE command when CICS is running. You can use the
Chapter 5. Diagnostic tools and information 89
CETR transaction and SET TRACETYPE command to make changes in response to contingencies as theyarise.
About this taskThere are four possible destinations for trace entries in CICS:
• The internal trace table• The auxiliary trace data sets• The MVS generalized trace facility (GTF) data sets• The JVM server trace file in z/OS Unix System Services
You can select any combination of tracing, based on these factors:
• The characteristics of the various types of CICS tracing• The amount of trace data that you need to capture• Whether you want to integrate CICS tracing with tracing done by other programs
For information about the different trace destinations, see “Trace destinations” on page 78.
Procedure• To set up the tracing status at system initialization, use the following system initialization parameters:
– AUXTR, to specify whether auxiliary trace is to be on or off at CICS startup. – AUXTRSW, to specify whether or not automatic switching takes place for auxiliary trace data sets
when they are full. – GTFTR, to specify whether CICS is to use GTF as a destination for CICS trace data. – INTTR, to specify whether internal tracing is to be on or off at CICS startup. – SYSTR, to set the main system trace flag on or off at CICS startup.– TRTABSZ, to specify the size of the internal trace table.– TRTRANSZ, to specify the size of the transaction dump trace table, which is the copy of the internal
trace table that CICS makes in the event of a transaction dump.– USERTR, to set the main user trace flag on or off at CICS startup. This flag must be on if your
applications make user trace calls.• To set the tracing status while CICS is running, use the CETR transaction or the CEMT transaction:
a) If you want to use standard tracing or capture user trace entries from applications, ensure that boththe main system trace flag (SYSTR) and the main user trace flag (USERTR) are set to ON.
If the main system trace flag is OFF, no standard tracing is done at all, even though standard tracingmight be specified for some tasks. Also, any trace call requests in your programs are ignored. Youcan see the role of the main system trace flag in Logic used to determine if a trace call is to be madefrom a trace point.
b) If you want to direct regular tracing explicitly to the internal trace table, set internal tracing statusto STARTED.The internal trace table is used as a buffer for the other trace destinations, so it always containsthe most recent trace entry if at least one trace destination is STARTED. It is also used as thedestination for exception trace entries.
c) To use GTF tracing, set the GTF trace status to STARTED. Ensure that the GTF trace data set isdefined to MVS.Be aware that no error condition is reported if the CICS GTF status is started but GTF tracinghas not been started under MVS. If this happens, the trace entries are not written. To write traceentries, MVS GTF trace must be started with the TRACE=USR option before CICS GTF trace isstarted.
90 CICS TS for z/OS: Troubleshooting CICS
d) To start writing entries to the auxiliary trace data sets, set the auxiliary trace status to STARTED.If you have two auxiliary trace data sets, you can use the auxiliary switch to specify the action CICStakes when one data set is full. For an explanation of the actions, see “Auxiliary trace data sets” onpage 79.
e) To start writing JVM server tracing, use the CETR transaction to trace the SJ and AP components.JVM servers do not use auxiliary or GTF tracing. Instead, a small amount of trace is written tothe internal trace table and the rest of the trace is written out to a file in zFS that is unique forthe JVM server. For more information, see Activating and managing tracing for JVM servers inTroubleshooting.
f) To stop internal tracing, GTF tracing, or auxiliary tracing, set their status to STOPPED.For auxiliary tracing, you can also set a status of PAUSED. With this status, CICS stops writingentries to the auxiliary trace data set, but leaves the data set open.
• Alternatively, to set the tracing status while CICS is running, use the SET TRACETYPE command.• To change the size of the internal trace table while CICS is running, use the CETR transaction.
When you change the size of the internal trace table, you lose all of the trace data that was present inthe table at the time of the change. If you want to keep the data and change the size of the table, takea system dump before you make the change.
Formatting and interpreting trace entriesBefore you can look at the trace entries that have been sent to the various trace destinations, you need todo some formatting. The way you do the formatting and printing varies depending on the destination.
Trace formatting optionsYou can specify abbreviated, short, or full trace formatting, to give you varying levels of informationand detail in your output. Typically, abbreviated-format trace gives you one line of trace per entry;short-format provides two lines of trace per entry; full-format provides many lines of trace per entry. Thestructures of the different types of trace entry are described in the sections that follow.
Determining which trace formatting to useMost of the time, the abbreviated trace table is the most useful form of trace formatting, as you canquickly scan many trace entries to locate areas of interest.
However, in error situations, you might require more information than the abbreviated trace can provide.The short trace provides the information that is presented in the abbreviated trace, and, additionally,presents certain items that are presented in the full trace. These are:
• Interpreted parameter list• Return address• Time that the trace entry was written• Time interval between trace entries
These items of information are often very useful in the diagnosis of problems. By selecting the shortformat, you can gain access to this information without having to bear the processing overhead offormatting a full trace, and without having to deal with the mass of information in a full trace.
There may be occasions, however, when you need to look at full format trace entries, to understand morefully the information given in the corresponding abbreviated and short entries, and to be aware of theadditional data supplied with many full trace entries.
For abbreviated and full trace formatting, a trace summary table provides summary information aboutthe trace entries that relate to each task in the system during the time period. The trace summary tableappears at the end of the formatted trace output. Use the table to see the tasks that were traced, and thelocation and number of their trace entries in the trace output. The table also highlights any long time gaps
Chapter 5. Diagnostic tools and information 91
between the trace entries for a task, which can indicate a performance problem, and any exception traceentries for a task. The trace summary table is not produced for short-format trace.
How to format and print trace entriesThe way you do the formatting and printing varies depending on the destination.
The internal trace tableThe internal trace table can be formatted and printed in one of two ways:
1. From a CICS system dump, using the CICS print dump exit, DFHPD730.2. From a transaction dump, using the CICS dump utility program, DFHDU730.
Auxiliary traceAuxiliary trace can be formatted and printed using the CICS trace utility program, DFHTU730. You cancontrol the formatting, and you can select trace entries on the basis of task, terminal, transaction,time frame, trace point ID (single or range), dispatcher task reference, and task-owning domain. Thiscomplements the usefulness of auxiliary trace for capturing large amounts of trace data.
Note: Trace entries can only be formatted selectively by transaction or terminal if the transactionattach entry (point ID XM 1102, XM level-1) for the transaction is included in the trace data set. Thetransaction attach entry will not be written if for example the main system trace flag is switched offand the transaction status is set to special.
For more details of trace utility programs, see Trace utility print program (DFHTUnnn).
GTF traceGTF trace can be formatted and printed with the same sort of selectivity as auxiliary trace, using aCICS-supplied routine with the MVS interactive problem control system (IPCS).
For details, see Using IPCS to print trace records written to GTF.
Interpreting extended-format CICS system trace entriesCICS system trace entries made to the internal trace table, the auxiliary trace data sets, and the GTF tracedata set can all be formatted to give the same type of information.
About this taskThere are two slightly different extended trace entry formats. The short style resembles the format usedin earlier releases of CICS, and gives FIELD A and FIELD B values. The other long style uses a differentformat, described below.
Procedure1. Look at the trace point ID.
This is an identifier that indicates where the trace point is in CICS code. In the case of application (AP)domain, the request type field included in the entry is also needed to uniquely identify the trace point.For all other domains, each trace point has a unique trace point ID.
Its format is always a two-character domain index, showing which domain the trace point is in, then aspace, then a four-digit (two-byte) hexadecimal number identifying the trace point within the domain.
The following are examples of trace point IDs:
AP 00E1 trace point X'00EE' in Application DomainDS 0005 trace point X'0005' in Dispatcher DomainTI 0101 trace point X'0101' in Timer Domain
2. Look at the interpretation string.It shows:
92 CICS TS for z/OS: Troubleshooting CICS
• The module where the trace point is located• The function being performed• Any parameters passed on a call, and any response from a called routine.
3. Look at the standard information string. It shows:
• The task number, which is used to identify a task uniquely for as long as it is in the system. Itprovides a simple way of locating trace entries associated with specific tasks, as follows:
– A five-digit decimal number shows that this is a trace entry for a task with a TCA, the value beingtaken from field TCAKCTTA of the TCA.
– A three-character non-numeric value in this field shows that the trace entry is for a system task.You could, for example, see “III” (initialization), or “TCP” (terminal control).
– A two-character domain index in this field shows that the trace entry is for a task without a TCA.The index identifies the domain that attached the task.
• The kernel task number (KE_NUM), which is the number used by the kernel domain to identify thetask. The same KE_NUM value for the task is shown in the kernel task summary in the formattedsystem dump.
• The time when the trace entry was made. (Note that the GTF trace time is GMT time.) • The interval that elapsed between this and the previous trace entry, in seconds.
The standard information string gives two other pieces of useful information:
• The CICS TCB ID and the address of the MVS TCB (field TCB ) that is in use for this task. This fieldcan help you in comparing a CICS trace with the corresponding MVS trace. As there can be multipleOTE TCBs, the TCB ID for an OTE TCB is in the format ccnnn where cc identifies the type of OTE TCB(e.g. X9, L8 etc.) and nnn is a sequence number identifying which of the OTE TCBs is in use.
• The return address (field RET), passed in Register 14 to a called routine. This field helps by showingwhat invoked the module that is making this trace entry.
4. Read the data fields, that contain information relevant to the function being performed.
For short trace points, these are shown as fixed length (4-byte) FIELD A and FIELD B values in thesame line as the interpretation string. Both the hexadecimal data values and any printable EBCDICcharacters that they represent are shown. Some short trace entries also have a RESOURCE field. Whenprovided, it is usually the name of a resource associated with the request being traced. For example,for program control requests, it is the program name.
For long trace points, 1–7 variable-length data fields can be given. They are shown immediately belowthe standard information line. Any printable EBCDIC characters represented by byte values in the datafields are shown on the right of the trace.
Some of the data fields in the new trace entries contain material intended for use by IBM supportpersonnel and you cannot interpret them directly. However, there is enough information to resolve usererrors and for IBM support personnel to resolve most system errors in the interpretation string for theentry.
Examples of the extended format for short and long trace entriesThe tracing in the AP domain has two different styles of trace entry; the oldest style of trace entry is shortand contains minimal information, whereas the later style of trace entry is long, containing much moreinformation to help with problem determination.
Figure 4 on page 94 shows a trace entry made from a short trace point. Its trace point ID is AP 00E1,corresponding to trace ID X'E1' in old releases of CICS.
Chapter 5. Diagnostic tools and information 93
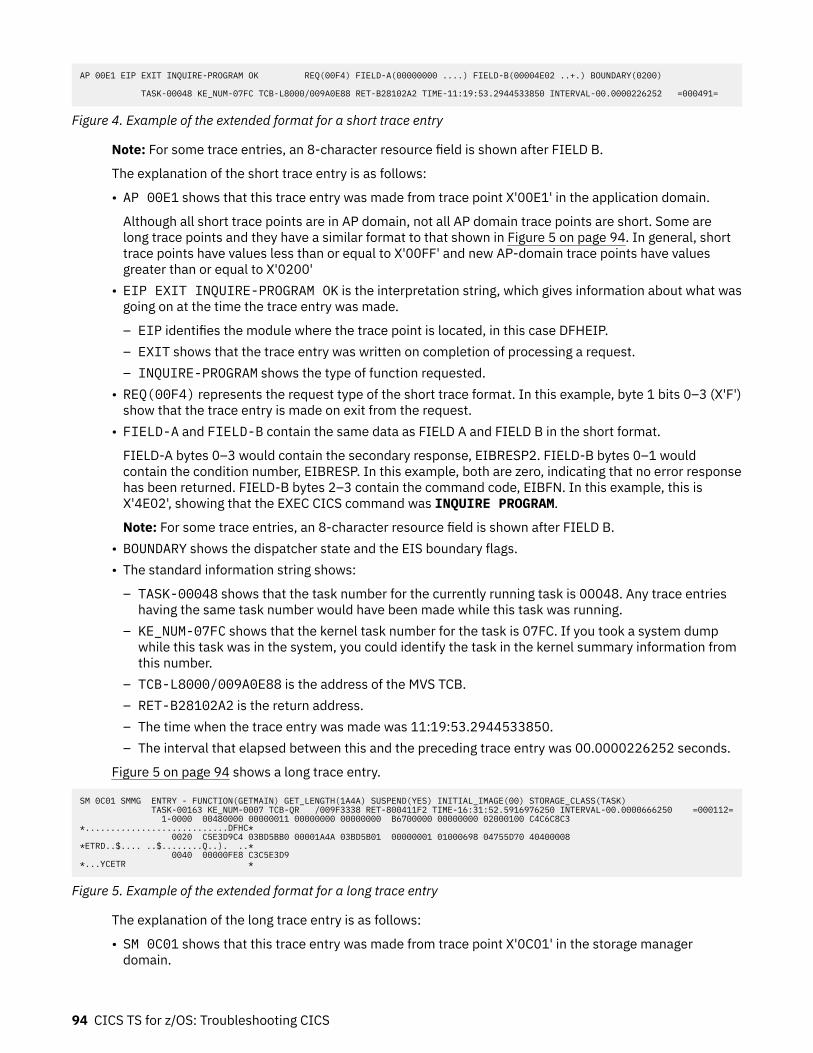
AP 00E1 EIP EXIT INQUIRE-PROGRAM OK REQ(00F4) FIELD-A(00000000 ....) FIELD-B(00004E02 ..+.) BOUNDARY(0200)
TASK-00048 KE_NUM-07FC TCB-L8000/009A0E88 RET-B28102A2 TIME-11:19:53.2944533850 INTERVAL-00.0000226252 =000491=
Figure 4. Example of the extended format for a short trace entry
Note: For some trace entries, an 8-character resource field is shown after FIELD B.
The explanation of the short trace entry is as follows:
• AP 00E1 shows that this trace entry was made from trace point X'00E1' in the application domain.
Although all short trace points are in AP domain, not all AP domain trace points are short. Some arelong trace points and they have a similar format to that shown in Figure 5 on page 94. In general, shorttrace points have values less than or equal to X'00FF' and new AP-domain trace points have valuesgreater than or equal to X'0200'
• EIP EXIT INQUIRE-PROGRAM OK is the interpretation string, which gives information about what wasgoing on at the time the trace entry was made.
– EIP identifies the module where the trace point is located, in this case DFHEIP.– EXIT shows that the trace entry was written on completion of processing a request.– INQUIRE-PROGRAM shows the type of function requested.
• REQ(00F4) represents the request type of the short trace format. In this example, byte 1 bits 0–3 (X'F')show that the trace entry is made on exit from the request.
• FIELD-A and FIELD-B contain the same data as FIELD A and FIELD B in the short format.
FIELD-A bytes 0–3 would contain the secondary response, EIBRESP2. FIELD-B bytes 0–1 wouldcontain the condition number, EIBRESP. In this example, both are zero, indicating that no error responsehas been returned. FIELD-B bytes 2–3 contain the command code, EIBFN. In this example, this isX'4E02', showing that the EXEC CICS command was INQUIRE PROGRAM.
Note: For some trace entries, an 8-character resource field is shown after FIELD B.• BOUNDARY shows the dispatcher state and the EIS boundary flags.• The standard information string shows:
– TASK-00048 shows that the task number for the currently running task is 00048. Any trace entrieshaving the same task number would have been made while this task was running.
– KE_NUM-07FC shows that the kernel task number for the task is 07FC. If you took a system dumpwhile this task was in the system, you could identify the task in the kernel summary information fromthis number.
– TCB-L8000/009A0E88 is the address of the MVS TCB.– RET-B28102A2 is the return address.– The time when the trace entry was made was 11:19:53.2944533850.– The interval that elapsed between this and the preceding trace entry was 00.0000226252 seconds.
Figure 5 on page 94 shows a long trace entry.
SM 0C01 SMMG ENTRY - FUNCTION(GETMAIN) GET_LENGTH(1A4A) SUSPEND(YES) INITIAL_IMAGE(00) STORAGE_CLASS(TASK) TASK-00163 KE_NUM-0007 TCB-QR /009F3338 RET-800411F2 TIME-16:31:52.5916976250 INTERVAL-00.0000666250 =000112= 1-0000 00480000 00000011 00000000 00000000 B6700000 00000000 02000100 C4C6C8C3 *............................DFHC* 0020 C5E3D9C4 03BD5BB0 00001A4A 03BD5B01 00000001 01000698 04755D70 40400008 *ETRD..$.... ..$........Q..). ..* 0040 00000FE8 C3C5E3D9 *...YCETR *
Figure 5. Example of the extended format for a long trace entry
The explanation of the long trace entry is as follows:
• SM 0C01 shows that this trace entry was made from trace point X'0C01' in the storage managerdomain.
94 CICS TS for z/OS: Troubleshooting CICS
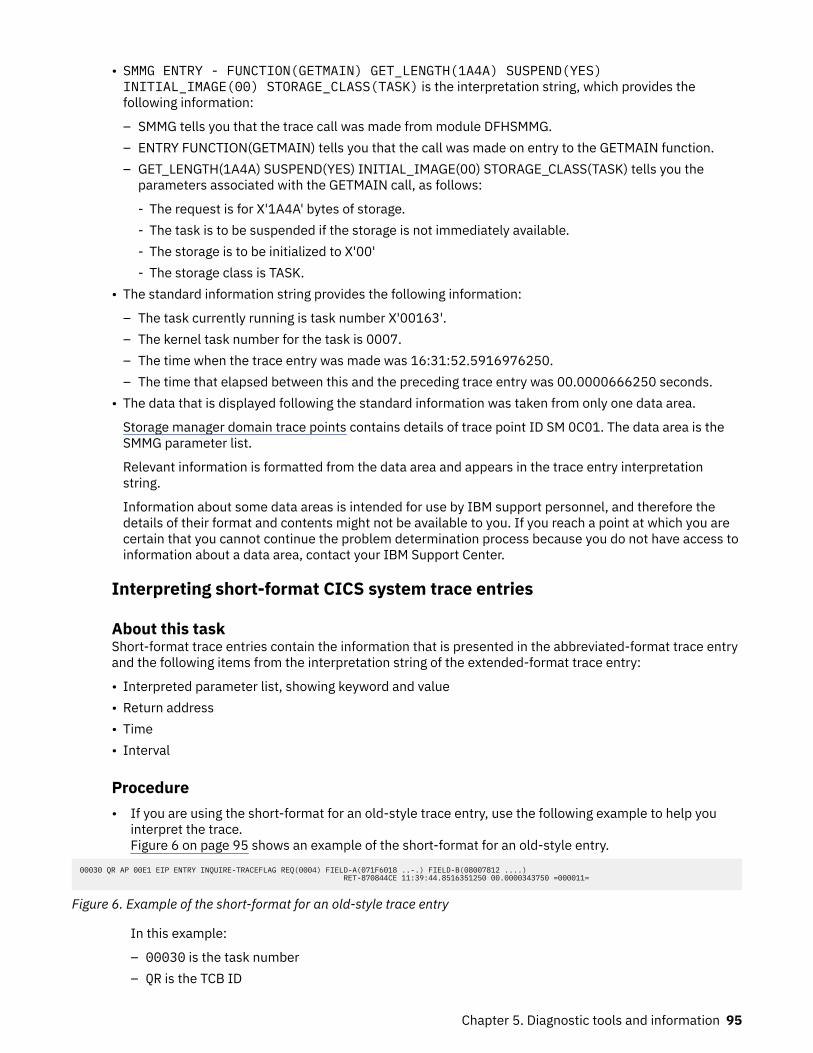
• SMMG ENTRY - FUNCTION(GETMAIN) GET_LENGTH(1A4A) SUSPEND(YES)INITIAL_IMAGE(00) STORAGE_CLASS(TASK) is the interpretation string, which provides thefollowing information:
– SMMG tells you that the trace call was made from module DFHSMMG.– ENTRY FUNCTION(GETMAIN) tells you that the call was made on entry to the GETMAIN function.– GET_LENGTH(1A4A) SUSPEND(YES) INITIAL_IMAGE(00) STORAGE_CLASS(TASK) tells you the
parameters associated with the GETMAIN call, as follows:
- The request is for X'1A4A' bytes of storage.- The task is to be suspended if the storage is not immediately available.- The storage is to be initialized to X'00'- The storage class is TASK.
• The standard information string provides the following information:
– The task currently running is task number X'00163'.– The kernel task number for the task is 0007.– The time when the trace entry was made was 16:31:52.5916976250.– The time that elapsed between this and the preceding trace entry was 00.0000666250 seconds.
• The data that is displayed following the standard information was taken from only one data area.
Storage manager domain trace points contains details of trace point ID SM 0C01. The data area is theSMMG parameter list.
Relevant information is formatted from the data area and appears in the trace entry interpretationstring.
Information about some data areas is intended for use by IBM support personnel, and therefore thedetails of their format and contents might not be available to you. If you reach a point at which you arecertain that you cannot continue the problem determination process because you do not have access toinformation about a data area, contact your IBM Support Center.
Interpreting short-format CICS system trace entries
About this taskShort-format trace entries contain the information that is presented in the abbreviated-format trace entryand the following items from the interpretation string of the extended-format trace entry:
• Interpreted parameter list, showing keyword and value• Return address• Time• Interval
Procedure• If you are using the short-format for an old-style trace entry, use the following example to help you
interpret the trace.Figure 6 on page 95 shows an example of the short-format for an old-style entry.
00030 QR AP 00E1 EIP ENTRY INQUIRE-TRACEFLAG REQ(0004) FIELD-A(071F6018 ..-.) FIELD-B(08007812 ....) RET-870844CE 11:39:44.8516351250 00.0000343750 =000011=
Figure 6. Example of the short-format for an old-style trace entry
In this example:
– 00030 is the task number– QR is the TCB ID
Chapter 5. Diagnostic tools and information 95
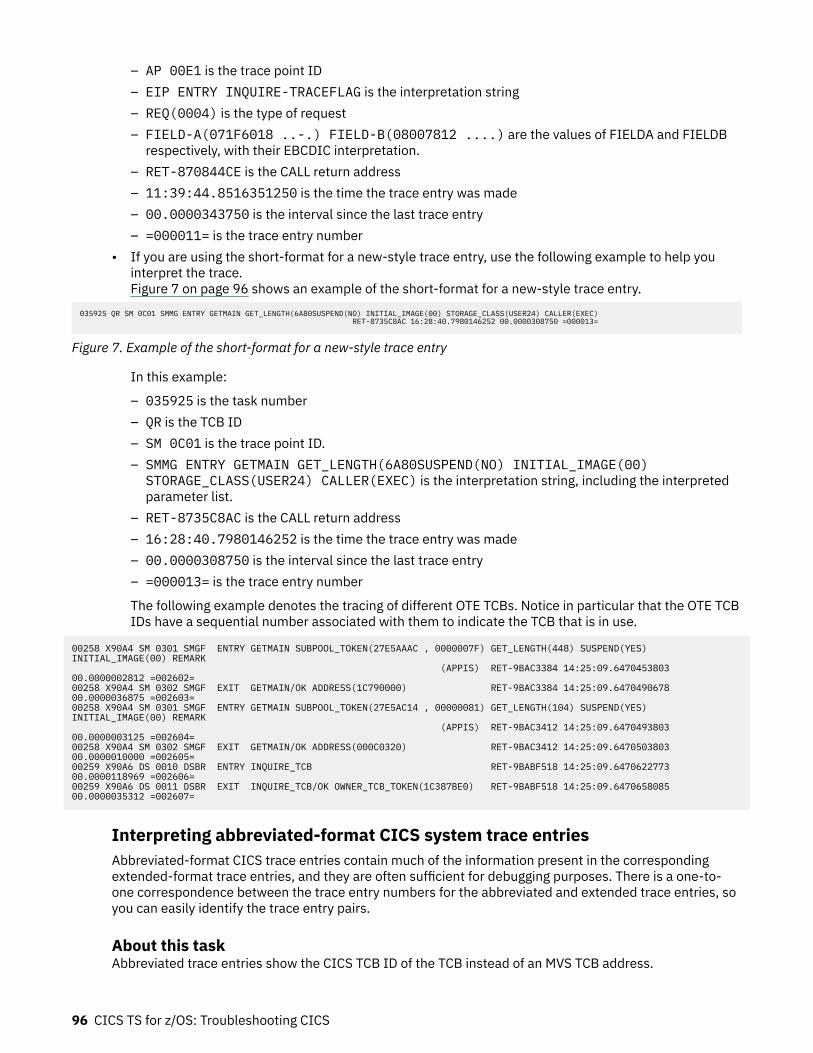
– AP 00E1 is the trace point ID– EIP ENTRY INQUIRE-TRACEFLAG is the interpretation string– REQ(0004) is the type of request– FIELD-A(071F6018 ..-.) FIELD-B(08007812 ....) are the values of FIELDA and FIELDB
respectively, with their EBCDIC interpretation.– RET-870844CE is the CALL return address– 11:39:44.8516351250 is the time the trace entry was made– 00.0000343750 is the interval since the last trace entry– =000011= is the trace entry number
• If you are using the short-format for a new-style trace entry, use the following example to help youinterpret the trace.Figure 7 on page 96 shows an example of the short-format for a new-style trace entry.
035925 QR SM 0C01 SMMG ENTRY GETMAIN GET_LENGTH(6A80SUSPEND(NO) INITIAL_IMAGE(00) STORAGE_CLASS(USER24) CALLER(EXEC) RET-8735C8AC 16:28:40.7980146252 00.0000308750 =000013=
Figure 7. Example of the short-format for a new-style trace entry
In this example:
– 035925 is the task number– QR is the TCB ID– SM 0C01 is the trace point ID.– SMMG ENTRY GETMAIN GET_LENGTH(6A80SUSPEND(NO) INITIAL_IMAGE(00)STORAGE_CLASS(USER24) CALLER(EXEC) is the interpretation string, including the interpretedparameter list.
– RET-8735C8AC is the CALL return address– 16:28:40.7980146252 is the time the trace entry was made– 00.0000308750 is the interval since the last trace entry– =000013= is the trace entry number
The following example denotes the tracing of different OTE TCBs. Notice in particular that the OTE TCBIDs have a sequential number associated with them to indicate the TCB that is in use.
00258 X90A4 SM 0301 SMGF ENTRY GETMAIN SUBPOOL_TOKEN(27E5AAAC , 0000007F) GET_LENGTH(448) SUSPEND(YES) INITIAL_IMAGE(00) REMARK (APPIS) RET-9BAC3384 14:25:09.6470453803 00.0000002812 =002602= 00258 X90A4 SM 0302 SMGF EXIT GETMAIN/OK ADDRESS(1C790000) RET-9BAC3384 14:25:09.6470490678 00.0000036875 =002603= 00258 X90A4 SM 0301 SMGF ENTRY GETMAIN SUBPOOL_TOKEN(27E5AC14 , 00000081) GET_LENGTH(104) SUSPEND(YES) INITIAL_IMAGE(00) REMARK (APPIS) RET-9BAC3412 14:25:09.6470493803 00.0000003125 =002604= 00258 X90A4 SM 0302 SMGF EXIT GETMAIN/OK ADDRESS(000C0320) RET-9BAC3412 14:25:09.6470503803 00.0000010000 =002605= 00259 X90A6 DS 0010 DSBR ENTRY INQUIRE_TCB RET-9BABF518 14:25:09.6470622773 00.0000118969 =002606= 00259 X90A6 DS 0011 DSBR EXIT INQUIRE_TCB/OK OWNER_TCB_TOKEN(1C387BE0) RET-9BABF518 14:25:09.6470658085 00.0000035312 =002607=
Interpreting abbreviated-format CICS system trace entriesAbbreviated-format CICS trace entries contain much of the information present in the correspondingextended-format trace entries, and they are often sufficient for debugging purposes. There is a one-to-one correspondence between the trace entry numbers for the abbreviated and extended trace entries, soyou can easily identify the trace entry pairs.
About this taskAbbreviated trace entries show the CICS TCB ID of the TCB instead of an MVS TCB address.
96 CICS TS for z/OS: Troubleshooting CICS
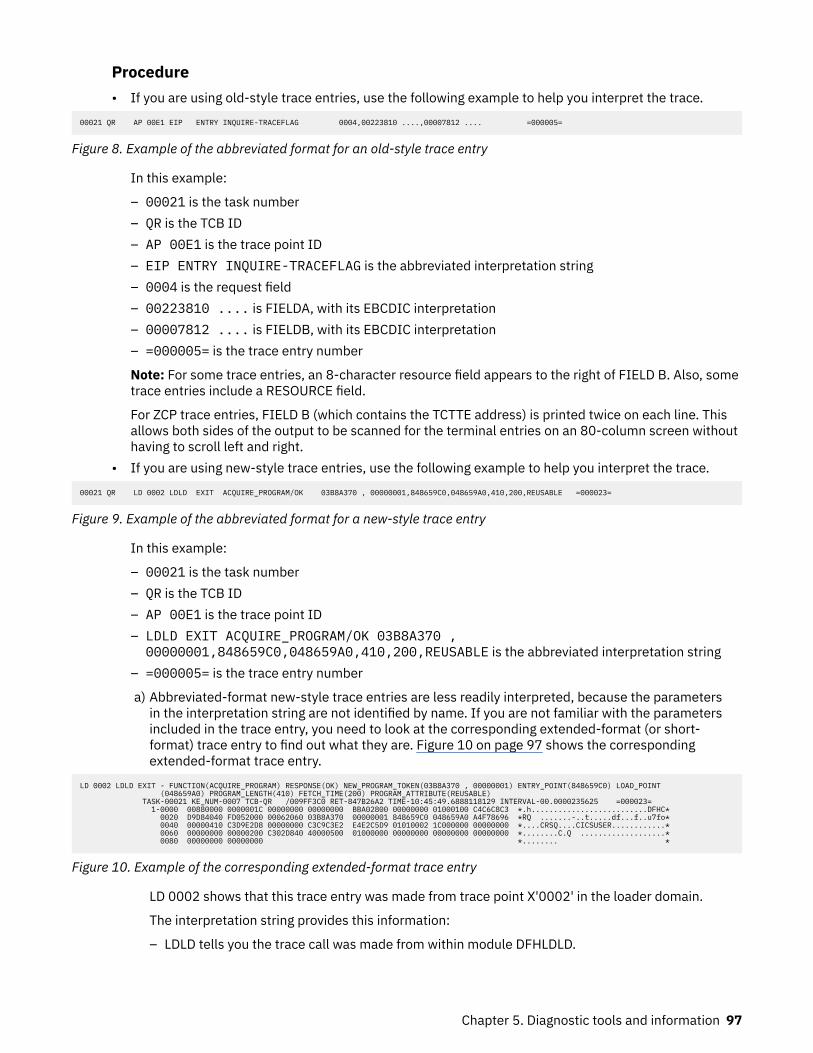
Procedure• If you are using old-style trace entries, use the following example to help you interpret the trace.
00021 QR AP 00E1 EIP ENTRY INQUIRE-TRACEFLAG 0004,00223810 ....,00007812 .... =000005=
Figure 8. Example of the abbreviated format for an old-style trace entry
In this example:
– 00021 is the task number– QR is the TCB ID– AP 00E1 is the trace point ID– EIP ENTRY INQUIRE-TRACEFLAG is the abbreviated interpretation string– 0004 is the request field– 00223810 .... is FIELDA, with its EBCDIC interpretation– 00007812 .... is FIELDB, with its EBCDIC interpretation– =000005= is the trace entry number
Note: For some trace entries, an 8-character resource field appears to the right of FIELD B. Also, sometrace entries include a RESOURCE field.
For ZCP trace entries, FIELD B (which contains the TCTTE address) is printed twice on each line. Thisallows both sides of the output to be scanned for the terminal entries on an 80-column screen withouthaving to scroll left and right.
• If you are using new-style trace entries, use the following example to help you interpret the trace.
00021 QR LD 0002 LDLD EXIT ACQUIRE_PROGRAM/OK 03B8A370 , 00000001,848659C0,048659A0,410,200,REUSABLE =000023=
Figure 9. Example of the abbreviated format for a new-style trace entry
In this example:
– 00021 is the task number– QR is the TCB ID– AP 00E1 is the trace point ID– LDLD EXIT ACQUIRE_PROGRAM/OK 03B8A370 ,00000001,848659C0,048659A0,410,200,REUSABLE is the abbreviated interpretation string
– =000005= is the trace entry number
a) Abbreviated-format new-style trace entries are less readily interpreted, because the parametersin the interpretation string are not identified by name. If you are not familiar with the parametersincluded in the trace entry, you need to look at the corresponding extended-format (or short-format) trace entry to find out what they are. Figure 10 on page 97 shows the correspondingextended-format trace entry.
LD 0002 LDLD EXIT - FUNCTION(ACQUIRE_PROGRAM) RESPONSE(OK) NEW_PROGRAM_TOKEN(03B8A370 , 00000001) ENTRY_POINT(848659C0) LOAD_POINT (048659A0) PROGRAM_LENGTH(410) FETCH_TIME(200) PROGRAM_ATTRIBUTE(REUSABLE) TASK-00021 KE_NUM-0007 TCB-QR /009FF3C0 RET-847B26A2 TIME-10:45:49.6888118129 INTERVAL-00.0000235625 =000023= 1-0000 00880000 0000001C 00000000 00000000 BBA02800 00000000 01000100 C4C6C8C3 *.h..........................DFHC* 0020 D9D84040 FD052000 00062060 03B8A370 00000001 848659C0 048659A0 A4F78696 *RQ .......-..t.....df...f..u7fo* 0040 00000410 C3D9E2D8 00000000 C3C9C3E2 E4E2C5D9 01010002 1C000000 00000000 *....CRSQ....CICSUSER............* 0060 00000000 00000200 C302D840 40000500 01000000 00000000 00000000 00000000 *........C.Q ...................* 0080 00000000 00000000 *........ *
Figure 10. Example of the corresponding extended-format trace entry
LD 0002 shows that this trace entry was made from trace point X'0002' in the loader domain.
The interpretation string provides this information:
– LDLD tells you the trace call was made from within module DFHLDLD.
Chapter 5. Diagnostic tools and information 97
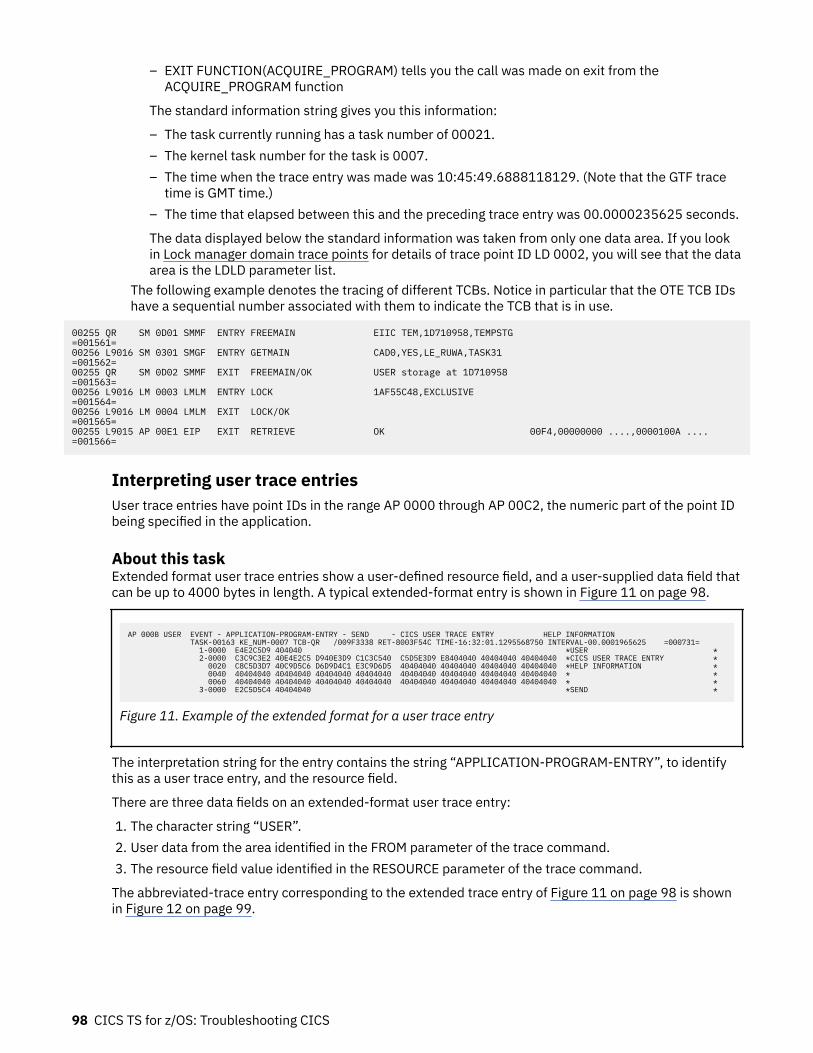
– EXIT FUNCTION(ACQUIRE_PROGRAM) tells you the call was made on exit from theACQUIRE_PROGRAM function
The standard information string gives you this information:
– The task currently running has a task number of 00021.– The kernel task number for the task is 0007.– The time when the trace entry was made was 10:45:49.6888118129. (Note that the GTF trace
time is GMT time.)– The time that elapsed between this and the preceding trace entry was 00.0000235625 seconds.
The data displayed below the standard information was taken from only one data area. If you lookin Lock manager domain trace points for details of trace point ID LD 0002, you will see that the dataarea is the LDLD parameter list.
The following example denotes the tracing of different TCBs. Notice in particular that the OTE TCB IDshave a sequential number associated with them to indicate the TCB that is in use.
00255 QR SM 0D01 SMMF ENTRY FREEMAIN EIIC TEM,1D710958,TEMPSTG =001561=00256 L9016 SM 0301 SMGF ENTRY GETMAIN CAD0,YES,LE_RUWA,TASK31 =001562=00255 QR SM 0D02 SMMF EXIT FREEMAIN/OK USER storage at 1D710958 =001563=00256 L9016 LM 0003 LMLM ENTRY LOCK 1AF55C48,EXCLUSIVE =001564=00256 L9016 LM 0004 LMLM EXIT LOCK/OK =001565=00255 L9015 AP 00E1 EIP EXIT RETRIEVE OK 00F4,00000000 ....,0000100A .... =001566=
Interpreting user trace entriesUser trace entries have point IDs in the range AP 0000 through AP 00C2, the numeric part of the point IDbeing specified in the application.
About this taskExtended format user trace entries show a user-defined resource field, and a user-supplied data field thatcan be up to 4000 bytes in length. A typical extended-format entry is shown in Figure 11 on page 98.
AP 000B USER EVENT - APPLICATION-PROGRAM-ENTRY - SEND - CICS USER TRACE ENTRY HELP INFORMATION TASK-00163 KE_NUM-0007 TCB-QR /009F3338 RET-8003F54C TIME-16:32:01.1295568750 INTERVAL-00.0001965625 =000731= 1-0000 E4E2C5D9 404040 *USER * 2-0000 C3C9C3E2 40E4E2C5 D940E3D9 C1C3C540 C5D5E3D9 E8404040 40404040 40404040 *CICS USER TRACE ENTRY * 0020 C8C5D3D7 40C9D5C6 D6D9D4C1 E3C9D6D5 40404040 40404040 40404040 40404040 *HELP INFORMATION * 0040 40404040 40404040 40404040 40404040 40404040 40404040 40404040 40404040 * * 0060 40404040 40404040 40404040 40404040 40404040 40404040 40404040 40404040 * * 3-0000 E2C5D5C4 40404040 *SEND *
Figure 11. Example of the extended format for a user trace entry
The interpretation string for the entry contains the string “APPLICATION-PROGRAM-ENTRY”, to identifythis as a user trace entry, and the resource field.
There are three data fields on an extended-format user trace entry:
1. The character string “USER”.2. User data from the area identified in the FROM parameter of the trace command.3. The resource field value identified in the RESOURCE parameter of the trace command.
The abbreviated-trace entry corresponding to the extended trace entry of Figure 11 on page 98 is shownin Figure 12 on page 99.
98 CICS TS for z/OS: Troubleshooting CICS
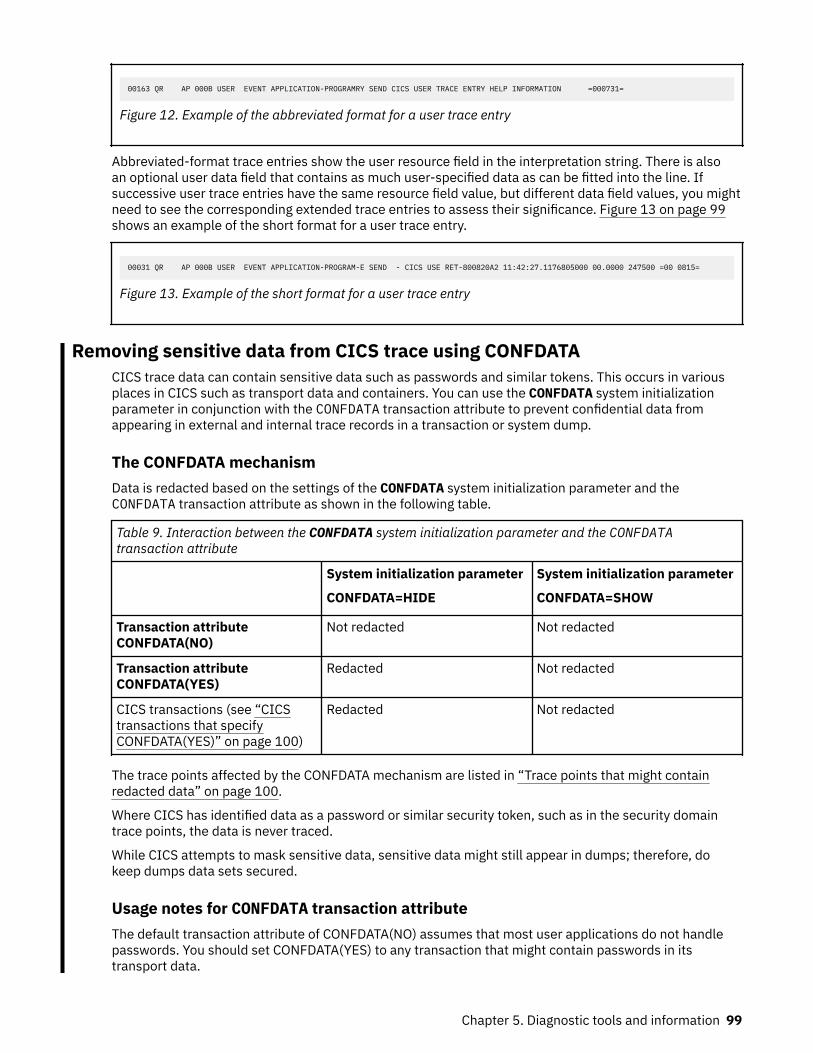
00163 QR AP 000B USER EVENT APPLICATION-PROGRAMRY SEND CICS USER TRACE ENTRY HELP INFORMATION =000731=
Figure 12. Example of the abbreviated format for a user trace entry
Abbreviated-format trace entries show the user resource field in the interpretation string. There is alsoan optional user data field that contains as much user-specified data as can be fitted into the line. Ifsuccessive user trace entries have the same resource field value, but different data field values, you mightneed to see the corresponding extended trace entries to assess their significance. Figure 13 on page 99shows an example of the short format for a user trace entry.
00031 QR AP 000B USER EVENT APPLICATION-PROGRAM-E SEND - CICS USE RET-800820A2 11:42:27.1176805000 00.0000 247500 =00 0815=
Figure 13. Example of the short format for a user trace entry
Removing sensitive data from CICS trace using CONFDATACICS trace data can contain sensitive data such as passwords and similar tokens. This occurs in variousplaces in CICS such as transport data and containers. You can use the CONFDATA system initializationparameter in conjunction with the CONFDATA transaction attribute to prevent confidential data fromappearing in external and internal trace records in a transaction or system dump.
The CONFDATA mechanismData is redacted based on the settings of the CONFDATA system initialization parameter and theCONFDATA transaction attribute as shown in the following table.
Table 9. Interaction between the CONFDATA system initialization parameter and the CONFDATAtransaction attribute
System initialization parameter
CONFDATA=HIDE
System initialization parameter
CONFDATA=SHOW
Transaction attributeCONFDATA(NO)
Not redacted Not redacted
Transaction attributeCONFDATA(YES)
Redacted Not redacted
CICS transactions (see “CICStransactions that specifyCONFDATA(YES)” on page 100)
Redacted Not redacted
The trace points affected by the CONFDATA mechanism are listed in “Trace points that might containredacted data” on page 100.
Where CICS has identified data as a password or similar security token, such as in the security domaintrace points, the data is never traced.
While CICS attempts to mask sensitive data, sensitive data might still appear in dumps; therefore, dokeep dumps data sets secured.
Usage notes for CONFDATA transaction attributeThe default transaction attribute of CONFDATA(NO) assumes that most user applications do not handlepasswords. You should set CONFDATA(YES) to any transaction that might contain passwords in itstransport data.
Chapter 5. Diagnostic tools and information 99
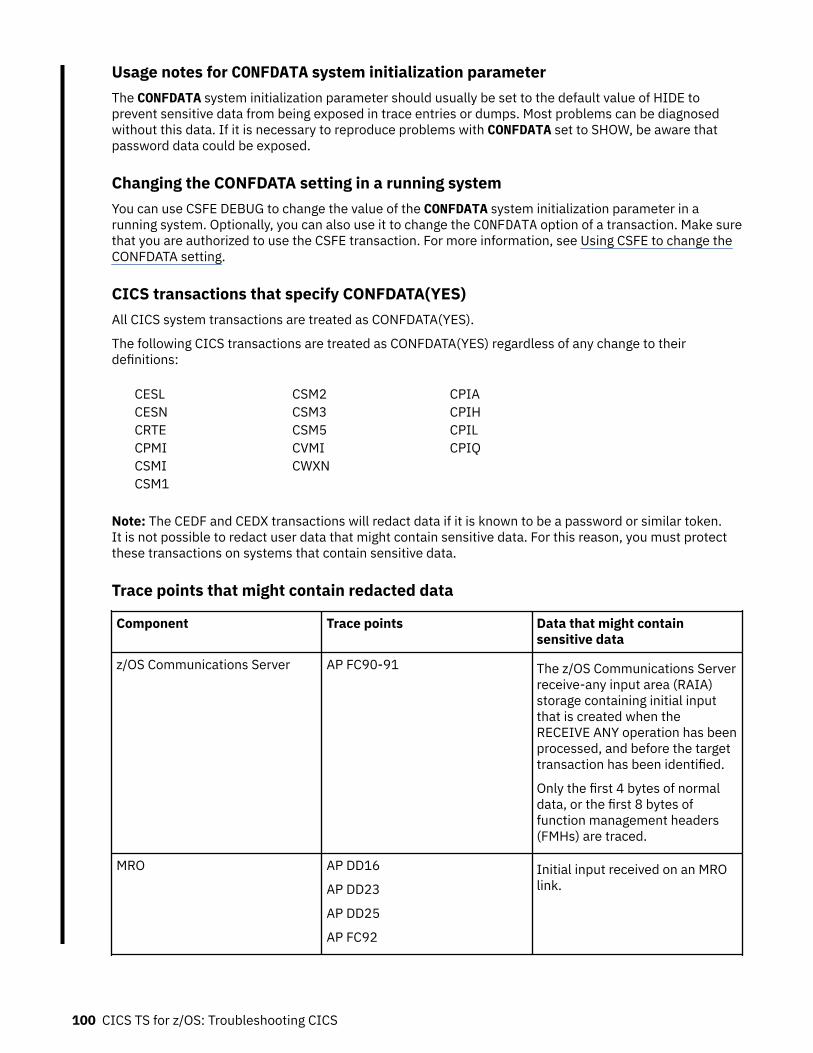
Usage notes for CONFDATA system initialization parameterThe CONFDATA system initialization parameter should usually be set to the default value of HIDE toprevent sensitive data from being exposed in trace entries or dumps. Most problems can be diagnosedwithout this data. If it is necessary to reproduce problems with CONFDATA set to SHOW, be aware thatpassword data could be exposed.
Changing the CONFDATA setting in a running systemYou can use CSFE DEBUG to change the value of the CONFDATA system initialization parameter in arunning system. Optionally, you can also use it to change the CONFDATA option of a transaction. Make surethat you are authorized to use the CSFE transaction. For more information, see Using CSFE to change theCONFDATA setting.
CICS transactions that specify CONFDATA(YES)All CICS system transactions are treated as CONFDATA(YES).
The following CICS transactions are treated as CONFDATA(YES) regardless of any change to theirdefinitions:
CESLCESNCRTECPMICSMICSM1
CSM2CSM3CSM5CVMICWXN
CPIACPIHCPILCPIQ
Note: The CEDF and CEDX transactions will redact data if it is known to be a password or similar token.It is not possible to redact user data that might contain sensitive data. For this reason, you must protectthese transactions on systems that contain sensitive data.
Trace points that might contain redacted data
Component Trace points Data that might containsensitive data
z/OS Communications Server AP FC90-91 The z/OS Communications Serverreceive-any input area (RAIA)storage containing initial inputthat is created when theRECEIVE ANY operation has beenprocessed, and before the targettransaction has been identified.
Only the first 4 bytes of normaldata, or the first 8 bytes offunction management headers(FMHs) are traced.
MRO AP DD16
AP DD23
AP DD25
AP FC92
Initial input received on an MROlink.
100 CICS TS for z/OS: Troubleshooting CICS
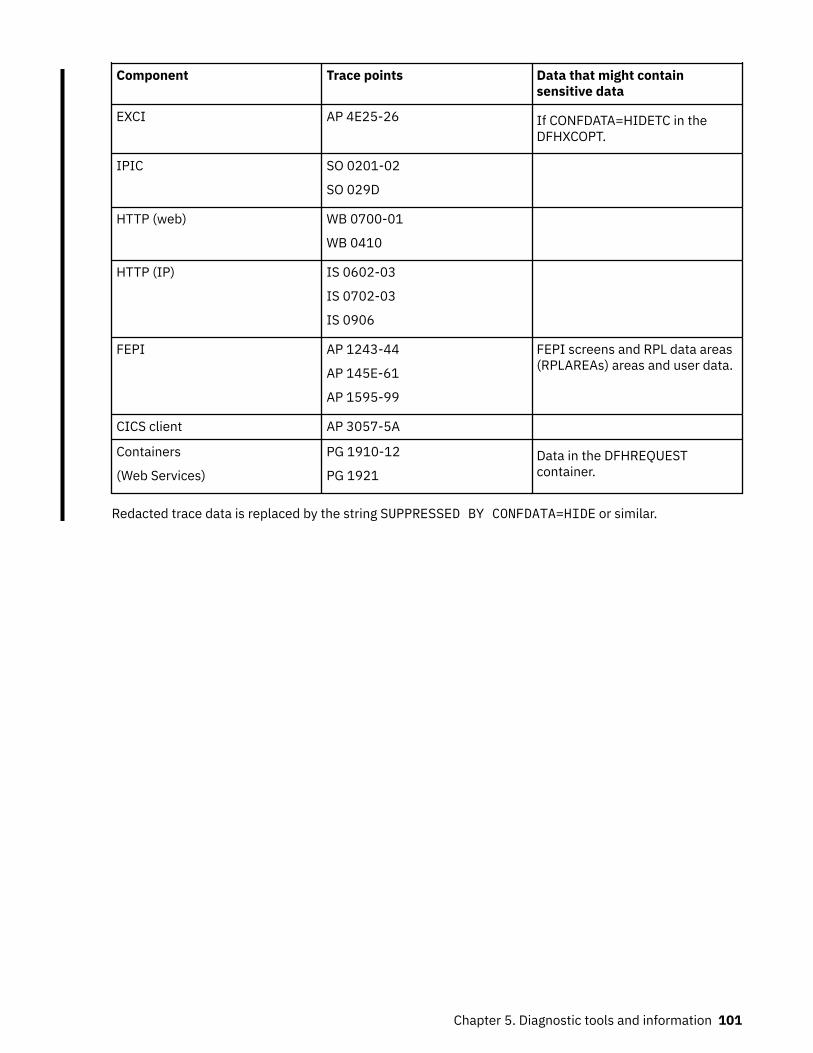
Component Trace points Data that might containsensitive data
EXCI AP 4E25-26 If CONFDATA=HIDETC in theDFHXCOPT.
IPIC SO 0201-02
SO 029D
HTTP (web) WB 0700-01
WB 0410
HTTP (IP) IS 0602-03
IS 0702-03
IS 0906
FEPI AP 1243-44
AP 145E-61
AP 1595-99
FEPI screens and RPL data areas(RPLAREAs) areas and user data.
CICS client AP 3057-5A
Containers
(Web Services)
PG 1910-12
PG 1921Data in the DFHREQUESTcontainer.
Redacted trace data is replaced by the string SUPPRESSED BY CONFDATA=HIDE or similar.
Chapter 5. Diagnostic tools and information 101

102 CICS TS for z/OS: Troubleshooting CICS
Chapter 6. Dealing with the problemFollowing on from classifying your problem, this section describes how to find the cause of problems ineach area.
Dealing with transaction abend codesWhen a CICS transaction abends (ends abnormally), a transaction abend message and an abend codeof four alphanumeric characters are sent to CSMT, the CEMT transient data destination (or your sitereplacement).
This is an example of what the message looks like:DFHAC2006 date time applid Transaction tranid program program name abend primary abcode at termid.
The message contains several vital pieces of information. It identifies the transaction (tranid) thatfailed, and the program (program name) that was being executed when the failure was detected. Mostimportantly, it gives you the abend code (abcode), indicating the nature of the error.
The transaction abend can originate from several places, and the method you use for problemdetermination depends on the source of the abend. The procedures are described in the sections thatfollow. As you go through them, you might like to use the worksheet that is included at the end of thissection to record your findings (“Worksheet for transaction abends” on page 114).
Collecting the evidenceThe evidence you need to investigate the transaction abend should be in the information sent to thevarious transient data queues for error messages, and in the transaction dump.
Procedure1. Check the transaction dump to find information about the transaction abend.
CICS produces a symptom string as part of the transaction dump. The symptom string gives somedetails about the circumstances of the transaction dump. It might show, for example, that the dumpwas taken because the transaction abended with the abend code ASRA. If you refer the problemthat caused the dump to be taken to the IBM Support Center, they can use the symptom string tosearch the RETAIN database for any similar problems. For an introduction to symptom strings and theircontents, see “Symptom strings” on page 18.
If no transaction dump has been produced, it is possible that transaction dumping has beensuppressed for the transaction (through the transaction definition), or the dump code entry in thetransaction dump code table suppresses dumping. For guidance about changing the dumping optionsso that you get a transaction dump, see “Using dumps in problem determination” on page 18.
2. Check the CSMT log.The transaction abend code and the abend message are recorded in the log. Make a note of any othermessages in the log that might relate to the abend, because they might provide additional valuableevidence.
3. Check whether any relevant messages were sent to the transient data destinations used by CICS torecord messages.Look in particular for any messages about files, terminals, or printers that you might be attempting touse.
For a list of destinations used by CICS, see Setting up data sets for transient data.
© Copyright IBM Corp. 1974, 2021 103
What the abend code can tell youThe first thing that the transaction abend code can indicate is whether or not this was a CICS abend.CICS transaction abend codes begin with the letter “A”. A user program or another product might alsouse abend codes beginning with “A”. However, if the transaction abend code begins with anything otherthan “A”, it is an abend code belonging to a user program or to some other product. For the sake ofconvenience, all such non-CICS abend codes are referred to in this section as user abend codes.
For detailed information and a full list of the transaction abend codes used by CICS and by other IBMproducts, see CICS messages.
If you have received a user abend code, it can still be difficult to find out which program is responsible forit unless you have adequate documentation. For this reason, it is good practice for all programmers whoissue abends from within their programs to document the codes in a central location at your installation.
As far as vendor products are concerned, the documentation includes, in most cases, a list ofabend codes that are issued from the programs making up the products. This list, together with thedocumentation for your internal applications, should make it possible for you to find what caused theabend. If it is not clear why the user abend was issued, you might need to describe the problem to theowner of the program.
Transaction abend codes: AEYD, AICA, ASRA, ASRB, and ASRDSpecial procedures apply to the AEYD, AICA, ASRA, ASRB, and ASRD abend codes.
For an abend code other than AEYD, AICA, ASRA, ASRB, and ASRD, use the procedures in “Last statementidentification” on page 63 to find the last command that was executed, and then see “Analyzing theproblem further” on page 114. For details about CICS abend codes, see Transaction abend codes. Alltransaction abend codes that CICS issues are listed, with an explanation of why the code was issued,and details of system and user actions. The same information is available online, using the CICS-suppliedmessages and codes transaction, CMAC.
If, after you review this information, you cannot find the cause of the problem, continue with theprocedures in “Dealing with transaction abend codes” on page 103.
AEYD abendsIf command storage protection is activated by the CMDPROT(YES) option in the system initialization table(SIT), the AEYD transaction abend can occur. CICS terminates a transaction with this code when an outputparameter of an EXEC CICS command addresses storage that the issuing transaction could not itselfdirectly overwrite.
At the time of the abend, register 2 points to the parameter area that contains the invalid address. Thetrace should include an exception trace entry that is created by DFHEISR or DFHEIGR and that identifiesthe parameter in error. If the abend is handled, EXEC CICS ASSIGN ASRASTG, ASRAKEY, and ASRASPCcan give additional information about the abend.
To prevent a recurrence of the abend, correct the program code. Alternatively, changing one or more ofthe following options might alleviate the problem:
• EXECKEY in the program definition, if storage protection is active• TASKDATAKEY in the transaction definition• ISOLATE in the transaction definition, if transaction isolation is enabled
For further information, see “Protecting against storage violations” on page 250.
AICA abendsIf your transaction terminated with abend code AICA, the transaction was probably in a loop. For detailedguidance about dealing with loops, see “Dealing with loops” on page 215.
104 CICS TS for z/OS: Troubleshooting CICS
ASRA abendsCICS issues an ASRA abend code when it detects that a program check has occurred in a transaction.Program checks can occur for a wide variety of reasons, but you can find the nature of the error fromthe program interrupt code in the program status word (PSW). The machine hardware uses the PSW torecord the address of the current instruction being executed, the addressing mode, and other controlinformation. The PSW gives you the address at which the program check occurred, and so it represents arecord of the circumstances of the failure.
ASRB abendsA transaction can abend with an ASRB abend code when a program issues the MVS ABEND macro. Forexample, BDAM issues this ABEND macro when it detects errors, rather than sending a return code to thecalling program. CICS is notified when an MVS abend occurs, and in turn issues an ASRB abend code forthe transaction.
Use the procedures in “Locating the last command or statement” on page 63 to find the origin of theabend in your program. Use that information, and the description and procedures for ASRB abends inTransaction abend codes, to resolve the problem.
ASRD abendsA transaction abends with code ASRD in the following situations:
• An application program attempts to invoke CICS macros.• An application program attempts to access the common service area (CSA) or task control area (TCA).
These situations cause a program check that CICS diagnoses as an ASRD abend, rather than the usualASRA abend. You can use the information in the PSW to investigate the cause of an ASRD abend.
Finding where a program check occurredWhen a transaction abends with code ASRA or ASRD, the first thing you need to do is find out where theprogram check occurred. CICS will have attempted to establish this for you.
About this taskA record of the program in error and the offset of the program check within the program load module arecontained in the following places:
• Message DFHAP0001 or DFHSR0001, which will have preceded the abend• The transaction abend control block (TACB), which will have been created to describe the abend• Exception trace point ID AP 0781 for an ASRA abend, or AP 0783 for an ASRD abend
See “Interpreting transaction dumps” on page 60.
Procedure1. Find the offset of the program check within the program load module.
The offset indicates the point in the program at which the program check occurred. Note that the offsetis derived from the PSW next sequential instruction address and so may indicate the instruction afterthe one that failed.
• If the offset is not X'FFFFFFFF', go to “What type of program check occurred?” on page 108.• If the offset is X'FFFFFFFF', CICS was unable to establish the location of the program check. In this
situation, you have to use the program status word (PSW) to obtain the next sequential instructionaddress. To locate the PSW and the registers for the program check. Continue with step “2” on page105.
2. Locate the PSW.
Chapter 6. Dealing with the problem 105
The PSW can be found in the following places:
• The TACB for the abend• At the head of the formatted transaction dump• Within the kernel error data block traced by exception trace point IDs AP 0781 or AP 0783
a) Enter option 0 from the IPCS primary option menu to display the IPCS default values panel.b) Enter DSNAME('xxxxx.xxxxx.xxxx') to the right of Source where xxxxx.xxxxx.xxxx is the dump
dataset name. Then, enter Enter and F3 to return to the IPCS primary option menu.c) Enter option 6 from the IPCS primary option menu to display the IPCS Subcommand Entry panel.d) Enter IPCS command verbx dfhpdxxx 'ke' where xxx is the version and release for the CICS
dump (for example, 730 for CICS TS 5.6).
This command formats the dump and displays to the Kernel Domain KE_TASK Summary.e) Enter f *YES* to get to the running task that had the program check.
There might be more than one. In the example below, there is one task with *YES* under ERROR(KE_NUM 0157).
===KE: Kernel Domain KE_TASK SummaryKE_NUM KE_TASK STATUS TCA_ADDR TRAN_# TRANSID DS_TASK KE_KTCB ERROR TCB CURRENT_PSW0001 22FEA000 KTCB Step 00000000 00000000 2302E038 AFF208 078D1000_A2E702A40002 22FEA630 KTCB QR 00000000 23017F00 230311B8 AE68F8 070C4000_818481CC0003 22FE9000 KTCB RO 00000000 23026E00 23030138 AE6B28 078D1000_A2E1857E0157 24b15100 ***Running** 232D3100 00383 ABCD 5B6A6C80 230311B8 *YES* AE68F8 070C4000_818481CC
f) Make a note of the KE_NUM, TCA_ADDR and the TRANSID of the tasks in error.g) Enter f table to find the KE Domain Error Table Summary.
This is a summary containing the last 50 abends in the region since it was started.
===KE: Kernel Domain Error Table SummaryERR_NUM ERR_TIME KE_NUM ERROR TYPE ERR_CODE MODULE OFFSET======= ======== ====== ========== ======== ====== ======0000005B 14:19:59 0158 TRAN_ABEND_PERCOLATE ---/AJ04 DFHPCP 000006960000005C 14:19:59 0158 TRAN_ABEND_PERCOLATE ---/AJ04 UNKNOWN UNKNOWN0000005D 14:19:59 0158 TRAN_ABEND_PERCOLATE ---/AJ04 DFHEPC 000002260000005E 14:19:59 0157 PROGRAM_CHECK 0C4/AKEA DFHYI730 000002F2
h) Enter ip st sys on the command line to determine the local time and date that the dump wastaken.
i) Make a note of the ERR_NUM associated with the program check that has an ERR_TIME matchingthe time the dump was taken and a KE_NUM matching the KE_NUM found in the Kernel DomainKE_TASK Summary. If there is more than one program check for the same ERR_TIME and KE_NUM,focus on the first program check. The other program checks are probably a result of the firstprogram check.
j) Enter f 'Number: xxxxxxxx' where xxxxxxxx is the ERR_NUM of the program check you havedecided to focus on.This operation displays the entry in the KE Domain Error table for the error number you specify.
106 CICS TS for z/OS: Troubleshooting CICS
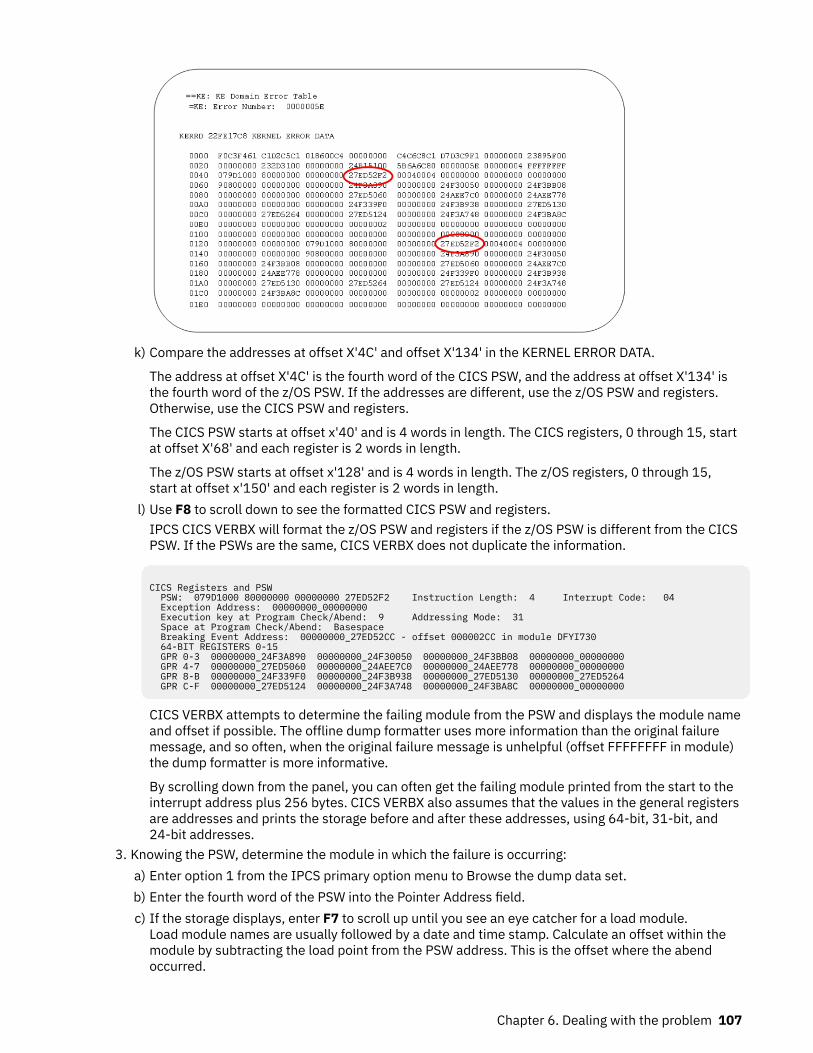
k) Compare the addresses at offset X'4C' and offset X'134' in the KERNEL ERROR DATA.
The address at offset X'4C' is the fourth word of the CICS PSW, and the address at offset X'134' isthe fourth word of the z/OS PSW. If the addresses are different, use the z/OS PSW and registers.Otherwise, use the CICS PSW and registers.
The CICS PSW starts at offset x'40' and is 4 words in length. The CICS registers, 0 through 15, startat offset X'68' and each register is 2 words in length.
The z/OS PSW starts at offset x'128' and is 4 words in length. The z/OS registers, 0 through 15,start at offset x'150' and each register is 2 words in length.
l) Use F8 to scroll down to see the formatted CICS PSW and registers.IPCS CICS VERBX will format the z/OS PSW and registers if the z/OS PSW is different from the CICSPSW. If the PSWs are the same, CICS VERBX does not duplicate the information.
CICS Registers and PSW PSW: 079D1000 80000000 00000000 27ED52F2 Instruction Length: 4 Interrupt Code: 04 Exception Address: 00000000_00000000 Execution key at Program Check/Abend: 9 Addressing Mode: 31 Space at Program Check/Abend: Basespace Breaking Event Address: 00000000_27ED52CC - offset 000002CC in module DFYI730 64-BIT REGISTERS 0-15 GPR 0-3 00000000_24F3A890 00000000_24F30050 00000000_24F3BB08 00000000_00000000 GPR 4-7 00000000_27ED5060 00000000_24AEE7C0 00000000_24AEE778 00000000_00000000 GPR 8-B 00000000_24F339F0 00000000_24F3B938 00000000_27ED5130 00000000_27ED5264 GPR C-F 00000000_27ED5124 00000000_24F3A748 00000000_24F3BA8C 00000000_00000000
CICS VERBX attempts to determine the failing module from the PSW and displays the module nameand offset if possible. The offline dump formatter uses more information than the original failuremessage, and so often, when the original failure message is unhelpful (offset FFFFFFFF in module)the dump formatter is more informative.
By scrolling down from the panel, you can often get the failing module printed from the start to theinterrupt address plus 256 bytes. CICS VERBX also assumes that the values in the general registersare addresses and prints the storage before and after these addresses, using 64-bit, 31-bit, and24-bit addresses.
3. Knowing the PSW, determine the module in which the failure is occurring:a) Enter option 1 from the IPCS primary option menu to Browse the dump data set.b) Enter the fourth word of the PSW into the Pointer Address field.c) If the storage displays, enter F7 to scroll up until you see an eye catcher for a load module.
Load module names are usually followed by a date and time stamp. Calculate an offset within themodule by subtracting the load point from the PSW address. This is the offset where the abendoccurred.
Chapter 6. Dealing with the problem 107
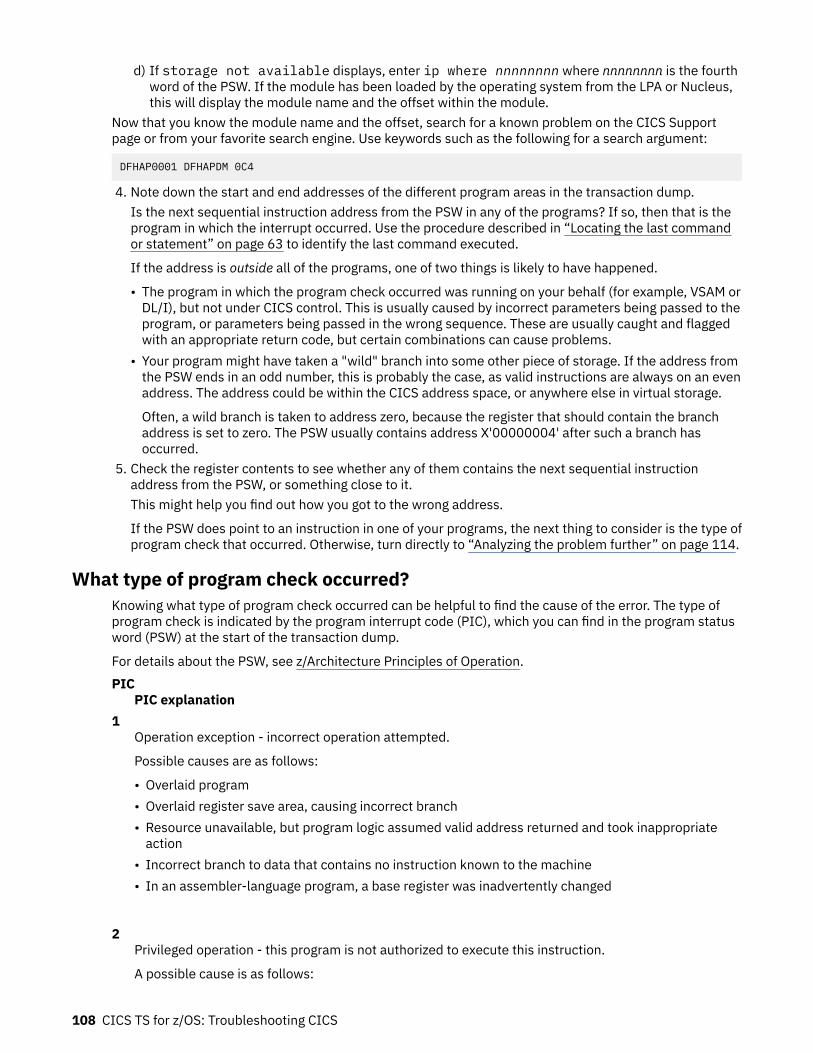
d) If storage not available displays, enter ip where nnnnnnnn where nnnnnnnn is the fourthword of the PSW. If the module has been loaded by the operating system from the LPA or Nucleus,this will display the module name and the offset within the module.
Now that you know the module name and the offset, search for a known problem on the CICS Supportpage or from your favorite search engine. Use keywords such as the following for a search argument:
DFHAP0001 DFHAPDM 0C4
4. Note down the start and end addresses of the different program areas in the transaction dump.Is the next sequential instruction address from the PSW in any of the programs? If so, then that is theprogram in which the interrupt occurred. Use the procedure described in “Locating the last commandor statement” on page 63 to identify the last command executed.
If the address is outside all of the programs, one of two things is likely to have happened.
• The program in which the program check occurred was running on your behalf (for example, VSAM orDL/I), but not under CICS control. This is usually caused by incorrect parameters being passed to theprogram, or parameters being passed in the wrong sequence. These are usually caught and flaggedwith an appropriate return code, but certain combinations can cause problems.
• Your program might have taken a "wild" branch into some other piece of storage. If the address fromthe PSW ends in an odd number, this is probably the case, as valid instructions are always on an evenaddress. The address could be within the CICS address space, or anywhere else in virtual storage.
Often, a wild branch is taken to address zero, because the register that should contain the branchaddress is set to zero. The PSW usually contains address X'00000004' after such a branch hasoccurred.
5. Check the register contents to see whether any of them contains the next sequential instructionaddress from the PSW, or something close to it.This might help you find out how you got to the wrong address.
If the PSW does point to an instruction in one of your programs, the next thing to consider is the type ofprogram check that occurred. Otherwise, turn directly to “Analyzing the problem further” on page 114.
What type of program check occurred?Knowing what type of program check occurred can be helpful to find the cause of the error. The type ofprogram check is indicated by the program interrupt code (PIC), which you can find in the program statusword (PSW) at the start of the transaction dump.
For details about the PSW, see z/Architecture Principles of Operation.PIC
PIC explanation 1
Operation exception - incorrect operation attempted.
Possible causes are as follows:
• Overlaid program• Overlaid register save area, causing incorrect branch• Resource unavailable, but program logic assumed valid address returned and took inappropriate
action• Incorrect branch to data that contains no instruction known to the machine• In an assembler-language program, a base register was inadvertently changed
2Privileged operation - this program is not authorized to execute this instruction.
A possible cause is as follows:
108 CICS TS for z/OS: Troubleshooting CICS
• Incorrect branch to this code. Possible reasons for this situation are as follows:
– Overlaid register save area– Program overlaid by data that contains the privileged operation code
3Execution exception - you are not allowed to EXECUTE an EXECUTE instruction.
Possible causes are as follows:
• Incorrect branch to this code• Incorrect register contents. Possible reasons for this situation are as follows:
– Overlaid register save area– Program overlaid by data that contains the incorrect instruction– Incorrect program logic
4Protection exception - read or write access violation has occurred.
Possible causes are as follows:
• Resource unavailable, and return code not checked. Program logic assumed valid address returnedand took inappropriate action.
• Incorrect interface parameters to another program or subsystem (for example, VSAM or DL/I).• Overlaid register save area, causing incorrect reference to data.• In an assembler-language program, incorrect initialization or modification of a register used to
address data.• Attempt to access internal control blocks illegally or use a CICS system or application programming
macro call.• Attempt to write to storage for which the application does not have an adequate key. For example, in
a CICS system with storage protection, an application running in USER key attempts to write to theCDSA, RDSA, ECDSA, ERDSA, ETDSA, or GCDSA.
• Attempt to write to the ERDSA or RDSA when PROTECT is specified for the RENTPGM parameter.• Attempt to read or write to another transaction's storage. For example, in a system running with
transaction isolation, a program running in USER key might experience a protection exception whenattempting to access the USER key task-lifetime storage of another transaction.
• Storage that is passed to CICS as an output parameter through the EXEC interface that is notaddressable by the application issuing the call. The transaction is abended AEYD, and the PSWshows that a protection exception has occurred.
5Addressing exception - the address that you referenced is not available or is not valid.
A possible cause is as follows:
• Incorrect register contents, which might be because of an overlaid register save area.
6Specification exception - incorrect format of an instruction or invalid registers.
Possible causes are as follows:
• Overlaid program• Incorrect field lengths used in packed decimal multiply and divide instructions
Chapter 6. Dealing with the problem 109
• Branch to an odd-numbered address, caused by an overlaid register save area
7Data exception - data invalid in a packed or signed display decimal operation. One, or both of theoperands contain data that is not suitable for the instruction.
Possible causes are as follows:
• Incorrect input data (often because blanks are used where numeric data is expected)• Overlaid data• Overlaid register save area, causing an incorrect branch• Incorrect program logic, execution of code with uninitialized variables• Wrong length
8 through FArithmetic exceptions, such as divide checks, overflow, and underflow. They differ in the form ofarithmetic that was being used: binary, packed decimal, or floating point.
Possible causes are as follows:
• Incorrect user data• Overlaid data areas• Overlaid register save area, causing incorrect reference to data
10 and aboveProgram checks associated with system-related interrupts.
Dealing with arithmetic exceptions
About this taskIf the program check was due to an arithmetic error (interruption codes 7 through F), you need to find theoperands used in the last instruction.
Procedure1. Use the procedure described in section “Locating program data” on page 64 to locate the fields.2. Check that the operands are valid.
You need to know a little about the type of arithmetic being done, so that you can verify the operandsare correct. The interrupt you received tells you what sort of arithmetic the system was doing (binary,packed decimal, or floating point), but you need to determine if that is what you had intended to do.You might need to consult a programming language manual if you have any queries about this.
3. When you have identified the operands, you need to decide where the problem is.
Questions to consider include:
• Has the data been overlaid?• Has the value been changed by faulty logic?• Does the data type not match the operation type? For example, if you define the variable as being
packed decimal and then you read in binary information, this causes a ‘data exception’ error.
110 CICS TS for z/OS: Troubleshooting CICS
Dealing with protection exceptionsStorage protection, transaction isolation, and command protection are facilities that add data integrityby highlighting application errors. The use of these facilities greatly reduces the number of abends thatappear to be CICS problems.
About this taskWith the storage protection facility, there are further situations in which a protection exception (interruptcode 4) might occur:
• An attempt is made to write to the CDSA, RDSA, ECDSA, ERDSA, or GCDSA when storage protection isactive and the application is running in user key.
• An attempt is made to write to the ERDSA or RDSA when PROTECT is specified for the RENTPGM systeminitialization parameter.
If transaction isolation (for which storage protection is a prerequisite) is enabled, additional situations canoccur:
• A transaction, defined with ISOLATE(YES), is executing a USER key program and attempts to read orwrite to another transaction's USER key task-lifetime storage in the UDSA or EUDSA.
• A transaction, defined with ISOLATE(NO), is executing a USER key program and attempts to read orwrite to another transaction's USER key task-lifetime storage in the UDSA or EUDSA, but the secondtransaction is defined with ISOLATE(YES). For a full description of the transaction isolation facility andits use, see TRANSACTION attributes.
If any of these situations occur, CICS abnormally terminates the transaction with abend code ASRA andissues message DFHSR0622, which identifies the DSA over which the program attempted to write. Thisinformation is in the TACB and is traced by exception trace point ID AP 0781. It is also useful to knowthe execution key of the program at the time of the protection exception, and whether the program wasexecuting in a subspace (CDSA, UDSA, RDSA, ECDSA, EUDSA, ERDSA, ETDSA, GCDSA, or GUDSA). Thisinformation is in the TACB, exception trace point ID AP 0781 and at the head of the formatted transactiondump.
If the command storage protection facility is enabled, a protection exception can occur if storage thatis passed to CICS as an output parameter through the EXEC interface is not accessible for READ/WRITEby the program that issued the command. The program is passing to CICS storage that it cannot itselfupdate, but it requires CICS to update the storage. The transaction terminates abnormally with abendcode AEYD. CICS creates an exception trace entry AP 0779 and saves relevant data in the TACB that isformatted at the beginning of the transaction dump.
It is still possible for CICS to abend when the problem is in the application. For example, commandstorage protection only checks output parameters and does not prevent the passing of fetch-protectedstorage as an input parameter to CICS. When CICS attempts to read such storage, an ASRA abend occurs.
Causes of protection exceptionsCICS storage protection is intended to prevent application programs erroneously overwriting CICSprograms and control blocks. The occurrence of a protection exception in a new program running in asystem with storage protection active probably indicates an error in the application program. However,when existing programs which need to be defined with EXECKEY(CICS) are first run in an upgradedsystem with storage protection active, protection exceptions may well occur.
Any application program causing a protection exception when defined with EXECKEY(USER) must beexamined to determine why it is attempting to modify storage that it is not allowed to modify. Itsdefinition should be changed to EXECKEY(CICS) only if it is determined that the application program islegitimately accessing CICS key storage, and the exception is not the result of an application error.
Programs might also be incorrectly link-edited as reentrant, and, as a result, loaded by CICS into one ofthe read-only DSAs (RDSA, ERDSA). When such an incorrectly defined program attempts to modify itself,or another program tries to modify it, a protection exception occurs. The program should be checked
Chapter 6. Dealing with the problem 111
to see whether it should be redefined as non-reentrant, or whether the program should be changed tobe truly reentrant. The protection exception might indicate that the program uses poor programmingtechniques that could result in other problems if uncorrected.
Transaction isolationTransaction isolation protects the data associated with a user transaction from being overwritten byEXECKEY(USER) programs invoked by other user transactions.
If transaction isolation is active, the occurrence of a protection exception in a new transaction indicatesa probable error in the transaction or program definition. An interdependency might exist between twoor more transactions. In a system running without transaction isolation, a transaction can read or writeto the task-lifetime storage of another transaction. The CICS Interdependency Analyzer helps to identifypotential dependencies. Ideally, such interdependencies should be removed. If interdependencies cannotbe removed, define all affected transactions with ISOLATE(NO).
For further details about defining transactions, see TRANSACTION attributes. For more information aboutCICS Interdependency Analyzer, see CICS Interdependency Analyzer for z/OS Overview.
Command storage protectionCommand storage protection prevents CICS from updating storage if the storage address is passed as acommand output parameter by a transaction that is not authorized to update that storage.
The transaction terminates with abend code AEYD. The exception trace entry AP 0779 supplies detailsof the failing program and command. When upgrading to a system with command storage protectionenabled, EXEC commands that pass unauthorized storage are identified and can be corrected.
Possible causes of protection exceptions referencing CICS DSAsThe following list summarizes some of the causes of protection exceptions that can occur in user keyprograms
• Issuing an MVS macro request. Most MVS macros and services are not supported in EXECKEY(USER)application programs. Use of unsupported macros and services might cause a failure if these macros orservices attempt to reference MVS storage outside the CICS DSAs.
• Referencing storage that is obtained by an MVS GETMAIN request or another MVS macro. MVS storagethat is obtained by these methods resides outside the CICS DSAs, and is therefore protected from userkey programs.
• Using PL/I statements, COBOL verbs or compiler options that are not permitted in CICS applicationprograms (see Developing applications for details of prohibited language statements and compileroptions). For example, the use of CALL with the RES compiler option, or a verb such as INSPECT, mightalso cause MVS storage outside the CICS DSAs to be obtained or updated (such storage is protectedfrom user-key programs).
In previous releases of CICS, these might have worked, or at least might not have caused theapplication to fail. However, the use of these statements and options can have other effects on theoverall execution of the CICS system, and should be removed where possible.
• Modifying the CWA when CWAKEY=CICS is specified as a system initialization parameter. In a user keyprogram, this is an invalid reference to storage allocated from the CDSA or ECDSA.
• Modifying the TCTUA when TCTUAKEY=CICS is specified as a system initialization parameter. In a userkey program this is an invalid reference to storage allocated from the CDSA or ECDSA.
• Issuing EXEC CICS EXTRACT EXIT command and attempting to update an exit program’s global workarea. In a user key program this is an invalid reference to storage allocated from the CDSA or ECDSA.
Note: If you are using CSP/AD, CSP/AE, or CSP/RS, you must ensure that the definitions for programsDCBINIT, DCBMODS, DCBRINIT and DCBNCOP specify EXECKEY(CICS). These are all examples ofprograms that modify global work areas that are set up by global user exit programs.
112 CICS TS for z/OS: Troubleshooting CICS
• If you are using Db2 and you use the Db2 message formatting routine DSNTIAR, which is link-editedwith your application programs, you should apply the PTF for Db2 APAR PN12516, and relink-edit theapplications using DSNTIAR so that they can run in user key. If the applications are not re-link-editedafter this PTF is applied, they will have to run in CICS key. As a first step, until you have applied this PTF,you can define the applications which use DSNTIAR with EXECKEY(CICS).
Protection exceptions referencing the read-only DSAsProtection exceptions occurring in programs resident in the ERDSA and RDSA are caused by the programnot being truly reentrant. It might be that the program should not be defined as reentrant, or it mightbe that the program should be reentrant but is using poor coding techniques which should be correctedrather than making the program non-reentrant.
For example:
• Using static variables or constants for fields which are set by CICS requests. For example, in assemblercoding, if the LENGTH parameter for a retrieval operation such as EXEC CICS READQ TS is specified asa DC elsewhere in the program, a constant is set up in static storage. When CICS attempts to set theactual length into the data area, it causes a protection exception if the program is in the ERDSA or RDSA.
In some cases, for example EXEC CICS READ DATASET INTO () LENGTH() ..., the LENGTH value specifiesthe maximum length that the application can accept, and is set by CICS to contain the actual lengthread on completion of the operation. Even if the program does not have RENT specified, using avariable in the program itself for this length could cause problems if the program is being executedconcurrently for multiple users. The first transaction may execute correctly, resulting in the actualrecord length being set in the LENGTH parameter, which is then used as the maximum length for thesecond transaction.
• Defining a table with the RENT attribute and then attempting to initialize or update the table during CICSexecution. Such a table should not be defined as RENT.
• Defining BMS mapsets as RENT can cause a protection exception, if CICS attempts to modify themapsets. In some cases, CICS needs to modify BMS mapsets during execution. Mapsets should not belink-edited with the RENT attribute. BMS mapsets should be loaded into CICS key storage (because theyshould not be modified by application programs) which means they must not be link-edited with theRENT attribute. (Partition sets are not modified by CICS and can be link-edited with the RENT attribute.)
Protection exceptions referencing the UDSA and EUDSAIn a system running with transaction isolation enabled, protection exceptions can occur in programs withEXECKEY(USER).
Such an exception is caused by one transaction using a user key program to read or write to the user-key task-lifetime storage of another transaction. This situation might highlight a program error or aninterdependency between two transactions. The IBM CICS Interdependency Analyzer for z/OS tool canhelp to identify potential transaction interdependencies. Examples of transaction interdependencies are:
• A transaction might use EXEC CICS GETMAIN or GETMAIN64 to obtain 24-bit or 31-bit storage, andpass the address of the storage to other transactions. Access to this storage by one of these othertransactions causes a protection exception if transaction isolation is enabled, unless both affectedtransactions are defined with ISOLATE(NO). Storage to be shared in this manner should be acquired bya GETMAIN with the SHARED option. This is preferable to defining the transactions with ISOLATE(NO).
• A transaction might attempt to post an ECB that exists in another transaction’s task-lifetime storage.ECBs should be acquired by a GETMAIN from shared storage. Alternatively, the affected transactionsshould be defined with ISOLATE(NO).
Transaction isolation does not apply to 64-bit storage, so protection exceptions caused in this way do notreference the GUDSA.
Chapter 6. Dealing with the problem 113
Analyzing the problem further
About this taskYou should now know the point in the program at which the abend occurred, and what the program wasattempting to do.
• If your program uses or calls other programs or systems, examine the interface and the way you passdata to the program. Are you checking the returned information from the other system? Incorrect logicpaths based on incorrect assumptions can give unpredictable results.
• Examine the flow of your program using tools like the Execution Diagnostic Facility (CEDF). Check thetransient data and temporary storage queues with the CICS browse transaction (CEBR), and use theCICS command-level interpreter and syntax checker transactions (CECI and CECS). If necessary, insertadditional statements into the program until you understand the flow.
• Look at any trace output you might have. If you have a "normal" trace output included in thedocumentation, compare the two for differences.
• Define the current environment, and try to isolate any changes in it since your program last worked.This can be difficult in large installations, because so many people interact with the systems and slightchanges can affect things that seem unconnected.
Abends when CICS is using the DBCTL interfaceIf a transaction terminates abnormally while CICS is using DBCTL, you need to determine whether CICS orIMS was in control at the time of the abend.
You can do this by examining the time stamps in the CICS and DBCTL traces. For guidance about this,see ../dfht443.dita#dfht443.
If tracing was off at the time of the failure, you can find an indicator in the task local work area forDFHDBAT. The indicator is set when CICS passes control to DBCTL, and reset when DBCTL returns controlto CICS.
To find the indicator, locate the eye-catcher for the TIE in the dump and then locate the LOCLAREAeye-catcher that follows it. The indicator is at offset X'14' from the start of the LOCLAREA eye-catcher.If the indicator byte is set to X'08', CICS has passed control to DBCTL, and you should examine the IMSpart of the transaction. If the byte is set to X'00', DBCTL has returned control to CICS, and you shouldinvestigate the CICS part of the transaction.
Worksheet for transaction abends1. Record the abend code and messages
Find the abend code from the heading of the dump and record any pertinent messages.2. Is this a CICS or a USER abend code?
• If this is a USER abend code, tell the appropriate person.• For a CICS abend code, continue with “3” on page 114.
3. Look up the abend code
If you need further advice, continue with “4” on page 114.4. Is this an AICA abend?
If it is, read “Dealing with loops” on page 215. If not, continue with “5” on page 114.5. Is this an ASRA abend?
If it is, go to step “7” on page 115. If not, continue with “6” on page 114.6. Is this an ASRD abend?
If it is, continue with “7” on page 115. If not, go to “14” on page 115.
114 CICS TS for z/OS: Troubleshooting CICS
7. Record the program areas from the dump.
Find the program names from the Module Index at the end of the formatted dump. For each program,record the program name, the beginning address, and end address.
8. Record the address of the next instruction from the PSW, or the offset established by CICS.9. Did the program check occur in one of the program areas listed above?
If it did, continue with “10” on page 115. If not, go to “14” on page 115.10. Record what type of program check occurred.
You will need to record the Program Interrupt Code (PIC).11. Find the last statement executed.
See “Locating the last command or statement” on page 63.12. Was the PIC one of the arithmetic interrupts (7,8,9,A,B,C,D,E,F)?
If it was, find the contents of the operands of the last instruction (see “Locating program data” onpage 64), and go to step “15” on page 115. If not, continue with “13” on page 115
13. Was the PIC a protection exception?
If it was, read “Dealing with protection exceptions” on page 111.
Go to “15” on page 115.14. Find the last statement executed
See “Locating the last command or statement” on page 63.15. Analyze the problem and the data gathered.
For most problems you should now have enough information to solve the problem. If you still cannotfind the source, recheck the following:
• Parameters to or from other programs or systems.• Any needed resource that may not be available.• The formatted trace, for any unexplained flow.• The running environment, for any changes in it.
FEPI abendsFor information about FEPI-associated abends in CICS or MVS, see FEPI abends.
Dealing with CICS system abendsThis information provides guidance about gathering essential information about CICS system abends.
If you have not done so already, use the CMAC transaction or refer to CICS messages for an explanationof any message you have received, because it could offer a straightforward solution to your problem. Forfurther information about the CMAC transaction, see CMAC - messages and codes display.
If the abend was clearly caused by a storage violation, refer to the information in “Dealing with storageviolations” on page 249. You know when CICS has detected a storage violation, because it issues thefollowing message:DFHSM0102 applid A storage violation (code X'code') has been detected by module modname.
After you refer to the information about storage violations, if you find the cause of the abend is anapplication error, you must investigate the application to find out why it caused the abend. However, if youfind that a CICS module seems to be in error, you need to contact the IBM Support Center. Before you doso, you must gather the following information:
• The name of the failing module, and the module level• The offset in the module at which the failure occurred
Chapter 6. Dealing with the problem 115
• The instruction at that offset• The abend type.
This section tells you how to find the information just listed, and contains the following topics:
• “The documentation you need” on page 116• “Interpreting the evidence” on page 116• “Looking at the kernel domain storage areas” on page 118• “Using the linkage stack to identify the failing module” on page 126
The documentation you needThe primary documentation you need for investigating abends is the system dump that was taken at thetime the error occurred. This usually contains all the evidence needed to find the cause of the problem.
If system dumping is permitted for the dump code, and if system dumping is not otherwise disabled,a system dump is taken when the error was detected. You can find out which dump relates to whichmessage, because the time stamps and the dump IDs are the same.
If a system dump was not taken when the abend occurred, you need to find out why. Use the proceduredescribed in “You do not get a dump when an abend occurs” on page 233, and follow the advice giventhere. When you are sure that dumping is enabled for the appropriate system dump code, you need tore-create the system abend.
You can use the interactive problem control system (IPCS) to process dumps and view them online. See“Formatting system dumps” on page 42 for guidance about processing dumps using IPCS VERBEXITparameters. The kernel domain storage areas (formatting keyword KE) and the internal trace table(formatting keyword TR) are likely to be the most useful at the start of your investigation.
The formatted output for kernel domain contains summary information about the error (search for theeye-catcher ===KE). The internal trace table contains the exception trace entry (if any) that was made atthe time the error was detected (search for the eye-catcher ===TR).
Later, you might find that storage summaries for the application, transaction manager, program manager,dispatcher, and loader domains (formatting keywords AP, XM, PG, DS, and LD, respectively) are alsouseful. In each case, level-1 formatting is sufficient in the first instance.
You can format and print the dump offline. For details of how to do this, see Dump utilities (DFHDUnnnand DFHPDnnn).
You might need to copy the dump so that you can leave the system dump data set free for use, or so thatyou have a more permanent copy for problem reporting.
Whether you look at the dump online or offline, do not purge it from the dump data set until you haveeither copied it or finished with it; you might need to format other areas later, or format the same areas inmore detail.
Interpreting the evidenceThe first things to look at are any messages that accompany the abend, the exception trace entry in theinternal trace table, and the symptom string at the start of the dump.
Procedure1. Look at any messages that accompany a CICS system abend, because they might point directly to the
cause of the failure.For advice about the user response to a message, see CICS messages.
2. Examine the exception trace entry.The exception trace entry gives information about what was happening when the failure occurred, anddata that was being used at the time. When a CICS system abend occurs, an exception trace entry is
116 CICS TS for z/OS: Troubleshooting CICS
made to the internal trace table and any other active trace destination. It does not matter whether youhave tracing turned on; the trace entry is still made.
If the trace table contains more than one exception trace entry, it is likely that the last one isassociated with the dump. However, this might not always be the case, and you should make surethat you have found the correct entry. Be aware, too, that dumps can sometimes be requested withouta corresponding exception trace entry being made.
For details of trace entries, see Using CICS trace.3. Look at the symptom string in the system dump.
The symptom string, similar to the short symptom string at the beginning of a transaction dump,appears at the beginning of a CICS system dump. It is also written to SYS1.LOGREC and is issued aspart of message DFHME0116.
The symptom string provides a number of keywords that can be directly typed into RETAIN and usedto search the RETAIN database. The possible keywords are shown in Table 10 on page 117. Thekeywords are used at the IBM Support Center to discover duplicate problems, or problems that havealready been reported by other users and for which a solution is available.
Table 10. Symptom string keywords
Keyword Meaning
PIDS/ Product ID (CICS product number)
LVLS/ Level indicator (CICS release level)
RIDS/ Module name
PTFS/ Module PTF level
MS/ Message ID reporting error
AB/ Abend code
ADRS/ Address or offset indicator
PRCS/ Return code
PCSS/ CICS jobname
OVS/ Overlaid storage
FLDS/ Name of a field associated with problem
REGS/ Software register associated with problem
VALU/ Value of a named field or register
Although the symptom string is designed to provide keywords for searching the RETAIN database, itcan also give you significant information about what was happening at the time the error occurred, andit might suggest an obvious cause or a likely area in which to start your investigation. Among otherthings, it might contain the abend code. If you have not already done so, look in CICS messages to seewhat action it suggests for this abend code.
If the system cannot gather much information about the error, the symptom string is less specific. Insuch cases, it might not help you much with problem determination, and you need to look at otherparts of the dump. The kernel domain storage summary is a good place to start.
Chapter 6. Dealing with the problem 117
Looking at the kernel domain storage areasAfter you look at the symptom string at the start of the dump, the next place to look is the kernel domainstorage summary.
Procedure1. Gather the following information from the kernel domain storage areas:
• A summary of tasks and their status, and whether they were in error when the dump was taken.• An error analysis report for each task currently in error. CICS retains information for the previous fifty
errors.• The linkage stack for each task, showing which programs have been called and have not yet
returned.2. When you have this information, find out which tasks are associated with the error.
Finding which tasks are associated with the errorTo find out which tasks are associated with the error, you can use the kernel task summary. The kerneltask summary shows which tasks were in the system when the dump was taken, whether those taskswere running, and whether they were in error.
About this taskThe task summary is in the form of a table, where each line in the table represents a different task. Theleft-hand column of the task summary shows the kernel task number, which is the number used by thekernel domain to identify the task. This is not the same as the normal CICS task number taken from fieldTCAKCTTA of the TCA.
Figure 14 on page 119 shows an example of a kernel task summary with a task in error.
118 CICS TS for z/OS: Troubleshooting CICS
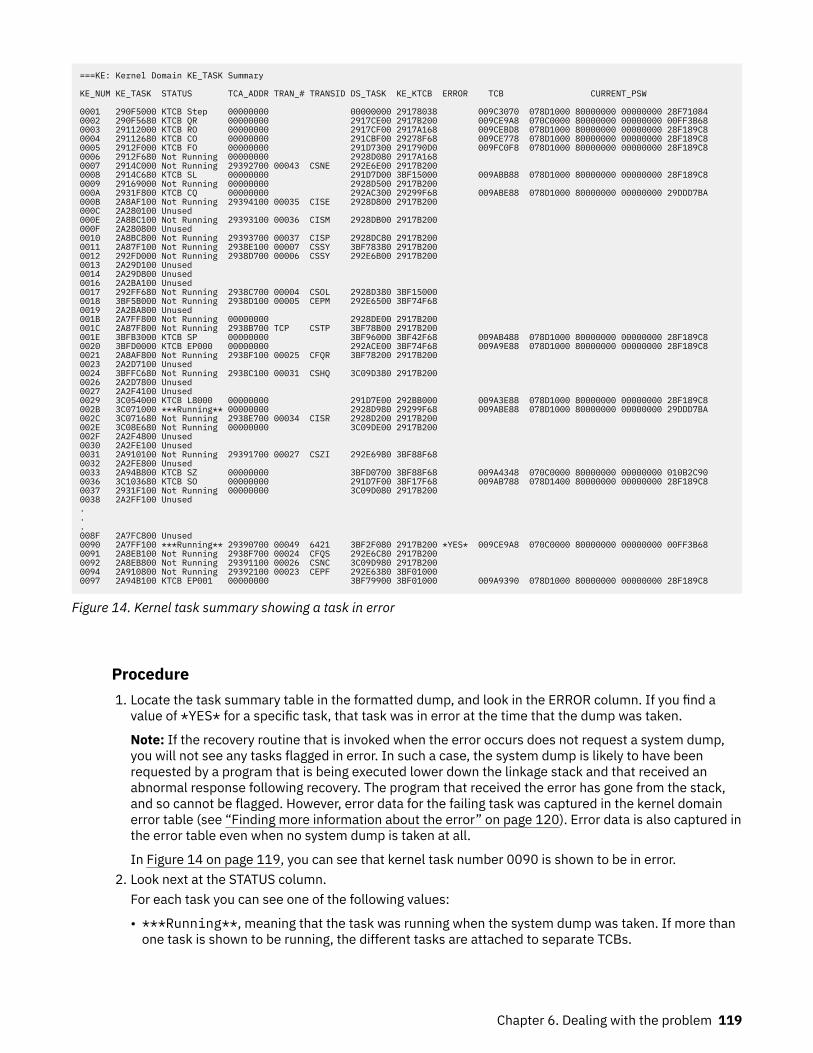
===KE: Kernel Domain KE_TASK Summary
KE_NUM KE_TASK STATUS TCA_ADDR TRAN_# TRANSID DS_TASK KE_KTCB ERROR TCB CURRENT_PSW
0001 290F5000 KTCB Step 00000000 00000000 29178038 009C3070 078D1000 80000000 00000000 28F710840002 290F5680 KTCB QR 00000000 2917CE00 2917B200 009CE9A8 070C0000 80000000 00000000 00FF3B680003 29112000 KTCB RO 00000000 2917CF00 2917A168 009CEBD8 078D1000 80000000 00000000 28F189C80004 29112680 KTCB CO 00000000 291CBF00 29278F68 009CE778 078D1000 80000000 00000000 28F189C80005 2912F000 KTCB FO 00000000 291D7300 291790D0 009FC0F8 078D1000 80000000 00000000 28F189C80006 2912F680 Not Running 00000000 2928D080 2917A1680007 2914C000 Not Running 29392700 00043 CSNE 292E6E00 2917B2000008 2914C680 KTCB SL 00000000 291D7D00 3BF15000 009ABB88 078D1000 80000000 00000000 28F189C80009 29169000 Not Running 00000000 2928D500 2917B200000A 2931F800 KTCB CQ 00000000 292AC300 29299F68 009ABE88 078D1000 80000000 00000000 29DDD7BA000B 2A8AF100 Not Running 29394100 00035 CISE 2928D800 2917B200000C 2A280100 Unused000E 2A8BC100 Not Running 29393100 00036 CISM 2928DB00 2917B200000F 2A280800 Unused0010 2A8BC800 Not Running 29393700 00037 CISP 2928DC80 2917B2000011 2A87F100 Not Running 2938E100 00007 CSSY 3BF78380 2917B2000012 292FD000 Not Running 2938D700 00006 CSSY 292E6B00 2917B2000013 2A29D100 Unused0014 2A29D800 Unused0016 2A2BA100 Unused0017 292FF680 Not Running 2938C700 00004 CSOL 2928D380 3BF150000018 3BF5B000 Not Running 2938D100 00005 CEPM 292E6500 3BF74F680019 2A2BA800 Unused001B 2A7FF800 Not Running 00000000 2928DE00 2917B200001C 2A87F800 Not Running 2938B700 TCP CSTP 3BF78B00 2917B200001E 3BFB3000 KTCB SP 00000000 3BF96000 3BF42F68 009AB488 078D1000 80000000 00000000 28F189C80020 3BFD0000 KTCB EP000 00000000 292ACE00 3BF74F68 009A9E88 078D1000 80000000 00000000 28F189C80021 2A8AF800 Not Running 2938F100 00025 CFQR 3BF78200 2917B2000023 2A2D7100 Unused0024 3BFFC680 Not Running 2938C100 00031 CSHQ 3C09D380 2917B2000026 2A2D7800 Unused0027 2A2F4100 Unused0029 3C054000 KTCB L8000 00000000 291D7E00 292BB000 009A3E88 078D1000 80000000 00000000 28F189C8002B 3C071000 ***Running** 00000000 2928D980 29299F68 009ABE88 078D1000 80000000 00000000 29DDD7BA002C 3C071680 Not Running 2938E700 00034 CISR 2928D200 2917B200002E 3C08E680 Not Running 00000000 3C09DE00 2917B200002F 2A2F4800 Unused0030 2A2FE100 Unused0031 2A910100 Not Running 29391700 00027 CSZI 292E6980 3BF88F680032 2A2FE800 Unused0033 2A94B800 KTCB SZ 00000000 3BFD0700 3BF88F68 009A4348 070C0000 80000000 00000000 010B2C900036 3C103680 KTCB SO 00000000 291D7F00 3BF17F68 009AB788 078D1400 80000000 00000000 28F189C80037 2931F100 Not Running 00000000 3C09D080 2917B2000038 2A2FF100 Unused...008F 2A7FC800 Unused0090 2A7FF100 ***Running** 29390700 00049 6421 3BF2F080 2917B200 *YES* 009CE9A8 070C0000 80000000 00000000 00FF3B680091 2A8EB100 Not Running 2938F700 00024 CFQS 292E6C80 2917B2000092 2A8EB800 Not Running 29391100 00026 CSNC 3C09D980 2917B2000094 2A910800 Not Running 29392100 00023 CEPF 292E6380 3BF010000097 2A94B100 KTCB EP001 00000000 3BF79900 3BF01000 009A9390 078D1000 80000000 00000000 28F189C8
Figure 14. Kernel task summary showing a task in error
Procedure1. Locate the task summary table in the formatted dump, and look in the ERROR column. If you find a
value of *YES* for a specific task, that task was in error at the time that the dump was taken.
Note: If the recovery routine that is invoked when the error occurs does not request a system dump,you will not see any tasks flagged in error. In such a case, the system dump is likely to have beenrequested by a program that is being executed lower down the linkage stack and that received anabnormal response following recovery. The program that received the error has gone from the stack,and so cannot be flagged. However, error data for the failing task was captured in the kernel domainerror table (see “Finding more information about the error” on page 120). Error data is also captured inthe error table even when no system dump is taken at all.
In Figure 14 on page 119, you can see that kernel task number 0090 is shown to be in error.2. Look next at the STATUS column.
For each task you can see one of the following values:
• ***Running**, meaning that the task was running when the system dump was taken. If more thanone task is shown to be running, the different tasks are attached to separate TCBs.
Chapter 6. Dealing with the problem 119
• Not Running, meaning that the task is in the system but is currently not running. For example, thetask might be suspended because it is waiting for a resource, or the task might be ready to run butwaiting for a TCB to become available.
• KE_KTCB, referring to CICS control blocks that correspond to the CICS TCBs. These are treated astasks in the kernel task summary.
• Unused, meaning either that the task was in the system but it has now terminated, or that there hasnot yet been a task in the system with the corresponding task number. Earlier unused tasks are likelyto have run and terminated, and later ones are likely never to have represented actual tasks. It ismost unlikely that you will ever need to distinguish between the two possibilities.
It is very likely that the task shown to be in error has a status of "Running", as in the example of Figure14 on page 119. Such a task would have been running at the time the error was detected.
It is possible, but less likely, that the task shown to be in error has a status of "Not Running". Thissituation might occur if the task in error was attempting recovery when, for some reason, it wassuspended.
3. If you are using trace to help you diagnose a problem, use the TRAN_# and KE_NUM columns of thekernel task summary to find more information about the task.The TRAN_# column for a task can contain the following information:
• A number that matches the task number in the corresponding trace• TCP for the CICS terminal control task• Other character entries for CICS system tasks (for example, a component identifier such as AP for a
CICS system task in the AP domain).
When you are working with trace output, you can use the number from the TRAN_# column to identifyentries associated with a user task up to the point when that task passes control to CICS.
To identify the CICS processing associated with the user task, use the entry in the KE_NUM column ofthe kernel task summary. This matches the KE_NUM shown in the full trace entries for the task so thatyou can distinguish the CICS processing associated with the task you are interested in from other CICSprocessing.
Finding more information about the errorThe summary information for the task in error follows the kernel task summary and provides moreinformation about the failure. It provides a storage report for the task, including registers and PSWs, andany data addressed by the registers.
About this taskThe PSW is the program status word that is used by the machine hardware to record the address of thecurrent instruction being executed, the addressing mode, and other control information. Figure 15 onpage 121 is the first part of an example of such a storage report for a program check.
120 CICS TS for z/OS: Troubleshooting CICS
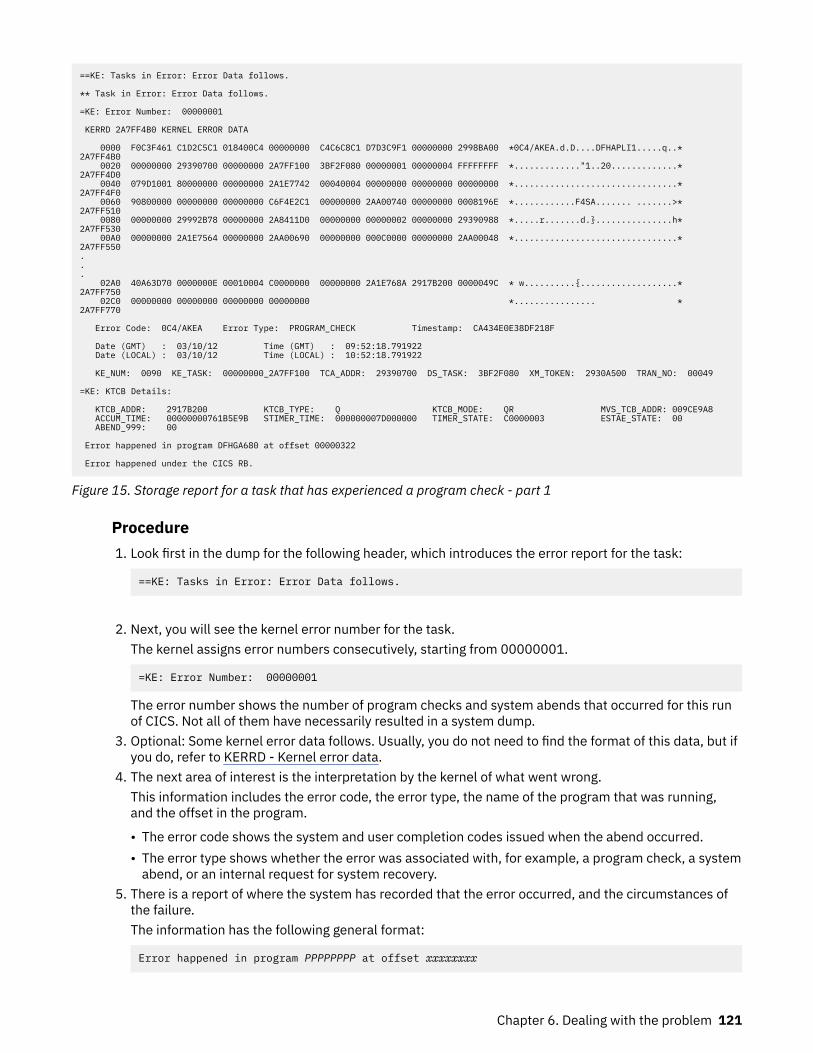
==KE: Tasks in Error: Error Data follows.
** Task in Error: Error Data follows.
=KE: Error Number: 00000001
KERRD 2A7FF4B0 KERNEL ERROR DATA
0000 F0C3F461 C1D2C5C1 018400C4 00000000 C4C6C8C1 D7D3C9F1 00000000 2998BA00 *0C4/AKEA.d.D....DFHAPLI1.....q..* 2A7FF4B0 0020 00000000 29390700 00000000 2A7FF100 3BF2F080 00000001 00000004 FFFFFFFF *............."1..20.............* 2A7FF4D0 0040 079D1001 80000000 00000000 2A1E7742 00040004 00000000 00000000 00000000 *................................* 2A7FF4F0 0060 90800000 00000000 00000000 C6F4E2C1 00000000 2AA00740 00000000 0008196E *............F4SA....... .......>* 2A7FF510 0080 00000000 29992B78 00000000 2A8411D0 00000000 00000002 00000000 29390988 *.....r.......d.}...............h* 2A7FF530 00A0 00000000 2A1E7564 00000000 2AA00690 00000000 000C0000 00000000 2AA00048 *................................* 2A7FF550... 02A0 40A63D70 0000000E 00010004 C0000000 00000000 2A1E768A 2917B200 0000049C * w..........{...................* 2A7FF750 02C0 00000000 00000000 00000000 00000000 *................ * 2A7FF770
Error Code: 0C4/AKEA Error Type: PROGRAM_CHECK Timestamp: CA434E0E38DF218F
Date (GMT) : 03/10/12 Time (GMT) : 09:52:18.791922 Date (LOCAL) : 03/10/12 Time (LOCAL) : 10:52:18.791922
KE_NUM: 0090 KE_TASK: 00000000_2A7FF100 TCA_ADDR: 29390700 DS_TASK: 3BF2F080 XM_TOKEN: 2930A500 TRAN_NO: 00049
=KE: KTCB Details:
KTCB_ADDR: 2917B200 KTCB_TYPE: Q KTCB_MODE: QR MVS_TCB_ADDR: 009CE9A8 ACCUM_TIME: 00000000761B5E9B STIMER_TIME: 000000007D000000 TIMER_STATE: C0000003 ESTAE_STATE: 00 ABEND_999: 00
Error happened in program DFHGA680 at offset 00000322
Error happened under the CICS RB.
Figure 15. Storage report for a task that has experienced a program check - part 1
Procedure1. Look first in the dump for the following header, which introduces the error report for the task:
==KE: Tasks in Error: Error Data follows.
2. Next, you will see the kernel error number for the task.The kernel assigns error numbers consecutively, starting from 00000001.
=KE: Error Number: 00000001
The error number shows the number of program checks and system abends that occurred for this runof CICS. Not all of them have necessarily resulted in a system dump.
3. Optional: Some kernel error data follows. Usually, you do not need to find the format of this data, but ifyou do, refer to KERRD - Kernel error data.
4. The next area of interest is the interpretation by the kernel of what went wrong.This information includes the error code, the error type, the name of the program that was running,and the offset in the program.
• The error code shows the system and user completion codes issued when the abend occurred.• The error type shows whether the error was associated with, for example, a program check, a system
abend, or an internal request for system recovery.5. There is a report of where the system has recorded that the error occurred, and the circumstances of
the failure.The information has the following general format:
Error happened in program PPPPPPPP at offset xxxxxxxx
Chapter 6. Dealing with the problem 121
The program name (PPPPPPPP) and offset (xxxxxxxx) are determined by searching through the CICSloader's control blocks for a program that owned the abending instruction at the time of the abend. Ifthis search does not find such a program, the report shows the following text:
PROGRAM PPPPPPPP WAS IN CONTROL, BUT THE PSW WAS ELSEWHERE.
The reported program name (PPPPPPPP) is the program that owns the current kernel stack entry forthe abending task. If this text is shown, it might be possible to locate the failing program using themethod described in “Using the linkage stack to identify the failing module” on page 126. The failingprogram name and offset are also displayed in the section of the report immediately after the contentsof the registers are reported. This information has the following format: :
DATA AT PSW: AAAAAAAA MODULE: PPPPPPPP OFFSET: XXXXXXXX
If the failing program cannot be located, the module name and offset are reported as unknown.Possible reasons why the program cannot be located are as follows:
• The failure occurred in a z/OS loaded module.• The failing program had been released by the CICS loader before the dump was taken.• A wild branch in the failing program caused the PSW to point to storage not occupied by a CICS
loaded program.
The accuracy of the program name and offset reported in a formatted dump that was produced as theresult of a program executing a wild branch cannot be guaranteed.
6. After the interpretation by the kernel of the error, one of the following diagnostic messages is shown:
• Error happened under the CICS RB
The error was detected either when CICS code was executing, or when an access method called byCICS was running (for example, VSAM or QSAM). The CICS RB is the CICS request block, an MVScontrol block that records the state of the CICS program.
• Error did not happen under the CICS RB
This message can be issued in any of the following circumstances:
– An error occurs in CICS SVC code.– An error occurs in a CICS z/OS Communications Server exit. – CICS detects a runaway task during the execution of an MVS service request.– An error occurs during the execution of an SVC request that was made by CICS or an access
method invoked by CICS.7. After either of these messages, data that is likely to be related to the problem is shown. The data
shown depends on whether the error happened under the CICS request block.
• If the error happened under the CICS RB, the error data in the task storage report is based on valuesin the PSW and the CICS registers at the time the error was detected. Figure 15 on page 121 showsthe storage report for a task that failed when a program check was detected. It illustrates the errordata supplied when an error happens under the CICS RB.
• If the error did not happen under the CICS RB, for example when CICS was calling an MVS service,you get data based on two sets of registers and PSWs. The registers and PSW of the CICS RBat the time of the error constitute one set. The registers and PSW of the RB in which the erroroccurred constitute the other set. This data will relate, very probably, to the execution of an SVCroutine called by CICS. The error might have occurred, however, during an IRB interrupt or inan SRB. You can confirm whether this has happened by checking flags KERNEL_ERROR_IRB andKERNEL_ERROR_SRB_MODE.
For more information about this data in the task storage report, see “The storage addressed by theCICS registers and PSW” on page 123.
122 CICS TS for z/OS: Troubleshooting CICS
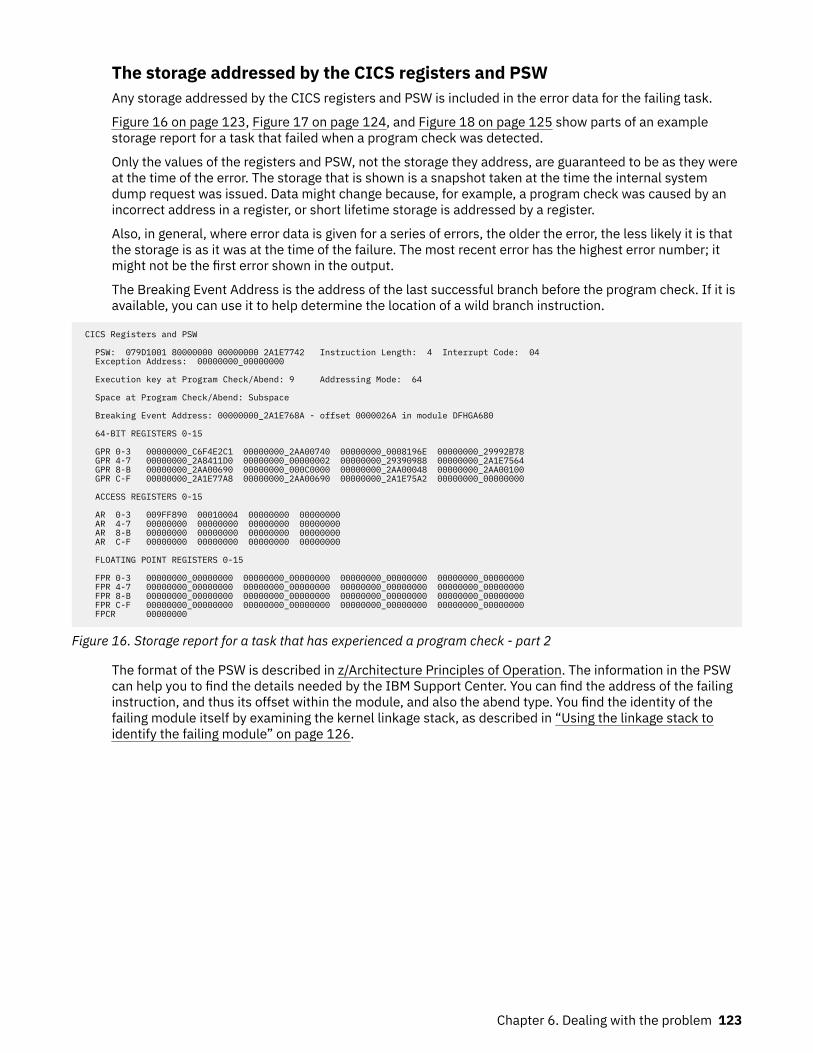
The storage addressed by the CICS registers and PSWAny storage addressed by the CICS registers and PSW is included in the error data for the failing task.
Figure 16 on page 123, Figure 17 on page 124, and Figure 18 on page 125 show parts of an examplestorage report for a task that failed when a program check was detected.
Only the values of the registers and PSW, not the storage they address, are guaranteed to be as they wereat the time of the error. The storage that is shown is a snapshot taken at the time the internal systemdump request was issued. Data might change because, for example, a program check was caused by anincorrect address in a register, or short lifetime storage is addressed by a register.
Also, in general, where error data is given for a series of errors, the older the error, the less likely it is thatthe storage is as it was at the time of the failure. The most recent error has the highest error number; itmight not be the first error shown in the output.
The Breaking Event Address is the address of the last successful branch before the program check. If it isavailable, you can use it to help determine the location of a wild branch instruction.
CICS Registers and PSW
PSW: 079D1001 80000000 00000000 2A1E7742 Instruction Length: 4 Interrupt Code: 04 Exception Address: 00000000_00000000
Execution key at Program Check/Abend: 9 Addressing Mode: 64
Space at Program Check/Abend: Subspace
Breaking Event Address: 00000000_2A1E768A - offset 0000026A in module DFHGA680
64-BIT REGISTERS 0-15
GPR 0-3 00000000_C6F4E2C1 00000000_2AA00740 00000000_0008196E 00000000_29992B78 GPR 4-7 00000000_2A8411D0 00000000_00000002 00000000_29390988 00000000_2A1E7564 GPR 8-B 00000000_2AA00690 00000000_000C0000 00000000_2AA00048 00000000_2AA00100 GPR C-F 00000000_2A1E77A8 00000000_2AA00690 00000000_2A1E75A2 00000000_00000000
ACCESS REGISTERS 0-15
AR 0-3 009FF890 00010004 00000000 00000000 AR 4-7 00000000 00000000 00000000 00000000 AR 8-B 00000000 00000000 00000000 00000000 AR C-F 00000000 00000000 00000000 00000000
FLOATING POINT REGISTERS 0-15
FPR 0-3 00000000_00000000 00000000_00000000 00000000_00000000 00000000_00000000 FPR 4-7 00000000_00000000 00000000_00000000 00000000_00000000 00000000_00000000 FPR 8-B 00000000_00000000 00000000_00000000 00000000_00000000 00000000_00000000 FPR C-F 00000000_00000000 00000000_00000000 00000000_00000000 00000000_00000000 FPCR 00000000
Figure 16. Storage report for a task that has experienced a program check - part 2
The format of the PSW is described in z/Architecture Principles of Operation. The information in the PSWcan help you to find the details needed by the IBM Support Center. You can find the address of the failinginstruction, and thus its offset within the module, and also the abend type. You find the identity of thefailing module itself by examining the kernel linkage stack, as described in “Using the linkage stack toidentify the failing module” on page 126.
Chapter 6. Dealing with the problem 123
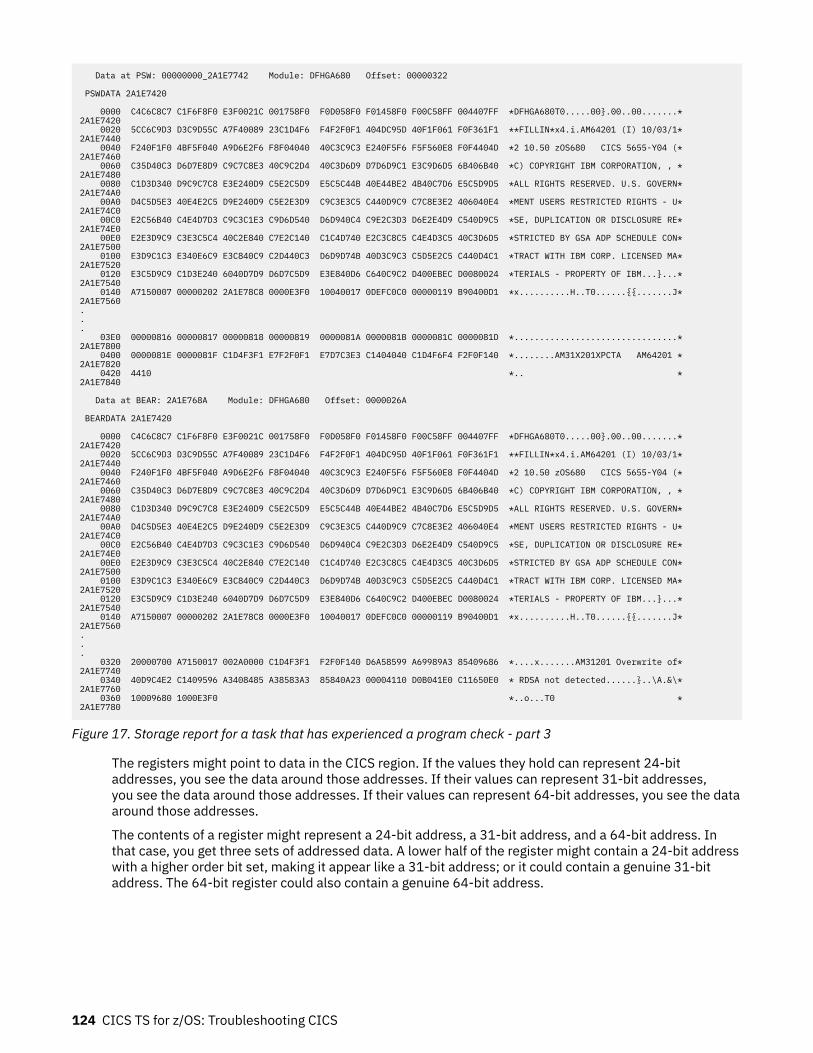
Data at PSW: 00000000_2A1E7742 Module: DFHGA680 Offset: 00000322
PSWDATA 2A1E7420
0000 C4C6C8C7 C1F6F8F0 E3F0021C 001758F0 F0D058F0 F01458F0 F00C58FF 004407FF *DFHGA680T0.....00}.00..00.......* 2A1E7420 0020 5CC6C9D3 D3C9D55C A7F40089 23C1D4F6 F4F2F0F1 404DC95D 40F1F061 F0F361F1 **FILLIN*x4.i.AM64201 (I) 10/03/1* 2A1E7440 0040 F240F1F0 4BF5F040 A9D6E2F6 F8F04040 40C3C9C3 E240F5F6 F5F560E8 F0F4404D *2 10.50 zOS680 CICS 5655-Y04 (* 2A1E7460 0060 C35D40C3 D6D7E8D9 C9C7C8E3 40C9C2D4 40C3D6D9 D7D6D9C1 E3C9D6D5 6B406B40 *C) COPYRIGHT IBM CORPORATION, , * 2A1E7480 0080 C1D3D340 D9C9C7C8 E3E240D9 C5E2C5D9 E5C5C44B 40E44BE2 4B40C7D6 E5C5D9D5 *ALL RIGHTS RESERVED. U.S. GOVERN* 2A1E74A0 00A0 D4C5D5E3 40E4E2C5 D9E240D9 C5E2E3D9 C9C3E3C5 C440D9C9 C7C8E3E2 406040E4 *MENT USERS RESTRICTED RIGHTS - U* 2A1E74C0 00C0 E2C56B40 C4E4D7D3 C9C3C1E3 C9D6D540 D6D940C4 C9E2C3D3 D6E2E4D9 C540D9C5 *SE, DUPLICATION OR DISCLOSURE RE* 2A1E74E0 00E0 E2E3D9C9 C3E3C5C4 40C2E840 C7E2C140 C1C4D740 E2C3C8C5 C4E4D3C5 40C3D6D5 *STRICTED BY GSA ADP SCHEDULE CON* 2A1E7500 0100 E3D9C1C3 E340E6C9 E3C840C9 C2D440C3 D6D9D74B 40D3C9C3 C5D5E2C5 C440D4C1 *TRACT WITH IBM CORP. LICENSED MA* 2A1E7520 0120 E3C5D9C9 C1D3E240 6040D7D9 D6D7C5D9 E3E840D6 C640C9C2 D400EBEC D0080024 *TERIALS - PROPERTY OF IBM...}...* 2A1E7540 0140 A7150007 00000202 2A1E78C8 0000E3F0 10040017 0DEFC0C0 00000119 B90400D1 *x..........H..T0......{{.......J* 2A1E7560... 03E0 00000816 00000817 00000818 00000819 0000081A 0000081B 0000081C 0000081D *................................* 2A1E7800 0400 0000081E 0000081F C1D4F3F1 E7F2F0F1 E7D7C3E3 C1404040 C1D4F6F4 F2F0F140 *........AM31X201XPCTA AM64201 * 2A1E7820 0420 4410 *.. * 2A1E7840
Data at BEAR: 2A1E768A Module: DFHGA680 Offset: 0000026A
BEARDATA 2A1E7420
0000 C4C6C8C7 C1F6F8F0 E3F0021C 001758F0 F0D058F0 F01458F0 F00C58FF 004407FF *DFHGA680T0.....00}.00..00.......* 2A1E7420 0020 5CC6C9D3 D3C9D55C A7F40089 23C1D4F6 F4F2F0F1 404DC95D 40F1F061 F0F361F1 **FILLIN*x4.i.AM64201 (I) 10/03/1* 2A1E7440 0040 F240F1F0 4BF5F040 A9D6E2F6 F8F04040 40C3C9C3 E240F5F6 F5F560E8 F0F4404D *2 10.50 zOS680 CICS 5655-Y04 (* 2A1E7460 0060 C35D40C3 D6D7E8D9 C9C7C8E3 40C9C2D4 40C3D6D9 D7D6D9C1 E3C9D6D5 6B406B40 *C) COPYRIGHT IBM CORPORATION, , * 2A1E7480 0080 C1D3D340 D9C9C7C8 E3E240D9 C5E2C5D9 E5C5C44B 40E44BE2 4B40C7D6 E5C5D9D5 *ALL RIGHTS RESERVED. U.S. GOVERN* 2A1E74A0 00A0 D4C5D5E3 40E4E2C5 D9E240D9 C5E2E3D9 C9C3E3C5 C440D9C9 C7C8E3E2 406040E4 *MENT USERS RESTRICTED RIGHTS - U* 2A1E74C0 00C0 E2C56B40 C4E4D7D3 C9C3C1E3 C9D6D540 D6D940C4 C9E2C3D3 D6E2E4D9 C540D9C5 *SE, DUPLICATION OR DISCLOSURE RE* 2A1E74E0 00E0 E2E3D9C9 C3E3C5C4 40C2E840 C7E2C140 C1C4D740 E2C3C8C5 C4E4D3C5 40C3D6D5 *STRICTED BY GSA ADP SCHEDULE CON* 2A1E7500 0100 E3D9C1C3 E340E6C9 E3C840C9 C2D440C3 D6D9D74B 40D3C9C3 C5D5E2C5 C440D4C1 *TRACT WITH IBM CORP. LICENSED MA* 2A1E7520 0120 E3C5D9C9 C1D3E240 6040D7D9 D6D7C5D9 E3E840D6 C640C9C2 D400EBEC D0080024 *TERIALS - PROPERTY OF IBM...}...* 2A1E7540 0140 A7150007 00000202 2A1E78C8 0000E3F0 10040017 0DEFC0C0 00000119 B90400D1 *x..........H..T0......{{.......J* 2A1E7560... 0320 20000700 A7150017 002A0000 C1D4F3F1 F2F0F140 D6A58599 A69989A3 85409686 *....x.......AM31201 Overwrite of* 2A1E7740 0340 40D9C4E2 C1409596 A3408485 A38583A3 85840A23 00004110 D0B041E0 C11650E0 * RDSA not detected......}..\A.&\* 2A1E7760 0360 10009680 1000E3F0 *..o...T0 * 2A1E7780
Figure 17. Storage report for a task that has experienced a program check - part 3
The registers might point to data in the CICS region. If the values they hold can represent 24-bitaddresses, you see the data around those addresses. If their values can represent 31-bit addresses,you see the data around those addresses. If their values can represent 64-bit addresses, you see the dataaround those addresses.
The contents of a register might represent a 24-bit address, a 31-bit address, and a 64-bit address. Inthat case, you get three sets of addressed data. A lower half of the register might contain a 24-bit addresswith a higher order bit set, making it appear like a 31-bit address; or it could contain a genuine 31-bitaddress. The 64-bit register could also contain a genuine 64-bit address.
124 CICS TS for z/OS: Troubleshooting CICS
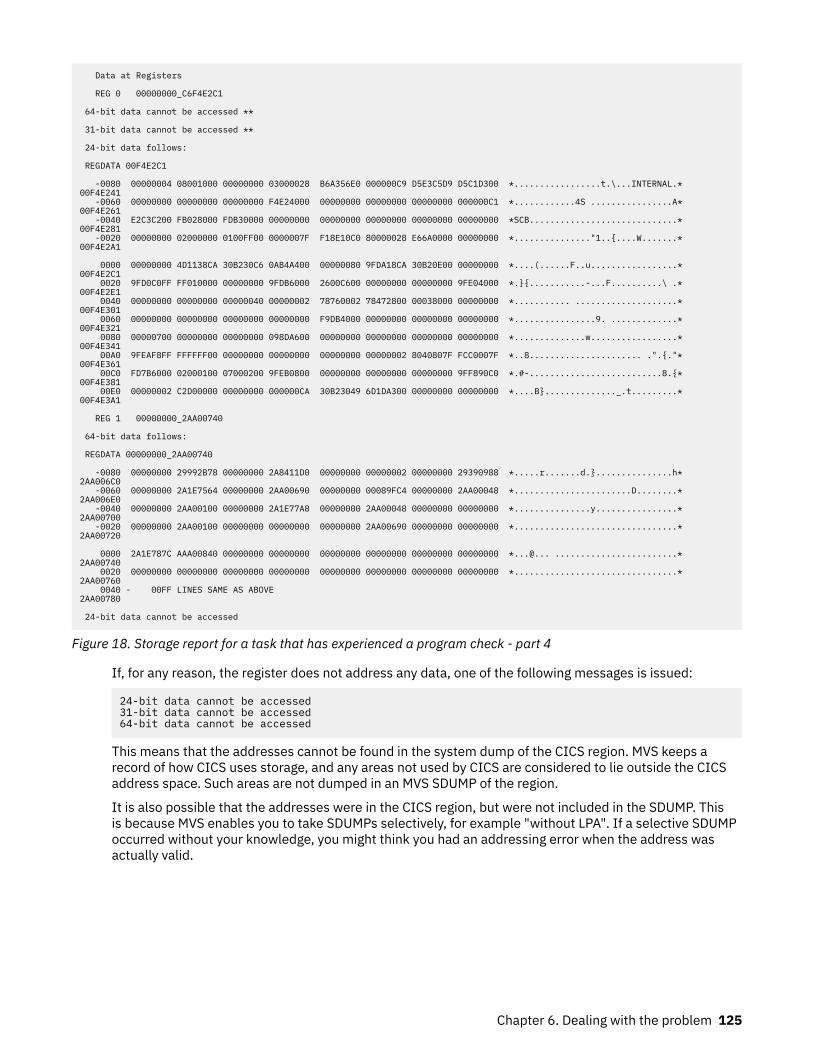
Data at Registers
REG 0 00000000_C6F4E2C1
64-bit data cannot be accessed **
31-bit data cannot be accessed **
24-bit data follows:
REGDATA 00F4E2C1
-0080 00000004 08001000 00000000 03000028 B6A356E0 000000C9 D5E3C5D9 D5C1D300 *.................t.\...INTERNAL.* 00F4E241 -0060 00000000 00000000 00000000 F4E24000 00000000 00000000 00000000 000000C1 *............4S ................A* 00F4E261 -0040 E2C3C200 FB028000 FDB30000 00000000 00000000 00000000 00000000 00000000 *SCB.............................* 00F4E281 -0020 00000000 02000000 0100FF00 0000007F F18E10C0 80000028 E66A0000 00000000 *..............."1..{....W.......* 00F4E2A1
0000 00000000 4D1138CA 30B230C6 0AB4A400 00000080 9FDA18CA 30B20E00 00000000 *....(......F..u.................* 00F4E2C1 0020 9FD0C0FF FF010000 00000000 9FDB6000 2600C600 00000000 00000000 9FE04000 *.}{...........-...F..........\ .* 00F4E2E1 0040 00000000 00000000 00000040 00000002 78760002 78472800 00038000 00000000 *........... ....................* 00F4E301 0060 00000000 00000000 00000000 00000000 F9DB4000 00000000 00000000 00000000 *................9. .............* 00F4E321 0080 00000700 00000000 00000000 098DA600 00000000 00000000 00000000 00000000 *..............w.................* 00F4E341 00A0 9FEAF8FF FFFFFF00 00000000 00000000 00000000 00000002 8040807F FCC0007F *..8...................... .".{."* 00F4E361 00C0 FD7B6000 02000100 07000200 9FEB0800 00000000 00000000 00000000 9FF890C0 *.#-..........................8.{* 00F4E381 00E0 00000002 C2D00000 00000000 000000CA 30B23049 6D1DA300 00000000 00000000 *....B}.............._.t.........* 00F4E3A1
REG 1 00000000_2AA00740
64-bit data follows:
REGDATA 00000000_2AA00740
-0080 00000000 29992B78 00000000 2A8411D0 00000000 00000002 00000000 29390988 *.....r.......d.}...............h* 2AA006C0 -0060 00000000 2A1E7564 00000000 2AA00690 00000000 00089FC4 00000000 2AA00048 *.......................D........* 2AA006E0 -0040 00000000 2AA00100 00000000 2A1E77A8 00000000 2AA00048 00000000 00000000 *...............y................* 2AA00700 -0020 00000000 2AA00100 00000000 00000000 00000000 2AA00690 00000000 00000000 *................................* 2AA00720
0000 2A1E787C AAA00840 00000000 00000000 00000000 00000000 00000000 00000000 *...@... ........................* 2AA00740 0020 00000000 00000000 00000000 00000000 00000000 00000000 00000000 00000000 *................................* 2AA00760 0040 - 00FF LINES SAME AS ABOVE 2AA00780
24-bit data cannot be accessed
Figure 18. Storage report for a task that has experienced a program check - part 4
If, for any reason, the register does not address any data, one of the following messages is issued:
24-bit data cannot be accessed31-bit data cannot be accessed64-bit data cannot be accessed
This means that the addresses cannot be found in the system dump of the CICS region. MVS keeps arecord of how CICS uses storage, and any areas not used by CICS are considered to lie outside the CICSaddress space. Such areas are not dumped in an MVS SDUMP of the region.
It is also possible that the addresses were in the CICS region, but were not included in the SDUMP. Thisis because MVS enables you to take SDUMPs selectively, for example "without LPA". If a selective SDUMPoccurred without your knowledge, you might think you had an addressing error when the address wasactually valid.
Chapter 6. Dealing with the problem 125
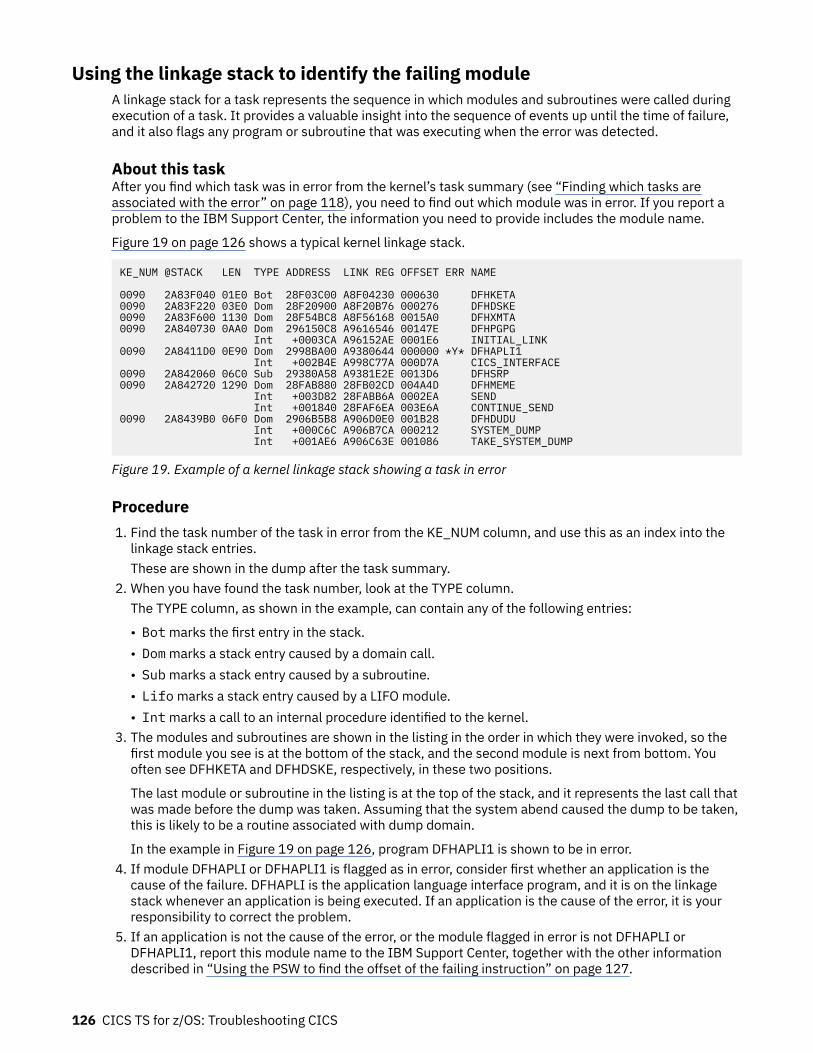
Using the linkage stack to identify the failing moduleA linkage stack for a task represents the sequence in which modules and subroutines were called duringexecution of a task. It provides a valuable insight into the sequence of events up until the time of failure,and it also flags any program or subroutine that was executing when the error was detected.
About this taskAfter you find which task was in error from the kernel’s task summary (see “Finding which tasks areassociated with the error” on page 118), you need to find out which module was in error. If you report aproblem to the IBM Support Center, the information you need to provide includes the module name.
Figure 19 on page 126 shows a typical kernel linkage stack.
KE_NUM @STACK LEN TYPE ADDRESS LINK REG OFFSET ERR NAME
0090 2A83F040 01E0 Bot 28F03C00 A8F04230 000630 DFHKETA0090 2A83F220 03E0 Dom 28F20900 A8F20B76 000276 DFHDSKE0090 2A83F600 1130 Dom 28F54BC8 A8F56168 0015A0 DFHXMTA0090 2A840730 0AA0 Dom 296150C8 A9616546 00147E DFHPGPG Int +0003CA A96152AE 0001E6 INITIAL_LINK0090 2A8411D0 0E90 Dom 2998BA00 A9380644 000000 *Y* DFHAPLI1 Int +002B4E A998C77A 000D7A CICS_INTERFACE0090 2A842060 06C0 Sub 29380A58 A9381E2E 0013D6 DFHSRP0090 2A842720 1290 Dom 28FAB880 28FB02CD 004A4D DFHMEME Int +003D82 28FABB6A 0002EA SEND Int +001840 28FAF6EA 003E6A CONTINUE_SEND0090 2A8439B0 06F0 Dom 2906B5B8 A906D0E0 001B28 DFHDUDU Int +000C6C A906B7CA 000212 SYSTEM_DUMP Int +001AE6 A906C63E 001086 TAKE_SYSTEM_DUMP
Figure 19. Example of a kernel linkage stack showing a task in error
Procedure1. Find the task number of the task in error from the KE_NUM column, and use this as an index into the
linkage stack entries.These are shown in the dump after the task summary.
2. When you have found the task number, look at the TYPE column.The TYPE column, as shown in the example, can contain any of the following entries:
• Bot marks the first entry in the stack.• Dom marks a stack entry caused by a domain call.• Sub marks a stack entry caused by a subroutine.• Lifo marks a stack entry caused by a LIFO module.• Int marks a call to an internal procedure identified to the kernel.
3. The modules and subroutines are shown in the listing in the order in which they were invoked, so thefirst module you see is at the bottom of the stack, and the second module is next from bottom. Youoften see DFHKETA and DFHDSKE, respectively, in these two positions.
The last module or subroutine in the listing is at the top of the stack, and it represents the last call thatwas made before the dump was taken. Assuming that the system abend caused the dump to be taken,this is likely to be a routine associated with dump domain.
In the example in Figure 19 on page 126, program DFHAPLI1 is shown to be in error.4. If module DFHAPLI or DFHAPLI1 is flagged as in error, consider first whether an application is the
cause of the failure. DFHAPLI is the application language interface program, and it is on the linkagestack whenever an application is being executed. If an application is the cause of the error, it is yourresponsibility to correct the problem.
5. If an application is not the cause of the error, or the module flagged in error is not DFHAPLI orDFHAPLI1, report this module name to the IBM Support Center, together with the other informationdescribed in “Using the PSW to find the offset of the failing instruction” on page 127.
126 CICS TS for z/OS: Troubleshooting CICS
What to do nextYou can sometimes use the technique described in this section to gather the information that the IBMSupport Center needs to resolve a CICS system abend. However, you should normally use the summaryinformation presented in the formatted output for the kernel domain storage areas. This method is validonly if the abend has occurred in a module or subroutine that has a kernel linkage stack entry. This is thecase only where the module or subroutine has been invoked by one of the following mechanisms:
• A kernel domain call• A kernel subroutine call• A call to an internal procedure identified to the kernel• A LIFO call
Routines that have been invoked by assembler language BALR instructions do not have kernel linkagestack entries.
Using the PSW to find the offset of the failing instructionYou can calculate the offset of the failing instruction from the PSW, although in practice you seldom needto because the offset is quoted in the storage report for the task.
Before you beginFor details about format of the PSW, or how to calculate the offset, see z/Architecture Principles ofOperation.
About this taskIf you report a problem to the IBM Support Center, the information you need to provide includes theinstruction at the offset.
Procedure1. Locate the address of the failing instruction in the dump, and find out what instruction is there.
It is sufficient to give the hex code for the instruction, but make sure you quote as many bytes as youfound from the PSW instruction length field.
2. Identify the abend type from the program interrupt code, so that you can report that too.For example, it might be protection exception (interrupt code 0004), or data exception (interrupt code0007). For a list of program interrupt codes (PICs), see “What type of program check occurred?” onpage 108.
Finding the PTF level of the module in errorThe IBM Support Center needs to know the PTF level of any module reported to them as being in error.You can find this in the loader domain program storage map summary, which you can get using the dumpformatting keyword LD.
Figure 20 on page 128 shows some entries from a typical program storage map summary.
Chapter 6. Dealing with the problem 127
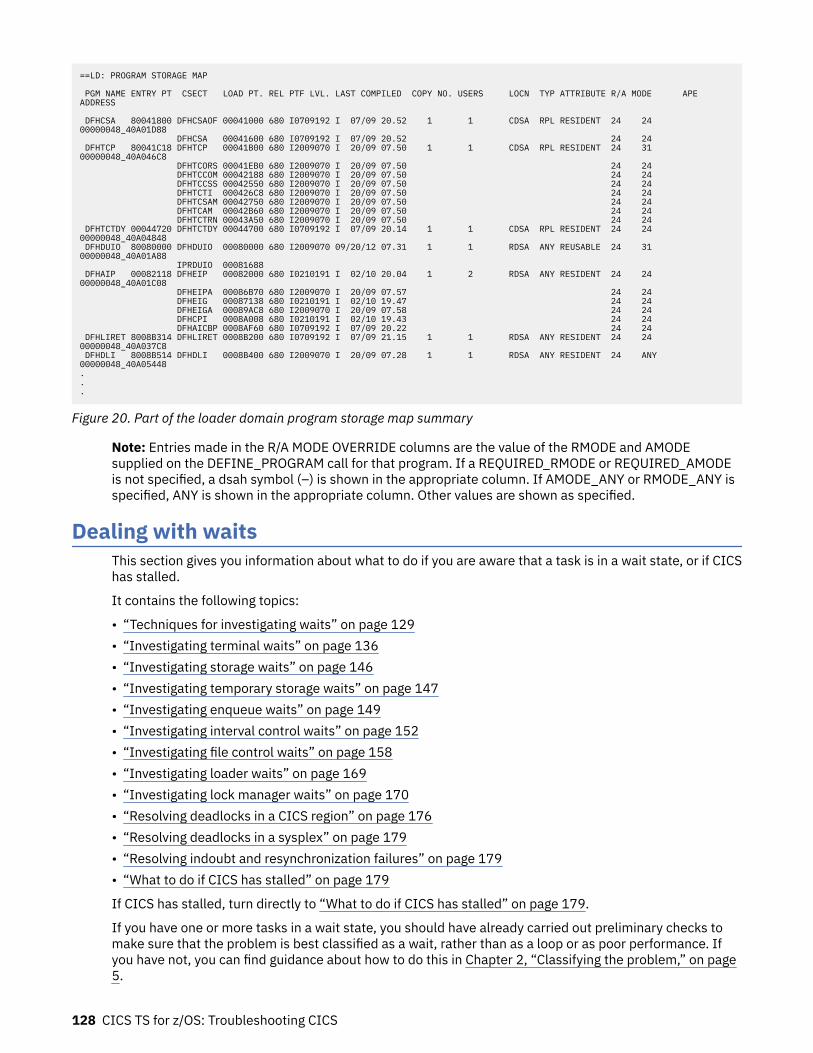
==LD: PROGRAM STORAGE MAP
PGM NAME ENTRY PT CSECT LOAD PT. REL PTF LVL. LAST COMPILED COPY NO. USERS LOCN TYP ATTRIBUTE R/A MODE APE ADDRESS
DFHCSA 80041800 DFHCSAOF 00041000 680 I0709192 I 07/09 20.52 1 1 CDSA RPL RESIDENT 24 24 00000048_40A01D88 DFHCSA 00041600 680 I0709192 I 07/09 20.52 24 24 DFHTCP 80041C18 DFHTCP 00041B00 680 I2009070 I 20/09 07.50 1 1 CDSA RPL RESIDENT 24 31 00000048_40A046C8 DFHTCORS 00041EB0 680 I2009070 I 20/09 07.50 24 24 DFHTCCOM 00042188 680 I2009070 I 20/09 07.50 24 24 DFHTCCSS 00042550 680 I2009070 I 20/09 07.50 24 24 DFHTCTI 000426C8 680 I2009070 I 20/09 07.50 24 24 DFHTCSAM 00042750 680 I2009070 I 20/09 07.50 24 24 DFHTCAM 00042B60 680 I2009070 I 20/09 07.50 24 24 DFHTCTRN 00043A50 680 I2009070 I 20/09 07.50 24 24 DFHTCTDY 00044720 DFHTCTDY 00044700 680 I0709192 I 07/09 20.14 1 1 CDSA RPL RESIDENT 24 24 00000048_40A04848 DFHDUIO 80080000 DFHDUIO 00080000 680 I2009070 09/20/12 07.31 1 1 RDSA ANY REUSABLE 24 31 00000048_40A01A88 IPRDUIO 00081688 DFHAIP 00082118 DFHEIP 00082000 680 I0210191 I 02/10 20.04 1 2 RDSA ANY RESIDENT 24 24 00000048_40A01C08 DFHEIPA 00086B70 680 I2009070 I 20/09 07.57 24 24 DFHEIG 00087138 680 I0210191 I 02/10 19.47 24 24 DFHEIGA 00089AC8 680 I2009070 I 20/09 07.58 24 24 DFHCPI 0008A008 680 I0210191 I 02/10 19.43 24 24 DFHAICBP 0008AF60 680 I0709192 I 07/09 20.22 24 24 DFHLIRET 8008B314 DFHLIRET 0008B200 680 I0709192 I 07/09 21.15 1 1 RDSA ANY RESIDENT 24 24 00000048_40A037C8 DFHDLI 8008B514 DFHDLI 0008B400 680 I2009070 I 20/09 07.28 1 1 RDSA ANY RESIDENT 24 ANY 00000048_40A05448...
Figure 20. Part of the loader domain program storage map summary
Note: Entries made in the R/A MODE OVERRIDE columns are the value of the RMODE and AMODEsupplied on the DEFINE_PROGRAM call for that program. If a REQUIRED_RMODE or REQUIRED_AMODEis not specified, a dsah symbol (–) is shown in the appropriate column. If AMODE_ANY or RMODE_ANY isspecified, ANY is shown in the appropriate column. Other values are shown as specified.
Dealing with waitsThis section gives you information about what to do if you are aware that a task is in a wait state, or if CICShas stalled.
It contains the following topics:
• “Techniques for investigating waits” on page 129• “Investigating terminal waits” on page 136• “Investigating storage waits” on page 146• “Investigating temporary storage waits” on page 147• “Investigating enqueue waits” on page 149• “Investigating interval control waits” on page 152• “Investigating file control waits” on page 158• “Investigating loader waits” on page 169• “Investigating lock manager waits” on page 170• “Resolving deadlocks in a CICS region” on page 176• “Resolving deadlocks in a sysplex” on page 179• “Resolving indoubt and resynchronization failures” on page 179• “What to do if CICS has stalled” on page 179
If CICS has stalled, turn directly to “What to do if CICS has stalled” on page 179.
If you have one or more tasks in a wait state, you should have already carried out preliminary checks tomake sure that the problem is best classified as a wait, rather than as a loop or as poor performance. Ifyou have not, you can find guidance about how to do this in Chapter 2, “Classifying the problem,” on page5.
128 CICS TS for z/OS: Troubleshooting CICS
You are unlikely to have direct evidence that a CICS system task is in a wait state, except from a detailedexamination of trace. You are more likely to have noticed that one of your user tasks, or possibly a CICSuser task - that is, an instance of a CICS-supplied transaction - is waiting. In such a case, it is possiblethat a waiting CICS system task could be the cause of the user task having to wait.
For the purpose of this section a task is considered to be in a wait state if it has been suspended afterfirst starting to run. The task is not in a wait state if it has been attached to the transaction managerbut has not yet started to run, or if it has been resumed after waiting but cannot, for some reason, startrunning. These are best regarded as performance problems. Tasks that are ready to run but cannot bedispatched might, for example, have too low a priority, or the CICS system might be at the MXT limit, orthe CICS system might be under stress (short on storage). If you think you might have such a problem,read “Dealing with performance problems” on page 222.
Most tasks are suspended at least once during their execution, for example while they wait for file I/Oto take place. This is part of the regular flow of control, and it gives other tasks a chance to run in themeantime. It is only when they stay suspended longer than they should that a problem arises.
There are two stages in resolving most wait problems involving user tasks. The first stage involves findingout what resource the suspended task is waiting for, and the second stage involves finding out whythat resource is not available. This section focuses principally on the first of these objectives. However,in some cases there are suggestions of ways in which the constraints on resource availability can berelieved.
If you know that a CICS system task is in a wait state, it does not necessarily indicate an error in CICS.Some system tasks spend long periods in wait states, while they are waiting for work to do. For moreinformation about waiting system tasks, see “CICS system task waits” on page 213.
Techniques for investigating waitsYou can investigate waits in a CICS system by online inquiry, by tracing, or by analysis of the formattedCICS system dump. The last two techniques are, to some extent, complementary.
Online inquiry is the least powerful technique, and it can only tell you what resource a suspended usertask is waiting for. This is enough information to locate the failing area, but you often need to do moreinvestigation before you can solve the problem. The advantage of online inquiry is that you can find outabout the waiting task as soon as you detect the problem, and so you capture the data early.
Tracing can give you much more detail than online inquiry, but it involves significant processing overhead.It must also be running with the appropriate options selected when the task first enters a wait state,so this usually means you need to reproduce the problem. However, the information it gives you aboutsystem activity in the period leading up to the wait is likely to provide much of the information you need tosolve the problem.
A CICS system dump can give you a picture of the state of the CICS system at an instant during the wait.You can request the dump as soon as you notice that a task has entered a wait state, so it gives you earlydata capture for the problem. However, the dump is unlikely to tell you anything about system activityin the period leading up to the wait, even if you had internal tracing running with the correct selectivitywhen the task entered the wait. This is because the trace table has probably wrapped before you havehad a chance to respond. However, the formatted dump might contain much of the information you needto solve the problem.
If you are able to reproduce the problem, consider using auxiliary tracing and dumping in combination.
Investigating waits - online methodOnline, you can use either CEMT INQ TASK or EXEC CICS INQUIRE TASK to find out what resource auser task is waiting on. EXEC CICS INQUIRE TASK can be executed under CECI, or from a user program.Whatever online method you use, you need to supply the task ID of the suspended user task.
If the task is suspended, the information that is returned to you includes the resource type or theresource name identifying the unavailable resource. CEMT INQ TASK displays:
• the resource type of the unavailable resource in the HTYPE field.
Chapter 6. Dealing with the problem 129
• the resource name of the unavailable resource in the HVALUE field.
EXEC CICS INQUIRE TASK returns values in the SUSPENDTYPE and SUSPENDVALUE fields whichcorrespond to the resource type and resource name of the unavailable resource.
HTYPE and SUSPENDTYPE, and HVALUE and SUSPENDVALUE correspond to the values in the resourcetype and resource name fields of the dispatcher task summary.
Table 17 on page 184 gives a list of all the resource types and resource names that user tasks might besuspended on, and references showing where to look next for guidance about solving the wait.
You probably need a system dump of the appropriate CICS region to investigate the wait. If you do not yethave one, you can get one using CEMT PERFORM SNAP or CEMT PERFORM DUMP - but make sure the taskis still in a wait state when you take the dump. You subsequently need to format the dump using keywordsfor the given resource type. Advice on which keywords to use is given, where appropriate, in the individualsections.
Investigating waits using traceYou can find detailed information about the suspension and resumption of tasks during a run of CICS bystudying the trace table. Tracing must, of course, be running when the task in question is suspended orresumed, and the tracing options must be selected correctly.
When you look at the trace table, you can find trace entries relating to a particular task from the tasknumbers that the entries contain. Each is unique to a task so you can be sure that, for any run of CICS,trace entries having the same task number belong to the same task.
For general guidance about setting tracing options and interpreting trace entries, see Using CICS trace.
Setting up trace for wait problems
About this taskGate DSSR of the dispatcher domain provides the major functions associated with the suspension andresumption of tasks. (See “How tasks are made to wait” on page 183.) The level-1 trace points DS 0004and DS 0005 are produced on entry to, and exit from, the gate.
Procedure1. Select tracing to capture the DS level-1 trace entries to investigate a wait problem.
You need to capture trace entries for other components as well, when you know what functional areasare involved. The functional area invoking the task wait might, for example, be terminal control (TC), orfile control (FC). Level-1 tracing is often enough for these components. However, there are cases, suchas those relating to VSAM I/O errors where level-2 trace is needed to examine the RPL as it is passedto VSAM.
2. Ensure that tracing is performed for the task that has the wait problem. Next, you can:a) Select special tracing for just that task, and disable tracing for all other tasks by setting the main
system trace flag off.b) Select special tracing for other tasks as well if it becomes clear that they are implicated in the wait.
Interpreting trace for wait problemsFor new-style trace entries, which include those for point IDs DS 0004 and DS 0005, the function beingtraced is shown explicitly in the interpretation string. The functions that can cause a task to enter a waitstate are identified in the table. Look out for these in particular in the trace entries for any waiting task youare investigating.
Each function has its own set of input and output parameters, and these, too, are shown in theinterpretation strings of the formatted trace entries. Input parameters are shown in the trace entriesmade from point ID DS 0004, and output parameters in the trace entries made from point ID DS 0005.
130 CICS TS for z/OS: Troubleshooting CICS
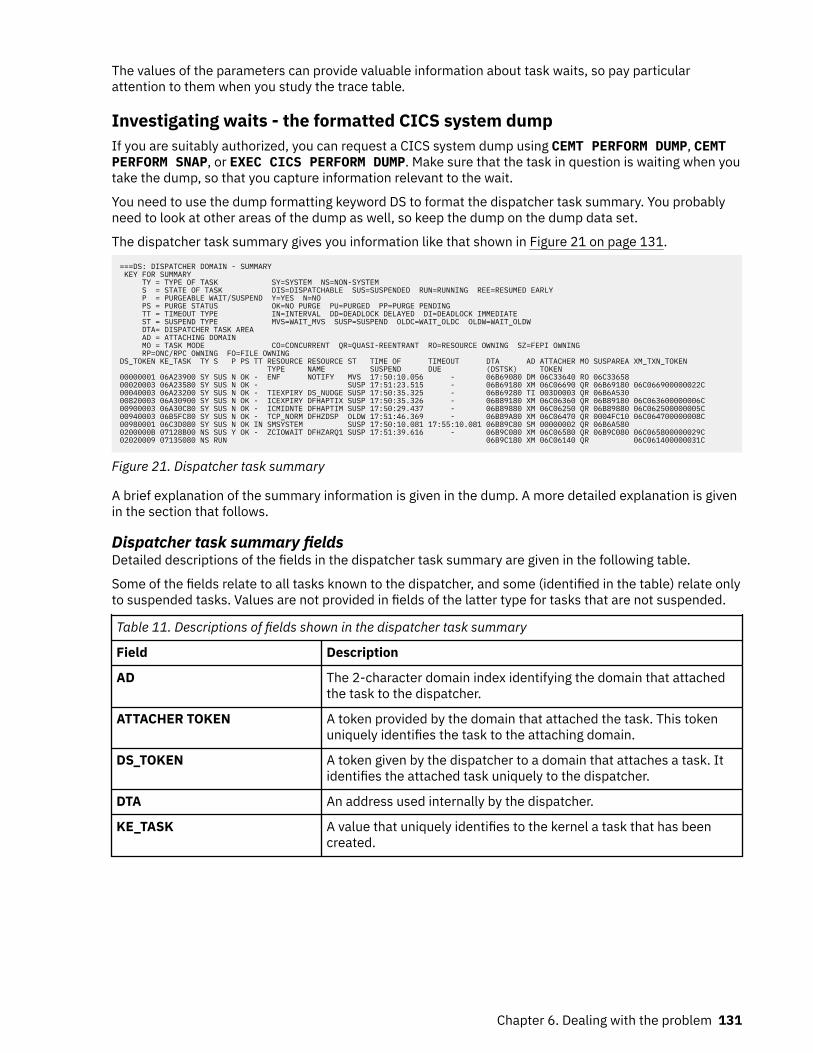
The values of the parameters can provide valuable information about task waits, so pay particularattention to them when you study the trace table.
Investigating waits - the formatted CICS system dumpIf you are suitably authorized, you can request a CICS system dump using CEMT PERFORM DUMP, CEMTPERFORM SNAP, or EXEC CICS PERFORM DUMP. Make sure that the task in question is waiting when youtake the dump, so that you capture information relevant to the wait.
You need to use the dump formatting keyword DS to format the dispatcher task summary. You probablyneed to look at other areas of the dump as well, so keep the dump on the dump data set.
The dispatcher task summary gives you information like that shown in Figure 21 on page 131.
===DS: DISPATCHER DOMAIN - SUMMARY KEY FOR SUMMARY TY = TYPE OF TASK SY=SYSTEM NS=NON-SYSTEM S = STATE OF TASK DIS=DISPATCHABLE SUS=SUSPENDED RUN=RUNNING REE=RESUMED EARLY P = PURGEABLE WAIT/SUSPEND Y=YES N=NO PS = PURGE STATUS OK=NO PURGE PU=PURGED PP=PURGE PENDING TT = TIMEOUT TYPE IN=INTERVAL DD=DEADLOCK DELAYED DI=DEADLOCK IMMEDIATE ST = SUSPEND TYPE MVS=WAIT_MVS SUSP=SUSPEND OLDC=WAIT_OLDC OLDW=WAIT_OLDW DTA= DISPATCHER TASK AREA AD = ATTACHING DOMAIN MO = TASK MODE CO=CONCURRENT QR=QUASI-REENTRANT RO=RESOURCE OWNING SZ=FEPI OWNING RP=ONC/RPC OWNING FO=FILE OWNINGDS_TOKEN KE_TASK TY S P PS TT RESOURCE RESOURCE ST TIME OF TIMEOUT DTA AD ATTACHER MO SUSPAREA XM_TXN_TOKEN TYPE NAME SUSPEND DUE (DSTSK) TOKEN00000001 06A23900 SY SUS N OK - ENF NOTIFY MVS 17:50:10.056 - 06B69080 DM 06C33640 RO 06C3365800020003 06A23580 SY SUS N OK - SUSP 17:51:23.515 - 06B69180 XM 06C06690 QR 06B69180 06C066900000022C00040003 06A23200 SY SUS N OK - TIEXPIRY DS_NUDGE SUSP 17:50:35.325 - 06B69280 TI 003D0003 QR 06B6A53000820003 06A30900 SY SUS N OK - ICEXPIRY DFHAPTIX SUSP 17:50:35.326 - 06B89180 XM 06C06360 QR 06B89180 06C063600000006C00900003 06A30C80 SY SUS N OK - ICMIDNTE DFHAPTIM SUSP 17:50:29.437 - 06B89880 XM 06C06250 QR 06B89880 06C062500000005C00940003 06B5FC80 SY SUS N OK - TCP_NORM DFHZDSP OLDW 17:51:46.369 - 06B89A80 XM 06C06470 QR 0004FC10 06C064700000008C00980001 06C3D080 SY SUS N OK IN SMSYSTEM SUSP 17:50:10.081 17:55:10.081 06B89C80 SM 00000002 QR 06B6A5800200000B 07128B00 NS SUS Y OK - ZCIOWAIT DFHZARQ1 SUSP 17:51:39.616 - 06B9C080 XM 06C06580 QR 06B9C080 06C065800000029C02020009 07135080 NS RUN 06B9C180 XM 06C06140 QR 06C061400000031C
Figure 21. Dispatcher task summary
A brief explanation of the summary information is given in the dump. A more detailed explanation is givenin the section that follows.
Dispatcher task summary fieldsDetailed descriptions of the fields in the dispatcher task summary are given in the following table.
Some of the fields relate to all tasks known to the dispatcher, and some (identified in the table) relate onlyto suspended tasks. Values are not provided in fields of the latter type for tasks that are not suspended.
Table 11. Descriptions of fields shown in the dispatcher task summary
Field Description
AD The 2-character domain index identifying the domain that attachedthe task to the dispatcher.
ATTACHER TOKEN A token provided by the domain that attached the task. This tokenuniquely identifies the task to the attaching domain.
DS_TOKEN A token given by the dispatcher to a domain that attaches a task. Itidentifies the attached task uniquely to the dispatcher.
DTA An address used internally by the dispatcher.
KE_TASK A value that uniquely identifies to the kernel a task that has beencreated.
Chapter 6. Dealing with the problem 131
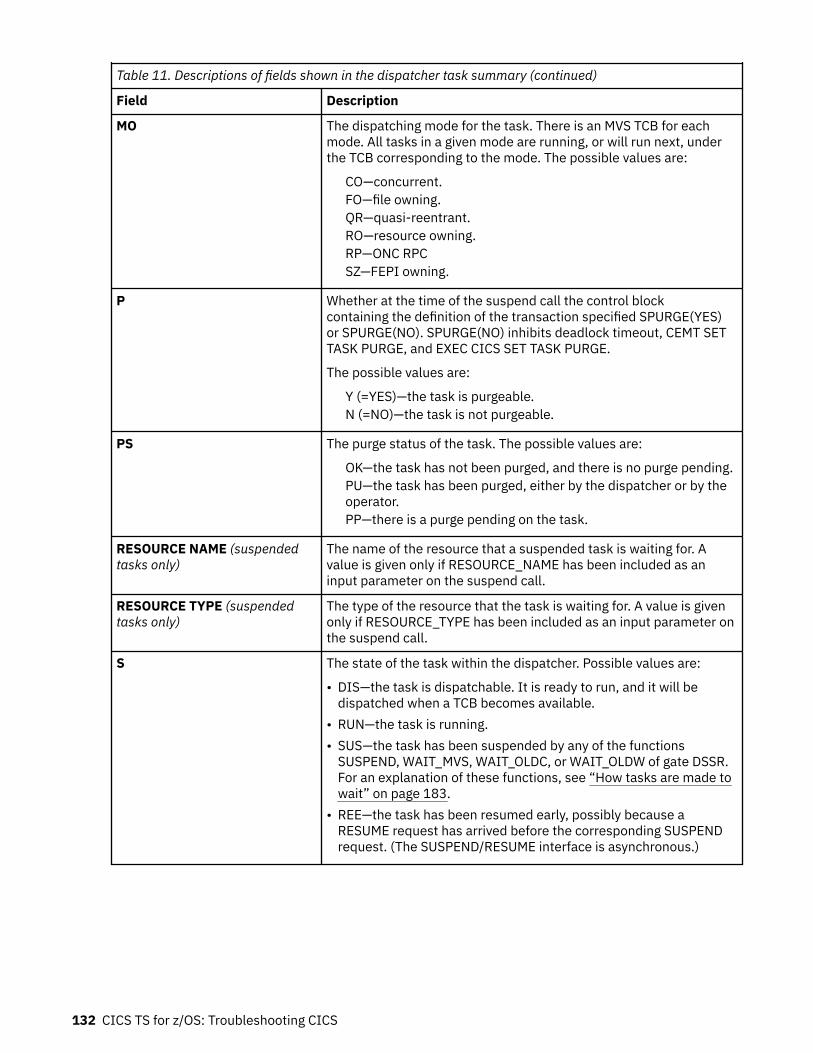
Table 11. Descriptions of fields shown in the dispatcher task summary (continued)
Field Description
MO The dispatching mode for the task. There is an MVS TCB for eachmode. All tasks in a given mode are running, or will run next, underthe TCB corresponding to the mode. The possible values are:
CO—concurrent.FO—file owning.QR—quasi-reentrant.RO—resource owning.RP—ONC RPCSZ—FEPI owning.
P Whether at the time of the suspend call the control blockcontaining the definition of the transaction specified SPURGE(YES)or SPURGE(NO). SPURGE(NO) inhibits deadlock timeout, CEMT SETTASK PURGE, and EXEC CICS SET TASK PURGE.
The possible values are:
Y (=YES)—the task is purgeable.N (=NO)—the task is not purgeable.
PS The purge status of the task. The possible values are:
OK—the task has not been purged, and there is no purge pending.PU—the task has been purged, either by the dispatcher or by theoperator.PP—there is a purge pending on the task.
RESOURCE NAME (suspendedtasks only)
The name of the resource that a suspended task is waiting for. Avalue is given only if RESOURCE_NAME has been included as aninput parameter on the suspend call.
RESOURCE TYPE (suspendedtasks only)
The type of the resource that the task is waiting for. A value is givenonly if RESOURCE_TYPE has been included as an input parameter onthe suspend call.
S The state of the task within the dispatcher. Possible values are:
• DIS—the task is dispatchable. It is ready to run, and it will bedispatched when a TCB becomes available.
• RUN—the task is running.• SUS—the task has been suspended by any of the functions
SUSPEND, WAIT_MVS, WAIT_OLDC, or WAIT_OLDW of gate DSSR.For an explanation of these functions, see “How tasks are made towait” on page 183.
• REE—the task has been resumed early, possibly because aRESUME request has arrived before the corresponding SUSPENDrequest. (The SUSPEND/RESUME interface is asynchronous.)
132 CICS TS for z/OS: Troubleshooting CICS
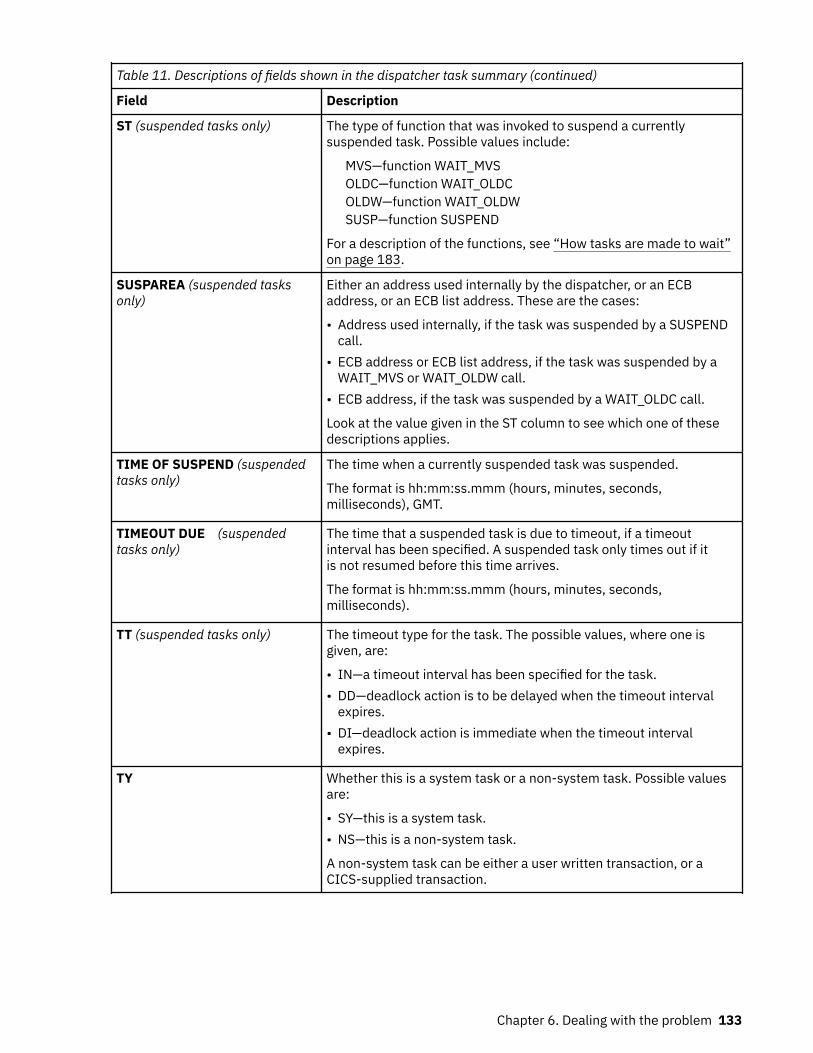
Table 11. Descriptions of fields shown in the dispatcher task summary (continued)
Field Description
ST (suspended tasks only) The type of function that was invoked to suspend a currentlysuspended task. Possible values include:
MVS—function WAIT_MVSOLDC—function WAIT_OLDCOLDW—function WAIT_OLDWSUSP—function SUSPEND
For a description of the functions, see “How tasks are made to wait”on page 183.
SUSPAREA (suspended tasksonly)
Either an address used internally by the dispatcher, or an ECBaddress, or an ECB list address. These are the cases:
• Address used internally, if the task was suspended by a SUSPENDcall.
• ECB address or ECB list address, if the task was suspended by aWAIT_MVS or WAIT_OLDW call.
• ECB address, if the task was suspended by a WAIT_OLDC call.
Look at the value given in the ST column to see which one of thesedescriptions applies.
TIME OF SUSPEND (suspendedtasks only)
The time when a currently suspended task was suspended.
The format is hh:mm:ss.mmm (hours, minutes, seconds,milliseconds), GMT.
TIMEOUT DUE (suspendedtasks only)
The time that a suspended task is due to timeout, if a timeoutinterval has been specified. A suspended task only times out if itis not resumed before this time arrives.
The format is hh:mm:ss.mmm (hours, minutes, seconds,milliseconds).
TT (suspended tasks only) The timeout type for the task. The possible values, where one isgiven, are:
• IN—a timeout interval has been specified for the task.• DD—deadlock action is to be delayed when the timeout interval
expires.• DI—deadlock action is immediate when the timeout interval
expires.
TY Whether this is a system task or a non-system task. Possible valuesare:
• SY—this is a system task.• NS—this is a non-system task.
A non-system task can be either a user written transaction, or aCICS-supplied transaction.
Chapter 6. Dealing with the problem 133
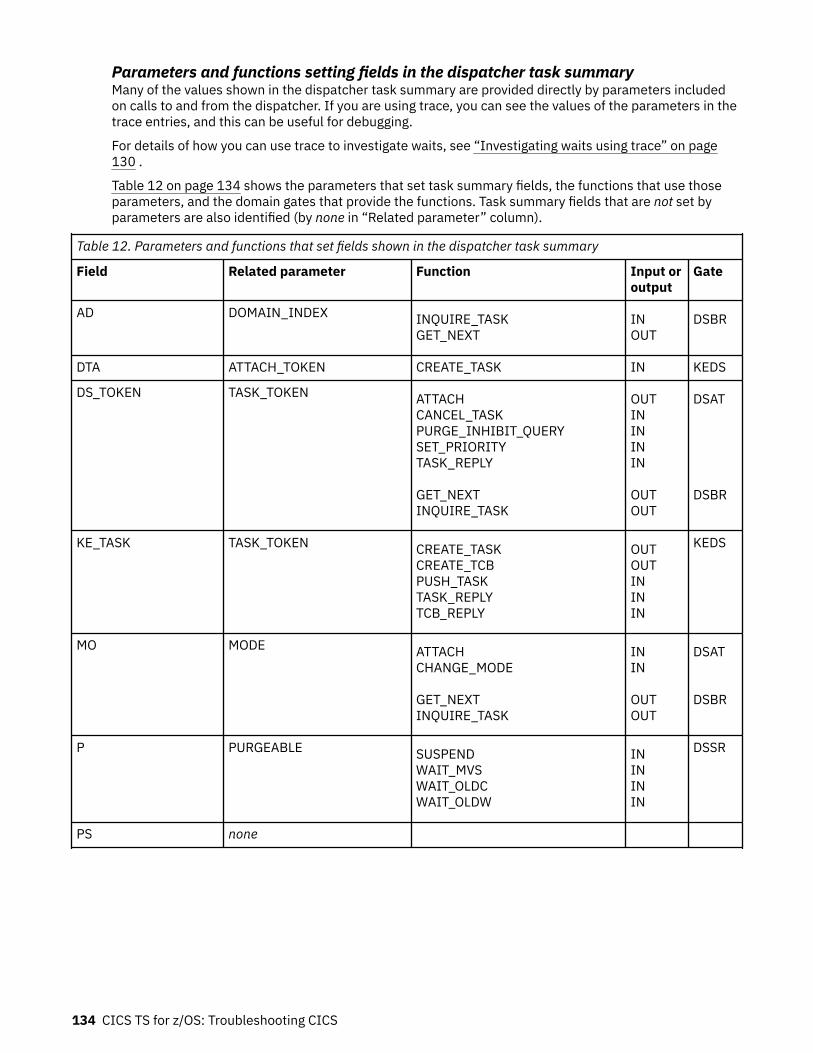
Parameters and functions setting fields in the dispatcher task summaryMany of the values shown in the dispatcher task summary are provided directly by parameters includedon calls to and from the dispatcher. If you are using trace, you can see the values of the parameters in thetrace entries, and this can be useful for debugging.
For details of how you can use trace to investigate waits, see “Investigating waits using trace” on page130 .
Table 12 on page 134 shows the parameters that set task summary fields, the functions that use thoseparameters, and the domain gates that provide the functions. Task summary fields that are not set byparameters are also identified (by none in “Related parameter” column).
Table 12. Parameters and functions that set fields shown in the dispatcher task summary
Field Related parameter Function Input oroutput
Gate
AD DOMAIN_INDEX INQUIRE_TASKGET_NEXT
INOUT
DSBR
DTA ATTACH_TOKEN CREATE_TASK IN KEDS
DS_TOKEN TASK_TOKEN ATTACHCANCEL_TASKPURGE_INHIBIT_QUERYSET_PRIORITYTASK_REPLY GET_NEXTINQUIRE_TASK
OUTININININ OUTOUT
DSAT DSBR
KE_TASK TASK_TOKEN CREATE_TASKCREATE_TCBPUSH_TASKTASK_REPLYTCB_REPLY
OUTOUTINININ
KEDS
MO MODE ATTACHCHANGE_MODE GET_NEXTINQUIRE_TASK
ININ OUTOUT
DSAT DSBR
P PURGEABLE SUSPENDWAIT_MVSWAIT_OLDCWAIT_OLDW
ININININ
DSSR
PS none
134 CICS TS for z/OS: Troubleshooting CICS
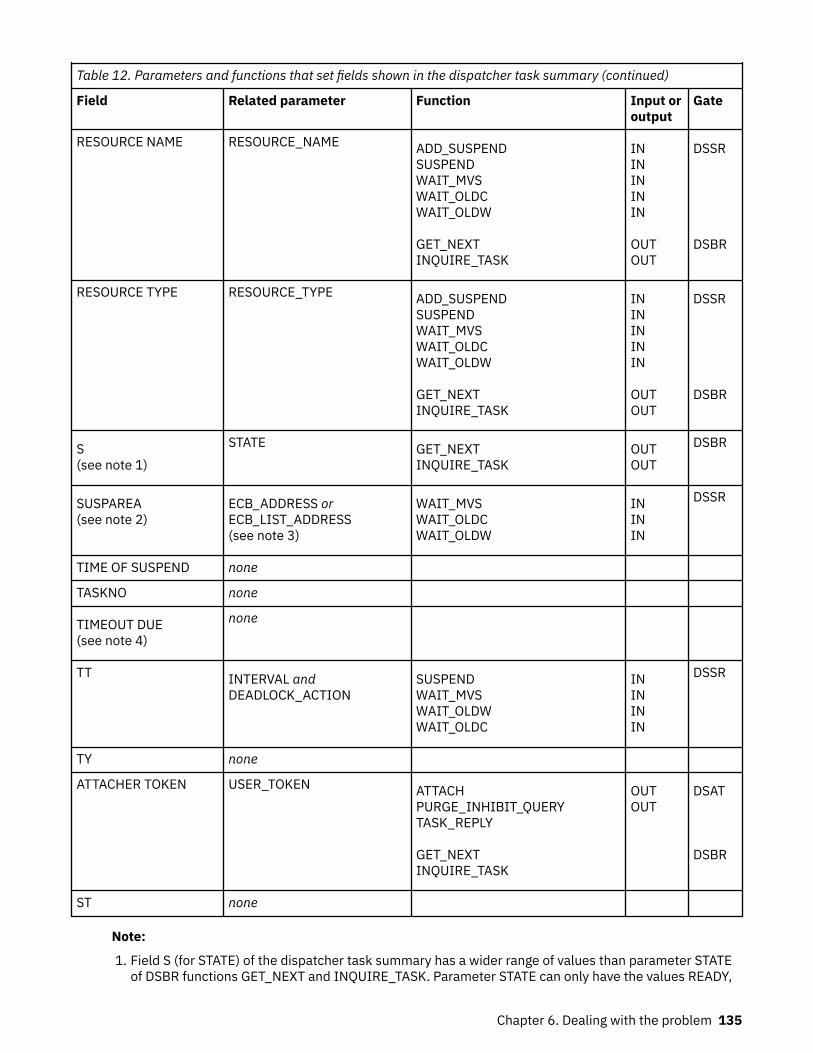
Table 12. Parameters and functions that set fields shown in the dispatcher task summary (continued)
Field Related parameter Function Input oroutput
Gate
RESOURCE NAME RESOURCE_NAME ADD_SUSPENDSUSPENDWAIT_MVSWAIT_OLDCWAIT_OLDW GET_NEXTINQUIRE_TASK
INININININ OUTOUT
DSSR DSBR
RESOURCE TYPE RESOURCE_TYPE ADD_SUSPENDSUSPENDWAIT_MVSWAIT_OLDCWAIT_OLDW GET_NEXTINQUIRE_TASK
INININININ OUTOUT
DSSR DSBR
S(see note 1)
STATE GET_NEXTINQUIRE_TASK
OUTOUT
DSBR
SUSPAREA(see note 2)
ECB_ADDRESS orECB_LIST_ADDRESS(see note 3)
WAIT_MVSWAIT_OLDCWAIT_OLDW
INININ
DSSR
TIME OF SUSPEND none
TASKNO none
TIMEOUT DUE(see note 4)
none
TT INTERVAL andDEADLOCK_ACTION
SUSPENDWAIT_MVSWAIT_OLDWWAIT_OLDC
ININININ
DSSR
TY none
ATTACHER TOKEN USER_TOKEN ATTACHPURGE_INHIBIT_QUERYTASK_REPLY GET_NEXTINQUIRE_TASK
OUTOUT
DSAT DSBR
ST none
Note:
1. Field S (for STATE) of the dispatcher task summary has a wider range of values than parameter STATEof DSBR functions GET_NEXT and INQUIRE_TASK. Parameter STATE can only have the values READY,
Chapter 6. Dealing with the problem 135
RUNNING, or SUSPENDED. For the possible values of field S, see “Dispatcher task summary fields” onpage 131.
2. Parameters ECB_ADDRESS and ECB_LIST_ADDRESS only relate to SUSPAREA when the task has beensuspended by the WAIT_MVS, WAIT_OLDW, or WAIT_OLDC functions of gate DSSR.
3. Parameter ECB_LIST_ADDRESS is only valid for functions WAIT_MVS and WAIT_OLDW, and not forfunction WAIT_OLDC.
4. If INTERVAL has been specified, the value of TIMEOUT DUE should be equal to INTERVAL + TIME OFSUSPEND.
Investigating terminal waits
Before you beginRead this section if you have any of the following problems:
• A task should have started at a terminal, but has failed to do so.• A task is waiting on a resource type of KCCOMPAT, with a resource name of TERMINAL.• A task is waiting on a resource type of IRLINK, with a resource name of SYSIDNT concatenated with the
session name.
About this taskIf you have one or more unresponsive terminals, that is terminals that are showing no new output andaccepting no input, this does not necessarily indicate a terminal wait.
Procedure1. If you have one or more unresponsive terminals:
a) Use CEMT INQ TERMINAL to find the transaction running at the terminal.b) UseCEMT INQ TASK to find out what resource that task is waiting on.c) When you know that, look at Table 17 on page 184 to find where you can get further guidance.
2. If all the terminals in the network are affected, and CICS has stalled, read “What to do if CICS hasstalled” on page 179 for advice about how to investigate the problem.
ResultsIf you have a genuine terminal wait, remember when you carry out your investigation that terminals inthe CICS environment can have a wide range of characteristics. A terminal is, in fact, anything that canbe at the end of a communications line. It could, for example, be a physical device such as a 3270terminal or a printer, or a batch region, or it could be another CICS region connected by an interregioncommunication link, or it could be a system that is connected by an LUTYPE6.1 or APPC (LUTYPE6.2)protocol. If LUTYPE6.1 is in use, the other system might be another CICS region or an IMS region. WithAPPC (LUTYPE6.2), the range of possibilities is much wider. It could include any of the systems anddevices that support this communications protocol. For example, apart from another CICS region, theremight be a PC or a DISOSS system at the other end of the link.
If you eventually find that the fault lies with a terminal, or a resource such as DISOSS, the way in whichyou approach the problem depends on what type it is. In some cases, you probably need to look inappropriate books from other libraries for guidance about problem determination.
Terminal waits - first considerationsWhen you investigate a terminal wait, there are preliminary considerations that might lead to a simplesolution.
• Look for an obvious physical explanation for the wait, for example, a terminal operator has notresponded to a request for input. For a printer, is it powered off, or has it run out of paper?
136 CICS TS for z/OS: Troubleshooting CICS
• Check in the CSTL and CSNE logs for any messages. If either DFHTCP or DFHZCP detected an errorrelated to terminal control, a message is sent to the CSNE log, and might also be sent to the console.
If there is a message that reports a terminal error that can be related to the task, the messageshould provide more information about why the task is waiting. For an explanation of the message,and a description of the system action in response to the error, use the CMAC transaction or see CICSmessages.
The CSNE log entry might show that an error was detected, but that TACP or NACP took no action. Thissituation might occur if the line or terminal is out of service, or if the error actions are turned off in theuser exits of DFHTEP and DFHNEP. In this situation, the CICS code to resume the waiting task wouldnever run, and the task would wait indefinitely.
• Check whether any HANDLE CONDITION routines for terminal errors are coded incorrectly. If there is anattempt to access the terminal with such an error in a routine, the application might wait indefinitely.
• If the terminal is installed using autoinstall, check whether the system loaded DFHZATA, the autoinstallprogram, or DFHZCQ, which is called by DFHZATA. The system might fail to load DFHZATA or DFHZCQbecause of a short-on-storage condition. If so, deal with the cause of the short-on-storage condition.
Check the delete delay that you have specified; if the delay is too short, your system might be deletingand reinstalling terminals unnecessarily.
If storage fragmentation prevents DFHZATA or DFHZCQ from being loaded, consider defining them asresident. However, be aware that DFHZCQ is a large program, and check your storage requirementsbefore making this change.
If none of the preliminary considerations apply, start a systematic investigation into the reason for thewait.
Terminal waits - a systematic approachYou first need to determine the type of terminal involved in the wait, and the type of access method in usefor that terminal. Both of these factors influence the way you perform problem determination.
Your strategy must then be to find where in the communication process the fault lies. These are the basicquestions that must be answered:
1. Is the problem associated with the access method?2. If the access method has returned, or has not been involved, is terminal control at fault?3. If terminal control is working correctly, why is the terminal not responding?
To answer most of these questions, you will need to do some offline dump analysis. Use CEMT PERFORMSNAP to get the dump, and then format it using the formatting keyword TCP. Do not cancel your taskbefore taking the dump. If you do, the values in the terminal control data areas will not relate to theerror.
What type of terminal is not responding?You can check the terminal type either online, using a system programming command, or offline, bylooking at the appropriate TCTTE in the formatted system dump.
Online methodUse the transaction CECI to execute the system programming command EXEC CICS INQUIRETERMINAL DEVICE. This returns one of the terminal types that are described in TERMINAL resources.
Offline methodLook at the formatted dump output you have obtained for keyword TCP. First, identify the TCTTE relatingto the terminal, from the four-character terminal ID shown in field TCTTETI. Now look in field TCTTETT,
Chapter 6. Dealing with the problem 137
and read the 1-byte character that identifies the type of terminal. You can find what terminal type isrepresented by the value in the field from the description given in the Data areas.
What type of access method is in use?You can use both an online method and an offline method for finding the type of access method beingused by the terminal that is not responding.
Online methodUse the CECI transaction to execute the system programming command EXEC CICS INQUIRE TERMINALACCESSMETHOD. This returns the access method in use by the terminal.
Offline methodYou can find the access method for the terminal from the TCTTE. Look in field TCTEAMIB, which is thebyte name definition for the access method. The Data areas relates values to access methods.
The most common access method is the z/OS Communications Server, identified by a value of TCTEVTAM.The problem determination procedures outlined below focus exclusively on the Communications Server.You might also find either of these values, each being of special significance for problem determination:
• TCTEISMM, meaning that the access method is ISMM. This is used for interregion communication, and itshows that the resource that is not responding is a remote CICS region. In such a case, the most likelyreason for the wait is that some task in the remote region is also in a wait state. The way you deal withthis type of problem is described in “Your task is waiting on a physical terminal” on page 145.
• TCTELU6, meaning that you have intersystem communication (ISC). In this case, the resource that is notresponding is a remote system, and the way you deal with the wait depends on what the remote systemis. If it is a CICS system, you need to diagnose the problem in the remote system using the techniquesgiven in this book. If the remote system is a non-CICS system, you might need to read a diagnosis bookfrom another library for advice on problem determination.
If you have any other access method, for example BSAM, you need to adapt the guidance given hereaccordingly.
z/OS Communications Server in use - debugging proceduresThe following information gives guidance about debugging terminal waits when the access method is z/OSCommunications Server.
1. Look in the CSNE log to see if there is an error message that explains the wait. If it contains an errorcode, refer to z/OS Communications Server: SNA Messages.
2. Look for any NACP error codes in fields TCTEVRC5, TCTEVRC6, TCTEVRC7, and TCTEVRC8 of theterminal table entry, TCTTE. Look also for any SNA sense code in field TCTEVNSS. For an explanation ofSNA sense codes, see z/OS Communications Server: IP and SNA Codes.
Is the problem associated with the z/OS Communications Server?You can find the z/OS Communications Server (SNA) process status with respect to the waiting task fromfields TCTEICIP and TCTEIDIP in the TCTTE.
The following are the values you might find there, and their interpretations:
TCTECIP command request in progress TCTEDIP data request in progress
Either of these status values indicates that a Communications Server request is in progress, and that thecommunications server RPL is active. A response is expected either from the Communications Server, orfrom the terminal. You can find the address of the RPL from field TCTERPLA, unless the request was for aRECEIVE on an APPC session, in which case you can find the RPL address from field TCTERPLB.
138 CICS TS for z/OS: Troubleshooting CICS
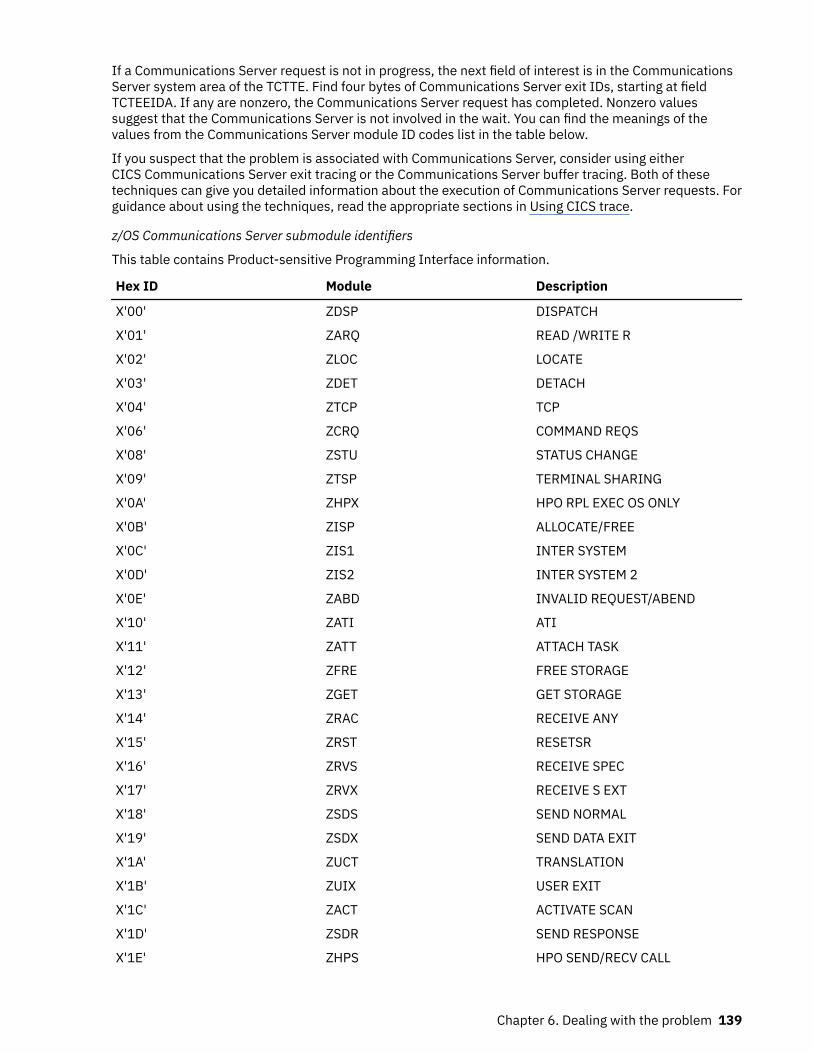
If a Communications Server request is not in progress, the next field of interest is in the CommunicationsServer system area of the TCTTE. Find four bytes of Communications Server exit IDs, starting at fieldTCTEEIDA. If any are nonzero, the Communications Server request has completed. Nonzero valuessuggest that the Communications Server is not involved in the wait. You can find the meanings of thevalues from the Communications Server module ID codes list in the table below.
If you suspect that the problem is associated with Communications Server, consider using eitherCICS Communications Server exit tracing or the Communications Server buffer tracing. Both of thesetechniques can give you detailed information about the execution of Communications Server requests. Forguidance about using the techniques, read the appropriate sections in Using CICS trace.
z/OS Communications Server submodule identifiers
This table contains Product-sensitive Programming Interface information.
Hex ID Module Description
X'00' ZDSP DISPATCH
X'01' ZARQ READ /WRITE R
X'02' ZLOC LOCATE
X'03' ZDET DETACH
X'04' ZTCP TCP
X'06' ZCRQ COMMAND REQS
X'08' ZSTU STATUS CHANGE
X'09' ZTSP TERMINAL SHARING
X'0A' ZHPX HPO RPL EXEC OS ONLY
X'0B' ZISP ALLOCATE/FREE
X'0C' ZIS1 INTER SYSTEM
X'0D' ZIS2 INTER SYSTEM 2
X'0E' ZABD INVALID REQUEST/ABEND
X'10' ZATI ATI
X'11' ZATT ATTACH TASK
X'12' ZFRE FREE STORAGE
X'13' ZGET GET STORAGE
X'14' ZRAC RECEIVE ANY
X'15' ZRST RESETSR
X'16' ZRVS RECEIVE SPEC
X'17' ZRVX RECEIVE S EXT
X'18' ZSDS SEND NORMAL
X'19' ZSDX SEND DATA EXIT
X'1A' ZUCT TRANSLATION
X'1B' ZUIX USER EXIT
X'1C' ZACT ACTIVATE SCAN
X'1D' ZSDR SEND RESPONSE
X'1E' ZHPS HPO SEND/RECV CALL
Chapter 6. Dealing with the problem 139
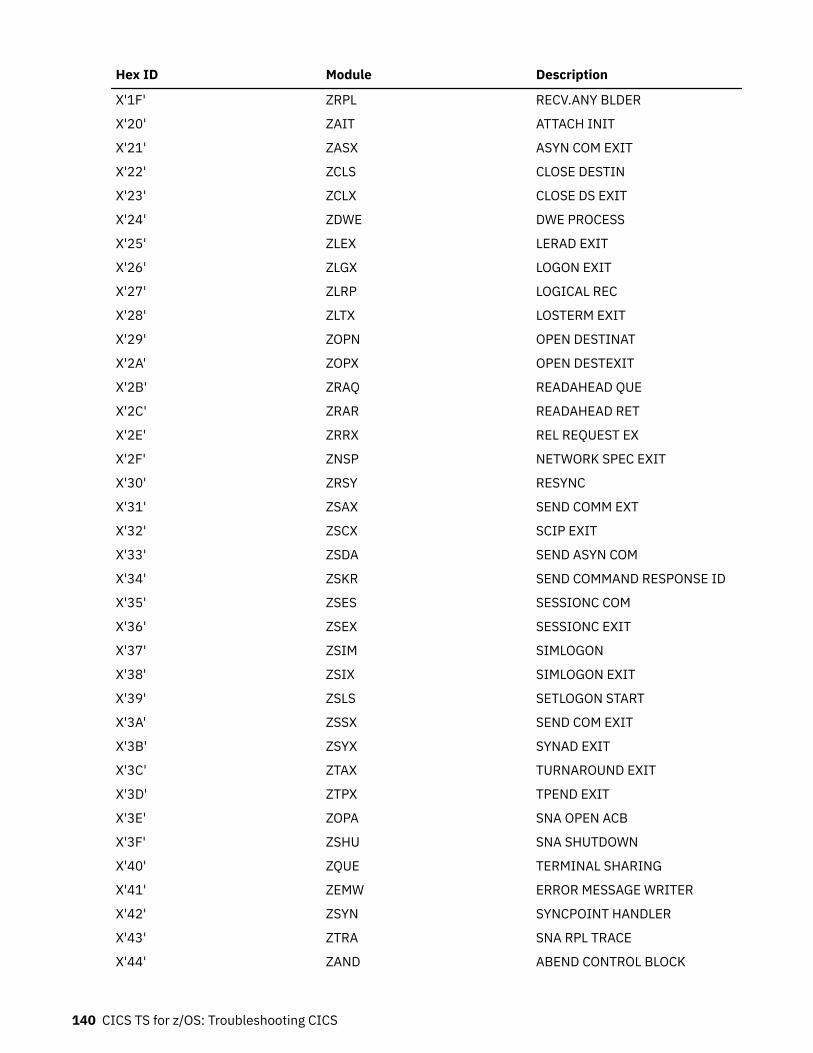
Hex ID Module Description
X'1F' ZRPL RECV.ANY BLDER
X'20' ZAIT ATTACH INIT
X'21' ZASX ASYN COM EXIT
X'22' ZCLS CLOSE DESTIN
X'23' ZCLX CLOSE DS EXIT
X'24' ZDWE DWE PROCESS
X'25' ZLEX LERAD EXIT
X'26' ZLGX LOGON EXIT
X'27' ZLRP LOGICAL REC
X'28' ZLTX LOSTERM EXIT
X'29' ZOPN OPEN DESTINAT
X'2A' ZOPX OPEN DESTEXIT
X'2B' ZRAQ READAHEAD QUE
X'2C' ZRAR READAHEAD RET
X'2E' ZRRX REL REQUEST EX
X'2F' ZNSP NETWORK SPEC EXIT
X'30' ZRSY RESYNC
X'31' ZSAX SEND COMM EXT
X'32' ZSCX SCIP EXIT
X'33' ZSDA SEND ASYN COM
X'34' ZSKR SEND COMMAND RESPONSE ID
X'35' ZSES SESSIONC COM
X'36' ZSEX SESSIONC EXIT
X'37' ZSIM SIMLOGON
X'38' ZSIX SIMLOGON EXIT
X'39' ZSLS SETLOGON START
X'3A' ZSSX SEND COM EXIT
X'3B' ZSYX SYNAD EXIT
X'3C' ZTAX TURNAROUND EXIT
X'3D' ZTPX TPEND EXIT
X'3E' ZOPA SNA OPEN ACB
X'3F' ZSHU SNA SHUTDOWN
X'40' ZQUE TERMINAL SHARING
X'41' ZEMW ERROR MESSAGE WRITER
X'42' ZSYN SYNCPOINT HANDLER
X'43' ZTRA SNA RPL TRACE
X'44' ZAND ABEND CONTROL BLOCK
140 CICS TS for z/OS: Troubleshooting CICS
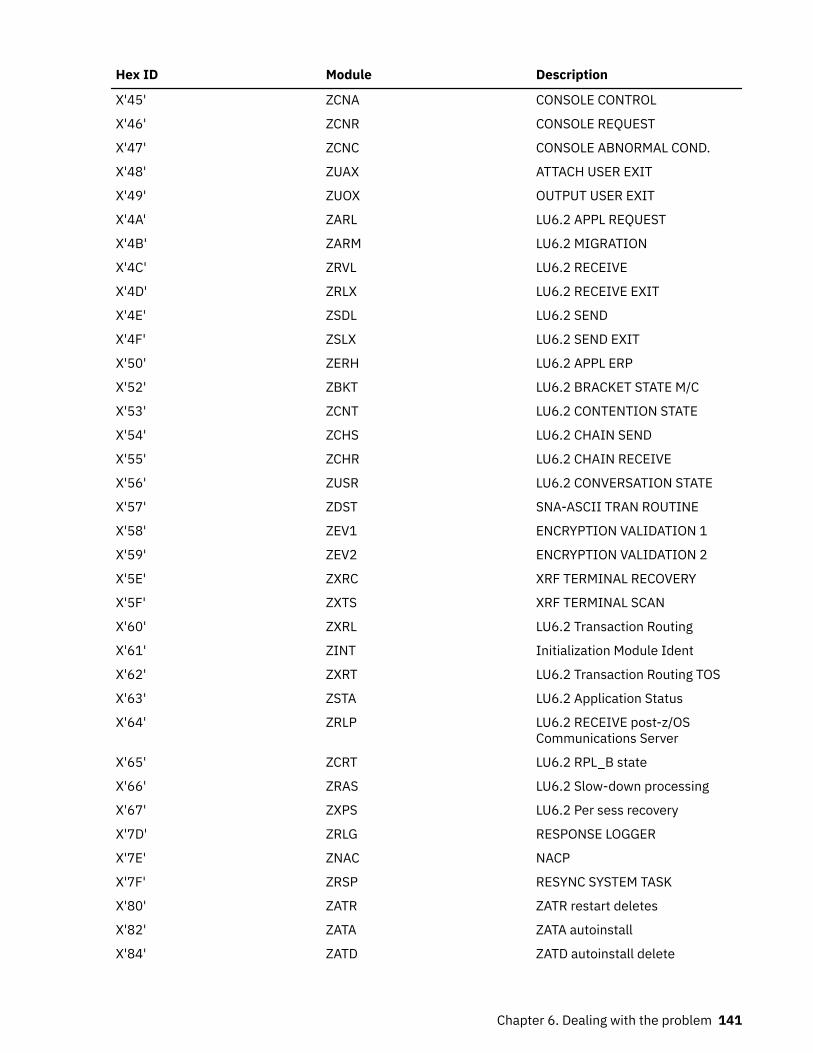
Hex ID Module Description
X'45' ZCNA CONSOLE CONTROL
X'46' ZCNR CONSOLE REQUEST
X'47' ZCNC CONSOLE ABNORMAL COND.
X'48' ZUAX ATTACH USER EXIT
X'49' ZUOX OUTPUT USER EXIT
X'4A' ZARL LU6.2 APPL REQUEST
X'4B' ZARM LU6.2 MIGRATION
X'4C' ZRVL LU6.2 RECEIVE
X'4D' ZRLX LU6.2 RECEIVE EXIT
X'4E' ZSDL LU6.2 SEND
X'4F' ZSLX LU6.2 SEND EXIT
X'50' ZERH LU6.2 APPL ERP
X'52' ZBKT LU6.2 BRACKET STATE M/C
X'53' ZCNT LU6.2 CONTENTION STATE
X'54' ZCHS LU6.2 CHAIN SEND
X'55' ZCHR LU6.2 CHAIN RECEIVE
X'56' ZUSR LU6.2 CONVERSATION STATE
X'57' ZDST SNA-ASCII TRAN ROUTINE
X'58' ZEV1 ENCRYPTION VALIDATION 1
X'59' ZEV2 ENCRYPTION VALIDATION 2
X'5E' ZXRC XRF TERMINAL RECOVERY
X'5F' ZXTS XRF TERMINAL SCAN
X'60' ZXRL LU6.2 Transaction Routing
X'61' ZINT Initialization Module Ident
X'62' ZXRT LU6.2 Transaction Routing TOS
X'63' ZSTA LU6.2 Application Status
X'64' ZRLP LU6.2 RECEIVE post-z/OSCommunications Server
X'65' ZCRT LU6.2 RPL_B state
X'66' ZRAS LU6.2 Slow-down processing
X'67' ZXPS LU6.2 Per sess recovery
X'7D' ZRLG RESPONSE LOGGER
X'7E' ZNAC NACP
X'7F' ZRSP RESYNC SYSTEM TASK
X'80' ZATR ZATR restart deletes
X'82' ZATA ZATA autoinstall
X'84' ZATD ZATD autoinstall delete
Chapter 6. Dealing with the problem 141
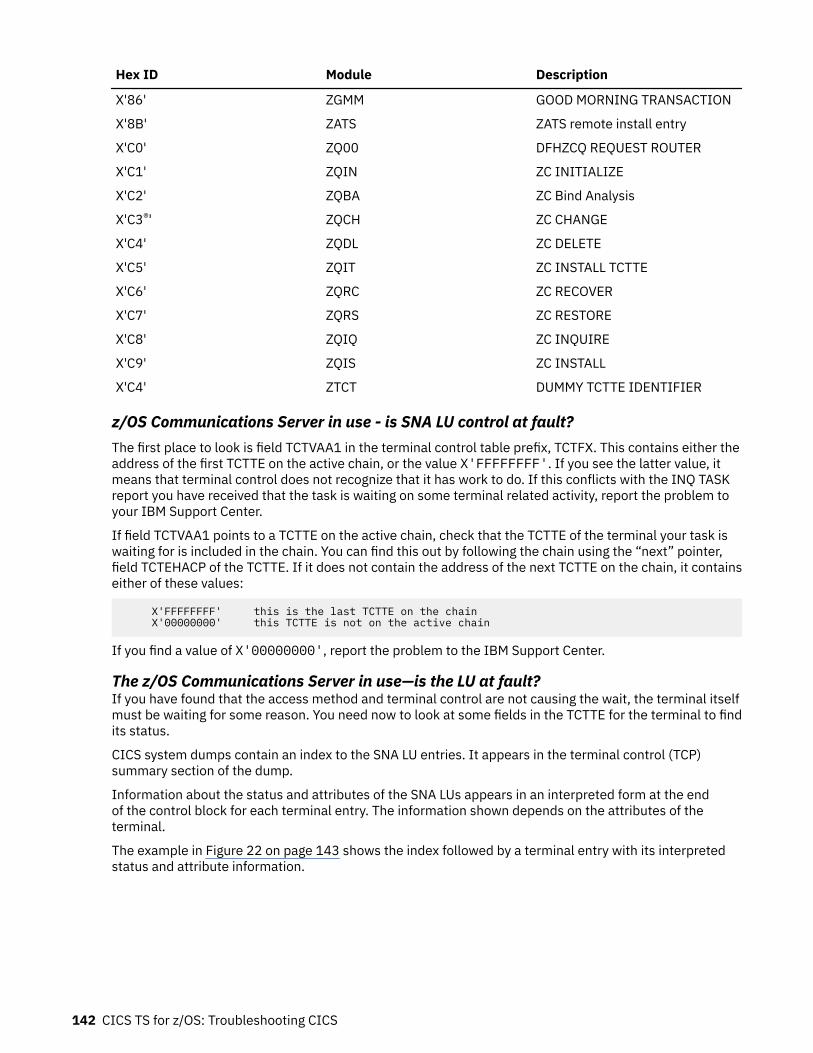
Hex ID Module Description
X'86' ZGMM GOOD MORNING TRANSACTION
X'8B' ZATS ZATS remote install entry
X'C0' ZQ00 DFHZCQ REQUEST ROUTER
X'C1' ZQIN ZC INITIALIZE
X'C2' ZQBA ZC Bind Analysis
X'C3®' ZQCH ZC CHANGE
X'C4' ZQDL ZC DELETE
X'C5' ZQIT ZC INSTALL TCTTE
X'C6' ZQRC ZC RECOVER
X'C7' ZQRS ZC RESTORE
X'C8' ZQIQ ZC INQUIRE
X'C9' ZQIS ZC INSTALL
X'C4' ZTCT DUMMY TCTTE IDENTIFIER
z/OS Communications Server in use - is SNA LU control at fault?The first place to look is field TCTVAA1 in the terminal control table prefix, TCTFX. This contains either theaddress of the first TCTTE on the active chain, or the value X'FFFFFFFF'. If you see the latter value, itmeans that terminal control does not recognize that it has work to do. If this conflicts with the INQ TASKreport you have received that the task is waiting on some terminal related activity, report the problem toyour IBM Support Center.
If field TCTVAA1 points to a TCTTE on the active chain, check that the TCTTE of the terminal your task iswaiting for is included in the chain. You can find this out by following the chain using the “next” pointer,field TCTEHACP of the TCTTE. If it does not contain the address of the next TCTTE on the chain, it containseither of these values:
X'FFFFFFFF' this is the last TCTTE on the chain X'00000000' this TCTTE is not on the active chain
If you find a value of X'00000000', report the problem to the IBM Support Center.
The z/OS Communications Server in use—is the LU at fault?If you have found that the access method and terminal control are not causing the wait, the terminal itselfmust be waiting for some reason. You need now to look at some fields in the TCTTE for the terminal to findits status.
CICS system dumps contain an index to the SNA LU entries. It appears in the terminal control (TCP)summary section of the dump.
Information about the status and attributes of the SNA LUs appears in an interpreted form at the endof the control block for each terminal entry. The information shown depends on the attributes of theterminal.
The example in Figure 22 on page 143 shows the index followed by a terminal entry with its interpretedstatus and attribute information.
142 CICS TS for z/OS: Troubleshooting CICS
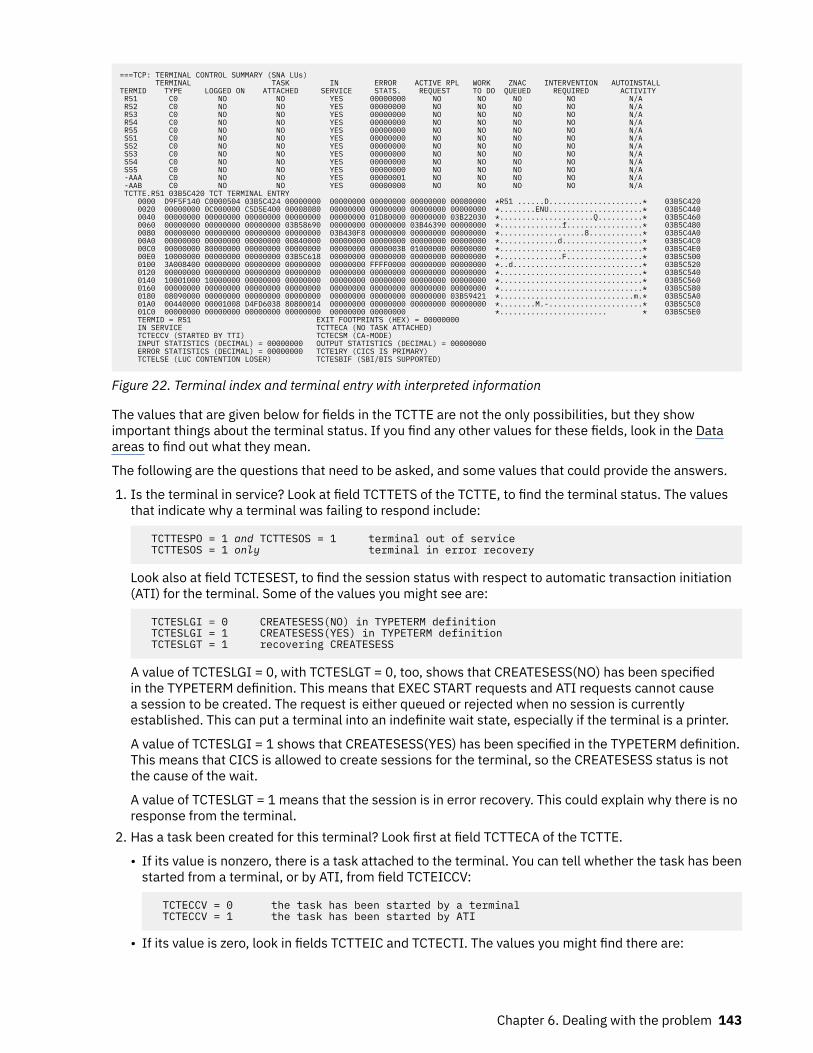
===TCP: TERMINAL CONTROL SUMMARY (SNA LUs) TERMINAL TASK IN ERROR ACTIVE RPL WORK ZNAC INTERVENTION AUTOINSTALLTERMID TYPE LOGGED ON ATTACHED SERVICE STATS. REQUEST TO DO QUEUED REQUIRED ACTIVITY R51 C0 NO NO YES 00000000 NO NO NO NO N/A R52 C0 NO NO YES 00000000 NO NO NO NO N/A R53 C0 NO NO YES 00000000 NO NO NO NO N/A R54 C0 NO NO YES 00000000 NO NO NO NO N/A R55 C0 NO NO YES 00000000 NO NO NO NO N/A S51 C0 NO NO YES 00000000 NO NO NO NO N/A S52 C0 NO NO YES 00000000 NO NO NO NO N/A S53 C0 NO NO YES 00000000 NO NO NO NO N/A S54 C0 NO NO YES 00000000 NO NO NO NO N/A S55 C0 NO NO YES 00000000 NO NO NO NO N/A -AAA C0 NO NO YES 00000001 NO NO NO NO N/A -AAB C0 NO NO YES 00000000 NO NO NO NO N/A TCTTE.R51 03B5C420 TCT TERMINAL ENTRY 0000 D9F5F140 C0000504 03B5C424 00000000 00000000 00000000 00000000 00080000 *R51 ......D.....................* 03B5C420 0020 00000000 0C000000 C5D5E400 00008080 00000000 00000000 00000000 00000000 *........ENU.....................* 03B5C440 0040 00000000 00000000 00000000 00000000 00000000 01D80000 00000000 03B22030 *.....................Q..........* 03B5C460 0060 00000000 00000000 00000000 03B58690 00000000 00000000 03B46390 00000000 *..............f.................* 03B5C480 0080 00000000 00000000 00000000 00000000 03B430F8 00000000 00000000 00000000 *...................8............* 03B5C4A0 00A0 00000000 00000000 00000000 00840000 00000000 00000000 00000000 00000000 *.............d..................* 03B5C4C0 00C0 00000000 80000000 00000000 00000000 00000000 0000003B 01000000 00000000 *................................* 03B5C4E0 00E0 10000000 00000000 00000000 03B5C618 00000000 00000000 00000000 00000000 *..............F.................* 03B5C500 0100 3A008400 00000000 00000000 00000000 00000000 FFFF0000 00000000 00000000 *..d.............................* 03B5C520 0120 00000000 00000000 00000000 00000000 00000000 00000000 00000000 00000000 *................................* 03B5C540 0140 10001000 10000000 00000000 00000000 00000000 00000000 00000000 00000000 *................................* 03B5C560 0160 00000000 00000000 00000000 00000000 00000000 00000000 00000000 00000000 *................................* 03B5C580 0180 08090000 00000000 00000000 00000000 00000000 00000000 00000000 03B59421 *..............................m.* 03B5C5A0 01A0 00440000 00001008 D4FD6038 80800014 00000000 00000000 00000000 00000000 *........M.-.....................* 03B5C5C0 01C0 00000000 00000000 00000000 00000000 00000000 00000000 *........................ * 03B5C5E0 TERMID = R51 EXIT FOOTPRINTS (HEX) = 00000000 IN SERVICE TCTTECA (NO TASK ATTACHED) TCTECCV (STARTED BY TTI) TCTECSM (CA-MODE) INPUT STATISTICS (DECIMAL) = 00000000 OUTPUT STATISTICS (DECIMAL) = 00000000 ERROR STATISTICS (DECIMAL) = 00000000 TCTE1RY (CICS IS PRIMARY) TCTELSE (LUC CONTENTION LOSER) TCTESBIF (SBI/BIS SUPPORTED)
Figure 22. Terminal index and terminal entry with interpreted information
The values that are given below for fields in the TCTTE are not the only possibilities, but they showimportant things about the terminal status. If you find any other values for these fields, look in the Dataareas to find out what they mean.
The following are the questions that need to be asked, and some values that could provide the answers.
1. Is the terminal in service? Look at field TCTTETS of the TCTTE, to find the terminal status. The valuesthat indicate why a terminal was failing to respond include:
TCTTESPO = 1 and TCTTESOS = 1 terminal out of service TCTTESOS = 1 only terminal in error recovery
Look also at field TCTESEST, to find the session status with respect to automatic transaction initiation(ATI) for the terminal. Some of the values you might see are:
TCTESLGI = 0 CREATESESS(NO) in TYPETERM definition TCTESLGI = 1 CREATESESS(YES) in TYPETERM definition TCTESLGT = 1 recovering CREATESESS
A value of TCTESLGI = 0, with TCTESLGT = 0, too, shows that CREATESESS(NO) has been specifiedin the TYPETERM definition. This means that EXEC START requests and ATI requests cannot causea session to be created. The request is either queued or rejected when no session is currentlyestablished. This can put a terminal into an indefinite wait state, especially if the terminal is a printer.
A value of TCTESLGI = 1 shows that CREATESESS(YES) has been specified in the TYPETERM definition.This means that CICS is allowed to create sessions for the terminal, so the CREATESESS status is notthe cause of the wait.
A value of TCTESLGT = 1 means that the session is in error recovery. This could explain why there is noresponse from the terminal.
2. Has a task been created for this terminal? Look first at field TCTTECA of the TCTTE.
• If its value is nonzero, there is a task attached to the terminal. You can tell whether the task has beenstarted from a terminal, or by ATI, from field TCTEICCV:
TCTECCV = 0 the task has been started by a terminal TCTECCV = 1 the task has been started by ATI
• If its value is zero, look in fields TCTTEIC and TCTECTI. The values you might find there are:
Chapter 6. Dealing with the problem 143
TCTTEOIC = 1 ATI is waiting to start TCTECTI = 1 there is ATI work for ZCP to do
3. Is there a task related to the terminal? You can find the task session state with SNA from fieldTCTEMOST, and, if bracket protocol is required (from field TCTEIBPE), its conversation state with theterminal from field TCTEIINB. The significant values that might provide further clues to the cause ofthe wait are:
TCTECSM = 1 the task is in conversation with the terminal TCTECSM = 0 terminal control will accept new tasks from the terminal
Look now at field TCTEIBPE, to see if bracket protocol is required:
TCTEBPE = 1 bracket protocol is required
If you find that bracket protocol is required, look in field TCTEIINB:
TCTEINB = 0 a conversation has not been started TCTEINB = 1 a task is in conversation with the terminal
4. Is the terminal logged on to CICS? Look first at the node session status in the TCTTE. The threestages of session creation are represented by three separate bits, in fields TCTEILOS, TCTEIOPD, andTCTEINSD:
TCTELOS = 1 the node is logged on TCTEOPD = 1 z/OS Communications Server OPNDST macro issued TCTENSD = 1 Start Data Traffic sent
If all three bits are set, so the value of the byte is TCTENIS, the node is in session.
You next need to see if the terminal is logging off, or if it has already been logged off. The fields ofinterest are TCTEINND, TCTEINBD, and TCTEIPSA. The values to look for are:
TCTENND = 1 the terminal is to be logged off TCTENBD = 1 the terminal is logging off because of an error TCTEPSA = 1 the session with the terminal ended abnormally —look for any explanatory message on CSMT
If any of these bits are set, the terminal might not be able to respond to the waiting task.5. Should the terminal respond to the task? Field TCTEIPRA tells you this:
TCTEPRA = 1 the terminal should respond
If the values you have found in all these fields suggest that the terminal status is normal, the terminal isprobably waiting for some activity to complete before it responds. The type of investigation you need todo next depends on the type of terminal involved in the wait. You should already have determined this, forexample by using the system programming command EXEC CICS INQUIRE TERMINAL DEVICE.
Tools you can use for debugging terminal waits when the z/OSCommunications Server is in useAmong your debugging tools, two are likely to be of particular use for investigating terminal waits in anSNA environment.
These tools are as follows:
• Communications Server SNA buffer trace. This trace feature is part of the Communications Server itselfand you must see the appropriate manual in the Communications Server library for details of how to useit.
144 CICS TS for z/OS: Troubleshooting CICS
• CICS Communications Server exit trace. This trace feature is part of CICS and you can control it from theCETR panel.
For a description of the use of these two types of tracing in CICS problem determination, see Using CICStrace.
Your task is waiting on a physical terminalIf your task is waiting on a physical terminal, the terminal should first be checked physically to see why itis not responding. If the terminal is at a remote location, you need to ask someone else to check it for you.Some possibilities are:
• A terminal with a keyboard might be waiting for an operator to enter some data.• A printer might have been powered off, or it could have run out of paper.
Consider also the possibility of hardware error in the terminal.
If a session has been acquired and it has not failed, your task is likely to be waiting for someresponse from a task in the other region. This can apply to any of the interregion or intersystemcommunication activities—function shipping, asynchronous processing, transaction routing, distributedtransaction processing, or distributed program link. No matter which of these applies, it is most likely thatthe other region is not responding because the related task there has been suspended.
You need to identify the related task in the remote region, and find out the resource it is waiting on. Whenyou have done that, see Table 17 on page 184 to find out which part of this section to turn to next.
Investigating the related task in a remote regionYou can identify the region that is not responding to your local task, the related task in the remote regionthat is not responding, and the resource that the remote task is waiting on.
Procedure1. Identify the region that is not responding to your local task.
• If the task is using interregion communication (IRC), look first at the name of the resourcebeing waited on, returned together with resource type IRLINK by CEMT INQ TASK. The first fourcharacters give you the SYSIDNT of the remote CICS region.
• If the task is using intersystem communication (ISC), you need to look in field TCTTEIST of theTCTTE, which points to the ISC system table entry. The first field in the system table entry is theidentity of the remote region.
2. When you have identified the region, take a system dump of it.You can do that either by using the CEMT PERFORM DUMP command in that region, or by using theMVS DUMP command.
3. Take a system dump of the local region.4. Format the dumps using the formatting keyword DS to get a summary of the tasks in each region, and
TCP to get the TCTTEs.5. Find the TCTTE for the task in the local region.
The way you find the TCTTE for the task in the remote region depends on whether you are usingLUTYPE6.1 sessions (or IRC) or APPC sessions:
• For LUTYPE6.1 sessions and IRC sessions, look in local control block TCTENIB, the TCTTEextension for the NIB descriptor, at field TCTESQP. This gives you the session qualifier pair for thesession. It provides the terminal ID associated with the local task, concatenated with the terminalID associated with the remote task. Now go to the dump of the remote region, and use the terminalID to locate its TCTTE. Check in field TCTESQP of TCTENIB to make sure that the session qualifierpair matches that in the local system. It should be made up of the same terminal IDs, but with theirorder reversed.
• For APPC sessions, look in local control block TCTTELUC, the APPC extension, in field TCTESII.Ignoring the high-order byte, this gives you the session instance identifier of the session. Now go
Chapter 6. Dealing with the problem 145
to the dump of the remote region, and use the session instance identifier you have found for theremote task to locate its TCTTELUC. The TCTTE precedes the TCTTELUC in the dump.
6. When you have confirmed that you have located the correct TCTTE, look in field TCTTECA.This gives you the TCA address of the task that is not responding.
7. Using the TCA address as the entry point, you can now investigate the reason why the task has notresponded.It is very likely that it has been suspended because some resource is unavailable. Look in thedispatcher and transaction manager summaries. If you can identify your task, you can see whatresource it is waiting on.
8. When you have identified the resource, turn to the appropriate section in this section for guidanceabout investigating waits on that resource.
Investigating storage waitsIf a task is waiting for a long time on any of the resource types CDSA, RDSA, SDSA, UDSA, ECDSA, ERDSA,ESDSA, ETDSA, EUDSA, GCDSA, GUDSA, or GSDSA, you can use a CICS system dump to investigatefurther.
About this taskWaits on these resources occur when tasks make unconditional storage requests (SUSPEND=YES) thatcannot be satisfied. For storage requests below the 16 MB line, waits can be on the CDSA, RDSA, SDSA,or UDSA. For storage requests above 16 MB but below 2 GB, waits can be on the ECDSA, ERDSA, ESDSA,ETDSA, or EUDSA. For storage requests above the bar, waits can be on the GCDSA, GUDSA, or GSDSA.
If tasks make conditional storage requests (SUSPEND=NO), tasks are not suspended on these resources.If the request cannot be satisfied, an exception response is returned.
CICS automatically attempts to relieve storage when it is under stress, for example by releasing storageoccupied by programs whose current use count is 0. Also, if a task waits for storage longer thanthe deadlock timeout parameter specified in the installed transaction definition, the task might beautomatically purged. Certain conditions prevent purging of a task, for example, a deadlock timeout valueof 0, or a specification of SPURGE(NO).
The most likely reasons for extended waits on storage requests are as follows:
• The task issued an unconditional GETMAIN request for an unreasonably large amount of storage.• The task issued an unconditional GETMAIN request for a reasonable amount of storage, but the system
has too little available. The system might be approaching a short-on-storage (SOS) condition, or thestorage might be too fragmented to satisfy the request.
Procedure1. Produce a CICS system dump, and format it using the formatting keyword SM.2. Interpret the dump to investigate the problem.
a) Was the request for too much storage? Look in the SM suspend queue summary.
This summary includes the number of bytes requested by every task that the storage manager hassuspended. You can see whether any task made a GETMAIN request for an unreasonably largeamount of storage.
For example, the following is the dump output in the SM suspend queue summary when task 41requests 10,000,000 bytes:
==SM: Suspend queue summary KE Task Tran # Susptok Subpool DSA Request 053E5400 0000041 04080011 U0000041 EUDSA 10000016
146 CICS TS for z/OS: Troubleshooting CICS
If the suspended task made a reasonable GETMAIN request, investigate whether the system isapproaching an SOS condition.
b) Is the storage close to being exhausted? Look at the DSA summary in the formatted dump.
This summary shows the current free space in each DSA, both in bytes and as a percentage of thetotal storage. It also shows the size of the largest free area, that is, the biggest piece of contiguousstorage. (In this context, contiguous storage means storage that is not fragmented by other records.It is accepted that records too large to fit in a single CI can be split across two or more CIs that arenot necessarily contiguous.)
If the largest free area is smaller than the requested storage, this is probably the reason why thetask cannot obtain its requested storage.
If the amount of free space is unexpectedly small, look at the task subpool summary. If a taskhas made an unusually large number of GETMAIN requests, this might indicate that the task islooping. A looping task might be issuing GETMAIN requests repetitively, each for a reasonableamount of storage, but collectively for a very large amount. If you find evidence for a looping task,see “Dealing with loops” on page 215 for more information.
If the task made a reasonable storage request and the system seems to have sufficient freestorage, investigate whether fragmentation of free storage is causing the GETMAIN request to fail.
c) Is fragmentation of free storage causing the GETMAIN request to fail? Look at the DSA summary inthe formatted dump.If the summary shows that the current free space is significantly greater than the largest free area,it is likely that the DSA has become fragmented.
Investigating temporary storage waitsIf a user task is waiting on a resource type that starts with TS, showing that it is for temporary storage, thefollowing information describes possible reasons for the wait.
About this taskEnqueues on temporary storage should be held in retained state, so no user task should ever wait on aresource type of ENQUEUE with a value of TSNQ (temporary storage enqueue). If you have this resourcetype, see “Investigating enqueue waits” on page 149.
Procedure• Resource type TSAUX indicates that a task is waiting because it has made an unconditional request
for temporary storage, and the request cannot be met because insufficient auxiliary storage isavailable. Take the following actions:a) Get a system dump and format it using the formatting keyword TS to show the temporary storage
control blocks, as well as SM and KE as the information for these components could be useful.b) Analyze the dump using the help given in “Is temporary storage close to being exhausted?” on page
149 and “Is fragmentation of unallocated storage causing the WRITEQ TS request to fail?” on page149.
These are the two most likely reasons why a task that has issued an unconditional WRITEQ TS requestmight be suspended on resource type TSAUX:
1. The task has issued a request requiring too large a piece of temporary storage.2. The task has issued a request requiring a reasonable amount of temporary storage, but there is too
little available.
This could indicate that the amount of auxiliary storage is becoming exhausted. Otherwise, it could bethat there is quite a large amount of auxiliary storage left, but the storage is too fragmented for therequest to be satisfied.
The task has issued an EXEC CICS WRITEQ TS command, without specifying NOSUSPEND andwithout any code to handle the NOSPACE condition. If SPURGE(YES) is defined for the task on the
Chapter 6. Dealing with the problem 147
CEDA DEFINE TRANSACTION command, and a deadlock timeout interval other than 0 has beenspecified, the task is purged when that time expires. Otherwise, it is not purged, and is liable to besuspended indefinitely.
A task that makes a conditional temporary storage WRITEQ TS request (NOSUSPEND specified) is notsuspended if the request cannot be met. Instead, if the required auxiliary storage is not available,an exception response is returned to it. There might still be a suspension for another reason - forexample, the temporary storage program itself might become suspended after issuing a GETMAIN, ifCICS went short on storage.
• Resource type TSBUFFER indicates that the task that is waiting has issued an auxiliary temporarystorage request, but the buffers are all in use. If you find that tasks are often made to wait on thisresource, consider increasing the number of auxiliary temporary storage buffers (system initializationparameter TS).
• Resource type TSEXTEND indicates that the waiting task has issued a request to extend the auxiliarytemporary storage data set, but some other task has already made the same request. The wait doesnot extend beyond the time taken for the extend operation to complete. If you have a task that iswaiting for a long time on this resource, check if there is a hardware fault or a problem with VSAM.
• Resource type TSIO indicates that the task is being made to wait while physical I/O takes place duringan auxiliary temporary storage read or write. If there is an extended wait on this resource, check ifthere is a hardware fault or a problem with VSAM.
• Resource type TSMAINLM indicates that the task that is waiting issued a main temporary storagerequest, but the request cannot be met because insufficient storage is available. If you find that tasksare often made to wait on this resource, check for large temporary storage queues that could bedeleted, or consider increasing the limit for the storage that is available for main temporary storagequeues to use (system initialization parameter TSMAINLIMIT).
• Resource type TSPOOL indicates that the maximum number of concurrent requests (10) for atemporary storage pool in the coupling facility has been reached. The task resumes when one ofthe requests completes.
• Resource type TSQUEUE indicates that the waiting task has issued a request against a temporarystorage queue that is already in use by another task.
The latter task has the lock on the queue. The length of time that a task has the lock on a temporarystorage queue depends on whether or not the queue is recoverable. If the queue is recoverable, thetask has the lock until the logical unit of work is complete. If it is not recoverable, the task has the lockfor the duration of the temporary storage request only.
If tasks in your system are frequently made to wait on temporary storage queues, consider thefollowing:
• Are tasks that are performing operations on the same temporary storage queue intended to do so,or is the ID of the queue unintentionally not unique?
• Is it possible to create more temporary storage queues to reduce the contention between tasks?• If the queue in question is recoverable, is it possible to make tasks relinquish control
of it more quickly? Consider reducing the size of UOWs, or making conversational taskspseudoconversational.
• Resource type TSSHARED indicates that a shared temporary storage request is being processedasynchronously. The task is resumed when the request is complete. The logic that determines whethera request is processed synchronously or asynchronously is outside CICS control.
• Resource type TSSTRING indicates that the task is waiting for an auxiliary temporary storage VSAMstring. If you find that tasks frequently wait on this resource, consider increasing the number oftemporary storage strings (system initialization parameter TS).
• Resource type TSWBUFFR indicates that the waiting task has issued an auxiliary temporary storagerequest, but the write buffers are all in use. You have no control over how temporary storage allocatesread buffers and write buffers from the buffer pool, but if you find that tasks are often made to waiton this resource, increasing the number of auxiliary temporary storage buffers (system initializationparameter TS) should help solve the problem.
148 CICS TS for z/OS: Troubleshooting CICS
Is temporary storage close to being exhausted?It could be that your task has made a reasonable request for temporary storage, but the amount ofunallocated space is close to exhaustion.
To see if this could be the cause of the wait, look at the temporary storage summary in the formatteddump. If the current free space is very small, this is likely to be the reason why the task cannot obtain itsrequested temporary storage. In such a case, consider defining secondary extents for the data set.
Look also at the trace. If a task has made an unusually large number of WRITEQ TS requests, it could belooping. A looping task might be issuing WRITEQ TS requests repetitively, each for a reasonable amountof storage, but collectively for a very large amount. If you find evidence for a looping task, turn to “Dealingwith loops” on page 215.
If your task has made a reasonable request and the system seems to have sufficient unallocatedtemporary storage, you next need to see if fragmentation of unallocated storage is causing the WRITEQ TSrequest to fail.
Is fragmentation of unallocated storage causing the WRITEQ TS request tofail?You can tell whether fragmentation of unallocated temporary storage is causing the WRITEQ TS requestto fail by looking at the temporary storage summary in the dump.
The following fields in the summary are of interest should your task be suspended on resource typeTSAUX:
Number of control intervals in data set:Number of control intervals currently in use:Available bytes per CI:
For control intervals of 4K, the available bytes per CI figure is 4032.
If your task is attempting to a write a record that is smaller than or equal to the available bytes perCI figure (including its record header which is 28 bytes long), this means that no control interval has therequired amount of contiguous space to satisfy the request.
If your task is attempting to write a record that is longer than the available bytes per CI figure,CICS splits the record into sections of a length equal to this figure. CICS then attempts to store eachsection in a completely empty control interval, and any remaining part of the record in a control intervalwith the contiguous space to accommodate it. If your task is waiting on resource type TSAUX after havingattempted to write a record longer than the available bytes per CI figure, either of the followinghas occurred:
• There are not enough available completely empty control intervals to accommodate all the sections
(CIs in data set - CIs in use) < (record length / available bytes per CI)
• No control interval has enough contiguous space to accommodate the remainder.
Investigating enqueue waitsA task is suspended by the enqueue domain if it requests access to a resource on which another taskalready holds an enqueue (lock).
About this taskThere are two ways in which you can discover the owner of the enqueue that the task is waiting on:
Procedure• Use the CEMT INQUIRE UOWENQ command.
For an example of how to use this command to discover the owner of an enqueue, see “Resource typeENQUEUE” on page 211.
Chapter 6. Dealing with the problem 149
For definitive information about CEMT INQUIRE UOWENQ, see CEMT INQUIRE UOWENQ.
Do not use the EXEC CICS ENQ command for recoverable resources.• Use the NQ section of a system dump if you have an enqueue wait for one of the following resource
names:
– ISSSENQP– JOURNALS– KCADDR– KCSTRING– LOGSTRMS
Some types of enqueue wait are not displayed by the CEMT INQUIRE UOWENQ command. In thesecases, you can use a system dump to identify the owner of the enqueue (for an example, see “Using asystem dump to resolve enqueue waits” on page 150) .
ResultsIt is possible for an enqueue wait to be caused by a deadlock. For more information on how to resolve adeadlock, see “Resolving deadlocks in a CICS region” on page 176.
Using a system dump to resolve enqueue waitsThe CEMT INQUIRE UOWENQ (or CEMT INQUIRE ENQ) command does not return information aboutenqueues on some types of resources.
Table 13 on page 150 shows the resources that this applies to.
Table 13. Resources for which INQUIRE UOWENQ does not return information
Resource name Type of resource
ISSSENQP Sockets used by IPIC communication for an IPCONN.
JOURNALS CICS journal names used during creation, deletion, or use of a journal entry. See“Log manager waits” on page 205 for information to help you diagnose problemswith the MVS system logger.
KCADDR Addresses locked internally by CICS.
KCSTRING Strings locked internally by CICS.
LOGSTRMS MVS logstream names used during connection of streams to the MVS logger. A longwait could indicate a problem with the logger. See “Log manager waits” on page205 for information to help you diagnose problems with the MVS system logger.
To investigate enqueue waits on these resources, you can use the NQ section of a system dump. (Youcan use a system dump to investigate enqueue waits on other types of resource, but you might find theINQUIRE UOWENQ command more convenient.)
CICS maintains a separate enqueue pool for each type of resource that can be enqueued upon. Toproduce a summary of each enqueue pool, specify 1 on the NQ dump formatting keyword (dumpformatting keywords are described in “Summary of system dump formatting keywords and levels” onpage 44). Figure 23 on page 151 shows an example summary for the transient data enqueue (TDNQ)pool.
150 CICS TS for z/OS: Troubleshooting CICS
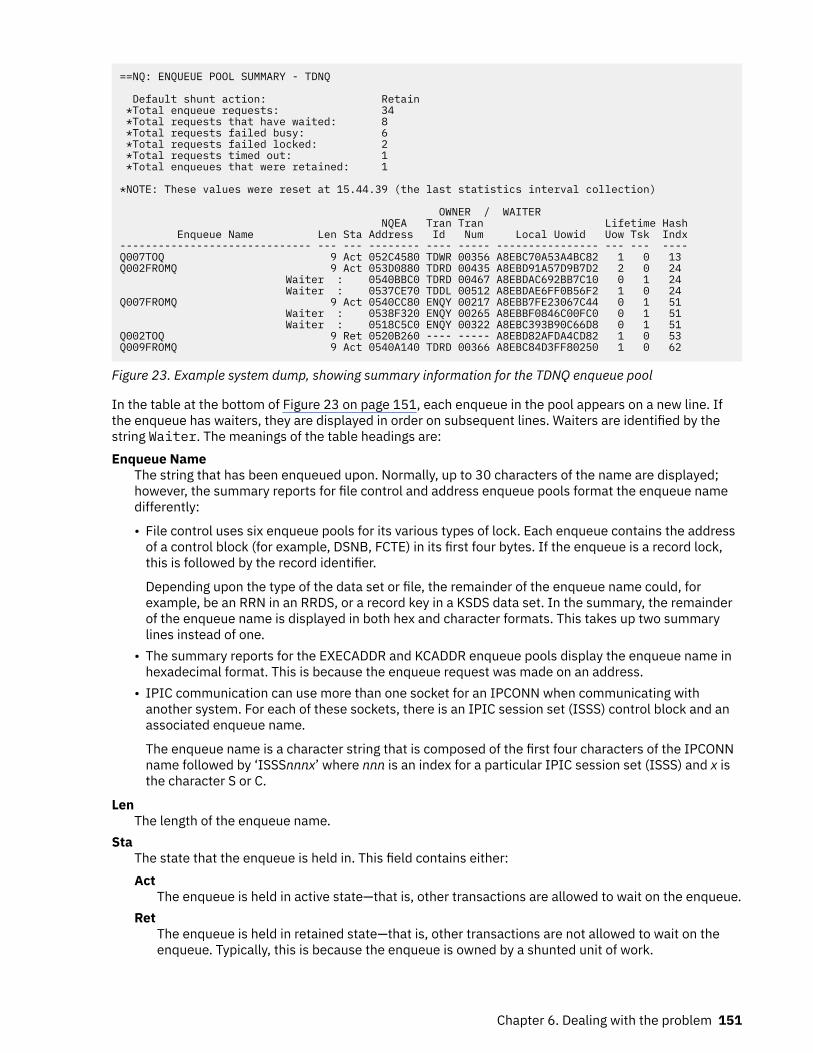
==NQ: ENQUEUE POOL SUMMARY - TDNQ Default shunt action: Retain *Total enqueue requests: 34 *Total requests that have waited: 8 *Total requests failed busy: 6 *Total requests failed locked: 2 *Total requests timed out: 1 *Total enqueues that were retained: 1 *NOTE: These values were reset at 15.44.39 (the last statistics interval collection) OWNER / WAITER NQEA Tran Tran Lifetime Hash Enqueue Name Len Sta Address Id Num Local Uowid Uow Tsk Indx------------------------------ --- --- -------- ---- ----- ---------------- --- --- ----Q007TOQ 9 Act 052C4580 TDWR 00356 A8EBC70A53A4BC82 1 0 13Q002FROMQ 9 Act 053D0880 TDRD 00435 A8EBD91A57D9B7D2 2 0 24 Waiter : 0540BBC0 TDRD 00467 A8EBDAC692BB7C10 0 1 24 Waiter : 0537CE70 TDDL 00512 A8EBDAE6FF0B56F2 1 0 24Q007FROMQ 9 Act 0540CC80 ENQY 00217 A8EBB7FE23067C44 0 1 51 Waiter : 0538F320 ENQY 00265 A8EBBF0846C00FC0 0 1 51 Waiter : 0518C5C0 ENQY 00322 A8EBC393B90C66D8 0 1 51Q002TOQ 9 Ret 0520B260 ---- ----- A8EBD82AFDA4CD82 1 0 53Q009FROMQ 9 Act 0540A140 TDRD 00366 A8EBC84D3FF80250 1 0 62
Figure 23. Example system dump, showing summary information for the TDNQ enqueue pool
In the table at the bottom of Figure 23 on page 151, each enqueue in the pool appears on a new line. Ifthe enqueue has waiters, they are displayed in order on subsequent lines. Waiters are identified by thestring Waiter. The meanings of the table headings are:Enqueue Name
The string that has been enqueued upon. Normally, up to 30 characters of the name are displayed;however, the summary reports for file control and address enqueue pools format the enqueue namedifferently:
• File control uses six enqueue pools for its various types of lock. Each enqueue contains the addressof a control block (for example, DSNB, FCTE) in its first four bytes. If the enqueue is a record lock,this is followed by the record identifier.
Depending upon the type of the data set or file, the remainder of the enqueue name could, forexample, be an RRN in an RRDS, or a record key in a KSDS data set. In the summary, the remainderof the enqueue name is displayed in both hex and character formats. This takes up two summarylines instead of one.
• The summary reports for the EXECADDR and KCADDR enqueue pools display the enqueue name inhexadecimal format. This is because the enqueue request was made on an address.
• IPIC communication can use more than one socket for an IPCONN when communicating withanother system. For each of these sockets, there is an IPIC session set (ISSS) control block and anassociated enqueue name.
The enqueue name is a character string that is composed of the first four characters of the IPCONNname followed by ‘ISSSnnnx’ where nnn is an index for a particular IPIC session set (ISSS) and x isthe character S or C.
LenThe length of the enqueue name.
StaThe state that the enqueue is held in. This field contains either:Act
The enqueue is held in active state—that is, other transactions are allowed to wait on the enqueue.Ret
The enqueue is held in retained state—that is, other transactions are not allowed to wait on theenqueue. Typically, this is because the enqueue is owned by a shunted unit of work.
Chapter 6. Dealing with the problem 151
NQEA AddressThe address of the NQEA corresponding to the enqueue owner or waiter. The NQEA contains the fullenqueue name if it was too large to display fully.
TranIdThe transaction identifier of the enqueue owner or waiter. If the enqueue is owned by a shunted UOW,this field contains '----'.
TranNumThe task number of the enqueue owner or waiter. If the enqueue is owned by a shunted UOW, thisfield contains '-----'.
Local UowidThe local UOW identifier of the enqueue owner or waiter.
Uow LifetimeFor an enqueue owner, the number of times the enqueue is owned with UOW lifetime. For an enqueuewaiter, whether the waiter has requested the enqueue for the lifetime of the UOW.
Tsk LifetimeFor an enqueue owner, the number of times the enqueue is owned with task lifetime. For an enqueuewaiter, whether the waiter has requested the enqueue for the lifetime of the task.
Hash IndxAn index into the pool’s internal hash table.
EXEC CICS ENQ waitsThese waits are a particular type of enqueue wait. They occur when an application issues an EXEC CICSENQ command to acquire an enqueue on a resource, and another task already holds an enqueue on it.
• A resource name of EXECADDR indicates that the LENGTH option of the EXEC CICS ENQ command wasomitted - that is, the RESOURCE option supplied the address of the resource to be enqueued upon.
• A resource name of EXECSTRN indicates that the LENGTH option of the EXEC CICS region ENQcommand was specified - that is, the RESOURCE option supplied the name of the resource to beenqueued upon.
• A resource name of EXECPLEX indicates that the LENGTH option of the EXEC CICS sysplex ENQcommand was specified - that is, the RESOURCE option supplied the name of the resource to beenqueued upon.
You can use the CEMT INQUIRE UOWENQ command to discover the owner of the enqueue that thesuspended task is waiting on providing the owner is on the same region. This cannot detect owners onother regions. For EXECADDR type waits, to display the address of the resource specified on the EXECCICS ENQ command you need to use the hexadecimal display option of CEMT.
For detailed information about the EXEC CICS ENQ command, see ENQ.
Investigating interval control waitsIf you have a task that is not running and interval control seems to be involved, you can use thisinformation to understand the possible causes.
About this taskThe following is a list of possible causes, and suggestions to consider before you carry out a detailedinvestigation. If these do not give you enough information in order to solve the problem, go to “Findingthe reason for a DELAY request not completing” on page 153 for further guidance. If, in the course of yourpreliminary investigations, you find that the task is waiting because the terminal where it is due to start isunavailable, turn to “Investigating terminal waits” on page 136.
152 CICS TS for z/OS: Troubleshooting CICS
Procedure• A terminal task that should have been initiated with an EXEC CICS START command did not start
when you expected it to. CEMT INQ TASK does not recognize the task, because it has not yet beenattached.
One approach is to identify the terminal where the subject task should have started, and see if thatterminal is unavailable. You can use CEMT INQ TERMINAL to find the status of the terminal.
• You have found that a task is waiting on resource type ICGTWAIT.This means that the task has issued an EXEC CICS RETRIEVE WAIT command, and the data to beretrieved is not available.a) Find the target TERMID for other tasks issuing EXEC CICS START commands to supply more data.
The resource name gives you the name of the terminal running the task in the ICGTWAIT andtherefore the target TERMID.
b) If there are no tasks in the system that would issue START commands for this TERMID, you need todetermine whether this is reasonable.
c) If there are such tasks in the system, check to see why they are not issuing the required STARTcommands.They might, for example, be waiting for terminal input.
d) Look at the deadlock timeout interval (DTIMOUT) and the system purge value (SPURGE) for the taskissuing the EXEC CICS RETRIEVE WAIT command.If there is no DTIMOUT value or SPURGE=NO has been specified, the task will wait indefinitely forthe data.
Note: The task waiting on resource ICGTWAIT might not be the one that you first set out to investigate.Any AID task scheduled to start at the same terminal cannot do so until the current task hasterminated.
• You have found that the task is waiting on resource type ICWAIT. This means that the task issued anEXEC CICS DELAY command that has not yet completed.a) Check that the interval or time specified on the request was what you intended.
If you believe that the expiry time of the request has passed, that suggests a possible CICS error.b) Consider the possibility that the task was the subject of a long DELAY that was due to be canceled
by some other task. If the second task failed before it could cancel the delay, the first would notcontinue until the full interval specified on DELAY had expired.
• A task that issued EXEC CICS POST did not have its ECB posted when you expected it to. Check tomake sure the interval or time you specified was what you intended.
• A task that issued EXEC CICS WAIT EVENT was not resumed when you thought it should have been.Assuming the WAIT was issued sometime after a POST:a) Check to make sure that the interval or time specified on the POST was what you intended.b) If it is, check to see whether the ECB being waited on was posted. If it has been posted, that
indicates a possible CICS error.
ResultsIf none of the simple checks outlined here help you to solve the problem, read the following information.
Finding the reason for a DELAY request not completingIf your preliminary investigations have not shown the reason for the wait, you need to look in greaterdetail at the evidence available.
Before you begin
Chapter 6. Dealing with the problem 153
About this task
Procedure1. Take a system dump, and format it using the keywords CSA, ICP, and AP.
These get you the common system area, the interval control program control blocks, and the taskcontrol areas, respectively. You might also find information given by the formatting keywords KE(kernel storage areas, including the calling sequence for each task), DS (dispatcher task summary,including details of suspended tasks), and TR (internal trace table) to be useful.
2. Locate field CSATODTU in the CSA and make a note of its value.It is the current CICS time of day in internal ‘timer units’.
3. Locate the TCA for your task, and read the value of field TCAICEAD. This gives you the address of theinterval control element for your task. Use this information to find the ICE (interval control element) forthe task, and look at field ICEXTOD. Make a note of its value.
ResultsIf the value of ICEXTOD is greater than CSATODTU, the ICE has not yet reached the expiry time. Thepossible explanations are:
• Your task either did not make the DELAY request you expected, or the interval specified was longer thanintended. This could indicate a user error. Check the code of the transaction issuing the request to makesure it is correct.
• Your task’s delay request was not executed correctly. This might indicate an error within CICS code, or acorrupted control block.
If the value of ICEXTOD is equal to CSATODTU (very unlikely), you probably took the system dump just asthe interval was about to expire. In such a case, attempt to re-create the problem, take another systemdump, and compare the values again.
If the value of ICEXTOD is less than CSATODTU, the ICE has already expired. The associated task shouldhave resumed. This indicates that some area of storage might have been corrupted, or there is an errorwithin CICS code.
Using trace to find out why tasks are waiting on interval controlFollow this procedure to use trace to find out why tasks are waiting on interval control.
Before you beginBefore using trace to find out why your task is waiting on interval control, select an appropriate tracedestination and set up the right tracing options.
About this taskBy their nature, interval control waits can be long, so select auxiliary trace as the destination, becauseyou can specify large trace data sets for auxiliary trace. However, the data sets do not have to be largeenough to record tracing for the whole interval specified when you first detected the problem. That isbecause the error is likely to be reproducible when you specify a shorter interval, if it is reproducible at all.For example, if the error was detected when an interval of 20 seconds was specified, try to reproduce itspecifying an interval of 1 second.
As far as tracing selectivity is concerned, you need to capture level 2 trace entries made by dispatcherdomain, timer domain, and interval control program. The sort of trace entries that you can expect innormal operation are shown in the examples below. They show the flow of data and control followingexecution of the command EXEC CICS DELAY INTERVAL(000003). A similar set of trace entries wouldbe obtained if TIME had been specified instead of INTERVAL, because TIME values are converted tocorresponding INTERVAL values before timer domain is called.
154 CICS TS for z/OS: Troubleshooting CICS
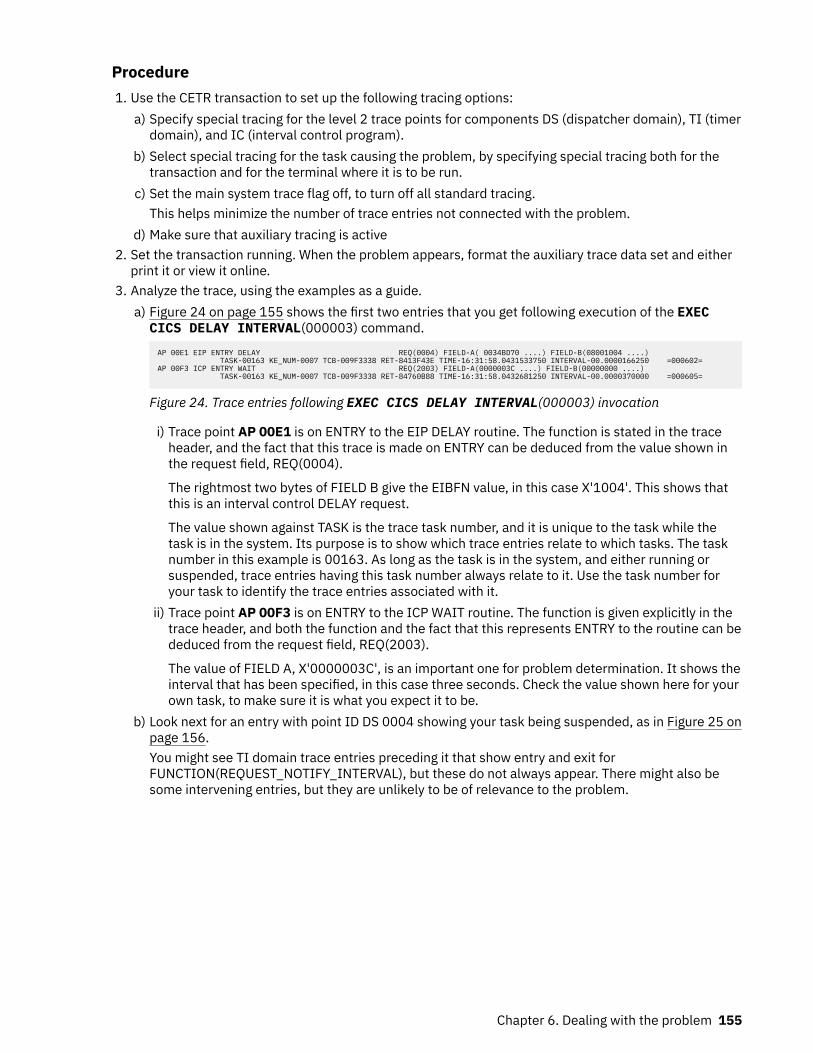
Procedure1. Use the CETR transaction to set up the following tracing options:
a) Specify special tracing for the level 2 trace points for components DS (dispatcher domain), TI (timerdomain), and IC (interval control program).
b) Select special tracing for the task causing the problem, by specifying special tracing both for thetransaction and for the terminal where it is to be run.
c) Set the main system trace flag off, to turn off all standard tracing.This helps minimize the number of trace entries not connected with the problem.
d) Make sure that auxiliary tracing is active2. Set the transaction running. When the problem appears, format the auxiliary trace data set and either
print it or view it online.3. Analyze the trace, using the examples as a guide.
a) Figure 24 on page 155 shows the first two entries that you get following execution of the EXECCICS DELAY INTERVAL(000003) command.
AP 00E1 EIP ENTRY DELAY REQ(0004) FIELD-A( 0034BD70 ....) FIELD-B(08001004 ....) TASK-00163 KE_NUM-0007 TCB-009F3338 RET-8413F43E TIME-16:31:58.0431533750 INTERVAL-00.0000166250 =000602=AP 00F3 ICP ENTRY WAIT REQ(2003) FIELD-A(0000003C ....) FIELD-B(00000000 ....) TASK-00163 KE_NUM-0007 TCB-009F3338 RET-84760B88 TIME-16:31:58.0432681250 INTERVAL-00.0000370000 =000605=
Figure 24. Trace entries following EXEC CICS DELAY INTERVAL(000003) invocation
i) Trace point AP 00E1 is on ENTRY to the EIP DELAY routine. The function is stated in the traceheader, and the fact that this trace is made on ENTRY can be deduced from the value shown inthe request field, REQ(0004).
The rightmost two bytes of FIELD B give the EIBFN value, in this case X'1004'. This shows thatthis is an interval control DELAY request.
The value shown against TASK is the trace task number, and it is unique to the task while thetask is in the system. Its purpose is to show which trace entries relate to which tasks. The tasknumber in this example is 00163. As long as the task is in the system, and either running orsuspended, trace entries having this task number always relate to it. Use the task number foryour task to identify the trace entries associated with it.
ii) Trace point AP 00F3 is on ENTRY to the ICP WAIT routine. The function is given explicitly in thetrace header, and both the function and the fact that this represents ENTRY to the routine can bededuced from the request field, REQ(2003).
The value of FIELD A, X'0000003C', is an important one for problem determination. It shows theinterval that has been specified, in this case three seconds. Check the value shown here for yourown task, to make sure it is what you expect it to be.
b) Look next for an entry with point ID DS 0004 showing your task being suspended, as in Figure 25 onpage 156.You might see TI domain trace entries preceding it that show entry and exit forFUNCTION(REQUEST_NOTIFY_INTERVAL), but these do not always appear. There might also besome intervening entries, but they are unlikely to be of relevance to the problem.
Chapter 6. Dealing with the problem 155
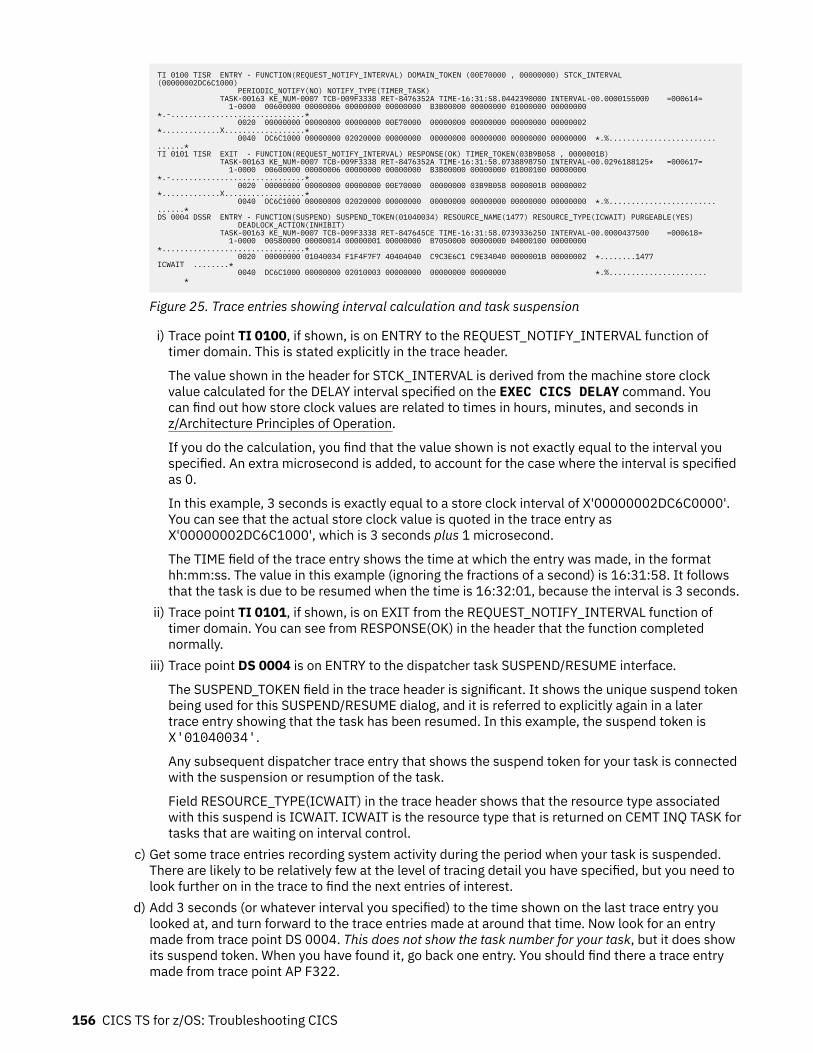
TI 0100 TISR ENTRY - FUNCTION(REQUEST_NOTIFY_INTERVAL) DOMAIN_TOKEN (00E70000 , 00000000) STCK_INTERVAL(00000002DC6C1000) PERIODIC_NOTIFY(NO) NOTIFY_TYPE(TIMER_TASK) TASK-00163 KE_NUM-0007 TCB-009F3338 RET-8476352A TIME-16:31:58.0442390000 INTERVAL-00.0000155000 =000614= 1-0000 00600000 00000006 00000000 00000000 B3B00000 00000000 01000000 00000000 *.-..............................* 0020 00000000 00000000 00000000 00E70000 00000000 00000000 00000000 00000002 *.............X..................* 0040 DC6C1000 00000000 02020000 00000000 00000000 00000000 00000000 00000000 *.%..............................*TI 0101 TISR EXIT - FUNCTION(REQUEST_NOTIFY_INTERVAL) RESPONSE(OK) TIMER_TOKEN(03B9B058 , 0000001B) TASK-00163 KE_NUM-0007 TCB-009F3338 RET-8476352A TIME-16:31:58.0738898750 INTERVAL-00.0296188125* =000617= 1-0000 00600000 00000006 00000000 00000000 B3B00000 00000000 01000100 00000000 *.-..............................* 0020 00000000 00000000 00000000 00E70000 00000000 03B9B058 0000001B 00000002 *.............X..................* 0040 DC6C1000 00000000 02020000 00000000 00000000 00000000 00000000 00000000 *.%..............................*DS 0004 DSSR ENTRY - FUNCTION(SUSPEND) SUSPEND_TOKEN(01040034) RESOURCE_NAME(1477) RESOURCE_TYPE(ICWAIT) PURGEABLE(YES) DEADLOCK_ACTION(INHIBIT) TASK-00163 KE_NUM-0007 TCB-009F3338 RET-847645CE TIME-16:31:58.0739336250 INTERVAL-00.0000437500 =000618= 1-0000 00580000 00000014 00000001 00000000 B7050000 00000000 04000100 00000000 *................................* 0020 00000000 01040034 F1F4F7F7 40404040 C9C3E6C1 C9E34040 0000001B 00000002 *........1477 ICWAIT ........* 0040 DC6C1000 00000000 02010003 00000000 00000000 00000000 *.%...................... *
Figure 25. Trace entries showing interval calculation and task suspension
i) Trace point TI 0100, if shown, is on ENTRY to the REQUEST_NOTIFY_INTERVAL function oftimer domain. This is stated explicitly in the trace header.
The value shown in the header for STCK_INTERVAL is derived from the machine store clockvalue calculated for the DELAY interval specified on the EXEC CICS DELAY command. Youcan find out how store clock values are related to times in hours, minutes, and seconds inz/Architecture Principles of Operation.
If you do the calculation, you find that the value shown is not exactly equal to the interval youspecified. An extra microsecond is added, to account for the case where the interval is specifiedas 0.
In this example, 3 seconds is exactly equal to a store clock interval of X'00000002DC6C0000'.You can see that the actual store clock value is quoted in the trace entry asX'00000002DC6C1000', which is 3 seconds plus 1 microsecond.
The TIME field of the trace entry shows the time at which the entry was made, in the formathh:mm:ss. The value in this example (ignoring the fractions of a second) is 16:31:58. It followsthat the task is due to be resumed when the time is 16:32:01, because the interval is 3 seconds.
ii) Trace point TI 0101, if shown, is on EXIT from the REQUEST_NOTIFY_INTERVAL function oftimer domain. You can see from RESPONSE(OK) in the header that the function completednormally.
iii) Trace point DS 0004 is on ENTRY to the dispatcher task SUSPEND/RESUME interface.
The SUSPEND_TOKEN field in the trace header is significant. It shows the unique suspend tokenbeing used for this SUSPEND/RESUME dialog, and it is referred to explicitly again in a latertrace entry showing that the task has been resumed. In this example, the suspend token isX'01040034'.
Any subsequent dispatcher trace entry that shows the suspend token for your task is connectedwith the suspension or resumption of the task.
Field RESOURCE_TYPE(ICWAIT) in the trace header shows that the resource type associatedwith this suspend is ICWAIT. ICWAIT is the resource type that is returned on CEMT INQ TASK fortasks that are waiting on interval control.
c) Get some trace entries recording system activity during the period when your task is suspended.There are likely to be relatively few at the level of tracing detail you have specified, but you need tolook further on in the trace to find the next entries of interest.
d) Add 3 seconds (or whatever interval you specified) to the time shown on the last trace entry youlooked at, and turn forward to the trace entries made at around that time. Now look for an entrymade from trace point DS 0004. This does not show the task number for your task, but it does showits suspend token. When you have found it, go back one entry. You should find there a trace entrymade from trace point AP F322.
156 CICS TS for z/OS: Troubleshooting CICS
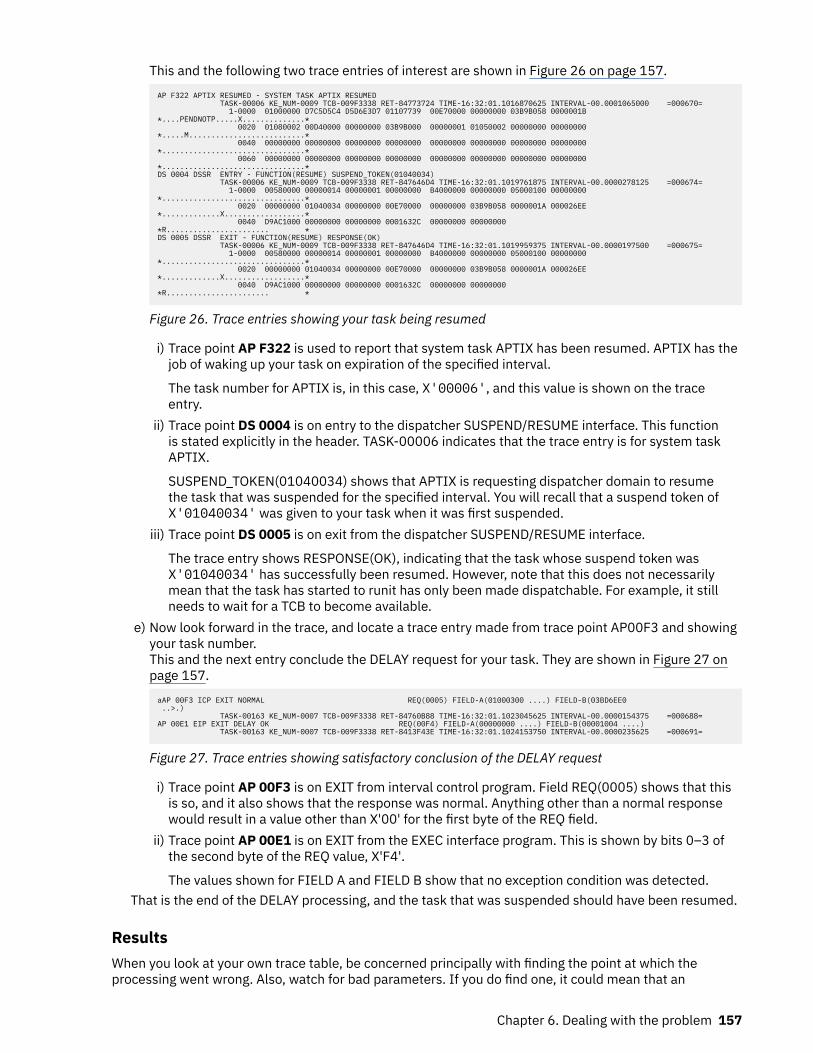
This and the following two trace entries of interest are shown in Figure 26 on page 157.
AP F322 APTIX RESUMED - SYSTEM TASK APTIX RESUMED TASK-00006 KE_NUM-0009 TCB-009F3338 RET-84773724 TIME-16:32:01.1016870625 INTERVAL-00.0001065000 =000670= 1-0000 01000000 D7C5D5C4 D5D6E3D7 01107739 00E70000 00000000 03B9B058 0000001B *....PENDNOTP.....X..............* 0020 01080002 00D40000 00000000 03B9B000 00000001 01050002 00000000 00000000 *.....M..........................* 0040 00000000 00000000 00000000 00000000 00000000 00000000 00000000 00000000 *................................* 0060 00000000 00000000 00000000 00000000 00000000 00000000 00000000 00000000 *................................*DS 0004 DSSR ENTRY - FUNCTION(RESUME) SUSPEND_TOKEN(01040034) TASK-00006 KE_NUM-0009 TCB-009F3338 RET-847646D4 TIME-16:32:01.1019761875 INTERVAL-00.0000278125 =000674= 1-0000 00580000 00000014 00000001 00000000 B4000000 00000000 05000100 00000000 *................................* 0020 00000000 01040034 00000000 00E70000 00000000 03B9B058 0000001A 000026EE *.............X..................* 0040 D9AC1000 00000000 00000000 0001632C 00000000 00000000 *R....................... *DS 0005 DSSR EXIT - FUNCTION(RESUME) RESPONSE(OK) TASK-00006 KE_NUM-0009 TCB-009F3338 RET-847646D4 TIME-16:32:01.1019959375 INTERVAL-00.0000197500 =000675= 1-0000 00580000 00000014 00000001 00000000 B4000000 00000000 05000100 00000000 *................................* 0020 00000000 01040034 00000000 00E70000 00000000 03B9B058 0000001A 000026EE *.............X..................* 0040 D9AC1000 00000000 00000000 0001632C 00000000 00000000 *R....................... *
Figure 26. Trace entries showing your task being resumed
i) Trace point AP F322 is used to report that system task APTIX has been resumed. APTIX has thejob of waking up your task on expiration of the specified interval.
The task number for APTIX is, in this case, X'00006', and this value is shown on the traceentry.
ii) Trace point DS 0004 is on entry to the dispatcher SUSPEND/RESUME interface. This functionis stated explicitly in the header. TASK-00006 indicates that the trace entry is for system taskAPTIX.
SUSPEND_TOKEN(01040034) shows that APTIX is requesting dispatcher domain to resumethe task that was suspended for the specified interval. You will recall that a suspend token ofX'01040034' was given to your task when it was first suspended.
iii) Trace point DS 0005 is on exit from the dispatcher SUSPEND/RESUME interface.
The trace entry shows RESPONSE(OK), indicating that the task whose suspend token wasX'01040034' has successfully been resumed. However, note that this does not necessarilymean that the task has started to runit has only been made dispatchable. For example, it stillneeds to wait for a TCB to become available.
e) Now look forward in the trace, and locate a trace entry made from trace point AP00F3 and showingyour task number.This and the next entry conclude the DELAY request for your task. They are shown in Figure 27 onpage 157.
aAP 00F3 ICP EXIT NORMAL REQ(0005) FIELD-A(01000300 ....) FIELD-B(03BD6EE0 ..>.) TASK-00163 KE_NUM-0007 TCB-009F3338 RET-84760B88 TIME-16:32:01.1023045625 INTERVAL-00.0000154375 =000688=AP 00E1 EIP EXIT DELAY OK REQ(00F4) FIELD-A(00000000 ....) FIELD-B(00001004 ....) TASK-00163 KE_NUM-0007 TCB-009F3338 RET-8413F43E TIME-16:32:01.1024153750 INTERVAL-00.0000235625 =000691=
Figure 27. Trace entries showing satisfactory conclusion of the DELAY request
i) Trace point AP 00F3 is on EXIT from interval control program. Field REQ(0005) shows that thisis so, and it also shows that the response was normal. Anything other than a normal responsewould result in a value other than X'00' for the first byte of the REQ field.
ii) Trace point AP 00E1 is on EXIT from the EXEC interface program. This is shown by bits 0–3 ofthe second byte of the REQ value, X'F4'.
The values shown for FIELD A and FIELD B show that no exception condition was detected.That is the end of the DELAY processing, and the task that was suspended should have been resumed.
ResultsWhen you look at your own trace table, be concerned principally with finding the point at which theprocessing went wrong. Also, watch for bad parameters. If you do find one, it could mean that an
Chapter 6. Dealing with the problem 157
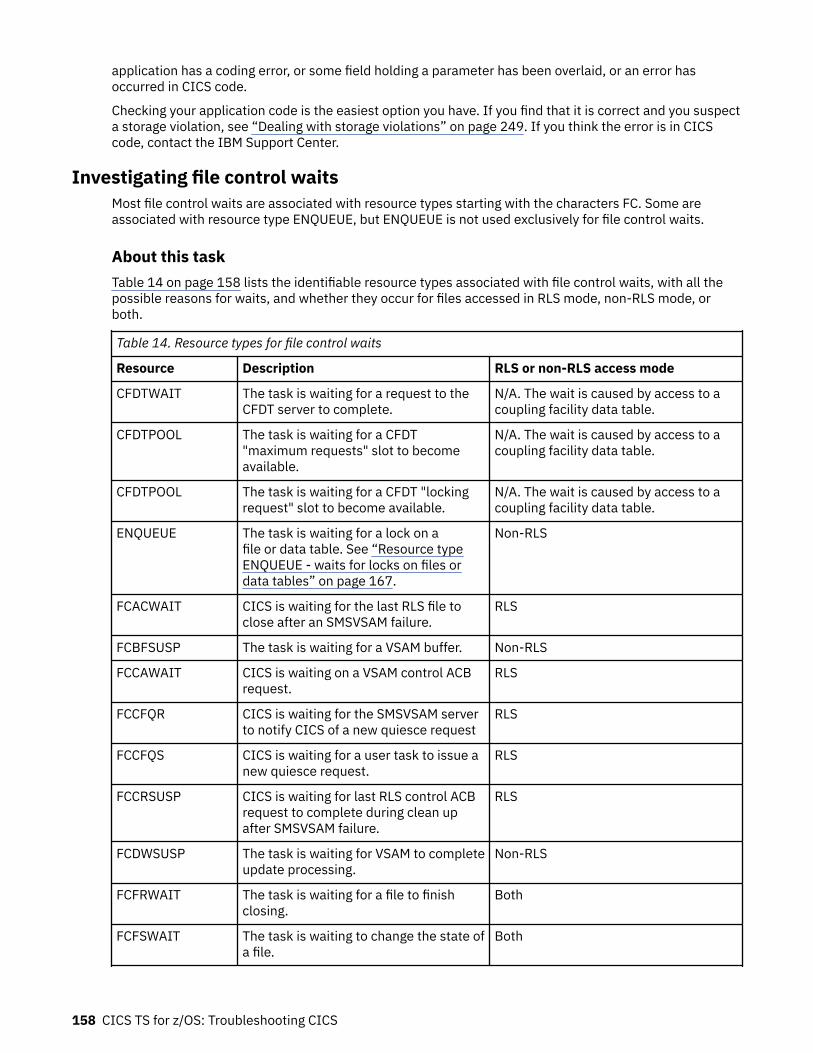
application has a coding error, or some field holding a parameter has been overlaid, or an error hasoccurred in CICS code.
Checking your application code is the easiest option you have. If you find that it is correct and you suspecta storage violation, see “Dealing with storage violations” on page 249. If you think the error is in CICScode, contact the IBM Support Center.
Investigating file control waitsMost file control waits are associated with resource types starting with the characters FC. Some areassociated with resource type ENQUEUE, but ENQUEUE is not used exclusively for file control waits.
About this taskTable 14 on page 158 lists the identifiable resource types associated with file control waits, with all thepossible reasons for waits, and whether they occur for files accessed in RLS mode, non-RLS mode, orboth.
Table 14. Resource types for file control waits
Resource Description RLS or non-RLS access mode
CFDTWAIT The task is waiting for a request to theCFDT server to complete.
N/A. The wait is caused by access to acoupling facility data table.
CFDTPOOL The task is waiting for a CFDT"maximum requests" slot to becomeavailable.
N/A. The wait is caused by access to acoupling facility data table.
CFDTPOOL The task is waiting for a CFDT "lockingrequest" slot to become available.
N/A. The wait is caused by access to acoupling facility data table.
ENQUEUE The task is waiting for a lock on afile or data table. See “Resource typeENQUEUE - waits for locks on files ordata tables” on page 167.
Non-RLS
FCACWAIT CICS is waiting for the last RLS file toclose after an SMSVSAM failure.
RLS
FCBFSUSP The task is waiting for a VSAM buffer. Non-RLS
FCCAWAIT CICS is waiting on a VSAM control ACBrequest.
RLS
FCCFQR CICS is waiting for the SMSVSAM serverto notify CICS of a new quiesce request
RLS
FCCFQS CICS is waiting for a user task to issue anew quiesce request.
RLS
FCCRSUSP CICS is waiting for last RLS control ACBrequest to complete during clean upafter SMSVSAM failure.
RLS
FCDWSUSP The task is waiting for VSAM to completeupdate processing.
Non-RLS
FCFRWAIT The task is waiting for a file to finishclosing.
Both
FCFSWAIT The task is waiting to change the state ofa file.
Both
158 CICS TS for z/OS: Troubleshooting CICS
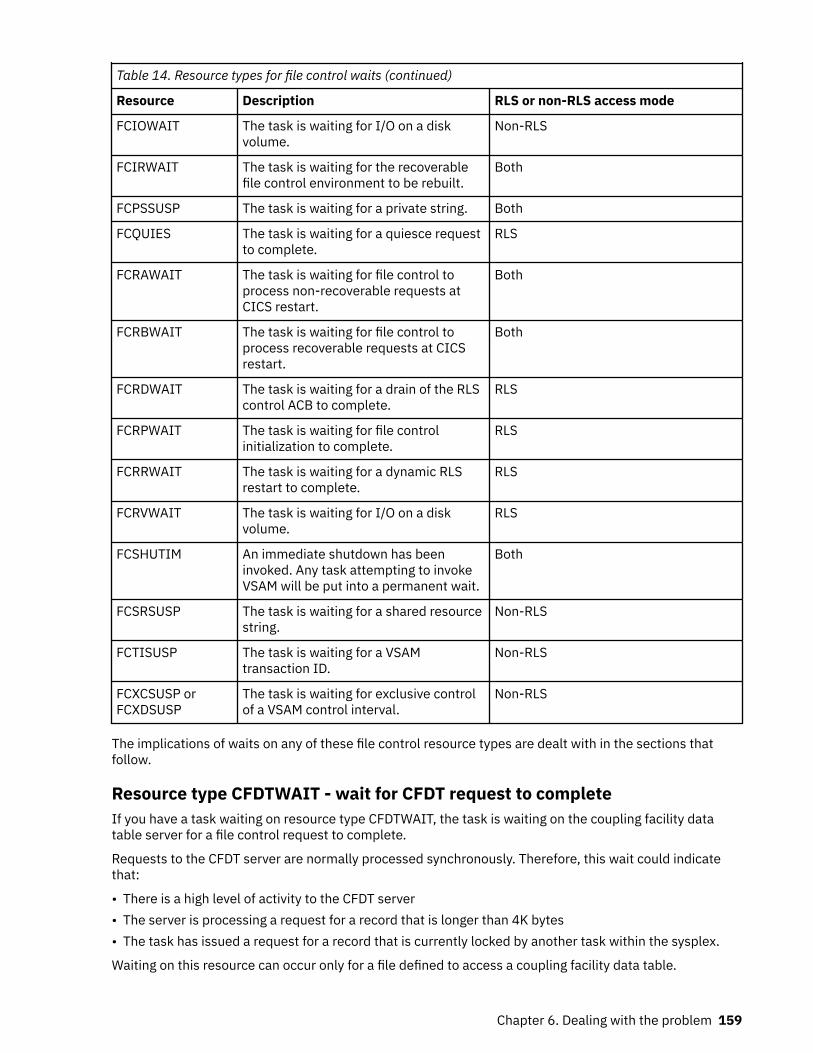
Table 14. Resource types for file control waits (continued)
Resource Description RLS or non-RLS access mode
FCIOWAIT The task is waiting for I/O on a diskvolume.
Non-RLS
FCIRWAIT The task is waiting for the recoverablefile control environment to be rebuilt.
Both
FCPSSUSP The task is waiting for a private string. Both
FCQUIES The task is waiting for a quiesce requestto complete.
RLS
FCRAWAIT The task is waiting for file control toprocess non-recoverable requests atCICS restart.
Both
FCRBWAIT The task is waiting for file control toprocess recoverable requests at CICSrestart.
Both
FCRDWAIT The task is waiting for a drain of the RLScontrol ACB to complete.
RLS
FCRPWAIT The task is waiting for file controlinitialization to complete.
RLS
FCRRWAIT The task is waiting for a dynamic RLSrestart to complete.
RLS
FCRVWAIT The task is waiting for I/O on a diskvolume.
RLS
FCSHUTIM An immediate shutdown has beeninvoked. Any task attempting to invokeVSAM will be put into a permanent wait.
Both
FCSRSUSP The task is waiting for a shared resourcestring.
Non-RLS
FCTISUSP The task is waiting for a VSAMtransaction ID.
Non-RLS
FCXCSUSP orFCXDSUSP
The task is waiting for exclusive controlof a VSAM control interval.
Non-RLS
The implications of waits on any of these file control resource types are dealt with in the sections thatfollow.
Resource type CFDTWAIT - wait for CFDT request to completeIf you have a task waiting on resource type CFDTWAIT, the task is waiting on the coupling facility datatable server for a file control request to complete.
Requests to the CFDT server are normally processed synchronously. Therefore, this wait could indicatethat:
• There is a high level of activity to the CFDT server• The server is processing a request for a record that is longer than 4K bytes• The task has issued a request for a record that is currently locked by another task within the sysplex.
Waiting on this resource can occur only for a file defined to access a coupling facility data table.
Chapter 6. Dealing with the problem 159
Resource type CFDTPOOL - wait for CFDT a request slotIf you have a task waiting on resource type CFDTPOOL, the task is waiting for a free slot within themaximum requests limit to become available.
CICS places a limit on the number of requests that a region can have running simultaneously in a couplingfacility data tables server. This limit is known as the "maxreqs" limit, and it avoids overloading thecoupling facility. If the number of requests currently running in the server for a CICS region has reachedthis limit, a request waits until one of the other requests completes.
Waiting on this resource can occur only for a file defined to access a coupling facility data table.
Resource type CFDTLRSW - wait for CFDT locking request slotIf you have a task waiting on resource type CFDTLRSW, the task is waiting for a free locking request slot tobecome available.
CICS places a limit on the number of locking requests (that is, requests that might acquire record locks)that a region can have simultaneously running in a coupling facility data table server. This limit is knownas the locking request slot (LRS) limit, and it avoids tasks that hold locks from preventing other couplingfacility data table accesses. If the number of locking requests currently running in the server for a CICSregion has reached the LRS limit, this request waits for one of the locking requests to complete.
Waiting on this resource can occur only for files defined to access a coupling facility data table, and onlyfor record access requests that could potentially require a lock.
Resource type FCACWAIT & FCCRSUSP - wait for SMSVSAM clean upThe only task that can wait on resource types FCACWAIT and FCCRSUSP is CSFR, the task that performsclean up after failure of the SMSVSAM server.
This is the server that CICS file control uses for any VSAM request it issues in RLS mode. clean up afterSMSVSAM failure is in two stages.
1. Wait for VSAM to reject any file requests that were in-flight at the time of the server failure. When allthese active file requests have been rejected, CSFR cleans up CICS state by issuing a CLOSE requestagainst every file open in RLS mode. When the last CLOSE request has completed, the first stage ofclean up is complete.
If CSFR is waiting for this first stage of clean up to complete, it is waiting on resource type FCACWAIT.2. Wait for VSAM to reject any system requests issued against the SMSVSAM control ACB, and then
unregister the control ACB.
If CSFR is waiting for this second stage of clean up to complete, it is waiting on resource typeFCCRSUSP.
FCACWAIT and FCCRSUSP are RLS-related waits only.
Resource type FCBFSUSP - waits for VSAM buffersIf your task is waiting on resource type FCBFSUSP, it means that a VSAM buffer is not currently available.
You can specify the number of VSAM data buffers and VSAM index buffers in the FILE resource definitionusing the DATABUFFERS and INDEXBUFFERS parameters, respectively. Consider increasing the numbersof these buffers if you find that tasks are frequently having to wait on this resource type.
If there are insufficient data and index buffers for a single task, the task is suspended indefinitely. Thismight happen unexpectedly if you have a base cluster and one or more paths in the upgrade set, and yourapplication references only the base. VSAM upgrades the paths whenever changes are made to the base.There could then be too few buffers defined in the LSRPOOL for both base and paths.
Waiting on this resource can occur only for files accessed in non-RLS mode.
160 CICS TS for z/OS: Troubleshooting CICS
Resource type FCCAWAIT - waits on the SMSVSAM control ACBIf your task is waiting for resource type FCCAWAIT, it means that the task is waiting within VSAM for arequest issued against the RLS control ACB to complete. The control ACB is used for requests that are notissued against any specific file.
For example, requests to:
• Release locks• Convert locks to retained status• Quiesce data sets.
If the request is to quiesce a data set, CICS is waiting for other CICS regions that access the data set torespond to the quiesce request. In other cases, the request should complete quickly. Failure to completequickly could indicate a delay within the VSAM lock manager.
Waits on this type of resource can occur only for files accessed in RLS mode.
Resource type FCCFQR - wait for SMSVSAM server notificationThe system task CFQR can wait on resource type FCCFQR. This is the normal state for this task and meansthat the task is waiting on an ECB for more work.
New work is created for the task when CICS receives a quiesce request from its SMSVSAM server throughthe CICS RLS quiesce exit program, DFHFCQX. SMSVSAM drives the CICS RLS quiesce exit, which createsa control block for the request and posts the CFQR task to notify it of the request’'s arrival.
Resource type FCCFQS - wait for user task to issue quiesceThe system task CFQS can wait on resource type FCCFQS. This is the normal state for this task and meansthat the task is waiting on an ECB for more work.
New work is created for this system task when a user task issues a quiesce request (for example, issuesan EXEC CICS SET DSNAME(…) QUIESCED WAIT command). The user request is processed by CICSmodule DFHFCQI, which creates a control block for the request and posts the CFQS task to notify it of therequest’s arrival.
Resource type FCDWSUSP - wait for VSAM to complete update processingIf your task is waiting on resource type FCDWSUSP, it has received a VSAM response which might indicatethat your task is trying to read a record while this record is being updated.
Depending on the VSAM response code:
• The read is using a VSAM path while this record is being updated by another request. This other requestis updating the record either using the base or another path. If VSAM has not yet completed the update,the content of the alternate index currently in use is no longer the same as the content of the base dataset.
• A concurrent write to the end of the data set is incomplete.
This is a transient condition. CICS waits for all current update operations for this VSAM data set tocomplete and retries the request twice. If the error continues after the request is retried, CICS assumesthat there is a genuine error and returns a response of ILLOGIC to the application. Since ILLOGIC isa response to all unexpected VSAM errors, CICS also returns the VSAM response and reason codes(X'0890') or (X'089C') in bytes 2 and 3 of EIBRCODE. These identify the cause of the ILLOGIC response.
Waiting on this resource can occur only for files accessed in non-RLS mode.
Chapter 6. Dealing with the problem 161
Resource type FCFRWAIT - wait for file state changesIf your task is waiting on resource type FCFRWAIT, it means that an implicit open is being performed on afile and that file is found to be closing.
This behavior can happen, for example, when an implicit open is being performed on a file and that file isfound to be closing. In that situation the task performing the implicit open waits in an FCFRWAIT for thefile to finish closing at which time it attempts to open the file again.
Only one task at a time waits on FCFRWAIT. If any other tasks attempt to change the state of the samefile, they are suspended on resource type ENQUEUE. See “Task control waits” on page 206.
Waiting on this resource can occur for files accessed in both RLS and non-RLS mode.
Resource type FCFSWAIT - wait for file state changesIf your task is waiting on resource type FCFSWAIT, it means that it has attempted to change the state of afile, but another task is still using the file.
This can happen, for example, if a long-running transaction, possibly conversational, is using arecoverable file. The file cannot be closed until the updates made by the transaction have beencommitted; that is, the transaction has issued a syncpoint. In such a case, consider changing theprogramming logic so that intermediate syncpoints are issued.
Only one task at a time waits on FCFSWAIT. If any other tasks attempt to change the state of the samefile, they are suspended on resource type ENQUEUE. See “Task control waits” on page 206.
Waiting on this resource can occur for files accessed in both RLS and non-RLS mode.
Resource type FCIOWAIT - wait for VSAM I/O (non-RLS)If you have a task waiting on resource type FCIOWAIT, it means that the task is waiting within VSAM forI/O to take place.
For example, VSAM uses MVS RESERVE volume locking, and it is likely that another job has at present gotthe lock on the volume. See if there are any messages on the MVS console to explain the error.
A wait on resource type FCIOWAIT occurs when the exclusive control conflict is deferred internally byVSAM and not returned as an error condition to CICS. An example of this is when a request against an LSRfile is made for exclusive control of a control interval (for example, by WRITE or READ UPDATE) and eitherthis task or another task already holds shared control of this control interval (for example, by STARTBR).
Exclusive control waits are discussed further in “Resource types FCXCSUSP, FCXDSUSP, FCXCPROT, andFCXDPROT - VSAM exclusive control waits” on page 165.
Waiting on this resource can occur only for files accessed in non-RLS mode.
Resource type FCIRWAIT - wait for FC environment to be rebuiltDuring CICS initialization, on a warm or emergency restart, file control must wait for the recoverable filecontrol environment to be rebuilt before performing any restart actions for recoverable files.
DFHFCIR is the module that rebuilds the recoverable file control environment, and the file controlinitialization task waits on resource type FCIRWAIT.
Because this wait occurs during CICS initialization, you should not be able to see a task waiting on thisresource.
162 CICS TS for z/OS: Troubleshooting CICS
Resource types FCPSSUSP and FCSRSUSP - waits for VSAM stringsIf your task is waiting on either of resource types FCPSSUSP or FCSRSUSP, it means that it cannot get aVSAM string. FCPSSUSP shows that the wait is for a private string, and FCSRSUSP shows that the wait isfor a shared resource string. You can purge the task from the system, if the task is purgeable.
For non-RLS mode, the number of strings defined for a VSAM data set (STRINGS parameter in the FILEresource definition) determines how many tasks can use the data set concurrently. STRINGS can have avalue in the range 1–255. For RLS mode, strings are automatically allocated as needed up to a maximumof 1024. When all the strings are in use, any other task wanting to access the data set must wait until astring has been released.
The CICS monitoring facility provides performance data for the VSAM string wait time for each user task.The performance data field 427, FCVSWTT, in the DFHFILE group, shows the elapsed time in which thetask waited for a VSAM string. If tasks are being caused to wait unduly for strings, consider whether youcan increase the value of STRINGS, or change the programming logic so that strings are released morequickly.
An example of programming logic that can hold onto strings (and other VSAM resources) for too long iswhen a conversational transaction issues a STARTBR or READNEXT and then enters a wait for terminalinput without issuing an ENDBR. The browse remains active until the ENDBR, and the VSAM strings andbuffers are retained over the terminal wait. Also, for an LSR file, the transaction continues to hold sharedcontrol of the control interval and causes transactions that attempt to update records in the same controlinterval to wait.
Similarly, transactions hold VSAM resources for too long if a READ UPDATE or WRITE MASSINSERT isoutstanding over a wait for terminal input.
Waiting on this resource can occur for files accessed in both RLS and non-RLS mode.
Resource type FCQUIES - wait for a quiesce request to completeIf your task is waiting on resource type FCQUIES, the task is waiting for the completion of a quiescecommand it has issued for a data set.
For example, an EXEC CICS SET DSNAME(…) QUIESCED WAIT command. The command generates anFCQSE containing the request and passes this into the CFQS task. The CFQS task posts the user taskwhen the request is completed. The resource name gives the hexadecimal address of the FCQSE controlblock.
Resource type FCRAWAIT - file control to process non-recoverable requestsA non-recoverable file control request waits on resource type FCRAWAIT if file control has not completedthe actions required to allow the processing of non-recoverable work. These actions include the buildingof FCT entries.
You do not see a task waiting on this resource type, because this wait occurs during CICS initialization.
Waits on this resource type can occur for files accessed in both RLS and non-RLS mode.
Resource type FCRBWAIT - file control to process recoverable requestsA recoverable file control request waits on resource type FCRBWAIT if file control has not completedthe actions required to allow the processing of recoverable work. These actions include the rebuilding ofnon-RLS enqueues and restarting RLS access.
You do not see a task waiting on this resource type, because this wait occurs during CICS initialization.
Waiting on this resource can occur for files accessed in both RLS and non-RLS mode.
Chapter 6. Dealing with the problem 163
Resource type FCRDWAIT - wait for a drain of the RLS control ACBIf a task is waiting on resource type FCRDWAIT, it is waiting for completion of the drain of the RLS controlACB following an SMSVSAM server failure.
DFHFCRD is the module that performs the drain. When the SMSVSAM server fails, CICS must drain all RLSprocessing, which involves:
• Disabling further RLS access• Preventing existing tasks from issuing further RLS requests after the server becomes available again• Closing all ACBs that are open in RLS mode.
If a system task is waiting on this resource, it means that it is waiting to perform a dynamic RLS restart toreestablish access to a restarted (new) SMSVSAM server. CICS access to the failed server must be drainedbefore CICS can register with the new server.
If a user task is waiting on this resource, it means that it is waiting in backout processing for a drain tocomplete before checking whether the file being backed out is open, because drain affects the open stateof the file.
The drain is carried out by the system task CSFR. This should normally complete without problems,although it may take some time if there is a large number of files to be closed. If a task is waiting onFCRDWAIT for a considerable length of time, you should check whether the CSFR task is itself in a waitand therefore failing to complete.
Resource type FCRPWAIT - wait for file control initialization to completeIf a task is waiting on resource type FCRPWAIT, dynamic RLS restart is waiting for file control initializationto complete.
DFHFCRP is the module that performs most of file control initialization processing. A dynamic RLS restartoccurs when a restarted SMSVSAM server becomes available following a failure of the previous server.If this occurs during CICS initialization, dynamic RLS restart must wait for file control initialization tocomplete.
Because this wait occurs during CICS initialization, you should not be able to see a task waiting on thisresource.
Resource Type FCRRWAIT - wait for dynamic RLS restart to completeIf a task is waiting on resource type FCRRWAIT it means that a dynamic RLS restart is waiting for anearlier dynamic RLS restart to complete.
DFHFCRR is the module that performs dynamic RLS restart processing.
A dynamic RLS restart occurs when a restarted SMSVSAM server becomes available following a failure ofthe previous server. If a restarted SMSVSAM server, which has caused one dynamic RLS restart, fails andbecomes available again, it causes CICS to perform another dynamic RLS restart. If the first dynamic RLSrestart has not finished, the second dynamic RLS restart must wait for the first to complete.
If a task is waiting in FCRRWAIT for a considerable length of time, you should check whether there is anyother task performing dynamic RLS restart, which is itself in a wait and therefore failing to complete.
Resource type FCRVWAIT - wait for VSAM I/O (RLS)If you have a task waiting on resource type FCRVWAIT, it means that the task is waiting within VSAM forI/O to take place, or is waiting for a record lock.
A wait on resource type FCRVWAIT occurs when conflicts over shared or exclusive locks are deferredinternally by VSAM and not returned as an error condition to CICS. Conflicts that can cause an FCRVWAITwait are:
• A task issues a file control READ UPDATE request for a record, for which:
164 CICS TS for z/OS: Troubleshooting CICS
– Another task already holds an exclusive lock– One or more tasks hold a shared lock.
• A task issues a file control READ request with CONSISTENT or REPEATABLE integrity for a record, forwhich:
– Another task already holds an exclusive lock.– Another task is waiting for an exclusive lock because one or more tasks may already have a shared
lock, or another task has an exclusive lock.
Waiting on this resource can occur only for files accessed in RLS mode.
A task could be in an FCRVWAIT state because of a deadlock. If VSAM detects an RLS deadlock condition,it returns a deadlock exception condition to CICS, causing CICS file control to abend the transaction withan AFCW abend code. CICS also writes messages and trace entries that identify the members of thedeadlock chain.
VSAM cannot detect a cross-resource deadlock (for example, a deadlock arising from use of RLS and Db2resources) where another resource manager is involved. A cross-resource deadlock is resolved by VSAMwhen the timeout period expires, as defined by either the DTIMOUT or FTIMEOUT parameters, and thewaiting request is timed out. In this situation, VSAM cannot determine whether the timeout is causedby a cross-resource deadlock, or a timeout caused by another transaction acquiring an RLS lock and notreleasing it. In the event of a timeout, CICS writes trace entries and messages to identify the holder of thelock for which a timed-out transaction is waiting. Similarly, a task could be made to wait on another taskthat has an exclusive or shared lock on a record. If this second task was, itself, waiting for an exclusivelock on a resource for which the first task already has a lock, both tasks would be deadlocked.
Resource type FCTISUSP - wait for a VSAM transaction IDIf your task is waiting on resource type FCTISUSP, it means that there are no VSAM transaction IDsavailable.
Transaction IDs are retained by a task for the duration of a MASSINSERT session. Waits on FCTISUSPshould not be prolonged, and if your task stays suspended on this resource type, it could indicate any ofthe following:
• There could be a system-wide problem. CICS could have stopped running, or it might be running slowly.Turn to Chapter 2, “Classifying the problem,” on page 5 for advice if you suspect this.
• There could be a performance problem. Guidance about dealing with performance problems is given in“Dealing with performance problems” on page 222.
• The logic of your applications might need changing, so that tasks do not retain VSAM transaction IDsfor too long. If the task does other processing during the session, perhaps even involving input from anoperator, code to release the VSAM transaction ID should be included each time.
Waiting on this resource can occur only for files accessed in non-RLS mode.
Resource types FCXCSUSP, FCXDSUSP, FCXCPROT, and FCXDPROT - VSAMexclusive control waitsIf your task is waiting on resource type FCXCSUSP, FCXDSUSP, FCXCPROT, or FCXDPROT, it means thatit cannot get exclusive control of a VSAM control interval at the present time. Another task already hasshared or exclusive control of the control interval, so your task is suspended pending the release of thatcontrol interval.
An exclusive control wait on these resource types occurs in CICS, unlike the similar wait on FCIOWAIT,which occurs in VSAM. See “Resource type FCIOWAIT - wait for VSAM I/O (non-RLS)” on page 162.
FCXCPROT or FCXDPROT waits indicate that VSAM has detected an error in the base cluster, AIX®, orupgrade set. In these cases, it is not advisable to purge the requests because the data set can be lift inan inconsistent state. Purge other tasks involved in the wait to allow CICS to retry the VSAM requests forthose tasks with FCXCPROT and FCXDPROT waits.
Chapter 6. Dealing with the problem 165
Unlike the FCXCSUSP and FCXDSUSP types, tasks waiting with a resource type of FCXCPROT orFCXDPROT will not be purged if the are suspended for longer than their DTIMOUT value.
The CICS monitoring facility provides performance data for the exclusive control wait time for each usertask. The performance data field 426, FCXCWTT, in the DFHFILE group, shows the elapsed time in whichthe task waited for exclusive control. If you find that exclusive control conflicts occur too often in yoursystem, consider changing the programming logic so that applications are less likely to have exclusivecontrol for long periods.
Waiting on this resource can occur only for files accessed in non-RLS mode.
The possibility that a task is deadlocked, waiting on itself or another task for release of the controlinterval, is dealt with in the next section.
Exclusive control deadlockIn non-RLS mode, without some means of avoiding it, a task could wait on itself for exclusive control of aVSAM control interval. If this was allowed to happen, the task would be deadlocked, and neither able torelease exclusive control or reacquire it.
Similarly, a task could be made to wait on another task that has exclusive or shared control of a VSAMcontrol interval. If this second task was, itself, waiting for exclusive control of a resource of which the firsttask has exclusive or shared control, then both tasks would be deadlocked.
CICS however, provides a mechanism to avoid exclusive control deadlock. If a task is waiting on resourcetype FCXCSUSP or FCXDSUSP and causing a task to wait (either itself or another task), causing adeadlock, the task abends either with abend code AFCF or AFCG at the time that it makes the request forexclusive control.
• A task that abends with abend code AFCF would have been waiting for exclusive control of a VSAMcontrol interval of which another task has shared or exclusive control.
• A task that abends with abend code AFCG would have been waiting for exclusive control of a VSAMcontrol interval of which it has shared control.
See Transaction abend codes for more information about these abend codes.
To resolve the problem, you must determine which program caused the potential deadlock. Find outwhich programs are associated with the abending task, and attempt to find the one in error. It is likelyto be one that provides successive browse and update facilities. When you have found the programsassociated with the task, see “How tasks can become deadlocked waiting for exclusive control” on page166 for guidance about finding how the error might have occurred.
For further details on the redispatch of CICS tasks that were waiting for VSAM exclusive control of acontrol interval to become available, see File control operations.
How tasks can become deadlocked waiting for exclusive controlTasks can become deadlocked waiting for exclusive control of a CI only when they have shared control ofthe CI and then attempt to get exclusive control without relinquishing shared control first. This can onlyoccur for VSAM shared resource data sets accessed in non-RLS mode.
For the deadlock to occur, a transaction must first issue a VSAM READ SEQUENTIAL request usingEXEC CICS STARTBR. This is a VSAM shared control operation. It must then issue some VSAM requestrequiring exclusive control of the CI without first ending the shared control operation.
The requests that require exclusive control of the CI are:
• VSAM READ UPDATE, using EXEC CICS READ UPDATE and then EXEC CICS REWRITE.
Exclusive control of the CI is not acquired until after the initial read is complete, but it happensautomatically after that and the CI is not released until the record has been rewritten.
• VSAM WRITE DIRECT, using EXEC CICS WRITE. • VSAM WRITE SEQUENTIAL, using EXEC CICS WRITE MASSINSERT.
166 CICS TS for z/OS: Troubleshooting CICS
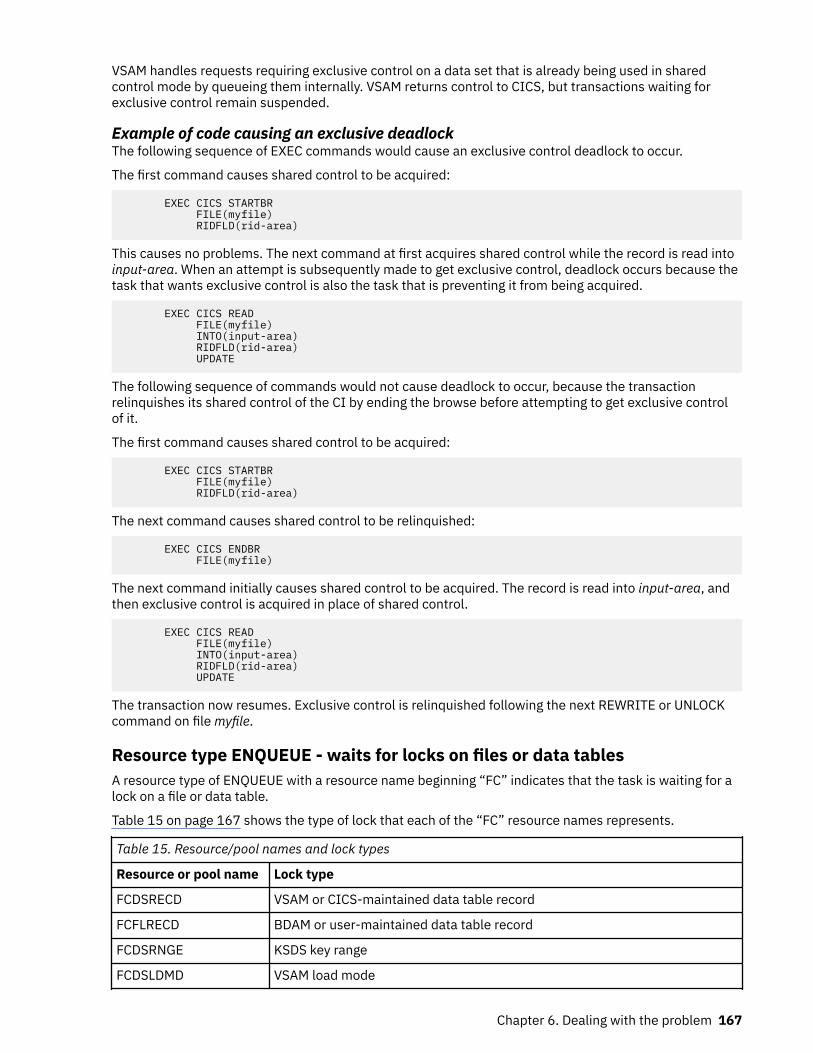
VSAM handles requests requiring exclusive control on a data set that is already being used in sharedcontrol mode by queueing them internally. VSAM returns control to CICS, but transactions waiting forexclusive control remain suspended.
Example of code causing an exclusive deadlockThe following sequence of EXEC commands would cause an exclusive control deadlock to occur.
The first command causes shared control to be acquired:
EXEC CICS STARTBR FILE(myfile) RIDFLD(rid-area)
This causes no problems. The next command at first acquires shared control while the record is read intoinput-area. When an attempt is subsequently made to get exclusive control, deadlock occurs because thetask that wants exclusive control is also the task that is preventing it from being acquired.
EXEC CICS READ FILE(myfile) INTO(input-area) RIDFLD(rid-area) UPDATE
The following sequence of commands would not cause deadlock to occur, because the transactionrelinquishes its shared control of the CI by ending the browse before attempting to get exclusive controlof it.
The first command causes shared control to be acquired:
EXEC CICS STARTBR FILE(myfile) RIDFLD(rid-area)
The next command causes shared control to be relinquished:
EXEC CICS ENDBR FILE(myfile)
The next command initially causes shared control to be acquired. The record is read into input-area, andthen exclusive control is acquired in place of shared control.
EXEC CICS READ FILE(myfile) INTO(input-area) RIDFLD(rid-area) UPDATE
The transaction now resumes. Exclusive control is relinquished following the next REWRITE or UNLOCKcommand on file myfile.
Resource type ENQUEUE - waits for locks on files or data tablesA resource type of ENQUEUE with a resource name beginning “FC” indicates that the task is waiting for alock on a file or data table.
Table 15 on page 167 shows the type of lock that each of the “FC” resource names represents.
Table 15. Resource/pool names and lock types
Resource or pool name Lock type
FCDSRECD VSAM or CICS-maintained data table record
FCFLRECD BDAM or user-maintained data table record
FCDSRNGE KSDS key range
FCDSLDMD VSAM load mode
Chapter 6. Dealing with the problem 167
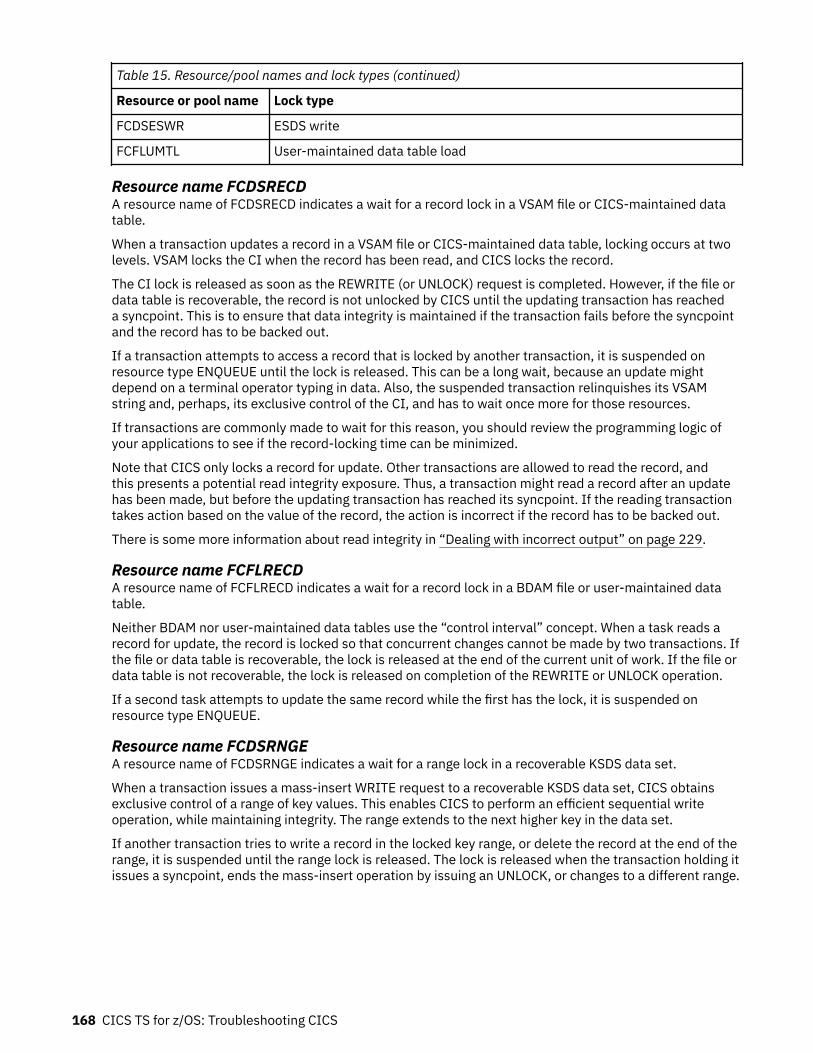
Table 15. Resource/pool names and lock types (continued)
Resource or pool name Lock type
FCDSESWR ESDS write
FCFLUMTL User-maintained data table load
Resource name FCDSRECDA resource name of FCDSRECD indicates a wait for a record lock in a VSAM file or CICS-maintained datatable.
When a transaction updates a record in a VSAM file or CICS-maintained data table, locking occurs at twolevels. VSAM locks the CI when the record has been read, and CICS locks the record.
The CI lock is released as soon as the REWRITE (or UNLOCK) request is completed. However, if the file ordata table is recoverable, the record is not unlocked by CICS until the updating transaction has reacheda syncpoint. This is to ensure that data integrity is maintained if the transaction fails before the syncpointand the record has to be backed out.
If a transaction attempts to access a record that is locked by another transaction, it is suspended onresource type ENQUEUE until the lock is released. This can be a long wait, because an update mightdepend on a terminal operator typing in data. Also, the suspended transaction relinquishes its VSAMstring and, perhaps, its exclusive control of the CI, and has to wait once more for those resources.
If transactions are commonly made to wait for this reason, you should review the programming logic ofyour applications to see if the record-locking time can be minimized.
Note that CICS only locks a record for update. Other transactions are allowed to read the record, andthis presents a potential read integrity exposure. Thus, a transaction might read a record after an updatehas been made, but before the updating transaction has reached its syncpoint. If the reading transactiontakes action based on the value of the record, the action is incorrect if the record has to be backed out.
There is some more information about read integrity in “Dealing with incorrect output” on page 229.
Resource name FCFLRECDA resource name of FCFLRECD indicates a wait for a record lock in a BDAM file or user-maintained datatable.
Neither BDAM nor user-maintained data tables use the “control interval” concept. When a task reads arecord for update, the record is locked so that concurrent changes cannot be made by two transactions. Ifthe file or data table is recoverable, the lock is released at the end of the current unit of work. If the file ordata table is not recoverable, the lock is released on completion of the REWRITE or UNLOCK operation.
If a second task attempts to update the same record while the first has the lock, it is suspended onresource type ENQUEUE.
Resource name FCDSRNGEA resource name of FCDSRNGE indicates a wait for a range lock in a recoverable KSDS data set.
When a transaction issues a mass-insert WRITE request to a recoverable KSDS data set, CICS obtainsexclusive control of a range of key values. This enables CICS to perform an efficient sequential writeoperation, while maintaining integrity. The range extends to the next higher key in the data set.
If another transaction tries to write a record in the locked key range, or delete the record at the end of therange, it is suspended until the range lock is released. The lock is released when the transaction holding itissues a syncpoint, ends the mass-insert operation by issuing an UNLOCK, or changes to a different range.
168 CICS TS for z/OS: Troubleshooting CICS
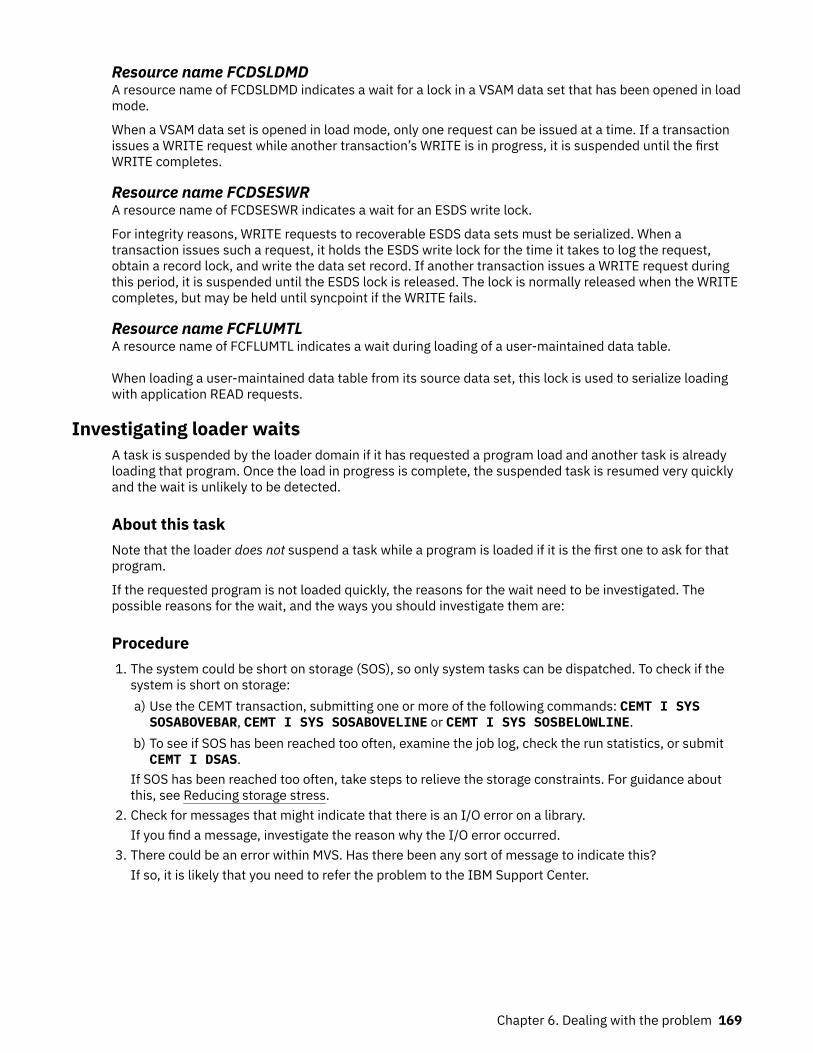
Resource name FCDSLDMDA resource name of FCDSLDMD indicates a wait for a lock in a VSAM data set that has been opened in loadmode.
When a VSAM data set is opened in load mode, only one request can be issued at a time. If a transactionissues a WRITE request while another transaction’s WRITE is in progress, it is suspended until the firstWRITE completes.
Resource name FCDSESWRA resource name of FCDSESWR indicates a wait for an ESDS write lock.
For integrity reasons, WRITE requests to recoverable ESDS data sets must be serialized. When atransaction issues such a request, it holds the ESDS write lock for the time it takes to log the request,obtain a record lock, and write the data set record. If another transaction issues a WRITE request duringthis period, it is suspended until the ESDS lock is released. The lock is normally released when the WRITEcompletes, but may be held until syncpoint if the WRITE fails.
Resource name FCFLUMTLA resource name of FCFLUMTL indicates a wait during loading of a user-maintained data table.
When loading a user-maintained data table from its source data set, this lock is used to serialize loadingwith application READ requests.
Investigating loader waitsA task is suspended by the loader domain if it has requested a program load and another task is alreadyloading that program. Once the load in progress is complete, the suspended task is resumed very quicklyand the wait is unlikely to be detected.
About this taskNote that the loader does not suspend a task while a program is loaded if it is the first one to ask for thatprogram.
If the requested program is not loaded quickly, the reasons for the wait need to be investigated. Thepossible reasons for the wait, and the ways you should investigate them are:
Procedure1. The system could be short on storage (SOS), so only system tasks can be dispatched. To check if the
system is short on storage:a) Use the CEMT transaction, submitting one or more of the following commands: CEMT I SYSSOSABOVEBAR, CEMT I SYS SOSABOVELINE or CEMT I SYS SOSBELOWLINE.
b) To see if SOS has been reached too often, examine the job log, check the run statistics, or submitCEMT I DSAS.
If SOS has been reached too often, take steps to relieve the storage constraints. For guidance aboutthis, see Reducing storage stress.
2. Check for messages that might indicate that there is an I/O error on a library.If you find a message, investigate the reason why the I/O error occurred.
3. There could be an error within MVS. Has there been any sort of message to indicate this?If so, it is likely that you need to refer the problem to the IBM Support Center.
Chapter 6. Dealing with the problem 169
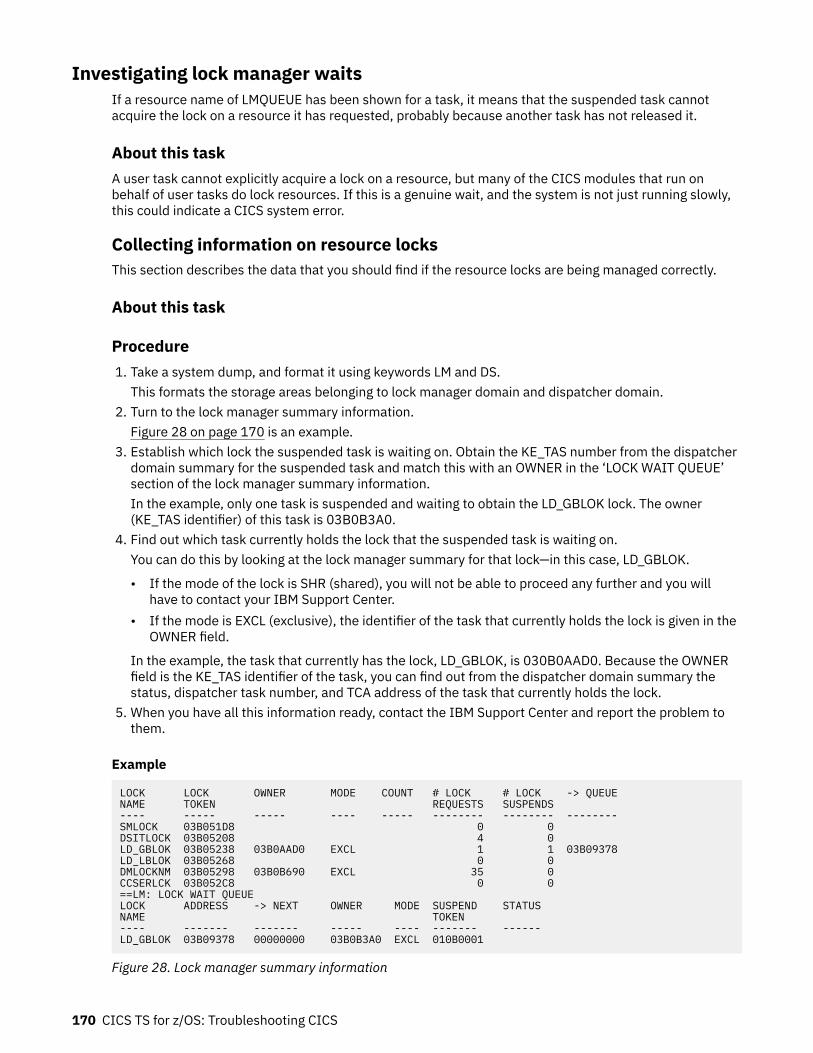
Investigating lock manager waitsIf a resource name of LMQUEUE has been shown for a task, it means that the suspended task cannotacquire the lock on a resource it has requested, probably because another task has not released it.
About this taskA user task cannot explicitly acquire a lock on a resource, but many of the CICS modules that run onbehalf of user tasks do lock resources. If this is a genuine wait, and the system is not just running slowly,this could indicate a CICS system error.
Collecting information on resource locksThis section describes the data that you should find if the resource locks are being managed correctly.
About this task
Procedure1. Take a system dump, and format it using keywords LM and DS.
This formats the storage areas belonging to lock manager domain and dispatcher domain.2. Turn to the lock manager summary information.
Figure 28 on page 170 is an example.3. Establish which lock the suspended task is waiting on. Obtain the KE_TAS number from the dispatcher
domain summary for the suspended task and match this with an OWNER in the ‘LOCK WAIT QUEUE’section of the lock manager summary information.In the example, only one task is suspended and waiting to obtain the LD_GBLOK lock. The owner(KE_TAS identifier) of this task is 03B0B3A0.
4. Find out which task currently holds the lock that the suspended task is waiting on.You can do this by looking at the lock manager summary for that lock—in this case, LD_GBLOK.
• If the mode of the lock is SHR (shared), you will not be able to proceed any further and you willhave to contact your IBM Support Center.
• If the mode is EXCL (exclusive), the identifier of the task that currently holds the lock is given in theOWNER field.
In the example, the task that currently has the lock, LD_GBLOK, is 030B0AAD0. Because the OWNERfield is the KE_TAS identifier of the task, you can find out from the dispatcher domain summary thestatus, dispatcher task number, and TCA address of the task that currently holds the lock.
5. When you have all this information ready, contact the IBM Support Center and report the problem tothem.
Example
LOCK LOCK OWNER MODE COUNT # LOCK # LOCK -> QUEUENAME TOKEN REQUESTS SUSPENDS---- ----- ----- ---- ----- -------- -------- --------SMLOCK 03B051D8 0 0DSITLOCK 03B05208 4 0LD_GBLOK 03B05238 03B0AAD0 EXCL 1 1 03B09378LD_LBLOK 03B05268 0 0DMLOCKNM 03B05298 03B0B690 EXCL 35 0CCSERLCK 03B052C8 0 0==LM: LOCK WAIT QUEUELOCK ADDRESS -> NEXT OWNER MODE SUSPEND STATUSNAME TOKEN---- ------- ------- ----- ---- ------- ------LD_GBLOK 03B09378 00000000 03B0B3A0 EXCL 010B0001
Figure 28. Lock manager summary information
170 CICS TS for z/OS: Troubleshooting CICS
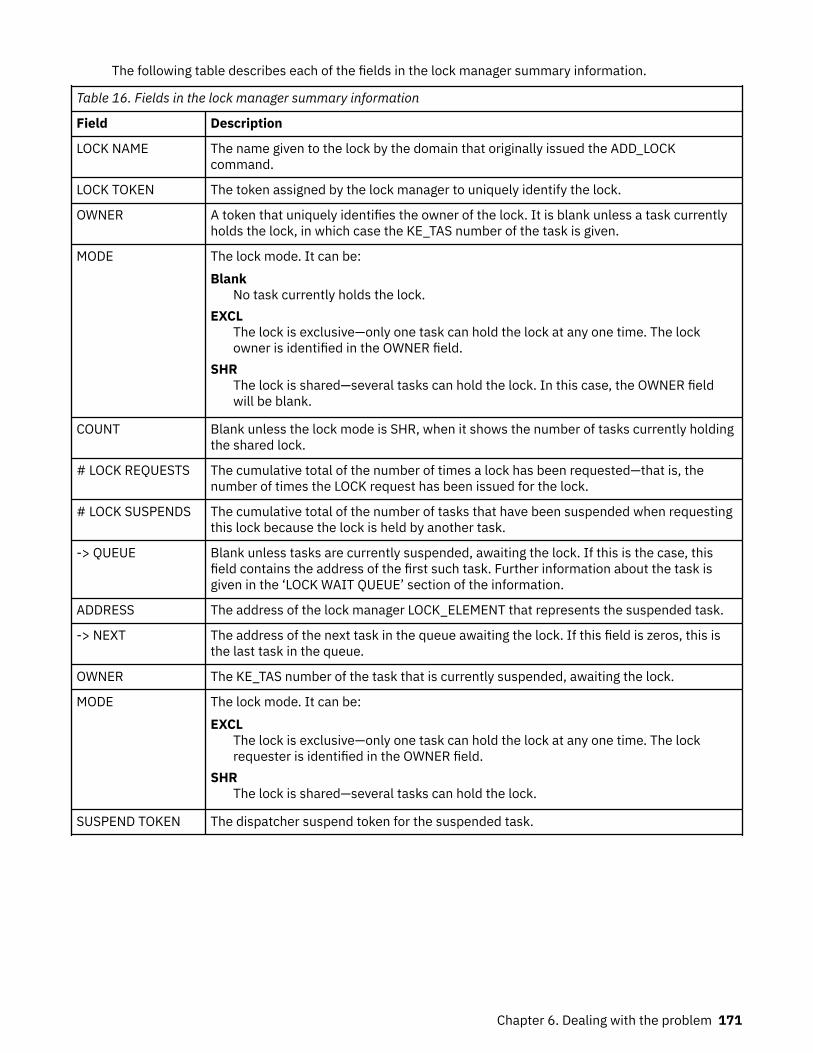
The following table describes each of the fields in the lock manager summary information.
Table 16. Fields in the lock manager summary information
Field Description
LOCK NAME The name given to the lock by the domain that originally issued the ADD_LOCKcommand.
LOCK TOKEN The token assigned by the lock manager to uniquely identify the lock.
OWNER A token that uniquely identifies the owner of the lock. It is blank unless a task currentlyholds the lock, in which case the KE_TAS number of the task is given.
MODE The lock mode. It can be:Blank
No task currently holds the lock.EXCL
The lock is exclusive—only one task can hold the lock at any one time. The lockowner is identified in the OWNER field.
SHRThe lock is shared—several tasks can hold the lock. In this case, the OWNER fieldwill be blank.
COUNT Blank unless the lock mode is SHR, when it shows the number of tasks currently holdingthe shared lock.
# LOCK REQUESTS The cumulative total of the number of times a lock has been requested—that is, thenumber of times the LOCK request has been issued for the lock.
# LOCK SUSPENDS The cumulative total of the number of tasks that have been suspended when requestingthis lock because the lock is held by another task.
-> QUEUE Blank unless tasks are currently suspended, awaiting the lock. If this is the case, thisfield contains the address of the first such task. Further information about the task isgiven in the ‘LOCK WAIT QUEUE’ section of the information.
ADDRESS The address of the lock manager LOCK_ELEMENT that represents the suspended task.
-> NEXT The address of the next task in the queue awaiting the lock. If this field is zeros, this isthe last task in the queue.
OWNER The KE_TAS number of the task that is currently suspended, awaiting the lock.
MODE The lock mode. It can be:EXCL
The lock is exclusive—only one task can hold the lock at any one time. The lockrequester is identified in the OWNER field.
SHRThe lock is shared—several tasks can hold the lock.
SUSPEND TOKEN The dispatcher suspend token for the suspended task.
Chapter 6. Dealing with the problem 171
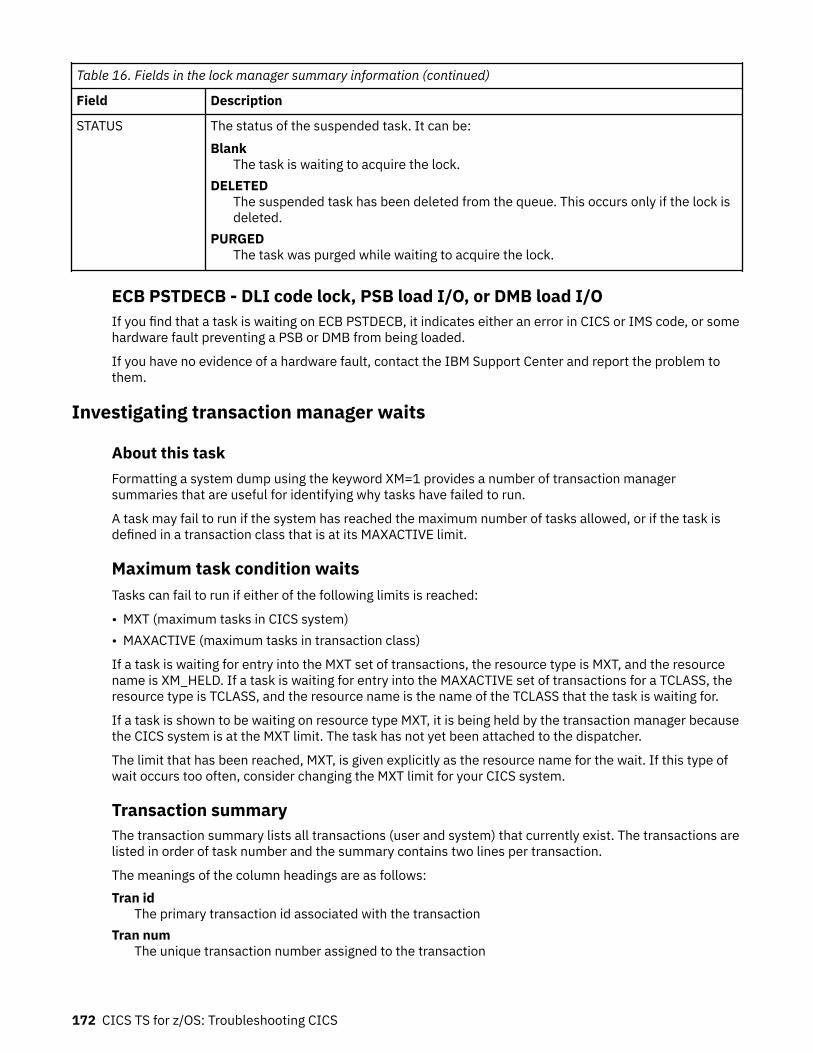
Table 16. Fields in the lock manager summary information (continued)
Field Description
STATUS The status of the suspended task. It can be:Blank
The task is waiting to acquire the lock.DELETED
The suspended task has been deleted from the queue. This occurs only if the lock isdeleted.
PURGEDThe task was purged while waiting to acquire the lock.
ECB PSTDECB - DLI code lock, PSB load I/O, or DMB load I/OIf you find that a task is waiting on ECB PSTDECB, it indicates either an error in CICS or IMS code, or somehardware fault preventing a PSB or DMB from being loaded.
If you have no evidence of a hardware fault, contact the IBM Support Center and report the problem tothem.
Investigating transaction manager waits
About this taskFormatting a system dump using the keyword XM=1 provides a number of transaction managersummaries that are useful for identifying why tasks have failed to run.
A task may fail to run if the system has reached the maximum number of tasks allowed, or if the task isdefined in a transaction class that is at its MAXACTIVE limit.
Maximum task condition waitsTasks can fail to run if either of the following limits is reached:
• MXT (maximum tasks in CICS system)• MAXACTIVE (maximum tasks in transaction class)
If a task is waiting for entry into the MXT set of transactions, the resource type is MXT, and the resourcename is XM_HELD. If a task is waiting for entry into the MAXACTIVE set of transactions for a TCLASS, theresource type is TCLASS, and the resource name is the name of the TCLASS that the task is waiting for.
If a task is shown to be waiting on resource type MXT, it is being held by the transaction manager becausethe CICS system is at the MXT limit. The task has not yet been attached to the dispatcher.
The limit that has been reached, MXT, is given explicitly as the resource name for the wait. If this type ofwait occurs too often, consider changing the MXT limit for your CICS system.
Transaction summaryThe transaction summary lists all transactions (user and system) that currently exist. The transactions arelisted in order of task number and the summary contains two lines per transaction.
The meanings of the column headings are as follows:Tran id
The primary transaction id associated with the transactionTran num
The unique transaction number assigned to the transaction
172 CICS TS for z/OS: Troubleshooting CICS
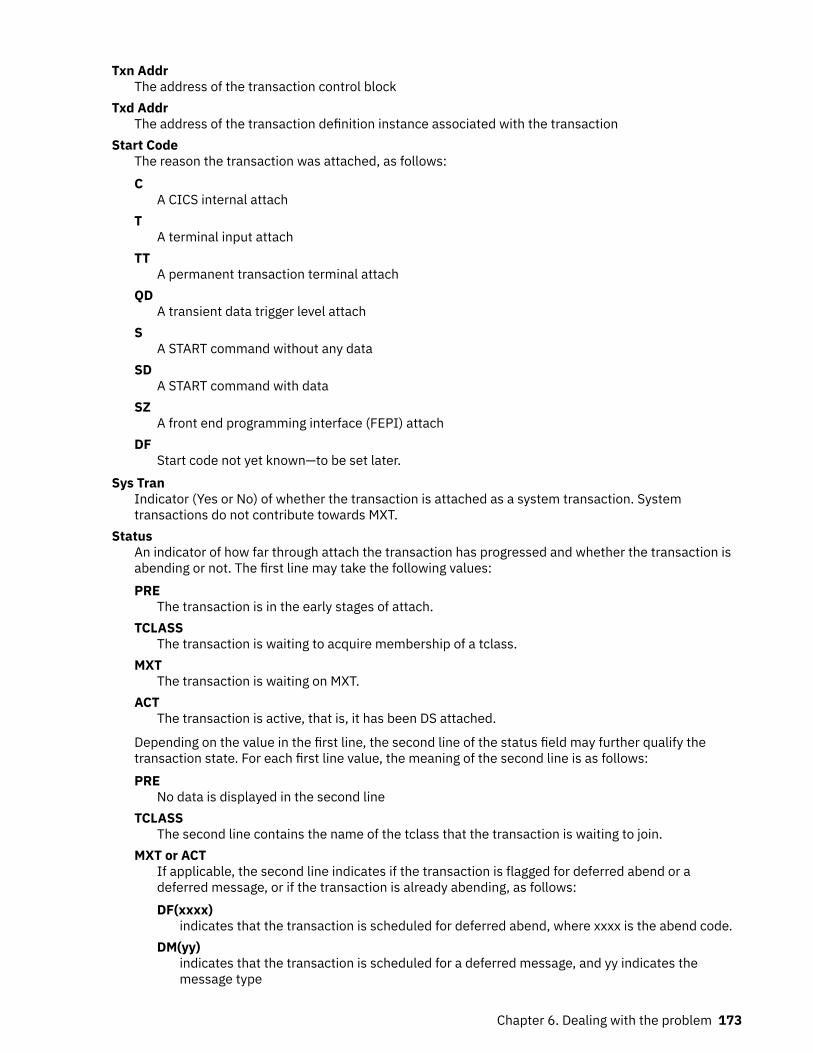
Txn AddrThe address of the transaction control block
Txd AddrThe address of the transaction definition instance associated with the transaction
Start CodeThe reason the transaction was attached, as follows:C
A CICS internal attachT
A terminal input attachTT
A permanent transaction terminal attachQD
A transient data trigger level attachS
A START command without any dataSD
A START command with dataSZ
A front end programming interface (FEPI) attachDF
Start code not yet known—to be set later.Sys Tran
Indicator (Yes or No) of whether the transaction is attached as a system transaction. Systemtransactions do not contribute towards MXT.
StatusAn indicator of how far through attach the transaction has progressed and whether the transaction isabending or not. The first line may take the following values:PRE
The transaction is in the early stages of attach.TCLASS
The transaction is waiting to acquire membership of a tclass.MXT
The transaction is waiting on MXT.ACT
The transaction is active, that is, it has been DS attached.
Depending on the value in the first line, the second line of the status field may further qualify thetransaction state. For each first line value, the meaning of the second line is as follows:PRE
No data is displayed in the second lineTCLASS
The second line contains the name of the tclass that the transaction is waiting to join.MXT or ACT
If applicable, the second line indicates if the transaction is flagged for deferred abend or adeferred message, or if the transaction is already abending, as follows:DF(xxxx)
indicates that the transaction is scheduled for deferred abend, where xxxx is the abend code.DM(yy)
indicates that the transaction is scheduled for a deferred message, and yy indicates themessage type
Chapter 6. Dealing with the problem 173
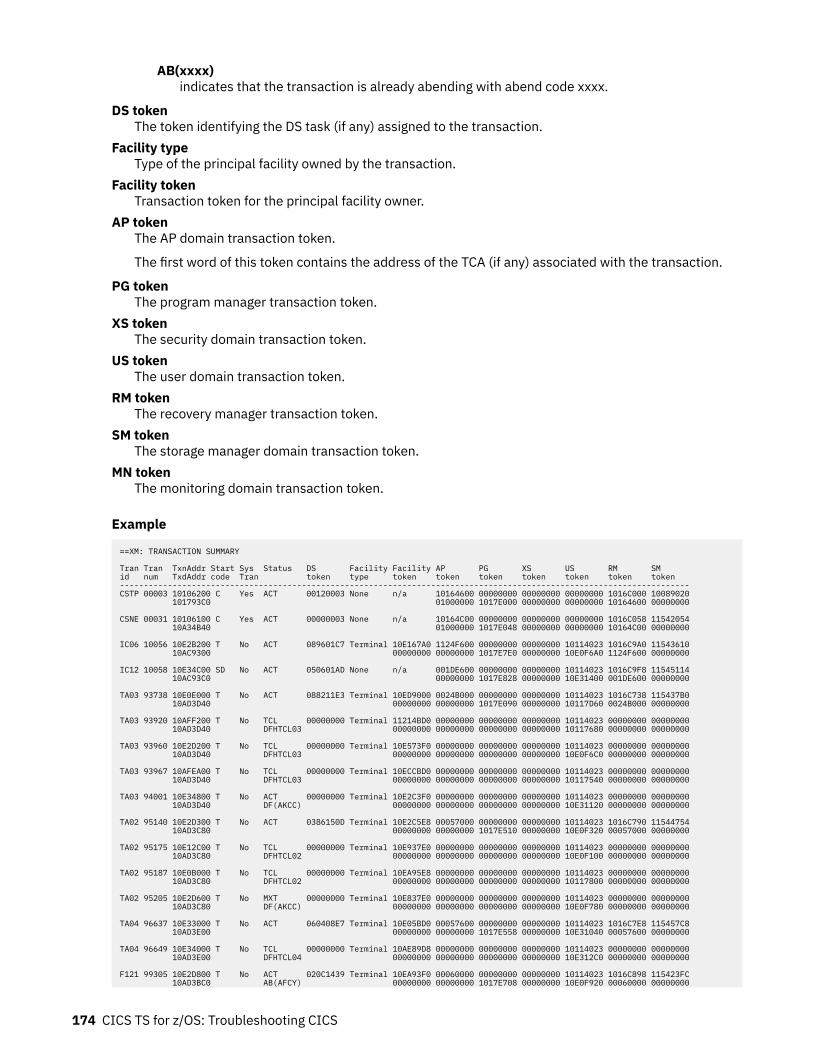
AB(xxxx)indicates that the transaction is already abending with abend code xxxx.
DS tokenThe token identifying the DS task (if any) assigned to the transaction.
Facility typeType of the principal facility owned by the transaction.
Facility tokenTransaction token for the principal facility owner.
AP tokenThe AP domain transaction token.
The first word of this token contains the address of the TCA (if any) associated with the transaction.
PG tokenThe program manager transaction token.
XS tokenThe security domain transaction token.
US tokenThe user domain transaction token.
RM tokenThe recovery manager transaction token.
SM tokenThe storage manager domain transaction token.
MN tokenThe monitoring domain transaction token.
Example
==XM: TRANSACTION SUMMARY Tran Tran TxnAddr Start Sys Status DS Facility Facility AP PG XS US RM SMid num TxdAddr code Tran token type token token token token token token token-----------------------------------------------------------------------------------------------------------------------CSTP 00003 10106200 C Yes ACT 00120003 None n/a 10164600 00000000 00000000 00000000 1016C000 10089020 101793C0 01000000 1017E000 00000000 00000000 10164600 00000000 CSNE 00031 10106100 C Yes ACT 00000003 None n/a 10164C00 00000000 00000000 00000000 1016C058 11542054 10A34B40 01000000 1017E048 00000000 00000000 10164C00 00000000 IC06 10056 10E2B200 T No ACT 089601C7 Terminal 10E167A0 1124F600 00000000 00000000 10114023 1016C9A0 11543610 10AC9300 00000000 00000000 1017E7E0 00000000 10E0F6A0 1124F600 00000000 IC12 10058 10E34C00 SD No ACT 050601AD None n/a 001DE600 00000000 00000000 10114023 1016C9F8 11545114 10AC93C0 00000000 1017E828 00000000 10E31400 001DE600 00000000 TA03 93738 10E0E000 T No ACT 088211E3 Terminal 10ED9000 0024B000 00000000 00000000 10114023 1016C738 115437B0 10AD3D40 00000000 00000000 1017E090 00000000 10117D60 0024B000 00000000 TA03 93920 10AFF200 T No TCL 00000000 Terminal 11214BD0 00000000 00000000 00000000 10114023 00000000 00000000 10AD3D40 DFHTCL03 00000000 00000000 00000000 00000000 10117680 00000000 00000000 TA03 93960 10E2D200 T No TCL 00000000 Terminal 10E573F0 00000000 00000000 00000000 10114023 00000000 00000000 10AD3D40 DFHTCL03 00000000 00000000 00000000 00000000 10E0F6C0 00000000 00000000 TA03 93967 10AFEA00 T No TCL 00000000 Terminal 10ECCBD0 00000000 00000000 00000000 10114023 00000000 00000000 10AD3D40 DFHTCL03 00000000 00000000 00000000 00000000 10117540 00000000 00000000 TA03 94001 10E34800 T No ACT 00000000 Terminal 10E2C3F0 00000000 00000000 00000000 10114023 00000000 00000000 10AD3D40 DF(AKCC) 00000000 00000000 00000000 00000000 10E31120 00000000 00000000 TA02 95140 10E2D300 T No ACT 0386150D Terminal 10E2C5E8 00057000 00000000 00000000 10114023 1016C790 11544754 10AD3C80 00000000 00000000 1017E510 00000000 10E0F320 00057000 00000000 TA02 95175 10E12C00 T No TCL 00000000 Terminal 10E937E0 00000000 00000000 00000000 10114023 00000000 00000000 10AD3C80 DFHTCL02 00000000 00000000 00000000 00000000 10E0F100 00000000 00000000 TA02 95187 10E0B000 T No TCL 00000000 Terminal 10EA95E8 00000000 00000000 00000000 10114023 00000000 00000000 10AD3C80 DFHTCL02 00000000 00000000 00000000 00000000 10117800 00000000 00000000 TA02 95205 10E2D600 T No MXT 00000000 Terminal 10E837E0 00000000 00000000 00000000 10114023 00000000 00000000 10AD3C80 DF(AKCC) 00000000 00000000 00000000 00000000 10E0F780 00000000 00000000 TA04 96637 10E33000 T No ACT 060408E7 Terminal 10E05BD0 00057600 00000000 00000000 10114023 1016C7E8 115457C8 10AD3E00 00000000 00000000 1017E558 00000000 10E31040 00057600 00000000 TA04 96649 10E34000 T No TCL 00000000 Terminal 10AE89D8 00000000 00000000 00000000 10114023 00000000 00000000 10AD3E00 DFHTCL04 00000000 00000000 00000000 00000000 10E312C0 00000000 00000000 F121 99305 10E2D800 T No ACT 020C1439 Terminal 10EA93F0 00060000 00000000 00000000 10114023 1016C898 115423FC 10AD3BC0 AB(AFCY) 00000000 00000000 1017E708 00000000 10E0F920 00060000 00000000
174 CICS TS for z/OS: Troubleshooting CICS
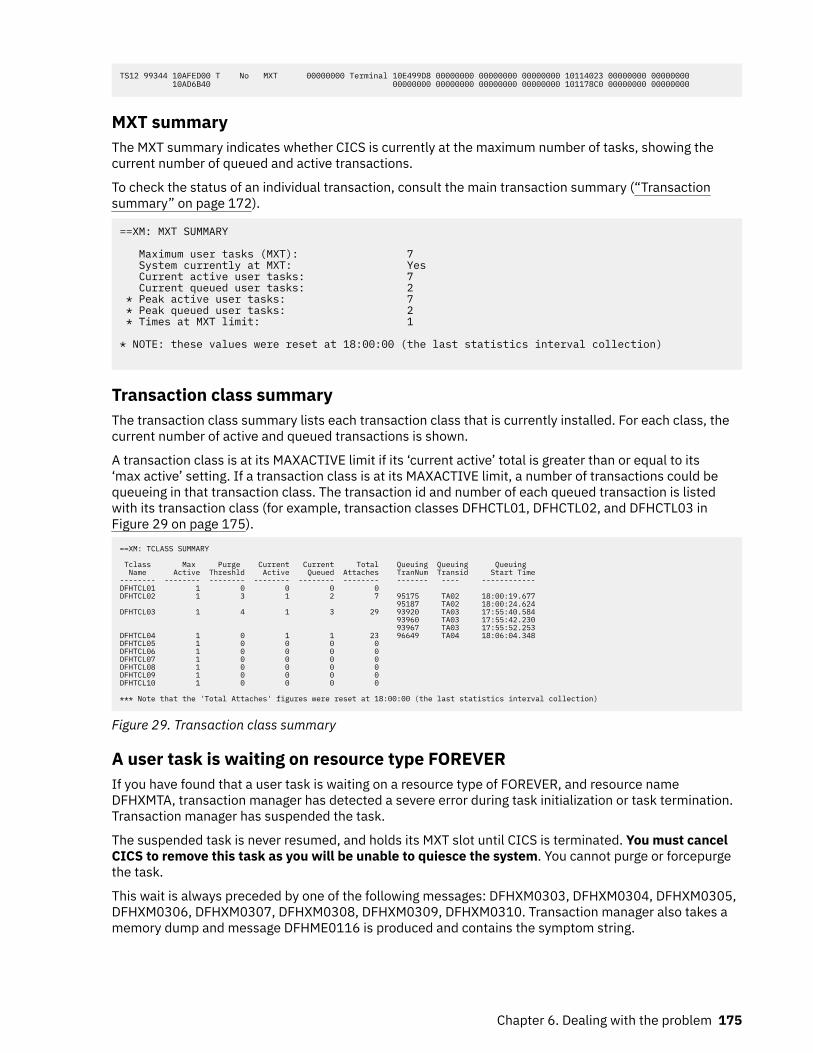
TS12 99344 10AFED00 T No MXT 00000000 Terminal 10E499D8 00000000 00000000 00000000 10114023 00000000 00000000 10AD6B40 00000000 00000000 00000000 00000000 101178C0 00000000 00000000
MXT summaryThe MXT summary indicates whether CICS is currently at the maximum number of tasks, showing thecurrent number of queued and active transactions.
To check the status of an individual transaction, consult the main transaction summary (“Transactionsummary” on page 172).
==XM: MXT SUMMARY Maximum user tasks (MXT): 7 System currently at MXT: Yes Current active user tasks: 7 Current queued user tasks: 2 * Peak active user tasks: 7 * Peak queued user tasks: 2 * Times at MXT limit: 1 * NOTE: these values were reset at 18:00:00 (the last statistics interval collection)
Transaction class summaryThe transaction class summary lists each transaction class that is currently installed. For each class, thecurrent number of active and queued transactions is shown.
A transaction class is at its MAXACTIVE limit if its ‘current active’ total is greater than or equal to its‘max active’ setting. If a transaction class is at its MAXACTIVE limit, a number of transactions could bequeueing in that transaction class. The transaction id and number of each queued transaction is listedwith its transaction class (for example, transaction classes DFHCTL01, DFHCTL02, and DFHCTL03 inFigure 29 on page 175).
==XM: TCLASS SUMMARY Tclass Max Purge Current Current Total Queuing Queuing Queuing Name Active Threshld Active Queued Attaches TranNum Transid Start Time-------- -------- -------- -------- -------- -------- ------- ---- ------------DFHTCL01 1 0 0 0 0DFHTCL02 1 3 1 2 7 95175 TA02 18:00:19.677 95187 TA02 18:00:24.624DFHTCL03 1 4 1 3 29 93920 TA03 17:55:40.584 93960 TA03 17:55:42.230 93967 TA03 17:55:52.253DFHTCL04 1 0 1 1 23 96649 TA04 18:06:04.348DFHTCL05 1 0 0 0 0DFHTCL06 1 0 0 0 0DFHTCL07 1 0 0 0 0DFHTCL08 1 0 0 0 0DFHTCL09 1 0 0 0 0DFHTCL10 1 0 0 0 0 *** Note that the 'Total Attaches' figures were reset at 18:00:00 (the last statistics interval collection)
Figure 29. Transaction class summary
A user task is waiting on resource type FOREVERIf you have found that a user task is waiting on a resource type of FOREVER, and resource nameDFHXMTA, transaction manager has detected a severe error during task initialization or task termination.Transaction manager has suspended the task.
The suspended task is never resumed, and holds its MXT slot until CICS is terminated. You must cancelCICS to remove this task as you will be unable to quiesce the system. You cannot purge or forcepurgethe task.
This wait is always preceded by one of the following messages: DFHXM0303, DFHXM0304, DFHXM0305,DFHXM0306, DFHXM0307, DFHXM0308, DFHXM0309, DFHXM0310. Transaction manager also takes amemory dump and message DFHME0116 is produced and contains the symptom string.
Chapter 6. Dealing with the problem 175
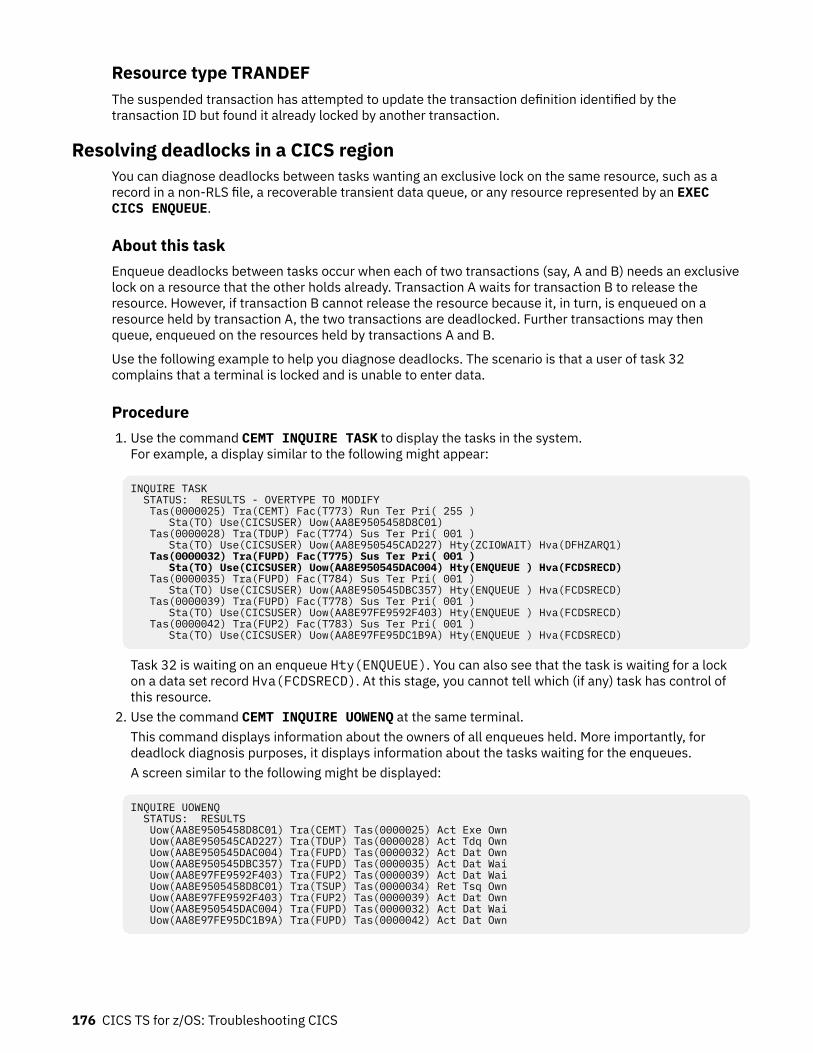
Resource type TRANDEFThe suspended transaction has attempted to update the transaction definition identified by thetransaction ID but found it already locked by another transaction.
Resolving deadlocks in a CICS regionYou can diagnose deadlocks between tasks wanting an exclusive lock on the same resource, such as arecord in a non-RLS file, a recoverable transient data queue, or any resource represented by an EXECCICS ENQUEUE.
About this taskEnqueue deadlocks between tasks occur when each of two transactions (say, A and B) needs an exclusivelock on a resource that the other holds already. Transaction A waits for transaction B to release theresource. However, if transaction B cannot release the resource because it, in turn, is enqueued on aresource held by transaction A, the two transactions are deadlocked. Further transactions may thenqueue, enqueued on the resources held by transactions A and B.
Use the following example to help you diagnose deadlocks. The scenario is that a user of task 32complains that a terminal is locked and is unable to enter data.
Procedure1. Use the command CEMT INQUIRE TASK to display the tasks in the system.
For example, a display similar to the following might appear:
INQUIRE TASK STATUS: RESULTS - OVERTYPE TO MODIFY Tas(0000025) Tra(CEMT) Fac(T773) Run Ter Pri( 255 ) Sta(TO) Use(CICSUSER) Uow(AA8E9505458D8C01) Tas(0000028) Tra(TDUP) Fac(T774) Sus Ter Pri( 001 ) Sta(TO) Use(CICSUSER) Uow(AA8E950545CAD227) Hty(ZCIOWAIT) Hva(DFHZARQ1) Tas(0000032) Tra(FUPD) Fac(T775) Sus Ter Pri( 001 ) Sta(TO) Use(CICSUSER) Uow(AA8E950545DAC004) Hty(ENQUEUE ) Hva(FCDSRECD) Tas(0000035) Tra(FUPD) Fac(T784) Sus Ter Pri( 001 ) Sta(TO) Use(CICSUSER) Uow(AA8E950545DBC357) Hty(ENQUEUE ) Hva(FCDSRECD) Tas(0000039) Tra(FUPD) Fac(T778) Sus Ter Pri( 001 ) Sta(TO) Use(CICSUSER) Uow(AA8E97FE9592F403) Hty(ENQUEUE ) Hva(FCDSRECD) Tas(0000042) Tra(FUP2) Fac(T783) Sus Ter Pri( 001 ) Sta(TO) Use(CICSUSER) Uow(AA8E97FE95DC1B9A) Hty(ENQUEUE ) Hva(FCDSRECD)
Task 32 is waiting on an enqueue Hty(ENQUEUE). You can also see that the task is waiting for a lockon a data set record Hva(FCDSRECD). At this stage, you cannot tell which (if any) task has control ofthis resource.
2. Use the command CEMT INQUIRE UOWENQ at the same terminal.This command displays information about the owners of all enqueues held. More importantly, fordeadlock diagnosis purposes, it displays information about the tasks waiting for the enqueues.A screen similar to the following might be displayed:
INQUIRE UOWENQ STATUS: RESULTS Uow(AA8E9505458D8C01) Tra(CEMT) Tas(0000025) Act Exe Own Uow(AA8E950545CAD227) Tra(TDUP) Tas(0000028) Act Tdq Own Uow(AA8E950545DAC004) Tra(FUPD) Tas(0000032) Act Dat Own Uow(AA8E950545DBC357) Tra(FUPD) Tas(0000035) Act Dat Wai Uow(AA8E97FE9592F403) Tra(FUP2) Tas(0000039) Act Dat Wai Uow(AA8E9505458D8C01) Tra(TSUP) Tas(0000034) Ret Tsq Own Uow(AA8E97FE9592F403) Tra(FUP2) Tas(0000039) Act Dat Own Uow(AA8E950545DAC004) Tra(FUPD) Tas(0000032) Act Dat Wai Uow(AA8E97FE95DC1B9A) Tra(FUPD) Tas(0000042) Act Dat Own
176 CICS TS for z/OS: Troubleshooting CICS
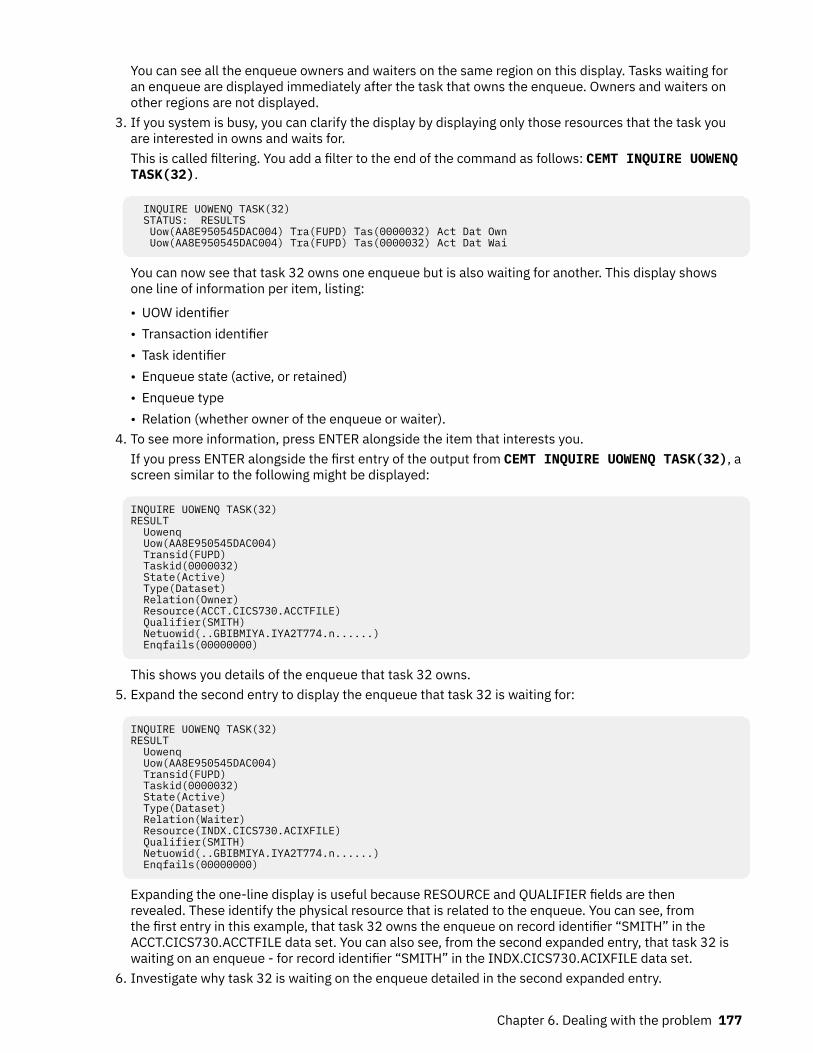
You can see all the enqueue owners and waiters on the same region on this display. Tasks waiting foran enqueue are displayed immediately after the task that owns the enqueue. Owners and waiters onother regions are not displayed.
3. If you system is busy, you can clarify the display by displaying only those resources that the task youare interested in owns and waits for.This is called filtering. You add a filter to the end of the command as follows: CEMT INQUIRE UOWENQTASK(32).
INQUIRE UOWENQ TASK(32) STATUS: RESULTS Uow(AA8E950545DAC004) Tra(FUPD) Tas(0000032) Act Dat Own Uow(AA8E950545DAC004) Tra(FUPD) Tas(0000032) Act Dat Wai
You can now see that task 32 owns one enqueue but is also waiting for another. This display showsone line of information per item, listing:
• UOW identifier• Transaction identifier• Task identifier• Enqueue state (active, or retained)• Enqueue type• Relation (whether owner of the enqueue or waiter).
4. To see more information, press ENTER alongside the item that interests you.If you press ENTER alongside the first entry of the output from CEMT INQUIRE UOWENQ TASK(32), ascreen similar to the following might be displayed:
INQUIRE UOWENQ TASK(32)RESULT Uowenq Uow(AA8E950545DAC004) Transid(FUPD) Taskid(0000032) State(Active) Type(Dataset) Relation(Owner) Resource(ACCT.CICS730.ACCTFILE) Qualifier(SMITH) Netuowid(..GBIBMIYA.IYA2T774.n......) Enqfails(00000000)
This shows you details of the enqueue that task 32 owns.5. Expand the second entry to display the enqueue that task 32 is waiting for:
INQUIRE UOWENQ TASK(32)RESULT Uowenq Uow(AA8E950545DAC004) Transid(FUPD) Taskid(0000032) State(Active) Type(Dataset) Relation(Waiter) Resource(INDX.CICS730.ACIXFILE) Qualifier(SMITH) Netuowid(..GBIBMIYA.IYA2T774.n......) Enqfails(00000000)
Expanding the one-line display is useful because RESOURCE and QUALIFIER fields are thenrevealed. These identify the physical resource that is related to the enqueue. You can see, fromthe first entry in this example, that task 32 owns the enqueue on record identifier “SMITH” in theACCT.CICS730.ACCTFILE data set. You can also see, from the second expanded entry, that task 32 iswaiting on an enqueue - for record identifier “SMITH” in the INDX.CICS730.ACIXFILE data set.
6. Investigate why task 32 is waiting on the enqueue detailed in the second expanded entry.
Chapter 6. Dealing with the problem 177
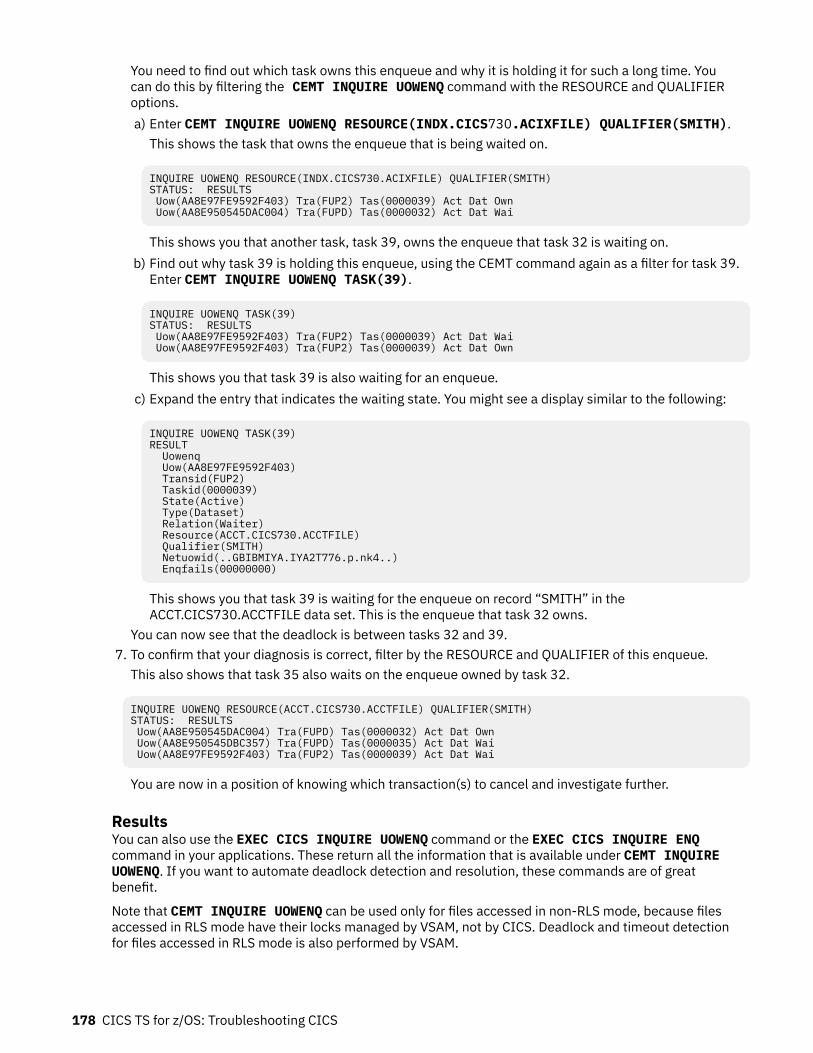
You need to find out which task owns this enqueue and why it is holding it for such a long time. Youcan do this by filtering the CEMT INQUIRE UOWENQ command with the RESOURCE and QUALIFIERoptions.a) Enter CEMT INQUIRE UOWENQ RESOURCE(INDX.CICS730.ACIXFILE) QUALIFIER(SMITH).
This shows the task that owns the enqueue that is being waited on.
INQUIRE UOWENQ RESOURCE(INDX.CICS730.ACIXFILE) QUALIFIER(SMITH)STATUS: RESULTS Uow(AA8E97FE9592F403) Tra(FUP2) Tas(0000039) Act Dat Own Uow(AA8E950545DAC004) Tra(FUPD) Tas(0000032) Act Dat Wai
This shows you that another task, task 39, owns the enqueue that task 32 is waiting on.b) Find out why task 39 is holding this enqueue, using the CEMT command again as a filter for task 39.
Enter CEMT INQUIRE UOWENQ TASK(39).
INQUIRE UOWENQ TASK(39)STATUS: RESULTS Uow(AA8E97FE9592F403) Tra(FUP2) Tas(0000039) Act Dat Wai Uow(AA8E97FE9592F403) Tra(FUP2) Tas(0000039) Act Dat Own
This shows you that task 39 is also waiting for an enqueue.c) Expand the entry that indicates the waiting state. You might see a display similar to the following:
INQUIRE UOWENQ TASK(39)RESULT Uowenq Uow(AA8E97FE9592F403) Transid(FUP2) Taskid(0000039) State(Active) Type(Dataset) Relation(Waiter) Resource(ACCT.CICS730.ACCTFILE) Qualifier(SMITH) Netuowid(..GBIBMIYA.IYA2T776.p.nk4..) Enqfails(00000000)
This shows you that task 39 is waiting for the enqueue on record “SMITH” in theACCT.CICS730.ACCTFILE data set. This is the enqueue that task 32 owns.
You can now see that the deadlock is between tasks 32 and 39.7. To confirm that your diagnosis is correct, filter by the RESOURCE and QUALIFIER of this enqueue.
This also shows that task 35 also waits on the enqueue owned by task 32.
INQUIRE UOWENQ RESOURCE(ACCT.CICS730.ACCTFILE) QUALIFIER(SMITH)STATUS: RESULTS Uow(AA8E950545DAC004) Tra(FUPD) Tas(0000032) Act Dat Own Uow(AA8E950545DBC357) Tra(FUPD) Tas(0000035) Act Dat Wai Uow(AA8E97FE9592F403) Tra(FUP2) Tas(0000039) Act Dat Wai
You are now in a position of knowing which transaction(s) to cancel and investigate further.
ResultsYou can also use the EXEC CICS INQUIRE UOWENQ command or the EXEC CICS INQUIRE ENQcommand in your applications. These return all the information that is available under CEMT INQUIREUOWENQ. If you want to automate deadlock detection and resolution, these commands are of greatbenefit.
Note that CEMT INQUIRE UOWENQ can be used only for files accessed in non-RLS mode, because filesaccessed in RLS mode have their locks managed by VSAM, not by CICS. Deadlock and timeout detectionfor files accessed in RLS mode is also performed by VSAM.
178 CICS TS for z/OS: Troubleshooting CICS
Resolving deadlocks in a sysplex
About this taskSince sysplex-scope ENQUEUE supports deadlock timeout there should be no possibility of an unresolveddeadlock across CICS systems.
• If a CICS task fails, the NQ domain releases all MVS ENQs held on behalf of that CICS task• If a CICS system fails, MVS releases all MVS ENQs owned by that CICS region. This applies even if the
reason for the CICS system failure was an MVS failure.
When there is a rogue task with enqueues held, which hangs or loops but is not subject to runaway, theentire region can halt. CICSPlex SM tries to assist in the determination of which task to purge to free-upthe system. CICSPlex SM allows you to put out an alert when a task's suspend time is too long. Once thishas occurred, you need to find the task causing the problem. To do this:
Procedure1. Display the suspended task's details and determine what the suspend reason is.
If the suspend reason is ENQUEUE, you have to find out which enqueue is being waited upon by thistask.
2. Display the enqueues held and the one this task is waiting for using the UOWENQ display (uow) Browsefor this UOWid).From this display you can get the enqueue name that this task is waiting for.
3. Display the details of this enqueueYou are now in a position to analyze the problem to determine the cause of the problem.
Results
Resolving indoubt and resynchronization failures
About this taskFor examples of how to resolve indoubt and resynchronization failures, see Troubleshooting intersystemproblems.
What to do if CICS has stalledCICS can stall during initialization, when it is running apparently “normally”, or during termination. Thesepossibilities are dealt with separately in the following information.
Procedure1. If CICS stalls during initialization, read “CICS has stalled during initialization” on page 179.2. If CICS stalls during a run, read “CICS has stalled during a run” on page 180.3. If CICS stalls during termination, read “CICS has stalled during termination” on page 182
CICS has stalled during initializationIf CICS stalls during initialization, on an initial, cold, warm, or emergency start, the first place to look is theMVS console log. This tells you how far initialization has progressed.
Note that there might be significant delays at specific stages of initialization, depending on how CICS lastterminated.
Chapter 6. Dealing with the problem 179
On a cold start, loading the GRPLIST definitions from the CICS system definition data set (CSD) can takeseveral minutes. For large systems, the delay could be 20 minutes or more while this takes place. You cantell if this stage of initialization has been reached because you get this console message:
DFHSI1511 INSTALLING GROUP LIST xxxxxxxx
On a warm start, there may be a considerable delay while resource definitions are being created from theglobal catalog.
If you find that unexpected delays occur at other times during CICS initialization, consider the messagesthat have already been sent to the console and see if they suggest the reason for the wait. For example,a shortage of storage is one of the most common causes of stalling, and is always accompanied by amessage. The JCL job log is another useful source of information.
You can find out if this has happened by taking an SDUMP of the CICS region. Format the dump using thekeywords KE and DS, to get the kernel and dispatcher task summaries.
Consider, too, whether any first-or second-stage program list table (PLT) program that you have writtencould be in error. If such a program does not follow the strict protocols that are required, it can causeCICS to stall. For programming information about PLT programs, see Writing initialization and shutdownprograms .
CICS has stalled during a runIf a CICS region that has been running normally stalls, so that it produces no output and accepts no input,the scope of the problem is potentially system-wide. The problem might be confined exclusively to CICS,or it could be caused by any other task running under MVS.
Look first on your MVS console for any messages. Look particularly for messages indicating that operatorintervention is needed, for example to change a tape volume. The action could be required on behalf of aCICS task, or it could be for any other program that CICS interfaces with.
If there is no operator action outstanding, inquire on active users at the MVS console to see what the CPUusage is for CICS. If you find the value is very high, this probably indicates that a task is looping. Read“Dealing with loops” on page 215 for advice about investigating the problem further.
If the CPU usage is low, CICS is doing very little work. Some of the possible reasons are:
• The system definition parameters are not suitable for your system.• The system is short on storage, and new tasks cannot be started. This situation is unlikely to last for
long unless old tasks cannot, for some reason, be purged.• The system is at one of the MXT or transaction class limits, and no new tasks can be attached. In such a
case, it is likely that existing tasks are deadlocked, and for some reason they cannot be timed out.• There is an exclusive control conflict for a volume.• There is a problem with the communications access method.• There is a CICS system error.
The way you can find out if any of these apply to your system is dealt with in the information that follows.For some of the investigations, you will need to see a system dump of the CICS region. If you do notalready have one, you can request one using the MVS console. Make sure that CICS is apparently stalledat the time you take the dump, because otherwise it will not provide the evidence you need. Formatthe dump using the formatting keywords KE and XM, to get the storage areas for the kernel and thetransaction manager.
Are the system definition parameters wrong?The system definition parameters for your system might be causing it to stall, possibly at a critical loading.Check what is specified, paying particular attention to the following items:
• The CICS maximum tasks (MXT) and transaction class (MAXACTIVE) limits. If these parameters are toolow, new tasks might fail to be attached. If you think that one of these limits might be the cause of the
180 CICS TS for z/OS: Troubleshooting CICS
stall, read “Are MXT or transaction class limits causing the stall?” on page 181 for advice about furtherinvestigation.
• ICV system initialization parameter, the system region exit time. If this parameter is set too high, CICSmight relinquish control to the operating system for longer than intended when it has no work to do, andmight give the impression of a stall.
• ICVR system initialization parameter, the runaway task time interval. If this parameter is set too high, arunaway task might stop other tasks from running for a relatively long time. The maximum ICVR value is2,700,000 milliseconds, in which case, a runaway task would not time out for 45 minutes. CICS could,in the meantime, be stalled. If the ICVR parameter is set to 0, the runaway task does not time out at all.
You should already have an indication if the ICVR is the problem, from the CPU usage.
For more details about the choice of these and other system definition parameters, see Interval controlvalue parameters and Improving the performance of a CICS system.
Is the system short on storage?Storage manager statistics and console messages can indicate that the system is short on storage.
If storage is under stress, storage manager statistics indicate that a storage stress situation has occurred.For example, check the "Times went short on storage" and "Total time SOS" statistics.
Also, if the short-on-storage (SOS) condition is caused by a suspended GETMAIN request, or if CICScannot alleviate the situation by releasing programs with no current user and by slowing the attachmentof new tasks, the following actions occur:
• A message that states that CICS is short on storage is sent to the console:
– DFHSM0131 for storage below 16 MB– DFHSM0133 for storage above 16 MB but below 2 GB– DFHSM0606 for storage above the bar
• The storage manager statistic "Times went short on storage" is updated.
CICS can become short on storage independently in any dynamic storage area (DSA). You might see taskssuspended on any of the following resource types: CDSA, SDSA, RDSA, UDSA, ECDSA, ESDSA, ERDSA,EUDSA, ETDSA, GCDSA, GUDSA, or GSDSA.
Are MXT or transaction class limits causing the stall?Before new transactions can be attached for the first time, they must qualify under the MXT andtransaction class limits. In a system that is running normally, tasks run and terminate and newtransactions are attached, even though these limits are reached occasionally. It is only when tasks canneither complete nor be purged from the system that CICS can stall as a result of one of these limits beingreached.
Look first at the transaction manager summary in the formatted system dump.
Investigate the tasks accepted into the MXT set of tasks to see if they are causing the problem. XM dumpformatting formats the state of MXT and provides a summary of the TCLASSes and of the transactionswaiting for acceptance into each TCLASS.
Now look at the Enqueue Pool Summary in the NQ section of the dump for a summary of task enqueuesand resources. This section of the dump lists all enqueues in CICS. Look for any enqueues that have manytasks in a waiting state. If there are any, look for the unit of work (UOW) for which the enqueue state isactive. Look to see if this UOW is waiting on a resource.
Is there an exclusive control conflict on a volume?Some programs use MVS RESERVE to gain exclusive control of a volume, and nothing else can haveaccess to any data set on that volume until it is released. Watch for operations involving database access,because these could indicate an exclusive control conflict on a volume.
Chapter 6. Dealing with the problem 181
Is there a problem with the communications access method?If you suspect that there is a communication problem, you can inquire on the status of the z/OSCommunications Server from the MVS console. To do this, use the command F cicsname,CEMT INQVTAM. Substitute the name of the CICS job for “cicsname”. You can only use this command if the MVSconsole has been defined to CICS as a terminal. The status returned has a value of OPEN or CLOSED.
• If the Communications Server status is OPEN, the problem could be associated with processing done inthe Communications Server part of your system or with processing done in the CICS part of your system.If it appears that there is a communication problem, consider using either CICS Communications Serverexit tracing or Communications Server buffer tracing. For guidance about using these techniques, seeUsing CICS trace.
• If the Communications Server status is CLOSED, CICS cannot use the Communications Server toperform communication functions.
Is there an MVS system logger error?If you suspect that there may be a problem with the MVS system logger, see “Log manager waits” on page205.
Is there a CICS system error?If you have investigated all the task activity, and all the other possibilities from the list, and you have stillnot found an explanation for the stall, it is possible that there is a CICS system error. Contact the IBMSupport Center with the problem.
CICS has stalled during terminationWaits often occur when CICS is being quiesced because some terminal input or output has not beencompleted. To test this possibility, try using the CEMT transaction to inquire on the tasks currently in thesystem.
CICS termination takes place in two stages:
1. All transactions are quiesced.2. All data sets and terminals are closed.
If you find that you cannot use the CEMT transaction, it is likely that the system is already in the secondstage of termination. CEMT cannot be used beyond the first stage of termination.
Note: Even if CEMT is not included in the transaction list table (XLT), you can still use it in the first stage oftermination.
The action to take next depends on whether you can use the CEMT transaction, and if so, whether or notthere are current user tasks.
• If you can use the CEMT transaction:
– If there are user tasks currently in the system, check what they are. A task may be performinga prolonged termination routine, or it might be waiting on a resource before it can complete itsprocessing. It is also possible that a task is waiting for operator intervention.
Determine what type of terminal is associated with the task. If the terminal is a 3270 device, somekeyboard input might be expected. If it is a printer, it might have been powered off or it might haverun out of paper.
– If there are no user tasks in the system, it may be that one or more terminals have not been closed.Use the CEMT transaction to see which terminals are currently INSERVICE, and then use CEMT SET toplace them OUTSERVICE.
If these actions fail, proceed as if you were unable to use the CEMT transaction. • If you cannot use the CEMT transaction, go to the MVS console or the NetView® main
terminal and display the active sessions. If necessary, close down the network using the VARY
182 CICS TS for z/OS: Troubleshooting CICS
NET,INACT,ID=applid command. This should enable CICS to resume its termination sequence. Ifit does not, you might need to cancel the CICS job. If this does happen, consider whether any PLTprogram running in the second quiesce stage could be in error. If such a program did not follow thestrict protocols that are required, it could cause CICS to stall during termination. For programminginformation about PLT programs, see Writing initialization and shutdown programs .
How tasks are made to waitThe suspension and resumption of tasks in a CICS system are performed by the dispatcher domain,usually on behalf of some other CICS component. If the exit programming interface (XPI) is being used, itcan be at the request of user code.
The major dispatcher functions associated with the suspension and subsequent resumption of tasks aredescribed in detail in Dispatcher domain (DS). You can use trace to see the dispatcher functions that arerequested, and the values of parameters that are supplied. See “Investigating waits using trace” on page130 .
Some of the dispatcher functions are available to users through the exit programming interface (XPI). Ifyou have any applications using these XPI functions, make sure that they follow the rules and protocolsexactly. For programming information about the XPI, see XPI functions (by domain).
If you want guidance about using online or offline techniques to investigate waits, see “Techniques forinvestigating waits” on page 129.
If you already know the identity of the resource that a task is waiting for, but are not sure what functionalarea of CICS is involved, see Table 17 on page 184. It shows you where to look for further guidance.
Throughout this section, the terms “suspension” and “resumption” and “suspended” and “resumed”are used generically. Except where otherwise indicated, they refer to any of the SUSPEND/RESUME andWAIT/POST processes by which tasks can be made to stop running and then be made ready to run again.
This section covers information on the following waits:
• “The resources that CICS tasks can wait for” on page 183• “Dispatcher waits” on page 201• “CICS Db2 waits” on page 203• “DBCTL waits” on page 204• “Investigating storage waits” on page 146• “EDF waits” on page 205• “Investigating terminal waits” on page 136• “Log manager waits” on page 205• “Task control waits” on page 206• “SNA LU control waits” on page 208• “Interregion and intersystem communication waits” on page 210• “Transient data waits” on page 210• “CICS system task waits” on page 213• “FEPI waits” on page 213• “Recovery manager waits” on page 214• “Region Status server waits” on page 215
The resources that CICS tasks can wait forTasks in a CICS system can wait for various resources.
Some resources are identified by both a resource name and a resource type, some by a resource namealone, and some by a resource type alone. The resource names and resource types that are shown are theones that you can see in formatted trace entries and, for some resources, by online inquiry.
Chapter 6. Dealing with the problem 183
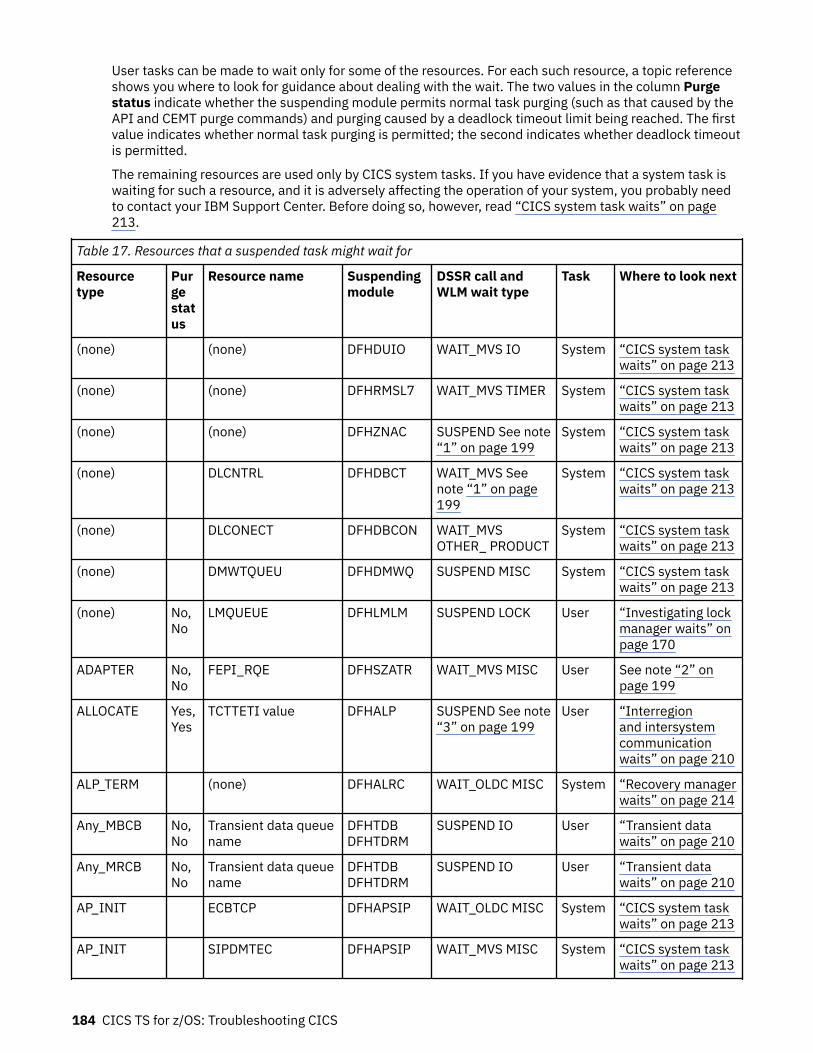
User tasks can be made to wait only for some of the resources. For each such resource, a topic referenceshows you where to look for guidance about dealing with the wait. The two values in the column Purgestatus indicate whether the suspending module permits normal task purging (such as that caused by theAPI and CEMT purge commands) and purging caused by a deadlock timeout limit being reached. The firstvalue indicates whether normal task purging is permitted; the second indicates whether deadlock timeoutis permitted.
The remaining resources are used only by CICS system tasks. If you have evidence that a system task iswaiting for such a resource, and it is adversely affecting the operation of your system, you probably needto contact your IBM Support Center. Before doing so, however, read “CICS system task waits” on page213.
Table 17. Resources that a suspended task might wait for
Resourcetype
Purgestatus
Resource name Suspendingmodule
DSSR call andWLM wait type
Task Where to look next
(none) (none) DFHDUIO WAIT_MVS IO System “CICS system taskwaits” on page 213
(none) (none) DFHRMSL7 WAIT_MVS TIMER System “CICS system taskwaits” on page 213
(none) (none) DFHZNAC SUSPEND See note“1” on page 199
System “CICS system taskwaits” on page 213
(none) DLCNTRL DFHDBCT WAIT_MVS Seenote “1” on page199
System “CICS system taskwaits” on page 213
(none) DLCONECT DFHDBCON WAIT_MVSOTHER_ PRODUCT
System “CICS system taskwaits” on page 213
(none) DMWTQUEU DFHDMWQ SUSPEND MISC System “CICS system taskwaits” on page 213
(none) No,No
LMQUEUE DFHLMLM SUSPEND LOCK User “Investigating lockmanager waits” onpage 170
ADAPTER No,No
FEPI_RQE DFHSZATR WAIT_MVS MISC User See note “2” onpage 199
ALLOCATE Yes,Yes
TCTTETI value DFHALP SUSPEND See note“3” on page 199
User “Interregionand intersystemcommunicationwaits” on page 210
ALP_TERM (none) DFHALRC WAIT_OLDC MISC System “Recovery managerwaits” on page 214
Any_MBCB No,No
Transient data queuename
DFHTDBDFHTDRM
SUSPEND IO User “Transient datawaits” on page 210
Any_MRCB No,No
Transient data queuename
DFHTDBDFHTDRM
SUSPEND IO User “Transient datawaits” on page 210
AP_INIT ECBTCP DFHAPSIP WAIT_OLDC MISC System “CICS system taskwaits” on page 213
AP_INIT SIPDMTEC DFHAPSIP WAIT_MVS MISC System “CICS system taskwaits” on page 213
184 CICS TS for z/OS: Troubleshooting CICS
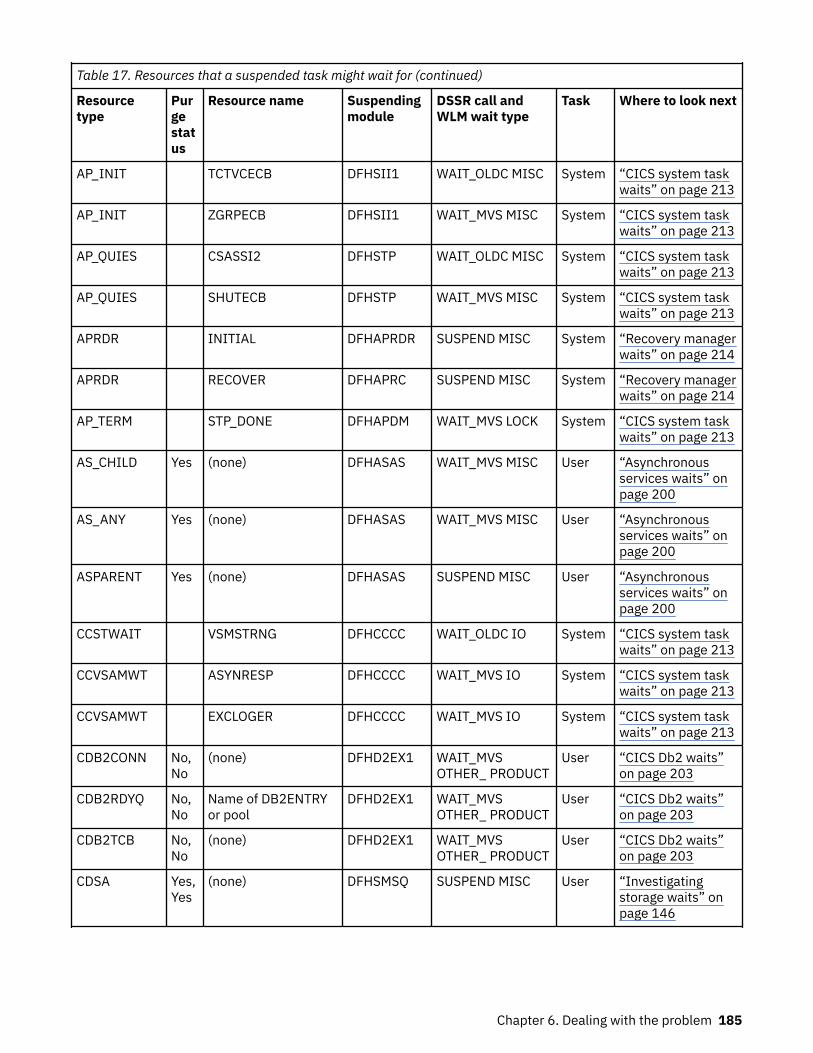
Table 17. Resources that a suspended task might wait for (continued)
Resourcetype
Purgestatus
Resource name Suspendingmodule
DSSR call andWLM wait type
Task Where to look next
AP_INIT TCTVCECB DFHSII1 WAIT_OLDC MISC System “CICS system taskwaits” on page 213
AP_INIT ZGRPECB DFHSII1 WAIT_MVS MISC System “CICS system taskwaits” on page 213
AP_QUIES CSASSI2 DFHSTP WAIT_OLDC MISC System “CICS system taskwaits” on page 213
AP_QUIES SHUTECB DFHSTP WAIT_MVS MISC System “CICS system taskwaits” on page 213
APRDR INITIAL DFHAPRDR SUSPEND MISC System “Recovery managerwaits” on page 214
APRDR RECOVER DFHAPRC SUSPEND MISC System “Recovery managerwaits” on page 214
AP_TERM STP_DONE DFHAPDM WAIT_MVS LOCK System “CICS system taskwaits” on page 213
AS_CHILD Yes (none) DFHASAS WAIT_MVS MISC User “Asynchronousservices waits” onpage 200
AS_ANY Yes (none) DFHASAS WAIT_MVS MISC User “Asynchronousservices waits” onpage 200
ASPARENT Yes (none) DFHASAS SUSPEND MISC User “Asynchronousservices waits” onpage 200
CCSTWAIT VSMSTRNG DFHCCCC WAIT_OLDC IO System “CICS system taskwaits” on page 213
CCVSAMWT ASYNRESP DFHCCCC WAIT_MVS IO System “CICS system taskwaits” on page 213
CCVSAMWT EXCLOGER DFHCCCC WAIT_MVS IO System “CICS system taskwaits” on page 213
CDB2CONN No,No
(none) DFHD2EX1 WAIT_MVSOTHER_ PRODUCT
User “CICS Db2 waits”on page 203
CDB2RDYQ No,No
Name of DB2ENTRYor pool
DFHD2EX1 WAIT_MVSOTHER_ PRODUCT
User “CICS Db2 waits”on page 203
CDB2TCB No,No
(none) DFHD2EX1 WAIT_MVSOTHER_ PRODUCT
User “CICS Db2 waits”on page 203
CDSA Yes,Yes
(none) DFHSMSQ SUSPEND MISC User “Investigatingstorage waits” onpage 146
Chapter 6. Dealing with the problem 185
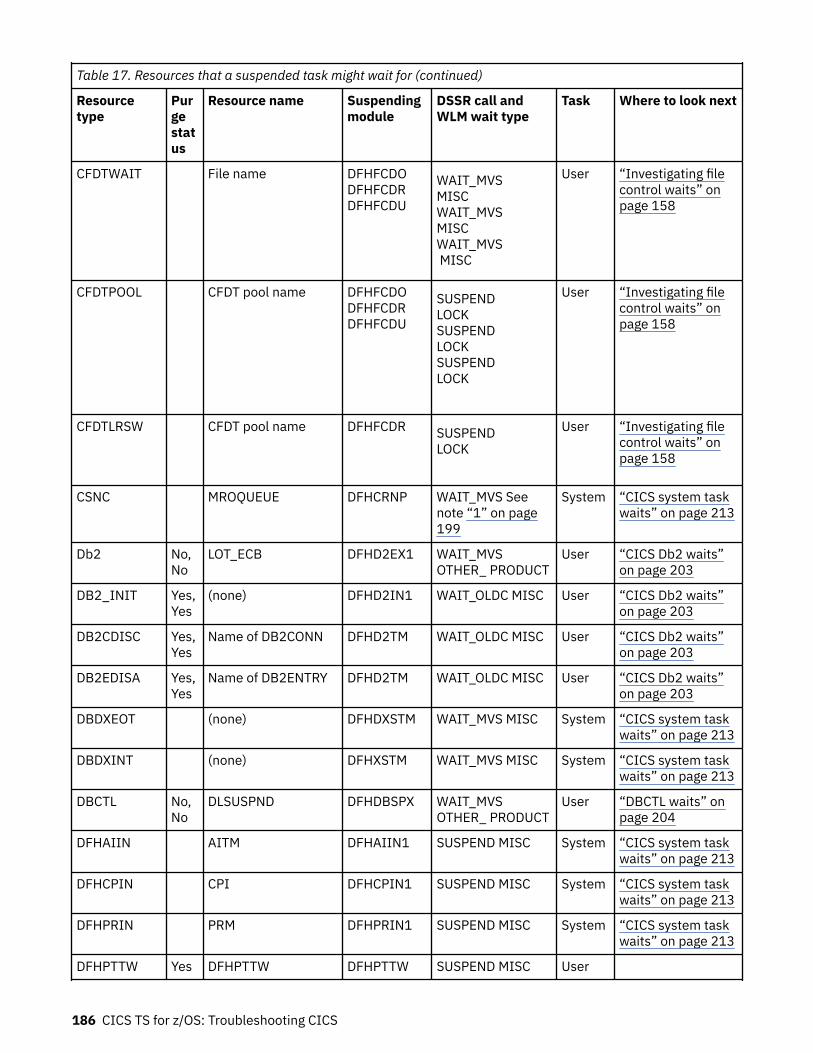
Table 17. Resources that a suspended task might wait for (continued)
Resourcetype
Purgestatus
Resource name Suspendingmodule
DSSR call andWLM wait type
Task Where to look next
CFDTWAIT File name DFHFCDODFHFCDRDFHFCDU
WAIT_MVSMISCWAIT_MVSMISCWAIT_MVS MISC
User “Investigating filecontrol waits” onpage 158
CFDTPOOL CFDT pool name DFHFCDODFHFCDRDFHFCDU
SUSPENDLOCKSUSPENDLOCKSUSPENDLOCK
User “Investigating filecontrol waits” onpage 158
CFDTLRSW CFDT pool name DFHFCDR SUSPENDLOCK
User “Investigating filecontrol waits” onpage 158
CSNC MROQUEUE DFHCRNP WAIT_MVS Seenote “1” on page199
System “CICS system taskwaits” on page 213
Db2 No,No
LOT_ECB DFHD2EX1 WAIT_MVSOTHER_ PRODUCT
User “CICS Db2 waits”on page 203
DB2_INIT Yes,Yes
(none) DFHD2IN1 WAIT_OLDC MISC User “CICS Db2 waits”on page 203
DB2CDISC Yes,Yes
Name of DB2CONN DFHD2TM WAIT_OLDC MISC User “CICS Db2 waits”on page 203
DB2EDISA Yes,Yes
Name of DB2ENTRY DFHD2TM WAIT_OLDC MISC User “CICS Db2 waits”on page 203
DBDXEOT (none) DFHDXSTM WAIT_MVS MISC System “CICS system taskwaits” on page 213
DBDXINT (none) DFHXSTM WAIT_MVS MISC System “CICS system taskwaits” on page 213
DBCTL No,No
DLSUSPND DFHDBSPX WAIT_MVSOTHER_ PRODUCT
User “DBCTL waits” onpage 204
DFHAIIN AITM DFHAIIN1 SUSPEND MISC System “CICS system taskwaits” on page 213
DFHCPIN CPI DFHCPIN1 SUSPEND MISC System “CICS system taskwaits” on page 213
DFHPRIN PRM DFHPRIN1 SUSPEND MISC System “CICS system taskwaits” on page 213
DFHPTTW Yes DFHPTTW DFHPTTW SUSPEND MISC User
186 CICS TS for z/OS: Troubleshooting CICS
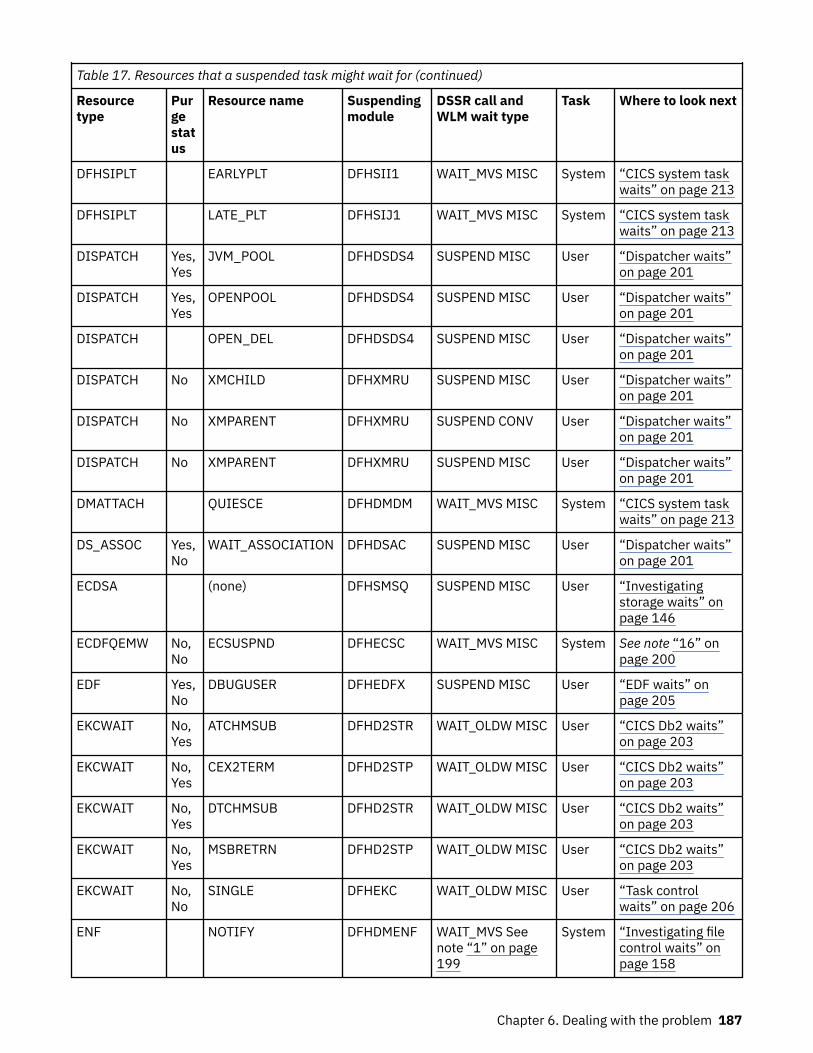
Table 17. Resources that a suspended task might wait for (continued)
Resourcetype
Purgestatus
Resource name Suspendingmodule
DSSR call andWLM wait type
Task Where to look next
DFHSIPLT EARLYPLT DFHSII1 WAIT_MVS MISC System “CICS system taskwaits” on page 213
DFHSIPLT LATE_PLT DFHSIJ1 WAIT_MVS MISC System “CICS system taskwaits” on page 213
DISPATCH Yes,Yes
JVM_POOL DFHDSDS4 SUSPEND MISC User “Dispatcher waits”on page 201
DISPATCH Yes,Yes
OPENPOOL DFHDSDS4 SUSPEND MISC User “Dispatcher waits”on page 201
DISPATCH OPEN_DEL DFHDSDS4 SUSPEND MISC User “Dispatcher waits”on page 201
DISPATCH No XMCHILD DFHXMRU SUSPEND MISC User “Dispatcher waits”on page 201
DISPATCH No XMPARENT DFHXMRU SUSPEND CONV User “Dispatcher waits”on page 201
DISPATCH No XMPARENT DFHXMRU SUSPEND MISC User “Dispatcher waits”on page 201
DMATTACH QUIESCE DFHDMDM WAIT_MVS MISC System “CICS system taskwaits” on page 213
DS_ASSOC Yes,No
WAIT_ASSOCIATION DFHDSAC SUSPEND MISC User “Dispatcher waits”on page 201
ECDSA (none) DFHSMSQ SUSPEND MISC User “Investigatingstorage waits” onpage 146
ECDFQEMW No,No
ECSUSPND DFHECSC WAIT_MVS MISC System See note “16” onpage 200
EDF Yes,No
DBUGUSER DFHEDFX SUSPEND MISC User “EDF waits” onpage 205
EKCWAIT No,Yes
ATCHMSUB DFHD2STR WAIT_OLDW MISC User “CICS Db2 waits”on page 203
EKCWAIT No,Yes
CEX2TERM DFHD2STP WAIT_OLDW MISC User “CICS Db2 waits”on page 203
EKCWAIT No,Yes
DTCHMSUB DFHD2STR WAIT_OLDW MISC User “CICS Db2 waits”on page 203
EKCWAIT No,Yes
MSBRETRN DFHD2STP WAIT_OLDW MISC User “CICS Db2 waits”on page 203
EKCWAIT No,No
SINGLE DFHEKC WAIT_OLDW MISC User “Task controlwaits” on page 206
ENF NOTIFY DFHDMENF WAIT_MVS Seenote “1” on page199
System “Investigating filecontrol waits” onpage 158
Chapter 6. Dealing with the problem 187
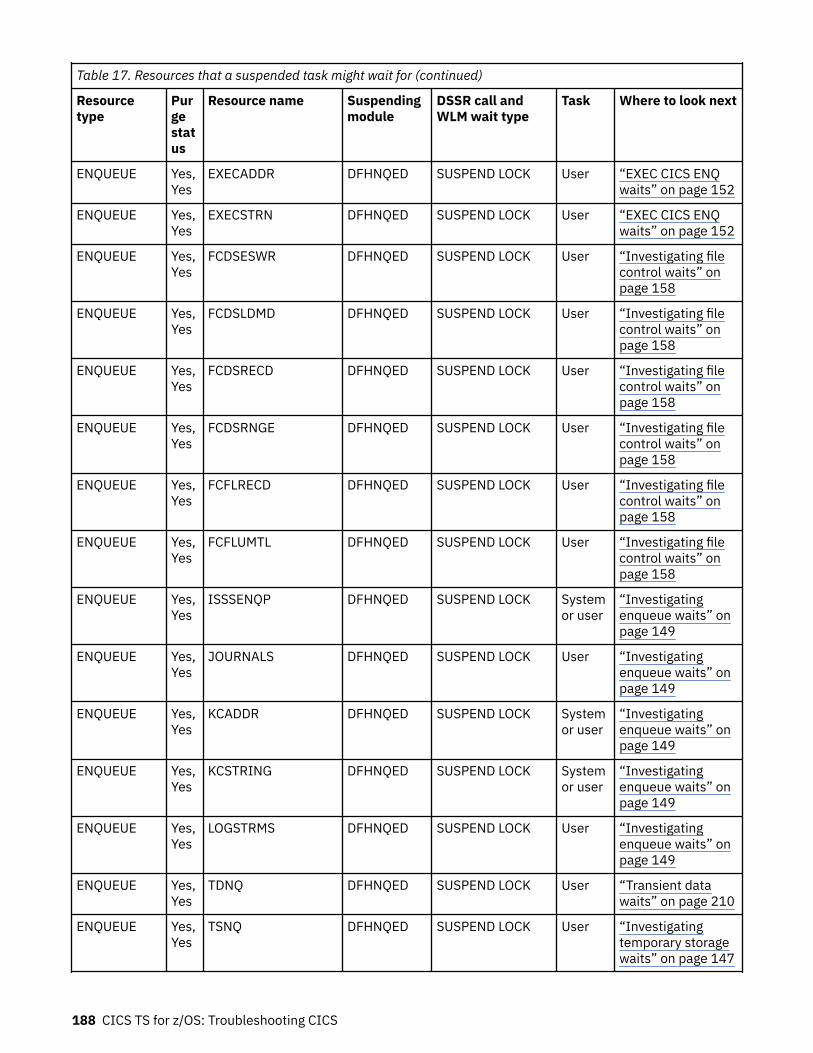
Table 17. Resources that a suspended task might wait for (continued)
Resourcetype
Purgestatus
Resource name Suspendingmodule
DSSR call andWLM wait type
Task Where to look next
ENQUEUE Yes,Yes
EXECADDR DFHNQED SUSPEND LOCK User “EXEC CICS ENQwaits” on page 152
ENQUEUE Yes,Yes
EXECSTRN DFHNQED SUSPEND LOCK User “EXEC CICS ENQwaits” on page 152
ENQUEUE Yes,Yes
FCDSESWR DFHNQED SUSPEND LOCK User “Investigating filecontrol waits” onpage 158
ENQUEUE Yes,Yes
FCDSLDMD DFHNQED SUSPEND LOCK User “Investigating filecontrol waits” onpage 158
ENQUEUE Yes,Yes
FCDSRECD DFHNQED SUSPEND LOCK User “Investigating filecontrol waits” onpage 158
ENQUEUE Yes,Yes
FCDSRNGE DFHNQED SUSPEND LOCK User “Investigating filecontrol waits” onpage 158
ENQUEUE Yes,Yes
FCFLRECD DFHNQED SUSPEND LOCK User “Investigating filecontrol waits” onpage 158
ENQUEUE Yes,Yes
FCFLUMTL DFHNQED SUSPEND LOCK User “Investigating filecontrol waits” onpage 158
ENQUEUE Yes,Yes
ISSSENQP DFHNQED SUSPEND LOCK Systemor user
“Investigatingenqueue waits” onpage 149
ENQUEUE Yes,Yes
JOURNALS DFHNQED SUSPEND LOCK User “Investigatingenqueue waits” onpage 149
ENQUEUE Yes,Yes
KCADDR DFHNQED SUSPEND LOCK Systemor user
“Investigatingenqueue waits” onpage 149
ENQUEUE Yes,Yes
KCSTRING DFHNQED SUSPEND LOCK Systemor user
“Investigatingenqueue waits” onpage 149
ENQUEUE Yes,Yes
LOGSTRMS DFHNQED SUSPEND LOCK User “Investigatingenqueue waits” onpage 149
ENQUEUE Yes,Yes
TDNQ DFHNQED SUSPEND LOCK User “Transient datawaits” on page 210
ENQUEUE Yes,Yes
TSNQ DFHNQED SUSPEND LOCK User “Investigatingtemporary storagewaits” on page 147
188 CICS TS for z/OS: Troubleshooting CICS
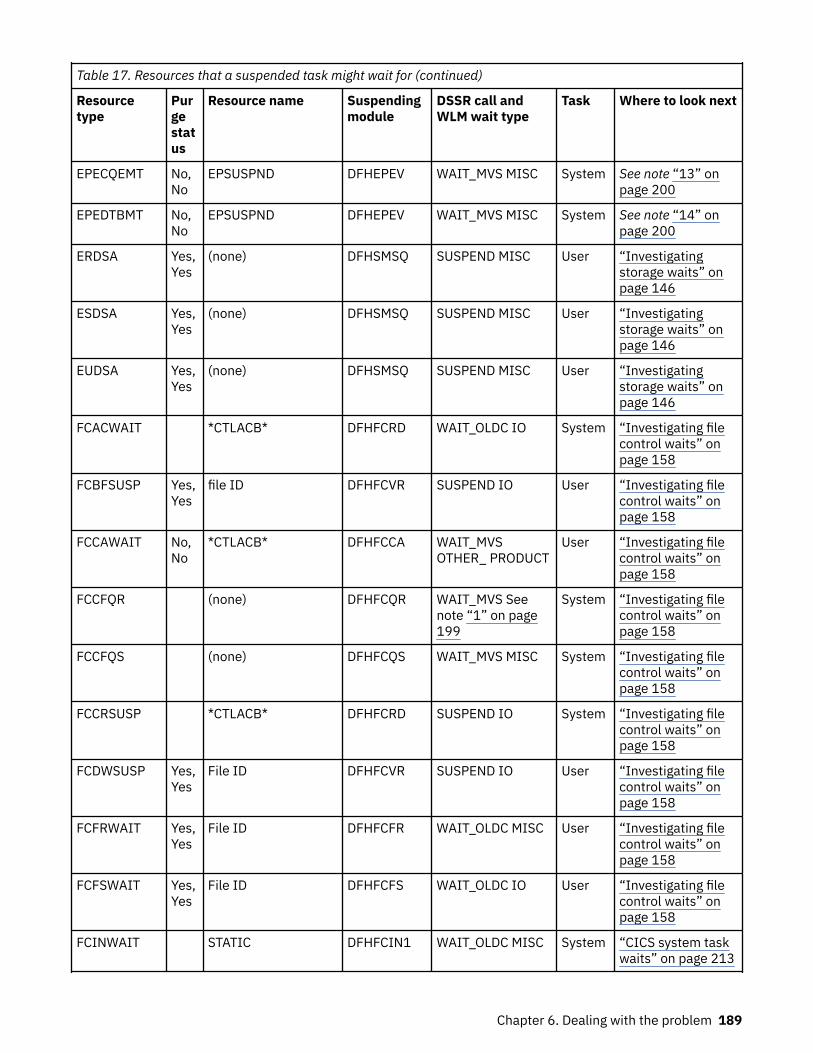
Table 17. Resources that a suspended task might wait for (continued)
Resourcetype
Purgestatus
Resource name Suspendingmodule
DSSR call andWLM wait type
Task Where to look next
EPECQEMT No,No
EPSUSPND DFHEPEV WAIT_MVS MISC System See note “13” onpage 200
EPEDTBMT No,No
EPSUSPND DFHEPEV WAIT_MVS MISC System See note “14” onpage 200
ERDSA Yes,Yes
(none) DFHSMSQ SUSPEND MISC User “Investigatingstorage waits” onpage 146
ESDSA Yes,Yes
(none) DFHSMSQ SUSPEND MISC User “Investigatingstorage waits” onpage 146
EUDSA Yes,Yes
(none) DFHSMSQ SUSPEND MISC User “Investigatingstorage waits” onpage 146
FCACWAIT *CTLACB* DFHFCRD WAIT_OLDC IO System “Investigating filecontrol waits” onpage 158
FCBFSUSP Yes,Yes
file ID DFHFCVR SUSPEND IO User “Investigating filecontrol waits” onpage 158
FCCAWAIT No,No
*CTLACB* DFHFCCA WAIT_MVSOTHER_ PRODUCT
User “Investigating filecontrol waits” onpage 158
FCCFQR (none) DFHFCQR WAIT_MVS Seenote “1” on page199
System “Investigating filecontrol waits” onpage 158
FCCFQS (none) DFHFCQS WAIT_MVS MISC System “Investigating filecontrol waits” onpage 158
FCCRSUSP *CTLACB* DFHFCRD SUSPEND IO System “Investigating filecontrol waits” onpage 158
FCDWSUSP Yes,Yes
File ID DFHFCVR SUSPEND IO User “Investigating filecontrol waits” onpage 158
FCFRWAIT Yes,Yes
File ID DFHFCFR WAIT_OLDC MISC User “Investigating filecontrol waits” onpage 158
FCFSWAIT Yes,Yes
File ID DFHFCFS WAIT_OLDC IO User “Investigating filecontrol waits” onpage 158
FCINWAIT STATIC DFHFCIN1 WAIT_OLDC MISC System “CICS system taskwaits” on page 213
Chapter 6. Dealing with the problem 189
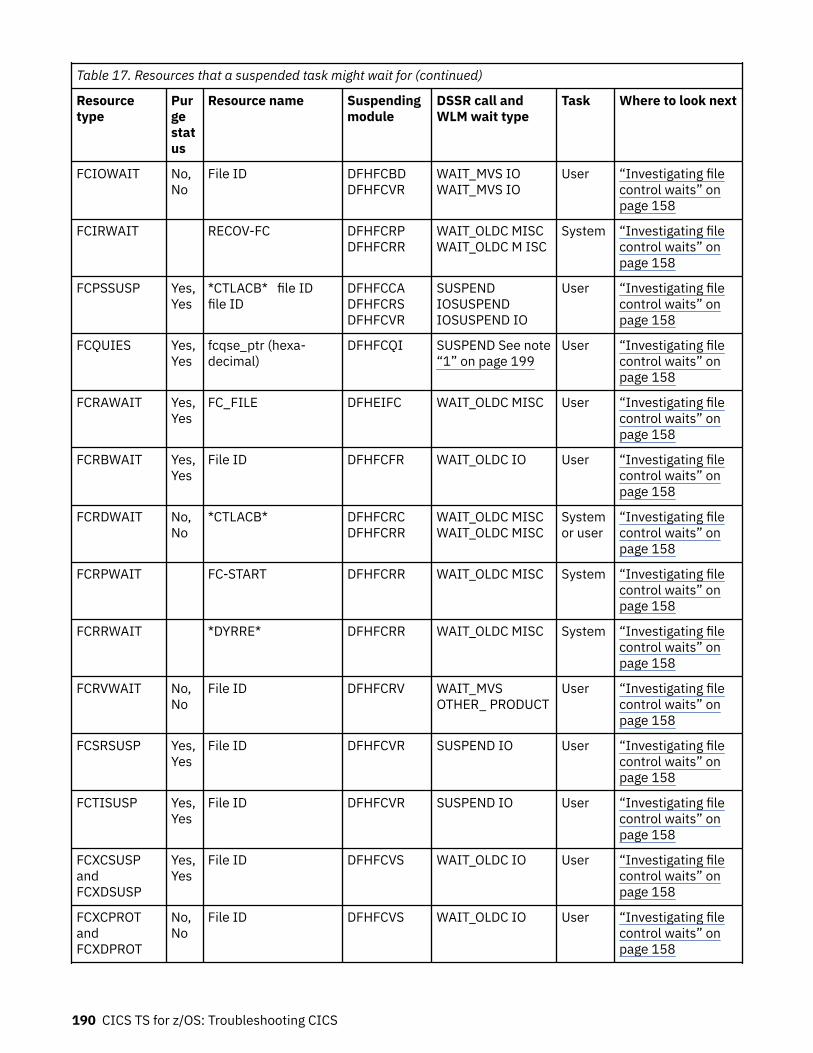
Table 17. Resources that a suspended task might wait for (continued)
Resourcetype
Purgestatus
Resource name Suspendingmodule
DSSR call andWLM wait type
Task Where to look next
FCIOWAIT No,No
File ID DFHFCBD DFHFCVR
WAIT_MVS IOWAIT_MVS IO
User “Investigating filecontrol waits” onpage 158
FCIRWAIT RECOV-FC DFHFCRP DFHFCRR
WAIT_OLDC MISCWAIT_OLDC M ISC
System “Investigating filecontrol waits” onpage 158
FCPSSUSP Yes,Yes
*CTLACB* file ID file ID
DFHFCCA DFHFCRS DFHFCVR
SUSPENDIOSUSPENDIOSUSPEND IO
User “Investigating filecontrol waits” onpage 158
FCQUIES Yes,Yes
fcqse_ptr (hexa-decimal)
DFHFCQI SUSPEND See note“1” on page 199
User “Investigating filecontrol waits” onpage 158
FCRAWAIT Yes,Yes
FC_FILE DFHEIFC WAIT_OLDC MISC User “Investigating filecontrol waits” onpage 158
FCRBWAIT Yes,Yes
File ID DFHFCFR WAIT_OLDC IO User “Investigating filecontrol waits” onpage 158
FCRDWAIT No,No
*CTLACB* DFHFCRC DFHFCRR
WAIT_OLDC MISCWAIT_OLDC MISC
Systemor user
“Investigating filecontrol waits” onpage 158
FCRPWAIT FC-START DFHFCRR WAIT_OLDC MISC System “Investigating filecontrol waits” onpage 158
FCRRWAIT *DYRRE* DFHFCRR WAIT_OLDC MISC System “Investigating filecontrol waits” onpage 158
FCRVWAIT No,No
File ID DFHFCRV WAIT_MVSOTHER_ PRODUCT
User “Investigating filecontrol waits” onpage 158
FCSRSUSP Yes,Yes
File ID DFHFCVR SUSPEND IO User “Investigating filecontrol waits” onpage 158
FCTISUSP Yes,Yes
File ID DFHFCVR SUSPEND IO User “Investigating filecontrol waits” onpage 158
FCXCSUSPandFCXDSUSP
Yes,Yes
File ID DFHFCVS WAIT_OLDC IO User “Investigating filecontrol waits” onpage 158
FCXCPROTandFCXDPROT
No,No
File ID DFHFCVS WAIT_OLDC IO User “Investigating filecontrol waits” onpage 158
190 CICS TS for z/OS: Troubleshooting CICS
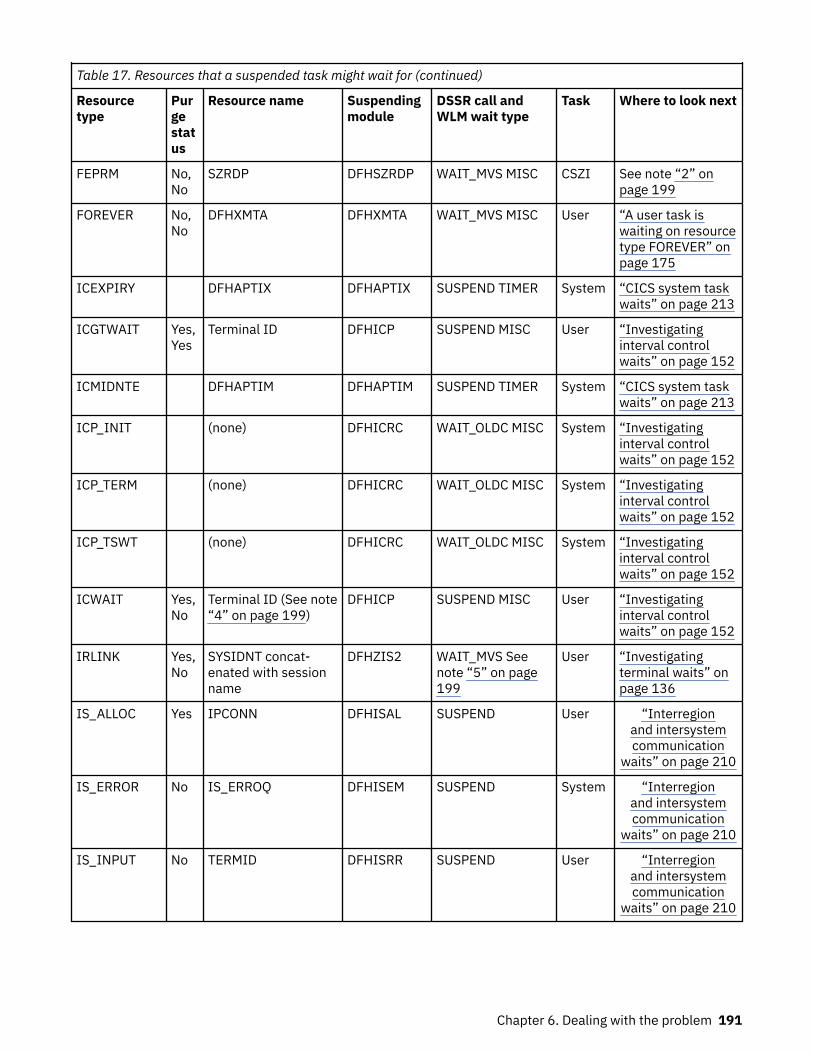
Table 17. Resources that a suspended task might wait for (continued)
Resourcetype
Purgestatus
Resource name Suspendingmodule
DSSR call andWLM wait type
Task Where to look next
FEPRM No,No
SZRDP DFHSZRDP WAIT_MVS MISC CSZI See note “2” onpage 199
FOREVER No,No
DFHXMTA DFHXMTA WAIT_MVS MISC User “A user task iswaiting on resourcetype FOREVER” onpage 175
ICEXPIRY DFHAPTIX DFHAPTIX SUSPEND TIMER System “CICS system taskwaits” on page 213
ICGTWAIT Yes,Yes
Terminal ID DFHICP SUSPEND MISC User “Investigatinginterval controlwaits” on page 152
ICMIDNTE DFHAPTIM DFHAPTIM SUSPEND TIMER System “CICS system taskwaits” on page 213
ICP_INIT (none) DFHICRC WAIT_OLDC MISC System “Investigatinginterval controlwaits” on page 152
ICP_TERM (none) DFHICRC WAIT_OLDC MISC System “Investigatinginterval controlwaits” on page 152
ICP_TSWT (none) DFHICRC WAIT_OLDC MISC System “Investigatinginterval controlwaits” on page 152
ICWAIT Yes,No
Terminal ID (See note“4” on page 199)
DFHICP SUSPEND MISC User “Investigatinginterval controlwaits” on page 152
IRLINK Yes,No
SYSIDNT concat-enated with sessionname
DFHZIS2 WAIT_MVS Seenote “5” on page199
User “Investigatingterminal waits” onpage 136
IS_ALLOC Yes IPCONN DFHISAL SUSPEND User “Interregionand intersystemcommunication
waits” on page 210
IS_ERROR No IS_ERROQ DFHISEM SUSPEND System “Interregionand intersystemcommunication
waits” on page 210
IS_INPUT No TERMID DFHISRR SUSPEND User “Interregionand intersystemcommunication
waits” on page 210
Chapter 6. Dealing with the problem 191
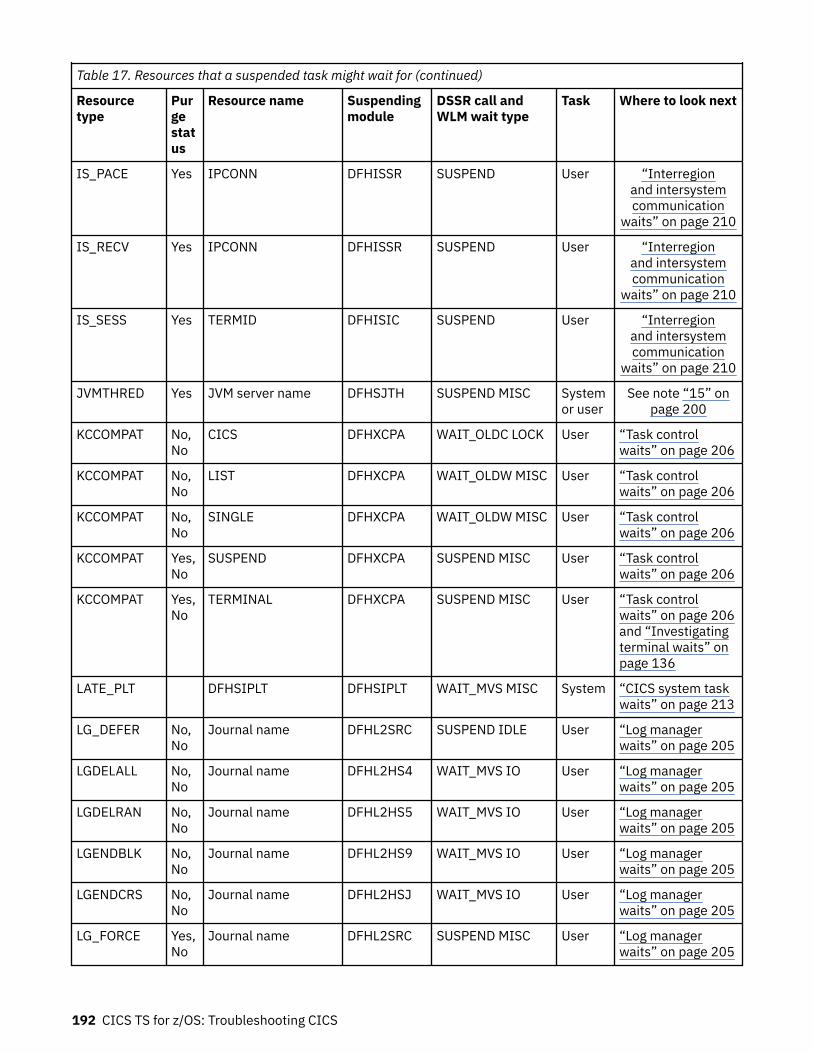
Table 17. Resources that a suspended task might wait for (continued)
Resourcetype
Purgestatus
Resource name Suspendingmodule
DSSR call andWLM wait type
Task Where to look next
IS_PACE Yes IPCONN DFHISSR SUSPEND User “Interregionand intersystemcommunication
waits” on page 210
IS_RECV Yes IPCONN DFHISSR SUSPEND User “Interregionand intersystemcommunication
waits” on page 210
IS_SESS Yes TERMID DFHISIC SUSPEND User “Interregionand intersystemcommunication
waits” on page 210
JVMTHRED Yes JVM server name DFHSJTH SUSPEND MISC Systemor user
See note “15” onpage 200
KCCOMPAT No,No
CICS DFHXCPA WAIT_OLDC LOCK User “Task controlwaits” on page 206
KCCOMPAT No,No
LIST DFHXCPA WAIT_OLDW MISC User “Task controlwaits” on page 206
KCCOMPAT No,No
SINGLE DFHXCPA WAIT_OLDW MISC User “Task controlwaits” on page 206
KCCOMPAT Yes,No
SUSPEND DFHXCPA SUSPEND MISC User “Task controlwaits” on page 206
KCCOMPAT Yes,No
TERMINAL DFHXCPA SUSPEND MISC User “Task controlwaits” on page 206and “Investigatingterminal waits” onpage 136
LATE_PLT DFHSIPLT DFHSIPLT WAIT_MVS MISC System “CICS system taskwaits” on page 213
LG_DEFER No,No
Journal name DFHL2SRC SUSPEND IDLE User “Log managerwaits” on page 205
LGDELALL No,No
Journal name DFHL2HS4 WAIT_MVS IO User “Log managerwaits” on page 205
LGDELRAN No,No
Journal name DFHL2HS5 WAIT_MVS IO User “Log managerwaits” on page 205
LGENDBLK No,No
Journal name DFHL2HS9 WAIT_MVS IO User “Log managerwaits” on page 205
LGENDCRS No,No
Journal name DFHL2HSJ WAIT_MVS IO User “Log managerwaits” on page 205
LG_FORCE Yes,No
Journal name DFHL2SRC SUSPEND MISC User “Log managerwaits” on page 205
192 CICS TS for z/OS: Troubleshooting CICS
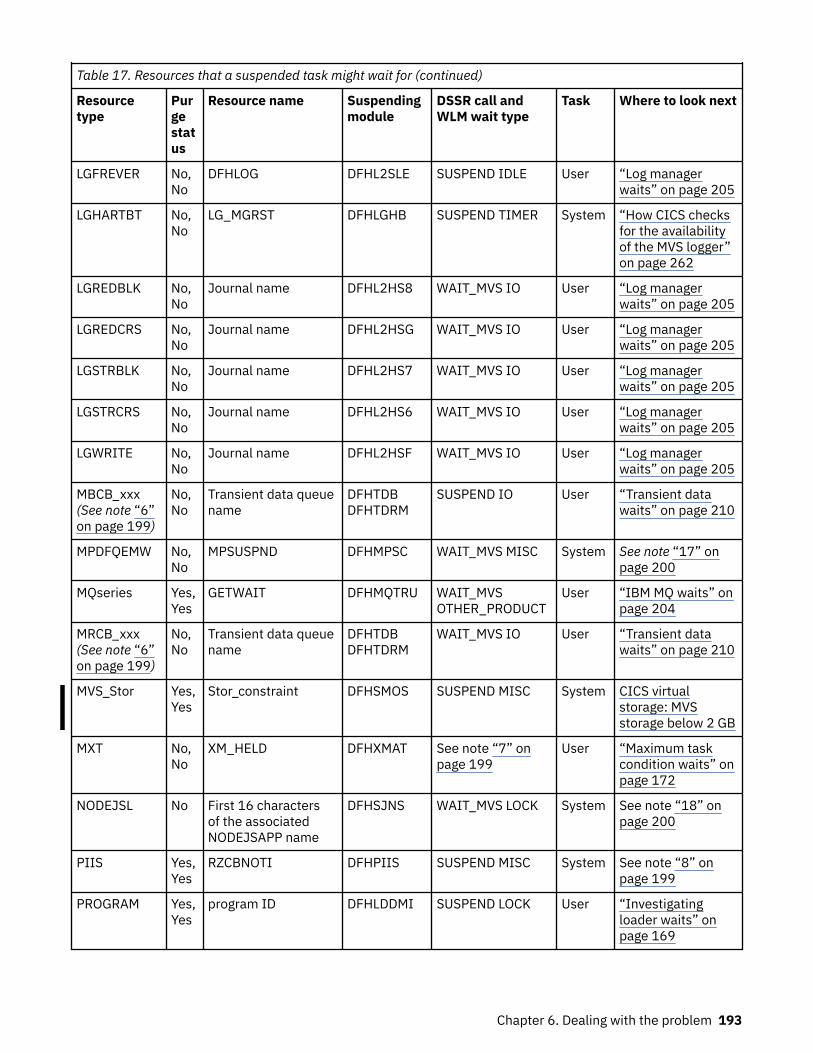
Table 17. Resources that a suspended task might wait for (continued)
Resourcetype
Purgestatus
Resource name Suspendingmodule
DSSR call andWLM wait type
Task Where to look next
LGFREVER No,No
DFHLOG DFHL2SLE SUSPEND IDLE User “Log managerwaits” on page 205
LGHARTBT No,No
LG_MGRST DFHLGHB SUSPEND TIMER System “How CICS checksfor the availabilityof the MVS logger”on page 262
LGREDBLK No,No
Journal name DFHL2HS8 WAIT_MVS IO User “Log managerwaits” on page 205
LGREDCRS No,No
Journal name DFHL2HSG WAIT_MVS IO User “Log managerwaits” on page 205
LGSTRBLK No,No
Journal name DFHL2HS7 WAIT_MVS IO User “Log managerwaits” on page 205
LGSTRCRS No,No
Journal name DFHL2HS6 WAIT_MVS IO User “Log managerwaits” on page 205
LGWRITE No,No
Journal name DFHL2HSF WAIT_MVS IO User “Log managerwaits” on page 205
MBCB_xxx(See note “6”on page 199)
No,No
Transient data queuename
DFHTDBDFHTDRM
SUSPEND IO User “Transient datawaits” on page 210
MPDFQEMW No,No
MPSUSPND DFHMPSC WAIT_MVS MISC System See note “17” onpage 200
MQseries Yes,Yes
GETWAIT DFHMQTRU WAIT_MVSOTHER_PRODUCT
User “IBM MQ waits” onpage 204
MRCB_xxx(See note “6”on page 199)
No,No
Transient data queuename
DFHTDBDFHTDRM
WAIT_MVS IO User “Transient datawaits” on page 210
MVS_Stor Yes,Yes
Stor_constraint DFHSMOS SUSPEND MISC System CICS virtualstorage: MVSstorage below 2 GB
MXT No,No
XM_HELD DFHXMAT See note “7” onpage 199
User “Maximum taskcondition waits” onpage 172
NODEJSL No First 16 charactersof the associatedNODEJSAPP name
DFHSJNS WAIT_MVS LOCK System See note “18” onpage 200
PIIS Yes,Yes
RZCBNOTI DFHPIIS SUSPEND MISC System See note “8” onpage 199
PROGRAM Yes,Yes
program ID DFHLDDMI SUSPEND LOCK User “Investigatingloader waits” onpage 169
Chapter 6. Dealing with the problem 193
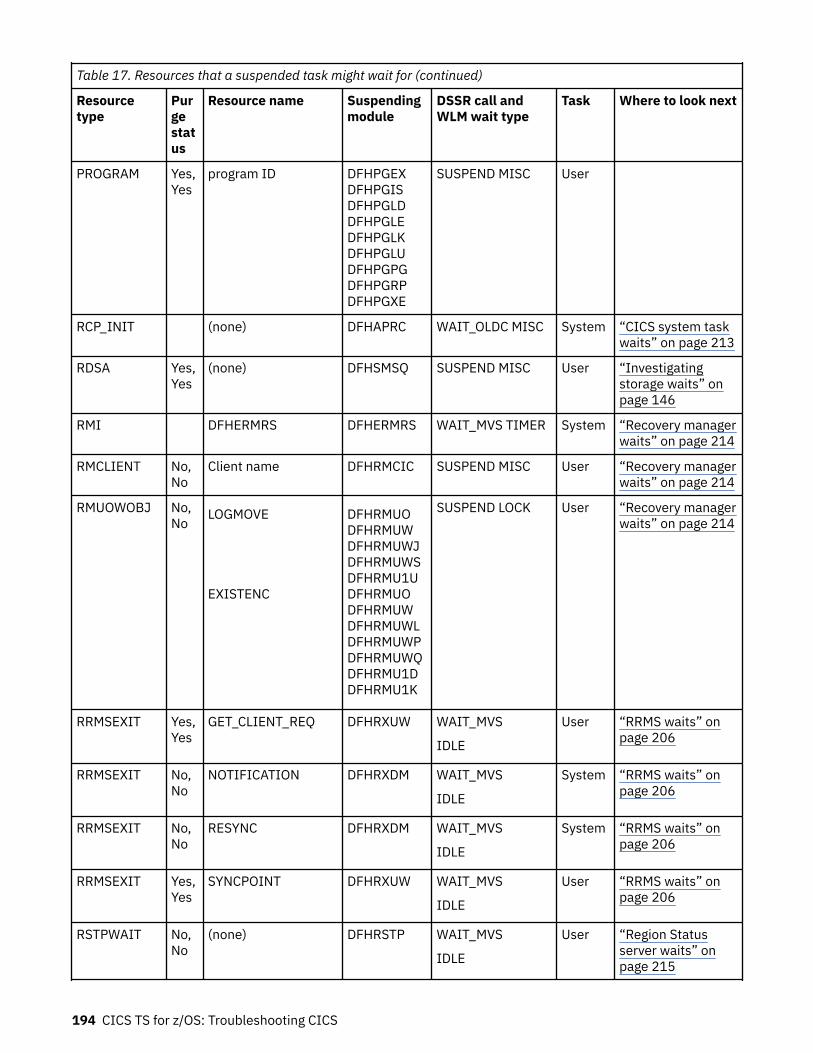
Table 17. Resources that a suspended task might wait for (continued)
Resourcetype
Purgestatus
Resource name Suspendingmodule
DSSR call andWLM wait type
Task Where to look next
PROGRAM Yes,Yes
program ID DFHPGEXDFHPGISDFHPGLDDFHPGLEDFHPGLKDFHPGLUDFHPGPGDFHPGRPDFHPGXE
SUSPEND MISC User
RCP_INIT (none) DFHAPRC WAIT_OLDC MISC System “CICS system taskwaits” on page 213
RDSA Yes,Yes
(none) DFHSMSQ SUSPEND MISC User “Investigatingstorage waits” onpage 146
RMI DFHERMRS DFHERMRS WAIT_MVS TIMER System “Recovery managerwaits” on page 214
RMCLIENT No,No
Client name DFHRMCIC SUSPEND MISC User “Recovery managerwaits” on page 214
RMUOWOBJ No,No
LOGMOVE
EXISTENC
DFHRMUODFHRMUWDFHRMUWJDFHRMUWSDFHRMU1UDFHRMUODFHRMUWDFHRMUWLDFHRMUWPDFHRMUWQDFHRMU1DDFHRMU1K
SUSPEND LOCK User “Recovery managerwaits” on page 214
RRMSEXIT Yes,Yes
GET_CLIENT_REQ DFHRXUW WAIT_MVS
IDLE
User “RRMS waits” onpage 206
RRMSEXIT No,No
NOTIFICATION DFHRXDM WAIT_MVS
IDLE
System “RRMS waits” onpage 206
RRMSEXIT No,No
RESYNC DFHRXDM WAIT_MVS
IDLE
System “RRMS waits” onpage 206
RRMSEXIT Yes,Yes
SYNCPOINT DFHRXUW WAIT_MVS
IDLE
User “RRMS waits” onpage 206
RSTPWAIT No,No
(none) DFHRSTP WAIT_MVS
IDLE
User “Region Statusserver waits” onpage 215
194 CICS TS for z/OS: Troubleshooting CICS
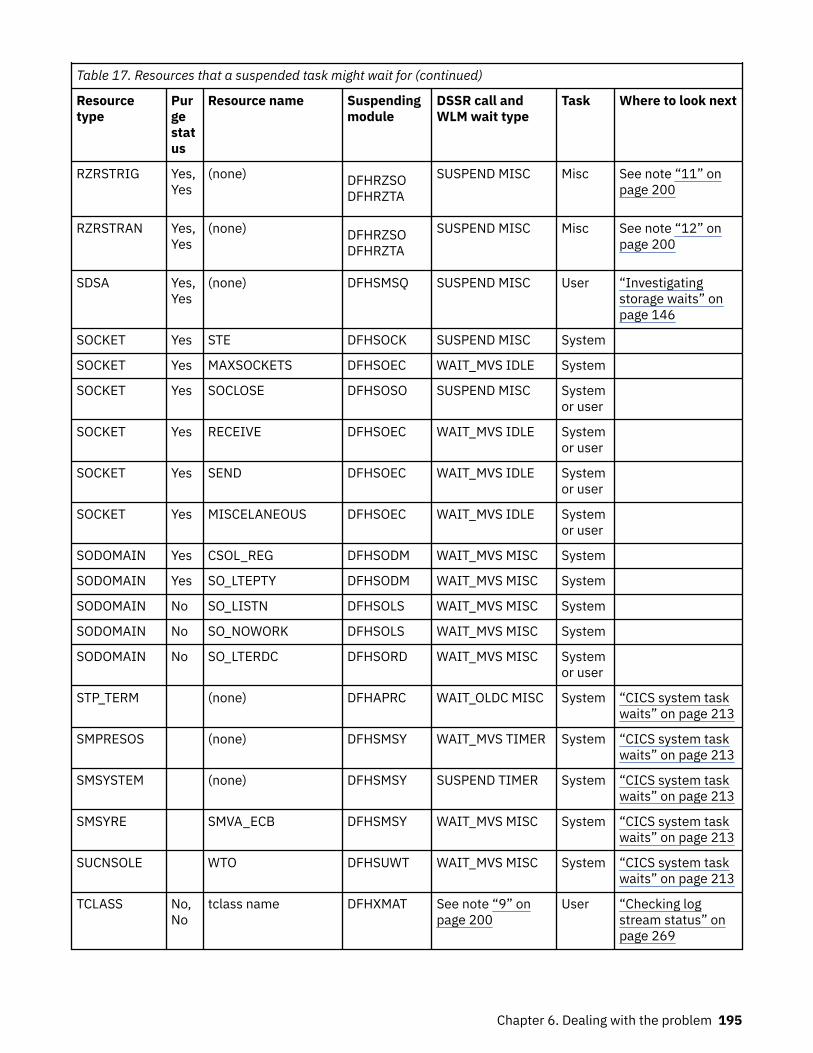
Table 17. Resources that a suspended task might wait for (continued)
Resourcetype
Purgestatus
Resource name Suspendingmodule
DSSR call andWLM wait type
Task Where to look next
RZRSTRIG Yes,Yes
(none) DFHRZSODFHRZTA
SUSPEND MISC Misc See note “11” onpage 200
RZRSTRAN Yes,Yes
(none) DFHRZSODFHRZTA
SUSPEND MISC Misc See note “12” onpage 200
SDSA Yes,Yes
(none) DFHSMSQ SUSPEND MISC User “Investigatingstorage waits” onpage 146
SOCKET Yes STE DFHSOCK SUSPEND MISC System
SOCKET Yes MAXSOCKETS DFHSOEC WAIT_MVS IDLE System
SOCKET Yes SOCLOSE DFHSOSO SUSPEND MISC Systemor user
SOCKET Yes RECEIVE DFHSOEC WAIT_MVS IDLE Systemor user
SOCKET Yes SEND DFHSOEC WAIT_MVS IDLE Systemor user
SOCKET Yes MISCELANEOUS DFHSOEC WAIT_MVS IDLE Systemor user
SODOMAIN Yes CSOL_REG DFHSODM WAIT_MVS MISC System
SODOMAIN Yes SO_LTEPTY DFHSODM WAIT_MVS MISC System
SODOMAIN No SO_LISTN DFHSOLS WAIT_MVS MISC System
SODOMAIN No SO_NOWORK DFHSOLS WAIT_MVS MISC System
SODOMAIN No SO_LTERDC DFHSORD WAIT_MVS MISC Systemor user
STP_TERM (none) DFHAPRC WAIT_OLDC MISC System “CICS system taskwaits” on page 213
SMPRESOS (none) DFHSMSY WAIT_MVS TIMER System “CICS system taskwaits” on page 213
SMSYSTEM (none) DFHSMSY SUSPEND TIMER System “CICS system taskwaits” on page 213
SMSYRE SMVA_ECB DFHSMSY WAIT_MVS MISC System “CICS system taskwaits” on page 213
SUCNSOLE WTO DFHSUWT WAIT_MVS MISC System “CICS system taskwaits” on page 213
TCLASS No,No
tclass name DFHXMAT See note “9” onpage 200
User “Checking logstream status” onpage 269
Chapter 6. Dealing with the problem 195
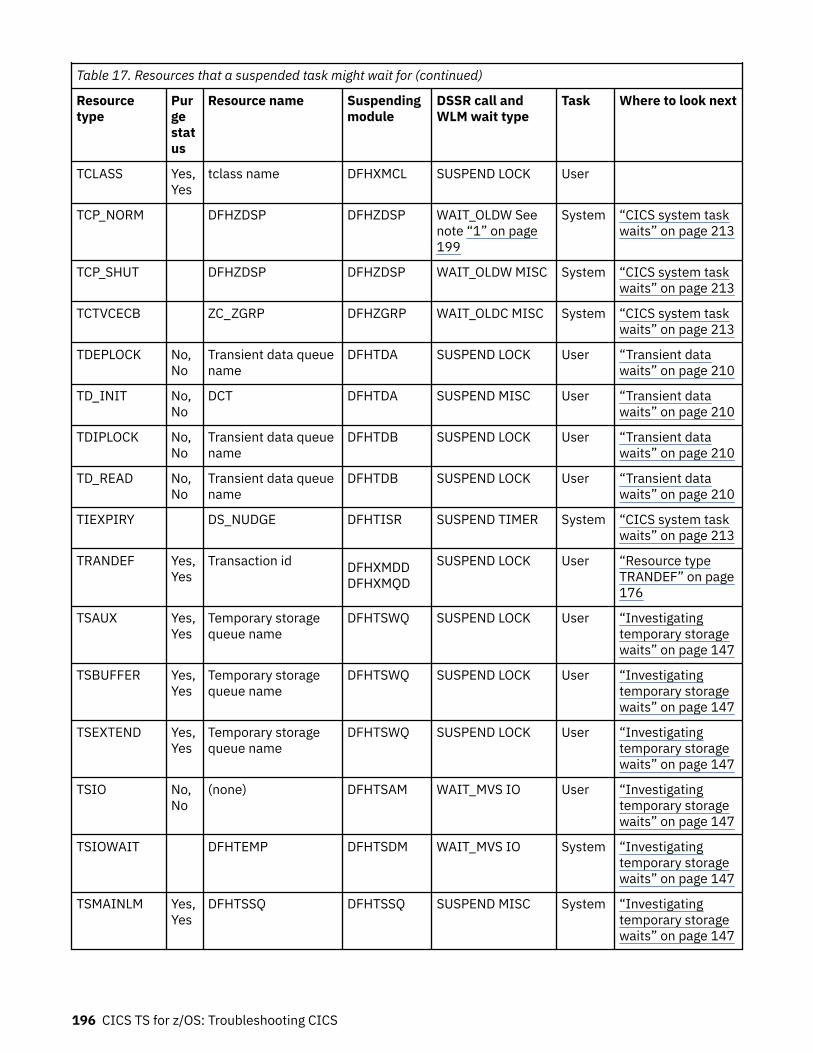
Table 17. Resources that a suspended task might wait for (continued)
Resourcetype
Purgestatus
Resource name Suspendingmodule
DSSR call andWLM wait type
Task Where to look next
TCLASS Yes,Yes
tclass name DFHXMCL SUSPEND LOCK User
TCP_NORM DFHZDSP DFHZDSP WAIT_OLDW Seenote “1” on page199
System “CICS system taskwaits” on page 213
TCP_SHUT DFHZDSP DFHZDSP WAIT_OLDW MISC System “CICS system taskwaits” on page 213
TCTVCECB ZC_ZGRP DFHZGRP WAIT_OLDC MISC System “CICS system taskwaits” on page 213
TDEPLOCK No,No
Transient data queuename
DFHTDA SUSPEND LOCK User “Transient datawaits” on page 210
TD_INIT No,No
DCT DFHTDA SUSPEND MISC User “Transient datawaits” on page 210
TDIPLOCK No,No
Transient data queuename
DFHTDB SUSPEND LOCK User “Transient datawaits” on page 210
TD_READ No,No
Transient data queuename
DFHTDB SUSPEND LOCK User “Transient datawaits” on page 210
TIEXPIRY DS_NUDGE DFHTISR SUSPEND TIMER System “CICS system taskwaits” on page 213
TRANDEF Yes,Yes
Transaction id DFHXMDDDFHXMQD
SUSPEND LOCK User “Resource typeTRANDEF” on page176
TSAUX Yes,Yes
Temporary storagequeue name
DFHTSWQ SUSPEND LOCK User “Investigatingtemporary storagewaits” on page 147
TSBUFFER Yes,Yes
Temporary storagequeue name
DFHTSWQ SUSPEND LOCK User “Investigatingtemporary storagewaits” on page 147
TSEXTEND Yes,Yes
Temporary storagequeue name
DFHTSWQ SUSPEND LOCK User “Investigatingtemporary storagewaits” on page 147
TSIO No,No
(none) DFHTSAM WAIT_MVS IO User “Investigatingtemporary storagewaits” on page 147
TSIOWAIT DFHTEMP DFHTSDM WAIT_MVS IO System “Investigatingtemporary storagewaits” on page 147
TSMAINLM Yes,Yes
DFHTSSQ DFHTSSQ SUSPEND MISC System “Investigatingtemporary storagewaits” on page 147
196 CICS TS for z/OS: Troubleshooting CICS
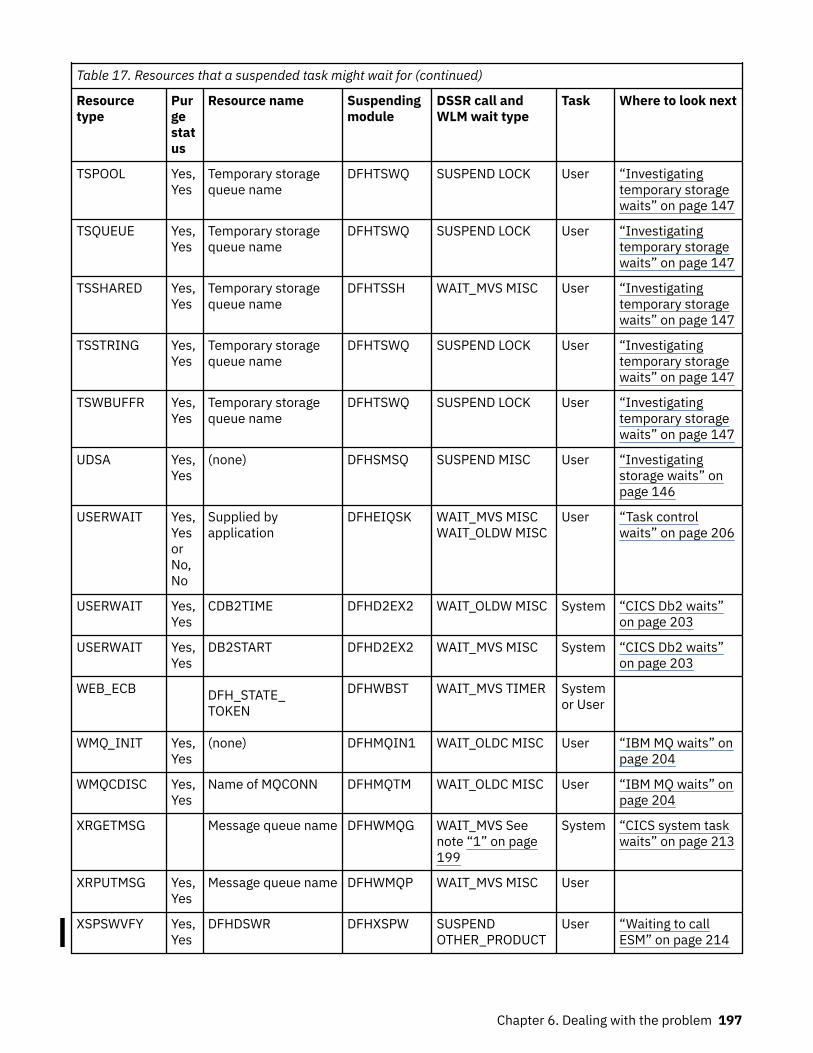
Table 17. Resources that a suspended task might wait for (continued)
Resourcetype
Purgestatus
Resource name Suspendingmodule
DSSR call andWLM wait type
Task Where to look next
TSPOOL Yes,Yes
Temporary storagequeue name
DFHTSWQ SUSPEND LOCK User “Investigatingtemporary storagewaits” on page 147
TSQUEUE Yes,Yes
Temporary storagequeue name
DFHTSWQ SUSPEND LOCK User “Investigatingtemporary storagewaits” on page 147
TSSHARED Yes,Yes
Temporary storagequeue name
DFHTSSH WAIT_MVS MISC User “Investigatingtemporary storagewaits” on page 147
TSSTRING Yes,Yes
Temporary storagequeue name
DFHTSWQ SUSPEND LOCK User “Investigatingtemporary storagewaits” on page 147
TSWBUFFR Yes,Yes
Temporary storagequeue name
DFHTSWQ SUSPEND LOCK User “Investigatingtemporary storagewaits” on page 147
UDSA Yes,Yes
(none) DFHSMSQ SUSPEND MISC User “Investigatingstorage waits” onpage 146
USERWAIT Yes,YesorNo,No
Supplied byapplication
DFHEIQSK WAIT_MVS MISCWAIT_OLDW MISC
User “Task controlwaits” on page 206
USERWAIT Yes,Yes
CDB2TIME DFHD2EX2 WAIT_OLDW MISC System “CICS Db2 waits”on page 203
USERWAIT Yes,Yes
DB2START DFHD2EX2 WAIT_MVS MISC System “CICS Db2 waits”on page 203
WEB_ECB DFH_STATE_TOKEN
DFHWBST WAIT_MVS TIMER Systemor User
WMQ_INIT Yes,Yes
(none) DFHMQIN1 WAIT_OLDC MISC User “IBM MQ waits” onpage 204
WMQCDISC Yes,Yes
Name of MQCONN DFHMQTM WAIT_OLDC MISC User “IBM MQ waits” onpage 204
XRGETMSG Message queue name DFHWMQG WAIT_MVS Seenote “1” on page199
System “CICS system taskwaits” on page 213
XRPUTMSG Yes,Yes
Message queue name DFHWMQP WAIT_MVS MISC User
XSPSWVFY Yes,Yes
DFHDSWR DFHXSPW SUSPENDOTHER_PRODUCT
User “Waiting to callESM” on page 214
Chapter 6. Dealing with the problem 197
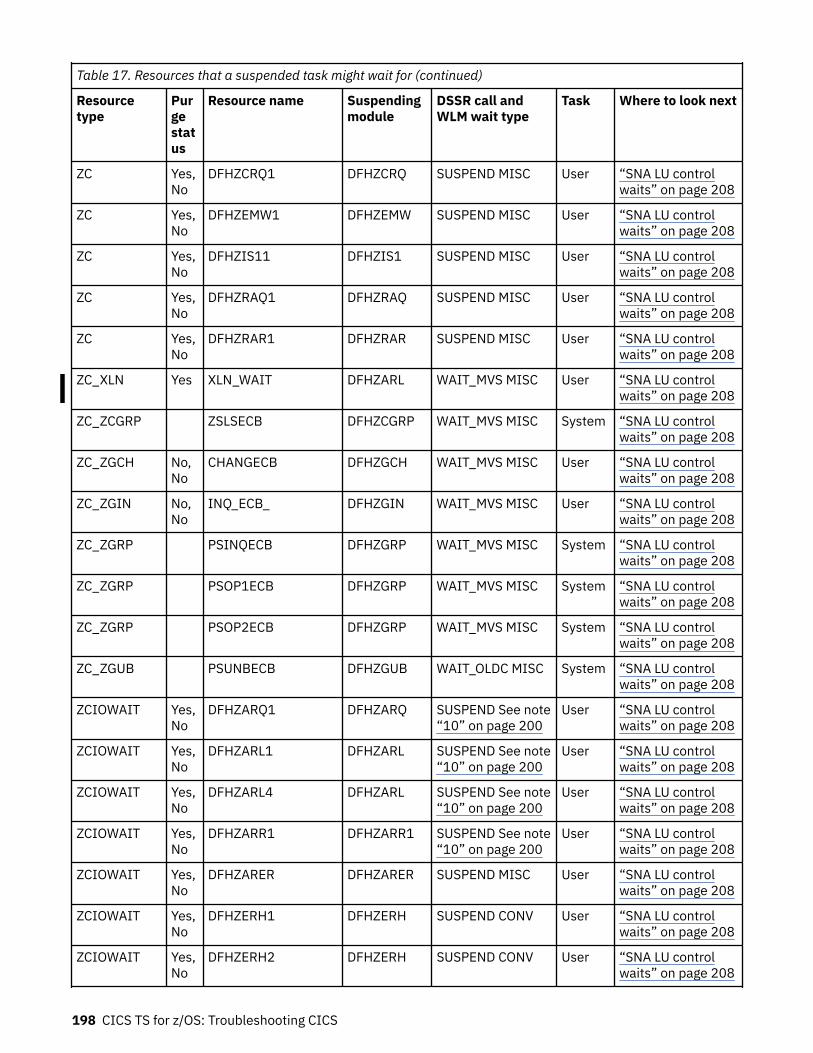
Table 17. Resources that a suspended task might wait for (continued)
Resourcetype
Purgestatus
Resource name Suspendingmodule
DSSR call andWLM wait type
Task Where to look next
ZC Yes,No
DFHZCRQ1 DFHZCRQ SUSPEND MISC User “SNA LU controlwaits” on page 208
ZC Yes,No
DFHZEMW1 DFHZEMW SUSPEND MISC User “SNA LU controlwaits” on page 208
ZC Yes,No
DFHZIS11 DFHZIS1 SUSPEND MISC User “SNA LU controlwaits” on page 208
ZC Yes,No
DFHZRAQ1 DFHZRAQ SUSPEND MISC User “SNA LU controlwaits” on page 208
ZC Yes,No
DFHZRAR1 DFHZRAR SUSPEND MISC User “SNA LU controlwaits” on page 208
ZC_XLN Yes XLN_WAIT DFHZARL WAIT_MVS MISC User “SNA LU controlwaits” on page 208
ZC_ZCGRP ZSLSECB DFHZCGRP WAIT_MVS MISC System “SNA LU controlwaits” on page 208
ZC_ZGCH No,No
CHANGECB DFHZGCH WAIT_MVS MISC User “SNA LU controlwaits” on page 208
ZC_ZGIN No,No
INQ_ECB_ DFHZGIN WAIT_MVS MISC User “SNA LU controlwaits” on page 208
ZC_ZGRP PSINQECB DFHZGRP WAIT_MVS MISC System “SNA LU controlwaits” on page 208
ZC_ZGRP PSOP1ECB DFHZGRP WAIT_MVS MISC System “SNA LU controlwaits” on page 208
ZC_ZGRP PSOP2ECB DFHZGRP WAIT_MVS MISC System “SNA LU controlwaits” on page 208
ZC_ZGUB PSUNBECB DFHZGUB WAIT_OLDC MISC System “SNA LU controlwaits” on page 208
ZCIOWAIT Yes,No
DFHZARQ1 DFHZARQ SUSPEND See note“10” on page 200
User “SNA LU controlwaits” on page 208
ZCIOWAIT Yes,No
DFHZARL1 DFHZARL SUSPEND See note“10” on page 200
User “SNA LU controlwaits” on page 208
ZCIOWAIT Yes,No
DFHZARL4 DFHZARL SUSPEND See note“10” on page 200
User “SNA LU controlwaits” on page 208
ZCIOWAIT Yes,No
DFHZARR1 DFHZARR1 SUSPEND See note“10” on page 200
User “SNA LU controlwaits” on page 208
ZCIOWAIT Yes,No
DFHZARER DFHZARER SUSPEND MISC User “SNA LU controlwaits” on page 208
ZCIOWAIT Yes,No
DFHZERH1 DFHZERH SUSPEND CONV User “SNA LU controlwaits” on page 208
ZCIOWAIT Yes,No
DFHZERH2 DFHZERH SUSPEND CONV User “SNA LU controlwaits” on page 208
198 CICS TS for z/OS: Troubleshooting CICS
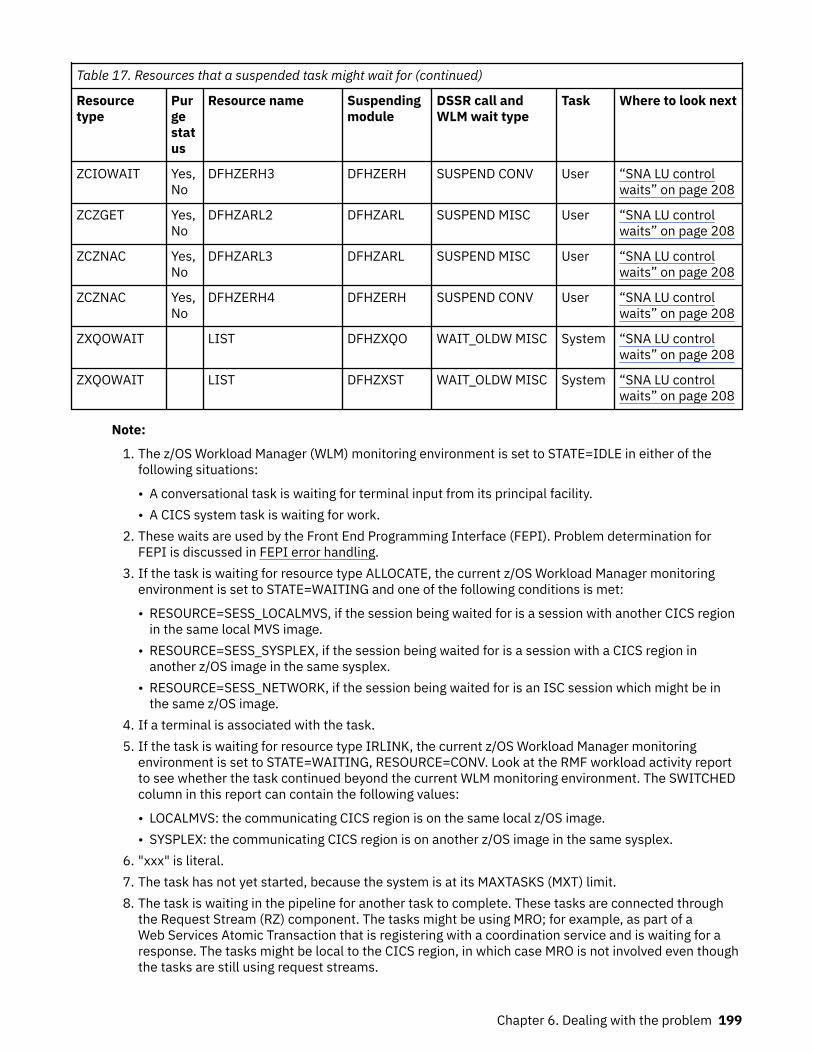
Table 17. Resources that a suspended task might wait for (continued)
Resourcetype
Purgestatus
Resource name Suspendingmodule
DSSR call andWLM wait type
Task Where to look next
ZCIOWAIT Yes,No
DFHZERH3 DFHZERH SUSPEND CONV User “SNA LU controlwaits” on page 208
ZCZGET Yes,No
DFHZARL2 DFHZARL SUSPEND MISC User “SNA LU controlwaits” on page 208
ZCZNAC Yes,No
DFHZARL3 DFHZARL SUSPEND MISC User “SNA LU controlwaits” on page 208
ZCZNAC Yes,No
DFHZERH4 DFHZERH SUSPEND CONV User “SNA LU controlwaits” on page 208
ZXQOWAIT LIST DFHZXQO WAIT_OLDW MISC System “SNA LU controlwaits” on page 208
ZXQOWAIT LIST DFHZXST WAIT_OLDW MISC System “SNA LU controlwaits” on page 208
Note:
1. The z/OS Workload Manager (WLM) monitoring environment is set to STATE=IDLE in either of thefollowing situations:
• A conversational task is waiting for terminal input from its principal facility.• A CICS system task is waiting for work.
2. These waits are used by the Front End Programming Interface (FEPI). Problem determination forFEPI is discussed in FEPI error handling.
3. If the task is waiting for resource type ALLOCATE, the current z/OS Workload Manager monitoringenvironment is set to STATE=WAITING and one of the following conditions is met:
• RESOURCE=SESS_LOCALMVS, if the session being waited for is a session with another CICS regionin the same local MVS image.
• RESOURCE=SESS_SYSPLEX, if the session being waited for is a session with a CICS region inanother z/OS image in the same sysplex.
• RESOURCE=SESS_NETWORK, if the session being waited for is an ISC session which might be inthe same z/OS image.
4. If a terminal is associated with the task.5. If the task is waiting for resource type IRLINK, the current z/OS Workload Manager monitoring
environment is set to STATE=WAITING, RESOURCE=CONV. Look at the RMF workload activity reportto see whether the task continued beyond the current WLM monitoring environment. The SWITCHEDcolumn in this report can contain the following values:
• LOCALMVS: the communicating CICS region is on the same local z/OS image.• SYSPLEX: the communicating CICS region is on another z/OS image in the same sysplex.
6. "xxx" is literal.7. The task has not yet started, because the system is at its MAXTASKS (MXT) limit.8. The task is waiting in the pipeline for another task to complete. These tasks are connected through
the Request Stream (RZ) component. The tasks might be using MRO; for example, as part of aWeb Services Atomic Transaction that is registering with a coordination service and is waiting for aresponse. The tasks might be local to the CICS region, in which case MRO is not involved even thoughthe tasks are still using request streams.
Chapter 6. Dealing with the problem 199
9. The task has not yet started because it is being held for transaction class purposes.10. If the task is waiting for resource type ZCIOWAIT, the current z/OS Workload Manager monitoring
environment is set to one of the following states:
• STATE=IDLE for a conversational task, or DTP transaction, that is awaiting input from its principalfacility.
• STATE=WAITING,RESOURCE=CONV for a task awaiting input from its alternate facility. Look atthe RMF workload activity report to see whether the task continued beyond the current WLMmonitoring environment. The SWITCHED column in this report can contain the following values:
– LOCALMVS: the communicating CICS region is on the same local z/OS image.– SYSPLEX: the communicating CICS region is on another z/OS image in the same sysplex.– NETWORK: the communicating CICS region is in the z/OS Communications Server network,
which might be in the same z/OS image.11. The task is waiting for a request stream request or response from its request stream partner.12. The task is waiting to send or receive a request or response.13. The event processing queue server is waiting for an event to be placed on the queue.14. The event processing dispatcher is waiting for an event to be dispatched.15. The thread limit for the JVM server has been reached, as specified in the THREADLIMIT attribute of
the JVMSERVER resource. The JVM server must wait until a thread becomes available before startinganother task. To reduce the frequency of waits for a particular JVM server, increase the value of theTHREADLIMIT attribute for that JVMSERVER resource.
16. The event processing deferred filtering task CEPF is waiting for a request to be placed on the queue.17. The Policy deferred rule evaluation task CMPE is waiting for a request to be placed on the queue.18. The long running task is waiting to receive a notification from a NODEJSAPP.
Asynchronous services waitsThis section describes the waits associated with CICS asynchronous services support.
Resource type AS_CHILDA suspend can occur when a task issues a FETCH CHILD command without the NOSUSPEND optionspecified, and the child task associated with the specified token hasn't completed. The task will resumewhen the child task completes, or the suspend times out according to the TIMEOUT option on thecommand.
You can purge the task when it is in this state.
Resource type AS_ANYA suspend can occur when a task issues a FETCH ANY command without the NOSUSPEND optionspecified, and no unfetched child task is complete. The task will resume when any unfetched child taskcompletes, or the suspend times out according to the TIMEOUT option on the command.
You can purge the task when it is in this state.
Resource type ASPARENTA parent task can be suspended when it issues a RUN TRANSID command if CICS needs to regulateworkflow (see Managing performance with the asynchronous API for more information). The task willresume when the workload level in the region drops.
You can purge the task when it is in this state.
200 CICS TS for z/OS: Troubleshooting CICS
Dispatcher waitsThe CICS dispatcher might cause tasks to wait, depending on the availability of TCBs in the CICS regionand the maximum number of TCBs that CICS is allowed to create for tasks.
The resource names or resource type associated with these dispatcher waits are as follows:
• DS_ASSOC• DSTSKDEF• OPENPOOL• OPEN_DEL• SSL_POOL• THR_POOL• XMCHILD• XMPARENT• XP_POOL
Resource type DS_ASSOC
When a task performs an EXEC CICS LINK to a Liberty program, or a transaction is attached whoseinitial program is a Liberty program, CICS will dispatch the task onto a T8 TCB in the Liberty JVM server.The task is suspended on the resource type DS_ASSOC and later resumed on the T8 TCB. If the task is notresumed in the period specified by the WLP_LINK_TIMEOUT parameter in the JVM profile, the suspendwill timeout. See Symbols used in the JVM profile for more information.
Resource type DSTSKDEF
A task waiting on the resource type DSTSKDEF is not suspended. Task attach has added the new task tothe dispatcher chain and it is waiting for first dispatch. The task might be waiting for a dump to complete,for example.
Resource name OPENPOOL
CICS automatically sets the limit for the number of open TCBs in the L8 and L9 mode open TCB pool. Thelimit is based on the maximum number of tasks (MXT or MAXTASKS) specified for the CICS region, usingthe following formula:
(2 * MXT Value) + 32
When a task first needs an L8 or L9 mode open TCB, the dispatcher domain tries to find a free TCB of thismode with the correct subspace attributes. If no L8 or L9 mode TCB associated with a matching subspaceis free, CICS performs these actions:
• Attaches a new L8 or L9 mode TCB of the required subspace, if the number of open TCBs in the L8 andL9 mode open TCB pool is less than the limit set by CICS, and allocates the new TCB to the requestingtask.
• Detaches a free open L8 or L9 mode TCB associated with a different subspace, if there is one availableand the limit has been reached, attaches a new L8 or L9 mode TCB, and allocates this new TCB to therequesting task. This process is referred to as TCB stealing: deleting a free TCB of one type to attach oneof a different type.
However, if neither of these options is available, the dispatcher places the requesting task onto a queueand the task is suspended, using suspend token AWAITING_OPENPOOL_TOKEN in the DS task block.
Chapter 6. Dealing with the problem 201
When an open TCB becomes free, or if the limit changes, the task at the front of the queue is resumed,and the open TCB allocation process is retried.
Resource name OPEN_DEL
If your task is waiting on a resource name of OPEN_DEL, the dispatcher is detaching an unsuitable TCB(stealing) so that it can allocate a new one, and your task is waiting for the old TCB to end so that thedispatcher can attach a new one.
If your task requires an open TCB, but no suitable TCB is available, and a new TCB cannot be attachedbecause the limit set for the number of open TCBs has been reached, CICS deletes a currently idle TCB toallow the task to attach a TCB of the required type. However, the attach cannot proceed until the processto delete the TCB is complete, otherwise, the number of open TCBs in the pool would temporarily exceedthe limit.
Resource name SSL_POOL
When a task first needs a S8 mode open TCB, the dispatcher domain attempts to find a free TCB from theSSL pool. If no S8 mode TCB is free, and the number of open TCBs in the SSL pool is less than the limitspecified by the MAXSSLTCBS system initialization parameter, CICS attaches a new TCB and allocates it tothe requesting task.
However, if the number of S8 TCBs in the pool is at the limit set by MAXSSLTCBS, dispatcherplaces the requesting task onto a queue and the task is suspended, using suspend tokenAWAITING_OPEN_TCB_TOKEN in the DS task block. When an open TCB becomes free, or theMAXSSLTCBS limit is raised, the task at the front of the queue is resumed, and the open TCB allocationprocess is retried.
Resource name THR_POOL
When a task first needs a T8 mode open TCB, the dispatcher domain attempts to find a free TCB from theTHRD pool. If no T8 TCB is free, and the number of open TCBs in the THRD pool is less than the maximumlimit, CICS attaches a new TCB and allocates it to the requesting task. The maximum limit for the THRDpool is total number of threads reserved for all the JVM servers in the region, up to a limit of 2000. Thenumber of threads reserved for each JVM server is the THREADLIMIT value on the JVMSERVER resource,plus 1 (the TCB that is reserved for the JVM server).
If the number of T8 TCBs in the pool is at the maximum limit, dispatcher places the requesting task ontoa queue and the task is suspended, using suspend token AWAITING_OPEN_TCB_TOKEN in the DS taskblock. When an open TCB becomes free, the task at the front of the queue is resumed, and the open TCBallocation process is retried.
Resource type XMCHILD
The task is a CICS Business Transaction Services (BTS) child transaction that is suspended waiting for itsparent transaction to resume it. The resource name is the task number of the parent transaction.
Resource type XMPARENT
The task is a CICS Business Transaction Services (BTS) parent transaction that is suspended waitingfor an associated child transaction to resume it. The resource name is the task number of the childtransaction.
202 CICS TS for z/OS: Troubleshooting CICS
Resource name XP_POOL
CICS automatically sets the limit for the number of X8 and X9 TCBs to a value equal to the maximumnumber of tasks specified for the CICS region (the MXT value).
When a task first needs a X8 or X9 mode open TCB, the dispatcher domain attempts to find a free TCBfrom the XP pool. If no X8 or X9 mode TCB is free, and the number of open TCBs in the XP pool is lessthan the limit set by CICS, CICS attaches a new TCB and allocates it to the requesting task.
However, if the number of X8 and X9 TCBs in the pool is at the limit set by CICS, dispatcherplaces the requesting task onto a queue and the task is suspended, using suspend tokenAWAITING_OPEN_TCB_TOKEN in the DS task block. When an open TCB becomes free, or if the limitchanges, the task at the front of the queue is resumed, and the open TCB allocation process is retried.
CICS Db2 waitsCICS Db2 uses the WAIT_MVS and WAIT_OLDC functions of the CICS dispatcher to put the running CICStask into a wait.
Resource type CDB2CONN
The CICS task has an open TCB but is waiting for a Db2 connection to become available to use with theopen TCB. This indicates that the TCBLIMIT value has been reached, which limits the number of openTCBs (and hence connections) that can be used to access Db2. The CICS task must wait for a connectionto be freed by another TCB running on behalf of another CICS task, after which it may use the freed Db2connection with its own TCB.
You cannot purge the task when it is in this state. Message DFHAP0604 is issued at the console if anattempt to forcepurge the task is made. Forcepurge processing is deferred until a Db2 connection hasbeen acquired.
You can increase the number of open TCBs permitted to access Db2 with a SET DB2CONN TCBLIMITcommand. If you increase the TCBLIMIT value, CICS posts tasks to retry acquisition of a Db2 connection.
Resource type CDB2RDYQ
The task is waiting for a thread to become available. The resource name details the DB2ENTRY or pool forwhich there is a shortage of threads.
You cannot purge the task when it is in this state. Message DFHAP0604 is issued at the console if anattempt to forcepurge the task is made. Forcepurge processing is deferred until a thread is acquired.
You can increase the number of threads available for the DB2ENTRY with a SET DB2ENTRY ( )THREADLIMIT(nn) command. You can increase the number of threads available for the pool with a SETDB2CONN THREADLIMIT(nn) command. If you increase the THREADLIMIT value, CICS posts tasks toretry acquisition of a thread.
Resource type DB2_INITDFHD2IN1 (CICS Db2 initialization program) issues the wait for DFHD2IN2 to complete.
Resource type DB2CDISCA SET DB2CONN NOTCONNECTED command has been issued with the WAIT or FORCE option. DFHD2TMwaits for the count of tasks using Db2 to reach zero.
Resource type DB2EDISAA SET DB2ENTRY DISABLED command has been issued with the WAIT or FORCE option. DFHD2TM waitsfor the count of tasks using the DB2ENTRY to reach zero.
Chapter 6. Dealing with the problem 203
IBM MQ waitsIf a task is waiting on the resource type MQseries, WMQ_INIT, or WMQCDISC, the CICS-IBM MQ adapterhas suspended it.
Resource type MQseriesThe CICS-IBM MQ MQ adapter (DFHMQTRU module) put the task into a CICS wait because the WAIToption was used with the MQGET call and there was no message available. The resource name used forthe wait is GETWAIT. The WAIT_MVS function of the dispatcher is used for this wait, and the wait type forworkload management is OTHER_PRODUCT. The task can be purged.
Resource type WMQ_INITDFHMQIN1, the CICS-IBM MQ initialization program, issues this wait for DFHMQIN2 to complete. TheWAIT_OLDC function of the dispatcher is used for this wait, and the wait type for workload management isMISC. The task can be purged.
Resource type WMQCDISCA SET MQCONN NOTCONNECTED command has been issued with the WAIT or FORCE option, and theDFHMQTM module waits for the count of user tasks using IBM MQ to reach zero. The resource name isgiven as the name of the installed MQCONN resource definition for the CICS system. The WAIT_OLDCfunction of the dispatcher is used for this wait, and the wait type for workload management is MISC. Thetask can be purged.
DBCTL waitsDBCTL can enter the wait state for three reasons: the connection to DBCTL using CICS-suppliedtransaction CDBC has failed to complete, a user task is waiting on the DBCTL resource DLSUSPND, orthe attempt to disconnect from DBCTL using CICS-supplied transaction CDBC has failed to complete.
Connection to DBCTL has failed to completeConnection to DBCTL using the CICS-supplied transaction CDBC takes place in two phases. You can findthe current phase using either transaction CDBC, by refreshing the screen display, or transaction CDBI.
In phase 1, CDBC passes the request for connection to IMS, and returns. It is very unlikely for a wait tooccur during this phase, unless there is an error in CICS code. In such a case, you would see this messagedisplayed whenever you inquired on the connection status using CDBI:
DFHDB8291I DBCTL connect phase 1 in progress.
In phase 2, IMS processes the request asynchronously, and returns to CICS when connection is complete.Until the connection is complete, you see this status message displayed whenever you inquire with CDBI:
DFHDB8292I DBCTL connect phase 2 in progress.
If this phase fails to complete, the failure is associated with IMS. See Diagnosis in IMS productdocumentation for guidance about debugging the problem.
A user task is waiting on resource type DBCTLIf you find that a user task is waiting on a resource type of DBCTL and resource name DLSUSPND, the taskhas made a DL/I request. The task is suspended by CICS while the request is serviced by DBCTL. If thetask has not resumed, the request has not completed.
204 CICS TS for z/OS: Troubleshooting CICS
Disconnection from DBCTL has failed to completeWhen you use CDBC to disconnect from DBCTL, it invokes another CICS transaction, CDBT. CDBTmakes the disconnection request to DBCTL and is suspended by CICS while DBCTL services the requestasynchronously.
If disconnection fails to complete, you can inquire on CDBT using, for example, CEMT INQ TASK to seehow far disconnection has progressed. You will probably find that CDBT is waiting on resource type DBCTLand resource name DLSUSPND, in which case the request is being processed by DBCTL.
• If CDBT is waiting on DBCTL, what you do next depends on whether you have requested “orderly” or“immediate” disconnection.
– If you have requested “orderly” disconnection, it is likely that DBCTL is waiting for conversationaltasks to finish. You can override an “orderly” disconnection by requesting “immediate”disconnection, in which case the process should end at once.
– If you have requested “immediate” disconnection, and this does not happen, there is an unexpectedwait within IMS. See Diagnosis in IMS product documentation for guidance about investigating theproblem.
• If CDBT is not waiting on DBCTL, this indicates a problem with CICS code. Contact the IBM SupportCenter for further assistance.
EDF waitsA user task is made to wait on resource type EDF and resource name DBUGUSER when, under the EDFsession, CICS has control for EDF processing.
Log manager waitsRead this section if the resource type your task is waiting on starts with the characters LG, indicating logmanager.
The journal name, given as the resource name, refers to the last element of the MVS log stream name.For example, in the log stream name PAYRO.ACC0001.UJ4321, the journal name, for these purposes, isUJ4321. If you do encounter any of these waits, look at the MVS console for messages prefixed with ‘IXG'.These are the MVS system logger messages and might provide further information about the cause of thewait. The MVS system console might also reveal evidence of resource contention within MVS, a possiblecause of a log manager wait.
If the task is writing to a journal on an SMF log, the journal name is the name of the journal.
Do not use the SET TASK command to remove tasks that are waiting for the log manager resource types.If you use this command to purge the task, CICS ignores the command. If you use the FORCEPURGE orKILL options, the CICS region might fail.
Resource type LG_DEFERThe task is the first task to request that the currently active log buffer be flushed. The task waits for30 milliseconds to allow other tasks to append more records to the buffer.
Resource type LG_FORCEThe task is waiting for the flush of a log buffer to complete. It is resumed by the task that performs theflush operation. The task can be purged if the log stream is not DFHLOG, the primary system log.
Resource type LG_RETRYThis is a temporary error, reading or writing a log from a log stream. CICS waits and retries theoperation.
Resource type LGDELALLDuring an initial start of CICS, CICS calls the MVS system logger macro IXGDELET ALL. CICS waitsuntil the MVS system logger posts the ECB.
Resource type LGDELRANDuring keypoint processing, CICS calls the MVS system logger macro IXGDELET RANGE. CICS waitsuntil the MVS system logger posts the ECB.
Chapter 6. Dealing with the problem 205
Resource type LGENDBLKDuring an emergency restart of CICS, or transaction backout, CICS calls the MVS system logger macroIXGBRWSE END. CICS waits until the MVS system logger posts the ECB.
Resource type LGENDCRSDuring an emergency restart of CICS, CICS calls the MVS system logger macro IXGBRWSE END. CICSwaits until the MVS system logger posts the ECB.
Resource type LGFREVERWhen CICS is quiescing and a dynamic backout fails because a task fails to read the system log, thetask is suspended 'forever' to allow other tasks to continue to back out. The SDTRAN process deletesthese suspended tasks during CICS shutdown.
Resource type LGHARTBTThe log manager 'heartbeat' system task checks that the MVS Logger connection to the system log isstill valid. The task is in this wait state most of the time. There must be one task in this state on thesystem.
Resource type LGREDBLKDuring an emergency restart of CICS, or transaction backout, CICS calls the MVS system logger macroIXGBRWSE READBLOCK. CICS waits until the MVS system logger posts the ECB.
Resource type LGREDCRSDuring an emergency restart of CICS, CICS calls the MVS system logger macro IXGBRWSEREADCURSOR. CICS waits until the MVS system logger posts the ECB.
Resource type LGSTRBLKDuring an emergency restart of CICS, or transaction backout, CICS calls the MVS system logger macroIXGBRWSE START. CICS waits until the MVS system logger posts the ECB.
Resource type LGSTRCRSDuring an emergency restart of CICS, CICS calls the MVS system logger macro IXGBRWSE START.CICS waits until the MVS system logger posts the ECB.
Resource type LGWRITEIn several situations, CICS calls the MVS system logger macro IXGWRITE. CICS waits until the MVSsystem logger posts the ECB.
RRMS waitsIf a task is waiting on the resource type RRMSEXIT, the RX domain has suspended the task.
GET_CLIENT_INFOThe RX domain waits on the next inbound request from the external client for the unit of recovery.
NOTIFICATIONThe system task waits on an ECB. When an ECB is posted, the task checks the current state of theresource manager.
RESYNCThe system task waits on an ECB. When an ECB is posted, the task executes resync for any units ofrecovery on the resync chain.
SYNCPOINTThe RX domain waits for the RRS to deliver the overall decision for the unit of recovery.
Task control waitsIf your task is waiting on a resource type of KCCOMPAT or KC_ENQ, it has been suspended by thetransaction manager. If your task is waiting on a resource type of EKCWAIT, it has been suspended by taskcontrol.
KC_ENQ indicates that CICS code acting for a task has issued an EXEC CICS ENQ command or a DFHKCTYPE=ENQ macro. If there is an extended wait for no apparent reason, this might indicate an error withinCICS. If that turns out to be the case, contact the IBM Support Center.
206 CICS TS for z/OS: Troubleshooting CICS
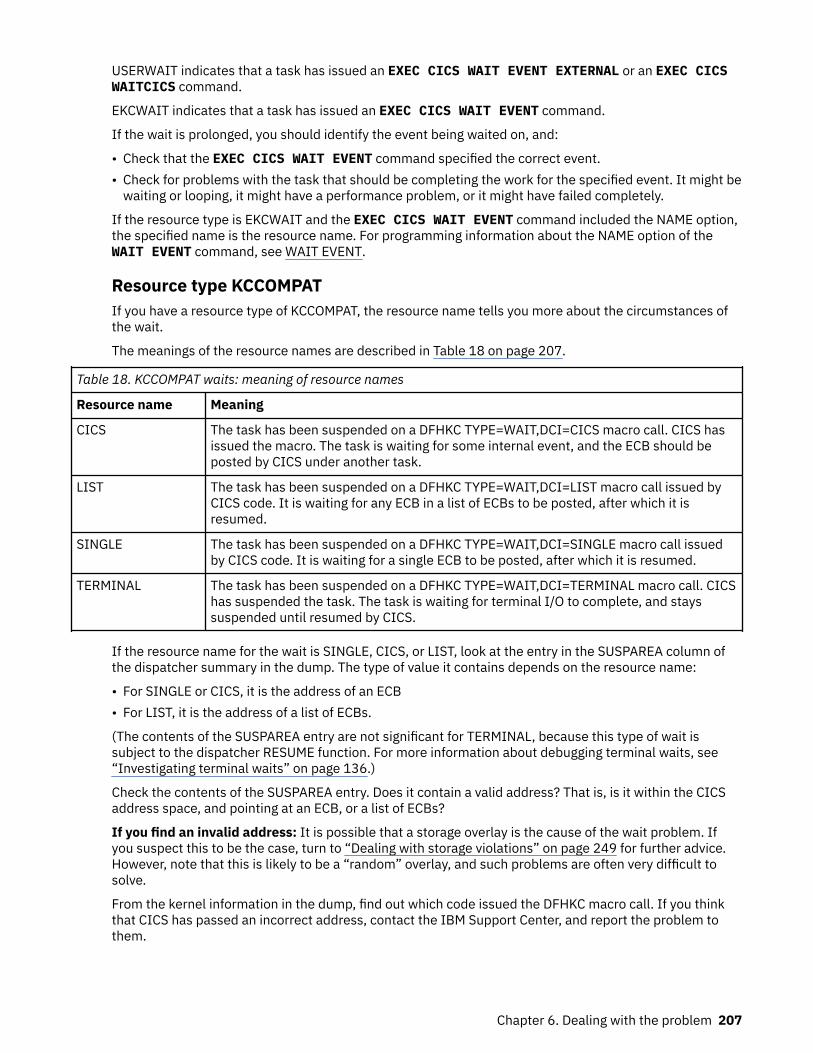
USERWAIT indicates that a task has issued an EXEC CICS WAIT EVENT EXTERNAL or an EXEC CICSWAITCICS command.
EKCWAIT indicates that a task has issued an EXEC CICS WAIT EVENT command.
If the wait is prolonged, you should identify the event being waited on, and:
• Check that the EXEC CICS WAIT EVENT command specified the correct event.• Check for problems with the task that should be completing the work for the specified event. It might be
waiting or looping, it might have a performance problem, or it might have failed completely.
If the resource type is EKCWAIT and the EXEC CICS WAIT EVENT command included the NAME option,the specified name is the resource name. For programming information about the NAME option of theWAIT EVENT command, see WAIT EVENT.
Resource type KCCOMPATIf you have a resource type of KCCOMPAT, the resource name tells you more about the circumstances ofthe wait.
The meanings of the resource names are described in Table 18 on page 207.
Table 18. KCCOMPAT waits: meaning of resource names
Resource name Meaning
CICS The task has been suspended on a DFHKC TYPE=WAIT,DCI=CICS macro call. CICS hasissued the macro. The task is waiting for some internal event, and the ECB should beposted by CICS under another task.
LIST The task has been suspended on a DFHKC TYPE=WAIT,DCI=LIST macro call issued byCICS code. It is waiting for any ECB in a list of ECBs to be posted, after which it isresumed.
SINGLE The task has been suspended on a DFHKC TYPE=WAIT,DCI=SINGLE macro call issuedby CICS code. It is waiting for a single ECB to be posted, after which it is resumed.
TERMINAL The task has been suspended on a DFHKC TYPE=WAIT,DCI=TERMINAL macro call. CICShas suspended the task. The task is waiting for terminal I/O to complete, and stayssuspended until resumed by CICS.
If the resource name for the wait is SINGLE, CICS, or LIST, look at the entry in the SUSPAREA column ofthe dispatcher summary in the dump. The type of value it contains depends on the resource name:
• For SINGLE or CICS, it is the address of an ECB• For LIST, it is the address of a list of ECBs.
(The contents of the SUSPAREA entry are not significant for TERMINAL, because this type of wait issubject to the dispatcher RESUME function. For more information about debugging terminal waits, see“Investigating terminal waits” on page 136.)
Check the contents of the SUSPAREA entry. Does it contain a valid address? That is, is it within the CICSaddress space, and pointing at an ECB, or a list of ECBs?
If you find an invalid address: It is possible that a storage overlay is the cause of the wait problem. Ifyou suspect this to be the case, turn to “Dealing with storage violations” on page 249 for further advice.However, note that this is likely to be a “random” overlay, and such problems are often very difficult tosolve.
From the kernel information in the dump, find out which code issued the DFHKC macro call. If you thinkthat CICS has passed an incorrect address, contact the IBM Support Center, and report the problem tothem.
Chapter 6. Dealing with the problem 207
If you find a valid address: Consider what area the ECB is in. Does the position of the ECB, and itsenvironment, suggest that it relates to a resource whose availability you can control? If so, you might beable to solve the problem by redefining the quantity of that resource.
If the ECB does not lie within an area that you can control, refer the problem to the IBM Support Center.
Resource type KC_ENQIf your task is waiting on resource type KC_ENQ, it is unconditionally enqueued on a single serverresource that is currently unavailable.
Typically, tasks are made to wait on KC_ENQ when they make certain types of file control request, if thefile is already in use. These are the cases:
• The waiting task has attempted to change the state of a file that is in use. Another task has alreadyattempted to change the state of the same file, and is suspended on resource type FCFSWAIT. For moredetails, see “Resource type FCFSWAIT - wait for file state changes” on page 162.
• The waiting task has attempted to update a record in a recoverable file while another task has the lockon it. The task owning the record lock retains it until it reaches the end of the current logical unit ofwork (syncpoint or end of task). For more details of record locking for VSAM files, see “Resource typeENQUEUE - waits for locks on files or data tables” on page 167.
If the wait on resource type KC_ENQ is prolonged:
• More than one task might be enqueued on the resource, and the task you are investigating couldbe some way down the list. Check the programming logic of any of your programs accessing theresource, to see if it can be released more quickly. Consider whether you can include EXEC CICS DEQcommands.
• Another (long-running) task might have used the resource and finished with it, without issuing an EXECCICS DEQ command or a DFHKC TYPE=DEQ macro call. The resource is made available automaticallywhen the task terminates, but in the meantime, no other tasks are able to use it.
• There might be a CICS system error. If you have considered the other possibilities and you think this isthe most likely explanation, refer the problem to the IBM Support Center.
SNA LU control waitsSystems Network Architecture (SNA) logical unit (LU) control waits are associated with the followingresource types. The implication of waits on any of these resource types are also described.
Resource type ZCIf your task is waiting on a resource name of DFHZCRQ1, it is waiting for I/O to complete. The task isattempting to complete one of the following:
• RESETSR• A send synchronous data flow• A send asynchronous command• SESSIONC.
The task waits for the time specified in the RTIMOUT value of the profile used by the transaction. If thetask times out, it receives either an AKCT or AZCT abend.
• If your task is waiting on a resource name of DFHZEMW1, the error message writer module, DFHZEMQ,is waiting for the completion of I/O. If a timeout value exists and is exceeded, the suspend expires.
• If your task is waiting on a resource name of DFHZRAQ1, this means a READ has been issued. The taskis resumed once the I/O operation is complete. If a timeout value exists and is exceeded, the suspendexpires.
208 CICS TS for z/OS: Troubleshooting CICS
• If your task is waiting on a resource name of DFHZRAR1, this means a READ has been issued. The taskis resumed once the I/O operation is complete. If a timeout value exists and is exceeded, the suspendexpires.
Resource type ZC_XLNYour task is waiting for the exchange of log names.
Resource type ZC_ZCGRPDFHZSLS has to set the TCT prefix SNA fields from the ACB. This wait is issued to ensure that these fieldsare set before being used.
Resource type ZC_ZGCHDFHZGCH is waiting for the SNA CHANGE ENDAFFIN macro to complete.
Resource type ZC_ZGINDFHZGIN issues the SNA INQUIRE macro and waits until SNA completes execution of this request.
Resource type ZC_ZGRP• If the task is waiting on resource name PSINQECB, this means that DFHZGRP has issued the SNA macro
INQUIRE PERSESS during SNA persistent session restart, or during the reopening of the SNA ACB, andis waiting for a response from SNA. The wait expires after 5 minutes if SNA does not respond.
• If the task is waiting for resource name PSOP2ECB, this means that DFHZGRP has issued the SNAmacro OPNDST RESTORE during emergency restart, and is waiting for a response from SNA. The waitexpires after 5 minutes if SNA does not respond.
Resource type ZC_ZGUBDFHZGUB issues ten SNA CLSDST or TERMSESS macros during persistent sessions restart. It waits foran RPL to become free for SNA to post the SNA exit. The wait expires after 5 minutes if SNA does notrespond.
Resource type ZCIOWAITSuspends on resource type ZCIOWAIT occur when the task is waiting for some terminal I/O. Once theexpected I/O event occurs, the task is resumed.
Resource type ZCZGETIf your task is waiting on a resource name of DFHZARL2, it is suspended by module DFHZARL which dealswith application request logic for LU6.2 devices. The suspend is caused by a GETMAIN call to DFHZGETfailing. DFHZGET is continually invoked until the GETMAIN is successful.
Resource type ZCZNACSuspends on resource type ZCZNAC are on resource names DFHZARL3 or DFHZERH4. The wait is forDFHZNAC to issue an error message. The error message to be issued depends on the error that led to thesuspend. Various actions may be taken by DFHZNAC before control is returned to the suspended task.
Resource type ZXQOWAITThe XRF queue organizer, DFHZXQO, waits for the posting of TCAICTEC and XQOVECTE which happenswhen the queue is emptied.
Chapter 6. Dealing with the problem 209
Resource type ZXSTWAITThe XRF session tracker, DFHZXST, waits for the posting of TCAICTEC and TCTVXPLE which happenswhen the session tracking queue is emptied.
Interregion and intersystem communication waitsIf you have a user task that is waiting for resource type ALLOCATE, it has attempted to get a session withanother CICS region, but all the sessions are in use.
Consider defining a greater number of sessions, which should solve the problem. For guidance about this,see Effects of the MAXIMUM option of the SESSIONS resource.
If you otherwise have a problem that you have identified as an interregion or an intersystemcommunication wait, investigate it as for terminal waits. This is dealt with in “Investigating terminal waits”on page 136.
The method of debugging is the same in each case. You need to consider the access method, terminalcontrol, and the “terminal” itself.
For interregion and intersystem communication, the remote region or system is the terminal. Its statuscan be found using the same online or offline techniques that you would use to find the status of aphysical terminal. The status may lead you to suspect that the task running in the remote region is thecause of the problem, and you then need to investigate why that task is waiting. So you could find thatwhat started as a terminal wait might, after all, be a wait on some other type of resource.
Transient data waitsTasks issuing requests to read and write to transient data destinations can be made to wait for severaldifferent reasons. The reasons depend on the type of request being made, and whether the task isattempting to access an extrapartition or an intrapartition queue.
The resource types that might be associated with the wait are described in the following information. Notethat the resource name is the transient data queue name, except in the case of TD_INIT, whose resourcename is DCT.
Resource type TD_INIT: waits during initialization processingA second stage PLT program that is being run during system initialization can issue a request for aresource that is not yet available, because the component that services the request has not yet beeninitialized.
If the program issues a transient data request that cannot yet be serviced, the program is suspended on aresource type of TD_INIT with a resource name of DCT.
You are unlikely to see any evidence for this type of wait, unless you have trace running duringinitialization with DS level-1 tracing selected. An error at this stage would be likely to cause CICS tostall (see “CICS has stalled during initialization” on page 179), or to terminate abnormally.
Resource type TDEPLOCK: waits for transient data extrapartition requestsIf you have a task suspended on resource type TDEPLOCK, with a resource name that corresponds to atransient data queue name, the task has issued a request against an extrapartition transient data queue.Another task is already accessing the same queue, and the waiting task cannot resume until that activityis complete.
If the wait is prolonged, it could be for either of the following reasons:
• A task needs to change TCB mode to open and close a data set. The task must relinquish control whilethis happens, and, depending on the system loading, this might take several seconds. This contributesto the wait that the second task, suspended on resource type TDEPLOCK, experiences.
• CICS uses the access method QSAM to write data to extrapartition transient data destinations. QSAMruns synchronously with tasks that are requesting its services. This means that any task that invokes a
210 CICS TS for z/OS: Troubleshooting CICS
QSAM service must wait until the QSAM processing is complete. If QSAM enters an extended wait forany reason, the requesting task also experiences an extended wait.
An extended wait might occur when QSAM attempts to access an extrapartition data set. QSAM uses theMVS RESERVE volume-locking mechanism to gain exclusive control of volumes while it accesses them,which means that any other region that attempts to write to the same volume is forced to wait.
If tasks frequently get suspended on resource type TDEPLOCK, you need to determine which othertransactions write data to the same extrapartition destination. You might then consider redefining theextrapartition destinations.
Resource types TDIPLOCK, ENQUEUE, RRMSEXIT, TD_READ, Any_MBCB,Any_MRCB, MBCB_xxx, and MRCB_xxxIf your task is waiting on any of the resource types TDIPLOCK, ENQUEUE, RRMSEXIT, TD_READ,Any_MBCB, Any_MRCB, MBCB_xxx, or MRCB_xxx, it has made a transient data intrapartition requestthat cannot be serviced at once. In each case, the resource name identifies the intrapartition queue thatthe request has been issued against.
Resource type TDIPLOCK: waits for transient data intrapartition requestsIf you have a task suspended on resource type TDIPLOCK, with a resource name that corresponds to atransient data queue name, the task has issued a request against an intrapartition transient data queue.Another task is already accessing the same queue and the waiting task cannot resume until that activity iscomplete.
If tasks frequently get suspended on resource type TDIPLOCK, you need to determine which othertransactions use the same intrapartition destination. You might then consider redefining the intrapartitiondestinations.
For more information about the constraints that apply to tasks writing to intrapartition destinations, seeTransient data control.
Resource type ENQUEUEIf a transient data queue has been defined as intrapartition and logically recoverable, there are furtherrestrictions on the use of the queue by more than one task at a time (in addition to those leading to waitson resource type TDIPLOCK).
If you have a task suspended on resource type ENQUEUE, and a value of TDNQ, the task has beensuspended while attempting to read, write or delete a logically recoverable queue because a requiredenqueue is currently held by another task.
Note: For general information about dealing with enqueue waits, see “Investigating enqueue waits” onpage 149. Issuing a CEMT INQUIRE UOWENQ command reveals the name of the queue and whether theenqueued read or write is required by the task. If the task is enqueued against the read end of the queue,a qualifier of FROMQ is displayed on the CEMT INQUIRE UOWENQ screen. If the task is enqueued againstthe write end of the queue, a qualifier of TOQ is displayed on the CEMT INQUIRE UOWENQ screen.
If you want to delete a queue, both the read and the write enqueues must be obtained. No task may,therefore, read or write to a queue while a delete operation is in progress. A delete cannot proceed untilany task currently reading has completed its read or any task writing has committed its changes.
In general, a wait on a resource type of ENQUEUE should not last for long unless the task owning theenqueue has been delayed. If the UOW that owns the enqueue has suffered an indoubt failure, the UOW isshunted. If the queue accessed by this UOW is defined as WAIT=YES and WAITACTION=QUEUE, the waitcan last for a long period of time. To deduce if an indoubt failure has occurred:
• Issue a CEMT INQUIRE UOWENQ command to display the name of the enqueue owner.• Issue a CEMT INQUIRE UOW command to see if the UOW is shunted.
Chapter 6. Dealing with the problem 211
Resource type RRMSEXIT
Resource type TD_READIf a queue is defined as logically recoverable, a TD_READ wait may be encountered.
A task can read from a queue while another task is writing to the same queue. If this happens, the firsttask holds the read enqueue and the second task holds the write enqueue on the queue. The task readingthe queue can only read data that has already been committed. It cannot read data that is currentlybeing written to the queue until the task holding the write enqueue commits the changes it has made anddequeues from the write end of the queue.
A task is suspended on a resource type of TD_READ if it is trying to read uncommitted data from alogically recoverable queue. The queue name is displayed in a qualifier. The suspended task is forced towait until the task owning the write enqueue commits the changes it has made..
In most cases, the suspended task will not have to wait long. A lengthy wait can occur if the task owningthe write enqueue suffers from an indoubt failure (which causes the associated UOW to be shunted), andthe queue is defined with the WAIT=YES and WAITACTION=QUEUE attributes.
If you do not want to wait for data to be committed to the queue, code NOSUSPEND on the READQ TDrequest. QBUSY is returned to the application and the task does not wait.
Resource type Any_MBCBIf your task is waiting on resource type Any_MBCB, the resource name is the name of an intrapartitionqueue that it is attempting to access.
This type of wait shows that all the transient data I/O buffers are in use, and the task resumes only whenone becomes available.
Tasks are only likely to wait in this way in a heavily loaded system.
Resource type Any_MRCBWhen a transient data I/O buffer has been acquired for a task, a VSAM string must be obtained. If all theVSAM strings available for transient data processing are in use, the task is suspended on resource typeAny_MRCB, with a resource name equal to the intrapartition queue name.
Waits on Any_MRCB should not be prolonged, except in a heavily loaded system.
Resource type MRCB_xxxA resource type of MRCB_xxx, with a resource name equal to an intrapartition transient data queue name,shows that the suspended task has successfully obtained a VSAM string, and is now waiting for VSAM I/Oto complete. This should not be a long wait, unless operator intervention is required.
Resource type MBCB_xxxIf a task is waiting on resource type MBCB_xxx, with a resource name equal to the intrapartition queuename, this indicates contention for a transient data I/O buffer. It should not be an extended wait, althoughit is dependent on VSAM I/O taking place on behalf of another task that has issued a transient datarequest. If that, for any reason, takes a long time, the wait on resource type MBCB_xxx is correspondinglylong. (For descriptions of the waits that might occur during transient data VSAM I/O processing, see“Resource type Any_MRCB” on page 212 and “Resource type MRCB_xxx” on page 212).
The reason for this type of wait is best illustrated by example, as follows:
1. Task #1 issues a transient data request that requires access to an intrapartition queue. Before therequest can be serviced, task #1 must be assigned a transient data I/O buffer that is not currentlybeing used by any other task.
I/O buffers each contain a copy of a control interval (CI) from a data set. Each CI contains records thatcorrespond to elements in an intrapartition queue. A search is made to see if the CI required for task#1 is already in one of the I/O buffers. If it is, that I/O buffer can be used to service the request made
212 CICS TS for z/OS: Troubleshooting CICS
by task #1, and no VSAM I/O is involved. If it is not, task #1 is allocated any buffer, so the required CIcan be read in. The current contents of the buffer is overwritten.
An I/O buffer can have a R/O (read only) status or a R/W (read/write) status. If the buffer that isallocated to task #1 has R/W status, it contains a copy of a CI that has been updated by some othertask, but not yet written back to the data set. Before the buffer can be used by task #1, the CI itcontains must be preserved by writing it back to the data set.
2. A request now arrives from task #2, and the request requires the CI that is currently being written tothe data set. No two buffers can contain the same CI, so task #2 is made to wait on resource typeMRCB_xxx until the outcome of the VSAM I/O is known.
If VSAM I/O was successful, task #2 is resumed and assigned some other I/O buffer.
If VSAM I/O was unsuccessful, task #2 can use the I/O buffer that already contains the CI it needs.
CICS system task waitsFrom an analysis of trace, you could have evidence that a CICS system task is in a wait state. You mighthave seen the task suspended on a SUSPEND call to the dispatcher, but with no corresponding RESUMEcall. Alternatively, by looking at the dispatcher task summary in a formatted CICS system dump, you mightsee that a CICS system task is waiting.
Note: You cannot get online information about waiting system tasks from CEMT INQ TASK or EXECCICS INQUIRE TASK.
If a system task is in a wait state, and there is a system error preventing it from resuming, contact yourIBM Support Center. However, do not assume that there is a system error unless you have other evidencethat the system is malfunctioning. Other possibilities are:
• Some system tasks are intended to wait for long periods while they wait for work to do. ModuleDFHSMSY of storage manager domain, for example, can stay suspended for minutes, or even hours, innormal operation. Its purpose is to clean up storage when significant changes occur in the amount beingused, and that might happen only infrequently in a production system running well within its plannedcapacity.
• System tasks perform many I/O operations, and they are subject to constraints like string availabilityand volume and data set locking. In the case of tape volumes, the tasks can also be dependent onoperator action while new volumes are mounted.
If, in addition to the waiting system task, you think you have enough evidence that shows there is asystem error, contact your IBM Support Center.
FEPI waitsThis section outlines the CICS waits that FEPI issues.
Table 19 on page 213 shows the points at which FEPI issues CICS waits:
Table 19. FEPI waits
Resource name Resource type Wait type Description
FEPI_RQE ADAPTER WAIT_MVS Issued in the FEPI adapter when a FEPIcommand is passed to the ResourceManager for processing. Ends when theResource Manager has processed therequest.
SZRDP FEPRM WAIT_MVS Issued in the FEPI Resource Managerwhen it has no work to do. Endswhen work arrives (from either theFEPI adapter or a z/OS CommunicationsServer exit).
Chapter 6. Dealing with the problem 213
It is possible for a FEPI_RQE wait to be outstanding for a long time, such as when awaiting a flow from theback-end system that is delayed due to network traffic. It is recommended that you do not cancel tasksthat are waiting at this point; to do so could lead to severe application problems.
An SZRDP wait is generated when the FEPI Resource Manager is idle. Consequently, the SZ TCB is alsoinactive. On lightly loaded systems, this occurs frequently.
If the Resource Manager abends, then any active CICS FEPI transactions are left waiting on the FEPI_RQEresource. Because the Resource Manager is absent, these waits never get posted, so the transactionssuspend. You must issue a CEMT SET TASK FORCEPURGE command to remove these suspendedtransactions from the system.
Recovery manager waitsThis section describes waits associated with the CICS recovery manager (RM).
Resource type RMCLIENTIf a task is suspended with a resource type of RMCLIENT, the recovery manager is trying to call a clientwhich has not yet registered or set its gate. Clients register with the recovery manager and set their gatesduring CICS initialization, so the suspended task should be resumed by the time CICS initialization iscomplete.
If such a task does remain suspended for a long time after CICS initialization completes, there is probablyan error in CICS. Contact your IBM Support Center.
Resource type RMUOWOBJ• If a task is suspended with a resource type of RMUOWOBJ and a resource name of LOGMOVE, the
recovery manager is trying to log data for a unit of work while an activity keypoint which is moving theUOW’s log data is in progress. The suspended task should be resumed when the activity keypoint taskcompletes the move of the UOW’s log data.
If a task remains suspended for a long time with a resource type of RMUOWOBJ and a resource name ofLOGMOVE, try to discover why the activity keypoint task (CSKP) is not completing.
• If a task is suspended with a resource type of RMUOWOBJ and a resource name of EXISTENC, therecovery manager is trying to delete a unit of work while an activity keypoint is in progress. Thesuspended task should be resumed when the activity keypoint task finishes working with the UOW.
If a task remains suspended for a long time with a resource type of RMUOWOBJ and a resource name ofEXISTENC, try to discover why the activity keypoint task (CSKP) is not completing.
Waiting to call ESMA CICS region limits the number of tasks that can call the external security manager (ESM) in parallel forauthentication. The reason for this is to prevent a problem from occurring when there is a temporary delayin the ESM. When a temporary delay in the ESM occurs, there will be a build-up of requests waiting for theESM, causing CICS to reach the MAXTASK limit. Because such requests will use non-CICS-managed 24-bitstorage, the build-up of requests might also result in shortage of non-CICS-managed 24-bit storage andcause CICS to abend.
Tasks will go into a wait state against resource type XSPSWVFY until a request completes.
There are XS statistics that indicate the current and peak number of requests waiting. If you see a largenumber of tasks waiting, this might indicate a problem in the ESM or in an associated security component.
214 CICS TS for z/OS: Troubleshooting CICS
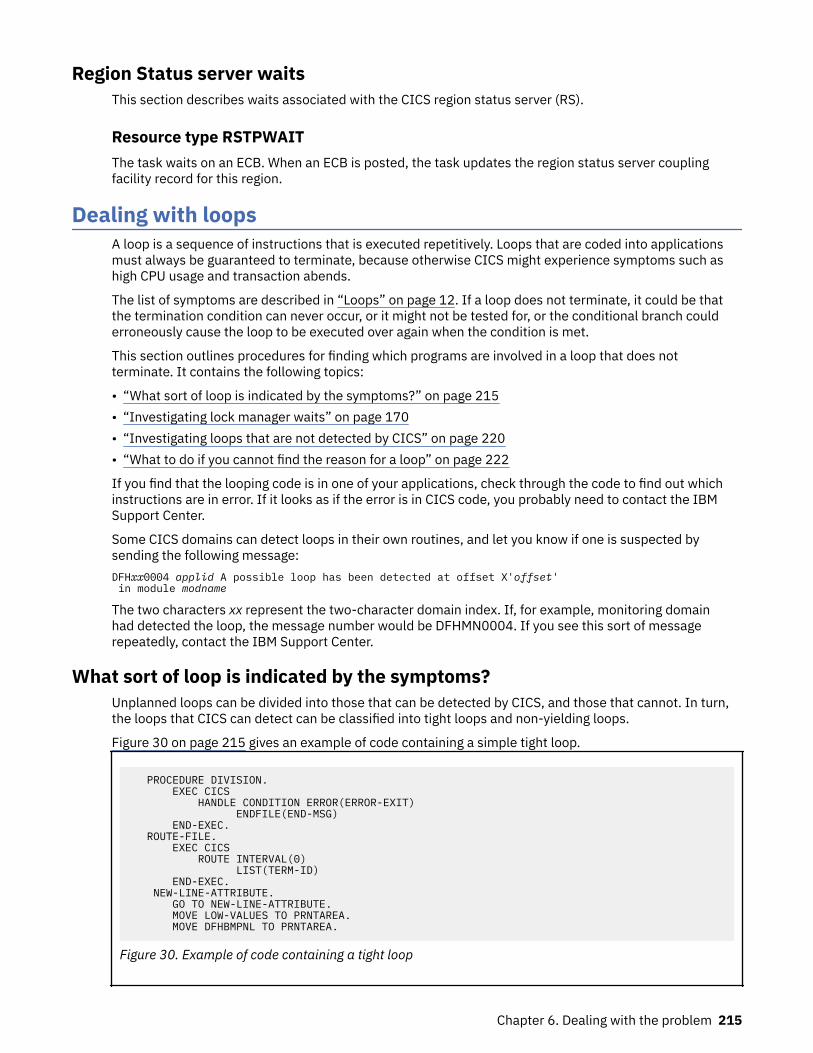
Region Status server waitsThis section describes waits associated with the CICS region status server (RS).
Resource type RSTPWAITThe task waits on an ECB. When an ECB is posted, the task updates the region status server couplingfacility record for this region.
Dealing with loopsA loop is a sequence of instructions that is executed repetitively. Loops that are coded into applicationsmust always be guaranteed to terminate, because otherwise CICS might experience symptoms such ashigh CPU usage and transaction abends.
The list of symptoms are described in “Loops” on page 12. If a loop does not terminate, it could be thatthe termination condition can never occur, or it might not be tested for, or the conditional branch coulderroneously cause the loop to be executed over again when the condition is met.
This section outlines procedures for finding which programs are involved in a loop that does notterminate. It contains the following topics:
• “What sort of loop is indicated by the symptoms?” on page 215• “Investigating lock manager waits” on page 170• “Investigating loops that are not detected by CICS” on page 220• “What to do if you cannot find the reason for a loop” on page 222
If you find that the looping code is in one of your applications, check through the code to find out whichinstructions are in error. If it looks as if the error is in CICS code, you probably need to contact the IBMSupport Center.
Some CICS domains can detect loops in their own routines, and let you know if one is suspected bysending the following message:DFHxx0004 applid A possible loop has been detected at offset X'offset' in module modname
The two characters xx represent the two-character domain index. If, for example, monitoring domainhad detected the loop, the message number would be DFHMN0004. If you see this sort of messagerepeatedly, contact the IBM Support Center.
What sort of loop is indicated by the symptoms?Unplanned loops can be divided into those that can be detected by CICS, and those that cannot. In turn,the loops that CICS can detect can be classified into tight loops and non-yielding loops.
Figure 30 on page 215 gives an example of code containing a simple tight loop.
PROCEDURE DIVISION. EXEC CICS HANDLE CONDITION ERROR(ERROR-EXIT) ENDFILE(END-MSG) END-EXEC. ROUTE-FILE. EXEC CICS ROUTE INTERVAL(0) LIST(TERM-ID) END-EXEC. NEW-LINE-ATTRIBUTE. GO TO NEW-LINE-ATTRIBUTE. MOVE LOW-VALUES TO PRNTAREA. MOVE DFHBMPNL TO PRNTAREA.
Figure 30. Example of code containing a tight loop
Chapter 6. Dealing with the problem 215
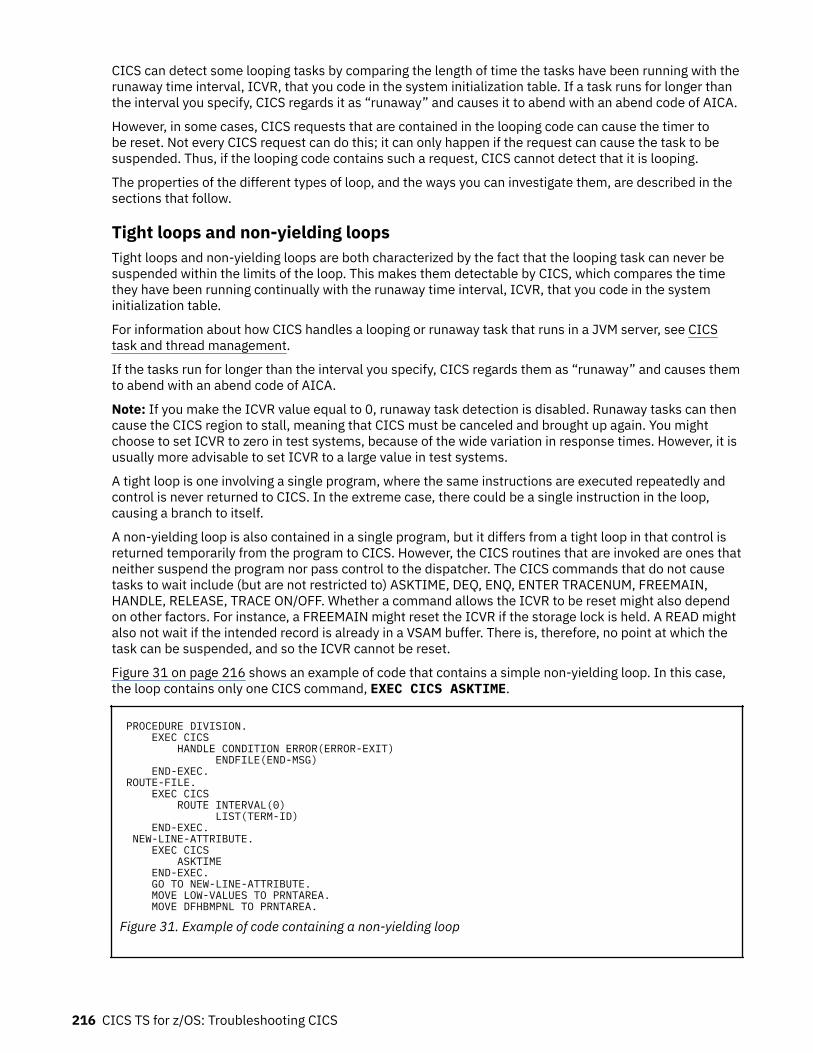
CICS can detect some looping tasks by comparing the length of time the tasks have been running with therunaway time interval, ICVR, that you code in the system initialization table. If a task runs for longer thanthe interval you specify, CICS regards it as “runaway” and causes it to abend with an abend code of AICA.
However, in some cases, CICS requests that are contained in the looping code can cause the timer tobe reset. Not every CICS request can do this; it can only happen if the request can cause the task to besuspended. Thus, if the looping code contains such a request, CICS cannot detect that it is looping.
The properties of the different types of loop, and the ways you can investigate them, are described in thesections that follow.
Tight loops and non-yielding loopsTight loops and non-yielding loops are both characterized by the fact that the looping task can never besuspended within the limits of the loop. This makes them detectable by CICS, which compares the timethey have been running continually with the runaway time interval, ICVR, that you code in the systeminitialization table.
For information about how CICS handles a looping or runaway task that runs in a JVM server, see CICStask and thread management.
If the tasks run for longer than the interval you specify, CICS regards them as “runaway” and causes themto abend with an abend code of AICA.
Note: If you make the ICVR value equal to 0, runaway task detection is disabled. Runaway tasks can thencause the CICS region to stall, meaning that CICS must be canceled and brought up again. You mightchoose to set ICVR to zero in test systems, because of the wide variation in response times. However, it isusually more advisable to set ICVR to a large value in test systems.
A tight loop is one involving a single program, where the same instructions are executed repeatedly andcontrol is never returned to CICS. In the extreme case, there could be a single instruction in the loop,causing a branch to itself.
A non-yielding loop is also contained in a single program, but it differs from a tight loop in that control isreturned temporarily from the program to CICS. However, the CICS routines that are invoked are ones thatneither suspend the program nor pass control to the dispatcher. The CICS commands that do not causetasks to wait include (but are not restricted to) ASKTIME, DEQ, ENQ, ENTER TRACENUM, FREEMAIN,HANDLE, RELEASE, TRACE ON/OFF. Whether a command allows the ICVR to be reset might also dependon other factors. For instance, a FREEMAIN might reset the ICVR if the storage lock is held. A READ mightalso not wait if the intended record is already in a VSAM buffer. There is, therefore, no point at which thetask can be suspended, and so the ICVR cannot be reset.
Figure 31 on page 216 shows an example of code that contains a simple non-yielding loop. In this case,the loop contains only one CICS command, EXEC CICS ASKTIME.
PROCEDURE DIVISION. EXEC CICS HANDLE CONDITION ERROR(ERROR-EXIT) ENDFILE(END-MSG) END-EXEC. ROUTE-FILE. EXEC CICS ROUTE INTERVAL(0) LIST(TERM-ID) END-EXEC. NEW-LINE-ATTRIBUTE. EXEC CICS ASKTIME END-EXEC. GO TO NEW-LINE-ATTRIBUTE. MOVE LOW-VALUES TO PRNTAREA. MOVE DFHBMPNL TO PRNTAREA.
Figure 31. Example of code containing a non-yielding loop
216 CICS TS for z/OS: Troubleshooting CICS
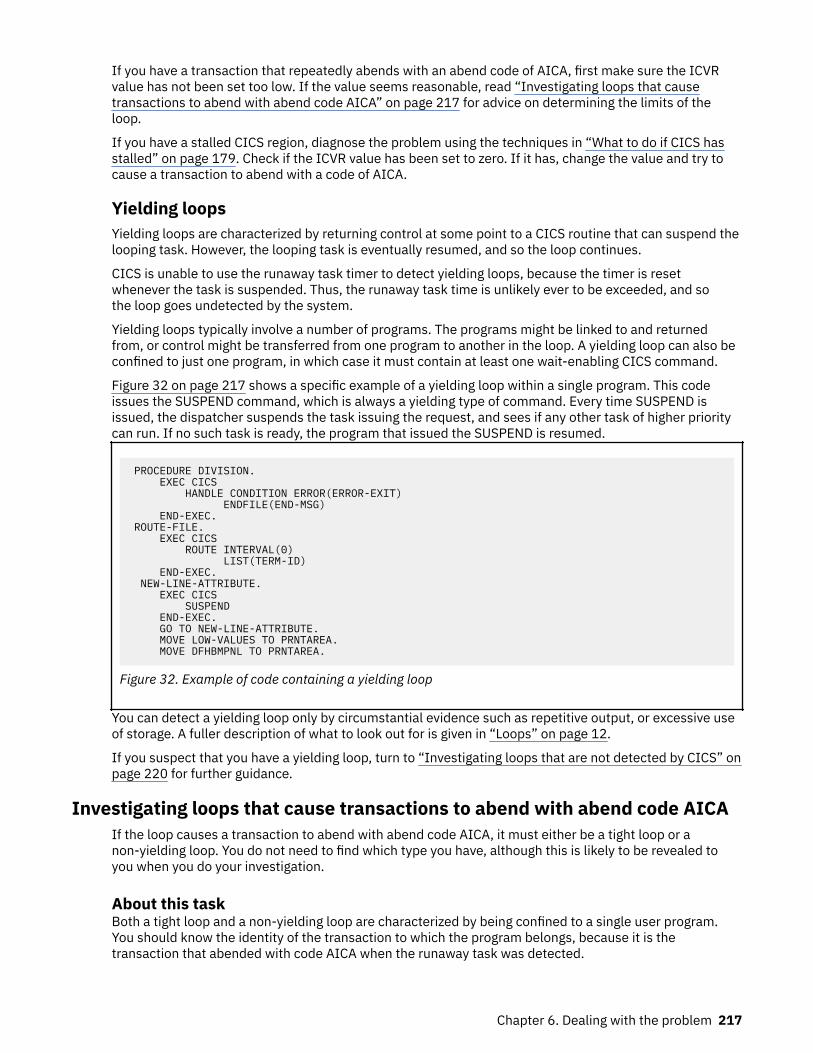
If you have a transaction that repeatedly abends with an abend code of AICA, first make sure the ICVRvalue has not been set too low. If the value seems reasonable, read “Investigating loops that causetransactions to abend with abend code AICA” on page 217 for advice on determining the limits of theloop.
If you have a stalled CICS region, diagnose the problem using the techniques in “What to do if CICS hasstalled” on page 179. Check if the ICVR value has been set to zero. If it has, change the value and try tocause a transaction to abend with a code of AICA.
Yielding loopsYielding loops are characterized by returning control at some point to a CICS routine that can suspend thelooping task. However, the looping task is eventually resumed, and so the loop continues.
CICS is unable to use the runaway task timer to detect yielding loops, because the timer is resetwhenever the task is suspended. Thus, the runaway task time is unlikely ever to be exceeded, and sothe loop goes undetected by the system.
Yielding loops typically involve a number of programs. The programs might be linked to and returnedfrom, or control might be transferred from one program to another in the loop. A yielding loop can also beconfined to just one program, in which case it must contain at least one wait-enabling CICS command.
Figure 32 on page 217 shows a specific example of a yielding loop within a single program. This codeissues the SUSPEND command, which is always a yielding type of command. Every time SUSPEND isissued, the dispatcher suspends the task issuing the request, and sees if any other task of higher prioritycan run. If no such task is ready, the program that issued the SUSPEND is resumed.
PROCEDURE DIVISION. EXEC CICS HANDLE CONDITION ERROR(ERROR-EXIT) ENDFILE(END-MSG) END-EXEC. ROUTE-FILE. EXEC CICS ROUTE INTERVAL(0) LIST(TERM-ID) END-EXEC. NEW-LINE-ATTRIBUTE. EXEC CICS SUSPEND END-EXEC. GO TO NEW-LINE-ATTRIBUTE. MOVE LOW-VALUES TO PRNTAREA. MOVE DFHBMPNL TO PRNTAREA.
Figure 32. Example of code containing a yielding loop
You can detect a yielding loop only by circumstantial evidence such as repetitive output, or excessive useof storage. A fuller description of what to look out for is given in “Loops” on page 12.
If you suspect that you have a yielding loop, turn to “Investigating loops that are not detected by CICS” onpage 220 for further guidance.
Investigating loops that cause transactions to abend with abend code AICAIf the loop causes a transaction to abend with abend code AICA, it must either be a tight loop or anon-yielding loop. You do not need to find which type you have, although this is likely to be revealed toyou when you do your investigation.
About this taskBoth a tight loop and a non-yielding loop are characterized by being confined to a single user program.You should know the identity of the transaction to which the program belongs, because it is thetransaction that abended with code AICA when the runaway task was detected.
Chapter 6. Dealing with the problem 217
Procedure1. Get the documentation you need.2. Look at the evidence.3. Identify the loop, using information from the trace table and transaction dump.4. Determine the reason for the loop.
ResultsUse the following information to complete the steps above.
Getting the documentation you need
Before you beginWhen investigating loops that cause transactions to abend AICA, you need the CICS system dumpaccompanying the abend. System dumping must be enabled for dump code AICA.
About this taskYou can use the system dump to find out:
• Whether the loop is in your user code or in CICS code• If the loop is in your user code, the point at which the loop was entered.
It is also useful to have trace running, as trace can help you to identify the point in your program wherelooping started. If you have a non-yielding loop, it can probably also show you some instructions in theloop.
A tight loop is unlikely to contain many instructions, and you might be able to capture all the evidenceyou need from the record of events in the internal trace table. A non-yielding loop may contain moreinstructions, depending on the EXEC CICS commands it contains, but you might still be able to capturethe evidence you need from the record of events in the internal trace table. If you find that it is not bigenough, direct tracing to the auxiliary trace destination instead.
Procedure1. You need to trace CICS system activity selectively, to ensure that most of the data you obtain is
relevant to the problem. Set up the tracing like this:a) Select level-1 special tracing for AP domain, and for the EXEC interface program (EI).b) Select special tracing for just the task that has the loop, and disable tracing for all other tasks by
turning the main system trace flag off.You can find guidance about setting up these tracing options in Using CICS trace.
2. Start the task, and wait until it abends AICA.3. Format the CICS system dump with formatting keywords KE and TR, to get the kernel storage areas
and the internal trace table.(See “Formatting system dumps” on page 42.)
ResultsYou now have the documentation you need to find the loop.
218 CICS TS for z/OS: Troubleshooting CICS
Looking at the evidenceOnce you have collected the necessary documentation, use the following guidance to analyze theinformation you have gathered.
Procedure1. Look first at the kernel task summary.
The runaway task is flagged “*YES*” in the ERROR column. The status of the task is shown as“***Running**”.
2. Use the kernel task number for the looping task to find its linkage stack.
• If a user task is looping, DFHAPLI, a transaction manager program, should be near the top of thestack. You are likely to find other CICS modules at the top of the stack that have been invoked inresponse to the abend. For example, those associated with taking the dump.
• If you find any program or subroutine above DFHAPLI that has not been invoked in response to theerror, it is possible that CICS code, or the code of another program, has been looping.
ResultsIf you find that the loop is within CICS code, you need to contact the IBM Support Center. Make sure youkeep the dump, because the Support Center staff need it to investigate the problem.
If the kernel linkage stack entries suggest that the loop is in your user program, you next need to identifythe loop.
Identifying the loopTo identify loops in user programs, you can look in the transaction dump or you can use the trace table.
Procedure• To identify a loop by using the transaction dump, use the following steps:
a) Find the program status word (PSW), and see whether it points into your program.This is likely to be the case if you have a tight loop, and it should lead you to an instruction withinthe loop.
b) Use the module index at the end of the formatted dump to find the module name of the nextinstruction.If the instruction address is not in your code, it is less useful for locating the loop. However, tryto identify the module that contains the instruction, because it is probably the one that was calledduring the execution of a CICS request made within the loop. If the PSW address is not contained inone of these areas, another program was probably executing on behalf of CICS when the runawaytask timer expired.
Note: It is possible that the loop is in a module owned by CICS or another product, and yourprogram is not responsible for it. If the loop is in CICS code, contact the IBM Support Center.
c) If the PSW points to a module outside your application program, find the address of the return pointin your program from the contents of register 14 in the appropriate register save area.The return address will lie within the loop, if the loop is not confined to system code.
d) When you have located a point within the loop, work through the source code and try to find thelimits of the loop.
• To identify a loop by using the trace table, use the following steps:a) Go to the last entry in the internal trace table, and work backwards until you get to an entry for
point ID AP 1942.The trace entry should have been made when recovery was entered after the transaction abendedAICA.
Chapter 6. Dealing with the problem 219
b) Make a note of the task number, so you can check that any other trace entries you read relate to thesame abended task.
c) Look at the entries preceding AP 1942. In particular, look for trace entries with the point ID AP00E1.These entries should have been made either just before the loop was entered (for a tight loop), orwithin the loop itself (for a non-yielding loop). Entries with a point ID of AP 00E1 are made on entryto the EXEC interface program (DFHEIP) whenever your program issues an EXEC CICS command,and again on exit from the EXEC interface program. Field B gives you the value of EIBFN, whichidentifies the specific command that was issued.
d) When you have identified the value of EIBFN, use the function code list in Function codes of EXECCICS commands to identify the command that was issued.
e) For trace entries made on exit from DFHEIP, field A gives you the response code from the request.Look carefully at any response codes - they could provide the clue to the loop.Has the program been designed to deal with every possible response from DFHEIP? Could theresponse code you see explain the loop?
If you see a repeating pattern of trace points for AP 00E1, you have a non-yielding loop. If you canmatch the repeating pattern to statements in the source code for your program, you have identified thelimits of the loop.
If you see no repeating pattern of trace points for AP 00E1, it is likely that you have a tight loop. Thelast entry for AP 00E1 (if there is one) should have been made from a point just before the programentered the loop. You might be able to recognize the point in the program where the request wasmade, by matching trace entries with the source code of the program.
Finding the reason for the loopWhen you have identified the limits of the loop, you need to find the reason why the loop occurred.
Assuming you have the trace, and EI level-1 tracing has been done, ensure that you can explain why eachEIP entry is there. Verify that the responses are as expected.
A good place to look for clues to loops is immediately before the loop sequence, the first time it isentered. Occasionally, a request that results in an unexpected return code can trigger a loop. However,you usually can only see the last entry before the loop if you have CICS auxiliary or GTF trace running,because the internal trace table is likely to wrap before the AICA abend occurs.
Investigating loops that are not detected by CICSYou probably suspect that you have a loop through circumstantial evidence, and CICS has failed to detectit. You might, for example, see some sort of repetitive output, or statistics might show an excessivenumber of I/O operations or requests for storage. These types of symptom can indicate that you have ayielding loop.
About this taskThe nature of the symptoms might indicate which transaction is involved, but you probably need to usetrace to define the limits of the loop. Use auxiliary trace to capture the trace entries, to ensure that theentire loop is captured in the trace data. If you use internal trace, there is a danger that wraparound willprevent you from seeing the whole loop.
Procedure1. Use the CETR transaction to set up the following tracing options.
You can use the transaction dynamically, on the running CICS system. For guidance about using theCETR transaction, see Using CICS trace.a) Select level-1 special tracing for every component. You need to capture as much trace information
for the task as possible, because you do not yet know what functions are involved in the loop.
220 CICS TS for z/OS: Troubleshooting CICS
b) Set all standard tracing off, by setting the main system trace flag off.c) Select special tracing for just the task containing the loop.d) Set the auxiliary tracing status to STARTED, and the auxiliary switch status to ALL.
As CETR allows you to control trace dynamically, you do not need to start tracing until the task isrunning and the symptoms of looping appear.
These steps ensure that you get all level-1 trace points traced for just the task you suspect of looping,the trace entries being sent to the auxiliary trace destination.
2. When you have captured the trace data, you need to purge the looping task from the system.a) Use the CEMT INQ TASK command to find the number of the task.b) Purge the task using either the CEMT SET TASK PURGE or the CEMT SET TASK FORCEPURGE
command.
Note: The use of FORCEPURGE is, in general, not recommended, because it can causeunpredictable system problems. For example, it causes task storage areas to be released, includingI/O areas, without notifying any components that might be accessing them. If the FORCEPURGEdtask was waiting for input, such an area might be written to after it is released. The storage mighteven be in use by another task when the input occurs.
This causes the transaction to abend, and to produce a transaction dump of the task storage areas.3. In addition to the auxiliary trace data and the transaction dump, get the source listings of all the
programs in the transaction.
ResultsThe trace data and the program listings should enable you to identify the limits of the loop. You need thetransaction dump to examine the user storage for the program. The data you find there could provide theevidence you need to explain why the loop occurred.
Identifying the loop
About this taskNote: The PSW is of no value in locating loops that are not detected by CICS. The contents of the PSW areunpredictable, and the PSW is not formatted in the transaction dump for ATCH abends.
Procedure1. Examine the trace table, and try to detect the repeating pattern of trace entries.
If you cannot do so straightaway, remember that many different programs might be involved, and theloop could be large. Another possibility is that you might not have captured the entire loop in the tracedata set. This could be because the loop did not have time to complete one cycle before you purgedthe transaction, or the trace data sets might have wrapped before the loop was complete.
Consider also the possibility that you might not be dealing with a loop, and the symptoms you saw aredue to something else - poor application design, for example.
2. If you are able to detect a pattern, you should be able to identify the corresponding pattern ofstatements in your source code.
Finding the reason for the loop
Before you begin
About this task
Chapter 6. Dealing with the problem 221
Procedure1. Look carefully at the statements contained in the loop. Does the logic of the code suggest why the loop
occurred?2. If not, examine the contents of data fields in the task user storage.
Look particularly for unexpected response codes, and null values when finite values are expected.Programs can react unpredictably when they encounter these conditions, unless they are tested forand handled accordingly.
Example
What to do next
What to do if you cannot find the reason for a loopIf you cannot find the reason for a non-yielding or a yielding loop using the techniques outlined above,there are two more approaches that you can adopt.
About this task
Procedure1. Use the interactive tools that CICS provides.
• Use the execution diagnostic facility (CEDF) to look at the various parts of your program and storageat each interaction with CICS. If you suspect that some unexpected return code might have causedthe problem, CEDF is a convenient way of investigating the possibility.
• Use CECI and CEBR to examine the status of files and queues during the execution of your program.Programs can react unpredictably if records and queue entries are not found when these conditionsare not tested for and handled accordingly.
2. Modify the program, and execute it again.If the program is extremely complex, or the data path difficult to follow, you might need to insertadditional statements into the source code.
• Adding extra ASKTIME commands allow you to use EDF and inspect the program at more points.• Request dumps from within your program, and insert user trace entries, to help you find the reason
for the loop.
Dealing with performance problemsWhen you have a performance problem, you might be able to find that it is characterized by one of thefollowing symptoms, each of which represents a particular processing bottleneck.
If so, turn directly to the relevant section:
1. Some tasks fail to get attached to the transaction manager—see “Why tasks fail to get attached to thetransaction manager” on page 224.
2. Some tasks fail to get attached to the dispatcher—see “Why tasks fail to get attached to thedispatcher” on page 224.
3. Some tasks get attached to the dispatcher, but fail to get dispatched—see “Why tasks fail to get aninitial dispatch” on page 226.
4. Tasks get attached to the dispatcher and then run and complete, but take a long time to do so—see“Why tasks take a long time to complete” on page 228.
If you are only aware that performance is poor, and you have not yet found which of these is relevant toyour system, read “Finding the bottleneck” on page 223.
222 CICS TS for z/OS: Troubleshooting CICS
There is a quick reference section at the end of this section (“A summary of performance bottlenecks,symptoms, and causes” on page 228) that summarizes bottlenecks, symptoms, and actions that youshould take.
Finding the bottleneckFour potential bottlenecks can be identified for user tasks, and three for CICS system tasks.
About this taskThe bottlenecks are:
• Attach to transaction manager (user tasks only)• Attach to dispatcher (user tasks and system tasks)• Initial dispatch (user tasks and system tasks)• Dispatch, suspend and resume cycle (user tasks and system tasks)
Procedure1. Determine which bottleneck is causing your performance problem.
Each bottleneck is affected by a different set of system parameters and you might find that adjustingthe parameters solves the problem.
2. If performance is particularly poor for any of the tasks in your system, you might be able to captureuseful information about them with the command CEMT INQ TASK.However, tasks usually run more quickly than you can inquire on them, even though there might be aperformance problem. You can use performance class monitoring or tracing to get the information yourequire.
Initial attach to the transaction managerIf a task has not been attached to the transaction manager, you cannot get any information about itsstatus online.
CEMT INQ TASK returns a response indicating that the task is not known. If the task has not already runand ended, this response means that it has not been attached to the transaction manager.
Guidance about finding out why tasks take a long time to get an initial attach to the transaction manager isgiven in “Why tasks fail to get attached to the transaction manager” on page 224.
Initial attach to the dispatcherIf a task has been attached to the transaction manager, but has not yet been attached to the dispatcher,CEMT INQ TASK shows it to be ‘SUSPENDED’ on a resource type of MXT or TCLASS. These are the onlyvalid reasons why a user task, having been attached to the transaction manager, would not be attached tothe dispatcher.
If CEMT INQ TASK returns anything other than this, the task is not waiting to be attached to thedispatcher. However, consider whether the MXT limit might be causing the performance problem, eventhough individual tasks are not being held up long enough for you to use CEMT INQ TASK on them. Insuch a case, use monitoring and tracing to find just how long tasks are waiting to be attached to thedispatcher.
Guidance about finding whether the MXT limit is to blame for the performance problem is given in “MXTsummary” on page 175.
Chapter 6. Dealing with the problem 223
Initial dispatchA task can be attached to the dispatcher, but then take a long time to get an initial dispatch.
In such a case, CEMT INQ TASK returns a status of ‘Dispatchable’ for the task. If you keep getting thisresponse and the task fails to do anything, it is likely that the task you are inquiring on is not getting itsfirst dispatch.
The delay might be too short for you to use CEMT INQ TASK in this way, but still long enough to cause aperformance problem. In such a case, use tracing or performance class monitoring for the task, either ofwhich would tell you how long the task had to wait for an initial attachment to the dispatcher.
If you think your performance problem could be due to tasks taking a long time to get a first dispatch,read “Why tasks fail to get an initial dispatch” on page 226.
The dispatch, suspend, and resume cycleIf performance is poor and tasks are getting attached and dispatched, the problem lies with the dispatch,suspend and resume cycle.
Tasks run, but the overall performance is poor. If you are able to show that tasks are getting attached andthen dispatched, read “Why tasks take a long time to complete” on page 228.
Why tasks fail to get attached to the transaction managerA task might fail to get attached to the transaction manager for one of the following reasons:
1. The interval specified on an EXEC CICS START command might not have expired, or the timespecified might not have been reached, or there might be some error affecting interval control.
Guidance about investigating these possibilities is given in “Investigating interval control waits” onpage 152. You need to consider doing this only if INTERVAL or TIME was specified on the STARTcommand.
2. The terminal specified on an EXEC CICS START command might not be available. It could becurrently OUTSERVICE, or executing some other task. You can check its status using CEMT INQTERMINAL, and perhaps take some remedial action.
Remember that several tasks might be queued on the terminal, some of which might require operatorinteraction. In such a case, the transaction to be started might not get attached to the transactionmanager for a considerable time.
3. A remote system specified on an EXEC CICS START command might not be available, or an errorcondition might have been detected in the remote system. In such a case, the error would not bereported back to the local system.
You can use CEMT INQ TERMINAL to inquire on the status of the remote system.
Why tasks fail to get attached to the dispatcherTwo valid reasons why a user task might fail to get an initial attach to the dispatcher are that the systemhas reached the maximum number of tasks (MXT) limit or the task belongs to a transaction class that hasreached its MAXACTIVE limit.
For a system task, there may not be enough storage to build the new task. This sort of problem is morelikely to occur near peak system load times.
Is the MXT limit preventing tasks from getting attached?Before the transaction manager can attach a user task to the dispatcher, the task must first qualify underthe MXT (maximum tasks in the system) and transaction class limits. If a task is not getting attached, it ispossible that one or both of these values is too small.
You might be able to use CEMT INQ TASK to show that a task is failing to get attached becauseof the MXT or transaction class limits. If you cannot use CEMT because the task is held up for tooshort a time, you can look at either the transaction global statistics, transaction class statistics, or the
224 CICS TS for z/OS: Troubleshooting CICS
CICS performance-class monitoring records. Another option is to use CICS system tracing. For moreinformation on setting MXT, see Setting the maximum task specification (MXT) .
Using transaction manager statisticsYou can use the transaction global statistics and transaction class statistics to see whether the MXT andtransaction class limits are adversely affecting performance.
About this taskTo find out how often the MXT and transaction class limits are reached, look at the transaction globalstatistics and transaction class statistics. You can compare the number of times these limits are reachedwith the total number of transactions and see whether the values set for the limits are adversely affectingperformance.
Procedure1. To gather statistics relating to the number of times that the MXT or transaction class limits are
reached, you need to use, at the start of the run, the command CEMT PERFORM STATISTICS RECORD(or your site replacement) with the keywords TRANSACTION and TRANCLASS.
CEMT PERFORM STATISTICS RECORD [TRANCLASS TRANSACTION]
The statistics are gathered and recorded in the SMF data set.2. Format this data set by using the statistics utility program, DFHSTUP.
You might find the following DFHSTUP control parameters useful:
SELECT APPLID=COLLECTION TYPE=REQTIME START= ,STOP=DATE START= ,STOP=
If you correctly code these control parameters, you avoid formatting information that is unnecessary atthis point. For information about the DFHSTUP utility, see Statistics utility program (DFHSTUP).
ResultsIf MXT is never reached, or reached only infrequently, it is not affecting performance. If MXT is reachedfor 5% of transactions, this might have a noticeable effect on performance. When the ratio reaches 10%,there is likely to be a significant effect on performance, and this could account for some tasks taking along time to get a first attach.
What to do nextConsider revising the MXT and transaction class values if the statistics indicate that they are affectingperformance. For guidance about the performance considerations when you set these limits, see CICSmonitoring facility: Performance and tuning .
Using CICS monitoringYou can use monitoring information to find out how long an individual task waits to be attached to thedispatcher.
Monitoring produces performance class records (if performance class monitoring is active) for each taskthat is executing or has executed in the CICS region. Performance class records contain a breakdownof the delays incurred in dispatching a task, part of which is the impact on a task of the MXT limit andtransaction class limits.
For further information on the data produced by CICS monitoring, see Monitoring.
Chapter 6. Dealing with the problem 225
Using traceYou can use trace if you want to find out just how long an individual task waits to be attached to thedispatcher.
About this taskIf you do not want to do any other tracing, internal trace is probably a suitable destination for traceentries. Because the task you are interested in is almost inactive, very few trace entries are generated.
Procedure1. Select special tracing for the transaction associated with the task, and turn off all standard tracing by
setting the main system trace flag off.2. Define as special trace points the level-1 trace points for transaction manager (XM), and for the CICS
task controlling the facility that initiates the task, such as terminal control (TC).Make sure that no other trace points are defined as special. For guidance about setting up thesetracing options, see Using CICS trace.
3. When you have selected the options, start tracing to the internal trace table and attempt to initiate thetask.
4. When the task starts, get a system dump using the command CEMT PERFORM SNAP. Format the dumpusing the keyword TR, to get the internal trace table.
5. Look for the trace entry showing terminal control calling the transaction manager with a request toattach the task, and the subsequent trace entry showing the transaction manager calling dispatcherdomain with a request to attach the task.The time stamps on the two trace entries tell you the time that elapsed between the two events. Thatis equal to the time taken for the task to be attached.
What to do next
Why tasks fail to get an initial dispatchWhen a task is past the transaction class and MXT barriers, it can be attached to the dispatcher. It mustthen wait for its initial dispatch. If tasks are made to wait for a relatively long time for their first dispatch,you will probably notice the degradation in the performance of the system.
You can get evidence that tasks are waiting too long for a first dispatch from performance classmonitoring. If you do find this to be the case, you need to investigate the reasons for the delay. Tocalculate the initial dispatch delay incurred by a task use the following fields from the performance-classmonitoring record:
DSPDELAY = First dispatch delayTCLDELAY = Transaction Class delayMXTDELAY = MXT delay
Using the above names:
Delay in dispatcher = DSPDELAY - (TCLDELAY + MXTDELAY)
If the value you calculate is significantly greater than 0, the dispatcher could not dispatch the taskimmediately.
The following factors influence the length of time that a task must wait before getting its first dispatch:
• The priority of the task• Whether the system is becoming short on storage• Whether the system is short on storage
226 CICS TS for z/OS: Troubleshooting CICS
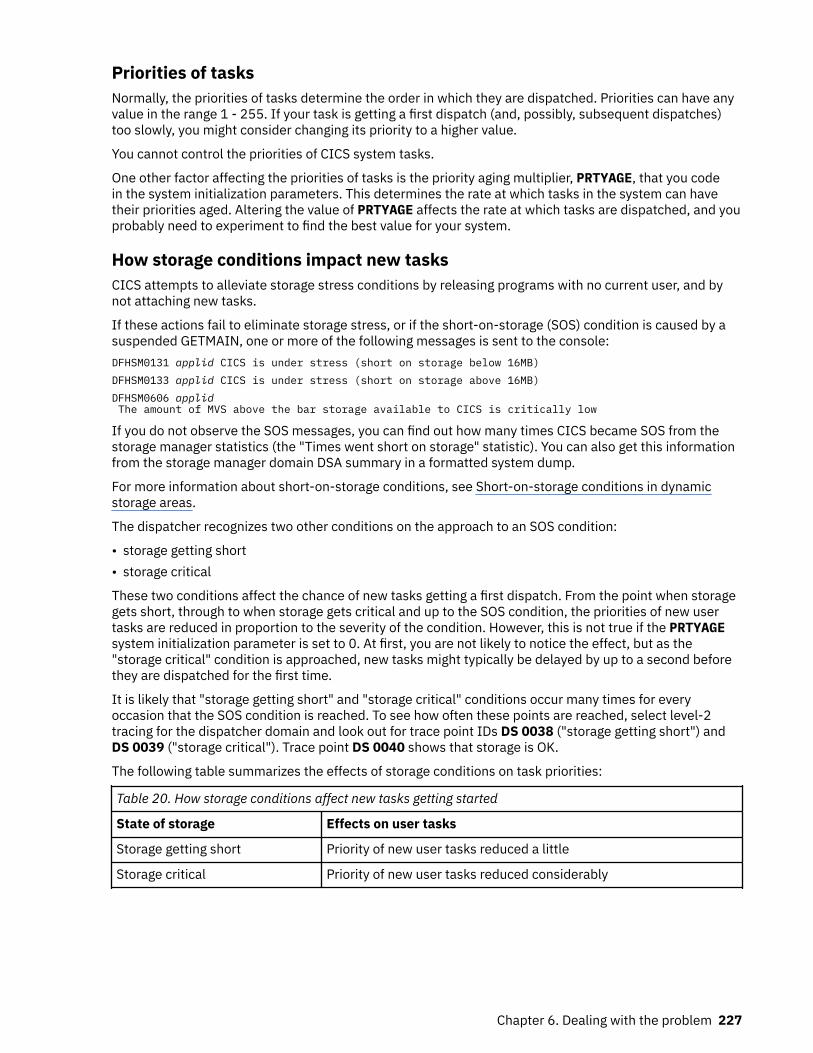
Priorities of tasksNormally, the priorities of tasks determine the order in which they are dispatched. Priorities can have anyvalue in the range 1 - 255. If your task is getting a first dispatch (and, possibly, subsequent dispatches)too slowly, you might consider changing its priority to a higher value.
You cannot control the priorities of CICS system tasks.
One other factor affecting the priorities of tasks is the priority aging multiplier, PRTYAGE, that you codein the system initialization parameters. This determines the rate at which tasks in the system can havetheir priorities aged. Altering the value of PRTYAGE affects the rate at which tasks are dispatched, and youprobably need to experiment to find the best value for your system.
How storage conditions impact new tasksCICS attempts to alleviate storage stress conditions by releasing programs with no current user, and bynot attaching new tasks.
If these actions fail to eliminate storage stress, or if the short-on-storage (SOS) condition is caused by asuspended GETMAIN, one or more of the following messages is sent to the console:DFHSM0131 applid CICS is under stress (short on storage below 16MB)DFHSM0133 applid CICS is under stress (short on storage above 16MB)DFHSM0606 applid The amount of MVS above the bar storage available to CICS is critically low
If you do not observe the SOS messages, you can find out how many times CICS became SOS from thestorage manager statistics (the "Times went short on storage" statistic). You can also get this informationfrom the storage manager domain DSA summary in a formatted system dump.
For more information about short-on-storage conditions, see Short-on-storage conditions in dynamicstorage areas.
The dispatcher recognizes two other conditions on the approach to an SOS condition:
• storage getting short• storage critical
These two conditions affect the chance of new tasks getting a first dispatch. From the point when storagegets short, through to when storage gets critical and up to the SOS condition, the priorities of new usertasks are reduced in proportion to the severity of the condition. However, this is not true if the PRTYAGEsystem initialization parameter is set to 0. At first, you are not likely to notice the effect, but as the"storage critical" condition is approached, new tasks might typically be delayed by up to a second beforethey are dispatched for the first time.
It is likely that "storage getting short" and "storage critical" conditions occur many times for everyoccasion that the SOS condition is reached. To see how often these points are reached, select level-2tracing for the dispatcher domain and look out for trace point IDs DS 0038 ("storage getting short") andDS 0039 ("storage critical"). Trace point DS 0040 shows that storage is OK.
The following table summarizes the effects of storage conditions on task priorities:
Table 20. How storage conditions affect new tasks getting started
State of storage Effects on user tasks
Storage getting short Priority of new user tasks reduced a little
Storage critical Priority of new user tasks reduced considerably
Chapter 6. Dealing with the problem 227
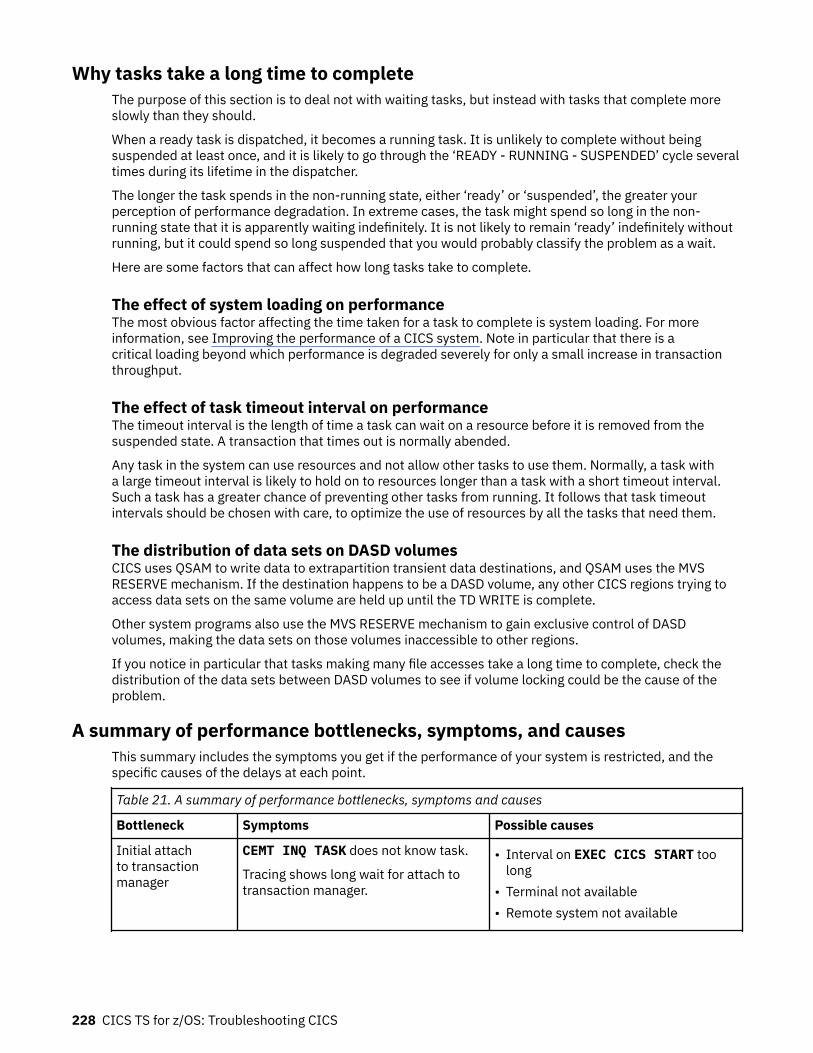
Why tasks take a long time to completeThe purpose of this section is to deal not with waiting tasks, but instead with tasks that complete moreslowly than they should.
When a ready task is dispatched, it becomes a running task. It is unlikely to complete without beingsuspended at least once, and it is likely to go through the ‘READY - RUNNING - SUSPENDED’ cycle severaltimes during its lifetime in the dispatcher.
The longer the task spends in the non-running state, either ‘ready’ or ‘suspended’, the greater yourperception of performance degradation. In extreme cases, the task might spend so long in the non-running state that it is apparently waiting indefinitely. It is not likely to remain ‘ready’ indefinitely withoutrunning, but it could spend so long suspended that you would probably classify the problem as a wait.
Here are some factors that can affect how long tasks take to complete.
The effect of system loading on performanceThe most obvious factor affecting the time taken for a task to complete is system loading. For moreinformation, see Improving the performance of a CICS system. Note in particular that there is acritical loading beyond which performance is degraded severely for only a small increase in transactionthroughput.
The effect of task timeout interval on performanceThe timeout interval is the length of time a task can wait on a resource before it is removed from thesuspended state. A transaction that times out is normally abended.
Any task in the system can use resources and not allow other tasks to use them. Normally, a task witha large timeout interval is likely to hold on to resources longer than a task with a short timeout interval.Such a task has a greater chance of preventing other tasks from running. It follows that task timeoutintervals should be chosen with care, to optimize the use of resources by all the tasks that need them.
The distribution of data sets on DASD volumesCICS uses QSAM to write data to extrapartition transient data destinations, and QSAM uses the MVSRESERVE mechanism. If the destination happens to be a DASD volume, any other CICS regions trying toaccess data sets on the same volume are held up until the TD WRITE is complete.
Other system programs also use the MVS RESERVE mechanism to gain exclusive control of DASDvolumes, making the data sets on those volumes inaccessible to other regions.
If you notice in particular that tasks making many file accesses take a long time to complete, check thedistribution of the data sets between DASD volumes to see if volume locking could be the cause of theproblem.
A summary of performance bottlenecks, symptoms, and causesThis summary includes the symptoms you get if the performance of your system is restricted, and thespecific causes of the delays at each point.
Table 21. A summary of performance bottlenecks, symptoms and causes
Bottleneck Symptoms Possible causes
Initial attachto transactionmanager
CEMT INQ TASK does not know task.
Tracing shows long wait for attach totransaction manager.
• Interval on EXEC CICS START toolong
• Terminal not available• Remote system not available
228 CICS TS for z/OS: Troubleshooting CICS
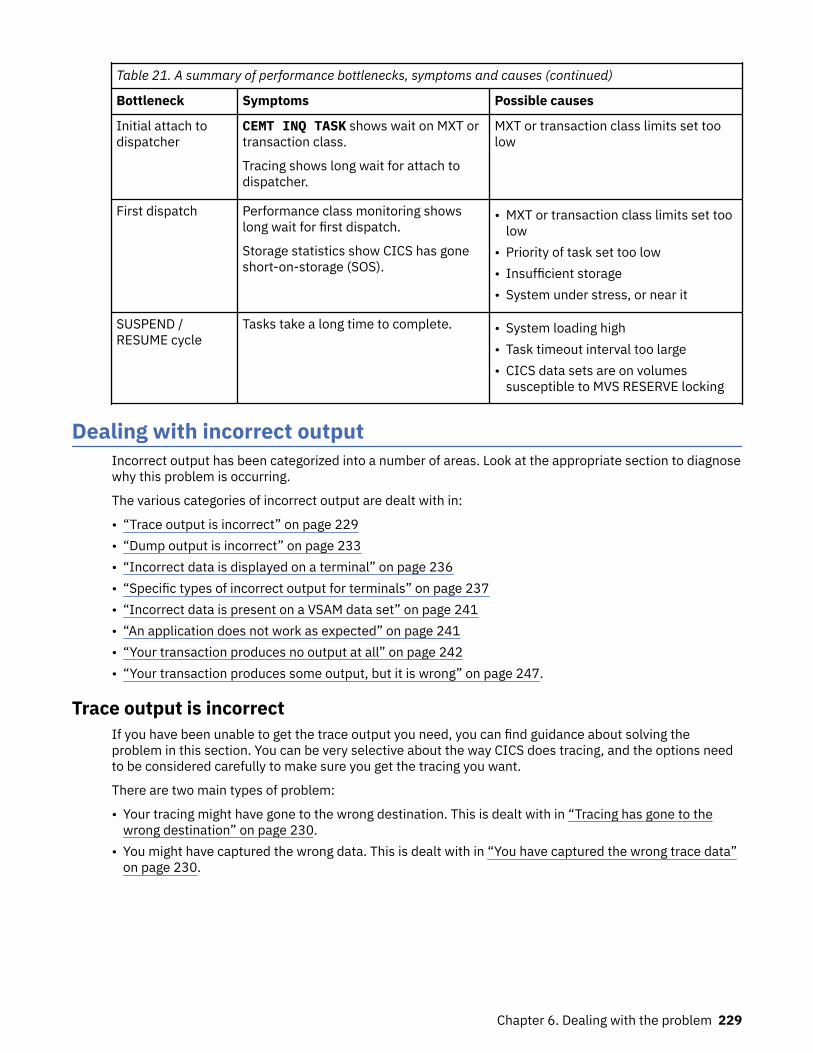
Table 21. A summary of performance bottlenecks, symptoms and causes (continued)
Bottleneck Symptoms Possible causes
Initial attach todispatcher
CEMT INQ TASK shows wait on MXT ortransaction class.
Tracing shows long wait for attach todispatcher.
MXT or transaction class limits set toolow
First dispatch Performance class monitoring showslong wait for first dispatch.
Storage statistics show CICS has goneshort-on-storage (SOS).
• MXT or transaction class limits set toolow
• Priority of task set too low• Insufficient storage• System under stress, or near it
SUSPEND /RESUME cycle
Tasks take a long time to complete. • System loading high• Task timeout interval too large• CICS data sets are on volumes
susceptible to MVS RESERVE locking
Dealing with incorrect outputIncorrect output has been categorized into a number of areas. Look at the appropriate section to diagnosewhy this problem is occurring.
The various categories of incorrect output are dealt with in:
• “Trace output is incorrect” on page 229• “Dump output is incorrect” on page 233• “Incorrect data is displayed on a terminal” on page 236• “Specific types of incorrect output for terminals” on page 237• “Incorrect data is present on a VSAM data set” on page 241• “An application does not work as expected” on page 241• “Your transaction produces no output at all” on page 242• “Your transaction produces some output, but it is wrong” on page 247.
Trace output is incorrectIf you have been unable to get the trace output you need, you can find guidance about solving theproblem in this section. You can be very selective about the way CICS does tracing, and the options needto be considered carefully to make sure you get the tracing you want.
There are two main types of problem:
• Your tracing might have gone to the wrong destination. This is dealt with in “Tracing has gone to thewrong destination” on page 230.
• You might have captured the wrong data. This is dealt with in “You have captured the wrong trace data”on page 230.
Chapter 6. Dealing with the problem 229
Tracing has gone to the wrong destinationIn terms of destinations, CICS system trace entries belong to one of three groups - internal tracing,auxiliary tracing and GTF tracing.
• CICS trace entries, other than CICS z/OS Communications Server (SNA) exit traces and exceptiontraces, go to any of the following trace destinations that are currently active:
– The internal trace table– The current auxiliary trace data set– The GTF trace data set.
• CICS Communications Server exit traces that are not exception traces go only to the GTF trace data set,if GTF tracing is active.
• CICS Communications Server exit traces that are exception traces go to the internal trace table and, ifGTF tracing is active, to the GTF trace data set.
• All other CICS exception traces go to the internal trace table and to any other trace destination that iscurrently active.
For CICS system tracing other than exception traces and CICS Communications Server exit traces, youcan inquire on the current destinations and set them to what you want using the CETR transaction.
CETR - trace control illustrates what you might see on a CETR screen, and indicates how you can changethe options by overtyping the fields. From that illustration you can see that, from the options in effect,a normal trace call results in a trace entry being written to the GTF trace destination. If an exceptionalcondition occurred, the corresponding exception trace entry would be made both to the GTF data set andto the internal trace table, even though the internal trace status is STOPPED.
Note that the main system trace flag value only determines whether standard tracing is to be done for atask (see Table 8 on page 85). It has no effect on any other tracing status.
Internal tracinggoes to the internal trace table in main storage. The internal trace table is used as a buffer in whichthe trace entries are built no matter what the destination. It, therefore, always contains the mostrecent trace entries, even if its status is STOPPED—if at least one of the other trace destinations iscurrently STARTED.
Auxiliary tracinggoes to one of two data sets, if the auxiliary tracing status is STARTED. The current data set can beselected from the CETR screen by overtyping the appropriate field with A or B, as required. Whathappens when the data set becomes full is determined by the auxiliary switch status. Make surethat the switch status is correct for your system, or you might lose the trace entries you want, eitherbecause the data set is full or because they are overwritten.
GTF tracinggoes to the GTF trace data set. GTF tracing must be started under MVS, using the TRACE=USR option,before the trace entry can be written. Note that if GTF tracing has not been started in this way, the GTFtracing status can be shown as STARTED on the CETR screen and yet no trace entries are made, andno error condition reported.
You have captured the wrong trace dataThere are several ways in which you might capture the wrong trace data. The following points are somesets of symptoms that suggest specific areas for attention
1. You are not getting the right task tracing, because:
• Tasks do not trace the right trace points for some components.• Transactions are not being traced when they are started from certain terminals.• There is no tracing for some terminals that interest you.
If you are aware of symptoms like these, it is likely that you do not have the right task tracing optionsset up. Turn to “You are not getting the correct task tracing” on page 231 for further guidance.
230 CICS TS for z/OS: Troubleshooting CICS
2. You are getting the wrong amount of data traced, because:
• Tracing is not being done for all the components you want, so you are getting too little information.• Tracing is being done for too many components, so you are getting more information than you want.• You are not getting the right trace points (level-1 or level-2) traced for some of the components.• Tasks are not tracing the component trace points you want. This evidence suggests CICS component
tracing selectivity is at fault.
If your observations fit any of these descriptions, turn to “You are not getting the correct componenttracing” on page 231 for guidance about fixing the problem.
3. The data you want is missing entirely from the trace table.
If you have this sort of problem, turn to “The entries you want are missing from the trace table” onpage 231 for guidance about finding the cause.
It is worth remembering that the more precisely you can define the trace data you need for any sort ofproblem determination, the more quickly you are likely to get to the cause of the problem.
You are not getting the correct task tracingIf you are not getting the correct task tracing, use the CETR transaction to check the transaction andterminal tracing options, and if necessary change them.
You can define whether you want standard or special CICS tracing for specific transactions, and standardor special tracing for transactions started at specific terminals. You can also suppress tracing fortransactions and terminals that do not interest you. The type of task tracing that you get (standard orspecial) depends on the type of tracing for the corresponding transaction-terminal pair, in the way shownin Table 7 on page 84.
You can deduce from the table that it is possible to get standard tracing when a transaction is initiated atone terminal, and special tracing when it is initiated from another terminal. This raises the possibility ofsetting up inappropriate task tracing options, so the trace entries that interest you - for example, when thetransaction is initiated from a particular terminal - are not made.
You are not getting the correct component tracingIf you are not getting the correct component tracing, use the CETR transaction to inquire on the currentcomponent tracing options and, if necessary, to change them.
1. check that you are only tracing components that interest you. If some other components are beingtraced, change the options so they are no longer traced for standard tracing or for special tracing, asappropriate.
2. check that the right tracing levels have been defined for standard tracing and special tracing.Remember that, whenever a task that has standard tracing is running, the trace points that youhave defined as standard for a component are traced whenever that component is invoked. Similarly,special trace points are traced whenever special task tracing is being done.
Table 8 on page 85 illustrates the logic used to determine whether a trace call is to be made from atrace point.
3. If you are satisfied that the component tracing selectivity is correct but you are still getting too muchor too little data, read “You are not getting the correct task tracing” on page 231.
The entries you want are missing from the trace tableRead this section if one or more entries you were expecting were missing entirely from the trace table.
These cases are considered:
• The trace data you wanted did not appear at the expected time.• The earliest trace entry in the table was time-stamped after the activity that interested you took place.• You could not find the exception trace entry you were expecting.
Chapter 6. Dealing with the problem 231
If the trace entry did not appear at the expected time, consider these possibilities:
• If tracing for some components or some tasks did not appear, you might not have set up the tracingselectivity correctly. For guidance about checking and correcting the options, see “You are not gettingthe correct task tracing” on page 231 and “You are not getting the correct component tracing” on page231.
• If you were using GTF tracing, it might not have been active at the time the trace entry should have beenmade. GTF tracing must be started under MVS using the TRACE=USR option.
• If CICS z/OS Communications Server exit trace entries (point IDs AP FCxx) were missing, rememberthat they are only ever made to the GTF trace data set.
• If you attempted to format the auxiliary trace data set selectively by transaction or terminal, and traceentries for the transaction or terminal were missing entirely, it could be that you did not capture thecorresponding transaction attach (point ID XM 1102) trace entry. This could occur if the main systemtrace flag is switched off and the transaction status is set to special, or if you do not have KC level 1tracing selected.
When you select trace entries by specifying TRANID or TERMID parameters in the DFHTU730 tracecontrol statements, DFHTU730 searches for any transaction attach trace entries that contain thespecified TRANID or TERMID. It then formats any associated trace entries, identified by the TASKIDfound in the transaction attach trace entry data.
It follows that you must have KC level-1 tracing selected for the task in question at the time it isattached if you want to format the auxiliary trace data set selectively by transaction or terminal.
For more details about trace formatting using DFHTU730, see Trace utility print program (DFHTUnnn).
If the options were correct and tracing was running at the right time, but the trace entries you wanteddid not appear, it is likely that the task you were interested in did not run or did not invoke the CICScomponents you expected. Examine the trace carefully in the region in which you expected the task toappear, and attempt to find why it was not invoked. Remember also that the task tracing options mightnot, after all, have been appropriate.
If the earliest trace entry was later than the event that interested you, and tracing was running at theright time, it is likely that the trace table wrapped round and earlier entries were overwritten.
Internal trace always wraps when it is full. Try using a bigger trace table, or direct the trace entries to theauxiliary trace or GTF trace destinations.
Note: Changing the size of the internal trace table during a run causes the data that was already thereto be destroyed. In such a case, the earliest data would have been recorded after the time when youredefined the table size.
Auxiliary trace switches from one data set to the next when it is full, if the autoswitch status is NEXT orALL.
If the autoswitch status is NEXT, the two data sets can fill up but earlier data cannot be overwritten. Yourmissing data might be in the initial data set, or the events you were interested in might have occurredafter the data sets were full. In the second case, you can try increasing the size of the auxiliary trace datasets.
If the autoswitch status is ALL, you might have overwritten the data you wanted. The initial data set isreused when the second extent is full. Try increasing the size of the auxiliary trace data sets.
GTF trace always wraps when the data set is full. If this was your trace destination, try increasing the sizeof the GTF trace data set.
If you cannot find an exception trace entry that you expected, bear in mind that exception tracing isalways done to the internal trace table irrespective of the status of any other type of tracing. So, if youmissed it in your selected trace destination, try looking in the internal trace table.
232 CICS TS for z/OS: Troubleshooting CICS
Dump output is incorrectRead this section if you do not get the dump output you expect.
The things that can go wrong are:
• The dump does not seem to relate to you CICS region.• You do not get a dump when an abend occurs.• Some dump IDs are missing from the sequence of dumps in the dump data set.• You do not get the correct data when you format a system dump.
The sections that follow give guidance about resolving each of these problems in turn.
The dump does not seem to relate to your CICS regionIf you have experienced this problem, it is likely that you have dumped the wrong CICS region. It shouldnot occur if you are running a single region.
If you invoked the dump from the MVS console using the MVS MODIFY command, check that youspecified the correct job name. It must be the job used to start the CICS region in which you areinterested.
If you invoked the dump from the CICS main terminal using CEMT PERFORM SNAP, check that you wereusing the main terminal for the correct region. This is more likely to be a problem if you have an SNAnetwork, because that allows you to switch a single physical SNA LU between the different CICS regions.
You do not get a dump when an abend occursRead this section if you are experiencing any of these problems:
• A transaction abended, but you do not get a transaction dump.• A transaction abended and you get a transaction dump, but you do not get the system dump you want at
the same time.• A system abend occurred, but you do not get a system dump.
There are, in general, two reasons why dumps might not be taken:
• Dumping is suppressed because of the way the dumping requirements for the CICS region were defined.The valid ways that dumping can be suppressed are described in detail in the sections that follow.
• A system error could have prevented a dump from being taken. Some of the possibilities are:
– No transaction or system dump data sets were available.– An I/O error occurred on a transaction or a system dump data set.– The system dump data set was being written to by another region, and the DURETRY time was
exceeded.– There was insufficient space to write the dump in the dump data set. In such a case, you might have
obtained a partial dump.
Depending on the areas that are missing from the dump, the dump formatting program mightsubsequently be able to format the data that is there, or it might not be able to format the dataat all.
For each of these system errors, there should be a message explaining what has happened. Use theCMAC transaction or see CICS messages for guidance about the action to take.
How dumping can be suppressedIf you do not get a dump when an abend occurred, and there was no system error, the dumping that yourequired must somehow have been suppressed.
There are several levels at which dumping can be suppressed:
• System dumps can be globally suppressed.
Chapter 6. Dealing with the problem 233
• System dumps and transaction dumps can be suppressed for specific transactions.• System dumps can be suppressed for specific dump codes from a dump domain global user exit
program.• System dumps and transaction dumps can be suppressed by dump table options.
You need to find out which of these types of dump suppression apply to your system before you decidewhat remedial action to take.
Global suppression of system dumpingSystem dumping can be suppressed globally in two ways:
• By coding a value of NO for the DUMP parameter in the system initialization table.• By using the system programming command EXEC CICS SET SYSTEM DUMPING, with a CVDA value
of NOSYSDUMP.
If system dumping has been suppressed globally by either of these means, any system dumpingrequirements specified in the transaction dump table and the system dump table are overridden.
You can inquire whether system dumping has been suppressed globally by using the EXEC CICSINQUIRE SYSTEM DUMPING system programming command. If necessary, you can cancel the globalsuppression of system dumping using EXEC CICS SET SYSTEM DUMPING with a CVDA value ofSYSDUMP.
Suppression of system dumping from a global user exit programSystem dumping can be suppressed for specific dump codes by an XDUREQ user exit program. Forprogramming information about the XDUREQ global user exit program, see How ESM exit programsaccess CICS-related information.
If an exit program that suppresses system dumping for a particular dump code is enabled, systemdumping is not done for that dump code. This overrides any system dumping requirement specified forthe dump code in the dump table.
The exit program can suppress system dumps only while it is enabled. If you want the system dumpingsuppression to be canceled, you can issue an EXEC CICS DISABLE command for the program. Anysystem dumping requirements specified in the dump table then take effect.
Suppression of dumping for individual transactionsTransaction dumps taken when a transaction abends can be suppressed for individual transactions byusing the EXEC CICS SET TRANSACTION DUMPING system programming command, or by using theDUMP attribute on the RDO definition of the transaction. None of the dumping requirements specified inthe transaction dump table would be met if a transaction for which dumping is suppressed were to abend.
You can use EXEC CICS INQUIRE TRANSACTION DUMPING to see whether dumping has beensuppressed for a transaction, and then use the corresponding SET command to cancel the suppression ifnecessary.
Suppression of dumping by dump table optionsIf transaction dumping and system dumping are not suppressed by any of the preceding mechanisms, thedump table options determine whether or not you get a dump for a particular dump code.
You can inquire on transaction and system dump code attributes using CEMT INQ TRDUMPCODE andCEMT INQ SYDUMPCODE, respectively. You must specify the dump code you are inquiring on.
If you find that the dumping options are not what you want, you can use CEMT SET TRDUMPCODE code orCEMT SET SYDUMPCODE code to change the values of the attributes accordingly.
• If you had no transaction dump when a transaction abended, look first to see if attribute TRANDUMPor NOTRANDUMP is specified for this dump code. The attribute needs to be TRANDUMP if a transactiondump is to be taken.
234 CICS TS for z/OS: Troubleshooting CICS
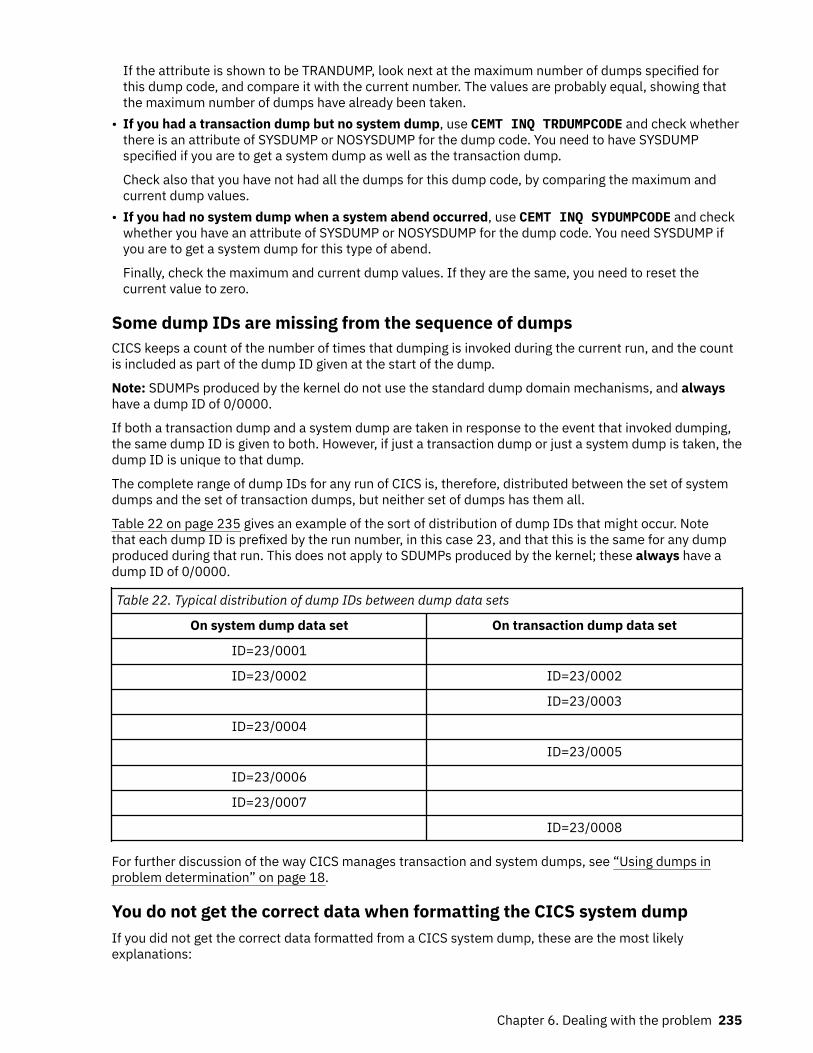
If the attribute is shown to be TRANDUMP, look next at the maximum number of dumps specified forthis dump code, and compare it with the current number. The values are probably equal, showing thatthe maximum number of dumps have already been taken.
• If you had a transaction dump but no system dump, use CEMT INQ TRDUMPCODE and check whetherthere is an attribute of SYSDUMP or NOSYSDUMP for the dump code. You need to have SYSDUMPspecified if you are to get a system dump as well as the transaction dump.
Check also that you have not had all the dumps for this dump code, by comparing the maximum andcurrent dump values.
• If you had no system dump when a system abend occurred, use CEMT INQ SYDUMPCODE and checkwhether you have an attribute of SYSDUMP or NOSYSDUMP for the dump code. You need SYSDUMP ifyou are to get a system dump for this type of abend.
Finally, check the maximum and current dump values. If they are the same, you need to reset thecurrent value to zero.
Some dump IDs are missing from the sequence of dumpsCICS keeps a count of the number of times that dumping is invoked during the current run, and the countis included as part of the dump ID given at the start of the dump.
Note: SDUMPs produced by the kernel do not use the standard dump domain mechanisms, and alwayshave a dump ID of 0/0000.
If both a transaction dump and a system dump are taken in response to the event that invoked dumping,the same dump ID is given to both. However, if just a transaction dump or just a system dump is taken, thedump ID is unique to that dump.
The complete range of dump IDs for any run of CICS is, therefore, distributed between the set of systemdumps and the set of transaction dumps, but neither set of dumps has them all.
Table 22 on page 235 gives an example of the sort of distribution of dump IDs that might occur. Notethat each dump ID is prefixed by the run number, in this case 23, and that this is the same for any dumpproduced during that run. This does not apply to SDUMPs produced by the kernel; these always have adump ID of 0/0000.
Table 22. Typical distribution of dump IDs between dump data sets
On system dump data set On transaction dump data set
ID=23/0001
ID=23/0002 ID=23/0002
ID=23/0003
ID=23/0004
ID=23/0005
ID=23/0006
ID=23/0007
ID=23/0008
For further discussion of the way CICS manages transaction and system dumps, see “Using dumps inproblem determination” on page 18.
You do not get the correct data when formatting the CICS system dumpIf you did not get the correct data formatted from a CICS system dump, these are the most likelyexplanations:
Chapter 6. Dealing with the problem 235
• You did not use the correct dump formatting keywords. If you do not specify any formatting keywords,the whole system dump is formatted. However, if you specify any keywords at all, you must be careful tospecify keywords for all the functional areas you are interested in.
• You used the correct dump formatting keywords, but the dump formatting program was unable toformat the dump correctly because it detected an error. In such a case, you should be able to find adiagnostic error message from the dump formatter.
• A partial dump might have been specified at the MVS level, for example “without LPA”. This requirementwould be recorded in the MVS parameter library.
Incorrect data is displayed on a terminalThere are many reasons why you might get the wrong data displayed, some with system-related causesand some with application-related causes. If you think that it is system-related, read this section for somesuggestions on likely areas in which to start your investigations.
For the present purpose, a terminal is considered to be any device where data can be displayed. It mightbe some unit with a screen, or it could be a printer. Many other types of terminals are recognized by CICS,including remote CICS regions, batch regions, IMS regions and so on, but they are not considered in thissection on incorrect output.
Broadly, there are two types of incorrect output that you might get on a screen, or on a printer:
• The data information is wrong, so unexpected values appear on the screen or in the hard copy from aprinter.
• The layout is incorrect on the screen or in the hard copy. That is, the data is formatted wrongly.
In practice, you may sometimes find it difficult to distinguish between incorrect data information andincorrect formatting. In fact, you seldom need to make this classification when you are debugging thistype of problem.
Sometimes, you might find that a transaction runs satisfactorily at one terminal, but fails to give thecorrect output on another. This is probably due to the different characteristics of the different terminals,and you should find the answer to the problem in the sections that follow.
The preliminary information you need to getBefore you can investigate the reasons why incorrect output is displayed at a terminal, you need to gathersome information about the transaction running at the terminal, and the about terminal itself.
The first things you need to know are:
1. The identity of the transaction associated with the incorrect output.2. For an autoinstalled terminal, the model number, to ensure that you inquire on the correct TERMTYPE.
You can find this from the autoinstall message in the CADL log.
Depending on the symptoms you have experienced, you probably need to examine the PROFILEdefinitions for the transaction, and the TYPETERM definitions for the affected terminal. The attributesmost likely to be of interest are SCRNSIZE for the PROFILE, and ALTSCREEN, ALTPAGE, PAGESIZE,EXTENDEDDS, and QUERY for TYPETERM. Other attributes might also be significant, but the values youfind for the attributes named here can often explain why the incorrect output was obtained.
Tools for debugging terminal output in a z/OS Communications ServerenvironmentAmong the debugging tools you have, two are likely to be of particular use for investigating terminalincorrect output errors in a z/OS Communications Server environment.
These debugging tools are as follows:z/OS Communications Server buffer trace
This is a function of the Communications Server. You need to read the appropriate manual in the z/OSCommunications Server library to find out how to use it.
236 CICS TS for z/OS: Troubleshooting CICS
CICS Communications Server exit traceThis is a function of CICS, and you can control it from the CETR panel.
For information on using tracing in CICS problem determination, see Using CICS trace.
Specific types of incorrect output for terminalsThis section contains some suggestions about what to do for specific types of incorrect output, and whatmight be at fault.
Logon rejection messageIf you get a logon rejection message when you attempt to log on to CICS, it could be that the TYPETERMdefinitions for the terminal are incorrect.
A message recording the failure is written to the CSNE log or, in the case of autoinstall, to the CADL log.
You are likely to get a logon rejection if you attempt to specify anything other than QUERY(NO) for aterminal that does not have the structured query field feature. Note that NO is the default value forTYPETERM definitions that you supply, but YES is the value for TYPETERM definitions that are suppliedwith CICS.
If you have a persistent problem with logon rejection, you can use the z/OS Communications Server buffertrace to find out more about the reasons for the failure.
Unexpected messages and codesIf the “wrong data” is in the form of a message or code that you do not understand, look in theappropriate manual for an explanation of what it means.
Messages that are prefixed by DFH originate from CICS. You can look up messages in CICS messages. Forcodes that appear in the space at the bottom of the screen where status information is displayed, look inthe appropriate guide for the terminal.
The following are examples of common errors that can cause messages or codes to be displayed:
• SCRNSIZE(ALTERNATE) has been specified in a PROFILE, and too many rows have been specified forALTSCREEN and ALTPAGE in the TYPETERM definition for the terminal.
• An application has sent a spurious hex value corresponding to a control character in a data stream. Forexample, X'11' is understood as “set buffer address” by a 3270 terminal, and the values that followare interpreted as the new buffer address. This eventually causes an error code to be displayed.
If you suspect this may be the cause of the problem, check your application code carefully to make sureit cannot send any unintended control characters.
• EXTENDEDDS(YES) has been specified for a device that does not support this feature. In such a case, amessage is sent to the screen, and a message might also be written to the CSMT log.
The default value for EXTENDEDDS is NO, but check to make sure that YES has not been specified if youknow your terminal is not an extended data stream device.
Unexpected appearance of upper and lowercase charactersIf the data displayed on your terminal has unexpectedly been translated into uppercase characters, or ifyou have some lowercase characters when you were expecting uppercase translation, you must look atthe options governing the translation.
These are the significant properties of the various translation options you have:
• The ASIS option for BMS or terminal control specifies that lowercase characters in an input data streamare not to be translated to uppercase.
ASIS overrides the UCTRAN attributes for both TYPETERM and PROFILE definitions. • The UCTRAN attribute of the TYPETERM definition states whether lowercase characters in input data
streams are to be translated to uppercase for terminals with this TYPETERM definition.
Chapter 6. Dealing with the problem 237
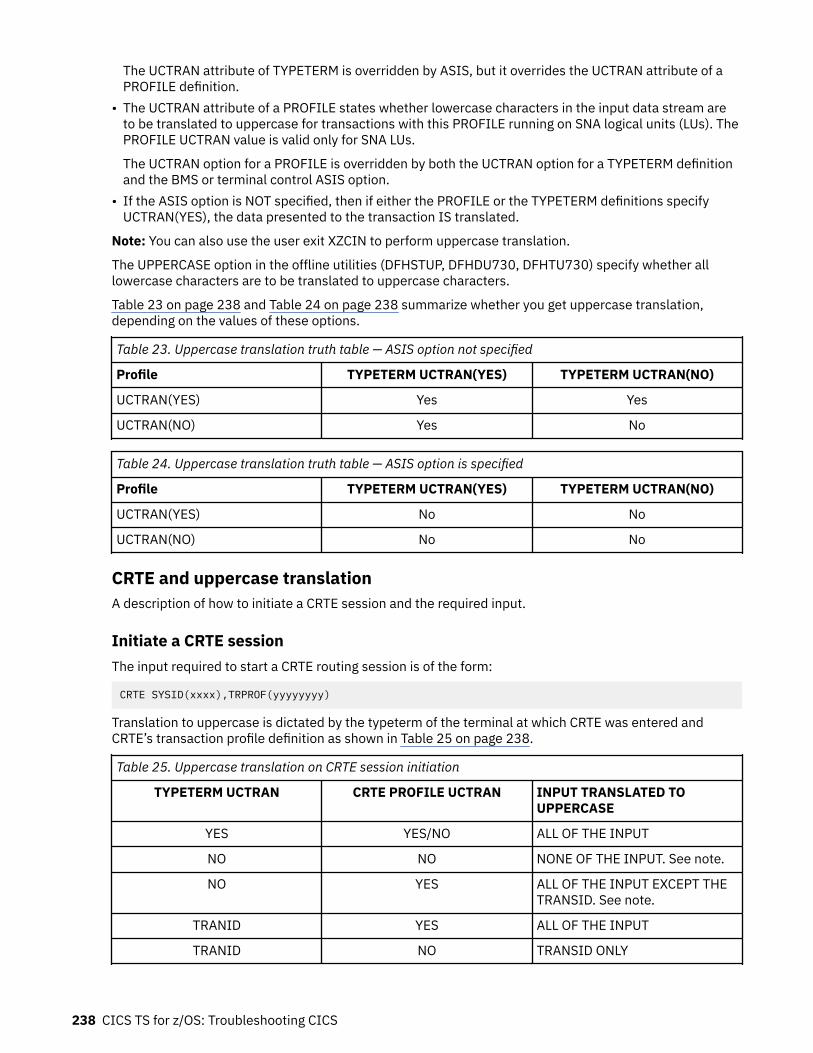
The UCTRAN attribute of TYPETERM is overridden by ASIS, but it overrides the UCTRAN attribute of aPROFILE definition.
• The UCTRAN attribute of a PROFILE states whether lowercase characters in the input data stream areto be translated to uppercase for transactions with this PROFILE running on SNA logical units (LUs). ThePROFILE UCTRAN value is valid only for SNA LUs.
The UCTRAN option for a PROFILE is overridden by both the UCTRAN option for a TYPETERM definitionand the BMS or terminal control ASIS option.
• If the ASIS option is NOT specified, then if either the PROFILE or the TYPETERM definitions specifyUCTRAN(YES), the data presented to the transaction IS translated.
Note: You can also use the user exit XZCIN to perform uppercase translation.
The UPPERCASE option in the offline utilities (DFHSTUP, DFHDU730, DFHTU730) specify whether alllowercase characters are to be translated to uppercase characters.
Table 23 on page 238 and Table 24 on page 238 summarize whether you get uppercase translation,depending on the values of these options.
Table 23. Uppercase translation truth table — ASIS option not specified
Profile TYPETERM UCTRAN(YES) TYPETERM UCTRAN(NO)
UCTRAN(YES) Yes Yes
UCTRAN(NO) Yes No
Table 24. Uppercase translation truth table — ASIS option is specified
Profile TYPETERM UCTRAN(YES) TYPETERM UCTRAN(NO)
UCTRAN(YES) No No
UCTRAN(NO) No No
CRTE and uppercase translationA description of how to initiate a CRTE session and the required input.
Initiate a CRTE sessionThe input required to start a CRTE routing session is of the form:
CRTE SYSID(xxxx),TRPROF(yyyyyyyy)
Translation to uppercase is dictated by the typeterm of the terminal at which CRTE was entered andCRTE’s transaction profile definition as shown in Table 25 on page 238.
Table 25. Uppercase translation on CRTE session initiation
TYPETERM UCTRAN CRTE PROFILE UCTRAN INPUT TRANSLATED TOUPPERCASE
YES YES/NO ALL OF THE INPUT
NO NO NONE OF THE INPUT. See note.
NO YES ALL OF THE INPUT EXCEPT THETRANSID. See note.
TRANID YES ALL OF THE INPUT
TRANID NO TRANSID ONLY
238 CICS TS for z/OS: Troubleshooting CICS
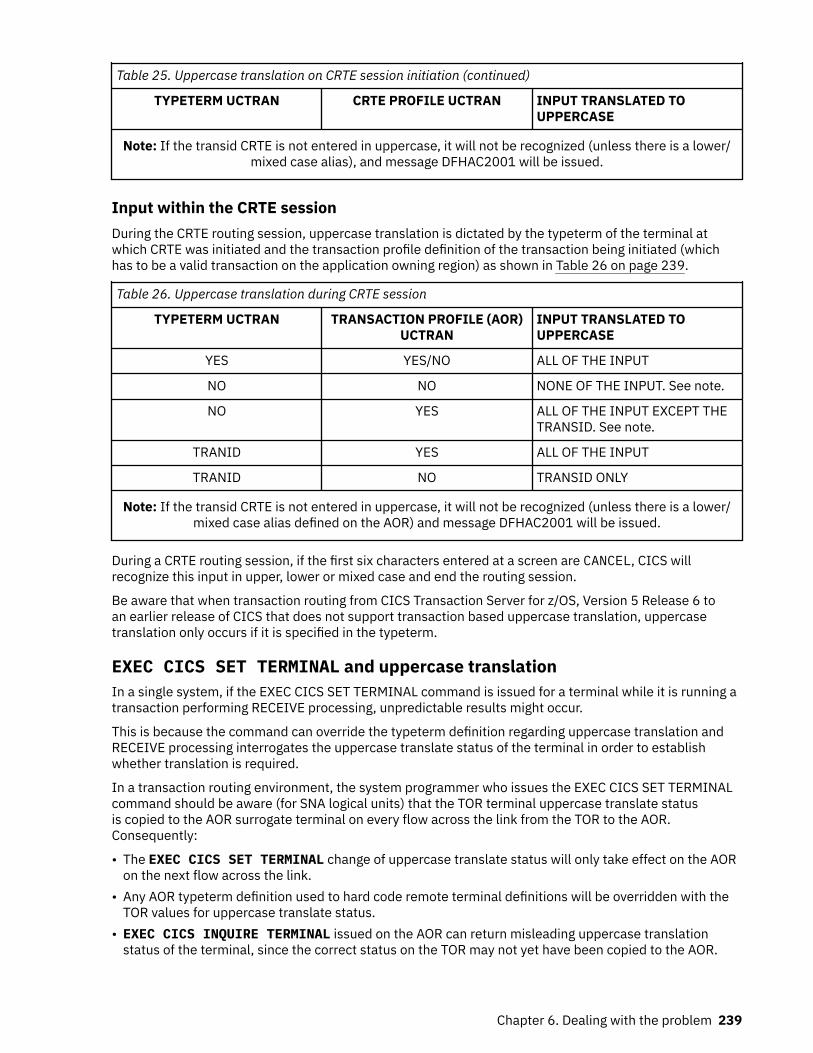
Table 25. Uppercase translation on CRTE session initiation (continued)
TYPETERM UCTRAN CRTE PROFILE UCTRAN INPUT TRANSLATED TOUPPERCASE
Note: If the transid CRTE is not entered in uppercase, it will not be recognized (unless there is a lower/mixed case alias), and message DFHAC2001 will be issued.
Input within the CRTE sessionDuring the CRTE routing session, uppercase translation is dictated by the typeterm of the terminal atwhich CRTE was initiated and the transaction profile definition of the transaction being initiated (whichhas to be a valid transaction on the application owning region) as shown in Table 26 on page 239.
Table 26. Uppercase translation during CRTE session
TYPETERM UCTRAN TRANSACTION PROFILE (AOR)UCTRAN
INPUT TRANSLATED TOUPPERCASE
YES YES/NO ALL OF THE INPUT
NO NO NONE OF THE INPUT. See note.
NO YES ALL OF THE INPUT EXCEPT THETRANSID. See note.
TRANID YES ALL OF THE INPUT
TRANID NO TRANSID ONLY
Note: If the transid CRTE is not entered in uppercase, it will not be recognized (unless there is a lower/mixed case alias defined on the AOR) and message DFHAC2001 will be issued.
During a CRTE routing session, if the first six characters entered at a screen are CANCEL, CICS willrecognize this input in upper, lower or mixed case and end the routing session.
Be aware that when transaction routing from CICS Transaction Server for z/OS, Version 5 Release 6 toan earlier release of CICS that does not support transaction based uppercase translation, uppercasetranslation only occurs if it is specified in the typeterm.
EXEC CICS SET TERMINAL and uppercase translationIn a single system, if the EXEC CICS SET TERMINAL command is issued for a terminal while it is running atransaction performing RECEIVE processing, unpredictable results might occur.
This is because the command can override the typeterm definition regarding uppercase translation andRECEIVE processing interrogates the uppercase translate status of the terminal in order to establishwhether translation is required.
In a transaction routing environment, the system programmer who issues the EXEC CICS SET TERMINALcommand should be aware (for SNA logical units) that the TOR terminal uppercase translate statusis copied to the AOR surrogate terminal on every flow across the link from the TOR to the AOR.Consequently:
• The EXEC CICS SET TERMINAL change of uppercase translate status will only take effect on the AORon the next flow across the link.
• Any AOR typeterm definition used to hard code remote terminal definitions will be overridden with theTOR values for uppercase translate status.
• EXEC CICS INQUIRE TERMINAL issued on the AOR can return misleading uppercase translationstatus of the terminal, since the correct status on the TOR may not yet have been copied to the AOR.
Chapter 6. Dealing with the problem 239
• The processing of RECEIVE requests on the TOR and AOR can interrogate the uppercase translatestatus of the terminal. Therefore unpredictable results can also occur if the system programmer issuesthe EXEC CICS SET TERMINAL command during receive processing.
CICS client virtual terminalIf the code page sent by a client is incorrect, this can lead to the entire screenful of data being incorrect.You must resolve this problem at the client end of operations.
The entire screenful of data might also be incorrect if the bit TCTSK_VIRTUAL_TERMINAL is not set onin the skeleton for the virtual terminal. The bit might have been overwritten, or not turned on when thevirtual terminal was being created during CTIN processing.
Katakana terminals - mixed English and Katakana charactersIf you are using a Katakana terminal, you might see some messages that contain mixed English andKatakana characters.
That is because Katakana terminals cannot display mixed-case output. Uppercase characters in the datastream appear as uppercase English characters, but lowercase characters appear as Katakana characters.If you have any Katakana terminals that are connected to your CICS system, specify MSGCASE=UPPER inthe system initialization table to ensure that messages contain uppercase characters only.
The offline utilities DFHSTUP, DFHDU730, andDFHTU730 have an extra parameter to ensure that alloutput is translated to uppercase.
Data that is displayed incorrectlySuggestions on how to deal with incorrect data values, partially missing data, early data that is overlaid bylater data and data that is formatted incorrectly.
Wrong data values are displayedIf the data values are wrong on the user’s part of the screen (the space above the area used to displaystatus information to the operator), or in the hard copy produced by a printer, it is likely that theapplication is at fault.
Some data is not displayedIf you find that some data is not being displayed, consider these possibilities:
• The SENDSIZE value for the TYPETERM definition could be too large for the device receiving the data.Its receiving buffer could then overflow, with some data being lost.
• SCRNSIZE(ALTERNATE) might be specified in the PROFILE definition for the transaction running at theterminal, while default values for ALTSCREEN and ALTPAGE are allowed in the TYPETERM definition forthe terminal.
The default values for ALTSCREEN and ALTPAGE are 0 rows and 0 columns, so no data could then bedisplayed if SCRNSIZE(ALTERNATE) were specified.
• EXTENDEDDS(YES) is specified for a device that does not support this feature.
Early data is overlaid by later dataEarly data can be overlaid by later data, so that data appears in the wrong order, when the SENDSIZEvalue of the TYPETERM definition is too large for the device receiving the data. This is because the buffercan wrap when it is full, with the surplus data overlaying the first data that was received.
The data is formatted wronglyIncorrect formatting of data can have a wide range of causes, but here are some suggestions of areas thatcan sometimes be troublesome:
240 CICS TS for z/OS: Troubleshooting CICS
• BMS maps are incorrect. • Applications have not been recompiled with the latest maps. • Different numbers of columns have been specified for ALTSCREEN and ALTPAGE in the TYPETERMdefinitions for the terminal. This can lead to unpredictable formatting errors. However, you will not seethem unless SCRNSIZE(ALTERNATE) has been specified in the PROFILE for the transaction running atthe terminal.
• The PAGESIZE values included in the TYPETERM definitions must suit the characteristics of theterminal, or you get formatting errors.
For a screen display, the number of columns specified must be less than or equal to the line width. Fora printer, the number of columns specified must be less than the line width, or else both BMS (if you areusing it) and the printer might provide a new line and you will get extra spacing you do not want.
The default values for PAGESIZE depend on the value you specify for the DEVICE keyword. • If you get extra line feeds and form feeds on your printer, it could be that an application is sending
control characters that are not required because the printer is already providing end of line and end ofform operations.
If your application is handling the buffering of output to a printer, make sure that an “end of message”control character is sent at the end of every buffer full of data. Otherwise, the printer might put the nextdata it receives on a new line.
Incorrect data is present on a VSAM data setIf READ UPDATE is not used, an error can occur because VSAM allows a record to be read by onetransaction while another transaction is updating it.
If the first transaction were to take some action based on the value of the record, the action wouldprobably be erroneous.
For example, in inventory control, a warehouse has 150 items in stock. 100 items are sold to a customer,who is promised delivery within 24 hours. The invoice is prepared, and this causes a transaction to beinvoked that is designed to read the inventory record from a VSAM data set and update it accordingly.
In the meantime, a second customer also asks for 100 items. The salesperson uses a terminal to inquireon the number currently in stock. The “inquire” transaction reads the record that has been read forupdate but not yet rewritten, and returns the information that there are 150 items. This customer, too, ispromised delivery within 24 hours.
Errors of this kind are prevented by the use of READ UPDATE.
An application does not work as expectedIt is not possible to give specific advice on dealing with this sort of problem, but the points and techniquesthat follow should help you to find the area where the failure is occurring.
General points for you to consider1. Make sure you can define exactly what happened, and how this differs from what you expected to
happen.2. Check the commands you are using for accuracy and completeness. For programming information
about EXEC CICS commands, see the CICS command summary. Are any default values the ones youreally want? Does the description of the effect of each command match your expectations?
3. Can you identify a failing sequence of commands? If so, can it be reproduced using CECI?4. Consider the resources required by the application. Are they defined as expected?5. Are the required functions in the failing functional area available in this system?6. For input type requests, does the item exist? You can verify this using offline utilities.7. For output type requests, is the item created? Verify that the before and after images are as expected.
Chapter 6. Dealing with the problem 241
Using traces and dumpsTraces and dumps can give you valuable information about unusual conditions that might be causing yourapplication to work in an unexpected way.
1. If the path through the transaction is indeterminate, insert user trace entries at all the principal points.2. If you know the point in the code where the failure occurs, insert a CICS system dump request
immediately after it.3. Use CETR to select special tracing for the level-1 trace points for all components. Select special tracing
for the failing task only, and disable all standard tracing by setting the main system trace flag off.4. Run the transaction after setting the trace options, and wait until the system dump request is
executed. Format the internal trace table from the dump (formatting keyword TR), and examine thetrace entries before the failure. Look in particular for unusual or unexpected conditions, possibly onesthat the application is not designed to handle.
Your transaction produces no output at allIf your transaction produced no output at all, you need to carry out some preliminary checks beforelooking at the problem in detail. You might be able to find a simple explanation for the failure.
1. Are there any messages explaining why there is no output?
Look carefully in each of the transient data destinations CSMT, CSTL, and CDBC for any messages thatmight relate to the task. You could find one there that explains why you received no output.
If you can find no such message, the next step is to get some information about the status of thetransaction that produced no output, your terminal, and the CICS system.
2. Can you use the terminal where the transaction should have started? See “Can you use the terminalwhere the transaction should have started?” on page 242 for the steps to follow.
3. If you obtained no output and the task is still in the system, it is either waiting for a resource, orlooping. You should get an indication of which of these two conditions is the most likely from the statusfor the task returned by CEMT INQ TASK.
• If you have a suspended task, treat this as a “wait” problem. Use the techniques described in“Dealing with waits” on page 128 to investigate it further.
• If you have a running task, it is likely to be looping. See “Dealing with loops” on page 215 to find outwhat to do next.
If you have obtained no output and the task is not in the system, read “No output - what to do if thetask is not in the system” on page 243.
4. Did the task run? There are a variety of techniques for finding this information. These are described in“Techniques to find out whether a transaction started” on page 243
Can you use the terminal where the transaction should have started?Go to the terminal where the transaction should have started, and note whether the keyboard is locked. Ifit is, press RESET. Now try issuing CEMT INQ TASK (or your site replacement) from the terminal.
If you cannot issue CEMT INQ TASK from the terminal, one of these explanations applies:
• The task that produced no output is still attached to the terminal.• The terminal where you made the inquiry is not in service.• There is a system-wide problem.• You are not authorized to use the CEMT transaction. (This may be because you have not signed on to
the terminal and the CEMT transaction is not authorized for that terminal. If you have signed on to theterminal, you are probably authorized to use CEMT.)
Try to find a terminal where you can issue CEMT INQ TASK. If no terminal seems to work, thereis probably a system-wide problem. Otherwise, see if the task you are investigating is shown in thesummary.
242 CICS TS for z/OS: Troubleshooting CICS
• If the task is shown, it is probably still attached, and either looping or waiting. Turn to Chapter 3,“Distinguishing between waits, loops, and poor performance,” on page 11 to see what to do next.
• If the task is not shown, there is a problem with the terminal where you first attempted to issue CEMTINQ TASK.
If you are able to issue CEMT INQ TASK from the terminal where the transaction was attached, one ofthese explanations applies:
• The transaction gave no output because it never started.• The transaction ran without producing any output, and terminated.• The transaction started at another terminal, and might still be in the system. If it is still in the system,
you can see it in the task summary that you got for CEMT INQ TASK. It is probably looping or waiting.See Chapter 3, “Distinguishing between waits, loops, and poor performance,” on page 11 for adviceabout what to do next. If you do not see the task in the summary, go to “No output - what to do if thetask is not in the system” on page 243.
No output - what to do if the task is not in the systemIf you have obtained no output and CEMT INQ TASK shows the task is not in the system, one of two thingscould have happened:
• Your transaction never started.• Your transaction ran, but produced no output.
Note: If you’re not getting output on a printer, the reason could be that you are not setting on the STARTPRINTER bit in the write control character. You need to set this bit to get printed output if you havespecified the STRFIELD option on a CONVERSE or SEND command, which means that the data areaspecified in the FROM option contains structured fields. Your application must set up the contents of thestructured fields.
Your task might have been initiated by direct request from a terminal, or by automatic task initiation (ATI).Most of the techniques apply to both sorts of task, but there are some extra things to investigate for ATItasks. Carry out the tests which apply to all tasks first, then go on to the tests for ATI tasks if you need to.
Techniques to find out whether a transaction startedThere are many different techniques for finding out whether a transaction started, or whether it ran butproduced no output. Use the ones that are most convenient at your installation.
Using CICS system trace entry pointsCICS system tracing is probably the most powerful technique for finding out whether a transactionstarted. You might need to direct the trace output to the auxiliary trace destination, depending on howcertain you can be about the time the task is expected to start. Even a large internal trace table mightwrap and overlay the data you want to see if you are not too sure about when the task should start.
Before you beginYou need to use the CETR transaction to set up the right tracing options. See Using CICS trace forguidance about setting up trace options.
Procedure1. Select special tracing for just your task, and disable tracing for all other tasks by setting the main
system trace flag off.2. Set up special tracing for the level one trace points for the components that are likely to be used during
the invocation of the task.The components you choose depend on how the task is initiated: by direct request from a terminalor by automatic transaction initialization. The components should always include loader domain (LD),
Chapter 6. Dealing with the problem 243
program manager (PG), transaction manager (XM), and dispatcher domain (DS). Make sure that specialtracing is disabled for all other components, to minimize the amount of trace data that is collected andthe tracing overhead.
3. Now turn tracing on, and attempt to start your task.4. When you are sure that the time has passed when the output should have appeared, stop tracing, and
format the trace data set.
ResultsIf your transaction ran, you should see the following types of trace entries for your task and the programsassociated with it:
• Loader domain, when it loaded your program, if the program was not already in main storage.• Transaction manager, when it attached your task to the dispatcher.• Dispatcher domain, when your task got its first dispatch. You might also see subsequent entries
showing your task being suspended, and then resumed.• Program manager, for any program management functions associated with your task.
If trace entries for any of these processes are missing, that should help you to find where the failureoccurred.
Using supplied transactions and EDFYou can use CICS-supplied transactions or the execution diagnostic facility (EDF) to find out whether atransaction started successfully.
Debug nonterminal transactionsYou can use CEDX to debug nonterminal transactions. CICS intercepts the transaction specified on theCEDX tranid command, and displays the EDF diagnostic panels at the terminal at which the EDF commandis issued. CEDX provides the same function and diagnostic display panels as CEDF, and the same basicrules for CEDF also apply to CEDX.
Debug transactions from a terminalIf the transaction that is being tested requires a terminal, you can use EDF. You must have two otherterminals for input, as well as the one that the transaction requires (tttt). Use one of these others to putthe transaction terminal under control of EDF, with the command:
CEDF tttt
At the remaining terminal, enter the transaction, or sequence of transactions, that initiate the transactionthat is being tested. Wait long enough for the transaction to start. If no output appears at the secondterminal, the transaction has not started. If you have not yet done so, consider using trace to get moreinformation about the failure.
Debug transactions that use TD queues or TS queuesYou can use CEBR to investigate your transaction if the transaction reads or writes to a transient dataqueue, or writes to a temporary storage queue. A change in such a queue is strong evidence that thetransaction ran, provided that the environment is sufficiently controlled that nothing else could producethe same effect.
You must be sure that no other transaction that might be executed while you are doing your testingperforms the same action. The absence of such a change does not mean that the transaction did not run;it might have run incorrectly, so that the expected change was not made.
244 CICS TS for z/OS: Troubleshooting CICS
Debug transactions that write to filesIf your transaction writes to a file, you can use CECI before and after the transaction to look for evidenceof the execution of your transaction. A change in the file means the transaction ran. If no change occurred,that does not necessarily mean that the transaction failed to run; it could have worked incorrectly, so thatthe changes you were expecting were not made.
Using statisticsIf nobody else is using the transaction that you are investigating, you can tell from CICS statistics whetherthe program has run.
About this taskYou can use the CEMT PERFORM STATISTICS RECORD or CEMT INQUIRE PROGRAM command toobtain statistics that indicate whether the program has run. Use one of the following procedures.
Procedure• Use the CEMT PERFORM STATISTICS RECORD command.
a) Enter the command CEMT PERFORM STATISTICS RECORD, using the TRANSACTION option,before you test your transaction.
CEMT PERFORM STATISTICS RECORD[TRANSACTION]
Statistics on transactions that have been run are recorded in the SMF data set.b) Initiate® the transaction and wait until it should have run.c) Repeat the CEMT PERFORM STATISTICS RECORD command to get a new set of statistics written
to the SMF data set.d) Format the SMF data set for the APPLID that interests you, and look at the statistics recorded
before and after you attempted to run the transaction.You can use the statistics utility program, DFHSTUP, to prepare and print reports offline using thedata recorded in the SMF data set. The following control parameters can be useful:
SELECT APPLID=COLLECTION TYPE=REQTIME START= ,STOP=DATE START= ,STOP=
If the count for your transaction increased by 1, the transaction ran. If the count is unchanged, thetransaction did not run.
• Use the CEMT INQUIRE PROGRAM command.a) Enter the command CEMT INQUIRE PROGRAM(program), where program is the program name.
The resulting screen includes a USECOUNT value. This value is the number of times that theprogram has run since the start of the current CICS session.
b) Initiate the transaction and wait until it should have run.c) Enter the CEMT INQUIRE PROGRAM command again. If the program has run, the USECOUNT value
is incremented.The USECOUNT value is not reset as part of statistics. When the USECOUNT value reaches itsmaximum (2147483647), it does not increment but remains fixed at that maximum value.
Disabling the transactionIf your transaction requires a terminal, you can disable the transaction to test whether the problem isbecauese of the terminal.
Use the following steps:
1. Use CEMT to disable the transaction that is being tested.
Chapter 6. Dealing with the problem 245
2. Initiate the transaction.
CICS issues the following message at the terminal where the transaction should run:DFHAC2008 date time applid Transaction tranid has been disabled and cannot be used
If you do not get this message, it is likely that your transaction did not start because of a problem withthat terminal.
Investigating tasks initiated by ATIIn addition to the general techniques for all tasks described above, there are some additional ones fortasks that should have started by ATI.
Tasks to be started by ATI can be invoked in any of these ways:
• By issuing EXEC CICS START commands, even if no interval is specified• By BMS ROUTE operations• By writing to transient data queues with nonzero trigger levels.
There are many reasons why automatically initiated tasks could fail to start. Even when the CICS systemis operating normally, an ATI transaction might fail to start for any of the following reasons:
• It might require a resource that is not available. The resource is usually a terminal, although it could bea queue.
• It might not be scheduled to start until some time in the future. START commands and output sent withBMS ROUTE are both subject to this sort of scheduling, but transactions started when transient datatrigger levels are reached are not.
CICS maintains two chains for scheduling transactions that have been requested, but not started. Theyare the interval control element (ICE) chain, and the automatic initiate descriptor (AID) chain. Theinformation contained in one or other of the chains can sometimes indicate why your task has failedto start.
The ICE chainThe ICE chain is used for tasks scheduled to start after some specified interval, for example on an EXECCICS START command.
You can locate it in the formatted system dump by looking at the ICP section. Look in field ICETRNID ofeach ICE (the 4-character transaction ID) to see if it relates to your task.
If you find an ICE for your task, look in field ICEXTOD. That will show you the expiration time of day. Doesit contain the value you expect? If not, either the task which caused this one to be autoinitiated was inerror, or there is a system problem.
The AID chainThe AID chain is used for tasks that are due to start immediately. Tasks are moved from the ICE chain tothe AID chain as soon as the scheduled time expires, and they are placed there directly if there is no timedelay requested.
If a task needs a resource, usually a terminal, that is unavailable, the task remains on the AID chain until itcan use the resource.
AIDs are addressed from system entries with their forward and backward chain pointers at offset '0C' and'10' respectively. AIDs contain the following fields that can be useful in debugging.
AIDTYPE (X'2D')Type of aid:
Content Offset Meaning
AIDBMS X'80' BMS AID
AIDPUT X'50' Start with data
246 CICS TS for z/OS: Troubleshooting CICS
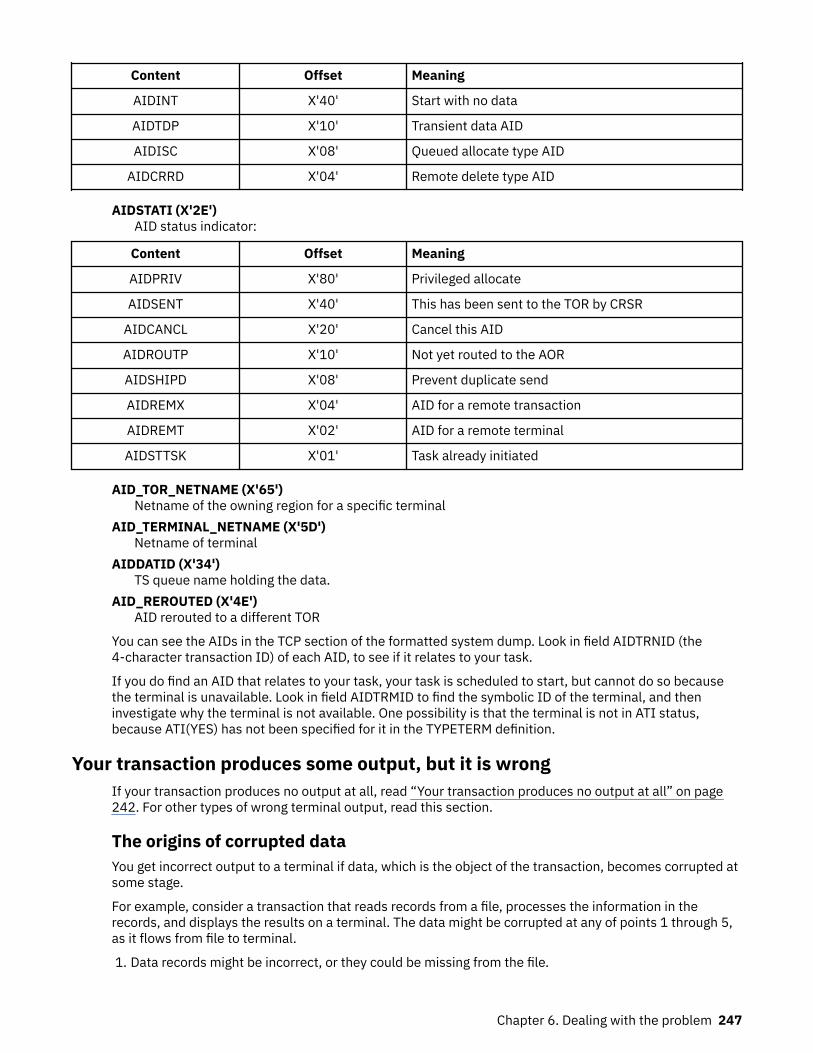
Content Offset Meaning
AIDINT X'40' Start with no data
AIDTDP X'10' Transient data AID
AIDISC X'08' Queued allocate type AID
AIDCRRD X'04' Remote delete type AID
AIDSTATI (X'2E')AID status indicator:
Content Offset Meaning
AIDPRIV X'80' Privileged allocate
AIDSENT X'40' This has been sent to the TOR by CRSR
AIDCANCL X'20' Cancel this AID
AIDROUTP X'10' Not yet routed to the AOR
AIDSHIPD X'08' Prevent duplicate send
AIDREMX X'04' AID for a remote transaction
AIDREMT X'02' AID for a remote terminal
AIDSTTSK X'01' Task already initiated
AID_TOR_NETNAME (X'65')Netname of the owning region for a specific terminal
AID_TERMINAL_NETNAME (X'5D')Netname of terminal
AIDDATID (X'34')TS queue name holding the data.
AID_REROUTED (X'4E')AID rerouted to a different TOR
You can see the AIDs in the TCP section of the formatted system dump. Look in field AIDTRNID (the4-character transaction ID) of each AID, to see if it relates to your task.
If you do find an AID that relates to your task, your task is scheduled to start, but cannot do so becausethe terminal is unavailable. Look in field AIDTRMID to find the symbolic ID of the terminal, and theninvestigate why the terminal is not available. One possibility is that the terminal is not in ATI status,because ATI(YES) has not been specified for it in the TYPETERM definition.
Your transaction produces some output, but it is wrongIf your transaction produces no output at all, read “Your transaction produces no output at all” on page242. For other types of wrong terminal output, read this section.
The origins of corrupted dataYou get incorrect output to a terminal if data, which is the object of the transaction, becomes corrupted atsome stage.
For example, consider a transaction that reads records from a file, processes the information in therecords, and displays the results on a terminal. The data might be corrupted at any of points 1 through 5,as it flows from file to terminal.
1. Data records might be incorrect, or they could be missing from the file.
Chapter 6. Dealing with the problem 247
2. Data from the file might be mapped into the program incorrectly.3. Data input at the terminal might be mapped into the program incorrectly.4. Bad programming logic might corrupt the data.5. The data might be mapped incorrectly to the terminal.
Each of these possibilities will be dealt with in turn.
Are records in the file incorrect or missing?You can check the contents of a file or database either by using CECI or by using a utility program to listoff the records in question.
If you find bad data in the file or data set, the error is likely to have been caused by the program that lastupdated the records containing that data. If the records you expected to see are missing, make sure thatyour application can deal with a ‘record not found’ condition.
If the data in the file is valid, it must have been corrupted later on in the processing.
Is the data mapped correctly into the program?When a program reads data from a file or a database, the data is put into a field described by a symbolicdata declaration in the program.
Is the data contained in the record that is read compatible with the data declaration in the program?
Check each field in the data structure receiving the record, making sure in particular that the type of datain the record is the same as that in the declaration, and that the field receiving the record is the rightlength.
If the program receives input data from the terminal, make sure that the relevant data declarations arecorrect for that, too.
If there seems to be no error in the way in which the data is mapped from the file or terminal to theprogram storage areas, the next thing to check is the program logic.
Is the data being corrupted by bad programming logic?To find out whether data is being corrupted by bad programming logic in the application, consider the flowof data through the transaction.
You can determine the flow of data through your transaction by "desk checking", or by using theinteractive tools and tracing techniques supplied by CICS.
Desk checking your source code is sometimes best done with the help of another programmer who is notfamiliar with the program. Such a person might see weaknesses in the code that you have overlooked.
You can use interactive tools to see how the data values being manipulated by your program change asthe transaction proceeds.
• CEDF is a powerful interactive tool for checking your programming logic. You can use it to follow theinternal flow from one CICS command-level statement to another. If necessary, you can add CICSstatements such as ASKTIME at critical points in your program, to see if certain paths are taken, and tocheck program storage values.
• You can use CECI to simulate CICS command statements. Try to make your test environment match theenvironment in which the error occurred as closely as possible. If you do not, you might find that yourprogram works with CECI, but not otherwise.
• You can use CEBR to look at temporary storage and transient data queues, and to put data into them.This can be useful when many different programs use the queues to pass data.
When you use CEBR to look at a transient data queue, the records you retrieve are removed from thequeue before they are displayed to you. This could alter the flow of control in the program you aretesting. You can, however, use CEBR to copy transient data queues to and from temporary storage, as away of preserving the queues if you need to.
248 CICS TS for z/OS: Troubleshooting CICS
You can use user tracing to trace the flow of control and data through your program, and to record datavalues at specific points in the execution of the transaction. For example, you can look at the values ofcounters, flags, and key variables during the execution of your program. You can include up to 4000 bytesof data on any trace entry, and so this can be a powerful technique for finding where data values are beingcorrupted.
For programming information about how you can invoke user tracing, see Application developmentreference.
You can use CSFE storage freeze to freeze the storage associated with a terminal or a transaction so thatit is not released by a freemain request at the end of processing. This can be a useful tool if, for example,you want to investigate possible storage violations. You need to get a transaction dump to look at thestorage after you have run the task with storage freeze on.
For long-running tasks, there is a possibility that a large amount of storage may be consumed becauseit cannot be released by a freemain request while storage freeze is on. For short-running tasks, however,there should be no significant overhead.
If, after using these techniques, you can find no fault with the logic of the program, the fault either lieswith the way data is mapped to the terminal, or you could have missed some important evidence.
Is the data being mapped incorrectly to the terminal?Incorrect data mapping to a terminal can have both application-related and system-related causes.
If you are using BMS mapping, check the items below.
• Examine the symbolic map very carefully to make sure that it agrees with the map in the load module.Check the date and time stamps, and the size of the map.
• Make sure that the attributes of the fields are what they should be. For example:
– An attribute of DARK on a field can prevent the data in the field from being displayed on the screen. – Failing to turn on the modified data tag (MDT) in a field might prevent that field from being
transmitted when the screen is read in.
Note: The MDT is turned on automatically if the operator types data in the field. If, however, theoperator does not type data there, the application must turn the tag on explicitly if the field is to beread in.
• If your program changes a field attribute byte, or a write control character, look at each bit and checkthat its value is correct by looking in the appropriate reference manual for the terminal.
Dealing with storage violationsA storage violation occurs when a transaction attempts to modify storage that it does not own.
The following topics describe how to deal with storage violations:
• “Protecting against storage violations” on page 250• “Two kinds of storage violation” on page 251• “CICS has detected a storage violation” on page 252• “Storage violations that affect innocent transactions” on page 256• “Programming errors that can cause storage violations” on page 257• “Storage recovery” on page 257
Chapter 6. Dealing with the problem 249
Protecting against storage violationsCICS provides facilities to help you protect against storage violations. They are CICS subsystem storageprotection, transaction isolation, command storage protection, and reentrant program storage protection.These facilities protect storage from user application code. When possible, you should turn these facilitieson, at a minimum, in your development and test environments. By catching the offenders in developmentand test, you can protect CICS code, control blocks, and transaction storage from being overwrittenin your production regions. Reducing storage violations can decrease down time and improve the dataintegrity in your regions.
Overview of CICS storage protection facilitiesCICS subsystem storage protection
Protects CICS code and control blocks from being overwritten accidentally by user applications.Transaction isolation
Protects transaction data from being overwritten accidentally by other user transactions. In otherwords, transaction isolation prevents a user transaction from directly overwriting user applicationstorage of other transactions.
Command storage protectionPrevents CICS, during its processing of an EXEC CICS command, from modifying storage that theissuing transaction could not itself directly modify. This occurs when an application program issues anEXEC CICS command that causes CICS to modify storage on the program's behalf, but the programdoes not own the storage.
If a program passes an invalid address to CICS as an output field on the EXEC CICS command, anAEYD abend occurs.
Command storage protection is completely independent of CICS subsystem storage protection andtransaction isolation.
Reentrant program storage protectionProtects storage of reentrant user application programs from being overwritten by CICS and otheruser-key applications by loading them into MVS key 0 read-only storage.
Reentrant program storage protection is independent of CICS subsystem storage protection.
Note:
These facilities protect storage from user application code. They add no benefit to a region where no usercode is executed; that is, a pure terminal-owning region (TOR) or a pure file-owning region (FOR) (whereno distributed program link (DPL) requests are function-shipped).
Enabling CICS storage protection facilitiesUse of the storage protection facilities is optional. You can enable the facilities by using options on thesystem initialization parameters that are related to storage protection.
For a description of the performance impact of these facilities, see CICS storage protection facilities:Performance and tuning.
Turning on storage protection
1. Set the STGPROT system initialization parameter to YES.
You can use CEMT INQ SYSTEM to see the status of storage protection in a region. The value ofStoreprotect will be set to Active if storage protection is on.
2. Ensure that the majority of your application programs are defined as user-key applications; thatis, with EXECKEY(USER) on the program definitions and TASKDATAKEY(USER) on the associatedtransaction definitions. USER is the default for both the EXECKEY and TASKDATAKEY options.Therefore, in most cases you do not have to change the resource definitions.
250 CICS TS for z/OS: Troubleshooting CICS
3. See CICS-key applications to determine if you have any application programs that are usingfacilities that require you to define them with EXECKEY(CICS) and TASKDATAKEY(CICS).Change the resource definitions accordingly.
Turning on transaction isolation
1. Ensure that storage protection is enabled in the CICS region.2. To turn on transaction isolation globally (that is, for the whole CICS region), set the TRANISO
system initialization parameter to YES.
You can use CEMT INQ SYSTEM to display the status of transaction isolation in a region. The valueof Tranisolate will be Active if transaction isolation is on.
3. Where necessary, specify ISOLATE(NO) on transaction resource definitions to allow transactionsto continue to function if they fail to meet the criteria for the default of ISOLATE(YES). See MVSsubspaces to get a better understanding of the default and to determine whether you have anyprograms that need to share common storage.
ISOLATE(NO) provides support for migration, allowing the separation of transactions into theirown unique subspaces to be staged gradually. The best approach is to remove transactioninterdependencies. However, some programs have a legitimate need for one task to access, orshare, the storage of another task. In that case, consider changing the program to use sharedstorage; that is, storage obtained by GETMAIN commands with the SHARED option (SDSA orESDSA).
Note: VSAM nonshared resources (NSR) are not supported for transactions that use transactionisolation. You should specify ISOLATE(NO) when you define transactions that access VSAM files usingNSR.
Turning on command storage protection
1. Set the CMDPROT system initialization parameter to YES. This causes CICS to validate the startaddress of the storage and to establish that the application program has write access to thestorage that begins with that address before CICS executes the command.
2. You can use CEMT INQ SYSTEM to display the value of CMDPROT in your region. The value ofCmdprotect will be set to Cmdprot if command storage protection is active.
Turning on reentrant program storage protection
1. Set the RENTPGM system initialization parameter to PROTECT. This causes CICS to obtain storagefor eligible programs from MVS key 0 read-only storage. The CICS loader automatically loadsprograms into the read-only DSAs (RDSA and ERDSA) if you link-edit the programs as reentrantby using the RENT attribute. Programs that you link-edit with RENT and RMODE(ANY) are loadedinto the ERDSA. For more details about program eligibility, see Running application programs in theread-only DSAs.
2. You can use CEMT INQ SYSTEM to display the value of RENTPGM in your region. The value ofReentprotect will be set to Reentprot if read-only storage is allocated from key 0 storage.
Note: You must specify RENTPGM=NOPROTECT for development regions if you have a development aidpackage that sets break points in your application programs.
After these facilities are activated, you will receive message DFHSR0001 reporting a protection exception(0C4) when CICS detects and prevents an attempted storage violation. The X'offset' into the program andthe program name will be included in the message. Examine the program to determine why it is tryingto modify storage that it is not allowed to modify. Also, make sure that you do not have any error in thetransaction or program definition.
Two kinds of storage violationStorage violations can be divided into two classes, namely those detected and reported by CICS, andthose not detected by CICS. They require different problem determination techniques.
CICS-detected violations are identified by the following message sent to the console:
Chapter 6. Dealing with the problem 251
DFHSM0102 applid A storage violation (code Xcode') has been detected by module modname
If you have received this message, turn first to the description of message DFHSM0102 in CICS messagesto see an explanation of the message, and then to Trace entries to see an explanation of the exceptiontrace point ID, X'code'. This tells you how CICS detected the storage violation. Then return to this section,and read “CICS has detected a storage violation” on page 252.
Storage violations not detected by CICS are less easy to identify. They can cause almost any sort ofsymptom. Typically, you might have got a program check with a condition code indicating ‘operationexception’ or ‘data exception’, because the program or its data has been overlaid. Otherwise, you mighthave obtained a message from the dump formatting program saying that it had found a corrupted dataarea. Whatever the evidence for the storage violation, if it has not been detected by CICS, turn to “Storageviolations that affect innocent transactions” on page 256.
CICS has detected a storage violationCICS can detect storage violations when:
1. The duplicate storage accounting area (SAA) or the initial SAA of a TIOA storage element has becomecorrupted.
2. The leading storage check zone or the trailing storage check zone of a user-task storage element hasbecome corrupted.
CICS detects storage violations involving TIOAs by checking the SAA chains when it receives a FREEMAINcommand to release an individual element of TIOA storage, at least as far as the target element. It alsochecks the chains when it releases the storage, by using a FREEMAIN request, belonging to a TCTTE afterthe last output has taken place. CICS detects storage violations involving user-task storage by checkingthe storage check zones of an element of user-task storage when it receives a command to release thatelement of storage by using a FREEMAIN request. It also checks the chains when it releases all thestorage , by using a FREEMAIN request, belonging to a task when the task ends.
The storage violation is detected not at the time it occurs, but only when the SAA chain or the storage checkzones are checked. This is illustrated in Figure 33 on page 253, which shows the sequence of events whenCICS detects a violation of a user task storage element. The sequence is the same when CICS detects aviolation of a TIOA storage element.
The fact that the SAA or storage check zone is overlaid some time before it is detected does notmatter too much for user storage where the trailing storage check zone has been overlaid, becausethe transaction whose storage has been violated is also very likely to be the one responsible for theviolation. It is fairly common for transactions to write data beyond the end of the allocated area in astorage element and into the check zone. This is the cause of the violation in Figure 33 on page 253.
The situation could be more serious if the leading check zone has been overlaid, because in that case itcould be that some other unrelated transaction was to blame. However, storage elements belonging toindividual tasks are likely to be more or less contiguous, and overwrites could extend beyond the end ofone element and into the next.
If the leading storage check zone was only overwritten by chance by some other task, the problem mightnot be reproducible. On other occasions, other parts of storage might be affected. If you have this sort ofproblem, you need to investigate it as though CICS had not detected it, using the techniques of “Storageviolations that affect innocent transactions” on page 256.
Finding the offending transaction when the duplicate SAA of a TIOA storage element has been overlaidmight not be so straightforward. This is because TIOAs tend to have much longer lifetimes than tasks,because they wait on the response of terminal operators. By the time the storage violation is detected,the transaction that caused it is unlikely to still be in the system. However, the techniques for CICS-detected violations still apply.
252 CICS TS for z/OS: Troubleshooting CICS
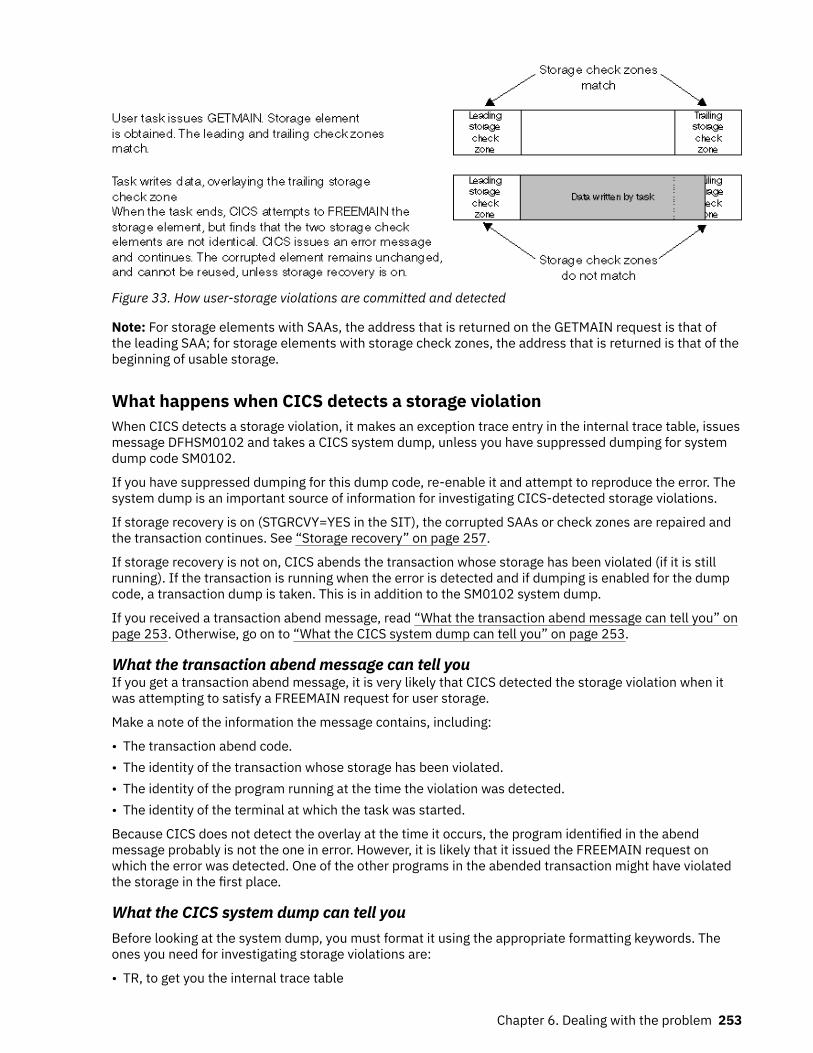
Figure 33. How user-storage violations are committed and detected
Note: For storage elements with SAAs, the address that is returned on the GETMAIN request is that ofthe leading SAA; for storage elements with storage check zones, the address that is returned is that of thebeginning of usable storage.
What happens when CICS detects a storage violationWhen CICS detects a storage violation, it makes an exception trace entry in the internal trace table, issuesmessage DFHSM0102 and takes a CICS system dump, unless you have suppressed dumping for systemdump code SM0102.
If you have suppressed dumping for this dump code, re-enable it and attempt to reproduce the error. Thesystem dump is an important source of information for investigating CICS-detected storage violations.
If storage recovery is on (STGRCVY=YES in the SIT), the corrupted SAAs or check zones are repaired andthe transaction continues. See “Storage recovery” on page 257.
If storage recovery is not on, CICS abends the transaction whose storage has been violated (if it is stillrunning). If the transaction is running when the error is detected and if dumping is enabled for the dumpcode, a transaction dump is taken. This is in addition to the SM0102 system dump.
If you received a transaction abend message, read “What the transaction abend message can tell you” onpage 253. Otherwise, go on to “What the CICS system dump can tell you” on page 253.
What the transaction abend message can tell youIf you get a transaction abend message, it is very likely that CICS detected the storage violation when itwas attempting to satisfy a FREEMAIN request for user storage.
Make a note of the information the message contains, including:
• The transaction abend code.• The identity of the transaction whose storage has been violated.• The identity of the program running at the time the violation was detected.• The identity of the terminal at which the task was started.
Because CICS does not detect the overlay at the time it occurs, the program identified in the abendmessage probably is not the one in error. However, it is likely that it issued the FREEMAIN request onwhich the error was detected. One of the other programs in the abended transaction might have violatedthe storage in the first place.
What the CICS system dump can tell youBefore looking at the system dump, you must format it using the appropriate formatting keywords. Theones you need for investigating storage violations are:
• TR, to get you the internal trace table
Chapter 6. Dealing with the problem 253
• TCP, to get you terminal-related areas• AP, to get you the TCAs and user storage.
The dump formatting program reports the damaged storage check zone or SAA chain when it attempts toformat the storage areas, and this can help you with diagnosis by identifying the TCA or TCTTE owning thestorage.
When you have formatted the dump, take a look at the data overlaying the SAA or storage check zone tosee if its nature suggests which program put it there. There are two places you can see this, one beingthe exception trace entry in the internal trace table, and the other being the violated area of storage itself.Look first at the exception trace entry in the internal trace table to check that it shows the data overlayingthe SAA or storage check zone. Does the data suggest what program put it there? Remember that theprogram is likely to be part of the violated transaction in the case of user storage. For terminal storage,you probably have more than one transaction to consider.
As the SAAs and storage check zones are only 8 bytes long, there might not be enough data for you toidentify the program. In this case, find the overlaid data in the formatted dump. The area is pointed to inthe diagnostic message from the dump formatting program. The data should tell you what program put itthere, and, more importantly, what part of the program was being executed when the overlay occurred.
If the investigations you have done so far have enabled you to find the cause of the overlay, you should beable to fix the problem.
What to do if you cannot find what is overlaying the SAAThe technique described in this section enables you to locate the code responsible for the error bynarrowing your search to the sequence of instructions executing between the last two successive old-style trace entries in the trace table.
You do this by forcing CICS to check the SAA chain of terminal storage and the storage check zones ofuser-task storage every time an old-style trace entry is made from AP domain. These types of trace entryhave point IDs of the form AP 00xx, “xx” being two hexadecimal digits. Storage chain checking is not donefor new-style trace entries from AP domain or any other domain. (For a discussion of old and new-styletrace entries, see Using CICS trace.)
The procedure has a significant processing overhead, because it involves a large amount of tracing. Youare likely to use it only when you have had no success with other methods.
How you can force storage chain checkingYou can force storage chain checking either by using the CSFE DEBUG transaction, or by using theCHKSTSK or CHKSTRM system initialization parameter.
Tracing must also be active, or CICS will do no extra checking. The CSFE transaction has the advantagethat you need not bring CICS down before you can use it.
Table 27 on page 254 shows the CSFE DEBUG options and their effects. Table 28 on page 255 shows thestartup overrides that have the same effects.
Table 27. Effects of the CSFE DEBUG transaction
CSFE syntax Effect
CSFE DEBUG, CHKSTSK=CURRENT This checks storage check zones for all storage areason the transaction storage chain for the current taskonly.
If a task is overlaying one of the storage check zonesof its own user storage, use
CSFE DEBUG,CHKSTSK=CURRENT
CSFE DEBUG, CHKSTRM=CURRENT This checks SAAs for all TIOAs linked off the currentTCTTE. Use this if the SAA of a TIOA has been overlaid.
254 CICS TS for z/OS: Troubleshooting CICS
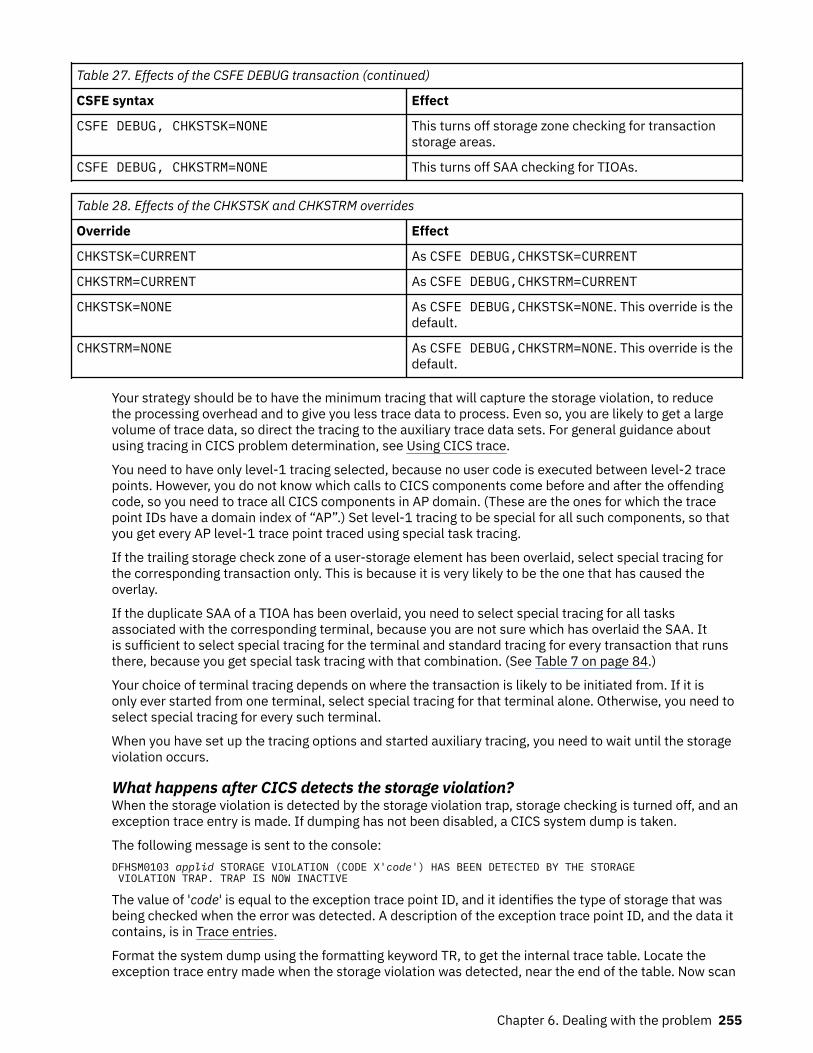
Table 27. Effects of the CSFE DEBUG transaction (continued)
CSFE syntax Effect
CSFE DEBUG, CHKSTSK=NONE This turns off storage zone checking for transactionstorage areas.
CSFE DEBUG, CHKSTRM=NONE This turns off SAA checking for TIOAs.
Table 28. Effects of the CHKSTSK and CHKSTRM overrides
Override Effect
CHKSTSK=CURRENT As CSFE DEBUG,CHKSTSK=CURRENT
CHKSTRM=CURRENT As CSFE DEBUG,CHKSTRM=CURRENT
CHKSTSK=NONE As CSFE DEBUG,CHKSTSK=NONE. This override is thedefault.
CHKSTRM=NONE As CSFE DEBUG,CHKSTRM=NONE. This override is thedefault.
Your strategy should be to have the minimum tracing that will capture the storage violation, to reducethe processing overhead and to give you less trace data to process. Even so, you are likely to get a largevolume of trace data, so direct the tracing to the auxiliary trace data sets. For general guidance aboutusing tracing in CICS problem determination, see Using CICS trace.
You need to have only level-1 tracing selected, because no user code is executed between level-2 tracepoints. However, you do not know which calls to CICS components come before and after the offendingcode, so you need to trace all CICS components in AP domain. (These are the ones for which the tracepoint IDs have a domain index of “AP”.) Set level-1 tracing to be special for all such components, so thatyou get every AP level-1 trace point traced using special task tracing.
If the trailing storage check zone of a user-storage element has been overlaid, select special tracing forthe corresponding transaction only. This is because it is very likely to be the one that has caused theoverlay.
If the duplicate SAA of a TIOA has been overlaid, you need to select special tracing for all tasksassociated with the corresponding terminal, because you are not sure which has overlaid the SAA. Itis sufficient to select special tracing for the terminal and standard tracing for every transaction that runsthere, because you get special task tracing with that combination. (See Table 7 on page 84.)
Your choice of terminal tracing depends on where the transaction is likely to be initiated from. If it isonly ever started from one terminal, select special tracing for that terminal alone. Otherwise, you need toselect special tracing for every such terminal.
When you have set up the tracing options and started auxiliary tracing, you need to wait until the storageviolation occurs.
What happens after CICS detects the storage violation?When the storage violation is detected by the storage violation trap, storage checking is turned off, and anexception trace entry is made. If dumping has not been disabled, a CICS system dump is taken.
The following message is sent to the console:DFHSM0103 applid STORAGE VIOLATION (CODE X'code') HAS BEEN DETECTED BY THE STORAGE VIOLATION TRAP. TRAP IS NOW INACTIVE
The value of 'code' is equal to the exception trace point ID, and it identifies the type of storage that wasbeing checked when the error was detected. A description of the exception trace point ID, and the data itcontains, is in Trace entries.
Format the system dump using the formatting keyword TR, to get the internal trace table. Locate theexception trace entry made when the storage violation was detected, near the end of the table. Now scan
Chapter 6. Dealing with the problem 255
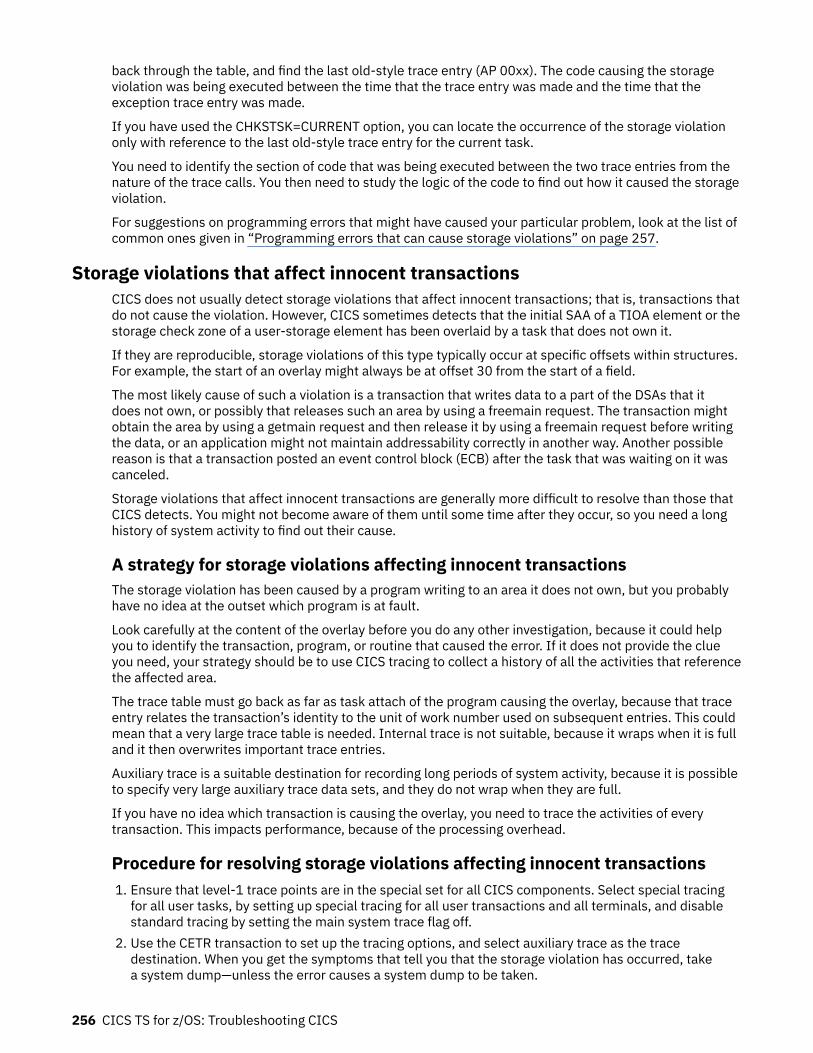
back through the table, and find the last old-style trace entry (AP 00xx). The code causing the storageviolation was being executed between the time that the trace entry was made and the time that theexception trace entry was made.
If you have used the CHKSTSK=CURRENT option, you can locate the occurrence of the storage violationonly with reference to the last old-style trace entry for the current task.
You need to identify the section of code that was being executed between the two trace entries from thenature of the trace calls. You then need to study the logic of the code to find out how it caused the storageviolation.
For suggestions on programming errors that might have caused your particular problem, look at the list ofcommon ones given in “Programming errors that can cause storage violations” on page 257.
Storage violations that affect innocent transactionsCICS does not usually detect storage violations that affect innocent transactions; that is, transactions thatdo not cause the violation. However, CICS sometimes detects that the initial SAA of a TIOA element or thestorage check zone of a user-storage element has been overlaid by a task that does not own it.
If they are reproducible, storage violations of this type typically occur at specific offsets within structures.For example, the start of an overlay might always be at offset 30 from the start of a field.
The most likely cause of such a violation is a transaction that writes data to a part of the DSAs that itdoes not own, or possibly that releases such an area by using a freemain request. The transaction mightobtain the area by using a getmain request and then release it by using a freemain request before writingthe data, or an application might not maintain addressability correctly in another way. Another possiblereason is that a transaction posted an event control block (ECB) after the task that was waiting on it wascanceled.
Storage violations that affect innocent transactions are generally more difficult to resolve than those thatCICS detects. You might not become aware of them until some time after they occur, so you need a longhistory of system activity to find out their cause.
A strategy for storage violations affecting innocent transactionsThe storage violation has been caused by a program writing to an area it does not own, but you probablyhave no idea at the outset which program is at fault.
Look carefully at the content of the overlay before you do any other investigation, because it could helpyou to identify the transaction, program, or routine that caused the error. If it does not provide the clueyou need, your strategy should be to use CICS tracing to collect a history of all the activities that referencethe affected area.
The trace table must go back as far as task attach of the program causing the overlay, because that traceentry relates the transaction’s identity to the unit of work number used on subsequent entries. This couldmean that a very large trace table is needed. Internal trace is not suitable, because it wraps when it is fulland it then overwrites important trace entries.
Auxiliary trace is a suitable destination for recording long periods of system activity, because it is possibleto specify very large auxiliary trace data sets, and they do not wrap when they are full.
If you have no idea which transaction is causing the overlay, you need to trace the activities of everytransaction. This impacts performance, because of the processing overhead.
Procedure for resolving storage violations affecting innocent transactions1. Ensure that level-1 trace points are in the special set for all CICS components. Select special tracing
for all user tasks, by setting up special tracing for all user transactions and all terminals, and disablestandard tracing by setting the main system trace flag off.
2. Use the CETR transaction to set up the tracing options, and select auxiliary trace as the tracedestination. When you get the symptoms that tell you that the storage violation has occurred, takea system dump—unless the error causes a system dump to be taken.
256 CICS TS for z/OS: Troubleshooting CICS
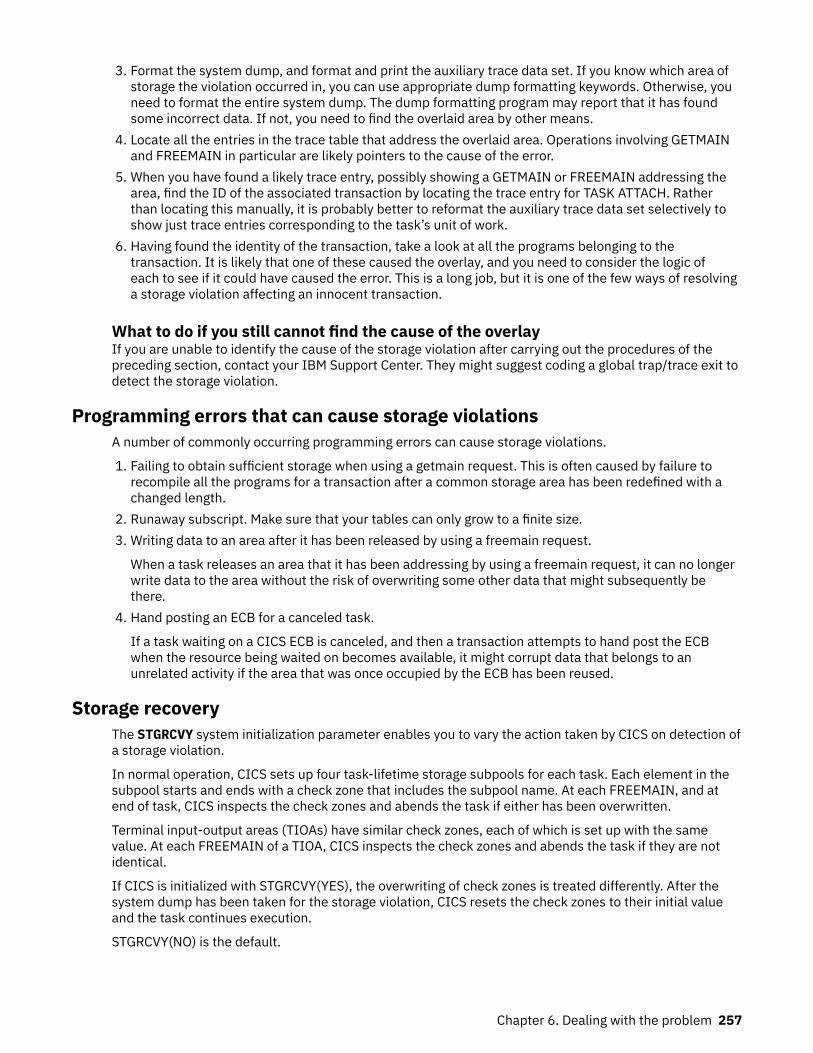
3. Format the system dump, and format and print the auxiliary trace data set. If you know which area ofstorage the violation occurred in, you can use appropriate dump formatting keywords. Otherwise, youneed to format the entire system dump. The dump formatting program may report that it has foundsome incorrect data. If not, you need to find the overlaid area by other means.
4. Locate all the entries in the trace table that address the overlaid area. Operations involving GETMAINand FREEMAIN in particular are likely pointers to the cause of the error.
5. When you have found a likely trace entry, possibly showing a GETMAIN or FREEMAIN addressing thearea, find the ID of the associated transaction by locating the trace entry for TASK ATTACH. Ratherthan locating this manually, it is probably better to reformat the auxiliary trace data set selectively toshow just trace entries corresponding to the task’s unit of work.
6. Having found the identity of the transaction, take a look at all the programs belonging to thetransaction. It is likely that one of these caused the overlay, and you need to consider the logic ofeach to see if it could have caused the error. This is a long job, but it is one of the few ways of resolvinga storage violation affecting an innocent transaction.
What to do if you still cannot find the cause of the overlayIf you are unable to identify the cause of the storage violation after carrying out the procedures of thepreceding section, contact your IBM Support Center. They might suggest coding a global trap/trace exit todetect the storage violation.
Programming errors that can cause storage violationsA number of commonly occurring programming errors can cause storage violations.
1. Failing to obtain sufficient storage when using a getmain request. This is often caused by failure torecompile all the programs for a transaction after a common storage area has been redefined with achanged length.
2. Runaway subscript. Make sure that your tables can only grow to a finite size.3. Writing data to an area after it has been released by using a freemain request.
When a task releases an area that it has been addressing by using a freemain request, it can no longerwrite data to the area without the risk of overwriting some other data that might subsequently bethere.
4. Hand posting an ECB for a canceled task.
If a task waiting on a CICS ECB is canceled, and then a transaction attempts to hand post the ECBwhen the resource being waited on becomes available, it might corrupt data that belongs to anunrelated activity if the area that was once occupied by the ECB has been reused.
Storage recoveryThe STGRCVY system initialization parameter enables you to vary the action taken by CICS on detection ofa storage violation.
In normal operation, CICS sets up four task-lifetime storage subpools for each task. Each element in thesubpool starts and ends with a check zone that includes the subpool name. At each FREEMAIN, and atend of task, CICS inspects the check zones and abends the task if either has been overwritten.
Terminal input-output areas (TIOAs) have similar check zones, each of which is set up with the samevalue. At each FREEMAIN of a TIOA, CICS inspects the check zones and abends the task if they are notidentical.
If CICS is initialized with STGRCVY(YES), the overwriting of check zones is treated differently. After thesystem dump has been taken for the storage violation, CICS resets the check zones to their initial valueand the task continues execution.
STGRCVY(NO) is the default.
Chapter 6. Dealing with the problem 257
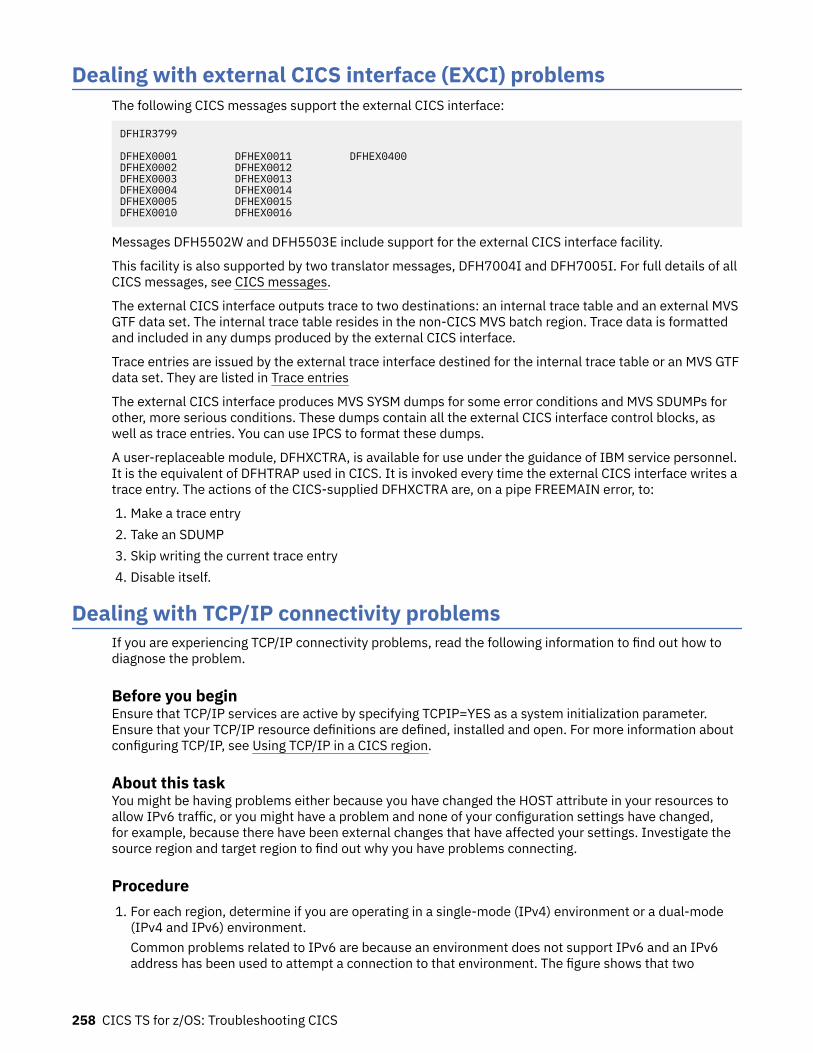
Dealing with external CICS interface (EXCI) problemsThe following CICS messages support the external CICS interface:
DFHIR3799 DFHEX0001 DFHEX0011 DFHEX0400DFHEX0002 DFHEX0012DFHEX0003 DFHEX0013DFHEX0004 DFHEX0014DFHEX0005 DFHEX0015DFHEX0010 DFHEX0016
Messages DFH5502W and DFH5503E include support for the external CICS interface facility.
This facility is also supported by two translator messages, DFH7004I and DFH7005I. For full details of allCICS messages, see CICS messages.
The external CICS interface outputs trace to two destinations: an internal trace table and an external MVSGTF data set. The internal trace table resides in the non-CICS MVS batch region. Trace data is formattedand included in any dumps produced by the external CICS interface.
Trace entries are issued by the external trace interface destined for the internal trace table or an MVS GTFdata set. They are listed in Trace entries
The external CICS interface produces MVS SYSM dumps for some error conditions and MVS SDUMPs forother, more serious conditions. These dumps contain all the external CICS interface control blocks, aswell as trace entries. You can use IPCS to format these dumps.
A user-replaceable module, DFHXCTRA, is available for use under the guidance of IBM service personnel.It is the equivalent of DFHTRAP used in CICS. It is invoked every time the external CICS interface writes atrace entry. The actions of the CICS-supplied DFHXCTRA are, on a pipe FREEMAIN error, to:
1. Make a trace entry2. Take an SDUMP3. Skip writing the current trace entry4. Disable itself.
Dealing with TCP/IP connectivity problemsIf you are experiencing TCP/IP connectivity problems, read the following information to find out how todiagnose the problem.
Before you beginEnsure that TCP/IP services are active by specifying TCPIP=YES as a system initialization parameter.Ensure that your TCP/IP resource definitions are defined, installed and open. For more information aboutconfiguring TCP/IP, see Using TCP/IP in a CICS region.
About this taskYou might be having problems either because you have changed the HOST attribute in your resources toallow IPv6 traffic, or you might have a problem and none of your configuration settings have changed,for example, because there have been external changes that have affected your settings. Investigate thesource region and target region to find out why you have problems connecting.
Procedure1. For each region, determine if you are operating in a single-mode (IPv4) environment or a dual-mode
(IPv4 and IPv6) environment.Common problems related to IPv6 are because an environment does not support IPv6 and an IPv6address has been used to attempt a connection to that environment. The figure shows that two
258 CICS TS for z/OS: Troubleshooting CICS
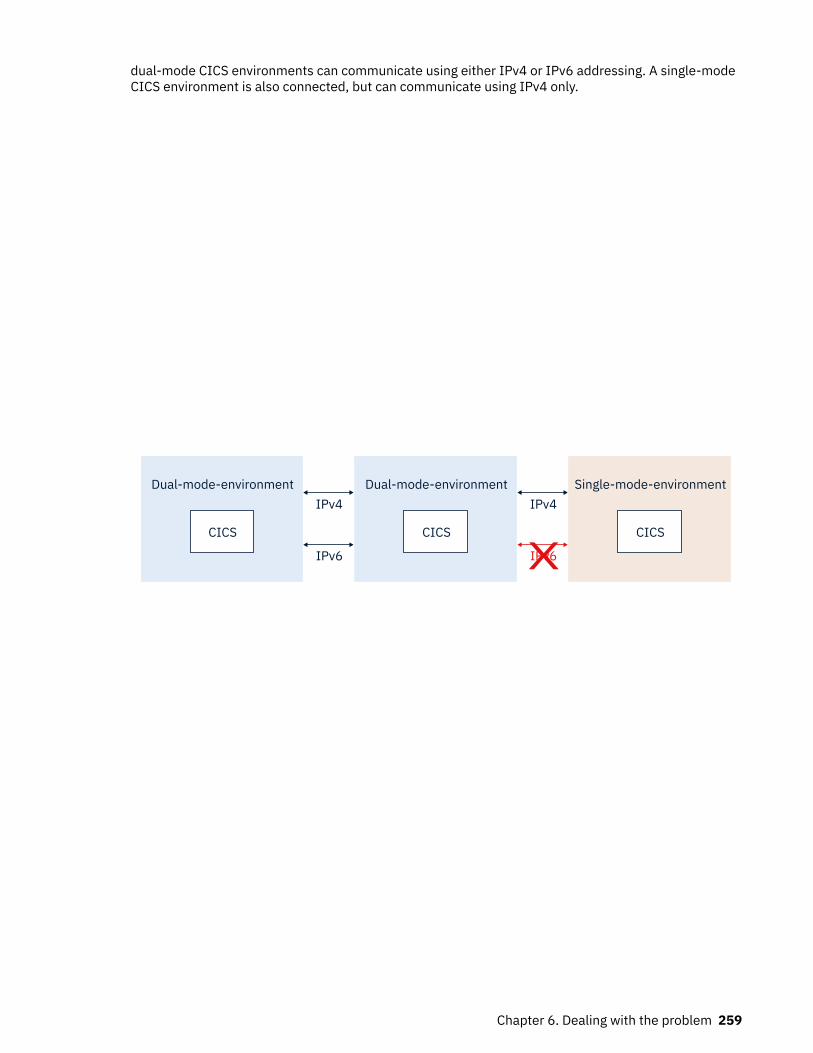
dual-mode CICS environments can communicate using either IPv4 or IPv6 addressing. A single-modeCICS environment is also connected, but can communicate using IPv4 only.
Single-mode-environment
CICS
Dual-mode-environment
CICS
IPv4
IPv6
Dual-mode-environment
CICS
IPv4
IPv6 X
Chapter 6. Dealing with the problem 259
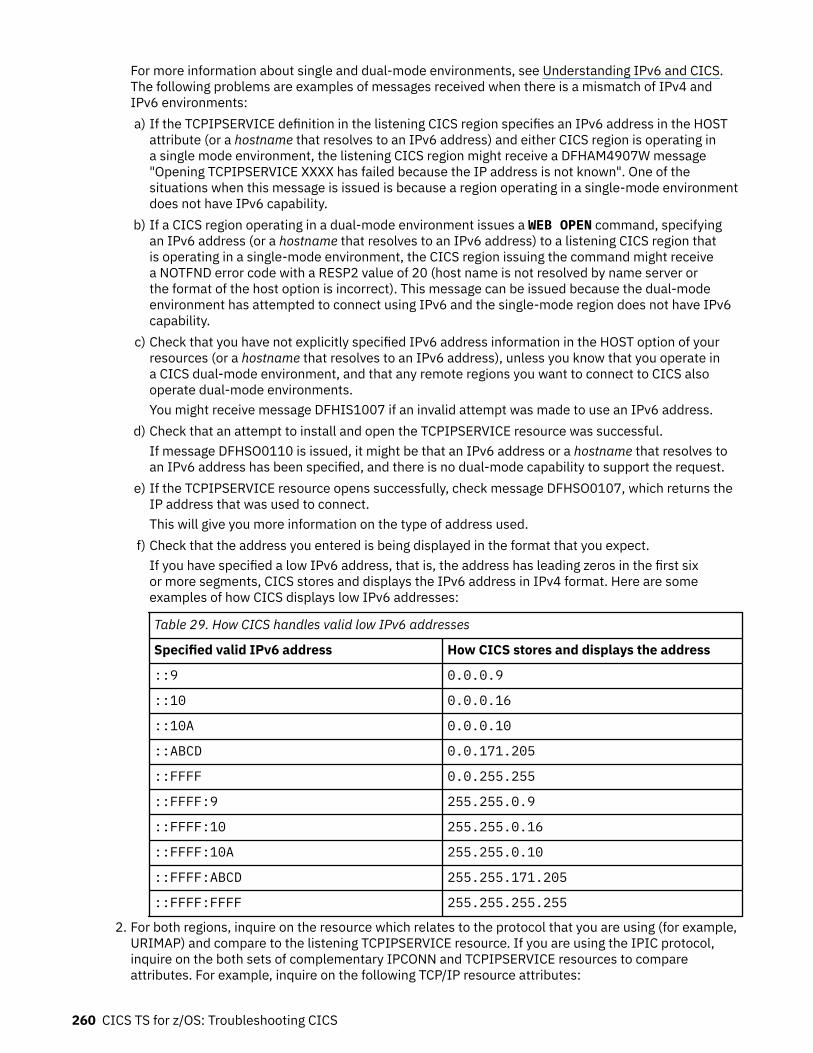
For more information about single and dual-mode environments, see Understanding IPv6 and CICS.The following problems are examples of messages received when there is a mismatch of IPv4 andIPv6 environments:a) If the TCPIPSERVICE definition in the listening CICS region specifies an IPv6 address in the HOST
attribute (or a hostname that resolves to an IPv6 address) and either CICS region is operating ina single mode environment, the listening CICS region might receive a DFHAM4907W message"Opening TCPIPSERVICE XXXX has failed because the IP address is not known". One of thesituations when this message is issued is because a region operating in a single-mode environmentdoes not have IPv6 capability.
b) If a CICS region operating in a dual-mode environment issues a WEB OPEN command, specifyingan IPv6 address (or a hostname that resolves to an IPv6 address) to a listening CICS region thatis operating in a single-mode environment, the CICS region issuing the command might receivea NOTFND error code with a RESP2 value of 20 (host name is not resolved by name server orthe format of the host option is incorrect). This message can be issued because the dual-modeenvironment has attempted to connect using IPv6 and the single-mode region does not have IPv6capability.
c) Check that you have not explicitly specified IPv6 address information in the HOST option of yourresources (or a hostname that resolves to an IPv6 address), unless you know that you operate ina CICS dual-mode environment, and that any remote regions you want to connect to CICS alsooperate dual-mode environments.You might receive message DFHIS1007 if an invalid attempt was made to use an IPv6 address.
d) Check that an attempt to install and open the TCPIPSERVICE resource was successful.If message DFHSO0110 is issued, it might be that an IPv6 address or a hostname that resolves toan IPv6 address has been specified, and there is no dual-mode capability to support the request.
e) If the TCPIPSERVICE resource opens successfully, check message DFHSO0107, which returns theIP address that was used to connect.This will give you more information on the type of address used.
f) Check that the address you entered is being displayed in the format that you expect.If you have specified a low IPv6 address, that is, the address has leading zeros in the first sixor more segments, CICS stores and displays the IPv6 address in IPv4 format. Here are someexamples of how CICS displays low IPv6 addresses:
Table 29. How CICS handles valid low IPv6 addresses
Specified valid IPv6 address How CICS stores and displays the address
::9 0.0.0.9
::10 0.0.0.16
::10A 0.0.0.10
::ABCD 0.0.171.205
::FFFF 0.0.255.255
::FFFF:9 255.255.0.9
::FFFF:10 255.255.0.16
::FFFF:10A 255.255.0.10
::FFFF:ABCD 255.255.171.205
::FFFF:FFFF 255.255.255.255
2. For both regions, inquire on the resource which relates to the protocol that you are using (for example,URIMAP) and compare to the listening TCPIPSERVICE resource. If you are using the IPIC protocol,inquire on the both sets of complementary IPCONN and TCPIPSERVICE resources to compareattributes. For example, inquire on the following TCP/IP resource attributes:
260 CICS TS for z/OS: Troubleshooting CICS
a) Inquire on the HOST option to determine the host name, IPv4, or IPv6 address specified for theregion.If you have an IPv6 address or a hostname that resolves to an IPv6 address in the HOST option,ensure that both CICS regions are operating in dual-mode environments.
b) If there is a host name in the HOST option, this might resolve to an IPv6 address at the domainname server. Trace points SO 0436 and SO 0437 give details of resolved addresses, or consultyour system support representative to find out the IP addresses that have been configured at thedomain name server for this port.
3. Look for any error messages or TCP/IP connection information that might indicate the cause of theconnectivity problem; for example, a port sharing conflict or a problem because the task has not runproperly.You can inquire on socket application data (ApplData) for each TCP socket owned by CICS to correlateTCP/IP connections with the CICS regions and transactions using them. ApplData is also availableusing Netstat reports. For more information about CICS ApplData, see TCP/IP management andcontrol.
4. Modify any resources that have not been correctly defined.5. Verify that traffic is flowing across the connection.
What to do nextThe network connection is available. If the connection is not available, contact your NetworkAdministrator and request an investigation into the network components that are being used to connectyour CICS regions.
Dealing with log manager problemsThe CICS log manager uses services provided by the MVS logger to support the logging and journaling ofdata to the CICS system log, forward recovery logs, autojournals, and user journals.
This section contains the following topics:
• “Categories of problem” on page 261• “Exceeding the capacity of a log stream” on page 262• “How CICS checks for the availability of the MVS logger” on page 262• “Some conditions that cause CICS log manager error messages” on page 263• “Diagnosing problems in the MVS logger” on page 267.
Categories of problemThe following categories of problem (in order of ascending impact on the user) may be encountered by theCICS log manager.
1. Those problems within the MVS logger that the MVS logger resolves for itself. CICS has no involvementin this category and might only experience the problem as an increase in response times.
2. Where the MVS logger is unable to satisfy the CICS log manager's request immediately. This problemstate can be encountered:
• For a log stream that uses a coupling facility structure, on a "STRUCTURE FULL" condition, wherethe coupling facility has reached its capacity before offloading data to DASD. This state may also beencountered during the rebuilding of a coupling facility structure.
• For a DASD-only log stream, on a 'STAGING DATA SET FULL' condition, where the staging data sethas reached its capacity before offloading data to secondary storage.
If either of these conditions occur, CICS issues message DFHLG0771 (for a general log) or DFHLG0777(for a system log). The CICS log manager retries the request every three seconds until the request issatisfied. Typically, this can take up to a minute.
Chapter 6. Dealing with the problem 261
3. If the MVS logger fails, CICS is abended. If the system log has not been damaged, a subsequentemergency restart of CICS should succeed.
4. If a return code implies that the CICS system log has been damaged, CICS is quiesced, meaningtransactions are allowed to run to completion as far as possible, with no further records being writtento the system log. To get CICS back into production, you must perform an initial start. However, beforedoing so you may want to perform a diagnostic run, to gather information for problem diagnosis - see“Dealing with a corrupt system log” on page 273.
If a return code implies damage to a forward recovery log or autojournal, all files using the logstream are quiesced and their transactions run to completion. Message DFHFC4800, DFHFC4801, orDFHFC4802 is issued. User transactions writing journal records to the log stream experience a writeerror. For a forward recovery log, before you can continue to use the log stream, you must:
a. Take an image copy of all data sets referencing the log stream.b. Redefine the log stream.c. Unquiesce the data sets using the affected logs. You may then explicitly open the files but they
open automatically at the first READ or WRITE if they are in a CLOSED ENABLED state after theunquiesce.
For an autojournal, before you can continue to use the log stream, you must:
a. Try to read and recover data from the damaged autojournal.b. Redefine the log stream.
Exceeding the capacity of a log streamThe MVS logger imposes a limit on the number of data sets per log stream. In practice, this is unlikely tobe a problem.
System logYou are strongly recommended to allow the CICS log manager to manage the size of the system log. If youdo so, you do not need to worry about the data set limit being exceeded.
In the unlikely event that you need to retain data beyond the time it would be deleted by CICS, seeManaging auxiliary storage for advice on how to define the system log.
General logsIf a journal write to a user journal fails because the data set limit is reached, you must delete the tail ofthe log, or archive it, before you can use the SET JOURNALNAME command to open the journal and makeit available for use again. For an example of how to do this, see Examples of using DFHJUP.
• The number of data sets per log stream recognized by the MVS logger is several million. In normalcircumstances, you do not need to be concerned about the limit being exceeded.
• You can cause redundant data to be deleted from log streams automatically, after a specified period. Toarrange this for general log streams, define the logs to MVS with AUTODELETE(YES) and RETPD(dddd),where dddd is the number of days for which data is to be retained. This causes the MVS logger to deletean entire log data set when all the data in it is older than the retention period (RETPD) specified for thelog stream.
How CICS checks for the availability of the MVS loggerAt intervals, CICS itself checks for the availability of the MVS logger. It uses one of two procedures toperform these checks, depending on your operating system.
CICS checks by querying the system log connection status. If the check fails, CICS either abends orquiesces, depending on the returned MVS logger reason code.
The interval at which CICS checks for the availability of the MVS logger varies, depending on the amountof system logging activity in the CICS region. The first check is made after CICS has not made contact with
262 CICS TS for z/OS: Troubleshooting CICS
the MVS logger for 10 seconds. If CICS continues to perform no system logging after the first check, theinterval between checks doubles each time, up to a maximum of 600 seconds. If CICS makes contact withthe MVS logger at any point, the interval between checks is halved, down to a minimum of 10 seconds.
The checking interval can be affected by the exit time interval specified in the ICV system initializationparameter:
• If the value specified in the ICV system initialization parameter is less than 10 seconds, it has no effecton the checking interval.
• If the value specified in the ICV system initialization parameter is greater than 10 seconds but less than600 seconds, the checking interval varies between the value specified in the ICV system initializationparameter, and 600 seconds. The first check is made after an interval corresponding to the value in theICV system initialization parameter, instead of being made after 10 seconds. The minimum checkinginterval is the value in the ICV system initialization parameter.
• If the value specified in the ICV system initialization parameter is greater than 600 seconds, thechecking interval does not vary, and always corresponds to the value in the ICV system initializationparameter.
For more information about this parameter, see ICV system initialization parameter.
Use the statistics field IGXQUERY in the CICS log manager statistics to monitor the number of checks thatCICS makes for the availability of the MVS logger.
Some conditions that cause CICS log manager error messagesProblems in the CICS log manager and its interface with the MVS system logger can arise from variousconditions, as a result of which the CICS region can fail because of loss of access to its system log. Youneed to be aware of the more common conditions, which (although very rare) result in a failure in thiscomponent of CICS.
In order to understand what has happened in a particular failure, it is helpful to look at the variouscombinations of messages that can be issued by CICS in different error situations. This approach is usefulin ensuring that you gather the necessary diagnostic information at the time of the failure, to enableaccurate problem determination and resolution. It also helps to ensure a rapid restart of the CICS region,with a full appreciation of the possible impact on data integrity.
The following CICS log manager messages cover some of the CICS logger failure situations. The morecommon message combinations are as follows:
DFHLG0772, DFHLG0800, and DFHLG0738DFHLG0772, DFHLG0800, DFHLG0736, and DFHLG0741DFHLG0772 and DFHLG0740DFHLG0772 and DFHLG0734DFHLG0002 and DFHLG0734
Note that if messages DFHLG0736, DFHLG0738, or DFHLG0740 are issued, CICS recovery manager setsits global catalog type-of-start override record to AUTODIAG. For more information, see “Restarting CICSafter a system log failure” on page 266.
Note: For details of all the return and reason codes for the MVS logger macros, see z/OS MVSProgramming: Authorized Assembler Services Reference (Volume 2).
Message DFHLG0772DFHLG0772 is the first message CICS issues if the MVS logger returns an exception condition in responseto a call to an IXGCONN, IXGWRITE, IXGBRWSE, or IXGDELET operation.
The MVS logger return and reason codes for the failure are given in the message, together with thename of the call and the attributes of the log stream being accessed at the time. Message DFHLG0772 isfollowed by one or more other messages when CICS has determined the extent of the problem.
Chapter 6. Dealing with the problem 263
CICS takes a system dump at the time the message is issued. This is the primary source of informationfor determining the cause of the error, and a dump from a DFHLG0772 should not be suppressed. See“Setting a SLIP trap for MVS logger errors and coupling facility errors” on page 271 for information on howto capture dumps of the MVS system logger address space and the coupling facility structure at the sametime. These three pieces of documentation are essential if you refer the problem to IBM service. You arealso recommended to run the DFHJUP utility to obtain printed output from the DFHLOG and DFHSHUNTsystem log streams before you restart a failed region.
If CICS decides the data integrity is compromised, or the problem is too serious to allow continuedoperation, it marks the system log as broken. CICS then begins automatic action to shut itself down.
Log block not found with DFHLG0800, DFHLG0736 and DFHLG0741If CICS issues DFHLG0772 with return code 8 and reason code IxgRsnCodeNoBlock (00000804), itmeans that the MVS logger could not find a log block requested by CICS, because the log data is missingfrom the log stream.
If this occurs after initialization is complete, CICS issues messages DFHLG0800, DFHLG0736 and at leastone DFHLG0741:
DFHLG0800This provides further diagnostic information to complement the system dump captured with thepreceding DFHLG0772 message.
DFHLG0800 gives the log stream block ID of the requested block and the block ID of the chainhistory point of the log block chain being read by CICS. The DFHLG0800 message is one of themost important pieces of diagnostic information when investigating a failure caused by an 00000804reason code.
DFHLG0736This message informs you that CICS is performing a normal shutdown, issued by system task CSQC,following the DFHLG0772 and DFHLG0800 messages.
The task that was executing when the error occurred is abended but cannot perform backout becauseof the failure (see message DFHLG0741).
Performing a normal shutdown allows all other existing tasks unaffected by the error to completenormally, but prevents new work from starting. Note that this phase of processing is exceptional inthat CICS cannot make any use of the system log either for reading or writing, and therefore updatesperformed by the tasks running in this phase are not recoverable: if one of these tasks abends, anyupdates it makes cannot be backed out by CICS. If a task does abend in this phase, capture details ofthe task from the associated message DFHLG0741 (see below).
If the other existing tasks complete normally with a successful syncpoint, CICS does not need to readthe log for any data that may have been written for these tasks before the system log failed. Thesesuccessfully completed tasks are unaffected by the failure, even though the log is marked as "broken".
DFHLG0741This message follows DFHLG0736, and identifies the task ID, the transaction ID and the terminal IDassociated with the task. There must be at least one task that has attempted to read the systemlog—the task that issued the log manager request that led to the DFHLG0772, DFHLG0800, andDFHLG0736 set of messages being issued. CICS suspends the task indefinitely with resource typeLGFREVER (meaning "logger wait forever"). The current UOW in the suspended task cannot beallowed to complete and commit its changes. This decision is taken because log data relating tothe UOW has been lost. Similarly, the UOW cannot be backed out by dynamic transaction backout,because the required before images cannot be read from the system log.
CICS issues a DFHLG0741 message for each task affected in this way. If any other in-flight tasksattempt backout (by issuing a SYNCPOINT ROLLBACK or ABEND command, or by failing and beingabended by CICS), these also are suspended LGFREVER. They are in the same position as the taskthat triggered the DFHLG0736 message. That is, they are attempting to retrieve log data from thesystem log, and CICS cannot guarantee the integrity of the system log because some of the log data isnot accessible by the MVS logger.
264 CICS TS for z/OS: Troubleshooting CICS
Note: The quiesce of CICS initiated with message DFHLG0736 continues until the in-flight taskson the system complete, either successfully by committing their updates, or by abending. Thosetasks that attempt a backout are suspended forever. CICS, therefore, is unable to complete a normalshutdown operation and hangs, requiring intervention to be terminated. This intervention can be byone of the following:
• Operator action• The shutdown assist transaction• A CICS monitor package.
The intervention is required because there is at least one task suspended indefinitely in an LGFREVERwait.
After DFHLG0800, DFHLG0736, and DFHLG0741, ensure that you perform a diagnostic start, followed byan initial start when you have successfully captured the diagnostics. See “Restarting CICS after a systemlog failure” on page 266 for details.
Log block not found with DFHLG0800 and DFHLG0738If CICS issues DFHLG0772 with return code 8 and reason code IxgRsnCodeNoBlock (00000804), itmeans that the MVS logger could not find a log block requested by CICS, because the log data is missingfrom the log stream.
If this occurs during initialization, CICS issues messages DFHLG0800 and DFHLG0738:
DFHLG0800This provides further diagnostic information to complement the system dump captured with thepreceding DFHLG0772 message.
DFHLG0800 gives the log stream block ID of the requested block and the block ID of the chainhistory point of the log block chain being read by CICS. The DFHLG0800 message is one of themost important pieces of diagnostic information when investigating a failure caused by an 00000804reason code.
DFHLG0738This informs you that CICS cannot continue initializing and is terminating. The MVS logger has failed toretrieve log data in which CICS has an interest during the restart, and because of this CICS cannot relyon the integrity of the system log.
After DFHLG0800 and DFHLG0738, ensure that you perform a diagnostic start, followed by an initial startwhen you have successfully captured the diagnostics. See “Restarting CICS after a system log failure” onpage 266 for details.
Loss of log data with DFHLG0740If DFHLG0772 gives the MVS system logger reason code as IxgRsnCodeLossOfDataGap (0000084B), itis followed by DFHLG0740.
DFHLG0740This explains that a write request to the system log completed successfully, but the MVS logger hasdetected that previously hardened log data has since been lost from the log. Therefore, the integrity ofthe system log is suspect, because CICS might need to refer to the missing log data at some point inthe future either for dynamic transaction backout of a UOW, or system recovery on either a cold, warmor emergency restart.
CICS initiates a quiesce of the system in the same way as for a DFHLG0736 message. If all in-flighttasks complete normally and commit their changes, they terminate successfully with no need to referto the system log, ensuring data integrity of local resources is maintained. However, as in the case ofDFHLG0741 (see above) if any in-flight tasks attempt backout (by issuing a SYNCPOINT ROLLBACK orABEND command, or by failing and being abended by CICS), these are suspended with resource typeLGFREVER. Any transactions that fail to complete before shutdown must be recovered by some otherway before starting CICS again.
Chapter 6. Dealing with the problem 265
CICS forces the next restart to be an initial start, because this is the only type of restart that has nointerest in any log data previously stored on the system log
Log error with DFHLG0734If CICS issues DFHLG0772 with a reason code other than block not found (IxgRsnCodeNoBlock) or lossof log data (IxgRsnCodeLossOfDataGap), it issues message DFHLG0734.DFHLG0734
This indicates a severe exception condition, indicated by the reason code in the precedingDFHLG0772 message and CICS immediately terminates. The problem should be investigated andthe error corrected before restarting CICS.
Under this abnormal termination CICS does attempt to allow in-flighttasks to complete. In this case, CICSdoes not force the next type of start to be an initial start. The type-of-restart indicator in the recoverymanager control record is set to "emergency restart needed," to ensure CICS performs an emergencyrestart. This is because the nature of this error and its resolution should allow a CICS emergency restart torestore the system to a committed state. This assumes the system log remains intact and is accessible toCICS when you perform the restart.
Message DFHLG0002This is a general message that is issued when a severe error has occurred within the CICS log managerdomain. The module in error is identified in the message, together with the unique error code value. CICStakes a system dump to allow problem determination of the severe error condition.
This is usually followed by another message, typically DFHLG0734.
Severe log manager error with DFHLG0734If CICS issues DFHLG0002, but determines that an emergency restart may resolve the error andsuccessfully recover in-flight tasks, CICS issues DFHLG0734.
DFHLG0734This indicates a severe exception condition, indicated by the reason code in the precedingDFHLG0002 message and CICS immediately terminates. The problem should be investigated andthe error corrected before restarting CICS.
The type-of-restart indicator in the recovery manager control record is set to "emergency restart needed,"to ensure CICS performs an emergency restart. This is because the nature of this error and its resolutioncould allow a CICS emergency restart to restore the system to a committed state. This assumes thesystem log remains intact and is accessible to CICS when you perform the restart.
Restarting CICS after a system log failureWhen you restart CICS with START=AUTO after a failure following DFHLG0736, DFHLG0738, orDFHLG0740, CICS initializes for a diagnostic run only.
About this taskOn a diagnostic run, CICS produces a dump of the CICS region state, retrieved from the CICS systemlog and then terminates. On a diagnostic run, CICS performs no recovery work and no new work. Thissituation persists until you start the region with an initial start.
A diagnostic run produces diagnostics for investigation by IBM Service. For example, if DFHLG0772reported return code 8 and reason code IxgRsnCodeNoBlock (00000804), but the associated systemdump is lost, the diagnostic run reproduces the dump (assuming the 00000804 condition is a solidfailure).
For information about the AUTODIAG type-of-start override record, see Specifying parameters forDFHRMUTL. For more details of a diagnostic run, see “Dealing with a corrupt system log” on page 273.
266 CICS TS for z/OS: Troubleshooting CICS
When you have obtained the required diagnostics and are ready to restart the region with the brokensystem log, you can do so only with an initial start. You can do this either by running the DFHRMUTLutility with the SET_AUTO_START=AUTOINIT parameter, or by specifying START=INITIAL as a systeminitialization parameter.
Procedure• Run the DFHRMUTL utility with the SET_AUTO_START=AUTOINIT parameter.• Alternatively, specify the START=INITIAL as a system initialization parameter.
ResultsAn initial start is the only form of CICS startup that does refer to log data written during the previous run.It is the only restart that is possible in these circumstances.
Diagnosing problems in the MVS loggerExtended waits by the CICS log manager can be caused by problems within the MVS logger or other areasof MVS. You can investigate these by looking at the MVS console messages.
About this taskLook at the following:
• “Console messages and dumps” on page 267• “GRS resource contention” on page 268• “Checking coupling facility structure and couple data set status” on page 269• “Checking log stream status” on page 269• “SMF and RMF statistics” on page 271• “Obtaining MVS logger and coupling facility dumps” on page 271• “Restarting the MVS logger address space” on page 273
Console messages and dumpsLook for:
• Outstanding WTOR messages• IXGxxx messages• Allocation, catalog and HSM error messages• IO errors for log stream data sets and LOGR couple data sets• IXCxxx messages, indicating problems with the coupling facility structure or couple data sets.• 1C5 abends, and other abends from the IXGLOGR address space.
Log stream data sets are of the form IXGLOGR.stream_name.Annnnnnn. The high level qualifier(IXGLOGR) may be different if the HLQ parameter was specified when the log stream was defined.
Explanations of MVS logger reason codes which are shown in CICS and MVS messages and traces are inthe IXGCON macro and in z/OS MVS Programming: Assembler Services Reference ABE-HSP .
Chapter 6. Dealing with the problem 267
GRS resource contentionTo check GRS resource contention by displaying GRS enqueues and latch usage on all machines in thesysplex, issue either of the following MVS commands.
The RO *ALL phrase means that the command goes to all systems in the sysplex:
RO *ALL,D GRS,C RO *ALL,D GRS,RES=(SYSZLOGR,*)
A normal response looks like:
D GRS,C ISG020I 12.06.49 GRS STATUS 647 NO ENQ CONTENTION EXISTS NO LATCH CONTENTION EXISTS D GRS,RES=(SYSZLOGR,*) ISG020I 14.04.28 GRS STATUS 952 NO REQUESTORS FOR RESOURCE SYSZLOGR *
A response showing GRS contention looks like this. You may also see latch set nameSYS.IXGLOGER_MISC:
D GRS,C ISG020I 12.06.31 GRS STATUS 619 LATCH SET NAME: SYS.IXGLOGER_LCBVT CREATOR JOBNAME: IXGLOGR CREATOR ASID: 0202 LATCH NUMBER: 7 REQUESTOR ASID EXC/SHR OWN/WAIT IXGLOGR 0202 EXCLUSIVE OWN IXGLOGR 0202 SHARED WAIT D GRS,RES=(SYSZLOGR,*) ISG020I 19.58.33 GRS STATUS 374 S=STEP SYSZLOGR 91 SYSNAME JOBNAME ASID TCBADDR EXC/SHR OWN/WAIT MV26 MSLDELC1 002F 008F6370 EXCLUSIVE OWN S=STEP SYSZLOGR 93 SYSNAME JOBNAME ASID TCBADDR EXC/SHR OWN/WAIT MV26 MSLWRTC1 002E 008DED90 EXCLUSIVE OWN MV26 MSLWRTC1 002E 008DB990 EXCLUSIVE WAIT MV26 MSLWRTC1 002E 008DB700 EXCLUSIVE WAIT MV26 MSLWRTC1 002E 008F60C8 EXCLUSIVE WAIT S=SYSTEMS SYSZLOGR LPAYROL.TESTLOG.TLOG1 SYSNAME JOBNAME ASID TCBADDR EXC/SHR OWN/WAIT MV27 IXGLOGR 0011 008F7398 EXCLUSIVE OWN MV26 IXGLOGR 0011 008F7398 EXCLUSIVE WAIT
This shows which tasks (that is, MVS TCBs) have exclusive enqueues on the log streams, and whichtasks are waiting for them. It is quite normal for enqueues and latches to be obtained, occasionally withcontention. They are indications of a problem only if they last for more than a minute or so.
Long term enqueuing on the SYSZLOGR resource can be a sign of problems even if there is no contention.
You can choose to display only those log streams exclusively enqueued on by CICS jobs in the sysplex.Issue the following MVS command:
D GRS,RES=(DFHSTRM,*)
A typical response to this command looks like this:
ISG020I 14.51.28 GRS STATUS 541 S=SYSTEMS DFHSTRM PAYROL.CICSVR.DFHLGLOG SYSNAME JOBNAME ASID TCBADDR EXC/SHR OWN/WAIT MV29 PAYROL91 0042 007D9108 SHARE OWN MV29 PAYROL93 0044 007D9138 SHARE OWN S=SYSTEMS DFHSTRM PAYROL.FWDRECOV.UTL3 SYSNAME JOBNAME ASID TCBADDR EXC/SHR OWN/WAIT
268 CICS TS for z/OS: Troubleshooting CICS
MV29 PAYROL91 0042 007D9108 SHARE OWN MV29 PAYROL93 0044 007D9138 SHARE OWN S=SYSTEMS DFHSTRM PAYROL.IYK8ZET1.DFHJ02 SYSNAME JOBNAME ASID TCBADDR EXC/SHR OWN/WAIT MV29 PAYROL91 0042 007D9108 SHARE OWN S=SYSTEMS DFHSTRM PAYROL.IYK8ZET1.DFHLOG SYSNAME JOBNAME ASID TCBADDR EXC/SHR OWN/WAIT MV29 PAYROL91 0042 007D9108 EXCLUSIVE OWN S=SYSTEMS DFHSTRM PAYROL.IYK8ZET1.DFHSHUNT SYSNAME JOBNAME ASID TCBADDR EXC/SHR OWN/WAIT MV29 PAYROL91 0042 007D9108 EXCLUSIVE OWN S=SYSTEMS DFHSTRM PAYROL.IYK8ZET3.DFHJ02 SYSNAME JOBNAME ASID TCBADDR EXC/SHR OWN/WAIT MV29 PAYROL93 0044 007D9138 SHARE OWN S=SYSTEMS DFHSTRM PAYROL.IYK8ZET3.DFHLOG SYSNAME JOBNAME ASID TCBADDR EXC/SHR OWN/WAIT MV29 PAYROL93 0044 007D9138 EXCLUSIVE OWN S=SYSTEMS DFHSTRM PAYROL.IYK8ZET3.DFHSHUNT SYSNAME JOBNAME ASID TCBADDR EXC/SHR OWN/WAIT MV29 PAYROL93 0044 007D9138 EXCLUSIVE OWN
Checking coupling facility structure and couple data set statusTo display the MVS logger couple data set status, issue the following MVS command:
D XCF,CPL,TYPE=LOGR
A normal response looks like this:
D XCF,CPL,TYPE=LOGR IXC358I 14.47.51 DISPLAY XCF 391 LOGR COUPLE DATA SETS PRIMARY DSN: SYS1.SYSPLEX2.SEQ26.PLOGR VOLSER: P2SS05 DEVN: 230D FORMAT TOD MAXSYSTEM 12/20/95 09:25:48 8 ALTERNATE DSN: SYS1.SYSPLEX2.SEQ26.ALOGR VOLSER: P2SS06 DEVN: 2C10 FORMAT TOD MAXSYSTEM 12/20/95 09:27:45 8 LOGR IN USE BY ALL SYSTEMS
If the response shows that LOGR is not in use by all systems, there may be a problem to investigate. Lookfor IXCxxx messages which might indicate the cause of the problem and issue the following command toattempt reconnection to the couple data set:
SETXCF CPL,TYPE=(LOGR),PCOUPLE=(couple_dataset_name)
To display all structures with Failed_persistent connections, issue the following MVS command:
D XCF,STR,STRNM=*,STATUS=FPCONN
The MVS logger should resolve any failed connections.
Checking log stream statusTo display information about the status of CICS log streams, a batch job should issue the IXCMIAPUcommand:
LIST LOGSTREAM NAME(streamname) DETAIL(YES)
You can use wildcards to select multiple log streams. For example, the following job produces a report onthe system log streams for CICS region IYLX4:
//IYLXLIST JOB NOTIFY=WILLIN,MSGCLASS=A //LOGLIST EXEC PGM=IXCMIAPU //SYSPRINT DD SYSOUT=A,DCB=RECFM=FBA //SYSIN DD * DATA TYPE(LOGR) REPORT(NO) LIST LOGSTREAM NAME(WILLIN.IYLX4.DFH*) DETAIL(YES)
Chapter 6. Dealing with the problem 269
Figure 34 on page 270 shows a typical response to this command, with system logs streams for CICSregion IYXL4.
LOGSTREAM NAME(WILLIN.IYLX4.DFHLOG) STRUCTNAME() LS_DATACLAS() LS_MGMTCLAS() LS_STORCLAS() HLQ(IXGLOGR) MODEL(NO) LS_SIZE(0) STG_MGMTCLAS() STG_STORCLAS() STG_DATACLAS() STG_SIZE(0) LOWOFFLOAD(40) HIGHOFFLOAD(85) STG_DUPLEX(YES) DUPLEXMODE(UNCOND) RMNAME() DESCRIPTION() RETPD(0) AUTODELETE(NO) DASDONLY(YES) MAXBUFSIZE(64000) LOG STREAM ATTRIBUTES: User Data: 0000000000000000000000000000000000000000000000000000000000000000 0000000000000000000000000000000000000000000000000000000000000000 LOG STREAM CONNECTION INFO: SYSTEMS CONNECTED: 1 SYSTEM STRUCTURE CON CONNECTION CONNECTION NAME VERSION ID VERSION STATE -------- ---------------- -- ---------- ---------- MV28 0000000000000000 00 00000000 N/A
LOG STREAM DATA SET INFO: DATA SET NAMES IN USE: IXGLOGR.WILLIN.IYLX4.DFHLOG.<SEQ#> Ext. <SEQ#> Lowest Blockid Highest GMT Highest Local ----- -------- ---------------- ----------------- --------------- *00001 A0000007 0000000000496BAB 07/18/97 08:29:13 07/18/97 09:29: NUMBER OF DATA SETS IN LOG STREAM: 1 POSSIBLE ORPHANED LOG STREAM DATA SETS: DATA SET NAMES: -------------------------------------------- IXGLOGR.WILLIN.IYLX4.DFHLOG.A0000037 IXGLOGR.WILLIN.IYLX4.DFHLOG.A0000404 NUMBER OF POSSIBLE ORPHANED LOG STREAM DATA SETS: 2
LOGSTREAM NAME(WILLIN.IYLX4.DFHSHUNT) STRUCTNAME() LS_DATACLAS() LS_MGMTCLAS() LS_STORCLAS() HLQ(IXGLOGR) MODEL(NO) LS_SIZE(0) STG_MGMTCLAS() STG_STORCLAS() STG_DATACLAS() STG_SIZE(0) LOWOFFLOAD(0) HIGHOFFLOAD(80) STG_DUPLEX(YES) DUPLEXMODE(UNCOND) RMNAME() DESCRIPTION() RETPD(0) AUTODELETE(NO) DASDONLY(YES) MAXBUFSIZE(64000) LOG STREAM ATTRIBUTES: User Data: 0000000000000000000000000000000000000000000000000000000000000000 0000000000000000000000000000000000000000000000000000000000000000 LOG STREAM CONNECTION INFO: SYSTEMS CONNECTED: 1 SYSTEM STRUCTURE CON CONNECTION CONNECTION NAME VERSION ID VERSION STATE -------- ---------------- -- ---------- ---------- MV28 0000000000000000 00 00000000 N/A LOG STREAM DATA SET INFO: DATA SET NAMES IN USE: IXGLOGR.WILLIN.IYLX4.DFHSHUNT.<SEQ#> Ext. <SEQ#> Lowest Blockid Highest GMT Highest Local ----- -------- ---------------- ----------------- --------------- *00001 A0000000 0000000000001F1E 07/16/97 12:52:22 07/16/97 13:52: NUMBER OF DATA SETS IN LOG STREAM: 1 POSSIBLE ORPHANED LOG STREAM DATA SETS: NUMBER OF POSSIBLE ORPHANED LOG STREAM DATA SETS: 0
Figure 34. Example output produced by the LIST LOGSTREAM NAME command
If you are using coupling facility log streams, the IXCMIAPU LIST STRUCTURE NAME(structname)DETAIL(YES) command is useful in finding the status of CICS log stream structures. For furtherinformation about these commands, see z/OS MVS Setting Up a Sysplex.
270 CICS TS for z/OS: Troubleshooting CICS
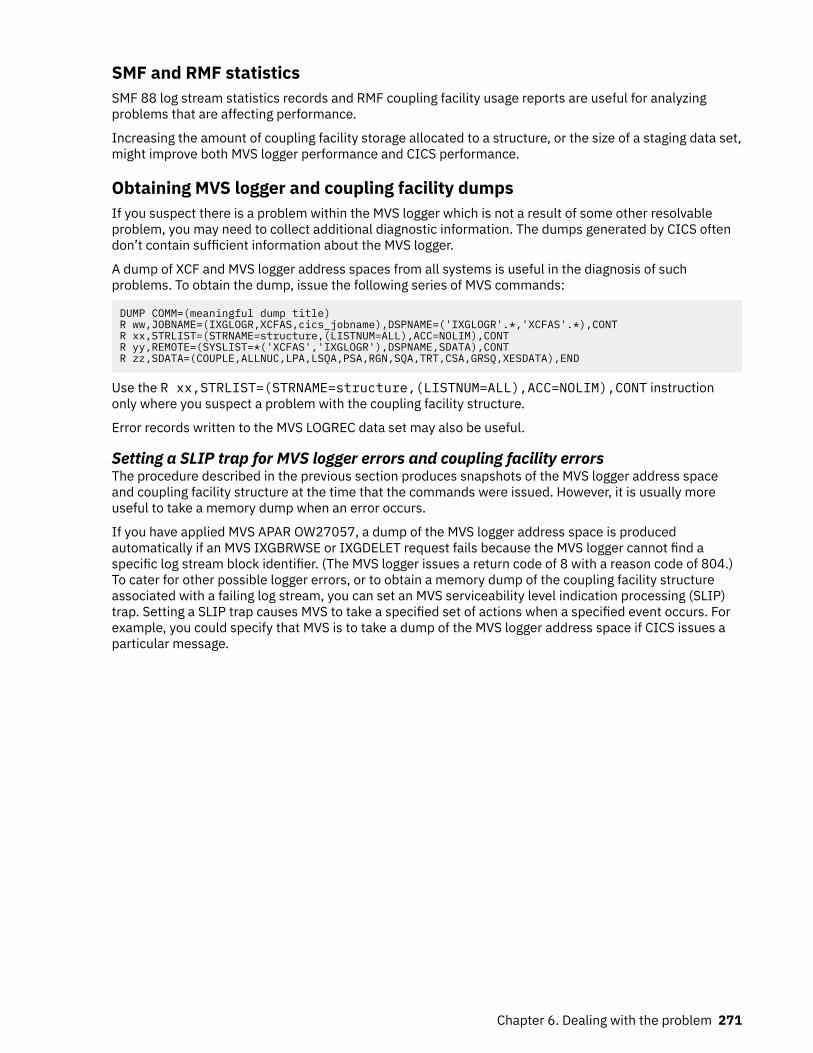
SMF and RMF statisticsSMF 88 log stream statistics records and RMF coupling facility usage reports are useful for analyzingproblems that are affecting performance.
Increasing the amount of coupling facility storage allocated to a structure, or the size of a staging data set,might improve both MVS logger performance and CICS performance.
Obtaining MVS logger and coupling facility dumpsIf you suspect there is a problem within the MVS logger which is not a result of some other resolvableproblem, you may need to collect additional diagnostic information. The dumps generated by CICS oftendon’t contain sufficient information about the MVS logger.
A dump of XCF and MVS logger address spaces from all systems is useful in the diagnosis of suchproblems. To obtain the dump, issue the following series of MVS commands:
DUMP COMM=(meaningful dump title)R ww,JOBNAME=(IXGLOGR,XCFAS,cics_jobname),DSPNAME=('IXGLOGR'.*,'XCFAS'.*),CONTR xx,STRLIST=(STRNAME=structure,(LISTNUM=ALL),ACC=NOLIM),CONTR yy,REMOTE=(SYSLIST=*('XCFAS','IXGLOGR'),DSPNAME,SDATA),CONTR zz,SDATA=(COUPLE,ALLNUC,LPA,LSQA,PSA,RGN,SQA,TRT,CSA,GRSQ,XESDATA),END
Use the R xx,STRLIST=(STRNAME=structure,(LISTNUM=ALL),ACC=NOLIM),CONT instructiononly where you suspect a problem with the coupling facility structure.
Error records written to the MVS LOGREC data set may also be useful.
Setting a SLIP trap for MVS logger errors and coupling facility errorsThe procedure described in the previous section produces snapshots of the MVS logger address spaceand coupling facility structure at the time that the commands were issued. However, it is usually moreuseful to take a memory dump when an error occurs.
If you have applied MVS APAR OW27057, a dump of the MVS logger address space is producedautomatically if an MVS IXGBRWSE or IXGDELET request fails because the MVS logger cannot find aspecific log stream block identifier. (The MVS logger issues a return code of 8 with a reason code of 804.)To cater for other possible logger errors, or to obtain a memory dump of the coupling facility structureassociated with a failing log stream, you can set an MVS serviceability level indication processing (SLIP)trap. Setting a SLIP trap causes MVS to take a specified set of actions when a specified event occurs. Forexample, you could specify that MVS is to take a dump of the MVS logger address space if CICS issues aparticular message.
Chapter 6. Dealing with the problem 271
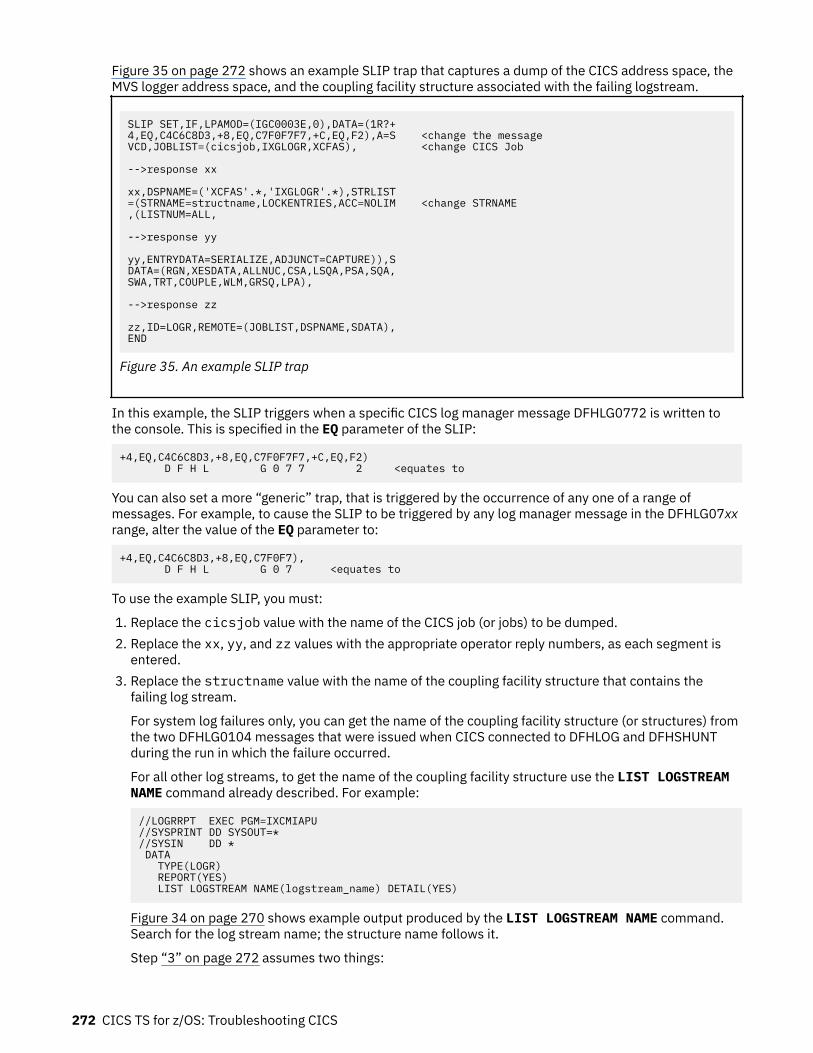
Figure 35 on page 272 shows an example SLIP trap that captures a dump of the CICS address space, theMVS logger address space, and the coupling facility structure associated with the failing logstream.
SLIP SET,IF,LPAMOD=(IGC0003E,0),DATA=(1R?+4,EQ,C4C6C8D3,+8,EQ,C7F0F7F7,+C,EQ,F2),A=S <change the messageVCD,JOBLIST=(cicsjob,IXGLOGR,XCFAS), <change CICS Job -->response xx xx,DSPNAME=('XCFAS'.*,'IXGLOGR'.*),STRLIST=(STRNAME=structname,LOCKENTRIES,ACC=NOLIM <change STRNAME,(LISTNUM=ALL, -->response yy yy,ENTRYDATA=SERIALIZE,ADJUNCT=CAPTURE)),SDATA=(RGN,XESDATA,ALLNUC,CSA,LSQA,PSA,SQA,SWA,TRT,COUPLE,WLM,GRSQ,LPA), -->response zz zz,ID=LOGR,REMOTE=(JOBLIST,DSPNAME,SDATA),END
Figure 35. An example SLIP trap
In this example, the SLIP triggers when a specific CICS log manager message DFHLG0772 is written tothe console. This is specified in the EQ parameter of the SLIP:
+4,EQ,C4C6C8D3,+8,EQ,C7F0F7F7,+C,EQ,F2) D F H L G 0 7 7 2 <equates to
You can also set a more “generic” trap, that is triggered by the occurrence of any one of a range ofmessages. For example, to cause the SLIP to be triggered by any log manager message in the DFHLG07xxrange, alter the value of the EQ parameter to:
+4,EQ,C4C6C8D3,+8,EQ,C7F0F7), D F H L G 0 7 <equates to
To use the example SLIP, you must:
1. Replace the cicsjob value with the name of the CICS job (or jobs) to be dumped.2. Replace the xx, yy, and zz values with the appropriate operator reply numbers, as each segment is
entered.3. Replace the structname value with the name of the coupling facility structure that contains the
failing log stream.
For system log failures only, you can get the name of the coupling facility structure (or structures) fromthe two DFHLG0104 messages that were issued when CICS connected to DFHLOG and DFHSHUNTduring the run in which the failure occurred.
For all other log streams, to get the name of the coupling facility structure use the LIST LOGSTREAMNAME command already described. For example:
//LOGRRPT EXEC PGM=IXCMIAPU//SYSPRINT DD SYSOUT=*//SYSIN DD * DATA TYPE(LOGR) REPORT(YES) LIST LOGSTREAM NAME(logstream_name) DETAIL(YES)
Figure 34 on page 270 shows example output produced by the LIST LOGSTREAM NAME command.Search for the log stream name; the structure name follows it.
Step “3” on page 272 assumes two things:
272 CICS TS for z/OS: Troubleshooting CICS
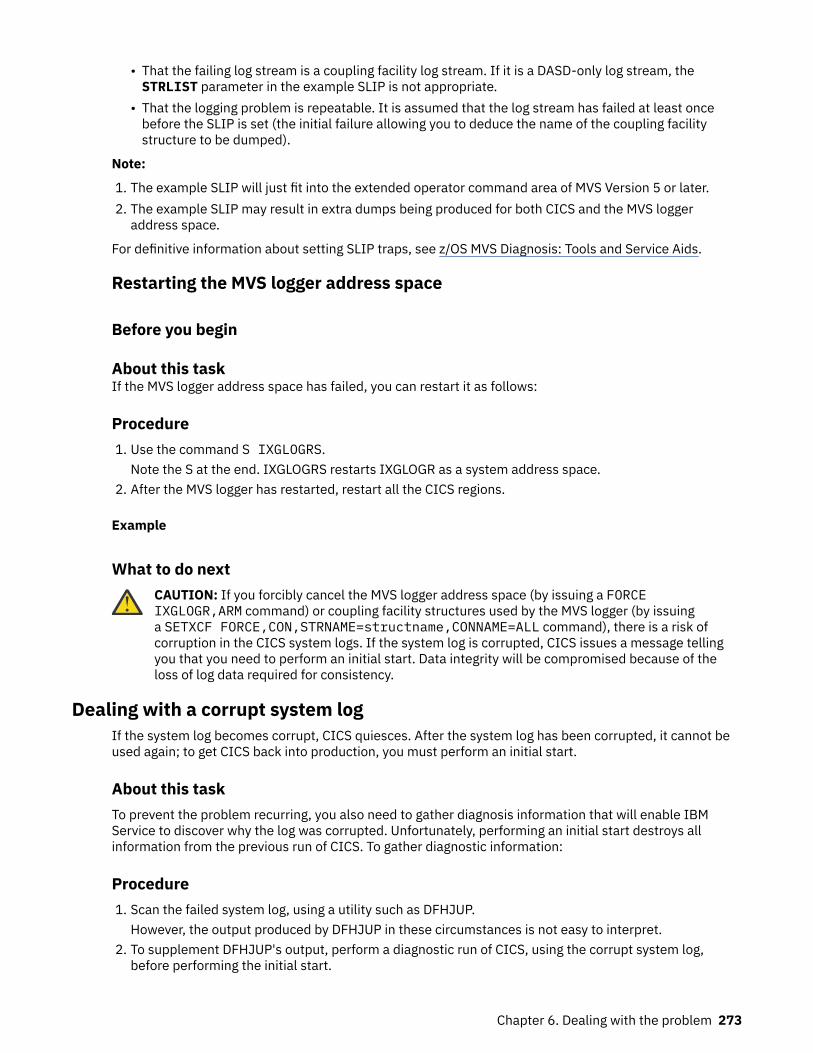
• That the failing log stream is a coupling facility log stream. If it is a DASD-only log stream, theSTRLIST parameter in the example SLIP is not appropriate.
• That the logging problem is repeatable. It is assumed that the log stream has failed at least oncebefore the SLIP is set (the initial failure allowing you to deduce the name of the coupling facilitystructure to be dumped).
Note:
1. The example SLIP will just fit into the extended operator command area of MVS Version 5 or later.2. The example SLIP may result in extra dumps being produced for both CICS and the MVS logger
address space.
For definitive information about setting SLIP traps, see z/OS MVS Diagnosis: Tools and Service Aids.
Restarting the MVS logger address space
Before you begin
About this taskIf the MVS logger address space has failed, you can restart it as follows:
Procedure1. Use the command S IXGLOGRS.
Note the S at the end. IXGLOGRS restarts IXGLOGR as a system address space.2. After the MVS logger has restarted, restart all the CICS regions.
Example
What to do nextCAUTION: If you forcibly cancel the MVS logger address space (by issuing a FORCEIXGLOGR,ARM command) or coupling facility structures used by the MVS logger (by issuinga SETXCF FORCE,CON,STRNAME=structname,CONNAME=ALL command), there is a risk ofcorruption in the CICS system logs. If the system log is corrupted, CICS issues a message tellingyou that you need to perform an initial start. Data integrity will be compromised because of theloss of log data required for consistency.
Dealing with a corrupt system logIf the system log becomes corrupt, CICS quiesces. After the system log has been corrupted, it cannot beused again; to get CICS back into production, you must perform an initial start.
About this taskTo prevent the problem recurring, you also need to gather diagnosis information that will enable IBMService to discover why the log was corrupted. Unfortunately, performing an initial start destroys allinformation from the previous run of CICS. To gather diagnostic information:
Procedure1. Scan the failed system log, using a utility such as DFHJUP.
However, the output produced by DFHJUP in these circumstances is not easy to interpret.2. To supplement DFHJUP's output, perform a diagnostic run of CICS, using the corrupt system log,
before performing the initial start.
Chapter 6. Dealing with the problem 273
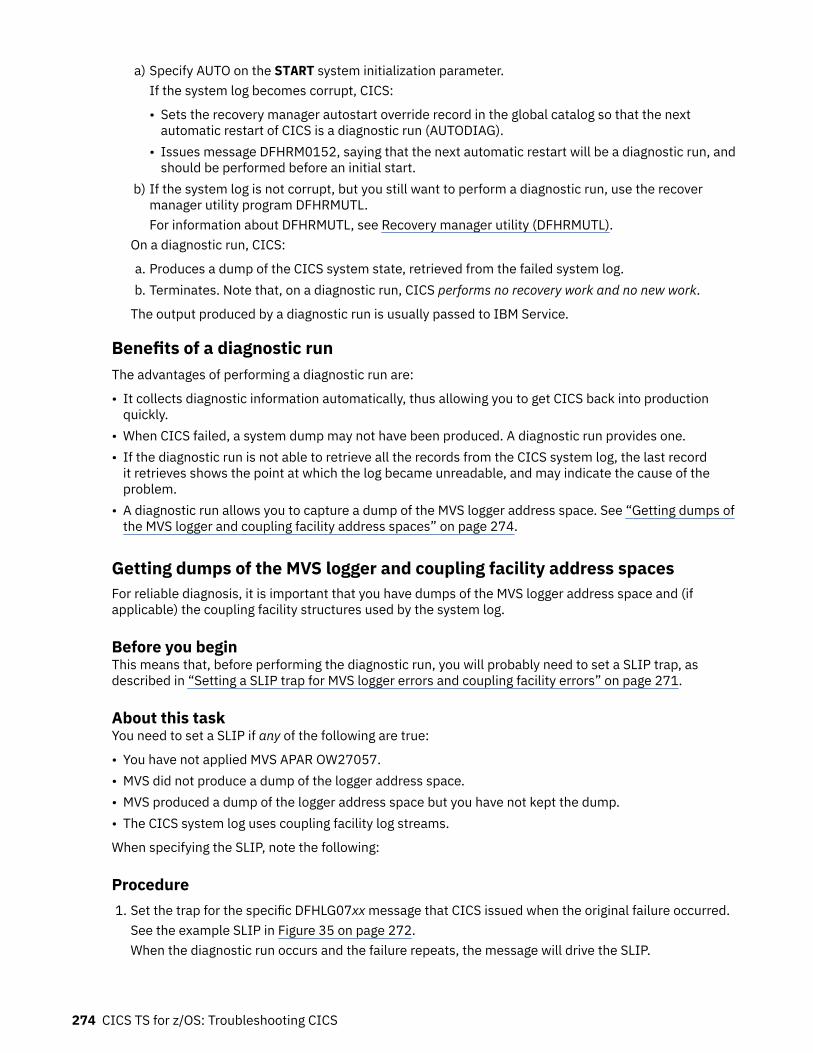
a) Specify AUTO on the START system initialization parameter.If the system log becomes corrupt, CICS:
• Sets the recovery manager autostart override record in the global catalog so that the nextautomatic restart of CICS is a diagnostic run (AUTODIAG).
• Issues message DFHRM0152, saying that the next automatic restart will be a diagnostic run, andshould be performed before an initial start.
b) If the system log is not corrupt, but you still want to perform a diagnostic run, use the recovermanager utility program DFHRMUTL.For information about DFHRMUTL, see Recovery manager utility (DFHRMUTL).
On a diagnostic run, CICS:
a. Produces a dump of the CICS system state, retrieved from the failed system log.b. Terminates. Note that, on a diagnostic run, CICS performs no recovery work and no new work.
The output produced by a diagnostic run is usually passed to IBM Service.
Benefits of a diagnostic runThe advantages of performing a diagnostic run are:
• It collects diagnostic information automatically, thus allowing you to get CICS back into productionquickly.
• When CICS failed, a system dump may not have been produced. A diagnostic run provides one.• If the diagnostic run is not able to retrieve all the records from the CICS system log, the last record
it retrieves shows the point at which the log became unreadable, and may indicate the cause of theproblem.
• A diagnostic run allows you to capture a dump of the MVS logger address space. See “Getting dumps ofthe MVS logger and coupling facility address spaces” on page 274.
Getting dumps of the MVS logger and coupling facility address spacesFor reliable diagnosis, it is important that you have dumps of the MVS logger address space and (ifapplicable) the coupling facility structures used by the system log.
Before you beginThis means that, before performing the diagnostic run, you will probably need to set a SLIP trap, asdescribed in “Setting a SLIP trap for MVS logger errors and coupling facility errors” on page 271.
About this taskYou need to set a SLIP if any of the following are true:
• You have not applied MVS APAR OW27057.• MVS did not produce a dump of the logger address space.• MVS produced a dump of the logger address space but you have not kept the dump.• The CICS system log uses coupling facility log streams.
When specifying the SLIP, note the following:
Procedure1. Set the trap for the specific DFHLG07xx message that CICS issued when the original failure occurred.
See the example SLIP in Figure 35 on page 272.When the diagnostic run occurs and the failure repeats, the message will drive the SLIP.
274 CICS TS for z/OS: Troubleshooting CICS
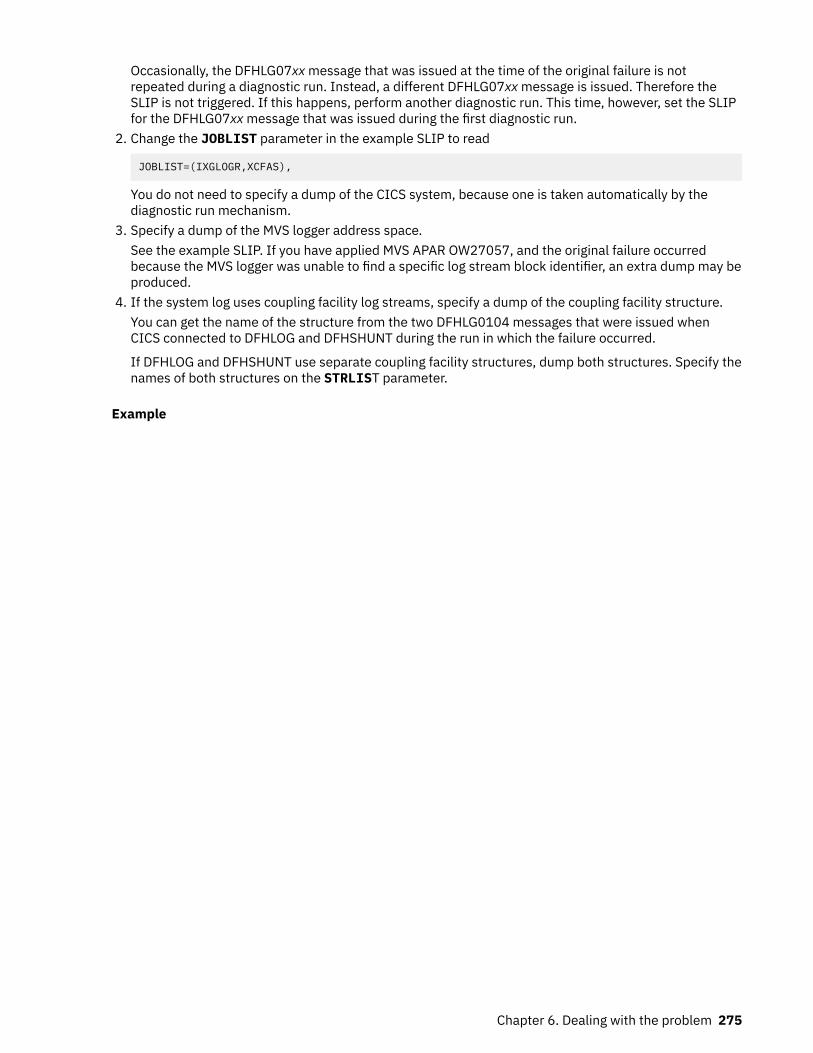
Occasionally, the DFHLG07xx message that was issued at the time of the original failure is notrepeated during a diagnostic run. Instead, a different DFHLG07xx message is issued. Therefore theSLIP is not triggered. If this happens, perform another diagnostic run. This time, however, set the SLIPfor the DFHLG07xx message that was issued during the first diagnostic run.
2. Change the JOBLIST parameter in the example SLIP to read
JOBLIST=(IXGLOGR,XCFAS),
You do not need to specify a dump of the CICS system, because one is taken automatically by thediagnostic run mechanism.
3. Specify a dump of the MVS logger address space.See the example SLIP. If you have applied MVS APAR OW27057, and the original failure occurredbecause the MVS logger was unable to find a specific log stream block identifier, an extra dump may beproduced.
4. If the system log uses coupling facility log streams, specify a dump of the coupling facility structure.You can get the name of the structure from the two DFHLG0104 messages that were issued whenCICS connected to DFHLOG and DFHSHUNT during the run in which the failure occurred.
If DFHLOG and DFHSHUNT use separate coupling facility structures, dump both structures. Specify thenames of both structures on the STRLIST parameter.
Example
Chapter 6. Dealing with the problem 275

276 CICS TS for z/OS: Troubleshooting CICS
Chapter 7. Working with IBM to solve your problemThe IBM Support organization is a global network of centers, with expertise across the IBM productportfolio. It provides you with the responsive software support that you require.
For information about how to contact and work with IBM Support, refer to the IBM Software SupportHandbook.
Collecting CICS troubleshooting data (CICS MustGather) for IBMSupport
When you encounter a problem in CICS Transaction Server for z/OS (CICS TS), before you contact IBMSupport, ensure that you collect troubleshooting data, also known as MustGather. CICS Support can usetroubleshooting data to identify and resolve your specific problem. Different symptoms require differentdata. MustGather documents expedite the troubleshooting process and save you time. The followinginformation applies to all CICS versions unless otherwise specified.
General informationGather the following general information for every problem record:
1. A complete description of the problem that includes the following questions:
a. When did the problem first occur?b. Is the problem a one time failure or recurring?c. Was software or hardware maintenance applied?d. Did the failure occur while doing a specific task?e. Is the failure occurring in more than one address space?
2. CICS product version, release, and maintenance level3. Operating system version, release, and maintenance level4. Related products version, and release levels5. Your valid contact phone number and email address
Component-specific informationAfter you collect general information, gather information that is specific to your component. From thefollowing list, click the problem type or component to view a listing of specific documentation that thesupport team requires to diagnose your problem:
• Abend 878 or 80A• Ansible® IBM z/OS CICS collection• CICS-MQ adapter or CICS-MQ bridge• CICSPlex SM• CMCI JVM server• Coupling facility data table server• Db2• Dynamic Scripting for CICS TS 5.1 or later• Dynamic Scripting for CICS TS 4.2 or CICS TS 4.1• Event processing• Explorer errors or incorrect output
© Copyright IBM Corp. 1974, 2021 277
• Explorer UI not available or not stable• File control (non-RLS)• File control (RLS)• IMS Database Control (DBCTL)• IBM Documentation• Intersystem communication (ISC)• IP interconnectivity (IPIC)• Java (JVM server)• Logger• Language Environment (LE) abend• LIBRARY management• Mobile extensions• Multiregion operation (MRO)• Node.js applications• Performance• Policies• Program checks or abends• SFR (Service Flow Runtime)• Shared data tables (SDT)• Short on storage (SOS)• Storage violation• Terminal hang• Temporary storage servers• Waits or loops• Web services, XML, and JSON transformation
Tip:
• Search the CICS support site for known problems using symptoms like the message number and errorcodes.
• If you find a fixing PTF, see Ordering CICS products and maintenance for the options that are availableto order CICS maintenance.
• Gather the documentation and work with the CICS support team to resolve your problem.
Troubleshooting data for Abend 878 or 80A problemsCICS MustGather for Abend 878 or 80A problems
If the available MVS storage is not enough to satisfy an MVS GETMAIN request, you might have an abend878 or an abend 80A problem in CICS TS. To determine the type of storage that is requested, see theexplanation of system completion codes 878 in z/OS MVS System Codes and 80A in z/OS MVS SystemCodes. Abend 0F9 and 40D might occur when MVS does not have enough storage to create the dump forthe abend 80A or 878.
Gather the following diagnostic information before contacting the CICS support team to troubleshoot yourAbend 878 or 80A problems.
Required data:
1. The MVS system dump that is taken when an out of storage condition occurs.
278 CICS TS for z/OS: Troubleshooting CICS
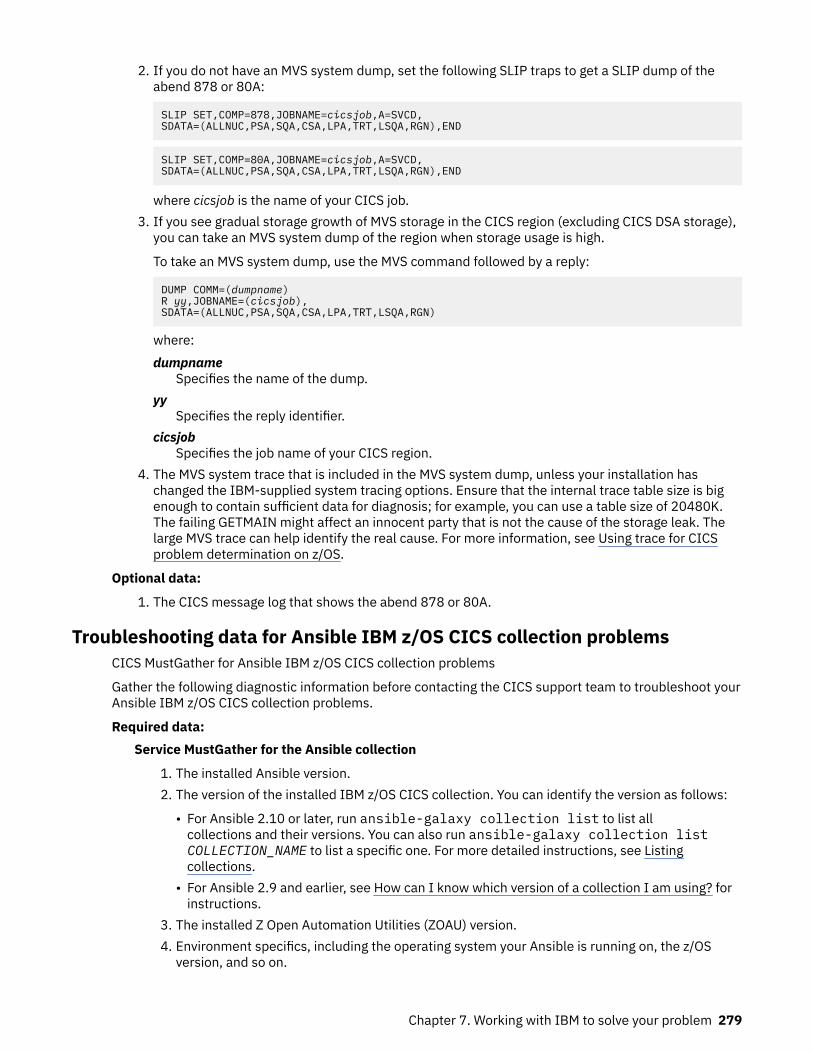
2. If you do not have an MVS system dump, set the following SLIP traps to get a SLIP dump of theabend 878 or 80A:
SLIP SET,COMP=878,JOBNAME=cicsjob,A=SVCD,SDATA=(ALLNUC,PSA,SQA,CSA,LPA,TRT,LSQA,RGN),END
SLIP SET,COMP=80A,JOBNAME=cicsjob,A=SVCD,SDATA=(ALLNUC,PSA,SQA,CSA,LPA,TRT,LSQA,RGN),END
where cicsjob is the name of your CICS job.3. If you see gradual storage growth of MVS storage in the CICS region (excluding CICS DSA storage),
you can take an MVS system dump of the region when storage usage is high.
To take an MVS system dump, use the MVS command followed by a reply:
DUMP COMM=(dumpname)R yy,JOBNAME=(cicsjob),SDATA=(ALLNUC,PSA,SQA,CSA,LPA,TRT,LSQA,RGN)
where:dumpname
Specifies the name of the dump.yy
Specifies the reply identifier.cicsjob
Specifies the job name of your CICS region.4. The MVS system trace that is included in the MVS system dump, unless your installation has
changed the IBM-supplied system tracing options. Ensure that the internal trace table size is bigenough to contain sufficient data for diagnosis; for example, you can use a table size of 20480K.The failing GETMAIN might affect an innocent party that is not the cause of the storage leak. Thelarge MVS trace can help identify the real cause. For more information, see Using trace for CICSproblem determination on z/OS.
Optional data:
1. The CICS message log that shows the abend 878 or 80A.
Troubleshooting data for Ansible IBM z/OS CICS collection problemsCICS MustGather for Ansible IBM z/OS CICS collection problems
Gather the following diagnostic information before contacting the CICS support team to troubleshoot yourAnsible IBM z/OS CICS collection problems.
Required data:Service MustGather for the Ansible collection
1. The installed Ansible version.2. The version of the installed IBM z/OS CICS collection. You can identify the version as follows:
• For Ansible 2.10 or later, run ansible-galaxy collection list to list allcollections and their versions. You can also run ansible-galaxy collection listCOLLECTION_NAME to list a specific one. For more detailed instructions, see Listingcollections.
• For Ansible 2.9 and earlier, see How can I know which version of a collection I am using? forinstructions.
3. The installed Z Open Automation Utilities (ZOAU) version.4. Environment specifics, including the operating system your Ansible is running on, the z/OS
version, and so on.
Chapter 7. Working with IBM to solve your problem 279
https://www.ibm.com/support/knowledgecenter/SSGMCP_latest/troubleshooting/cics/quickstart-trace.html
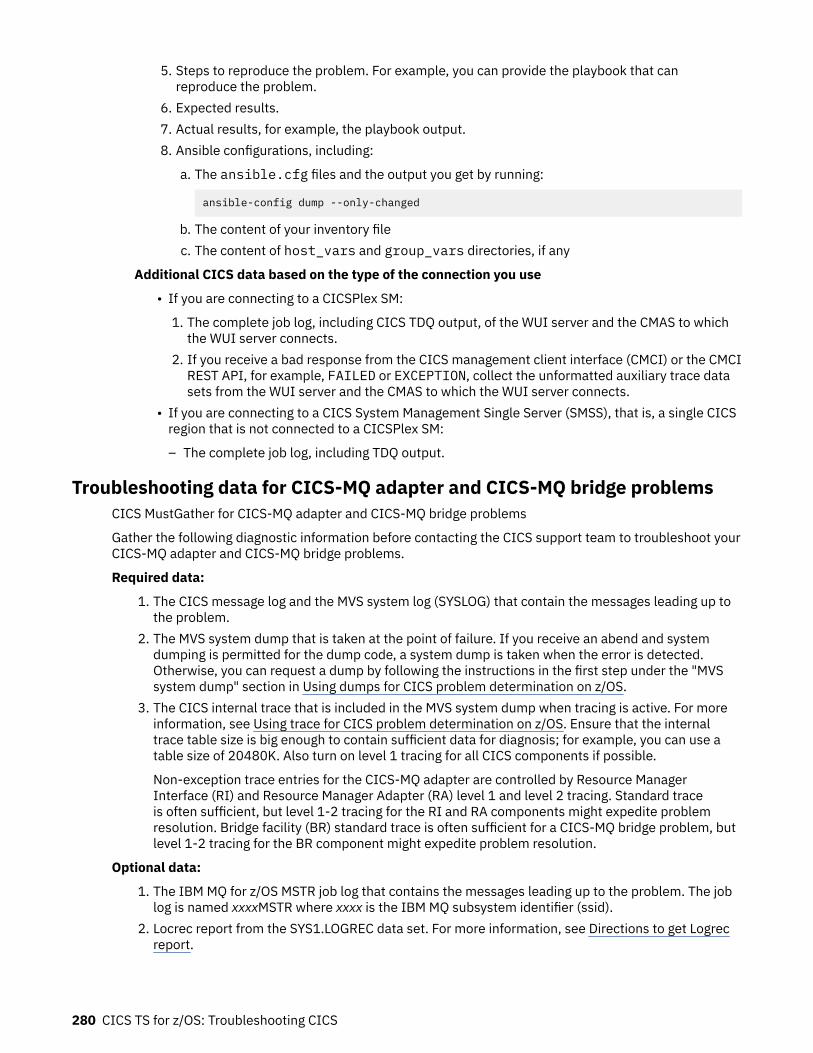
5. Steps to reproduce the problem. For example, you can provide the playbook that canreproduce the problem.
6. Expected results.7. Actual results, for example, the playbook output.8. Ansible configurations, including:
a. The ansible.cfg files and the output you get by running:
ansible-config dump --only-changed
b. The content of your inventory filec. The content of host_vars and group_vars directories, if any
Additional CICS data based on the type of the connection you use
• If you are connecting to a CICSPlex SM:
1. The complete job log, including CICS TDQ output, of the WUI server and the CMAS to whichthe WUI server connects.
2. If you receive a bad response from the CICS management client interface (CMCI) or the CMCIREST API, for example, FAILED or EXCEPTION, collect the unformatted auxiliary trace datasets from the WUI server and the CMAS to which the WUI server connects.
• If you are connecting to a CICS System Management Single Server (SMSS), that is, a single CICSregion that is not connected to a CICSPlex SM:
– The complete job log, including TDQ output.
Troubleshooting data for CICS-MQ adapter and CICS-MQ bridge problemsCICS MustGather for CICS-MQ adapter and CICS-MQ bridge problems
Gather the following diagnostic information before contacting the CICS support team to troubleshoot yourCICS-MQ adapter and CICS-MQ bridge problems.
Required data:
1. The CICS message log and the MVS system log (SYSLOG) that contain the messages leading up tothe problem.
2. The MVS system dump that is taken at the point of failure. If you receive an abend and systemdumping is permitted for the dump code, a system dump is taken when the error is detected.Otherwise, you can request a dump by following the instructions in the first step under the "MVSsystem dump" section in Using dumps for CICS problem determination on z/OS.
3. The CICS internal trace that is included in the MVS system dump when tracing is active. For moreinformation, see Using trace for CICS problem determination on z/OS. Ensure that the internaltrace table size is big enough to contain sufficient data for diagnosis; for example, you can use atable size of 20480K. Also turn on level 1 tracing for all CICS components if possible.
Non-exception trace entries for the CICS-MQ adapter are controlled by Resource ManagerInterface (RI) and Resource Manager Adapter (RA) level 1 and level 2 tracing. Standard traceis often sufficient, but level 1-2 tracing for the RI and RA components might expedite problemresolution. Bridge facility (BR) standard trace is often sufficient for a CICS-MQ bridge problem, butlevel 1-2 tracing for the BR component might expedite problem resolution.
Optional data:
1. The IBM MQ for z/OS MSTR job log that contains the messages leading up to the problem. The joblog is named xxxxMSTR where xxxx is the IBM MQ subsystem identifier (ssid).
2. Locrec report from the SYS1.LOGREC data set. For more information, see Directions to get Logrecreport.
280 CICS TS for z/OS: Troubleshooting CICS
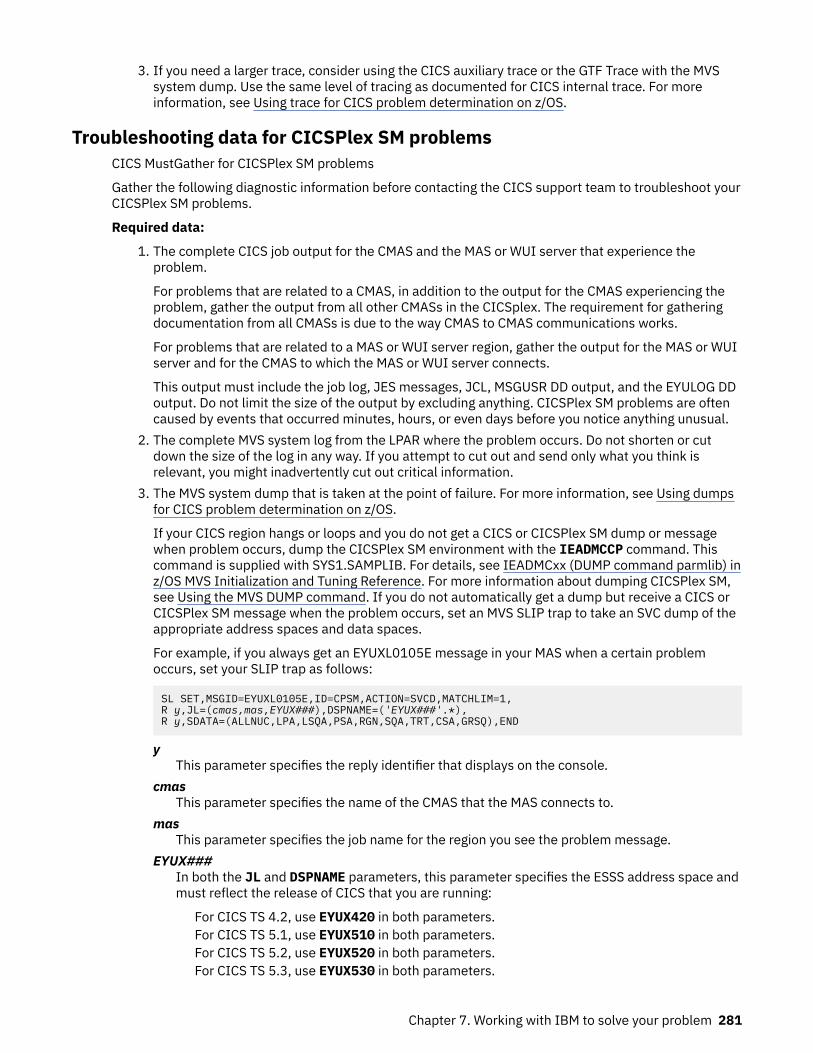
3. If you need a larger trace, consider using the CICS auxiliary trace or the GTF Trace with the MVSsystem dump. Use the same level of tracing as documented for CICS internal trace. For moreinformation, see Using trace for CICS problem determination on z/OS.
Troubleshooting data for CICSPlex SM problemsCICS MustGather for CICSPlex SM problems
Gather the following diagnostic information before contacting the CICS support team to troubleshoot yourCICSPlex SM problems.
Required data:
1. The complete CICS job output for the CMAS and the MAS or WUI server that experience theproblem.
For problems that are related to a CMAS, in addition to the output for the CMAS experiencing theproblem, gather the output from all other CMASs in the CICSplex. The requirement for gatheringdocumentation from all CMASs is due to the way CMAS to CMAS communications works.
For problems that are related to a MAS or WUI server region, gather the output for the MAS or WUIserver and for the CMAS to which the MAS or WUI server connects.
This output must include the job log, JES messages, JCL, MSGUSR DD output, and the EYULOG DDoutput. Do not limit the size of the output by excluding anything. CICSPlex SM problems are oftencaused by events that occurred minutes, hours, or even days before you notice anything unusual.
2. The complete MVS system log from the LPAR where the problem occurs. Do not shorten or cutdown the size of the log in any way. If you attempt to cut out and send only what you think isrelevant, you might inadvertently cut out critical information.
3. The MVS system dump that is taken at the point of failure. For more information, see Using dumpsfor CICS problem determination on z/OS.
If your CICS region hangs or loops and you do not get a CICS or CICSPlex SM dump or messagewhen problem occurs, dump the CICSPlex SM environment with the IEADMCCP command. Thiscommand is supplied with SYS1.SAMPLIB. For details, see IEADMCxx (DUMP command parmlib) inz/OS MVS Initialization and Tuning Reference. For more information about dumping CICSPlex SM,see Using the MVS DUMP command. If you do not automatically get a dump but receive a CICS orCICSPlex SM message when the problem occurs, set an MVS SLIP trap to take an SVC dump of theappropriate address spaces and data spaces.
For example, if you always get an EYUXL0105E message in your MAS when a certain problemoccurs, set your SLIP trap as follows:
SL SET,MSGID=EYUXL0105E,ID=CPSM,ACTION=SVCD,MATCHLIM=1,R y,JL=(cmas,mas,EYUX###),DSPNAME=('EYUX###'.*),R y,SDATA=(ALLNUC,LPA,LSQA,PSA,RGN,SQA,TRT,CSA,GRSQ),END
yThis parameter specifies the reply identifier that displays on the console.
cmasThis parameter specifies the name of the CMAS that the MAS connects to.
masThis parameter specifies the job name for the region you see the problem message.
EYUX###In both the JL and DSPNAME parameters, this parameter specifies the ESSS address space andmust reflect the release of CICS that you are running:
For CICS TS 4.2, use EYUX420 in both parameters.For CICS TS 5.1, use EYUX510 in both parameters.For CICS TS 5.2, use EYUX520 in both parameters.For CICS TS 5.3, use EYUX530 in both parameters.
Chapter 7. Working with IBM to solve your problem 281
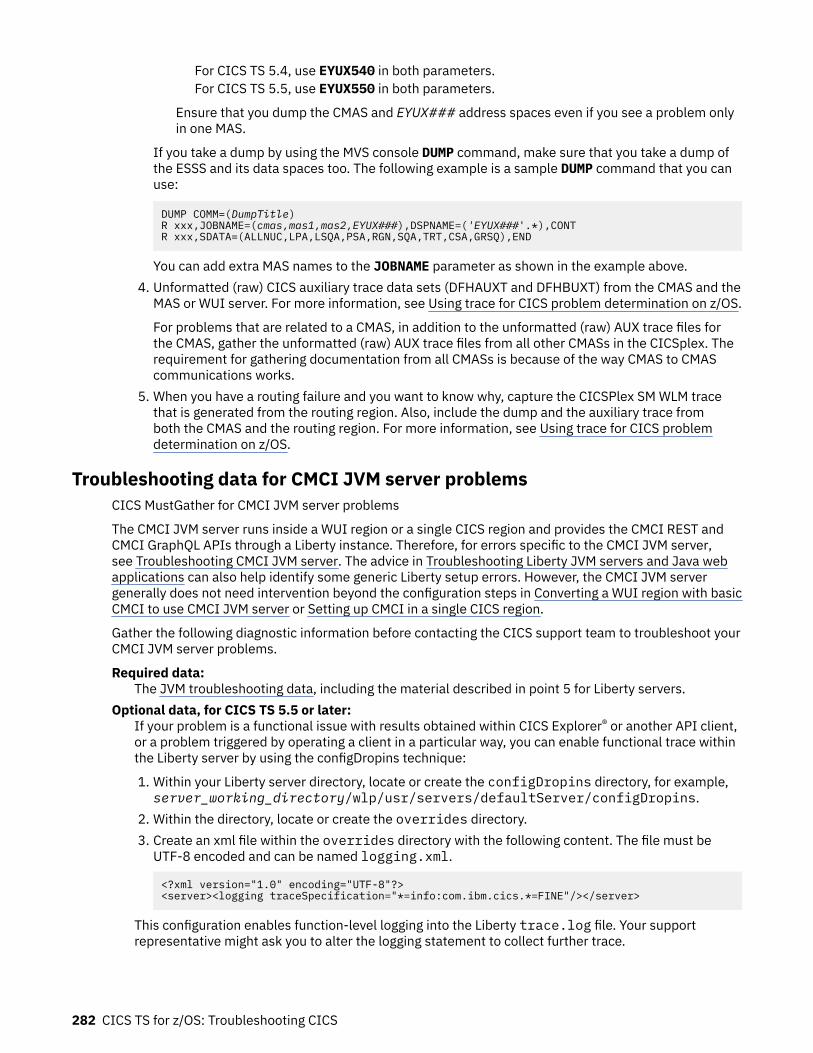
For CICS TS 5.4, use EYUX540 in both parameters.For CICS TS 5.5, use EYUX550 in both parameters.
Ensure that you dump the CMAS and EYUX### address spaces even if you see a problem onlyin one MAS.
If you take a dump by using the MVS console DUMP command, make sure that you take a dump ofthe ESSS and its data spaces too. The following example is a sample DUMP command that you canuse:
DUMP COMM=(DumpTitle) R xxx,JOBNAME=(cmas,mas1,mas2,EYUX###),DSPNAME=('EYUX###'.*),CONTR xxx,SDATA=(ALLNUC,LPA,LSQA,PSA,RGN,SQA,TRT,CSA,GRSQ),END
You can add extra MAS names to the JOBNAME parameter as shown in the example above.4. Unformatted (raw) CICS auxiliary trace data sets (DFHAUXT and DFHBUXT) from the CMAS and the
MAS or WUI server. For more information, see Using trace for CICS problem determination on z/OS.
For problems that are related to a CMAS, in addition to the unformatted (raw) AUX trace files forthe CMAS, gather the unformatted (raw) AUX trace files from all other CMASs in the CICSplex. Therequirement for gathering documentation from all CMASs is because of the way CMAS to CMAScommunications works.
5. When you have a routing failure and you want to know why, capture the CICSPlex SM WLM tracethat is generated from the routing region. Also, include the dump and the auxiliary trace fromboth the CMAS and the routing region. For more information, see Using trace for CICS problemdetermination on z/OS.
Troubleshooting data for CMCI JVM server problemsCICS MustGather for CMCI JVM server problems
The CMCI JVM server runs inside a WUI region or a single CICS region and provides the CMCI REST andCMCI GraphQL APIs through a Liberty instance. Therefore, for errors specific to the CMCI JVM server,see Troubleshooting CMCI JVM server. The advice in Troubleshooting Liberty JVM servers and Java webapplications can also help identify some generic Liberty setup errors. However, the CMCI JVM servergenerally does not need intervention beyond the configuration steps in Converting a WUI region with basicCMCI to use CMCI JVM server or Setting up CMCI in a single CICS region.
Gather the following diagnostic information before contacting the CICS support team to troubleshoot yourCMCI JVM server problems.
Required data:The JVM troubleshooting data, including the material described in point 5 for Liberty servers.
Optional data, for CICS TS 5.5 or later:If your problem is a functional issue with results obtained within CICS Explorer® or another API client,or a problem triggered by operating a client in a particular way, you can enable functional trace withinthe Liberty server by using the configDropins technique:
1. Within your Liberty server directory, locate or create the configDropins directory, for example,server_working_directory/wlp/usr/servers/defaultServer/configDropins.
2. Within the directory, locate or create the overrides directory.3. Create an xml file within the overrides directory with the following content. The file must be
UTF-8 encoded and can be named logging.xml.
<?xml version="1.0" encoding="UTF-8"?><server><logging traceSpecification="*=info:com.ibm.cics.*=FINE"/></server>
This configuration enables function-level logging into the Liberty trace.log file. Your supportrepresentative might ask you to alter the logging statement to collect further trace.
282 CICS TS for z/OS: Troubleshooting CICS
https://www.ibm.com/support/knowledgecenter/SSGMCP_latest/troubleshooting/cics/quickstart-trace.html
https://www.ibm.com/support/knowledgecenter/SSGMCP_latest/troubleshooting/cics/quickstart-trace.html
https://www.ibm.com/support/knowledgecenter/SSGMCP_latest/troubleshooting/cics/quickstart-trace.html
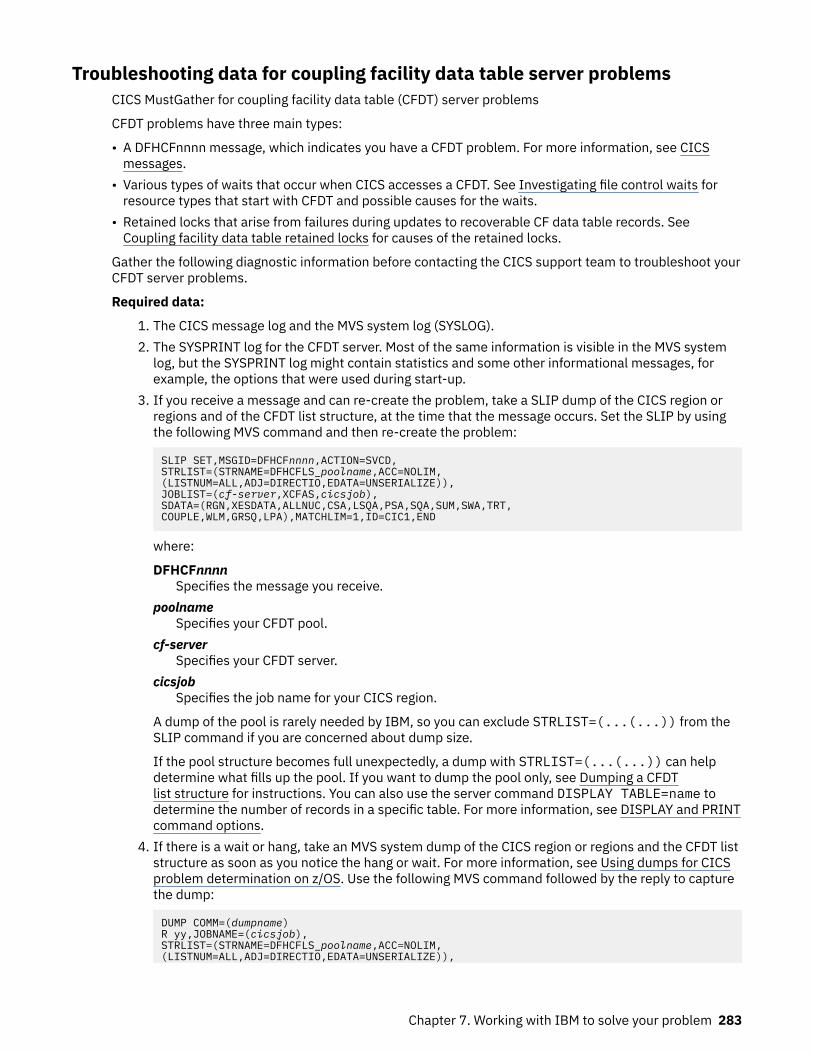
Troubleshooting data for coupling facility data table server problemsCICS MustGather for coupling facility data table (CFDT) server problems
CFDT problems have three main types:
• A DFHCFnnnn message, which indicates you have a CFDT problem. For more information, see CICSmessages.
• Various types of waits that occur when CICS accesses a CFDT. See Investigating file control waits forresource types that start with CFDT and possible causes for the waits.
• Retained locks that arise from failures during updates to recoverable CF data table records. SeeCoupling facility data table retained locks for causes of the retained locks.
Gather the following diagnostic information before contacting the CICS support team to troubleshoot yourCFDT server problems.
Required data:
1. The CICS message log and the MVS system log (SYSLOG).2. The SYSPRINT log for the CFDT server. Most of the same information is visible in the MVS system
log, but the SYSPRINT log might contain statistics and some other informational messages, forexample, the options that were used during start-up.
3. If you receive a message and can re-create the problem, take a SLIP dump of the CICS region orregions and of the CFDT list structure, at the time that the message occurs. Set the SLIP by usingthe following MVS command and then re-create the problem:
SLIP SET,MSGID=DFHCFnnnn,ACTION=SVCD,STRLIST=(STRNAME=DFHCFLS_poolname,ACC=NOLIM,(LISTNUM=ALL,ADJ=DIRECTIO,EDATA=UNSERIALIZE)),JOBLIST=(cf-server,XCFAS,cicsjob),SDATA=(RGN,XESDATA,ALLNUC,CSA,LSQA,PSA,SQA,SUM,SWA,TRT,COUPLE,WLM,GRSQ,LPA),MATCHLIM=1,ID=CIC1,END
where:
DFHCFnnnnSpecifies the message you receive.
poolnameSpecifies your CFDT pool.
cf-serverSpecifies your CFDT server.
cicsjobSpecifies the job name for your CICS region.
A dump of the pool is rarely needed by IBM, so you can exclude STRLIST=(...(...)) from theSLIP command if you are concerned about dump size.
If the pool structure becomes full unexpectedly, a dump with STRLIST=(...(...)) can helpdetermine what fills up the pool. If you want to dump the pool only, see Dumping a CFDTlist structure for instructions. You can also use the server command DISPLAY TABLE=name todetermine the number of records in a specific table. For more information, see DISPLAY and PRINTcommand options.
4. If there is a wait or hang, take an MVS system dump of the CICS region or regions and the CFDT liststructure as soon as you notice the hang or wait. For more information, see Using dumps for CICSproblem determination on z/OS. Use the following MVS command followed by the reply to capturethe dump:
DUMP COMM=(dumpname)R yy,JOBNAME=(cicsjob),STRLIST=(STRNAME=DFHCFLS_poolname,ACC=NOLIM,(LISTNUM=ALL,ADJ=DIRECTIO,EDATA=UNSERIALIZE)),
Chapter 7. Working with IBM to solve your problem 283
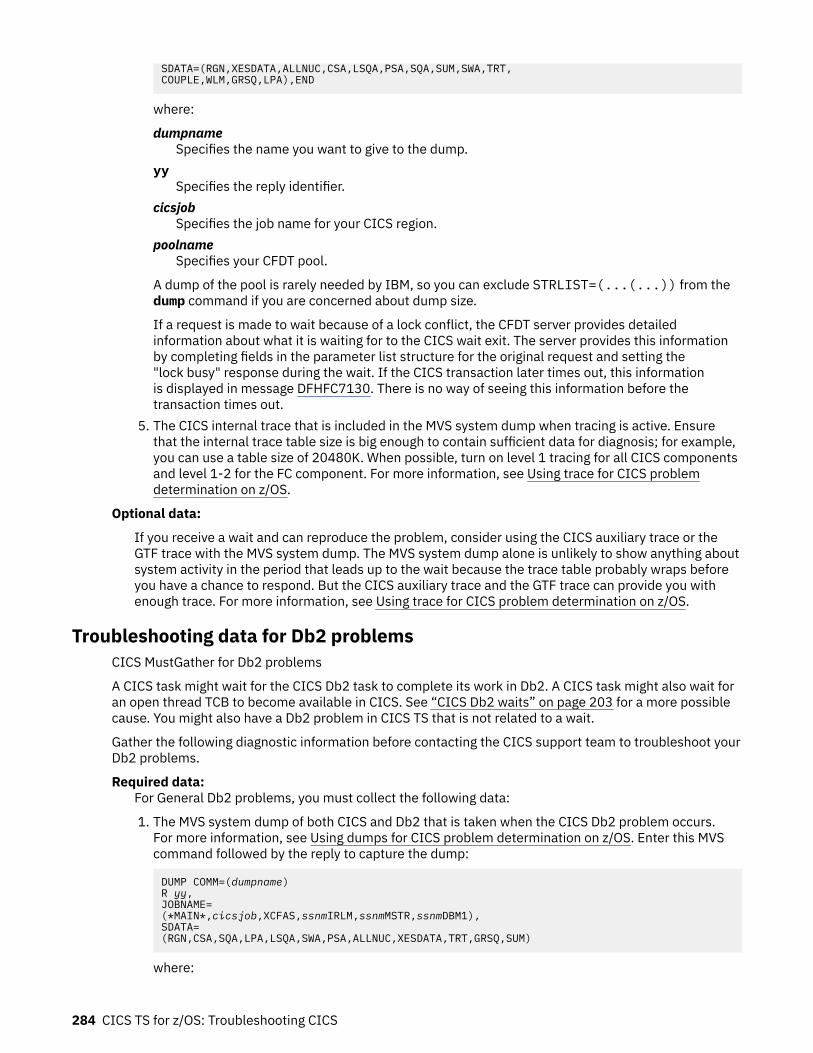
SDATA=(RGN,XESDATA,ALLNUC,CSA,LSQA,PSA,SQA,SUM,SWA,TRT,COUPLE,WLM,GRSQ,LPA),END
where:
dumpnameSpecifies the name you want to give to the dump.
yySpecifies the reply identifier.
cicsjobSpecifies the job name for your CICS region.
poolnameSpecifies your CFDT pool.
A dump of the pool is rarely needed by IBM, so you can exclude STRLIST=(...(...)) from thedump command if you are concerned about dump size.
If a request is made to wait because of a lock conflict, the CFDT server provides detailedinformation about what it is waiting for to the CICS wait exit. The server provides this informationby completing fields in the parameter list structure for the original request and setting the"lock busy" response during the wait. If the CICS transaction later times out, this informationis displayed in message DFHFC7130. There is no way of seeing this information before thetransaction times out.
5. The CICS internal trace that is included in the MVS system dump when tracing is active. Ensurethat the internal trace table size is big enough to contain sufficient data for diagnosis; for example,you can use a table size of 20480K. When possible, turn on level 1 tracing for all CICS componentsand level 1-2 for the FC component. For more information, see Using trace for CICS problemdetermination on z/OS.
Optional data:
If you receive a wait and can reproduce the problem, consider using the CICS auxiliary trace or theGTF trace with the MVS system dump. The MVS system dump alone is unlikely to show anything aboutsystem activity in the period that leads up to the wait because the trace table probably wraps beforeyou have a chance to respond. But the CICS auxiliary trace and the GTF trace can provide you withenough trace. For more information, see Using trace for CICS problem determination on z/OS.
Troubleshooting data for Db2 problemsCICS MustGather for Db2 problems
A CICS task might wait for the CICS Db2 task to complete its work in Db2. A CICS task might also wait foran open thread TCB to become available in CICS. See “CICS Db2 waits” on page 203 for a more possiblecause. You might also have a Db2 problem in CICS TS that is not related to a wait.
Gather the following diagnostic information before contacting the CICS support team to troubleshoot yourDb2 problems.
Required data:For General Db2 problems, you must collect the following data:
1. The MVS system dump of both CICS and Db2 that is taken when the CICS Db2 problem occurs.For more information, see Using dumps for CICS problem determination on z/OS. Enter this MVScommand followed by the reply to capture the dump:
DUMP COMM=(dumpname) R yy,JOBNAME=(*MAIN*,cicsjob,XCFAS,ssnmIRLM,ssnmMSTR,ssnmDBM1),SDATA=(RGN,CSA,SQA,LPA,LSQA,SWA,PSA,ALLNUC,XESDATA,TRT,GRSQ,SUM)
where:
284 CICS TS for z/OS: Troubleshooting CICS
https://www.ibm.com/support/knowledgecenter/SSGMCP_latest/troubleshooting/cics/quickstart-trace.html
https://www.ibm.com/support/knowledgecenter/SSGMCP_latest/troubleshooting/cics/quickstart-trace.html
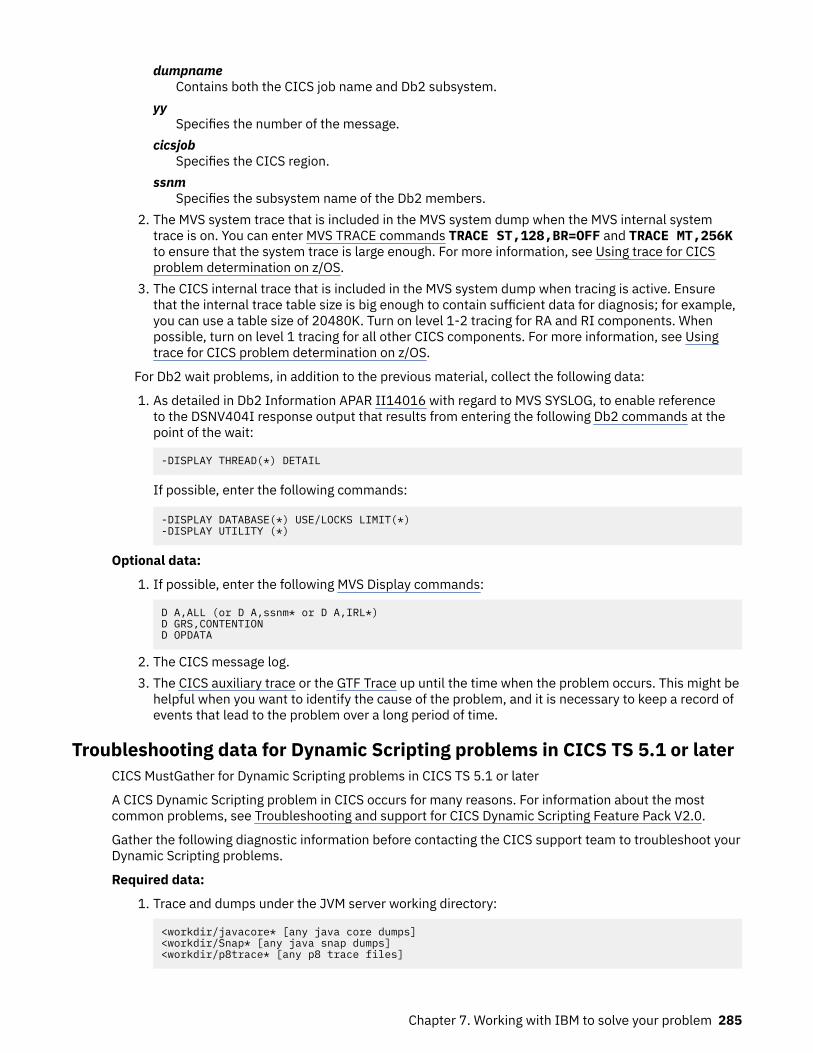
dumpnameContains both the CICS job name and Db2 subsystem.
yySpecifies the number of the message.
cicsjobSpecifies the CICS region.
ssnmSpecifies the subsystem name of the Db2 members.
2. The MVS system trace that is included in the MVS system dump when the MVS internal systemtrace is on. You can enter MVS TRACE commands TRACE ST,128,BR=OFF and TRACE MT,256Kto ensure that the system trace is large enough. For more information, see Using trace for CICSproblem determination on z/OS.
3. The CICS internal trace that is included in the MVS system dump when tracing is active. Ensurethat the internal trace table size is big enough to contain sufficient data for diagnosis; for example,you can use a table size of 20480K. Turn on level 1-2 tracing for RA and RI components. Whenpossible, turn on level 1 tracing for all other CICS components. For more information, see Usingtrace for CICS problem determination on z/OS.
For Db2 wait problems, in addition to the previous material, collect the following data:
1. As detailed in Db2 Information APAR II14016 with regard to MVS SYSLOG, to enable referenceto the DSNV404I response output that results from entering the following Db2 commands at thepoint of the wait:
-DISPLAY THREAD(*) DETAIL
If possible, enter the following commands:
-DISPLAY DATABASE(*) USE/LOCKS LIMIT(*)-DISPLAY UTILITY (*)
Optional data:
1. If possible, enter the following MVS Display commands:
D A,ALL (or D A,ssnm* or D A,IRL*)D GRS,CONTENTIOND OPDATA
2. The CICS message log.3. The CICS auxiliary trace or the GTF Trace up until the time when the problem occurs. This might be
helpful when you want to identify the cause of the problem, and it is necessary to keep a record ofevents that lead to the problem over a long period of time.
Troubleshooting data for Dynamic Scripting problems in CICS TS 5.1 or laterCICS MustGather for Dynamic Scripting problems in CICS TS 5.1 or later
A CICS Dynamic Scripting problem in CICS occurs for many reasons. For information about the mostcommon problems, see Troubleshooting and support for CICS Dynamic Scripting Feature Pack V2.0.
Gather the following diagnostic information before contacting the CICS support team to troubleshoot yourDynamic Scripting problems.
Required data:
1. Trace and dumps under the JVM server working directory:
<workdir/javacore* [any java core dumps]<workdir/Snap* [any java snap dumps]<workdir/p8trace* [any p8 trace files]
Chapter 7. Working with IBM to solve your problem 285
https://www.ibm.com/support/knowledgecenter/SSGMCP_latest/troubleshooting/cics/quickstart-trace.html
https://www.ibm.com/support/knowledgecenter/SSGMCP_latest/troubleshooting/cics/quickstart-trace.html
https://www.ibm.com/support/knowledgecenter/SSGMCP_latest/troubleshooting/cics/quickstart-trace.html
https://www.ibm.com/support/knowledgecenter/SSGMCP_latest/troubleshooting/cics/quickstart-trace.html
https://www.ibm.com/support/knowledgecenter/SSGMCP_latest/troubleshooting/cics/quickstart-trace.html
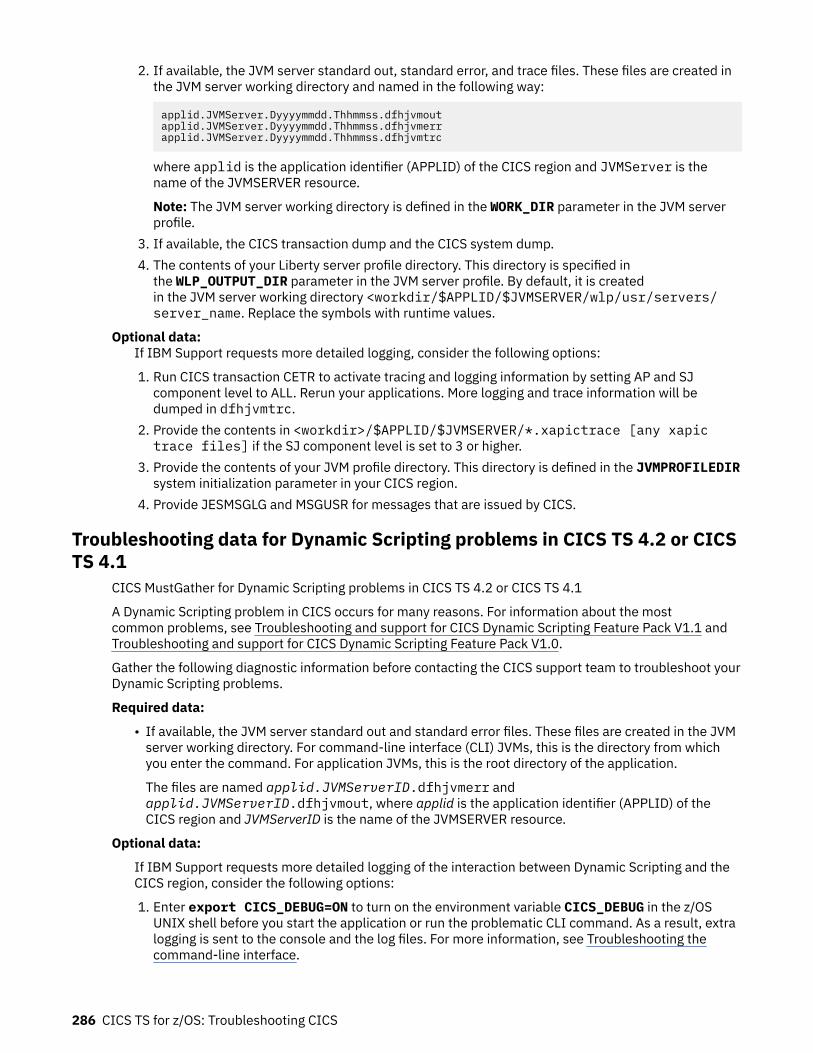
2. If available, the JVM server standard out, standard error, and trace files. These files are created inthe JVM server working directory and named in the following way:
applid.JVMServer.Dyyyymmdd.Thhmmss.dfhjvmoutapplid.JVMServer.Dyyyymmdd.Thhmmss.dfhjvmerrapplid.JVMServer.Dyyyymmdd.Thhmmss.dfhjvmtrc
where applid is the application identifier (APPLID) of the CICS region and JVMServer is thename of the JVMSERVER resource.
Note: The JVM server working directory is defined in the WORK_DIR parameter in the JVM serverprofile.
3. If available, the CICS transaction dump and the CICS system dump.4. The contents of your Liberty server profile directory. This directory is specified in
the WLP_OUTPUT_DIR parameter in the JVM server profile. By default, it is createdin the JVM server working directory <workdir/$APPLID/$JVMSERVER/wlp/usr/servers/server_name. Replace the symbols with runtime values.
Optional data:If IBM Support requests more detailed logging, consider the following options:
1. Run CICS transaction CETR to activate tracing and logging information by setting AP and SJcomponent level to ALL. Rerun your applications. More logging and trace information will bedumped in dfhjvmtrc.
2. Provide the contents in <workdir>/$APPLID/$JVMSERVER/*.xapictrace [any xapictrace files] if the SJ component level is set to 3 or higher.
3. Provide the contents of your JVM profile directory. This directory is defined in the JVMPROFILEDIRsystem initialization parameter in your CICS region.
4. Provide JESMSGLG and MSGUSR for messages that are issued by CICS.
Troubleshooting data for Dynamic Scripting problems in CICS TS 4.2 or CICSTS 4.1
CICS MustGather for Dynamic Scripting problems in CICS TS 4.2 or CICS TS 4.1
A Dynamic Scripting problem in CICS occurs for many reasons. For information about the mostcommon problems, see Troubleshooting and support for CICS Dynamic Scripting Feature Pack V1.1 andTroubleshooting and support for CICS Dynamic Scripting Feature Pack V1.0.
Gather the following diagnostic information before contacting the CICS support team to troubleshoot yourDynamic Scripting problems.
Required data:
• If available, the JVM server standard out and standard error files. These files are created in the JVMserver working directory. For command-line interface (CLI) JVMs, this is the directory from whichyou enter the command. For application JVMs, this is the root directory of the application.
The files are named applid.JVMServerID.dfhjvmerr andapplid.JVMServerID.dfhjvmout, where applid is the application identifier (APPLID) of theCICS region and JVMServerID is the name of the JVMSERVER resource.
Optional data:
If IBM Support requests more detailed logging of the interaction between Dynamic Scripting and theCICS region, consider the following options:
1. Enter export CICS_DEBUG=ON to turn on the environment variable CICS_DEBUG in the z/OSUNIX shell before you start the application or run the problematic CLI command. As a result, extralogging is sent to the console and the log files. For more information, see Troubleshooting thecommand-line interface.
286 CICS TS for z/OS: Troubleshooting CICS
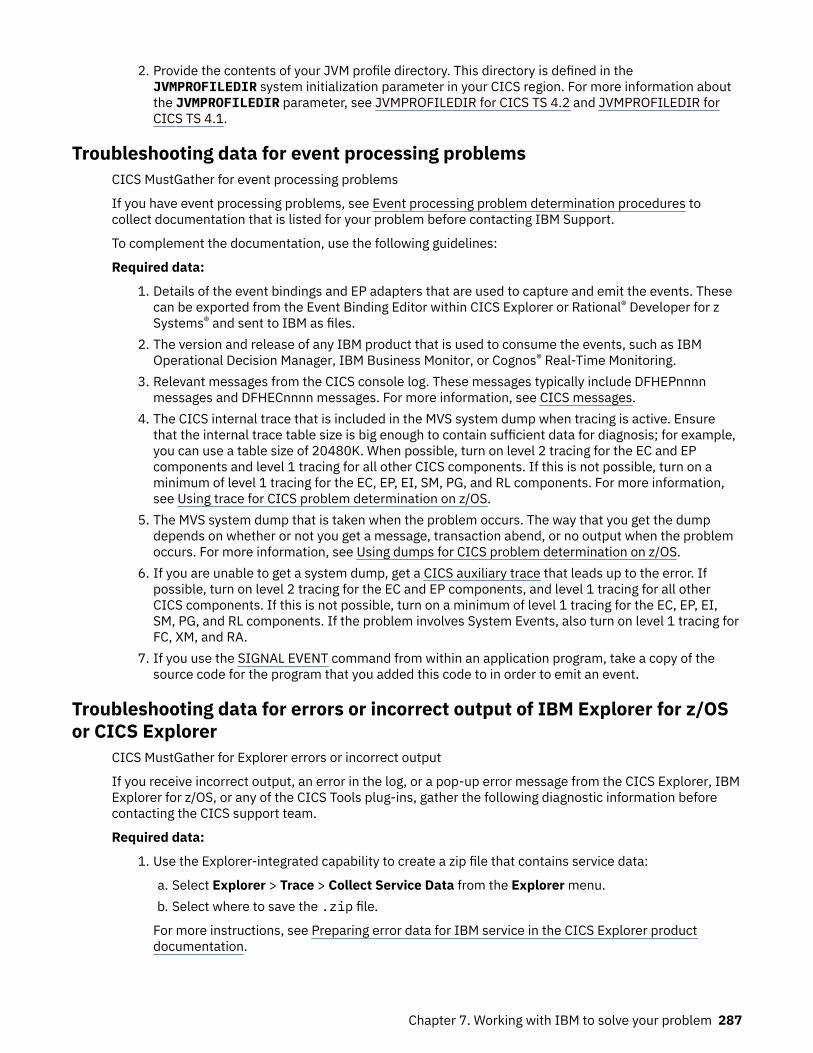
2. Provide the contents of your JVM profile directory. This directory is defined in theJVMPROFILEDIR system initialization parameter in your CICS region. For more information aboutthe JVMPROFILEDIR parameter, see JVMPROFILEDIR for CICS TS 4.2 and JVMPROFILEDIR forCICS TS 4.1.
Troubleshooting data for event processing problemsCICS MustGather for event processing problems
If you have event processing problems, see Event processing problem determination procedures tocollect documentation that is listed for your problem before contacting IBM Support.
To complement the documentation, use the following guidelines:
Required data:
1. Details of the event bindings and EP adapters that are used to capture and emit the events. Thesecan be exported from the Event Binding Editor within CICS Explorer or Rational® Developer for zSystems® and sent to IBM as files.
2. The version and release of any IBM product that is used to consume the events, such as IBMOperational Decision Manager, IBM Business Monitor, or Cognos® Real-Time Monitoring.
3. Relevant messages from the CICS console log. These messages typically include DFHEPnnnnmessages and DFHECnnnn messages. For more information, see CICS messages.
4. The CICS internal trace that is included in the MVS system dump when tracing is active. Ensurethat the internal trace table size is big enough to contain sufficient data for diagnosis; for example,you can use a table size of 20480K. When possible, turn on level 2 tracing for the EC and EPcomponents and level 1 tracing for all other CICS components. If this is not possible, turn on aminimum of level 1 tracing for the EC, EP, EI, SM, PG, and RL components. For more information,see Using trace for CICS problem determination on z/OS.
5. The MVS system dump that is taken when the problem occurs. The way that you get the dumpdepends on whether or not you get a message, transaction abend, or no output when the problemoccurs. For more information, see Using dumps for CICS problem determination on z/OS.
6. If you are unable to get a system dump, get a CICS auxiliary trace that leads up to the error. Ifpossible, turn on level 2 tracing for the EC and EP components, and level 1 tracing for all otherCICS components. If this is not possible, turn on a minimum of level 1 tracing for the EC, EP, EI,SM, PG, and RL components. If the problem involves System Events, also turn on level 1 tracing forFC, XM, and RA.
7. If you use the SIGNAL EVENT command from within an application program, take a copy of thesource code for the program that you added this code to in order to emit an event.
Troubleshooting data for errors or incorrect output of IBM Explorer for z/OSor CICS Explorer
CICS MustGather for Explorer errors or incorrect output
If you receive incorrect output, an error in the log, or a pop-up error message from the CICS Explorer, IBMExplorer for z/OS, or any of the CICS Tools plug-ins, gather the following diagnostic information beforecontacting the CICS support team.
Required data:
1. Use the Explorer-integrated capability to create a zip file that contains service data:
a. Select Explorer > Trace > Collect Service Data from the Explorer menu.b. Select where to save the .zip file.
For more instructions, see Preparing error data for IBM service in the CICS Explorer productdocumentation.
Chapter 7. Working with IBM to solve your problem 287
http://www.ibm.com/support/knowledgecenter/SSGMCP_5.6.0/troubleshooting/dfhep_troubleshootingpd.html
https://www.ibm.com/support/knowledgecenter/SSGMCP_latest/troubleshooting/cics/quickstart-trace.html
2. If you think the Explorer shows an incorrect output, create screen captures of the Explorer screenas image files (.bmp or .jpg). These images might provide useful information for IBM Support.
3. When you get an error, gather the following additional data based on the type of the connectionyou use:
• For a CICSPlex SM connection, the complete job log (including CICS TDQ output) of the WUIserver and the CMAS to which the WUI server connects.
If you receive a bad response from the CICS management client interface (CMCI) or the CICSPlexSM application programming interface (API), for example FAILED or EXCEPTION response,collect the unformatted auxiliary trace data sets from the WUI server and the CMAS to whichthe WUI server connects.
• For a single server (SMSS) version in a stand-alone CICS region, the complete job log (includingTDQ output).
• For other types of connections, the required documentation varies. For example, for CICSPerformance Analyzer, a copy of the input file that is used on the request is useful.
Troubleshooting data for the z/OS or CICS Explorer when the user interfaceis not available or not usable
CICS MustGather for Explorer UI
If the startup of the CICS Explorer, IBM Explorer for z/OS, or any of the CICS Tools plug-ins fails, appearsto be hanging, or is not responding, gather the following diagnostic information before contacting theCICS support team.
Required data:
1. If the UI is displayed, create screen captures of the Explorer screen as image files (.bmp or .jpg).These images might provide useful information for IBM Support.
2. If the Explorer user interface is usable, use the Explorer-integrated capability to create a zip filecontaining service data:
a. Select Explorer > Trace > Collect Service Data from the Explorer menu.b. Select where to save the .zip file.
For more instructions, see Preparing error data for IBM service in the CICS Explorer productdocumentation.
3. If the Explorer user interface is not usable, collect the logs and other Explorer working files(such as settings) from one of the following directories. Use an archiving utility (a program thatcreates .zip, .rar, .tar, or .tar.gz files) to collect directory content.
• If you use the default on Windows, use the location C:\Users\$User\.zosexplorer.• If you use the default on Linux®, use the location /home/$username/.zosexplorer.• If you use the default on macOS, use the location /Users/$username/.zosexplorer.• If you use an alternate workspace, which is described in the "Starting multiple instances of CICS
Explorer" Help, use that location.
Optional data:If the UI is up but unresponsive, follow these instructions to take a Java Thread Dump. The dumpmight provide useful information for IBM Support.
1. If you use the Explorer on Linux, perform the following procedures:
a. Find out the process identifier of the CICS Explorer by using any system tool. For example, enterthe following command from a shell (command line):
$ ps -ef | grep cicsexplorer
288 CICS TS for z/OS: Troubleshooting CICS
b. From a shell, invoke kill -QUIT <process_id>. A file namedjavacore.YYYYMMDD.<other>.txt will be created in the Explorer directory.
2. If you use the Explorer on Windows, perform the following procedures:
a. Ensure that you start the Explorer with the -consolelog parameter, so that the Exploreropens a shell (command line) window only for output besides a graphical UI window.
b. If a dump is not taken, press Ctrl+Break on the command line to request a dump.c. From the consolelog window, you will see a message that includes the location and name of the
dump:
JVMDUMP010I Java dump written to C:\...\CICS Explorer\javacore.20090610.092732.6908.0001.txt.
Send the message to IBM.
Troubleshooting data for file control (VSAM non-RLS) wait problemsCICS MustGather for file control (non-RLS) problems
Many problems in file control are caused by waits for CICS or VSAM resources.
Gather the following diagnostic information before contacting the CICS support team to troubleshoot yourfile control (non-RLS) problems.
Required data:
1. The CICS message log and the MVS system log (SYSLOG).2. The CICS internal trace that is included in the MVS system dump when tracing is active. Ensure
that the internal trace table size is big enough to contain sufficient data for diagnosis; for example,you can use a table size of 20480K. When possible, turn on level 1 tracing for all CICS componentsand level 1-2 for the FC component. For more information, see Using trace for CICS problemdetermination on z/OS.
3. An MVS system dump of the CICS region that is taken as soon as you notice the hang or wait.
To take an MVS system dump, use the MVS command followed by a reply:
DUMP COMM=(dumpname)R yy,JOBNAME=(cicsjob),SDATA=(ALLNUC,PSA,SQA,CSA,LPA,TRT,LSQA,RGN)
where:dumpname
Specifies the name of the dump.yy
Specifies the reply identifier.cicsjob
Specifies the job name of your CICS region.
For more information, see Using dumps for CICS problem determination on z/OS.
Optional data:
1. If feasible, save the data set by using IDCAMS ALTER NEWNAME to rename the data set andsave it in place (note that the example in the link has a DEFINE before the ALTER). If this isnot feasible, run IDCAMS EXAMINE ITEST DTEST against the data set and any alternate indexesthat are associated with the data set before you continue. For more information, see z/OS DFSMSAccess Method Services Commands.
2. If you can reproduce the problem, consider using the CICS auxiliary trace or the GTF Trace with theMVS system dump. The MVS system dump alone is unlikely to show anything about system activityin the period that leads up to the wait because the trace table probably wraps before you have achance to respond. For more information, see Using trace for CICS problem determination on z/OS.
Chapter 7. Working with IBM to solve your problem 289
https://www.ibm.com/support/knowledgecenter/SSGMCP_latest/troubleshooting/cics/quickstart-trace.html
Troubleshooting data for file control (VSAM RLS) problemsCICS MustGather for file control (RLS) problems
Gather the following diagnostic information before contacting the CICS support team to troubleshoot yourfile control (RLS) problems.
Required data:
1. The CICS message log for all CICS regions that use RLS and the system log (SYSLOG) for all MVSimages that use RLS.
2. The CICS internal trace that is included in the MVS system dump and the SLIP dump when tracingis active. Ensure that the internal trace table size is big enough to contain sufficient data fordiagnosis; for example, you can use a table size of 20480K. When possible, turn on level 1 tracingfor all CICS components and level 1-2 for the FC component. For more information, see Using tracefor CICS problem determination on z/OS.
3. If you experience hang situations with CICS and RLS, take MVS system dumps of SMSVSAMaddress spaces and dataspaces, Main address spaces, XCF address spaces and dataspaces, andCICS address spaces. For more information, see Using dumps for CICS problem determination onz/OS. To capture a dump on each MVS system in your sysplex, use the following MVS commandwith the REMOTE option when the hang occurs:
DUMP COMM=(dumpname)R nn,JOBNAME=(SMSVSAM, XCFAS,*MAIN*,cicsjob*),CONTR nn,DSPNAME=('XCFAS'.*,'SMSVSAM.*),CONTR nn,SDATA=(COUPLE,ALLNUC,LPA,LSQA,PSA,RGN,SQA,SUM,TRT,CSA,GRSQ,XESDATA),CONTR nn,REMOTE=(SYSLIST=*('XCFAS','SMSVSAM,cicsjob*,*MAIN*),DSPNAME,SDATA),END
where:
dumpnameSpecifies the name you want to give to the dump.
nnSpecifies the unique reply identifier for each reply.
cicsjob*Specifies the first part of the job name for your CICS regions. The asterisk is a wildcard thatinstructs MVS to dump all regions that start with cicsjob.
Note: The incident token in message IEA611I or IEA911I is the same on all MVS systems.
To avoid replying with so many dump options, you can specify the suffixes of one or moreIEADMCxx parmlib members. For more information, see IEADMCxx (DUMP command parmlib)in z/OS MVS Initialization and Tuning Reference.
a. Customize an IEADMCxx member to include the dump command. The following sample is forCICS and RLS problems:
/* ** Start of Specifications for IEADMCCR ************************ */ /* */ /* $MAC(IEADMCCR) COMP(SCDMP) PROD(HBB7705): Dump CICS and RLS */ /* */ /* PROPRIETARY STATEMENT: */ /* */ /* LICENSED MATERIALS - PROPERTY OF IBM */ /* THIS MACRO IS "RESTRICTED MATERIALS OF IBM" */ /* 5694-A01 (C) COPYRIGHT IBM CORP. 2001 */ /* */ /* STATUS: HBB7705 */ /* */ /* External classification= none */ /* End of external classification: */ /* */ /* DUMP command Parmlib member */ /* */ /* Function: Provides DUMP command options to dump */ /* Logger, RLS and CICS. */
290 CICS TS for z/OS: Troubleshooting CICS
https://www.ibm.com/support/knowledgecenter/SSGMCP_latest/troubleshooting/cics/quickstart-trace.html
/* */ /* */ /* To use: Copy this member to Parmlib. */ /* Modify cicsjob to be the first part of the jobname for */ /* your CICS regions. */ /* */ /* To execute: Specify the following DUMP command: */ /* */ /* DUMP PARMLIB=xx */ /* - or - */ /* DUMP TITLE=(dump_title_text),PARMLIB=xx */ /* */ /* If a dump title is specified on the DUMP command using the */ /* TITLE option, the specified text will be used instead of the */ /* TITLE line in the parmlib member. */ /* * /* ================================================================ * /* * /* Change activity: * /* * /* 10/24/05 created as sample for CICS MustGather * /* * /* ** End of Specifications for IEADMCCR ************************** *TITLE=(DUMP RLS AND CICS),JOBNAME=(SMSVSAM, XCFAS,*MAIN*,cicsjob*),DSPNAME=('XCFAS'.*,'SMSVSAM.*),REMOTE=(SYSLIST=*('XCFAS','SMSVSA,cicsjob*,*MAIN*), DSPNAME,SDATA)SDATA=(COUPLE,ALLNUC,LPA,LSQA,PSA,RGN,SQA,SUM,TRT,CSA,GRSQ, XESDATA)
b. Copy the member into SYS1.PARMLIB.c. Enter DUMP TITLE=(dump-name),PARMLIB=xx to request a dump by using the dump
command in IEADMCxx. To request multiple parmlib members, specify PARMLIB=(xx,yy).4. If you receive RLS messages such as DFHFC0987, take a SLIP dump. For more information, see
Using trace for CICS problem determination on z/OS. Use the following SLIP command to capture adump of the SMSVSAM address space and the CICS address spaces for message DFHFC0987:
SLIP SET,MSGID=DFHFC0987,A=SVCD,JOBLIST=(SMSVSAM,cicsjob*),DSPNAME =('SMSVSAM'.*),REMOTE=(JOBLIST,DSPNAME),ID=id,END
where:
DFHFC0987Specifies the message you receive.
idSpecifies the dump identifier.
cicsjob*Specifies the first part of the job name for your CICS regions. The asterisk is a wildcard thatinstructs MVS to dump all regions that start with cicsjob.
Note: The MSGID parameter is valid for z/OS V1.2 or later. The incident token in messageIEA611I or IEA911I is the same on all MVS systems.
Optional data:
If you can reproduce the problem, consider using the CICS auxiliary trace or the GTF Trace with theMVS system dump. The MVS system dump alone is unlikely to show anything about system activity inthe period that leads up to the wait because the trace table probably wraps before you have a chanceto respond. But the CICS auxiliary trace and the GTF trace can provide you with enough trace.
Troubleshooting data for IMS problemsCICS MustGather for IMS problems
IMS problems might occur because a CICS task waits for the CICS IMS task to complete its work in IMS orbecause a CICS task waits for an open thread TCB to become available in CICS.
Chapter 7. Working with IBM to solve your problem 291
https://www.ibm.com/support/knowledgecenter/SSGMCP_latest/troubleshooting/cics/quickstart-trace.html
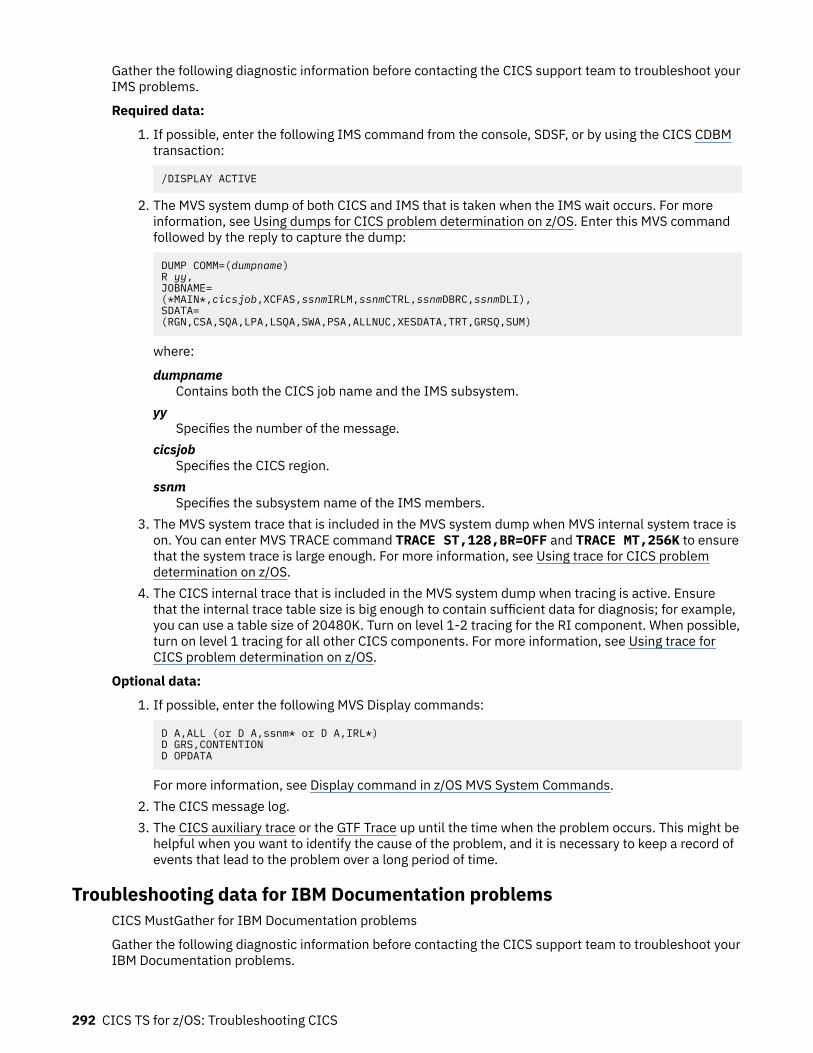
Gather the following diagnostic information before contacting the CICS support team to troubleshoot yourIMS problems.
Required data:
1. If possible, enter the following IMS command from the console, SDSF, or by using the CICS CDBMtransaction:
/DISPLAY ACTIVE
2. The MVS system dump of both CICS and IMS that is taken when the IMS wait occurs. For moreinformation, see Using dumps for CICS problem determination on z/OS. Enter this MVS commandfollowed by the reply to capture the dump:
DUMP COMM=(dumpname)R yy,JOBNAME=(*MAIN*,cicsjob,XCFAS,ssnmIRLM,ssnmCTRL,ssnmDBRC,ssnmDLI),SDATA=(RGN,CSA,SQA,LPA,LSQA,SWA,PSA,ALLNUC,XESDATA,TRT,GRSQ,SUM)
where:
dumpnameContains both the CICS job name and the IMS subsystem.
yySpecifies the number of the message.
cicsjobSpecifies the CICS region.
ssnmSpecifies the subsystem name of the IMS members.
3. The MVS system trace that is included in the MVS system dump when MVS internal system trace ison. You can enter MVS TRACE command TRACE ST,128,BR=OFF and TRACE MT,256K to ensurethat the system trace is large enough. For more information, see Using trace for CICS problemdetermination on z/OS.
4. The CICS internal trace that is included in the MVS system dump when tracing is active. Ensurethat the internal trace table size is big enough to contain sufficient data for diagnosis; for example,you can use a table size of 20480K. Turn on level 1-2 tracing for the RI component. When possible,turn on level 1 tracing for all other CICS components. For more information, see Using trace forCICS problem determination on z/OS.
Optional data:
1. If possible, enter the following MVS Display commands:
D A,ALL (or D A,ssnm* or D A,IRL*)D GRS,CONTENTIOND OPDATA
For more information, see Display command in z/OS MVS System Commands.2. The CICS message log.3. The CICS auxiliary trace or the GTF Trace up until the time when the problem occurs. This might be
helpful when you want to identify the cause of the problem, and it is necessary to keep a record ofevents that lead to the problem over a long period of time.
Troubleshooting data for IBM Documentation problemsCICS MustGather for IBM Documentation problems
Gather the following diagnostic information before contacting the CICS support team to troubleshoot yourIBM Documentation problems.
292 CICS TS for z/OS: Troubleshooting CICS
https://www.ibm.com/support/knowledgecenter/SSGMCP_latest/troubleshooting/cics/quickstart-trace.html
https://www.ibm.com/support/knowledgecenter/SSGMCP_latest/troubleshooting/cics/quickstart-trace.html
https://www.ibm.com/support/knowledgecenter/SSGMCP_latest/troubleshooting/cics/quickstart-trace.html
https://www.ibm.com/support/knowledgecenter/SSGMCP_latest/troubleshooting/cics/quickstart-trace.html
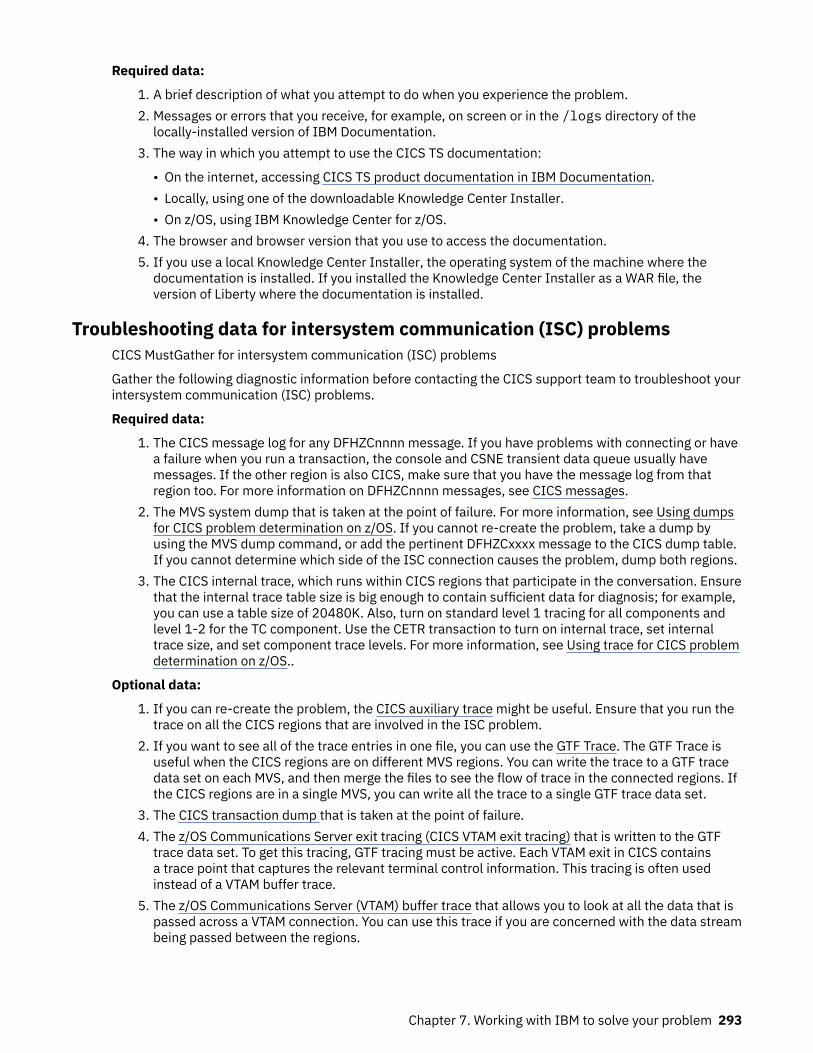
Required data:
1. A brief description of what you attempt to do when you experience the problem.2. Messages or errors that you receive, for example, on screen or in the /logs directory of the
locally-installed version of IBM Documentation.3. The way in which you attempt to use the CICS TS documentation:
• On the internet, accessing CICS TS product documentation in IBM Documentation.• Locally, using one of the downloadable Knowledge Center Installer.• On z/OS, using IBM Knowledge Center for z/OS.
4. The browser and browser version that you use to access the documentation.5. If you use a local Knowledge Center Installer, the operating system of the machine where the
documentation is installed. If you installed the Knowledge Center Installer as a WAR file, theversion of Liberty where the documentation is installed.
Troubleshooting data for intersystem communication (ISC) problemsCICS MustGather for intersystem communication (ISC) problems
Gather the following diagnostic information before contacting the CICS support team to troubleshoot yourintersystem communication (ISC) problems.
Required data:
1. The CICS message log for any DFHZCnnnn message. If you have problems with connecting or havea failure when you run a transaction, the console and CSNE transient data queue usually havemessages. If the other region is also CICS, make sure that you have the message log from thatregion too. For more information on DFHZCnnnn messages, see CICS messages.
2. The MVS system dump that is taken at the point of failure. For more information, see Using dumpsfor CICS problem determination on z/OS. If you cannot re-create the problem, take a dump byusing the MVS dump command, or add the pertinent DFHZCxxxx message to the CICS dump table.If you cannot determine which side of the ISC connection causes the problem, dump both regions.
3. The CICS internal trace, which runs within CICS regions that participate in the conversation. Ensurethat the internal trace table size is big enough to contain sufficient data for diagnosis; for example,you can use a table size of 20480K. Also, turn on standard level 1 tracing for all components andlevel 1-2 for the TC component. Use the CETR transaction to turn on internal trace, set internaltrace size, and set component trace levels. For more information, see Using trace for CICS problemdetermination on z/OS..
Optional data:
1. If you can re-create the problem, the CICS auxiliary trace might be useful. Ensure that you run thetrace on all the CICS regions that are involved in the ISC problem.
2. If you want to see all of the trace entries in one file, you can use the GTF Trace. The GTF Trace isuseful when the CICS regions are on different MVS regions. You can write the trace to a GTF tracedata set on each MVS, and then merge the files to see the flow of trace in the connected regions. Ifthe CICS regions are in a single MVS, you can write all the trace to a single GTF trace data set.
3. The CICS transaction dump that is taken at the point of failure.4. The z/OS Communications Server exit tracing (CICS VTAM exit tracing) that is written to the GTF
trace data set. To get this tracing, GTF tracing must be active. Each VTAM exit in CICS containsa trace point that captures the relevant terminal control information. This tracing is often usedinstead of a VTAM buffer trace.
5. The z/OS Communications Server (VTAM) buffer trace that allows you to look at all the data that ispassed across a VTAM connection. You can use this trace if you are concerned with the data streambeing passed between the regions.
Chapter 7. Working with IBM to solve your problem 293
https://www.ibm.com/support/knowledgecenter/SSGMCP_latest/troubleshooting/cics/quickstart-trace.html
https://www.ibm.com/support/knowledgecenter/SSGMCP_latest/troubleshooting/cics/quickstart-trace.html
https://www.ibm.com/support/knowledgecenter/SSGMCP_latest/troubleshooting/cics/quickstart-trace.html
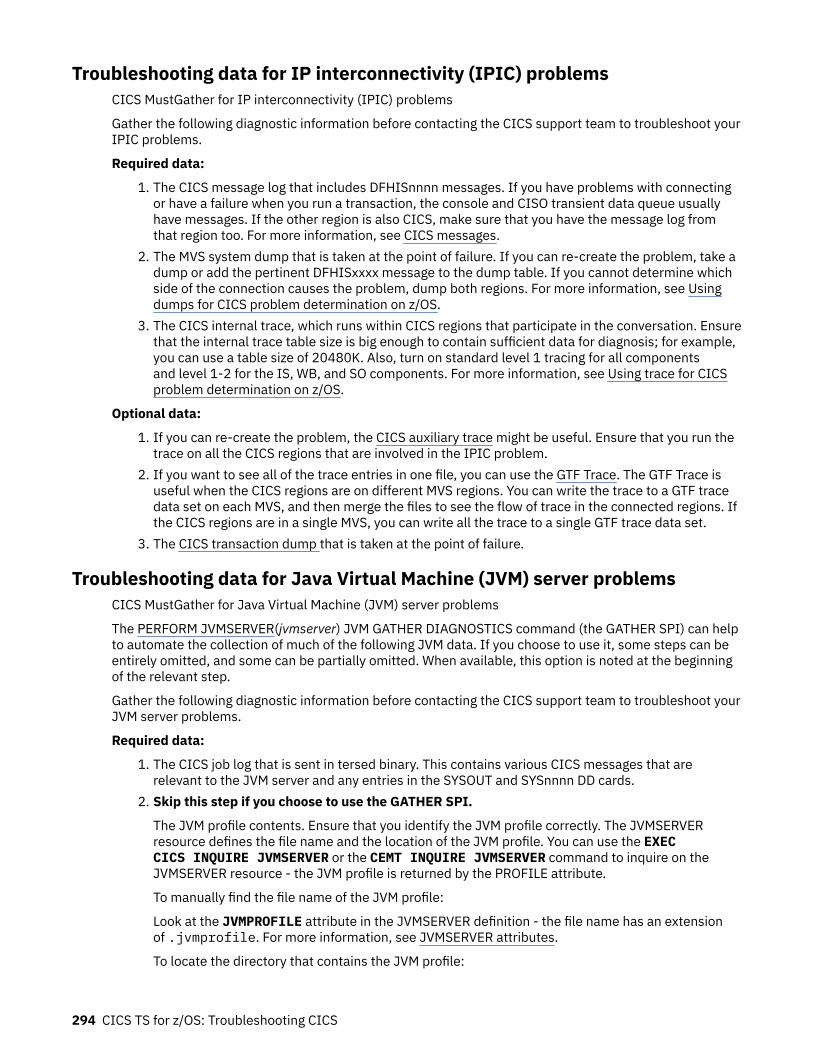
Troubleshooting data for IP interconnectivity (IPIC) problemsCICS MustGather for IP interconnectivity (IPIC) problems
Gather the following diagnostic information before contacting the CICS support team to troubleshoot yourIPIC problems.
Required data:
1. The CICS message log that includes DFHISnnnn messages. If you have problems with connectingor have a failure when you run a transaction, the console and CISO transient data queue usuallyhave messages. If the other region is also CICS, make sure that you have the message log fromthat region too. For more information, see CICS messages.
2. The MVS system dump that is taken at the point of failure. If you can re-create the problem, take adump or add the pertinent DFHISxxxx message to the dump table. If you cannot determine whichside of the connection causes the problem, dump both regions. For more information, see Usingdumps for CICS problem determination on z/OS.
3. The CICS internal trace, which runs within CICS regions that participate in the conversation. Ensurethat the internal trace table size is big enough to contain sufficient data for diagnosis; for example,you can use a table size of 20480K. Also, turn on standard level 1 tracing for all componentsand level 1-2 for the IS, WB, and SO components. For more information, see Using trace for CICSproblem determination on z/OS.
Optional data:
1. If you can re-create the problem, the CICS auxiliary trace might be useful. Ensure that you run thetrace on all the CICS regions that are involved in the IPIC problem.
2. If you want to see all of the trace entries in one file, you can use the GTF Trace. The GTF Trace isuseful when the CICS regions are on different MVS regions. You can write the trace to a GTF tracedata set on each MVS, and then merge the files to see the flow of trace in the connected regions. Ifthe CICS regions are in a single MVS, you can write all the trace to a single GTF trace data set.
3. The CICS transaction dump that is taken at the point of failure.
Troubleshooting data for Java Virtual Machine (JVM) server problemsCICS MustGather for Java Virtual Machine (JVM) server problems
The PERFORM JVMSERVER(jvmserver) JVM GATHER DIAGNOSTICS command (the GATHER SPI) can helpto automate the collection of much of the following JVM data. If you choose to use it, some steps can beentirely omitted, and some can be partially omitted. When available, this option is noted at the beginningof the relevant step.
Gather the following diagnostic information before contacting the CICS support team to troubleshoot yourJVM server problems.
Required data:
1. The CICS job log that is sent in tersed binary. This contains various CICS messages that arerelevant to the JVM server and any entries in the SYSOUT and SYSnnnn DD cards.
2. Skip this step if you choose to use the GATHER SPI.
The JVM profile contents. Ensure that you identify the JVM profile correctly. The JVMSERVERresource defines the file name and the location of the JVM profile. You can use the EXECCICS INQUIRE JVMSERVER or the CEMT INQUIRE JVMSERVER command to inquire on theJVMSERVER resource - the JVM profile is returned by the PROFILE attribute.
To manually find the file name of the JVM profile:
Look at the JVMPROFILE attribute in the JVMSERVER definition - the file name has an extensionof .jvmprofile. For more information, see JVMSERVER attributes.
To locate the directory that contains the JVM profile:
294 CICS TS for z/OS: Troubleshooting CICS
https://www.ibm.com/support/knowledgecenter/SSGMCP_latest/troubleshooting/cics/quickstart-trace.html
https://www.ibm.com/support/knowledgecenter/SSGMCP_latest/troubleshooting/cics/quickstart-trace.html
https://www.ibm.com/support/knowledgecenter/SSGMCP_latest/troubleshooting/cics/quickstart-trace.html
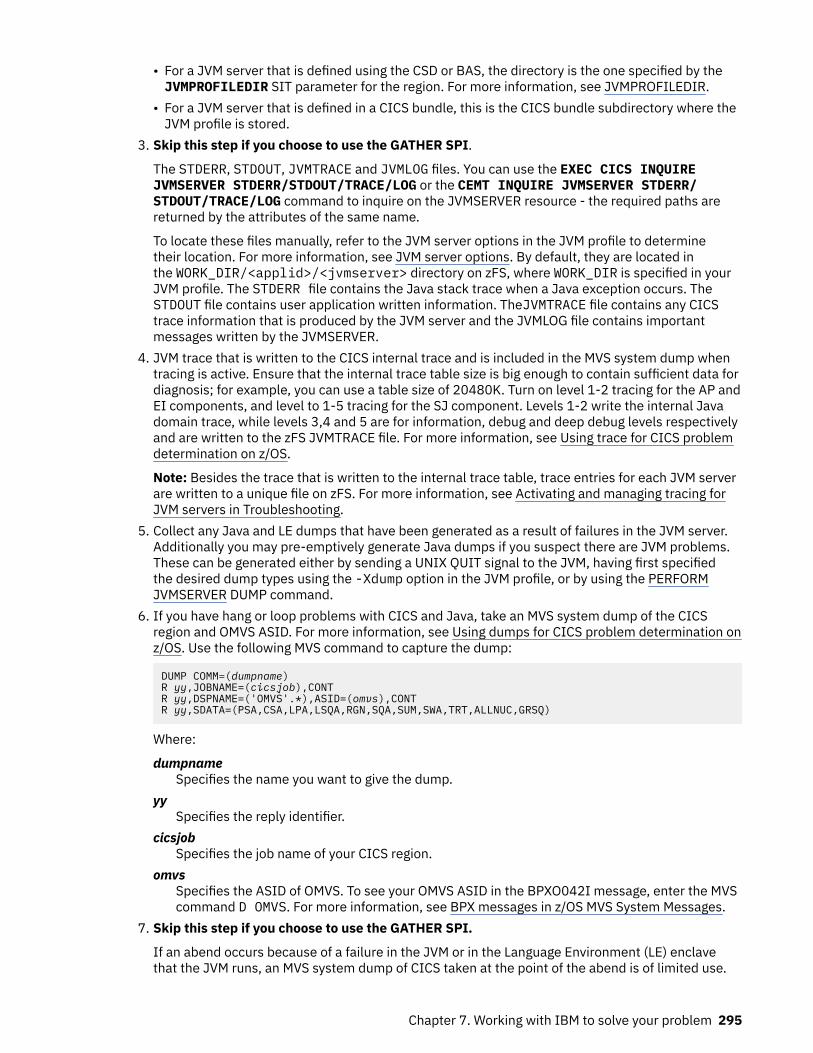
• For a JVM server that is defined using the CSD or BAS, the directory is the one specified by theJVMPROFILEDIR SIT parameter for the region. For more information, see JVMPROFILEDIR.
• For a JVM server that is defined in a CICS bundle, this is the CICS bundle subdirectory where theJVM profile is stored.
3. Skip this step if you choose to use the GATHER SPI.
The STDERR, STDOUT, JVMTRACE and JVMLOG files. You can use the EXEC CICS INQUIREJVMSERVER STDERR/STDOUT/TRACE/LOG or the CEMT INQUIRE JVMSERVER STDERR/STDOUT/TRACE/LOG command to inquire on the JVMSERVER resource - the required paths arereturned by the attributes of the same name.
To locate these files manually, refer to the JVM server options in the JVM profile to determinetheir location. For more information, see JVM server options. By default, they are located inthe WORK_DIR/<applid>/<jvmserver> directory on zFS, where WORK_DIR is specified in yourJVM profile. The STDERR file contains the Java stack trace when a Java exception occurs. TheSTDOUT file contains user application written information. TheJVMTRACE file contains any CICStrace information that is produced by the JVM server and the JVMLOG file contains importantmessages written by the JVMSERVER.
4. JVM trace that is written to the CICS internal trace and is included in the MVS system dump whentracing is active. Ensure that the internal trace table size is big enough to contain sufficient data fordiagnosis; for example, you can use a table size of 20480K. Turn on level 1-2 tracing for the AP andEI components, and level to 1-5 tracing for the SJ component. Levels 1-2 write the internal Javadomain trace, while levels 3,4 and 5 are for information, debug and deep debug levels respectivelyand are written to the zFS JVMTRACE file. For more information, see Using trace for CICS problemdetermination on z/OS.
Note: Besides the trace that is written to the internal trace table, trace entries for each JVM serverare written to a unique file on zFS. For more information, see Activating and managing tracing forJVM servers in Troubleshooting.
5. Collect any Java and LE dumps that have been generated as a result of failures in the JVM server.Additionally you may pre-emptively generate Java dumps if you suspect there are JVM problems.These can be generated either by sending a UNIX QUIT signal to the JVM, having first specifiedthe desired dump types using the -Xdump option in the JVM profile, or by using the PERFORMJVMSERVER DUMP command.
6. If you have hang or loop problems with CICS and Java, take an MVS system dump of the CICSregion and OMVS ASID. For more information, see Using dumps for CICS problem determination onz/OS. Use the following MVS command to capture the dump:
DUMP COMM=(dumpname)R yy,JOBNAME=(cicsjob),CONTR yy,DSPNAME=('OMVS'.*),ASID=(omvs),CONTR yy,SDATA=(PSA,CSA,LPA,LSQA,RGN,SQA,SUM,SWA,TRT,ALLNUC,GRSQ)
Where:
dumpnameSpecifies the name you want to give the dump.
yySpecifies the reply identifier.
cicsjobSpecifies the job name of your CICS region.
omvsSpecifies the ASID of OMVS. To see your OMVS ASID in the BPXO042I message, enter the MVScommand D OMVS. For more information, see BPX messages in z/OS MVS System Messages.
7. Skip this step if you choose to use the GATHER SPI.
If an abend occurs because of a failure in the JVM or in the Language Environment (LE) enclavethat the JVM runs, an MVS system dump of CICS taken at the point of the abend is of limited use.
Chapter 7. Working with IBM to solve your problem 295
https://www.ibm.com/support/knowledgecenter/SSGMCP_latest/troubleshooting/cics/quickstart-trace.html
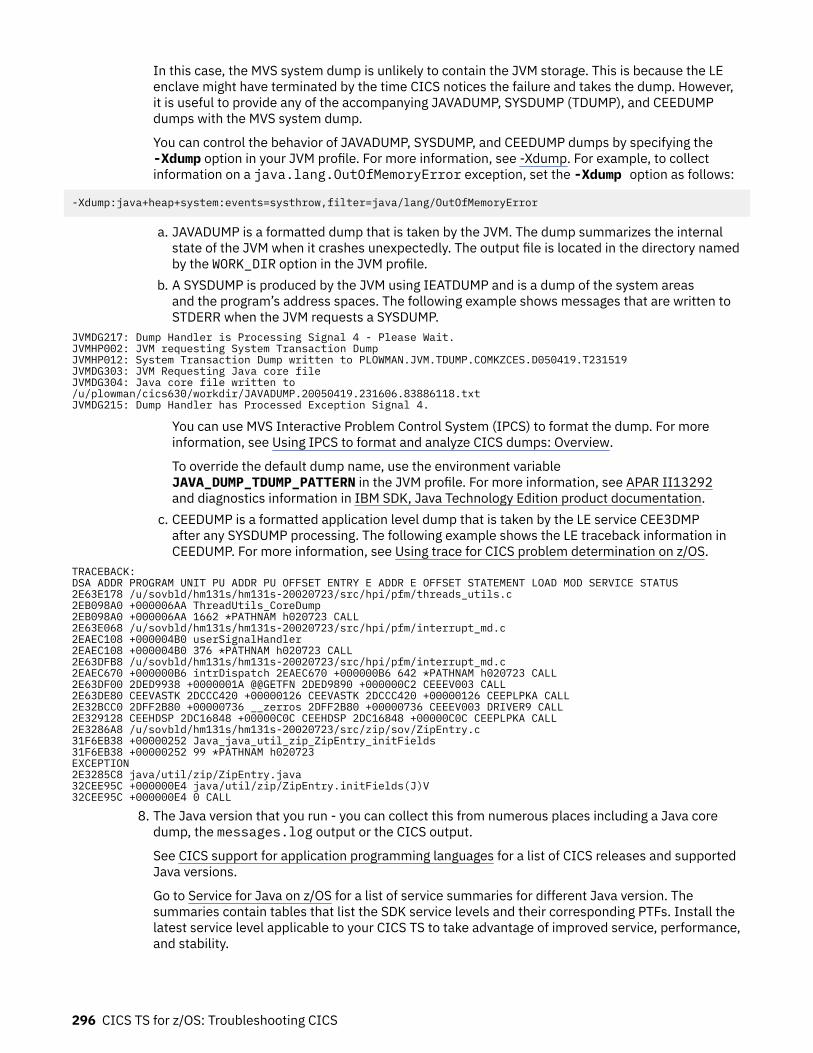
In this case, the MVS system dump is unlikely to contain the JVM storage. This is because the LEenclave might have terminated by the time CICS notices the failure and takes the dump. However,it is useful to provide any of the accompanying JAVADUMP, SYSDUMP (TDUMP), and CEEDUMPdumps with the MVS system dump.
You can control the behavior of JAVADUMP, SYSDUMP, and CEEDUMP dumps by specifying the-Xdump option in your JVM profile. For more information, see -Xdump. For example, to collectinformation on a java.lang.OutOfMemoryError exception, set the -Xdump option as follows:
-Xdump:java+heap+system:events=systhrow,filter=java/lang/OutOfMemoryError
a. JAVADUMP is a formatted dump that is taken by the JVM. The dump summarizes the internalstate of the JVM when it crashes unexpectedly. The output file is located in the directory namedby the WORK_DIR option in the JVM profile.
b. A SYSDUMP is produced by the JVM using IEATDUMP and is a dump of the system areasand the program’s address spaces. The following example shows messages that are written toSTDERR when the JVM requests a SYSDUMP.
JVMDG217: Dump Handler is Processing Signal 4 - Please Wait.JVMHP002: JVM requesting System Transaction DumpJVMHP012: System Transaction Dump written to PLOWMAN.JVM.TDUMP.COMKZCES.D050419.T231519JVMDG303: JVM Requesting Java core fileJVMDG304: Java core file written to/u/plowman/cics630/workdir/JAVADUMP.20050419.231606.83886118.txtJVMDG215: Dump Handler has Processed Exception Signal 4.
You can use MVS Interactive Problem Control System (IPCS) to format the dump. For moreinformation, see Using IPCS to format and analyze CICS dumps: Overview.
To override the default dump name, use the environment variableJAVA_DUMP_TDUMP_PATTERN in the JVM profile. For more information, see APAR II13292and diagnostics information in IBM SDK, Java Technology Edition product documentation.
c. CEEDUMP is a formatted application level dump that is taken by the LE service CEE3DMPafter any SYSDUMP processing. The following example shows the LE traceback information inCEEDUMP. For more information, see Using trace for CICS problem determination on z/OS.
TRACEBACK:DSA ADDR PROGRAM UNIT PU ADDR PU OFFSET ENTRY E ADDR E OFFSET STATEMENT LOAD MOD SERVICE STATUS2E63E178 /u/sovbld/hm131s/hm131s-20020723/src/hpi/pfm/threads_utils.c2EB098A0 +000006AA ThreadUtils_CoreDump2EB098A0 +000006AA 1662 *PATHNAM h020723 CALL2E63E068 /u/sovbld/hm131s/hm131s-20020723/src/hpi/pfm/interrupt_md.c2EAEC108 +000004B0 userSignalHandler2EAEC108 +000004B0 376 *PATHNAM h020723 CALL2E63DFB8 /u/sovbld/hm131s/hm131s-20020723/src/hpi/pfm/interrupt_md.c2EAEC670 +000000B6 intrDispatch 2EAEC670 +000000B6 642 *PATHNAM h020723 CALL2E63DF00 2DED9938 +0000001A @@GETFN 2DED9890 +000000C2 CEEEV003 CALL2E63DE80 CEEVASTK 2DCCC420 +00000126 CEEVASTK 2DCCC420 +00000126 CEEPLPKA CALL2E32BCC0 2DFF2B80 +00000736 __zerros 2DFF2B80 +00000736 CEEEV003 DRIVER9 CALL2E329128 CEEHDSP 2DC16848 +00000C0C CEEHDSP 2DC16848 +00000C0C CEEPLPKA CALL2E3286A8 /u/sovbld/hm131s/hm131s-20020723/src/zip/sov/ZipEntry.c31F6EB38 +00000252 Java_java_util_zip_ZipEntry_initFields31F6EB38 +00000252 99 *PATHNAM h020723EXCEPTION2E3285C8 java/util/zip/ZipEntry.java32CEE95C +000000E4 java/util/zip/ZipEntry.initFields(J)V32CEE95C +000000E4 0 CALL
8. The Java version that you run - you can collect this from numerous places including a Java coredump, the messages.log output or the CICS output.
See CICS support for application programming languages for a list of CICS releases and supportedJava versions.
Go to Service for Java on z/OS for a list of service summaries for different Java version. Thesummaries contain tables that list the SDK service levels and their corresponding PTFs. Install thelatest service level applicable to your CICS TS to take advantage of improved service, performance,and stability.
296 CICS TS for z/OS: Troubleshooting CICS
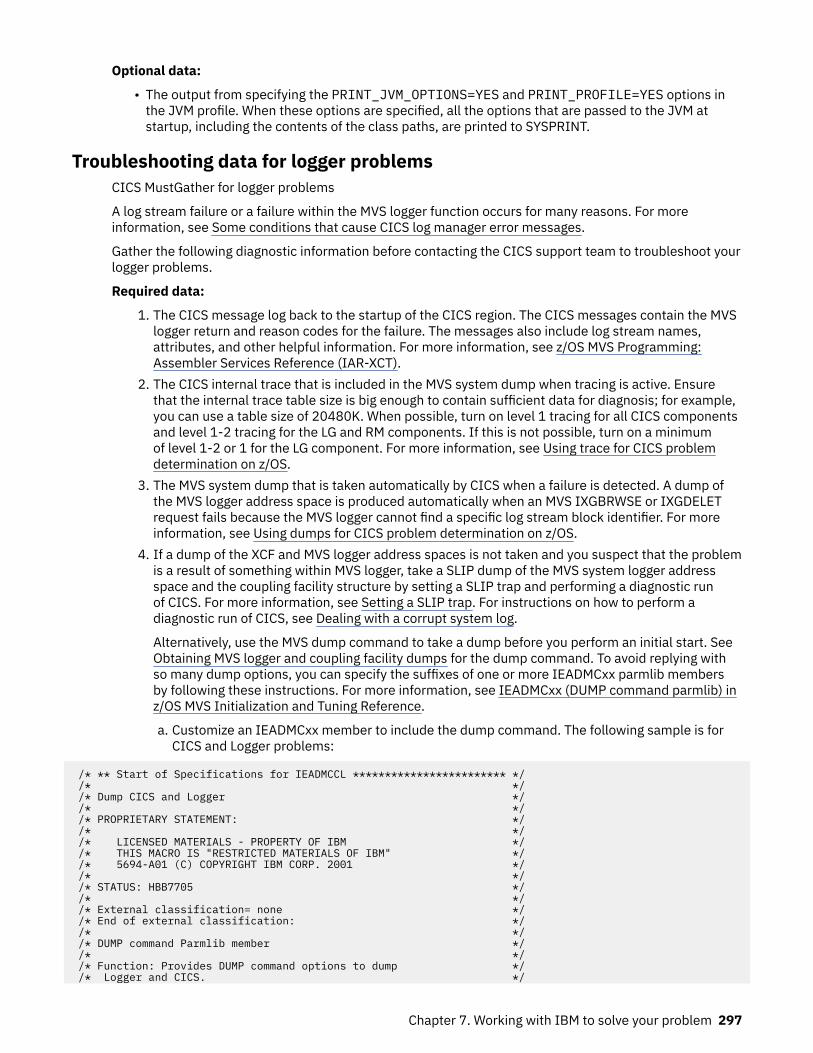
Optional data:
• The output from specifying the PRINT_JVM_OPTIONS=YES and PRINT_PROFILE=YES options inthe JVM profile. When these options are specified, all the options that are passed to the JVM atstartup, including the contents of the class paths, are printed to SYSPRINT.
Troubleshooting data for logger problemsCICS MustGather for logger problems
A log stream failure or a failure within the MVS logger function occurs for many reasons. For moreinformation, see Some conditions that cause CICS log manager error messages.
Gather the following diagnostic information before contacting the CICS support team to troubleshoot yourlogger problems.
Required data:
1. The CICS message log back to the startup of the CICS region. The CICS messages contain the MVSlogger return and reason codes for the failure. The messages also include log stream names,attributes, and other helpful information. For more information, see z/OS MVS Programming:Assembler Services Reference (IAR-XCT).
2. The CICS internal trace that is included in the MVS system dump when tracing is active. Ensurethat the internal trace table size is big enough to contain sufficient data for diagnosis; for example,you can use a table size of 20480K. When possible, turn on level 1 tracing for all CICS componentsand level 1-2 tracing for the LG and RM components. If this is not possible, turn on a minimumof level 1-2 or 1 for the LG component. For more information, see Using trace for CICS problemdetermination on z/OS.
3. The MVS system dump that is taken automatically by CICS when a failure is detected. A dump ofthe MVS logger address space is produced automatically when an MVS IXGBRWSE or IXGDELETrequest fails because the MVS logger cannot find a specific log stream block identifier. For moreinformation, see Using dumps for CICS problem determination on z/OS.
4. If a dump of the XCF and MVS logger address spaces is not taken and you suspect that the problemis a result of something within MVS logger, take a SLIP dump of the MVS system logger addressspace and the coupling facility structure by setting a SLIP trap and performing a diagnostic runof CICS. For more information, see Setting a SLIP trap. For instructions on how to perform adiagnostic run of CICS, see Dealing with a corrupt system log.
Alternatively, use the MVS dump command to take a dump before you perform an initial start. SeeObtaining MVS logger and coupling facility dumps for the dump command. To avoid replying withso many dump options, you can specify the suffixes of one or more IEADMCxx parmlib membersby following these instructions. For more information, see IEADMCxx (DUMP command parmlib) inz/OS MVS Initialization and Tuning Reference.
a. Customize an IEADMCxx member to include the dump command. The following sample is forCICS and Logger problems:
/* ** Start of Specifications for IEADMCCL ************************ */ /* */ /* Dump CICS and Logger */ /* */ /* PROPRIETARY STATEMENT: */ /* */ /* LICENSED MATERIALS - PROPERTY OF IBM */ /* THIS MACRO IS "RESTRICTED MATERIALS OF IBM" */ /* 5694-A01 (C) COPYRIGHT IBM CORP. 2001 */ /* */ /* STATUS: HBB7705 */ /* */ /* External classification= none */ /* End of external classification: */ /* */ /* DUMP command Parmlib member */ /* */ /* Function: Provides DUMP command options to dump */ /* Logger and CICS. */
Chapter 7. Working with IBM to solve your problem 297
https://www.ibm.com/support/knowledgecenter/SSGMCP_latest/troubleshooting/cics/quickstart-trace.html
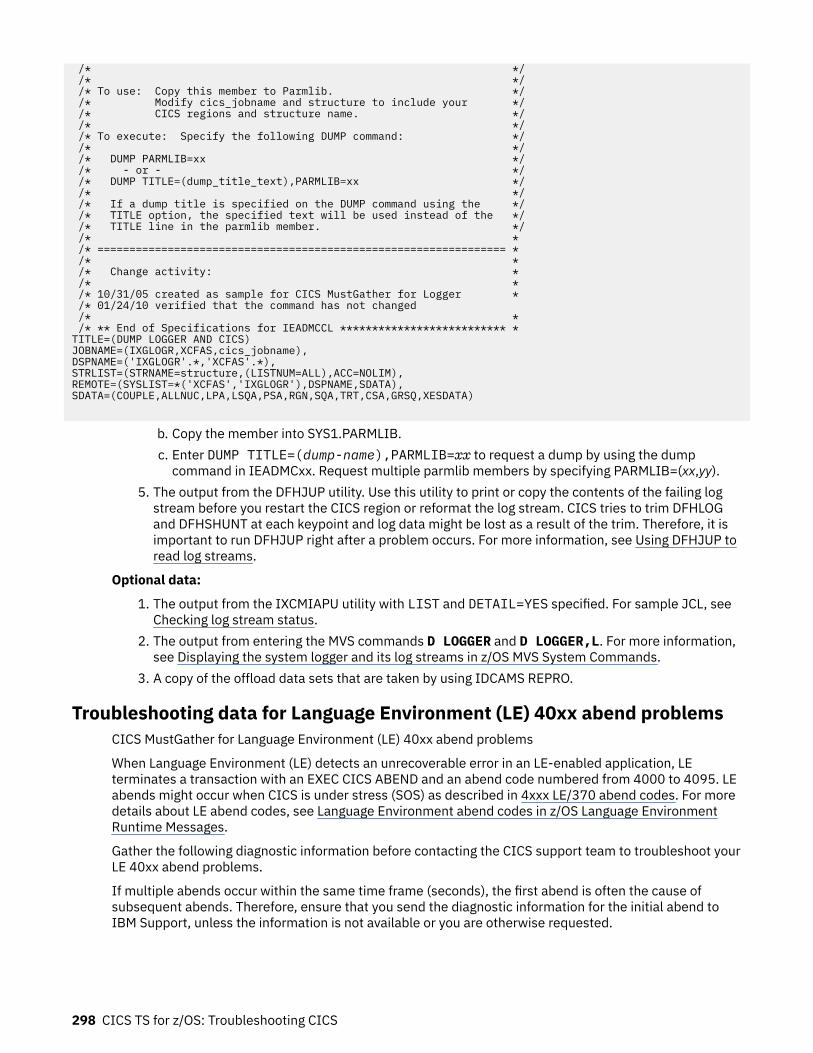
/* */ /* */ /* To use: Copy this member to Parmlib. */ /* Modify cics_jobname and structure to include your */ /* CICS regions and structure name. */ /* */ /* To execute: Specify the following DUMP command: */ /* */ /* DUMP PARMLIB=xx */ /* - or - */ /* DUMP TITLE=(dump_title_text),PARMLIB=xx */ /* */ /* If a dump title is specified on the DUMP command using the */ /* TITLE option, the specified text will be used instead of the */ /* TITLE line in the parmlib member. */ /* * /* ================================================================ * /* * /* Change activity: * /* * /* 10/31/05 created as sample for CICS MustGather for Logger * /* 01/24/10 verified that the command has not changed /* * /* ** End of Specifications for IEADMCCL ************************** *TITLE=(DUMP LOGGER AND CICS)JOBNAME=(IXGLOGR,XCFAS,cics_jobname),DSPNAME=('IXGLOGR'.*,'XCFAS'.*),STRLIST=(STRNAME=structure,(LISTNUM=ALL),ACC=NOLIM),REMOTE=(SYSLIST=*('XCFAS','IXGLOGR'),DSPNAME,SDATA),SDATA=(COUPLE,ALLNUC,LPA,LSQA,PSA,RGN,SQA,TRT,CSA,GRSQ,XESDATA)
b. Copy the member into SYS1.PARMLIB.c. Enter DUMP TITLE=(dump-name),PARMLIB=xx to request a dump by using the dump
command in IEADMCxx. Request multiple parmlib members by specifying PARMLIB=(xx,yy).5. The output from the DFHJUP utility. Use this utility to print or copy the contents of the failing log
stream before you restart the CICS region or reformat the log stream. CICS tries to trim DFHLOGand DFHSHUNT at each keypoint and log data might be lost as a result of the trim. Therefore, it isimportant to run DFHJUP right after a problem occurs. For more information, see Using DFHJUP toread log streams.
Optional data:
1. The output from the IXCMIAPU utility with LIST and DETAIL=YES specified. For sample JCL, seeChecking log stream status.
2. The output from entering the MVS commands D LOGGER and D LOGGER,L. For more information,see Displaying the system logger and its log streams in z/OS MVS System Commands.
3. A copy of the offload data sets that are taken by using IDCAMS REPRO.
Troubleshooting data for Language Environment (LE) 40xx abend problemsCICS MustGather for Language Environment (LE) 40xx abend problems
When Language Environment (LE) detects an unrecoverable error in an LE-enabled application, LEterminates a transaction with an EXEC CICS ABEND and an abend code numbered from 4000 to 4095. LEabends might occur when CICS is under stress (SOS) as described in 4xxx LE/370 abend codes. For moredetails about LE abend codes, see Language Environment abend codes in z/OS Language EnvironmentRuntime Messages.
Gather the following diagnostic information before contacting the CICS support team to troubleshoot yourLE 40xx abend problems.
If multiple abends occur within the same time frame (seconds), the first abend is often the cause ofsubsequent abends. Therefore, ensure that you send the diagnostic information for the initial abend toIBM Support, unless the information is not available or you are otherwise requested.
298 CICS TS for z/OS: Troubleshooting CICS
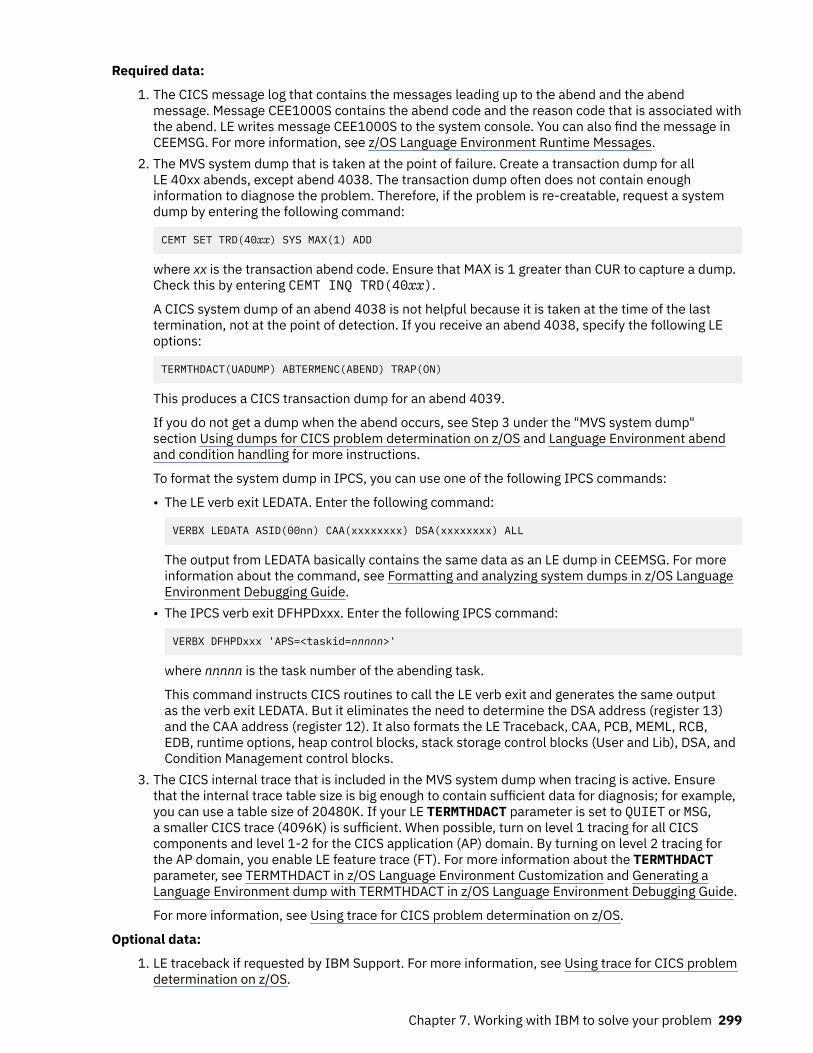
Required data:
1. The CICS message log that contains the messages leading up to the abend and the abendmessage. Message CEE1000S contains the abend code and the reason code that is associated withthe abend. LE writes message CEE1000S to the system console. You can also find the message inCEEMSG. For more information, see z/OS Language Environment Runtime Messages.
2. The MVS system dump that is taken at the point of failure. Create a transaction dump for allLE 40xx abends, except abend 4038. The transaction dump often does not contain enoughinformation to diagnose the problem. Therefore, if the problem is re-creatable, request a systemdump by entering the following command:
CEMT SET TRD(40xx) SYS MAX(1) ADD
where xx is the transaction abend code. Ensure that MAX is 1 greater than CUR to capture a dump.Check this by entering CEMT INQ TRD(40xx).
A CICS system dump of an abend 4038 is not helpful because it is taken at the time of the lasttermination, not at the point of detection. If you receive an abend 4038, specify the following LEoptions:
TERMTHDACT(UADUMP) ABTERMENC(ABEND) TRAP(ON)
This produces a CICS transaction dump for an abend 4039.
If you do not get a dump when the abend occurs, see Step 3 under the "MVS system dump"section Using dumps for CICS problem determination on z/OS and Language Environment abendand condition handling for more instructions.
To format the system dump in IPCS, you can use one of the following IPCS commands:
• The LE verb exit LEDATA. Enter the following command:
VERBX LEDATA ASID(00nn) CAA(xxxxxxxx) DSA(xxxxxxxx) ALL
The output from LEDATA basically contains the same data as an LE dump in CEEMSG. For moreinformation about the command, see Formatting and analyzing system dumps in z/OS LanguageEnvironment Debugging Guide.
• The IPCS verb exit DFHPDxxx. Enter the following IPCS command:
VERBX DFHPDxxx 'APS=<taskid=nnnnn>'
where nnnnn is the task number of the abending task.
This command instructs CICS routines to call the LE verb exit and generates the same outputas the verb exit LEDATA. But it eliminates the need to determine the DSA address (register 13)and the CAA address (register 12). It also formats the LE Traceback, CAA, PCB, MEML, RCB,EDB, runtime options, heap control blocks, stack storage control blocks (User and Lib), DSA, andCondition Management control blocks.
3. The CICS internal trace that is included in the MVS system dump when tracing is active. Ensurethat the internal trace table size is big enough to contain sufficient data for diagnosis; for example,you can use a table size of 20480K. If your LE TERMTHDACT parameter is set to QUIET or MSG,a smaller CICS trace (4096K) is sufficient. When possible, turn on level 1 tracing for all CICScomponents and level 1-2 for the CICS application (AP) domain. By turning on level 2 tracing forthe AP domain, you enable LE feature trace (FT). For more information about the TERMTHDACTparameter, see TERMTHDACT in z/OS Language Environment Customization and Generating aLanguage Environment dump with TERMTHDACT in z/OS Language Environment Debugging Guide.
For more information, see Using trace for CICS problem determination on z/OS.
Optional data:
1. LE traceback if requested by IBM Support. For more information, see Using trace for CICS problemdetermination on z/OS.
Chapter 7. Working with IBM to solve your problem 299
https://www.ibm.com/support/knowledgecenter/SSGMCP_latest/troubleshooting/cics/quickstart-trace.html
2. If you need a larger trace, consider using the CICS auxiliary trace or the GTF Trace with the MVSsystem dump. Ensure that you turn on the levels of tracing as documented in the "CICS internaltrace" section in Using trace for CICS problem determination on z/OS.
Troubleshooting data for dynamic LIBRARY management problemsCICS MustGather for dynamic LIBRARY management problems
Unexpected errors of dynamic LIBRARY management might occur under the following circumstances:
1. Installing a dynamic LIBRARY2. Using SET LIBRARY to change a dynamic LIBRARY3. Loading programs4. Using SET PROGRAM NEWCOPY
Also, if an error results in a system dump that is taken by the CICS Loader, the error might be a dynamicLIBRARY management problem.
Gather the following diagnostic information before contacting the CICS support team to troubleshoot yourdynamic LIBRARY management problems.
Required data:
1. The CICS message log that contains the messages that lead up to the failure, including all theDFHLDnnnn messages that report the problem. For more information, see CICS messages.
2. LIBRARY audit trail messages that are sent to the CSLB transient data queue, which by default isan indirect queue to CSSL. The most recent instances of audit trail messages are very useful:
a. DFHLD0555 and DFHLD0556 that give the dynamic LIBRARY configuration at the time of theerror
b. DFHLD0505, DFHLD0506, and DFHLD0507 that give details for each LIBRARY when it isinstalled
The audit trail also contains messages that indicate the success or failure of LIBRARY managementoperations.
3. The MVS system dump that is taken at the point of failure. If a dump is not created by CICS whenthe problem occurs and you can re-create the problem, take a system dump manually, or add thepertinent DFHLDnnnn message to the dump table. If system dumping is permitted for the dumpcode and system dumping is not disabled, a system dump is taken when the error is detected.If you do not get a dump when the abend occurs, see number 3 under the "MVS system dump "section in Using dumps for CICS problem determination on z/OS.
4. The CICS internal trace that is included in the MVS system dump when tracing is active. Ensurethat the internal trace table size is big enough to contain sufficient data for diagnosis; for example,you can use a table size of 20480K. When possible, turn on level 1 tracing for all CICS componentsand level 1-2 tracing for the LD component. If this is not possible, turn on a minimum of level 1-2for the LD component, and turn on level 1 for LM and SM when possible. For more information, seeUsing trace for CICS problem determination on z/OS.
Optional data:
1. Output from the CEMT INQUIRE LIBRARY command. The output shows the LIBRARY resourcesthat are installed in the system and the details for each LIBRARY. This command is particularlyhelpful if audit trail information is not available.
2. Output from the CEMT INQUIRE PROGRAM command for programs that are affected by theproblem. The output shows the information in the LIBRARY and LIBRARYDSN parameters.
3. The CICS auxiliary trace might be useful if you can re-create the problem. As with the CICS internaltrace, when possible, turn on level 1 tracing for all CICS components and level 1-2 tracing forthe LD component. If this is not possible, turn on a minimum of level 1-2 for the LD componentand if possible, level 1 for LM and SM. For more information, see Using trace for CICS problemdetermination on z/OS.
300 CICS TS for z/OS: Troubleshooting CICS
https://www.ibm.com/support/knowledgecenter/SSGMCP_latest/troubleshooting/cics/quickstart-trace.html
https://www.ibm.com/support/knowledgecenter/SSGMCP_latest/troubleshooting/cics/quickstart-trace.html
Troubleshooting data for CICS TS Feature Pack for Mobile Extensions V1.0 inCICS TS 4.2 or CICS TS 5.1
CICS MustGather for CICS TS Feature Pack for Mobile Extensions problems
Before you gather the following documentation and contact IBM Support, run the sample application thatis distributed with the feature pack to verify your installation. Depending on the release you use, followeither the Version 4.2 instruction or the Version 5.1 instruction.
Note: In CICS TS 5.2, the functionality of the CICS TS Feature Pack for Mobile Extensions is incorporatedinto CICS; therefore, there is no longer a requirement to install the feature pack. If you use CICS TS 5.2 orlater, see “Troubleshooting data for web services, XML, and JSON transformation problems” on page 312.
Gather the following diagnostic information before contacting the CICS support team to troubleshoot yourCICS TS Feature Pack for Mobile Extensions problems.
Required data:
• For problems with the CICS JSON assistants, including problems with DFHJS2LS or DFHLS2JS,provide the following documentation:
1. A description of the problem.2. The source document. For DFHLS2JS, the document includes the language structure (copybook).
For DFHJS2LS, the document includes the JSON schema that is used as input.3. A list of the parameters that you specified.4. The log file that is generated by DFHJS2LS or DFHLS2JS.
• For problems with the configuration of a pipeline that is used to handle JSON web service requests,provide the pipeline configuration file that is used. This file includes problems with installing andmanipulating pipelines. For more information about the pipeline configuration file in CICS TS 5.1,see Creating the CICS infrastructure for a JSON service provider in IBM Documentation for CICSTS 5.1. For the pipeline configuration file in CICS TS 4.2, see Creating the CICS infrastructure for aJSON service provider in IBM Documentation for CICS TS 4.2.
• For JSON web services runtime problems or problems in using the linkable interface to transformJSON, provide the following documentation:
1. An MVS system dump if one is taken. For more information, see Using dumps for CICS problemdetermination on z/OS. If you receive message DFHPI1007 or DFHPI1008 and a dump is nottaken, request a dump when you receive the message by enter the following command:
CEMT SET SYD(xxxxx) SYS MAX(1) ADD
where xxxxx is the CICS message without the DFH prefix.
And then re-create the problem or wait for it to occur.2. The CICS internal trace that is included in the MVS system dump when tracing is active. For more
information, see Using trace for CICS problem determination on z/OS. Ensure that the internaltrace table size is big enough to contain sufficient data for diagnosis; for example, you can use atable size of 20480K. When possible, turn on the following trace levels:
a. Level 1-2 for the ML, PG, PI, SO, and WB components. ML level 2 trace might affectperformance.
b. Level 1-2 for the AP component if you have a code page conversion problem.c. Level 1 for all other CICS components.
3. An unformatted CICS auxiliary trace if no dump is available. For more information on CICSauxiliary trace and the trace levels you need to turn on, see the "CICS internal trace" section inUsing trace for CICS problem determination on z/OS.
Chapter 7. Working with IBM to solve your problem 301
Troubleshooting data for multiregion operation (MRO) problemsCICS MustGather for multiregion operation (MRO) problems
Gather the following diagnostic information before contacting the CICS support team to troubleshoot yourMRO problems.
Required data:
1. The CICS message log of both regions in the MRO conversation.2. The MVS system dump that is taken at the point of failure. Setting system or transaction
dump codes by using CEMT is preferred. Ensure that appropriate dump codes are set in bothCICS regions within the conversation.For more information, see Using dumps for CICS problemdetermination on z/OS.
Note: Messages or abends might be different on each side of the conversation.3. The CICS internal trace of CICS regions that participate in the conversation. Ensure that the
internal trace table size is big enough to contain sufficient data for diagnosis; for example, you canuse a table size of 20480K. Also, turn on standard level 1 tracing for all components and level1-2 for the IS component. Use the CETR transaction to turn on internal trace, to set internal tracesize, and to set component trace levels. For more information, see Using trace for CICS problemdetermination on z/OS.
Optional data:
1. If you can re-create the problem, the CICS auxiliary trace might be useful. Ensure that you runthe trace on all the CICS regions that are involved in the MRO problem. For more information, seeUsing trace for CICS problem determination on z/OS.
2. If you want to see all of the trace entries in one file, you can use the GTF Trace. The GTF Trace isuseful in an XCF environment, when the CICS regions are on different MVS regions. You can writethe trace to a GTF trace data set on each MVS, and then merge the files to see the flow of tracein the connected regions. If the CICS regions are in a single MVS, you can write all the trace to asingle GTF trace data set. For more information, see Using trace for CICS problem determinationon z/OS.
3. The CICS transaction dump that is taken at the point of failure. For more information, see Usingdumps for CICS problem determination on z/OS.
Troubleshooting data for Node.js problems in CICS Transaction Server forz/OS, Version 5 Release 5 or later
CICS MustGather for Node.js problems
Gather the following diagnostic information before contacting the CICS support team to troubleshoot yourNode.js problems.
Required data:
1. The CICS job log and any entries in the SYSOUT and SYSnnnn DD cards. Ensure this is sentin tersed binary format. The job log contains CICS messages that are relevant to the BUNDLEresource and Node.js application.
2. The Node.js profile contents, and files that are included using the %INCLUDE profile option. Ensurethat you identify the Node.js profile correctly. The NODEJSAPP resource defines the file name andthe location of the Node.js profile. You can use INQUIRE NODEJSAPP API or the CEMT INQUIRENODEJSAPP command to inquire on the NODEJSAPP resource.
3. The LOG, STDERR, STDOUT, and TRACE files. Refer to the Node.js profile options to determine theirlocation, as described in Node.js profile and command line options. You can also use the INQUIRENODEJSAPP API or the CEMT INQUIRE NODEJSAPP command to determine the locations ofthese files. The STDERR file contains the Node.js stack trace when a JavaScript exception occurs.The STDOUT file contains information written by the application. The LOG file contains CICS
302 CICS TS for z/OS: Troubleshooting CICS
https://www.ibm.com/support/knowledgecenter/SSGMCP_latest/troubleshooting/cics/quickstart-trace.html
https://www.ibm.com/support/knowledgecenter/SSGMCP_latest/troubleshooting/cics/quickstart-trace.html
https://www.ibm.com/support/knowledgecenter/SSGMCP_latest/troubleshooting/cics/quickstart-trace.html
https://www.ibm.com/support/knowledgecenter/SSGMCP_latest/troubleshooting/cics/quickstart-trace.html
messages related to managing the environment for Node.js. The TRACE file contains CICS traceinformation relating to the execution of the Node.js runtime and application.
4. The CICS internal trace table that is included in a z/OS system dump when tracing is active.Ensure that the internal trace table size is big enough to contain sufficient data for diagnosis. Forexample, you can use a table size of 20480K. Set CICS JS component tracing to level 1-5, andall other components to at least level 1. For more information, see Using trace for CICS problemdetermination on z/OS.
Note: Besides the trace that is written to the internal trace table, trace entries for each Node.jsapplication are written to a unique file on zFS. For more information, see Activating and managingtracing for Node.js applications.
5. The Language Environment system dump. This is required if there is a failure in the Node.jsapplication or in the Language Environment (LE) enclave that the Node.js application runs. Thehigh-level qualifier for the dump dataset is controlled by the Language Environment runtime optionDYNDUMP. For more information, see z/OS Language Environment Programming Reference. AnIEA822I message is written to the CICS job log identifying the dump dataset. In addition, aCEEDUMP may be written to the CICS job log.
6. The Node.js version used by the application. To determine the Node.js version, execute the z/OSUNIX command:
<NODE_HOME>/bin/node --version
where <NODE_HOME> is the value of the NODE_HOME option specified in the Node.js profile.
Troubleshooting data for performance problems in CICS TSCICS MustGather for performance problems
Performance problems tend to fall into one of two common categories:
• Poor response time - tasks fail to start running at all or take a long time to complete. Both symptomscontribute to your perception that CICS is running slowly.
• Increased CPU time - either the end user paying the bill is complaining that CPU costs have gone up, orsomeone has noticed that they are using more CPU than before.
A defect in CICS or other related product could be the cause of your problem.
Performance problems can also be a result of your system being badly tuned, or because it is operatingnear the limits of its capacity. In this case, you will probably notice that the problem is worst at peaksystem load times, typically at mid-morning and mid-afternoon.
If you find that performance degradation is not dependent on system loading, but happens sometimeswhen the system is lightly loaded, a poorly designed transaction could be the cause.
CICS Services: IBM support is responsible for helping you when there is a defect in an IBM product. Ifyou have a new application that has never successfully worked, or if IBM support determines that yourproblem is out of the scope of what they do, you can contact your IBM sales representative. The salesteam can initiate a call with IBM Lab Services who can help you tune CICS or make changes to yourapplications to reduce resource demand. They can also help you determine if you have insufficient orpoorly configured hardware resources.
Before you gather any documentationAnswer the following performance questions to help support determine the nature of the problem(the more detail and more precise the better):
• What is the problem (CPU increase or response time increase, specific transaction or alltransactions...)?
• How much of an increase in CPU or response time are you seeing?• What is the scope and business impact (is it an overall slowdown, are all transactions affected, or
are only a few transactions affected, perhaps a single application)?
Chapter 7. Working with IBM to solve your problem 303
https://www.ibm.com/support/knowledgecenter/SSGMCP_latest/troubleshooting/cics/quickstart-trace.html
• Does the problem occur at a specific time in the day (peek hours, intermittently, or continuously)?• Did something change when the problem started? If so, what changed?
Application programsWorkload (increase in number of transactions)CICS configuration (JCL, SIT, or resource definitions)Other software like MVS, Db2, IMS, or OEM vendor softwareMaintenance applied to CICS, MVS, VTAM, LE, OEM vendor software, or other products thatinterface with CICSHardware (processor, DASD, LPAR configuration, network, new NCP or I/O configuration)
IBM Support would like to encourage you to look at performance reports and is very interested in youranalysis. Screen shots or output from tooling are welcome.
Gather the following diagnostic information before contacting the CICS support team to troubleshoot yourperformance problems.
Required data:
1. Complete CICS job log (that includes at minimum JESMSGLG, MSGUSR, and CEEMSG) back to thestartup of the CICS region. System Management Facilities (SMF) writes message IEF374I to theJESYSMG log for the job at step termination. This message contains overall CPU time (TCB) andSRB accumulated time for the address space. Other helpful information like error messages mightalso be in the CICS job log.
2. MVS system dump of your CICS region taken during the time of the problem. If possible, anMVS system dump of same region during a time of equivalent workload when the problem is notoccurring.
3. SMF110 records from all LPARs involved in the problem. If possible, the SMF110 records shouldspan from about 15 minutes before the problem started to about 15 minutes after the problemended. If that is not feasible, send about 1 hour of SMF110 records starting from about 15 minutesbefore the problem started.
• Monitoring data - SMF type 110 subtype 0001 records (Performance and Exception data) showresource usage by individual transactions. There are several utilities available for you to processCICS monitoring data.
• Statistics data - SMF type 110 subtype 0002 - 0005 records show system-wide resource usage.There are several utilities that you can use to process CICS statistics.
4. Printed detail summary reports of software records written to SYS1.LOGREC. To print theserecords, use the EREP service aid. See Step 9: Generating Detail Reports for Software Recordsin the EREP User's Guide for more information.
5. If the performance problem is confined to one LPAR, MVS system log (SYSLOG) containingmessages for the LPAR leading up to and including the time when the problem is happening (or theentire day).
6. If the problem spans multiple LPARs, the merged sysplex-wide system message log, also knownas the operations log (OPERLOG), from the time leading up to and including the time when theproblem is happening (or the entire day).
Optional data:
1. CPU - CPU Activity report that includes SMF type 70 subtype 1 (CPU activity) records leading up toand including the time of increased CPU consumption (a few 15 minute intervals before and duringthe problem). This report will show you if CPU capping is occurring due to limits that have been set.
2. RMF 3 VSAM data sets covering the time leading up to and including the time when the problemis occurring. See Sending data sets to a different system for instructions on how to use the CLISTERBV2S, which is supplied with RMF, to unload the VSAM dataset(s) to a sequential data set fortransport.
3. If the problem is short lived and predictable, output from the STAT transaction (DFH0STAT) for theCICS address space. Run STAT just before the problem occurs and after the problem ends.
304 CICS TS for z/OS: Troubleshooting CICS
Tip: Review the logs and performance data generated during the period of time you are seeing theperformance problem. Compare this data with data from the same CICS region during a time of equivalentworkload when the problem is not occurring.
Troubleshooting data for policy problemsCICS MustGather for policy problems
Policy problems occur for different reasons. To identify the source of errors that affect policies:
• For CICS TS 5.1, see Troubleshooting for policies.• For CICS TS 5.2 or later, see Troubleshooting platforms, applications, and policies.
After that, follow these guidelines to gather complementary diagnostic information before contacting theCICS support team.
Required data:
1. Relevant messages from the CICS console log. These messages typically include any DFHMPnnnnmessage. For more information, see CICS messages.
2. The CICS internal trace that is included in the MVS system dump when tracing is active. For moreinformation, see Using trace for CICS problem determination on z/OS. Ensure that the internaltrace table size is big enough to contain sufficient data for diagnosis; for example, you can use atable size of 20480K. When possible, turn on level 2 tracing for the MP component and level 1tracing for all other CICS components. If this is not possible, turn on level 1 tracing by followingthese rules:
• For problems during the installation of a policy, turn on a minimum of level 1 tracing for MP, PI,SM, PG, and RL components.
• For runtime problems, turn on a minimum of level 1 tracing for MP, EI, ME, and SM components.If the problem involves Time policies, also turn on level 1 tracing for the DS component. Forpolicies with an action of event, also turn on level 1 tracing for EC, EP, and PG components.
3. The MVS system dump that is taken when the problem occurs. The way that you get the dumpdepends on whether or not you get a message, transaction abend, or no output when the problemoccurs. For more information, see Using dumps for CICS problem determination on z/OS.
4. If you are unable to get a system dump, take a CICS auxiliary trace that leads up to the error. Formore information, see Using trace for CICS problem determination on z/OS. If possible, turn onlevel 2 tracing for the MP components, and level 1 tracing for all other CICS components. If this isnot possible, turn on level 1 tracing by using the following rules:
• For problems during the install of a policy, turn on a minimum of level 1 tracing for MP, PI, SM,PG, and RL components.
• For runtime problems, turn on a minimum of level 1 tracing for MP, EI, ME, and SM components.If the problem involves Time policies, also turn on level 1 tracing for the DS component. Forpolicies with an action of event, also turn on EC, EP, and PG components.
Troubleshooting data for program check or abend problemsCICS MustGather for program check or abend problems
Gather the following diagnostic information before contacting the CICS support team to troubleshoot yourprogram check or abend problems.
Required data:
1. The CICS message log that contains the messages leading up to the abend with the abend codeand the abend message.
If multiple abends occur within the same time frame (seconds), the first abend is often the causeof subsequent abends. Therefore, ensure that you send the diagnostic information for the initialabend to IBM Support, unless the information is not available or you are otherwise requested.
Chapter 7. Working with IBM to solve your problem 305
2. The MVS system dump that is taken at the point of failure. If system dumping is permitted forthe dump code and system dumping is not disabled, a system dump is taken when the error isdetected. See number 3 under the "MVS system dump " section in Using dumps for CICS problemdetermination on z/OS if you do not get a dump when the abend occurs.
Optional data:
1. The CICS transaction dump that is taken at the point of failure. The transaction dump oftendoes not contain enough information to diagnose the problem. Therefore, if you have only onetransaction dump and the problem is re-creatable, you can request a system dump by entering oneof the following commands:
• CEMT SET TRD(xxxx) SYS MAX(1) ADD
where xxxx is the transaction abend code.
Ensure that MAX is 1 greater than CUR to capture a dump. Check this by entering CEMT INQTRD(xxxx).
• CEMT SET SYD(xxxxx) SYS MAX(1) ADD
where xxxxx is the CICS message without the DFH.
Enter this command to request a system dump when you receive CICS messages at the timeof the error. It is common to suppress dumps for dump code AP0001. Make sure that you donot suppress dumps for AP0001 by entering CEMT INQ SYS(AP0001) and ensuring that SYS isspecified.
For more information, see Using dumps for CICS problem determination on z/OS.2. The CICS internal trace that is included in the MVS system dump when tracing is active. Ensure
that the internal trace table size is big enough to contain sufficient data for diagnosis; for example,you can use a table size of 20480K. When possible, turn on level 1 tracing for all CICS components.For more information, see Using trace for CICS problem determination on z/OS.
Troubleshooting data for Service Flow Runtime (SFR) problemsCICS MustGather for Service Flow Runtime (SFR) problems
If you are a new user to the SFR, you can use SupportPac CH1C to test whether program links that use aCICS channel and Link3270 bridge invocations can be made from within a service flow. These tests helpyou ensure that the CICS Service Flow Runtime is installed and configured correctly. After that, gather thefollowing diagnostic information before contacting the CICS support team to troubleshoot your CICS SFRproblems.
Required data:
1. The CICS message log that contains the SFR error messages. See Messages and codes issued byCICS Service Flow Runtime V3.2 for more information.
2. If you experience a problem with a Link3270 server adapter, see Steps 4 through 6 underTroubleshooting Link3270 server adapters for instructions on how to turn on vector logging,populate the vector log file, and dump the vector log file.
3. The MVS system dump that is taken at the point of failure. The CICS internal trace is included inthe MVS system dump if tracing is active. Ensure that the internal trace table size is big enoughto contain sufficient data for diagnosis; for example, you can use a table size of 20480K. Activatethe CICS auxiliary trace, and turn on level 1 tracing for all components, with an exception of ALLfor EI, AP, BA, BR, EM, PI, SH, TC, and WB. Then re-create the error and capture a system dumpby using the CEMT P SNAP command. For more information, see Using dumps for CICS problemdetermination on z/OS and Using trace for CICS problem determination on z/OS.
For information on application domain (AP) trace points that are written by CICS SFR, see CICSService Flow Runtime: Trace points. For information on trace points that are written by CICS
306 CICS TS for z/OS: Troubleshooting CICS
https://www.ibm.com/support/knowledgecenter/SSGMCP_latest/troubleshooting/cics/quickstart-trace.html
Business Transactions Services (BTS), see Trace entries. BTS consists of business applicationmanager (BA), event manager (EM), and scheduler services (SH).
4. The non-compiled generated service flow that is produced by the Rational Developer for System z®
modeler. This is the generated COBOL code that is the code equivalent of what the user modeledon the modeler.
Optional data:
1. The MVS system dump that is taken at the point of failure. For more information, see Using dumpsfor CICS problem determination on z/OS.
2. An archive file that contains the Service Flow Projects. Perform the following steps from IBMRational Developer for System z that contains the Service Flow Projects:
a. Click File > Export.b. In the Export window, select General > Archive File.c. In the Archive file wizard, select the base Service Flow Project and all its associated projects.
The following examples are possible project names:
• serviceprojectname• serviceprojectname.Interface• serviceprojectname.Nonterminal• serviceprojectname.OutboundWebService• serviceprojectname.Terminal
d. Complete the Archive file wizard to produce the archive file that contains the Service FlowProjects.
Troubleshooting data for file control shared data table (SDT) problemsCICS MustGather for file control shared data table (SDT) problems
Gather the following diagnostic information before contacting the CICS support team to troubleshoot yourshared data table (SDT) problems.
Required data:
1. The CICS message log for all CICS regions that use the SDT and the system log (SYSLOG) for allMVS images that use the SDT.
2. The CICS internal trace that is included in the MVS system dump when tracing is active. Ensurethat the internal trace table size is big enough to contain sufficient data for diagnosis; for example,you can use a table size of 20480K. When possible, turn on level 1 tracing for all CICS componentsand level 1-2 for the FC component. For more information, see Using trace for CICS problemdetermination on z/OS.
3. The MVS system dump of the CICS address space and the data spaces for the shared data tables.For more information, see Using dumps for CICS problem determination on z/OS and Data spacesfor data tables. Use the following MVS command at the time of the problem to capture the dump:
DUMP COMM=(CICS & SDT)R nn,JOBNAME=(cicsjob),DSPNAME=('cicsjob'.DFHDTnnn),END
where:
nnSpecifies the reply identifier.
cicsjobSpecifies your CICS job name.
DFHDTnnnSpecifies the data space name.
Chapter 7. Working with IBM to solve your problem 307
https://www.ibm.com/support/knowledgecenter/SSGMCP_latest/troubleshooting/cics/quickstart-trace.html
If the total size of the data tables exceeds 2GB, the data records for each table might be spreadacross more than one data space. For example, DFHDT003, DFHDT004 and so on.
To dump multiple data spaces, you can follow a partial data space name with a wildcard ofasterisk. For example, specify DSPNAME=('cicsjob'.DFHDT*) to dump all data spaces thatstart with DFHDT. However, use wildcards with care because if there are many data spaces thedump data set might be huge. For more information, see Dump information for data tables.
To determine the data space name or names of your CICS region, enter MVS command DJ,jobname, where jobname is your CICS job name. For example, a DSPNAME=DFHDT001 in themessage output indicates that the data space name is DFHDT001.
Troubleshooting data for short on storage (SOS) problemsCICS MustGather for short on storage (SOS) problems
SOS conditions might occur for the following reasons:
• Other resource constraints that cause CICS tasks to occupy storage for longer than is normallynecessary
• A flood of tasks that simply overwhelms available free storage• Badly designed applications that require unreasonably large amounts of storage
Follow this instruction to analyze your SOS conditions. Review the logs and dumps generated at the pointof failure.
Gather the following diagnostic information before contacting the CICS support team to troubleshoot yourSOS problems.
Required data:MVS system dump taken at the point that the SOS condition occurs. Capture the dump by placingSM0131 or SM0133 in the system dump table. For example, enter CEMT SET SYD(SM0131) SYSMAX(1) ADD to add SM0133 and request one system dump.
Optional data:CICS message log containing either message DFHSM0131, DFHSM0133 or DFHSM0606.
Troubleshooting data for storage violation problemsCICS MustGather for storage violation problems
A storage violation occurs for an overlay of storage that should not be changed, for example, an overlayof storage check zones (SCZ) that surround task storage. In normal operation, CICS sets up four task-lifetime storage subpools for each task. Each element in the subpool starts and ends with a check zonethat includes the subpool name. At each FREEMAIN execution and at the end of task, CICS checks thecheck zones and abends the task if either check zone has been overwritten.
To diagnose a storage violation problem, see Dealing with storage violations. After that, follow theseguidelines to gather complementary diagnostic information before contacting the CICS support team.
Required data:
1. The CICS message log that contains the messages DFHSM0102 or DFHSM0103, which indicatethat CICS has detected a storage violation.
2. The MVS system dump that is taken automatically when CICS generates messages DFHSM0102and DFHSM0103. You can use the SIT parameter DUMP=NO or the system dump table with thesystem dump codes SM0102 or SM0103 to suppress the dumps. For more information, see Usingdumps for CICS problem determination on z/OS.
3. The CICS internal trace that is included in the MVS system dump when tracing is active. Ensurethat the internal trace table size is big enough to contain sufficient data for diagnosis; for example,you can use a table size of 20480K. Also, turn on level 1 tracing for all CICS components. For moreinformation, see Using trace for CICS problem determination on z/OS.
308 CICS TS for z/OS: Troubleshooting CICS
Optional data:
1. If you want to identify the transaction that causes the storage overlay or if you need to keep arecord of system actions over a long period of time, take the CICS auxiliary trace or the GTF Trace.For more information, see Using trace for CICS problem determination on z/OS.
2. If you receive message DFHSM0103 as a result of the storage checker, take an MVS system dump.You can force storage chain checking by using the CHKSTSK or the CHKSTRM SIT parameter, or byusing the CSFE DEBUG transaction. Set your options in one of the following ways:CHKSTSK=CURRENT
Validates SCZs for task storage.CHKSTRM=CURRENT
Validates SAAs.
For more information, see How you can force storage chain checking.
Troubleshooting data for terminal hang problemsCICS MustGather for terminal hang problems
Terminals hang with x-clock or other symptoms for many reasons, for example, application problems,emulators, or failure to follow SNA protocol.
Gather the following diagnostic information before contacting the CICS support team to troubleshoot yourterminal hang problems.
Required data:
1. The CICS message log that contains DFHZCnnnn messages for the terminal. Messages are writtento the console or the CSNE transient data destination. If terminals are involved in transactionrouting, collect the CICS message log for both the terminal owning region (TOR) and theapplication owning region (AOR). For more information, see CICS messages.
2. The MVS system dump that is taken after the terminal is hung so control blocks such as the RPLand TCTTE can be analyzed. If terminals are involved in transaction routing, take an MVS systemdump of both the TOR and the AOR. For more information, see Using dumps for CICS problemdetermination on z/OS.
3. The CICS internal trace that is included in the MVS system dump when tracing is active. Ensurethat the internal trace table size is big enough to contain sufficient data for diagnosis; for example,you can use a table size of 20480K. Also, turn on level 1 tracing for all CICS components. If theproblem is re-creatable, set the level of tracing to 1-2 for the AP, IS, and TC components. For moreinformation, see Using trace for CICS problem determination on z/OS.
Optional data:
1. If you want to identify a transaction that causes the terminal to hang and you need to keep a recordof system actions over a long period of time, take the CICS auxiliary trace or the GTF Trace. Formore information, see Using trace for CICS problem determination on z/OS.
2. If the hang occurs at bind time (you never see the CICS good morning message), take a z/OSCommunications Server (VTAM) buffer trace of the logon application identifier (applid) to see thebind flow. Also, take a z/OS Communications Server exit trace (CICS VTAM exit trace), and aZCP trace. For more information on the trace, see Using trace for CICS problem determinationon z/OS, “z/OS Communications Server exit tracing” on page 81, and Specifying transaction andterminal-related trace options.
3. If a specific DFHZCxxxx message appears to be the cause of the hang, you can add the message tothe CICS system dump table. The following command is an example:
CEMT SET SYD(ZC2403) MAX(1) ADD
This produces a system dump at the time of the DFHZCxxxx message. The dump contains the tracethat leads up to the failure. Ensure that MAX is 1 greater than CUR to capture a dump. Check thisby entering CEMT INQ SYD(ZCxxxx).
Chapter 7. Working with IBM to solve your problem 309
https://www.ibm.com/support/knowledgecenter/SSGMCP_latest/troubleshooting/cics/quickstart-trace.html
https://www.ibm.com/support/knowledgecenter/SSGMCP_latest/troubleshooting/cics/quickstart-trace.html
https://www.ibm.com/support/knowledgecenter/SSGMCP_latest/troubleshooting/cics/quickstart-trace.html
https://www.ibm.com/support/knowledgecenter/SSGMCP_latest/troubleshooting/cics/quickstart-trace.html
Troubleshooting data for temporary storage (TS) server problemsCICS MustGather for temporary storage (TS) server problems
If you receive a message, see DFHXQnnnn messages for the explanation and user response. For moreinformation, see CICS messages. If a user task waits on a resource type of TSSHARED, TSPOOL, orTSQUEUE, see Investigating temporary storage waits.
Gather the following diagnostic information before contacting the CICS support team to troubleshoot yourtemporary storage server problems.
Required data:
1. The CICS message log and the MVS system log (SYSLOG).2. The SYSPRINT log for the TS server. Although most of the same information is also visible in
the MVS system log, the SYSPRINT log might contain statistics and some other informationalmessages, for example, the options that are used during start-up.
3. The CICS internal trace that is included in the MVS system dump when tracing is active. Ensurethat the internal trace table size is big enough to contain sufficient data for diagnosis; for example,you can use a table size of 20480K. When possible, turn on level 1 tracing for all CICS componentsand level 1-2 for the TS component. For more information, see Using trace for CICS problemdetermination on z/OS.
4. If you receive a message and can re-create the problem, take a SLIP dump of the CICS region orregions. Also, take the TS list structure when you receive the message. Set the SLIP by using thefollowing MVS command, and then re-create the problem as follows. For more information, seeUsing dumps for CICS problem determination on z/OS.
SLIP SET,MSGID=DFHXQnnnn,ACTION=SVCD,STRLIST=(STRNAME=DFHXQLS_poolname,ACC=NOLIM,(LISTNUM=ALL,ADJ=DIRECTIO,EDATA=UNSERIALIZE)),JOBLIST=(ts-server,XCFAS,cicsjob),SDATA=(RGN,XESDATA,ALLNUC,CSA,LSQA,PSA,SQA,SUM,SWA,TRT,COUPLE,WLM,GRSQ,LPA),MATCHLIM=1,ID=CIC1,END
where:
DFHXQnnnnSpecifies the message you receive.
poolnameSpecifies your TS pool.
ts-serverSpecifies your TS server.
cicsjobSpecifies the job name for your CICS region.
If the pool structure becomes unexpectedly full, a dump with the STRLIST=(...(...)) helpsdetermine what fills up the pool. If you only want to dump the pool, see “Dumping a sharedtemporary storage list structure ” on page 41 for more instructions.
5. If there is a wait or hang, take an MVS system dump of the CICS region or regions. Also, take theTS list structure when you notice the hang or wait. For more information, see Using dumps for CICSproblem determination on z/OS. Use the following MVS command followed by the reply to capturethe dump of the list structure:
DUMP COMM=(dumpname)R yy,JOBNAME=(ts-server,XCFAS,cicsjob),STRLIST=(STRNAME=DFHXQLS_poolname,ACC=NOLIM,(LISTNUM=ALL,ADJ=DIRECTIO,EDATA=UNSERIALIZE)),SDATA=(RGN,XESDATA,ALLNUC,CSA,LSQA,PSA,SQA,SUM,SWA,TRT,COUPLE,WLM,GRSQ,LPA),END
where:
310 CICS TS for z/OS: Troubleshooting CICS
https://www.ibm.com/support/knowledgecenter/SSGMCP_latest/troubleshooting/cics/quickstart-trace.html
dumpnameSpecifies the name you want to give the dump.
yySpecifies the reply identifier.
ts-serverSpecifies your TS server.
cicsjobSpecifies the job name for your CICS region.
poolnameSpecifies your TS pool.
A dump of the pool is rarely needed by IBM, so you can exclude STRLIST=(...(...)) from thedump command if you are concerned about dump size.
Optional data:
If you receive a wait and can reproduce the problem, consider using the CICS auxiliary trace or theGTF trace with the MVS system dump. The MVS system dump alone is unlikely to show anything aboutsystem activity in the period that leads up to the wait because the trace table probably wraps beforeyou have a chance to respond. But the CICS auxiliary trace and the GTF trace can provide you withenough trace. For more information, see Using trace for CICS problem determination on z/OS.
Troubleshooting data for waits or loopsCICS MustGather for waits or loops
A wait or hang occurs for different reasons. For example, the region might be at the MXT limit, so no newtasks can be attached. Or the region might wait for an ECB to be posted. A loop is the repeated executionof some code.
If you suspect that the problem is due to another IBM product or subsystem like MVS system logger,Db2, VSAM, or RLS, see the MustGather document for that particular component. Otherwise, gather thefollowing diagnostic information before contacting the CICS support team to troubleshoot your wait orloop problems.
Required data:
1. The CICS internal trace that is included in the MVS system dump when tracing is active. Ensurethat the internal trace table size is big enough to contain sufficient data for diagnosis; for example,you can use a table size of 20480K. When possible, turn on level 1 tracing for all CICS components.For more information, see Using trace for CICS problem determination on z/OS.
2. An MVS system dump of the CICS region that is taken as soon as you notice the hang or wait. Formore information, see Using dumps for CICS problem determination on z/OS. Use the followingMVS command followed by the reply to capture the dump:
DUMP COMM=(dumpname)R yy,JOBNAME=(cicsjob),SDATA=(ALLNUC,PSA,SQA,CSA,LPA,TRT,LSQA,RGN)
where:
dumpnameSpecifies the name you want to give the dump.
yySpecifies the reply identifier.
cicsjobSpecifies the job name of your CICS region.
3. The CPU utilization for the CICS region. To display the active CICS job, enter S.DA when you useSDSF under TSO. Enter PF11 to display the percent of CPU time that is used on behalf of thisaddress space during the most recent interval measured.
Chapter 7. Working with IBM to solve your problem 311
https://www.ibm.com/support/knowledgecenter/SSGMCP_latest/troubleshooting/cics/quickstart-trace.html
Optional data:
1. The CICS message log that contains the last message created by CICS and the time the messagewas created.
2. If you can reproduce the problem, consider using the CICS auxiliary trace or the GTF Trace with theMVS system dump. The MVS system dump alone is unlikely to show anything about system activityin the period that leads up to the wait because the trace table probably wraps before you have achance to respond. For more information, see Using trace for CICS problem determination on z/OS.
Troubleshooting data for web services, XML, and JSON transformationproblems
CICS MustGather for web services, XML, and JSON transformation problems
If you are a new user to web services, run the web services sample application that is distributed withCICS. For more information on sample applications, see The CICS catalog manager example application.The CICS sample requires that you use WebSphere® Application Server or something similar as the clientplatform. If you do not have those, you can test CICS web services by using free Eclipse software toensure that web services are set up correctly in your CICS region. For more information, see Testing CICSWeb services.
Gather the following diagnostic information before contacting the CICS support team to troubleshoot yourweb services problems.
Note: In CICS TS 5.1 or earlier, support for JSON web services is provided by CICS TS Feature Packfor Mobile Extensions. For problems with JSON web services in CICS TS 4.2 or CICS TS 5.1, see“Troubleshooting data for CICS TS Feature Pack for Mobile Extensions V1.0 in CICS TS 4.2 or CICS TS 5.1”on page 301.
Required data:
1. For the CICS web services assistant, the CICS XML assistant, or the CICS JSON assistant that hasproblems with DFHWS2LS, DFHLS2WS, DFHSC2LS, DFHLS2SC, DFHJS2LS, or DFHLS2JS, collectthe following documentation. For more information, see The CICS web services assistant, The CICSXML assistant, and The CICS JSON assistant.
a. A description of the problem.b. The source document. For DFHLS2WS, DFHLS2SC, and DFHLS2JS, the source document
includes the language structure (copybook). For DFHWS2LS, DFHSC2LS, or DFHJS2LS, thedocument includes the Web Services Description Language (WSDL) file, XML schema, or JSONschema that is used as input to the assistant, and all external WSDL and schema documentsthat are included in it.
c. A list of the parameters that you specified.d. The log file that is generated by DFHWS2LS, DFHLS2WS, DFHSC2LS, DFHLS2SC, DFHJS2LS, or
DFHLS2JS.2. For problems with the configuration of a pipeline that is used to handle web service requests,
collect the pipeline configuration file that is used. This file includes problems such as handlerprograms not being called or problems with installing and manipulating pipelines by using CEMT.For more information, see Pipeline configuration files.
3. For web services runtime problems, collect the following documentation:
a. An MVS system dump if one is taken. For more information, see Using dumps for CICS problemdetermination on z/OS. If you receive message DFHPI1007 or DFHPI1008 and a dump is nottaken, enter the following command when you receive the message to request a dump:
CEMT SET SYD(xxxxx) SYS MAX(1) ADD
where xxxxx specifies the CICS message without the DFH. And then re-create the problem orwait for it to occur.
312 CICS TS for z/OS: Troubleshooting CICS
b. The CICS internal trace that is included in the MVS system dump when tracing is active. Formore information, see Using trace for CICS problem determination on z/OS. Ensure that theinternal trace table size is big enough to contain sufficient data for diagnosis; for example, youcan use a table size of 20480K. When possible, turn on the following trace levels:
i) Level 1-2 for the PI, SO, and WB components.ii) Level 1-2 for the AP component if you have a code page conversion problem.
iii) Level 1-2 for the ML component. ML level 2 trace might affect performance.iv) Level 1-2 for the PG component.v) Level 1 for all other CICS components.
c. An unformatted CICS auxiliary trace if no dump is available. For more information on the CICSinternal trace and the trace levels you need to turn on, see the "CICS internal trace " section inUsing trace for CICS problem determination on z/OS.
The global trap exit DFHTRAPThe global trap exit DFHTRAP is an Assembler language program that can be invoked when the CICS tracedomain is called to write a trace entry. DFHTRAP is intended to be used only under the guidance of IBMService personnel, to make a detailed diagnosis of a problem without having to stop and restart CICS.
Typically, the global trap exit is used to detect errors that cannot be diagnosed by other methods:
• Errors that occurred some time before the effects are noticed• Errors that cause intermittent problems that are difficult to reproduce
For example, a field might be changed to a bad value, or some structure in storage might be overlaid at aspecific offset.
A skeleton version of DFHTRAP is supplied in both source and load-module forms. The source ofDFHTRAP is cataloged in the CICS730.SDFHMAC library.
Installing and controlling the DFHTRAP exitBefore you use the global trap exit DFHTRAP you must install and activate it.
About this taskYou can install and activate the global trap exit DFHTRAP at CICS initialization or while CICS is running.You can also deactivate the exit while CICS is running.
If a program check occurs in DFHTRAP, the recovery routine in DFHTRPT marks the exit as unusable,and it is ignored on future invocations of the trace domain. CICS issues the message DFHTR1001 tothe system console and takes a CICS system dump with dump code TR1001, showing the PSW andregisters at the time of the interrupt. To recover from this situation, you must replace the current versionof DFHTRAP.
Procedure• Install DFHTRAP as part of the RDO group DFHFE, using one of the following methods:
• The GRPLIST system initialization parameter.• The CEDA transaction while CICS is running.
• To activate the global trap exit at CICS initialization, specify the system initialization parameterTRAP=ON, either in DFHSIT or as a startup override.
• To activate or reactivate the global trap exit while CICS is running, issue the following command:
CSFE DEBUG,TRAP=ON
• To deactivate the global trap exit, issue the following command:
Chapter 7. Working with IBM to solve your problem 313
CSFE DEBUG,TRAP=OFF
• To replace the current version of DFHTRAP, issue the following sequence of commands:
CSFE DEBUG,TRAP=OFFCEMT SET PROGRAM(DFHTRAP) NEWCOPYCSFE DEBUG,TRAP=ON
Related tasksCoding the DFHTRAP exitThe source of the skeleton version of the global trap exit DFHTRAP contains comments that explain itsuse of registers and DSECTs, and the coding required to use the exit.Related referenceInformation passed to the DFHTRAP exitThe CICS trace domain passes information to the DFHTRAP exit in a parameter list addressed by register1. The DSECT DFHTRADS is supplied for this list.Actions the DFHTRAP exit can takeThe global trap exit can set a return-action flag byte to tell the trace domain what action is required onreturn from the exit.
Information passed to the DFHTRAP exitThe CICS trace domain passes information to the DFHTRAP exit in a parameter list addressed by register1. The DSECT DFHTRADS is supplied for this list.
DFHTRADS contains the addresses of the following items:
• The return-action flag byte• The trace entry that has just been added to the trace table• Up to three data fields for data below the bar or above the bar (in 64-bit storage) to be included in a
further trace entry• An 80-byte work area for the sole use of the global trap exit• The CICS common system area (CSA)• The task control area (TCA), if there is one• A register save area
The CSA address is zero for invocations of DFHTRAP early in initialization, before the CSA is acquired.
The DSECT also contains EQU statements for use in setting the return-action flag byte.
The global trap exit can look at data from the current trace entry to determine whether or not the problemunder investigation has appeared. It can also look at the TCA of the current task, and the CSA. TheDSECTs for these areas are included in the skeleton source for DFHTRAP.
Related tasksInstalling and controlling the DFHTRAP exitBefore you use the global trap exit DFHTRAP you must install and activate it.Coding the DFHTRAP exitThe source of the skeleton version of the global trap exit DFHTRAP contains comments that explain itsuse of registers and DSECTs, and the coding required to use the exit.Related referenceActions the DFHTRAP exit can take
314 CICS TS for z/OS: Troubleshooting CICS
The global trap exit can set a return-action flag byte to tell the trace domain what action is required onreturn from the exit.
Actions the DFHTRAP exit can takeThe global trap exit can set a return-action flag byte to tell the trace domain what action is required onreturn from the exit.
Any combination of the following actions can be specified:
• Do nothing.• Make a further trace entry using data in 24 bit storage or 31 bit storage (below the bar).• Make a further trace entry using data in 64 bit storage (above the bar).• Take a CICS system dump. There are two possible actions here, take a system dump while holding the
trace lock using system dump code TR1004, or take a system dump without holding the trace lock usingsystem dump code TR1003. Holding the trace lock while the system dump is taken is more invasive tothe system but might be required if debugging a concurrency problem.
• Terminate CICS without a system dump after message DFHTR1000. (If you require a system dump, thesystem dump return-action flag must also be set.)
• Disable the trap exit, so that it is not invoked again until you issue the command CSFEDEBUG,TRAP=ON.
All actions are honored on return to the trace domain.
The skeleton source for DFHTRAP shows how to make a further trace entry. When DFHTRAP detects a TSGET request, you can ask for a further trace entry to be made by entering the data required in the datafields supplied for this purpose, and by setting the appropriate bit in the return-action flag byte. If therequired data is in 64 bit storage (above the bar), you must use the 64 bit versions of the data fields, andset the appropriate bit in the return-action flag byte to show that 64 bit data is used. The trace domainmakes a trace entry with trace point ID TR 0103, incorporating the information supplied by the exit.
Trace entries created following a request by DFHTRAP are written to the currently active trace destination.This could be the internal trace table, the auxiliary trace data set, or the GTF trace data set.
The skeleton source for DFHTRAP also shows how to detect the trace entry made by the storage manager(SM) domain for a GETMAIN request for a particular subpool. The skeleton source shows you how to lookat the data fields within a trace entry.
Related tasksInstalling and controlling the DFHTRAP exitBefore you use the global trap exit DFHTRAP you must install and activate it.Coding the DFHTRAP exitThe source of the skeleton version of the global trap exit DFHTRAP contains comments that explain itsuse of registers and DSECTs, and the coding required to use the exit.Related referenceInformation passed to the DFHTRAP exitThe CICS trace domain passes information to the DFHTRAP exit in a parameter list addressed by register1. The DSECT DFHTRADS is supplied for this list.
Coding the DFHTRAP exitThe source of the skeleton version of the global trap exit DFHTRAP contains comments that explain itsuse of registers and DSECTs, and the coding required to use the exit.
About this taskThe skeleton version of DFHTRAP is supplied in both source and load-module forms. The source ofDFHTRAP is cataloged in the CICS730.SDFHMAC library. DFHTRAP runs in AMODE(64).
Chapter 7. Working with IBM to solve your problem 315
The 80-byte work area that is provided for the sole use of the global trap exit is in 64-bit storage (storageabove the bar). When the global trap exit is activated, the trace domain acquires the storage and initializesit to binary zeros. The working storage exists until the global trap exit is deactivated by the commandCSFE DEBUG,TRAP=OFF. In a dump, the DFHTRAP working storage is located as follows:
• In a CICS transaction dump, the information about DFHTRAP is soon after the CSA optional features list.The 80-byte work area is at the end of the DFHTRAP working storage and is immediately preceded bya 16-byte eye catcher (DFHTRAP_WORKAREA), so that the work area can be located even if it has notbeen formatted.
• In a CICS system dump, the DFHTRAP working storage is in the trace domain (TR) section. See“Formatting system dumps” on page 42 for details of how to use the TR keyword to format the tracedomain information in the dump.
For information about the actions that you can specify for DFHTRAP, see “Actions the DFHTRAP exit cantake” on page 315.
Procedure• Ensure that the code in DFHTRAP does not use any CICS services, cause the current task to lose
control, or change the status of the CICS system.• Ensure that DFHTRAP saves and restores the trace domain's registers. The supplied skeleton version
contains the code necessary to do this.You are strongly advised not to change this code.
• Ensure that DFHTRAP is specified as AMODE(64) and RMODE(ANY).DFHTRAP might switch addressing mode while it is running, but it must always return control to thetrace domain in 64-bit mode.
• Ensure that the library search sequence in the CICS startup JCL finds the correct version of the loadmodule.
Related tasksInstalling and controlling the DFHTRAP exitBefore you use the global trap exit DFHTRAP you must install and activate it.Related referenceInformation passed to the DFHTRAP exitThe CICS trace domain passes information to the DFHTRAP exit in a parameter list addressed by register1. The DSECT DFHTRADS is supplied for this list.Actions the DFHTRAP exit can takeThe global trap exit can set a return-action flag byte to tell the trace domain what action is required onreturn from the exit.
316 CICS TS for z/OS: Troubleshooting CICS
Chapter 8. Troubleshooting EXCI
Important: This information contains Diagnosis, Modification or Tuning information.
The external CICS interface provides diagnostic information that you can use to help with problemdetermination.
CICS provides the following diagnostic information:
• Trace• System dumps• MVS 04xx abends for the external CICS interface• The EXCI service trap, DFHXCTRA• EXCI trace entry points
For details of the external CICS interface messages and abend codes, see DFHEX messages and 04xx(external CICS interface) abend codes.
TraceThe external CICS interface writes trace data to two destinations: an internal trace table and an externalMVS GTF data set. The internal trace table resides in the non-CICS MVS address space. Trace data isformatted and included in any dumps produced by the external CICS interface.
Trace entries are issued by the external CICS interface destined for the internal trace table, an MVS GTFdata set, or both. They are listed in “EXCI trace entry points” on page 319.
To use GTF for external CICS interface tracing, GTF user tracing must be active, GTF must be started in theMVS image, and you must specify GTF=ON in the DFHXCOPT options table.
If you use GTF trace for both the CICS server region and the external CICS interface region, the traceentries are interleaved, which can help you with problem determination in the CICS–EXCI environment.
Note: The external CICS interface maintains a separate trace table for each user TCB in an external CICSinterface application program.
The external CICS interface does not support any form of auxiliary trace.
Formatting GTF traceTo format external CICS interface trace entries written to GTF, you can use the standard CICS DFHTR730trace formatting routine.
To format external CICS interface trace entries you use the same FID and ID as for CICS (that is,FID=X'EF', and ID=X'F6C').
Using System dumpsThe external CICS interface produces MVS SYSMDUMPs for some error conditions and MVS SDUMPs forother, more serious conditions. These dumps contain all the external CICS interface control blocks, aswell as trace entries.
Formatting system dumpsYou can use the CICS IPCS verb exit, DFHPD730, to format the system dumps.
The following keywords are available for use when formatting an external CICS interface dump usingDFHPD730:
© Copyright IBM Corp. 1974, 2021 317
KEFormats PSW and registers, and all external CICS interface control blocks.
LDFormats a load map of where the external CICS interface modules are loaded in the address space,and gives their PTF level.
MROFormats the MRO control blocks for the external CICS interface address space, including commoncontrol blocks that reside in the MVS common service area (CSA). This option also formats some MROblocks that reside in the CICS address space for pipes connected to CICS.
PGFormats the PG control blocks for channels and containers.
TRFormats the external CICS interface trace table. You can format the trace table in abbreviated and fullforms (TR=1 gives you the abbreviated trace).
SUProduces a dump summary.
Multiple TCBsIf the external CICS interface takes a system dump when there is more than one TCB in use, it dumps onlythe control blocks and trace table for the TCB that requested the dump.
If you take a memory dump of the external CICS address space using a console command, the CICS verbexit routine, DFHPD730 formats the control blocks and trace tables for every TCB it finds in the dump.
Capturing SYSMDUMPsTo capture SYSMDUMPs produced by the external CICS interface, ensure you always include a DDstatement for the SYSMDUMP data set in the client application program's JCL.
Using the MVS DUMP command at the console for dumpsIn addition to the dumps taken automatically by the external CICS interface, you can also force a dumpof an address space running a client application program by entering the MVS DUMP command at theconsole.
You can use the CICS IPCS verb exit routine DFHPD730 to format dumps taken in this way. You can alsoissue the DUMP command from TSO, SDSF, or NetView.
You can also use the DUMP command to dump the CICS server address space as well as the client addressspace. Use the CICS IPCS verb exit routine DFHPD730 to format the dump that contains both addressspaces.
The EXCI service trap, DFHXCTRAA user-replaceable program, DFHXCTRA, is available for use under the guidance of IBM servicepersonnel. It is the equivalent of DFHTRAP used in CICS. It is invoked every time the external CICSinterface writes a trace entry.
DFHXCTRA can perform one or all of the following actions:
1. Request the external CICS interface to write a trace entry on its behalf2. Instruct the external CICS interface to take an SDUMP3. Instruct the external CICS interface to skip writing the current trace entry to GTF4. Instruct the external CICS interface to disable DFHXCTRA
318 CICS TS for z/OS: Troubleshooting CICS
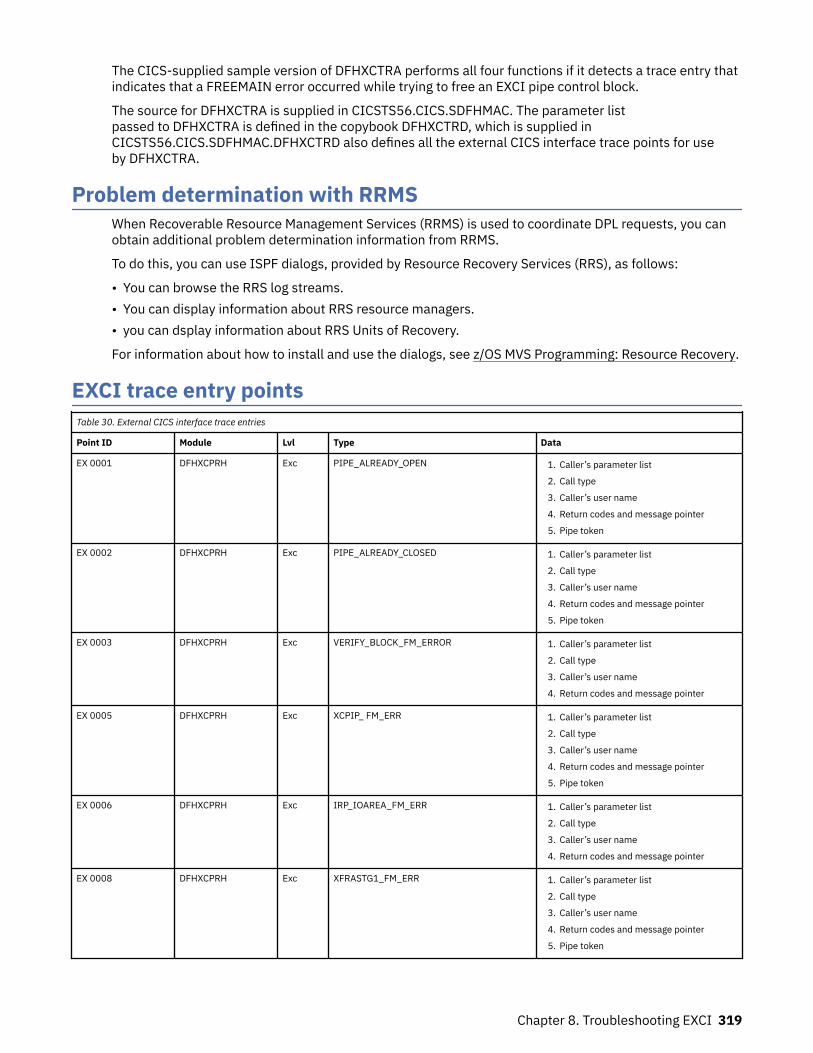
The CICS-supplied sample version of DFHXCTRA performs all four functions if it detects a trace entry thatindicates that a FREEMAIN error occurred while trying to free an EXCI pipe control block.
The source for DFHXCTRA is supplied in CICSTS56.CICS.SDFHMAC. The parameter listpassed to DFHXCTRA is defined in the copybook DFHXCTRD, which is supplied inCICSTS56.CICS.SDFHMAC.DFHXCTRD also defines all the external CICS interface trace points for useby DFHXCTRA.
Problem determination with RRMSWhen Recoverable Resource Management Services (RRMS) is used to coordinate DPL requests, you canobtain additional problem determination information from RRMS.
To do this, you can use ISPF dialogs, provided by Resource Recovery Services (RRS), as follows:
• You can browse the RRS log streams.• You can display information about RRS resource managers.• you can dsplay information about RRS Units of Recovery.
For information about how to install and use the dialogs, see z/OS MVS Programming: Resource Recovery.
EXCI trace entry pointsTable 30. External CICS interface trace entries
Point ID Module Lvl Type Data
EX 0001 DFHXCPRH Exc PIPE_ALREADY_OPEN 1. Caller’s parameter list
2. Call type
3. Caller’s user name
4. Return codes and message pointer
5. Pipe token
EX 0002 DFHXCPRH Exc PIPE_ALREADY_CLOSED 1. Caller’s parameter list
2. Call type
3. Caller’s user name
4. Return codes and message pointer
5. Pipe token
EX 0003 DFHXCPRH Exc VERIFY_BLOCK_FM_ERROR 1. Caller’s parameter list
2. Call type
3. Caller’s user name
4. Return codes and message pointer
EX 0005 DFHXCPRH Exc XCPIP_ FM_ERR 1. Caller’s parameter list
2. Call type
3. Caller’s user name
4. Return codes and message pointer
5. Pipe token
EX 0006 DFHXCPRH Exc IRP_IOAREA_FM_ERR 1. Caller’s parameter list
2. Call type
3. Caller’s user name
4. Return codes and message pointer
EX 0008 DFHXCPRH Exc XFRASTG1_FM_ERR 1. Caller’s parameter list
2. Call type
3. Caller’s user name
4. Return codes and message pointer
5. Pipe token
Chapter 8. Troubleshooting EXCI 319
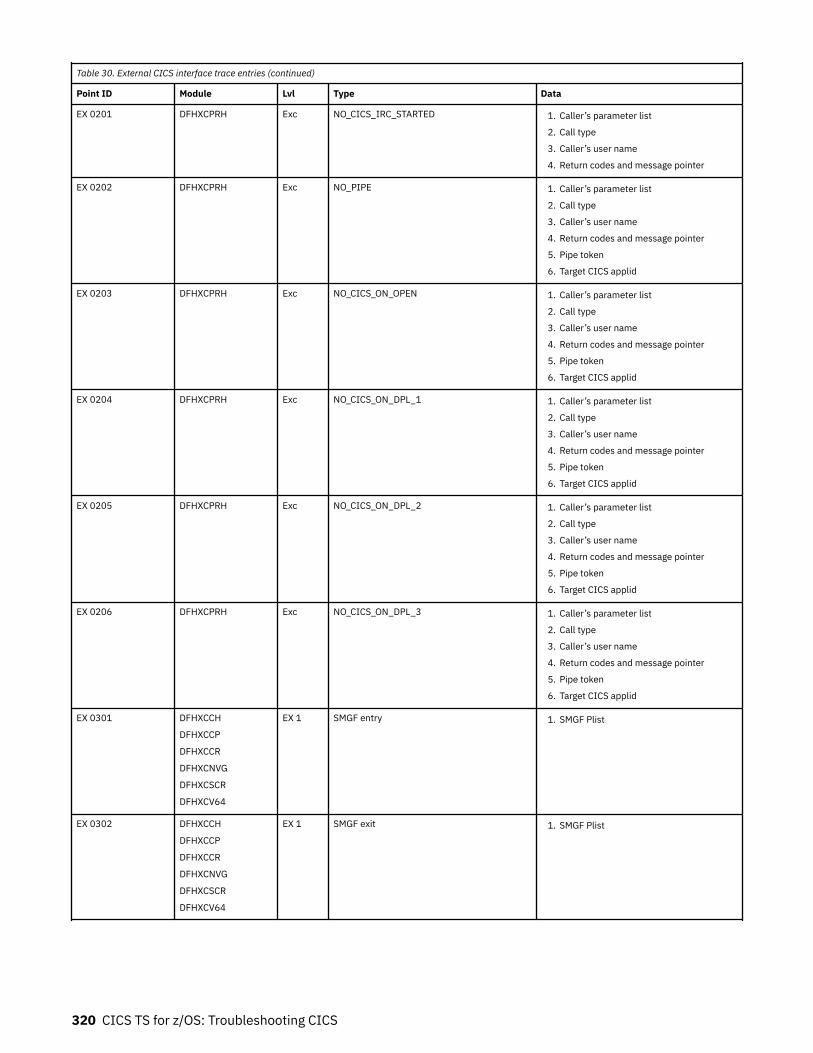
Table 30. External CICS interface trace entries (continued)
Point ID Module Lvl Type Data
EX 0201 DFHXCPRH Exc NO_CICS_IRC_STARTED 1. Caller’s parameter list
2. Call type
3. Caller’s user name
4. Return codes and message pointer
EX 0202 DFHXCPRH Exc NO_PIPE 1. Caller’s parameter list
2. Call type
3. Caller’s user name
4. Return codes and message pointer
5. Pipe token
6. Target CICS applid
EX 0203 DFHXCPRH Exc NO_CICS_ON_OPEN 1. Caller’s parameter list
2. Call type
3. Caller’s user name
4. Return codes and message pointer
5. Pipe token
6. Target CICS applid
EX 0204 DFHXCPRH Exc NO_CICS_ON_DPL_1 1. Caller’s parameter list
2. Call type
3. Caller’s user name
4. Return codes and message pointer
5. Pipe token
6. Target CICS applid
EX 0205 DFHXCPRH Exc NO_CICS_ON_DPL_2 1. Caller’s parameter list
2. Call type
3. Caller’s user name
4. Return codes and message pointer
5. Pipe token
6. Target CICS applid
EX 0206 DFHXCPRH Exc NO_CICS_ON_DPL_3 1. Caller’s parameter list
2. Call type
3. Caller’s user name
4. Return codes and message pointer
5. Pipe token
6. Target CICS applid
EX 0301 DFHXCCH
DFHXCCP
DFHXCCR
DFHXCNVG
DFHXCSCR
DFHXCV64
EX 1 SMGF entry 1. SMGF Plist
EX 0302 DFHXCCH
DFHXCCP
DFHXCCR
DFHXCNVG
DFHXCSCR
DFHXCV64
EX 1 SMGF exit 1. SMGF Plist
320 CICS TS for z/OS: Troubleshooting CICS
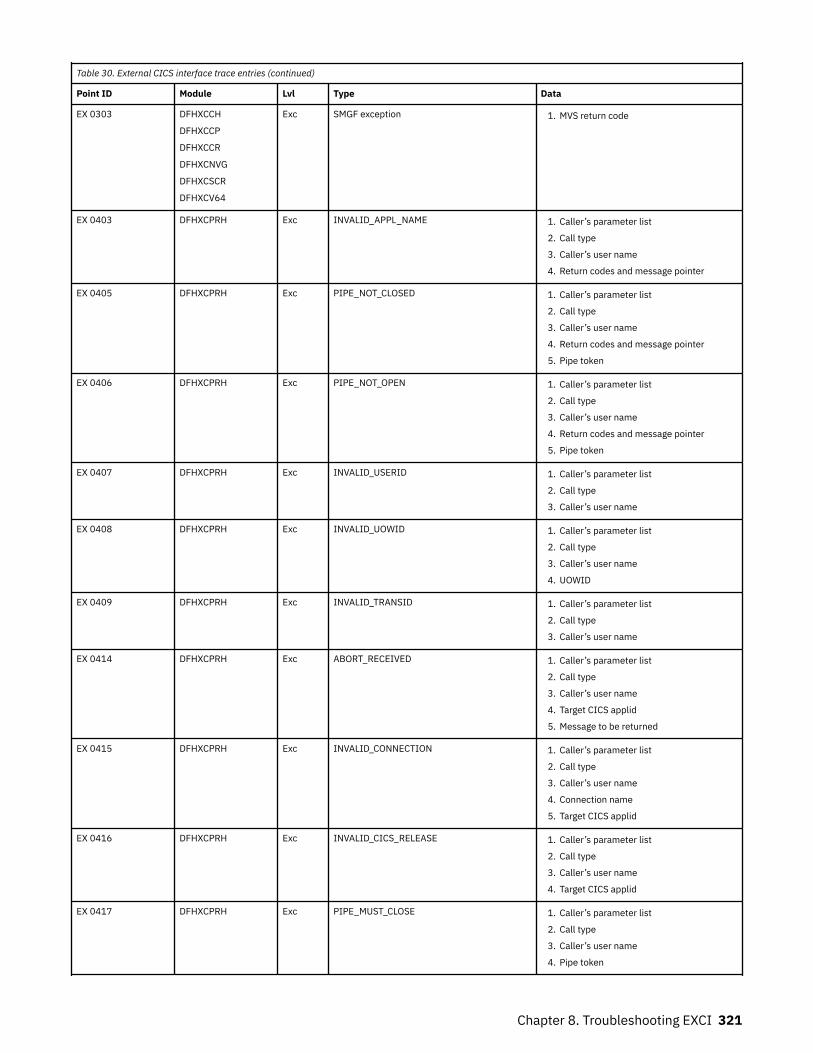
Table 30. External CICS interface trace entries (continued)
Point ID Module Lvl Type Data
EX 0303 DFHXCCH
DFHXCCP
DFHXCCR
DFHXCNVG
DFHXCSCR
DFHXCV64
Exc SMGF exception 1. MVS return code
EX 0403 DFHXCPRH Exc INVALID_APPL_NAME 1. Caller’s parameter list
2. Call type
3. Caller’s user name
4. Return codes and message pointer
EX 0405 DFHXCPRH Exc PIPE_NOT_CLOSED 1. Caller’s parameter list
2. Call type
3. Caller’s user name
4. Return codes and message pointer
5. Pipe token
EX 0406 DFHXCPRH Exc PIPE_NOT_OPEN 1. Caller’s parameter list
2. Call type
3. Caller’s user name
4. Return codes and message pointer
5. Pipe token
EX 0407 DFHXCPRH Exc INVALID_USERID 1. Caller’s parameter list
2. Call type
3. Caller’s user name
EX 0408 DFHXCPRH Exc INVALID_UOWID 1. Caller’s parameter list
2. Call type
3. Caller’s user name
4. UOWID
EX 0409 DFHXCPRH Exc INVALID_TRANSID 1. Caller’s parameter list
2. Call type
3. Caller’s user name
EX 0414 DFHXCPRH Exc ABORT_RECEIVED 1. Caller’s parameter list
2. Call type
3. Caller’s user name
4. Target CICS applid
5. Message to be returned
EX 0415 DFHXCPRH Exc INVALID_CONNECTION 1. Caller’s parameter list
2. Call type
3. Caller’s user name
4. Connection name
5. Target CICS applid
EX 0416 DFHXCPRH Exc INVALID_CICS_RELEASE 1. Caller’s parameter list
2. Call type
3. Caller’s user name
4. Target CICS applid
EX 0417 DFHXCPRH Exc PIPE_MUST_CLOSE 1. Caller’s parameter list
2. Call type
3. Caller’s user name
4. Pipe token
Chapter 8. Troubleshooting EXCI 321
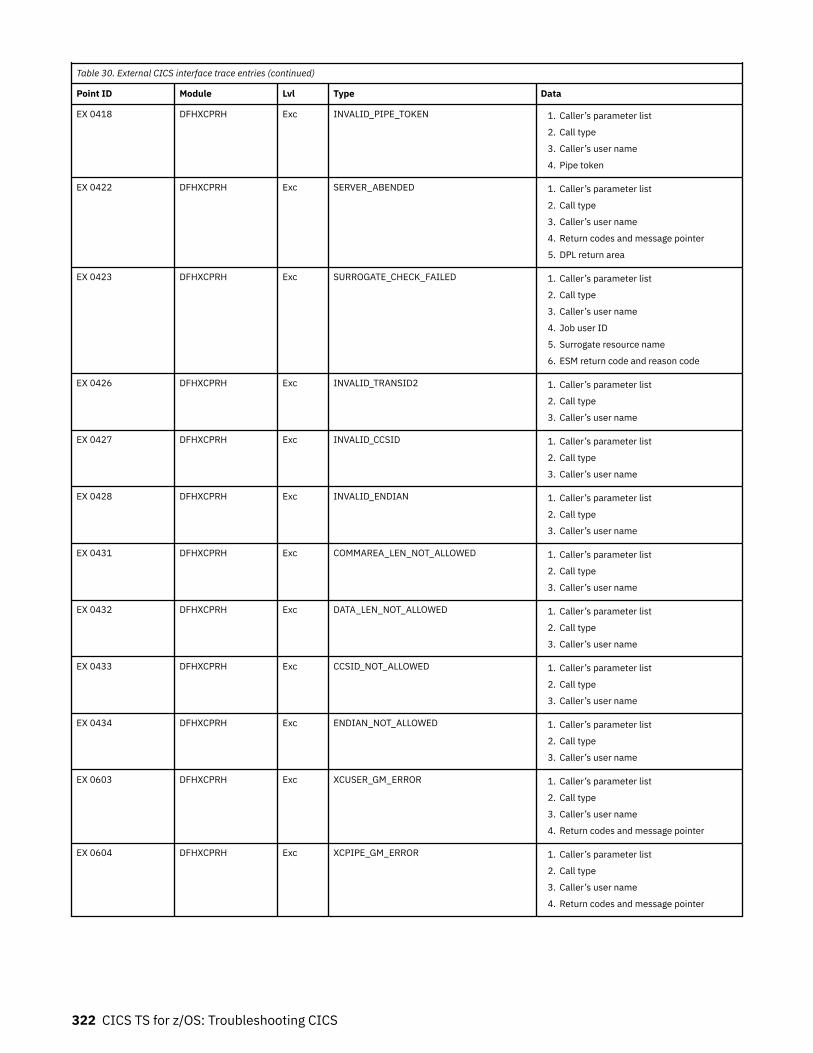
Table 30. External CICS interface trace entries (continued)
Point ID Module Lvl Type Data
EX 0418 DFHXCPRH Exc INVALID_PIPE_TOKEN 1. Caller’s parameter list
2. Call type
3. Caller’s user name
4. Pipe token
EX 0422 DFHXCPRH Exc SERVER_ABENDED 1. Caller’s parameter list
2. Call type
3. Caller’s user name
4. Return codes and message pointer
5. DPL return area
EX 0423 DFHXCPRH Exc SURROGATE_CHECK_FAILED 1. Caller’s parameter list
2. Call type
3. Caller’s user name
4. Job user ID
5. Surrogate resource name
6. ESM return code and reason code
EX 0426 DFHXCPRH Exc INVALID_TRANSID2 1. Caller’s parameter list
2. Call type
3. Caller’s user name
EX 0427 DFHXCPRH Exc INVALID_CCSID 1. Caller’s parameter list
2. Call type
3. Caller’s user name
EX 0428 DFHXCPRH Exc INVALID_ENDIAN 1. Caller’s parameter list
2. Call type
3. Caller’s user name
EX 0431 DFHXCPRH Exc COMMAREA_LEN_NOT_ALLOWED 1. Caller’s parameter list
2. Call type
3. Caller’s user name
EX 0432 DFHXCPRH Exc DATA_LEN_NOT_ALLOWED 1. Caller’s parameter list
2. Call type
3. Caller’s user name
EX 0433 DFHXCPRH Exc CCSID_NOT_ALLOWED 1. Caller’s parameter list
2. Call type
3. Caller’s user name
EX 0434 DFHXCPRH Exc ENDIAN_NOT_ALLOWED 1. Caller’s parameter list
2. Call type
3. Caller’s user name
EX 0603 DFHXCPRH Exc XCUSER_GM_ERROR 1. Caller’s parameter list
2. Call type
3. Caller’s user name
4. Return codes and message pointer
EX 0604 DFHXCPRH Exc XCPIPE_GM_ERROR 1. Caller’s parameter list
2. Call type
3. Caller’s user name
4. Return codes and message pointer
322 CICS TS for z/OS: Troubleshooting CICS
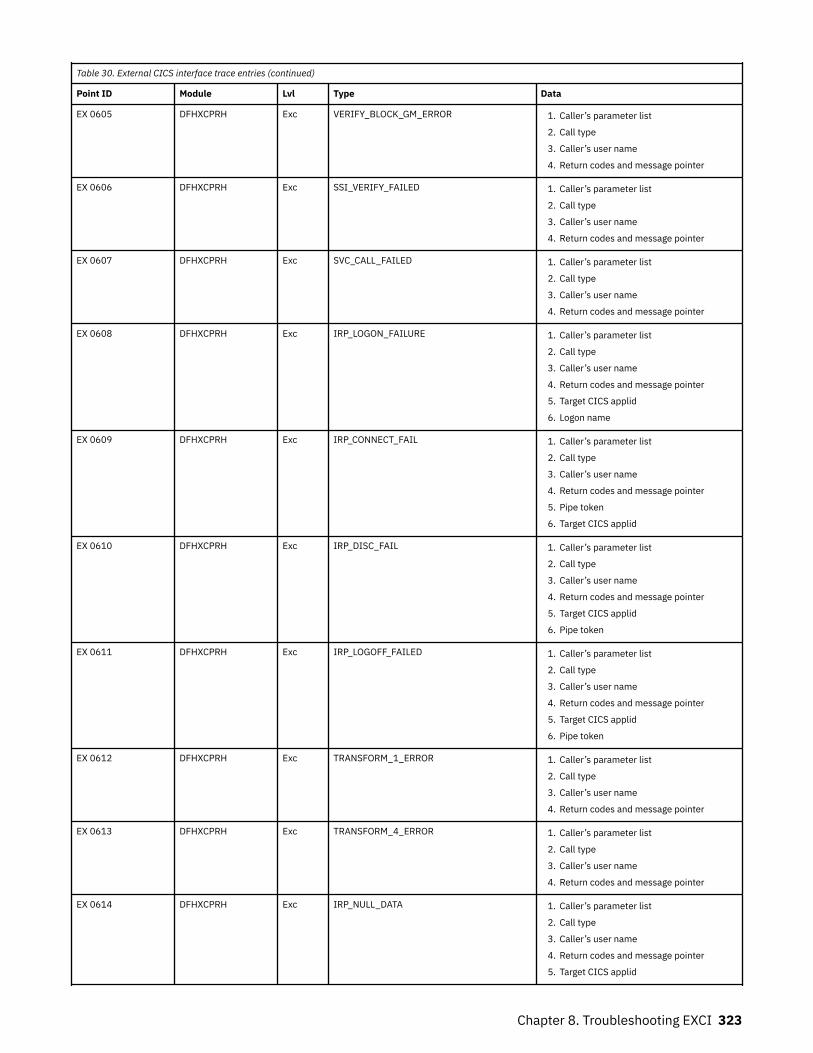
Table 30. External CICS interface trace entries (continued)
Point ID Module Lvl Type Data
EX 0605 DFHXCPRH Exc VERIFY_BLOCK_GM_ERROR 1. Caller’s parameter list
2. Call type
3. Caller’s user name
4. Return codes and message pointer
EX 0606 DFHXCPRH Exc SSI_VERIFY_FAILED 1. Caller’s parameter list
2. Call type
3. Caller’s user name
4. Return codes and message pointer
EX 0607 DFHXCPRH Exc SVC_CALL_FAILED 1. Caller’s parameter list
2. Call type
3. Caller’s user name
4. Return codes and message pointer
EX 0608 DFHXCPRH Exc IRP_LOGON_FAILURE 1. Caller’s parameter list
2. Call type
3. Caller’s user name
4. Return codes and message pointer
5. Target CICS applid
6. Logon name
EX 0609 DFHXCPRH Exc IRP_CONNECT_FAIL 1. Caller’s parameter list
2. Call type
3. Caller’s user name
4. Return codes and message pointer
5. Pipe token
6. Target CICS applid
EX 0610 DFHXCPRH Exc IRP_DISC_FAIL 1. Caller’s parameter list
2. Call type
3. Caller’s user name
4. Return codes and message pointer
5. Target CICS applid
6. Pipe token
EX 0611 DFHXCPRH Exc IRP_LOGOFF_FAILED 1. Caller’s parameter list
2. Call type
3. Caller’s user name
4. Return codes and message pointer
5. Target CICS applid
6. Pipe token
EX 0612 DFHXCPRH Exc TRANSFORM_1_ERROR 1. Caller’s parameter list
2. Call type
3. Caller’s user name
4. Return codes and message pointer
EX 0613 DFHXCPRH Exc TRANSFORM_4_ERROR 1. Caller’s parameter list
2. Call type
3. Caller’s user name
4. Return codes and message pointer
EX 0614 DFHXCPRH Exc IRP_NULL_DATA 1. Caller’s parameter list
2. Call type
3. Caller’s user name
4. Return codes and message pointer
5. Target CICS applid
Chapter 8. Troubleshooting EXCI 323
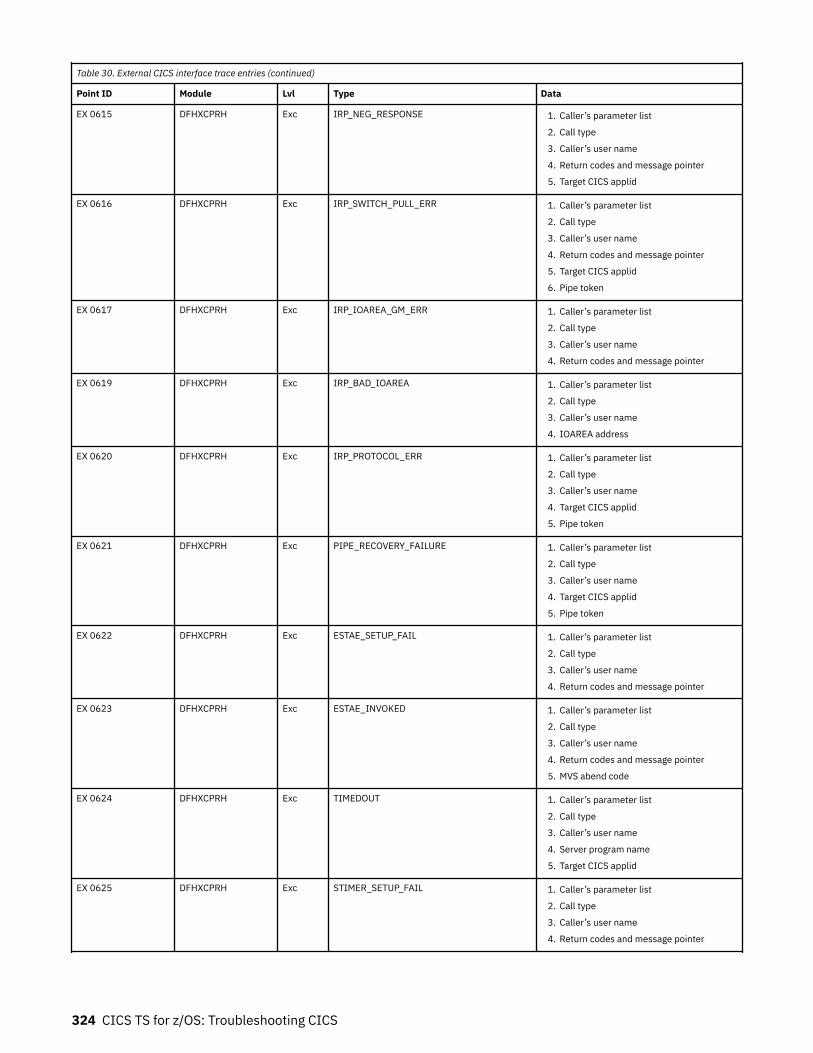
Table 30. External CICS interface trace entries (continued)
Point ID Module Lvl Type Data
EX 0615 DFHXCPRH Exc IRP_NEG_RESPONSE 1. Caller’s parameter list
2. Call type
3. Caller’s user name
4. Return codes and message pointer
5. Target CICS applid
EX 0616 DFHXCPRH Exc IRP_SWITCH_PULL_ERR 1. Caller’s parameter list
2. Call type
3. Caller’s user name
4. Return codes and message pointer
5. Target CICS applid
6. Pipe token
EX 0617 DFHXCPRH Exc IRP_IOAREA_GM_ERR 1. Caller’s parameter list
2. Call type
3. Caller’s user name
4. Return codes and message pointer
EX 0619 DFHXCPRH Exc IRP_BAD_IOAREA 1. Caller’s parameter list
2. Call type
3. Caller’s user name
4. IOAREA address
EX 0620 DFHXCPRH Exc IRP_PROTOCOL_ERR 1. Caller’s parameter list
2. Call type
3. Caller’s user name
4. Target CICS applid
5. Pipe token
EX 0621 DFHXCPRH Exc PIPE_RECOVERY_FAILURE 1. Caller’s parameter list
2. Call type
3. Caller’s user name
4. Target CICS applid
5. Pipe token
EX 0622 DFHXCPRH Exc ESTAE_SETUP_FAIL 1. Caller’s parameter list
2. Call type
3. Caller’s user name
4. Return codes and message pointer
EX 0623 DFHXCPRH Exc ESTAE_INVOKED 1. Caller’s parameter list
2. Call type
3. Caller’s user name
4. Return codes and message pointer
5. MVS abend code
EX 0624 DFHXCPRH Exc TIMEDOUT 1. Caller’s parameter list
2. Call type
3. Caller’s user name
4. Server program name
5. Target CICS applid
EX 0625 DFHXCPRH Exc STIMER_SETUP_FAIL 1. Caller’s parameter list
2. Call type
3. Caller’s user name
4. Return codes and message pointer
324 CICS TS for z/OS: Troubleshooting CICS
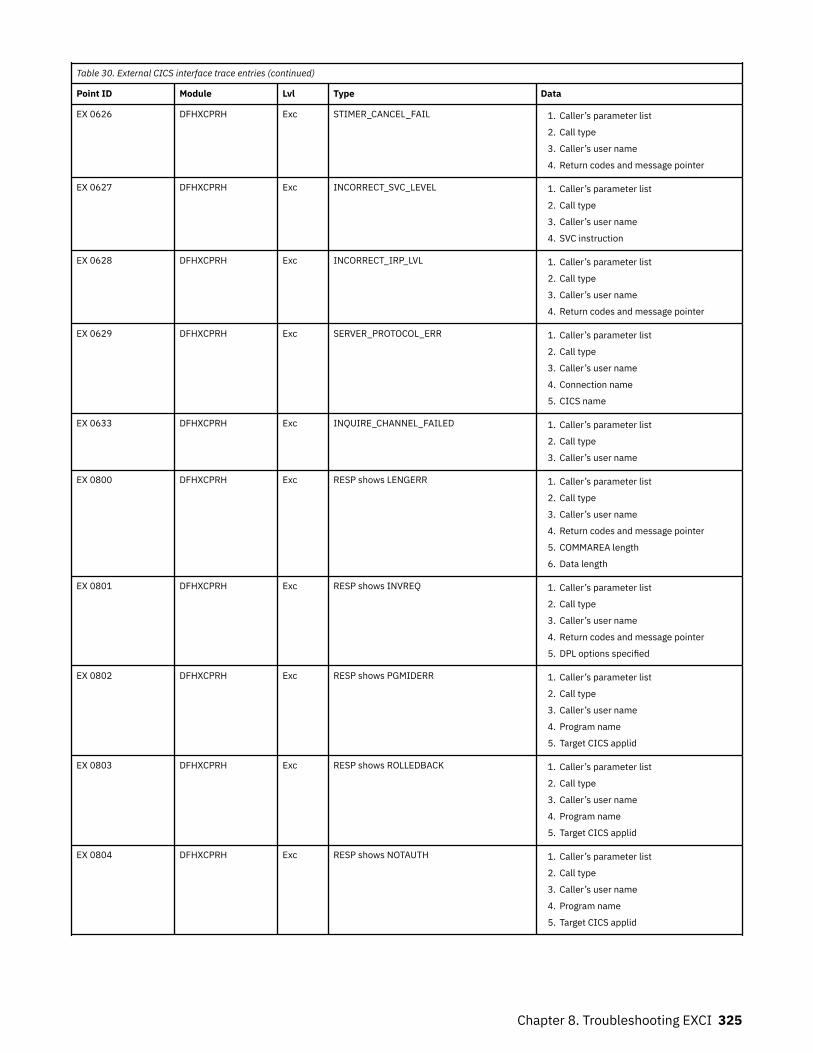
Table 30. External CICS interface trace entries (continued)
Point ID Module Lvl Type Data
EX 0626 DFHXCPRH Exc STIMER_CANCEL_FAIL 1. Caller’s parameter list
2. Call type
3. Caller’s user name
4. Return codes and message pointer
EX 0627 DFHXCPRH Exc INCORRECT_SVC_LEVEL 1. Caller’s parameter list
2. Call type
3. Caller’s user name
4. SVC instruction
EX 0628 DFHXCPRH Exc INCORRECT_IRP_LVL 1. Caller’s parameter list
2. Call type
3. Caller’s user name
4. Return codes and message pointer
EX 0629 DFHXCPRH Exc SERVER_PROTOCOL_ERR 1. Caller’s parameter list
2. Call type
3. Caller’s user name
4. Connection name
5. CICS name
EX 0633 DFHXCPRH Exc INQUIRE_CHANNEL_FAILED 1. Caller’s parameter list
2. Call type
3. Caller’s user name
EX 0800 DFHXCPRH Exc RESP shows LENGERR 1. Caller’s parameter list
2. Call type
3. Caller’s user name
4. Return codes and message pointer
5. COMMAREA length
6. Data length
EX 0801 DFHXCPRH Exc RESP shows INVREQ 1. Caller’s parameter list
2. Call type
3. Caller’s user name
4. Return codes and message pointer
5. DPL options specified
EX 0802 DFHXCPRH Exc RESP shows PGMIDERR 1. Caller’s parameter list
2. Call type
3. Caller’s user name
4. Program name
5. Target CICS applid
EX 0803 DFHXCPRH Exc RESP shows ROLLEDBACK 1. Caller’s parameter list
2. Call type
3. Caller’s user name
4. Program name
5. Target CICS applid
EX 0804 DFHXCPRH Exc RESP shows NOTAUTH 1. Caller’s parameter list
2. Call type
3. Caller’s user name
4. Program name
5. Target CICS applid
Chapter 8. Troubleshooting EXCI 325
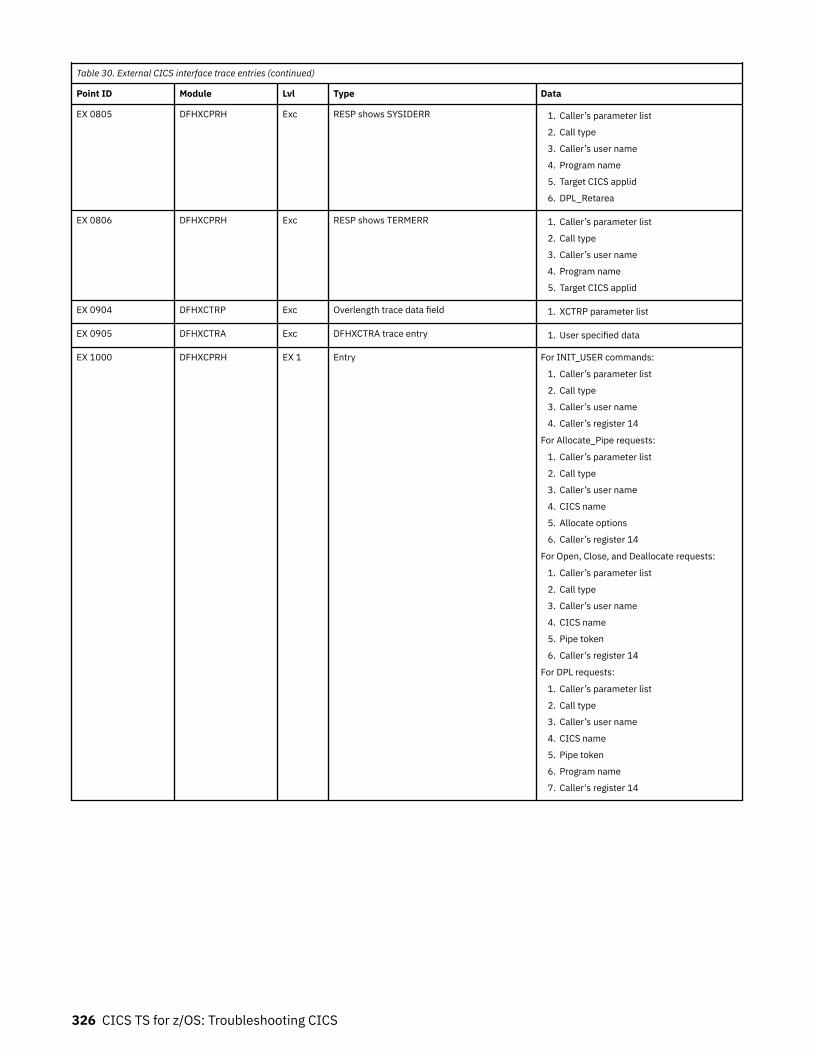
Table 30. External CICS interface trace entries (continued)
Point ID Module Lvl Type Data
EX 0805 DFHXCPRH Exc RESP shows SYSIDERR 1. Caller’s parameter list
2. Call type
3. Caller’s user name
4. Program name
5. Target CICS applid
6. DPL_Retarea
EX 0806 DFHXCPRH Exc RESP shows TERMERR 1. Caller’s parameter list
2. Call type
3. Caller’s user name
4. Program name
5. Target CICS applid
EX 0904 DFHXCTRP Exc Overlength trace data field 1. XCTRP parameter list
EX 0905 DFHXCTRA Exc DFHXCTRA trace entry 1. User specified data
EX 1000 DFHXCPRH EX 1 Entry For INIT_USER commands:
1. Caller’s parameter list
2. Call type
3. Caller’s user name
4. Caller’s register 14
For Allocate_Pipe requests:
1. Caller’s parameter list
2. Call type
3. Caller’s user name
4. CICS name
5. Allocate options
6. Caller’s register 14
For Open, Close, and Deallocate requests:
1. Caller’s parameter list
2. Call type
3. Caller’s user name
4. CICS name
5. Pipe token
6. Caller's register 14
For DPL requests:
1. Caller’s parameter list
2. Call type
3. Caller’s user name
4. CICS name
5. Pipe token
6. Program name
7. Caller's register 14
326 CICS TS for z/OS: Troubleshooting CICS
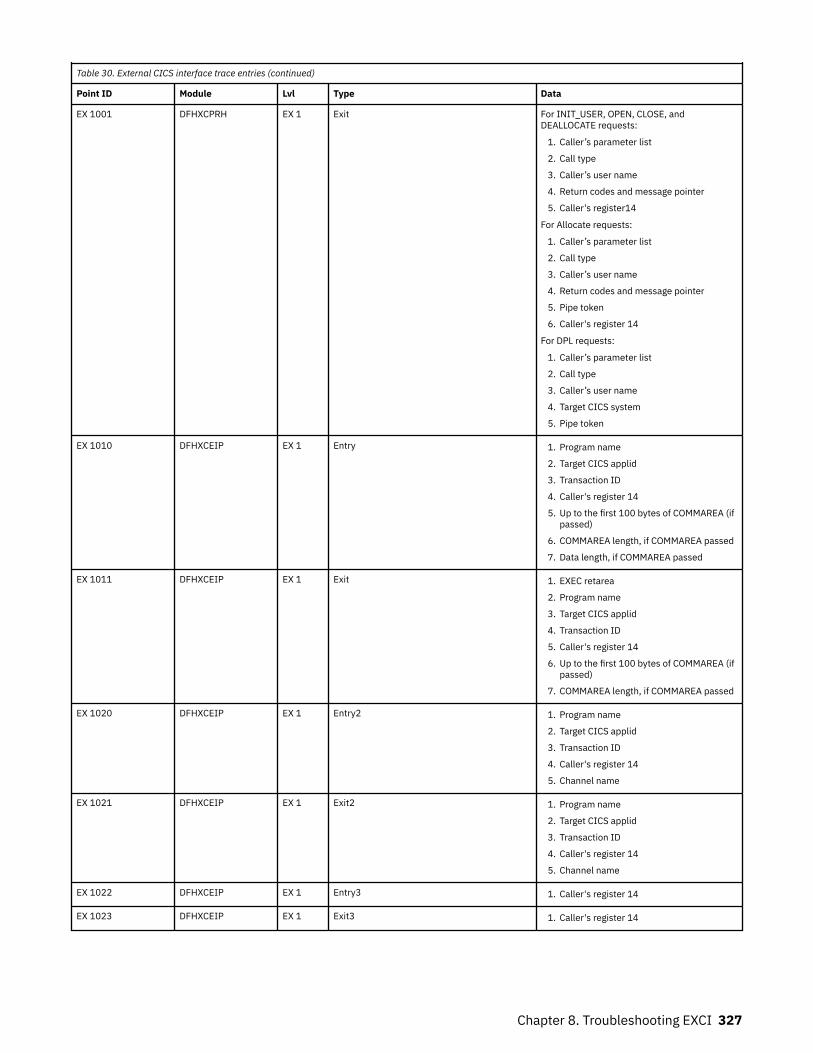
Table 30. External CICS interface trace entries (continued)
Point ID Module Lvl Type Data
EX 1001 DFHXCPRH EX 1 Exit For INIT_USER, OPEN, CLOSE, andDEALLOCATE requests:
1. Caller’s parameter list
2. Call type
3. Caller’s user name
4. Return codes and message pointer
5. Caller's register14
For Allocate requests:
1. Caller’s parameter list
2. Call type
3. Caller’s user name
4. Return codes and message pointer
5. Pipe token
6. Caller's register 14
For DPL requests:
1. Caller’s parameter list
2. Call type
3. Caller’s user name
4. Target CICS system
5. Pipe token
EX 1010 DFHXCEIP EX 1 Entry 1. Program name
2. Target CICS applid
3. Transaction ID
4. Caller's register 14
5. Up to the first 100 bytes of COMMAREA (ifpassed)
6. COMMAREA length, if COMMAREA passed
7. Data length, if COMMAREA passed
EX 1011 DFHXCEIP EX 1 Exit 1. EXEC retarea
2. Program name
3. Target CICS applid
4. Transaction ID
5. Caller's register 14
6. Up to the first 100 bytes of COMMAREA (ifpassed)
7. COMMAREA length, if COMMAREA passed
EX 1020 DFHXCEIP EX 1 Entry2 1. Program name
2. Target CICS applid
3. Transaction ID
4. Caller's register 14
5. Channel name
EX 1021 DFHXCEIP EX 1 Exit2 1. Program name
2. Target CICS applid
3. Transaction ID
4. Caller's register 14
5. Channel name
EX 1022 DFHXCEIP EX 1 Entry3 1. Caller's register 14
EX 1023 DFHXCEIP EX 1 Exit3 1. Caller's register 14
Chapter 8. Troubleshooting EXCI 327
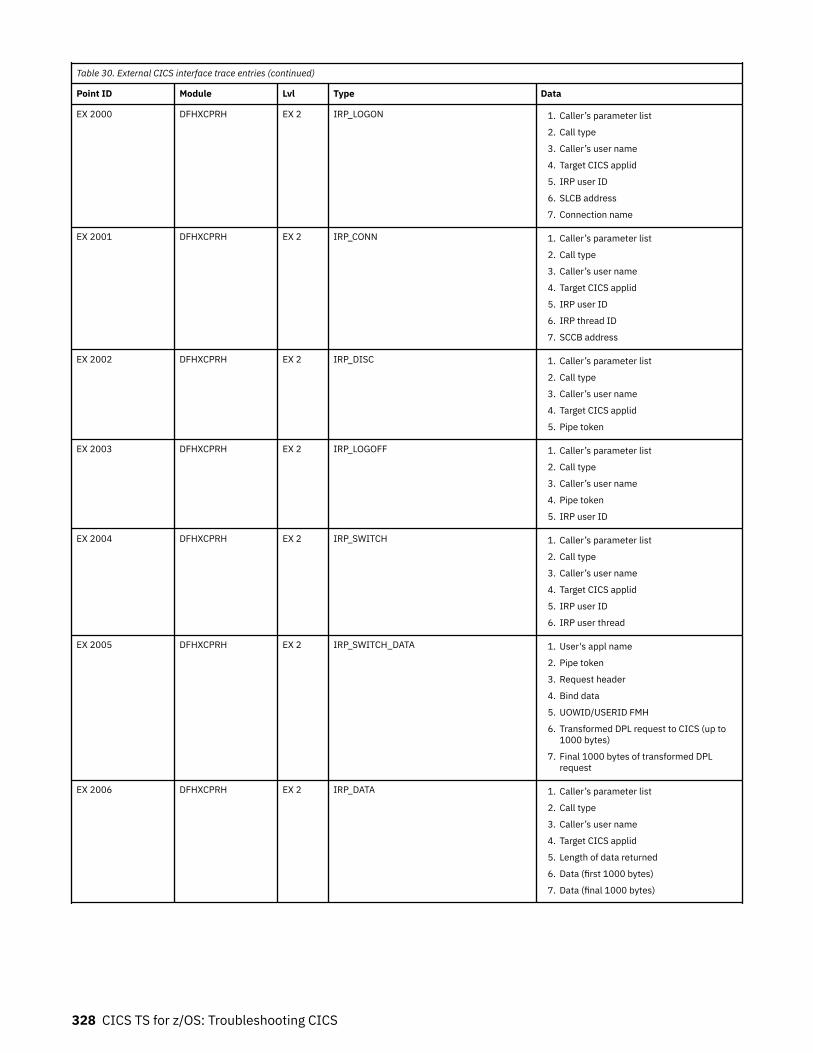
Table 30. External CICS interface trace entries (continued)
Point ID Module Lvl Type Data
EX 2000 DFHXCPRH EX 2 IRP_LOGON 1. Caller’s parameter list
2. Call type
3. Caller’s user name
4. Target CICS applid
5. IRP user ID
6. SLCB address
7. Connection name
EX 2001 DFHXCPRH EX 2 IRP_CONN 1. Caller’s parameter list
2. Call type
3. Caller’s user name
4. Target CICS applid
5. IRP user ID
6. IRP thread ID
7. SCCB address
EX 2002 DFHXCPRH EX 2 IRP_DISC 1. Caller’s parameter list
2. Call type
3. Caller’s user name
4. Target CICS applid
5. Pipe token
EX 2003 DFHXCPRH EX 2 IRP_LOGOFF 1. Caller’s parameter list
2. Call type
3. Caller’s user name
4. Pipe token
5. IRP user ID
EX 2004 DFHXCPRH EX 2 IRP_SWITCH 1. Caller’s parameter list
2. Call type
3. Caller’s user name
4. Target CICS applid
5. IRP user ID
6. IRP user thread
EX 2005 DFHXCPRH EX 2 IRP_SWITCH_DATA 1. User's appl name
2. Pipe token
3. Request header
4. Bind data
5. UOWID/USERID FMH
6. Transformed DPL request to CICS (up to1000 bytes)
7. Final 1000 bytes of transformed DPLrequest
EX 2006 DFHXCPRH EX 2 IRP_DATA 1. Caller’s parameter list
2. Call type
3. Caller’s user name
4. Target CICS applid
5. Length of data returned
6. Data (first 1000 bytes)
7. Data (final 1000 bytes)
328 CICS TS for z/OS: Troubleshooting CICS
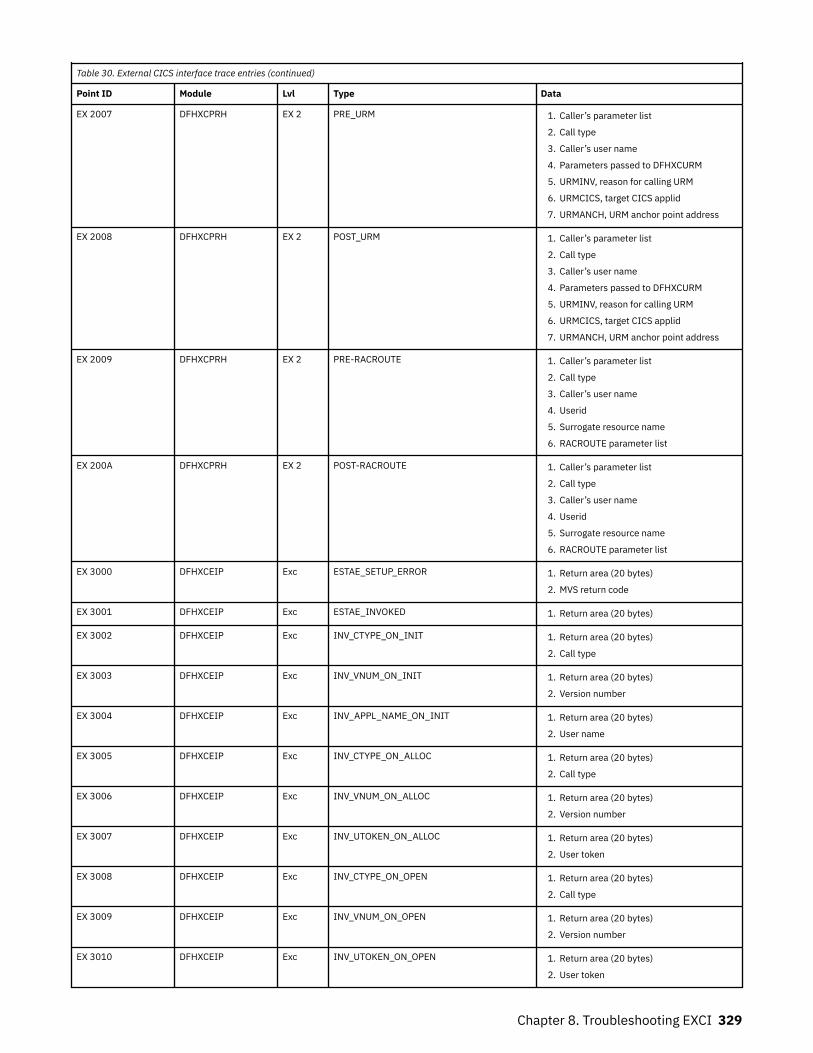
Table 30. External CICS interface trace entries (continued)
Point ID Module Lvl Type Data
EX 2007 DFHXCPRH EX 2 PRE_URM 1. Caller’s parameter list
2. Call type
3. Caller’s user name
4. Parameters passed to DFHXCURM
5. URMINV, reason for calling URM
6. URMCICS, target CICS applid
7. URMANCH, URM anchor point address
EX 2008 DFHXCPRH EX 2 POST_URM 1. Caller’s parameter list
2. Call type
3. Caller’s user name
4. Parameters passed to DFHXCURM
5. URMINV, reason for calling URM
6. URMCICS, target CICS applid
7. URMANCH, URM anchor point address
EX 2009 DFHXCPRH EX 2 PRE-RACROUTE 1. Caller’s parameter list
2. Call type
3. Caller’s user name
4. Userid
5. Surrogate resource name
6. RACROUTE parameter list
EX 200A DFHXCPRH EX 2 POST-RACROUTE 1. Caller’s parameter list
2. Call type
3. Caller’s user name
4. Userid
5. Surrogate resource name
6. RACROUTE parameter list
EX 3000 DFHXCEIP Exc ESTAE_SETUP_ERROR 1. Return area (20 bytes)
2. MVS return code
EX 3001 DFHXCEIP Exc ESTAE_INVOKED 1. Return area (20 bytes)
EX 3002 DFHXCEIP Exc INV_CTYPE_ON_INIT 1. Return area (20 bytes)
2. Call type
EX 3003 DFHXCEIP Exc INV_VNUM_ON_INIT 1. Return area (20 bytes)
2. Version number
EX 3004 DFHXCEIP Exc INV_APPL_NAME_ON_INIT 1. Return area (20 bytes)
2. User name
EX 3005 DFHXCEIP Exc INV_CTYPE_ON_ALLOC 1. Return area (20 bytes)
2. Call type
EX 3006 DFHXCEIP Exc INV_VNUM_ON_ALLOC 1. Return area (20 bytes)
2. Version number
EX 3007 DFHXCEIP Exc INV_UTOKEN_ON_ALLOC 1. Return area (20 bytes)
2. User token
EX 3008 DFHXCEIP Exc INV_CTYPE_ON_OPEN 1. Return area (20 bytes)
2. Call type
EX 3009 DFHXCEIP Exc INV_VNUM_ON_OPEN 1. Return area (20 bytes)
2. Version number
EX 3010 DFHXCEIP Exc INV_UTOKEN_ON_OPEN 1. Return area (20 bytes)
2. User token
Chapter 8. Troubleshooting EXCI 329
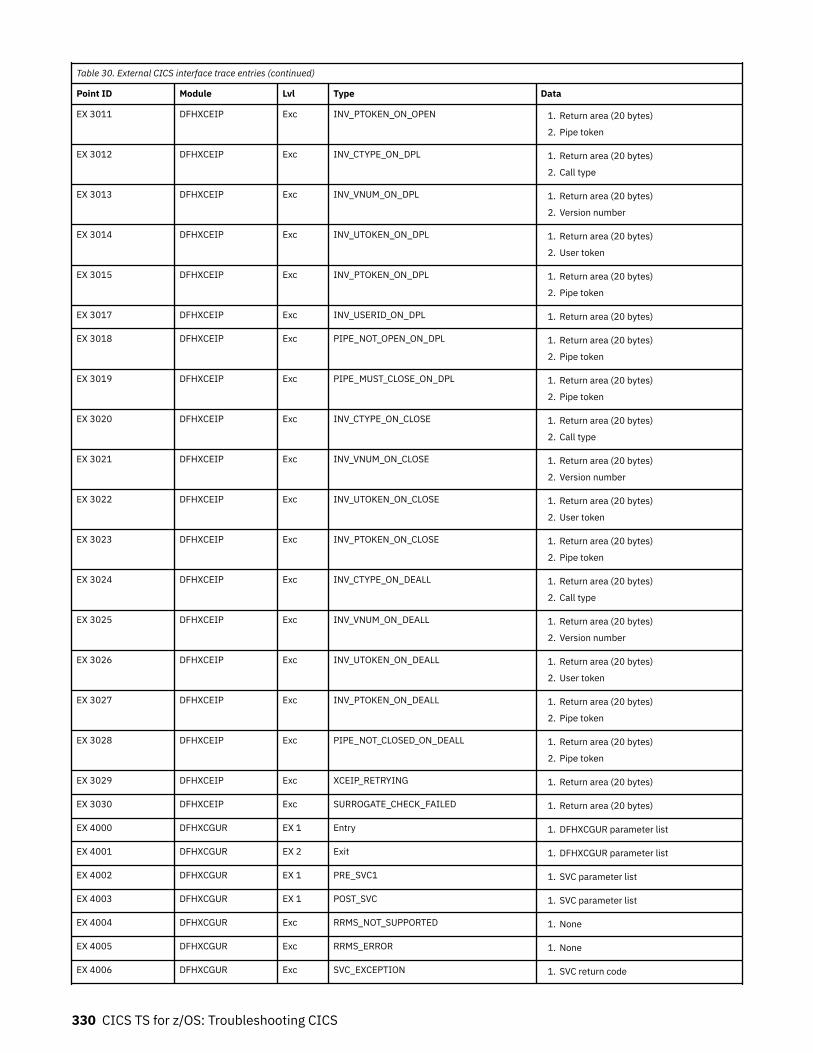
Table 30. External CICS interface trace entries (continued)
Point ID Module Lvl Type Data
EX 3011 DFHXCEIP Exc INV_PTOKEN_ON_OPEN 1. Return area (20 bytes)
2. Pipe token
EX 3012 DFHXCEIP Exc INV_CTYPE_ON_DPL 1. Return area (20 bytes)
2. Call type
EX 3013 DFHXCEIP Exc INV_VNUM_ON_DPL 1. Return area (20 bytes)
2. Version number
EX 3014 DFHXCEIP Exc INV_UTOKEN_ON_DPL 1. Return area (20 bytes)
2. User token
EX 3015 DFHXCEIP Exc INV_PTOKEN_ON_DPL 1. Return area (20 bytes)
2. Pipe token
EX 3017 DFHXCEIP Exc INV_USERID_ON_DPL 1. Return area (20 bytes)
EX 3018 DFHXCEIP Exc PIPE_NOT_OPEN_ON_DPL 1. Return area (20 bytes)
2. Pipe token
EX 3019 DFHXCEIP Exc PIPE_MUST_CLOSE_ON_DPL 1. Return area (20 bytes)
2. Pipe token
EX 3020 DFHXCEIP Exc INV_CTYPE_ON_CLOSE 1. Return area (20 bytes)
2. Call type
EX 3021 DFHXCEIP Exc INV_VNUM_ON_CLOSE 1. Return area (20 bytes)
2. Version number
EX 3022 DFHXCEIP Exc INV_UTOKEN_ON_CLOSE 1. Return area (20 bytes)
2. User token
EX 3023 DFHXCEIP Exc INV_PTOKEN_ON_CLOSE 1. Return area (20 bytes)
2. Pipe token
EX 3024 DFHXCEIP Exc INV_CTYPE_ON_DEALL 1. Return area (20 bytes)
2. Call type
EX 3025 DFHXCEIP Exc INV_VNUM_ON_DEALL 1. Return area (20 bytes)
2. Version number
EX 3026 DFHXCEIP Exc INV_UTOKEN_ON_DEALL 1. Return area (20 bytes)
2. User token
EX 3027 DFHXCEIP Exc INV_PTOKEN_ON_DEALL 1. Return area (20 bytes)
2. Pipe token
EX 3028 DFHXCEIP Exc PIPE_NOT_CLOSED_ON_DEALL 1. Return area (20 bytes)
2. Pipe token
EX 3029 DFHXCEIP Exc XCEIP_RETRYING 1. Return area (20 bytes)
EX 3030 DFHXCEIP Exc SURROGATE_CHECK_FAILED 1. Return area (20 bytes)
EX 4000 DFHXCGUR EX 1 Entry 1. DFHXCGUR parameter list
EX 4001 DFHXCGUR EX 2 Exit 1. DFHXCGUR parameter list
EX 4002 DFHXCGUR EX 1 PRE_SVC1 1. SVC parameter list
EX 4003 DFHXCGUR EX 1 POST_SVC 1. SVC parameter list
EX 4004 DFHXCGUR Exc RRMS_NOT_SUPPORTED 1. None
EX 4005 DFHXCGUR Exc RRMS_ERROR 1. None
EX 4006 DFHXCGUR Exc SVC_EXCEPTION 1. SVC return code
330 CICS TS for z/OS: Troubleshooting CICS
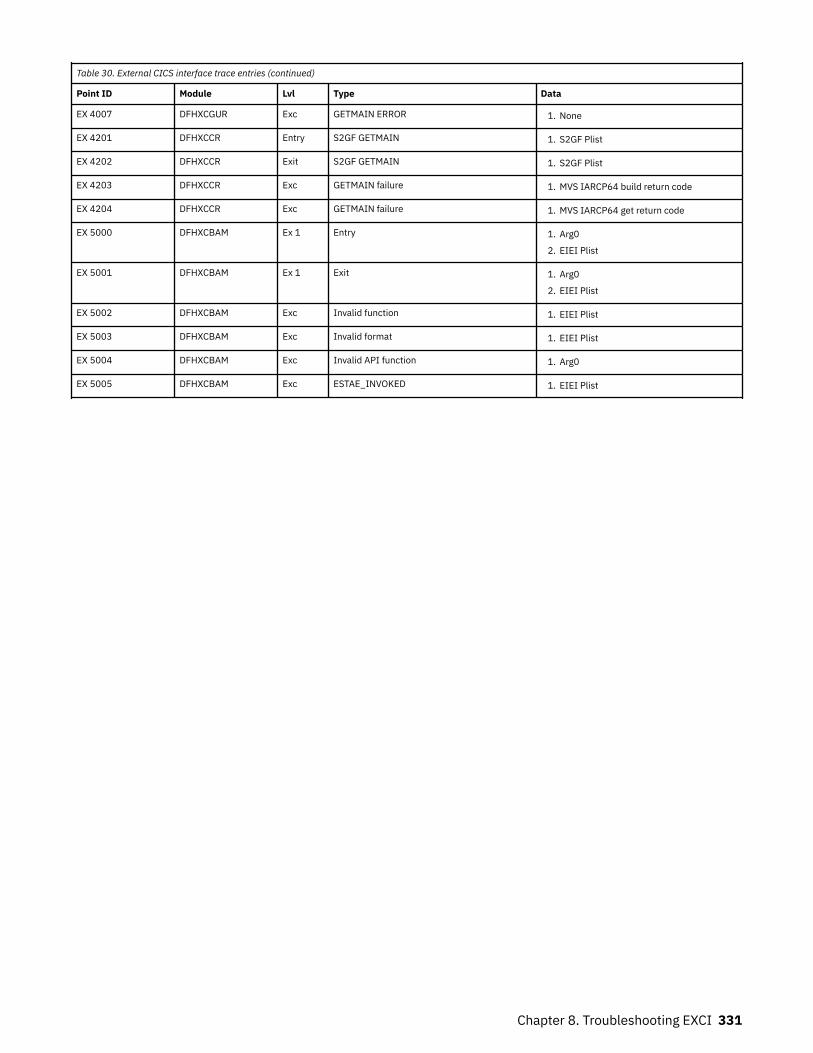
Table 30. External CICS interface trace entries (continued)
Point ID Module Lvl Type Data
EX 4007 DFHXCGUR Exc GETMAIN ERROR 1. None
EX 4201 DFHXCCR Entry S2GF GETMAIN 1. S2GF Plist
EX 4202 DFHXCCR Exit S2GF GETMAIN 1. S2GF Plist
EX 4203 DFHXCCR Exc GETMAIN failure 1. MVS IARCP64 build return code
EX 4204 DFHXCCR Exc GETMAIN failure 1. MVS IARCP64 get return code
EX 5000 DFHXCBAM Ex 1 Entry 1. Arg0
2. EIEI Plist
EX 5001 DFHXCBAM Ex 1 Exit 1. Arg0
2. EIEI Plist
EX 5002 DFHXCBAM Exc Invalid function 1. EIEI Plist
EX 5003 DFHXCBAM Exc Invalid format 1. EIEI Plist
EX 5004 DFHXCBAM Exc Invalid API function 1. Arg0
EX 5005 DFHXCBAM Exc ESTAE_INVOKED 1. EIEI Plist
Chapter 8. Troubleshooting EXCI 331

332 CICS TS for z/OS: Troubleshooting CICS
Chapter 9. Troubleshooting ONCThis section helps you debug problems in CICS ONC RPC user-replaceable programs, the IBM-suppliedparts of CICS ONC RPC, and in the system setup of CICS ONC RPC.
The formats of messages and trace outputs in CICS ONC RPC are also described.
Diagnostic information is designed to provide first failure data capture, so that if an error occurs, enoughinformation about the error is available directly without having to reproduce the error situation. Theinformation is presented in the following forms:
MessagesCICS ONC RPC provides CICS messages. The CICS ONC RPC messages are listed in CICS messages.
TraceCICS ONC RPC outputs system trace entries containing all the important information required forproblem diagnosis.
DumpDump formatting is provided for data areas relating to CICS ONC RPC.
Abend codesTransaction abend codes are standard 4-character names. The abend codes output by CICS ONC RPCare listed in CICS messages.
CICS ONC RPC recovery proceduresSoftware errors within the server controller may cause it to perform an immediate disable (if this is notprevented by the nature of the error). After an immediate disable of CICS ONC RPC, CICS continues torun.
CICS ONC RPC is not included in CICS recovery. Registration details are not saved on the CICS catalog. IfCICS abends and is then restarted, RPC interface registrations from the previous run are not preserved.After a CICS abend, you must enable CICS ONC RPC as described in Enabling CICS ONC RPC. However,4-tuple definitions can be stored in the CICS ONC RPC data set. Each time you enable CICS ONC RPC, thedefinitions can be retrieved from the CICS ONC RPC data set.
If z/OS Communications Server abends, CICS ONC RPC enters immediate disable processing, but CICScontinues to run.
The abending of an alias transaction might cause changes to recoverable resources to be backed out.
CICS immediate shutdown might leave 3-tuples registered with z/OS Communications Server. These3-tuples can be registered again when CICS ONC RPC is enabled without loss of z/OS CommunicationsServer resources, since CICS ONC RPC always unregisters a 3-tuple before it registers it.
CICS ONC RPC operational considerationsThe server controller uses EXEC CICS START to start the aliases that run the CICS programs.
CICS limits on the numbers of tasks that can be started may prevent aliases from running as soon as theyare started by the server controller. This leads to delays in servicing the client requests, and this may leadto timeouts in the client.
In the XDR routines, storage allocation is done using MVS facilities, not CICS facilities. The storage isowned by the RP TCB. If an XDR routine abends, the storage is not freed by the server controller or thealias, nor is it freed by MVS, since the RP task does not end. Repeated abends in XDR routines may lead toshortage of storage that can only be corrected by stopping CICS.
© Copyright IBM Corp. 1974, 2021 333
MVS task control blocks (TCBs) used by ONC RPCThe TCB that interacts with z/OS Communications Server goes into a wait as a result of that interaction.
This is avoided by using an extra TCB, the RP TCB, for issuing calls to z/OS Communications Server.
The RP TCB is used for some processing for every client request, but most of the call processing done byCICS ONC RPC takes place under the QR TCB. The split between the two TCBs is transparent to you formost of your work, but you need to be aware of it for problem determination.
ONC RPC task-related user exit (TRUE)CICS ONC RPC includes a task-related user exit; this is used to anchor shared storage and to improveCICS ONC RPC's response to CICS shutdown. CICS ONC RPC does not use a TRUE to pass commands anddata to and from z/OS Communications Server.
Troubleshooting CICS ONC/RPCThis section provides some hints on troubleshooting.
About this taskIt follows the general outline:
1. Define the problem.2. Obtain information (documentation) on the problem.
Defining the problemWhen you have a problem, first try to define the circumstances that gave rise to it.
About this taskIf you need to report the problem to the IBM software support center, this information is useful to thesupport personnel.
1. What is the system configuration?
• CICS Transaction Server release• z/OS Communications Server release• Language Environment release
2. What is the connection manager configuration?
• Operating options• Registered 4-tuples
3. When did the problem first occur?4. What were you trying to accomplish at the time the problem occurred?5. What changes were made to the system before the occurrence of the problem?
• To CICS ONC RPC• To the CICS program being called by the client• To the converter being used in the call• To the XDR routines being used in the call• To the client• To CICS Transaction Server• To z/OS Communications Server
6. What is the problem?
334 CICS TS for z/OS: Troubleshooting CICS
• Incorrect output• Hang/Wait: If you suspect that CICS ONC RPC aliases may be in a hung state, you can use the
connection manager to display a list of alias transactions and can display associated details. SeeProcessing the alias list.
• Loop: Use CEMT INQUIRE to display the details of the transaction.• Abend in user-replaceable program• Abend in a CICS program• Abend in the IBM-supplied part of CICS ONC RPC• Performance problem• Storage violation• Logic Error
7. At what point in the processing did the problem occur?8. What was the state of z/OS Communications Server? (Try the rpcinfo command.)
Documentation about the problemTo investigate most problems, you must look at the dumps, traces, and logs provided with MVS and CICS.
• System Dump: This contains the CICS internal trace• CICS auxiliary trace, if enabled• z/OS Communications Server trace• GTF trace, if enabled• Console log• CSMT log• CRPO log• CICS job log
To identify which are likely to be useful for your problem, try to work out the area of CICS ONC RPC givingrise to the problem, and read the relevant section in the rest of this section.
Using messages and codes for ONC RPCCICS ONC RPC messages have identifiers of the form DFHRPnnnn, where nnnn are four numericcharacters.
They are sent to the CICS ONC RPC message transient data queue CRPO, or the terminal user, or both,depending on the event that is being reported. If you define CRPO as an indirect destination for CSMT, theCICS ONC RPC messages appear in CSMT. Some messages are sent to the console.
When CICS ONC RPC issues a message as a result of an error, it also makes an exception trace entry.CICS ONC RPC also generates information messages, for instance during enable processing and disableprocessing.
CICS ONC RPC messages are supplied in English, Kanji, and Chinese.
CMAC (online help facility for messages and codes)You can use utilities supplied as part of CICS to update your base CMAC file with the CICS ONC RPC CMACfile.
The CICS ONC RPC abend codes are listed in CICS messages.
Chapter 9. Troubleshooting ONC 335
CICS ONC RPC trace informationCICS ONC RPC outputs CICS system trace, which is formatted using software supplied as part of CICSONC RPC.
Exception trace entries produced by CICS ONC RPC are written to CICS internal trace even when the Traceoperating option is set to NO. See Setting and modifying options for information about the Trace option.
If selected, level 2 trace gives a full trace of the data being transmitted between the client and the CICSprogram. CICS trace output is described in Trace entries overview.
Feature trace pointsTrace points with domain identifier FT are feature trace points.
The format of these entries is slightly different from standard trace points in that the Module identifiercontains the short name of the feature and a full module name. Feature trace point IDs are not globallydefined. This means that a feature can reuse the trace point IDs of another feature. You should obtaininformation about the trace points of any other product from that product's documentation.
Numeric values of response and reason codesThe response codes from the converter and resource checker appear in the trace output as numericvalues.
• URP_OK (0)• URP_EXCEPTION (4)• URP_INVALID (8)• URP_DISASTER (12)
The CICS-defined reason codes from the converter and resource checker appear in the trace output asnumeric codes as follows:
• URP_AUTH_BAD_CRED (1)• URP_AUTH_TOO_WEAK (2)• URP_CORRUPT_CLIENT_DATA (3)
ONC RPC dump and trace formattingTo switch dump formatting on and off for CICS ONC RPC, you change the CICS VERBEXIT in the JCL fordump formatting.
IPCS VERBEXIT DFHPD730 FT=0|1|2|3,TR=1|2
The parameters have these meanings:FT=0
Suppress system dump for all featuresFT=1
Produce system dump summary listing for all registered featuresFT=2
Produce system dump for all registered featuresFT=3
Produce system dump summary listing and a system dump for all registered featuresTR=1
Produce abbreviated trace (includes trace for all registered features)TR=2
Produce full trace (includes trace for all registered features)
336 CICS TS for z/OS: Troubleshooting CICS
Full details of these and other parameters are described in the Starting up CICS regions in Administering.
CICS ONC RPC output in the formatted dump consists of the major control blocks of CICS ONC RPC,with interpretation of some of the fields. The CICS ONC RPC output can be found in the IPCS output bysearching for ===RP. It is under the heading CICS ONC RPC Feature for z/OS.
Each trace entry for CICS ONC RPC has a comment ONC RPC to distinguish it from other trace points withthe FT prefix.
Debugging the ONC RPC user-replaceable programsThe user-replaceable programs are:
• The user-written XDR routines• The converters• The resource checker• The CICS programs that service the client requests
The debugging of the CICS programs is not dealt with in this manual.
XDR routinesThe XDR routines, inbound and outbound, run under the RP TCB.
The CICS application programming interface is not available under the RP TCB, so you cannot use EDF,CICS abend handling, or CICS trace to diagnose problems. The printf function must not be used. If anXDR routine has a program check, a C run-time message is written to the CICS job log.
Converter and resource checkerThe converter and resource checker run under the QR TCB, and the CICS application programminginterface is available.
Using EDFEDF is available for debugging the resource checker and the Encode function.
If you want to use EDF, you must:
• Ensure that the alias is terminal-attached. To do this, you must set the EDF Terminal ID field in theconnection manager, as described in EDF Terminal ID. The chosen terminal must be a local terminalthat is either logged on, or predefined.
• Define CEDF(YES) in the program definition of converter, or resource checker. The resource checkermust run in the same CICS region as CICS ONC RPC if you want to use EDF to debug it.
Using trace entriesDiagnostic information can be output to the CICS trace by the use of the EXEC CICS ENTER TRACENUMcommand.
The amount of trace information and the information contained within trace entries is at your discretion.See ENTER TRACENUM for more information about this command.
Writing messagesDiagnostic messages can be output by using EXEC CICS WRITEQ TD.
Message information content, message format, frequency, and destination are at your discretion.
Chapter 9. Troubleshooting ONC 337
AbendsYou are recommended to use EXEC CICS HANDLE ABEND to trap abends. You should collect thediagnostic information you need by tracing, and other forms of diagnostic output, and then return aURP_DISASTER response.
338 CICS TS for z/OS: Troubleshooting CICS
Chapter 10. SDUMP contents and IPCS CICSVERBEXIT keywords
This section provides a cross-reference between the CICS control blocks contained in an SDUMP and theirassociated IPCS CICS VERBEXIT keyword.
Keyword to control block mapThis reference provides a list of IPCS CICS VERBEXIT keywords and the CICS control blocks that theydisplay.
AI keyword
• AITMSSA (AITM static storage)• AITMTE (AITM entry)
AP keyword
• CICS24 (task storage, below 16 MB, CICS key)• CICS31 (task storage, above 16 MB, CICS key)• CICS64 (task storage, above the bar, CICS key)• DWE (user DWE storage)• EIB (EXEC interface block)• EIS (EXEC interface structure)• EIUS (EXEC interface user structure)• FILE (user file storage)• JCA (journal control area)• MAPCOPY (user BMS MAP storage)• SYSEIB (system EXEC interface block)• SYS_TCA (task control area, system area only)• TCA (task control area, user)• TD (user transient data)• TS (user temporary storage)• USER24 (task storage, below 16 MB, user key)• USER31 (task storage, above 16 MB, user key)• USER64 (task storage, above the bar, user key)
APS keyword
• CICS24 (task storage, below 16 MB, CICS key)• CICS31 (task storage, above 16 MB, CICS key)• DWE (user DWE storage)• EIB (EXEC interface block)• EIS (EXEC interface structure)• EIUS (EXEC interface user structure)• FILE (user file storage)• JCA (journal control area)• MAPCOPY(user BMS MAP storage)
© Copyright IBM Corp. 1974, 2021 339
• SYSEIB (system EXEC interface block)• SYS_TCA (task control area, system area only)• TCA (task control area, user)• TD (user transient data)• TS (user temporary storage)• USER24 (task storage, below 16 MB, user key)• USER31 (task storage, above 16 MB, user key)
Refer to the z/OS Language Environment Debugging Guide for details of LE control blocks and dataareas.
AS keyword
• ASA (asynchronous services domain anchor block)• ACCB (asynchronous coordination control block)• ACTXN (Asynchronous Parent Transaction Token)
BR keyword
• Bridge facility bitmap• Bridge facility block• Bridge facility keep chain• BRXA (bridge exit interface)• TXN_CS
CP keyword
• CPSTATIC (common programming interface static storage)
CSA keyword
• CSA (common system area)• CSAOPFL (CSA optional features list)• CWA (common work area)
Db2 keyword
• D2CSB (CICS Db2 subtask block)• D2ENT (CICS DB2ENTRY control block)• D2GLB (CICS Db2 global block)• D2LOT (CICS Db2 life of task block)• D2PKGSET (CICS Db2 PACKAGESET control block)• D2SS (CICS Db2 static storage)• D2TRN (CICS DB2TRAN control block)
DD keyword
• ANCHOR (directory manager anchor block)• AVL_HEAD (AVL tree header)• BRWS_VAL (browse value)• DIR_HEAD (directory header)• HASH_TBL (hash table)• HASHELEM (collision list element)
DH keyword
• DBB (document bookmark block)
340 CICS TS for z/OS: Troubleshooting CICS
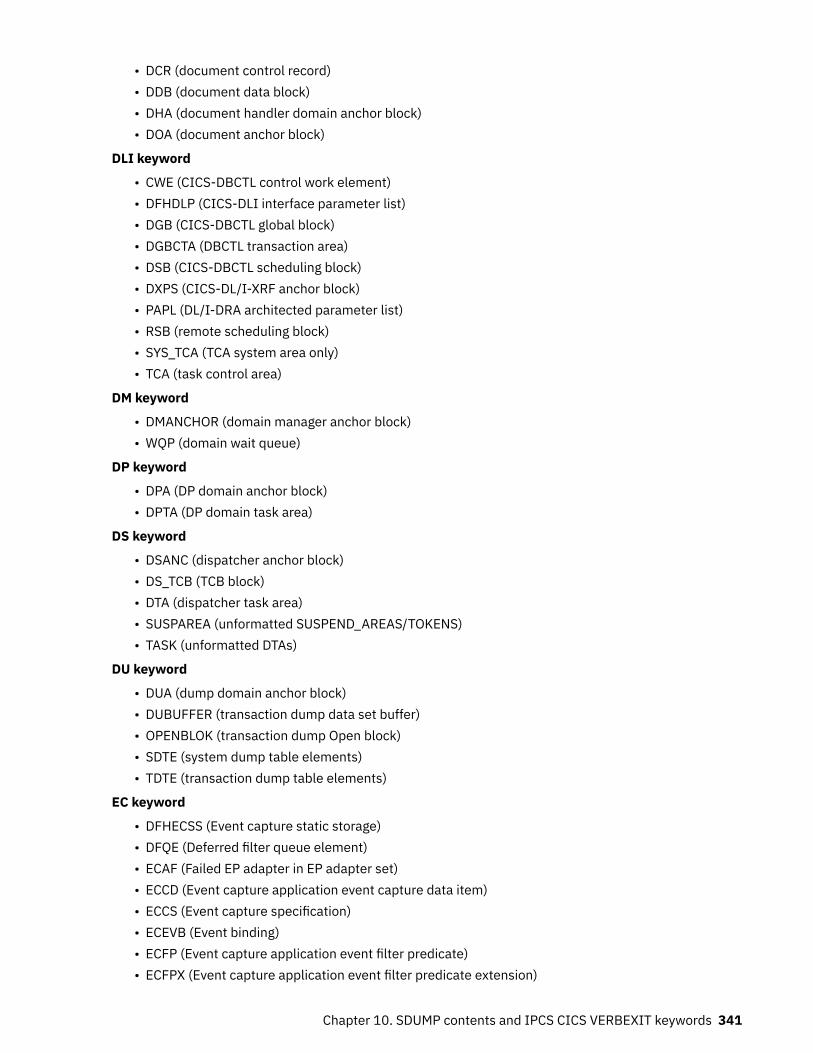
• DCR (document control record)• DDB (document data block)• DHA (document handler domain anchor block)• DOA (document anchor block)
DLI keyword
• CWE (CICS-DBCTL control work element)• DFHDLP (CICS-DLI interface parameter list)• DGB (CICS-DBCTL global block)• DGBCTA (DBCTL transaction area)• DSB (CICS-DBCTL scheduling block)• DXPS (CICS-DL/I-XRF anchor block)• PAPL (DL/I-DRA architected parameter list)• RSB (remote scheduling block)• SYS_TCA (TCA system area only)• TCA (task control area)
DM keyword
• DMANCHOR (domain manager anchor block)• WQP (domain wait queue)
DP keyword
• DPA (DP domain anchor block)• DPTA (DP domain task area)
DS keyword
• DSANC (dispatcher anchor block)• DS_TCB (TCB block)• DTA (dispatcher task area)• SUSPAREA (unformatted SUSPEND_AREAS/TOKENS)• TASK (unformatted DTAs)
DU keyword
• DUA (dump domain anchor block)• DUBUFFER (transaction dump data set buffer)• OPENBLOK (transaction dump Open block)• SDTE (system dump table elements)• TDTE (transaction dump table elements)
EC keyword
• DFHECSS (Event capture static storage)• DFQE (Deferred filter queue element)• ECAF (Failed EP adapter in EP adapter set)• ECCD (Event capture application event capture data item)• ECCS (Event capture specification)• ECEVB (Event binding)• ECFP (Event capture application event filter predicate)• ECFPX (Event capture application event filter predicate extension)
Chapter 10. SDUMP contents and IPCS CICS VERBEXIT keywords 341
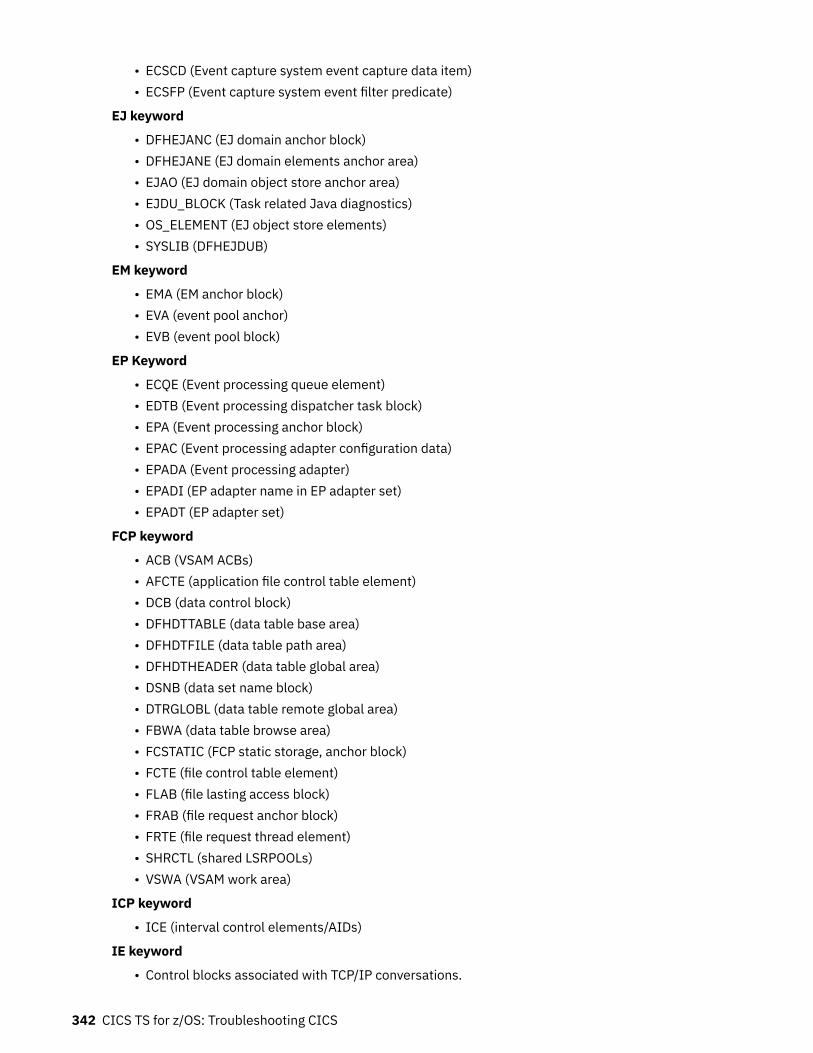
• ECSCD (Event capture system event capture data item)• ECSFP (Event capture system event filter predicate)
EJ keyword
• DFHEJANC (EJ domain anchor block)• DFHEJANE (EJ domain elements anchor area)• EJAO (EJ domain object store anchor area)• EJDU_BLOCK (Task related Java diagnostics)• OS_ELEMENT (EJ object store elements)• SYSLIB (DFHEJDUB)
EM keyword
• EMA (EM anchor block)• EVA (event pool anchor)• EVB (event pool block)
EP Keyword
• ECQE (Event processing queue element)• EDTB (Event processing dispatcher task block)• EPA (Event processing anchor block)• EPAC (Event processing adapter configuration data)• EPADA (Event processing adapter)• EPADI (EP adapter name in EP adapter set)• EPADT (EP adapter set)
FCP keyword
• ACB (VSAM ACBs)• AFCTE (application file control table element)• DCB (data control block)• DFHDTTABLE (data table base area)• DFHDTFILE (data table path area)• DFHDTHEADER (data table global area)• DSNB (data set name block)• DTRGLOBL (data table remote global area)• FBWA (data table browse area)• FCSTATIC (FCP static storage, anchor block)• FCTE (file control table element)• FLAB (file lasting access block)• FRAB (file request anchor block)• FRTE (file request thread element)• SHRCTL (shared LSRPOOLs)• VSWA (VSAM work area)
ICP keyword
• ICE (interval control elements/AIDs)
IE keyword
• Control blocks associated with TCP/IP conversations.
342 CICS TS for z/OS: Troubleshooting CICS
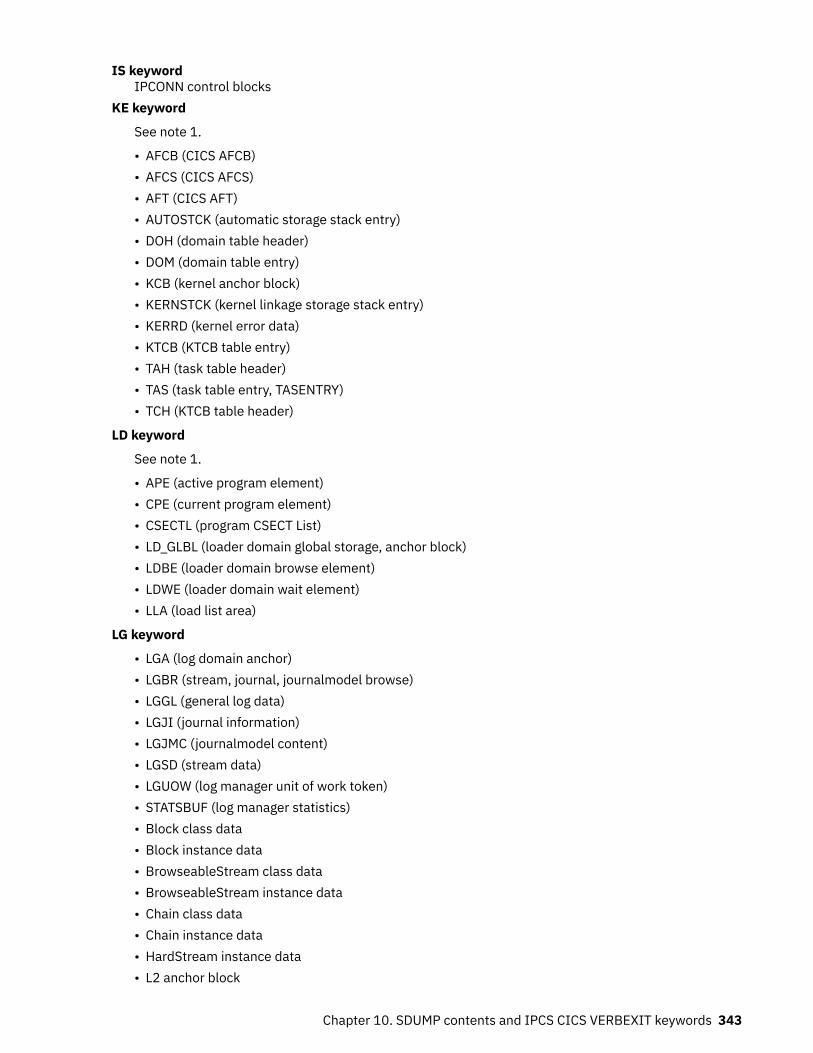
IS keywordIPCONN control blocks
KE keyword
See note 1.
• AFCB (CICS AFCB)• AFCS (CICS AFCS)• AFT (CICS AFT)• AUTOSTCK (automatic storage stack entry)• DOH (domain table header)• DOM (domain table entry)• KCB (kernel anchor block)• KERNSTCK (kernel linkage storage stack entry)• KERRD (kernel error data)• KTCB (KTCB table entry)• TAH (task table header)• TAS (task table entry, TASENTRY)• TCH (KTCB table header)
LD keyword
See note 1.
• APE (active program element)• CPE (current program element)• CSECTL (program CSECT List)• LD_GLBL (loader domain global storage, anchor block)• LDBE (loader domain browse element)• LDWE (loader domain wait element)• LLA (load list area)
LG keyword
• LGA (log domain anchor)• LGBR (stream, journal, journalmodel browse)• LGGL (general log data)• LGJI (journal information)• LGJMC (journalmodel content)• LGSD (stream data)• LGUOW (log manager unit of work token)• STATSBUF (log manager statistics)• Block class data• Block instance data• BrowseableStream class data• BrowseableStream instance data• Chain class data• Chain instance data• HardStream instance data• L2 anchor block
Chapter 10. SDUMP contents and IPCS CICS VERBEXIT keywords 343
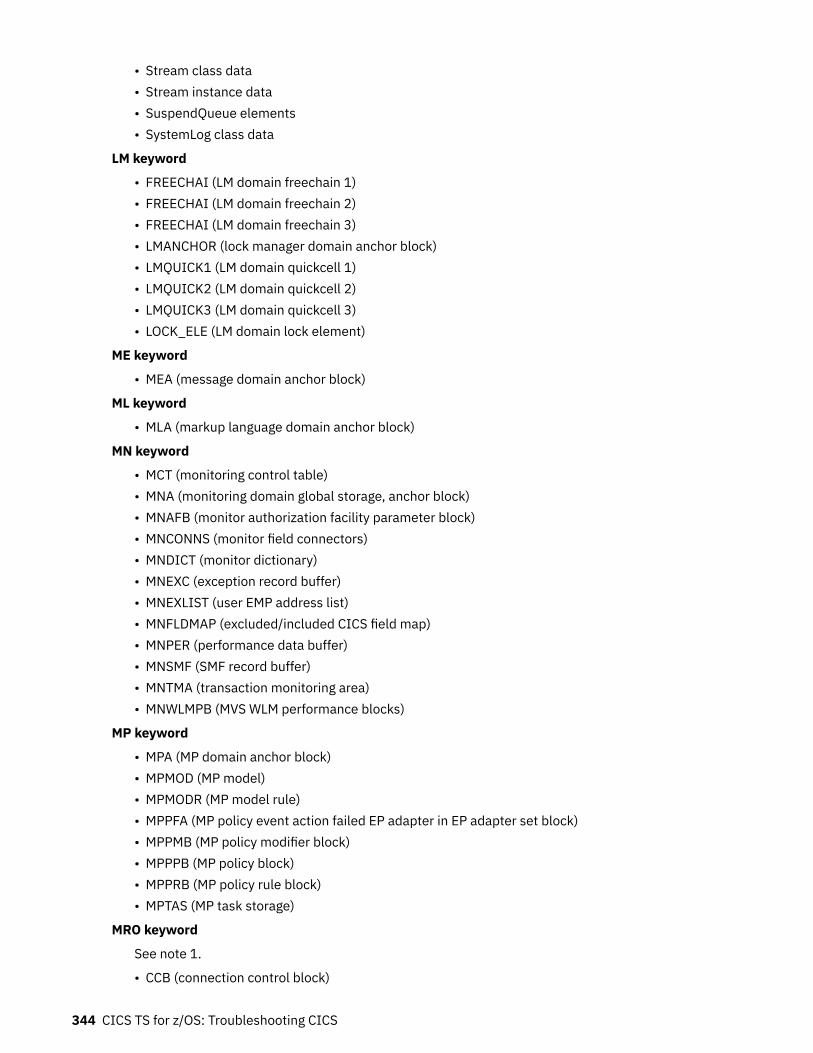
• Stream class data• Stream instance data• SuspendQueue elements• SystemLog class data
LM keyword
• FREECHAI (LM domain freechain 1)• FREECHAI (LM domain freechain 2)• FREECHAI (LM domain freechain 3)• LMANCHOR (lock manager domain anchor block)• LMQUICK1 (LM domain quickcell 1)• LMQUICK2 (LM domain quickcell 2)• LMQUICK3 (LM domain quickcell 3)• LOCK_ELE (LM domain lock element)
ME keyword
• MEA (message domain anchor block)
ML keyword
• MLA (markup language domain anchor block)
MN keyword
• MCT (monitoring control table)• MNA (monitoring domain global storage, anchor block)• MNAFB (monitor authorization facility parameter block)• MNCONNS (monitor field connectors)• MNDICT (monitor dictionary)• MNEXC (exception record buffer)• MNEXLIST (user EMP address list)• MNFLDMAP (excluded/included CICS field map)• MNPER (performance data buffer)• MNSMF (SMF record buffer)• MNTMA (transaction monitoring area)• MNWLMPB (MVS WLM performance blocks)
MP keyword
• MPA (MP domain anchor block)• MPMOD (MP model)• MPMODR (MP model rule)• MPPFA (MP policy event action failed EP adapter in EP adapter set block)• MPPMB (MP policy modifier block)• MPPPB (MP policy block)• MPPRB (MP policy rule block)• MPTAS (MP task storage)
MRO keyword
See note 1.
• CCB (connection control block)
344 CICS TS for z/OS: Troubleshooting CICS
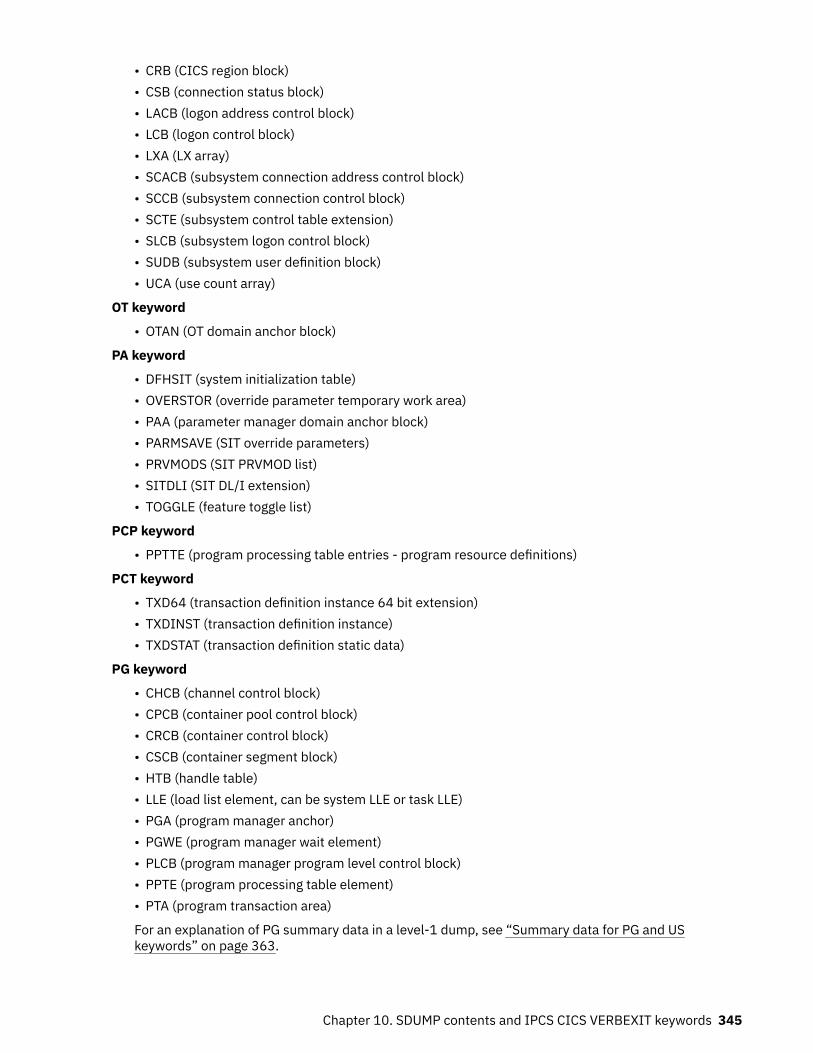
• CRB (CICS region block)• CSB (connection status block)• LACB (logon address control block)• LCB (logon control block)• LXA (LX array)• SCACB (subsystem connection address control block)• SCCB (subsystem connection control block)• SCTE (subsystem control table extension)• SLCB (subsystem logon control block)• SUDB (subsystem user definition block)• UCA (use count array)
OT keyword
• OTAN (OT domain anchor block)
PA keyword
• DFHSIT (system initialization table)• OVERSTOR (override parameter temporary work area)• PAA (parameter manager domain anchor block)• PARMSAVE (SIT override parameters)• PRVMODS (SIT PRVMOD list)• SITDLI (SIT DL/I extension)• TOGGLE (feature toggle list)
PCP keyword
• PPTTE (program processing table entries - program resource definitions)
PCT keyword
• TXD64 (transaction definition instance 64 bit extension)• TXDINST (transaction definition instance)• TXDSTAT (transaction definition static data)
PG keyword
• CHCB (channel control block)• CPCB (container pool control block)• CRCB (container control block)• CSCB (container segment block)• HTB (handle table)• LLE (load list element, can be system LLE or task LLE)• PGA (program manager anchor)• PGWE (program manager wait element)• PLCB (program manager program level control block)• PPTE (program processing table element)• PTA (program transaction area)
For an explanation of PG summary data in a level-1 dump, see “Summary data for PG and USkeywords” on page 363.
Chapter 10. SDUMP contents and IPCS CICS VERBEXIT keywords 345
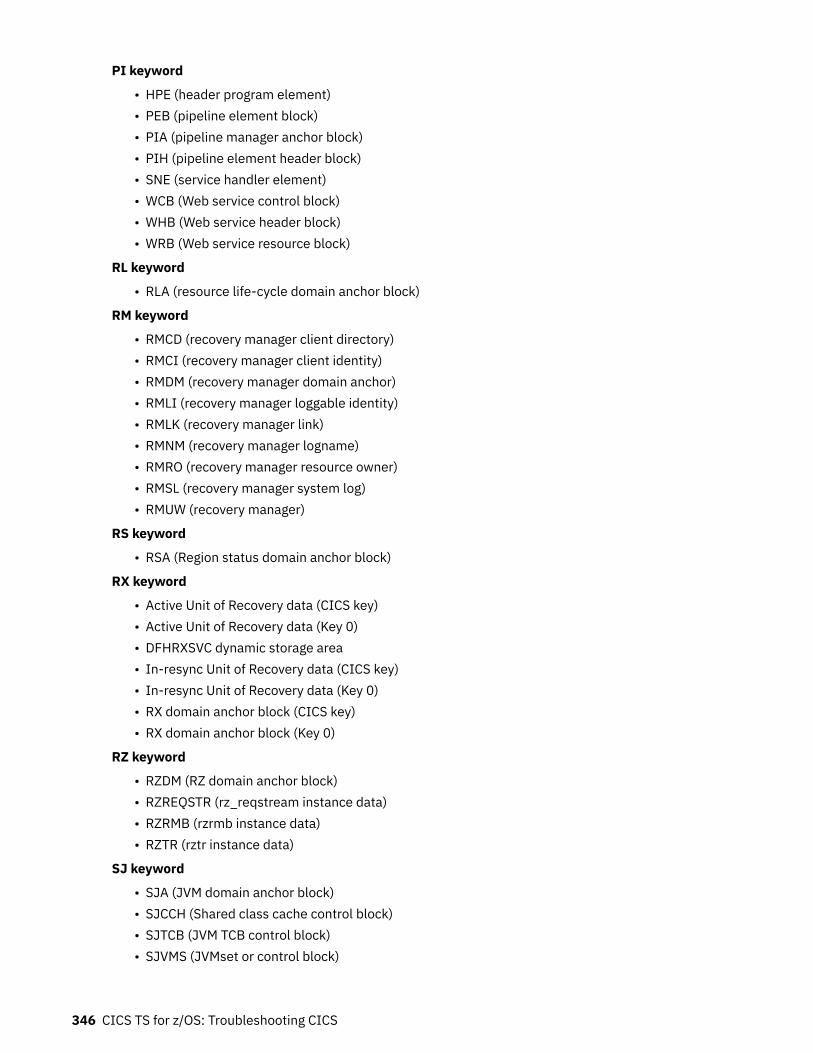
PI keyword
• HPE (header program element)• PEB (pipeline element block)• PIA (pipeline manager anchor block)• PIH (pipeline element header block)• SNE (service handler element)• WCB (Web service control block)• WHB (Web service header block)• WRB (Web service resource block)
RL keyword
• RLA (resource life-cycle domain anchor block)
RM keyword
• RMCD (recovery manager client directory)• RMCI (recovery manager client identity)• RMDM (recovery manager domain anchor)• RMLI (recovery manager loggable identity)• RMLK (recovery manager link)• RMNM (recovery manager logname)• RMRO (recovery manager resource owner)• RMSL (recovery manager system log)• RMUW (recovery manager)
RS keyword
• RSA (Region status domain anchor block)
RX keyword
• Active Unit of Recovery data (CICS key)• Active Unit of Recovery data (Key 0)• DFHRXSVC dynamic storage area• In-resync Unit of Recovery data (CICS key)• In-resync Unit of Recovery data (Key 0)• RX domain anchor block (CICS key)• RX domain anchor block (Key 0)
RZ keyword
• RZDM (RZ domain anchor block)• RZREQSTR (rz_reqstream instance data)• RZRMB (rzrmb instance data)• RZTR (rztr instance data)
SJ keyword
• SJA (JVM domain anchor block)• SJCCH (Shared class cache control block)• SJTCB (JVM TCB control block)• SJVMS (JVMset or control block)
346 CICS TS for z/OS: Troubleshooting CICS
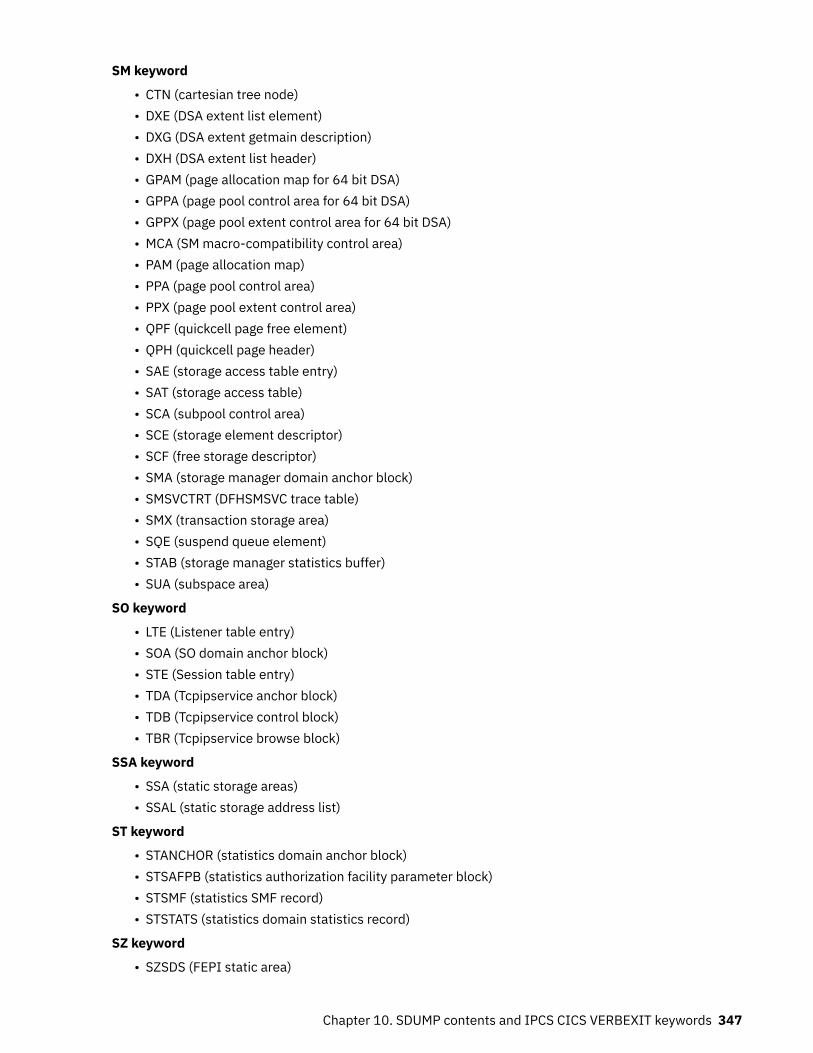
SM keyword
• CTN (cartesian tree node)• DXE (DSA extent list element)• DXG (DSA extent getmain description)• DXH (DSA extent list header)• GPAM (page allocation map for 64 bit DSA)• GPPA (page pool control area for 64 bit DSA)• GPPX (page pool extent control area for 64 bit DSA)• MCA (SM macro-compatibility control area)• PAM (page allocation map)• PPA (page pool control area)• PPX (page pool extent control area)• QPF (quickcell page free element)• QPH (quickcell page header)• SAE (storage access table entry)• SAT (storage access table)• SCA (subpool control area)• SCE (storage element descriptor)• SCF (free storage descriptor)• SMA (storage manager domain anchor block)• SMSVCTRT (DFHSMSVC trace table)• SMX (transaction storage area)• SQE (suspend queue element)• STAB (storage manager statistics buffer)• SUA (subspace area)
SO keyword
• LTE (Listener table entry)• SOA (SO domain anchor block)• STE (Session table entry)• TDA (Tcpipservice anchor block)• TDB (Tcpipservice control block)• TBR (Tcpipservice browse block)
SSA keyword
• SSA (static storage areas)• SSAL (static storage address list)
ST keyword
• STANCHOR (statistics domain anchor block)• STSAFPB (statistics authorization facility parameter block)• STSMF (statistics SMF record)• STSTATS (statistics domain statistics record)
SZ keyword
• SZSDS (FEPI static area)
Chapter 10. SDUMP contents and IPCS CICS VERBEXIT keywords 347
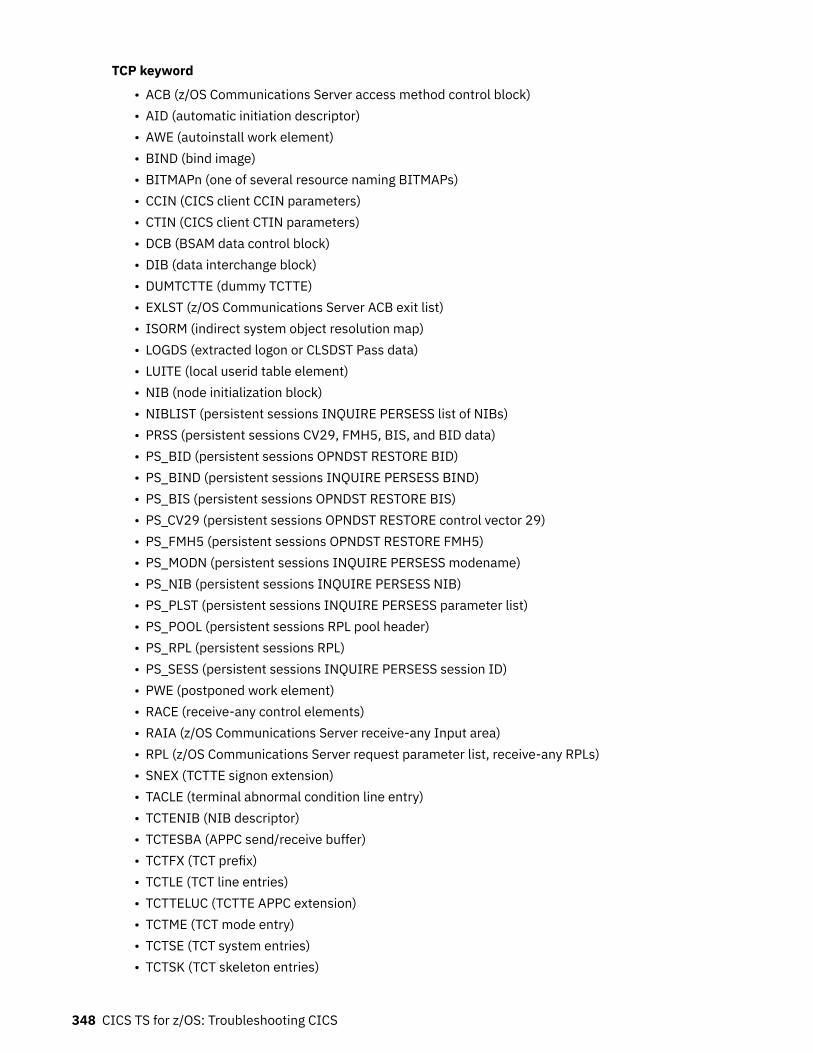
TCP keyword
• ACB (z/OS Communications Server access method control block)• AID (automatic initiation descriptor)• AWE (autoinstall work element)• BIND (bind image)• BITMAPn (one of several resource naming BITMAPs)• CCIN (CICS client CCIN parameters)• CTIN (CICS client CTIN parameters)• DCB (BSAM data control block)• DIB (data interchange block)• DUMTCTTE (dummy TCTTE)• EXLST (z/OS Communications Server ACB exit list)• ISORM (indirect system object resolution map)• LOGDS (extracted logon or CLSDST Pass data)• LUITE (local userid table element)• NIB (node initialization block)• NIBLIST (persistent sessions INQUIRE PERSESS list of NIBs)• PRSS (persistent sessions CV29, FMH5, BIS, and BID data)• PS_BID (persistent sessions OPNDST RESTORE BID)• PS_BIND (persistent sessions INQUIRE PERSESS BIND)• PS_BIS (persistent sessions OPNDST RESTORE BIS)• PS_CV29 (persistent sessions OPNDST RESTORE control vector 29)• PS_FMH5 (persistent sessions OPNDST RESTORE FMH5)• PS_MODN (persistent sessions INQUIRE PERSESS modename)• PS_NIB (persistent sessions INQUIRE PERSESS NIB)• PS_PLST (persistent sessions INQUIRE PERSESS parameter list)• PS_POOL (persistent sessions RPL pool header)• PS_RPL (persistent sessions RPL)• PS_SESS (persistent sessions INQUIRE PERSESS session ID)• PWE (postponed work element)• RACE (receive-any control elements)• RAIA (z/OS Communications Server receive-any Input area)• RPL (z/OS Communications Server request parameter list, receive-any RPLs)• SNEX (TCTTE signon extension)• TACLE (terminal abnormal condition line entry)• TCTENIB (NIB descriptor)• TCTESBA (APPC send/receive buffer)• TCTFX (TCT prefix)• TCTLE (TCT line entries)• TCTTELUC (TCTTE APPC extension)• TCTME (TCT mode entry)• TCTSE (TCT system entries)• TCTSK (TCT skeleton entries)
348 CICS TS for z/OS: Troubleshooting CICS
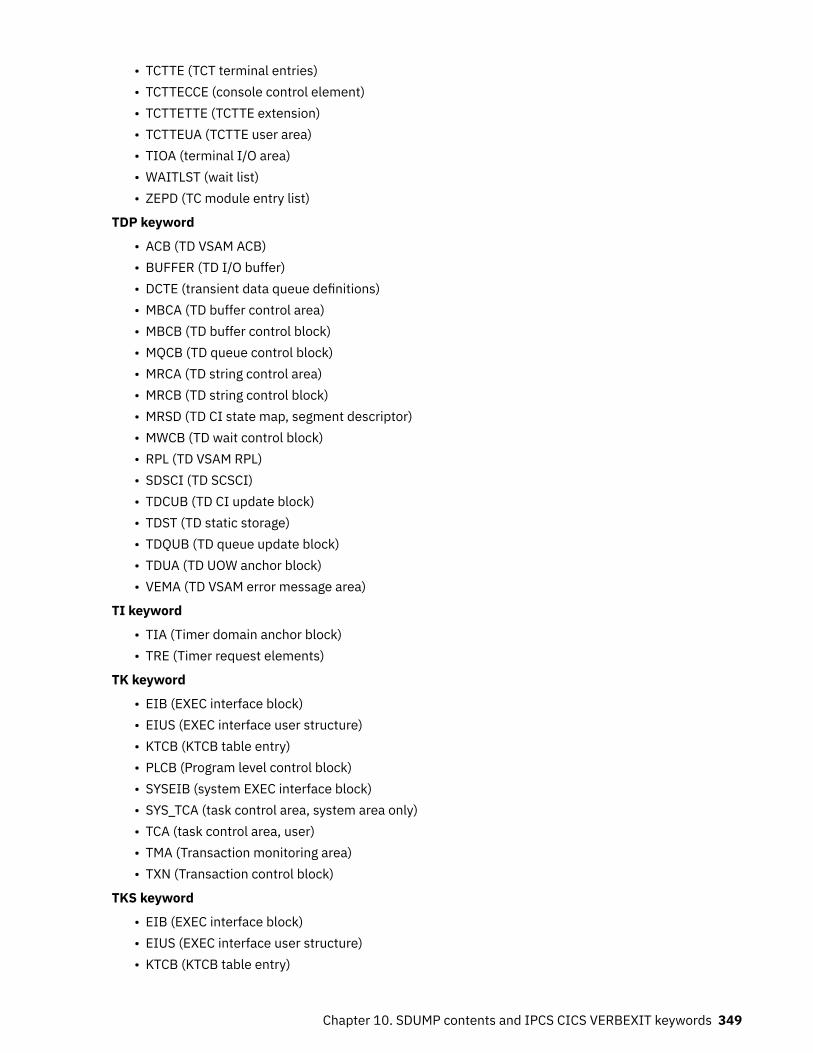
• TCTTE (TCT terminal entries)• TCTTECCE (console control element)• TCTTETTE (TCTTE extension)• TCTTEUA (TCTTE user area)• TIOA (terminal I/O area)• WAITLST (wait list)• ZEPD (TC module entry list)
TDP keyword
• ACB (TD VSAM ACB)• BUFFER (TD I/O buffer)• DCTE (transient data queue definitions)• MBCA (TD buffer control area)• MBCB (TD buffer control block)• MQCB (TD queue control block)• MRCA (TD string control area)• MRCB (TD string control block)• MRSD (TD CI state map, segment descriptor)• MWCB (TD wait control block)• RPL (TD VSAM RPL)• SDSCI (TD SCSCI)• TDCUB (TD CI update block)• TDST (TD static storage)• TDQUB (TD queue update block)• TDUA (TD UOW anchor block)• VEMA (TD VSAM error message area)
TI keyword
• TIA (Timer domain anchor block)• TRE (Timer request elements)
TK keyword
• EIB (EXEC interface block)• EIUS (EXEC interface user structure)• KTCB (KTCB table entry)• PLCB (Program level control block)• SYSEIB (system EXEC interface block)• SYS_TCA (task control area, system area only)• TCA (task control area, user)• TMA (Transaction monitoring area)• TXN (Transaction control block)
TKS keyword
• EIB (EXEC interface block)• EIUS (EXEC interface user structure)• KTCB (KTCB table entry)
Chapter 10. SDUMP contents and IPCS CICS VERBEXIT keywords 349
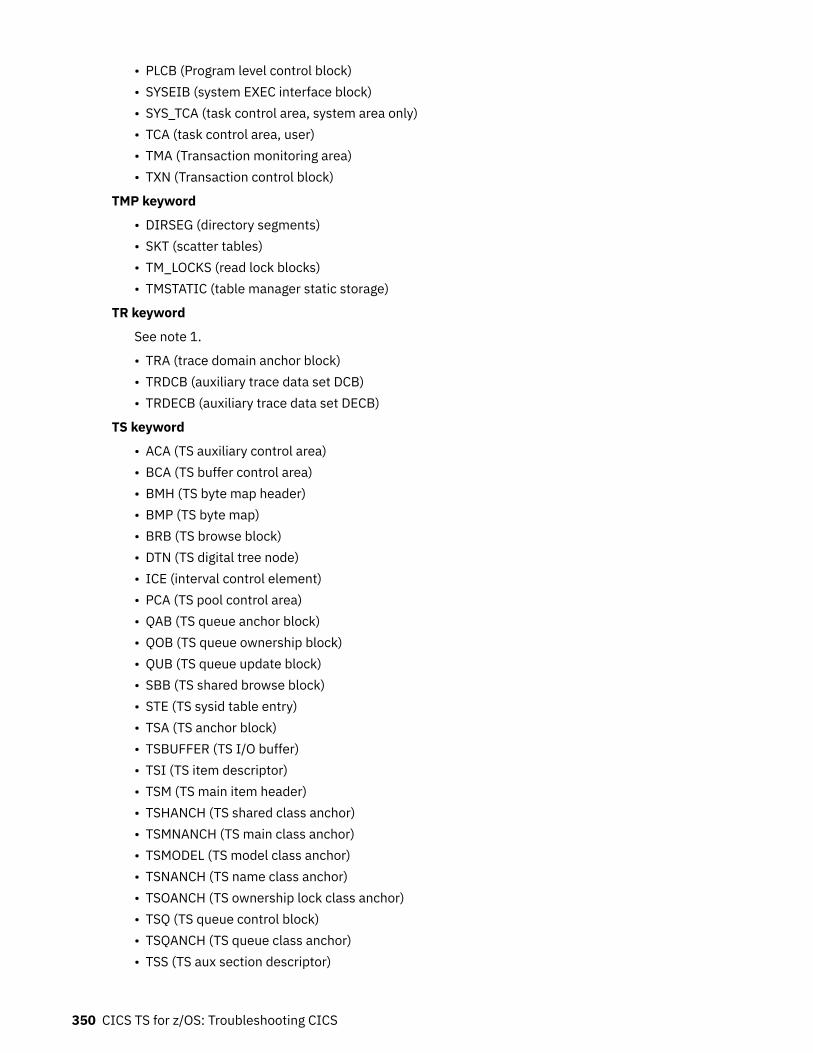
• PLCB (Program level control block)• SYSEIB (system EXEC interface block)• SYS_TCA (task control area, system area only)• TCA (task control area, user)• TMA (Transaction monitoring area)• TXN (Transaction control block)
TMP keyword
• DIRSEG (directory segments)• SKT (scatter tables)• TM_LOCKS (read lock blocks)• TMSTATIC (table manager static storage)
TR keyword
See note 1.
• TRA (trace domain anchor block)• TRDCB (auxiliary trace data set DCB)• TRDECB (auxiliary trace data set DECB)
TS keyword
• ACA (TS auxiliary control area)• BCA (TS buffer control area)• BMH (TS byte map header)• BMP (TS byte map)• BRB (TS browse block)• DTN (TS digital tree node)• ICE (interval control element)• PCA (TS pool control area)• QAB (TS queue anchor block)• QOB (TS queue ownership block)• QUB (TS queue update block)• SBB (TS shared browse block)• STE (TS sysid table entry)• TSA (TS anchor block)• TSBUFFER (TS I/O buffer)• TSI (TS item descriptor)• TSM (TS main item header)• TSHANCH (TS shared class anchor)• TSMNANCH (TS main class anchor)• TSMODEL (TS model class anchor)• TSNANCH (TS name class anchor)• TSOANCH (TS ownership lock class anchor)• TSQ (TS queue control block)• TSQANCH (TS queue class anchor)• TSS (TS aux section descriptor)
350 CICS TS for z/OS: Troubleshooting CICS
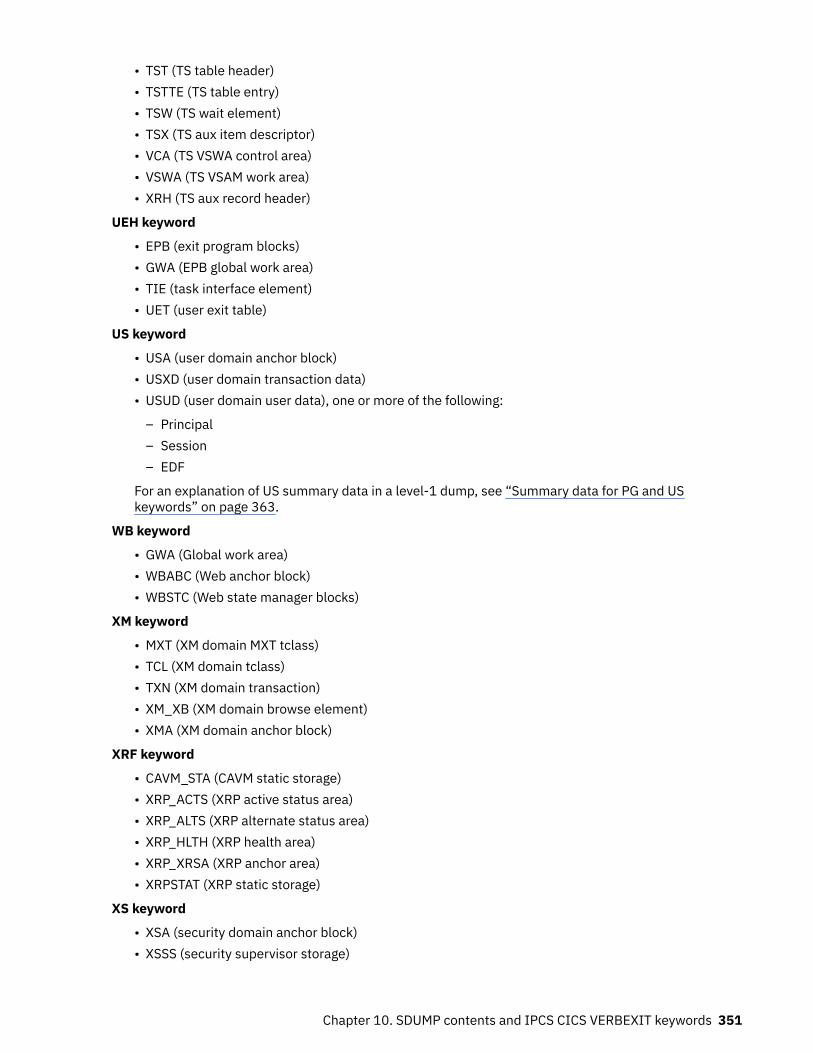
• TST (TS table header)• TSTTE (TS table entry)• TSW (TS wait element)• TSX (TS aux item descriptor)• VCA (TS VSWA control area)• VSWA (TS VSAM work area)• XRH (TS aux record header)
UEH keyword
• EPB (exit program blocks)• GWA (EPB global work area)• TIE (task interface element)• UET (user exit table)
US keyword
• USA (user domain anchor block)• USXD (user domain transaction data)• USUD (user domain user data), one or more of the following:
– Principal– Session– EDF
For an explanation of US summary data in a level-1 dump, see “Summary data for PG and USkeywords” on page 363.
WB keyword
• GWA (Global work area)• WBABC (Web anchor block)• WBSTC (Web state manager blocks)
XM keyword
• MXT (XM domain MXT tclass)• TCL (XM domain tclass)• TXN (XM domain transaction)• XM_XB (XM domain browse element)• XMA (XM domain anchor block)
XRF keyword
• CAVM_STA (CAVM static storage)• XRP_ACTS (XRP active status area)• XRP_ALTS (XRP alternate status area)• XRP_HLTH (XRP health area)• XRP_XRSA (XRP anchor area)• XRPSTAT (XRP static storage)
XS keyword
• XSA (security domain anchor block)• XSSS (security supervisor storage)
Chapter 10. SDUMP contents and IPCS CICS VERBEXIT keywords 351
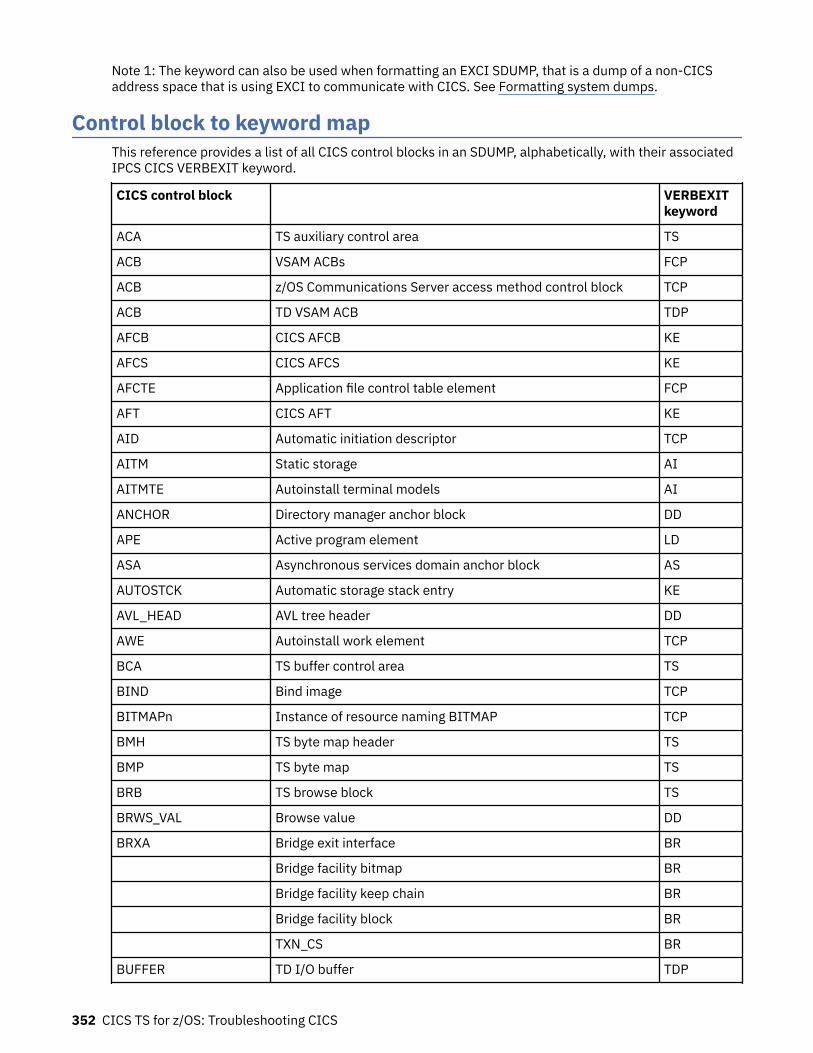
Note 1: The keyword can also be used when formatting an EXCI SDUMP, that is a dump of a non-CICSaddress space that is using EXCI to communicate with CICS. See Formatting system dumps.
Control block to keyword mapThis reference provides a list of all CICS control blocks in an SDUMP, alphabetically, with their associatedIPCS CICS VERBEXIT keyword.
CICS control block VERBEXITkeyword
ACA TS auxiliary control area TS
ACB VSAM ACBs FCP
ACB z/OS Communications Server access method control block TCP
ACB TD VSAM ACB TDP
AFCB CICS AFCB KE
AFCS CICS AFCS KE
AFCTE Application file control table element FCP
AFT CICS AFT KE
AID Automatic initiation descriptor TCP
AITM Static storage AI
AITMTE Autoinstall terminal models AI
ANCHOR Directory manager anchor block DD
APE Active program element LD
ASA Asynchronous services domain anchor block AS
AUTOSTCK Automatic storage stack entry KE
AVL_HEAD AVL tree header DD
AWE Autoinstall work element TCP
BCA TS buffer control area TS
BIND Bind image TCP
BITMAPn Instance of resource naming BITMAP TCP
BMH TS byte map header TS
BMP TS byte map TS
BRB TS browse block TS
BRWS_VAL Browse value DD
BRXA Bridge exit interface BR
Bridge facility bitmap BR
Bridge facility keep chain BR
Bridge facility block BR
TXN_CS BR
BUFFER TD I/O buffer TDP
352 CICS TS for z/OS: Troubleshooting CICS
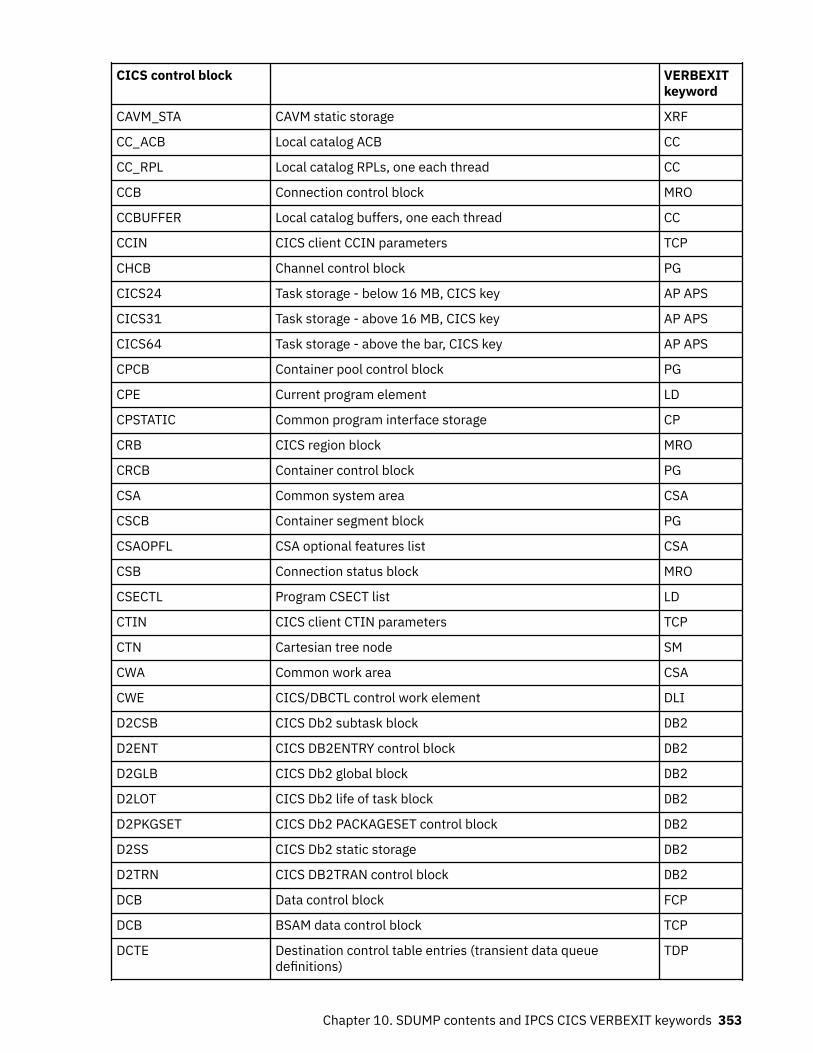
CICS control block VERBEXITkeyword
CAVM_STA CAVM static storage XRF
CC_ACB Local catalog ACB CC
CC_RPL Local catalog RPLs, one each thread CC
CCB Connection control block MRO
CCBUFFER Local catalog buffers, one each thread CC
CCIN CICS client CCIN parameters TCP
CHCB Channel control block PG
CICS24 Task storage - below 16 MB, CICS key AP APS
CICS31 Task storage - above 16 MB, CICS key AP APS
CICS64 Task storage - above the bar, CICS key AP APS
CPCB Container pool control block PG
CPE Current program element LD
CPSTATIC Common program interface storage CP
CRB CICS region block MRO
CRCB Container control block PG
CSA Common system area CSA
CSCB Container segment block PG
CSAOPFL CSA optional features list CSA
CSB Connection status block MRO
CSECTL Program CSECT list LD
CTIN CICS client CTIN parameters TCP
CTN Cartesian tree node SM
CWA Common work area CSA
CWE CICS/DBCTL control work element DLI
D2CSB CICS Db2 subtask block DB2
D2ENT CICS DB2ENTRY control block DB2
D2GLB CICS Db2 global block DB2
D2LOT CICS Db2 life of task block DB2
D2PKGSET CICS Db2 PACKAGESET control block DB2
D2SS CICS Db2 static storage DB2
D2TRN CICS DB2TRAN control block DB2
DCB Data control block FCP
DCB BSAM data control block TCP
DCTE Destination control table entries (transient data queuedefinitions)
TDP
Chapter 10. SDUMP contents and IPCS CICS VERBEXIT keywords 353
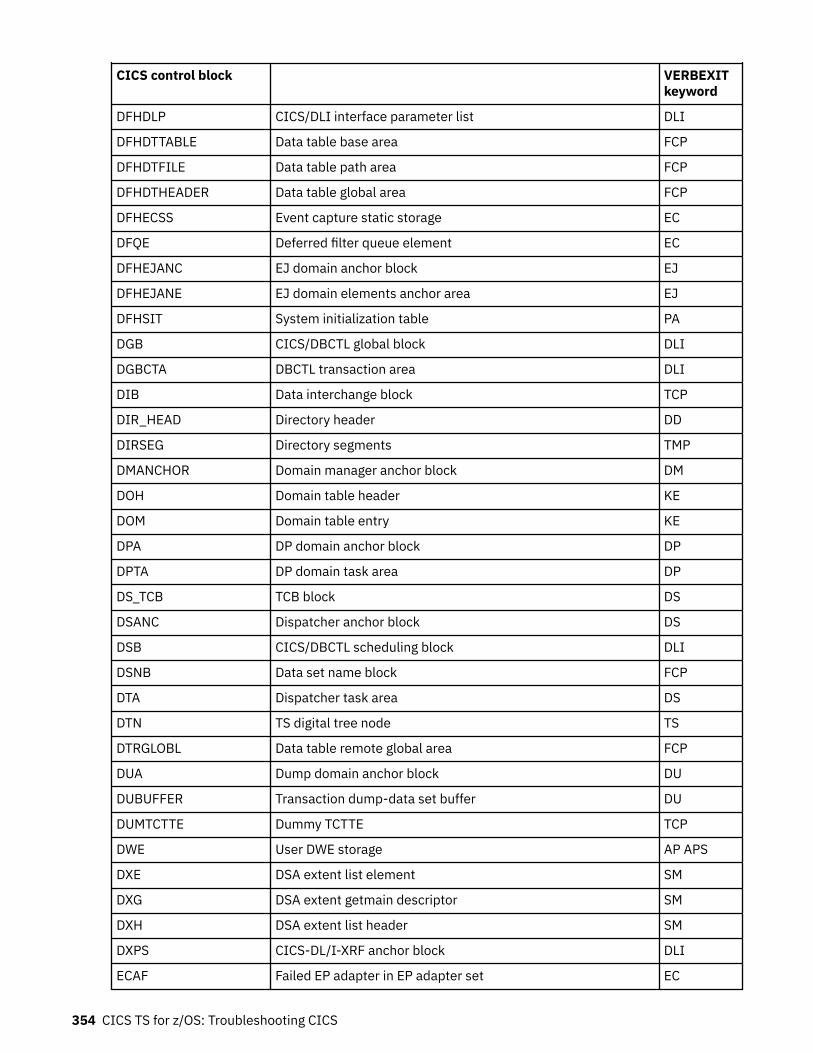
CICS control block VERBEXITkeyword
DFHDLP CICS/DLI interface parameter list DLI
DFHDTTABLE Data table base area FCP
DFHDTFILE Data table path area FCP
DFHDTHEADER Data table global area FCP
DFHECSS Event capture static storage EC
DFQE Deferred filter queue element EC
DFHEJANC EJ domain anchor block EJ
DFHEJANE EJ domain elements anchor area EJ
DFHSIT System initialization table PA
DGB CICS/DBCTL global block DLI
DGBCTA DBCTL transaction area DLI
DIB Data interchange block TCP
DIR_HEAD Directory header DD
DIRSEG Directory segments TMP
DMANCHOR Domain manager anchor block DM
DOH Domain table header KE
DOM Domain table entry KE
DPA DP domain anchor block DP
DPTA DP domain task area DP
DS_TCB TCB block DS
DSANC Dispatcher anchor block DS
DSB CICS/DBCTL scheduling block DLI
DSNB Data set name block FCP
DTA Dispatcher task area DS
DTN TS digital tree node TS
DTRGLOBL Data table remote global area FCP
DUA Dump domain anchor block DU
DUBUFFER Transaction dump-data set buffer DU
DUMTCTTE Dummy TCTTE TCP
DWE User DWE storage AP APS
DXE DSA extent list element SM
DXG DSA extent getmain descriptor SM
DXH DSA extent list header SM
DXPS CICS-DL/I-XRF anchor block DLI
ECAF Failed EP adapter in EP adapter set EC
354 CICS TS for z/OS: Troubleshooting CICS
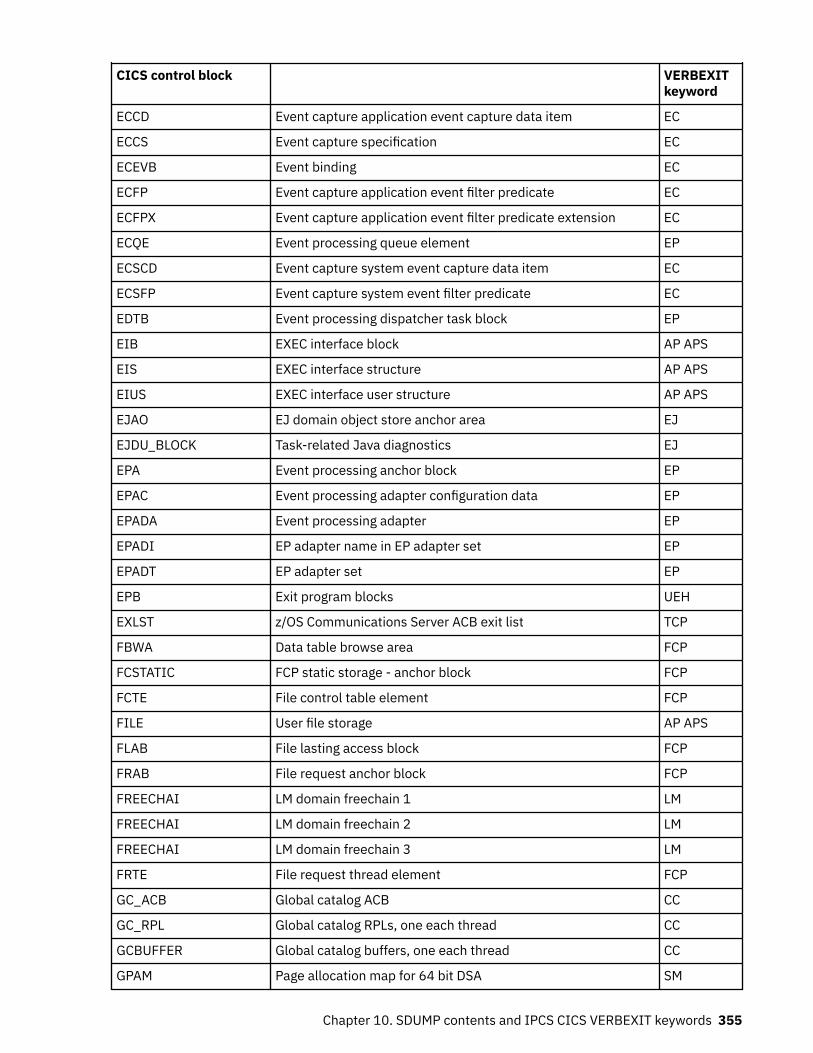
CICS control block VERBEXITkeyword
ECCD Event capture application event capture data item EC
ECCS Event capture specification EC
ECEVB Event binding EC
ECFP Event capture application event filter predicate EC
ECFPX Event capture application event filter predicate extension EC
ECQE Event processing queue element EP
ECSCD Event capture system event capture data item EC
ECSFP Event capture system event filter predicate EC
EDTB Event processing dispatcher task block EP
EIB EXEC interface block AP APS
EIS EXEC interface structure AP APS
EIUS EXEC interface user structure AP APS
EJAO EJ domain object store anchor area EJ
EJDU_BLOCK Task-related Java diagnostics EJ
EPA Event processing anchor block EP
EPAC Event processing adapter configuration data EP
EPADA Event processing adapter EP
EPADI EP adapter name in EP adapter set EP
EPADT EP adapter set EP
EPB Exit program blocks UEH
EXLST z/OS Communications Server ACB exit list TCP
FBWA Data table browse area FCP
FCSTATIC FCP static storage - anchor block FCP
FCTE File control table element FCP
FILE User file storage AP APS
FLAB File lasting access block FCP
FRAB File request anchor block FCP
FREECHAI LM domain freechain 1 LM
FREECHAI LM domain freechain 2 LM
FREECHAI LM domain freechain 3 LM
FRTE File request thread element FCP
GC_ACB Global catalog ACB CC
GC_RPL Global catalog RPLs, one each thread CC
GCBUFFER Global catalog buffers, one each thread CC
GPAM Page allocation map for 64 bit DSA SM
Chapter 10. SDUMP contents and IPCS CICS VERBEXIT keywords 355
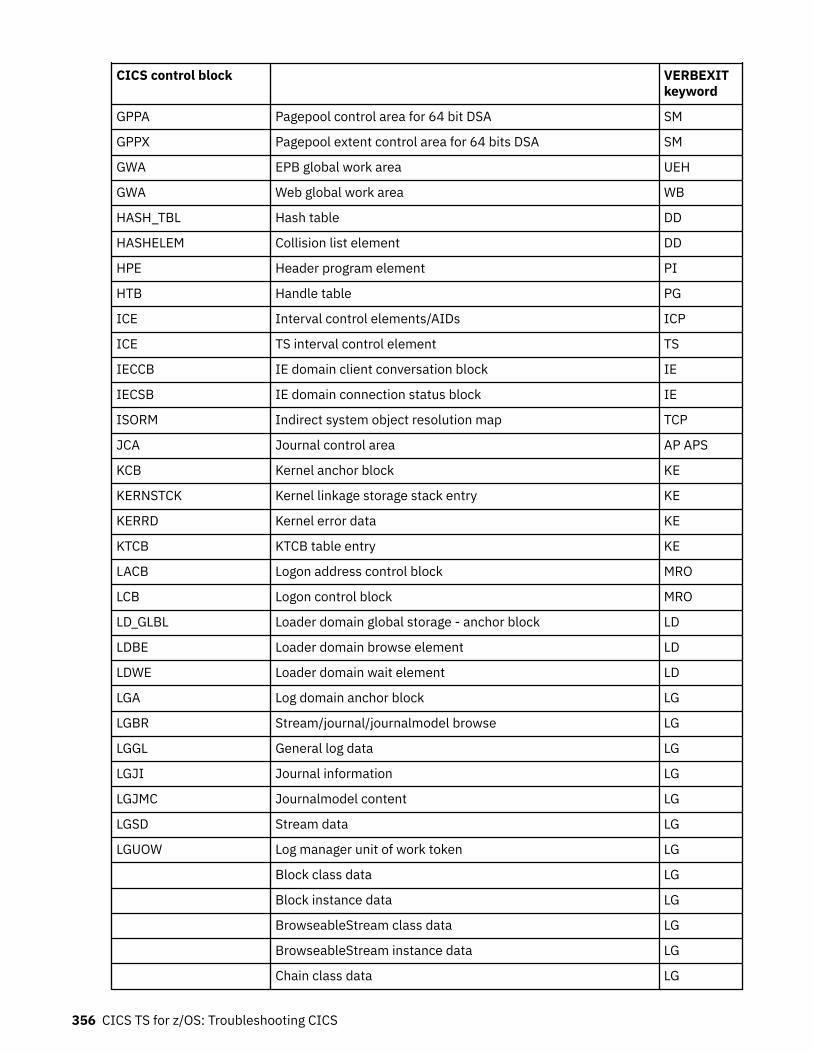
CICS control block VERBEXITkeyword
GPPA Pagepool control area for 64 bit DSA SM
GPPX Pagepool extent control area for 64 bits DSA SM
GWA EPB global work area UEH
GWA Web global work area WB
HASH_TBL Hash table DD
HASHELEM Collision list element DD
HPE Header program element PI
HTB Handle table PG
ICE Interval control elements/AIDs ICP
ICE TS interval control element TS
IECCB IE domain client conversation block IE
IECSB IE domain connection status block IE
ISORM Indirect system object resolution map TCP
JCA Journal control area AP APS
KCB Kernel anchor block KE
KERNSTCK Kernel linkage storage stack entry KE
KERRD Kernel error data KE
KTCB KTCB table entry KE
LACB Logon address control block MRO
LCB Logon control block MRO
LD_GLBL Loader domain global storage - anchor block LD
LDBE Loader domain browse element LD
LDWE Loader domain wait element LD
LGA Log domain anchor block LG
LGBR Stream/journal/journalmodel browse LG
LGGL General log data LG
LGJI Journal information LG
LGJMC Journalmodel content LG
LGSD Stream data LG
LGUOW Log manager unit of work token LG
Block class data LG
Block instance data LG
BrowseableStream class data LG
BrowseableStream instance data LG
Chain class data LG
356 CICS TS for z/OS: Troubleshooting CICS
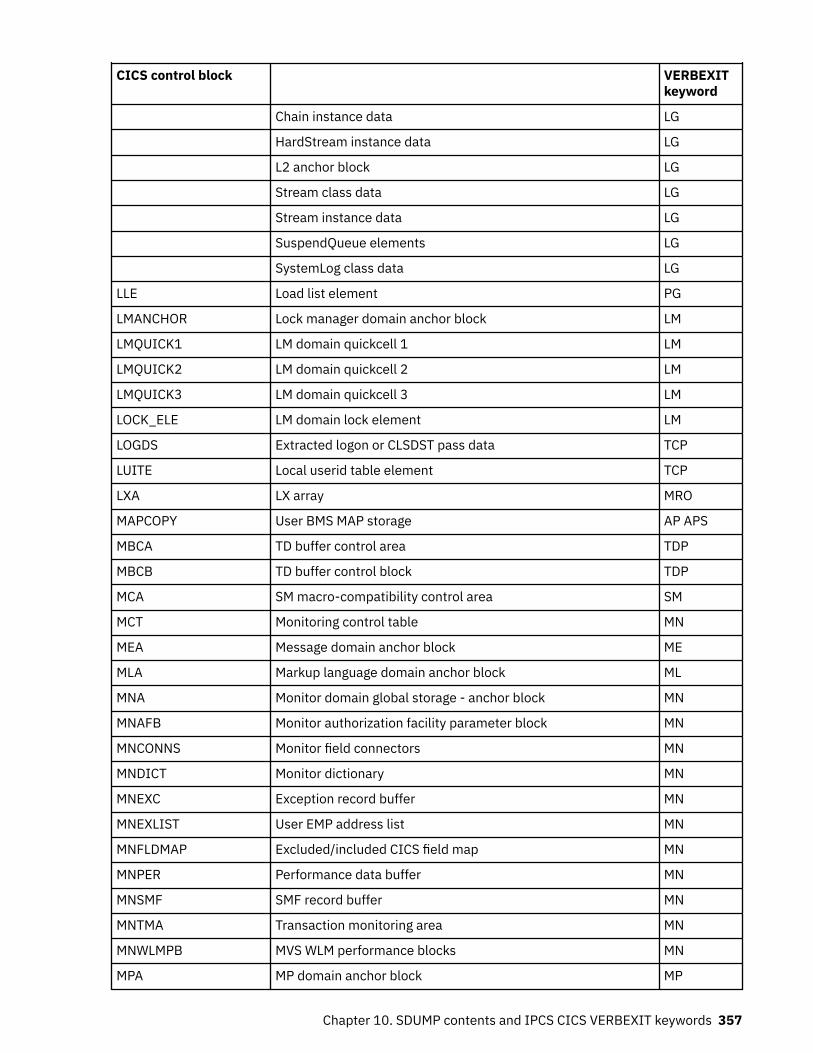
CICS control block VERBEXITkeyword
Chain instance data LG
HardStream instance data LG
L2 anchor block LG
Stream class data LG
Stream instance data LG
SuspendQueue elements LG
SystemLog class data LG
LLE Load list element PG
LMANCHOR Lock manager domain anchor block LM
LMQUICK1 LM domain quickcell 1 LM
LMQUICK2 LM domain quickcell 2 LM
LMQUICK3 LM domain quickcell 3 LM
LOCK_ELE LM domain lock element LM
LOGDS Extracted logon or CLSDST pass data TCP
LUITE Local userid table element TCP
LXA LX array MRO
MAPCOPY User BMS MAP storage AP APS
MBCA TD buffer control area TDP
MBCB TD buffer control block TDP
MCA SM macro-compatibility control area SM
MCT Monitoring control table MN
MEA Message domain anchor block ME
MLA Markup language domain anchor block ML
MNA Monitor domain global storage - anchor block MN
MNAFB Monitor authorization facility parameter block MN
MNCONNS Monitor field connectors MN
MNDICT Monitor dictionary MN
MNEXC Exception record buffer MN
MNEXLIST User EMP address list MN
MNFLDMAP Excluded/included CICS field map MN
MNPER Performance data buffer MN
MNSMF SMF record buffer MN
MNTMA Transaction monitoring area MN
MNWLMPB MVS WLM performance blocks MN
MPA MP domain anchor block MP
Chapter 10. SDUMP contents and IPCS CICS VERBEXIT keywords 357
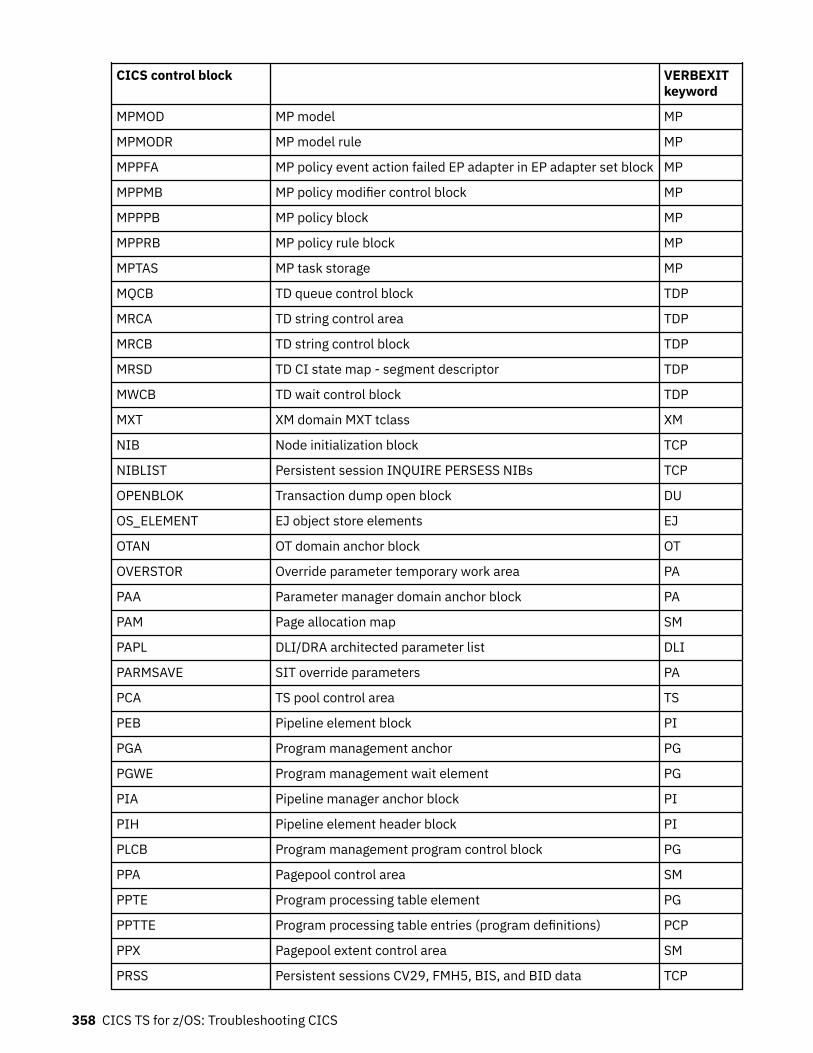
CICS control block VERBEXITkeyword
MPMOD MP model MP
MPMODR MP model rule MP
MPPFA MP policy event action failed EP adapter in EP adapter set block MP
MPPMB MP policy modifier control block MP
MPPPB MP policy block MP
MPPRB MP policy rule block MP
MPTAS MP task storage MP
MQCB TD queue control block TDP
MRCA TD string control area TDP
MRCB TD string control block TDP
MRSD TD CI state map - segment descriptor TDP
MWCB TD wait control block TDP
MXT XM domain MXT tclass XM
NIB Node initialization block TCP
NIBLIST Persistent session INQUIRE PERSESS NIBs TCP
OPENBLOK Transaction dump open block DU
OS_ELEMENT EJ object store elements EJ
OTAN OT domain anchor block OT
OVERSTOR Override parameter temporary work area PA
PAA Parameter manager domain anchor block PA
PAM Page allocation map SM
PAPL DLI/DRA architected parameter list DLI
PARMSAVE SIT override parameters PA
PCA TS pool control area TS
PEB Pipeline element block PI
PGA Program management anchor PG
PGWE Program management wait element PG
PIA Pipeline manager anchor block PI
PIH Pipeline element header block PI
PLCB Program management program control block PG
PPA Pagepool control area SM
PPTE Program processing table element PG
PPTTE Program processing table entries (program definitions) PCP
PPX Pagepool extent control area SM
PRSS Persistent sessions CV29, FMH5, BIS, and BID data TCP
358 CICS TS for z/OS: Troubleshooting CICS
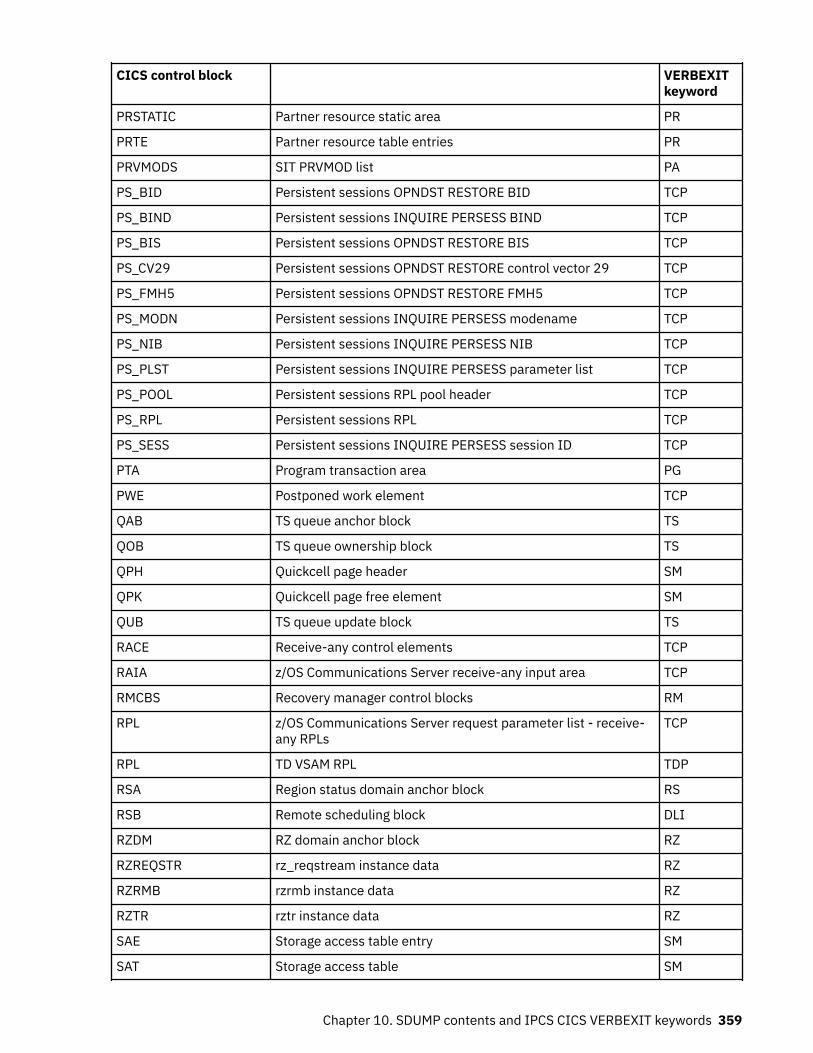
CICS control block VERBEXITkeyword
PRSTATIC Partner resource static area PR
PRTE Partner resource table entries PR
PRVMODS SIT PRVMOD list PA
PS_BID Persistent sessions OPNDST RESTORE BID TCP
PS_BIND Persistent sessions INQUIRE PERSESS BIND TCP
PS_BIS Persistent sessions OPNDST RESTORE BIS TCP
PS_CV29 Persistent sessions OPNDST RESTORE control vector 29 TCP
PS_FMH5 Persistent sessions OPNDST RESTORE FMH5 TCP
PS_MODN Persistent sessions INQUIRE PERSESS modename TCP
PS_NIB Persistent sessions INQUIRE PERSESS NIB TCP
PS_PLST Persistent sessions INQUIRE PERSESS parameter list TCP
PS_POOL Persistent sessions RPL pool header TCP
PS_RPL Persistent sessions RPL TCP
PS_SESS Persistent sessions INQUIRE PERSESS session ID TCP
PTA Program transaction area PG
PWE Postponed work element TCP
QAB TS queue anchor block TS
QOB TS queue ownership block TS
QPH Quickcell page header SM
QPK Quickcell page free element SM
QUB TS queue update block TS
RACE Receive-any control elements TCP
RAIA z/OS Communications Server receive-any input area TCP
RMCBS Recovery manager control blocks RM
RPL z/OS Communications Server request parameter list - receive-any RPLs
TCP
RPL TD VSAM RPL TDP
RSA Region status domain anchor block RS
RSB Remote scheduling block DLI
RZDM RZ domain anchor block RZ
RZREQSTR rz_reqstream instance data RZ
RZRMB rzrmb instance data RZ
RZTR rztr instance data RZ
SAE Storage access table entry SM
SAT Storage access table SM
Chapter 10. SDUMP contents and IPCS CICS VERBEXIT keywords 359
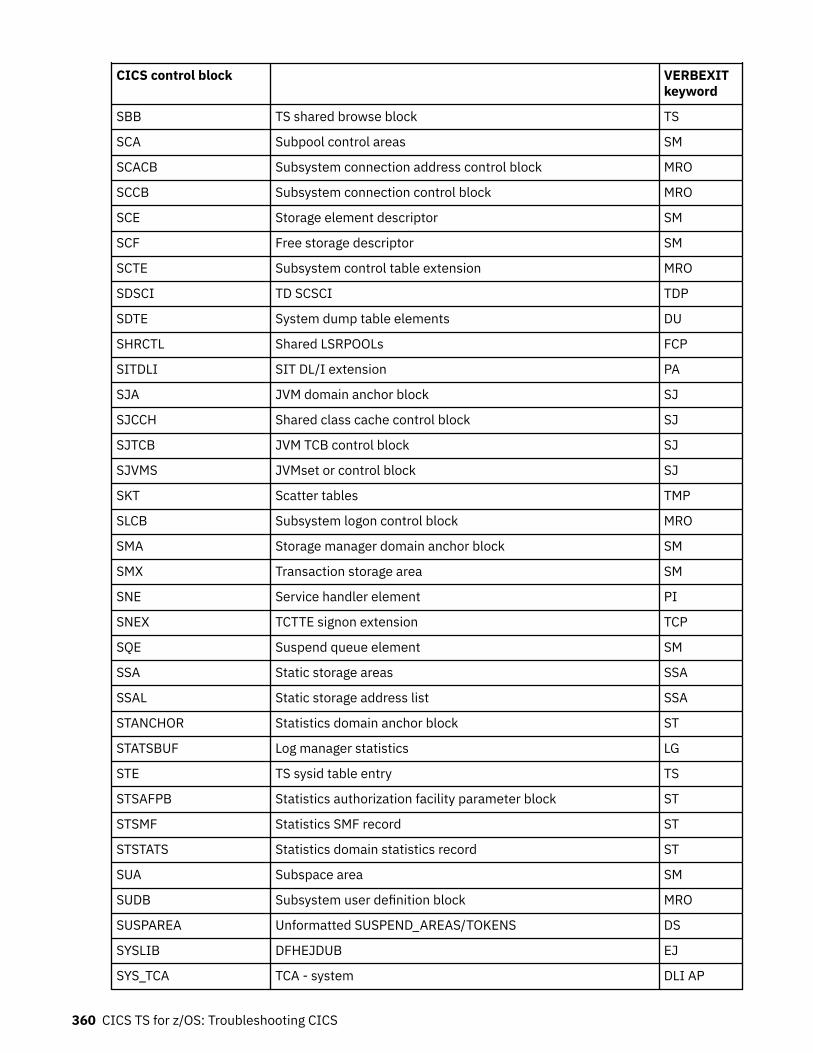
CICS control block VERBEXITkeyword
SBB TS shared browse block TS
SCA Subpool control areas SM
SCACB Subsystem connection address control block MRO
SCCB Subsystem connection control block MRO
SCE Storage element descriptor SM
SCF Free storage descriptor SM
SCTE Subsystem control table extension MRO
SDSCI TD SCSCI TDP
SDTE System dump table elements DU
SHRCTL Shared LSRPOOLs FCP
SITDLI SIT DL/I extension PA
SJA JVM domain anchor block SJ
SJCCH Shared class cache control block SJ
SJTCB JVM TCB control block SJ
SJVMS JVMset or control block SJ
SKT Scatter tables TMP
SLCB Subsystem logon control block MRO
SMA Storage manager domain anchor block SM
SMX Transaction storage area SM
SNE Service handler element PI
SNEX TCTTE signon extension TCP
SQE Suspend queue element SM
SSA Static storage areas SSA
SSAL Static storage address list SSA
STANCHOR Statistics domain anchor block ST
STATSBUF Log manager statistics LG
STE TS sysid table entry TS
STSAFPB Statistics authorization facility parameter block ST
STSMF Statistics SMF record ST
STSTATS Statistics domain statistics record ST
SUA Subspace area SM
SUDB Subsystem user definition block MRO
SUSPAREA Unformatted SUSPEND_AREAS/TOKENS DS
SYSLIB DFHEJDUB EJ
SYS_TCA TCA - system DLI AP
360 CICS TS for z/OS: Troubleshooting CICS
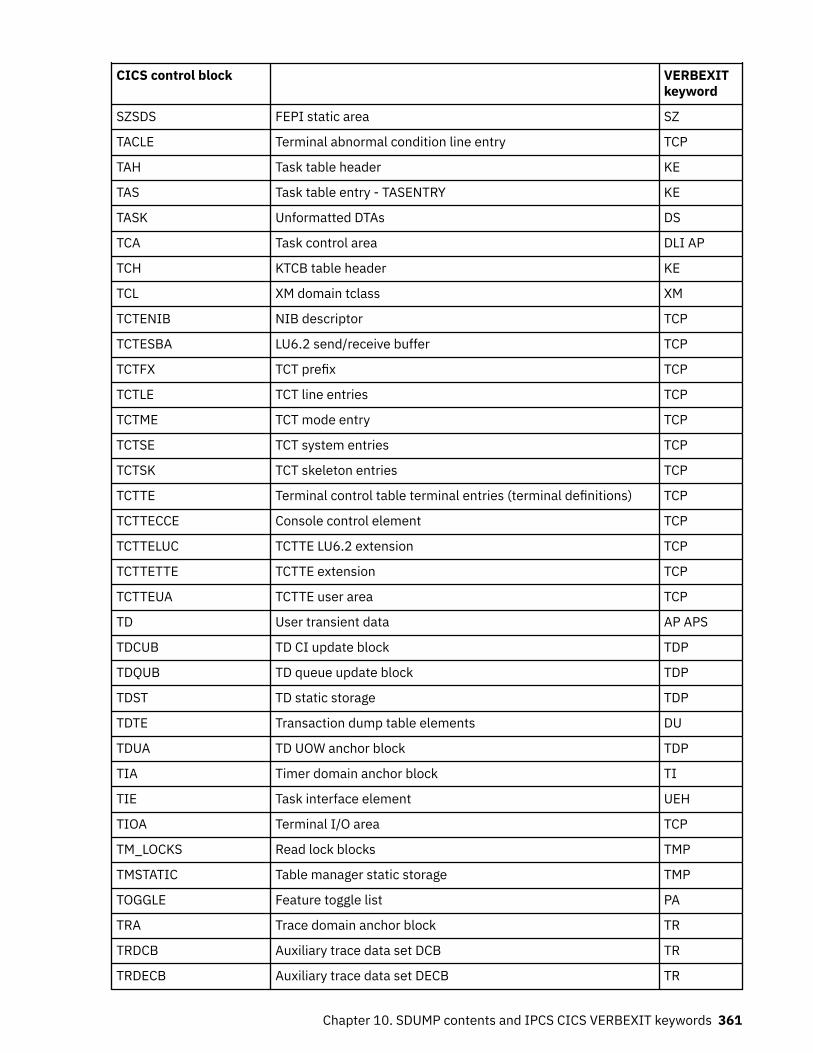
CICS control block VERBEXITkeyword
SZSDS FEPI static area SZ
TACLE Terminal abnormal condition line entry TCP
TAH Task table header KE
TAS Task table entry - TASENTRY KE
TASK Unformatted DTAs DS
TCA Task control area DLI AP
TCH KTCB table header KE
TCL XM domain tclass XM
TCTENIB NIB descriptor TCP
TCTESBA LU6.2 send/receive buffer TCP
TCTFX TCT prefix TCP
TCTLE TCT line entries TCP
TCTME TCT mode entry TCP
TCTSE TCT system entries TCP
TCTSK TCT skeleton entries TCP
TCTTE Terminal control table terminal entries (terminal definitions) TCP
TCTTECCE Console control element TCP
TCTTELUC TCTTE LU6.2 extension TCP
TCTTETTE TCTTE extension TCP
TCTTEUA TCTTE user area TCP
TD User transient data AP APS
TDCUB TD CI update block TDP
TDQUB TD queue update block TDP
TDST TD static storage TDP
TDTE Transaction dump table elements DU
TDUA TD UOW anchor block TDP
TIA Timer domain anchor block TI
TIE Task interface element UEH
TIOA Terminal I/O area TCP
TM_LOCKS Read lock blocks TMP
TMSTATIC Table manager static storage TMP
TOGGLE Feature toggle list PA
TRA Trace domain anchor block TR
TRDCB Auxiliary trace data set DCB TR
TRDECB Auxiliary trace data set DECB TR
Chapter 10. SDUMP contents and IPCS CICS VERBEXIT keywords 361
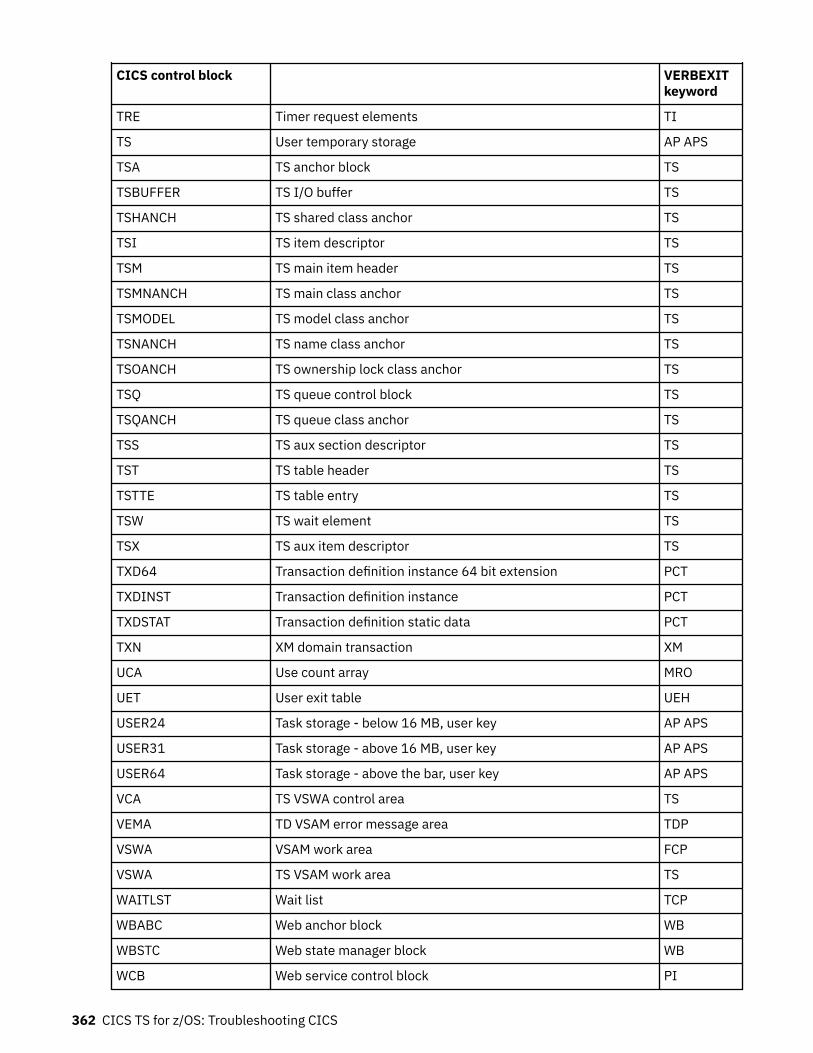
CICS control block VERBEXITkeyword
TRE Timer request elements TI
TS User temporary storage AP APS
TSA TS anchor block TS
TSBUFFER TS I/O buffer TS
TSHANCH TS shared class anchor TS
TSI TS item descriptor TS
TSM TS main item header TS
TSMNANCH TS main class anchor TS
TSMODEL TS model class anchor TS
TSNANCH TS name class anchor TS
TSOANCH TS ownership lock class anchor TS
TSQ TS queue control block TS
TSQANCH TS queue class anchor TS
TSS TS aux section descriptor TS
TST TS table header TS
TSTTE TS table entry TS
TSW TS wait element TS
TSX TS aux item descriptor TS
TXD64 Transaction definition instance 64 bit extension PCT
TXDINST Transaction definition instance PCT
TXDSTAT Transaction definition static data PCT
TXN XM domain transaction XM
UCA Use count array MRO
UET User exit table UEH
USER24 Task storage - below 16 MB, user key AP APS
USER31 Task storage - above 16 MB, user key AP APS
USER64 Task storage - above the bar, user key AP APS
VCA TS VSWA control area TS
VEMA TD VSAM error message area TDP
VSWA VSAM work area FCP
VSWA TS VSAM work area TS
WAITLST Wait list TCP
WBABC Web anchor block WB
WBSTC Web state manager block WB
WCB Web service control block PI
362 CICS TS for z/OS: Troubleshooting CICS
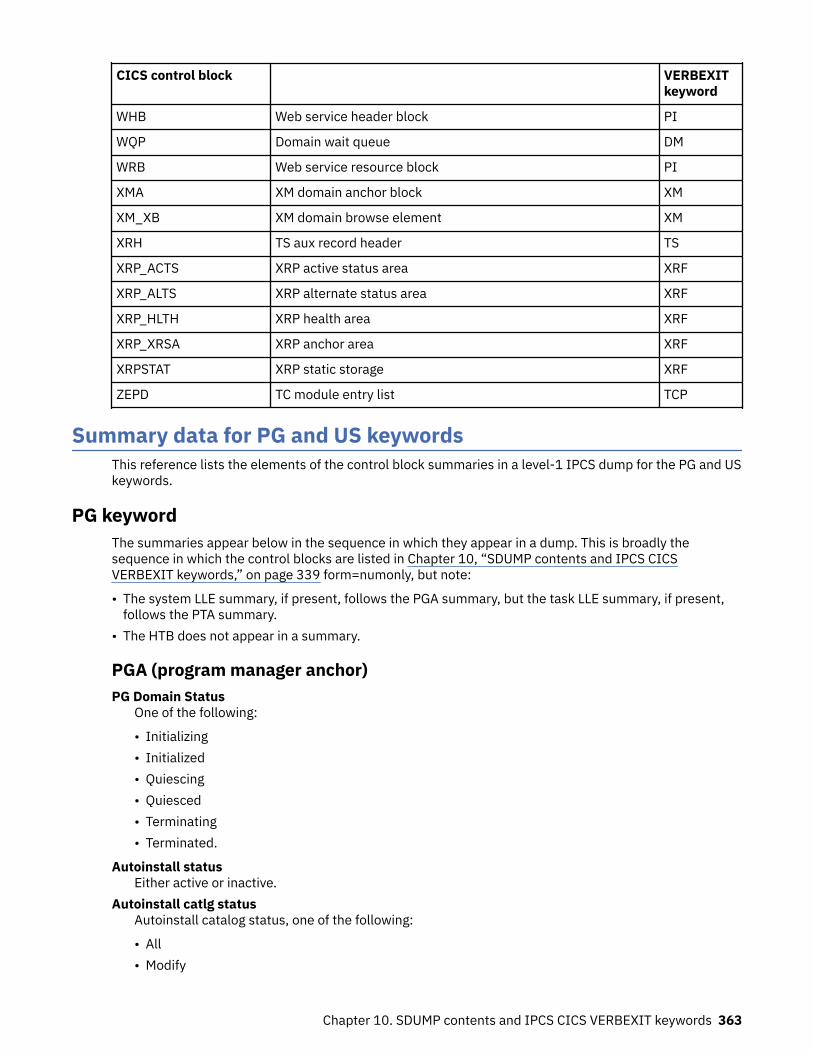
CICS control block VERBEXITkeyword
WHB Web service header block PI
WQP Domain wait queue DM
WRB Web service resource block PI
XMA XM domain anchor block XM
XM_XB XM domain browse element XM
XRH TS aux record header TS
XRP_ACTS XRP active status area XRF
XRP_ALTS XRP alternate status area XRF
XRP_HLTH XRP health area XRF
XRP_XRSA XRP anchor area XRF
XRPSTAT XRP static storage XRF
ZEPD TC module entry list TCP
Summary data for PG and US keywordsThis reference lists the elements of the control block summaries in a level-1 IPCS dump for the PG and USkeywords.
PG keywordThe summaries appear below in the sequence in which they appear in a dump. This is broadly thesequence in which the control blocks are listed in Chapter 10, “SDUMP contents and IPCS CICSVERBEXIT keywords,” on page 339 form=numonly, but note:
• The system LLE summary, if present, follows the PGA summary, but the task LLE summary, if present,follows the PTA summary.
• The HTB does not appear in a summary.
PGA (program manager anchor)PG Domain Status
One of the following:
• Initializing• Initialized• Quiescing• Quiesced• Terminating• Terminated.
Autoinstall statusEither active or inactive.
Autoinstall catlg statusAutoinstall catalog status, one of the following:
• All• Modify
Chapter 10. SDUMP contents and IPCS CICS VERBEXIT keywords 363
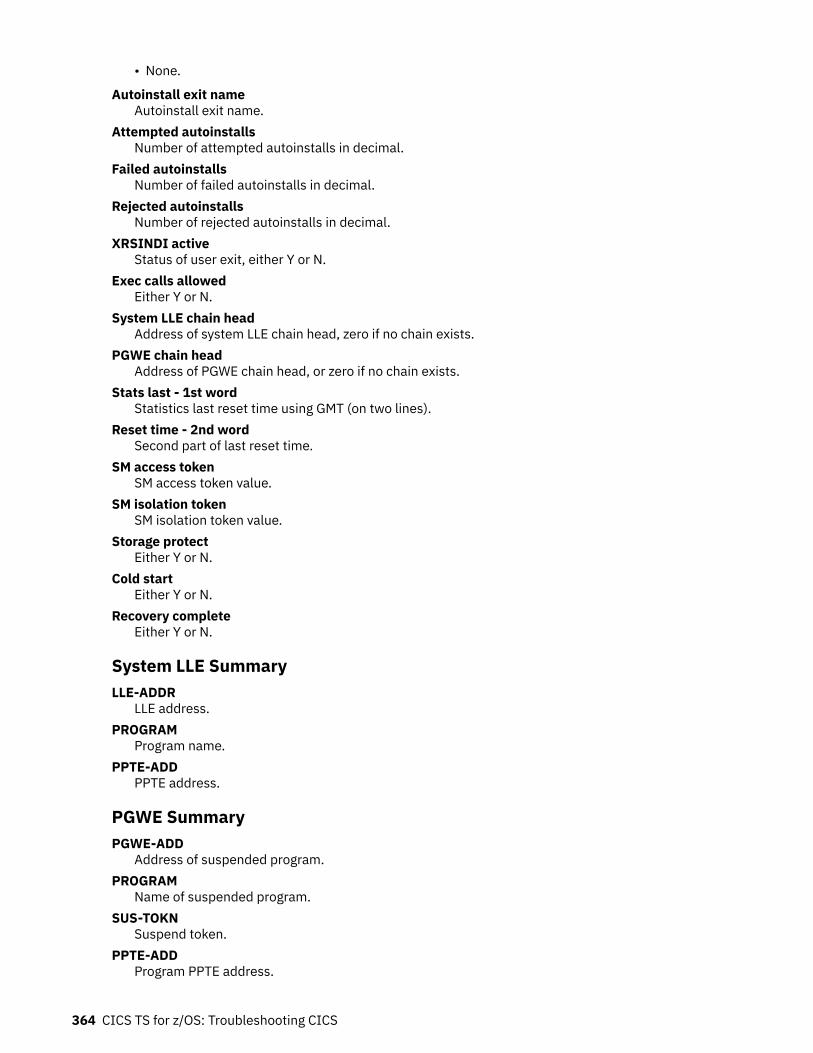
• None.
Autoinstall exit nameAutoinstall exit name.
Attempted autoinstallsNumber of attempted autoinstalls in decimal.
Failed autoinstallsNumber of failed autoinstalls in decimal.
Rejected autoinstallsNumber of rejected autoinstalls in decimal.
XRSINDI activeStatus of user exit, either Y or N.
Exec calls allowedEither Y or N.
System LLE chain headAddress of system LLE chain head, zero if no chain exists.
PGWE chain headAddress of PGWE chain head, or zero if no chain exists.
Stats last - 1st wordStatistics last reset time using GMT (on two lines).
Reset time - 2nd wordSecond part of last reset time.
SM access tokenSM access token value.
SM isolation tokenSM isolation token value.
Storage protectEither Y or N.
Cold startEither Y or N.
Recovery completeEither Y or N.
System LLE SummaryLLE-ADDR
LLE address.PROGRAM
Program name.PPTE-ADD
PPTE address.
PGWE SummaryPGWE-ADD
Address of suspended program.PROGRAM
Name of suspended program.SUS-TOKN
Suspend token.PPTE-ADD
Program PPTE address.
364 CICS TS for z/OS: Troubleshooting CICS
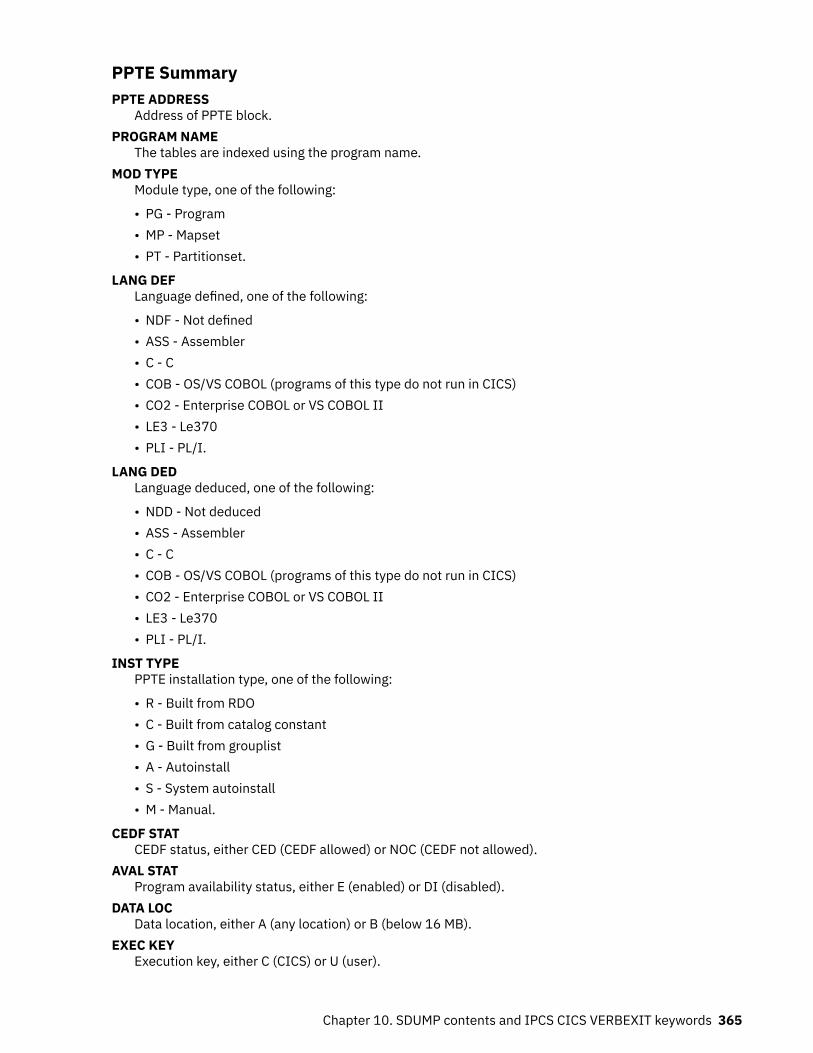
PPTE SummaryPPTE ADDRESS
Address of PPTE block.PROGRAM NAME
The tables are indexed using the program name.MOD TYPE
Module type, one of the following:
• PG - Program• MP - Mapset• PT - Partitionset.
LANG DEFLanguage defined, one of the following:
• NDF - Not defined• ASS - Assembler• C - C• COB - OS/VS COBOL (programs of this type do not run in CICS)• CO2 - Enterprise COBOL or VS COBOL II• LE3 - Le370• PLI - PL/I.
LANG DEDLanguage deduced, one of the following:
• NDD - Not deduced• ASS - Assembler• C - C• COB - OS/VS COBOL (programs of this type do not run in CICS)• CO2 - Enterprise COBOL or VS COBOL II• LE3 - Le370• PLI - PL/I.
INST TYPEPPTE installation type, one of the following:
• R - Built from RDO• C - Built from catalog constant• G - Built from grouplist• A - Autoinstall• S - System autoinstall• M - Manual.
CEDF STATCEDF status, either CED (CEDF allowed) or NOC (CEDF not allowed).
AVAL STATProgram availability status, either E (enabled) or DI (disabled).
DATA LOCData location, either A (any location) or B (below 16 MB).
EXEC KEYExecution key, either C (CICS) or U (user).
Chapter 10. SDUMP contents and IPCS CICS VERBEXIT keywords 365
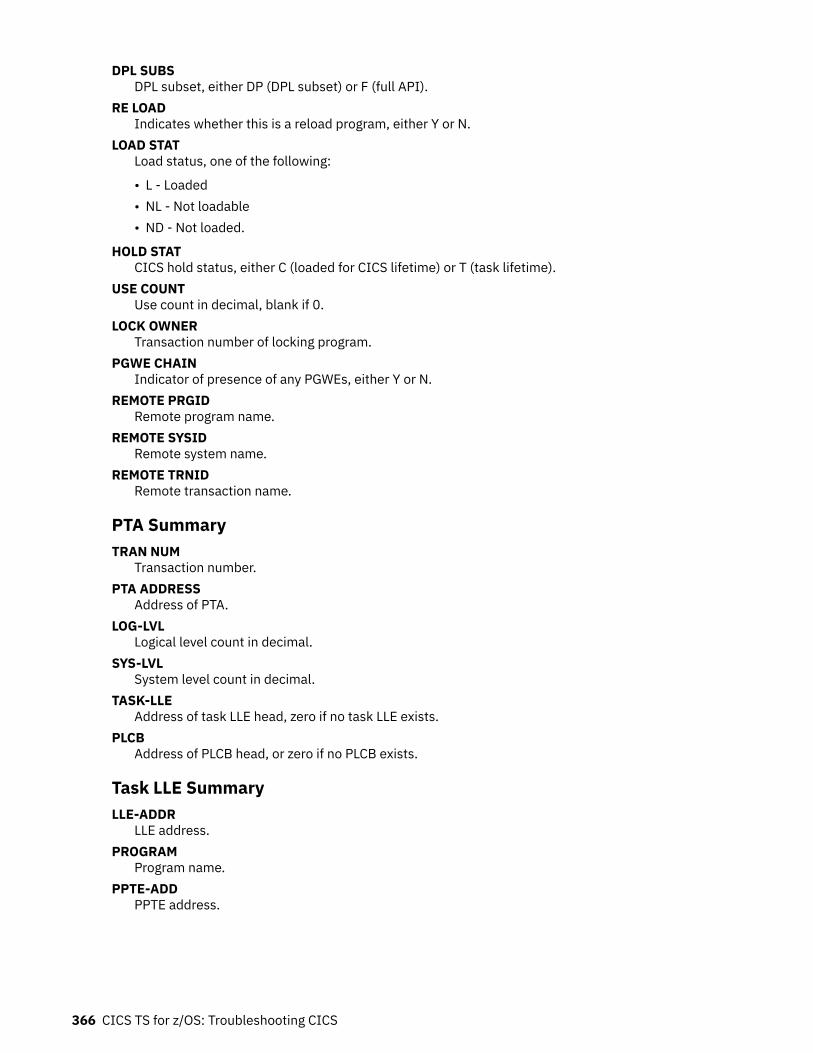
DPL SUBSDPL subset, either DP (DPL subset) or F (full API).
RE LOADIndicates whether this is a reload program, either Y or N.
LOAD STATLoad status, one of the following:
• L - Loaded• NL - Not loadable• ND - Not loaded.
HOLD STATCICS hold status, either C (loaded for CICS lifetime) or T (task lifetime).
USE COUNTUse count in decimal, blank if 0.
LOCK OWNERTransaction number of locking program.
PGWE CHAINIndicator of presence of any PGWEs, either Y or N.
REMOTE PRGIDRemote program name.
REMOTE SYSIDRemote system name.
REMOTE TRNIDRemote transaction name.
PTA SummaryTRAN NUM
Transaction number.PTA ADDRESS
Address of PTA.LOG-LVL
Logical level count in decimal.SYS-LVL
System level count in decimal.TASK-LLE
Address of task LLE head, zero if no task LLE exists.PLCB
Address of PLCB head, or zero if no PLCB exists.
Task LLE SummaryLLE-ADDR
LLE address.PROGRAM
Program name.PPTE-ADD
PPTE address.
366 CICS TS for z/OS: Troubleshooting CICS
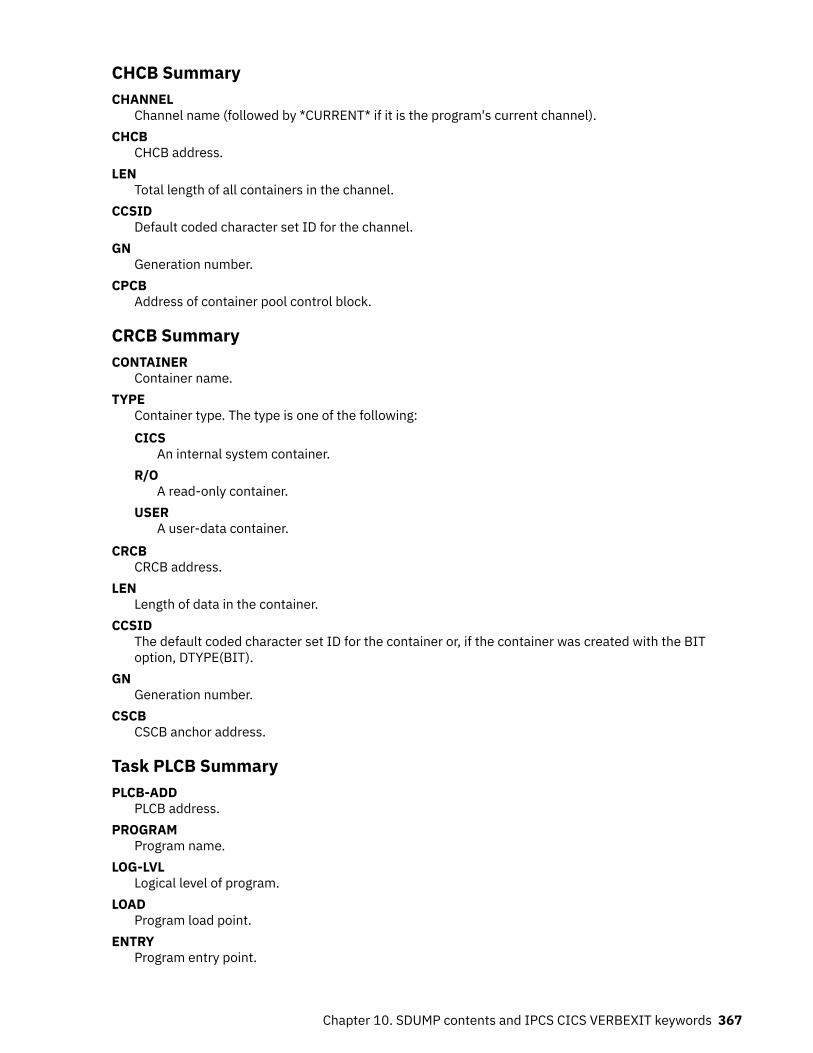
CHCB SummaryCHANNEL
Channel name (followed by *CURRENT* if it is the program's current channel).CHCB
CHCB address.LEN
Total length of all containers in the channel.CCSID
Default coded character set ID for the channel.GN
Generation number.CPCB
Address of container pool control block.
CRCB SummaryCONTAINER
Container name.TYPE
Container type. The type is one of the following:CICS
An internal system container.R/O
A read-only container.USER
A user-data container.CRCB
CRCB address.LEN
Length of data in the container.CCSID
The default coded character set ID for the container or, if the container was created with the BIToption, DTYPE(BIT).
GNGeneration number.
CSCBCSCB anchor address.
Task PLCB SummaryPLCB-ADD
PLCB address.PROGRAM
Program name.LOG-LVL
Logical level of program.LOAD
Program load point.ENTRY
Program entry point.
Chapter 10. SDUMP contents and IPCS CICS VERBEXIT keywords 367
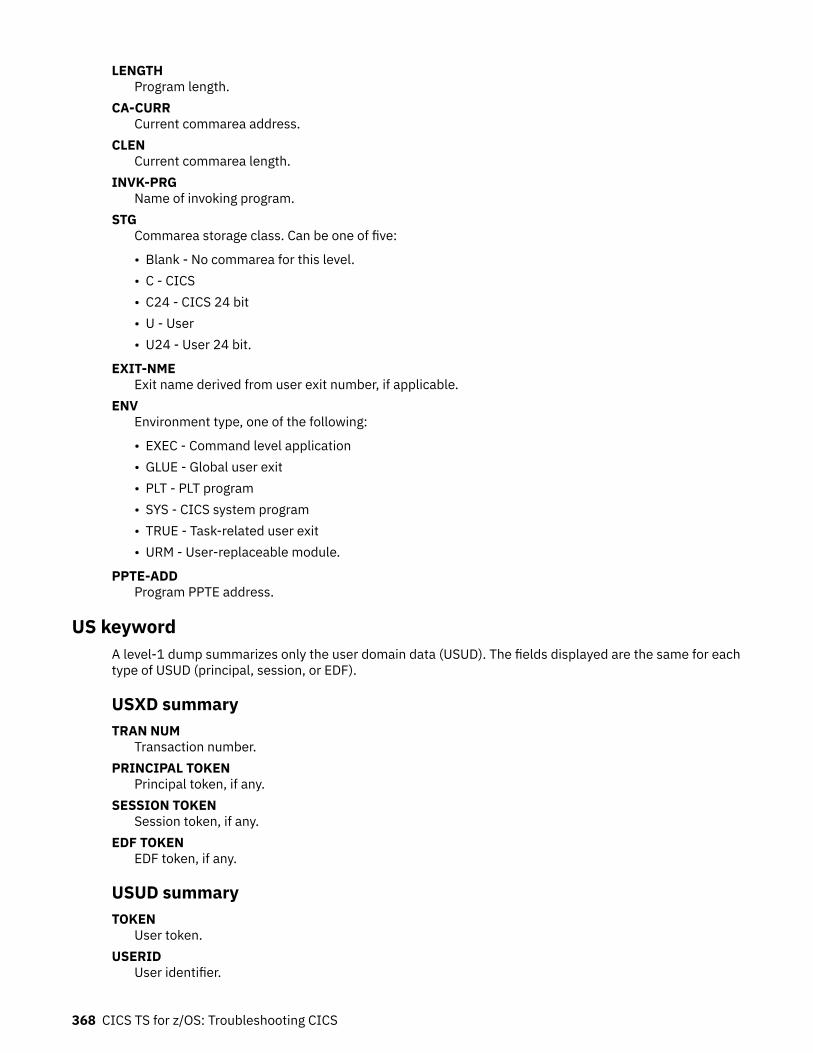
LENGTHProgram length.
CA-CURRCurrent commarea address.
CLENCurrent commarea length.
INVK-PRGName of invoking program.
STGCommarea storage class. Can be one of five:
• Blank - No commarea for this level.• C - CICS• C24 - CICS 24 bit• U - User• U24 - User 24 bit.
EXIT-NMEExit name derived from user exit number, if applicable.
ENVEnvironment type, one of the following:
• EXEC - Command level application• GLUE - Global user exit• PLT - PLT program• SYS - CICS system program• TRUE - Task-related user exit• URM - User-replaceable module.
PPTE-ADDProgram PPTE address.
US keywordA level-1 dump summarizes only the user domain data (USUD). The fields displayed are the same for eachtype of USUD (principal, session, or EDF).
USXD summaryTRAN NUM
Transaction number.PRINCIPAL TOKEN
Principal token, if any.SESSION TOKEN
Session token, if any.EDF TOKEN
EDF token, if any.
USUD summaryTOKEN
User token.USERID
User identifier.
368 CICS TS for z/OS: Troubleshooting CICS
GROUPIDGroup identifier.
ADDCOUNTAdduser use count.
TRNCOUNTTransaction use count.
OPIDOperator identifier.
CLASSESA bitmap expressing the operator classes in order 24 to 1.
PRTYOperator priority.
TIMEOUTTimeout interval in hours and minutes (hh:mm) as defined in the CICS RACF® segment. This specifieswhen an inactive terminal is signed off.
ACEEAddress of ACEE.
XRFSOFFXRF user signon. Can be NOFORCE or FORCE.
USERNAMEUser name.
Chapter 10. SDUMP contents and IPCS CICS VERBEXIT keywords 369

370 CICS TS for z/OS: Troubleshooting CICS
Notices
This information was developed for products and services offered in the U.S.A. This material might beavailable from IBM in other languages. However, you may be required to own a copy of the product orproduct version in that language in order to access it.
IBM may not offer the products, services, or features discussed in this document in other countries.Consult your local IBM representative for information on the products and services currently available inyour area. Any reference to an IBM product, program, or service is not intended to state or imply thatonly that IBM product, program, or service may be used. Any functionally equivalent product, program, orservice that does not infringe any IBM intellectual property rights may be used instead. However, it is theuser's responsibility to evaluate and verify the operation of any non-IBM product, program, or service.
IBM may have patents or pending patent applications covering subject matter described in thisdocument. The furnishing of this document does not grant you any license to these patents. You cansend license inquiries, in writing, to:
IBM Director of Licensing IBM Corporation North Castle Drive, MD-NC119 Armonk, NY 10504-1785 United States of America
For license inquiries regarding double-byte (DBCS) information, contact the IBM Intellectual PropertyDepartment in your country or send inquiries, in writing, to:
Intellectual Property Licensing Legal and Intellectual Property Law IBM Japan Ltd. 19-21, Nihonbashi-Hakozakicho, Chuo-ku Tokyo 103-8510, Japan
INTERNATIONAL BUSINESS MACHINES CORPORATION PROVIDES THIS PUBLICATION “AS IS”WITHOUT WARRANTY OF ANY KIND, EITHER EXPRESS OR IMPLIED, INCLUDING, BUT NOT LIMITEDTO, THE IMPLIED WARRANTIES OF NON-INFRINGEMENT, MERCHANTABILITY, OR FITNESS FOR APARTICULAR PURPOSE. Some jurisdictions do not allow disclaimer of express or implied warranties incertain transactions, therefore this statement may not apply to you.
This information could include technical inaccuracies or typographical errors. Changes are periodicallymade to the information herein; these changes will be incorporated in new editions of the publication.IBM may make improvements and/or changes in the product(s) and/or the program(s) described in thispublication at any time without notice.
Any references in this information to non-IBM websites are provided for convenience only and do not inany manner serve as an endorsement of those websites. The materials at those websites are not part ofthe materials for this IBM product and use of those websites is at your own risk.
IBM may use or distribute any of the information you supply in any way it believes appropriate withoutincurring any obligation to you.
Licensees of this program who want to have information about it for the purpose of enabling: (i) theexchange of information between independently created programs and other programs (including thisone) and (ii) the mutual use of the information which has been exchanged, should contact
IBM Director of Licensing IBM Corporation North Castle Drive, MD-NC119 Armonk, NY 10504-1785United States of America
© Copyright IBM Corp. 1974, 2021 371
Such information may be available, subject to appropriate terms and conditions, including in some cases,payment of a fee.
The licensed program described in this document and all licensed material available for it are provided byIBM under terms of the IBM Customer Agreement, IBM International Programming License Agreement, orany equivalent agreement between us.
The performance data discussed herein is presented as derived under specific operating conditions.Actual results may vary.
Information concerning non-IBM products was obtained from the suppliers of those products, theirpublished announcements or other publicly available sources. IBM has not tested those products andcannot confirm the accuracy of performance, compatibility or any other claims related to non-IBMproducts. Questions on the capabilities of non-IBM products should be addressed to the suppliers ofthose products.
This information contains examples of data and reports used in daily business operations. To illustratethem as completely as possible, the examples include the names of individuals, companies, brands, andproducts. All of these names are fictitious and any similarity to actual people or business enterprises isentirely coincidental.
COPYRIGHT LICENSE:
This information contains sample application programs in source language, which illustrate programmingtechniques on various operating platforms. You may copy, modify, and distribute these sample programsin any form without payment to IBM, for the purposes of developing, using, marketing or distributingapplication programs conforming to the application programming interface for the operating platformfor which the sample programs are written. These examples have not been thoroughly tested underall conditions. IBM, therefore, cannot guarantee or imply reliability, serviceability, or function of theseprograms. The sample programs are provided "AS IS", without warranty of any kind. IBM shall not beliable for any damages arising out of your use of the sample programs.
Programming interface informationCICS supplies some documentation that can be considered to be Programming Interfaces, and somedocumentation that cannot be considered to be a Programming Interface.
Programming Interfaces that allow the customer to write programs to obtain the services of CICSTransaction Server for z/OS, Version 5 Release 6 are included in the following sections of the onlineproduct documentation:
• Developing applications• Developing system programs• CICS TS security• Developing for external interfaces• Application development reference• Reference: system programming• Reference: connectivity
Information that is NOT intended to be used as a Programming Interface of CICS Transaction Server forz/OS, Version 5 Release 6 , but that might be misconstrued as Programming Interfaces, is included in thefollowing sections of the online product documentation:
• Troubleshooting and support• CICS TS diagnostics reference
If you access the CICS documentation in manuals in PDF format, Programming Interfaces that allow thecustomer to write programs to obtain the services of CICS Transaction Server for z/OS, Version 5 Release6 are included in the following manuals:
• Application Programming Guide and Application Programming Reference
372 Notices
• Business Transaction Services• Customization Guide• C++ OO Class Libraries• Debugging Tools Interfaces Reference• Distributed Transaction Programming Guide• External Interfaces Guide• Front End Programming Interface Guide• IMS Database Control Guide• Installation Guide• Security Guide• Supplied Transactions• CICSPlex SM Managing Workloads• CICSPlex SM Managing Resource Usage• CICSPlex SM Application Programming Guide and Application Programming Reference• Java Applications in CICS
If you access the CICS documentation in manuals in PDF format, information that is NOT intended to beused as a Programming Interface of CICS Transaction Server for z/OS, Version 5 Release 6 , but that mightbe misconstrued as Programming Interfaces, is included in the following manuals:
• Data Areas• Diagnosis Reference• Problem Determination Guide• CICSPlex SM Problem Determination Guide
TrademarksIBM, the IBM logo, and ibm.com® are trademarks or registered trademarks of International BusinessMachines Corp., registered in many jurisdictions worldwide. Other product and service names might betrademarks of IBM or other companies. A current list of IBM trademarks is available on the Web atCopyright and trademark information at www.ibm.com/legal/copytrade.shtml.
Adobe, the Adobe logo, PostScript, and the PostScript logo are either registered trademarks ortrademarks of Adobe Systems Incorporated in the United States, and/or other countries.
Apache, Apache Axis2, Apache Maven, Apache Ivy, the Apache Software Foundation (ASF) logo, and theASF feather logo are trademarks of Apache Software Foundation.
Gradle and the Gradlephant logo are registered trademark of Gradle, Inc. and its subsidiaries in the UnitedStates and/or other countries.
Intel, Intel logo, Intel Inside, Intel Inside logo, Intel Centrino, Intel Centrino logo, Celeron, Intel Xeon,Intel SpeedStep, Itanium, and Pentium are trademarks or registered trademarks of Intel Corporation orits subsidiaries in the United States and other countries.
Java and all Java-based trademarks and logos are trademarks or registered trademarks of Oracle and/orits affiliates.
The registered trademark Linux is used pursuant to a sublicense from the Linux Foundation, the exclusivelicensee of Linus Torvalds, owner of the mark on a worldwide basis.
Microsoft, Windows, Windows NT, and the Windows logo are trademarks of Microsoft Corporation in theUnited States, other countries, or both.
Red Hat®, and Hibernate® are trademarks or registered trademarks of Red Hat, Inc. or its subsidiaries inthe United States and other countries.
Notices 373
Spring Boot is a trademark of Pivotal Software, Inc. in the U.S. and other countries.
UNIX is a registered trademark of The Open Group in the United States and other countries.
Zowe™, the Zowe logo and the Open Mainframe Project™ are trademarks of The Linux Foundation.
Terms and conditions for product documentationPermissions for the use of these publications are granted subject to the following terms and conditions.Applicability
These terms and conditions are in addition to any terms of use for the IBM website.Personal use
You may reproduce these publications for your personal, noncommercial use provided that allproprietary notices are preserved. You may not distribute, display or make derivative work of thesepublications, or any portion thereof, without the express consent of IBM.
Commercial useYou may reproduce, distribute and display these publications solely within your enterprise providedthat all proprietary notices are preserved. You may not make derivative works of these publications,or reproduce, distribute or display these publications or any portion thereof outside your enterprise,without the express consent of IBM.
RightsExcept as expressly granted in this permission, no other permissions, licenses or rights are granted,either express or implied, to the publications or any information, data, software or other intellectualproperty contained therein.
IBM reserves the right to withdraw the permissions granted herein whenever, in its discretion, the useof the publications is detrimental to its interest or, as determined by IBM, the above instructions arenot being properly followed.
You may not download, export or re-export this information except in full compliance with allapplicable laws and regulations, including all United States export laws and regulations.
IBM MAKES NO GUARANTEE ABOUT THE CONTENT OF THESE PUBLICATIONS. THE PUBLICATIONSARE PROVIDED "AS-IS" AND WITHOUT WARRANTY OF ANY KIND, EITHER EXPRESSED ORIMPLIED, INCLUDING BUT NOT LIMITED TO IMPLIED WARRANTIES OF MERCHANTABILITY, NON-INFRINGEMENT, AND FITNESS FOR A PARTICULAR PURPOSE.
IBM online privacy statementIBM Software products, including software as a service solutions, (Software Offerings) may use cookies orother technologies to collect product usage information, to help improve the end user experience, to tailorinteractions with the end user or for other purposes. In many cases no personally identifiable informationis collected by the Software Offerings. Some of our Software Offerings can help enable you to collectpersonally identifiable information. If this Software Offering uses cookies to collect personally identifiableinformation, specific information about this offering’s use of cookies is set forth below:
For the CICSPlex SM Web User Interface (main interface):Depending upon the configurations deployed, this Software Offering may use session and persistentcookies that collect each user’s user name and other personally identifiable information for purposesof session management, authentication, enhanced user usability, or other usage tracking or functionalpurposes. These cookies cannot be disabled.
For the CICSPlex SM Web User Interface (data interface):Depending upon the configurations deployed, this Software Offering may use session cookies thatcollect each user's user name and other personally identifiable information for purposes of sessionmanagement, authentication, or other usage tracking or functional purposes. These cookies cannot bedisabled.
For the CICSPlex SM Web User Interface ("hello world" page):Depending upon the configurations deployed, this Software Offering may use session cookies thatcollect no personally identifiable information. These cookies cannot be disabled.
374 Notices
For CICS Explorer:Depending upon the configurations deployed, this Software Offering may use session and persistentpreferences that collect each user’s user name and password, for purposes of session management,authentication, and single sign-on configuration. These preferences cannot be disabled, althoughstoring a user's password on disk in encrypted form can only be enabled by the user's explicit actionto check a check box during sign-on.
If the configurations deployed for this Software Offering provide you, as customer, the ability to collectpersonally identifiable information from end users via cookies and other technologies, you should seekyour own legal advice about any laws applicable to such data collection, including any requirements fornotice and consent.
For more information about the use of various technologies, including cookies, for these purposes, seeIBM Privacy Policy and IBM Online Privacy Statement, the section entitled Cookies, Web Beacons andOther Technologies and the IBM Software Products and Software-as-a-Service Privacy Statement.
Notices 375

376 CICS TS for z/OS: Troubleshooting CICS
Index
Aabbreviated-format trace 96abend codes
transactionAICA 104ASRA 105ASRB 105CICS 104destination 103documentation 104interpretation 104product other than CICS 104user 104
ABEND symptom keyword 5abends
AICA 216DBCTL interface 114dump not made when expected 233exception trace entry 116investigating
the documentation you need 116looking at the symptom string 116symptom keyword 5transaction
AICA 104ASRA 105ASRB 105worksheet 114
access methodBSAM 138determining the type in use 138intersystem communication 138ISMM 138possible reason for stalled system 182z/OS Communications
Serverterminal waits 138
access methodLogical Unit accessresource names
DFHZCRQ1 208resource types
ZC 208SNASystems Network Architecture Logical Unit
terminal control waits 208addressing exception 109AEYD
causes 104AICA abend
probable cause 104PSW 60registers 60
AICA abends 216AID chain
investigating tasks that have not started 246locating in the formatted system dump 246
AIDTRMID (symbolic ID of terminal) 247
AIDTRNID (transaction ID) 247AITM resource name 186ALLOCATE resource type 184, 210ALTPAGE attribute 237, 240, 241ALTSCREEN attribute, 237, 240, 241Any_MBCB resource type 184Any_MRCB resource type 184AP_INIT resource type 184, 185AP_QUIES resource type 185AP_TERM resource type 185APPC (LUTYPE6.2), range of devices 136application programs
storage areas 64arithmetic exceptions
investigating 110ASIS option 237ASRA abend
execution key 61PSW 60registers 60
ASRB abendcauses 105execution key 61PSW 60registers 60
ASRD abendcauses 105PSW 60registers 60
assemblerserrors in output 1
asynchronous processing 145ASYNRESP resource name 185ATCHMSUB, resource name 187ATI (automatic transaction initiation) 143autoinitiated tasks
excessive numbers shown in statistics 12automatic initiate descriptor (AID)
identifying the related task 247identifying the terminal 247investigating tasks that have not started 246
automatic transaction initiation (ATI)task produced no output
looking at the AID chain 246looking at the ICE chain 246resource not available 246task not yet scheduled to start 246
automatic transaction initiation session status 143auxiliary switch 79auxiliary trace
abbreviated-format 96controlling 89extended-format 92interpreting 92, 96loss of trace data 230short-format 95trace entries missing 232
Index 377
auxiliary trace utility program, DFHTUnnn 79AUXTR, system initialization parameter 90AUXTRSW, system initialization parameter 90
BBDAM
cause of ASRB abends 105record locking 168
BMS (basic mapping support)applications not compiled with latest maps 241ASIS option 237attributes of fields
DARK field attribute 249incorrect output to terminal
attributes of fields 249DARK field attribute 249MDT 249modified data tag 249symbolic map 249
maps incorrect 241MDT 249modified data tag 249symbolic map 249
bottlenecksdispatch, suspend and resume cycle 224initial attach to the dispatcher 223initial attach to the transaction manager 223initial dispatch 224
BSAM 138builder parameter set (BPS)
CSFE ZCQTRACE facility 21
Ccapturing dumps 318CCSTWAIT resource type 185CCVSAMWT resource type 185CDB2CONN resource type 185CDB2RDYQ resource type 185CDB2TCB resource type 185CDB2TIME, resource name 197CDBC transaction
DBCTL connection fails 204DBCTL disconnection fails 205
CDBT transaction 205CDSA resource type 185CEBR transaction
checking programming logic 248investigating loops 222
CECI transactionchecking for bad data in a file 248checking programming logic 248investigating loops 222
CEDF transactionchecking programming logic 248investigating loops 222
CEMT INQUIRE TASKHTYPE field 129HVALUE field 130
CEMT INQUIRE UOWENQ commanddeadlock diagnosis 176
CEMT transaction
CEMT transaction (continued)SET PROGRAM NEWCOPY 1use during CICS termination 182
CETR transactionexample screen 87main system trace flag 85selecting components to be traced 87setting special trace levels 87setting standard trace levels 87suppressing standard tracing 85task tracing options 84terminal tracing options 84transaction tracing options 84
CEX2TERM, resource name 187CFDTLRSW resource type 186CFDTPOOL resource type 186CFDTWAIT resource type 186CHANGECB resource name 198CHKSTRM option, startup override 254CHKSTSK option, startup override 254CICS GTF trace
abbreviated-format 96controlling 89extended-format 92interpreting 92, 96no CICS trace entries made 230short-format 95trace entries missing 232
CICS running slowly 7CICS stalled
caused by SOS condition 181during a run 180, 216during initialization 179during quiesce 182during termination 182effect of ICV parameter 181effect of ICVR parameter 181effect of MXT parameter 181exclusive control of volume conflict 181investigating the reason for the stall 6messages 6on cold start 179on emergency restart 179on initial start 179on warm start 179PLT initialization programs 180PLT shutdown programs 183possible causes 6specific regions 12system definition parameters wrong 180
CICS system abendsCICS system dump following 28CSMT log messages 6exception trace entry 116from global trap exit DFHTRAP 315information needed by the Support Center 115investigating 115looking at the symptom string 116messages 6the documentation you need 116
CICS system dumpsdata not formatted correctly 235dispatcher domain storage areas 170dump not made on CICS system abend 233
378 CICS TS for z/OS: Troubleshooting CICS
CICS system dumps (continued)following CICS system abend 28following transaction abend 28formatting
selectivity 42formatting keywords 44formatting levels 44from global trap exit DFHTRAP 315global suppression 19, 234in problem determination 18interactive problem control system (IPCS) 42internal trace table 116investigating CICS system abends 116investigating waits 129, 131kernel domain storage areas
CICS system abends 116error code 121error data 122error type 121failing program 121information provided 118kernel error number 121point of failure 121PSW at time of error 122registers at time of error 122task error information 120task summary 118tasks in error 119waits for resource locks 170
locating the AID chain 246locating the ICE chain 246lock manager domain storage areas 170looking at the symptom string 116precautions using dump formatting keywords 236statistics 35, 36storage manager domain storage areas 146storage violation 253, 256suppression by user exit program 234suppression for individual transactions 19, 234system dump code option 20system dump codes 19temporary storage control blocks 147terminal control storage areas 137
CICS, resource name 192CICS610 dump exit
JOB parameter 44keyword parameter 44
CICS680 dump exitDEF parameter 44
classification of problems 5client program
JCL neededcapturing SYSMDUMPs 318
COBOL programsworking storage 64
common system area (CSA)in transaction dump 61locating the AID chain 246optional features list 61
compilerserrors in output 1
component tracingidentifying codes 86precautions when selecting 231
component tracing (continued)setting special trace levels 87setting standard trace levels 87
control interval (CI)exclusive control deadlock 166exclusive control waits 165
CPI resource name 186CRTE and uppercase translation 238CSAOPFL 61CSASSI2 resource name 185CSATODTU 153CSFE DEBUG transaction
global trap exit DFHTRAP 313storage checking 254TRAP operand 313
CSFE transactionchecking the programming logic 249storage freeze option 249
CSFE ZCQTRACE transactiondumps of builder parameter set 21
CSMT logabend messages 1, 6, 8terminal error messages 8, 136
CSNC resource type 186CSOL_REG resource name 195CWA (common work area) 61
Ddata corruption
bad programming logic 248incorrect mapping to program 248incorrect mapping to terminal
attributes of fields 249DARK field attribute 249MDT 249modified data tag 249symbolic map 249
incorrect records in file 248missing records in file 248possible causes 247
data exception 108DATABUFFERS parameter of FILE resource definition 160Db2 migration considerations
DSNTIAR 113DB2EDISA resource type 186DB2START, resource name 197DBCTL (database control)
abends 114connection fails 204disconnection fails 205immediate disconnection 205orderly disconnection 205waits 204
DBCTL resource type 186, 204DBDXEOT resource type 186DBDXINT resource type 186DBUGUSER resource name 187DCT resource name 196deadlock timeout interval
EXEC CICS WRITEQ TS command 147interval control waits 153task storage waits 146
deadlocks
Index 379
deadlocks (continued)resolving 176resolving in a sysplex 179
DEF parameter of CICS dump exit 44destination control table (DCT)
extrapartition transient data destination 211logically recoverable queues 211
DFHAIIN resource type 186DFHAUXT 79DFHBUXT 79DFHCPIN resource type 186DFHDMPA dump data set 27DFHDMPB dump data set 27DFHEIB
EIBFN 61DFHKC TYPE=DEQ macro 208DFHKC TYPE=ENQ macro 206DFHKC TYPE=WAIT macro
DCI=CICS option 207DCI=LIST option 207DCI=SINGLE option 207DCI=TERMINAL option 207
DFHPRIN resource type 186DFHPTTW resource name 186DFHPTTW resource type 186DFHSIPLT resource name 192DFHSIPLT resource type 187DFHTACB
PSW 62registers 62
DFHTEMP resource name 196DFHTRADS DSECT 314DFHTSSQ resource name 196DFHTUnnn, CICS auxiliary trace utility program 79DFHXCTRA, EXCI service trap 318DFHXCTRD, parameter list 319DFHZARER resource name 198DFHZARL1 resource name 198DFHZARL2 resource name 199DFHZARL3 resource name 199DFHZARL4 resource name 198DFHZARQ1 resource name 198DFHZARR1 resource name 198DFHZCRQ1 resource name 198DFHZDSP resource name 196DFHZEMW1 resource name 198DFHZERH1 resource name 198DFHZERH2 resource name 198DFHZERH3 resource name 199DFHZERH4 resource name 199DFHZIS11 resource name 198DFHZRAQ1 resource name 198DFHZRAR1 resource name 198diagnostic run, of CICS 273DISOSS, communication with CICS 136DISPATCH resource type 187dispatcher
dispatch, suspend and resume cycle 224, 228failure of tasks to get attached 223, 224failure of tasks to get initial dispatch 224, 226functions of gate DSSR 183suspension and resumption of tasks 183tracing the suspension and resumption of tasks 130
dispatcher wait
dispatcher wait (continued)OPEN_DEL 202OPENPOOL 201SSL_POOL 202THR_POOL 202XMCHILD 202XMPARENT 202XP_POOL 203
distributed transaction processing (DTP) 145DLCNTRL resource name 184DLCONECT resource name 184DLSUSPND resource name 186DMATTACH resource type 187DMB (data management block)
load I/O 172DMWTQUEU resource name 184domain identifying codes 86DS_NUDGE resource name 196DSA (dynamic storage area)
current free space 146storage fragmentation 146
DSNTIAR 113DSSR gate of dispatcher domain
tracing the functionsinterpreting the trace table 130
tracing the input and output parameters 130DSTSKDEF dispatcher wait 201DTCHMSUB, resource name 187dump codes
checking the attributes 234DUMPSCOPE option 28, 29RELATED attribute 28, 29storage violation 253system
CICS termination option 20maximum dumps option 20NOSYSDUMP attribute 235options 20RELATED dumping option 20SYSDUMP attribute 235system dumping option 20
transactionCICS termination option 19maximum dumps option 20NOTRANDUMP attribute 234options 19RELATED dumping option 19system dumping option 19TRANDUMP attribute 234transaction dumping option 19
dump data setsattributes 27DFHDMPA 27DFHDMPB 27inquiring on 27setting 27
dump domainXDUREQ global user exit 234
dump tableexamples 37, 39options
loss of additions and changes 20preservation of additions and changes 20
statistics
380 CICS TS for z/OS: Troubleshooting CICS
dump table (continued)statistics (continued)
current count 35reset 36system dumps suppressed 36system dumps taken 35times dump code action taken 35transaction dumps suppressed 35transaction dumps taken 35
suppression of dumping 234system 39temporary entries 20, 36transaction 37
DUMP, system initialization parameter 19, 234dumping in a sysplex 28dumps
CFDT list structure dump 40controlling
dump codes 19dump tables 19examples 37, 39specifying dump options 19using an undefined dump code 36
current dump ID 39dump output is incorrect
data not formatted correctly 235dump not made on abend 233investigating 233some dump IDs missing from the sequence ofdumps 235wrong CICS region 233
formatting 317formatting a CFDT pool dump 65formatting a named counter pool dump 65formatting a shared temporary storage pool dump 66formatting keywords 44formatting levels 44IDs missing from the sequence of dumps 235in a sysplex 28in problem determination 18looking at the symptom string 116named counter list structure dump 40options 19Region Status Server list structure dump 40setting the dumping environment 19shared temporary storage list structure dump 41suppressing 26, 233SYSMDUMP 318
DUMPSCOPE dump code option 28, 29
EEARLYPLT resource name 187ECB (event control block)
EXEC CICS POST command 153finding the address. 207invalid address, task control waits 207posting after task is canceled 256PSTDECB 172storage violations 256valid address, task control waits 208
ECBTCP resource name 184ECDFQEMW resource type 187ECDSA resource type 187
EDF 337EDF (execution diagnostic facility)
investigating loops 222use in investigating no task output 244waits 205
EDF resource type 187EDSA (extended dynamic storage area)
current free space 146storage fragmentation 146
EIBFNin last command identification 63
EKCWAIT resource type 187EMP (event monitoring point) 67ENF resource type 187ENQUEUE on single server resource 208ENQUEUE resource type
BDAM record locking 168ESDS write lock 169KSDS range lock 168VSAM load mode lock 169VSAM record locking 168
enqueue waits 149ENTER TRACENUM command 337entry point, trace 77EPECQEMT resource type 189EPEDTBMT resource type 189ERDSA resource type 189error code 121error data 122error number 121error type 121ESDSA resource type 189EUDSA resource type 189event monitoring point (EMP) 67exceeding the capacity of a log stream 262exception trace
characteristics 80CICS system abends 116destination 80format 80missing trace entries 232purpose 80storage violation 253–255user 80
exception trace entry point 77EXCLOGER resource name 185exclusive control of volume conflict 181EXEC CICS ABEND command 28EXEC CICS DELAY command 153EXEC CICS ENTER TRACENUM command 80EXEC CICS INQUIRE TASK
SUSPENDTYPE field 130SUSPENDVALUE field 130
EXEC CICS POST 153EXEC CICS READ UPDATE command 166EXEC CICS RETRIEVE WAIT command 153EXEC CICS REWRITE command 166EXEC CICS START command 153, 224EXEC CICS STARTBR command 166EXEC CICS WAIT EVENT command 153EXEC CICS WRITE command 166EXEC CICS WRITE MASSINSERT command 166EXEC CICS WRITEQ TD 337EXEC CICS WRITEQ TS command
Index 381
EXEC CICS WRITEQ TS command (continued)NOSUSPEND 147REWRITE option 147
EXEC interface block (EIB)EIBFN 61
EXECADDR resource name 188EXECSTRN resource name 188execution diagnostic facility (EDF)
investigating loops 222execution exception 109Execution key 61exit programming interface (XPI)
correctness of input parameters 1need to observe protocols and restrictions 1problems using 1restrictions in user exits 1suspension and resumption of tasks 183
extended-format trace 92EXTENDEDDS attribute, TYPETERM 237, 240external CICS interface (EXCI)
problem determination 317extrapartition transient data waits 210
FFCACWAIT resource type 189FCBFSUSP resource type 160, 189FCCAWAIT resource type 161, 189FCCFQR resource type 161, 189FCCFQS resource type 161, 189FCCRSUSP resource type 189FCDSESWR resource name 188FCDSLDMD resource name 188FCDSRECD resource name 188FCDSRNGE resource name 188FCDWSUSP resource type 161, 189FCFLRECD resource name 188FCFLUMTL resource name 188FCFRWAIT resource type 162, 189FCFSWAIT resource type 162, 189FCINWAIT resource type 189FCIOWAIT resource type 162, 190FCIRWAIT resource type 162, 190FCPSSUSP resource type 163, 190FCQUIES resource type 163, 190FCRAWAIT resource type 163, 190FCRBWAIT resource type 163, 190FCRDWAIT resource type 164, 190FCRPWAIT resource type 164, 190FCRRWAIT resource type 164, 190FCRVWAIT resource type 164, 190FCSRSUSP resource type 163, 190FCTISUSP resource type 165, 190FCVSWTT 163FCXCPROT resource type 165, 190FCXCSUSP resource type 165, 190FCXCWTT 165FCXDPROT resource type 165, 190FCXDSUSP resource type 165, 190file accesses, excessive 12file control waits
BDAM record locking 168drain of RLS control ACB 164ESDS write lock 169
file control waits (continued)exclusive control conflict 165exclusive control deadlock 166FC environment rebuild 162file state changes 162KSDS range lock 168process non-recoverable requests 163process recoverable requests 163RLS control ACB access 161VSAM buffer unavailable 160VSAM completing update processing 161VSAM I/O 162, 164VSAM I/O waits (RLS) 164VSAM load mode lock 169VSAM record locking by CICS 168VSAM string unavailable 163VSAM transaction IDs 165VSAM upgrade set activity 161, 163wait for dynamic RLS restart 164wait for FC initialization 164
first failure data capture 78, 80FOREVER resource type 191formatting CICS system dumps
keywords 44front end programming interface (FEPI)
dump control option 56FEPI waits 213
function shipping 145
Gglobal catalog data set (GCD)
dump table options 20effect of redefinition on dump table 20
global ENQUEUE 179global trap exit DFHTRAP
actions 315activating 313coding 315deactivating 313information passed to the exit 314installing 313program check handling 313uses 313work area 315
global trap/trace exit 257GTF (generalized trace facility) 79GTFTR, system initialization parameter 90
HHTYPE field 129HVALUE field 130
II/O buffers, transient data
all in use 212IBM Support Center
use of RETAIN database 5ICE (interval control element) 246ICE expiration 153ICETRNID transaction ID 246
382 CICS TS for z/OS: Troubleshooting CICS
ICEXPIRY resource type 191ICEXTOD expiration time 246ICEXTOD value 153ICGTWAIT resource type 136, 153, 191ICMIDNTE resource type 191ICV, system initialization parameter
possible cause of CICS stall 181ICVR, system initialization parameter
non-yielding loops 216possible cause of CICS stall 181tight loops 216
ICWAIT resource type 136, 153, 191incorrect output
abend codes 17application did not work as expected 241BMS mapping
attributes of fields 249DARK field attribute 249MDT 249modified data tag 249symbolic map 249
change log 18checking for bad data in a file 248checking the mapping from file to program 248checking the programming logic
desk checking 248using CEBR 248using CECI 248using CEDF 248using interactive tools 248
databases 68error messages 17files 68incorrect output read from VSAM data set 241investigating 229link-edit maps 17monitoring 67no output obtained
ATI tasks 243, 246disabling the transaction 245explanatory messages 242finding if the task ran 243possible causes 242START PRINTER bit on write control character 243task not in system 243task still in system 242testing the terminal status 242using execution diagnostic facility 244using statistics 245using trace 243
passed information 68printed output wrong 236source listings 17statistics 66symptom keyword 5symptoms 8temporary storage 68terminal data 67terminal output wrong 236trace data wrong 230trace destination wrong 230trace entries missing 231trace output wrong 229transaction inputs and outputs 67
incorrect output (continued)transient data 68unexpected messages 8user documentation 17wrong CICS components being traced 231wrong output obtained
possible causes 247wrong tasks being traced 231
INCORROUT symptom keyword 5INDEXBUFFERS parameter of FILE resource definition 160information sources 17INFORMATION/ACCESS licensed program 5INITIAL resource name 185initialization stall 179INQUIRE UOWENQ command
deadlock diagnosis 178INQUIRE_ resource name 198interactive problem control system (IPCS)
analyzing CICS system dumps 42CICS dump exit 44CICS system abends 116
internal traceabbreviated-format 96controlling 89extended-format 92interpreting 92, 96short-format 95trace entries missing 232
internal trace table 78intersystem communication (ISC)
poor performance 224waits 145, 210
interval controlelement 153performance considerations 224waits
deadlock timeout interval 153systematic investigation 153
interval control element (ICE) 246INTTR, system initialization parameter 90IRC (interregion communication)
poor performance 224waits 145, 210
IRLINK resource type 136, 191IS_ALLOC 191IS_ERROR 191IS_INPUT 191IS_PACE 192IS_RECV 192IS_SESS 192ISMM access method 138ISSSENQP resource name 188
Jjob control language (JCL)
for capturing SYSMDUMPs 318job log 60JOB parameter of CICS dump exit 44JOURNALS resource name 188JVM_POOL dispatcher wait 201JVM_POOL resource name 187JVMTHRED 192
Index 383
KKatakana terminals
mixed English and Katakana characters 240KCADDR resource name 188KCCOMPAT resource type
resource namesCICS 207LIST 207SINGLE 207SUSPEND 207TERMINAL 136, 207
KCSTRNG resource name 188kernel domain
information given in dumperror code 121error data 122error table 120error type 121failing program 121, 127kernel error number 121point of failure 121PSW at time of error 122registers at time of error 122storage addressed by PSW 123storage addressed by registers 123task error information 120task summary 118tasks in error 119, 120
linkage stackidentifying the task in error 126
stack entries 61storage areas 118
keyword parameter of CICS dump exit 44
Llast command identification 63last statement identification 63LATE_PLT resource name 187LATE_PLT resource type 192LG_DEFER resource type 192LG_FORCE resource type 192LG_MGRST resource name 193LGDELALL resource type 192LGDELRAN resource type 192LGENDBLK resource type 192LGENDCRS resource type 192LGFREVER resource type 193LGHARTBT resource type 193LGREDBLK resource type 193LGREDCRS resource type 193LGSTRBLK resource type 193LGSTRCRS resource type 193LGWRITE resource type 193link editor
errors in output 1LIST resource name 192, 199LMQUEUE resource name 170, 184loader domain (LD)
program storage map 127waits 169
lock manager domain (LM)involvement in waits
lock manager domain (LM) (continued)involvement in waits (continued)
identifying the lock owning task 170investigating 170
log manager problemscategories of 261corrupt system log 273diagnostic run, of CICS 273exceeding the capacity of a log stream 262problems in the MVS logger 267
logon rejection 237LOGSTRMS resource name 188LOOP symptom keyword 5loops
CICS detected 215debugging with interactive tools 222identifying the point of entry 219in CICS code 215investigating
looking at the evidence 219techniques 217, 220
investigating by modifying your program 222looking at the transaction dump 219non-yielding
characteristics 216finding the cause 220investigating 217possible causes 220
possible causes 215potential consumption of storage 146potential consumption of temporary storage 149symptom keyword 5symptoms
CICS region stalled 12CPU usage high 12reduced activity at terminals 12repetitive output 12short on storage 12system busy symbol 12
tightcharacteristics 216finding the cause 220identifying an instruction in the loop 219investigating 217possible causes 220
types 215using CEBR 222using CECI 222using CEDF 222using the CEMT transaction 12using trace 218, 220yielding
characteristics 217finding the cause 221investigating 220possible causes 221
LOT_ECB resource name 186lowercase characters 237LU waits
z/OS Communications Server access method in use138
LUsstatus 142
LUTYPE6.1, range of devices 136
384 CICS TS for z/OS: Troubleshooting CICS
MMAXSOCKETS resource name 195MBCB_xxx resource type 193MESSAGE symptom keyword 5messages
absence of, when expected 12CICS under stress 13destination
CDBC 8CSMT 6, 8CSTL 8
DFHAC2008 245DFHSM0131 13, 227DFHSM0133 13, 227DFHSM0604 227DFHSM0606 13, 227DFHSR0601 6DFHST0001 6dump formatting error 254preliminary checks 1short on storage 227sources 1storage violation 251, 253symptom keyword 5terminal errors 137transaction abend 103transaction disabled 245unexpected 8, 237
MISCELANEOUS resource name 195missing trace entries 231module index
in transaction dump 62MONITOR POINT command 67monitoring point 67MPDQEMW resource type 193MQseries resource type 193MRCB_xxx resource type 193MRO waits 145, 210MROQUEUE resource name 186MSBRETRN, resource name 187multiregion operation waits 145, 210MVS ABEND macro 105MVS console
CICS termination message 6MVS logger availability check 262MVS RESERVE locking
CICS system stalls 181effect on CICS performance 228transient data extrapartition waits 210VSAM I/O waits 162
MXT (maximum tasks value)effect on performance 224kernel task summary 119possible cause of CICS stall 181reason for task failing to start 7waits 172XM_HELD resource type 172
MXT resource type 193MXT, system initialization parameter
possible cause of CICS stall 181
NNetView 182networks
messages 136preliminary checks 1
NODEJSL resource type 193NOSYSDUMP, system dump code attribute 235NOTRANDUMP, transaction dump code attribute 234
OONC/RPC 5open transaction environment
TCB stealing 202OPEN_DEL resource name 187OPEN_DEL wait 202OPENPOOL dispatcher wait 201OPENPOOL resource name 187OPENPOOL wait 201operation exceptions 108output
absence when it is expected 11none obtained
ATI tasks 243, 246disabling the transaction 245explanatory messages 242finding if the task ran 243possible causes 242START PRINTER bit on write control character 243task not in system 243task still in system 242testing the terminal status 242using execution diagnostic facility 244using statistics 245using trace 243
repetitive 12wrong
possible causes 247
PPAGESIZE attribute, TYPETERM 241PC, communication with CICS 136PERFM symptom keyword 5performance
bottlenecksdispatch, suspend and resume cycle 224initial attach to the dispatcher 223initial attach to the transaction manager 223initial dispatch 224
dispatch, suspend and resume cycle 228extrapartition transient data 228initial attach to the dispatcher 224initial attach to the transaction manager 224initial dispatch to the dispatcher 226interval control delays 224MXT limit 224performance class monitoring 226poor
at peak system load times 7finding the bottleneck 223investigating 222
Index 385
performance (continued)poor (continued)
lightly loaded system 7possible causes 7symptom keyword 5symptoms 7, 11, 13, 222
remote system status 224system loading 228task control statistics 225task priority 227task timeout interval 228terminal status 224use of MVS RESERVE 228using trace 226
performance class monitoring 226PIIS resource type 193PL/I application programs
locating the DSA chain 64preliminary checks
all functions fully exercised 1any changes to the application 1any previous success 1changes since last success
hardware modification 1initialization procedure 1modified application 1new application 1PTF (program temporary fix) 1resource definitions 1
common programming errors 1failure at specific times of day 1intermittent failures 1interval control waits 152messages 1network related errors
many terminals 1single terminal 1
no previous success 1output from assembler 1output from compiler 1output from link editor 1output from translator 1reproducible problems
caused by poor system definition 1related to applications 1related to system loading 1
terminal waits 136printers
no output 243printed output wrong 236, 240unexpected line feeds and form feeds 241write control character 243
privileged operation 108PRM resource name 186problem classification 5problem determination
dumps 317FEPI waits 213service trap 318trace 317
problems in the MVS logger 267processors
usage high 12PROFILE definition
PROFILE definition (continued)SCRNSIZE attribute 237, 240, 241UCTRAN attribute 237
program checkaddressing exception 109arithmetic exceptions
investigating 110cause of ASRA abends 105data exception 108execution exception 109investigating 105next sequential instruction 105operation exception 108outside of CICS 108possible types 108privileged operation 108protection exception 109specification exception 109system interrupts 110wild branch 108
program check and abend tracing 81program control waits 169program interrupt code (PIC)
addressing exception 109arithmetic exceptions 110data exception 108execution exception 109interpretation 108operation exception 108privileged operation 108protection exception 109specification exception 109system interrupts 110
program list table (PLT)programs executing during CICS quiesce 183transient data waits 180, 210
PROGRAM resource type 193, 194program status word (PSW) 105programming errors
preliminary checks 1programs
information for current transaction 62loops 215problems with loading 169representation in linkage stack 126storage 62
protection exceptiondealing with 111possible causes 111
PSB (program specification block)load I/O 172
PSINQECB resource name 198PSOP1ECB resource name 198PSOP2ECB resource name 198PSTDECB 172PSUNBECB resource name 198PSW (program status word)
at time of error 122CICS system abends 122description 105finding the offset of a failing instruction 127format 127in transaction abend control block 62in transaction dump 60
386 CICS TS for z/OS: Troubleshooting CICS
PTF level 127
QQR TCB 334QSAM 210, 228QUIESCE resource name 187quiesce stall 182
RRCP_INIT resource type 194RDSA resource type 194RECEIVE resource name 195record locking
BDAM data sets 168VSAM data sets 168
registersat time of error 122CICS system abends 122data addressed at the time of error 123in transaction abend control block 62in transaction dump 60
registers at last EXEC command 61RELATED dump code attribute 28, 29Remote abend indicator 60resource definition online (RDO)
ALTER mapset 1ALTER program 1ALTER transaction 1DEFINE mapset 1DEFINE program 1DEFINE transaction 1INSTALL option 1
resource names*CTLACB* 190AITM 186ASYNRESP 185ATCHMSUB 187CDB2TIME 197CEX2TERM 187CHANGECB 198, 208CICS 192CPI 186CSASSI2 185CSOL_REG 195DB2START 197DBUGUSER 187DCT 196, 210DFH_STATE_TOKEN 197DFHPTTW 186DFHSIPLT 192DFHTEMP 196DFHTSSQ 196DFHXMTA 191DFHZARER 198DFHZARL1 198DFHZARL2 199, 208DFHZARL3 199, 208DFHZARL4 198DFHZARQ1 198DFHZARR1 198DFHZCRQ1 198
resource names (continued)DFHZDSP 196DFHZEMW1 198, 208DFHZERH1 198DFHZERH2 198DFHZERH3 199DFHZERH4 199, 208DFHZIS11 198DFHZRAQ1 198, 208DFHZRAR1 198, 208DLCNTRL 184DLCONECT 184DLSUSPND 186DMWTQUEU 184DS_NUDGE 196DTCHMSUB 187EARLYPLT 187ECBTCP 184EXCLOGER 185EXECADDR 188EXECSTRN 188FCDSESWR 188FCDSLDMD 188FCDSRECD 188FCDSRNGE 188FCFLRECD 188FCFLUMTL 188file ID 187, 189, 190First 16 chars of the associated NODEJSAPP name 193GETWAIT 193HVALUE 130INITIAL 185INQ_ECB 198INQUIRE 208inquiring during task waits 129ISSSENQP 188JOURNALS 188JVM_POOL 187KCADDR 188KCSTRNG 188LATE_PLT 187LG_MGRST 193LIST 192, 199LMQUEUE 170, 184LOGSTRMS 188LOT_ECB 186MAXSOCKETS 195message queue ID 197MISCELANEOUS 195module name 191MROQUEUE 186MSBRETRN 187OPEN_DEL 187OPENPOOL 187PRM 186program ID 193, 194PSINQECB 198, 208PSOP1ECB 198PSOP2ECB 198, 208PSUNBECB 198, 208QUIESCE 187RECEIVE 195RZCBNOTI 193SEND 195
Index 387
resource names (continued)SHUTECB 185SINGLE 187, 192SIPDMTEC 184SMSYRE 195SMSYSTEM 195SO_LISTN 195SO_LTEPTY 195SO_LTERDC 195SO_NOWORK 195SOCLOSE 195STATIC 189STE 195STP_DONE 185summary of possible values 183SUSPEND 192SUSPENDVALUE 130SYSIDNT/session ID 191TCLASS 195TCTTETI value 184TCTVCECB 185TDNQ 188TERMINAL 192terminal ID 191transient data queue name 184, 193, 196, 210–212TSBUFFER 196TSEXTEND 196TSIO 196TSNQ 188TSQUEUE 197TSSTRING 197TSWBUFFR 197VSMSTRNG 185WTO 195XM_HELD 193XMCHILD 187XMPARENT 187ZC_ZGRP 196ZGRPECB 185ZSLSECB 198, 208
resource typesALLOCATE 184, 210Any_MBCB 184, 212Any_MRCB 184, 212AP_INIT 184, 185AP_QUIES 185AP_TERM 185CCSTWAIT 185CCVSAMWT 185CDB2CONN 185, 203CDB2RDYQ 185, 203CDB2TCB 185CDSA 146, 185CFDTLRSW 186CFDTPOOL 186CFDTWAIT 186CSNC 186DB2_INIT 203DB2CDISC 203DB2EDISA 186, 203DBCTL 186, 204DBDXEOT 186DBDXINT 186DFHAIIN 186
resource types (continued)DFHCPIN 186DFHPRIN 186DFHPTTW 186DFHSIPLT 187DISPATCH 187DMATTACH 187DS_ASSOC 201DSTSKDEF 201ECDFQEMW 187ECDSA 146, 187EDF 187, 205EKCWAIT 187, 206ENF 187ENQUEUE 188, 211EPECQEMT 189EPEDTBMT 189ERDSA 146, 189ESDSA 189EUDSA 146, 189FCACWAIT 189FCBFSUSP 160, 189FCCAWAIT 161, 189FCCFQR 161, 189FCCFQS 161, 189FCCRSUSP 189FCDWSUSP 161, 189FCFRWAIT 162, 189FCFSWAIT 162, 189FCINWAIT 189FCIOWAIT 162, 190FCIRWAIT 162, 190FCPSSUSP 163, 190FCQUIES 163, 190FCRAWAIT 163, 190FCRBWAIT 163, 190FCRDWAIT 164, 190FCRPWAIT 164, 190FCRRWAIT 164, 190FCRVWAIT 164, 190FCSRSUSP 163, 190FCTISUSP 165, 190FCXCPROT 165, 190FCXCSUSP 165, 190FCXDPROT 165, 190FCXDSUSP 165, 190FOREVER 191HTYPE 130ICEXPIRY 191ICGTWAIT 153, 191ICMIDNTE 191ICWAIT 153, 191inquiring during task waits 129IRLINK 136, 191KC_ENQ 162, 206, 208KCCOMPAT 136, 192, 206, 207LATE_PLT 192LG_DEFER 192, 205LG_FORCE 192, 193, 205LG_RETRY 205LGDELALL 192, 205LGDELRAN 192, 205LGENDBLK 192, 206LGENDCRS 192, 206
388 CICS TS for z/OS: Troubleshooting CICS
resource types (continued)LGFREVER 206LGHARTBT 193, 206LGREDBLK 193, 206LGREDCRS 193, 206LGSTRBLK 193, 206LGSTRCRS 193, 206LGWRITE 193, 206MBCB_xxx 193, 212MPDQEMW 193MQseries 193, 204MRCB_xxx 193, 212MXT 193NODEJSL 193PIIS 193PROGRAM 193, 194RCP_INIT 194RDSA 194RMCLIENT 194RMI 194RMUOWOBJ 194RZRSTRAN 195RZRSTRIG 195SDSA 195SMPRESOS 195SOCKET 195SODOMAIN 195STP_TERM 195SUCNSOLE 195summary of possible values 183SUSPENDTYPE 130TCP_NORM 196TCP_SHUT 196TCTVCECB 196TD_INIT 196, 210TD_READ 196, 212TDEPLOCK 196, 210TDIPLOCK 196, 211TIEXPIRY 196TRANDEF 196TSAUX 147, 196TSBUFFER 148TSEXTEND 148TSIO 148TSIOWAIT 196TSMAINLM 148, 196TSPOOL 148, 197TSQUEUE 148TSSHARED 148, 197TSSTRING 148TSWBUFFR 148UDSA 146, 197USERWAIT 197, 207WEB_ECB 197WMQ_INIT 197, 204WMQCDISC 197, 204XRGETMSG 197ZC 198ZC_ZCGRP 198, 208ZC_ZGCH 198, 208ZC_ZGIN 198, 208ZC_ZGRP 198, 208ZC_ZGUB 198, 208ZCIOWAIT 198, 208
resource types (continued)ZCZGET 199, 208ZCZNAC 199, 208ZXQOWAIT 199, 208ZXSTWAIT 199
resourcesDBCTL 204definition errors 1inquiring during task waits 129locks
investigating waits 170log manager 205names 183storage manager 146task control 206temporary storage 147types 183
RETAIN problem management systemdata base 5symptom keywords 5using INFORMATION/ACCESS 5
RLS (record-level sharing)taking SMSVSAM dumps 30
RMCLIENT resource type 194RMI resource type 194RMUOWOBJ resource type 194RP TCB 334RZRSTRAN resource type 195RZRSTRIG resource type 195
SSAA (storage accounting area)
chains 252overlays 252, 254, 256
SCRNSIZE attribute, PROFILE 237, 240, 241SDSA resource type 195SEND resource name 195SENDSIZE attribute, TYPETERM 240service trap 318short-format trace 95SHUTECB resource name 185SINGLE resource name 192SINGLE, resource name 187SIPDMTEC resource name 184SLIP trap, MVS 271SMPRESOS resource type 195SMSVSAM problems
taking RLS-related dumps 30SMSYRE resource name 195SMSYSTEM resource name 195SNA
process status 138session state with task 144
SO_LISTN resource name 195SO_LTEPTY resource name 195SO_LTERDC resource name 195SO_NOWORK resource name 195SOCKET resource type 195SOCLOSE resource name 195SODOMAIN resource type 195SOS (short on storage)
caused by looping code 12potential cause of waits 146
Index 389
SOSMVS dispatcher wait 201SPCTR, system initialization parameter 86SPCTRxx, system initialization parameter 86specification exception 109SSL_POOL dispatcher wait 201SSL_POOL wait 202START PRINTER bit on write control character 243statistics
autoinitiated tasks 12file accesses 12task control
number of times at MXT 225use in investigating no task output 245
STE resource name 195stealing TCBs 201STGRCVY system initialization parameter 257STNTR, system initialization parameter 86STNTRxx, system initialization parameter 86storage
consumption by looping tasks 146fragmentation 146task subpool summary 146waits
fragmentation of free storage 146too little free storage 146
storage chain checkingby CICS 252forcing 254
storage freeze 65storage manager domain (SM)
conditional storage requests 146request for too much storage 146suspend queue summary 146trace levels 3 and 4 86unconditional storage requests 146waits
likely causes 146storage recovery 257storage violations
CHKSTRM option 254CHKSTSK option 254CICS detected 252CICS system dump 253exception trace entry 253–255forcing storage chain checking 254looking at the overlaying data 254possible causes 257programming errors 257reason for invalid ECB address 207symptoms 251TIOA 252undetected 256user task storage element 252using CSFE DEBUG 254using trace 254, 256
STP_DONE resource name 185STP_TERM resource type 195STRFIELD option
CONVERSE command 243SEND command 243
STRINGS parameter of FILE resource definition 163structured fields 243SUCNSOLE resource type 195suppressing dumps
suppressing dumps (continued)CICS dump table options 233MVS Dump Analysis Elimination (DAE) 26
SUSPEND resource name 192SUSPENDTYPE field 130SUSPENDVALUE field 130symbolic maps 249symptom strings
in transaction dump 60problem determination 116RETAIN database search 60RETAIN search keywords 116
symptomsCICS has stopped running 6CICS running slowly 7incorrect output 8keywords 5loops 11, 12low priority tasks will not start 7no output is obtained 7poor performance 7, 11, 13, 222tasks do not complete 7tasks in a wait state 11tasks take a long time to complete 7tasks take a long time to start 7terminal activity is reduced 7use in classifying problems 6waits 11
SYSDUMP, system dump code attribute 235SYSIDNT/session ID resource name 191SYSMDUMPs, capturing 318sysplex
MVS console commands 31problem determination 28resolving deadlocks 179
system busy symbol 12system initialization
AUXTR parameter 90AUXTRSW parameter 90defining component tracing requirements 86defining the tracing status 90DUMP parameter 19, 234global suppression of CICS system dumps 19GTFTR parameter 90INTTR parameter 90setting transaction dump data set attributes 27SPCTR parameter 86SPCTRxx parameter 86STNTR parameter 86STNTRxx parameter 86suppressing standard tracing 85SYSTR parameter 85TRTABSZ parameter 90USERTR parameter 90
system loading, effect on performance 228system task waits
intentional 213system trace entry point 77SYSTR, system initialization parameter 85
Ttask control
waits
390 CICS TS for z/OS: Troubleshooting CICS
task control (continued)waits (continued)
causes 207failure of task to DEQUEUE on resource 208invalid ECB address 207resource type KCCOMPAT 207unconditional ENQUEUE on single server resource208valid ECB address 208
task control area (TCA)in transaction dump 61system area 61user area 61
task control blocks 334task termination
abnormal 1task tracing
precautions when choosing options 231special 84standard 84suppressed 84
task-related user exit (TRUE) 334tasks
abnormal termination 1ATI, no output produced
looking at the AID chain 246looking at the ICE chain 246
conversation state with terminal 144dispatch, suspend and resume cycle 224, 228dispatching priority 227error data 122exclusive control deadlock 166failure during MVS service call 122failure to complete 7, 8, 11failure to get attached to the dispatcher 223, 224failure to get attached to the transaction manager 223,224failure to get initial dispatch 224, 226failure to start 7, 11failure under the CICS RB 122identifying the AID 247identifying the ICE 246identifying, in remote region 145in a wait state 11in error
identified in linkage stack 126information in kernel domain storage areas 120lock owning
identifying a lock being waited on 170looping
consumption of storage 146, 149identifying the limits 221
MXT limit 224PSW at time of error 122reason for remaining on the AID chain 246registers at time of error 122runaway
detection by MVS 122non-yielding loops216tight loops 216
session state with SNA 144slow running 7, 228subpool summary 146
tasks (continued)summary in kernel storage 118suspended
inquiring on 11investigating 129
task error information 120timeout interval 228tracing 84, 231transfer from ICE to AID chain 246waits
CICS Db2 203DBCTL 204definition of wait state 129EDF 205log manager 205maximum task conditions 172on locked resources 170online investigation 129stages in resolving wait problems 129storage manager 146suspension and resumption of tasks 183system 183task control 206techniques for investigating 129temporary storage 147user 183using the formatted CICS system dump 129using trace 129WebSphere MQ 204
TCLASS resource type 195TCP_NORM resource type 196TCP_SHUT resource type 196TCSESUSF 246TCTTE (terminal control table terminal entry)
in transaction dump 62TCTTE chain, in terminal waits 142TCTVCECB resource name 185TCTVCECB resource type 196TD_INIT resource type 196TD_READ resource type 196TDEPLOCK resource type 196TDIPLOCK resource type 196TDNQ resource name 188temporary storage
conditional requests for auxiliary storage 147consumption by looping tasks 149current free space 149repetitive records 12summary 149unconditional requests for auxiliary storage 147waits
unallocated space close to exhaustion 149terminal control program (TCP) 142TERMINAL resource name 192terminal tracing
precautions when choosing options 231special 84standard 84suppressed 84
terminal waitsaccess method 138autoinstall program not loaded 137communications server access method in use
Index 391
terminal waits (continued)communications server access method in use (continued)
z/OS Communications Server process status138
Communications server access method in useSNAcommunications server exit ids 139
CREATESESS(NO) in TYPETERM definition 143error action by TACP or NACP turned off 137finding the access method 138finding the type of terminal 137HANDLE CONDITION coded incorrectly 137interregion communication 145intersystem communication 138, 145ISMM access method 138multiregion operation
identifying tasks in remote regions 145identifying the remote region 145
operator failing to respond 136preliminary considerations 136printer powered off 136printer run out of paper 136SNA access method in use
automatic transaction initiation session status 143node session status 144task conversation state with terminal 144task session state with SNA 144task status 143
SNA access method in usez/OS CommunicationsServer
TCTTE chain 142Systems network architecture access in use
SNA terminal control 208z/OS Communications Server access method in
useNACP error codes 138SNA sense codes 138terminal status 142
terminal waitsSNA LU control waitsterminal control waits 208
terminal waitsz/OS Communications ServerSNA access method in usez/OS Communications
Serverterminal control status 142
terminalsATI status 247control characters in data stream 237conversation state with task 144error messages 137incorrect mapping of data
attributes of fields 249DARK field attribute 249MDT 249modified data tag 249symbolic map 249
incorrect output displayeddata formatted wrongly 240debugging tools 236early data overlaid by later data 240investigating 236logon rejection message 237mixed English and Katakana characters 240some data not displayed 240unexpected messages and codes 237unexpected uppercase or lowercase characters 237
terminals (continued)incorrect output displayed (continued)
wrong data values displayed 240no output 7, 8range of characteristics 136reduced activity 7, 11, 12repetitive output 12status
effect on performance 224terminal control program 142terminals
no input accepted 8unresponsive 136
terminationabnormal 1system dump code option 20transaction dump code option 19
termination stall 182THR_POOL dispatcher wait 201THR_POOL wait 202TIEXPIRY resource type 196trace
abbreviated format 61abbreviated-format 96calls to other programs 68CICS Communications Server exit
destinations 230identifying the terminal 82
CICS Communications Server exitSNAterminal waits 144
CICS SNA exitadvantages 81description 81destination 81
communications server bufferdescription 82
Communications Server bufferinvestigating logon rejection 237
communications server bufferSNAdestination 82
Communications Server SNA bufferterminal waits 144
controllingauxiliary trace 89CICS GTF trace 89internal trace 89special task tracing 84special trace levels 87standard task tracing 84standard trace levels 87suppressing standard tracing 85suppressing task tracing 84
data provided on callexception trace 80
destinations 230DFHTUnnn. trace utility program 79DSSR functions
input and output parameters 130interpreting the trace table 130
entries from AP domain 93entries missing 231example of formatted entry 93extended-format 61, 92formatted entry
392 CICS TS for z/OS: Troubleshooting CICS
trace (continued)formatted entry (continued)
interpretation string 92interval 93kernel task number 93standard information string 93task number 93time of entry 93
formatting 91from global trap exit DFHTRAP 315global trap exit DFHTRAP 313GTFTR, system initialization parameter 90in problem determination
loops 218, 220poor performance 226storage violations 254, 256
incorrect output frominvestigating 229trace entries missing 231wrong CICS components being traced 231wrong data captured 230wrong destination 230wrong tasks being traced 231
interpretinguser entries 98
interpreting user entries 98INTTR, system initialization parameter 90investigating waits
setting the tracing options 130last command identification 63last statement identification 63levels 68, 80logic of selectivity 85main system trace flag 85, 230points 68program check and abend 81repetitive output 12storage manager trace levels 86suspension and resumption of tasks
interpreting the trace table 130trace entry point 77trace points 319use in investigating no task output 243user
checking programming logic 249user exception trace entries 80USERTR, system initialization parameter 90
trace (CICS ONC RPC)information 336
trace utility program, DFHTUnnn 79TRANDEF resource type 196TRANDUMP, transaction dump code attribute 234transaction abends
abend codedocumentation 104interpretation 104
AICA 104, 216ASRA 105ASRB 105collecting the evidence 103CSMT log messages 6dump not made when expected 233from global trap exit DFHTRAP 315getting a transaction dump 103
transaction abends (continued)investigating 103last command identification 63last statement identification 63message 103messages 1, 8storage violation 253system dump following 28transaction dump following 28worksheet 114
transaction deadlocksin a sysplex 179resolving 176
transaction dumpsabbreviated-format trace table 61accompanying transaction abends 103common system area 61CSA 61CSAOPFL 61CWA 61destination 27DFHTACB 62, 63dump not made on transaction abend 233exec interface structure 61EXEC interface user structure 61execution key 61extended-format trace table 61following transaction abend 28formatting
selectivity 42in problem determination 18interpretation 60job log for 60kernel stack entries 61last command identification 63last statement identification 63locating program data 64module index 62optional features list 61program information 62program storage 62PSW 60registers 60registers at last EXEC command 61remote abend indicator 60statistics 35storage violation 253suppression for individual transactions 19, 234symptom string 60system EXEC interface block 61task control area, system area 61task control area, user area 61TCTTE 62transaction abend control block 62, 63transaction dump code options 19transaction dump codes 19transaction storage 62transaction work area 61
transaction list table (XLT) 182transaction manager
failure of tasks to get initial attach 224transaction routing 145transaction storage
in transaction dump 62
Index 393
transaction tracingprecautions when choosing options 231special 84standard 84suppressed 84
transactionsdisabling 245evidence that it ran
program control 244program load 244task attach 244task dispatch 244
no output producedATI tasks 243, 246disabling the transaction 245explanatory messages 242finding if the task ran 243investigating 242possible causes 242START PRINTER bit on write control character 243task not in system 243task still in system 242testing the terminal status 242using execution diagnostic facility 244using statistics 245using trace 243
wrong output producedinvestigating 247possible causes 247
transient dataextrapartition destinations
performance considerations 228I/O buffers 212intrapartition destinations 211recoverable queues 211VSAM I/O 212VSAM strings 212waits
during initialization 210extrapartition 210I/O buffer contention 212I/O buffers all in use 212intrapartition 211resource names 210resource types 210VSAM I/O 212VSAM strings all in use 212
translatorerrors in output 1
trap, DFHXCTRA 318traps 313TRTABSZ, system initialization parameter 90TSAUX resource type 147, 196TSBUFFER resource name 148, 196TSEXTEND resource name 148, 196TSIO resource name 148, 196TSIOWAIT resource type 196TSMAINLM resource name 148TSMAINLM resource type 196TSNQ resource name 188TSPOOL resource type 148, 197TSQUEUE resource name 148, 197TSSHARED resource type 148, 197TSSTRING resource name 148, 197
TSWBUFFR resource name 148, 197TYPETERM definition
ALTPAGE attribute 237, 240, 241ALTSCREEN attribute 237, 240, 241ATI status 247CREATESESS(NO), cause of terminal waits 143EXTENDEDDS attribute 237, 240PAGESIZE attribute 241SENDSIZE attribute 240UCTRAN attribute 237
UUCTRAN attribute
PROFILE definition 237TYPETERM definition 237
UDSA resource type 197uppercase characters 237user
trace entry point 77user task waits 183user tracing
checking programming logic 249exception trace entries 80interpretation 98
USERTR, system initialization parameter 90USERWAIT resource type 197
VVARY NET,INACT command 182VSAM
data buffers 160exclusive control deadlock 166exclusive control of control interval 165I/O waits 162, 164incorrect data read from file 241index buffers 160strings 163transaction ID waits 165waits
exclusive control deadlock 166file state changes 162for exclusive control of control interval 165for VSAM transaction ID 165I/O 162record locking by CICS 168VSAM buffer unavailable 160VSAM string unavailable 163
VSAM READ SEQUENTIAL 166VSAM READ UPDATE 166VSAM WRITE DIRECT 166VSAM WRITE SEQUENTIAL 166VSMSTRNG resource name 185
WWAIT symptom keyword 5waits
CICS Db2 203DBCTL 204deadlock timeout interval 153definition 11, 129
394 CICS TS for z/OS: Troubleshooting CICS
waits (continued)EDF 205enqueue 149FEPI 213file control 158interregion communication 145, 210intersystem communication 145, 210interval control 152investigating 128lock manager 170log manager 205maximum task conditions 172online investigation
finding the resource 129program control 169SNA LU control 208stages in resolving 129storage manager 146suspension and resumption of tasks 183symptom keyword 5symptoms 11task control 206techniques for investigating 129temporary storage 147terminal 136transient data
during initialization 210extrapartition 210I/O buffer contention 212I/O buffers all in use 212intrapartition 211VSAM I/O 212VSAM strings all in use 212
using the formatted CICS system dump 129, 131using trace
setting the tracing options 130WebSphere MQ 204
waits in the dispatcher 201WCC (write control character) 243WEB_ECB resource type 197WMQ_INIT resource type 197WMQCDISC resource type 197working storage, COBOL programs 64write control character (WCC) 243WTO resource name 195
XXDUREQ, dump domain global user exit 234XLT (transaction list table) 182XM_HELD resource type 172XMCHILD resource name 187XMCHILD wait 202XMPARENT resource name 187XMPARENT wait 202XP_POOL dispatcher wait 201XP_POOL wait 203XRGETMSG resource type 197XRPUTMSG resource type 197
Zz/OS Communications Server 334
ZC resource type 198ZC_ZCGRP resource type 198ZC_ZGCH resource type 198ZC_ZGIN resource type 198ZC_ZGRP resource name 196ZC_ZGRP resource type 198ZC_ZGUB resource type 198ZCIOWAIT 198ZCZGET resource type 199ZCZNAC resource type 199ZGRPECB resource name 185ZSLSECB resource name 198ZXQOWAIT resource type 199ZXSTWAIT resource type 199
Index 395

396 CICS TS for z/OS: Troubleshooting CICS


IBM®