Network Troubleshooting Tools - NYLXS
366
-
Upload
khangminh22 -
Category
Documents
-
view
0 -
download
0
Transcript of Network Troubleshooting Tools - NYLXS


Network Troubleshooting Tools


Network Troubleshooting Tools
Joseph D. Sloan
Beijing • Cambridge • Farnham • Köln • Paris • Sebastopol • Taipei • Tokyo

Network Troubleshooting Toolsby Joseph D. Sloan
Copyright © 2001 O’Reilly & Associates, Inc. All rights reserved.Printed in the United States of America.
Published by O’Reilly & Associates, Inc., 101 Morris Street, Sebastopol, CA 95472.
Editors: Robert Denn and Mike Loukides
Production Editor: Catherine Morris
Cover Designer: Emma Colby
Printing History:
August 2001: First Edition.
Nutshell Handbook, the Nutshell Handbook logo, and the O’Reilly logo are registeredtrademarks of O’Reilly & Associates, Inc. Many of the designations used by manufacturers andsellers to distinguish their products are claimed as trademarks. Where those designationsappear in this book, and O’Reilly & Associates, Inc. was aware of a trademark claim, thedesignations have been printed in caps or initial caps. The association between the image ofa basilisk and network troubleshooting is a trademark of O’Reilly & Associates, Inc.
While every precaution has been taken in the preparation of this book, the publisher assumesno responsibility for errors or omissions, or for damages resulting from the use of theinformation contained herein.
Library of Congress Cataloging-in-Publication Data
Sloan, Joe.Network Troubleshooting Tools / Joe Sloan.--1st ed. p. cm.Includes bibliographical references and index.ISBN 0-596-00186-X1. Computer networks--Maintenance and repair 2. Computer networks--Management.I. Title.
TK5105.5 .S557 2001004.6--dc21 2001035422
[C] [3/02]

vOracle 8i Internal Services for Waits, Latches, Locks, and Memory, eMatter Edition
Copyright © 2007 O’Reilly & Associates, Inc. All rights reserved.
Table of Contents
Preface ..................................................................................................................... ix
1. Network Management and Troubleshooting .................................. 1General Approaches to Troubleshooting ....................................................... 2
Need for Troubleshooting Tools ..................................................................... 5
Troubleshooting and Management ................................................................. 6
2. Host Configurations ............................................................................... 18Utilities ............................................................................................................ 20
System Configuration Files ............................................................................ 35
Microsoft Windows ........................................................................................ 42
3. Connectivity Testing .............................................................................. 45Cabling ............................................................................................................ 45
Testing Adapters ............................................................................................ 52
Software Testing with ping ............................................................................ 53
Microsoft Windows ........................................................................................ 69
4. Path Characteristics ............................................................................... 71Path Discovery with traceroute ..................................................................... 71
Path Performance ........................................................................................... 79
Microsoft Windows ........................................................................................ 97
5. Packet Capture ....................................................................................... 100Traffic Capture Tools ................................................................................... 100
Access to Traffic ........................................................................................... 101

vi Table of Contents
Oracle 8i Internal Services for Waits, Latches, Locks, and Memory, eMatter EditionCopyright © 2007 O’Reilly & Associates, Inc. All rights reserved.
Capturing Data ............................................................................................. 103
tcpdump ....................................................................................................... 104
Analysis Tools .............................................................................................. 118
Packet Analyzers .......................................................................................... 124
Dark Side of Packet Capture ....................................................................... 129
Microsoft Windows ...................................................................................... 131
6. Device Discovery and Mapping ...................................................... 134Troubleshooting Versus Management ........................................................ 134
Device Discovery ......................................................................................... 137
Device Identification .................................................................................... 144
Scripts ........................................................................................................... 149
Mapping or Diagramming ........................................................................... 151
Politics and Security ..................................................................................... 156
Microsoft Windows ...................................................................................... 158
7. Device Monitoring with SNMP ........................................................ 160Overview of SNMP ....................................................................................... 160
SNMP-Based Management Tools ................................................................. 165
Non-SNMP Approaches ............................................................................... 190
Microsoft Windows ...................................................................................... 190
8. Performance Measurement Tools ................................................... 194What, When, and Where ............................................................................. 194
Host-Monitoring Tools ................................................................................. 196
Point-Monitoring Tools ................................................................................ 197
Network-Monitoring Tools .......................................................................... 205
RMON ........................................................................................................... 216
Microsoft Windows ...................................................................................... 219
9. Testing Connectivity Protocols ......................................................... 224Packet Injection Tools ................................................................................. 224
Network Emulators and Simulators ............................................................. 235
Microsoft Windows ...................................................................................... 238
10. Application-Level Tools ....................................................................... 239Application-Protocols Tools ........................................................................ 239
Microsoft Windows ...................................................................................... 254

Table of Contents vii
Oracle 8i Internal Services for Waits, Latches, Locks, and Memory, eMatter EditionCopyright © 2007 O’Reilly & Associates, Inc. All rights reserved.
11. Miscellaneous Tools ............................................................................. 255Communications Tools ................................................................................ 255
Log Files and Auditing ................................................................................. 260
NTP ............................................................................................................... 267
Security Tools ............................................................................................... 269
Microsoft Windows ...................................................................................... 270
12. Troubleshooting Strategies ................................................................ 273Generic Troubleshooting ............................................................................. 273
Task-Specific Troubleshooting .................................................................... 277
A. Software Sources ................................................................................... 289
B. Resources and References ................................................................. 305
Index .................................................................................................................... 317


ixThis is the Title of the Book, eMatter Edition
Copyright © 2007 O’Reilly & Associates, Inc. All rights reserved.
Preface
Preface
This book is not a general introduction to network troubleshooting. Rather, it isabout one aspect of troubleshooting—information collection. This book is a tuto-rial introduction to tools and techniques for collecting information about com-puter networks. It should be particularly useful when dealing with networkproblems, but the tools and techniques it describes are not limited to trouble-shooting. Many can and should be used on a regular basis regardless of whetheryou are having problems.
Some of the tools I have selected may be a bit surprising to many. I stronglybelieve that the best approach to troubleshooting is to be proactive, and the tools Idiscuss reflect this belief. Basically, if you don’t understand how your networkworks before you have problems, you will find it very difficult to diagnose prob-lems when they occur. Many of the tools described here should be used beforeyou have problems. As such, these tools could just as easily be classified as net-work management or network performance analysis tools.
This book does not attempt to catalog every possible tool. There are simply toomany tools already available, and the number is growing too rapidly. Rather, thisbook focuses on the tools that I believe are the most useful, a collection thatshould help in dealing with almost any problem you see. I have tried to includepointers to other relevant tools when there wasn’t space to discuss them. In manycases, I have described more than one tool for a particular job. It is extremely rarefor two tools to have exactly the same features. One tool may be more useful thananother, depending on circumstances. And, because of the differences in oper-ating systems, a specific tool may not be available on every system. It is worthknowing the alternatives.

x Preface
This is the Title of the Book, eMatter EditionCopyright © 2007 O’Reilly & Associates, Inc. All rights reserved.
The book is about freely available Unix tools. Many are open source tools cov-ered by GNU- or BSD-style licenses. In selecting tools, my first concern has beenavailability. I have given the highest priority to the standard Unix utilities. Next inpriority are tools available as packages or ports for FreeBSD or Linux. Toolsrequiring separate compilation or available only as binaries were given a lowerpriority since these may be available on fewer systems. In some cases, PC-onlytools and commercial tools are noted but are not discussed in detail. The bulk ofthe book is specific to Ethernet and TCP/IP, but the general approach and many ofthe tools can be used with other technologies.
While this is a book about Unix tools, at the end of most of the chapters I haveincluded a brief section for Microsoft Windows users. These sections are includedsince even small networks usually include a few computers running Windows.These sections are not, even in the wildest of fantasies, meant to be definitive. Theyare provided simply as starting points—a quick overview of what is available.
Finally, this book describes a wide range of tools. Many of these tools aredesigned to do one thing and are often overlooked because of their simplicity.Others are extremely complex tools or sets of tools. I have not attempted to pro-vide a comprehensive treatment for each tool discussed. Some of these tools canbe extremely complex when used to their fullest. Some have manuals and otherdocumentation that easily exceed the size of this book. Most have additional docu-mentation that you will want to retrieve once you begin using them.
My goal is to make you aware of the tools and to provide you with enough infor-mation that you can decide which ones may be the most useful to you and inwhat context so that you can get started using the tools. Each chapter centers on acollection of related tasks or problems and tools useful for dealing with thesetasks. The discussion is limited to features that are relevant to the problem beingdiscussed. Consequently, the same tool may be discussed in several placesthroughout the book.
Please be warned: the suitability or behavior of these tools on your system cannotbe guaranteed. While the material in this book is presented in good faith, neitherthe author nor O’Reilly & Associates makes any explicit or implied warranty as tothe behavior or suitability of these tools. We strongly urge you to assess and eval-uate these tool as appropriate for your circumstances.
AudienceThis book is written primarily for individuals new to network administration. Itshould also be useful to those of you who have inherited responsibility for existingsystems and networks set up by others. This book is designed to help you acquirethe additional information you need to do your job.

Preface xi
This is the Title of the Book, eMatter EditionCopyright © 2007 O’Reilly & Associates, Inc. All rights reserved.
Unfortunately, the book may also appeal to crackers. I truly regret this and wishthere were a way to present this material to limit its worth to crackers. I never meta system manager or network administrator who wasn’t overworked. Timedevoted to security is time stolen from providing new services to users orimproving existing services. There simply is no valid justification for cracking. Ican only hope that the positive uses for the information I provide will outweighthe inevitable malicious uses to which it may be put. I would feel much better ifcrackers would forego buying this book.
In writing this book, I attempted to write the sort of book I often wished I hadwhen I was learning. Certainly, there are others who are more knowledgeable andbetter prepared to write this book. But they never seemed to get around to it.They have written pieces of this book, a chapter here or a tutorial there, for whichI am both immensely thankful and greatly indebted.
I see this book as a work in progress. I hope that the response to it will makefuture expanded editions possible. You can help by sending me your commentsand corrections. I would particularly like to hear about new tools and about howyou have used the tools described here to solve your problems. Perhaps some ofthe experts who should have written this book will share their wisdom! While Ican’t promise to respond to your email, I will read it. You can contact me throughO’Reilly Book Support at [email protected].
OrganizationThere are 12 chapters and 2 appendixes in this book. The book begins with indi-vidual network hosts, discusses network connections next, and then considers net-works as a whole.
It is unlikely that every chapter in the book will be of equal interest to you. Thefollowing outline will give you an overview of the book so you can select thechapters of greatest interest and either skim or skip over the rest.
Chapter 1, Network Management and TroubleshootingThis chapter attempts to describe network management and troubleshooting inan administrative context. It discusses the need for network analysis andprobing tools, their appropriate and inappropriate uses, professionalism ingeneral, documentation practices, and the economic ramifications of trouble-shooting. If you are familiar with the general aspects of network administra-tion, you may want to skip this chapter.
Chapter 2, Host ConfigurationsChapter 2 is a review of tools and techniques used to configure or deter-mine the configuration of a networked host. The primary focus is on built-in

xii Preface
This is the Title of the Book, eMatter EditionCopyright © 2007 O’Reilly & Associates, Inc. All rights reserved.
utilities. If you are well versed in Unix system administration, you can safelyskip this chapter.
Chapter 3, Connectivity TestingChapter 3 describes tools and techniques to test basic point-to-point and end-to-end network connectivity. It begins with a brief discussion of cabling. A dis-cussion of ping, ping variants, and problems with ping follows. Even if youare very familiar with ping, you may want to skim over the discussion of theping variants.
Chapter 4, Path CharacteristicsThis chapter focuses on assessing the nature and quality of end-to-end con-nections. After a discussion of traceroute, a tool for decomposing a path intoindividual links, the primary focus is on tools that measure link performance.This chapter covers some lesser known tools, so even a seasoned networkadministrator may find a few useful tools and tricks.
Chapter 5, Packet CaptureThis chapter describes tools and techniques for capturing traffic on a network,primarily tcpdump and ethereal, although a number of other utilities are brieflymentioned. Using this chapter requires the greatest understanding of Internetprotocols. But, in my opinion, this is the most important chapter in the book.Skip it at your own risk.
Chapter 6, Device Discovery and MappingThis chapter begins with a general discussion of management tools. It thenfocuses on a few tools, such as nmap and arpwatch, that are useful in piecingtogether information about a network. After a brief discussion of networkmanagement extensions provided for Perl and Tcl/Tk, it concludes with a dis-cussion of route and network discovery using tkined.
Chapter 7, Device Monitoring with SNMPChapter 7 focuses on device monitoring. It begins with a brief review ofSNMP. Next, a discussion of NET SNMP (formerly UCD SNMP) demonstratesthe basics of SNMP. The chapter continues with a brief description of usingscotty to collect SNMP information. Finally, it describes additional features oftkined, including network monitoring. In one sense, this chapter is a hands-ontutorial for using SNMP. If you are not familiar with SNMP, you will definitelywant to read this chapter.
Chapter 8, Performance Measurement ToolsThis chapter is concerned with monitoring and measuring network behaviorover time. The stars of this chapter are ntop and mrtg. I also briefly describeusing SNMP tools to retrieve RMON data. This chapter assumes that you havea thorough knowledge of SNMP. If you don’t, go back and read Chapter 7.

Preface xiii
This is the Title of the Book, eMatter EditionCopyright © 2007 O’Reilly & Associates, Inc. All rights reserved.
Chapter 9, Testing Connectivity ProtocolsThis chapter describes several types of tools for examining the behavior oflow-level connectivity protocols, protocols at the data link and network levels,including tools for custom packet generation and load testing. The chapterconcludes with a brief discussion of emulation and simulation tools. Youprobably will not use these tools frequently and can safely skim this chapterthe first time through.
Chapter 10, Application-Level ToolsChapter 10 looks at several of the more common application-level protocolsand describes tools that may be useful when you are faced with a problemwith one of these protocols. Unless you currently face an application-levelproblem, you can skim this chapter for now.
Chapter 11, Miscellaneous ToolsThis chapter describes a number of different tools that are not really networktroubleshooting or management tools but rather are tools that can ease yourlife as a network administrator. You’ll want to read the sections in this chapterthat discuss tools you aren’t already familiar with.
Chapter 12, Troubleshooting StrategiesWhen dealing with a complex problem, no single tool is likely to meet allyour needs. This last chapter attempts to show how the different tools can beused together to troubleshoot and analyze performance. No new tools areintroduced in this chapter.
Arguably, this chapter should have come at the beginning of the book. Iincluded it at the end so that I could name specific tools without too manyforward references. If you are familiar with general troubleshooting tech-niques, you can safely skip this chapter. Alternately, if you need a quickreview of troubleshooting techniques and don’t mind references to tools youaren’t familiar with, you might jump ahead to this chapter.
Appendix A, Software SourcesThis appendix begins with a brief discussion of installing software and gen-eral software sources. This discussion is followed by an alphabetical listing ofthose tools mentioned in this book, with Internet addresses when feasible.Beware, many of the URLs in this section will be out of date by the time youread this. Nonetheless, these URLs will at least give you a starting point onwhere to begin looking.
Appendix B, Resources and ReferencesThis appendix begins with a discussion of different sources of information.Next, it discusses books by topic, followed by an alphabetical listing of thosebooks mentioned in this book.

xiv Preface
This is the Title of the Book, eMatter EditionCopyright © 2007 O’Reilly & Associates, Inc. All rights reserved.
ConventionsThis book uses the following typographical conventions:
ItalicsFor program names, filenames, system names, email addresses, and URLs andfor emphasizing new terms when first defined
Constant widthIn examples showing the output from programs, the contents of files, or lit-eral information
Constant-width italicsGeneral syntax and items that should be replaced in expressions
Indicates a tip, suggestion, or general note.
Indicates a warning or caution.
AcknowledgmentsThis book would not have been possible without the help of many people. Firston the list are the toolsmiths who created the tools described here. The numberand quality of the tools that are available is truly remarkable. We all owe a consid-erable debt to the people who selflessly develop these tools.
I have been very fortunate that many of my normal duties have overlapped signifi-cantly with tasks related to writing this book. These duties have included settingup and operating Lander University’s networking laboratory and evaluating toolsfor use in teaching. For their help with the laboratory, I gratefully acknowledgeLander’s Department of Computing Services, particularly Anthony Aven, MikeHenderson, and Bill Screws. This laboratory was funded in part by a National Sci-ence Foundation grant, DUE–9980366. I gratefully acknowledge the support theNational Science Foundation has given to Lander. I have also benefited from con-versations with the students and faculty at Lander, particularly Jim Crabtree. I

Preface xv
This is the Title of the Book, eMatter EditionCopyright © 2007 O’Reilly & Associates, Inc. All rights reserved.
would never have gotten started on this project without the help and encourage-ment of Jerry Wilson. Jerry, I owe you lunch (and a lot more).
This book has benefited from the help of numerous people within the O’Reillyorganization. In particular, the support given by Robert Denn, Mike Loukides, andRob Romano, to name only a few, has been exceptional. After talking with authorsworking with other publishers, I consider myself very fortunate in working withtechnically astute people from the start. If you are thinking about writing a tech-nical book, O’Reilly is a publisher to consider.
The reviewers for this book have done an outstanding job. Thanks go to JohnArchie, Anthony Aven, Jon Forrest, and Kevin and Diana Mullet. They cannot befaulted for not turning a sow’s ear into a silk purse.
It seems every author always acknowledges his or her family. It has almostbecome a cliché, but that doesn’t make it any less true. This book would not havebeen possible without the support and patience of my family, who have enduredmore that I should have ever asked them to endure. Thank you.


1This is the Title of the Book, eMatter Edition
Copyright © 2007 O’Reilly & Associates, Inc. All rights reserved.
Chapter 1
1Network Management
and Troubleshooting
The first step in diagnosing a network problem is to collect information. Thisincludes collecting information from your users as to the nature of the problemsthey are having, and it includes collecting data from your network. Your successwill depend, in large part, on your efficiency in collecting this information andon the quality of the information you collect. This book is about tools you canuse and techniques and strategies to optimize their use. Rather than trying tocover all aspects of troubleshooting, this book focuses on this first crucial step,data collection.
There is an extraordinary variety of tools available for this purpose, and morebecome available daily. Very capable people are selflessly devoting enormousamounts of time and effort to developing these tools. We all owe a tremendousdebt to these individuals. But with the variety of tools available, it is easy to beoverwhelmed. Fortunately, while the number of tools is large, data collection neednot be overwhelming. A small number of tools can be used to solve most prob-lems. This book centers on a core set of freely available tools, with pointers toadditional tools that might be needed in some circumstances.
This first chapter has two goals. Although general troubleshooting is not the focusof the book, it seems worthwhile to quickly review troubleshooting techniques.This review is followed by an examination of troubleshooting from a broaderadministrative context—using troubleshooting tools in an effective, productive, andresponsible manner. This part of the chapter includes a discussion of documenta-tion practices, personnel management and professionalism, legal and ethical con-cerns, and economic considerations. General troubleshooting is revisited inChapter 12, once we have discussed available tools. If you are already familiarwith these topics, you may want to skim or even skip this chapter.

2 Chapter 1: Network Management and Troubleshooting
This is the Title of the Book, eMatter EditionCopyright © 2007 O’Reilly & Associates, Inc. All rights reserved.
General Approaches to TroubleshootingTroubleshooting is a complex process that is best learned through experience.This section looks briefly at how troubleshooting is done in order to see howthese tools fit into the process. But while every problem is different, a key step iscollecting information.
Clearly, the best way to approach troubleshooting is to avoid it. If you never haveproblems, you will have nothing to correct. Sound engineering practices, redun-dancy, documentation, and training can help. But regardless of how well engi-neered your system is, things break. You can avoid troubleshooting, but you can’tescape it.
It may seem unnecessary to say, but go for the quick fixes first. As long as youdon’t fixate on them, they won’t take long. Often the first thing to try is resettingthe system. Many problems can be resolved in this way. Bit rot, cosmic rays, or thealignment of the planets may result in the system entering some strange state fromwhich it can’t exit. If the problem really is a fluke, resetting the system may resolvethe problem, and you may never see it again. This may not seem very satisfying,but you can take your satisfaction in going home on time instead.
Keep in mind that there are several different levels in resetting a system. For soft-ware, you can simply restart the program, or you may be able to send a signal tothe program so that it reloads its initialization file. From your users’ perspective,this is the least disruptive approach. Alternately, you might restart the operatingsystem but without cycling the power, i.e., do a warm reboot. Finally, you mighttry a cold reboot by cycling the power.
You should be aware, however, that there can be some dangers in resetting asystem. For example, it is possible to inadvertently make changes to a system sothat it can’t reboot. If you realize you have done this in time, you can correct theproblem. Once you have shut down the system, it may be too late. If you don’thave a backup boot disk, you will have to rebuild the system. These are, fortu-nately, rare circumstances and usually happen only when you have been makingmajor changes to a system.
When making changes to a system, remember that scheduled maintenance mayinvolve restarting a system. You may want to test changes you have made,including their impact on a system reset, prior to such maintenance to ensure thatthere are no problems. Otherwise, the system may fail when restarted during thescheduled maintenance. If this happens, you will be faced with the difficult task ofdeciding which of several different changes are causing problems.
Resetting the system is certainly worth trying once. Doing it more than once is adifferent matter. With some systems, this becomes a way of life. An operating

General Approaches to Troubleshooting 3
This is the Title of the Book, eMatter EditionCopyright © 2007 O’Reilly & Associates, Inc. All rights reserved.
system that doesn’t provide adequate memory protection will frequently becomewedged so that rebooting is the only option.* Sometimes you may want to limpalong resetting the system occasionally rather than dealing with the problem. In auniversity setting, this might get you through exam week to a time when you canbe more relaxed in your efforts to correct the underlying problem. Or, if the systemis to be replaced in the near future, the effort may not be justified. Usually, how-ever, when rebooting becomes a way of life, it is time for more decisive action.
Swapping components and reinstalling software is often the next thing to try. If youhave the spare components, this can often resolve problems immediately. Even ifyou don’t have spares, switching components to see if the problem follows theequipment can be a simple first test. Reinstalling software can be much more prob-lematic. This can often result in configuration errors that will worsen problems. Theold, installed version of the software can make getting a new, clean installationimpossible. But if the install is simple or you have a clear understanding of exactlyhow to configure the software, this can be a relatively quick fix.
While these approaches often work, they aren’t what we usually think of as trou-bleshooting. You certainly don’t need the tools described in this book to do them.Once you have exhausted the quick solutions, it is time to get serious. First, youmust understand the problem, if possible. Problems that are not understood areusually not fixed, just postponed.
One standard admonition is to ask the question “has anything changed recently?”Overwhelmingly, most problems relate to changes to a working system. If you cantemporarily change things back and the problem goes away, you have confirmedyour diagnosis.
Admittedly, this may not help with an installation where everything is new. Buteven a new installation can and should be grown. Pieces can be installed andtested. New pieces of equipment can then be added incrementally. When thisapproach is taken, the question of what has changed once again makes sense.
Another admonition is to change only one thing at a time and then to test thor-oughly after each change. This is certainly good advice when dealing with routinefailures. But this approach will not apply if you are dealing with a system failure.(See the upcoming sidebar on system failures.) Also, if you do find something thatyou know is wrong but fixing it doesn’t fix your problem, do you really want tochange it back? In this case, it is often better to make a note of the additionalchanges you have made and then proceed with your troubleshooting.
A key element to successful debugging is to control the focus of your investiga-tion so that you are really dealing with the problem. You can usually focus better
* Do you know what operating system I’m tactfully not naming?

4 Chapter 1: Network Management and Troubleshooting
This is the Title of the Book, eMatter EditionCopyright © 2007 O’Reilly & Associates, Inc. All rights reserved.
if you can break the problem into pieces. Swapping components, as mentionedpreviously, is an example of this approach. This technique is known by severalnames—problem decomposition, divide and conquer, binary search, and so on.This approach is applicable to all kinds of troubleshooting. For example, whenyour car won’t start, first decide whether you have an electrical or fuel supplyproblem. Then proceed accordingly. Chapter 12 outlines a series of specific stepsyou might want to consider.
System FailuresThe troubleshooting I have described so far can be seen roughly as dealingwith normal failures (although there may be nothing terribly normal aboutthem). A second general class of problems is known as system failures. Systemfailures are problems that stem from the interaction of the parts of a complexsystem in unexpected ways. They are most often seen when two or more sub-systems fail at about the same time and in ways that interact. However, systemfailures can result through interaction of subsystems without any ostensiblefailure in any of the subsystems.
A classic example of a system failure can be seen in the movie China Syn-drome. In one scene the reactor scrams, the pumps shut down, and the water-level indicator on a strip-chart recorder sticks. The water level in the reactorbecomes dangerously low due to the pump shutdown, but the problem is notrecognized because the indicator gives misleading information. These twonear-simultaneous failures conceal the true state of the reactor.
System failures are most pernicious in systems with tight coupling betweensubsystems and subsystems that are linked in nonlinear or nonobvious ways.Debugging a system failure can be extremely difficult. Many of the more stan-dard approaches simply don’t work. The strategy of decomposing the systeminto subsystems becomes difficult, because the symptoms misdirect yourefforts. Moreover, in extreme cases, each subsystem may be operating cor-rectly—the problem stems entirely from the unexpected interactions.
If you suspect you have a system failure, the best approach, when feasible, isto substitute entire subsystems. Your goal should not be to look for a restoredfunctioning system, but to look for changes in the symptoms. Such changesindicate that you may have found one of the subsystems involved. (Conversely,if you are working with a problem and the symptoms change when a sub-system is replaced, this is strong indication of a system failure.)
Unfortunately, if the problem stems from unexpected interaction of nonfailingsystems, even this approach will not work. These are extremely difficult prob-lems to diagnose. Each problem must be treated as a unique, special problem.But again, an important first step is collecting information.
Need for Troubleshooting Tools 5
This is the Title of the Book, eMatter EditionCopyright © 2007 O’Reilly & Associates, Inc. All rights reserved.
Need for Troubleshooting ToolsThe best time to prepare for problems is before you have them. It may sound trite,but if you don’t understand the normal behavior of your network, you will not beable to identify anomalous behavior. For the proper management of your system,you must have a clear understanding of the current behavior and performance ofyour system. If you don’t know the kinds of traffic, the bottlenecks, or the growthpatterns for your network, then you will not be able to develop sensible plans. Ifyou don’t know the normal behavior, you will not be able to recognize aproblem’s symptoms when you see them. Unless you have made a conscious,aggressive effort to understand your system, you probably don’t understand it. Allnetworks contain surprises, even for the experienced administrator. You only haveto look a little harder.
It might seem strange to some that a network administrator would need some ofthe tools described in this book, and that he wouldn’t already know the detailsthat some of these tools provide. But there are a number of reasons why anadministrator may be quite ignorant of his network.
With the rapid growth of the Internet, turnkey systems seem to have grown inpopularity. A fundamental assumption of these systems is that they are managedby an inexperienced administrator or an administrator who doesn’t want to bebothered by the details of the system. Documentation is almost always minimal.For example, early versions of Sun Microsystems’ Netra Internet servers, by default,did not install the Unix manpages and came with only a few small manuals. Printservices were disabled by default.
This is not a condemnation of turnkey systems. They can be a real blessing tosomeone who needs to go online quickly, someone who never wants to be both-ered by such details, or someone who can outsource the management of hersystem. But if at some later time she wants to know what her turnkey system isdoing, it may be up to her to discover that for herself. This is particularly likely ifshe ever wants to go beyond the basic services provided by the system or if shestarts having problems.
Other nonturnkey systems may be customized, often heavily. Of course, all thesechanges should be carefully documented. However, an administrator may inherit apoorly documented system. (And, of course, sometimes we do this to ourselves.)If you find yourself in this situation, you will need to discover (or rediscover) yoursystem for yourself.
In many organizations, responsibilities may be highly partitioned. One group maybe responsible for infrastructure such as wiring, another for network hardware,and yet another for software. In some environments, particularly universities, net-
6 Chapter 1: Network Management and Troubleshooting
This is the Title of the Book, eMatter EditionCopyright © 2007 O’Reilly & Associates, Inc. All rights reserved.
works may be a distributed responsibility. You may have very little control, if any,over what is connected to the network. This isn’t necessarily bad—it’s the way uni-versities work. But rogue systems on your network can have annoying conse-quences. In this situation, probably the best approach is to talk to the systemadministrator or user responsible for the system. Often he will be only too happyto discuss his configuration. The implications of what he is doing may have com-pletely escaped him. Developing a good relationship with power users may giveyou an extra set of eyes on your network. And, it is easier to rely on the systemadministrator to tell you what he is doing than to repeatedly probe the network todiscover changes. But if this fails, as it sometimes does, you may have to resort tocollecting the data yourself.
Sometimes there may be some unexpected, unauthorized, or even covert changesto your network. Well-meaning individuals can create problems when they try tohelp you out by installing equipment themselves. For example, someone might tryinstalling a new computer on the network by copying the network configurationfrom another machine, including its IP address. At other times, some “volunteeradministrator” simply has her own plans for your network.
Finally, almost to a person, network administrators must teach themselves as theygo. Consequently, for most administrators, these tools have an educational valueas well as an administrative value. They provide a way for administrators to learnmore about their networks. For example, protocol analyzers like ethereal providean excellent way to learn the inner workings of a protocol like TCP/IP. Often,more than one of these reasons may apply. Whatever the reason, it is not unusualto find yourself reading your configuration files and probing your systems.
Troubleshooting and ManagementTroubleshooting does not exist in isolation from network management. How youmanage your network will determine in large part how you deal with problems. Aproactive approach to management can greatly simplify problem resolution. Theremainder of this chapter describes several important management issues. Comingto terms with these issues should, in the long run, make your life easier.
Documentation
As a new administrator, your first step is to assess your existing resources andbegin creating new resources. Software sources, including the tools discussed inthis book, are described and listed in Appendix A. Other sources of informationare described in Appendix B.

Troubleshooting and Management 7
This is the Title of the Book, eMatter EditionCopyright © 2007 O’Reilly & Associates, Inc. All rights reserved.
The most important source of information is the local documentation created byyou or your predecessor. In a properly maintained network, there should be somekind of log about the network, preferably with sections for each device. In manynetworks, this will be in an abysmal state. Almost no one likes documenting orthinks he has the time required to do it. It will be full of errors, out of date, andincomplete. Local documentation should always be read with a healthy degree ofskepticism. But even incomplete, erroneous documentation, if treated as such, maybe of value. There are probably no intentional errors, just careless mistakes anderrors of omission. Even flawed documentation can give you some sense of thehistory of the system. Problems frequently occur due to multiple conflictingchanges to a system. Software that may have been only partially removed canhave lingering effects. Homegrown documentation may be the quickest way todiscover what may have been on the system.
While the creation and maintenance of documentation may once have beensomeone else’s responsibility, it is now your responsibility. If you are not happywith the current state of your documentation, it is up to you to update it andadopt policies so the next administrator will not be muttering about you the wayyou are muttering about your predecessors.
There are a couple of sets of standard documentation that, at a minimum, you willalways want to keep. One is purchase information, the other a change log. Pur-chase information includes sales information, licenses, warranties, service con-tracts, and related information such as serial numbers. An inventory of equipment,software, and documentation can be very helpful. When you unpack a system,you might keep a list of everything you receive and date all documentation andsoftware. (A changeable rubber date stamp and ink pad can help with this lasttask.) Manufacturers can do a poor job of distinguishing one version of softwareand its documentation from the next. Dates can be helpful in deciding which ver-sion of the documentation applies when you have multiple systems or upgrades.Documentation has a way of ending up in someone’s personal library, never to beseen again, so a list of what you should have can be very helpful at times.
Keep in mind, there are a number of ways software can enter your system otherthan through purchase orders. Some software comes through CD-ROM subscrip-tion services, some comes in over the Internet, some is bundled with the oper-ating system, some comes in on a CD-ROM in the back of a book, some is broughtfrom home, and so forth. Ideally, you should have some mechanism to track soft-ware. For example, for downloads from the Internet, be sure to keep a logincluding a list identifying filenames, dates, and sources.
You should also keep a change log for each major system. Record every signifi-cant change or problem you have with the system. Each entry should be dated.Even if some entries no longer seem relevant, you should keep them in your log.

8 Chapter 1: Network Management and Troubleshooting
This is the Title of the Book, eMatter EditionCopyright © 2007 O’Reilly & Associates, Inc. All rights reserved.
For instance, if you have installed and later removed a piece of software on aserver, there may be lingering configuration changes that you are not aware of thatmay come to haunt you years later. This is particularly true if you try to reinstallthe program but could even be true for a new program as well.
Beyond these two basic sets of documentation, you can divide the documentationyou need to keep into two general categories—configuration documentation andprocess documentation. Configuration documentation statically describes a system.It assumes that the steps involved in setting up the system are well understoodand need no further comments, i.e., that configuration information is sufficient toreconfigure or reconstruct the system. This kind of information can usually be col-lected at any time. Ironically, for that reason, it can become so easy to put off thatit is never done.
Process documentation describes the steps involved in setting up a device,installing software, or resolving a problem. As such, it is best written while you aredoing the task. This creates a different set of collection problems. Here the stressfrom the task at hand often prevents you from documenting the process.
The first question you must ask is what you want to keep. This may depend onthe circumstances and which tools you are using. Static configuration informationmight include lists of IP addresses and Ethernet addresses, network maps, copiesof server configuration files, switch configuration settings such as VLAN parti-tioning by ports, and so on.
When dealing with a single device, the best approach is probably just a simplecopy of the configuration. This can be either printed or saved as a disk file. Thiswill be a personal choice based on which you think is easiest to manage. Youdon’t need to waste time prettying this up, but be sure you label and date it.
When the information spans multiple systems, such as a list of IP addresses, man-agement of the data becomes more difficult. Fortunately, much of this informationcan be collected automatically. Several tools that ease the process are described insubsequent chapters, particularly in Chapter 6.
For process documentation, the best approach is to log and annotate the changesas you make them and then reconstruct the process at a later time. Chapter 11describes some of the common Unix utilities you can use to automate documenta-tion. You might refer to this chapter if you aren’t familiar with utilities like tee,script, and xwd.*
* Admittedly these guidelines are ideals. Does anyone actually do all of this documenting? Yes, while mostadministrators probably don’t, some do. But just because many administrators don’t succeed in meetingthe ideal doesn’t diminish the importance of trying.

Troubleshooting and Management 9
This is the Title of the Book, eMatter EditionCopyright © 2007 O’Reilly & Associates, Inc. All rights reserved.
Management Practices
A fundamental assumption of this book is that troubleshooting should be proac-tive. It is preferable to avoid a problem than have to correct it. Proper manage-ment practices can help. While some of this section may, at first glance, seemunrelated to troubleshooting, there are fundamental connections. Managementpractices will determine what you can do and how you do it. This is true both foravoiding problems and for dealing with problems that can’t be avoided. Theremainder of this chapter reviews some of the more important management issues.
Professionalism
To effectively administer a system requires a high degree of professionalism. Thisincludes personal honesty and ethical behavior. You should learn to evaluateyourself in an honest, objective manner. (See the later sidebar “The Peter Prin-ciple Revisited.”) It also requires that you conform to the organization’s missionand culture. Your network serves some higher purpose within your organization.It does not exist strictly for your benefit. You should manage the network with thisin mind. This means that everything you do should be done from the perspectiveof a cost-benefit trade-off. It is too easy to get caught in the trap of doing some-thing “the right way” at a higher cost than the benefits justify. Performance anal-ysis is the key element.
The organization’s mind-set or culture will have a tremendous impact on how youapproach problems in general and the use of tools in particular. It will determinewhich tools you can use, how you can use the tools, and, most important, whatyou can do with the information you obtain. Within organizations, there is often abattle between openness and secrecy. The secrecy advocate believes that details ofthe network should be available only on a need-to-know basis, if then. Shebelieves, not without justification, that this enhances security. The openness advo-cate believes that the details of a system should be open and available. This allowsusers to adapt and make optimal use of the system and provides a review pro-cess, giving users more input into the operation of the network.
Taken to an extreme, the secrecy advocate will suppress information that isneeded by the user, making a system or network virtually unusable. Openness,taken to an extreme, will leave a network vulnerable to attack. Most people’sviews fall somewhere between these two extremes but often favor one positionover the other. I advocate prudent openness. In most situations, it makes no senseto shut down a system because it might be attacked. And it is asinine not to pro-vide users with the information they need to protect themselves. Openness amongthose responsible for the different systems within an organization is absolutelyessential.

10 Chapter 1: Network Management and Troubleshooting
This is the Title of the Book, eMatter EditionCopyright © 2007 O’Reilly & Associates, Inc. All rights reserved.
Ego management
We would all like to think that we are irreplaceable, and that no one else could doour jobs as well as we do. This is human nature. Unfortunately, some people takesteps to make sure this is true. The most obvious way an administrator may do thisis hide what he actually does and how his system works.
This can be done many ways. Failing to document the system is one approach—leaving comments out of code or configuration files is common. The goal of suchan administrator is to make sure he is the only one who truly understands thesystem. He may try to limit others access to a system by restricting accounts oraccess to passwords. (This can be done to hide other types of unprofessionalactivities as well. If an administrator occasionally reads other users’ email, he maynot want anyone else to have standard accounts on the email server. If he is over-spending on equipment to gain experience with new technologies, he will notwant any technically literate people knowing what equipment he is buying.)
This behavior is usually well disguised, but it is extremely common. For example,a technician may insist on doing tasks that users could or should be doing. Theproblem is that this keeps users dependent on the technician when it isn’t neces-sary. This can seem very helpful or friendly on the surface. But, if you repeatedlyask for details and don’t get them, there may be more to it than meets the eye.
Common justifications are security and privacy. Unless you are in a managementposition, there is often little you can do other than accept the explanations given.But if you are in a management position, are technically competent, and still hearthese excuses from your employees, beware! You have a serious problem.
No one knows everything. Whenever information is suppressed, you lose inputfrom individuals who don’t have the information. If an employee can’t control herego, she should not be turned loose on your network with the tools described inthis book. She will not share what she learns. She will only use it to furtherentrench herself.
The problem is basically a personnel problem and must be dealt with as such.Individuals in technical areas seem particularly prone to these problems. It maystem from enlarged egos or from insecurity. Many people are drawn to technicalareas as a way to seem special. Alternately, an administrator may see informationas a source of power or even a weapon. He may feel that if he shares the informa-tion, he will lose his leverage. Often individuals may not even recognize thebehavior in themselves. It is just the way they have always done things and it isthe way that feels right.

Troubleshooting and Management 11
This is the Title of the Book, eMatter EditionCopyright © 2007 O’Reilly & Associates, Inc. All rights reserved.
If you are a manager, you should deal with this problem immediately. If you can’tcorrect the problem in short order, you should probably replace the employee. Anirreplaceable employee today will be even more irreplaceable tomorrow. Sooneror later, everyone leaves—finds a better job, retires, or runs off to Poughkeepsiewith an exotic dancer. In the meantime, such a person only becomes moreentrenched making the eventual departure more painful. It will be better to dealwith the problem now rather than later.
Legal and ethical considerations
From the perspective of tools, you must ensure that you use tools in a manner thatconforms not just to the policies of your organization, but to all applicable laws aswell. The tools I describe in this book can be abused, particularly in the realm ofprivacy. Before using them, you should make certain that your use is consistentwith the policies of your organization and all applicable laws. Do you have theappropriate permission to use the tools? This will depend greatly on your rolewithin the organization. Do not assume that just because you have access to toolsthat you are authorized to use them. Nor should you assume that any authoriza-tion you have is unlimited.
Packet capture software is a prime example. It allows you to examine every packetthat travels across a link, including applications data and each and every header.Unless data is encrypted, it can be decoded. This means that passwords can becaptured and email can be read. For this reason alone, you should be very circum-spect in how you use such tools.
A key consideration is the legality of collecting such information. Unfortunately,there is a constantly changing legal morass with respect to privacy in particularand technology in general. Collecting some data may be legitimate in some cir-cumstances but illegal in others.* This depends on factors such as the nature ofyour operations, what published policies you have, what assurances you havegiven your users, new and existing laws, and what interpretations the courts giveto these laws.
It is impossible for a book like this to provide a definitive answer to the questionssuch considerations raise. I can, however, offer four pieces of advice:
• First, if the information you are collecting can be tied to the activities of anindividual, you should consider the information highly confidential and shouldcollect only the information that you really need. Be aware that even seem-ingly innocent information may be sensitive in some contexts. For example,
* As an example, see the CERT Advisory CA-92.19 Topic: Keystroke Logging Banner at http://www.cert.org/advisories/CA-1992-19.html for a discussion on keystroke logging and its legal implications.

12 Chapter 1: Network Management and Troubleshooting
This is the Title of the Book, eMatter EditionCopyright © 2007 O’Reilly & Associates, Inc. All rights reserved.
source/destination address pairs may reveal communications between individ-uals that they would prefer not be made public.
• Second, place your users on notice. Let them know that you collect such infor-mation, why it is necessary, and how you use the information. Remember,however, if you give your users assurances as to how the information is used,you are then constrained by those assurances. If your management policiespermit, make their prior acceptance of these policies a requirement for usingthe system.
• Third, you must realize that with monitoring comes obligations. In manyinstances, your legal culpability may be less if you don’t monitor.
• Finally, don’t rely on this book or what your colleagues say. Get legal advicefrom a lawyer who specializes in this area. Beware: many lawyers will not liketo admit that they don’t know everything about the law, but many aren’t cur-rent with the new laws relating to technology. Also, keep in mind that even ifwhat you are doing is strictly legal and you have appropriate authority, youractions may still not be ethical.
Economic considerations
Solutions to problems have economic consequences, so you must understand theeconomic implications of what you do. Knowing how to balance the cost of thetime used to repair a system against the cost of replacing a system is an obviousexample. Cost management is a more general issue that has important implica-tions when dealing with failures.
One particularly difficult task for many system administrators is to come to termswith the economics of networking. As long as everything is running smoothly, thenext biggest issue to upper management will be how cost effectively you aredoing your job. Unless you have unlimited resources, when you overspend in onearea, you take resources from another area. One definition of an engineer that Iparticularly like is that “an engineer is someone who can do for a dime what afool can do for a dollar.” My best guess is that overspending and buying need-lessly complex systems is the single most common engineering mistake madewhen novice network administrators purchase network equipment.
One problem is that some traditional economic models do not apply in net-working. In most engineering projects, incremental costs are less than the initialper-unit cost. For example, if a 10,000-square-foot building costs $1 million, a15,000-square-foot building will cost somewhat less than $1.5 million. It may makesense to buy additional footage even if you don’t need it right away. This is justi-fied as “buying for the future.”
Troubleshooting and Management 13
This is the Title of the Book, eMatter EditionCopyright © 2007 O’Reilly & Associates, Inc. All rights reserved.
The Peter Principle RevisitedIn 1969, Laurence Peter and Raymond Hull published the satirical book, ThePeter Principle. The premise of the book was that people rise to their level ofincompetence. For example, a talented high school teacher might be promotedto principal, a job requiring a quite different set of skills. Even if ill suited forthe job, once she has this job, she will probably remain with it. She just won’tearn any new promotions. However, if she is adept at the job, she may be pro-moted to district superintendent, a job requiring yet another set of skills. Theprocess of promotions will continue until she reaches her level of incompe-tence. At that point, she will spend the remainder of her career at that level.
While hardly a rigorous sociological principle, the book was well receivedbecause it contained a strong element of truth. In my humble opinion, thePeter Principle usually fails miserably when applied to technical areas such asnetworking and telecommunications. The problem is the difficulty in recogniz-ing incompetence. If incompetence is not recognized, then an individual mayrise well beyond his level of incompetence. This often happens in technicalareas because there is no one in management who can judge an individual’stechnical competence.
Arguably, unrecognized incompetence is usually overengineering. Network-ing, a field of engineering, is always concerned with trade-offs between costsand benefits. An underengineered network that fails will not go unnoticed. Butan overengineered network will rarely be recognizable as such. Such networksmay cost many times what they should, drawing resources from other needs.But to the uninitiated, it appears as a normal, functioning network.
If a network engineer really wants the latest in new equipment when it isn’tneeded, who, outside of the technical personnel, will know? If this is a one-person department, or if all the members of the department can agree on whatthey want, no one else may ever know. It is too easy to come up with sometechnical mumbo jumbo if they are ever questioned.
If this seems far-fetched, I once attended a meeting where a young engineerwas arguing that a particular router needed to be replaced before it became abottleneck. He had picked out the ideal replacement, a hot new box that hadjust hit the market. The problem with all this was that I had recently taken mea-surements on the router and knew the average utilization of that “bottleneck”was less than 5% with peaks that rarely hit 40%.
This is an extreme example of why collecting information is the essential firststep in network management and troubleshooting. Without accurate measure-ments, you can easily spend money fixing imaginary problems.

14 Chapter 1: Network Management and Troubleshooting
This is the Title of the Book, eMatter EditionCopyright © 2007 O’Reilly & Associates, Inc. All rights reserved.
This kind of reasoning, when applied to computers and networking, leads towaste. Almost no one would go ahead and buy a computer now if they won’tneed it until next year. You’ll be able to buy a better computer for less if you waituntil you need it. Unfortunately, this same reasoning isn’t applied when buyingnetwork equipment. People will often buy higher-bandwidth equipment than theyneed, arguing that they are preparing for the future, when it would be much moreeconomical to buy only what is needed now and buy again in the future asneeded.
Moore’s Law lies at the heart of the matter. Around 1965, Gordon Moore, one ofthe founders of Intel, made the empirical observation that the density of inte-grated circuits was doubling about every 12 months, which he later revised to 24months. Since the cost of manufacturing integrated circuits is relatively flat, thisimplies that, in two years, a circuit can be built with twice the functionality withno increase in cost. And, because distances are halved, the circuit runs at twice thespeed—a fourfold improvement. Since the doubling applies to previous dou-blings, we have exponential growth.
It is generally estimated that this exponential growth with chips will go on foranother 15 to 20 years. In fact, this growth is nothing new. Raymond Kurzweil, inThe Age of Spiritual Machines: When Computers Exceed Human Intelligence, col-lected information on computing speeds and functionality from the beginning ofthe twentieth century to the present. This covers mechanical, electromechanical(relay), vacuum tube, discrete transistor, and integrated circuit technologies. Kurz-weil found that exponential growth has been the norm for the last hundred years.He believes that new technologies will be developed that will extend this rate ofgrowth well beyond the next 20 years. It is certainly true that we have seen evenfaster growth in disk densities and fiber-optic capacity in recent years, neither ofwhich can be attributed to semiconductor technology.
What does this mean economically? Clearly, if you wait, you can buy more forless. But usually, waiting isn’t an option. The real question is how far into thefuture should you invest? If the price is coming down, should you repeatedly buyfor the short term or should you “invest” in the long term?
The general answer is easy to see if we look at a few numbers. Suppose that$100,000 will provide you with network equipment that will meet your antici-pated bandwidth needs for the next four years. A simpleminded application ofMoore’s Law would say that you could wait and buy similar equipment for $25,000in two years. Of course, such a system would have a useful life of only two addi-tional years, not the original four. So, how much would it cost to buy just enough

Troubleshooting and Management 15
This is the Title of the Book, eMatter EditionCopyright © 2007 O’Reilly & Associates, Inc. All rights reserved.
equipment to make it through the next two years? Following the same reasoning,about $25,000. If your growth is tracking the growth of technology,* then twoyears ago it would have cost $100,000 to buy four years’ worth of technology. Thatwill have fallen to about $25,000 today. Your choice: $100,000 now or $25,000now and $25,000 in two years. This is something of a no-brainer. It is summarizedin the first two lines of Table 1-1.
If this argument isn’t compelling enough, there is the issue of maintenance. As ageneral rule of thumb, service contracts on equipment cost about 1% of the pur-chase price per month. For $100,000, that is $12,000 a year. For $25,000, this is$3,000 per year. Moore’s Law doesn’t apply to maintenance for several reasons:
• A major part of maintenance is labor costs and these, if anything, will go up.
• The replacement parts will be based on older technology and older (andhigher) prices.
• The mechanical parts of older systems, e.g., fans, connectors, and so on, areall more likely to fail.
• There is more money to be made selling new equipment so there is no incen-tive to lower maintenance prices.
Thus, the $12,000 a year for maintenance on a $100,000 system will cost $12,000 ayear for all four years. The third and fourth lines of Table 1-1 summarize thesenumbers.
* This is a pretty big if, but it’s reasonable for most users and organizations. Most users and organizationshave selected a point in the scheme of things that seems right for them—usually the latest technologythey can reasonably afford. This is why that new computer you buy always seems to cost $2500. Youare buying the latest in technology, and you are trying to reach about the same distance into the future.
Table 1-1. Cost estimates
Year 1 Year 2 Year 3 Year 4 Total
Four-year plan $100,000 $0 $0 $0 $100,000
Two-year plan $25,000 $0 $25,000 $0 $50,000
Four-year plan withmaintenance
$112,000 $12,000 $12,000 $12,000 $148,000
Two-year plan withmaintenance
$28,000 $3,000 $28,000 $3,000 $62,000
Four-year plan withmaintenance and20% MARR
$112,000 $10,000 $8,300 $6,900 $137, 200
Two-year plan withmaintenance and20% MARR
$28,000 $2,500 $19,500 $1,700 $51,700

16 Chapter 1: Network Management and Troubleshooting
This is the Title of the Book, eMatter EditionCopyright © 2007 O’Reilly & Associates, Inc. All rights reserved.
Yet another consideration is the time value of money. If you don’t need the$25,000 until two years from now, you can invest a smaller amount now andexpect to have enough to cover the costs later. So the $25,000 needed in twoyears is really somewhat less in terms of today’s dollars. How much less dependson the rate of return you can expect on investments. For most organizations, thisnumber is called the minimal acceptable rate of return (MARR). The last two linesof Table 1-1 use a MARR of 20%. This may seem high, but it is not an unusualnumber. As you can see, buying for the future is more than two and a half timesas expensive as going for the quick fix.
Of course, all this is a gross simplification. There are a number of other importantconsiderations even if you believe these numbers. First and foremost, Moore’s Lawdoesn’t always apply. The most important exception is infrastructure. It is notgoing to get any cheaper to pull cable. You should take the time to do infrastruc-ture well; that’s where you really should invest in the future.
Most of the other considerations seem to favor short-term investing. First, withshort-term purchasing, you are less likely to invest in dead-end technology sinceyou are buying later in the life cycle and will have a clearer picture of where theindustry is going. For example, think about the difference two years might havemade in choosing between Fast Ethernet and ATM for some organizations. For thesame reason, the cost of training should be lower. You will be dealing with morefamiliar technology, and there will be more resources available. You will have topurchase and install equipment more often, but the equipment you replace can bereused in your network’s periphery, providing additional savings.
On the downside, the equipment you buy won’t have a lot of excess capacity or avery long, useful lifetime. It can be very disconcerting to nontechnical manage-ment when you keep replacing equipment. And, if you experience sudden unex-pected growth, this is exactly what you will need to do. Take the time to educateupper management. If frequent changes to your equipment are particularly disrup-tive or if you have funding now, you may need to consider long-term purchaseseven if they are more expensive. Finally, don’t take the two-year time frame pre-sented here too literally. You’ll discover the appropriate time frame for your net-work only with experience.
Other problems come when comparing plans. You must consider the total eco-nomic picture. Don’t look just at the initial costs, but consider ongoing costs suchas maintenance and the cost of periodic replacement. As an example, consider thefollowing plans. Plan A has an estimated initial cost of $400,000, all for equip-ment. Plan B requires $150,000 for equipment and $450,000 for infrastructureupgrades. If you consider only initial costs, Plan A seems to be $200,000 cheaper.But equipment needs to be maintained and, periodically, replaced. At 1% per

Troubleshooting and Management 17
This is the Title of the Book, eMatter EditionCopyright © 2007 O’Reilly & Associates, Inc. All rights reserved.
month, the equipment for Plan A would cost $48,000 a year to maintain, com-pared to $18,000 per year with Plan B. If you replace equipment a couple of timesin the next decade, that will be an additional $800,000 for Plan A but only$300,000 for Plan B. As this quick, back-of-the-envelope calculation shows, the 10-year cost for Plan A was $1.68 million, while only $1.08 million for Plan B. Whatappeared to be $200,000 cheaper was really $600,000 more expensive. Of course,this was a very crude example, but it should convey the idea.
You shouldn’t take this example too literally either. Every situation is different. Inparticular, you may not be comfortable deciding what is adequate surplus capacityin your network. In general, however, you are probably much better off thinkingin terms of scalability than raw capacity. If you want to hedge your bets, you canmake sure that high-speed interfaces are available for the router you are consid-ering without actually buying those high-speed interfaces until needed.
How does this relate to troubleshooting? First, don’t buy overly complex systemsyou don’t really need. They will be much harder to maintain, as you can expectthe complexity of troubleshooting to grow with the complexity of the systems youbuy. Second, don’t spend all your money on the system and forget ongoing main-tenance costs. If you don’t anticipate operational costs, you may not have thefunds you need.
18This is the Title of the Book, eMatter Edition
Copyright © 2007 O’Reilly & Associates, Inc. All rights reserved.
Chapter 2
2Host Configurations
The goal of this chapter is to review system administration from the perspective ofthe individual hosts on a network. This chapter presumes that you have a basicunderstanding of system administration. Consequently, many of the more basicissues are presented in a very cursory manner. The intent is more to jog yourmemory, or to fill an occasional gap, than to teach the fundamentals of systemadministration. If you are new to system administration, a number of the bookslisted in Appendix B provide excellent introductions. If, on the other hand, youare a knowledgeable system administrator, you will probably want to skim or evenskip this chapter.
Chapter 1 lists several reasons why you might not know the details of your net-work and the computers on it. This chapter assumes that you are faced with a net-worked computer and need to determine or reconstruct its configuration. It shouldbe obvious that if you don’t understand how a system is configured, you will notbe able to change its configuration or correct misconfigurations. The toolsdescribed in this chapter can be used to discover or change a host’s configuration.
As discussed in Chapter 1, if you have documentation for the system, begin with it.The assumption here is that such documentation does not exist or that it is incom-plete. The primary focus is network configuration, but many of the techniques caneasily be generalized.
If you have inherited a multiuser system that has been in service for several yearswith many undocumented customizations, reconstructing its configuration can bean extremely involved and extended process. If your system has been compro-mised, the intruder has taken steps to hide her activity, and you aren’t running anintegrity checker like tripwire, it may be virtually impossible to discover all hercustomizations. (tripwire is discussed briefly in Chapter 11.) While it may not befeasible, you should at least consider reinstalling the system from scratch. While

Host Configurations 19
This is the Title of the Book, eMatter EditionCopyright © 2007 O’Reilly & Associates, Inc. All rights reserved.
this may seem draconian, it may ultimately be much less work than fighting thesame battles over and over, as often happens with compromised systems. The bestway to do this is to set up a replacement system in parallel and then moveeveryone over. This, of course, requires a second system.
If rebuilding the system is not feasible, or if your situation isn’t as extreme as thatjust described, then you can use the techniques described in this chapter to recon-struct the system’s configuration.
Whatever your original motivation, you should examine your system’s configura-tion on a regular basis. If for no other reason, this will help you remember howyour system is configured. But there are other reasons as well. As you learn more,you will undoubtedly want to revisit your configuration to correct problems,improve security, and optimize performance. Reviewing configurations is a neces-sary step to ensure that your system hasn’t been compromised. And, if you sharemanagement of a system, you may be forced to examine the configuration when-ever communications falter.
Keep a set of notes for each system, giving both the configuration and directionsfor changing the configuration. Usually the best place to start is by constructing alist of what can be found where in the vendor documentation you have. This mayseem pointless since this information is in the documentation. But the informationyou need will be spread throughout this documentation. You won’t want to plowthrough everything every time you need to check or change something. You mustcreate your own list. I frequently write key page numbers inside the front coversof manuals and specifics in the margins throughout the manual. For example, I’lladd device names to the manpages for the mount command, something I alwaysseem to need but often can’t remember. (Be warned that this has the disadvan-tage of tying manuals to specific hardware, which could create other problems.)
When reconstructing a host’s configuration, there are two basic approaches. One isto examine the system’s configuration files. This can be a very protractedapproach. It works well when you know what you are looking for and when youare looking for a specific detail. But it can be difficult to impossible to find all thedetails of the system, particularly if someone has taken steps to hide them. Andsome parameters are set dynamically and simply can’t be discovered just from con-figuration files.
The alternative is to use utilities designed to give snapshots of the current state ofthe system. Typically, these focus on one aspect of the system, for example, listingall open files. Collectively, these utilities can give you a fairly complete picture.They tend to be easy to use and give answers quickly. But, because they mayfocus on only one aspect of the system, they may not provide all the informationyou need if used in isolation.

20 Chapter 2: Host Configurations
This is the Title of the Book, eMatter EditionCopyright © 2007 O’Reilly & Associates, Inc. All rights reserved.
Clearly, by itself, neither approach is totally adequate. Where you start will dependin part on how quickly you must be up to speed and what specific problems youare facing. Each approach will be described in turn.
UtilitiesReviewing system configuration files is a necessary step that you will have toaddress before you can claim mastery of a system. But this can be a very time-consuming step. It is very easy to overlook one or more key files. If you are undertime pressure to resolve a problem, configuration files are not the best place tostart.
Even if you plan to jump into the configuration files, you will probably want aquick overview of the current state of the system before you begin. For thisreason, we will examine status and configuration utilities first. This approach hasthe advantage of being pretty much the same from one version of Unix to thenext. With configuration files, the differences among the various flavors of Unixcan be staggering. Even when the files have the same functionality and syntax,they can go by different names or be in different directories. Certainly, using theseutilities is much simpler than looking at kernel configuration files.
The output provided by these utilities may vary considerably fromsystem to system and will depend heavily on which options areused. In practice, this should present no real problem. Don’t bealarmed if the output on your system is formatted differently.
ps
The first thing any system administrator should do on a new system is run the pscommand. You are probably already familiar with ps so I won’t spend much timeon it. The ps command lists which processes are running on the system. Here is anexample:
bsd4# ps -auxUSER PID %CPU %MEM VSZ RSS TT STAT STARTED TIME COMMANDroot 6590 22.0 2.1 924 616 ?? R 11:14AM 0:09.80 inetd: chargen [2root 1 0.0 0.6 496 168 ?? Ss Fri09AM 0:00.03 /sbin/init --root 2 0.0 0.0 0 0 ?? DL Fri09AM 0:00.52 (pagedaemon)root 3 0.0 0.0 0 0 ?? DL Fri09AM 0:00.00 (vmdaemon)root 4 0.0 0.0 0 0 ?? DL Fri09AM 0:44.05 (syncer)root 100 0.0 1.7 820 484 ?? Ss Fri09AM 0:02.14 syslogddaemon 109 0.0 1.5 828 436 ?? Is Fri09AM 0:00.02 /usr/sbin/portmaproot 141 0.0 2.1 924 616 ?? Ss Fri09AM 0:00.51 inetdroot 144 0.0 1.7 980 500 ?? Is Fri09AM 0:03.14 cron

Utilities 21
This is the Title of the Book, eMatter EditionCopyright © 2007 O’Reilly & Associates, Inc. All rights reserved.
root 150 0.0 2.8 1304 804 ?? Is Fri09AM 0:02.59 sendmail: acceptiroot 173 0.0 1.3 788 368 ?? Is Fri09AM 0:01.84 moused -p /dev/psroot 213 0.0 1.8 824 508 v1 Is+ Fri09AM 0:00.02 /usr/libexec/gettroot 214 0.0 1.8 824 508 v2 Is+ Fri09AM 0:00.02 /usr/libexec/gettroot 457 0.0 1.8 824 516 v0 Is+ Fri10AM 0:00.02 /usr/libexec/gettroot 6167 0.0 2.4 1108 712 ?? Ss 4:10AM 0:00.48 telnetdjsloan 6168 0.0 0.9 504 252 p0 Is 4:10AM 0:00.09 -sh (sh)root 6171 0.0 1.1 464 320 p0 S 4:10AM 0:00.14 -su (csh)root 0 0.0 0.0 0 0 ?? DLs Fri09AM 0:00.17 (swapper)root 6597 0.0 0.8 388 232 p0 R+ 11:15AM 0:00.00 ps -aux
In this example, the first and last columns are the most interesting since they givethe owners and the processes, along with their arguments. In this example, thelines, and consequently the arguments, have been truncated, but this is easilyavoided. Running processes of interest include portmap, inetd, sendmail, telnetd,and chargen.
There are a number of options available to ps, although they vary from implemen-tation to implementation. In this example, run under FreeBSD, the parametersused were -aux. This combination shows all users’ processes (-a), including thosewithout controlling terminals (-x), in considerable detail (-u). The options -ax willprovide fewer details but show more of the command-line arguments. Alternately,you can use the -w option to extend the displayed information to 132 columns.With AT&T-derived systems, the options -ef do pretty much the same thing. Inter-estingly, Linux supports both sets of options. You will need to precede AT&T-styleoptions with a hyphen. This isn’t required for BSD options. You can do it eitherway with Solaris. /usr/bin/ps follows the AT&T conventions, while /usr/ucb/ps sup-ports the BSD options.
While ps quickly reveals individual processes, it gives a somewhat incomplete pic-ture if interpreted naively. For example, the inetd daemon is one source of confu-sion. inetd is used to automatically start services on a system as they are needed.Rather than start a separate process for each service that might eventually be run,the inetd daemon runs on their behalf. When a connection request arrives, inetdwill start the requested service. Since some network services like ftp, telnet, andfinger are usually started this way, ps will show processes for them only whenthey are currently running. If ps doesn’t list them, it doesn’t mean they aren’t avail-able; they just aren’t currently running.
For example, in the previous listing, chargen was started by inetd. We can seechargen in this instance because it was a running process when ps was run. But,this particular test system was configured to run a number of additional servicesvia inetd (as determined by the /etc/inetd.conf configuration file). None of theseother services show up under ps because, technically, they aren’t currently run-ning. Yet, these other services will be started automatically by inetd, so they areavailable services.

22 Chapter 2: Host Configurations
This is the Title of the Book, eMatter EditionCopyright © 2007 O’Reilly & Associates, Inc. All rights reserved.
In addition to showing what is running, ps is a useful diagnostic tool. It quicklyreveals defunct processes or multiple instances of the same process, therebypointing out configuration problems and similar issues. %MEM and %CPU can tellyou a lot about resource usage and can provide crucial information if you haveresource starvation. Or you can use ps to identify rogue processes that arespawning other processes by looking at processes that share a common PPID.Once you are comfortable with the usual uses, it is certainly worth revisiting psperiodically to learn more about its other capabilities, as this brief discussion justscratches the surface of ps.
top
Although less ubiquitous, the top command, a useful alternative to ps, is availableon many systems. It was written by William LeFebvre. When running, top gives aperiodically updated listing of processes ranked in order of CPU usage. Typically,only the top 10 processes are given, but this is implementation dependent, andyour implementation may let you select other values. Here is a single instancefrom our test system:
15 processes: 2 running, 13 sleepingCPU states: 0.8% user, 0.0% nice, 7.4% system, 7.8% interrupt, 84.0% idleMem: 6676K Active, 12M Inact, 7120K Wired, 2568K Cache, 3395K Buf, 1228K FreeSwap: 100M Total, 100M Free
PID USERNAME PRI NICE SIZE RES STATE TIME WCPU CPU COMMAND 6590 root 35 0 924K 616K RUN 0:15 21.20% 20.75% inetd 144 root 10 0 980K 500K nanslp 0:03 0.00% 0.00% cron 150 root 2 0 1304K 804K select 0:03 0.00% 0.00% sendmail 100 root 2 0 820K 484K select 0:02 0.00% 0.00% syslogd 173 root 2 0 788K 368K select 0:02 0.00% 0.00% moused 141 root 2 0 924K 616K select 0:01 0.00% 0.00% inetd 6167 root 2 0 1108K 712K select 0:00 0.00% 0.00% telnetd 6171 root 18 0 464K 320K pause 0:00 0.00% 0.00% csh 6168 jsloan 10 0 504K 252K wait 0:00 0.00% 0.00% sh 6598 root 28 0 1556K 844K RUN 0:00 0.00% 0.00% top 1 root 10 0 496K 168K wait 0:00 0.00% 0.00% init 457 root 3 0 824K 516K ttyin 0:00 0.00% 0.00% getty 214 root 3 0 824K 508K ttyin 0:00 0.00% 0.00% getty 213 root 3 0 824K 508K ttyin 0:00 0.00% 0.00% getty 109 daemon 2 0 828K 436K select 0:00 0.00% 0.00% portmap
Output is interrupted with a q or a Ctrl-C. Sometimes system administrators willleave top running on the console when the console is not otherwise in use. Ofcourse, this should be done only in a physically secure setting.
In a sense, ps is a more general top since it gives you all running processes. Theadvantage to top is that it focuses your attention on resource hogs, and it provides

Utilities 23
This is the Title of the Book, eMatter EditionCopyright © 2007 O’Reilly & Associates, Inc. All rights reserved.
a repetitive update. top has a large number of options and can provide a widerange of information. For more information, consult its Unix manpage.*
netstat
One of the most useful and diverse utilities is netstat. This program reports thecontents of kernel data structures related to networking. Because of the diversity innetworking data structures, many of netstat ’s uses may seem somewhat unrelated,so we will be revisiting netstat at several points in this book.
One use of netstat is to display the connections and services available on a host.For example, this is the output for the system we just looked at:
bsd4# netstat -aActive Internet connections (including servers)Proto Recv-Q Send-Q Local Address Foreign Address (state)tcp 0 0 bsd4.telnet 205.153.60.247.3473 TIME_WAITtcp 0 17458 bsd4.chargen sloan.1244 ESTABLISHEDtcp 0 0 *.chargen *.* LISTENtcp 0 0 *.discard *.* LISTENtcp 0 0 *.echo *.* LISTENtcp 0 0 *.time *.* LISTENtcp 0 0 *.daytime *.* LISTENtcp 0 0 *.finger *.* LISTENtcp 0 2 bsd4.telnet sloan.1082 ESTABLISHEDtcp 0 0 *.smtp *.* LISTENtcp 0 0 *.login *.* LISTENtcp 0 0 *.shell *.* LISTENtcp 0 0 *.telnet *.* LISTENtcp 0 0 *.ftp *.* LISTENtcp 0 0 *.sunrpc *.* LISTENudp 0 0 *.1075 *.*udp 0 0 *.1074 *.*udp 0 0 *.1073 *.*udp 0 0 *.1072 *.*udp 0 0 *.1071 *.*udp 0 0 *.1070 *.*udp 0 0 *.chargen *.*udp 0 0 *.discard *.*udp 0 0 *.echo *.*udp 0 0 *.time *.*udp 0 0 *.daytime *.*udp 0 0 *.sunrpc *.*udp 0 0 *.syslog *.*Active UNIX domain socketsAddress Type Recv-Q Send-Q Inode Conn Refs Nextref Addrc3378e80 dgram 0 0 0 c336efc0 0 c3378f80c3378f80 dgram 0 0 0 c336efc0 0 c3378fc0c3378fc0 dgram 0 0 0 c336efc0 0 0c336efc0 dgram 0 0 c336db00 0 c3378e80 0 /var/run/log
* Solaris users may want to look at process management utilities included in /usr/proc/bin.

24 Chapter 2: Host Configurations
This is the Title of the Book, eMatter EditionCopyright © 2007 O’Reilly & Associates, Inc. All rights reserved.
The first column gives the protocol. The next two columns give the sizes of thesend and receive queues. These should be 0 or near 0. Otherwise, you may have aproblem with that particular service. The next two columns give the socket or IPaddress and port number for each end of a connection. This socket pair uniquelyidentifies one connection. The socket is presented in the form hostname.service.Finally, the state of the connection is given in the last column for TCP services.This is blank for UDP since it is connectionless. The most common states areESTABLISHED for current connections, LISTEN for services awaiting a connection,and TIME_WAIT for recently terminated connections. Any of the TCP states couldshow up, but you should rarely see the others. An excessive number of SYN_RECEIVED, for example, is an indication of a problem (possibly a denial-of-serviceattack). You can safely ignore the last few lines of this listing.
A couple of examples should clarify this output. The following line shows a Telnetconnection between bsd4 and sloan using port 1082 on sloan:
tcp 0 2 bsd4.telnet sloan.1082 ESTABLISHED
The next line shows that there was a second connection to sloan that was recentlyterminated:
tcp 0 0 bsd4.telnet 205.153.60.247.3473 TIME_WAIT
Terminated connections remain in this state for a couple of minutes, during whichtime the socket pair cannot be reused.
Name resolution can be suppressed with the -n option if you would rather seenumeric entries. There are a couple of reasons you might want to do this. Typi-cally, netstat will run much faster without name resolution. This is particularly trueif you are having name resolution problems and have to wait for requests to timeout. This option can help you avoid confusion if your /etc/services or /etc/hosts filesare inaccurate.
The remaining TCP entries in the LISTEN state are services waiting for a connec-tion request. Since a request could come over any available interface, its IPaddress is not known in advance. The * in the entry *.echo acts as a placeholderfor the unknown IP address. (Since multiple addresses may be associated with ahost, the local address is unknown until a connection is actually made.) The *.*entries indicate that both the remote address and port are unknown. As you cansee, this shows a number of additional services that ps was not designed to dis-play. In particular, all the services that are under the control of inetd are shown.
Another use of netstat is to list the routing table. This may be essential informa-tion in resolving routing problems, e.g., when you discover that a host or a net-work is unreachable. Although it may be too long or volatile on many systems tobe very helpful, the routing table is sometimes useful in getting a quick idea of

Utilities 25
This is the Title of the Book, eMatter EditionCopyright © 2007 O’Reilly & Associates, Inc. All rights reserved.
what networks are communicating with yours. Displaying the routing tablerequires the -r option.
There are four main ways entries can be added to the routing table—by theifconfig command when an interface is configured, by the route command, by anICMP redirect, or through an update from a dynamic protocol like RIP or OSPF. Ifdynamic protocols are used, the routing table is an example of a dynamic struc-ture that can’t be discovered by looking at configuration files.
Here is an example of a routing table from a FreeBSD system:
bsd1# netstat -rnRouting tables
Internet:Destination Gateway Flags Refs Use Netif Expiredefault 205.153.60.2 UGSc 0 0 xl0127.0.0.1 127.0.0.1 UH 0 0 lo0172.16.1/24 172.16.2.1 UGSc 0 7 xl1172.16.2/24 link#2 UC 0 0 xl1172.16.2.1 0:10:7b:66:f7:62 UHLW 2 0 xl1 913172.16.2.255 ff:ff:ff:ff:ff:ff UHLWb 0 18 xl1172.16.3/24 172.16.2.1 UGSc 0 2 xl1205.153.60 link#1 UC 0 0 xl0205.153.60.1 0:0:a2:c6:e:42 UHLW 4 0 xl0 906205.153.60.2 link#1 UHLW 1 0 xl0205.153.60.5 0:90:27:9c:2d:c6 UHLW 0 34 xl0 987205.153.60.255 ff:ff:ff:ff:ff:ff UHLWb 1 18 xl0205.153.61 205.153.60.1 UGSc 0 0 xl0205.153.62 205.153.60.1 UGSc 0 0 xl0205.153.63 205.153.60.1 UGSc 2 0 xl0
At first glance, output from other systems may be organized differently, but usu-ally the same basic information is present. In this example, the -n option was usedto suppress name resolution.
The first column gives the destination, while the second gives the interface or nexthop to that destination. The third column gives the flags. These are often helpfulin interpreting the first two columns. A U indicates the path is up or available, an Hindicates the destination is a host rather than a network, and a G indicates agateway or router. These are the most useful. Others shown in this table include b,indicating a broadcast address; S, indicating a static or manual addition; and W andc, indicating a route that was generated as a result of cloning. (These and otherpossibilities are described in detail in the Unix manpage for some versions ofnetstat.) The fourth column gives a reference count, i.e., the number of active usesfor each of the routes. This is incremented each time a connection is built over theroute (e.g., a Telnet connection is made using the route) and decremented whenthe connection is torn down. The fifth column gives the number of packets sentusing this entry. The last entry is the interface that will be used.
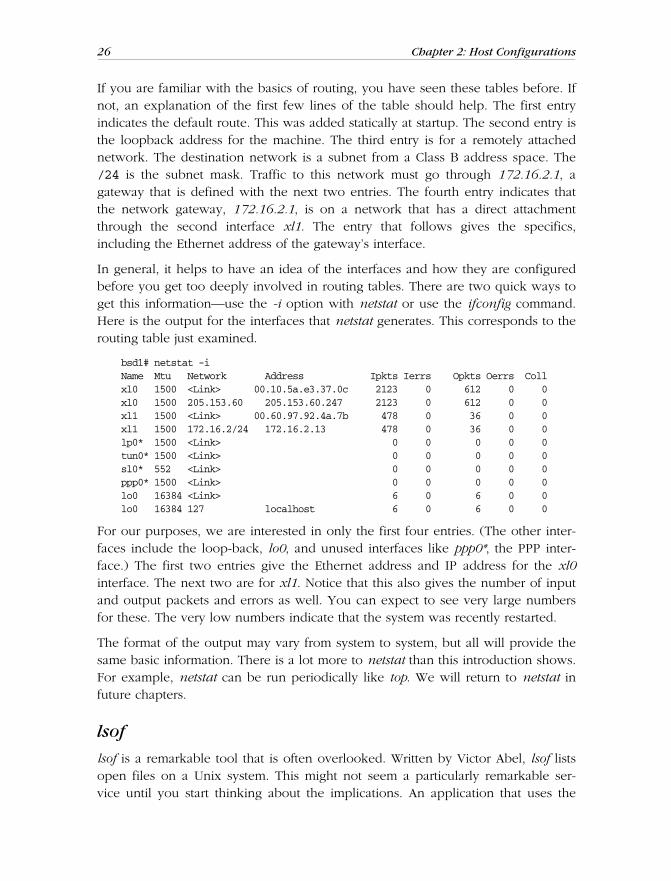
26 Chapter 2: Host Configurations
This is the Title of the Book, eMatter EditionCopyright © 2007 O’Reilly & Associates, Inc. All rights reserved.
If you are familiar with the basics of routing, you have seen these tables before. Ifnot, an explanation of the first few lines of the table should help. The first entryindicates the default route. This was added statically at startup. The second entry isthe loopback address for the machine. The third entry is for a remotely attachednetwork. The destination network is a subnet from a Class B address space. The/24 is the subnet mask. Traffic to this network must go through 172.16.2.1, agateway that is defined with the next two entries. The fourth entry indicates thatthe network gateway, 172.16.2.1, is on a network that has a direct attachmentthrough the second interface xl1. The entry that follows gives the specifics,including the Ethernet address of the gateway’s interface.
In general, it helps to have an idea of the interfaces and how they are configuredbefore you get too deeply involved in routing tables. There are two quick ways toget this information—use the -i option with netstat or use the ifconfig command.Here is the output for the interfaces that netstat generates. This corresponds to therouting table just examined.
bsd1# netstat -iName Mtu Network Address Ipkts Ierrs Opkts Oerrs Collxl0 1500 <Link> 00.10.5a.e3.37.0c 2123 0 612 0 0xl0 1500 205.153.60 205.153.60.247 2123 0 612 0 0xl1 1500 <Link> 00.60.97.92.4a.7b 478 0 36 0 0xl1 1500 172.16.2/24 172.16.2.13 478 0 36 0 0lp0* 1500 <Link> 0 0 0 0 0tun0* 1500 <Link> 0 0 0 0 0sl0* 552 <Link> 0 0 0 0 0ppp0* 1500 <Link> 0 0 0 0 0lo0 16384 <Link> 6 0 6 0 0lo0 16384 127 localhost 6 0 6 0 0
For our purposes, we are interested in only the first four entries. (The other inter-faces include the loop-back, lo0, and unused interfaces like ppp0*, the PPP inter-face.) The first two entries give the Ethernet address and IP address for the xl0interface. The next two are for xl1. Notice that this also gives the number of inputand output packets and errors as well. You can expect to see very large numbersfor these. The very low numbers indicate that the system was recently restarted.
The format of the output may vary from system to system, but all will provide thesame basic information. There is a lot more to netstat than this introduction shows.For example, netstat can be run periodically like top. We will return to netstat infuture chapters.
lsof
lsof is a remarkable tool that is often overlooked. Written by Victor Abel, lsof listsopen files on a Unix system. This might not seem a particularly remarkable ser-vice until you start thinking about the implications. An application that uses the

Utilities 27
This is the Title of the Book, eMatter EditionCopyright © 2007 O’Reilly & Associates, Inc. All rights reserved.
filesystem, networked or otherwise, will have open files at some point. lsof offers away to track that activity.
The program is available for a staggering variety of Unix systems, often in bothsource and binary formats. Although I will limit this discussion to networkingrelated tasks, lsof is more properly an operating system tool than a networkingtool. You may want to learn more about lsof than described here.
In its simplest form, lsof produces a list of all open files. You’ll probably be quitesurprised at the number of files that are open on a quiescent system. For example,on a FreeBSD system with no one else logged on, lsof listed 564 open files.
Here is an example of the first few lines of output from lsof:
bsd2# lsofCOMMAND PID USER FD TYPE DEVICE SIZE/OFF NODE NAMEswapper 0 root cwd VDIR 116,131072 512 2 /swapper 0 root rtd VDIR 116,131072 512 2 /init 1 root cwd VDIR 116,131072 512 2 /init 1 root rtd VDIR 116,131072 512 2 /init 1 root txt VREG 116,131072 255940 157 /sbin/init...
The most useful fields are the obvious ones, including the first three—the name ofthe command, the process ID, and its owner. The other fields and codes used inthe fields are explained in the manpage for lsof, which runs about 30 pages.
It might seem that lsof returns too much information to be useful. Fortunately, itprovides a number of options that will allow you to tailor the output to yourneeds. You can use lsof with the -p option to specify a specific process number orwith the -c option to specify the name of a process. For example, the commandlsof -csendmail will list all the files opened by sendmail. You only need to giveenough of the name to uniquely identify the process. The -N option can be usedto list files opened for the local computer on an NFS server. That is, when run onan NFS client, lsof shows files opened by the client. When run on a server, lsof willnot show the files the server is providing to clients.
The -i option limits output to Internet and X.25 network files. If no address is given,all such files will be listed, effectively showing all open socket files on your network:
bsd2# lsof -iCOMMAND PID USER FD TYPE DEVICE SIZE/OFF NODE NAMEsyslogd 105 root 4u IPv4 0xc3dd8f00 0t0 UDP *:syslogportmap 108 daemon 3u IPv4 0xc3dd8e40 0t0 UDP *:sunrpcportmap 108 daemon 4u IPv4 0xc3e09d80 0t0 TCP *:sunrpc (LISTEN)inetd 126 root 4u IPv4 0xc3e0ad80 0t0 TCP *:ftp (LISTEN)inetd 126 root 5u IPv4 0xc3e0ab60 0t0 TCP *:telnet (LISTEN)inetd 126 root 6u IPv4 0xc3e0a940 0t0 TCP *:shell (LISTEN)inetd 126 root 7u IPv4 0xc3e0a720 0t0 TCP *:login (LISTEN)inetd 126 root 8u IPv4 0xc3e0a500 0t0 TCP *:finger (LISTEN)

28 Chapter 2: Host Configurations
This is the Title of the Book, eMatter EditionCopyright © 2007 O’Reilly & Associates, Inc. All rights reserved.
inetd 126 root 9u IPv4 0xc3dd8d80 0t0 UDP *:biffinetd 126 root 10u IPv4 0xc3dd8cc0 0t0 UDP *:ntalkinetd 126 root 11u IPv6 0xc3e0a2e0 0t0 TCP *:ftpinetd 126 root 12u IPv6 0xc3e0bd80 0t0 TCP *:telnetinetd 126 root 13u IPv6 0xc3e0bb60 0t0 TCP *:shellinetd 126 root 14u IPv6 0xc3e0b940 0t0 TCP *:logininetd 126 root 15u IPv6 0xc3e0b720 0t0 TCP *:fingerlpd 131 root 6u IPv4 0xc3e0b500 0t0 TCP *:printer (LISTEN)sendmail 137 root 4u IPv4 0xc3e0b2e0 0t0 TCP *:smtp (LISTEN)httpd 185 root 16u IPv4 0xc3e0b0c0 0t0 TCP *:http (LISTEN)httpd 198 nobody 16u IPv4 0xc3e0b0c0 0t0 TCP *:http (LISTEN)httpd 199 nobody 16u IPv4 0xc3e0b0c0 0t0 TCP *:http (LISTEN)httpd 200 nobody 16u IPv4 0xc3e0b0c0 0t0 TCP *:http (LISTEN)httpd 201 nobody 16u IPv4 0xc3e0b0c0 0t0 TCP *:http (LISTEN)httpd 202 nobody 16u IPv4 0xc3e0b0c0 0t0 TCP *:http (LISTEN)httpd 10408 nobody 16u IPv4 0xc3e0b0c0 0t0 TCP *:http (LISTEN)httpd 10409 nobody 16u IPv4 0xc3e0b0c0 0t0 TCP *:http (LISTEN)httpd 10410 nobody 16u IPv4 0xc3e0b0c0 0t0 TCP *:http (LISTEN)httpd 25233 nobody 16u IPv4 0xc3e0b0c0 0t0 TCP *:http (LISTEN)httpd 25236 nobody 16u IPv4 0xc3e0b0c0 0t0 TCP *:http (LISTEN)telnetd 58326 root 0u IPv4 0xc3e0eb60 0t0 TCP bsd2.lander.edu:telnet->sloan.lander.edu:1184 (ESTABLISHED)telnetd 58326 root 1u IPv4 0xc3e0eb60 0t0 TCP bsd2.lander.edu:telnet->sloan.lander.edu:1184 (ESTABLISHED)telnetd 58326 root 2u IPv4 0xc3e0eb60 0t0 TCP bsd2.lander.edu:telnet->sloan.lander.edu:1184 (ESTABLISHED)perl 68936 root 4u IPv4 0xc3dd8c00 0t0 UDP *:eicon-x25ping 81206 nobody 3u IPv4 0xc3e98f00 0t0 ICMP *:*
As you can see, this is not unlike the -a option with netstat. Apart from theobvious differences in the details reported, the big difference is that lsof will notreport connections that do not have files open. For example, if a connection isbeing torn down, all files may already be closed. netstat will still report this con-nection while lsof won’t. The preferred behavior will depend on what informationyou need.
If you specify an address, then only those files related to the address will be listed:
bsd2# lsof [email protected] PID USER FD TYPE DEVICE SIZE/OFF NODE NAMEtelnetd 73825 root 0u IPv4 0xc3e0eb60 0t0 TCP bsd2.lander.edu:telnet->sloan.lander.edu:1177 (ESTABLISHED)telnetd 73825 root 1u IPv4 0xc3e0eb60 0t0 TCP bsd2.lander.edu:telnet->sloan.lander.edu:1177 (ESTABLISHED)telnetd 73825 root 2u IPv4 0xc3e0eb60 0t0 TCP bsd2.lander.edu:telnet->sloan.lander.edu:1177 (ESTABLISHED)
One minor problem with this output is the identification of the telnet user asroot—a consequence of root owning telnetd, the server’s daemon. On some sys-tems, you can use the PID with the -p option to track down the device entry andthen use lsof on the device to discover the owner. Unfortunately, this won’t workon many systems.

Utilities 29
This is the Title of the Book, eMatter EditionCopyright © 2007 O’Reilly & Associates, Inc. All rights reserved.
You can also use lsof to track an FTP transfer. You might want to do this to see ifa transfer is making progress. You would use the -p option to see which files areopen to the process. You can then use -ad to specify the device file descriptoralong with -r to specify repeat mode. lsof will be run repeatedly, and you can seeif the size of the file is changing.
Other uses of lsof are described in the manpage, the FAQ, and a quick-start guidesupplied with the distribution. The latter is probably the best place to begin.
ifconfig
ifconfig is usually thought of as the command used to alter the configuration ofthe network interfaces. But, since you may need to know the current configura-tion of the interfaces before you make changes, ifconfig provides a mechanism toretrieve interface configurations. It will report the configuration of all the inter-faces when called with the -a option or of a single interface when used with theinterface’s name.
Here are the results for the system we just looked at:
bsd1# ifconfig -axl0: flags=8843<UP,BROADCAST,RUNNING,SIMPLEX,MULTICAST> mtu 1500 inet 205.153.60.247 netmask 0xffffff00 broadcast 205.153.60.255 ether 00:10:5a:e3:37:0c media: 10baseT/UTP <half-duplex> supported media: autoselect 100baseTX <full-duplex> 100baseTX <half-duplex> 100baseTX 10baseT/UTP <full-duplex> 10baseT/UTP <half-duplex> 10baseT/UTPxl1: flags=8843<UP,BROADCAST,RUNNING,SIMPLEX,MULTICAST> mtu 1500 inet 172.16.2.13 netmask 0xffffff00 broadcast 172.16.2.255 ether 00:60:97:92:4a:7b media: 10baseT/UTP <half-duplex> supported media: autoselect 100baseTX <full-duplex> 100baseTX <half-duplex> 100baseTX 10baseT/UTP <full-duplex> 10baseT/UTP 10baseT/UTP <half-duplex>lp0: flags=8810<POINTOPOINT,SIMPLEX,MULTICAST> mtu 1500tun0: flags=8010<POINTOPOINT,MULTICAST> mtu 1500sl0: flags=c010<POINTOPOINT,LINK2,MULTICAST> mtu 552ppp0: flags=8010<POINTOPOINT,MULTICAST> mtu 1500lo0: flags=8049<UP,LOOPBACK,RUNNING,MULTICAST> mtu 16384 inet 127.0.0.1 netmask 0xff000000
You can see that for the interfaces xl0 and xl1, we are given a general statusreport. UP indicates that the interface is operational. If UP is missing, the interfaceis down and will not process packets. For Ethernet, the combination ofBROADCAST, SIMPLEX, and MULTICAST is not surprising. The mtu is the largestframe size the interface will handle. Next, we have the IP number, address mask,and broadcast address. The Ethernet address comes next, although some systems(Solaris, for example) will suppress this if you aren’t running the program as root.Finally, we see information about the physical interface connections.

30 Chapter 2: Host Configurations
This is the Title of the Book, eMatter EditionCopyright © 2007 O’Reilly & Associates, Inc. All rights reserved.
You can ignore the entries for lp0, tun0, sl0, and ppp0. In fact, if you don’t wantto see these, you can use the combination -au to list just the interfaces that are up.Similarly, -d is used to list just the interfaces that are down.
While netstat allows you to get basic information on the interfaces, if your goal isconfiguration information, ifconfig is a better choice. First, as you can see, ifconfigsupplies more of that sort of information. Second, on some systems, netstat mayskip interfaces that haven’t been configured. Finally, ifconfig also allows you tochange parameters such as the IP addresses and masks. In particular, ifconfig isfrequently used to shut down an interface. This is roughly equivalent to discon-necting the interface from the network. To shut down an interface, you use thedown option. For example, ifconfig xl1 down will shut down the interface xl1, andifconfig xl1 up will bring it back up. Of course, you must have root privileges touse ifconfig to change configurations.
Since ifconfig is used to configure interfaces, it is typically run automatically byone of the startup scripts when the system is booted. This is something to look forwhen you examine startup scripts. The use of ifconfig is discussed in detail inCraig Hunt’s TCP/IP Network Administration.
arp
The ARP table on a system maps network addresses into MAC addresses. Ofcourse, the ARP table applies only to directly connected devices, i.e., devices onthe local network. Remote devices, i.e., devices that can be reached only bysending traffic through one or more routers, will not be added to the ARP tablesince you can’t communicate with them directly. (However, the appropriate routerinterface will be added.)
Typically, addresses are added or removed automatically. If your system needs tocommunicate with another system on the local network whose MAC address isunknown, your system sends an ARP request, a broadcast packet with the destina-tion’s IP address. If the system is accessible, it will respond with an ARP reply thatincludes its MAC address. Your system adds this to its ARP table and then uses thisinformation to send packets directly to the destination. (A simple way to add anentry for a directly connected device to the ARP table is to ping the device youwant added. ping is discussed in detail in Chapter 3.) Most systems are configuredto drop entries from the ARP table if they aren’t being used, although the length ofthe timeout varies from system to system.
At times, you may want to examine or even change entries in the ARP table. Thearp command allows you to do this. When arp is invoked with the -a option, it

Utilities 31
This is the Title of the Book, eMatter EditionCopyright © 2007 O’Reilly & Associates, Inc. All rights reserved.
reports the current contents of the ARP table. Here is an example from a Solarissystem:
sol1# arp -aNet to Media TableDevice IP Address Mask Flags Phys Addr------ -------------------- --------------- ----- ---------------elxl0 205.153.60.1 255.255.255.255 00:00:a2:c6:0e:42elxl0 205.153.60.53 255.255.255.255 00:e0:29:21:3c:0belxl0 205.153.60.55 255.255.255.255 00:90:27:43:72:70elxl0 mail.lander.edu 255.255.255.255 00:90:27:9c:2d:c6elxl0 sol1 255.255.255.255 SP 00:60:97:58:71:b7elxl0 pm3.lander.edu 255.255.255.255 00:c0:05:04:2d:78elxl0 BASE-ADDRESS.MCAST.NET 240.0.0.0 SM 01:00:5e:00:00:00
The format or details may vary from system to system, but the same basic informa-tion should be provided.
For Solaris, the first column gives the interface for the connection. The next twoare the IP address and its mask. (You can get just IP numbers by using the -noption.) There are four possible flags that may appear in the flags column. An Sindicates a static entry, one that has been manually set rather than discovered. A Pindicates an address that will be published. That is, this machine will provide thisaddress should it receive an ARP request. In this case, the P flag is for the localmachine, so it is natural that the machine would respond with this information.The flags U and M are used for unresolved and multicast addresses, respectively.The final column is the actual Ethernet address.
This information can be useful in several ways. It can be used to determine theEthernet hardware in this computer, as well as the hardware in directly connecteddevices. The IEEE assigns to the manufacturers of Ethernet adapters unique identi-fiers to be used as the first three bytes of their Ethernet addresses. Theseaddresses, known as Organizationally Unique Identifiers (OUI), can be found atthe IEEE web page at http://standards.ieee.org/regauth/oui/index.html. In otherwords, the first three bytes of an Ethernet address identify the manufacturer. In thiscase, by entering on this web page 00 60 97, i.e., the first three bytes of theaddress 00 60 97 58 71 b7, we find that the host sol1 has a 3COM Ethernetadapter. In the same manner we can discover that the host 205.153.60.1 is BayNetworks equipment.
OUI designations are not foolproof. The MAC address of a devicemay have been changed and may not have the manufacturer’s OUI.And even if you can identify the manufacturer, in today’s world ofmerger mania and takeovers, you may see an OUI of an acquiredcompany that you don’t recognize.

32 Chapter 2: Host Configurations
This is the Title of the Book, eMatter EditionCopyright © 2007 O’Reilly & Associates, Inc. All rights reserved.
If some machines on your network are reachable but others aren’t, or connectivitycomes and goes, ARP problems may be the cause. (For an example of an ARPproblem, see Chapter 12.) If you think you might have a problem with IP-to-Ethernet address resolution on your local network, arp is the logical tool to use todiagnose the problem. First, look to see if there is an entry for the destination andif it is correct. If it is missing, you can attempt to add it using the -s option. (Youmust be root.) If the entry is incorrect, you must first delete it with the -d option.Entries added with the -s option will not time out but will be lost on reboot. If youwant to permanently add an entry, you can create a startup script to do this. Inparticular, in a script, arp can use the -f option to read entries from a file.
The usual reason for an incorrect entry in an arp table is a duplicated IP addresssomewhere on your network. Sometimes this is a typing mistake. Sometimes whensetting up their computers, people will copy the configuration from other com-puters, including the supposedly unique IP number. A rogue DHCP server isanother possibility. If you suspect one of your hosts is experiencing problemscaused by a duplicate IP number on the network, you can shut down the inter-face on that computer or unplug it from the network. (This is less drastic thanshutting down the computer, but that will also work.) Then you can ping the IPaddress in question from a second computer. If you get an answer, some othercomputer is using your IP address. Your arp table should give you the Ethernetaddress of the offending machine. Using its OUI will tell you the type of hard-ware. This usually won’t completely locate the problem machine, but it is a start,particularly for unusual hardware.*
Scanning Tools
We’ve already discussed one reason why ps may not give a complete picture ofyour system. There is another much worse possibility. If you are having securityproblems, your copy of ps may be compromised. Crackers sometimes will replaceps with their own version that has been patched to hide their activities. In thisevent, you may have an additional process running on your system that provides abackdoor that won’t show up under ps.
One way of detecting this is to use a port scanner to see which ports are active onyour system. You could choose to do this from the compromised system, but youare probably better off doing this from a remote system known to be secure. Thisassumes, however, that the attacker hasn’t installed a trapdoor on the compro-mised host that is masquerading as a legitimate service on a legitimate port.
* You can also use arp to deliberately publish a bad address. This will shut up a connection request thatwon’t otherwise stop.

Utilities 33
This is the Title of the Book, eMatter EditionCopyright © 2007 O’Reilly & Associates, Inc. All rights reserved.
There are a large number of freely available port scanners. These include pro-grams like gtkportscan, nessus, portscan, and strobe, to name just a few. They gen-erally work by generating a connection request for each port number in the rangebeing tested. If they receive a reply from the port, they add it to their list of openports. Here is an example using portscan:
bsd1# portscan 205.153.63.239 1 10000 -vvThis is a portscanner - Rafael Barrero, Jr.Email me at [email protected] further information. Enjoy!
Port: 7 --> echoPort: 9 --> discardPort: 13 --> daytimePort: 19 --> chargenPort: 21 --> ftpPort: 23 --> telnetPort: 25 --> smtpPort: 37 --> timePort: 79 --> fingerPort: 111 --> sunrpcPort: 513 --> loginPort: 514 --> shell
The arguments are the destination address and beginning and ending port num-bers. The result is a list of port numbers and service names for ports thatanswered.
Figure 2-1 shows another example of a port scanner running under Windows NT.This particular scanner is from Mentor Technologies, Inc., and can be freely down-loaded from http://www.mentortech.com/learn/tools/tools.shtml. It is written in Java,so it can be run on both Windows and Unix machines but will require a Javaruntime environment. It can also be run in command-line mode. Beware, thisscanner is very slow when used with Windows.
Most administrators look on such utilities as tools for crackers, but they can havelegitimate uses as shown here. Keep in mind that the use of these tools has polit-ical implications. You should be safe scanning your own system, but you are onvery shaky ground if you scan other systems. These two tools make no real effortto hide what they are doing, so they are not difficult to detect. Stealth port scan-ners, however, send the packets out of order over extended periods of time andare, consequently, more difficult to detect. Some administrators consider port scansadequate justification for cutting connections or blocking all traffic from a site. Donot use these tools on a system without authorization. Depending on the circum-stances, you may want to notify certain colleagues before you do a port scan evenif you are authorized. In Chapter 12, we will return to port scanners and examineother uses, such as testing firewalls.

34 Chapter 2: Host Configurations
This is the Title of the Book, eMatter EditionCopyright © 2007 O’Reilly & Associates, Inc. All rights reserved.
One last word about these tools. Don’t get caught up in using tools and overlooksimpler tests. For example, you can check to see if sendmail is running by tryingto connect to the SMTP port using telnet. In this example, the test not only tells methat sendmail is running, but it also tells me what version of sendmail is running:
lnx1# telnet 205.153.63.239 25Trying 205.153.63.239...Connected to 205.153.63.239.Escape character is '^]'.220 bsd4.lander.edu ESMTP Sendmail 8.9.3/8.9.3; Wed, 8 Mar 2000 09:38:02 -0500(EST)quit221 bsd4.lander.edu closing connectionConnection closed by foreign host.
In the same spirit:
bsd1# ipfw listipfw: getsockopt(IP_FW_GET): Protocol not available
clearly shows ipfw is not running on this system. All I did was try to use it. Thistype of application-specific testing is discussed in greater detail in Chapter 10.
Figure 2-1. Chesapeake Port Scanner

System Configuration Files 35
This is the Title of the Book, eMatter EditionCopyright © 2007 O’Reilly & Associates, Inc. All rights reserved.
System Configuration FilesA major problem with configuration files under Unix is that there are so many ofthem in so many places. On a multiuser system that provides a variety of services,there may be scores of configuration files scattered among dozens of directories.Even worse, it seems that every implementation of Unix is different. Even dif-ferent releases of the same flavor of Unix may vary. Add to this the complicationsthat multiple applications contribute and you have a major undertaking. If you arerunning a number of different platforms, you have your work cut out for you.
For these reasons, it is unrealistic to attempt to give an exhaustive list of configura-tion files. It is possible, however, to discuss configuration files by categories. Thecategories can then serve as a guide or reminder when you construct your ownlists so that you don’t overlook an important group of files. Just keep in mind thatwhat follows is only a starting point. You will have to discover your particularimplementations of Unix one file at a time.
Basic Configuration Files
There are a number of fairly standard configuration files that seem to show up onmost systems. These are usually, but not always, located in the /etc directory. (Forcustomization, you may see a number of files in the /usr/local or /usr/opt directo-ries or their subdirectories.) When looking at files, this is clearly the first place tostart. Your system will probably include many of the following: defaultdomain,defaultroute, ethers, gateways, host.conf, hostname, hosts, hosts.allow, hosts.equiv,inetd.conf, localhosts, localnetworks, named.boot, netmasks, networks, nodename,nsswitch.conf, protocols, rc, rc.conf, rc.local, resolv.conf, and services. You won’tfind all of these on a single system. Each version and release will have its ownconventions. For example, Solaris puts the host’s name in nodename.* With BSD, itis set in rc.conf. Customizations may change these as well. Thus, the locations andnames of files will vary from system to system.
One starting point might be to scan all the files in /etc and its subdirectories, tryingto identify which ones are relevant. In the long run, you may want to know therole of all the files in /etc, but you don’t need to do this all at once.
There are a few files or groups of files that will be of particular interest. One ofthe most important is inetd.conf. While we can piece together what is probablybeing handled by inetd by using ps in combination with netstat, an examinationof inetd.conf is usually much quicker and safer. On an unfamiliar system, this is
* The hostname may be used in other files as well so don’t try to change the hostname by editing thesefiles. Use the hostname command instead.
36 Chapter 2: Host Configurations
This is the Title of the Book, eMatter EditionCopyright © 2007 O’Reilly & Associates, Inc. All rights reserved.
one of the first places you will want to look. Be sure to compare this to theoutput provided by netstat. Services that you can’t match to running processes orinetd are a cause for concern.
You will also want to examine files like host.conf, resolv.conf, and nsswitch.conf todiscover how name resolution is done. Be sure to examine files that establish trustrelationships like hosts.allow. This is absolutely essential if you are having, or wantto avoid, security problems. (There is more on some of these files in the discus-sion of tcpwrappers in Chapter 11.)
Finally, there is one group of these files, the rc files, that deserve particular atten-tion. These are discussed separately in the later section on startup files and scripts.
Configuration Programs
Over the years, Unix has been heavily criticized because of its terse command-lineinterface. As a result, many GUI applications have been developed. System admin-istration has not escaped this trend. These utilities can be used to display as wellas change system configurations.
Once again, every flavor of Unix will be different. With Solaris, admintool was thetorchbearer for years. In recent years, this has been superseded with SolsticeAdminSuite. With FreeBSD, select the configure item from the menu presentedwhen you run /stand/sysinstall. With Linux you can use linuxconf. Both the menuand GUI versions of this program are common. The list goes on.
Kernel
It’s natural to assume that examining the kernel’s configuration might be an impor-tant first step. But while it may, in fact, be essential in resolving some key issues,in general, it is usually not the most productive place to look. You may want topostpone this until it seems absolutely necessary or you have lots of free time.
As you know, the first step in starting a system is loading and initializing thekernel. Network services rely on the kernel being configured correctly. Some ser-vices will be available only if first enabled in the kernel. While examining thekernel’s configuration won’t tell you which services are actually being used, it cangive some insight into what is not available. For example, if the kernel is not con-figured to forward IP packets, then clearly the system is not being used as arouter, even if it has multiple interfaces. On the other hand, it doesn’t immediatelyfollow that a system is configured as a firewall just because the kernel has beencompiled to support filtering.
System Configuration Files 37
This is the Title of the Book, eMatter EditionCopyright © 2007 O’Reilly & Associates, Inc. All rights reserved.
Changes to the kernel will usually be required only when building a new system,installing a new service or new hardware, or tuning system performance. Changingthe kernel will not normally be needed to simply discover how a system is config-ured. However, changes may be required to use some of the tools described laterin this book. For example, some versions of FreeBSD have not, by default,enabled the Berkeley packet filter pseudodriver. Thus, it is necessary to recompilethe kernel to enable this before some packet capture software, such as tcpdump,can be run on these systems.
To recompile a kernel, you’ll need to consult the documentation for your oper-ating system for the specifics. Usually, recompiling a kernel first requires editingconfiguration files. This may be done manually or with the aid of a utility createdfor this task. For example, with Linux, the command make config runs an interac-tive program that sets appropriate parameters.* BSD uses a program called config.If you can locate the configuration files used, you can see how the kernel wasconfigured. But, if the kernel has been rebuilt a number of times without fol-lowing a consistent naming scheme, this can be surprisingly difficult.
As an example, on BSD-derived systems, the kernel configuration files are usuallyfound in the directory /sys/arch/conf/kernel where arch corresponds to thearchitecture of the system and kernel is the name of the kernel. With FreeBSD,the file might be /sys/i386/conf/GENERIC if the kernel has not been recompiled. InLinux, the configuration file is .config in whatever directory the kernel wasunpacked in, usually /usr/src/linux/.
As you might expect, lines beginning with a # are comments. What you’ll prob-ably want to look for are lines specifying unusual options. For example, it is notdifficult to guess that the following lines from a FreeBSD system indicate that themachine may be used as a firewall:
...# Firewall optionsoptions IPFIREWALLoptions IPFIREWALL_VERBOSE_LIMIT=25...
Some entries can be pretty cryptic, but hopefully there are some comments. TheUnix manpages for a system may describe some options.
Unfortunately, there is very little consistency from one version of Unix to the nexton how such files are named, where they are located, what information they maycontain, or how they are used. For example, Solaris uses the file /etc/system to
* You can also use make xconfig or make menuconfig. These are more interactive, allowing you to goback and change parameters once you have moved on. make config is unforgiving in this respect.

38 Chapter 2: Host Configurations
This is the Title of the Book, eMatter EditionCopyright © 2007 O’Reilly & Associates, Inc. All rights reserved.
hold some directives, although there is little of interest in this file for our pur-poses. IRIX keeps its files in the /var/sysgen/system directory. For Linux, take alook at /etc/conf.modules. The list goes on.*
It is usually possible to examine or change selected system parameters for anexisting kernel. For example, Solaris has the utilities sysdef, prtconf, and ndd. Forour purposes, ndd is the most interesting and should provide the flavor of howsuch utilities work.
Specifically, ndd allows you to get or set driver configuration parameters. You willprobably want to begin by listing configurable options. Specifying the driver (i.e.,/dev/arp, /dev/icmp, /dev/ip, /dev/tcp, and /dev/udp) with the ? option will returnthe parameters available for that driver. Here is an example:
sol1# ndd /dev/arp ?? (read only)arp_cache_report (read only)arp_debug (read and write)arp_cleanup_interval (read and write)
This shows three parameters that can be examined, although only two can bechanged. We can examine an individual parameter by using its name as an argu-ment. For example, we can retrieve the ARP table as shown here:
sol1# ndd /dev/arp arp_cache_reportifname proto addr proto mask hardware addr flagselxl0 205.153.060.053 255.255.255.255 00:e0:29:21:3c:0belxl0 205.153.060.055 255.255.255.255 00:90:27:43:72:70elxl0 205.153.060.001 255.255.255.255 00:00:a2:c6:0e:42elxl0 205.153.060.005 255.255.255.255 00:90:27:9c:2d:c6elxl0 205.153.060.248 255.255.255.255 00:60:97:58:71:b7 PERM PUBLISH MYADDRelxl0 205.153.060.150 255.255.255.255 00:c0:05:04:2d:78elxl0 224.000.000.000 240.000.000.000 01:00:5e:00:00:00 PERM MAPPING
In this instance, it is fairly easy to guess the meaning of what’s returned. (Thisoutput is for the same ARP table that we looked at with the arp command.) Some-times, what’s returned can be quite cryptic. This example returns the value of theIP forwarding parameter:
# ndd /dev/ip ip_forwarding0
It is far from obvious how to interpret this result. In fact, 0 means never forward,1 means always forward, and 2 means forward only when two or more inter-faces are up. I’ve never been able to locate a definitive source for this sort ofinformation, although a number of the options are described in an appendix to
* While general configuration parameters should be in a single file, a huge number of files are actuallyinvolved. If you have access to FreeBSD, you might look at /sys/conf/files to get some idea of this. Thisis a list of the files FreeBSD uses.

System Configuration Files 39
This is the Title of the Book, eMatter EditionCopyright © 2007 O’Reilly & Associates, Inc. All rights reserved.
W. Richard Stevens’ TCP/IP Illustrated, vol. 1. If you want to change parameters,you can invoke the program interactively.
Other versions of Unix will have their own files and utilities. For example, BSDhas the sysctl command. This example shows that IP forwarding is disabled:
bsd1# sysctl net.inet.ip.forwardingnet.inet.ip.forwarding: 0
The manpages provide additional guidance, but to know what to change, you mayhave to delve into the source code. With AIX, there is the no utility. As I have saidbefore, the list goes on.
This brief description should give you a general idea of what’s involved ingleaning information about the kernel, but you will want to go to the appropriatedocumentation for your system. It should be clear that it takes a fair degree ofexperience to extract this kind of information. Occasionally, there is a bit of infor-mation that can be obtained only this way, but, in general, this is not the mostprofitable place to start.
One last comment—if you are intent on examining the behavior of the kernel, youwill almost certainly want to look at the messages it produces when booting. Onmost systems, these can be retrieved with the dmesg command. These can behelpful in determining what network hardware your system has and what drivers ituses. For hardware, however, I generally prefer opening the case and lookinginside. Accessing the CMOS is another approach for discovering the hardware thatdoesn’t require opening the box.
Startup Files and Scripts
Once the kernel is loaded, the swapper or scheduler is started and then the initprocess runs. This process will, in turn, run a number of startup scripts that willstart the various services and do additional configuration chores.
After the standard configuration files, these are the next group of files you mightwant to examine. These will primarily be scripts, but may include configurationfiles read by the scripts. In general, it is a bad idea to bury configuration parame-ters within these scripts, but this is still done at times. You should also be pre-pared to read fairly cryptic shell code. It is hoped that most of these will be eitherin their pristine state, heavily commented, or both.
Look for three things when examining these files. First, some networking parame-ters may be buried in these files. You will not want to miss these. Next, theremay be calls to network configuration utilities such as route or ifconfig. These arefrequently customizations, so read these with a critical eye. Finally, networking

40 Chapter 2: Host Configurations
This is the Title of the Book, eMatter EditionCopyright © 2007 O’Reilly & Associates, Inc. All rights reserved.
applications such as sendmail may be started from these files. I strongly urge thatyou create a list of all applications that are run automatically at startup.
For systems derived from BSD, you should look for files in /etc beginning with rc.Be sure to look at rc.conf and any rc files with extensions indicating a networkingfunction of interest, e.g., rc.firewall. Realize that many of these will be templatesfor services that you may not be using. For example, if you see the file rc.atm,don’t be too disappointed when you can’t find your ATM connection.
Unix systems can typically be booted in one of several different states or run levelsthat determine which services are started. For example, run level 1 is single-usermode and is used for system maintenance. The services started by the different runlevels vary somewhat among the different flavors of Unix. If your system isderived from System V, then the files will be in a half dozen or so directories in/etc. These are named rc1.d, rc2.d, and so forth. The digit indicates the run levelof the system when booted. Networking scripts are usually in rc2.d. In each direc-tory, there will be scripts starting with an S or a K and a two-digit number. Therest of the name should give some indication of the function of the file. Files withnames beginning with an S are started in numerical order when the system isrebooted. When the system shuts down, the files with K are run. (Some versionsof Linux, such as Red Hat, follow this basic approach but group these directoriestogether in the /etc/rc.d directory. Others, such as Debian, follow the System Vapproach.)
There is one serious catch with all this. When versions of operatingsystems change, sometimes the locations of files change. For back-ward compatibility, links may be created to old locations. For exam-ple, on recent versions of Solaris, the network configuration file /etc/hosts is actually a link to /etc/inet/hosts. There are other importantnetwork configuration files that are really in /etc/inet, not /etc. Simi-larly, some of the startup scripts are really links to files in /etc/init.d.If the link is somehow broken, you may find yourself editing thewrong version of a file and wondering why the system is ignoringyour changes.
Other Files
There are several other categories of files that are worth mentioning briefly. If youhave been following the steps just described, you will already have found most ofthese, but it may be worth mentioning them separately just in case you have over-looked something.

System Configuration Files 41
This is the Title of the Book, eMatter EditionCopyright © 2007 O’Reilly & Associates, Inc. All rights reserved.
Application files
Once you have your list of applications that are started automatically, investigatehow each application is configured. When it comes to configuration files, eachapplication will follow its own conventions. The files may be grouped together,reside in a couple of directories, or have some distributed structure that spans anumber of directories. For example, sendmail usually keeps configuration filestogether, usually in /etc or in /etc/mail. DNS may have a couple of files in /etc toget things started, with the database files grouped together somewhere else. Aweb server like apache may have an extensive set of files distributed across anumber of directories, particularly if you consider content. But beware, your par-ticular implementation may vary from the norm—in that case, all bets are off. Youwill need to look for these on an application-by-application and a system-by-system basis.
Security files
It is likely you will have already discovered relevant security files at this point, butif you are having problems, this is something worth revisiting. There are severaldifferent categories to consider:
Trust relationshipsSome files such as /etc/hosts.equiv set up trust relationships with other com-puters. You will definitely want to review these. Keep in mind that users canestablish their own trust relationships, so don’t forget the .rhost file in homedirectories if you are having problems tied to specific users.
Traffic controlA number of files may be tied to general access or the control of traffic. Theseinclude configuration files for applications like tcpwrappers or firewall configu-ration files.
Application specificDon’t forget that individual applications may have security files as well. Forexample, the file /etc/ftpusers may be used by ftp to restrict access. These arevery easy to overlook.
Log files
One last category of files you might want to consider is log files. Strictly speaking,these are not configuration files. Apart from an occasional startup message, thesemay not tell you very much about your system’s configuration. But occasionally,these will provide the missing puzzle piece for resolving a problem. Log files aredescribed in much greater detail in Chapter 11.

42 Chapter 2: Host Configurations
This is the Title of the Book, eMatter EditionCopyright © 2007 O’Reilly & Associates, Inc. All rights reserved.
Microsoft WindowsNetworking with Windows can be quite complicated, since it may involveMicrosoft’s proprietary enhancements. Fortunately, Microsoft’s approach to TCP/IPis pretty standard. As with Unix, you can approach the various versions of Win-dows by looking at configuration parameters or by using utilities to examine thecurrent configuration. For the most part, you won’t be examining files directlyunder Windows, at least for versions later than Windows for Workgroups. Rather,you’ll use the utilities that Windows provides. (There are exceptions. For example,like Unix, Windows has hosts, protocol, and services files.)
If you are looking for basic information quickly, Microsoft provides one of twoprograms for this purpose, depending on which version of Windows you use. Theutility winipcfg is included with Windows 95/98. A command-line program,ipconfig, is included with Windows NT and Windows 2000 and in Microsoft’s TCP/IP stack for Windows for Workgroups. Both programs provide the same informa-tion. winipcfg produces a pop-up window giving the basic parameters such as theEthernet address, the IP address, the default route, the name server’s address, andso on (see Figure 2-2). You can invoke the program by entering the programname from Run on the start menu or in a DOS window. The most basic parame-ters will be displayed. Additional information can be obtained by using the /alloption or by clicking on the More Info >> button.
For ipconfig, start a DOS window. You can use the command switch /all to get theadditional details.
As in Unix, the utilities arp, hostname, and netstat are available. All require a DOSwindow to run. There are a few differences in syntax, but they work basically thesame way and provide the same sorts of information. For example, arp -a will listall the entries in the ARP table:
C:\>arp -a
Interface: 205.153.63.30 on Interface 2 Internet Address Physical Address Type 205.153.63.1 00-00-a2-c6-28-44 dynamic 205.153.63.239 00-60-97-06-22-22 dynamic
The command netstat -r gives the computer’s routing table:
C:\>netstat -r
Route Table===========================================================================Interface List0x1 ........................... MS TCP Loopback interface0x2 ...00 10 5a a1 e9 08 ...... 3Com 3C90x Ethernet Adapter0x3 ...00 00 00 00 00 00 ...... NdisWan Adapter

Microsoft Windows 43
This is the Title of the Book, eMatter EditionCopyright © 2007 O’Reilly & Associates, Inc. All rights reserved.
======================================================================================================================================================Active Routes:Network Destination Netmask Gateway Interface Metric 0.0.0.0 0.0.0.0 205.153.63.1 205.153.63.30 1 127.0.0.0 255.0.0.0 127.0.0.1 127.0.0.1 1 205.153.63.0 255.255.255.0 205.153.63.30 205.153.63.30 1 205.153.63.30 255.255.255.255 127.0.0.1 127.0.0.1 1 205.153.63.255 255.255.255.255 205.153.63.30 205.153.63.30 1 224.0.0.0 224.0.0.0 205.153.63.30 205.153.63.30 1 255.255.255.255 255.255.255.255 205.153.63.30 205.153.63.30 1===========================================================================
Active Connections
Proto Local Address Foreign Address State TCP jsloan:1025 localhost:1028 ESTABLISHED TCP jsloan:1028 localhost:1025 ESTABLISHED TCP jsloan:1184 205.153.60.247:telnet ESTABLISHED TCP jsloan:1264 mail.lander.edu:pop3 TIME_WAIT
As you can see, the format is a little different, but it supplies the same basic infor-mation. (You can also use the command route print to list the routing table.) Youcan use netstat -a to get the active connections and services. There really isn’t an
Figure 2-2. winipcfg

44 Chapter 2: Host Configurations
This is the Title of the Book, eMatter EditionCopyright © 2007 O’Reilly & Associates, Inc. All rights reserved.
option that is analogous to -i in Unix’s netstat (the option to display attached inter-faces). For a listing of the basic syntax and available commands, try netstat /?.
While Windows does not provide ps, both Windows NT and Windows 2000 pro-vide the Task Manager (taskmgr.exe), a utility that can be used to see or controlwhat is running. If you have the Windows Resource Kit, three additional utilities,process viewer (pviewer.exe), process explode (pview.exe), and process monitor(pmon.exe), are worth looking at. All four can be started by entering their namesat Start ➝ Run. The Task Manager can also be started by pressing Ctrl-Alt-Deleteand selecting Task Manager from the menu or by right-clicking on a vacant areaon the task bar at the bottom of the screen and selecting Task Manger from themenu.
You won’t need NT’s administrator privileges to use the DOS-based commandsjust described. If you want to reconfigure the system or if you need additionaldetails, you will need to turn to the utilities provided by Windows. For NT, thiswill require administrator privileges. (You’ll also need administrative privileges tomake changes with arp or route.) This is available from Start ➝ Settings ➝ ControlPanel ➝ Network or by following a similar path from My Computer. Select theappropriate tab and fields as needed.
If you are interested in port scanners, a number are available. I have already men-tioned that the Chesapeake Port Scanner will run under Windows. Scan theInternet for others.
Finally, for the really brave of heart, you can go into the registry. But that’s a sub-ject for another book. (See Paul Robichaux’s Managing the Windows 2000 Reg-istry or Steven Thomas’s Windows NT 4.0 Registry.)

45This is the Title of the Book, eMatter Edition
Copyright © 2007 O’Reilly & Associates, Inc. All rights reserved.
Chapter 3
3Connectivity Testing
This chapter describes simple tests for individual network links and for end-to-endconnectivity between networked devices. The tools described in this chapter areused to show that there is a functioning connection between two devices. Thesetools can also be used for more sophisticated testing, including the discovery ofpath characteristics and the general performance measurements. These additionaluses are described in Chapter 4. Tools used for testing protocol issues related toconnectivity are described in Chapter 9. You may want to turn next to these chap-ters if you need additional information in either of these areas.
This chapter begins with a quick review of cabling practices. If your cabling isn’tadequate, that’s the first thing you need to address. Next, there is a lengthy discus-sion of using ping to test connectivity along with issues that might arise whenusing ping, such as security problems. Next, I describe alternatives to ping. Finally,I discuss alternatives that run on Microsoft Windows platforms.
CablingFor most managers, cabling is the most boring part of a network. Even administra-tors who are normally control freaks will often jump at the opportunity to delegateor cede responsibility for cabling to somebody else. It has none of the excitementof new equipment or new software. It is often hidden away in wiring closets, walls,and ceilings. When it is visible, it is usually in the way or an eyesore. The only timemost managers think about cabling is when it is causing problems. Yet, unless youare one of a very small minority running a wireless network, it is the core of yournetwork. Without adequate cabling, you don’t have a network.
Although this is a book about software tools, not cabling, the topics are not unre-lated. If you have a cabling problem, you may need to turn to the tools described

46 Chapter 3: Connectivity Testing
This is the Title of the Book, eMatter EditionCopyright © 2007 O’Reilly & Associates, Inc. All rights reserved.
later in this chapter to pinpoint the problem. Conversely, to properly use thesetools, you can’t ignore cabling, as it may be the real source of your problems.
If a cable is damaged, it won’t be difficult to recognize the problem. But intermit-tent cabling problems can be a nightmare to solve. The problem may be difficultto recognize as a cabling problem. It may come and go, working correctly most ofthe time. The problem may arise in cables that have been in use for years. Forexample, I once watched a technician try to deal with a small classroom LAN thathad been in use for more than five years and would fail only when the networkwas heavily loaded, i.e., if and only if there was a scheduled class in the room.The problem took weeks before what proved to be a cabling problem wasresolved. In the meantime, several classes were canceled.
A full discussion of cabling practices, standards, and troubleshooting has been thetopic of several books, so this coverage will be very selective. I am assuming thatyou are familiar with the basics. If not, several references in Appendix B provide ageneral but thorough introduction to cabling.
With cabling, as with most things, it is usually preferable to prevent problems thanto have to subsequently deal with them. The best way to avoid cabling problemsis to take a proactive approach. While some of the following suggestions mayseem excessive, the costs are minimal when compared to what can be involved insolving a problem.
Installing New Cabling
If you are faced with a new installation, take the time to be sure it is done cor-rectly from the start. While it is fairly straightforward to wire a few machinestogether in a home office, cabling should not generally be viewed as a do-it-your-self job. Large cabling projects should be left to trained professionals wheneverpossible.
Cabling is usually a large investment. Correcting cabling problems can be verycostly in lost time both for diagnosing the problem and for correcting the problem.Also, cabling must conform to all applicable building and fire codes. For example,using nonplenum cabling in plenum spaces can, in the event of a fire, greatlyendanger the safety of you and your fellow workers. (Plenum cabling is cablingdesigned to be used in plenum spaces, spaces used to recirculate air in a building.It uses materials that have low flame-spread and low smoke-producing properties.)
Cabling can also be very sensitive to its physical environment. Cable that runs toonear fluorescent lights or large motors, e.g., elevator motors, can be problematic.Proximity to power lines can also cause problems. The network cable acts like anantenna, picking up other nearby electrical activity and introducing unwanted sig-nals or noise onto the network. This can be highly intermittent and very difficult to

Cabling 47
This is the Title of the Book, eMatter EditionCopyright © 2007 O’Reilly & Associates, Inc. All rights reserved.
identify. Concerns such as these should be enough to discourage you from doingthe job yourself unless you are very familiar with the task.
Unfortunately, sometimes budget or organizational policies are such that you willhave no choice but to do the job yourself or use internal personnel. If you mustdo the job yourself, take the time to learn the necessary skills before you begin.Get formal training if at all possible. Invest in the appropriate tools and test equip-ment to do the job correctly. And make sure you aren’t violating any building orfire codes.
If the wiring is handled by others, you will need to evaluate whether thosecharged with the task really have the skill to complete the job. Most electriciansand telephone technicians are not familiar with data cabling practices. Worse still,many don’t realize this. So, if asked, they will reassure you they can do the job. Ifpossible, use an installer who has been certified in data cabling. Once you haveidentified a likely candidate, follow up on her references. Ask for the names ofsome past customers and call those customers. If possible, ask to see some of herwork.
When planning a project, you should install extra cable whenever feasible. It ismuch cheaper to pull extra cable as you go than to go back and install new cableor replace a faulty cable. You should also consider technologies that will supporthigher speeds than you are currently using. For example, if you are using 10-MbpsEthernet to the desktop, you should install cable that will support 100 Mbps. In thepast it has been a common recommendation to install fiber-optic cables to thedesk as well, even if you aren’t using fiber technologies at the desk at this time.Recent developments with copper cables have made this more of a judgment call.Certainly, you will want to pull spare fiber to any point your backbone may even-tually include.
If at all feasible, cabling should be certified. This means that each cable is tested toensure that it meets appropriate performance standards for the intended applica-tion. This can be particularly important for spare cabling. When it is time to usethat cable, you don’t want any nasty surprises.
Adequate documentation is essential. Maintenance will be much simpler if youfollow cabling standards and use one of the more common structured cableschemes. More information can be found in the sources given in Appendix B.
Maintaining Existing Cabling
For existing cabling, you won’t have as much latitude as with a new installation.You certainly won’t want to go back and replace working cable just because itdoes not follow some set of standards. But there are several things you can do tomake your life simpler when you eventually encounter problems.

48 Chapter 3: Connectivity Testing
This is the Title of the Book, eMatter EditionCopyright © 2007 O’Reilly & Associates, Inc. All rights reserved.
The first step in cable management is knowing which cable is which and whereeach cable goes. Perhaps the most important tool for the management and trou-bleshooting of cabling is a good label maker. Even if you weren’t around whenthe cable was originally installed, you should be able, over time, to piece togetherthis information. You will also want to collect basic information about each cablesuch as cable types and lengths.
You will want to know which of your cables don’t meet standards. If you haveone of the more sophisticated cable testers, you can self-certify your cabling plant.You probably won’t want to do either of these tasks all at once, but you may beable to do a little at a time. And you will definitely want to do it for any changesor additions you make.
Labeling CablesThis should be a self-explanatory topic. Unfortunately for some, this is not thecase. I have very vivid memories of working with a wiring technician withyears of experience. The individual had worked for major organizations andshould have been quite familiar with labeling practices.
We were installing a student laboratory. The laboratory has a switch mountedin a box on the wall. Cabling went from the box into the wall and then throughcable raceways down the length of the room. Along the raceway, it branchedinto raceways built into computer tables going to the individual computers.The problem should be clear. Once the cable disappears into the wall and race-ways, it is impossible to match the end at the switch with the correspondingend that emerges at the computer.
While going over what needed to be done, I mentioned, needlessly I thought,that the cable should be clearly labeled. This was just one part of my usuallengthy litany. He thought for a moment and then said, “I guess I can do that.”Then a puzzled expression came over his face and he added in dead earnest,“Which end do you want labeled?” I’d like to think he was just putting me on,but I don’t think so.
You should use some method of attaching labels that is reasonably permanent.It can be very discouraging to find several labels lying on the floor beneathyour equipment rack. Also, you should use a meaningful scheme for identify-ing your cables. TIA/EIA-606 Administration Standard for Telecommunica-tions Infrastructure of Commercial Buildings provides one possibility. (SeeAppendix B for more information of TIA/EIA standards.) And, at the risk ofstating the obvious, unless you can see the entire cable at the same time, itshould be labeled at both ends.

Cabling 49
This is the Title of the Book, eMatter EditionCopyright © 2007 O’Reilly & Associates, Inc. All rights reserved.
Testing Cabling
Cable testing can be a simple, quick check for continuity or a complex set of mea-surements that carefully characterizes a cable’s electrical properties. If you are in ahurry to get up and running, you may be limited to simple connectivity tests, butthe more information you collect, the better prepared you will be to deal withfuture problems. If you must be up quickly, make definite plans to return andfinish the job, and stick to those plans.
Link lights
Perhaps the simplest test is to rely on the network interface’s link lights. Almost allnetworking equipment now has status lights that show, when lit, that you havefunctioning connections. If these do not light when you make a connection, youdefinitely have a problem somewhere. Keep in mind, however, a lit link light doesnot necessarily indicate the absence of a problem.
Many devices have additional indicators that give you more information. It is notuncommon to have a transmit light that blinks each time a packet is sent, a receivelight that blinks each time a packet is received, and a collision light that blinkseach time the device detects a collision. To get an idea of what is normal, look atthe lights on other computers on the same network.
Typically, you would expect to see the receive light blinking intermittently as soonas you connect the device to an active network. Generally, anomalous behavior withthe receive light indicates a problem somewhere else on your network. If it doesn’tever light, you may have a problem with your connection to the network. Forexample, you could be plugged into a hub that is not connected to the network. Ifthe light is on all or most of the time, you probably have an overloaded network.
The transmit light should come on whenever you access the network but shouldremain off otherwise. You may be surprised, however, how often a computer willaccess the network. It will almost certainly blink several times when your com-puter is booted. If in doubt, try some basic networking tasks while watching foractivity. If it does not light when you try to access the network, you have prob-lems on that computer. If it stays lit, you not only have a problem but also areprobably flooding the network with packets, thereby causing problems for otherson the network as well. You may want to isolate this machine until the problem isresolved.
In the ideal network, from the user’s perspective at least, the collision light shouldremain relatively inactive. However, excessive collision light flashing or even onethat remains on most of the time may not indicate a problem. A collision is a verybrief event. If the light only remained on for the length of the event, the flashwould be too brief to be seen. Consequently, these lights are designed to remain

50 Chapter 3: Connectivity Testing
This is the Title of the Book, eMatter EditionCopyright © 2007 O’Reilly & Associates, Inc. All rights reserved.
on much longer than the actual event. A collision light that remains on doesn’tnecessarily mean that your network is saturated with collisions. On the other hand,this is something you’ll want to investigate further.
For any of the cases in which you have an indication of a network overload, unlessyour network is completely saturated, you should be able to get some packetsthrough. And you should see similar problems on every computer on that networksegment. If your network is completely saturated, then you may have a malfunc-tioning device that is continuously transmitting. Usually, this can be easily locatedby turning devices off one at a time until the problem suddenly disappears.
If you have an indication of a network overload, you should look at the overallbehavior and structure of your network. A good place to start is with netstat asdiscussed in Chapter 4. For a more thorough discussion of network performancemonitoring, turn to Chapter 8.
One last word of warning—you may see anomalous behavior withany of these lights if your interface is misconfigured or has thewrong driver installed.
Cable testers
A wide variety of cable testers are available. Typically, you get what you pay for.Some check little more than continuity and the cable’s pin-out (that the individualwires are connected to the appropriate pins). Others are extremely sophisticatedand fully characterize the electrical properties of your cabling. These can easilycost thousands of dollars. Better testers typically consist of a pair of units—theactual tester and a termination device that creates a signal loop. These devicescommonly check the following:
Wire-map (or pin-outs)This checks to see if the corresponding pins on each end of a cable are cor-rectly paired. Failure indicates an improperly terminated cable, such as crossedwires or faulty connections.
Near End Cross-Talk (NEXT)This is a measure of how much a signal on one wire interferes with other sig-nals on adjacent wires. High values can indicate improper termination or thewrong type of cable or connectors.
AttenuationThis measures how much of the original signal is lost over the length of thecable. As this is frequency dependent, this should be done at a number of dif-ferent frequencies over the range used. It will determine the maximum data

Cabling 51
This is the Title of the Book, eMatter EditionCopyright © 2007 O’Reilly & Associates, Inc. All rights reserved.
rates the cable can support. Problem causes include the wrong cable type,faulty connectors, and excessive lengths.
ImpedanceThis is the opposition to changes in current and arises from the resistance andthe inductance of the cable. Impedance measurements may be useful forfinding an impedance mismatch that may cause reflected signals at the pointwhere cables are joined. It can also be useful in ascertaining whether or notyou are using the right type of cable.
Attenuation to Cross-talk Ratio (ARC)This is a comparison of signal strength to noise. Values that are too low indi-cate excessive cable length or poor connections.
CapacitanceThis is the electrical field energy that can be stored in the cable. Anomalousvalues can indicate problems with the cable such as shorts or broken wires.
LengthBy timing the return of a signal injected onto the cable, the length of a cablecan be discovered. This can reveal how much cable is hidden in the walls,allowing you to verify that cable lengths are not exceeding the maximumallowed by the applicable standards.
The documentation with your cable tester will provide more details in under-standing and using these tests.
The better cable testers may be preprogrammed with appropriate values for dif-ferent types of cable, allowing you to quickly identify parameters that are out ofspecification. A good tester should also allow you to print or upload measure-ments into a database. This allows you to easily compare results over time to iden-tify changes.
Other cable tests
In general, moving cables around is a poor way to test them. You may jiggle anearby poor connection, changing the state of the problem. But if you can’t afforda cable tester, you may have little choice.
If the cable in question is not installed in the wall, you can try to test it by swap-ping it with a cable known to be good. However, it is usually better to replace aworking cable with a questionable cable and see if things continue to work ratherthan the other way around. This method is more robust to multiple failures. Youwill immediately know the status of the questionable cable. If you replace a ques-tionable cable with a good cable and you still have problems, you clearly have aproblem other than the cable. But you don’t know if it is just a different problemor an additional problem. Of course, this approach ties up more systems.

52 Chapter 3: Connectivity Testing
This is the Title of the Book, eMatter EditionCopyright © 2007 O’Reilly & Associates, Inc. All rights reserved.
Remember, electrical connectivity does not equate to network connectivity. I’veseen technicians plug different subnets into the same hub and then wonder whythe computers can’t communicate.*
Testing AdaptersWhile most problems with adapters, such as Ethernet cards, are configurationerrors, sometimes adapters do fail. Without getting into the actual electronics, thereare generally three simple tests you can make with adapters. However, each hasits drawbacks:
• If you have some doubts about whether the problem is in the adapter or net-work, you might try eliminating the bulk of the network from your tests. Theeasiest approach is to create a two-computer network using another workingcomputer. If you use coaxial cable, simply run a cable known to be goodbetween the computers and terminate each end appropriately. For twistedpair, use a crossover cable, i.e., a patch cable with send and receive crossed.If all is well, the computers should be able to communicate. If they don’t, youshould have a pretty clear idea of where to look next.
The crossover cable approach is analogous to setting up a serial connectionusing a null modem. You may want to first try this method with two workingcomputers just to verify you are using the right kind of cable. You should alsobe sure IP numbers and masks are set appropriately on each computer.Clearly, the drawbacks with this approach are shuffling computers around andfinding the right cable. But if you have a portable computer available, theshuffling isn’t too difficult.
• A second alternative is to use the configuration and test software provided bythe adapter’s manufacturer. If you bought the adapter as a separate purchase,you probably already have this software. If your adapter came with your com-puter, you may have to go to the manufacturer’s web page and download thesoftware. This approach can be helpful, particularly with configuration errors.For example, a combination adapter might be configured for coaxial cablewhile you are trying to use it with twisted pair. You may be able to changeinterrupts, DMA channels, memory locations, bus mastering configuration, andframing types with this software.
Using diagnostic software has a couple of limitations. First, the software maynot check for some problems and may seemingly absolve a faulty card.Second, the software may not be compatible with the operating system you
* There are also circumstances in which this will work, but mixing subnets this way is an extremely badidea.

Software Testing with ping 53
This is the Title of the Book, eMatter EditionCopyright © 2007 O’Reilly & Associates, Inc. All rights reserved.
are using. This is particularly likely if you are using something like Linux orFreeBSD on an Intel platform.
• The third alternative is to swap the card for one that is known to work. Thispresumes that you have a spare card or are willing to remove one fromanother machine. It also presumes that you aren’t having problems that maydamage some other component in the computer or the new card. Even thoughI generally keep spare cards on hand, I usually leave this test until last when-ever possible.
Software Testing with pingThus far, I have described ways to examine electrical and mechanical problems.The tools described in this section, ping and its variants, focus primarily on thesoftware problems and the interaction of software with hardware. When thesetools successfully communicate with remote systems, you have established basicconnectivity. Your problem is almost certainly at a higher level in your system.
With these tools, you begin with the presumption that your hardware is workingcorrectly. If the link light is out on the local host, these tools will tell you nothingyou don’t already know. But if you simply suspect a hardware problem some-where on your network, these tools may help you locate the problem. Once youknow the location of the problem, you will use the techniques previouslydescribed to resolve it. These tools can also provide insight when your hardware ismarginal or when you have intermittent failures.
ping
While there are several useful programs for analyzing connectivity, unquestion-ably ping is the most commonly used program. As it is required by the IP RFC, it isalmost always available as part of the networking software supplied with anysystem. In addition, numerous enhanced versions of ping are available at little orno cost. There are even web sites that will allow you to run ping from their sites.
Moreover, the basic idea has been adapted from IP networks to other protocols. Forexample, Cisco’s implementation of ping has an optional keyword to check connec-tivity among routers using AppleTalk, DECnet, or IPX. ping is nearly universal.
ping was written by Mike Muuss.* Inspired by echo location, the name comes fromsounds sonar makes. The name ping is frequently described as an acronym forPacket InterNet Groper. But, according to Muuss’s web page, the acronym wasapplied to the program after the fact by someone else.
* For more on the background of ping as well as a review of the book The Story About Ping, an allegedallegory of the ping program, visit Muuss’s web page at http://ftp.arl.mil/~mike/ping.html.

54 Chapter 3: Connectivity Testing
This is the Title of the Book, eMatter EditionCopyright © 2007 O’Reilly & Associates, Inc. All rights reserved.
How ping Works
It is, in essence, a simple program based on a simple idea. (Muuss describes it as a1000-line hack that was completed in about one evening.) One network devicesends a request for a reply to another device and records the time the request wassent. The device receiving the request sends a packet back. When the reply isreceived, the round-trip time for packet propagation can be calculated. The receiptof a reply indicates a working connection. This elapsed time provides an indica-tion of the length of the path. Consistency among repeated queries gives an indi-cation of the quality of the connection. Thus, ping answers two basic questions.Do I have a connection? How good is that connection? In this chapter, we willfocus on the first question, returning to the second question in the next chapter.
Clearly, for the program to work, the networking protocol must support thisquery/response mechanism. The ping program is based on Internet Control Mes-sage Protocol (ICMP), part of the TCP/IP protocol. ICMP was designed to passinformation about network performance between network devices and exchangeerror messages. It supports a wide variety of message types, including this query/response mechanism.
The normal operation of ping relies on two specific ICMP messages, ECHO_REQUEST and ECHO_REPLY, but it may respond to ICMP messages other thanECHO_REPLY when appropriate. In theory, all TCP/IP-based network equipmentshould respond to an ECHO_REQUEST by returning the packet to the source, butthis is not always the case.
Simple examples
The default behavior of ping will vary among implementations. Typically, imple-mentations have a wide range of command-line options so that the behavior dis-cussed here is generally available. For example, implementations may default tosending a single packet, a small number of packets, or a continuous stream ofpackets. They may respond with a set of round-trip transmission times or with asimple message. The version of ping that comes with the Solaris operating systemsends, by default, a single ICMP packet. It responds that the destination is alive orthat no answer was received. In this example, an ECHO_REPLY was received:
sol1# ping 205.153.63.30205.153.63.30 is alivesol1#
In this example, no response was received before the program timed out:
sol1# ping www.microsoft.comno answer from microsoft.comsol1#

Software Testing with ping 55
This is the Title of the Book, eMatter EditionCopyright © 2007 O’Reilly & Associates, Inc. All rights reserved.
Note that ping can be used with an IP number or with a hostname, as shown bythese examples.
Other implementations will, by default, repeatedly send ECHO_REQUESTs untilinterrupted. FreeBSD is an example:
bsd1# ping www.bay.comPING www.bay.com (204.80.244.66): 56 data bytes64 bytes from 204.80.244.66: icmp_seq=0 ttl=112 time=180.974 ms64 bytes from 204.80.244.66: icmp_seq=1 ttl=112 time=189.810 ms64 bytes from 204.80.244.66: icmp_seq=2 ttl=112 time=167.653 ms^C--- www.bay.com ping statistics ---3 packets transmitted, 3 packets received, 0% packet lossround-trip min/avg/max/stddev = 167.653/179.479/189.810/9.107 msbsd1#
The execution of the program was interrupted with a Ctrl-C, at which point thesummary statistics were printed. Without an interrupt, the program will continueindefinitely. With the appropriate command-line option, -s, similar output can beobtained with Solaris.
Interpreting results
Before I go into the syntax of ping and the ways it might be used, it is worth get-ting a clear understanding of what results might be returned by ping. The simplestresults are seen with Solaris, a message simply stating, in effect, that the replypacket was received or was not received. With FreeBSD, we receive a great dealmore information. It repeatedly sends packets and reports results for each packet,as well as providing a summary of results. In particular, for each packet we aregiven the size and source of each packet, an ICMP sequence number, a Time-To-Live (TTL) count, and the round-trip times. (The TTL field is explained later.) Ofthese, the sequence number and round-trip times are the most revealing whenevaluating basic connectivity.
When each ECHO_REQUEST packet is sent, the time the packet is sent is recordedin the packet. This is copied into the corresponding ECHO_REPLY packet by theremote host. When an ECHO_REPLY packet is received, the elapsed time is calcu-lated by comparing the current time to the time recorded in the packet, i.e., thetime the packet was sent. This difference, the elapsed time, is reported, along withthe sequence number and the TTL, which comes from the packet’s header. If noECHO_REPLY packet is received that matches a particular sequence number, thatpacket is presumed lost. The size and the variability of elapsed times will dependon the number and speed of intermediate links as well as the congestion on thoselinks.

56 Chapter 3: Connectivity Testing
This is the Title of the Book, eMatter EditionCopyright © 2007 O’Reilly & Associates, Inc. All rights reserved.
An obvious question is “What values are reasonable?” Typically, this is highlydependent on the networks you cross and the amount of activity on those net-works. For example, these times are taken from a PPP link with a 28.8-Kbpsmodem:
64 bytes from 205.153.60.42: icmp_seq=0 ttl=30 time=225.620 ms64 bytes from 205.153.60.42: icmp_seq=1 ttl=30 time=213.652 ms64 bytes from 205.153.60.42: icmp_seq=2 ttl=30 time=215.306 ms64 bytes from 205.153.60.42: icmp_seq=3 ttl=30 time=194.782 ms64 bytes from 205.153.60.42: icmp_seq=4 ttl=30 time=199.562 ms...
The following times were for the same link only moments later:
64 bytes from 205.153.60.42: icmp_seq=0 ttl=30 time=1037.367 ms64 bytes from 205.153.60.42: icmp_seq=1 ttl=30 time=2119.615 ms64 bytes from 205.153.60.42: icmp_seq=2 ttl=30 time=2269.448 ms64 bytes from 205.153.60.42: icmp_seq=3 ttl=30 time=2209.715 ms64 bytes from 205.153.60.42: icmp_seq=4 ttl=30 time=2493.881 ms...
There is nothing wrong here. The difference is that a file download was inprogress on the link during the second set of measurements.
In general, you can expect very good times if you are staying on a LAN. Typically,values should be well under 100 ms and may be less than 10 ms. Once you moveonto the Internet, values may increase dramatically. A coast-to-coast, round-triptime will take at least 60 ms when following a mythical straight-line path with nocongestion. For remote sites, times of 200 ms may be quite good, and times up to500 ms may be acceptable. Much larger times may be a cause for concern. Keep inmind these are very rough numbers.
You can also use ping to calculate a rough estimate of the throughput of a con-nection. (Throughput and related concepts are discussed in greater detail inChapter 4.) Send two packets with different sizes across the path of interest. This isdone with the -s option, which is described later in this chapter. The difference intimes will give an idea of how much longer it takes to send the additional data inthe larger packet. For example, say it takes 30 ms to ping with 100 bytes and 60ms with 1100 bytes. Thus, it takes an additional 30 ms round trip or 15 ms in onedirection to send the additional 1000 bytes or 8000 bits. The throughput is roughly8000 bits per 15 ms or 540,000 bps. The difference between two measurements isused to eliminate overhead. This is extremely crude. It makes no adjustment forother traffic and gives a composite picture for all the links on a path. Don’t try tomake too much out of these numbers.
It may seem that the TTL field could be used to estimate the number of hops on apath. Unfortunately, this is problematic. When a packet is sent, the TTL field is ini-tialized and is subsequently decremented by each router along the path. If it

Software Testing with ping 57
This is the Title of the Book, eMatter EditionCopyright © 2007 O’Reilly & Associates, Inc. All rights reserved.
reaches zero, the packet is discarded. This imposes a finite lifetime on all packets,ensuring that, in the event of a routing loop, the packet won’t remain on the net-work indefinitely. Unfortunately, the TTL field may or may not be reset at theremote machine and, if reset, there is little consistency in what it is set to. Thus,you need to know very system-specific information to use the TTL field to esti-mate the number of hops on a path.
A steady stream of replies with reasonably consistent times is generally an indica-tion of a healthy connection. If packets are being lost or discarded, you will seejumps in the sequence numbers, the missing numbers corresponding to the lostpackets. Occasional packet loss probably isn’t an indication of any real problem.This is particularly true if you are crossing a large number of routers or any con-gested networks. It is particularly common for the first packet in a sequence to belost or have a much higher elapsed time. This behavior is a consequence of theneed to do ARP resolution at each link along the path for the first packet. Sincethe ARP data is cached, subsequent packets do not have this overhead. If, how-ever, you see a large portion of the packets being lost, you may have a problemsomewhere along the path.
The program will also report duplicate and damaged packets. Damaged packetsare a cause for real concern. You will need to shift into troubleshooting mode tolocate the source of the problem. Unless you are trying to ping a broadcastaddress, you should not see duplicate packets. If your computers are configured torespond to ECHO_REQUESTs sent to broadcast addresses, you will see lots ofduplicate packets. With normal use, however, duplicate responses could indicate arouting loop. Unfortunately, ping will only alert you to the problem; its under-lying mechanism cannot explain the cause of such problems.
In some cases you may receive other ICMP error messages. Typically from routers,these can be very informative and helpful. For example, in the following, anattempt is made to reach a device on a nonexistent network:
bsd1# ping 172.16.4.1PING 172.16.4.1 (172.16.4.1): 56 data bytes36 bytes from 172.16.2.1: Destination Host UnreachableVr HL TOS Len ID Flg off TTL Pro cks Src Dst 4 5 00 5400 5031 0 0000 fe 01 0e49 172.16.2.13 172.16.4.1
36 bytes from 172.16.2.1: Destination Host UnreachableVr HL TOS Len ID Flg off TTL Pro cks Src Dst 4 5 00 5400 5034 0 0000 fe 01 0e46 172.16.2.13 172.16.4.1
^C--- 172.16.4.1 ping statistics ---2 packets transmitted, 0 packets received, 100% packet loss

58 Chapter 3: Connectivity Testing
This is the Title of the Book, eMatter EditionCopyright © 2007 O’Reilly & Associates, Inc. All rights reserved.
Since the router has no path to the network, it returns the ICMP DESTINATION_HOST_UNREACHABLE message. In general, you will receive a Destination HostUnreachable warning or a Destination Network Unreachable warning if theproblem is detected on the machine where ping is being run. If the problem isdetected on a device trying to forward a packet, you will receive only aDestination Host Unreachable warning.
In the next example, an attempt is being made to cross a router that has been con-figured to deny traffic from the source:
bsd1# ping 172.16.3.10PING 172.16.3.10 (172.16.3.10): 56 data bytes36 bytes from 172.16.2.1: Communication prohibited by filterVr HL TOS Len ID Flg off TTL Pro cks Src Dst 4 5 00 5400 5618 0 0000 ff 01 0859 172.16.2.13 172.16.3.10
36 bytes from 172.16.2.1: Communication prohibited by filterVr HL TOS Len ID Flg off TTL Pro cks Src Dst 4 5 00 5400 561b 0 0000 ff 01 0856 172.16.2.13 172.16.3.10
^C--- 172.16.3.10 ping statistics ---2 packets transmitted, 0 packets received, 100% packet loss
The warning Communication prohibited by filter indicates the packets arebeing discarded. Be aware that you may be blocked by filters without seeing thismessage. Consider the following example:
bsd1# ping 172.16.3.10PING 172.16.3.10 (172.16.3.10): 56 data bytes^C--- 172.16.3.10 ping statistics ---6 packets transmitted, 0 packets received, 100% packet loss
The same filter was used on the router, but it was applied to traffic leaving thenetwork rather than inbound traffic. Hence, no messages were sent. Unfortu-nately, ping will often be unable to tell you why a packet is unanswered.
While these are the most common ICMP messages you will see, ping may displaya wide variety of messages. A listing of ICMP messages can be found in RFC 792.A good discussion of the more common messages can be found in Eric A. Hall’sInternet Core Protocols: The Definitive Guide. Most ICMP messages are fairly self-explanatory if you are familiar with TCP/IP.
Options
A number of options are generally available with ping. These vary considerablyfrom implementation to implementation. Some of the more germane options aredescribed here.

Software Testing with ping 59
This is the Title of the Book, eMatter EditionCopyright © 2007 O’Reilly & Associates, Inc. All rights reserved.
Several options control the number of or the rate at which packets are sent. The -coption will allow you to specify the number of packets you want to send. Forexample, ping -c10 would send 10 packets and stop. This can be very useful ifyou are running ping from a script.
The commands -f and -l are used to flood packets onto a network. The -f optionsays that packets should be sent as fast as the receiving host can handle them.This can be used to stress-test a link or to get some indication of the comparativeperformance of interfaces. In this example, the program is run for about 10 sec-onds on each of two different destinations:
bsd1# ping -f 172.16.2.12PING 172.16.2.12 (172.16.2.12): 56 data bytes..^C--- 172.16.2.12 ping statistics ---27585 packets transmitted, 27583 packets received, 0% packet lossround-trip min/avg/max/stddev = 0.303/0.310/0.835/0.027 msbsd1# ping -f 172.16.2.20PING 172.16.2.20 (172.16.2.20): 56 data bytes.^C--- 172.16.2.20 ping statistics ---5228 packets transmitted, 5227 packets received, 0% packet lossround-trip min/avg/max/stddev = 1.535/1.736/6.463/0.363 ms
In the first case, the destination was a 200-MHz Pentium with a PCI adapter. In thesecond, the destination was a 50-MHz 486 with an ISA adapter. It is not surprisingthat the first computer was more than five times faster. But remember, it may notbe clear whether the limiting factor is the source or the receiver unless you do mul-tiple tests. Clearly, use of this option could cripple a host. Consequently, the optionrequires root privileges to run and may not be included in some implementations.
The -l option takes a count and sends out that many packets as fast as possible. Itthen falls back to normal mode. This could be used to see how the router handlesa flood of packets. Use of this command is also restricted to root.
The -i option allows the user to specify the amount of time in seconds to waitbetween sending consecutive packets. This could be a useful way to space outpackets for extended runs or for use with scripts. In general, the effect of an occa-sional ping packet is negligible when compared to the traffic already on all but theslowest of links. Repeated packets or packet flooding can, however, add consider-ably to traffic and congestion. For that reason, you should be very circumspect inusing any of these options (and perhaps ping in general).
The amount and form of the data can be controlled to a limited extent. The -noption restricts output to numeric form. This is useful if you are having DNS prob-lems. Implementations also typically include options for more detailed output, typ-ically -v for verbose output, and for fewer details, typically -q and -Q for quietoutput.

60 Chapter 3: Connectivity Testing
This is the Title of the Book, eMatter EditionCopyright © 2007 O’Reilly & Associates, Inc. All rights reserved.
The amount and nature of the data in the frame can be controlled using the -s and-p options. The packet size option, -s, allows you to specify how much data tosend. If set too small, less than 8, there won’t be space in the packet for a time-stamp. Setting the packet size can help in diagnosing a problem caused by pathMaximum Transmission Unit (MTU) settings (the largest frame size that can besent on the path) or fragmentation problems. (Fragmentation is dividing dataamong multiple frames when a single packet is too large to cross a link. It is han-dled by the IP portion of the protocol stack.) The general approach is to increasepacket sizes up to the maximum allowed to see if at some point you have prob-lems. When this option isn’t used, ping defaults to 64 bytes, which may be toosmall a packet to reveal some problems. Also remember that ping does not countthe IP or ICMP header in the specified length so your packets will be 28 byteslarger than you specify.
You could conceivably see MTU problems with protocols, such as PPP, that useescaped characters as well.* With escaped characters, a single character may bereplaced by two characters. The expansion of escaped characters increases the sizeof the data frame and can cause problems with MTU restrictions or fragmentation.
The -p option allows you to specify a pattern for the data included within the packetafter the timestamp. You might use this if you think you have data-dependent prob-lems. The FreeBSD manpage for ping notes that this sort of problem might show upif you lack sufficient “transitions” in your data, i.e., your data is all or almost all onesor all or almost all zeros. Some serial links are particularly vulnerable to this sort ofproblem.
There are a number of other options not discussed here. These provide controlover what interfaces are used, the use of multicast packets, and so forth. The flagspresented here are from FreeBSD and are fairly standard. Be aware, however, thatdifferent implementations may use different flags for these options. Be sure to con-sult your documentation if things don’t work as expected.
Using ping
To isolate problems using ping, you will want to run it repeatedly, changing yourdestination address so that you work your way through each intermediate device toyour destination. You should begin with your loopback interface. Use eitherlocalhost or 127.0.0.1. Next, ping your interface by IP number. (Run ifconfig -aif in doubt.) If either of these fails, you know that you have a problem with the host.
Next, try a host on a local network that you know is operational. Use its IPaddress rather than its hostname. If this fails, there are several possibilities. If other
* Generally there are better ways to deal with problems with PPP. For more information, see Chapter 15in Using and Managing PPP, by Andrew Sun.

Software Testing with ping 61
This is the Title of the Book, eMatter EditionCopyright © 2007 O’Reilly & Associates, Inc. All rights reserved.
hosts are able to communicate on the local network, then you likely have prob-lems with your connection to the network. This could be your interface, the cableto your machine, or your connection to a hub or switch. Of course, you can’t ruleout configuration errors such as media type on the adapter or a bad IP address ormask.
Next, try to reach the same host by name rather than number. If this fails, youalmost certainly have problems with name resolution. Even if you have thisproblem, you can continue using ping to check your network, but you will needto use IP addresses.
Try reaching the near and far interfaces of your router. This will turn up any basicrouting problems you may have on your host or connectivity problems getting toyour router.
If all goes well here, you are ready to ping remote computers. (You will need toknow the IP address of the intermediate devices to do this test. If in doubt, readthe section on traceroute in the next chapter.) Realize, of course, that if you starthaving failures at this point, the problem will likely lie beyond your router. Forexample, your ICMP ECHO_REQUEST packets may reach the remote machine, butit may not have a route to your machine to use for the ICMP ECHO_REPLYpackets.
When faced with failure at this point, your response will depend on who isresponsible for the machines beyond your router. If this is still part of your net-work, you will want to shift your tests to machines on the other side of the routerand try to work in both directions.
If these machines are outside your responsibility or control, you will need to enlistthe help of the appropriate person. Before you contact this person, however, youshould collect as much information as you can. There are three things you maywant to do. First, go back to using IP numbers if you have been using names. Assaid before, if things start working, you have a name resolution problem.
Second, if you were trying to ping a device several hops beyond your router, goback to closer machines and try to zero in on exactly where you first encounteredthe problem.
Finally, be sure to probe from more than one machine. While you may have agreat deal of confidence in your local machine at this point, your discussion withthe remote administrator may go much more smoothly if you can definitely saythat you are seeing this problem from multiple machines instead of just one. Ingeneral, this stepwise approach is the usual approach for this type of problem.
Sometimes, you may be more interested in investigating connectivity over time. Forexample, you might have a connection that seems to come and go. By running
62 Chapter 3: Connectivity Testing
This is the Title of the Book, eMatter EditionCopyright © 2007 O’Reilly & Associates, Inc. All rights reserved.
ping in the background or from a script, you may be able to collect useful informa-tion. For example, with some routing protocols, updates have a way of becomingsynchronized, resulting in periodic loading on the network. If you see increaseddelays, for example every 30 seconds, you might be having that sort of problem.Or, if you lose packets every time someone uses the elevator, you might look at thepath your cable takes.
If you are looking at performance over a long period of time, you will almost cer-tainly want to use the -i option to space out your packets in a more network-friendly manner. This is a reasonable approach to take if you are experiencingoccasional outages and need to document the time and duration of the outages.You should also be aware that over extended periods of time, you may seechanges in the paths the packets follow.
Problems with ping
Up to this point, I have been describing how ping is normally used. I nowdescribe some of the complications faced when using ping.
First, the program does not exist in isolation, but depends on the proper func-tioning of other elements of the network. In particular, ping usually depends uponARP and DNS. As previously noted, if you are using a hostname rather than an IPaddress as your destination, the name of the host will have to be resolved beforeping can send any packets. You can bypass DNS by using IP addresses.
It is also necessary to discover the host’s link-level address for each host along thepath to the destination. Although this is rarely a problem, should ARP resolutionfail, then ping will fail. You could avoid this problem, in part, by using static ARPentries to ensure that the ARP table is correct. A more common problem is that thetime reported by ping for the first packet sent will often be distorted since itreflects both transit times and ARP resolution times. On some networks, the firstpacket will often be lost. You can avoid this problem by sending more than onepacket and ignoring the results for the first packet.
The correct operation of your network will depend on considerations that do notaffect ping. In such situations, ping will work correctly, but you will still have linkproblems. For example, if there are problems with the configuration of the pathMTU, smaller ping packets may zip through the network while larger applicationpackets may be blocked. S. Lee Henry described a problem in which she couldping remote systems but could not download web pages.* While her particular
* “Systems Administration: You Can’t Get There from Here,” Server/Workstation Expert, May 1999. Thisarticle can be found in PDF format at http://sw.expert.com/C4/SE.C4.MAY.99.pdf.

Software Testing with ping 63
This is the Title of the Book, eMatter EditionCopyright © 2007 O’Reilly & Associates, Inc. All rights reserved.
problem was highly unusual, it does point out that a connection can appear to beworking, but still have problems.
The opposite can be true as well. Often ping will fail when the connection worksfor other uses. For various reasons, usually related to security, some system admin-istrators may block ICMP packets in general or ECHO_REQUEST packets in partic-ular. Moreover, this practice seems to be increasing. I’ve even seen a site blockping traffic at its DNS server.
Security and ICMP
Unfortunately, ping in particular, and ICMP packets in general, have been impli-cated in several recent denial-of-service attacks. But while these attacks have usedping, they are not inherently problems with ping. Nonetheless, network adminis-trators have responded as though ping was the problem (or at least the easiestway to deal with the problem), and this will continue to affect how and even ifping can be used in some contexts.
Smurf Attacks
In a Smurf Attack, ICMP ECHO_REQUEST packets are sent to the broadcastaddress of a network. Depending on how hosts are configured on the network,some may attempt to reply to the ECHO_REQUEST. The resulting flood ofresponses may degrade the performance of the network, particularly at the desti-nation host.
With this attack, there are usually three parties involved—the attacker who gener-ates the original request; an intermediary, sometimes called a reflector or multi-plier, that delivers the packet onto the network; and the victim. The attacker usesa forged source address so that the ECHO_REPLY packets are returned, not to theattacker, but to a “spoofed” address, i.e., the victim. The intermediary may beeither a router or a compromised host on the destination network.
Because there are many machines responding to a single request, little of theattacker’s bandwidth is used, while much of the victim’s bandwidth may be used.Attackers have developed tools that allow them to send ECHO_REQUESTs to mul-tiple intermediaries at about the same time. Thus, the victim will be overwhelmedby ECHO_REPLY packets from multiple sources. Notice also that congestion is notlimited to just the victim but may extend through its ISP all the way back to theintermediaries’ networks.
The result of these attacks is that many sites are now blocking ICMP ECHO_REQUEST traffic into their network. Some have gone as far as to block all ICMPtraffic. While understandable, this is not an appropriate response. First, it blockslegitimate uses of these packets, such as checking basic connectivity. Second, it

64 Chapter 3: Connectivity Testing
This is the Title of the Book, eMatter EditionCopyright © 2007 O’Reilly & Associates, Inc. All rights reserved.
may not be effective. In the event of a compromised host, the ECHO_REQUESTmay originate within the network. At best, blocking pings is only a temporarysolution.
A more appropriate response requires taking several steps. First, you should con-figure your routers so they will not forward broadcast traffic onto your networkfrom other networks. How you do this will depend on the type of router youhave, but solutions are available from most vendors.
Second, you may want to configure your hosts so they do not respond to ECHO_REQUESTs sent to broadcast addresses. It is easy to get an idea of which hosts onyour network respond to these broadcasts. First, examine your ARP table, thenping your broadcast address, and then look at your ARP table again for newentries.*
Finally, as a good network citizen, you should install filters on your access routerto prevent packets that have a source address not on your network from leavingyour network. This limits not only Smurf Attacks but also other attacks based onspoofed addresses from originating on your network. These filters should also beapplied to internal routers as well as access routers. (This assumes you are pro-viding forwarding for other networks!)
If you follow these steps, you should not have to disable ICMP traffic. For moreinformation on Smurf Attacks, including information on making these changes,visit http://www.cert.org/advisories/CA-1998-01.html. You might also look at RFC2827.
Ping of Death
The specifications for TCP/IP have a maximum packet size of 65536 octets orbytes. Unfortunately, some operating systems behave in unpredictable ways if theyreceive a larger packet. Systems may hang, crash, or reboot. With a Ping of Death(or Ping o’ Death) Attack, the packet size option for ping is used to send a slightlyoversized packet to the victim’s computer. For example, on some older machines,the command ping -s 65510 172.16.2.1 (use -l rather than -s on old Windows sys-tems) will send a packet, once headers are added, that causes this problem to thehost 172.16.2.1. (Admittedly, I have some misgivings about giving an explicitcommand, but this has been widely published and some of you may want to testyour systems.)
This is basically an operating system problem. Large packets must be fragmentedwhen sent. The destination will put the pieces in a buffer until all the pieces have
* At one time, you could test your site by going to http://www.netscan.org, but this site seems to havedisappeared.

Software Testing with ping 65
This is the Title of the Book, eMatter EditionCopyright © 2007 O’Reilly & Associates, Inc. All rights reserved.
arrived and the packet can be reassembled. Some systems simply don’t do ade-quate bounds checking, allowing memory to be trashed.
Again, this is not really a problem with ping. Any oversized packet, whether it isan ICMP packet, TCP packet, or UDP packet, will cause the same problem in sus-ceptible operating systems. (Even IPX has been mentioned.) All ping does issupply a trivial way to exploit the problem. The correct way to deal with thisproblem is to apply the appropriate patch to your operating system. BlockingICMP packets at your router will not protect you from other oversized packets.Fortunately, most systems have corrected this problem, so you are likely to see itonly if you are running older systems.*
Other problems
Of course, there may be other perceived problems with ping. Since it can be usedto garner information about a network, it can be seen as a threat to networks thatrely on security through obscurity. It may also be seen as generating unwanted orunneeded traffic. For these and previously cited reasons, ICMP traffic is frequentlyblocked at routers.
Blocking is not the only difficulty that routers may create. Routers may assignextremely low priorities to ICMP traffic rather than simply block such traffic. Thisis particularly true for routers implementing quality of service protocols. The resultcan be much higher variability in traffic patterns. Network Address Translation(NAT) can present other difficulties. Cisco’s implementation has the routerresponding to ICMP packets for the first address in the translation pool regardlessof whether it is being used. This might not be what you would have expected.
In general, blocking ICMP packets, even just ECHO_REQUEST packets, is notdesirable. You lose a valuable source of information about your network andinconvenience users who may have a legitimate need for these messages. This isoften done as a stopgap measure in the absence of a more comprehensiveapproach to security.
Interestingly, even if ICMP packets are being blocked, you can still use ping to seeif a host on the local subnet is up. Simply clear the ARP table (typically arp -ad),ping the device, and then examine the ARP table. If the device has been added tothe ARP table, it is up and responding.
One final note about ping. It should be obvious, but ping checks only connec-tivity, not the functionality of the end device. During some network changes, Ionce used ping to check to see if a networked printer had been reconnected yet.When I was finally able to ping the device, I sent a job to the printer. However,
* For more information on this attack, see http://www.cert.org/advisories/CA-1996-26.html.

66 Chapter 3: Connectivity Testing
This is the Title of the Book, eMatter EditionCopyright © 2007 O’Reilly & Associates, Inc. All rights reserved.
my system kept reporting that the job hadn’t printed. I eventually got up andwalked down the hall to the printer to see what was wrong. It had been recon-nected to the network, but someone had left it offline. Be warned, it is very easyto read too much into a successful ping.
Alternatives to ping
Variants to ping fall into two general categories, those that add to ping’s function-ality and those that are alternatives to ping. An example of the first is fping, and anexample of the second is echoping.
fping
Written by Roland Schemers of Stanford University, fping extends ping to supportmultiple hosts in parallel. Typical output is shown in this example:
bsd1# fping 172.16.2.10 172.16.2.11 172.16.2.12 172.16.2.13 172.16.2.14172.16.2.13 is alive172.16.2.10 is alive172.16.2.12 is alive172.16.2.14 is unreachable172.16.2.11 is unreachable
Notice that five hosts are being probed at the same time and that the results arereported in the order replies are received.
This works the same way ping works, through sending and receiving ICMP mes-sages. It is primarily designed to be used with files. Several command-line optionsare available, including the -f option for reading a list of devices to probe from afile and the -u option used to print only those systems that are unreachable. Forexample:
bsd1# fping -u 172.16.2.10 172.16.2.11 172.16.2.12 172.16.2.13 172.16.2.14172.16.2.14172.16.2.11
The utility of this form in a script should be self-evident.
echoping
Several tools similar to ping don’t use ICMP ECHO_REQUEST and ECHO_REPLYpackets. These may provide an alternative to ping in some contexts.
One such program is echoping. It is very similar to ping. It works by sendingpackets to one of several services that may be offered over TCP and UDP—ECHO,DISCARD, CHARGEN, and HTTP. Particularly useful when ICMP messages arebeing blocked, echoping may work where ping fails.

Software Testing with ping 67
This is the Title of the Book, eMatter EditionCopyright © 2007 O’Reilly & Associates, Inc. All rights reserved.
If none of these services is available, echoping cannot be used. Unfortunately,ECHO and CHARGEN have been used in the Fraggle denial of service attacks. Bysending the output from CHARGEN (a character-generation protocol) to ECHO,the network can be flooded. Consequently, many operating systems are nowshipped with these services disabled. Thus, the program may not be as useful asping. With Unix, these services are controlled by inetd and could be enabled ifdesired and if you have access to the destination machine. But these services havelimited value, and you are probably better off disabling them.
In this example, I have previously enabled ECHO on lnx1:
bsd1# echoping -v lnx1
This is echoping, version 2.2.0.
Trying to connect to internet address 205.153.61.177 to transmit 256 bytes...Connected...Sent (256 bytes)...256 bytes read from server.CheckedElapsed time: 0.004488 seconds
This provides basically the same information as ping. The -v option simply pro-vides a few more details. The program defaults to TCP and ECHO. Command-lineoptions allow UDP packet or the other services to be selected.
When ping was first introduced in this chapter, we saw that www.microsoft.comcould not be reached by ping. Nor can it be reached using echoping in its defaultmode. But, as a web server, port 80 should be available. This is in fact the case:
bsd1# echoping -v -h /ms.htm www.microsoft.com:80
This is echoping, version 2.2.0.
Trying to connect to internet address 207.46.130.14 (port 80) to transmit 100bytes...Connected...Sent (100 bytes)...2830 bytes read from server.Elapsed time: 0.269319 seconds
Clearly, Microsoft is blocking ICMP packets. In this example, we could just aseasily have turned to our web browser. Sometimes, however, this is not the case.
An obvious question is “Why would you need such a tool?” If you have beendenied access to a network, should you be using such probes? On the other hand,if you are responsible for the security of a network, you may want to test yourconfiguration. What can users outside your network discover about your network?If this is the case, you’ll need these tools to test your network.

68 Chapter 3: Connectivity Testing
This is the Title of the Book, eMatter EditionCopyright © 2007 O’Reilly & Associates, Inc. All rights reserved.
arping
Another interesting and useful variant of ping is arping. arping uses ARP requestsand replies instead of ICMP packets. Here is an example:
bsd2# arping -v -c3 00:10:7b:66:f7:62This box: Interface: ep0 IP: 172.16.2.236 MAC address: 00:60:97:06:22:22ARPING 00:10:7b:66:f7:6260 bytes from 172.16.2.1 (00:10:7b:66:f7:62): icmp_seq=060 bytes from 172.16.2.1 (00:10:7b:66:f7:62): icmp_seq=160 bytes from 172.16.2.1 (00:10:7b:66:f7:62): icmp_seq=2
--- 00:10:7b:66:f7:62 statistics ---3 packets transmitted, 3 packets received, 0% unanswered2 packets transmitted, 2 packets received, 0% unanswered
In this case, I’ve used the MAC address, but the IP address could also be used. The-v option is for verbose, while -c3 limits the run to three probes. Verbose doesn’treally add a lot to the default output, just the first line identifying the source. Ifyou just want the packets sent, you can use the -q, or quiet, option.
This tool has several uses. First, it is a way to find which IP addresses are beingused. It can also be used to work backward, i.e., to discover IP addresses givenMAC addresses. For example, if you have captured non-IP traffic (e.g., IPX, etc.)and you want to know the IP address for the traffic’s source, you can use arpingwith the MAC address. If you just want to check connectivity, arping is also auseful tool. Since ARP packets won’t be blocked, this should work even whenICMP packets are blocked. You could also use this tool to probe for ARP entries ina router. Of course, due to the nature of ARP, there is not a lot that this tool cantell you about devices not on the local network.
Other programs
There are other programs that can be used to check connectivity. Two aredescribed later in this book. nmap is described in Chapter 6, and hping is describedin Chapter 9. Both are versatile tools that can be used for many purposes.
A number of ping variants and extended versions of ping are also available, bothfreely and commercially. Some extend ping’s functionality to the point that theoriginal functionality seems little more than an afterthought. Although only a fewexamples are described here, don’t be fooled into believing that these are all thereare. A casual web search should turn up many, many more.
Finally, don’t forget the obvious. If you are interested in checking only basic con-nectivity, you can always try programs like telnet or your web browser. While thisis generally not a recommended approach, each problem is different, and youshould use whatever works. (For a discussion of the problems with this approach,see the sidebar “Using Applications to Test Connectivity.”)

Microsoft Windows 69
This is the Title of the Book, eMatter EditionCopyright © 2007 O’Reilly & Associates, Inc. All rights reserved.
Microsoft WindowsThe various versions of Windows include implementations of ping. With theMicrosoft implementation, there are a number of superficial differences in syntaxand somewhat less functionality. Basically, however, it works pretty much as youmight expect. The default is to send four packets, as shown in the two followingexamples. In the first, we successfully ping the host www.cabletron.com:
C:\>ping www.cabletron.com
Pinging www.cabletron.com [204.164.189.90] with 32 bytes of data:
Reply from 204.164.189.90: bytes=32 time=100ms TTL=239Reply from 204.164.189.90: bytes=32 time=100ms TTL=239
Using Applications to Test ConnectivityOne all-too-common way of testing a new installation is to see if networkingapplications are working. The cable is installed and connected, the TCP/IPstack is configured, and then a web browser is started to see if the connectionis working. If you can hit a couple of web sites, then everything is alright andno further testing is needed.
This is understandably an extremely common way to test a connection. It canbe particularly gratifying to see a web page loading on a computer you havejust connected to your network. But it is also an extremely poor way to test aconnection.
One problem is that the software stack you use to test the connection isdesigned to hide problems from users. If a packet is lost, the stack will trans-parently have the lost packet resent without any indication to the user. Youcould have a connection that is losing 90% of its packets. The problem wouldbe immediately obvious when using ping. But with most applications, thiswould show up only as a slow response. Other problems include locallycached information or the presence of proxy servers on the network.
Unfortunately, web browsers seem to be the program of choice for testing aconnection. This, of course, is the worst possible choice. The web’s slowresponse is an accepted fact of life. What technician is going to blame a slowconnection on his shoddy wiring when the alternative is to blame the slow con-nection on the Web? What technician would even consider the possibility thata slow web response is caused by a cable being too close to a fluorescent light?
The only thing testing with an application will really tell you is whether a con-nection is totally down. If you want to know more than that, you will have todo real testing.

70 Chapter 3: Connectivity Testing
This is the Title of the Book, eMatter EditionCopyright © 2007 O’Reilly & Associates, Inc. All rights reserved.
Reply from 204.164.189.90: bytes=32 time=110ms TTL=239Reply from 204.164.189.90: bytes=32 time=90ms TTL=239
C:\>
In the next example, we are unable to reach www.microsoft.com for reasons previ-ously explained:
C:\>ping www.microsoft.com
Pinging microsoft.com [207.46.130.149] with 32 bytes of data:
Request timed out.Request timed out.Request timed out.Request timed out.
Note that this is run in a DOS window. If you use ping without an argument, youwill get a description of the basic syntax and a listing of the various options:
C:\>ping
Usage: ping [-t] [-a] [-n count] [-l size] [-f] [-i TTL] [-v TOS] [-r count] [-s count] [[-j host-list] | [-k host-list]] [-w timeout] destination-list
Options: -t Ping the specifed host until interrupted. -a Resolve addresses to hostnames. -n count Number of echo requests to send. -l size Send buffer size. -f Set Don't Fragment flag in packet. -i TTL Time To Live. -v TOS Type Of Service. -r count Record route for count hops. -s count Timestamp for count hops. -j host-list Loose source route along host-list. -k host-list Strict source route along host-list. -w timeout Timeout in milliseconds to wait for each reply.
Notice that the flooding options, fortunately, are absent and that the -t option isused to get an output similar to that used in most of our examples. The implemen-tation does not provide a summary at the end, however.
In addition to Microsoft’s implementation of ping, numerous other versions—aswell as more generic tools or toolkits that include a ping-like utility—are avail-able. Most are free or modestly priced. Examples include tjping, trayping, andwinping, but many more are available, including some interesting variations. Forexample, trayping monitors a connection in the background. It displays a smallheart in the system tray as long as the connection is up. As availability changes fre-quently, if you need another version of ping, search the Web.

71This is the Title of the Book, eMatter Edition
Copyright © 2007 O’Reilly & Associates, Inc. All rights reserved.
Chapter 4
4Path Characteristics
In the last chapter, we attempted to answer a fundamental question, “Do we havea working network connection?” We used tools such as ping to verify basic con-nectivity. But simple connectivity is not enough for many purposes. For example,an ISP can provide connectivity but not meet your needs or expectations. If yourISP is not providing the level of service you think it should, you will need some-thing to base your complaints on. Or, if the performance of your local networkisn’t adequate, you will want to determine where the bottlenecks are locatedbefore you start implementing expensive upgrades. In this chapter, we will try toanswer the question, “Is our connection performing reasonably?”
We will begin by looking at ways to determine which links or individual connec-tions compose a path. This discussion focuses on the tool traceroute. Next, we willturn to several tools that allow us to identify those links along a path that mightcause problems. Once we have identified individual links of interest, we willexamine some simple ways to further characterize the performance of those links,including estimating the bandwidth of a connection and measuring the availablethroughput.
Path Discovery with tracerouteThis section describes traceroute, a tool used to discover the links along a path.While this is the first step in investigating a path’s behavior and performance, it isuseful for other tasks as well. In the previous discussion of ping, it was suggestedthat you work your way, hop by hop, toward a device you can’t reach to discoverthe point of failure. This assumes that you know the path.
Path discovery is also an essential step in diagnosing routing problems. While youmay fully understand the structure of your network and know what path you want

72 Chapter 4: Path Characteristics
This is the Title of the Book, eMatter EditionCopyright © 2007 O’Reilly & Associates, Inc. All rights reserved.
your packets to take through your network, knowing the path your packets actu-ally take is essential information and may come as a surprise.
Once packets leave your network, you have almost no control over the path theyactually take to their destination. You may know very little about the structure ofadjacent networks. Path discovery can provide a way to discover who their ISP is,how your ISP is connected to the world, and other information such as peeringarrangements. traceroute is the tool of choice for collecting this kind of information.
The traceroute program was written by Van Jacobson and others. It is based on aclever use of the Time-To-Live (TTL) field in the IP packet’s header. The TTL field,described briefly in the last chapter, is used to limit the life of a packet. When arouter fails or is misconfigured, a routing loop or circular path may result. The TTLfield prevents packets from remaining on a network indefinitely should such arouting loop occur. A packet’s TTL field is decremented each time the packetcrosses a router on its way through a network. When its value reaches 0, thepacket is discarded rather than forwarded. When discarded, an ICMP TIME_EXCEEDED message is sent back to the packet’s source to inform the source thatthe packet was discarded. By manipulating the TTL field of the original packet, theprogram traceroute uses information from these ICMP messages to discover pathsthrough a network.
traceroute sends a series of UDP packets with the destination address of thedevice you want a path to.* By default, traceroute sends sets of three packets todiscover each hop. traceroute sets the TTL field in the first three packets to a valueof 1 so that they are discarded by the first router on the path. When the ICMPTIME_EXCEEDED messages are returned by that router, traceroute records thesource IP address of these ICMP messages. This is the IP address of the first hopon the route to the destination.
Next, three packets are sent with their TTL field set to 2. These will be discardedby the second router on the path. The ICMP messages returned by this routerreveal the IP address of the second router on the path. The program proceeds inthis manner until a set of packets finally has a TTL value large enough so that thepackets reach their destination.
Typically, when the probe packets finally have an adequate TTL and reach theirdestination, they will be discarded and an ICMP PORT_UNREACHABLE messagewill be returned. This happens because traceroute sends all its probe packets withwhat should be invalid port numbers, i.e., port numbers that aren’t usually used.To do this, traceroute starts with a very large port number, typically 33434, and
* tracert, a Windows variant of traceroute, uses ICMP rather than UDP. tracert is discussed later in thischapter.

Path Discovery with traceroute 73
This is the Title of the Book, eMatter EditionCopyright © 2007 O’Reilly & Associates, Inc. All rights reserved.
increments this value with each subsequent packet. Thus, each of the threepackets in a set will have three different unlikely port numbers. The receipt ofICMP PORT_UNREACHABLE messages is the signal that the end of the path hasbeen reached. Here is a simple example of using traceroute:
bsd1# traceroute 205.160.97.122traceroute to 205.160.97.122 (205.160.97.122), 30 hops max, 40 byte packets 1 205.153.61.1 (205.153.61.1) 1.162 ms 1.068 ms 1.025 ms 2 cisco (205.153.60.2) 4.249 ms 4.275 ms 4.256 ms 3 165.166.36.17 (165.166.36.17) 4.433 ms 4.521 ms 4.450 ms 4 e0.r01.ia-gnwd.Infoave.Net (165.166.36.33) 5.178 ms 5.173 ms 5.140 ms 5 165.166.125.165 (165.166.125.165) 13.171 ms 13.277 ms 13.352 ms 6 165.166.125.106 (165.166.125.106) 18.395 ms 18.238 ms 18.210 ms 7 atm12-0-10-mp.r01.ia-clma.infoave.net (165.166.126.3) 18.816 ms 18.934 ms 18.893 ms 8 Serial5-1-1.GW1.RDU1.ALTER.NET (157.130.35.69) 26.658 ms 26.484 ms 26.855 ms 9 Fddi12-0-0.GW2.RDU1.ALTER.NET (137.39.40.231) 26.692 ms 26.697 ms 26.490ms10 smatnet-gw2.customer.ALTER.NET (157.130.36.94) 27.736 ms 28.101 ms 27.738 ms11 rcmt1-S10-1-1.sprintsvc.net (205.244.203.50) 33.539 ms 33.219 ms 32.446 ms12 rcmt3-FE0-0.sprintsvc.net (205.244.112.22) 32.641 ms 32.724 ms 32.898 ms13 gwd1-S3-7.sprintsvc.net (205.244.203.13) 46.026 ms 50.724 ms 45.960 ms14 gateway.ais-gwd.com (205.160.96.102) 47.828 ms 50.912 ms 47.823 ms15 pm3-02.ais-gwd.com (205.160.97.41) 63.786 ms 48.432 ms 48.113 ms16 user58.ais-gwd.com (205.160.97.122) 200.910 ms 184.587 ms 202.771 ms
The results should be fairly self-explanatory. This particular path was 16 hopslong. Reverse name lookup is attempted for the IP address of each device, and, ifsuccessful, these names are reported in addition to IP addresses. Times arereported for each of the three probes sent. They are interpreted in the same wayas times with ping. (However, if you just want times for one hop, ping is gener-ally a better choice.)
Although no packets were lost in this example, should a packet be lost, an asteriskis printed in the place of the missing time. In some cases, all three times may bereplaced with asterisks. This can happen for several reasons. First, the router at thishop may not return ICMP TIME_EXCEEDED messages. Second, some older routersmay incorrectly forward packets even though the TTL is 0. A third possibility is thatICMP messages may be given low priority and may not be returned in a timelymanner. Finally, beyond some point of the path, ICMP packets may be blocked.
Other routing problems may exist as well. In some instances traceroute willappend additional messages to the end of lines in the form of an exclamationpoint and a letter. !H, !N, and !P indicate, respectively, that the host, network, orprotocol is unreachable. !F indicates that fragmentation is needed. !S indicates asource route failure.

74 Chapter 4: Path Characteristics
This is the Title of the Book, eMatter EditionCopyright © 2007 O’Reilly & Associates, Inc. All rights reserved.
Options
Two options control how much information is printed. Name resolution can bedisabled with the -n option. This can be useful if name resolution fails for somereason or if you just don’t want to wait on it. The -v option is the verbose flag.With this flag set, the source and packet sizes of the probes will be reported foreach packet. If other ICMP messages are received, they will also be reported, sothis can be an important option when troubleshooting.
Several options may be used to alter the behavior of traceroute, but most arerarely needed. An example is the -m option. The TTL field is an 8-bit numberallowing a maximum of 255 hops. Most implementations of traceroute default totrying only 30 hops before halting. The -m option can be used to change the max-imum number of hops tested to any value up to 255.
As noted earlier, traceroute usually receives a PORT_UNREACHABLE messagewhen it reaches its final destination because it uses a series of unusually large portnumbers as the destination ports. Should the number actually match a port thathas a running service, the PORT_UNREACHABLE message will not be returned.This is rarely a problem since three packets are sent with different port numbers,but, if it is, the -p option lets you specify a different starting port so these ports canbe avoided.
Normally, traceroute sends three probe packets for each TTL value with a timeoutof three seconds for replies. The default number of packets per set can bechanged with the -q option. The default timeout can be changed with the -woption.
Additional options support how packets are routed. See the manpage for detailson these if needed.
Complications with traceroute
The information traceroute supplies has its limitations. In some situations, theresults returned by traceroute have a very short shelf life. This is particularly truefor long paths crossing several networks and ISPs.
You should also recall that a router, by definition, is a computer with multiple net-work interfaces, each with a different IP address. This raises an obvious question:which IP address should be returned for a router? For traceroute, the answer isdictated by the mechanism it uses to discover the route. It can report only theaddress of the interface receiving the packet. This means a quite different path willbe reported if traceroute is run in the reverse direction.

Path Discovery with traceroute 75
This is the Title of the Book, eMatter EditionCopyright © 2007 O’Reilly & Associates, Inc. All rights reserved.
Here is the output when the previous example is run again from what was origi-nally the destination to what was originally the source, i.e., with the source anddestination exchanged:
C:\>tracert 205.153.61.178
Tracing route to 205.153.61.178 over a maximum of 30 hops
1 132 ms 129 ms 129 ms pm3-02.ais-gwd.com [205.160.97.41] 2 137 ms 130 ms 129 ms sprint-cisco-01.ais-gwd.com [205.160.97.1] 3 136 ms 129 ms 139 ms 205.160.96.101 4 145 ms 150 ms 140 ms rcmt3-S4-5.sprintsvc.net [205.244.203.53] 5 155 ms 149 ms 149 ms sl-gw2-rly-5-0-0.sprintlink.net [144.232.184.85] 6 165 ms 149 ms 149 ms sl-bb11-rly-2-1.sprintlink.net [144.232.0.77] 7 465 ms 449 ms 399 ms sl-gw11-dc-8-0-0.sprintlink.net [144.232.7.198] 8 155 ms 159 ms 159 ms sl-infonet-2-0-0-T3.sprintlink.net [144.228.220.6] 9 164 ms 159 ms 159 ms atm4-0-10-mp.r01.ia-gnvl.infoave.net [165.166.126.4] 10 164 ms 169 ms 169 ms atm4-0-30.r1.scgnvl.infoave.net [165.166.125.105] 11 175 ms 179 ms 179 ms 165.166.125.166 12 184 ms 189 ms 195 ms e0.r02.ia-gnwd.Infoave.Net [165.166.36.34] 13 190 ms 179 ms 180 ms 165.166.36.18 14 185 ms 179 ms 179 ms 205.153.60.1 15 174 ms 179 ms 179 ms 205.153.61.178
Trace complete.
There are several obvious differences. First, the format is slightly different becausethis example was run using Microsoft’s implementation of traceroute, tracert. This,however, should present no difficulty.
A closer examination shows that there are more fundamental differences. Thesecond trace is not simply the first trace in reverse order. The IP addresses are notthe same, and the number of hops is different.
There are two things going on here. First, as previously mentioned, traceroutereports the IP number of the interface where the packet arrives. The reverse pathwill use different interfaces on each router, so different IP addresses will bereported. While this can be a bit confusing at first glance, it can be useful. By run-ning traceroute at each end of a connection, a much more complete picture of theconnection can be created.
Figure 4-1 shows the first six hops on the path starting from the source for the firsttrace as reconstructed from the pair of traces. We know the packet originates at205.153.61.178. The first trace shows us the first hop is 205.153.61.1. It leavesthis router on interface 205.153.60.1 for 205.153.60.2. The second of theseaddresses is just the next hop in the first trace. The first address comes from thesecond trace. It is the last hop before the destination. It is also reasonable in that

76 Chapter 4: Path Characteristics
This is the Title of the Book, eMatter EditionCopyright © 2007 O’Reilly & Associates, Inc. All rights reserved.
we have two addresses that are part of the same class C network. With IP net-works, the ends of a link are part of the link and must have IP numbers consis-tent with a single network.
From the first trace, we know packets go from the 205.153.60.2 to 165.166.36.17.From the reverse trace, we are able to deduce that the other end of the 165.166.36.17 link is 165.166.36.18. Or, equivalently, the outbound interface for the 205.153.60.2 router has the address 165.166.36.18.
In the same manner, the next router’s inbound interface is 165.166.36.17, and itsoutbound interface is 165.166.36.34. This can be a little confusing since it appearsthat these last three addresses should be on the same network. On closer examina-tion of this link and adjacent links, it appears that this class B address is using asubnet mask of /20. With this assumption, the addresses are consistent.
Figure 4-1. First six hops on path
205.153.61.1 (F1)ROUTER
205.153.60.1 (R14)
205.153.60.2 (F2)ROUTER
165.166.36.18 (R13)
165.166.36.17 (F3)ROUTER
165.166.36.34 (R12)
165.166.36.33 (F4)ROUTER
165.166.125.166 (R11)
165.166.125.165 (F5)ROUTER
165.166.125.105 (R10)
165.166.125.106 (F6)ROUTER
165.166.126.4 (R9)
F# is from the forward path traceR# is from the reverse path trace
HOST205.153.61.178 (R15)

Path Discovery with traceroute 77
This is the Title of the Book, eMatter EditionCopyright © 2007 O’Reilly & Associates, Inc. All rights reserved.
We can proceed in much the same manner to discover the next few links. How-ever, when we get to the seventh entry in the first trace (or to the eighth entryworking backward in the second trace), the process breaks down. The reason issimple—we have asymmetric paths across the Internet. This also accounts for thedifference in the number of hops between the two traces.
In much the same way we mapped the near end of the path, the remote end canbe reconstructed as well. The paths become asymmetric at the seventh routerwhen working in this direction. Figure 4-2 shows the first four hops. We couldprobably fill in the remaining addresses for each direction by running traceroute tothe specific machine where the route breaks down, but this probably isn’t worththe effort.
One possible surprise in Figure 4-2 is that we have the same IP number, 205.160.97.41, on each interface at the first hop. The explanation is that dial-in access isbeing used. The IP number 205.166.97.122 is assigned to the host when the con-nection is made. 205.160.97.41 must be the access router. This numberingscheme is normal for an access router.
Although we haven’t constructed a complete picture of the path(s) between thesetwo computers, we have laid out the basic connection to our network through our
Figure 4-2. First four hops on reverse path
205.160.97.41 (R1)ROUTER
205.160.97.41 (F15)
205.160.97.1 (R2)ROUTER
205.160.96.102 (F14)
205.160.96.101 (R3)ROUTER
205.244.203.13 (F13)
205.244.203.53 (R4)ROUTER
205.244.112.22 (F12)F# is from the forward path traceR# is from the reverse path trace
HOST205.166.97.122 (F16)

78 Chapter 4: Path Characteristics
This is the Title of the Book, eMatter EditionCopyright © 2007 O’Reilly & Associates, Inc. All rights reserved.
ISP. This is worth working out well in advance of any problems. When you sus-pect problems, you can easily ping these intermediate routers to pinpoint the exactlocation of a problem. This will tell you whether it is your problem or your ISP’sproblem. This can also be nice information to have when you call your ISP.
To construct the bidirectional path using the technique just described, you needaccess to a second, remote computer on the Internet from which you can runtraceroute. Fortunately, this is not a problem. There are a number of sites on theInternet, which, as a service to the network community, will run traceroute foryou. Often called looking glasses, such sites can provide a number of other ser-vices as well. For example, you may be able to test how accessible your local DNSsetup is by observing how well traceroute works. A list of such sites can be foundat http://www.traceroute.org. Alternately, the search string “web traceroute” or“traceroute looking glass” will usually turn up a number of such sites with mostsearch engines.
In theory, there is an alternative way to find this type of information with someimplementations of traceroute. Some versions of traceroute support loose sourcerouting, the ability to specify one or more intermediate hops that the packets mustgo through. This allows a packet to be diverted through a specific router on itsway to its destination. (Strict source routing may also be available. This allows theuser to specify an exact path through a network. While loose source routing cantake any path that includes the specified hops, strict source routing must exactlyfollow the given path.)
To construct a detailed list of all devices on a path, the approach is to usetraceroute to find a path from the source host to itself, specifying a route througha remote device. Packets leave the host with the remote device as their initial des-tination. When the packets arrive at the remote device, that device replaces thedestination address with the source’s address, and the packets are redirected backto the source. Thus, you get a picture of the path both coming and going. (Ofcourse, source routing is not limited to just this combination of addresses.)
At least, that is how it should work in theory. In practice, many devices no longersupport source routing. Unfortunately, source routing has been used in IPspoofing attacks. Packets sent with a spoofed source address can be diverted sothey pass through the spoofed device’s network. This approach will sometimesslip packets past firewalls since the packet seems to be coming from the rightplace.
This is shown in Figure 4-3. Without source routing, the packet would come intothe firewall on the wrong interface and be discarded. With source routing, thepacket arrives on the correct interface and passes through the firewall. Because ofproblems like this, source routing is frequently disabled.

Path Performance 79
This is the Title of the Book, eMatter EditionCopyright © 2007 O’Reilly & Associates, Inc. All rights reserved.
One final word of warning regarding traceroute—buggy or nonstandard imple-mentations exist. Nonstandard isn’t necessarily bad; it just means you need towatch for differences. For example, see the discussion of tracert later in thischapter. Buggy implementations, however, can really mislead you.
Path PerformanceOnce you have a picture of the path your traffic is taking, the next step in testingis to get some basic performance numbers. Evaluating path performance will meandoing three types of measurements. Bandwidth measurements will give you anidea of the hardware capabilities of your network, such as the maximum capacityof your network. Throughput measurements will help you discover what capacityyour network provides in practice, i.e., how much of the maximum is actuallyavailable. Traffic measurements will give you an idea of how the capacity is beingused.
My goal in this section is not a definitive analysis of performance. Rather, Idescribe ways to collect some general numbers that can be used to see if you havea reasonable level of performance or if you need to delve deeper. If you want togo beyond the quick-and-dirty approaches described here, you might consider
Figure 4-3. IP source spoofing
Default pathPath with source routing
Network with true source
Firewall
Destination host
Network with spoofed source

80 Chapter 4: Path Characteristics
This is the Title of the Book, eMatter EditionCopyright © 2007 O’Reilly & Associates, Inc. All rights reserved.
some of the more advanced tools described in Chapter 9. The tools mentionedhere should help you focus your efforts.
Performance Measurements
Several terms are used, sometimes inconsistently, to describe the capacity or per-formance of a link. Without getting too formal, let’s review some of these terms toavoid potential confusion.
Two factors determine how long it takes to send a packet or frame across a singlelink. The amount of time it takes to put the signal onto the cable is known as thetransmission time or transmission delay. This will depend on the transmission rate(or interface speed) and the size of the frame. The amount of time it takes for thesignal to travel across the cable is known as the propagation time or propagationdelay. Propagation time is determined by the type of media used and the distanceinvolved. It often comes as a surprise that a signal transmitted at 100 Mbps willhave the same propagation delay as a signal transmitted at 10 Mbps. The firstsignal is being transmitted 10 times as fast, but, once it is on a cable, it doesn’tpropagate any faster. That is, the difference between 10 Mbps and 100 Mbps is notthe speed the bits travel, but the length of the bits.
Once we move to multihop paths, a third consideration enters the picture—thedelay introduced from processing packets at intermediate devices such as routersand switches. This is usually called the queuing delay since, for the most part, itarises from the time packets spend in queues within the device. The total delay indelivering a packet is the sum of these three delays. Transmission and propaga-tion delays are usually quite predictable and stable. Queuing delays, however, canintroduce considerable variability.
The term bandwidth is typically used to describe the capacity of a link. For ourpurposes, this is the transmission rate for the link.* If we can transmit onto a linkat 10 Mbps, then we say we have a bandwidth of 10 Mbps.
Throughput is a measure of the amount of data that can be sent over a link in agiven amount of time. Throughput estimates, typically obtained through measure-ments based on the bulk transfer of data, are usually expressed in bits per secondor packets per second. Throughput is frequently used as an estimate of the band-width of a network, but bandwidth and throughput are really two different things.Throughput measurement may be affected by considerable overhead that is notincluded in bandwidth measurements. Consequently, throughput is a more real-istic estimator of the actual performance you will see.
* My apologies to any purist offended by my somewhat relaxed, pragmatic definition of bandwidth.

Path Performance 81
This is the Title of the Book, eMatter EditionCopyright © 2007 O’Reilly & Associates, Inc. All rights reserved.
Throughput is generally an end-to-end measurement. When dealing with multihoppaths, however, the bandwidths may vary from link to link. The bottleneck band-width is the bandwidth of the slowest link on a path, i.e., the link with the lowestbandwidth. (While introduced here, bottleneck analysis is discussed in greaterdetail in Chapter 12.)
Additional metrics will sometimes be needed. The best choice is usually taskdependent. If you are sending real-time audio packets over a long link, you maywant to minimize both delay and variability in the delay. If you are using FTP todo bulk transfers, you may be more concerned with the throughput. If you areevaluating the quality of your link to the Internet, you may want to look at bottle-neck bandwidth for the path. The development of reliable metrics is an active areaof research.
Bandwidth Measurements
We will begin by looking at ways to estimate bandwidth. Bandwidth really mea-sures the capabilities of our hardware. If bandwidth is not adequate, you will needto reexamine your equipment.
ping revisited
The preceding discussion should make clear that the times returned by ping,although frequently described as propagation delays, really are the sum of thetransmission, propagation, and queuing delays. In the last chapter, we used pingto calculate a rough estimate of the bandwidth of a connection and noted that thistreatment is limited since it gives a composite number.
We can refine this process and use it to estimate the bandwidth for a link along apath. The basic idea is to first calculate the path behavior up to the device on theclosest end of the link and then calculate the path behavior to the device at the farend of the link. The difference is then used to estimate the bandwidth for the linkin question. Figure 4-4 shows the basic arrangement.
Figure 4-4. Link traffic measurements
Router Router Router RouterLink ofinterest
Traffic to near end of link
Traffic to far end of link

82 Chapter 4: Path Characteristics
This is the Title of the Book, eMatter EditionCopyright © 2007 O’Reilly & Associates, Inc. All rights reserved.
This process requires using ping four times. First, ping the near end of a link withtwo different packet sizes. The difference in the times will eliminate the propaga-tion and queuing delays along the path (assuming they haven’t changed toomuch) leaving the time required to transmit the additional data in the largerpacket. Next, use the same two packet sizes to ping the far end of the link. Thedifference in the times will again eliminate the overhead. Finally, the difference inthese two differences will be the amount of time to send the additional data overthe last link in the path. This is the round-trip time. Divide this number by twoand you have the time required to send the additional data in one direction overthe link. The bandwidth is simply the amount of additional data sent divided bythis last calculated time.*
Table 4-1 shows the raw data for the second and third hops along the path shownin Figure 4-1. Packets sizes are 100 and 1100 bytes.
Table 4-2 shows the calculated results. The time difference was divided by two(RRT correction), then divided into 8000 bits (the size of the data in bits), and thenmultiplied by 1000 (milliseconds-to-seconds correction.). The results, in bps, werethen converted to Mbps. If several sets of packets are sent, the minimums of thetimes can be used to improve the estimate.
Clearly, doing this manually is confusing, tedious, and prone to errors. Fortu-nately, several tools based on this approach greatly simplify the process. Thesetools also improve accuracy by using multiple packets.
* The formula for bandwidth is . The larger and smallerpacket sizes are and bytes, and are the ping times for the larger and smaller packetsto the nearer interface in seconds, and and are the ping times for the larger and smaller packetsto the distant interface in seconds. The result is in bits per second.
Table 4-1. Raw data
IP address Time for 100 bytes Time for 1100 bytes
205.153.61.1 1.380 ms 5.805 ms
205.153.60.2 4.985 ms 12.823 ms
165.166.36.17 8.621 ms 26.713 ms
Table 4-2. Calculated bandwidth
Near link Far link Time difference Estimated bandwidth
205.153.61.1 205.153.60.2 3.413 ms 4.69 Mbps
205.153.60.2 165.166.36.17 10.254 ms 1.56 Mbps
BW 16 Pl Ps–( ) t2l t2s t1l t1s+––( )⁄×=Pl Ps t1l t1s
t2l t2s

Path Performance 83
This is the Title of the Book, eMatter EditionCopyright © 2007 O’Reilly & Associates, Inc. All rights reserved.
pathchar
One tool that automates this process is pathchar. This tool, written by VanJacobson several years ago, seems to be in a state of limbo. It has, for severalyears, been available as an alpha release, but nothing seems to have been releasedsince. Several sets of notes or draft notes are available on the Web, but thereappears to be no manpage for the program. Nonetheless, the program remainsavailable and has been ported to several platforms. Fortunately, a couple of alter-native implementations of the program have recently become available. Theseinclude bing, pchar, clink, and tmetric.
One strength of pathchar and its variants is that they can discover the bandwidthof each link along a path using software at only one end of the path. The methodused is basically that described earlier for ping, but pathchar uses a large numberof packets of various sizes. Here is an example of running pathchar :
bsd1# pathchar 165.166.0.2pathchar to 165.166.0.2 (165.166.0.2) mtu limited to 1500 bytes at local host doing 32 probes at each of 45 sizes (64 to 1500 by 32) 0 205.153.60.247 (205.153.60.247) | 4.3 Mb/s, 1.55 ms (5.88 ms) 1 cisco (205.153.60.2) | 1.5 Mb/s, -144 us (13.5 ms) 2 165.166.36.17 (165.166.36.17) | 10 Mb/s, 242 us (15.2 ms) 3 e0.r01.ia-gnwd.Infoave.Net (165.166.36.33) | 1.2 Mb/s, 3.86 ms (32.7 ms) 4 165.166.125.165 (165.166.125.165) | ?? b/s, 2.56 ms (37.7 ms) 5 165.166.125.106 (165.166.125.106) | 45 Mb/s, 1.85 ms (41.6 ms), +q 3.20 ms (18.1 KB) *4 6 atm1-0-5.r01.ncchrl.infoave.net (165.166.126.1) | 17 Mb/s, 0.94 ms (44.3 ms), +q 5.83 ms (12.1 KB) *2 7 h10-1-0.r01.ia-chrl.infoave.net (165.166.125.33) | ?? b/s, 89 us (44.3 ms), 1% dropped 8 dns1.InfoAve.Net (165.166.0.2)8 hops, rtt 21.9 ms (44.3 ms), bottleneck 1.2 Mb/s, pipe 10372 bytes
As pathchar runs, it first displays a message describing how the probing will bedone. From the third line of output, we see that pathchar is using 45 differentpacket sizes ranging from 64 to 1500 bytes. (1500 is the local host’s MTU.) It uses32 different sets of these packets for each hop. Thus, this eight-hop run generated11,520 test packets plus an equal number of replies.
The bandwidth and delay for each link is given. pathchar may also include informa-tion on the queuing delay (links 5 and 6 in this example). As you can see, pathcharis not always successful in estimating the bandwidth (see the links numbered 4 and

84 Chapter 4: Path Characteristics
This is the Title of the Book, eMatter EditionCopyright © 2007 O’Reilly & Associates, Inc. All rights reserved.
7) or the delay (see link numbered 1). With this information, we could go back toFigure 4-1 and fill in link speeds for most links.
As pathchar runs, it shows a countdown as it sends out each packet. It will dis-play a line that looks something like this:
1: 31 288 0 3
The 1: refers to the hop count and will be incremented for each successive hopon the path. The next number counts down, giving the number of sets of probesremaining to be run for this link. The third number is the size of the currentpacket being sent. Both the second and third numbers should be changing rap-idly. The last two numbers give the number of packets that have been dropped sofar on this link and the average round-trip time for this link.
When the probes for a hop are complete, this line is replaced with a line givingthe bandwidth, incremental propagation delay, and round-trip time. pathchar usesthe minimum of the observed delays to improve its estimate of bandwidth.
Several options are available with pathchar. Of greatest interest are those that con-trol the number and size of the probe packet used. The option -q allows the userto specify the number of sets of packets to send. The options -m and -M controlthe minimum and maximum packet sizes, respectively. The option -Q controls thestep size from the smallest to largest packet sizes. As a general rule of thumb,more packets are required for greater accuracy, particularly on busy links. Theoption -n turns off DNS resolution, and the option -v provides for more output.
pathchar is not without problems. One problem for pathchar is hidden orunknown transmission points. The first link reports a bandwidth of 4.3 Mbps.From traceroute, we only know of the host and the router at the end of the link.This is actually a path across a switched LAN with three segments and two addi-tional transmission points at the switches. The packet is transmitted onto a 10-Mbps network, then onto a 100-Mbps backbone, and then back onto a 10 Mbpsnetwork before reaching the first router. Consequently, there are three sets oftransmission delays rather than just one, and a smaller than expected bandwidth isreported.
You will see this problem with store-and-forward switches, but it is not appre-ciable with cut-through switches. (See the sidebar “Types of Switches” if you areunfamiliar with the difference between cut-through and store-and-forwardswitches.) In a test in which another switch, configured for cut-through, wasadded to this network, almost no change was seen in the estimated bandwidthwith pathchar. When the switch was reconfigured as a store-and-forward switch,the reported bandwidth on the first link dropped to 3.0 Mbps.

Path Performance 85
This is the Title of the Book, eMatter EditionCopyright © 2007 O’Reilly & Associates, Inc. All rights reserved.
This creates a problem if you are evaluating an ISP. For example, it might appearthat the fourth link is too slow if the contract specifies T1 service. This might bethe case, but it could just be a case of a hidden transmission point. Without moreinformation, this isn’t clear.
Finally, you should be extremely circumspect about running pathchar. It can gen-erate a huge amount of traffic. The preceding run took about 40 minutes to com-plete. It was run from a host on a university campus while the campus was closedfor Christmas break and largely deserted. If you are crossing a slow link and havea high path MTU, the amount of traffic can effectively swamp the link. Asym-metric routes, routes in which the path to a device is different from the path back,changing routes, links using tunneling, or links with additional padding added canall cause problems.
bing
One alternative to pathchar is bing, a program written by Pierre Beyssac. Wherepathchar gives the bandwidth for every link along a path, bing is designed tomeasure point-to-point bandwidth. Typically, you would run traceroute first if you
Types of SwitchesDevices may minimize queuing delays by forwarding frames as soon as possi-ble. In some cases, a device may begin retransmitting a frame before it has fin-ished receiving that frame. With Ethernet frames, for example, the destinationaddress is the first field in the header. Once this has been read, the out interfaceis known and transmission can begin even though much of the original frameis still being received. Devices that use this scheme are called cut-throughdevices.
The alternative is to wait until the entire frame has arrived before retransmittingit. Switches that use this approach are known as store-and-forward devices.
Cut-through devices have faster throughput than store-and-forward switchesbecause they begin retransmitting sooner. Unfortunately, cut-through devicesmay forward damaged frames, frames that a store-and-forward switch wouldhave discarded. The problem is that the damage may not be discovered by thecut-through device until after retransmission has already begun. Store-and-forward devices introduce longer delays but are less likely to transmit damagedframes since they can examine the entire frame before retransmitting it. Store-and-forward technology is also required if interfaces operate at differentspeeds. Often devices can be configured to operate in either mode.

86 Chapter 4: Path Characteristics
This is the Title of the Book, eMatter EditionCopyright © 2007 O’Reilly & Associates, Inc. All rights reserved.
don’t already know the links along a path. Then you would run bing specifyingthe near and far ends of the link of interest on the command line. This examplemeasures the bandwidth of the third hop in Figure 4-1:
bsd1# bing -e10 -c1 205.153.60.2 165.166.36.17BING 205.153.60.2 (205.153.60.2) and 165.166.36.17 (165.166.36.17) 44 and 108 data bytes1024 bits in 0.835ms: 1226347bps, 0.000815ms per bit1024 bits in 0.671ms: 1526080bps, 0.000655ms per bit1024 bits in 0.664ms: 1542169bps, 0.000648ms per bit1024 bits in 0.658ms: 1556231bps, 0.000643ms per bit1024 bits in 0.627ms: 1633174bps, 0.000612ms per bit1024 bits in 0.682ms: 1501466bps, 0.000666ms per bit1024 bits in 0.685ms: 1494891bps, 0.000669ms per bit1024 bits in 0.605ms: 1692562bps, 0.000591ms per bit1024 bits in 0.618ms: 1656958bps, 0.000604ms per bit
--- 205.153.60.2 statistics ---bytes out in dup loss rtt (ms): min avg max 44 10 10 0% 3.385 3.421 3.551 108 10 10 0% 3.638 3.684 3.762
--- 165.166.36.17 statistics ---bytes out in dup loss rtt (ms): min avg max 44 10 10 0% 3.926 3.986 4.050 108 10 10 0% 4.797 4.918 4.986
--- estimated link characteristics ---estimated throughput 1656958bpsminimum delay per packet 0.116ms (192 bits)
average statistics (experimental) :packet loss: small 0%, big 0%, total 0%average throughput 1528358bpsaverage delay per packet 0.140ms (232 bits)weighted average throughput 1528358bps
resetting after 10 samples.
The output begins with the addresses and packet sizes followed by lines for eachpair of probes. Next, bing returns round-trip times and packet loss data. Finally, itreturns several estimates of throughput.*
In this particular example, we have specified the options -e10 and -c1, which limitthe probe to one cycle using 10 pairs of packets. Alternatively, you can omit theseoptions and watch the output. When the process seems to have stabilized, enter aCtrl-C to terminate the program. The summary results will then be printed. Inter-pretation of these results should be self-explanatory.
* The observant reader will notice that bing reported throughput, not bandwidth. Unfortunately, there isa lot of ambiguity and inconsistency surrounding these terms.

Path Performance 87
This is the Title of the Book, eMatter EditionCopyright © 2007 O’Reilly & Associates, Inc. All rights reserved.
bing allows for a number of fairly standard options. These options allow control-ling the number of packet sizes, suppressing name resolution, controlling routing,and obtaining verbose output. See the manpage if you have need of these options.
Because bing uses the same mechanism as pathchar, it will suffer the same prob-lems with hidden transmission points. Thus, you should be circumspect whenusing it if you don’t fully understand the topology of the network. While bingdoes not generate nearly as much traffic as pathchar, it can still place strains on anetwork.
Packet pair software
One alternative approach that is useful for measuring bottleneck bandwidth is thepacket pair or packet stretch approach. With this approach, two packets that arethe same size are transmitted back-to-back. As they cross the network, wheneverthey come to a slower link, the second packet will have to wait while the first isbeing transmitted. This increases the time between the transmission of the packetsat this point on the network. If the packets go onto another faster link, the separa-tion is preserved. If the packets subsequently go onto a slower link, then the sepa-ration will increase. When the packets arrive at their destination, the bandwidth ofthe slowest link can be calculated from the amount of separation and the size ofthe packets.
It would appear that getting this method to work requires software at both ends ofthe link. In fact, some implementations of packet pair software work this way. How-ever, using software at both ends is not absolutely necessary since the acknowledg-ment packets provided with some protocols should preserve the separation.
One assumption of this algorithm is that packets will stay together as they movethrough the network. If other packets are queued between the two packets, theseparation will increase. To avoid this problem, a number of packet pairs are sentthrough the network with the assumption that at least one pair will stay together.This will be the pair with the minimum separation.
Several implementations of this algorithm exist. bprobe and cprobe are two exam-ples. At the time this was written, these were available only for the IRIX operatingsystem on SGI computers. Since the source code is available, this may havechanged by the time you read this.
Compared to the pathchar approach, the packet pair approach will find only thebottleneck bandwidth rather than the bandwidth of an arbitrary link. However, itdoes not suffer from the hidden hop problem. Nor does it create the levels oftraffic characteristic of pathchar. This is a technology to watch.

88 Chapter 4: Path Characteristics
This is the Title of the Book, eMatter EditionCopyright © 2007 O’Reilly & Associates, Inc. All rights reserved.
Throughput Measurements
Estimating bandwidth can provide a quick overview of hardware performance. Butif your bandwidth is not adequate, you are limited in what you can actually do—install faster hardware or contract for faster service. In practice, it is often not theraw bandwidth of the network but the bandwidth that is actually available that isof interest. That is, you may be more interested in the throughput that you canactually achieve.
Poor throughput can result not only from inadequate hardware but also fromarchitectural issues such as network design. For example, a broadcast domain thatis too large will create problems despite otherwise adequate hardware. The solu-tion is to redesign your network, breaking apart or segmenting such domains onceyou have a clear understanding of traffic patterns.
Equipment configuration errors may also cause poor performance. For example,some Ethernet devices may support full duplex communication if correctly config-ured but will fall back to half duplex otherwise. The first step toward a solution isrecognizing the misconfiguration. Throughput tests are the next logical step inexamining your network.
Throughput is typically measured by timing the transfer of a large block of data.This may be called the bulk transfer capacity of the link. There are a number ofprograms in this class besides those described here. The approach typicallyrequires software at each end of the link. Because the software usually works atthe application level, it tests not only the network but also your hardware and soft-ware at the endpoints.
Since performance depends on several parts, when you identify that a problemexists, you won’t immediately know where the problem is. Initially, you might tryswitching to a different set of machines with different implementations to localizethe problem. Before you get too caught up in your testing, you’ll want to look atthe makeup of the actual traffic as described later in this chapter. In extreme cases,you may need some of the more advanced tools described later in this book.
One simple quick-and-dirty test is to use an application like FTP. Transfer a filewith FTP and see what numbers it reports. You’ll need to convert these to a bitrate, but that is straightforward. For example, here is the final line for a filetransfer:
1294522 bytes received in 1.44 secs (8.8e+02 Kbytes/sec)
Convert 1,294,522 bytes to bits by multiplying by 8 and then dividing by the time,1.44 seconds. This gives about 7,191,789 bps.

Path Performance 89
This is the Title of the Book, eMatter EditionCopyright © 2007 O’Reilly & Associates, Inc. All rights reserved.
One problem with this approach is that the disk accesses required may skew yourresults. There are a few tricks you can use to reduce this, but if you need theadded accuracy, you are better off using a tool that is designed to deal with such aproblem. ttcp, for example, overcomes the disk access problem by repeatedlysending the same data from memory so that there is no disk overhead.
ttcp
One of the oldest bulk capacity measurement tools is ttcp. This was written by MikeMuuss and Terry Slattery. To run the program, you first need to start the server onthe remote machine using, typically, the -r and -s options. Then the client is startedwith the options -t and -s and the hostname or address of the server. Data is sentfrom the client to the server, performance is measured, the results are reported ateach end, and then both client and server terminate. For example, the server mightlook something like this:
bsd2# ttcp -r -sttcp-r: buflen=8192, nbuf=2048, align=16384/0, port=5001 tcpttcp-r: socketttcp-r: accept from 205.153.60.247ttcp-r: 16777216 bytes in 18.35 real seconds = 892.71 KB/sec +++ttcp-r: 11483 I/O calls, msec/call = 1.64, calls/sec = 625.67ttcp-r: 0.0user 0.9sys 0:18real 5% 15i+291d 176maxrss 0+2pf 11478+28csw
The client side would look like this:
bsd1# ttcp -t -s 205.153.63.239ttcp-t: buflen=8192, nbuf=2048, align=16384/0, port=5001 tcp -> 205.153.63.239ttcp-t: socketttcp-t: connectttcp-t: 16777216 bytes in 18.34 real seconds = 893.26 KB/sec +++ttcp-t: 2048 I/O calls, msec/call = 9.17, calls/sec = 111.66ttcp-t: 0.0user 0.5sys 0:18real 2% 16i+305d 176maxrss 0+2pf 3397+7csw
The program reports the amount of information transferred, indicates that the con-nection is being made, and then gives the results, including raw data, throughput,I/O call information, and execution times. The number of greatest interest is thetransfer rate, 892.71 KB/sec (or 893.26 KB/sec). This is about 7.3 Mbps, which isreasonable for a 10-Mbps Ethernet connection. (But it is not very different fromour quick-and-dirty estimate with FTP.)
These numbers reflect the rate at which data is transferred, not the raw capacity ofthe line. Relating these numbers to bandwidth is problematic since more bits areactually being transferred than these numbers would indicate. The program reportssending 16,777,216 bytes in 18.35 seconds, but this is just the data. On Ethernetwith an MTU of 1500, each buffer will be broken into 6 frames. The first will carryan IP and TCP header for 40 more bytes. Each of the other 5 will have an IP

90 Chapter 4: Path Characteristics
This is the Title of the Book, eMatter EditionCopyright © 2007 O’Reilly & Associates, Inc. All rights reserved.
header for 20 more bytes each. And each will be packaged as an Ethernet framecosting an additional 18 bytes each. And don’t forget the Ethernet preamble. Allthis additional overhead should be included in a calculation of raw capacity.
Poor throughput numbers typically indicate congestion but that may not always bethe case. Throughput will also depend on configuration issues such as the TCPwindow size for your connection. If your window size is not adequate, it will dras-tically affect performance. Unfortunately, this problem is not uncommon for oldersystems on today’s high-speed links.
The -u option allows you to check UDP throughput. A number of options giveyou some control over the amount and the makeup of the information trans-ferred. If you omit the -s option, the program uses standard input and output. Thisoption allows you to control the data being sent.*
The nice thing about ttcp is that a number of implementations are readily avail-able. For example, it is included as an undocumented command in the Enterpriseversion of Cisco IOS 11.2 and later. At one time, a Java version of ttcp was freelyavailable from Chesapeake Computer Consultants, Inc., (now part of Mentor Tech-nologies, Inc.). This program would run on anything with a Java interpreterincluding Windows machines. The Java version supported both a Windows and acommand-line interface. Unfortunately, this version does not seem to be availableanymore, but you might want to try tracking down a copy.
netperf
Another program to consider is netperf, which had its origin in the InformationNetworks Division of Hewlett-Packard. While not formally supported, the pro-gram does appear to have informal support. It is freely available, runs on anumber of Unix platforms, and has reasonable documentation. It has also beenported to Windows. While not as ubiquitous as ttcp, it supports a much widerrange of tests.
Unlike with ttcp, the client and server are two separate programs. The server isnetserver and can be started independently or via inetd. The client is known asnetperf. In the following example, the server and client are started on the samemachine:
bsd1# netserverStarting netserver at port 12865bsd1# netperfTCP STREAM TEST to localhost : histogramRecv Send Send
* In fact, ttcp can be used to transfer files or directories between machines. At the destination, use ttcp-r | tar xvpf - and, at the source, use tar cf - directory| ttcp -t dest_machine.

Path Performance 91
This is the Title of the Book, eMatter EditionCopyright © 2007 O’Reilly & Associates, Inc. All rights reserved.
Socket Socket Message ElapsedSize Size Size Time Throughputbytes bytes bytes secs. 10^6bits/sec
16384 16384 16384 10.00 326.10
This tests the loop-back interface, which reports a throughput of 326 Mbps.
In the next example, netserver is started on one host:
bsd1# netserverStarting netserver at port 12865
Then netperf is run with the -H option to specify the address of the server:
bsd2# netperf -H 205.153.60.247TCP STREAM TEST to 205.153.60.247 : histogramRecv Send SendSocket Socket Message ElapsedSize Size Size Time Throughputbytes bytes bytes secs. 10^6bits/sec
16384 16384 16384 10.01 6.86
This is roughly the same throughput we saw with ttcp. netperf performs a numberof additional tests. In the next test, the transaction rate of a connection is measured:
bsd2# netperf -H 205.153.60.247 -tTCP_RRTCP REQUEST/RESPONSE TEST to 205.153.60.247 : histogramLocal /RemoteSocket Size Request Resp. Elapsed Trans.Send Recv Size Size Time Ratebytes Bytes bytes bytes secs. per sec
16384 16384 1 1 10.00 655.8416384 16384
The program contains several scripts for testing. It is also possible to do variousstream tests with netperf. See the document that accompanies the program if youhave these needs.
iperf
If ttcp and netperf don’t meet your needs, you might consider iperf. iperf comesfrom the National Laboratory for Applied Network Research (NLANR) and is a veryversatile tool. While beyond the scope of this chapter, iperf can also be used totest UDP bandwidth, loss, and jitter. A Java frontend is included to make iperfeasier to use. This utility has also been ported to Windows.
Here is an example of running the server side of iperf on a FreeBSD system:
bsd2# iperf -s -p3000------------------------------------------------------------Server listening on TCP port 3000

92 Chapter 4: Path Characteristics
This is the Title of the Book, eMatter EditionCopyright © 2007 O’Reilly & Associates, Inc. All rights reserved.
TCP window size: 16.0 KByte (default)------------------------------------------------------------[ 4] local 172.16.2.236 port 3000 connected with 205.153.63.30 port 1133[ ID] Interval Transfer Bandwidth[ 4] 0.0-10.0 sec 5.6 MBytes 4.5 Mbits/sec^C
Here is the client side under Windows:
C:\>iperf -c205.153.60.236 -p3000------------------------------------------------------------Client connecting to 205.153.60.236, TCP port 3000TCP window size: 8.0 KByte (default)------------------------------------------------------------[ 28] local 205.153.63.30 port 1133 connected with 205.153.60.236 port 3000[ ID] Interval Transfer Bandwidth[ 28] 0.0-10.0 sec 5.6 MBytes 4.5 Mbits/sec
Notice the use of Ctrl-C to terminate the server side. In TCP mode, iperf is compat-ible with ttcp so it can be used as the client or server.
iperf is a particularly convenient tool for investigating whether your TCP windowis adequate. The -w option sets the socket buffer size. For TCP, this is the windowsize. Using the -w option, you can step through various window sizes and seehow they impact throughput. iperf has a number of other strengths that make itworth considering.
Other related tools
You may also want to consider several similar or related tools. treno uses atraceroute-like approach to calculate bulk capacity, path MTU, and minimum RTP.Here is an example:
bsd2# treno 205.153.63.30 MTU=8166 MTU=4352 MTU=2002 MTU=1492 ..........Replies were from sloan.lander.edu [205.153.63.30] Average rate: 3868.14 kbp/s (3380 pkts in + 42 lost = 1.2%) in 10.07 sEquilibrium rate: 0 kbp/s (0 pkts in + 0 lost = 0%) in 0 sPath properties: min RTT was 13.58 ms, path MTU was 1440 bytesXXX Calibration checks are still under construction, use -v
treno is part of a larger Internet traffic measurement project at NLANR. trenoservers are scattered across the Internet.
In general, netperf, iperf, and treno offer a wider range of features, but ttcp is gen-erally easier to find.

Path Performance 93
This is the Title of the Book, eMatter EditionCopyright © 2007 O’Reilly & Associates, Inc. All rights reserved.
Evaluating Internet Service ProvidersWhen you sign a contract with an ISP to provide a level of service, say T1access, what does this mean? The answer is not obvious.
ISPs sell services based, in some sense, on the total combined expected usageof all users. That is, they sell more capacity than they actually have, expectinglevels of usage by different customers to balance out. If everyone tries to usetheir connection at once, there won’t be enough capacity. But the idea is thatthis will rarely happen. To put it bluntly, ISPs oversell their capacity.
This isn’t necessarily bad. Telephone companies have always done this. And,apart from Mother’s Day and brief periods following disasters, you can almostalways count on the phone system working. When you buy T1 Internet access,the assumption is that you will not be using that line to its full capacity all thetime. If everyone used their connection to full capacity all the time, the priceof those connections would be greatly increased. If you really need some guar-anteed level of service, talk to your ISP. They may be able to provide guaran-tees if you are willing to pay for them.
But for the rest of us, the question is “What can we reasonably expect?” At aminimum, a couple of things seem reasonable. First, the ISP should have a con-nection to the Internet that well exceeds the largest connections that they areselling. For example, if they are selling multiple T1 lines, they should have aconnection that is larger than a T1 line, e.g., a T3 line. Otherwise, if more thatone customer is using the link, then no one can operate at full capacity. Sincetwo customers using the link at the same time is very likely, having only a T1line would violate the basic assumption that the contracted capacity is available.
Second, the ISP should be able to provide a path through their network to theirISP that operates in excess of the contracted speed. If you buy T1 access thatmust cross a 56-Kbps line to reach the rest of the Internet, you don’t really haveT1 access.
Finally, ISPs should have multiple peering arrangements (connections to theglobal Internet) so that if one connection goes down, there is an alternativepath available.
Of course, your ISP may feel differently. And, if the price is really good, yourarrangement may make sense. Clearly, not all service arrangements are thesame. You’ll want to come to a clear understanding with your ISP if you can.Unfortunately, with many ISPs, the information you will need is a closelyguarded secret. As always, caveat emptor.

94 Chapter 4: Path Characteristics
This is the Title of the Book, eMatter EditionCopyright © 2007 O’Reilly & Associates, Inc. All rights reserved.
Traffic Measurements with netstat
In the ideal network, throughput numbers, once you account for overhead, will befairly close to your bandwidth numbers. But few of us have our networks all toourselves. When throughput numbers are lower than expected, which is usuallythe case, you’ll want to account for the difference. As mentioned before, this couldbe hardware or software related. But usually it is just the result of the other trafficon your network. If you are uncertain of the cause, the next step is to look at thetraffic on your network.
There are three basic approaches you can take. First, the quickest way to get asummary of the activity on a link is to use a tool such as netstat. This approach isdescribed here. Or you can use packet capture to look at traffic. This approach isdescribed in Chapter 5. Finally, you could use SNMP-based tools like ntop. SNMPtools are described in Chapter 7. Performance analysis tools using SNMP aredescribed in Chapter 8.
The program netstat was introduced in Chapter 2. Given that netstat’s role is toreport network data structures, it should come as no surprise that it might beuseful in this context. To get a quick picture of the traffic on a network, use the -ioption. For example:
bsd2# netstat -iName Mtu Network Address Ipkts Ierrs Opkts Oerrs Colllp0* 1500 <Link> 0 0 0 0 0ep0 1500 <Link> 00.60.97.06.22.22 13971293 0 1223799 1 0ep0 1500 205.153.63 bsd2 13971293 0 1223799 1 0tun0* 1500 <Link> 0 0 0 0 0sl0* 552 <Link> 0 0 0 0 0ppp0* 1500 <Link> 0 0 0 0 0lo0 16384 <Link> 234 0 234 0 0lo0 16384 127 localhost 234 0 234 0 0
The output shows the number of packets processed for each interface since thelast reboot. In this example, interface ep0 has received 13,971,293 packets (Ipkts)with no errors (Ierrs), has sent 1,223,799 packets (Opkts) with 1 error (Oerrs),and has experienced no collisions (Coll). A few errors are generally not a causefor alarm, but the percentage of either error should be quite low, certainly muchlower than 0.1% of the total packets. Collisions can be higher but should be lessthan 10% of the traffic. The collision count includes only those involving the inter-face. A high number of collisions is an indication that your network is too heavilyloaded, and you should consider segmentation. This particular computer is on aswitch, which explains the absence of collision. Collisions are seen only on sharedmedia.

Path Performance 95
This is the Title of the Book, eMatter EditionCopyright © 2007 O’Reilly & Associates, Inc. All rights reserved.
If you want output for a single interface, you can specify this with the -I option.For example:
bsd2# netstat -Iep0Name Mtu Network Address Ipkts Ierrs Opkts Oerrs Collep0 1500 <Link> 00.60.97.06.22.22 13971838 0 1223818 1 0ep0 1500 205.153.63 bsd2 13971838 0 1223818 1 0
(This was run a couple of minutes later so the numbers are slightly larger.)
Implementations vary, so your output may look different but should contain thesame basic information. For example, here is output under Linux:
lnx1# netstat -iKernel Interface tableIface MTU Met RX-OK RX-ERR RX-DRP RX-OVR TX-OK TX-ERR TX-DRP TX-OVR Flgeth0 1500 0 7366003 0 0 0 93092 0 0 0 BMRUeth1 1500 0 289211 0 0 0 18581 0 0 0 BRUlo 3924 0 123 0 0 0 123 0 0 0 LRU
As you can see, Linux breaks down lost packets into three categories—errors,drops, and overruns.
Unfortunately, the numbers netstat returns are cumulative from the last reboot ofthe system. What is really of interest is how these numbers have changed recently,since a problem could develop and it would take a considerable amount of timebefore the actual numbers would grow enough to reveal the problem.*
One thing you may want to try is stressing the system in question to see if thisincreases the number of errors you see. You can use either ping with the -l optionor the spray command. (spray is discussed in greater detail in Chapter 9.)
First, run netstat to get a current set of values:
bsd2# netstat -Iep0Name Mtu Network Address Ipkts Ierrs Opkts Oerrs Collep0 1500 <Link> 00.60.97.06.22.22 13978296 0 1228137 1 0ep0 1500 205.153.63 bsd2 13978296 0 1228137 1 0
Next, send a large number of packets to the destination. In this example, 1000UDP packets were sent:
bsd1# spray -c1000 205.153.63.239sending 1000 packets of lnth 86 to 205.153.63.239 ... in 0.09 seconds elapsed time 464 packets (46.40%) droppedSent: 11267 packets/sec, 946.3K bytes/secRcvd: 6039 packets/sec, 507.2K bytes/sec
* System Performance Tuning by Mike Loukides contains a script that can be run at regular intervals sothat differences are more apparent.

96 Chapter 4: Path Characteristics
This is the Title of the Book, eMatter EditionCopyright © 2007 O’Reilly & Associates, Inc. All rights reserved.
Notice that this exceeded the capacity of the network as 464 packets weredropped. This may indicate a congested network. More likely, the host is trying tocommunicate with a slower machine. When spray is run in the reverse direction,no packets are dropped. This indicates the latter explanation. Remember, spray issending packets as fast as it can, so don’t make too much out of dropped packets.
Finally, rerun nestat to see if any problems exist:
bsd2# netstat -Iep0Name Mtu Network Address Ipkts Ierrs Opkts Oerrs Collep0 1500 <Link> 00.60.97.06.22.22 13978964 0 1228156 1 0ep0 1500 205.153.63 bsd2 13978964 0 1228156 1 0
No problems are apparent in this example.
If problems are indicated, you can get a much more detailed report with the -soption. You’ll probably want to pipe the output to more so it doesn’t disappear offthe top of the screen. The amount of output data can be intimidating but can givea wealth of information. The information is broken down by protocol and by errortypes such as bad checksums or incomplete headers.
On some systems, such as FreeBSD, a summary of the nonzero values can beobtained by using the -s option twice, as shown in this example:
bsd2# netstat -s -sip: 255 total packets received 255 packets for this host 114 packets sent from this hosticmp: ICMP address mask responses are disabledigmp:tcp: 107 packets sent 81 data packets (8272 bytes) 26 ack-only packets (25 delayed) 140 packets received 77 acks (for 8271 bytes) 86 packets (153 bytes) received in-sequence 1 connection accept 1 connection established (including accepts) 77 segments updated rtt (of 78 attempts) 2 correct ACK header predictions 62 correct data packet header predictionsudp: 115 datagrams received 108 broadcast/multicast datagrams dropped due to no socket 7 delivered 7 datagrams output
A summary for a single protocol can be obtained with the -p option to specify theprotocol. The next example shows the nonzero statistics for TCP:
Microsoft Windows 97
This is the Title of the Book, eMatter EditionCopyright © 2007 O’Reilly & Associates, Inc. All rights reserved.
bsd2# netstat -p tcp -s -stcp: 147 packets sent 121 data packets (10513 bytes) 26 ack-only packets (25 delayed) 205 packets received 116 acks (for 10512 bytes) 122 packets (191 bytes) received in-sequence 1 connection accept 1 connection established (including accepts) 116 segments updated rtt (of 117 attempts) 2 correct ACK header predictions 88 correct data packet header predictions
This can take a bit of experience to interpret. Begin by looking for statisticsshowing a large number of errors. Next, identify the type of errors. Typically, inputerrors are caused by faulty hardware. Output errors are a problem on or at thelocal host. Data corruption, such as faulty checksums, frequently occurs at routers.And, as noted before, congestion is indicated by collisions. Of course, these aregeneralizations, so don’t read too much into them.
Microsoft WindowsMost of the tools we have been discussing are available in one form or another forWindows platforms. Microsoft’s implementation of traceroute, known as tracert,has both superficial and fundamental differences from the original implementa-tion. Like ping, tracert requires a DOS window to run. We have already seen anexample of its output. tracert has fewer options, and there are some superficialdifferences in their flags. But most of traceroute’s options are rarely used anyway,so this isn’t much of a problem.
A more fundamental difference between Microsoft’s tracert and its Unix relative isthat tracert uses ICMP packets rather than UDP packets. This isn’t necessarily bad,just different. In fact, if you have access to both traceroute and tracert, you maybe able to use this to your advantage in some unusual circumstances. Its behaviormay be surprising in some cases. One obvious implication is that routers thatblock ICMP messages will block tracert, while traceroute’s UDP packets will bepassed.
As noted earlier in this chapter, Mentor’s Java implementation of ttcp runs underWindows if you can find it. Both netperf and iperf have also been ported to Win-dows. Another freely available program worth considering is Qcheck fromGanymede Software, Inc. This program requires that Ganymede’s PerformanceEndpoints software be installed on systems at each end of the link. This softwareis also provided at no cost and is available for a wide variety of systems rangingfrom Windows to MVS. In addition to supporting IP, the software supports SPX

98 Chapter 4: Path Characteristics
This is the Title of the Book, eMatter EditionCopyright © 2007 O’Reilly & Associates, Inc. All rights reserved.
and IPX protocols. The software provides ping-like connectivity checks, as well asresponse time and throughput measurements.
As noted in Chapter 2, Microsoft also provides its own version of netstat. Theoptions of interest here are -e and -s. The -e option gives a brief summary ofactivity on any Ethernet interface:
C:\>netstat -eInterface Statistics
Received Sent
Bytes 9840233 2475741Unicast packets 15327 16414Non-unicast packets 9268 174Discards 0 0Errors 0 0Unknown protocols 969
The -s option gives the per-protocol statistics:
C:\>netstat -s
IP Statistics
Packets Received = 22070 Received Header Errors = 0 Received Address Errors = 6 Datagrams Forwarded = 0 Unknown Protocols Received = 0 Received Packets Discarded = 0 Received Packets Delivered = 22064 Output Requests = 16473 Routing Discards = 0 Discarded Output Packets = 0 Output Packet No Route = 0 Reassembly Required = 0 Reassembly Successful = 0 Reassembly Failures = 0 Datagrams Successfully Fragmented = 0 Datagrams Failing Fragmentation = 0 Fragments Created = 0
ICMP Statistics
Received Sent Messages 20 8 Errors 0 0 Destination Unreachable 18 8 Time Exceeded 0 0 Parameter Problems 0 0 Source Quenchs 0 0 Redirects 0 0

Microsoft Windows 99
This is the Title of the Book, eMatter EditionCopyright © 2007 O’Reilly & Associates, Inc. All rights reserved.
Echos 0 0 Echo Replies 0 0 Timestamps 0 0 Timestamp Replies 0 0 Address Masks 0 0 Address Mask Replies 0 0
TCP Statistics
Active Opens = 489 Passive Opens = 2 Failed Connection Attempts = 69 Reset Connections = 66 Current Connections = 4 Segments Received = 12548 Segments Sent = 13614 Segments Retransmitted = 134
UDP Statistics
Datagrams Received = 8654 No Ports = 860 Receive Errors = 0 Datagrams Sent = 2717
Interpretation is basically the same as with the Unix version.

100This is the Title of the Book, eMatter Edition
Copyright © 2007 O’Reilly & Associates, Inc. All rights reserved.
Chapter 5
5Packet Capture
Packet capture and analysis is the most powerful technique that will be discussedin this book—it is the ultimate troubleshooting tool. If you really want to knowwhat is happening on your network, you will need to capture traffic. No other toolprovides more information.
On the other hand, no other tool requires the same degree of sophistication touse. If misused, it can compromise your system’s security and invade the privacyof your users. Of the software described in this book, packet capture software isthe most difficult to use to its full potential and requires a thorough understandingof the underlying protocols to be used effectively. As noted in Chapter 1, you mustensure that what you do conforms to your organization’s policies and any appli-cable laws. You should also be aware of the ethical implications of your actions.
This chapter begins with a discussion of the type of tools available and variousissues involved in traffic capture. Next I describe tcpdump, a ubiquitous and pow-erful packet capture tool. This is followed by a brief description of other closelyrelated tools. Next is a discussion of ethereal, a powerful protocol analyzer that israpidly gaining popularity. Next I describe some of the problems created by trafficcapture. The chapter concludes with a discussion of packet capture tools availablefor use with Microsoft Windows platforms.
Traffic Capture ToolsPacket capture is the real-time collection of data as it travels over networks. Toolsfor the capture and analysis of traffic go by a number of names including packetsniffers, packet analyzers, protocol analyzers, and even traffic monitors. Althoughthere is some inconsistency in how these terms are used, the primary difference isin how much analysis or interpretation is provided after a packet is captured.

Access to Traffic 101
This is the Title of the Book, eMatter EditionCopyright © 2007 O’Reilly & Associates, Inc. All rights reserved.
Packet sniffers generally do the least amount of analysis, while protocol analyzersprovide the greatest level of interpretation. Packet analyzers typically lie some-where in between. All have the capture of raw data as a core function. Trafficmonitors typically are more concerned with collecting statistical information, butmany support the capture of raw data. Any of these may be augmented with addi-tional functions such as graphing utilities and traffic generators. This chapterdescribes tcpdump, a packet sniffer, several analysis tools, and ethereal, a pro-tocol analyzer.
While packet capture might seem like a low-level tool, it can also be used toexamine what is happening at higher levels, including the application level,because of the way data is encapsulated. Since application data is encapsulated in agenerally transparent way by the lower levels of the protocol stack, the data is basi-cally intact when examined at a lower level.* By examining network traffic, we canexamine the data generated at the higher levels. (In general, however, it is usuallymuch easier to debug an application using a tool designed for that application.Tools specific to several application-level protocols are described in Chapter 10.)
Packet capture programs also require the most technical expertise of any programwe will examine. A thorough understanding of the underlying protocol is oftenrequired to interpret the results. For this reason alone, packet capture is a tool thatyou want to become familiar with well before you need it. When you are havingproblems, it will also be helpful to have comparison systems so you can observenormal behavior. The time to learn how your system works is before you haveproblems. This technique cannot be stressed enough—do a baseline run for yournetwork periodically and analyze it closely so you know what traffic you expect tosee on your network before you have problems.
Access to TrafficYou can capture traffic only on a link that you have access to. If you can’t gettraffic to an interface, you can’t capture it with that interface. While this mightseem obvious, it may be surprisingly difficult to get access to some links on yournetwork. On some networks, this won’t be a problem. For example, 10Base2 and10Base5 networks have shared media, at least between bridges and switches.Computers connected to a hub are effectively on a shared medium, and the trafficis exposed. But on other systems, watch out!
Clearly, if you are trying to capture traffic from a host on one network, it willnever see the local traffic on a different network. But the problem doesn’t stop
* There are two obvious exceptions. The data may be encrypted, or the data may be fragmented amongmultiple packets.

102 Chapter 5: Packet Capture
This is the Title of the Book, eMatter EditionCopyright © 2007 O’Reilly & Associates, Inc. All rights reserved.
there. Some networking devices, such as bridges and switches, are designed tocontain traffic so that it is seen only by parts of the local network. On a switchednetwork, only a limited amount of traffic will normally be seen at any interface.*
Traffic will be limited to traffic to or from the host or to multicast and broadcasttraffic. If this includes the traffic you are interested in, so much the better. But ifyou are looking at general network traffic, you will use other approaches.
Not being able to capture data on an interface has both positive and negative ram-ifications. The primary benefit is that it is possible to control access to traffic withan appropriate network design. By segmenting your network, you can limit accessto data, improving security and enhancing privacy.
Lack of access to data can become a serious problem, however, when you mustcapture that traffic. There are several basic approaches to overcome this problem.First, you can try to physically go to the traffic by using a portable computer tocollect the data. This has the obvious disadvantage of requiring that you travel tothe site. This may not be desirable or possible. For example, if you are addressinga security problem, it may not be feasible to monitor at the source of the sus-pected attack without revealing what you are doing. If you need to collect data atmultiple points simultaneously, being at different places at the same time is clearlynot possible by yourself.
Another approach is to have multiple probe computers located throughout yournetwork. For example, if you have computers on your network that you can reachusing telnet, ssh, X Window software, or vnc, you can install the appropriate soft-ware on each. Some software has been designed with remote probing in mind.For example, Microsoft’s netmon supports the use of a Windows platform as aprobe for collecting traffic. Data from the agents on these machines can be col-lected by a central management station. Some RMON probes will also do this. (vncand ssh are described in Chapter 11. netmon is briefly described later in thischapter, and RMON is described in Chapter 8.)
When dealing with switches, there are two common approaches you can take. (Sev-eral other techniques that I can’t recommend are described later in this chapter.)One approach is to augment the switch with a spare hub. Attach the hub to theswitch and move from the switch to the hub only the connections that need to beexamined. You could try replacing the switch with a hub, but this can be disruptiveand, since a hub inherently has a lower capacity, you may have more traffic than thehub can handle. Augmenting the switch with a hub is a better solution.
* This assumes the switches have been running long enough to have a reasonably complete address table.Most switches forward traffic onto all ports if the destination address is unknown. So when they are firstturned on, switches look remarkably like hubs.

Capturing Data 103
This is the Title of the Book, eMatter EditionCopyright © 2007 O’Reilly & Associates, Inc. All rights reserved.
Buying a small portable hub to use in establishing a probe point into your net-work is certainly worth the expense. Because you will be connecting a hub to aswitch, you will be using both crossover and patch cables. Be sure you work outthe details of the cabling well before you have to try this approach on a problem-atic network. Alternately, there are several commercially available devicesdesigned specifically for patching into networks. These devices include moni-toring switches, fiber splitters, and devices designed to patch into 100-Mbps linksor links with special protocols. If your hardware dictates such a need, thesedevices are worth looking into.
Here is a riddle for you—when is a hub not a hub? In recent years,the distinction between hubs and switches has become blurred. Forexample, a 10/100 autoswitching hub may be implemented, inter-nally, as a 10-Mbps hub and a 100-Mbps hub connected by a dual-port switch. With such a device, you may not be able to see all thetraffic. In the next few years, true hubs may disappear from the mar-ket. You may want to keep this in mind when looking for a hub fortraffic monitoring.
A second possibility with some switches is to duplicate the traffic from one portonto another port. If your switch supports this, it can be reconfigured dynamicallyto copy traffic to a monitoring port. Other ports continue functioning normally sothe monitoring appears transparent to the rest of the switch’s operation. This tech-nique is known by a variety of names. With Bay Network products, this is knownas conversation steering. Cisco refers to this as monitoring or using a spanningport. Other names include port aliasing and port mirroring.
Unfortunately, many switches either don’t support this behavior or place limita-tions on what can be done. For instance, some switches will allow traffic to beredirected only to a high-speed port. Implementation details determining exactlywhat can be examined vary greatly. Another problem is that some types of errorswill be filtered by the switch, concealing possible problems. For example, if thereare any framing errors, these will typically be discarded rather than forwarded.Normally, discarding these packets is exactly what you want the switch to do, justnot in this context. You’ll have to consult the documentation with your switch tosee what is possible.
Capturing DataPacket capture may be done by software running on a networked host or byhardware/software combinations designed specifically for that purpose. Devicesdesigned specifically for capturing traffic often have high-performance interfaces

104 Chapter 5: Packet Capture
This is the Title of the Book, eMatter EditionCopyright © 2007 O’Reilly & Associates, Inc. All rights reserved.
that can capture large amounts of data without loss. These devices will also cap-ture frames with framing errors—frames that are often silently discarded with moreconventional interfaces. More conventional interfaces may not be able to keep upwith high traffic levels so packets will be lost. Programs like tcpdump give sum-mary statistics, reporting the number of packets lost. On moderately loaded net-works, however, losing packets should not be a problem. If dropping packetsbecomes a problem, you will need to consider faster hardware or, better yet, seg-menting your network.
Packet capture software works by placing the network interface in promiscuousmode.* In normal operations, the network interface captures and passes on to theprotocol stack only those packets with the interface’s unicast address, packets sentto a multicast address that matches a configured address for the interface, orbroadcast packets. In promiscuous mode, all packets are captured regardless oftheir destination address.
While the vast majority of interfaces can be placed in promiscuous mode, a feware manufactured not to allow this. If in doubt, consult the documentation for yourinterface. Additionally, on Unix systems, the operating system software must beconfigured to allow promiscuous mode. Typically, placing an interface in promis-cuous mode requires root privileges.
tcpdumpThe tcpdump program was developed at the Lawrence Berkeley Laboratory at theUniversity of California, Berkeley, by Van Jacobson, Craig Leres, and StevenMcCanne. It was originally developed to analyze TCP/IP performance problems. Anumber of features have been added over time although some options may not beavailable with every implementation. The program has been ported to a widevariety of systems and comes preinstalled on many systems.
For a variety of reasons, tcpdump is an ideal tool to begin with. It is freely avail-able, runs on many Unix platforms, and has even been ported to Microsoft Win-dows. Features of its syntax and its file format have been used or supported by alarge number of subsequent programs. In particular, its capture software, libpcap,is frequently used by other capture programs. Even when proprietary programswith additional features exist, the universality of tcpdump makes it a compellingchoice. If you work with a wide variety of platforms, being able to use the sameprogram on all or most of the platforms can easily outweigh small advantages pro-prietary programs might have. This is particularly true if you use the programs on
* On a few systems you may need to manually place the interface in promiscuous mode with the ifconfigcommand before running the packet capture software.

tcpdump 105
This is the Title of the Book, eMatter EditionCopyright © 2007 O’Reilly & Associates, Inc. All rights reserved.
an irregular basis or don’t otherwise have time to fully master them. It is better toknow a single program well than several programs superficially. In such situa-tions, special features of other programs will likely go unused.
Since tcpdump is text based, it is easy to run remotely using a Telnet connection.Its biggest disadvantage is a lack of analysis, but you can easily capture traffic,move it to your local machine, and analyze it with a tool like ethereal. Typically, Iuse tcpdump in text-only environments or on remote computers. I use ethereal ina Microsoft Windows or X Window environment and to analyze tcpdump files.
Using tcpdump
The simplest way to run tcpdump is interactively by simply typing the program’sname. The output will appear on your screen. You can terminate the program bytyping Ctrl-C. But unless you have an idle network, you are likely to be over-whelmed by the amount of traffic you capture. What you are interested in willlikely scroll off your screen before you have a chance to read it.
Fortunately, there are better ways to run tcpdump. The first question is how youplan to use tcpdump. Issues include whether you also plan to use the host onwhich tcpdump is running to generate traffic in addition to capturing traffic, howmuch traffic you expect to capture, and how you will determine that the trafficyou need has been captured.
There are several very simple, standard ways around the problem of being over-whelmed by data. The Unix commands tee and script are commonly used to allowa user to both view and record output from a Unix session. (Both tee and scriptare described in Chapter 11.) For example, script could be started, tcpdump run,and script stopped to leave a file that could be examined later.
The tee command is slightly more complicated since tcpdump must be placed inline mode to display output with tee. This is done with the -l option. The syntaxfor capturing a file with tee is:
bsd1# tcpdump –l | tee outfile
Of course, additional arguments would probably be used.
Using multiple Telnet connections to a host or multiple windows in an X Windowsession allows you to record in one window while taking actions to generate trafficin another window. This approach can be very helpful in some circumstances.
An alternative is to use telnet to connect to the probe computer. The session couldbe logged with many of the versions of telnet that are available. Be aware, how-ever, that the Telnet connection will generate considerable traffic that may becomepart of your log file unless you are using filtering. (Filtering, which is discussed

106 Chapter 5: Packet Capture
This is the Title of the Book, eMatter EditionCopyright © 2007 O’Reilly & Associates, Inc. All rights reserved.
later in this chapter, allows you to specify the type of traffic you want to examine.)The additional traffic may also overload the connection, resulting in lost packets.
Another alternative is to run tcpdump as a detached process by including an & atthe end of the command line. Here is an example:
bsd1# tcpdump -w outfile &[1] 70260bsd1# tcpdump: listening on xl0
The command starts tcpdump, prints a process number, and returns the userprompt along with a message that tcpdump has started. You can now enter com-mands to generate the traffic you are interested in. (You really have a prompt atthis point; the message from tcpdump just obscures it.) Once you have generatedthe traffic of interest, you can terminate tcpdump by issuing a kill command usingthe process number reported when tcpdump was started. (You can use the pscommand if you have forgotten the process number.)
bsd1# kill 70260153 packets received by filter0 packets dropped by kernel[1] Done tcpdump -w outfile
You can now analyze the capture file. (Running tcpdump as a detached processcan also be useful when you are trying to capture traffic that might not show upfor a while, e.g., RADIUS or DNS exchanges. You might want to use the nohupcommand to run it in the background.)
Yet another approach is to use the -w option to write the captured data directly toa file. This option has the advantage of collecting raw data in binary format. Thedata can then be replayed with tcpdump using the -r option. The binary formatdecreases the amount of storage needed, and different filters can be applied to thefile without having to recapture the traffic. Using previously captured traffic is anexcellent way of fine-tuning filters to be sure they work as you expect. Of course,you can selectively analyze data captured as text files in Unix by using the manytools Unix provides, but you can’t use tcpdump filtering on text files. And you canalways generate a text file from a tcpdump file for subsequent analysis with Unixtools by simply redirecting the output. To capture data you might type:
bsd1# tcpdump –w rawfile
The data could be converted to a text file with:
bsd1# tcpdump –r rawfile > textfile
This approach has several limitations. Because the data is being written directly toa file, you must know when to terminate recording without actually seeing thetraffic. Also, if you limit what is captured with the original run, the data youexclude is lost. For these reasons, you will probably want to be very liberal in

tcpdump 107
This is the Title of the Book, eMatter EditionCopyright © 2007 O’Reilly & Associates, Inc. All rights reserved.
what you capture, offsetting some of the storage gains of the binary format.Clearly, each approach has its combination of advantages and disadvantages. Ifyou use tcpdump very much, you will probably need each from time to time.
tcpdump Options
A number of command-line options are available with tcpdump. Roughlyspeaking, options can be separated into four broad categories—commands thatcontrol the program operations (excluding filtering), commands that control howdata is displayed, commands that control what data is displayed, and filtering com-mands. We will consider each category in turn.
Controlling program behavior
This class of command-line options affects program behavior, including the waydata is collected. We have already seen two examples of control commands, -rand -w. The -w option allows us to redirect output to a file for later analysis,which can be extremely helpful if you are not sure exactly how you want to ana-lyze your data. You can subsequently play back capture data using the -r option.You can repeatedly apply different display options or filters to the data until youhave found exactly the information you want. These options are extremely helpfulin learning to use tcpdump and are essential for documentation and sharing.
If you know how many packets you want to capture or if you just have an upperlimit on the number of packets, the -c option allows you to specify that number.The program will terminate automatically when that number is reached, elimi-nating the need to use a kill command or Ctrl-C. In the next example, tcpdumpwill terminate after 100 packets are collected:
bsd1# tcpdump –c100
While limiting packet capture can be useful in some circumstances, it is generallydifficult to predict accurately how many packets need to be collected.
If you are running tcpdump on a host with more than one network interface, youcan specify which interface you want to use with the -i option. Use the commandifconfig -a to discover what interfaces are available and what networks they corre-spond to if you aren’t sure. For example, suppose you are using a computer withtwo class C interfaces, xl0 with an IP address of 205.153.63.238 and xl1 with anIP address of 205.153.61.178. Then, to capture traffic on the 205.153.61.0 net-work, you would use the command:
bsd1# tcpdump –i xl1
Without an explicitly identified interface, tcpdump defaults to the lowest num-bered interface.
108 Chapter 5: Packet Capture
This is the Title of the Book, eMatter EditionCopyright © 2007 O’Reilly & Associates, Inc. All rights reserved.
The -p option says that the interface should not be put into promiscuous mode.This option would, in theory, limit capture to the normal traffic on the interface—traffic to or from the host, multicast traffic, and broadcast traffic. In practice, theinterface might be in promiscuous mode for some other reason. In this event, -pwill not turn promiscuous mode off.
Finally, -s controls the amount of data captured. Normally, tcpdump defaults tosome maximum byte count and will only capture up to that number of bytes fromindividual packets. The actual number of bytes depends on the pseudodevicedriver used by the operating system. The default is selected to capture appro-priate headers, but not to collect packet data unnecessarily. By limiting thenumber of bytes collected, privacy can be improved. Limiting the number of bytescollected also decreases processing and buffering requirements.
If you need to collect more data, the -s option can be used to specify the numberof bytes to collect. If you are dropping packets and can get by with fewer bytes, -scan be used to decrease the number of bytes collected. The following commandwill collect the entire packet if its length is less than or equal to 200 bytes:
bsd1# tcpdump –s200
Longer packets will be truncated to 200 bytes.
If you are capturing files using the -w option, you should be aware that thenumber of bytes collected will be what is specified by the -s option at the time ofcapture. The -s option does not apply to files read back with the -r option. What-ever you captured is what you have. If it was too few bytes, then you will have torecapture the data.
Controlling how information is displayed
The -a, -n, -N, and -f options determine how address information is displayed. The-a option attempts to force network addresses into names, the -n option preventsthe conversion of addresses into names, the -N option prevents domain namequalification, and the -f option prevents remote name resolution. In the following,the remote site www.cisco.com (192.31.7.130) is pinged from sloan.lander.edu(205.153.63.30) without an option, with -a, with -n, with -N, and with -f, respec-tively. (The options -c1 host 192.31.7.130 restricts capture to one packet to orfrom the host 192.31.7.130.)
bsd1# tcpdump -c1 host 192.31.7.130tcpdump: listening on xl014:16:35.897342 sloan.lander.edu > cio-sys.cisco.com: icmp: echo requestbsd1# tcpdump -c1 -a host 192.31.7.130tcpdump: listening on xl014:16:14.567917 sloan.lander.edu > cio-sys.cisco.com: icmp: echo requestbsd1# tcpdump -c1 -n host 192.31.7.130tcpdump: listening on xl0

tcpdump 109
This is the Title of the Book, eMatter EditionCopyright © 2007 O’Reilly & Associates, Inc. All rights reserved.
14:17:09.737597 205.153.63.30 > 192.31.7.130: icmp: echo requestbsd1# tcpdump -c1 -N host 192.31.7.130tcpdump: listening on xl014:17:28.891045 sloan > cio-sys: icmp: echo requestbsd1# tcpdump -c1 -f host 192.31.7.130tcpdump: listening on xl014:17:49.274907 sloan.lander.edu > 192.31.7.130: icmp: echo request
Clearly, the -a option is the default.
Not using name resolution can eliminate the overhead and produce terser output.If the network is broken, you may not be able to reach your name server and willfind yourself with long delays, while name resolution times out. Finally, if you arerunning tcpdump interactively, name resolution will create more traffic that willhave to be filtered out.
The -t and -tt options control the printing of timestamps. The -t option suppressesthe display of the timestamp while -tt produces unformatted timestamps. The fol-lowing shows the output for the same packet using tcpdump without an option,with the -t option, and with the -tt option, respectively:
12:36:54.772066 sloan.lander.edu.1174 > 205.153.63.238.telnet: . ack 3259091394win 8647 (DF)
sloan.lander.edu.1174 > 205.153.63.238.telnet: . ack 3259091394 win 8647 (DF)
934303014.772066 sloan.lander.edu.1174 > 205.153.63.238.telnet: . ack 3259091394win 8647 (DF)
The -t option produces a more terse output while the -tt output can simplify sub-sequent processing, particularly if you are writing scripts to process the data.
Controlling what’s displayed
The verbose modes provided by -v and -vv options can be used to print someadditional information. For example, the -v option will print TTL fields. For lessinformation, use the -q, or quiet, option. Here is the output for the same packetpresented with the -q option, without options, with the -v option, and with the -vvoption, respectively:
12:36:54.772066 sloan.lander.edu.1174 > 205.153.63.238.telnet: tcp 0 (DF)
12:36:54.772066 sloan.lander.edu.1174 > 205.153.63.238.telnet: . ack 3259091394win 8647 (DF)
12:36:54.772066 sloan.lander.edu.1174 > 205.153.63.238.telnet: . ack 3259091394win 8647 (DF) (ttl 128, id 45836)
12:36:54.772066 sloan.lander.edu.1174 > 205.153.63.238.telnet: . ack 3259091394win 8647 (DF) (ttl 128, id 45836)

110 Chapter 5: Packet Capture
This is the Title of the Book, eMatter EditionCopyright © 2007 O’Reilly & Associates, Inc. All rights reserved.
This additional information might be useful in a few limited contexts, while thequiet mode provides shorter output lines. In this instance, there was no differencebetween the results with -v and -vv, but this isn’t always the case.
The -e option is used to display link-level header information. For the packet fromthe previous example, with the -e option, the output is:
12:36:54.772066 0:10:5a:a1:e9:8 0:10:5a:e3:37:c ip 60:sloan.lander.edu.1174 > 205.153.63.238.telnet: . ack 3259091394 win 8647 (DF)
0:10:5a:a1:e9:8 is the Ethernet address of the 3Com card in sloan.lander.edu,while 0:10:5a:e3:37:c is the Ethernet address of the 3Com card in 205.153.63.238.(We can discover the types of adapters used by looking up the OUI portion ofthese addresses, as described in Chapter 2.)
For the masochist who wants to decode packets manually, the -x option providesa hexadecimal dump of packets, excluding link-level headers. A packet displayedwith the -x and -vv options looks like this:
13:57:12.719718 bsd1.lander.edu.1657 > 205.153.60.5.domain: 11587+ A? www.microsoft.com. (35) (ttl 64, id 41353) 4500 003f a189 0000 4011 c43a cd99 3db2 cd99 3c05 0679 0035 002b 06d9 2d43 0100 0001 0000 0000 0000 0377 7777 096d 6963 726f 736f 6674 0363 6f6d 0000 0100 01
Please note that the amount of information displayed will depend on how manybytes are collected, as determined by the -s option. Such hex listings are typical ofwhat might be seen with many capture programs.
Describing how to do such an analysis in detail is beyond the scope of this book,as it requires a detailed understanding of the structure of packets for a variety ofprotocols. Interpreting this data is a matter of taking packets apart byte by byte oreven bit by bit, realizing that the interpretation of the results at one step maydetermine how the next steps will be done. For header formats, you can look tothe appropriate RFC or in any number of books. Table 5-1 summarizes the anal-ysis for this particular packet, but every packet is different. This particular packetwas a DNS lookup for www.microsoft.com. (For more information on decodingpackets, see Eric A. Hall’s Internet Core Protocols: The Definitive Guide.)
Table 5-1. Packet analysis summary
Raw data in hex Interpretation
IP header
First 4 bits of 45 IP version—4
Last 4 bits of 45 Length of header multiplier—5 (times 4 or 20 bytes)

tcpdump 111
This is the Title of the Book, eMatter EditionCopyright © 2007 O’Reilly & Associates, Inc. All rights reserved.
This analysis was included here primarily to give a better idea of how packet anal-ysis works. Several programs that analyze packet data from a tcpdump trace fileare described later in this chapter. Unix utilities like strings, od, and hexdump can
00 Type of service
00 3f Packet length in hex—63 bytes
a1 89 ID
First 3 bits of 00 000—flags, none set
Last 13 bits of 00 00 Fragmentation offset
40 TTL—64 hops
11 Protocol number in hex—UDP
c4 3a Header checksum
cd 99 3d b2 Source IP—205.153.61.178
cd 99 3c 05 Destination IP—205.153.60.5
UDP header
06 79 Source port
00 35 Destination port—DNS
00 2b UDP packet length—43 bytes
06 d9 Header checksum
DNS message
2d 43 ID
01 00 Flags—query with recursion desired
00 01 Number of queries
00 00 Number of answers
00 00 Number of authority RRs
00 00 Number of additional RRs
Query
03 Length—3
77 77 77 String—“www”
09 Length—9
6d 69 63 72 6f 73 6f 66 74 String—“microsoft”
03 Length—3
63 6f 6d String—“com”
00 Length—0
00 01 Query type—IP address
00 01 Query class—Internet
Table 5-1. Packet analysis summary (continued)
Raw data in hex Interpretation

112 Chapter 5: Packet Capture
This is the Title of the Book, eMatter EditionCopyright © 2007 O’Reilly & Associates, Inc. All rights reserved.
also make the process easier. For example, in the following example, this makes iteasier to pick out www.microsoft.com in the data:
bsd1# hexdump -C tracefile00000000 d4 c3 b2 a1 02 00 04 00 00 00 00 00 00 00 00 00 |................|00000010 c8 00 00 00 01 00 00 00 78 19 06 38 66 fb 0a 00 |........x..8f...|00000020 4d 00 00 00 4d 00 00 00 00 00 a2 c6 0e 43 00 60 |M...M........C.`|00000030 97 92 4a 7b 08 00 45 00 00 3f a1 89 00 00 40 11 |..J{..E..?....@.|00000040 c4 3a cd 99 3d b2 cd 99 3c 05 06 79 00 35 00 2b |.:..=...<..y.5.+|00000050 06 d9 2d 43 01 00 00 01 00 00 00 00 00 00 03 77 |..-C...........w|00000060 77 77 09 6d 69 63 72 6f 73 6f 66 74 03 63 6f 6d |ww.microsoft.com|00000070 00 00 01 00 01 |.....|00000075
The -vv option could also be used to get as much information as possible.
Hopefully, you will have little need for the -x option. But occasionally you mayencounter a packet that is unknown to tcpdump, and you have no choice. Forexample, some of the switches on my local network use a proprietary implementa-tion of a spanning tree protocol to implement virtual local area networks (VLANs).Most packet analyzers, including tcpdump, won’t recognize these. Fortunately,once you have decoded one unusual packet, you can usually easily identify sim-ilar packets.
Filtering
To effectively use tcpdump, it is necessary to master the use of filters. Filterspermit you to specify what traffic you want to capture, allowing you to focus onjust what is of interest. This can be absolutely essential if you need to extract asmall amount of traffic from a massive trace file. Moreover, tools like ethereal usethe tcpdump filter syntax for capturing traffic, so you’ll want to learn the syntax ifyou plan to use these tools.
If you are absolutely certain that you are not interested in some kinds of traffic,you can exclude traffic as you capture. If you are unclear of what traffic you want,you can collect the raw data to a file and apply the filters as you read back thefile. In practice, you will often alternate between these two approaches.
Filters at their simplest are keywords added to the end of the command line. How-ever, extremely complex commands can be constructed using logical and rela-tional operators. In the latter case, it is usually better to save the filter to a file anduse the -F option. For example, if testfilter is a text file containing the filter host205.153.63.30, then typing tcpdump -Ftestfilter is equivalent to typing thecommand tcpdump host 205.153.63.30. Generally, you will want to use this fea-ture with complex filters only. However, you can’t combine filters on the com-mand line with a filters file in the same command.

tcpdump 113
This is the Title of the Book, eMatter EditionCopyright © 2007 O’Reilly & Associates, Inc. All rights reserved.
Address filtering. It should come as no surprise that filters can select traffic basedon addresses. For example, consider the command:
bsd1# tcpdump host 205.153.63.30
This command captures all traffic to and from the host with the IP address 205.153.63.30. The host may be specified by IP number or name. Since an IP addresshas been specified, you might incorrectly guess that the captured traffic will belimited to IP traffic. In fact, other traffic, such as ARP traffic, will also be collectedby this filter. Restricting capture to a particular protocol requires a more complexfilter. Nonintuitive behavior like this necessitates a thorough testing of all filters.
Addresses can be specified and restricted in several ways. Here is an example thatuses the Ethernet address of a computer to select traffic:
bsd1# tcpdump ether host 0:10:5a:e3:37:c
Capture can be further restricted to traffic flows for a single direction, either to ahost or from a host, using src to specify the source of the traffic or dst to specifythe destination. The next example shows a filter that collects traffic sent to the hostat 205.153.63.30 but not from it:
bsd1# tcpdump dst 205.153.63.30
Note that the keyword host was omitted in this example. Such omissions are OK inseveral instances, but it is always safer to include these keywords.
Multicast or broadcast traffic can be selected by using the keyword multicast orbroadcast, respectively. Since multicast and broadcast traffic are specified differ-ently at the link level and the network level, there are two forms for each of thesefilters. The filter ether multicast captures traffic with an Ethernet multicast address,while ip multicast captures traffic with an IP multicast address. Similar qualifiersare used with broadcast traffic. Be aware that multicast filters may capture broad-cast traffic. As always, test your filters.
Traffic capture can be restricted to networks as well as hosts. For example, the fol-lowing command restricts capture to packets coming from or going to the 205.153.60.0 network:
bsd1# tcpdump net 205.153.60
The following command does the same thing:
bsd1# tcpdump net 205.153.60.0 mask 255.255.255.0
Although you might guess otherwise, the following command does not workproperly due to the final .0:
bsd1# tcpdump net 205.153.60.0
Be sure to test your filters!

114 Chapter 5: Packet Capture
This is the Title of the Book, eMatter EditionCopyright © 2007 O’Reilly & Associates, Inc. All rights reserved.
Protocol and port filtering. It is possible to restrict capture to specific protocolssuch as IP, Appletalk, or TCP. You can also restrict capture to services built on topof these protocols, such as DNS or RIP. This type of capture can be done in threeways—by using a few specific keywords known by tcpdump, by protocol usingthe proto keyword, or by service using the port keyword.
Several of these protocol names are recognized by tcpdump and can be identifiedby keyword. The following command restricts the traffic captured to IP traffic:
bsd1# tcpdump ip
Of course, IP traffic will include TCP traffic, UDP traffic, and so on.
To capture just TCP traffic, you would use:
bsd1# tcpdump tcp
Recognized keywords include ip, igmp, tcp, udp, and icmp.
There are many transport-level services that do not have recognized keywords. Inthis case, you can use the keywords proto or ip proto followed by either the nameof the protocol found in the /etc/protocols file or the corresponding protocolnumber. For example, either of the following will look for OSPF packets:
bsd1# tcpdump ip proto ospfbsd1# tcpdump ip proto 89
Of course, the first works only if there is an entry in /etc/protocols for OSPF.
Built-in keywords may cause problems. In these examples, the keyword tcp musteither be escaped or the number must be used. For example, the following is fine:
bsd#1 tcpdump ip proto 6
On the other hand, you can’t use tcp with proto.
bsd#1 tcpdump ip proto tcp
will generate an error.
For higher-level services, services built on top of the underlying protocols, youmust use the keyword port. Either of the following will collect DNS traffic:
bsd#1 tcpdump port domainbds#1 tcpdump port 53
In the former case, the keyword domain is resolved by looking in /etc/services.When there may be ambiguity between transport-layer protocols, you may furtherrestrict ports to a particular protocol. Consider the command:
bsd#1 tcpdump udp port domain
This will capture DNS name lookups using UDP but not DNS zone transfers usingTCP. The two previous commands would capture both.

tcpdump 115
This is the Title of the Book, eMatter EditionCopyright © 2007 O’Reilly & Associates, Inc. All rights reserved.
Packet characteristics. Filters can also be designed based on packet characteristicssuch as packet length or the contents of a particular field. These filters mustinclude a relational operator. To use length, the keyword less or greater is used.Here is an example:
bsd1# tcpdump greater 200
This command collects packets longer than 200 bytes.
Looking inside packets is a little more complicated in that you must understandthe structure of the packet’s header. But despite the complexity, or perhapsbecause of it, this technique gives you the greatest control over what is captured.(If you are charged with creating a firewall using a product that requires speci-fying offsets into headers, practicing with tcpdump could prove invaluable.)
The general syntax is proto [ expr : size ]. The field proto indicates whichheader to look into—ip for the IP header, tcp for the TCP header, and so forth.The expr field gives an offset into the header indexed from 0. That is, the first bytein a header is number 0, the second byte is number 1, and so forth. Alternately,you can think of expr as the number of bytes in the header to skip over. The sizefield is optional. It specifies the number of bytes to use and can be 1, 2, or 4.
bsd1# tcpdump "ip[9] = 6"
looks into the IP header at the tenth byte, the protocol field, for a value of 6.Notice that this must be quoted. Either an apostrophe or double quotes shouldwork, but a backquote will not work.
bsd1# tcpdump tcp
is an equivalent command since 6 is the protocol number for TCP.
This technique is frequently used with a mask to select specific bits. Values shouldbe in hex. Comparisons are specified using the syntax & followed by a bit mask. Thenext example extracts the first byte from the Ethernet header (i.e., the first byte ofthe destination address), extracts the low-order bit, and makes sure the bit is not 0:*
bsd1# tcpdump 'ether[0] & 1 != 0'
This will match multicast and broadcast packets.
With both of these examples, there are better ways of matching the packets. For amore realistic example, consider the command:
bsd1# tcpdump "tcp[13] & 0x03 != 0"
* The astute reader will notice that this test could be more concisely written as =1 rather than !=0. Whileit doesn’t matter for this example, using the second form simplifies testing in some cases and is a com-mon idiom. In the next command, the syntax is simpler since you are testing to see if multiple bits areset.

116 Chapter 5: Packet Capture
This is the Title of the Book, eMatter EditionCopyright © 2007 O’Reilly & Associates, Inc. All rights reserved.
This filter skips the first 13 bytes in the TCP header, extracting the flag byte. Themask 0x03 selects the first and second bits, which are the FIN and SYN bits. Apacket is captured if either bit is set. This will capture setup or teardown packetsfor a TCP connection.
It is tempting to try to mix in relational operators with these logical operators.Unfortunately, expressions like tcp src port > 23 don’t work. The best way ofthinking about it is that the expression tcp src port returns a value of true or false,not a numerical value, so it can’t be compared to a number. If you want to lookfor all TCP traffic with a source port with a value greater than 23, you must extractthe port field from the header using syntax such as “tcp[0:2] & 0xffff > 0x0017”.
Compound filters. All the examples thus far have consisted of simple commandswith a single test. Compound filters can be constructed in tcpdump using logicaloperator and, or, and not. These are often abbreviated &&, ||, and ! respec-tively. Negation has the highest precedence. Precedence is left to right in theabsence of parentheses. While parentheses can be used to change precedence,remember that they must be escaped or quoted.
Earlier it was noted that the following will not limit capture to just IP traffic:
bsd1# tcpdump host 205.153.63.30
If you really only want IP traffic in this case, use the command:
bsd1# tcpdump host 205.153.63.30 and ip
On the other hand, if you want all traffic to the host except IP traffic, you coulduse:
bsd1# tcpdump host 205.153.63.30 and not ip
If you need to capture all traffic to and from the host and all non-IP traffic, replacethe and with an or.
With complex expressions, you have to be careful of the precedence. Consider thetwo commands:
bsd1# tcpdump host lnx1 and udp or arpbsd1# tcpdump "host lnx1 and (udp or arp)"
The first will capture all UDP traffic to or from lnx1 and all ARP traffic. What youprobably want is the second, which captures all UDP or ARP traffic to or fromlxn1. But beware, this will also capture ARP broadcast traffic. To beat a deadhorse, be sure to test your filters.
I mentioned earlier that running tcpdump on a remote station using telnet was oneway to collect data across your network, except that the Telnet traffic itself wouldbe captured. It should be clear now that the appropriate filter can be used to

tcpdump 117
This is the Title of the Book, eMatter EditionCopyright © 2007 O’Reilly & Associates, Inc. All rights reserved.
avoid this problem. To eliminate a specific TCP connection, you need four piecesof information—the source and destination IP addresses and the source and desti-nation port numbers. In practice, the two IP addresses and the well-known portnumber is often enough.
For example, suppose you are interested in capturing traffic on the host lnx1, youare logged onto the host bsd1, and you are using telnet to connect from bsd1 tolnx1. To capture all the traffic at lnx1, excluding the Telnet traffic between bsd1and lnx1, the following command will probably work adequately in most cases:
lnx1# tcpdump –n "not (tcp port telnet and host lnx1 and host bsd1)"
We can’t just exclude Telnet traffic since that would exclude all Telnet trafficbetween lnx1 and any host. We can’t just exclude traffic to or from one of thehosts because that would exclude non-Telnet traffic as well. What we want toexclude is just traffic that is Telnet traffic, has lnx1 as a host, and has bsd1 as ahost. So we take the negation of these three requirements to get everything else.
While this filter is usually adequate, this filter excludes all Telnet sessions betweenthe two hosts, not just yours. If you really want to capture other Telnet trafficbetween lnx1 and bsd1, you would need to include a fourth term in the negationgiving the ephemeral port assigned by telnet. You’ll need to run tcpdump twice,first to discover the ephemeral port number for your current session since it willbe different with every session, and then again with the full filter to capture thetraffic you are interested in.
One other observation—while we are not reporting the traffic, the traffic is stillthere. If you are investigating a bandwidth problem, you have just added to thetraffic. You can, however, minimize this traffic during the capture if you write outyour trace to a file on lnx1 using the -w option. This is true, however, only if youare using a local filesystem. Finally, note the use of the -n option. This is requiredto prevent name resolution. Otherwise, tcpdump would be creating additional net-work traffic in trying to resolve IP numbers into names as noted earlier.
Once you have mastered the basic syntax of tcpdump, you should run tcpdump onyour own system without any filters. It is worthwhile to do this occasionally just tosee what sorts of traffic you have on your network. There are likely to be anumber of surprises. In particular, there may be router protocols, switch topologyinformation exchange, or traffic from numerous PC-based protocols that you aren’texpecting. It is very helpful to know that this is normal traffic so when you haveproblems you won’t blame the problems on this strange traffic.
This has not been an exhaustive treatment of tcpdump, but I hope that it ade-quately covers the basics. The manpage for tcpdump contains a wealth of addi-tional information, including several detailed examples with explanations. Oneissue I have avoided has been how to interpret tcpdump data. Unfortunately, this

118 Chapter 5: Packet Capture
This is the Title of the Book, eMatter EditionCopyright © 2007 O’Reilly & Associates, Inc. All rights reserved.
depends upon the protocol and is really beyond the scope of a book such as this.Ultimately, you must learn the details of the protocols. For TCP/IP, Richard W.Stevens’ TCP/IP Illustrated, vol. 1, The Protocols has extensive examples usingtcpdump. But the best way to learn is to use tcpdump to examine the behavior ofworking systems.
Analysis ToolsAs previously noted, one reason for using tcpdump is the wide variety of supporttools that are available for use with tcpdump or files created with tcpdump. Thereare tools for sanitizing the data, tools for reformatting the data, and tools for pre-senting and analyzing the data.
sanitize
If you are particularly sensitive to privacy or security concerns, you may want toconsider sanitize, a collection of five Bourne shell scripts that reduce or condensetcpdump trace files and eliminate confidential information. The scripts renumberhost entries and select classes of packets, eliminating all others. This has two pri-mary uses. First, it reduces the size of the files you must deal with, hopefullyfocusing your attention on a subset of the original traffic that still contains thetraffic of interest. Second, it gives you data that can be distributed or made public(for debugging or network analysis) without compromising individual privacy orrevealing too much specific information about your network. Clearly, these scriptswon’t be useful for everyone. But if internal policies constrain what you canreveal, these scripts are worth looking into.
The five scripts included in sanitize are sanitize-tcp, sanitize-syn-fin, sanitize-udp,sanitize-encap, and sanitize-other. Each script filters out inappropriate traffic andreduces the remaining traffic. For example, all non-TCP packets are removed bysanitize-tcp and the remaining TCP traffic is reduced to six fields—an unformattedtimestamp, a renumbered source address, a renumbered destination address, thesource port, a destination address, and the number of data bytes in the packet.
934303014.772066 205.153.63.30.1174 > 205.153.63.238.23: . ack 3259091394 win 8647(DF) 4500 0028 b30c 4000 8006 2d84 cd99 3f1e cd99 3fee 0496 0017 00ff f9b3 c241 c9c2 5010 21c7 e869 0000 0000 0000 0000
would be reduced to 934303014.772066 1 2 1174 23 0. Notice that the IPnumbers have been replaced with 1 and 2, respectively. This will be done in aconsistent manner with multiple packets so you will still be able to compare
Analysis Tools 119
This is the Title of the Book, eMatter EditionCopyright © 2007 O’Reilly & Associates, Inc. All rights reserved.
addresses within a single trace. The actual data reported varies from script toscript. Here is an example of the syntax:
bsd1# sanitize-tcp tracefile
This runs sanitize-tcp over the tcpdump trace file tracefile. There are no arguments.
tcpdpriv
The program tcpdpriv is another program for removing sensitive information fromtcpdump files. There are several major differences between tcpdpriv and sanitize.First, as a shell script, sanitize should run on almost any Unix system. As a com-piled program, this is not true of tcpdpriv. On the other hand, tcpdpriv supportsthe direct capture of data as well as the analysis of existing files. The capturedpackets are written as a tcpdump file, which can be subsequently processed.
Also, tcpdpriv allows you some degree of control over how much of the originaldata is removed or scrambled. For example, it is possible to have an IP addressscrambled but retain its class designation. If the -C4 option is chosen, an IPaddress such as 205.153.63.238 might be replaced with 193.0.0.2. Notice thataddress classes are preserved—a class C address is replaced with a class C address.
There are a variety of command-line options that control how data is rewritten,several of which are mandatory. Many of the command-line options will lookfamiliar to tcpdump users. The program does not allow output to be written to aterminal, so it must be written directly to a file or redirected. While a useful pro-gram, the number of required command-line options can be annoying. There issome concern that if the options are not selected properly, it may be possible toreconstruct the original data from the scrambled data. In practice, this should be aminor concern.
As an example of using tcpdpriv, the following command will scramble the filetracefile:
bsd1# tcpdpriv -P99 -C4 -M20 –r tracefile –w outfile
The -P99 option preserves (doesn’t scramble) the port numbers, -C4 preserves theclass identity of the IP addresses, and -M20 preserves multicast addresses. If youwant the data output to your terminal, you can pipe the output to tcpdump:
bsd1# tcpdpriv -P99 -C4 -M20 -r tracefile -w- | tcpdump -r-
The last options look a little strange, but they will work.
tcpflow
Another useful tool is tcpflow, written by Jeremy Elson. This program allows youto capture individual TCP flows or sessions. If the traffic you are looking at

120 Chapter 5: Packet Capture
This is the Title of the Book, eMatter EditionCopyright © 2007 O’Reilly & Associates, Inc. All rights reserved.
includes, say, three different Telnet sessions, tcpflow will separate the traffic intothree different files so you can examine each individually. The program can recon-struct data streams regardless of out-of-order packets or retransmissions but doesnot understand fragmentation.
tcpflow stores each flow in a separate file with names based on the source anddestination addresses and ports. For example, SSH traffic (port 22) between 172.16.2.210 and 205.153.63.30 might have the filename 172.016.002.210.00022-205.153.063.030.01071, where 1071 is the ephemeral port created for the session.
Since tcpflow uses libpcap, the same packet capture library tcpdump uses, capturefilters are constructed in exactly the same way and with the same syntax. It can beused in a number of ways. For example, you could see what cookies are beingsent during an HTTP session. Or you might use it to see if SSH is really encryptingyour data. Of course, you could also use it to capture passwords or read email, sobe sure to set permissions correctly.
tcp-reduce
The program tcp-reduce invokes a collection of shell scripts to reduce the packetcapture information in a tcpdump trace file to one-line summaries for each con-nection. That is, an entire Telnet session would be summarized by a single line.This could be extremely useful in getting an overall picture of how the traffic overa link breaks down or for looking quickly at very large files.
The syntax is quite simple.
bsd1# tcp-reduce tracefile > outfile
will reduce tracefile, putting the output in outfile. The program tcp-summary,which comes with tcp-reduce, will further summarize the results. For example, onmy system I traced a system briefly with tcpdump. This process collected 741packets. When processed with tcp-reduce, this revealed 58 TCP connections. Hereis an example when results were passed to tcp-summary :
bsd1# tcp-reduce out-file | tcp-summary
This example produced the following five-line summary:
proto # conn KBytes % SF % loc % ngh----- ------ ------ ---- ----- -----www 56 35 25 0 0telnet 1 1 100 0 0pop-3 1 0 100 0 0
In this instance, this clearly shows that the HTTP traffic dominated the local net-work traffic.
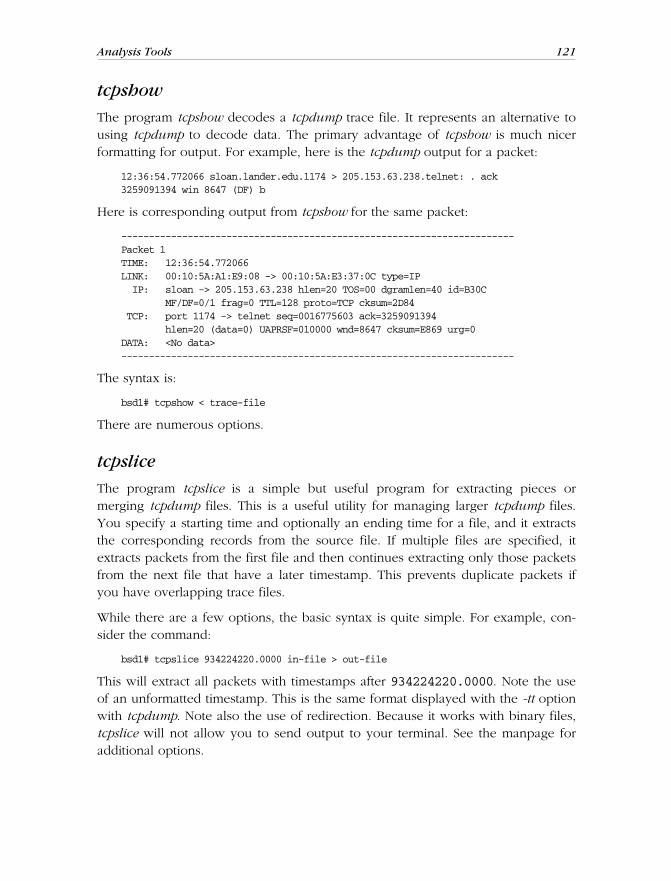
Analysis Tools 121
This is the Title of the Book, eMatter EditionCopyright © 2007 O’Reilly & Associates, Inc. All rights reserved.
tcpshow
The program tcpshow decodes a tcpdump trace file. It represents an alternative tousing tcpdump to decode data. The primary advantage of tcpshow is much nicerformatting for output. For example, here is the tcpdump output for a packet:
12:36:54.772066 sloan.lander.edu.1174 > 205.153.63.238.telnet: . ack3259091394 win 8647 (DF) b
Here is corresponding output from tcpshow for the same packet:
-----------------------------------------------------------------------Packet 1TIME: 12:36:54.772066LINK: 00:10:5A:A1:E9:08 -> 00:10:5A:E3:37:0C type=IP IP: sloan -> 205.153.63.238 hlen=20 TOS=00 dgramlen=40 id=B30C MF/DF=0/1 frag=0 TTL=128 proto=TCP cksum=2D84 TCP: port 1174 -> telnet seq=0016775603 ack=3259091394 hlen=20 (data=0) UAPRSF=010000 wnd=8647 cksum=E869 urg=0DATA: <No data>-----------------------------------------------------------------------
The syntax is:
bsd1# tcpshow < trace-file
There are numerous options.
tcpslice
The program tcpslice is a simple but useful program for extracting pieces ormerging tcpdump files. This is a useful utility for managing larger tcpdump files.You specify a starting time and optionally an ending time for a file, and it extractsthe corresponding records from the source file. If multiple files are specified, itextracts packets from the first file and then continues extracting only those packetsfrom the next file that have a later timestamp. This prevents duplicate packets ifyou have overlapping trace files.
While there are a few options, the basic syntax is quite simple. For example, con-sider the command:
bsd1# tcpslice 934224220.0000 in-file > out-file
This will extract all packets with timestamps after 934224220.0000. Note the useof an unformatted timestamp. This is the same format displayed with the -tt optionwith tcpdump. Note also the use of redirection. Because it works with binary files,tcpslice will not allow you to send output to your terminal. See the manpage foradditional options.

122 Chapter 5: Packet Capture
This is the Title of the Book, eMatter EditionCopyright © 2007 O’Reilly & Associates, Inc. All rights reserved.
tcptrace
This program is an extremely powerful tcpdump file analysis tool. The programtcptrace is strictly an analysis tool, not a capture program, but it works with avariety of capture file formats. The tool’s primary focus is the analysis of TCP con-nections. As such, it is more of a network management tool than a packet analysistool. The program provides several levels of output or analysis ranging from verybrief to very detailed.
While for most purposes tcptrace is used as a command-line tool, tcptrace iscapable of producing several types of output files for plotting with the X Windowprogram xplot. These include time sequence graphs, throughput graphs, and graphsof round-trip times. Time sequence graphs (-S option) are plots of sequence num-bers over time that give a picture of the activity on the network. Throughputgraphs (-T option), as the name implies, plot throughput in bytes per secondagainst time. While throughput gives a picture of the volume of traffic on the net-work, round-trip times give a better picture of the delays seen by individual con-nections. Round-trip time plots (-R option) display individual round-trip times overtime. For other graphs and graphing options, consult the documentation.
For normal text-based operations, there are an overwhelming number of optionsand possibilities. One of the most useful is the -l option. This produces a longlisting of summary statistics on a connection-by-connection basis. What follows isan example of the information provided for a single brief Telnet connection:
TCP connection 2: host c: sloan.lander.edu:1230 host d: 205.153.63.238:23 complete conn: yes first packet: Wed Aug 11 11:23:25.151274 1999 last packet: Wed Aug 11 11:23:53.638124 1999 elapsed time: 0:00:28.486850 total packets: 160 filename: telnet.trace c->d: d->c: total packets: 96 total packets: 64 ack pkts sent: 95 ack pkts sent: 64 pure acks sent: 39 pure acks sent: 10 unique bytes sent: 119 unique bytes sent: 1197 actual data pkts: 55 actual data pkts: 52 actual data bytes: 119 actual data bytes: 1197 rexmt data pkts: 0 rexmt data pkts: 0 rexmt data bytes: 0 rexmt data bytes: 0 outoforder pkts: 0 outoforder pkts: 0 pushed data pkts: 55 pushed data pkts: 52 SYN/FIN pkts sent: 1/1 SYN/FIN pkts sent: 1/1 mss requested: 1460 bytes mss requested: 1460 bytes max segm size: 15 bytes max segm size: 959 bytes min segm size: 1 bytes min segm size: 1 bytes

Analysis Tools 123
This is the Title of the Book, eMatter EditionCopyright © 2007 O’Reilly & Associates, Inc. All rights reserved.
avg segm size: 2 bytes avg segm size: 23 bytes max win adv: 8760 bytes max win adv: 17520 bytes min win adv: 7563 bytes min win adv: 17505 bytes zero win adv: 0 times zero win adv: 0 times avg win adv: 7953 bytes avg win adv: 17519 bytes initial window: 15 bytes initial window: 3 bytes initial window: 1 pkts initial window: 1 pkts ttl stream length: 119 bytes ttl stream length: 1197 bytes missed data: 0 bytes missed data: 0 bytes truncated data: 1 bytes truncated data: 1013 bytes truncated packets: 1 pkts truncated packets: 7 pkts data xmit time: 28.479 secs data xmit time: 27.446 secs idletime max: 6508.6 ms idletime max: 6709.0 ms throughput: 4 Bps throughput: 42 Bps
This was produced by using tcpdump to capture all traffic into the file telnet.traceand then executing tcptrace to process the data. Here is the syntax required to pro-duce this output:
bsd1# tcptrace -l telnet.trace
Similar output is produced for each TCP connection recorded in the trace file.Obviously, a protocol (like HTTP) that uses many different sessions may over-whelm you with output.
There is a lot more to this program than covered in this brief discussion. If yourprimary goal is analysis of network performance and related problems rather thanindividual packet analysis, this is a very useful tool.
trafshow
The program trafshow is a packet capture program of a different sort. It provides acontinuous display of traffic over the network, giving repeated snapshots of traffic.It displays the source address, destination address, protocol, and number of bytes.This program would be most useful in looking for suspicious traffic or just gettinga general idea of network traffic.
While trafshow can be run on a text-based terminal, it effectively takes over thedisplay. It is best used in a separate window of a windowing system. There are anumber of options, including support for packet filtering using the same filterformat as tcpdump.
xplot
The xplot program is an X Windows plotting program. While it is a general pur-pose plotting program, it was written as part of a thesis project for TCP analysis byDavid Clark. As a result, some support for plotting TCP data (oriented toward net-work analysis) is included with the package. It is also used by tcptrace. While a
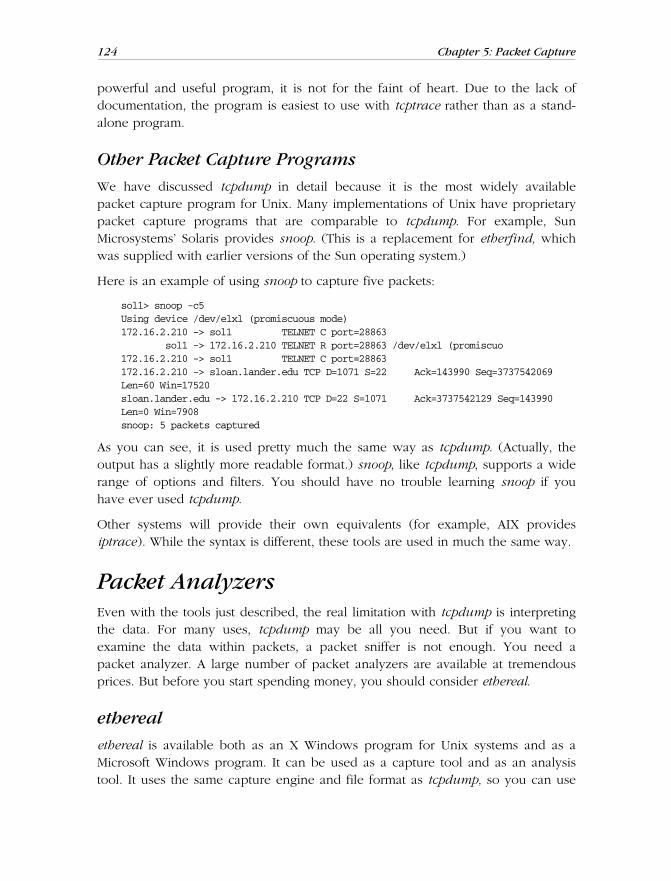
124 Chapter 5: Packet Capture
This is the Title of the Book, eMatter EditionCopyright © 2007 O’Reilly & Associates, Inc. All rights reserved.
powerful and useful program, it is not for the faint of heart. Due to the lack ofdocumentation, the program is easiest to use with tcptrace rather than as a stand-alone program.
Other Packet Capture Programs
We have discussed tcpdump in detail because it is the most widely availablepacket capture program for Unix. Many implementations of Unix have proprietarypacket capture programs that are comparable to tcpdump. For example, SunMicrosystems’ Solaris provides snoop. (This is a replacement for etherfind, whichwas supplied with earlier versions of the Sun operating system.)
Here is an example of using snoop to capture five packets:
sol1> snoop -c5Using device /dev/elxl (promiscuous mode)172.16.2.210 -> sol1 TELNET C port=28863 sol1 -> 172.16.2.210 TELNET R port=28863 /dev/elxl (promiscuo172.16.2.210 -> sol1 TELNET C port=28863172.16.2.210 -> sloan.lander.edu TCP D=1071 S=22 Ack=143990 Seq=3737542069Len=60 Win=17520sloan.lander.edu -> 172.16.2.210 TCP D=22 S=1071 Ack=3737542129 Seq=143990Len=0 Win=7908snoop: 5 packets captured
As you can see, it is used pretty much the same way as tcpdump. (Actually, theoutput has a slightly more readable format.) snoop, like tcpdump, supports a widerange of options and filters. You should have no trouble learning snoop if youhave ever used tcpdump.
Other systems will provide their own equivalents (for example, AIX providesiptrace). While the syntax is different, these tools are used in much the same way.
Packet AnalyzersEven with the tools just described, the real limitation with tcpdump is interpretingthe data. For many uses, tcpdump may be all you need. But if you want toexamine the data within packets, a packet sniffer is not enough. You need apacket analyzer. A large number of packet analyzers are available at tremendousprices. But before you start spending money, you should consider ethereal.
ethereal
ethereal is available both as an X Windows program for Unix systems and as aMicrosoft Windows program. It can be used as a capture tool and as an analysistool. It uses the same capture engine and file format as tcpdump, so you can use

Packet Analyzers 125
This is the Title of the Book, eMatter EditionCopyright © 2007 O’Reilly & Associates, Inc. All rights reserved.
the same filter syntax when capturing traffic, and you can use ethereal to analyzetcpdump files. Actually, ethereal supports two types of filters, capture filters basedon tcpdump and display filters used to control what you are looking at. Display fil-ters use a different syntax and are described later in this section.
Using ethereal
Usually ethereal will be managed entirely from a windowing environment. While itcan be run with command-line options, I’ve never encountered a use for these.(There is also a text-based version, tethereal.) When you run ethereal, you are pre-sented with a window with three initially empty panes. The initial screen is sim-ilar to Figure 5-1 except the panes are empty. (These figures are for the Windowsimplementation of ethereal, but these windows are almost identical to the Unixversion.) If you have a file you want to analyze, you can select File ➝ Open. Youcan either load a tcpdump file created with the -w option or a file previously savedfrom ethereal.
To capture data, select Capture ➝ Start. You will be presented with a Capture Pref-erences screen like the one shown in Figure 5-2. If you have multiple interfaces,you can select which one you want to use with the first field. The Count: field is
Figure 5-1. ethereal
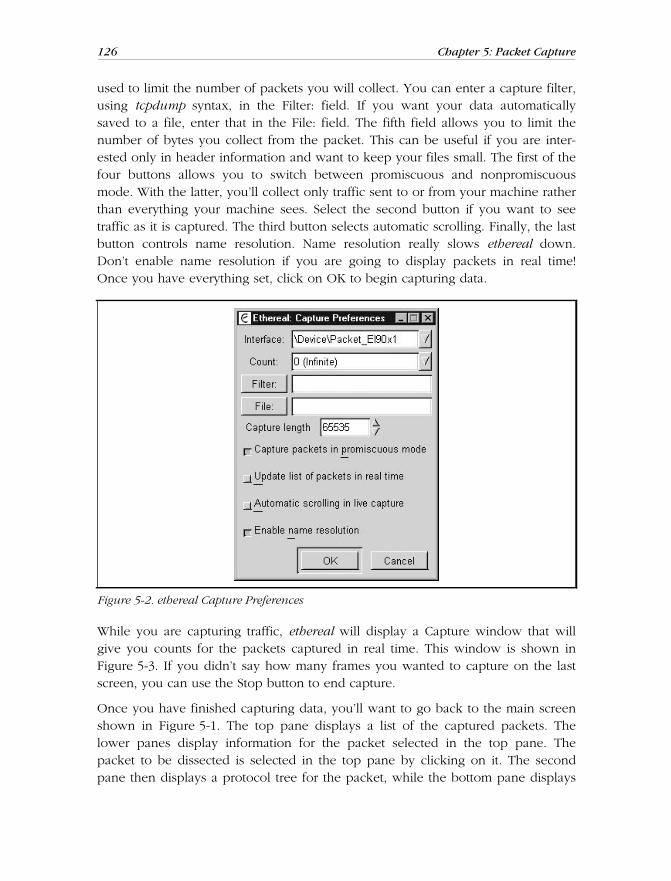
126 Chapter 5: Packet Capture
This is the Title of the Book, eMatter EditionCopyright © 2007 O’Reilly & Associates, Inc. All rights reserved.
used to limit the number of packets you will collect. You can enter a capture filter,using tcpdump syntax, in the Filter: field. If you want your data automaticallysaved to a file, enter that in the File: field. The fifth field allows you to limit thenumber of bytes you collect from the packet. This can be useful if you are inter-ested only in header information and want to keep your files small. The first of thefour buttons allows you to switch between promiscuous and nonpromiscuousmode. With the latter, you’ll collect only traffic sent to or from your machine ratherthan everything your machine sees. Select the second button if you want to seetraffic as it is captured. The third button selects automatic scrolling. Finally, the lastbutton controls name resolution. Name resolution really slows ethereal down.Don’t enable name resolution if you are going to display packets in real time!Once you have everything set, click on OK to begin capturing data.
While you are capturing traffic, ethereal will display a Capture window that willgive you counts for the packets captured in real time. This window is shown inFigure 5-3. If you didn’t say how many frames you wanted to capture on the lastscreen, you can use the Stop button to end capture.
Once you have finished capturing data, you’ll want to go back to the main screenshown in Figure 5-1. The top pane displays a list of the captured packets. Thelower panes display information for the packet selected in the top pane. Thepacket to be dissected is selected in the top pane by clicking on it. The secondpane then displays a protocol tree for the packet, while the bottom pane displays
Figure 5-2. ethereal Capture Preferences

Packet Analyzers 127
This is the Title of the Book, eMatter EditionCopyright © 2007 O’Reilly & Associates, Inc. All rights reserved.
the raw data in hex and ASCII. The layout of ethereal is shown in Figure 5-1.You’ll probably want to scroll through the top pane until you find the traffic ofinterest. Once you have selected a packet, you can resize the windows as needed.Alternately, you can select Display ➝ Show Packet in New Window to open a sep-arate window, allowing you to open several packets at once.
The protocol tree basically displays the structure of the packet by analyzing thedata and determining the header type and decoding accordingly. Fields can beexpanded or collapsed by clicking on the plus or minus next to the field, respec-tively. In the figure, the Internet Protocol header has been expanded and theType-Of-Service (TOS) field in turn has been expanded to show the various valuesof the TOS flags. Notice that the raw data for the field selected in the second paneis shown in bold in the bottom pane. This works well for most protocols, but ifyou are using some unusual protocol, like other programs, ethereal will not knowwhat to do with it.
ethereal has several other useful features. For example, you can select a TCPpacket from the main pane and then select Tools ➝ Follow TCP Stream. This toolcollects information from all the packets in the TCP session and displays the infor-mation. Unfortunately, while convenient at times, this feature makes it just a littletoo easy to capture passwords or otherwise invade users’ privacy.
The Tools ➝ Summary gives you the details for data you are looking at. Anexample is shown in Figure 5-4.
There are a number of additional features that I haven’t gone into here. But what Idescribed here is more than enough for most simple tasks.
Figure 5-3. ethereal Capture

128 Chapter 5: Packet Capture
This is the Title of the Book, eMatter EditionCopyright © 2007 O’Reilly & Associates, Inc. All rights reserved.
Display filters
Display filters allow you to selectively display data that has been captured. At thebottom of the window shown in Figure 5-1, there is a box for creating display fil-ters. As previously noted, display filters have their own syntax. The ethereal docu-mentation describes this syntax in great detail. In this case, I have entered http tolimit the displayed traffic to web traffic. I could just as easily enter any number ofother different protocols—ip, udp, icmp, arp, dns, etc.
The real power of ethereal ’s display filters comes when you realize that you don’treally need to understand the syntax of display filters to start using them. You canselect a field from the center pane and then select Display ➝ Match Selected, andethereal will construct and apply the filter for you. Of course, not every field isuseful, but it doesn’t take much practice to see what works and what doesn’t work.
The primary limitation of this approach comes in constructing compound filters. Ifyou want to capture all the traffic to or from a computer, you won’t be able tomatch a single field. But you should be able to discover the syntax for each ofthe pieces. Once you know that ip.src==205.153.63.30 matches all IP traffic
Figure 5-4. ethereal Summary

Dark Side of Packet Capture 129
This is the Title of the Book, eMatter EditionCopyright © 2007 O’Reilly & Associates, Inc. All rights reserved.
with 205.153.63.30 as its source and that ip.dst==205.153.63.30 matches allIP traffic to 205.153.63.30, it isn’t difficult to come up with the filter you need,ip.src==205.153.63.30 or ip.dst==205.153.63.30. Display filters are reallyvery intuitive, so you should have little trouble learning how to use them.
Perhaps more than any other tool described in this book, ethereal is constantlybeing changed and improved. While this book was being written, new versionswere appearing at the rate of about once a month. So you should not be sur-prised if ethereal looks a little different from what is described here. Fortunately,ethereal is a well-developed program that is very intuitive to use. You should havelittle trouble going on from here.
Dark Side of Packet CaptureWhat you can do, others can do. Pretty much anything you can discover throughpacket capture can be discovered by anyone else using packet capture in a sim-ilar manner. Moreover, some technologies that were once thought to be immuneto packet capture, such as switches, are not as safe as once believed.
Switch Security
Switches are often cited as a way to protect traffic from sniffing. And they really doprovide some degree of protection from casual sniffing. Unfortunately, there areseveral ways to defeat the protection that switches provide.
First, many switches will operate as hubs, forwarding traffic out on every port,whenever their address tables are full. When first initialized, this is the defaultbehavior until the address table is built. Unfortunately, tools like macof, part of thedsniff suite of tools, will flood switches with MAC addresses overflowing a switch’saddress table. If your switch is susceptible, all you need to do to circumvent secu-rity is run the program.
Second, if two machines have the same MAC address, some switches will forwardtraffic to both machines. So if you want copies of traffic sent to a particularmachine on your switch, you can change the MAC address on your interface tomatch the target devices’ MAC address. This is easily done on many Unix com-puters with the ifconfig command.
A third approach, sometimes called ARP poisoning, is to send a forged ARP packetto the source device. This can be done with a tool like arpredirect, also part ofdsniff. The idea is to substitute the packet capture device’s MAC address for thedestination’s MAC address. Traffic will be sent to a packet capture device, whichcan then forward the traffic to its destination. Of course, the forged ARP packetscan be sent to any number of devices on the switch.

130 Chapter 5: Packet Capture
This is the Title of the Book, eMatter EditionCopyright © 2007 O’Reilly & Associates, Inc. All rights reserved.
The result, with any of these three techniques, is that traffic will be copied to adevice that can capture it. Not all switches are susceptible to all of these attacks.Some switches provide various types of port security including static ARP assign-ments. You can also use tools like arpwatch to watch for suspicious activities onyour network. (arpwatch is described in Chapter 6.) If sniffing is a concern, youmay want to investigate what options you have with your switches.
While these techniques could be used to routinely capture traffic as part of normalmanagement, the techniques previously suggested are preferable. Flooding theaddress table can significantly degrade network performance. Duplicating a MACaddress will allow you to watch traffic only to a single host. ARP poisoning is a lotof work when monitoring more than one host and can introduce traffic delays.Consequently, these aren’t really techniques that you’ll want to use if you have achoice.
Protecting Yourself
Because of the potential for abuse, you should be very circumspect about who hasaccess to packet capture tools. If you are operating in a Unix-only environment,you may have some success in restricting access to capture programs. packet cap-ture programs should always be configured as privileged commands. If you wantto allow access to a group of users, the recommended approach is to create anadministrative group, restrict execution of packet capture programs to that group,and give group membership only to a small number of trusted individuals. Thisamounts to setting the SUID bit for the program, but limiting execution to theowner and any group members.
With some versions of Unix, you might even consider recompiling the kernel sothe packet capture software can’t be run on machines where it isn’t needed. Forexample, with FreeBSD, it is very straightforward to disable the Berkeley packetfilter in the kernel. (With older versions of FreeBSD, you needed to explicitlyenable it.) Another possibility is to use interfaces that don’t support promiscuousmode. Unfortunately, these can be hard to find.
There is also software that can be used to check to see if your interface is in pro-miscuous mode. You can do this manually with the ifconfig command. Look forPROMISC in the flags for the interface. For example, here is the output for oneinterface in promiscuous mode:
bsd2# ifconfig ep0ep0: flags=8943<UP,BROADCAST,RUNNING,PROMISC,SIMPLEX,MULTICAST> mtu 1500 inet 172.16.2.236 netmask 0xffffff00 broadcast 172.16.2.255 inet6 fe80::260:97ff:fe06:2222%ep0 prefixlen 64 scopeid 0x2 ether 00:60:97:06:22:22 media: 10baseT/UTP supported media: 10baseT/UTP
Microsoft Windows 131
This is the Title of the Book, eMatter EditionCopyright © 2007 O’Reilly & Associates, Inc. All rights reserved.
Of course, you’ll want to check every interface.
Alternately, you could use a program like cpm, check promiscuous mode fromCERT/CC. lsof, described in Chapter 11, can be used to look for large open filesthat might be packet sniffer output. But if you have Microsoft Windows com-puters on your network or allow user-controlled computers on your network, thisapproach isn’t enough.
While it may appear that packet capture is a purely passive activity that is unde-tectable, this is often not the case. There are several techniques and tools that canbe used to indicate packet capture or to test remote interfaces to see if they are inpromiscuous mode. One of the simplest techniques is to turn your packet capturesoftware on, ping an unused IP address, and watch for DNS queries trying toresolve that IP address. An unused address should be ignored. If someone is tryingto resolve the address, it is likely they have captured a packet.
Another possibility is the tool antisniff from L0pht Heavy Industries. This is a com-mercial tool, but a version is available for noncommercial uses. There are subtlechanges in the behavior of an interface when placed in promiscuous mode. Thistool is designed to look for those changes. It can probe the systems on a network,examine their responses, and usually determine which devices have an interface inpromiscuous mode.
Another approach is to restructure your network for greater security. To the extentyou can limit access to traffic, you can reduce the packet capture. Use of virtualLANs can help, but no approach is really foolproof. Ultimately, strong encryptionis your best bet. This won’t stop sniffing, but it will protect your data. Finally, it isalways helpful to have clearly defined policies. Make sure your users know thatunauthorized packet capture is not acceptable.
Microsoft WindowsIn general, it is inadvisable to leave packet capture programs installed on Win-dows systems unless you are quite comfortable with the physical security you pro-vide for those machines. Certainly, packet capture programs should never beinstalled on publicly accessible computers using consumer versions of Windows.
The programs WinDump95 and WinDump are ports of tcpdump to Windows 95/98and Windows NT, respectively. Each requires the installation of the appropriatedrivers. They are run in DOS windows and have the same basic syntax as tcpdump.As tcpdump has already been described, there is little to add here.
ethereal is also available for Windows and, on the whole, works quite well. Theone area in which the port doesn’t seem to work is in sending output directly to a

132 Chapter 5: Packet Capture
This is the Title of the Book, eMatter EditionCopyright © 2007 O’Reilly & Associates, Inc. All rights reserved.
printer. However, printing to files works nicely so you can save any output youwant and then print it.
One of the more notable capture programs available for Windows platforms isnetmon (Network Monitor), a basic version of which is included with Windows NTServer. The netmon program was originally included with Windows NT 3.5 as ameans of collecting data to send to Microsoft’s technical support. As such, it wasnot widely advertised. Figure 5-5 shows the packet display window.
The basic version supplied with Windows NT Server is quite limited in scope. Itrestricts capture to traffic to or from the server and severely limits the services itprovides. The full version is included as part of the Systems Management Server(SMS), part of the BackOffice suite, and is an extremely powerful program. Ofconcern with any capture and analysis program is what protocols can be effec-tively decoded. As might be expected, netmon is extremely capable when dealingwith Microsoft protocols but offers only basic decoding of Novell protocols. (ForNovell protocols, consider Novell’s LANalyzer.)
One particularly nice feature of netmon is the ability to set up collection agents onany Windows NT workstation and have them collect data remotely. The collecteddata resides with the agent until needed, thus minimizing traffic over the network.
Figure 5-5. netmon for Windows

Microsoft Windows 133
This is the Title of the Book, eMatter EditionCopyright © 2007 O’Reilly & Associates, Inc. All rights reserved.
The program is, by default, not installed. The program can be added as a serviceunder network configuration in the setup window. It is included under Administra-tive Tools (Common). The program, once started, is very intuitive and has a stronghelp system.

134This is the Title of the Book, eMatter Edition
Copyright © 2007 O’Reilly & Associates, Inc. All rights reserved.
Chapter 6
6Device Discoveryand Mapping
The earlier chapters in this book focused on collecting information on the smallerparts of a network, such as the configuration of an individual computer or thepath between a pair of computers. Starting with this chapter, we will broaden ourapproach and look at tools more suited to collecting information on IP networksas a whole. The next three closely related chapters deal with managing and trou-bleshooting devices distributed throughout a network. This chapter focuses ondevice discovery and mapping. Additional techniques and tools for this purposeare presented in Chapter 7, once Simple Network Management Protocol (SNMP)has been introduced. Chapter 8 focuses on the collection of information on trafficpatterns and device utilization throughout the network.
This chapter begins with a brief discussion of the relationship between networkmanagement and troubleshooting. This is followed by a discussion of ways to mapout the IP addresses that are being used on your network and ways to find whichIP addresses correspond to which hosts. This is followed by a description of waysto discover more information on these hosts based on the network services theysupport and other forensic information. The chapter briefly discusses scriptingtools, then describes the network mapping and monitoring tool, tkined. Thechapter concludes with a brief description of related tools for use with MicrosoftWindows platforms.
Troubleshooting Versus ManagementSome of the tools in the next few chapters may seem only marginally related totroubleshooting. This is not a totally unfair judgment. Of course, troubleshooting isan unpredictable business, and any tools that can provide information may beuseful in some circumstances. Often you will want to use tools that were designedwith another purpose in mind.

Troubleshooting Versus Management 135
This is the Title of the Book, eMatter EditionCopyright © 2007 O’Reilly & Associates, Inc. All rights reserved.
But these tools were not included just on the off chance they might be useful.Many of the tools described here, while typically used for management, are just asuseful for troubleshooting. In a very real sense, troubleshooting and managementare just different sides of the same coin. Ideally, management deals with problemsbefore they happen, while troubleshooting deals with problems after the fact. Withthis in mind, it is worth reviewing management software with an eye on how itcan be used as troubleshooting software.
Characteristics of Management Software
Everyone seems to have a different idea of exactly what management softwareshould do. Ideally, network management software will provide the following:
Discovery and mappingDiscovery includes both the automatic detection of all devices on a networkand the collection of basic information about each device, such as the type ofeach device, its MAC address and IP address, the type of software being used,and, possibly, the services it provides. Mapping is the creation of a graphicalrepresentation of the network showing individual interconnections as well asoverall topology.
Event monitoringOnce a picture of the network has been created, each device may be moni-tored to ensure continuous operation. This can be done passively, by waitingfor the device to send an update or alert, or by actively polling the device.
Remote configurationYou should be able to connect to each device and then examine and changeits configuration. It should also be possible to collectively track configurationinformation, such as which IP addresses are in use.
Metering and performance managementInformation on resource utilization should be collected. Ideally, this informa-tion should be available in a usable form for purposes such as trend analysisand capacity planning.
Software managementBeing able to install and configure software remotely is rapidly becoming anecessity in larger organizations. Being able to track licensing can be essentialto avoid legal problems. Version management is also important.
Security and accountingDepending on the sensitivity of data, the organization’s business model, andaccess and billing policies, it may be necessary to control or track who isusing what on the network.

136 Chapter 6: Device Discovery and Mapping
This is the Title of the Book, eMatter EditionCopyright © 2007 O’Reilly & Associates, Inc. All rights reserved.
It doesn’t take much imagination to see how most of these functions relate to trou-bleshooting. This chapter focuses on discovery and mapping. Chapter 7 will dis-cuss event monitoring and the remote configuration of hardware and software.Metering and performance management are discussed in Chapter 8. Security is dis-cussed throughout the next three chapters as appropriate.
Discovery and Mapping Tools
A wide range of tools is available. At the low end are point tools—tools designedto deal with specific tasks or closely related tasks. Several of the tools we willexamine, such as arpwatch and nmap, fall in this category. Such tools tend to bewell focused and do their job well. Typically, they are very easy to learn to useand are usually free or quite inexpensive.
Also found at the low end are toolkits and scripting languages for creating yourown applications. Unlike most prebuilt tools, these can be extremely difficult toboth learn and use, but they often give you the greatest degree of control. Thequality of the final tool will ultimately depend on how much effort and skill youput into its creation. The initial outlay may be modest, but the development timecan be extremely costly. Nonetheless, some people swear by this approach. Theidea is that time is spent once to develop a tool that saves time each time it isused. We will look very briefly at the scripting language Tcl and its extensions.The primary goal here will be to describe the issues and provide information onhow to get started.
At the middle of the range are integrated packages. This type of softwareaddresses more than one aspect of network management. They typically includenetwork discovery, mapping, and monitoring programs but may include otherfunctionality as well. Typically they are straightforward to use but don’t performwell with very large, diverse networks.
Finally, at the high end are frameworks. Roughly, these are packages that can beeasily extended. Since you can extend functionality by adding modules, frame-works are better suited for larger, diverse networks. But be warned, dividing linesamong these last categories are not finely drawn.
Unfortunately, at the time of this writing, there aren’t many freely available pack-ages at these higher levels. The leading contenders are really works in progress.tkined is described in this chapter and the next because it seemed, at the time thiswas written, to be further along and fairly stable. But there are at least two otherprojects making rapid progress in this area that are worth considering. The workof Open Network Management Systems (http://www.opennms.org) is truly out-standing and making terrific progress. The other is the GxSNMP SNMP Manager

Device Discovery 137
This is the Title of the Book, eMatter EditionCopyright © 2007 O’Reilly & Associates, Inc. All rights reserved.
(http://www.gxsnmp.org), a part of the GNOME project. Both are open source(http://opensource.org) projects, and both appear to have a committed base of sup-porters and are likely to be successful. At the time this was written, both hadbegun to release viable tools, particularly the Open Network Management Sys-tems folks. (Linux users may want to also consider Cheops.)
Selecting a Product
It may seem strange that a book devoted to noncommercial software would recom-mend buying software, but network management is one area in which you shouldat least consider the possibility. Commercial products are not without problems,but noncommercial mapping and management tools are relatively scarce.Depending on the size of the network you are dealing with, you may have littlechoice but to consider commercial products at this time.
The key factors are the size of your network, the size of your budget, and the costof a nonfunctioning network. With point tools, you will be forced to put thepieces together. Certainly, this is something you can do with a small network. Ifyou are responsible for a single LAN or small number of LANs and if you can tol-erate being down for a few hours at a time, then you can probably survive withthe noncommercial tools described here. But if you are responsible for a largernetwork or one that is rapidly changing, then you should consider commercialtools. While these may be quite expensive, they may be essential for a large net-work. And if you are really dealing with a large number of machines, the cost permachine may not be that high.
Even if you feel compelled to buy commercial management software, you shouldread the rest of this chapter. Several of the point tools described here can be usedin conjunction with commercial tools. Some of these tools, because they aredesigned for a single function, will perform better than commercial tools thatattempt to do everything. In a few instances, noncommercial tools address issuesnot addressed by commercial tools.
Device DiscoveryThe first step in managing a network is discovering which devices are on the net-work. There are some fairly obvious reasons why this is important. You will needto track address usage to manage services such as DNS. You may need this infor-mation to verify licensing information. From a security perspective, you will wantto know if there are any devices on your network that shouldn’t be there. And oneparticularly compelling reason for a complete picture of your network is IPaddress management.

138 Chapter 6: Device Discovery and Mapping
This is the Title of the Book, eMatter EditionCopyright © 2007 O’Reilly & Associates, Inc. All rights reserved.
IP Address Management
Management of IP addresses is often cited as the most common problem faced inthe management of an IP network. There are two goals in IP management—keeping track of the addresses in use so you know what is available and keepingtrack of the devices associated with each assigned IP address.
Several developments over the last few years have helped to lessen the problemsof IP management. First, DHCP servers, systems that automatically allocate andtrack IP addresses, help when dynamic allocation is appropriate. But there are anumber of reasons why a system may require a static IP address. Any resource orserver—time server, name server, and so on—should be given a static address.Network devices like switches and routers require static addresses. Some sitesrequire reverse DNS lookup before allowing access. The easiest way to providethis is with a static IP address and with an appropriate DNS entry.* Even whensuch issues don’t apply, the cost and complexity of DHCP services may preventtheir use. And even if you use DHCP, there is nothing to prevent a user fromincorrectly assigning a static IP address in the middle of the block of addressesyou have reserved for DNS assignment.
Another development that has helped is automatic testing of newly assignedaddresses. While earlier implementations of TCP/IP stacks sometimes neglected totest whether an IP address was being used, most systems, when booted, now firstcheck to see if an IP address is in use before using it. The test, known as gratu-itous ARP, sends out an ARP request for the IP address about to be used. Ifanyone replies, the address must already be in use. Of course, this test works onlywhen the other machine is turned on. You may set up a machine with everythingappearing to work correctly, only to get a call later in the day. Once such aproblem has been detected, you will need to track it down.
While these and similar developments have gone a long way toward lessening theproblems of IP management and duplicate IP addresses, IP management remains aheadache on many networks. Ideally, you will keep careful records as IPaddresses are assigned, but mistakes are unavoidable. Thus, an automatedapproach is often desirable.
The simplest way to collect MAC/IP address pairs is to ping the address and thenexamine your ARP table. The ping is necessary since most ARP tables are flushedfrequently. At one time, it was possible to ping a broadcast address and get anumber of replies at once. Most hosts are now configured to ignore ICMP requestssent to broadcast addresses. (See the discussion of Smurf Attacks in Chapter 3.)
* Strictly speaking, static addresses are not mandatory in every case. Support for dynamic DNS, or DDNS,has been available for several years. With DDNS, DNS entries can be mapped to dynamically assignedIP addresses. Unfortunately, many sites still do not use it.

Device Discovery 139
This is the Title of the Book, eMatter EditionCopyright © 2007 O’Reilly & Associates, Inc. All rights reserved.
You will need to repeat ping scans very frequently if you want to get a pictureover time. It is a simple matter to create a script that automates the process ofpinging a range of IP addresses, particularly if you use a tool like fping. You’llneed the output from the arp command if you want the MAC addresses. And youcertainly will want to do some cleanup with sort or sed.
Fortunately, there is a class of tools that simplifies this process—IP scanner or pingscanner. These are usually very simple tools that send ICMP ECHO_REQUESTpackets in a systematic manner to each IP address in a range of IP addresses andthen record any replies. (These tools are not limited to using just ECHO_REQUESTpackets.)
nmap
The program nmap is a multifunction tool that supports IP scanning. It also pro-vides port scanning and stack fingerprinting. (Stack fingerprinting is described laterin this chapter.) nmap is an extremely feature-rich program with lots of versatility.For many of its uses, root privileges are required, although some functions workwithout root privileges.
nmap certainly could have been described in Chapter 2, when port scanners wereintroduced. But if all you want is a port scan for a single machine, using nmap isoverkill.* Nonetheless, if you only want as few programs as possible and you needsome of the other functionality that nmap provides, then you can probably get bywith just nmap.
To use nmap as a port scanner, the only information you need is the IP address orhostname of the target:
bsd1# nmap sol1
Starting nmap V. 2.12 by Fyodor ([email protected], www.insecure.org/nmap/)Interesting ports on sol1.lander.edu (172.16.2.233):Port State Protocol Service21 open tcp ftp23 open tcp telnet25 open tcp smtp37 open tcp time111 open tcp sunrpc515 open tcp printer540 open tcp uucp6000 open tcp X11
Nmap run completed -- 1 IP address (1 host up) scanned in 1 second
* There are also reasons, as will become evident, why you might not want nmap too freely available onyour network.

140 Chapter 6: Device Discovery and Mapping
This is the Title of the Book, eMatter EditionCopyright © 2007 O’Reilly & Associates, Inc. All rights reserved.
The results should be self-explanatory. You can specify several IP addresses oryou can span a segment by specifying an address with a mask if you want to scanmultiple devices or addresses. The next example will scan all the addresses on thesame subnet as the lnx1 using a class C network mask:
bsd1# nmap lnx1/24
While nmap skips addresses that don’t respond, this can still produce a lot of output.
Fortunately, nmap will recognize a variety of address range options. Consider:
bsd1# nmap 172.16.2.230-235,240
This will scan seven IP addresses—those from 172.16.2.230 through 172.16.2.235inclusive and 172.16.2.240. You can use 172.16.2.* to scan everything on thesubnet. Be warned, however, that the shell you use may require you to use anescape sequence for the * to work correctly. For example, with C-shell, you coulduse 172.16.2.\*. You should also note that the network masks do not have toalign with a class boundary. For example, /29 would scan eight hosts by workingthrough the possibilities generated by changing the three low-order bits of theaddress.
If you want to just do an IP scan to discover which addresses are currently in use,you can use the -sP option. This will do a ping-like probe for each address on thesubnet:
bsd1# nmap -sP lnx1/24
Starting nmap V. 2.12 by Fyodor ([email protected], www.insecure.org/nmap/)Host (172.16.2.0) seems to be a subnet broadcast address (returned 3 extrapings). Skipping host.Host cisco.lander.edu (172.16.2.1) appears to be up.Host (172.16.2.12) appears to be up.Host (172.16.2.230) appears to be up.Host bsd2.lander.edu. (172.16.2.232) appears to be up.Host sol1.lander.edu (172.16.2.233) appears to be up.Host lnx1.lander.edu (172.16.2.234) appears to be up.Host (172.16.2.255) seems to be a subnet broadcast address (returned 3 extrapings). Skipping host.Nmap run completed -- 256 IP addresses (6 hosts up) scanned in 1 second
You should be warned that this particular scan uses both an ordinary ICMP packetand a TCP ACK packet to port 80 (HTTP). This second packet will get past routersthat block ICMP packets. If an RST packet is received, the host is up and theaddress is in use. Unfortunately, some intrusion detection software that will ignorethe ICMP packet will flag the TCP ACK as an attack. If you want to use only ICMPpackets, use the -PI option. For example, the previous scan could have been doneusing only ICMP packets with the command:
bsd1# nmap -sP -PI lnx1/24

Device Discovery 141
This is the Title of the Book, eMatter EditionCopyright © 2007 O’Reilly & Associates, Inc. All rights reserved.
In this case, since the devices are on the same subnet and there is no interveningfirewall, the same machines are found.
Unfortunately, nmap stretches the limits of what might be considered appropriateat times. In particular, nmap provides a number of options for stealth scanning.There are two general reasons for using stealth scanning. One is to probe amachine without being detected. This can be extremely difficult if the machine isactively watching for such activity.
The other reason is to slip packets past firewalls. Because firewall configurationcan be quite complex and because it can be very difficult to predict traffic pat-terns, many firewalls are configured in ways that allow or block broad, genericclasses of traffic. This minimizes the number of rules that need to be applied andimproves the throughput of the firewall. But blocking broad classes of traffic alsomeans that it may be possible to sneak packets past such firewalls by having themlook like legitimate traffic. For example, external TCP connections may be blockedby discarding the external SYN packets used to set up a connection. If a SYN/ACKpacket is sent from the outside, most firewalls will assume the packet is a responsefor a connection that was initiated by an internal machine. Consequently, the fire-wall will pass the packet. With these firewalls, it is possible to construct such apacket and slip it through the firewall to see how an internal host responds.
nmap has several types of scans that are designed to do stealth probes. Theseinclude -sF, -sX, and -sN. (You can also use the -f option to break stealth probesinto lots of tiny fragments.) But while these stealth packets may slip past firewalls,they should all be detected by any good intrusion detection software running onthe target. You may want to try these on your network just to see how well yourintrusion detection system works or to investigate how your firewall responds. Butif you are using these to do clandestine scans, you should be prepared to becaught and to face the consequences.
Another questionable feature of nmap is the ability to do decoy scans. This optionallows you to specify additional forged IP source addresses. In addition to theprobe packets that are sent with the correct source address, other similar packetsare sent with forged source addresses. The idea is to make it more difficult to pin-point the real source of the attack since only a few of the packets will have thecorrect source address. Not only does this create unnecessary network traffic, butit can create problems for hosts whose addresses are spoofed. If the probed siteautomatically blocks traffic from probing sites, it will cut off the spoofed sites aswell as the site where the probe originated. Clearly, this is not what you reallywant to do. This calls into question any policy that simply blocks sites without fur-ther investigation. Such systems are also extremely vulnerable to denial-of-serviceattacks. Personally, I can see no legitimate use for this feature and would behappy to see it dropped from nmap.

142 Chapter 6: Device Discovery and Mapping
This is the Title of the Book, eMatter EditionCopyright © 2007 O’Reilly & Associates, Inc. All rights reserved.
But while there are some questionable options, they are easily outnumbered byuseful options. If you want your output in greater detail, you might try the -v orthe -d option. If information is streaming past you on the screen too fast for you toread, you can log the output to a file in human-readable or machine-parseableform. Use, respectively, the -o or -m options along with a filename. The -h optionwill give a brief summary of nmap’s many options. You may want to print this touse while you learn nmap.
If you are using nmap to do port scans, you can use the -p option to specify arange of ports. Alternatively, the -F, or fast scan option, can be used to limit scansto ports in your services file. You’ll certainly want to consider using one or theother of these. Scanning every possible port on a network can take a lot of timeand generate a lot of traffic. A number of other options are described in nmap’sdocumentation.
Despite the few negative things I have mentioned, nmap really is an excellenttool. You will definitely want to add it to your collection.
arpwatch
Active scans, such as those we have just seen with nmap, have both advantagesand disadvantages. They allow scans of remote networks and give a good snap-shot of the current state of the network. The major disadvantage is that these scanswill identify only machines that are operational when you do the scan. If a deviceis on for only short periods at unpredictable times, it can be virtually impossible tocatch by scanning. Tools that run constantly, like arpwatch, provide a better pic-ture of activity over time.
For recording IP addresses and their corresponding MAC addresses, arpwatch ismy personal favorite. It is a very simple tool that does this very well. Basically,arpwatch places an interface in promiscuous mode and watches for ARP packets.It then records IP/MAC address pairs. The primary limitation to arpwatch comesfrom being restricted to local traffic. It is not a tool that can be used across net-works. If you need to watch several networks, you will need to start arpwatch oneach of those networks.
The information can be recorded in one of four ways. Data may be written directlyto the system console, to the system’s syslog file, or to a user-specified text file, orit can be sent as an email to root. (syslog is described in Chapter 11.) Output to theconsole or the syslog file is basically the same. An entry will look something like:
Mar 30 15:16:29 bsd1 arpwatch: new station 172.16.2.234 0:60:97:92:4a:6
Of course, with the syslog file, these messages will be interspersed with manyother messages, but you can easily use grep to extract them. For example, to write

Device Discovery 143
This is the Title of the Book, eMatter EditionCopyright © 2007 O’Reilly & Associates, Inc. All rights reserved.
all the messages from arpwatch that were recorded in /var/log/messages into thefile /temp/arp.data, you can use the command:
bsd1# grep arpwatch /var/log/messages > /tmp/arp.list
If your syslog file goes by a different name or you want output in a differentoutput file, you will need to adjust names accordingly. This approach will includeother messages from arpwatch as well, but you can easily delete those that are notof interest.
Email looks like:
From: arpwatch (Arpwatch)To: rootSubject: new station (lnx1.lander.edu)
hostname: lnx1.lander.edu ip address: 172.16.2.234 ethernet address: 0:60:97:92:4a:6 ethernet vendor: 3Com timestamp: Thursday, March 30, 2000 15:16:29 -0500
Email output has the advantage of doing name resolution for the IP address, and itgives the vendor for the MAC address. The vendor name is resolved using infor-mation in the file ethercodes.dat. This file, as supplied with arpwatch, is not partic-ularly complete or up-to-date, but you can always go to the IEEE site as describedin Chapter 2 if you need this data for a particular interface. If you do this, don’tforget to update the ethercodes.dat file on your system.
arpwatch can also record raw data to a file. This is typically the file arp.dat, butyou can specify a different file with the -f option. The default location for arp.datseems to vary with systems. The manpage for arpwatch specifies /usr/operator/arpwatch as the default home directory, but this may not be true for some ports. Ifyou use an alternative file, be sure to give its full pathname. Whether you use arp.dat or another file, the file must exist before you start arpwatch. The format ispretty sparse:
0:60:97:92:4a:6 172.16.2.234 954447389 lnx1
Expect a lot of entries the first few days after you start arpwatch as it learns yournetwork. This can be a little annoying at first, but once most machines arerecorded, you shouldn’t see much traffic—only new or changed addresses. Theseshould be very predictable. Of particular concern are frequently changingaddresses. The most likely explanation for a single address change is that a com-puter has been replaced by another. Although less likely, a new adapter wouldalso explain the change.
Frequent or unexplained changes deserve greater scrutiny. It could simply meansomeone is using two computers. Perhaps a user is unplugging his desktop

144 Chapter 6: Device Discovery and Mapping
This is the Title of the Book, eMatter EditionCopyright © 2007 O’Reilly & Associates, Inc. All rights reserved.
machine in order to plug in his portable. But it can also mean that someone istrying to hide something they are doing. On many systems, both the MAC and IPaddresses can be easily changed. A cracker will often change these addresses tocover her tracks. Or a cracker could be using ARP poisoning to redirect traffic.
Here is an example of an email report for an address change:
From: arpwatch (Arpwatch)To: rootSubject: changed ethernet address
hostname: <unknown> ip address: 205.153.63.55 ethernet address: 0:e0:29:21:88:83 ethernet vendor: <unknown>old ethernet address: 0:e0:29:21:89:d9 old ethernet vendor: <unknown> timestamp: Monday, April 3, 2000 4:57:16 -0400 previous timestamp: Monday, April 3, 2000 4:52:33 -0400 delta: 4 minutes
Notice that the subject line will alert you to the nature of the change. This changewas followed shortly by another change as shown here:
From: arpwatch (Arpwatch)To: rootSubject: flip flop
hostname: <unknown> ip address: 205.153.63.55 ethernet address: 0:e0:29:21:89:d9 ethernet vendor: <unknown>old ethernet address: 0:e0:29:21:88:83 old ethernet vendor: <unknown> timestamp: Monday, April 3, 2000 9:40:47 -0400 previous timestamp: Monday, April 3, 2000 9:24:07 -0400 delta: 16 minutes
This is basically the same sort of information, but arpwatch labels the first as achanged address and subsequent changes as flip-flops.
If you are running DHCP and find arpwatch’s output particularly annoying, youmay want to avoid arpwatch. But if you are having problems with DHCP,arpwatch might, in limited circumstances, be useful.
Device IdentificationAt times it can be helpful to identify the operating system used on a remotemachine. For example, you may need to identify systems vulnerable to somerecently disclosed security hole. Or if you are faced with a duplicate IP address,identifying the type of machine is usually the best first step in locating it. Using

Device Identification 145
This is the Title of the Book, eMatter EditionCopyright © 2007 O’Reilly & Associates, Inc. All rights reserved.
arp to discover the type of hardware may be all that you will need to do. If youhave identified the interface as a Cisco interface and you have only a half dozenCisco devices on your network, you should be able to easily find the one with theduplicate address. If, on the other hand, you can identify it only as one of severalhundred PCs, you’ll want more information. Knowing the operating system on thecomputer may narrow your search.
The obvious, simple strategies are usually the best place to start, since these areless likely to offend anyone. Ideally, you will have collected additional informa-tion as you set systems up, so all you’ll need to do is consult your database, DHCPrecords, or DNS files or, perhaps, give the user a call. But if your records areincomplete, you’ll need to probe the device.
Begin by using telnet to connect to the device to check for useful banners. Oftenlogin banners are changed or suppressed, so don’t restrict yourself to just theTelnet port. Here is an example of trying the SMTP port (25):
bsd1# telnet 172.16.2.233 25Trying 172.16.2.233...Connected to 172.16.2.233.Escape character is '^]'.220 sol1. ESMTP Sendmail 8.9.1b+Sun/8.9.1; Fri, 2 Jun 2000 09:02:45 -0400 (EDT)quit221 sol1. closing connectionConnection closed by foreign host.
This simple test tells us the host is sol1, and it is using a Sun port of sendmail. Themost likely ports to try are FTP (21), Telnet (23), SNMP (25), HTTP (80), POP2(109), POP3 (110), and NTTP (119), but, depending on the systems, others may beinformative as well.
Often, you don’t even have to get the syntax correct to get useful information.Here is an example of an ill-formed GET request (the REQUEST_URI is omitted)sent using telnet:
bsd1# telnet 172.16.2.230 80Trying 172.16.2.230...Connected to 172.16.2.230.Escape character is '^]'.GET HTTP/1.0HTTP/1.1 400 Bad RequestServer: Microsoft-IIS/4.0...
Additional output has been omitted, but the system has been identified in the lastline shown. (See Chapter 10 for other examples.)
Port scanning is one of the tools described in Chapter 2 that can also be usedhere. To do the tests described in Chapter 2, you need change only the hostaddress. The interpretation of the results is the same. The only thing you need

146 Chapter 6: Device Discovery and Mapping
This is the Title of the Book, eMatter EditionCopyright © 2007 O’Reilly & Associates, Inc. All rights reserved.
worry about is the possibility that some of the services you are testing may beblocked by a firewall. Of course, the presence or absence of a service may pro-vide insight into the role of the device. An obvious example is an open HTTP port.If it is open, you are looking at a web server (or, possibly, a machine misconfig-ured as a web server) and can probably get more information by using your webbrowser on the site.
When these obvious tests fail, as they often will, you’ll need a more sophisticatedapproach such as stack fingerprinting.
Stack Fingerprinting
The standards that describe TCP/IP stack implementations are incomplete in thesense that they sometimes do not address how the stack should respond in somedegenerate or pathological situations. For example, there may be no predefinedway for dealing with a packet with contradictory flags or with a meaninglesssequence of inconsistent packets. Since these situations should not normally arise,implementers are free to respond in whatever manner they see fit. Different imple-mentations respond in different ways.
There are also optional features that stack implementers may or may not choose toimplement. The presence or absence of such support is another useful clue to theidentity of a system. Even when behavior is well defined, some TCP/IP stacks donot fully conform to standards. Usually, the differences are minor inconsistenciesthat have no real impact on performance or interoperability. For example, if anisolated FIN packet is sent to an open port, the system should ignore the packet.Microsoft Windows, among others, will send a RESET instead of ignoring thepacket. This doesn’t create any problems for either of the devices involved, but itcan be used to distinguish systems.
Collectively, these different behaviors can be exploited to identify which oper-ating system (OS) is being used on a remote system. A carefully chosen set ofpackets is sent and the responses are examined. It is necessary only to comparethe responses seen against a set of known behaviors to deduce the remote system.This technique is known as stack fingerprinting or OS fingerprinting.
A fingerprinting program will be successful only if it has a set of anomalies or, tomix metaphors, a signature that distinguishes the device of interest from otherdevices. Since devices change and new devices are introduced, it is notuncommon for a stack fingerprinting program not to know the signature for somedevices. Ideally, the program will have a separate signature file or database so thatit can be easily updated. From the user’s perspective, it may also be helpful tohave more than one program since each may be able to identify devices unknownto the other. Consequently, both queso and the stack fingerprinting option fornmap are described here.

Device Identification 147
This is the Title of the Book, eMatter EditionCopyright © 2007 O’Reilly & Associates, Inc. All rights reserved.
It should also be noted that passive fingerprinting is possible. With passive finger-printing, the idea is to examine the initialization packets that come into yourmachine. Of course, this will only identify systems that try to contact you, but thiscan be a help in some circumstances, particularly with respect to security. In someways, this approach is more reliable. When a remote machine sends the firstpacket, it must fill in all the fields in the headers. When you probe a remotemachine, many of the fields in the headers in the reply packet will have beencopied directly from your probe packets. If you are interested in this approach,you might want to look at siphon or p0f.
When using stack fingerprinting, whether active or passive, you mustrealize that you are fingerprinting the machine you are actually com-municating with. Normally, that is exactly what you want. But ifthere is a proxy server between your machine and the target, youwill fingerprint the proxy server, not the intended target.
queso
A number of programs do stack fingerprinting. One simple program that workswell is queso. Its sole function is stack fingerprinting. The syntax is straightforward:
bsd1# queso 172.16.2.230172.16.2.230:80 * Windoze 95/98/NT
By default, queso probes the HTTP port (80). If that port is not in use, queso willtell you to try another port:
bsd1# queso 172.16.2.1172.16.2.1:80 *- Not Listen, try another port
You can do this with the -p option. In this example, the Telnet port is beingchecked:
bsd1# queso -p23 172.16.2.1172.16.2.1:23 * Cisco 11.2(10a), HP/3000 DTC, BayStack Switch
This is not a definitive answer, but it has certainly narrowed down the field.
You can call queso with multiple addresses by simply putting all the addresses onthe command line. You can also use subnet masks, as shown in the following:
bsd1# queso -p23 172.16.2.232/29172.16.2.233:23 * Solaris 2.x172.16.2.234:23 * Linux 2.1.xx172.16.2.235:23 *- Not Listen, try another port172.16.2.236:23 * Dead Host, Firewalled Port or Unassigned IP172.16.2.237:23 * Dead Host, Firewalled Port or Unassigned IP172.16.2.238:23 * Dead Host, Firewalled Port or Unassigned IP

148 Chapter 6: Device Discovery and Mapping
This is the Title of the Book, eMatter EditionCopyright © 2007 O’Reilly & Associates, Inc. All rights reserved.
Notice from this example that mask selection doesn’t have to fall on a class boundary.
queso maintains a separate configuration file. If it doesn’t recognize a system, itwill prompt you to update this file:
bsd1# queso -p23 205.153.60.1205.153.60.1:23 *- Unknown OS, pleez update /usr/local/etc/queso.conf
You can update this file with the -w option. queso can identify a hundred or sodifferent systems. It is not a particularly fast program but gives acceptable results.It can take several seconds to scan each machine on the same subnet. If youinvoke queso without any argument, it will provide a brief summary of its options.
nmap Revisited
You can also do stack fingerprinting with nmap by using the -O option:
bsd1# nmap -O 172.16.2.230
Starting nmap V. 2.12 by Fyodor ([email protected], www.insecure.org/nmap/)WARNING: OS didn't match until the 2 tryInteresting ports on (172.16.2.230):Port State Protocol Service21 open tcp ftp80 open tcp http135 open tcp loc-srv139 open tcp netbios-ssn443 open tcp https1032 open tcp iad36666 open tcp irc-serv7007 open tcp afs3-bos
TCP Sequence Prediction: Class=trivial time dependency Difficulty=0 (Trivial joke)Remote operating system guess: Windows NT4 / Win95 / Win98
Nmap run completed -- 1 IP address (1 host up) scanned in 5 seconds
You can suppress most of the port information by specifying a particular port. Forexample:
bsd1# nmap -p80 -O 172.16.2.230
Starting nmap V. 2.12 by Fyodor ([email protected], www.insecure.org/nmap/)Interesting ports on (172.16.2.230):Port State Protocol Service80 open tcp http
TCP Sequence Prediction: Class=trivial time dependency Difficulty=0 (Trivial joke)Remote operating system guess: Windows NT4 / Win95 / Win98
Nmap run completed -- 1 IP address (1 host up) scanned in 1 second

Scripts 149
This is the Title of the Book, eMatter EditionCopyright © 2007 O’Reilly & Associates, Inc. All rights reserved.
You will probably want to do this if you are scanning a range of machines to savetime. However, if you don’t restrict nmap to a single port, you are more likely toget a useful answer.
Results can be vague at times. This is what nmap returned on one device:
...Remote OS guesses: Cisco Catalyst 1900 switch or Netopia 655-U/POTS ISDN Router, Datavoice TxPORT PRISM 3000 T1 CSU/DSU 6.22/2.06, MultiTech CommPlete Controller, IBM MVS TCP/IP stack V. 3.2, APC MasterSwitch Network Power Controller, AXISor Meridian Data Network CD-ROM server, Meridian Data Network CD-ROM Server (V4.20 Nov 26 1997), WorldGroup BBS (MajorBBS) w/TCP/IP
The correct answer is none of the above. A system that may not be recognized bynmap may be recognized by queso or vice versa.
ScriptsSince most networks have evolved over time, they are frequently odd collectionsof equipment for which no single tool may be ideal. And even when the same toolcan be used, differences in equipment may necessitate minor differences in howthe tool is used. Since many of the tasks may need to be done on a regular basis,it should come as no surprise that scripting languages are a popular way to auto-mate these tasks. Getting started can be labor intensive, but if your currentapproach is already labor intensive, it can be justified.
You will want to use a scripting language with extensions that support the collec-tion of network data. To give an idea of this approach, Tcl and its extensions arebriefly described here. Even if you don’t really want to write your own tools, youmay want to consider one of the tools based on Tcl that are freely available, mostnotably tkined.
Tcl was selected because it is provides a natural introduction to tkined. Of course,there are other scripting languages that you may want to consider. Perl is anobvious choice. Several packages and extensions are available for system and net-work administration. For example, you may want to look at spidermap. This is a setof Perl scripts that do network scans. For SNMP-based management, you’ll prob-ably want to get Simon Leinen’s SNMP extensions SNMP_Session.pm and BER.pm.(Other tools you might also look at include mon and nocol.)
Tcl/Tk and scotty
Tool Command Language, or Tcl (pronounced “tickle”), is a scripting languagethat is well suited for network administration. Tcl was developed in the late 1980sby John Ousterhout, then a faculty member at UC Berkeley. Tcl was designed to

150 Chapter 6: Device Discovery and Mapping
This is the Title of the Book, eMatter EditionCopyright © 2007 O’Reilly & Associates, Inc. All rights reserved.
be a generic, embeddable, and extensible interpreted language. Users frequentlycite studies showing Tcl requires one-tenth the development time required by C/C++. Its major weakness is that it is not well suited for computationally intensivetasks, but that shouldn’t pose much of a problem for network management. Youcan also write applets or tclets (pronounced “tik-lets”) in Tcl.
Tcl can be invoked interactively using the shell tclsh (pronounced “ticklish”) orwith scripts. You may need to include a version number as part of the name. Hereis an example:
bsd2# tclsh8.2%
This really is a shell. You can change directories, print the working directory, copyfiles, remove files, and so forth, using the usual Unix commands. You can use theexit command to leave the program.
One thing that makes Tcl interesting is the number and variety of extensions thatare available. Tk is a set of extensions that provides the ability to create GUIs in anX Window environment. These extensions make it easy to develop graphical inter-faces for tools. Tk can be invoked interactively using the windowing shell wish.Both Tcl and Tk are implemented as C library packages that can be included inprograms if you prefer.
scotty, primarily the work of Jürgen Schönwälder, adds network managementextensions to Tcl/Tk. The tnm portion of scotty adds network administration sup-port. The tkined portion of scotty, described in the next section, is a graphical net-work administration program. What tnm adds is a number of networkmanagement commands. These include support for a number of protocolsincluding ICMP, UDP, DNS, HTTP, Sun’s RPC, NTP, and, most significantly, SNMP.In addition, there are several sets of commands that simplify writing networkapplications. The netdb command gives access to local network databases such as/etc/hosts, the syslog command supports sending messages to the system loggingfacilities, and the job command simplifies scheduling tasks. A few examples shouldgive an idea of how these commands could be used.
You can invoke the scotty interpreter directly as shown here. In this example, thenetdb command is used to list the /etc/host table on a computer:
bsd4# scotty% netdb hosts{localhost.lander.edu 1.0.0.127} {bsd4.lander.edu 239.63.153.205} {bsd4.lander.edu. 239.63.153.205} {bsd1.lander.edu 231.60.153.205} {sol1.lander.edu 233.60.153.205} {lnx1.lander.edu 234.60.153.205}% exit
Mapping or Diagramming 151
This is the Title of the Book, eMatter EditionCopyright © 2007 O’Reilly & Associates, Inc. All rights reserved.
The results are returned with each entry reduced to the canonical name and IPaddress in brackets. Here is the host table for the same system:
bsd4# cat /etc/hosts127.0.0.1 localhost.lander.edu localhost205.153.63.239 bsd4.lander.edu bsd4205.153.63.239 bsd4.lander.edu.205.153.60.231 bsd1.lander.edu bsd1205.153.60.233 sol1.lander.edu sol1205.153.60.234 lnx1.lander.edu lnx1
Note that there is not a separate entry for the alias bsd4.
Here are a few examples of other commands. In the first example, the name of theprotocol with a value of 1 is looked up in /etc/protocols using the netdb command:
% netdb protocols name 1icmp
In the second example, a reverse DNS lookup is done for the host at 205.153.63.30:
% dns name 205.153.63.30sloan.lander.edu
Finally, an ICMP ECHO_REQUEST is sent to www.cisco.com:
% icmp echo www.cisco.com{www.cisco.com 321}
The response took 321 ms. Other commands, such as snmp, require multiple stepsto first establish a session and then access information. (Examples are given inChapter 7.) If you are interested in using these tools in this manner, you will firstwant to learn Tcl. You can then consult the manpages for these extensions. Anumber of books and articles describe Tcl, some of them listed in Appendix B.The source is freely available for all these tools.
Mapping or DiagrammingAt this point, you should have a good idea of how to find out what is on your net-work. The next step is to put together a picture of how everything interconnects.This is usually referred to as mapping but may go by other names such as net-work drawing or diagramming. This can be absolutely essential if you are dealingwith topology-related problems.
A wide spectrum of approaches may be taken. At one extreme, you could simplyuse the collected data and some standard drawing utility to create your map.Clearly, some graphics software is better suited than others for this purpose. Forexample, special icons for different types of equipment are particularly nice. Butalmost any software should be usable to a degree. I have even put together pass-able diagrams using the drawing features in Microsoft Excel.

152 Chapter 6: Device Discovery and Mapping
This is the Title of the Book, eMatter EditionCopyright © 2007 O’Reilly & Associates, Inc. All rights reserved.
Manual diagramming is usually practical only for a single segment or a very smallnetwork. But there might be times when this will be desirable for larger net-works—for example, you may be preparing graphics for a formal presentation.This, however, should be an obvious exception, not a routine activity.
In the middle of the spectrum are programs that will both discover and draw thenetwork. When using tools with automatic discovery, you will almost certainlywant to clean up the graphics. It is extremely hard to lay out a graph in an aes-thetically pleasing manner when doing it manually. You can forget about a com-puter doing a good job automatically.
Another closely related possibility is to use scripting tools to update the files usedby a graphing utility. The graphic utility can then display the new or updated mapwith little or no additional interaction. While this is a wonderful learning opportu-nity, it really isn’t a practical solution for most people with real time constraints.
At the other extreme, mapping tools are usually part of more comprehensive man-agement packages. Automatic discovery is the norm for these. Once the map is cre-ated, additional management functions—including basic monitoring to ensure thatdevices and connections still work and to collect performance data—are performed.
Ideally, these programs will provide a full graphic display that is automaticallygenerated, includes every device on the network, provides details of the natureand state of the devices, updates the map in real time, and requires a minimum ofuser input. Some tools are well along the path to this goal.
There are problems with automatic discovery. First, you’ll want to be careful whenyou specify the networks to be analyzed and keep an eye on things whenever youchange this. It is not that uncommon to make an error and find that you are map-ping devices well beyond your network. And, as explained later in this chapter,not everyone will be happy about this.
Also, many mapping programs do a poor job of recognizing topology. Forexample, in a virtual LAN, a single switch may be logically part of two differentnetworks. Apart from proprietary tools, don’t expect many map programs to recog-nize and handle these devices correctly. Each logical device may be drawn as aseparate device. If you are relying solely on ICMP ECHO_REQUEST packets,unmanaged hubs and switches will not be recognized at all, while managed hubsand switches will be drawn as just another device on the network without anyindication of the role they play in the network topology.
Even with automatic discovery, network mapping and management tools may pre-suppose that you know the basic structure of your network. At a minimum, youmust know the address range for your network. It seems very unlikely that a legiti-mate administrator would not have this information. If for some bizarre reason you
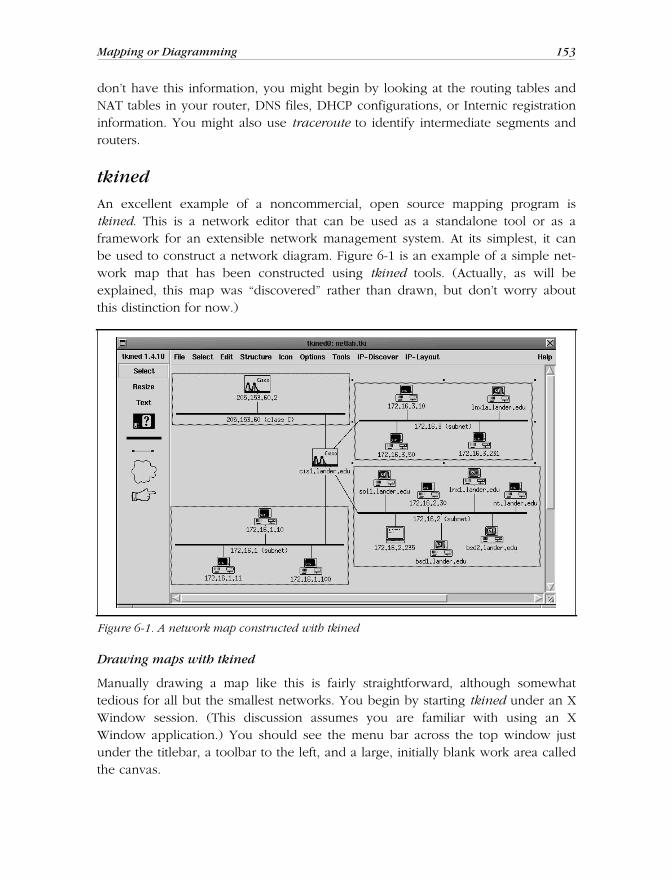
Mapping or Diagramming 153
This is the Title of the Book, eMatter EditionCopyright © 2007 O’Reilly & Associates, Inc. All rights reserved.
don’t have this information, you might begin by looking at the routing tables andNAT tables in your router, DNS files, DHCP configurations, or Internic registrationinformation. You might also use traceroute to identify intermediate segments androuters.
tkined
An excellent example of a noncommercial, open source mapping program istkined. This is a network editor that can be used as a standalone tool or as aframework for an extensible network management system. At its simplest, it canbe used to construct a network diagram. Figure 6-1 is an example of a simple net-work map that has been constructed using tkined tools. (Actually, as will beexplained, this map was “discovered” rather than drawn, but don’t worry aboutthis distinction for now.)
Drawing maps with tkined
Manually drawing a map like this is fairly straightforward, although somewhattedious for all but the smallest networks. You begin by starting tkined under an XWindow session. (This discussion assumes you are familiar with using an XWindow application.) You should see the menu bar across the top window justunder the titlebar, a toolbar to the left, and a large, initially blank work area calledthe canvas.
Figure 6-1. A network map constructed with tkined

154 Chapter 6: Device Discovery and Mapping
This is the Title of the Book, eMatter EditionCopyright © 2007 O’Reilly & Associates, Inc. All rights reserved.
To create a map, follow these steps:
1. Add the devices to the canvas. Begin by clicking* on the machine icon on thetoolbar on the left. This is the icon with the question mark in the middle. Withthis tool selected, each time you click over the canvas, a copy of this icon willbe inserted on the canvas at the cursor.
You can change the appearance of each of these icons to reflect the type ofdevice it represents. First, click on Select on the toolbar (not Select on themenu). Next, select the icon or icons you want to change. You select singleicons by clicking on them. Multiple icons can be selected by Shift-clicking oneach in turn. As you select devices, small boxes are displayed at the corners ofthe icon. Once you have selected the icons of interest, go to the icon pull-down menu and select the icon you want from the appropriate submenu.Notice that the icon on the toolbar changes. (You could make this changebefore inserting devices if you wish and insert the selected icon that way.)
2. Label each device. Right-click on each device in turn. From the pop-up menu,select Edit All Attributes…, enter the appropriate name and IP address for eachdevice, and then select Set Values. Once you have done this, right-click on theicon again and select Label with Attribute…, select either name or addressdepending on your preference, and then click on Accept.
3. Add the networks. This is done with the tool below the machine icon (the thickbar). Select this tool by clicking on it. Click where you want the bar to begin onthe canvas. Move the mouse to where you want the network icon to end andclick a second time. You can label networks in the same way you label nodes.
4. Connect devices to the networks. You can join devices to a network using thenext tool on the toolbar, the thin line with little boxes at either end. Select thistool, click on the device you want to join to the network, and then click onthe appropriate network icon. As you move the mouse, a line from the icon tothe mouse pointer will be shown. When you click on the network, the lineshould be attached to both the device and the network. If it disappears, youraim was off. Try again.
At this point, you will probably want to rearrange your drawing to tidy thingsup. You can move icons by dragging them with the middle mouse button. (Ifyour mouse doesn’t have three buttons, try holding down both the left andright buttons simultaneously.)
5. Group devices and networks. This allows you to collapse a subnet into asingle icon. You can open whichever subnets you need to work with at themoment and leave the rest closed. For large networks, this is essential. Other-wise, the map becomes too cluttered to use effectively.
* Unless otherwise noted, clicking means clicking with the left mouse button.

Mapping or Diagramming 155
This is the Title of the Book, eMatter EditionCopyright © 2007 O’Reilly & Associates, Inc. All rights reserved.
To combine devices, use the Select tool to select the devices and the net-work. Then select Structure ➝ Group. You can use this same menu to selectUngroup, Expand, and Collapse for your groups. You can edit the group labelas desired in the previously discussed manner.
Autodiscovery with tkined
For a small network, manually drawing a diagram doesn’t take very long. But forlarge networks, this can be a very tedious process. Fortunately, tkined providestools for the automatic discovery of nodes and the automatic layout of maps.
You begin with Tools ➝ IP-Discover. What this does is add the IP Discover menuto the menu bar. The first two items on this menu are Discover IP Network andDiscover Route. These tools will attempt to discover either the devices on a net-work or the routers along a path to a remote machine. When one of these isselected, a pop-up box queries you for the network number or remote device ofinterest. Unfortunately, tkined seems to support only class-based discovery, so youmust specify a class B or a class C address (although you can specify a portion ofa class B network by giving a class C style subnet address, e.g., 172.16.1.0). It alsotends to be somewhat unpredictable or quirky when trying to discover multiplenetworks. If you are using subnets on a class B address, what seems to work bestis to run separate discovery sessions and then cut and paste the results together.This is a little bit of a nuisance, but it is not too bad. This was what was actuallydone to create Figure 6-1.
Figure 6-2 shows the output generated in discovering a route across the networkand one of the subnets for the network shown in Figure 6-1. This window is auto-matically created by tkined and shows its progress during the discovery process.Note that it is sending out a flood of ICMP ECHO_REQUEST packets in addition tothe traceroute-style discovery packets, the ICMP network mask queries, and theSNMP queries shown here.
If you do end up piecing together a network map, other previously discussedtools, such as traceroute, can be very helpful. You might also want to look at yourrouting tables with netstat.
There are a couple of problems in using tkined. Foremost is the problem of get-ting everything installed correctly. You will need to install Tcl, then Tk, and thenscotty. scotty can be very particular about which version of Tcl and Tk are installed.You will also need to make sure everything is in the default location or that theenvironmental variables are correctly set. Fortunately, packages are available forsome systems, such as Linux, that take care of most of these details automatically.Also, tkined will not warn you if you exit without saving any changes you havemade.

156 Chapter 6: Device Discovery and Mapping
This is the Title of the Book, eMatter EditionCopyright © 2007 O’Reilly & Associates, Inc. All rights reserved.
Politics and SecurityYou should have a legitimate reason and the authority to use the tools describedhere. Some of these tools directly probe other computers on the network. Evenlegitimate uses of these tools can create surprises for users and may, in someinstances, result in considerable ill will and mistrust. For example, doing securityprobes to discover weaknesses in your network may be a perfectly reasonablething to do, provided that is your responsibility. But you don’t want these scans tocome as a surprise to your users. I, for one, strongly resent unexpected probing ofmy computer regardless of the reason. Often, a well-meaning individual hasscanned a network only to find himself with a lot of explaining to do. The list ofpeople who have made this mistake includes several big names in the securitycommunity.
With the rise of personal firewalls and monitoring tools, more and more users aremonitoring what is happening on their local networks and at their computers. Notall of these users really understand the results returned by these tools, so youshould be prepared to deal with misunderstandings. Reactions can be extreme,even from people who should know enough to put things in context.
The first time I used CiscoWorks for Windows, the program scanned the networkwith, among others, CMIP packets. This, of course, is a perfectly natural thing todo. Unfortunately, another machine on the network had been configured in a
Figure 6-2. Route and network discovery with tkined

Politics and Security 157
This is the Title of the Book, eMatter EditionCopyright © 2007 O’Reilly & Associates, Inc. All rights reserved.
manner that, when it saw the packet, it began blocking all subsequent packetsfrom the management station. It then began logging all subsequent traffic from themanagement station as attacks. This included the System Messaged Blocks (SMB)that are a normal part of the network background noise created by computers run-ning Microsoft Windows. A couple of days later I received a very concerned emailregarding a 10-page log of attacks originating from the management station. Tomake matters worse, the clock on the “attacked” computer was off a couple ofhours. The times recorded for the alleged attacks didn’t fall in the block of time Ihad run CiscoWorks. It did include, however, blocks of times I knew the manage-ment station was offline. Before it was all sorted out, my overactive imaginationhad turned it into a malicious attack with a goal of casting blame on the manage-ment station when it was nothing more than a misunderstanding.*
It is best to deal with such potential problems in advance by clearly stating whatyou will be doing and why. If you can’t justify it, then perhaps you should recon-sider exactly why you are doing it. A number of sites automatically block net-works or hosts they receive scans from. And within some organizations,unauthorized scanning may be grounds for dismissal. You should consider devel-oping a formal policy clearly stating when and by whom scanning may and maynot be done.
This leads to an important point: you really should have a thorough under-standing of how scanning tools work before you use them. For example, someSNMP tools have you enter a list of the various SNMP passwords (communitystrings) you use on your network. In the automatic discovery mode, it will probefor SNMP devices by trying each of these passwords in turn on each machine onthe network. This is intended to save the network manager from having to enterthis information for each individual device. However, it is a simple matter forscanned machines to capture these passwords. Tools like dsniff are designed spe-cifically for that purpose. I strongly recommend watching the behavior of what-ever scanning tools you use with a tool like tcpdump or ethereal to see what it isactually doing.
Unfortunately, some of the developers of these tools can’t seem to decide whetherthey are writing for responsible users or crackers. As previously noted, some toolsinclude questionable features, such as support stealth scans or forged IP addresses.In general, I have described only those features for which I can see a legitimateuse. However, sometimes there is no clear dividing line. For example, forged IPaddresses can be useful in testing firewalls. When I have described such features, Iassume that you will be able to distinguish between appropriate and inappro-priate uses.
* This problem could have been lessened if both had been running NTP. NTP is discussed in Chapter 11.
158 Chapter 6: Device Discovery and Mapping
This is the Title of the Book, eMatter EditionCopyright © 2007 O’Reilly & Associates, Inc. All rights reserved.
Microsoft WindowsTraditionally, commercial tools for network management have typically beendeveloped for Unix platforms rather than Windows. Those available under Win-dows tended not to scale well. In the last few years this has been changing rap-idly, and many of the standard commercial tools are now available for Windowsplatforms.
A number of packages support IP scanning under Windows. These include free-ware, shareware, and commercial packages. Generally, these products are lesssophisticated than similar Unix tools. For example, stealth scanning is usuallylacking under Windows. (Personally, I’m not sure this is something to complainabout.)
Nonetheless, there are a number of very impressive noncommercial tools for Win-dows. In fact, considering the quality and functionality of some of these free pack-ages, it is surprising that the commercial packages are so successful. But freesoftware, particularly in network management, seems to have a way of becomingcommercial software over time—once it has matured and developed a following.
Cyberkit
One particularly impressive tool is Luc Neijens’ cyberkit. The package works well,has a good help system, and implements a wide range of functions in onepackage. In addition to IP scanning, the program includes, among others, ping,traceroute, finger, whois, nslookup, and NTP synchronization.
With cyberkit, you can scan a range of addresses within an address space or youcan read a set of addresses from a file. Figure 6-3 shows an example of such ascan.
Here you can see how to specify a range of IP addresses. The button to the rightof the Address Range field will assist you in specifying an address range orentering a filename. If you want to use a file, you need enter only the path andname of a text file containing a set of addresses, one address per line. Notice thatyou can use the same tab to resolve addresses or do port scans of each address.There are a number of other tools you might consider. getif, which makes heavyuse of SNMP, is described in Chapter 7. You might also want to look at SamSpade. (Sam Spade is particularly helpful when dealing with spamming and otheremail related problems.)

Microsoft Windows 159
This is the Title of the Book, eMatter EditionCopyright © 2007 O’Reilly & Associates, Inc. All rights reserved.
Other Tools for Windows
The good news is that Tcl, Tk, scotty, and tkined are all available for Windowsplatforms. Tcl and Tk seem to be pretty stable ports. tkined is usually described asan early alpha port but seems to work fairly well. You’ll want a three-buttonmouse. The interface is almost identical to the Unix version, and I have movedfiles between Windows and Unix platforms without problems. For example, youcould create maps on one and move them to another for monitoring. Moreover,the tnm extensions have been used as the basis for additional tools available forWindows.
If you use Microsoft Exchange Server, a topology diagramming tool called emapcan be downloaded from Microsoft. It will read an Exchange directory and auto-matically generate a Visio diagram for your site topology. Of course, you’ll needVisio to view the results.
Finally, if you are using NetBIOS, you might want to look at the nbtstat utility.This command displays protocol statistics and current TCP connections using Net-BIOS over TCP/IP (NBT). You can use this command to poll remote NetBIOSname tables among other things. The basic syntax is returned if you call the pro-gram with no options.
Figure 6-3. IP scan with cyberkit

160This is the Title of the Book, eMatter Edition
Copyright © 2007 O’Reilly & Associates, Inc. All rights reserved.
Chapter 7
7Device Monitoringwith SNMP
This chapter is about monitoring devices with Simple Network Management Pro-tocol (SNMP). It describes how SNMP can be used to retrieve information fromremote systems, to monitor systems, and to alert you to problems. While other net-work management protocols exist, SNMP is currently the most commonly used.While SNMP has other uses, our primary focus will be on monitoring systems toensure that they are functioning properly and to collect information when theyaren’t. The material in this chapter is expanded upon in Chapter 8.
This chapter begins with a brief review of SNMP. This description is somewhatinformal but should serve to convey enough of the basic ideas to get you started ifyou are unfamiliar with SNMP. If you are already familiar with the basic conceptsand vocabulary, you can safely skip over this section. Next I describe NETSNMP—a wonderful tool for learning about SNMP that can be used for manysimple tasks. Network monitoring using tkined is next, followed by a few pointersto tools for Microsoft Windows.
Overview of SNMPSNMP is a management protocol allowing a management program to communi-cate, configure, or control remote devices that have embedded SNMP agents. Thebasic idea behind SNMP is to have a program or agent running on the remotesystem that you can communicate with over the network. This agent then canmonitor systems and collect information. Software on a management station sendsmessages to the remote agent requesting information or directing it to performsome specific task. While communication is usually initiated by the managementstation, under certain conditions the agent may send an unsolicited message ortrap back to the management station.

Overview of SNMP 161
This is the Title of the Book, eMatter EditionCopyright © 2007 O’Reilly & Associates, Inc. All rights reserved.
SNMP provides a framework for network management. While SNMP is not theonly management protocol or, arguably, even the best management protocol,SNMP is almost universal. It has a small footprint, can be implemented fairlyquickly, is extensible, is well documented, and is an open standard. It resides atthe application level of the TCP/IP protocol suite. On the other hand, SNMP, par-ticularly Version 1, is not a secure protocol; it is poorly suited for real-time applica-tions, and it can return an overwhelming amount of information.
SNMP is an evolving protocol with a confusing collection of abbreviations desig-nating the various versions. Only the major versions are mentioned here. Under-standing the major distinctions among versions can be important, because thereare a few things you can’t do with earlier versions and because of differences insecurity provided by the different versions. However, the original version,SNMPv1, is still widely used and will be the primary focus of this chapter. Gener-ally, the later versions are backward compatible, so differences in versionsshouldn’t cause too many operational problems.
The second version has several competing variants. SNMPv2 Classic has beensuperseded by community-based SNMPv2 or SNMPv2c. Two more secure super-sets of SNMPv2c are SNMPv2u and SNMPv2*. SNMPv2c is the most common of thesecond versions and is what is usually meant when you see a reference toSNMPv2. SNMPv2 has not been widely adopted, but its use is growing. SNMP-NGor SNMPv3 attempts to resolve the differences between SNMPv2u and SNMPv2*. Itis too soon to predict how successful SNMPv3 will be, but it also appears to begrowing in popularity.
Although there are usually legitimate reasons for the choice of terms, the nomen-clature used to describe SNMP can be confusing. For example, parameters that aremonitored are frequently referred to as objects, although variables might havebeen a better choice and is sometimes used. Basically, objects can be thought ofas data structures.
Sometimes, the specialized nomenclature doesn’t seem to be worth the effort. Forexample, SNMP uses community strings to control access. In order to gain accessto a device, you must give the community string. If this sounds a lot like a pass-word to you, you are not alone. The primary difference is the way communitystrings are used. The same community strings are often shared by a group or com-munity of devices, something frowned upon with passwords. Their purpose ismore to logically group devices than to provide security.

162 Chapter 7: Device Monitoring with SNMP
This is the Title of the Book, eMatter EditionCopyright © 2007 O’Reilly & Associates, Inc. All rights reserved.
An SNMP manager, software on a central management platform, communicateswith an SNMP agent, software located in the managed device, through SNMP mes-sages. With SNMPv1 there are five types of messages. GET_REQUEST, GET_NEXT_REQUEST, and SET_REQUEST are sent by the manager to the agent to request anaction. In the first two cases, the agent is asked to supply information, such as thevalue of an object. The SET_REQUEST message asks the agent to change the valueof an object.
The remaining messages, GET_RESPONSE and TRAP, originate at the agent. Theagent replies to the first three messages with the GET_RESPONSE message. Ineach case, the exchange is initiated by the manager. With the TRAP message, theaction is initiated by the agent. Like a hardware interrupt on a computer, the TRAPmessage is the agent’s way of getting the attention of the manager. Traps play anessential role in network management in that they alert you to problems needingattention. Knowing that a device is down is, of course, the first step to correctingthe problem. And it always helps to be able to tell a disgruntled user that you areaware of the problem and are working on it. Traps are as close as SNMP gets toreal-time processing. Unfortunately, for many network problems (such as acrashed system) traps may not be sent. Even when traps are sent, they could bediscarded by a busy router. UDP is the transport protocol, so there is no errordetection for lost packets. Figure 7-1 summarizes the direction messages takewhen traveling between the manager and agent.
For a management station to send a packet, it must know the IP address of theagent, the appropriate community string or password used by the agent, and thename of the identifier for the variable or object referenced. Unfortunately, SNMPv1is very relaxed about community strings. These are sent in clear text and can easilybe captured by a packet sniffer. One of the motivating factors for SNMPv2 was toprovide greater security. Be warned, however, SNMPv2c uses plain text commu-nity strings.
Figure 7-1. SNMP messages
GET_REQUEST
GET_RESPONSE
GET_NEXT_REQUEST
SET_NEXT
TRAP
Management Station(Manager)
Managed Device(Agent)

Overview of SNMP 163
This is the Title of the Book, eMatter EditionCopyright © 2007 O’Reilly & Associates, Inc. All rights reserved.
Most systems, by default, use public for the read-only communitystring and private for the read/write community string. When youset up SNMP access on a device, you will be given the opportunityto change these. If you don’t want your system to be reconfigurableby anyone on the Internet, you should change these. When commu-nicating with devices, use read-only community strings wheneverpossible and read/write community strings only when necessary. Usefilters to block all SNMP traffic into or out of your network. Mostagents will also allow you to restrict which devices you can sendand receive SNMP messages to and from. Do this! For simplicity andclarity, the examples in this chapter have been edited to use publicand private. These are not the community strings I actually use.
Another advantage to SNMPv2 is that two additional messages have been added.GET_BULK_REQUEST will request multiple pieces of data with a single query,whereas GET_REQUEST generates a separate request for each piece of data. Thiscan considerably improve performance. The other new message, INFORM_REQUEST, allows one manager to send unsolicited information to another.
Collectively, the objects are variables defined in the Management Information Base(MIB). Unfortunately, MIB is an overused term that means slightly different thingsin different contexts. There are some formal rules for dealing with MIBs—MIB for-mats are defined by Structure of Management Information (SMI), the syntax rulesfor MIB entries are described in Abstract Syntax Notation One (ASN.1), and howthe syntax is encoded is given by Basic Encoding Rules (BER). Unless you are plan-ning to delve into the implementation of SNMP or decode hex dumps, you canpostpone learning SMI, ASN.1, and BER. And because of the complexity of theserules, I advise against looking at hex dumps. Fortunately, programs like ethereal doa good job of decoding these packets, so I won’t discuss these rules in this book.
The actual objects that are manipulated are identified by a unique, authoritativeobject identifier (OID). Each OID is actually a sequence of integers separated bydecimal points, sometimes called dotted notation. For example, the OID for asystem’s description is 1.3.6.1.2.1.1.1. This OID arises from the standardized orga-nization of all such objects, part of which is shown in Figure 7-2. The actualobjects are the leaves of the tree. To eliminate any possibility of ambiguity amongobjects, they are named by giving their complete path from the root of the tree tothe leaf.
As you can see from the figure, nodes are given both names and numbers. Thus,the OID can also be given by specifying the names of each node or objectdescriptor. For example, iso.org.dod.internet.mgmt.mib-2.system.sysDescr is theobject descriptor that corresponds to the object identifier 1.3.6.1.2.1.1.1. The more

164 Chapter 7: Device Monitoring with SNMP
This is the Title of the Book, eMatter EditionCopyright © 2007 O’Reilly & Associates, Inc. All rights reserved.
concise numerical names are used within the agents and within messages. Thenonnumeric names are used at the management station for the convenience ofusers. Objects are coded directly into the agents and manipulated by objectdescriptors. While management stations can mechanically handle object descrip-tors, they must be explicitly given the mappings between object descriptors andobject identifiers if you want to call objects by name. This is one role of the MIBfiles that ship with devices and load onto the management station. These files alsotell the management station which identifiers are valid.
As you might guess from Figure 7-2, this is not a randomly created tree. Throughthe standardization process, a number of identifiers have been specified. In partic-ular, the mib-2 subtree has a number of subtrees or groups of interest. The systemgroup, 1.3.6.1.2.1.1, has nodes used to describe the system such as sysDescr(1),sysObjectID(2), sysUpTime(3), and so on. These should be pretty self-explanatory.Although not shown in the figure, the ip(4) group has a number of objects such asipForwarding(1), which indicates whether IP packets will be forwarded, andipDefaultTTL(2), which gives the default TTL when it isn’t specified by the trans-port layer. The ip group also has three tables including the ipRouteTable(20).While this information can be gleaned from RFC 1213, which defines the MIB, sev-eral books that present this material in a more accessible form are listed inAppendix B. Fortunately, there are tools that can be used to investigate MIBsdirectly.
Figure 7-2. Partial OID structure
ccitt(0) joint-iso-ccitt(2)iso(1)
org(3)
dod(6)
internet(1)
directory(1) mgmt(2) experimental(3) private(4)
enterprise(1)
cisco(9) apc(318) ucdavis(2021) oreilly(2035)
enterprise(1)
system(1) interfaces(2) at(3) rmon(16)
sysObjectID(2)sysDescr(1) sysUpTimes(3) ifNumber(1) ifTable(2)
ifEntry(1)
ifDesc(2)ifIndex(1) ifType(3)

SNMP-Based Management Tools 165
This is the Title of the Book, eMatter EditionCopyright © 2007 O’Reilly & Associates, Inc. All rights reserved.
In addition to standard entries, companies may register private or enterprise MIBs.These have extensions specific to their equipment. Typically, these MIBs must beadded to those on the management station if they are not already there. They areusually shipped with the device or can be downloaded over the Internet. Eachcompany registers for a node under the enterprises node (1.3.6.1.4.1). Theseextensions are under their respective registered nodes.
If you are new to SNMP, this probably seems pretty abstract. Appendix B also listsand discusses a number of sources that describe the theory and architecture ofSNMP in greater detail. But you should know enough at this point to get started.The best way to come to terms with SNMP and the structure of managed objects isby experimentation, and that requires tools. I will try to clarify some of these con-cepts as we examine SNMP management tools.
SNMP-Based Management ToolsThere are several extremely powerful and useful noncommercial SNMP tools.Tools from the NET SNMP project, scotty, and tkined are described here.
NET SNMP (UCD SNMP)
The University of California at Davis implementation of SNMP (UCD SNMP) has itsorigin in a similar project at Carnegie Mellon University under Steve Waldbusser(CMU SNMP). In the mid-nineties, the CMU project languished. During this period,the UCD project was born. The UCD project has greatly expanded the originalCMU work and is flourishing, thanks to the work of Wes Hardaker. The CMUproject reemerged for a while with a somewhat different focus and has seen a lotof support in the Linux community. Both are excellent. While only UCD SNMP willbe described here, the basics of each are so similar that you should have noproblem using CMU SNMP once you are familiar with UCD SNMP. Very recently,UCD SNMP has been renamed NET SNMP to reflect some organizational changes.
NET SNMP is actually a set of tools, a SNMP library, and an extensible agent. Thesource code is available and runs on a number of systems. Binaries are also avail-able for some systems, including Microsoft Windows. NET SNMP supportsSNMPv1, SNMPv2c, and SNMPv3.
Admittedly, the NET SNMP toolset is not ideal for the routine management of alarge network. But it is ideal for learning about SNMP, is not an unreasonabletoolset for occasional tasks on smaller networks, and can be particularly useful indebugging SNMP problems, in part because it separates SNMP functions into indi-vidual utilities. The agent software is a logical choice for systems using Linux orFreeBSD and is extensible. Most, but not all, of the utilities will be described.

166 Chapter 7: Device Monitoring with SNMP
This is the Title of the Book, eMatter EditionCopyright © 2007 O’Reilly & Associates, Inc. All rights reserved.
snmpget
In the last section, it was stated that there are three messages that can be sent by amanagement station: GET_REQUEST, GET_NEXT_REQUEST, and SET_REQUEST.NET SNMP provides utilities to send each of these messages—snmpget,snmpgetnext, and snmpset, respectively. In order to retrieve the value of an object,it is necessary to specify the name or IP address of the remote host, a communitystring for the host, and the OID of the object. For example:
bsd4# snmpget 172.16.1.5 public .1.3.6.1.2.1.1.1.0system.sysDescr.0 = "APC Embedded PowerNet SNMP Agent (SW v2.2, HW vB2, Mod: AP9605, Mfg 08/10/96, SN: WA9632270847, Agent Loader v1.0)"
There are a couple of points to make about the OID. First, notice the 0 at the end.This is an offset into the data. It is a common error to omit this. If you are lookingat a table, you would use the actual offset into the table instead of a 0. Forexample, the description of the third interface in the interface table would havethe OID ifDescr.3.
Second, the leading dot is important. NET SNMP will attempt to attach a prefix toany OIDs not beginning with a dot. By default, the prefix is 1.3.6.1.2.1, butyou can change this by setting the environment variable PREFIX. In this example,we have specified the OID explicitly. Without the leading dot, snmpget wouldhave added the prefix to what we had, giving an OID that was too long. On theother hand, you could just use 1.1.0 without the leading dot and you would getthe same results. Initially, using the prefix can be confusing, but it can save a lot oftyping once you are used to it.
Of course, you can also use names rather than numbers, provided the appropriateMIB is available. This is shown in the next two examples:
bsd4# snmpget 172.16.1.5 public iso.org.dod.internet.mgmt.mib-2.system.sysDescr.0system.sysDescr.0 = "APC Embedded PowerNet SNMP Agent (SW v2.2, HW vB2, Mod: AP9605, Mfg 08/10/96, SN: WA9632270847, Agent Loader v1.0)"bsd4# snmpget 172.16.1.5 public system.sysDescr.0system.sysDescr.0 = "APC Embedded PowerNet SNMP Agent (SW v2.2, HW vB2, Mod: AP9605, Mfg 08/10/96, SN: WA9632270847, Agent Loader v1.0)"
In the first case, the full path was given, and in the second the prefix was used.(Don’t forget the trailing 0.) Numbers and names can be mixed:
bsd4# snmpget 172.16.1.5 public .1.3.6.internet.2.1.system.1.0system.sysDescr.0 = "APC Embedded PowerNet SNMP Agent (SW v2.2, HW vB2, Mod: AP9605, Mfg 08/10/96, SN: WA9632270847, Agent Loader v1.0)"
(Frankly, I can’t see much reason for doing this.)

SNMP-Based Management Tools 167
This is the Title of the Book, eMatter EditionCopyright © 2007 O’Reilly & Associates, Inc. All rights reserved.
Also, if the MIB is known, you can do a random-access lookup for unique nodenames:
bsd4# snmpget 172.16.1.5 public upsBasicIdentModel.0enterprises.apc.products.hardware.ups.upsIdent.upsBasicIdent.upsBasicIdentModel.0 = "APC Smart-UPS 700 "
In this example, only the final identifier in the OID, upsBasicIdentMode.0, isgiven, and the MIB is searched to construct the full OID. This can be particularlyhelpful if you want to query several objects with a single snmpget. You can alsouse multiple OIDs in the same snmpget command to retrieve the values of severalobjects.
Configuration and options
Before we look further at the NET SNMP commands, let’s discuss configuration andoptions. For the most part, these tools share the same configuration files andoptions. (A few exceptions will be noted when appropriate.) The general configura-tion file is snmp.conf and is typically in the /usr/local/share/snmp, /usr/local/lib/snmp, or $HOME/.snmp directory. This search path can be overridden by setting theSNMPCONFPATH environment variable. Further documentation can be found in thesnmp.conf Unix manpage. This manpage also describes environment variables.
One particular concern in configuring the software is the proper installation ofMIBs. As noted earlier, use of the name form of OIDs works only if the appro-priate MIB* is loaded. Devices may have more than one MIB associated with them.In the examples just presented, we have been interacting with an SNMP-controlleduninterruptible power supply (UPS) manufactured by APC Corp. With this device,we can use the standard default MIB-II defined in RFC 1213. This standard MIBdefines objects used by most devices. If you have correctly installed the software,this MIB should be readily available. There are two additional MIBs that may beinstalled for this particular device. The first is the IETF MIB, which defines ageneric UPS. This is the UPS-MIB defined by RFC 1628. The third MIB, PowerNet-MIB, contains APC Corp.’s custom extensions. These last two MIBs came on a dis-kette with the SNMP adapter for this particular UPS.
To install these MIBs, the files are first copied to the appropriate directory, /usr/local/share/snmp in this case. (You may also want to rename them so that all yourMIB files have consistent names.) Next, the environment variable MIBS is set sothe MIBs will be loaded. This can be a colon-delimited list of individual MIBnames, but setting MIBS to ALL is usually simpler. On a Windows computer, usethe command:
C:\usr\bin>set MIBS=ALL
* When a MIB is loaded, it becomes part of the MIB. Don’t say I didn’t warn you.

168 Chapter 7: Device Monitoring with SNMP
This is the Title of the Book, eMatter EditionCopyright © 2007 O’Reilly & Associates, Inc. All rights reserved.
On a Unix system using the Bash shell, you would use:
export MIBS=ALL
For the C-shell, use:
setenv MIBS ALL
Of course, this may vary depending on the shell you use.
Alternately, you can use the environment variable MIBFILES to specify filenames.There is also a command-line option with most of these utilities, -m, to load spe-cific MIBs. If the MIBs are not installed correctly, you will not be able to usenames from the MIB, but you can still access objects by their numerical OIDs.
The NET SNMP commands use the same basic syntax and command-line options.For example, the earlier discussion on OID usage applies to each command. Thisis described in the variables manpage. The manpages for the individual com-mands are a little sparse. This is because the descriptions of the options have beencollected together on the snmpcmd manpage. Options applicable to a specificcommand can be displayed by using the -h option.
Let’s return to snmpget and look at some of the available options. The -O optionscontrol how output is formatted. The default is to print the text form of the OID:
bsd4# snmpget 172.16.1.5 public .1.3.6.1.4.1.318.1.1.1.1.1.1.0enterprises.apc.products.hardware.ups.upsIdent.upsBasicIdent.upsBasicIdentModel.0 = "APC Smart-UPS 700 "
-On forces the OID to be printed numerically:
bsd4# snmpget -On 172.16.1.5 public .1.3.6.1.4.1.318.1.1.1.1.1.1.0.1.3.6.1.4.1.318.1.1.1.1.1.1.0 = "APC Smart-UPS 700 "
Sometimes the value of an object will be a cryptic numerical code. By default, adescription will be printed. For example:
bsd4# snmpget 172.16.1.5 public ip.ipForwarding.0ip.ipForwarding.0 = not-forwarding(2)
Here, the actual value of the object is 2. This description can be suppressed withthe -Oe option:
bsd4# snmpget -Oe 172.16.1.5 public ip.ipForwarding.0ip.ipForwarding.0 = 2
This could be useful in eliminating any confusion about the actual stored value,particularly if you are going to use the value subsequently with a SET command.
Use the -Os, -OS, and -Of commands to control the amount of informationincluded in the OID. The -Os option displays the final identifier only:
bsd4# snmpget -Os 172.16.1.5 public enterprises.318.1.1.1.1.1.1.0upsBasicIdentModel.0 = "APC Smart-UPS 700 "

SNMP-Based Management Tools 169
This is the Title of the Book, eMatter EditionCopyright © 2007 O’Reilly & Associates, Inc. All rights reserved.
The -OS option is quite similar to -Os except that the name of the MIB is placedbefore the identifier:
sd4# snmpget -OS 172.16.1.5 public enterprises.318.1.1.1.1.1.1.0PowerNet-MIB::upsBasicIdentModel.0 = "APC Smart-UPS 700 "
-Of forces the display of the full OID:
bsd4# snmpget -Of 172.16.1.5 public enterprises.318.1.1.1.1.1.1.0.iso.org.dod.internet.private.enterprises.apc.products.hardware.ups.upsIdent.upsBasicIdent.upsBasicIdentModel.0 = "APC Smart-UPS 700 "
This leaves no question about what you are looking at.
There are a number of additional options. The -V option will return the program’sversion. The version of SNMP used can be set with the -v option, either 1, 2c, or 3.The -d option can be used to dump all SNMP packets. You can set the number ofretries and timeouts with the -r and -t options. These few options just scratch thesurface. The syntax for many of these options has changed recently, so be sure toconsult the snmpcmd manpage for more options and details for the version you use.
snmpgetnext, snmpwalk, and snmptable
Sometimes you will want to retrieve several related values that are stored togetherwithin the agent. Several commands facilitate this sort of retrieval. Thesnmpgetnext command is very similar to the snmpget command. But whilesnmpget returns the value of the specified OID, snmpgetnext returns the value ofthe next object in the MIB tree:
bsd4# snmpget -Os 172.16.1.5 public sysDescr.0sysDescr.0 = APC Embedded PowerNet SNMP Agent (SW v2.2, HW vB2, Mod: AP9605, Mfg 08/10/96, SN: WA9632270847, Agent Loader v1.0)bsd4# snmpgetnext -Os 172.16.1.5 public sysDescr.0sysObjectID.0 = OID: smartUPS700bsd4# snmpgetnext -Os 172.16.1.5 public sysObjectID.0sysUpTime.0 = Timeticks: (77951667) 9 days, 0:31:56.67bsd4# snmpgetnext -Os 172.16.1.5 public sysUpTime.0sysContact.0 = Sloan
As you can see from this example, snmpgetnext can be used to walk through asequence of values. Incidentally, this is one of the few cases in which it is OK toomit the trailing 0. This command can be particularly helpful if you don’t knowthe next identifier.
If you want all or most of the values of adjacent objects, the snmpwalk commandcan be used to retrieve a subtree. For example:
bsd4# snmpwalk 172.16.1.5 public systemsystem.sysDescr.0 = APC Embedded PowerNet SNMP Agent (SW v2.2, HW vB2, Mod:AP9605, Mfg 08/10/96, SN: WA9632270847, Agent Loader v1.0)system.sysObjectID.0 = OID: enterprises.apc.products.system.smartUPS.smartUPS700system.sysUpTime.0 = Timeticks: (78093618) 9 days, 0:55:36.18

170 Chapter 7: Device Monitoring with SNMP
This is the Title of the Book, eMatter EditionCopyright © 2007 O’Reilly & Associates, Inc. All rights reserved.
system.sysContact.0 = Sloansystem.sysName.0 = Equipment Rack APCsystem.sysLocation.0 = Network Laboratorysystem.sysServices.0 = 72
Be prepared to be overwhelmed if you don’t select a small subtree. You probablywouldn’t want to walk the mib-2 or enterprises subtree:
bsd4# snmpwalk 172.16.2.1 public enterprises | wc 3320 10962 121987
In this example, the enterprises subtree is 3320 lines long. Nonetheless, even withlarge subtrees this can be helpful to get a quick idea of what is out there. Forexample, you might pipe output from a subtree you aren’t familiar with to head ormore so you can skim it.
Some objects are stored as tables. It can be painful to work with these tables oneitem at a time, and once you have them, they can be almost unreadable.snmptable is designed to address this need. Here is an example of a small routetable from a Cisco 3620 router:
bsd4# snmptable -Cb -Cw 80 172.16.2.1 public ipRouteTableSNMP table: ip.ipRouteTable
Dest IfIndex Metric1 Metric2 Metric3 Metric4 NextHop Type 0.0.0.0 0 0 -1 -1 -1 205.153.60.2 indirect 172.16.1.0 2 0 -1 -1 -1 172.16.1.1 direct 172.16.2.0 3 0 -1 -1 -1 172.16.2.1 direct 172.16.3.0 4 0 -1 -1 -1 172.16.3.1 direct 205.153.60.0 1 0 -1 -1 -1 205.153.60.250 direct 205.153.61.0 0 0 -1 -1 -1 205.153.60.1 indirect 205.153.62.0 0 0 -1 -1 -1 205.153.60.1 indirect 205.153.63.0 0 0 -1 -1 -1 205.153.60.1 indirect
SNMP table ip.ipRouteTable, part 2
Proto Age Mask Metric5 Info local 33 0.0.0.0 -1 .ccitt.nullOID local 0 255.255.255.0 -1 .ccitt.nullOID local 0 255.255.255.0 -1 .ccitt.nullOID local 0 255.255.255.0 -1 .ccitt.nullOID local 0 255.255.255.0 -1 .ccitt.nullOID local 33 255.255.255.0 -1 .ccitt.nullOID local 33 255.255.255.0 -1 .ccitt.nullOID local 33 255.255.255.0 -1 .ccitt.nullOID
Even with snmptable, it can be a little tricky to get readable output. In this case, Ihave used two options to help. -Cb specifies a brief header. -Cw 80 defines a max-imum column width of 80 characters, resulting in a multipart table. You can alsospecify the column delimiter with the -Cf option, and you can suppress headersaltogether with the -CH option. (There are also a snmpbulkget and asnmpbulkwalk if you are using SNMPv2.)
SNMP-Based Management Tools 171
This is the Title of the Book, eMatter EditionCopyright © 2007 O’Reilly & Associates, Inc. All rights reserved.
snmpset
The snmpset command is used to change the value of objects by sending SET_REQUEST messages. The syntax of this command is a little different from previouscommands since you must also specify a value and a type for the value. You willalso need to use a community string that provides read/write access:
bsd4# snmpset 172.16.1.5 private sysContact.0 s "el Zorro"system.sysContact.0 = el Zorro
In this example, the system contact was set using a quote-delimited string. Legiti-mate types include integers (i), strings (s), hex strings (x), decimal strings (d), nullobjects (n), object ID (o), time ticks (t), and IP addresses (a), among others.
People often think of SNMP as being appropriate only for collecting information,not as a general configuration tool, since SNMP only allows objects to be retrievedor set. However, many objects are configuration parameters that control the opera-tion of the system. Moreover, agents can react to changes made to objects by run-ning scripts, and so on. With the appropriate agent, virtually any action can betaken.* For example, you could change entries in an IP routing table, enable ordisable a second interface on a device, or enable or disable IP forwarding. With anSNMP-controlled UPS, you could shut off power to a device. What you can do,and will want to do, will depend on both the device and the context. You willneed to study the documentation for the device and the applicable MIBs to knowwhat is possible on a case-by-case basis.
snmptranslate
In all the preceding examples, I have specified an OID. An obvious question ishow did I know the OID? Available OIDs are determined by the design of theagent and are described by its MIB. There are several different approaches youcan take to discover the contents of a MIB. The most direct approach is to read theMIB. This is not a difficult task if you don’t insist on understanding every detail.You’ll be primarily interested in the object definitions.
Here is an example of the definition of the system contact (sysContact) taken fromMIB-II (RFC 1213):
sysContact OBJECT-TYPE SYNTAX DisplayString (SIZE (0..255)) ACCESS read-write STATUS mandatory DESCRIPTION
* In an extremely interesting interview of John Romkey by Carl Malamud on this topic, Romkey describesan SNMP-controlled toaster. The interview was originally on the Internet radio program Geek of the Week(May 29, 1993). At one time, it was available on audio tape from O’Reilly & Associates (ISBN 1-56592-997-7). Visit http://town.hall.org/radio/Geek and follow the link to Romkey.

172 Chapter 7: Device Monitoring with SNMP
This is the Title of the Book, eMatter EditionCopyright © 2007 O’Reilly & Associates, Inc. All rights reserved.
"The textual identification of the contact person for this managed node, together with information on how to contact this person." ::= { system 4 }
The object name is in the first line. The next line says the object’s type is a stringand specifies its maximum size. The third line tells us that this can be read orwritten. In addition to read-write, an object may be designated read-only or not-accessible. While some objects may not be implemented in every agent, this objectis required, as shown in the next line. Next comes the description. The last linetells where the object fits into the MIB tree. This is the fourth node in the systemgroup.
With an enterprise MIB, there is usually some additional documentation thatexplains what is available. With standard MIBs like this one, numerous descrip-tions in books on SNMP describe each value in detail. These can be very helpfulsince they are usually accompanied by tables or diagrams that can be scannedquickly. See Appendix B for specific suggestions.
NET SNMP provides two tools that can be helpful. We have already discussedsnmpwalk. Another useful tool is snmptranslate. This command is designed topresent a MIB in a human-readable form. snmptranslate can be used in a numberof different ways. First, it can be used to translate between the text and numericform of an object. For example:
bsd4# snmptranslate system.sysContact.0.1.3.6.1.2.1.1.4.0
We can get the numeric form with the -On option as shown in the next twoexamples:
bsd4# snmptranslate -On .1.3.6.1.2.1.1.4.0system.sysContact.0
bsd4# snmptranslate -Ofn system.sysContact.0.iso.org.dod.internet.mgmt.mib-2.system.sysContact.0
snmptranslate can be a little particular about prefixes. In the previous example,sysContact.0 would not have been sufficient. You can get around this with the -IRoption. (This is usually the default for most NET SNMP commands.)
bsd4# snmptranslate -IR sysContact.0.1.3.6.1.2.1.1.4.0
You can also use regular expression matching. For example:
bsd4# snmptranslate -On -Ib 'sys.*ime'system.sysUpTime
Notice the use of single quotes. (This option can return a few surprises at times aswell.)

SNMP-Based Management Tools 173
This is the Title of the Book, eMatter EditionCopyright © 2007 O’Reilly & Associates, Inc. All rights reserved.
You get extended information by using the -Td option:
bsd4# snmptranslate -Td system.sysContact.1.3.6.1.2.1.1.4sysContact OBJECT-TYPE -- FROM SNMPv2-MIB, RFC1213-MIB -- TEXTUAL CONVENTION DisplayString SYNTAX OCTET STRING (0..255) DISPLAY-HINT "255a" MAX-ACCESS read-write STATUS current DESCRIPTION "The textual identification of the contact person for this managed node, together with information on how to contact this person. If no contact information is known, the value is the zero-length string."::= { iso(1) org(3) dod(6) internet(1) mgmt(2) mib-2(1) system(1) 4 }
This is basically what we saw in the MIB but in a little more detail. (By the way,the lines starting with -- are just comments embedded in the MIB.)
We can use snmptranslate to generate a tree representation for subtrees by usingthe -Tp option. For example:
bsd4# snmptranslate -Tp system+--system(1) | +-- -R-- String sysDescr(1) | Textual Convention: DisplayString | Size: 0..255 +-- -R-- ObjID sysObjectID(2) +-- -R-- TimeTicks sysUpTime(3) +-- -RW- String sysContact(4) | Textual Convention: DisplayString | Size: 0..255 +-- -RW- String sysName(5) | Textual Convention: DisplayString | Size: 0..255 +-- -RW- String sysLocation(6) | Textual Convention: DisplayString | Size: 0..255 +-- -R-- Integer sysServices(7) +-- -R-- TimeTicks sysORLastChange(8) | Textual Convention: TimeStamp | +--sysORTable(9) | +--sysOREntry(1) | +-- ---- Integer sysORIndex(1) +-- -R-- ObjID sysORID(2) +-- -R-- String sysORDescr(3) | Textual Convention: DisplayString | Size: 0..255 +-- -R-- TimeTicks sysORUpTime(4) Textual Convention: TimeStamp
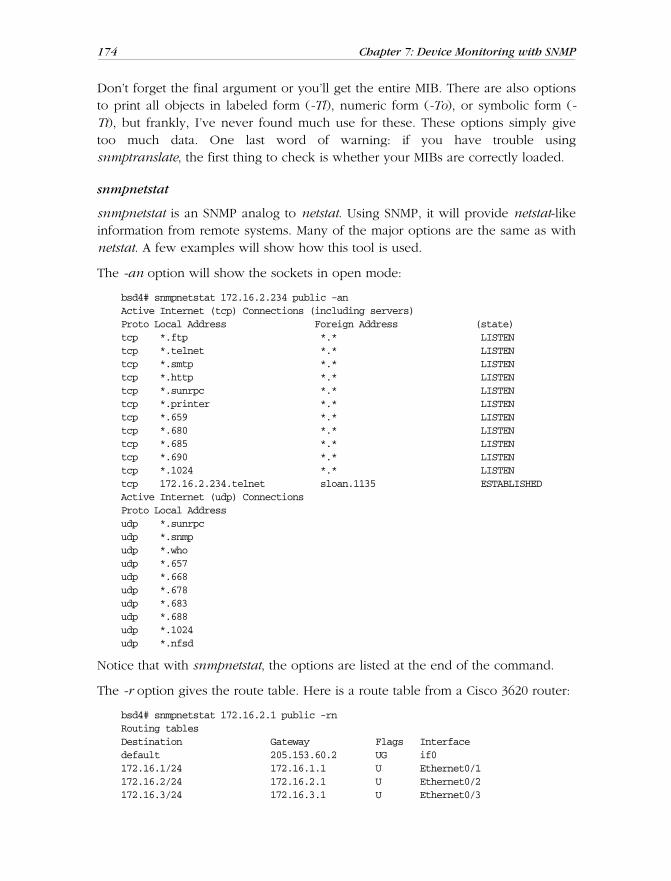
174 Chapter 7: Device Monitoring with SNMP
This is the Title of the Book, eMatter EditionCopyright © 2007 O’Reilly & Associates, Inc. All rights reserved.
Don’t forget the final argument or you’ll get the entire MIB. There are also optionsto print all objects in labeled form (-Tl), numeric form (-To), or symbolic form (-Tt), but frankly, I’ve never found much use for these. These options simply givetoo much data. One last word of warning: if you have trouble usingsnmptranslate, the first thing to check is whether your MIBs are correctly loaded.
snmpnetstat
snmpnetstat is an SNMP analog to netstat. Using SNMP, it will provide netstat-likeinformation from remote systems. Many of the major options are the same as withnetstat. A few examples will show how this tool is used.
The -an option will show the sockets in open mode:
bsd4# snmpnetstat 172.16.2.234 public -anActive Internet (tcp) Connections (including servers)Proto Local Address Foreign Address (state)tcp *.ftp *.* LISTENtcp *.telnet *.* LISTENtcp *.smtp *.* LISTENtcp *.http *.* LISTENtcp *.sunrpc *.* LISTENtcp *.printer *.* LISTENtcp *.659 *.* LISTENtcp *.680 *.* LISTENtcp *.685 *.* LISTENtcp *.690 *.* LISTENtcp *.1024 *.* LISTENtcp 172.16.2.234.telnet sloan.1135 ESTABLISHEDActive Internet (udp) ConnectionsProto Local Addressudp *.sunrpcudp *.snmpudp *.whoudp *.657udp *.668udp *.678udp *.683udp *.688udp *.1024udp *.nfsd
Notice that with snmpnetstat, the options are listed at the end of the command.
The -r option gives the route table. Here is a route table from a Cisco 3620 router:
bsd4# snmpnetstat 172.16.2.1 public -rnRouting tablesDestination Gateway Flags Interfacedefault 205.153.60.2 UG if0172.16.1/24 172.16.1.1 U Ethernet0/1172.16.2/24 172.16.2.1 U Ethernet0/2172.16.3/24 172.16.3.1 U Ethernet0/3

SNMP-Based Management Tools 175
This is the Title of the Book, eMatter EditionCopyright © 2007 O’Reilly & Associates, Inc. All rights reserved.
205.153.60 205.153.60.250 U Ethernet0/0205.153.61 205.153.60.1 UG if0205.153.62 205.153.60.1 UG if0205.153.63 205.153.60.1 UG if0
In each of these examples, the -n option is used to suppress name resolution.
Here are the packet counts for the interfaces from the same router:
bsd4# snmpnetstat 172.16.2.1 public -iName Mtu Network Address Ipkts Ierrs Opkts Oerrs QueueEthernet0/1 1500 172.16.1/24 172.16.1.1 219805 0 103373 0 0Ethernet0/0 1500 205.153.60 205.153.60.250 406485 0 194035 0 0Ethernet0/2 1500 172.16.2/24 172.16.2.1 177489 1 231011 0 0Ethernet0/3 1500 172.16.3/24 172.16.3.1 18175 0 97954 0 0Null0 1500 0 0 0 0 0
As with netstat, the -i option is used.
As a final example, the -s option is used with the -P option to get general statisticswith output restricted to a single protocol, in this case IP:
bsd4# snmpnetstat 172.16.2.1 public -s -P ipip: 533220 total datagrams received 0 datagrams with header errors 0 datagrams with an invalid destination address 231583 datagrams forwarded 0 datagrams with unknown protocol 0 datagrams discarded 301288 datagrams delivered 9924 output datagram requests 67 output datagrams discarded 4 datagrams with no route 0 fragments received 0 datagrams reassembled 0 reassembly failures 0 datagrams fragmented 0 fragmentation failures 0 fragments created
This should all seem very familiar to netstat users.
snmpstatus
The snmpstatus command is a quick way to get a few pieces of basic informationfrom an agent:
bsd4# snmpstatus 172.16.2.1 public[172.16.2.1]=>[Cisco Internetwork Operating System SoftwareIOS (tm) 3600 Software (C3620-IO3-M), Version 12.0(7)T, RELEASE SOFTWARE (fc2)Copyright (c) 1986-1999 by Cisco Systems, Inc.Compiled Wed 08-Dec-99 10:08 by phanguye] Up: 11 days, 1:31:43.66Interfaces: 5, Recv/Trans packets: 1113346/629074 | IP: 533415/9933

176 Chapter 7: Device Monitoring with SNMP
This is the Title of the Book, eMatter EditionCopyright © 2007 O’Reilly & Associates, Inc. All rights reserved.
It gets the IP address, text description, time since the system was booted, totalreceived and transmitted packets, and total received and transmitted IP packets.
Agents and traps
In addition to management software, NET SNMP also includes the agent snmpd.As with any agent, snmpd responds to SNMP messages, providing basic manage-ment for the host on which it is run. snmpd uses the snmpd.conf configuration file(not to be confused with snmp.conf, the configuration file for the utilities). snmpdfunctionality will depend, in part, on what is enabled by its configuration file. Thedistribution comes with the MIB UCD-SNMP-MIB.txt and the file EXAMPLE.conf, anexample configuration file that is fairly well documented. The manpage for snmpd.conf provides additional information.
At a minimum, you’ll want to edit the security entries. The com2sec entry is usedto set the community names for a host or network. The group entry defines anaccess class. For example, consider these three lines from a configuration file:
com2sec local 172.16.2.236 private...group MyRWGroup v1 local...access MyRWGroup "" any noauth prefix all all none
The first line sets the community string to private for the single host 172.16.2.236. The last two establish that this host is using SNMPv1 and has both read andwrite privileges.
Even without further editing of the configuration file, the agent provides a numberof useful pieces of information. These include things like information on pro-cesses (prTable), memory usage (memory), processor load (laTable), and diskusage (dskTable). For example, here is the disk information from a Linux system:
bsd4# snmpwalk 172.16.2.234 public dskTableenterprises.ucdavis.dskTable.dskEntry.dskIndex.1 = 1enterprises.ucdavis.dskTable.dskEntry.dskPath.1 = /enterprises.ucdavis.dskTable.dskEntry.dskDevice.1 = /dev/sda1enterprises.ucdavis.dskTable.dskEntry.dskMinimum.1 = 10000enterprises.ucdavis.dskTable.dskEntry.dskMinPercent.1 = -1enterprises.ucdavis.dskTable.dskEntry.dskTotal.1 = 202182enterprises.ucdavis.dskTable.dskEntry.dskAvail.1 = 133245enterprises.ucdavis.dskTable.dskEntry.dskUsed.1 = 58497enterprises.ucdavis.dskTable.dskEntry.dskPercent.1 = 31enterprises.ucdavis.dskTable.dskEntry.dskErrorFlag.1 = 0enterprises.ucdavis.dskTable.dskEntry.dskErrorMsg.1 =
Most of the entries are just what you would guess. The dskPath entry says we arelooking at the root partition. The dskDevice gives the path to the partition beingexamined, /dev/sda1. The next two items are parameters for triggering error mes-sages. The dskTotal entry is the size of the partition in kilobytes. This partition is

SNMP-Based Management Tools 177
This is the Title of the Book, eMatter EditionCopyright © 2007 O’Reilly & Associates, Inc. All rights reserved.
202MB. The next two entries, dskAvail and dskUsed, give the amount of availableand used space; 31% of the disk is in use. Here is the output from df for the samesystem:
lnx1# df -k /Filesystem 1k-blocks Used Available Use% Mounted on/dev/sda1 202182 58497 133245 31% /
The last two entries are objects used to signal errors. By editing the configurationfile, you can get information on other partitions. Brief descriptions for each objectare included within the MIB, UCD-SNMP-MIB.txt. Directions for changing the con-figuration file are given in the example file.
It is also possible to extend the agent. This will allow you to run external pro-grams or scripts. The output, in its simplest form, is limited to a single line and anexit code that can be retrieved as an MIB object. For example, the following linecould be added to the configuration file:
exec datetest /bin/date -j -u
Here, exec is a keyword, datetest is a label, /bin/date is the command, and the restof the line is treated as a set of arguments and parameters to the command. The -joption prevents a query to set the date, and -u specifies Coordinated Universaltime. The command is run by the agent each time you try to access the object. Forexample, snmpwalk could be used to retrieve the following information:
bsd4# snmpwalk 172.16.2.236 private extTableenterprises.ucdavis.extTable.extEntry.extIndex.1 = 1enterprises.ucdavis.extTable.extEntry.extNames.1 = datetestenterprises.ucdavis.extTable.extEntry.extCommand.1 = /bin/date -j -uenterprises.ucdavis.extTable.extEntry.extResult.1 = 0enterprises.ucdavis.extTable.extEntry.extOutput.1 = Mon Jun 26 14:10:50 GMT 2000enterprises.ucdavis.extTable.extEntry.extErrFix.1 = 0enterprises.ucdavis.extTable.extEntry.extErrFixCmd.1 =
You should be able to recognize the label, command with options, exit code, andoutput in this table. The command will be run each time you retrieve a value fromthis table.
Running snmpd on a system is straightforward. As root, type snmpd, and it willimmediately fork and return the prompt. There are several options you can use. Ifyou don’t want it to fork, you can use the -f option. This is useful with optionsthat return additional runtime information. I’ve found that it is also useful whentesting the configuration file. I’ll start snmpd in one window and test the configu-ration in another. When I’m ready to change configurations, I jump back to theoriginal window and kill and restart the process. Of course, you can always use psto look up the process and then send the process a -HUP signal. Or you could use

178 Chapter 7: Device Monitoring with SNMP
This is the Title of the Book, eMatter EditionCopyright © 2007 O’Reilly & Associates, Inc. All rights reserved.
snmpset to set the OID versionUpdateConfig to 1 to force a reload of the configu-ration file:
bsd4# snmpset 172.16.2.236 private versionUpdateConfig.0 i 1enterprises.ucdavis.version.versionUpdateConfig.0 = 1
Take your pick, but you must reload the file before changes will take effect.
It is possible to use snmpd options in a couple of ways to trace packet exchanges.You can use the options -f, -L, and -d, respectively, to prevent forking, to redirectmessages to standard output, and to dump packets. Here is an example:
bsd4# snmpd -f -L -dUCD-SNMP version 4.1.2
Received 49 bytes from 205.153.63.30:10550000: 30 82 00 2D 02 01 00 04 06 70 75 62 6C 69 63 A0 0..-.....public.0016: 82 00 1E 02 02 0B 78 02 01 00 02 01 00 30 82 00 ......x......0..0032: 10 30 82 00 0C 06 08 2B 06 01 02 01 01 06 00 05 .0.....+........0048: 00 .
Received SNMP packet(s) from 205.153.63.30 GET message -- system.sysLocation.0 >> system.sysLocation.0 = 303 Laura Lander Hall
Sending 70 bytes to 205.153.63.30:10550000: 30 82 00 42 02 01 00 04 06 70 75 62 6C 69 63 A2 0..B.....public.0016: 82 00 33 02 02 0B 78 02 01 00 02 01 00 30 82 00 ..3...x......0..0032: 25 30 82 00 21 06 08 2B 06 01 02 01 01 06 00 04 %0..!..+........0048: 15 33 30 33 20 4C 61 75 72 61 20 4C 61 6E 64 65 .303 Laura Lande0064: 72 20 48 61 6C 6C r Hall
This is probably more information than you want. As previously noted, you prob-ably don’t want to delve into the hex. You can replace the -d option with the -Voption to get a verbose display but without the dump:
bsd4# snmpd -f -L -VUCD-SNMP version 4.1.2Received SNMP packet(s) from 205.153.63.30 GET message -- system.sysLocation.0 >> system.sysLocation.0 = 303 Laura Lander Hall
This should give you an adequate idea of what is going on for most trouble-shooting needs. See the manpage for other options.
NET SNMP also includes two applications for dealing with traps. snmptrapd startsa daemon to receive and respond to traps. It uses the configuration filesnmptrapd.conf. The snmptrap is an application used to generate traps. Whilethese can be useful in troubleshooting, their use is arcane to say the least. You will

SNMP-Based Management Tools 179
This is the Title of the Book, eMatter EditionCopyright © 2007 O’Reilly & Associates, Inc. All rights reserved.
need to edit the appropriate MIB files before using these. There are simpler waysto test traps.
scotty
scotty was introduced in Chapter 6. Now that we’ve talked a little about SNMP,here are a few more examples of using scotty. These are based on examples givenin one of the README files that comes with scotty. Since you will have to installscotty to get tkined, it is helpful to know a few scotty commands to test yoursetup. These scotty commands also provide a quick-and-dirty way of getting a fewpieces of information.
To use SNMP with scotty, you must first establish an SNMP session:
lnx1# scotty% set s [snmp session -address 172.16.1.5 -community private]snmp0
Once you have a session, you can retrieve a single object, multiple objects, thesuccessor of an object, or subtrees. Here are some examples:
% $s get sysDescr.0{1.3.6.1.2.1.1.1.0 {OCTET STRING} {APC Embedded PowerNet SNMP Agent (SW v2.2, HW vB2, Mod: AP9605, Mfg 08/10/96, SN: WA9632270847, Agent Loader v1.0)}}% $s get "sysDescr.0 sysContact.0"{1.3.6.1.2.1.1.1.0 {OCTET STRING} {APC Embedded PowerNet SNMP Agent (SW v2.2, HW vB2, Mod: AP9605, Mfg 08/10/96, SN: WA9632270847, Agent Loader v1.0)}} {1.3.6.1.2.1.1.4.0 {OCTET STRING} {Sloan <[email protected]>}}% $s getnext sysUpTime.0{1.3.6.1.2.1.1.4.0 {OCTET STRING} {Sloan <[email protected]>}}% $s getnext [mib successor system]{1.3.6.1.2.1.1.1.0 {OCTET STRING} {APC Embedded PowerNet SNMP Agent (SW v2.2, HW vB2, Mod: AP9605, Mfg 08/10/96, SN: WA9632270847, Agent Loader v1.0)}} {1.3.6.1.2.1.1.2.0 {OBJECT IDENTIFIER} PowerNet-MIB!smartUPS700} {1.3.6.1.2.1.1.3.0 TimeTicks {4d 22:27:07.42}} {1.3.6.1.2.1.1.4.0 {OCTET STRING} {Joe Sloan}} {1.3.6.1.2.1.1.5.0 {OCTET STRING} {APC UPS}} {1.3.6.1.2.1.1.6.0 {OCTET STRING} {214 Laura Lander Hall, Equipment Rack}} {1.3.6.1.2.1.1.7.0 INTEGER 72} {1.3.6.1.2.1.2.1.0 INTEGER 1} {1.3.6.1.2.1.2.1.0 INTEGER 1}
Once you know the syntax, it is straightforward to change the value of objects ascan be seen here:
% $s set [list [list sysContact.0 "OCTET STRING" "Joe Sloan"] ]{1.3.6.1.2.1.1.4.0 {OCTET STRING} {Joe Sloan}}% $s get sysContact.0{1.3.6.1.2.1.1.4.0 {OCTET STRING} {Joe Sloan}}
Notice that after the object is set, I have retrieved it to verify the operation. Istrongly recommend doing this each time you change something.

180 Chapter 7: Device Monitoring with SNMP
This is the Title of the Book, eMatter EditionCopyright © 2007 O’Reilly & Associates, Inc. All rights reserved.
If you aren’t familiar with Tcl, then defining a trap handler will seem arcane. Hereis an example:
% % proc traphandler {ip list} { set msg "SNMP trap from $ip:" foreach vb $list { append msg " [mib name [lindex $vb 0]]=\"[lindex $vb 2]\"" } puts stderr $msg }% set t [snmp session -port 162]snmp1% $t bind "" trap {traphandler %A "%V"}
Once the trap handler is defined, we can test it by interrupting the power to theUPS by unplugging the UPS.* This test generated the following trap messages:
% SNMP trap from 172.16.1.5: sysUpTime.0="2d 21:15:50.44" snmpTrapOID.0="PowerNet-MIB!upsOnBattery" smartUPS700="57:41:52:4E:49:4E:47:3A:20:54:68:65:20:55:50:53:20:6F:6E:20:73:65:72:69:61:6C:20:70:6F:72:74:20:31:20:69:73:20:6F:6E:20:62:61:74:74:65:72:79:20:62:61:63:6B:75:70:20:70:6F:77:65:72:2E" snmpTrapEnterprise.0="apc"SNMP trap from 172.16.1.5: sysUpTime.0="2d 21:15:50.55" snmpTrapOID.0="1.3.6.1.2.1.33.2.0.1" upsEstimatedMinutesRemaining="31" upsSecondsOnBattery="0" upsConfigLowBattTime="2" snmpTrapEnterprise.0="upsTraps"SNMP trap from 172.16.1.5: sysUpTime.0="2d 21:15:50.66" snmpTrapOID.0="1.3.6.1.2.1.33.2.0.3" upsAlarmId="12" upsAlarmDescr="UPS-MIB!upsAlarmInputBad" snmpTrapEnterprise.0="upsTraps"SNMP trap from 172.16.1.5: sysUpTime.0="2d 21:15:55.27" snmpTrapOID.0="1.3.6.1.2.1.33.2.0.4" upsAlarmId="11" upsAlarmDescr="UPS-MIB!upsAlarmOnBattery" snmpTrapEnterprise.0="upsTraps"SNMP trap from 172.16.1.5: sysUpTime.0="2d 21:15:55.38" snmpTrapOID.0="1.3.6.1.2.1.33.2.0.4" upsAlarmId="12" upsAlarmDescr="UPS-MIB!upsAlarmInputBad" snmpTrapEnterprise.0="upsTraps"SNMP trap from 172.16.1.5: sysUpTime.0="2d 21:15:55.50" snmpTrapOID.0="PowerNet-MIB!powerRestored" smartUPS700="49:4E:46:4F:52:4D:41:54:49:4F:4E:3A:20:4E:6F:72:6D:61:6C:20:70:6F:77:65:72:20:68:61:73:20:62:65:65:6E:20:72:65:73:74:6F:72:65:64:20:74:6F:20:74:68:65:20:55:50:53:20:6F:6E:20:73:65:72:69:61:6C:20:70:6F:72:74:20:31:2E" snmpTrapEnterprise.0="apc"
From this example, you can see a sequence of traps as the power is lost andrestored. Most messages should be self-explanatory, and all are explained in theUPS documentation.
Generating traps is much simpler. In this example, a session is started and a trap issent to that session:
% set u [snmp session -port 162 -address 172.16.2.234]snmp2% $u trap coldStart ""
* This is OK with this particular UPS. In fact, it’s suggested in the documentation. However, you don’twant to do this with just any UPS. While UPSs are designed to deal with power interruptions, some arenot necessarily designed to deal with the ground being removed, as happens when you unplug a UPS.

SNMP-Based Management Tools 181
This is the Title of the Book, eMatter EditionCopyright © 2007 O’Reilly & Associates, Inc. All rights reserved.
You can terminate a session without exiting scotty with the destroy command:
% $u destroy
If you are thinking about writing Tcl scripts, this should give you an idea of thepower of the tnm extensions supplied by scotty.
If you aren’t familiar with the syntax of Tcl, these examples will seem fairlyopaque but should give you an idea of what is possible. You could try these onyour system as presented here, but if you are really interested is doing this sort ofthing, you’ll probably want to learn some Tcl first. Several sources of informationare given in Appendix B.
tkined
tkined was introduced in the last chapter. Here we will look at how it can be usedto retrieve information and do basic monitoring. tkined is a versatile tool, and onlysome of the more basic features will be described here. This should be enough toget you started and help you decide if tkined is the right tool for your needs. Asmall test network is shown in Figure 7-3. (We will be looking at this network,along with minor variations, in the following examples.)
ICMP monitoring
ICMP monitoring periodically sends an ECHO_REQUEST packet to a remotedevice to see if the connection is viable. (We’ve seen examples of this before.)
Figure 7-3. Demo network

182 Chapter 7: Device Monitoring with SNMP
This is the Title of the Book, eMatter EditionCopyright © 2007 O’Reilly & Associates, Inc. All rights reserved.
SNMP monitoring is superior when available since it can be used to retrieve addi-tional information. But if the device doesn’t support SNMP, or if you don’t haveSNMP access, ICMP monitoring may be your only option. Your ISP, for example,probably won’t give you SNMP access to their routers even though you depend onthem.
To use ICMP monitoring with tkined, use Tools ➝ IP-Monitor. This will add an IP-Monitor menu to the menu bar. Next, select a device on your map by clicking onthe Select tool and then the device’s icon. Now, use IP-Monitor ➝ Check Reach-ability. (See Figure 7-4.) Since the idea of monitoring is to alert you to problems, ifyour device is reachable, you shouldn’t see any changes. If the device is nearbyand it won’t create any problems, you can test your setup by disconnecting thedevice from the network. The device’s icon should turn red and start flashing. Amessage will also be displayed on the map under the icon.
If the device is in a collapsed group, the icon for the group will flash. Thus, youdon’t have to have an icon displayed for every device you are monitoring. Youcould start a monitor on each device of interest, put related devices into a group,and collapse the group. By creating a number of groups, all collapsed, you can
Figure 7-4. IP-Monitor menu

SNMP-Based Management Tools 183
This is the Title of the Book, eMatter EditionCopyright © 2007 O’Reilly & Associates, Inc. All rights reserved.
monitor a large number of machines from a small, uncluttered map and still beable to drill down on a problem.
When you reconnect the device, the icon should turn black and then stop flashing.It may take a minute to see these changes. By default, the system polls devicesevery 60 seconds. You can check which devices are being monitored by selectingIP-Monitor ➝ Monitor Job Info. A pop-up box will display a list of the monitorsthat are running.
If you want to change parameters, select IP-Monitor ➝ Modify Monitor Job. Thiswill bring up a box displaying a list of running jobs. Select the job of interest byclicking on it, then click on the Modify button. The box listing jobs will bereplaced by a box giving job parameters, as shown in Figure 7-5.
You can reset the polling rate by changing the Intervaltime field. The next tworadio buttons allow you to suspend or restart a suspended job. The two Thresholdfields allow you to establish limits on response times. If your system normallyresponds within, say, 100ms, you could set Rising Threshold to 200ms. If thequality of the connection degrades so that response time rises above 200ms, thesystem will alert you. The Threshold Action buttons allow you to say how youwant to be notified when thresholds are crossed. Finally, you can commit to thechanges, terminate the job, or cancel any changes.
If you are really interested in tracking how response time is changing, you canselect IP-Monitor ➝ Round Trip Time. A small box will appear on the map, par-tially obscuring the icon. (You can drag it to a more convenient location.) This iscalled a stripchart and will plot round-trip times against time. You can changeparameters using IP-Monitor ➝ Modify Monitor Job. You can change labels andscale by right-clicking on the chart.
Figure 7-5. Monitor job parameters

184 Chapter 7: Device Monitoring with SNMP
This is the Title of the Book, eMatter EditionCopyright © 2007 O’Reilly & Associates, Inc. All rights reserved.
Figure 7-6 shows two stripcharts. The chart in the upper right really isn’t veryrevealing since the device is on the local network and everything is working OK.The latest round-trip time is displayed below the stripchart and is updated dynami-cally. A device does not have to be integrated into the map. The site www.infoave.net, an ISP at the bottom of the figure, has been added to the site and is beingmonitored. This icon is partially obscured by a slider used to adjust the scale.Other ICMP monitoring options, shown in Figure 7-4, are available.
SNMP traps
Before you begin using tkined for SNMP-based monitoring, you want to make surethe appropriate MIBs are installed. These will usually be located in a common mibsdirectory under the tnm library directory, e.g., /usr/lib/tnm2.1.10/mibs or /usr/local/lib/tnm2.1.10/mibs. You will want to copy any enterprise MIB you plan to useto that directory. Next, you should verify that the files are compatible. Try loadingthem into scotty with the mib load command, e.g., mib load toaster.mib. If the fileloads without comment, you are probably OK. Finally, you will want to edit theinit.tcl file to automatically load the MIBs. Ideally, you will have a site-specific ver-sion of the file for changes, but you can edit the standard default file. You will wantto add a line that looks something like lappend tnm(mibs) toaster.mib. Youare now ready to start tkined and do SNMP-based monitoring.
The first step is to go to Tools ➝ SNMP-Monitor. This will add the SNMP-Monitormenu to the menu bar. This menu is shown in Figure 7-7. To receive traps, select
Figure 7-6. Map with stripcharts

SNMP-Based Management Tools 185
This is the Title of the Book, eMatter EditionCopyright © 2007 O’Reilly & Associates, Inc. All rights reserved.
SNMP-Monitor ➝ Trap Sink. A pop-up box will give you the option of listening toor ignoring traps. Select the Listen button and click on Accept to start receivingtraps. At this point, the station is now configured to receive traps.
To test that this is really working, we need to generate some traps for the systemto receive. If you are a scotty user, you might use the code presented in the lastsection. For this example, a UPS that was being monitored was unplugged.Regardless of how the trap is generated, tkined responds in the same way. Thedevice icon blinks, a message is written on the map, and a new window, shown inFigure 7-8, is displayed with the trap messages generated by the UPS. Note thatthe duration of this problem was under 5 seconds. It is likely this event wouldhave been missed with polling.
Examining MIBs
Tools ➝ SNMP Tree provides one way of examining MIBs. Or, if you prefer, youcan use Tools ➝ SNMP-Browser. The SNMP Tree command displays a graphicalrepresentation of a subtree of the MIB. This is shown in Figure 7-9.
Menu items allow you to focus in on a particular subtree. For example, the MIB-2menu shows the various subtrees under the MIB-2 node. The Enterprises menushows various enterprise MIBs that have been loaded. You simply select the MIB ofinterest from the menu, and it will be displayed in the window. You can click onan item on the tree and a pop-up window will give you the option of displaying adescription of the item, retrieving its value, changing its value, or displaying just the
Figure 7-7. SNMP-Monitor menu

186 Chapter 7: Device Monitoring with SNMP
This is the Title of the Book, eMatter EditionCopyright © 2007 O’Reilly & Associates, Inc. All rights reserved.
subtree of the node in question. Of course, you will need to select a system beforeyou can retrieve system-specific information.
The SNMP-Browser option provides much the same functionality but displaysinformation in a different format. If you select SNMP-Browser ➝ MIB Browser, youwill be given a text box listing the nodes below the internet node (.1.3.6.1) of theMIB tree. If you click on any of these nodes, the text box will be replaced withone of the nodes under the selected node. In this manner, you can move downthe MIB tree. After the first box, you will also be given the option to move up thetree or, if appropriate, to the previous or next node in the subtree. If you reach aleaf, you will be given a description of the object, as shown in Figure 7-10. If theobject can be changed, you will be given that choice as well.
Figure 7-8. SNMP monitor report
Figure 7-9. SNMP tree

SNMP-Based Management Tools 187
This is the Title of the Book, eMatter EditionCopyright © 2007 O’Reilly & Associates, Inc. All rights reserved.
You are also given the option to walk a subtree. This option will attempt toretrieve all the object values for leaves under the current node. This can be quitelengthy depending on where you are in the tree. Figure 7-11 shows the last fewentries under ip. Most of the values have scrolled off the window.
SNMP Tree provides a nice visual display, but it can be a little easier to movearound with the MIB Browser. Take your choice.
Figure 7-10. MIB Browser
Figure 7-11. Walk for IP

188 Chapter 7: Device Monitoring with SNMP
This is the Title of the Book, eMatter EditionCopyright © 2007 O’Reilly & Associates, Inc. All rights reserved.
Monitoring SNMP objects
In much the same way you monitor devices, you can monitor SNMP objects. First,you will need to identify the object you want to monitor. This can be done usingthe techniques just described. With MIB Browser you can select monitoring at aleaf. Alternately, you can select SNMP-Monitor ➝ Monitor Variable. This is a littleeasier if you already know the name of the object you want to monitor. A pop-upbox will request the name of the object to monitor. Type in the name of the objectand click on Start. (Don’t forget to select a system first.) A stripchart will be cre-ated on your map displaying the values for the monitored object.
Other commands
Tools ➝ SNMP Trouble installs the SNMP-Trouble menu. The name is somewhatmisleading. Generally, the SNMP-Trouble menu provides quick ways to collectcommon, useful information. First, it can be used to locate SNMP-aware devices onyour network. By selecting multiple devices on the map and then choosing SNMP-Trouble ➝ SNMP Devices, tkined will poll each of the devices. The output for thetest network is shown in Figure 7-12.
Please note that noResponse does not necessarily mean that the device is down orthat it doesn’t support SNMP. For example, it may simply mean that you are notusing the correct community string.
The SNMP-Trouble menu also provides menu options that will return some of themore commonly needed pieces of information such as system information, ARPtables, IP routing tables, interface information, or TCP connections. A few of thesereports are shown in Figure 7-13.
Caveats
tkined is a fine program, but it does have a couple of problems. As noted in thelast chapter, it will let you exit without saving changes. Another problem is that itdoesn’t recover well from one particular type of user error. When you are through
Figure 7-12. SNMP devices
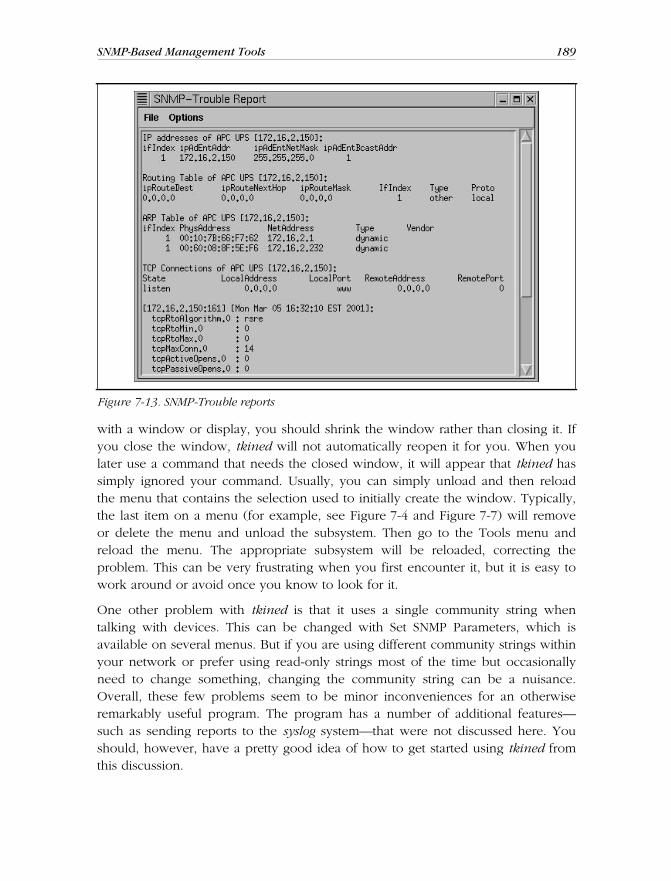
SNMP-Based Management Tools 189
This is the Title of the Book, eMatter EditionCopyright © 2007 O’Reilly & Associates, Inc. All rights reserved.
with a window or display, you should shrink the window rather than closing it. Ifyou close the window, tkined will not automatically reopen it for you. When youlater use a command that needs the closed window, it will appear that tkined hassimply ignored your command. Usually, you can simply unload and then reloadthe menu that contains the selection used to initially create the window. Typically,the last item on a menu (for example, see Figure 7-4 and Figure 7-7) will removeor delete the menu and unload the subsystem. Then go to the Tools menu andreload the menu. The appropriate subsystem will be reloaded, correcting theproblem. This can be very frustrating when you first encounter it, but it is easy towork around or avoid once you know to look for it.
One other problem with tkined is that it uses a single community string whentalking with devices. This can be changed with Set SNMP Parameters, which isavailable on several menus. But if you are using different community strings withinyour network or prefer using read-only strings most of the time but occasionallyneed to change something, changing the community string can be a nuisance.Overall, these few problems seem to be minor inconveniences for an otherwiseremarkably useful program. The program has a number of additional features—such as sending reports to the syslog system—that were not discussed here. Youshould, however, have a pretty good idea of how to get started using tkined fromthis discussion.
Figure 7-13. SNMP-Trouble reports

190 Chapter 7: Device Monitoring with SNMP
This is the Title of the Book, eMatter EditionCopyright © 2007 O’Reilly & Associates, Inc. All rights reserved.
Non-SNMP ApproachesOf course, SNMP is not the only way to retrieve information or monitor systems.For example, a number of devices now have small HTTP servers built in that allowremote configuration and management. These can be particularly helpful inretrieving information. With Unix, it is possible to remotely log on to a system usingtelnet or ssh over a network connection and reconfigure the host. There is prob-ably very little I can say about using these approaches that you don’t already knowor that isn’t obvious. There is one thing that you undoubtedly know, but that is alltoo easy to forget—don’t make any changes that will kill your connection.*
Some remote-access programs provide a greater degree of control than others. In aMicrosoft Windows environment, where traditionally there is only one user on asystem, a remote control program may take complete control of the remotesystem. On a multiuser system such as a Unix-based system, the same softwaremay simply create another session on the remote host. Although these programsare not specifically designed with network management in mind, they work wellas management tools.
While these approaches will allow you to actively retrieve information or recon-figure devices, the remote systems are basically passive entities. There are, how-ever, other monitoring tools that you could consider. Big Brother (bb) is onehighly regarded package. It is a web-based, multiplatform monitor. It is availablecommercially and, for some uses, noncommercially.
Microsoft WindowsSNMP is implemented as a Win32 service. It is available for the more recent ver-sions of Windows but must be installed from the distribution CD-ROM. Installa-tion and setup is very straightforward but varies from version to version.
Windows SNMP Setup
With NT, SNMP is installed from the Network applet under the Control Panel.Select Add under the Services tab, then select SNMP Services from the Select Net-work Service pop-up box. You will then be prompted for your distribution CD-ROM. Once it is installed, a pop-up box called Microsoft SNMP Properties willappear. You use the three tabs on this box to configure SNMP. The Agent tab isused to set the contact and location. The Traps tab is used to set the Community
* One precaution that some administrators use is connecting the console port of crucial devices to anotherdevice that should remain reachable—a port on a terminal server, a modem, or even a serial port on anearby server. If you take this “milking-machine” approach, be sure this portal is secure.

Microsoft Windows 191
This is the Title of the Book, eMatter EditionCopyright © 2007 O’Reilly & Associates, Inc. All rights reserved.
name and address of the management station that will receive the traps. Use theAdd button in the appropriate part of the box. The Security tab is used to set thecommunity strings, privileges, and addresses for the management stations. Be sureto select the radio button Accept SNMP Packets for These Hosts if you want tolimit access. If you experience problems running SNMP, try reinstalling the latestservice pack from Microsoft.
Installation with Windows 98 is similar, but at the Select Network Service prompt,you must click Have Disk. The SNMP agent can be found in the \Tools\Reskit\Netadmin\SNMP\ directory on the installation disk. SNMP is not included with theoriginal distribution of Windows 95 but can be installed from the Resource Kit ordownloaded from Microsoft. On later releases, it can be found on the distributiondisk in \Admin\Ntools\SNMP.
With Windows 2000, instead of using the Network applet, you will use the Add/Remove Programs applets. Select Add/Remove Windows Components. From theWindows Components Wizard, select Management and Monitoring Tools. Click onNext to install SNMP. To configure SNMP, start the Administrative Tools applet,and select Services and then SNMP Services. You’ll be given more choices, but youcan limit yourself to the same three tabs as with Windows NT.
For further details on installation and configuration of SNMP on Windows plat-forms, look first to the Windows help system. You might also look at James D.Murray’s Windows NT SNMP.
SNMP Tools
NET SNMP is available both in source and binary form for Windows. With thebinary version I downloaded, it was necessary to move all the subdirectories up toC:\usr to get things to work. Although the program still needs a little polish, itworks well enough. As noted in Chapter 6, tkined is also available under Windows.
One very nice freeware program for Windows, written by Philippe Simonet, isgetif. This provides both SNMP services as well as other basic network services. Itis intuitively organized as a window with a tab for each service.
To begin using getif, you must begin with the Parameters tab. You identify and setthe community strings for the remote host here. Having done this, clicking on Startwill retrieve the basic information contained in the system group. This is shown inFigure 7-14. Even if you know this information, it is a good idea to get it again justto make sure everything is working correctly.
Once this has been done, many of the other services simply require selecting theappropriate tab and clicking on Start. For example, you can retrieve the device’sinterface, address, routing, and ARP tables this way.

192 Chapter 7: Device Monitoring with SNMP
This is the Title of the Book, eMatter EditionCopyright © 2007 O’Reilly & Associates, Inc. All rights reserved.
The Reachability tab will allow you to send an ICMP ECHO_REQUEST and willalso test if several common TCP ports, such as HTTP, TELNET, SMTP, and so on,are open. The Traceroute tab does both a standard ICMP traceroute and an SNMPtraceroute. An SNMP traceroute constructs the route from the route tables alongthe path. Of course, all the intervening routers must be SNMP accessible using thecommunity strings set under the Parameters tab. The NSLookup tab does a nameservice lookup. The IP Discovery tab does simple IP scanning.
The MBrowser tab provides a graphical interface to NET SNMP. This is shown inFigure 7-15. In the large pane in the upper left, the MIB tree is displayed. You canexpand and collapse subtrees as needed. You can select a subtree by clicking onits root node. If you click on Walk, all readable objects in the subtree will be que-ried and displayed in the lower pane. You can also use this display to set objects.
The Graph tab will be discussed in Chapter 8.
Other Options
Apart from SNMP, there are a number of remote administration options includingseveral third-party commercial tools. If remote access is the only consideration,vnc is an excellent choice. In particular, the viewer requires no installation. It isunder 200KB so it can be run from a floppy disk. It provides a very nice way toaccess an X Window session on a Unix system from a PC even if you don’t wantto use it for management. Installation of the server binary is very straightforward.However, vnc will not provide multiuser access to Windows and can be sluggish
Figure 7-14. getif Parameters tab

Microsoft Windows 193
This is the Title of the Book, eMatter EditionCopyright © 2007 O’Reilly & Associates, Inc. All rights reserved.
over low-bandwidth connections such as dial-up lines. Under these circum-stances, you might consider Microsoft Terminal Server, Microsoft Corporation’s thinclient architecture, which supports remote access. (See Chapter 11 for more infor-mation on vnc.)
For other administrative tasks, there are a number of utilities that are sold as partof Microsoft’s Resource Kits. While not free, these are generally modestly priced,and many of the tools can be downloaded from the Web at no cost. Some tools,while not specifically designed for remote troubleshooting, can be used for thatpurpose if you are willing to allow appropriate file sharing. These include theSystem Policy Editor, Registry Editor, System Monitor, and Net Watcher, amongothers. These are all briefly described by the Windows help system and more thor-oughly in Microsoft published documentation.
Figure 7-15. getif MBrowser tab

194This is the Title of the Book, eMatter Edition
Copyright © 2007 O’Reilly & Associates, Inc. All rights reserved.
Chapter 8
8PerformanceMeasurement Tools
Everything on your network may be working, but using it can still be a frustratingexperience. Often, a poorly performing system is worse than a broken system. As auser on a broken system, you know when to give up and find something else to do.And as an administrator, it is usually much easier to identify a component that isn’tworking at all than one that is still working but performing poorly. In this chapter,we will look at tools and techniques used to evaluate network performance.
This chapter begins with a brief overview of the types of tools available. Then welook at ntop, an excellent tool for watching traffic on your local network. Next, Idescribe mrtg, rrd, and cricket—tools for collecting traffic data from remotedevices over time. RMON, monitoring extensions to SNMP, is next. We concludewith tools for use on Microsoft Windows systems.
Don’t overlook the obvious! Although we will look at tools for measuring traffic,user dissatisfaction is probably the best single indicator of the health of your net-work. If users are satisfied, you needn’t worry about theoretical problems. And ifusers are screaming at your door, then it doesn’t matter what the numbers prove.
What, When, and WhereNetwork performance will depend on many things—on the applications you areusing and how they are configured, on the hosts running these applications, onthe networking devices, on the structure and design of the network as a whole,and on how these pieces interact with one another. Even though the focus of thischapter is restricted to network performance, you shouldn’t ignore the other piecesof the puzzle. Problems may arise from the interaction of these pieces, or aproblem with one of the pieces may look like a problem with another piece. Amisconfigured or poorly designed application can significantly increase the amount
What, When, and Where 195
This is the Title of the Book, eMatter EditionCopyright © 2007 O’Reilly & Associates, Inc. All rights reserved.
of traffic on a network. For example, Version 1.1 of the HTTP protocol providesfor persistent connections that can significantly reduce traffic. Not using this partic-ular feature is unlikely to be a make or break issue. My point is, if you look onlyat the traffic on a network without considering software configurations, you mayseem to have a hardware capacity problem when a simple change in softwaremight lessen the problem and, at a minimum, buy you a little more time.
This chapter will focus on tools used to collect information on network perfor-mance. The first step in analyzing performance is measuring traffic. In addition toproblem identification and resolution, this should be done as part of capacity plan-ning and capacity management (tuning). Several books listed in Appendix B pro-vide general discussions of application and host performance analysis.
Of the issues related to measuring network traffic, the most important ones arewhat to measure, how often, and where. Although there are no simple answers toany of these questions, what to measure is probably the hardest of the three. It isextremely easy to end up with so much data that you don’t have time to analyzeit. Or you may collect data that doesn’t match your needs or that is in an unus-able format. If you keep at it, eventually you will learn from experience what ismost useful. Take the time to think about how you will use the data before youbegin. Be as goal directed as possible. Just realize that, even with the most carefulplanning, when faced with a new, unusual problem, you’ll probably think ofsomething you wish you had been measuring.
If you are looking at the performance of your system over time, then data at justone point in time will be of little value. You will need to collect data periodically.How often you collect will depend on the granularity or frequency of the eventsyou want to watch. For many tasks, the ideal approach is one that periodicallycondenses and eventually discards older data.
Unless your network is really unusual, the level of usage will vary with the time ofday, the day of the week, and the time of the year. Most performance relatedproblems will be most severe at the busiest times. In telephony, the hour whentraffic is heaviest is known as the busy hour, and planning centers around traffic atthis time. In a data network, for example, the busy hour may be first thing in themorning when everyone is logging on and checking their email, or it could be atnoon when everyone is web surfing over their lunch hour.
Knowing usage patterns can simplify data collection since you’ll need to do littlecollecting when the network is underutilized. Changes in usage patterns can indi-cate fundamental changes in your network that you’ll want to be able to identifyand explain. Finally, knowing when your network is least busy should give you anidea of the most convenient times to do maintenance.

196 Chapter 8: Performance Measurement Tools
This is the Title of the Book, eMatter EditionCopyright © 2007 O’Reilly & Associates, Inc. All rights reserved.
I have divided traffic-measurement tools into three rough categories based onwhere they are used within a network. Tools that allow you to capture trafficcoming into or going out of a particular machine are called host-monitoring tools.Tools that place an interface in promiscuous mode and allow you to capture allthe traffic at an interface are called point-monitoring tools. Finally, tools that builda global picture of network traffic by querying other hosts (which are in turn run-ning either host-monitoring or point-monitoring tools) are called network-monitoring tools. Both host monitoring and point monitoring should have a min-imal impact on network traffic. With the exception of DNS traffic, they shouldn’tbe generating additional traffic. This is not true for network-monitoring tools.
Because of their roles within a network, devices such as switches and routers don’teasily fit into this classification scheme. If a single switch interconnects all devicesin a subnet, then it will see all the local traffic. If, however, multiple switches areused and you aren’t mirroring traffic, each switch will see only part of the traffic.Routers will see only traffic moving between networks. While this is ideal for mea-suring traffic between local and remote devices, it is not helpful in understandingstrictly local traffic. The problem should be obvious. If you monitor the wrongdevice, you may easily miss bottlenecks or other problems. Before collecting data,you need to understand the structure of your network so you can understand whattraffic is actually being seen. This is one reason the information in Chapter 6, isimportant.
Finally, you certainly won’t want to deal with raw data on a routine basis. You willwant tools that present the data in a useful manner. For time-series data, graphsand summary statistics are usually the best choice.
Host-Monitoring ToolsWe have already discussed host-monitoring tools in several different parts of thisbook, particularly Chapter 2 and Chapter 4. An obvious example of a host-monitoring tool is netstat. You will recall that the -i option will give a cumulativepicture of the traffic into and out of a computer.
Although easy to overlook, any tool that logs traffic is a host-monitoring tool ofsorts. These are generally not too useful after the fact, but you may be able topiece together some information from them. A better approach is to configure thesoftware to collect what you need. Don’t forget applications, like web servers, thatcollect data. Accounting tools and security tools provide other possibilities. Toolslike ipfw, ipchains, and tcpwrappers all support logging. (Log files are discussed ingreater detail in Chapter 11.)

Point-Monitoring Tools 197
This is the Title of the Book, eMatter EditionCopyright © 2007 O’Reilly & Associates, Inc. All rights reserved.
Host-monitoring tools can be essential in diagnosing problems related to host per-formance, but they give very little information about the performance of the net-work as a whole. Of course, if you have this information for every host, you’llhave the data you need to construct a complete picture. Constructing that pictureis another story.
Point-Monitoring ToolsA point-monitoring tool puts your network interface in promiscuous mode andallows you to collect information on all traffic seen at the computer’s interface.The major limitation to point monitoring is it gives you only a local view of yournetwork. If your focus is on host performance, this is probably all that you willneed. Or, if you are on a shared media network such as a hub, you will see all ofthe local traffic. But, if you are on a switched network, you will normally be ableto see only traffic to or from the host or broadcast traffic. And as more and morenetworks shift to switches for efficiency, this problem will worsen.
The quintessential point-monitoring tools are network sniffers. In Chapter 5, wesaw several utilities that capture traffic and generate traffic summaries. Theseincluded tcp-reduce, tcptrace, and xplot. In general, sniffers are not really designedfor traffic measurement—they are too difficult to use for this purpose, provide toomuch information, and provide information in a format ill-suited to this purpose.But if you really want to understand a problem, packet capture gives you the mostcomplete picture, if you can wade through all the data.
ntop
ntop, the work of Luca Deri, is an excellent example of just how useful a point-monitoring tool can be. ntop is usually described as the network equivalent of theUnix utility top. Actually, it is a lot more.
ntop is based on the libpcap library that originated at the Lawrence BerkeleyNational Laboratory and on which tcpdump is based. It puts the network interfacein promiscuous mode so that all traffic at the interface is captured. It will thenbegin to collect data, periodically creating summary statistics. (It will also use lsofand other plug-ins to collect data if available.)
ntop can be run in two modes: as a web-based utility using a built-in web serveror in interactive mode, i.e., as a text-based application on a host. It closely resem-bles top when run in interactive mode. This was the default mode with earlier ver-sions of ntop but is now provided by a separate command, intop. Normally, youwill want to use a separate window when using interactive mode.

198 Chapter 8: Performance Measurement Tools
This is the Title of the Book, eMatter EditionCopyright © 2007 O’Reilly & Associates, Inc. All rights reserved.
Interactive mode
Here is an example of the output with intop :
$<50> intop 0.0.1 (Sep 19 2000) listening on [eth0]379 Pkts/56.2 Kb [IP 50.5 Kb/Other 5.7 Kb] Thpt: 6.1 Kbps/24.9 Kbps Host Act -Rcv-Rcvd- Sent TC-TCP- UDP IC$ sloan B 69.0% 16.7% 38.8 Kb 0 0 lnx1a B 16.7% 69.4% 9.4 Kb 0 0 rip2-routers.mcast.net R 3.7% 0.0% 0 2.1 Kb 0 172.16.3.1 B 2.1% 6.5% 0 0 0 Cisco CDPD/VTP [MAC] I 4.7% 0.0% 0 0 0 172.16.3.3 B 2.2% 6.1% 0 0 0
Interpretation of the data is straightforward. The top two lines show the programname and version, date, interface, number of packets, total traffic, and throughput.The first column lists hosts by name or IP number. The second column reflectsactivity since the last update—Idle, Send, Receive, or Both. The next two columnsare the amount of traffic sent and received, while the last two columns breaktraffic down as TCP, UPD, or ICMP traffic.
intop should be started with the -i option to specify which interface to use. Forexample:
lnx1# intop -i eth0
If your computer is multihomed, you can specify several interfaces on the com-mand line, each with a separate -i. Once started, it prints an annoying 20 lines orso of general information about the program and then gives you a prompt. At thispoint, you can enter ? to find out what services are available:
intop@eth0> ?Commands enclosed in '<>' are not yet implemented.Commands may be abbreviated. Commands are:
? <warranty> filter swap nbt help <copying> sniff top <dump> exit history uptime lsdev <last> quit open <hash> hosts <nslookup> prompt <close> info arpintop@eth0>
As you can see, a number of commands are planned but had not been imple-mented at the time this was written. Most are exactly what you would expect. Youuse the top command to get a display like the one just shown. The info commandreports the interface and number of packets captured. With the filter command,you can set packet-capture filters. You use the same syntax as explained inChapter 5 with tcpdump. (Filters can also be specified on the command line whenintop is started.) The lsdev command lists interfaces. The swap command is used tojump between data collection on two different interfaces.

Point-Monitoring Tools 199
This is the Title of the Book, eMatter EditionCopyright © 2007 O’Reilly & Associates, Inc. All rights reserved.
You can change how the data is displayed on-the-fly using your keyboard. Forexample, the d key will allow you to toggle between showing all hosts or onlyactive hosts. The l key toggles between showing or not showing only local hosts.The p key can be used to show or suppress showing data as percentages. The ykey is used to change the sorting order among the columns. The n key is used totoggle between hostnames and IP addresses. The r key can be used to reset orzero statistics. The q key is used to stop the program.
Web mode
Actually, you’ll probably prefer web mode to interactive mode, as it provides con-siderably more information and a simpler interface. Since ntop uses a built-in webserver, you won’t need to have a separate web server running on your system. Bydefault, ntop uses port 3000, so this shouldn’t interfere with any existing webservers. If it does, or if you are paranoid about using default ports, you can usethe -w option to select a different port. The only downside is that the built-in webserver uses frames and displays data as tables, which still seems to confuse somebrowsers, particularly when printing.
There are a number of options, some of which are discussed next, but the defaultswork well enough to get you started. Once you start ntop, point your browser tothe machine and port it runs on. Figure 8-1 shows what the initial screen lookslike.
As you can see, on startup ntop provides you with a brief description of the pro-gram in the larger frame to the right. The real area of interest is the menu on theleft. By clicking on the triangles, each menu expands to give you a number ofchoices. This is shown to the left in Figure 8-2.
Figure 8-2 shows the All Protocols page, which groups traffic by protocol andhost. This is available for both received and transmitted data. A number of statis-tics for other protocols—such as AppleTalk, OSPF, NetBIOS, and IGMP—havescrolled off the right of this window. You can click on the column header to sortthe data based on that column. By default, this screen will be updated every twominutes, but this can be changed.
The IP option displays received or transmitted data grouped by individual IP pro-tocols such as FTP, HTTP, DNS, and Telnet. The Throughput option gives a tableorganized by host and by throughput, average throughput, and peak throughputfor both bits and packets.

200 Chapter 8: Performance Measurement Tools
This is the Title of the Book, eMatter EditionCopyright © 2007 O’Reilly & Associates, Inc. All rights reserved.
The Stats submenu offers a number of options. Multicast gives a table of multicasttraffic. Traffic provides you with a number of tables and graphs showing howtraffic breaks down. Figure 8-3 shows one of these graphs.
Figures and tables break down traffic by broadcast versus unicast versus multicastpackets, by packet size categories, by IP versus non-IP traffic, by protocol cate-gory such as TCP versus UDP versus AppleTalk versus Other, and by applicationprotocols such as FTP versus Telnet. Either bar graphs or pie charts are used todisplay the data. The tables give the data in both kilobytes and percentages. Thesegraphs can save you a lot of work in analyzing data and discovering how yournetwork is being used.
Figure 8-1. ntop’s home page

Point-Monitoring Tools 201
This is the Title of the Book, eMatter EditionCopyright © 2007 O’Reilly & Associates, Inc. All rights reserved.
The Host option under Stats gives basic host information including hostnames, IPaddresses, MAC addresses for local hosts, transmit bandwidth, and vendors forMAC addresses when known. By clicking on a hostname, additional data will bedisplayed as shown in Figure 8-4.
The host shown here is on a different subnet from the host running ntop, so lessinformation is available. For example, there is no way for ntop to discover theremote host’s MAC address or to track traffic to or from the remote host thatdoesn’t cross the local network. Since this displays connections between hosts, itsuse has obvious privacy implications.
Figure 8-2. ntop’s All Protocols page

202 Chapter 8: Performance Measurement Tools
This is the Title of the Book, eMatter EditionCopyright © 2007 O’Reilly & Associates, Inc. All rights reserved.
The Throughput option gives a graph of the average throughput over the lasthour. Domain gives a table of traffic grouped by domain. Plug-ins provide a wayto extend the functionality of ntop by adding other applications. Existing plug-insprovide support for such activities as tracking new ARP entries, NFS traffic, andWAP traffic and tracking and classifying ICMP traffic.
An important issue in capacity planning is what percentage of traffic is purely localand what percentage has a remote network for its source or destination (see thesidebar “Local Versus Remote Traffic”). The IP Traffic menu gives you options tocollect this type of information. The Distribution option on the IP Protocols menugives you plots and tables for local and remote IP traffic. For example, Figure 8-5
Figure 8-3. ntop’s Traffic page under Stats

Point-Monitoring Tools 203
This is the Title of the Book, eMatter EditionCopyright © 2007 O’Reilly & Associates, Inc. All rights reserved.
shows a graph and tables for local and remote-to-local traffic. There is a local-to-remote table that is not shown. The Usage option shows IP subnet usage by port.Sessions shows active TCP sessions, and Routers identifies routers on the localsubnet.
The last menu, Admin, is used to control the operation of ntop. Switch NIC allowsyou to capture on a different interface, and Reset Stats zeros all cumulative statistics.Shutdown shuts down ntop. Users and URLs allow you to control access to ntop.
A number of command-line options allow you to control how ntop runs. These canbe listed with the -h option. As noted previously, -w is used to change the port it lis-tens to, and -i allows you to specify which interface to listen to. -r sets the delay
Figure 8-4. Host information

204 Chapter 8: Performance Measurement Tools
This is the Title of the Book, eMatter EditionCopyright © 2007 O’Reilly & Associates, Inc. All rights reserved.
between screen updates in seconds. The -n option is used to specify numeric IPaddresses rather than hostnames. Consult the documentation for other options.
ntop has other features not discussed here. It can be used as a lightweight intru-sion detection system. It provides basic access control and can be used withsecure HTTP. It also provides facilities to log data, including logging to a SQLdatabase.
As previously noted, the real problem with point monitoring is that it doesn’t reallywork well with segmented or switched networks. Unless you are mirroring alltraffic to your test host, many of these numbers can be meaningless. If this is thecase, you’ll want to collect information from a number of sources.
Figure 8-5. Measuring local and remote traffic

Network-Monitoring Tools 205
This is the Title of the Book, eMatter EditionCopyright © 2007 O’Reilly & Associates, Inc. All rights reserved.
Network-Monitoring ToolsIt should come as no surprise that SNMP can be used to collect performance infor-mation. We have already seen simple examples in Chapter 7. Using the raw statis-tics gathered with a tool like NET SNMP or even the stripcharts in tkined is alrightif you need only a little data, but in practice you will want tools designed to dealspecifically with performance data. Which tool you use will depend on what youwant to do. One of your best choices from this family of tools is mrtg. (Although itis not discussed here, you also may want to look at scion. This is from Merit Net-works, Inc., and will run under Windows as well as Unix.)
mrtg
mrtg (Multirouter Traffic Grapher) was originally developed by Tobias Oetikerwith the support of numerous people, most notably Dave Rand. This tool usesSNMP to collect statistics from network equipment and creates web-accessiblegraphs of the statistics. It is designed to be run periodically to provide a picture oftraffic over time. mrtg is ideally suited for identifying busy-hour traffic. All youneed to do is scan the graph looking for the largest peaks.
Local Versus Remote TrafficBefore the Internet became popular, most network traffic stayed on the localnetwork. This was often summarized as the 90-10 Rule (or sometimes the 80-20 Rule), a heuristic that says that roughly 90% of network traffic will stay onthe local network. The Internet has turned the old 90-10 Rule on its head byproviding a world of reasons to leave the local network; now most traffic doesjust that. Today the 90-10 Rule says that 90% of traffic on the local network willhave a remote site as its source or destination.
Clearly, the 90-10 Rule is nothing more than a very general rule of thumb. Itmay be an entirely inappropriate generalization for your network. But knowingthe percentage of local and remote traffic can be useful in understanding yournetwork in a couple of ways. First, whatever the numbers, they really shouldn’tbe changing a lot over time unless something fundamental is changing in theway your network is being used. This is something you’ll want to know about.
Second, local versus remote traffic provides a quick sanity check for networkdesign. If 90% of your traffic is entering or leaving your network over a 1.544-Mbps T1 line, you should probably think very carefully about why you needto upgrade your backbone to gigabit speeds.
206 Chapter 8: Performance Measurement Tools
This is the Title of the Book, eMatter EditionCopyright © 2007 O’Reilly & Associates, Inc. All rights reserved.
mrtg is most commonly used to graph traffic through router interfaces but can beconfigured for other uses. For example, since NET SNMP can be used to collectdisk usage data, mrtg could be used to retrieve and graph the amount of freespace on the disk drive over time for a system running snmpd. Because the graphsare web-accessible, mrtg is well suited for remote measurement. mrtg uses SNMP’sGET command to collect information. With the current implementation, collectionis done by a Perl module supplied as part of mrtg. No separate installation ofSNMP is needed.
mrtg is designed to be run regularly by cron, typically every five minutes. How-ever, mrtg can be run as a standalone program, or the sampling interval can bechanged. Configuration files, generally created with the cfgmaker utility, deter-mine the general appearance of the web pages and what data is collected. mrtggenerates graphs of traffic in GIF format and HTML pages to display these graphs.Typically, these will be made available by a web server running on the same com-puter as mrtg, but the files can be viewed with a web browser running on thesame computer or the files can be moved to another computer for viewing. Thiscould be helpful when debugging mrtg since the web server may considerablycomplicate the installation, particularly if you are not currently running a webserver or are not comfortable with web server configuration.
Figure 8-6 shows a typical web page generated by mrtg. In this example, you cansee some basic information about the router at the top of the page and, below it,two graphs. One shows traffic for the last 24 hours and the other shows traffic forthe last two weeks, along with summary statistics for each. The monthly andyearly graphs have scrolled off the page. This is the output for a single interface.Input traffic is shown in green and output traffic is shown in blue, by default, oncolor displays.
It is possible to have mrtg generate a summary web page with a graph for eachinterface. Each graph is linked to the more complete traffic report such as the oneshown in Figure 8-6. The indexmaker utility is used to generate this page once theconfiguration file has been created.
mrtg configuration file
To use mrtg, you will need a separate configuration file for each device. Each con-figuration file will describe all the interfaces within the device. Creating these filesis the first step after installation. While a sample configuration file is supplied aspart of the documentation, it is much easier to use the cfgmaker script. An SNMPcommunity string and hostname or IP number must be supplied as parts to a com-pound argument:
bsd2# cfgmaker [email protected] > mrtg.cfg

Network-Monitoring Tools 207
This is the Title of the Book, eMatter EditionCopyright © 2007 O’Reilly & Associates, Inc. All rights reserved.
Since the script writes the configuration to standard output, you’ll need to redirectyour output to a file. If you want to measure traffic at multiple devices, then yousimply need to create a different configuration file for each. Just give each a dif-ferent (but meaningful) name.
Once you have a basic configuration file, you can further edit it as you see fit. Asdescribed next, this can be an involved process. Fortunately, cfgmaker does a rea-sonable job. In many cases, this will provide all you need, so further editing won’tbe necessary.
Here is the first part of a fairly typical configuration file. (You may want to com-pare this to the sample output shown in Figure 8-6.)
Figure 8-6. mrtg interface report

208 Chapter 8: Performance Measurement Tools
This is the Title of the Book, eMatter EditionCopyright © 2007 O’Reilly & Associates, Inc. All rights reserved.
# Add a WorkDir: /some/path line to this fileWorkDir: /usr/local/share/doc/apache/mrtg
####################################################################### Description: Cisco Internetwork Operating System Software IOS (tm) 3600 Software (C3620-IO3-M), Version 12.0(7)T, RELEASE SOFTWARE (fc2) Copyright (c)1986-1999 by cisco Systems, Inc. Compiled Wed 08-Dec-99 10:08 by phanguye# Contact: "Joe Sloan"# System Name: NLRouter# Location: "LL 214"#.....................................................................
Target[C3600]: 1:[email protected][C3600]: 1250000Title[C3600]: NLRouter (C3600): Ethernet0/0PageTop[C3600]: <H1>Traffic Analysis for Ethernet0/0 </H1> <TABLE> <TR><TD>System:</TD><TD>NLRouter in "LL 214"</TD></TR> <TR><TD>Maintainer:</TD><TD>"Joe Sloan"</TD></TR> <TR><TD>Interface:</TD><TD>Ethernet0/0 (1)</TD></TR> <TR><TD>IP:</TD><TD>C3600 (205.153.60.250)</TD></TR> <TR><TD>Max Speed:</TD> <TD>1250.0 kBytes/s (ethernetCsmacd)</TD></TR> </TABLE>
#---------------------------------------------------------------
Target[172.16.2.1.2]: 2:[email protected][172.16.2.1.2]: 1250000Title[172.16.2.1.2]: NLRouter (No hostname defined for IP address): Ethernet0/1PageTop[172.16.2.1.2]: <H1>Traffic Analysis for Ethernet0/1 </H1> <TABLE> <TR><TD>System:</TD><TD>NLRouter in "LL 214"</TD></TR> <TR><TD>Maintainer:</TD><TD>"Joe Sloan"</TD></TR> <TR><TD>Interface:</TD><TD>Ethernet0/1 (2)</TD></TR> <TR><TD>IP:</TD><TD>No hostname defined for IP address (172.16.1.1)</TD></TR> <TR><TD>Max Speed:</TD> <TD>1250.0 kBytes/s (ethernetCsmacd)</TD></TR> </TABLE>
#---------------------------------------------------------------
As you can see from the example, the general format of a directive isKeyword[Label]: Arguments. Directives always start in the first column of theconfiguration file. Their arguments may extend over multiple lines, provided theadditional lines leave the first column blank. In the example, the argument to thefirst PageTop directive extends for 10 lines.
In this example, I’ve added the second line—specifying a directory where theworking files will be stored. This is a mandatory change. It should be set to a

Network-Monitoring Tools 209
This is the Title of the Book, eMatter EditionCopyright © 2007 O’Reilly & Associates, Inc. All rights reserved.
directory that is accessible to the web server on the computer. It will contain logfiles, home pages, and graphs for the most recent day, week, month, and year foreach interface. The interface label, explained shortly, is the first part of a filename.Filename extensions identify the function of each file.
Everything else, including the files just described, is automatically generated. Asyou can see, cfgmaker uses SNMP to collect some basic information from thedevice, e.g., sysName, sysLocation, and sysContact, for inclusion in the configura-tion file. This information has been used both in the initial comment (lines begin-ning with #) and in the HTML code under the PageTop directive. As you mightguess, PageTop determines what is displayed at the top of the page in Figure 8-6.
cfgmaker also determines the type of interface by retrieving ifType and its max-imum operating speed by retrieving ifSpeed, ethernetCsmacd and 125.0kBytes/s in this example. The interface type is used by the PageTop directive.The speed is used by both PageTop and the MaxBytes directive. The MaxBytesdirective determines the maximum value that a measured variable is allowed toreach. If a larger number is retrieved, it is ignored. This is given in bytes persecond, so if you think in bits per second, don’t be misled.
cfgmaker collects information on each interface and creates a section in the config-uration file for each. Only two interfaces are shown in this fragment, but theomitted sections are quite similar. Each section will begin with the Target direc-tive. In this example, the first interface is identified with the directiveTarget[C3600]: 1:[email protected]. The interface was identified by the ini-tial scan by cfgmaker. The label was obtained by doing name resolution on the IPaddress. In this case, it came from an entry in /etc/hosts.* If name resolution fails,the IP and port numbers will be used as a label. The argument to Target is a com-bination of the port number, SNMP community string, and IP address of the inter-face. You should be aware that adding or removing an interface in a monitoreddevice without updating the configuration file can lead to bogus results.
The only other directive in this example is Title, which determines the title dis-played for the HTML page. These examples are quite adequate for a simple page,but mrtg provides both additional directives and additional arguments that pro-vide a great deal of flexibility.
By default, mrtg collects the SNMP objects ifInOctets and ifOutOctets for eachinterface. This can be changed with the Target command. Here is an example of asmall test file (the recommended way to test mrtg) that is used to collect thenumber of unicast and nonunicast packets at an interface.
* In this example, a different system name and hostname are used to show where each is used. This isnot recommended.

210 Chapter 8: Performance Measurement Tools
This is the Title of the Book, eMatter EditionCopyright © 2007 O’Reilly & Associates, Inc. All rights reserved.
bsd2# cat test.cfgWorkDir: /usr/local/share/doc/apache/mrtg
Target[Testing]: ifInUcastPkts.1&ifInNUcastPkts.1:[email protected][Testing]: 1250000Title[Testing]: NLRouter: Ethernet0/0PageTop[Testing]: <H1>Traffic Analysis for Ethernet0/0 </H1> <TABLE> <TR><TD>System:</TD><TD>NLRouter in "LL 214"</TD></TR> <TR><TD>Maintainer:</TD><TD>"Joe Sloan"</TD></TR> <TR><TD>Interface:</TD><TD>Ethernet0/0 (1)</TD></TR> <TR><TD>IP:</TD><TD>C3600 (205.153.60.250)</TD></TR> <TR><TD>Max Speed:</TD> <TD>1250.0 kBytes/s (ethernetCsmacd)</TD></TR> </TABLE>
mrtg knows a limited number of OIDs. These are described in the mibhelp.txt filethat comes with mrtg. Fortunately, you can use dotted notation as well, so youaren’t limited to objects with known identifiers. Nor do you have to worry aboutMIBs. You can also use an expression in the place of an identifier, e.g., the sum oftwo OIDs, or you can specify an external program if you wish to collect data notavailable through SNMP. There are a number of additional formats and optionsavailable with Target.
Other keywords are available that will allow you to customize mrtg’s behavior. Forexample, you can use the Interval directive to change the reported frequency ofsampling. You’ll also need to change your crontab file to match. If you don’t wantto use cron, you can use the RunAsDaemon directive, in conjunction with theInterval directive to set mrtg up to run as a standalone program. Interval takes anargument in minutes; for example, Interval: 10 would sample every 10 minutes.To enable mrtg to run as a stand-alone program, the syntax is RunAsDaemon: yes.
Several directives are useful for controlling the appearance of your graphs. If youdon’t want all four graphs, you can suppress the display of selected graphs withthe Suppress directive. For example, Suppress[Testing]: my will suppress themonthly and yearly graphs. Use d and w for daily and weekly graphs. You mayuse whatever combination you want.
One annoyance with mrtg is that it scales each graph to the largest value that hasto be plotted. mrtg shouldn’t be faulted for this; it is simply using what informa-tion it has. But the result can be graphs with some very unusual vertical scales andsets of graphs that you can’t easily compare. This is something you’ll definitelywant to adjust.
You can work around this problem with several of the directives mrtg provides, butthe approach you choose will depend, at least in part, on the behavior of the datayou are collecting. The Unscaled directive suppresses automatic scaling of data. It

Network-Monitoring Tools 211
This is the Title of the Book, eMatter EditionCopyright © 2007 O’Reilly & Associates, Inc. All rights reserved.
uses the value from MaxBytes as maximum on the vertical scale. You can editMaxBytes if you are willing to have data go off the top of the graph. If you changethis, you should use AbsMax to set the largest value that you expect to see.
Other commands allow you to change the color, size, shape, and background ofyour graphs. You can also change the directions that graphs grow. Here is anexample that changes the display of data to bits per second, has the display growfrom left to right, displays only the daily and weekly graphs, and sets the verticalscale to 4000 bits per second:
Options[Testing]: growright,bitsSuppress[Testing]: myMaxBytes[Testing]: 500AbsMax[Testing]: 1250000Unscaled[Testing]: dw
Notice that you still need to give MaxBytes and AbsMax in bytes.
Many more keywords are available. Only the most common have been describedhere, but these should be more than enough to meet your initial needs. See themrtg sample configuration file and documentation for others.
Once you have the configuration file, use indexmaker to create a main page for allthe interfaces on a device. In its simplest form, you merely give the configurationfile and the destination file:
bsd2# indexmaker mrtg.cfg > /usr/local/www/data/mrtg/index.html
You may specify a router name and a regular expression that will match a subsetof the interfaces if you want to limit what you are looking at. For example, if youhave a switch with a large number of ports, you may want to monitor only theuplink ports.
You’ll probably want to run mrtg manually a couple of times. Here is an exampleusing the configuration file test.cfg:
bsd2# mrtg test.cfgRateup WARNING: .//rateup could not read the primary log file for testingRateup WARNING: .//rateup The backup log file for testing was invalid as wellRateup WARNING: .//rateup Can't remove testing.old updating log fileRateup WARNING: .//rateup Can't rename testing.log to testing.old updating log file
The first couple of runs will generate warning messages about missing log files andthe like. These should go away after a couple of runs and can be safely ignored.
Finally, you’ll want to make an appropriate entry in your contab file. For example,this entry will run mrtg every five minutes on a FreeBSD system:
0,5,10,15,20,25,30,35,40,45,50,55 * * * * /usr/ports/net/mrtg/work/mrtg-2.8.12/run/mrtg /usr/ports/net/mrtg/work/mrtg-2.8.12/run/mrtg.cfg > /dev/null 2>&1

212 Chapter 8: Performance Measurement Tools
This is the Title of the Book, eMatter EditionCopyright © 2007 O’Reilly & Associates, Inc. All rights reserved.
This should be all on a single line. The syntax is different on some systems, suchas Linux, so be sure to check your local manpages.
rrd and the Future of mrtg
The original version of mrtg had two deficiencies, a lack of both scalability andportability. Originally, mrtg was able to support only about 20 routers or switches.It used external utilities to perform SNMP queries and create GIF images—snmpgetfrom CMU SNMP and pnmtogif from the PBM package, respectively.
These issues were addressed by MRTG-2, the second and current version of mrtg.Performance was improved when Dave Rand contributed rateup to the project.Written in C, rateup improved both graph generation and handling of the log files.
The portability problem was addressed by two changes. First, Simon Leinen’s Perlscript for collecting SNMP is now used, eliminating the need for CMU SNMP.Second, Thomas Boutell’s GD library is now used to directly generate graphics. Atthis point, mrtg is said to reasonably support querying 500 ports on a regularbasis.
As an ongoing project, the next goal is to further improve performance and flexi-bility. Toward this goal, Tobias Oetiker has written rrd (Round Robin Database), aprogram to further optimize the database and the graphing portion of mrtg.Although MRTG-3, the next version of mrtg, is not complete, rrd has been com-pleted and is available as a standalone program. MRTG-3 will be built on top of rrd.
rrd is designed to store and display time-series data. It is written in C and is avail-able under the GNU General Public License. rrd stores data in a round-robinfashion so that older data is condensed and eventually discarded. Consequently,the size of the database stabilizes and will not continue to grow over time.
cricket
A number of frontends are available for rrd, including Jeff Allen’s cricket. Allen,working at WebTV, was using mrtg but found that it really wasn’t adequate to sup-port the 9000 targets he needed to manage. Rather than wait for MRTG-3, hedeveloped cricket. At least superficially, cricket has basically the same uses asmrtg. But cricket has been designed to be much more scalable. cricket is orga-nized around the concept of a configuration tree. The configuration files fordevices are organized in a hierarchical manner so the general device propertiescan be defined once at a higher level and inherited, while exceptions can besimply defined at a lower level of the hierarchy. This makes cricket much moremanageable for larger organizations with large numbers of devices. Since it isdesigned around rrd, cricket is also much more efficient.

Network-Monitoring Tools 213
This is the Title of the Book, eMatter EditionCopyright © 2007 O’Reilly & Associates, Inc. All rights reserved.
cricket does a very nice job of organizing the pages that it displays. To access thepages, you will begin by executing the grapher.cgi script on the server. Forexample, if the server were at 172.16.2.236 and CGI scripts were in the cgi-bindirectory, you would point your browser to the URL http://172.16.2.236/cgi-bin/grapher.cgi. This will present you with a page organized around types of devices,e.g., routers, router interfaces, switches, along with descriptions of each. From thisyou will select the type of device you want to monitor. Depending on yourchoice, you may be presented with a list of monitored devices items or withanother subhierarchy such as that shown in Figure 8-7.
Figure 8-7. cricket router interfaces

214 Chapter 8: Performance Measurement Tools
This is the Title of the Book, eMatter EditionCopyright © 2007 O’Reilly & Associates, Inc. All rights reserved.
You can quickly drill down to the traffic graph for the device of interest.Figure 8-8 shows an example of a traffic graph for a router interface on a routerduring a period of very low usage (but you get the idea, I hope).
As you can see, this looks an awful lot like the graphs from mrtg. Unlike withmrtg, you have some control over which graphs are displayed from the web page.Short-Term displays both hourly and daily graphs, Long-Term displays both
Figure 8-8. Traffic on a single interface

Network-Monitoring Tools 215
This is the Title of the Book, eMatter EditionCopyright © 2007 O’Reilly & Associates, Inc. All rights reserved.
weekly and monthly graphs, and Hourly, Daily, and All are just what you wouldexpect.*
Of course, you will need to configure each option for mrtg to work correctly. Youwill need to go through the hierarchy and identify the appropriate targets, setSNMP community strings, and add any descriptions that you want. Here is theinterfaces file in the router-interfaces subdirectory of the cricket-config directory,the directory that contains the configuration tree. (This file corresponds to theoutput shown in Figure 8-8.)
target --default-- router = NLCisco snmp-community=public
target Ethernet0_0 interface-name = Ethernet0/0 short-desc = "Gateway to Internet"
target Ethernet0_1 interface-name = Ethernet0/1 short-desc = "172.16.1.0/24 subnet"
target Ethernet0_2 interface-name = Ethernet0/2 short-desc = "172.16.2.0/24 subnet"
target Ethernet0_3 interface-name = Ethernet0/3 short-desc = "172.16.3.0/24 subnet"
target Null0 interface-name = Null0 short-desc = ""
While this may look simpler than an mrtg configuration file, you’ll be dealing witha large number of these files. If you make a change to the configuration tree, youwill need to recompile the configuration tree before you run cricket. As with mrtg,you will need to edit your crontab file to execute the collector script on a regularbasis.
On the whole, cricket is considerably more difficult to learn and to configure thanmrtg. One way that cricket gains efficiency is by using CGI scripts to generate webpages only when they are needed rather than after each update. The result is thatthe pages are not available unless you have a web server running on the samecomputer that cricket is running on. Probably the most difficult part of the cricketinstallation is setting up your web server and the cricket directory structure so that
* mrtg uses Daily to mean an hour-by-hour plot for 24 hours. cricket uses Hourly to mean the same thing.This shouldn’t cause any problems.

216 Chapter 8: Performance Measurement Tools
This is the Title of the Book, eMatter EditionCopyright © 2007 O’Reilly & Associates, Inc. All rights reserved.
the scripts can be executed by the web server without introducing any securityholes. Setting up a web server and web security are beyond the scope of thisbook.
Unless you have such a large installation that mrtg doesn’t meet your needs, myadvice would be to start with mrtg. It’s nice to know that cricket is out there. Andif you really need it, it is a solid package worth learning. But mrtg is easier to getstarted with and will meet most people’s needs.
RMONAs we saw in the last chapter, SNMP can be used to collect network traffic at aninterface. Unfortunately, SNMP is not a very efficient mechanism in some circum-stances. Frequent collection of data over an overused, low-bandwidth WAN linkcan create the very problems you are using SNMP to avoid. Even after you havethe data, a significant amount of processing may still be needed before the data isin a useful form.
A better approach is to do some of the processing and data reduction remotelyand retrieve data selectively. This is one of the ideas behind the remote moni-toring (RMON) extensions to SNMP. RMON is basically a mechanism to collect andprocess data at the point of collection. RMON provides both continuous andoffline data collection. Some implementation can even provide remote packet cap-ture. The RMON mechanism may be implemented in software on an existingdevice, in dedicated hardware such as an add-on card for a device, or even as aseparate device. Hardware implementations are usually called RMON probes.
Data is organized and retrieved in the same manner as SNMP data. Data organiza-tion is described in an RMON MIB, identified by OIDs, and retrieved with SNMPcommands. To the users, RMON will seem to be little more than an expanded orsuper MIB. To implementers, there are significant differences between RMON andtraditional SNMP objects, resulting from the need for continuous monitoring andremote data processing.
Originally, RMON data was organized in nine groups (RFCs 1271 and 1757) andlater expanded to include a tenth group (RFC 1513) for token rings:
Statistics groupOffers low-level utilization and error statistics
History groupProvides trend analysis data based on the data from the statistics group

RMON 217
This is the Title of the Book, eMatter EditionCopyright © 2007 O’Reilly & Associates, Inc. All rights reserved.
Alarm groupProvides for the user to configure alarms
Event groupLogs and generates traps for user-defined rising thresholds, falling thresholds,and matched packets
Host groupCollects statistics based on MAC addresses
Top N Hosts groupCollects host statistics for the busiest hosts
Packet Capture groupControls packet capture
Traffic Matrix groupCollects and returns errors and utilization data based on pairs of addresses
Filter groupCollects information based on definable filters
Token-ring groupCollects low-level token-ring statistics
RMON implementations are often limited to a subset of these groups. This isn’tunrealistic, but you should be aware of what you are getting when paying the pre-mium prices often required for RMON support.
Provided you have the RMON MIB loaded, you can use snmptranslate to explorethe structure of these groups. For example, here is the structure of the statisticsgroup:
bsd2# snmptranslate -Tp rmon.statistics+--statistics(1) | +--etherStatsTable(1) | +--etherStatsEntry(1) | +-- -R-- Integer etherStatsIndex(1) | Range: 1..65535 +-- -RW- ObjID etherStatsDataSource(2) +-- -R-- Counter etherStatsDropEvents(3) +-- -R-- Counter etherStatsOctets(4) +-- -R-- Counter etherStatsPkts(5) +-- -R-- Counter etherStatsBroadcastPkts(6) +-- -R-- Counter etherStatsMulticastPkts(7) +-- -R-- Counter etherStatsCRCAlignErrors(8) +-- -R-- Counter etherStatsUndersizePkts(9) +-- -R-- Counter etherStatsOversizePkts(10) +-- -R-- Counter etherStatsFragments(11) +-- -R-- Counter etherStatsJabbers(12)

218 Chapter 8: Performance Measurement Tools
This is the Title of the Book, eMatter EditionCopyright © 2007 O’Reilly & Associates, Inc. All rights reserved.
+-- -R-- Counter etherStatsCollisions(13) +-- -R-- Counter etherStatsPkts64Octets(14) +-- -R-- Counter etherStatsPkts65to127Octets(15) +-- -R-- Counter etherStatsPkts128to255Octets(16) +-- -R-- Counter etherStatsPkts256to511Octets(17) +-- -R-- Counter etherStatsPkts512to1023Octets(18) +-- -R-- Counter etherStatsPkts1024to1518Octets(19) +-- -RW- String etherStatsOwner(20) | Textual Convention: OwnerString +-- -RW- EnumVal etherStatsStatus(21) Textual Convention: EntryStatus Values: valid(1), createRequest(2), underCreation(3), invalid(4)
You retrieve the number of Ethernet packets on each interface exactly as youmight guess:
bsd2# snmpwalk 172.16.1.9 public rmon.1.1.1.5rmon.statistics.etherStatsTable.etherStatsEntry.etherStatsPkts.1 = 36214rmon.statistics.etherStatsTable.etherStatsEntry.etherStatsPkts.2 = 0rmon.statistics.etherStatsTable.etherStatsEntry.etherStatsPkts.3 = 3994rmon.statistics.etherStatsTable.etherStatsEntry.etherStatsPkts.4 = 242rmon.statistics.etherStatsTable.etherStatsEntry.etherStatsPkts.5 = 284rmon.statistics.etherStatsTable.etherStatsEntry.etherStatsPkts.6 = 292rmon.statistics.etherStatsTable.etherStatsEntry.etherStatsPkts.7 = 314548rmon.statistics.etherStatsTable.etherStatsEntry.etherStatsPkts.8 = 48074rmon.statistics.etherStatsTable.etherStatsEntry.etherStatsPkts.9 = 36861rmon.statistics.etherStatsTable.etherStatsEntry.etherStatsPkts.10 = 631831rmon.statistics.etherStatsTable.etherStatsEntry.etherStatsPkts.11 = 104rmon.statistics.etherStatsTable.etherStatsEntry.etherStatsPkts.12 = 457157rmon.statistics.etherStatsTable.etherStatsEntry.etherStatsPkts.25 = 0rmon.statistics.etherStatsTable.etherStatsEntry.etherStatsPkts.26 = 0rmon.statistics.etherStatsTable.etherStatsEntry.etherStatsPkts.27 = 0
(This is data from a recently installed 12 port switch. The last three interfaces arecurrently unused uplink ports.)
The primary problem with RMON, as described, is that it is limited to link-leveltraffic. This issue is being addressed with RMON2 (RFC 2021), which adds another10 groups. In order to collect network-level information, however, it is necessaryto delve into packets. This is processing intensive, so it is unlikely that RMON2will become common in the near future. For most purposes, the first few RMONgroups should be adequate.
One final word of warning. While RMON may lessen network traffic, RMON canbe CPU intensive. Make sure you aren’t overloading your system when collectingRMON data. It is ironic that tools designed to analyze traffic to avoid poor perfor-mance can actually cause that performance. To make truly effective use of anRMON probe, you should consider using a commercial tool designed specificallyfor your equipment and goals.

Microsoft Windows 219
This is the Title of the Book, eMatter EditionCopyright © 2007 O’Reilly & Associates, Inc. All rights reserved.
Microsoft WindowsApart from the basic text-based tools such as netstat, Microsoft doesn’t reallyinclude many useful utilities with the consumer versions of Windows. But if youare using Windows NT or Windows 2000, you have more options. The netmontool is included with the server versions. A brief description of how this tool canbe used to capture traffic was included in Chapter 5. netmon can also be used tocapture basic traffic information.
Figure 8-9 shows netmon’s basic capture screen. The upper-left pane shows fivebasic graphs for real-time traffic—network utilization, frames per second, bytes persecond, broadcasts per second, and multicasts per second. The second pane onthe left lists current connections between this and other hosts. The details of theseconnections are provided in the bottom pane. The pane on the right gives overallnetwork statistics. To use netmon in this fashion, just start the program and selectCapture ➝ Start. In standalone mode, netmon functions as a point-monitoring tool,but as noted in Chapter 5, it can be used with agents to collect traffic throughoutthe network.
For general systems monitoring, perfmon (Performance Monitor) is a better choice.It is also supplied with both the workstation and server versions. perfmon is a gen-
Figure 8-9. netmon traffic monitoring

220 Chapter 8: Performance Measurement Tools
This is the Title of the Book, eMatter EditionCopyright © 2007 O’Reilly & Associates, Inc. All rights reserved.
eral performance-monitoring tool, not just a network-monitoring tool. You can useit to measure system performance (including CPU utilization) and I/O perfor-mance, as well as basic network performance. If appropriately configured, it willalso monitor remote machines.
Data collected is organized by object type, e.g., groups of counters. For example,with the UDP object, there are counters for the number of datagrams sent persecond, datagrams received per second, datagrams received errors, etc. For net-work monitoring, the most interesting objects include ICMP, IP, Network Inter-face, RAS Ports, RAS Total, TCP, and UDP.
perfmon provides four views—alert, chart, log, and report. With alert view you canset a threshold and be notified when a counter exceeds or drops below it. Chartview gives a real-time graph for selected counters. You can customize the sam-pling rate and scale. Log view logs all the counters for an object to a file periodi-cally. Finally, report view displays numerical values in a window for selectedcounters. Each view is independent of the others. Figure 8-10 shows the processof adding a monitored object to the chart view for the Windows NT version.
The Windows 2000 version has received a slight face-lift but seems to be the samebasic program. perfmon can be particularly useful if you aren’t sure whether youhave a host problem or a network problem. Both netmon and perfmon are
Figure 8-10. Windows NT perfmon

Microsoft Windows 221
This is the Title of the Book, eMatter EditionCopyright © 2007 O’Reilly & Associates, Inc. All rights reserved.
described in the Windows help files as well as several books described inAppendix B.
ntop, mrtg, and cricket on Windows
All three major packages described in this chapter—ntop, mrtg, and cricket—areavailable for Windows systems.
The developers of ntop have provided you with two choices. You can compile ityourself for free. Both the Unix and Windows versions share the same source tree.Or, if you can’t easily compile it, you can buy a precompiled binary directly fromthem. Since ntop is basically a point-monitoring tool, you’ll likely want to run it onmultiple machines if you have a switched network or multiple subnetworks.
Since mrtg and cricket are primarily written in Perl, it is not surprising that theywill run under Windows. You’ll find mrtg fairly straightforward to set up. Whilecricket is said to work, at the time this was written there were no published direc-tions on how to set it up, and the Unix directions don’t generalize well.
Setting up mrtg for Windows is not that different from setting it up under Unix. Toget mrtg running, you’ll need to download a copy of mrtg with the binary forrateup. This was included with the copy of mrtg I downloaded, but the mrtg webpage for NT has a separate link should you need it. You will need a copy of Perlalong with anything else you may need to get Perl running. The mrtg site has linksto the Active Perl site. Installing Active Perl requires an updated version of theWindows Installer, available at their site. You’ll need to provide some mechanismfor running mrtg on a regular basis. The file fiveminute.zip provided a program toadd mrtg to the Windows NT scheduler. Finally, you’ll want to provide somemechanism to view the output from mrtg. This could be a web server or, at a min-imum, a web browser.
Once you have unpacked everything, you’ll need to edit the mrtg script so that NTrather than Unix is the operating system. This amounts to commenting out thefourth line of the script and uncommenting the fifth:
#$main::OS = 'UNIX';$main::OS = 'NT';
Also, make sure rateup is in the same directory as mrtg.
Creating the configuration file and running the script is basically the same as withthe Unix version. You’ll want to run cfgmaker and indexmaker. And, as with theUnix version, you’ll need to edit the configuration file to set WorkDir:. You will

222 Chapter 8: Performance Measurement Tools
This is the Title of the Book, eMatter EditionCopyright © 2007 O’Reilly & Associates, Inc. All rights reserved.
need to invoke Perl explicitly and use explicit paths with these scripts. Forexample, here are the commands to run indexmaker and mrtg on my system:
D:\mrtg\run>perl d:\mrtg\run\indexmaker d:\mrtg\run\mrtg.cfg > d:\apache\htdocs\mrtgD:\mrtg\run>perl d:\mrtg\run\mrtg d:\mrtg\run\mrtg.cfg
On my system, D:\mrtg\run is the directory where mrtg is installed and D:\apache\htdocs\mrtg is where the output is put so it can be accessed by the web server.
Finally, you’ll need to make some provision to run mrtg periodically. As noted,you can use supplied code to add it to the scheduler. Alternately, you can edit theconfiguration file to have it run as a daemon. For example, you could add the fol-lowing to your configuration file:
RunAsDaemon: yesInterval: 5
You’ll want to add mrtg to the startup group so that it will be run automaticallyeach time the system is rebooted.
getif revisited
In Chapter 7, we introduced getif but did not discuss the graph tab. Basically, thegraph tab provides for two types of graphs—graphs of ping round-trip delays andgraphs of SNMP objects. The latter allows us to use getif as a traffic-monitoringtool.
Graphing SNMP objects is a three-step process. First, you’ll need to go back to theParameters tab and identify the remote system and set its SNMP communitystrings. Next, you’ll need to visit the MBrowser tab and select the objects you wantto graph. Locate the objects of interest by working your way down the MIB tree inthe large pane on the upper left of the window. Visit the object by clicking theWalk button. The object and its value should be added to the large lower pane.Finally, select the item from the large pane and click on the Add to Graph button.(Both of these tabs were described in Chapter 7.)
You can now go to the Graph tab. Each of the selected variables should havebeen added to the legend to the right of the chart. You can begin collecting databy clicking on the Start button. Figure 8-11 shows one such graph.

Microsoft Windows 223
This is the Title of the Book, eMatter EditionCopyright © 2007 O’Reilly & Associates, Inc. All rights reserved.
The controls along the bottom of the page provide some control over the appear-ance of the chart and over the sampling rate.
Figure 8-11. getif graph

224This is the Title of the Book, eMatter Edition
Copyright © 2007 O’Reilly & Associates, Inc. All rights reserved.
Chapter 9
9Testing ConnectivityProtocols
This chapter and the next describe tools used to investigate protocol-specificbehavior. In this chapter, I describe tools used to explore connectivity protocols,protocols that work at the network and transport levels to provide connectivity.Chapter 10 focuses on tools used in testing protocols at the application level.
I begin with a description of packet generation tools. Custom packet generators,like hping and nemesis, will allow you to create custom packets to test protocols.Load generators, like MGEN, will let you flood your network with packets to seehow your network responds to the additional traffic. We conclude with a brief dis-cussion of network emulators and simulators.
Many of the tools described in this chapter and the next are not tools that you willneed often, if ever. But should the need arise, you will want to know about them.Some of these tools are described quite briefly. My goal is to familiarize you withthe tools rather than to provide a detailed introduction. Unless you have a specificneed for one of these tools, you’ll probably want to just skim these chapters ini-tially. Should the need arise, you’ll know the appropriate tool exists and can turnto the references for more information.
Packet Injection ToolsThis first group of tools generates and injects packets into your network. Basi-cally, there are two different purposes for generating packets, each with its owngeneral approach and its own set of tools.
First, to test software configuration and protocols, it may be necessary to controlthe content of individual fields within packets. For example, customized packetscan be essential to test whether a firewall is performing correctly. They can also beused to investigate problems with specific protocols or to collect information such

Packet Injection Tools 225
This is the Title of the Book, eMatter EditionCopyright © 2007 O’Reilly & Associates, Inc. All rights reserved.
as path MTU. They are wonderful learning tools, but using them can be a lot ofwork and will require a very detailed knowledge of the relevant protocols.
The second reason for generating packets is to test performance. For this purpose,you typically generate a large number of packets to see how your network ordevices on the network respond to the increased load. We have already done someof this. In Chapter 4, we looked at tools that generated streams of packets to analyzelink and path performance. Basically, any network benchmark will have a packetgenerator as a component. Typically, however, you won’t have much control overthis component. The tools described here give you much greater control over thenumber, size, and spacing of packets. Unlike custom packet generators, load genera-tors typically won’t provide much control over the contents of the packets.
These two uses are best thought of as extremes on a continuum rather than mutu-ally exclusive categories. Some programs lie somewhere between these twoextremes, providing a moderate degree of control over packet contents and thefunctionality to generate multiple packets. There is no one ideal tool, so you maywant to become familiar with several, depending on your needs.
Custom Packets Generators
A number of different programs will construct custom packets for you. The utili-ties vary considerably in the amount of control you actually have. As all require athorough understanding of the underlying protocols, none of these tools are par-ticularly easy to use. All of the ones I am familiar with are command-line pro-grams. This is really a plus since, if you find yourself using these programs heavily,you will want to call them from scripts.
Two programs, hping and nemesis, are briefly described here. A number of addi-tional tools are cited at the end of this section in case these utilities don’t providethe exact functionality you want or aren’t easily ported to your system. Of the two,hping is probably the better known, but nemesis has features that recommend it.Neither is perfect.
Generally, once you have the idea of how to use one of these tools, learninganother is simply a matter of identifying the options of interest. Most custompacket generators have a reasonable set of defaults that you can start with.Depending on what you want to do, you select the appropriate options to changejust what is necessary—ideally as little as possible.
Custom packet tools have a mixed reputation. They are extremely powerful toolsand, as such, can be abused. And some of their authors seem to take great pridein this potential. These are definitely tools that you should use with care. For somepurposes, such as testing firewalls, they can be indispensable. Just make sure it isyour firewall, and not someone else’s, that you are testing.

226 Chapter 9: Testing Connectivity Protocols
This is the Title of the Book, eMatter EditionCopyright © 2007 O’Reilly & Associates, Inc. All rights reserved.
hping
hping, or hping2 as it is sometimes called, was written by Salvatore Sanfilippo.The documentation is a little rough at times and suggests uses that are inappro-priate. Nonetheless, it is a powerful, versatile program.
When run with the default parameters, it looks a lot like ping and is useful forchecking connectivity:
lnx1# hping 205.153.63.30eth0 default routing interface selected (according to /proc)HPING 205.153.63.30 (eth0 205.153.63.30): NO FLAGS are set, 40 headers + 0 databytes46 bytes from 205.153.63.30: flags=RA seq=0 ttl=126 id=786 win=0 rtt=4.4 ms46 bytes from 205.153.63.30: flags=RA seq=1 ttl=126 id=1554 win=0 rtt=4.5 ms46 bytes from 205.153.63.30: flags=RA seq=2 ttl=126 id=2066 win=0 rtt=4.6 ms46 bytes from 205.153.63.30: flags=RA seq=3 ttl=126 id=2578 win=0 rtt=5.5 ms46 bytes from 205.153.63.30: flags=RA seq=4 ttl=126 id=3090 win=0 rtt=4.5 ms
--- 205.153.63.30 hping statistic ---5 packets tramitted, 5 packets received, 0% packet lossround-trip min/avg/max = 4.4/4.7/5.5 ms
At first glance, the output looks almost identical to ping’s. Actually, by default,hping does not send ICMP packets. It sends TCP packets to port 0. (You canchange ports with the -p option.) Since this port is almost never used, most sys-tems will reply with a RESET message. Consequently, hping will sometimes getresponses from systems that block ping. On the other hand, it may trigger intru-sion detection systems as well. If you want to mimic ping, you can use the -1argument, which specifies ICMP. Or, if you prefer, you can use -2 to send UDPpackets.
When using ICMP, this is what one of the replies from the output looks like:
46 bytes from 205.153.63.30: icmp_seq=0 ttl=126 id=53524 rtt=2.2 ms
Otherwise, the output will be almost identical to the default behavior.
If you want more information, you can use -V for verbose mode. Here is what areply looks like with this option:
46 bytes from 172.16.2.236: flags=RA seq=0 ttl=63 id=12961 win=0 rtt=1.0 ms tos = 0 len = 40 seq = 0 ack = 108515096 sum = a5bc urp = 0
There is also a debug mode if you are having problems with hping.
Other options that control the general behavior of hping include -c to set thenumber of packets to send, -i to set the time between packets, -n for numeric

Packet Injection Tools 227
This is the Title of the Book, eMatter EditionCopyright © 2007 O’Reilly & Associates, Inc. All rights reserved.
output (no name resolution), and -q for quiet output (just summary lines whendone).
Another group of options allows you to control the contents of the packet header.For example, the -a option can be used to specify an arbitrary source address for apacket. Here is an example:
lnx1# hping2 -a 205.153.63.30 172.16.2.236eth0 default routing interface selected (according to /proc)HPING 172.16.2.236 (eth0 172.16.2.236): NO FLAGS are set, 40 headers + 0 databytes
--- 172.16.2.236 hping statistic ---4 packets tramitted, 0 packets received, 100% packet lossround-trip min/avg/max = 0.0/0.0/0.0 ms
In this case, the packet has been sent from a computer whose actual sourceaddress is 172.16.3.234. The packet, however, will have 205.153.63.30 in its IPheader as the source address. Of course, any reply from the destination will goback to the spoofed source address, not the actual source address. If this a validaddress that belongs to someone else, they may not look kindly on your testing.
Spoofing source addresses can be useful when testing router and firewall setup,but you should do this in a controlled environment. All routers should be config-ured to drop any packets with invalid source addresses. That is, if a packet claimsto have a source that is not on the local network or that is not from a device forwhich the local network should be forwarding a packet, then the source address isillegal and the packet should be dropped. By creating packets with illegal sourceaddresses, you can test your routers to be sure they are, in fact, dropping thesepackets. Of course, you need to use a tool like ethereal or tcpdump to see what isgetting through and what is blocked.*
The source port can be changed with the -s option. The TTL field can be set withthe -t option. There are options to set the various TCP flags: -A for ACK, -F forFIN, -P for PUSH, -R for RST, -S for SYN, and -U for URG. Oddly, although youcan set the urgent flag, there doesn’t seem to be a way to set the urgent pointer.You can set the packet size with the -d option, set the TCP header length with the-O option, and read the packet’s data from a file with the -E option. Here is anexample of sending a DNS packet using data in the file data.dns:
bsd2# hping -2 -p 53 -E data.dns -d 31 205.153.63.30
hping generated an error on my system with this command, but the packet wassent correctly.
* If this is all you are testing, you may prefer to use a specialized tool like egressor.

228 Chapter 9: Testing Connectivity Protocols
This is the Title of the Book, eMatter EditionCopyright © 2007 O’Reilly & Associates, Inc. All rights reserved.
Be warned, constructing a usable data file is nontrivial. Here is a crude C programthat will construct the data needed for this DNS example:
#include <stdio.h>main(){FILE *fp;
fp=fopen("data.dns", "w");fprintf(fp, "%c%c%c%c", 0x00, 0x01, 0x01, 0x00);fprintf(fp, "%c%c%c%c", 0x00, 0x01, 0x00, 0x00);fprintf(fp, "%c%c%c%c", 0x00, 0x00, 0x00, 0x00);fprintf(fp, "%c%s", 0x03, "www");fprintf(fp, "%c%s", 0x05, "cisco");fprintf(fp, "%c%s%c", 0x03, "com", 0x00);fprintf(fp, "%c%c%c%c", 0x00, 0x01, 0x00, 0x01);fclose(fp);}
Even if you don’t use C, it should be fairly clear how this works. The fopen com-mand creates the file, and the fprintf commands write out the data. %c and %s areused to identify the datatype when formatting the output. The remaining argu-ments are the actual values for the data. (I’m sure there are cleaner ways to createthis data, but this will work.)
Finally, hping can also be put in dump mode so that the contents of the replypackets are displayed in hex:
bsd2# hping -c 1 -j 172.16.2.230HPING 172.16.2.230 (ep0 172.16.2.230): NO FLAGS are set, 40 headers + 0 databytes46 bytes from 172.16.2.230: flags=RA seq=0 ttl=128 id=60017 win=0 rtt=2.1 ms 0060 9706 2222 0060 088f 5f0e 0800 4500 0028 ea71 0000 8006 f26b ac10 02e6 ac10 02ec 0000 0a88 0000 0000 1f41 a761 5014 0000 80b3 0000 0000 0000 0000
--- 172.16.2.230 hping statistic ---1 packets transmitted, 1 packets received, 0% packet lossround-trip min/avg/max = 2.1/2.1/2.1 ms
Numerous other options are described in hping’s documentation. You can get avery handy summary of options if you run hping with the -h option. I strongly rec-ommend you print this to use while you are learning the program.
nemesis
nemesis, whose author is identified only as Obecian in the documentation, is actu-ally a family of closely related command-line tools designed to generate packets.They are nemesis-arp, nemesis-dns, nemesis-icmp, nemesis-igmp, nemesis-ospf,nemesis-rip, nemesis-tcp, and nemesis-udp. Each, as you might guess, is designed

Packet Injection Tools 229
This is the Title of the Book, eMatter EditionCopyright © 2007 O’Reilly & Associates, Inc. All rights reserved.
to construct and send a particular type of packet. The inclusion of support for pro-tocols like OSPF or IGMP really sets nemesis apart from similar tools.
Here is an example that sends a TCP packet:
bsd2# nemesis-tcp -v -D 205.153.63.30 -S 205.153.60.236
TCP Packet Injection -=- The NEMESIS Project 1.1(c) 1999, 2000 obecian <[email protected]>
205.153.63.30[IP] 205.153.60.236 > [Ports] 42069 > 23[Flags][TCP Urgent Pointer] 2048[Window Size] 512[IP ID] 0[IP TTL] 254[IP TOS] 0x18[IP Frag] 0x4000[IP Options]Wrote 40 bytes
TCP Packet Injected
The -v option is for verbose mode. Without this option, the program sends thepacket but displays nothing on the screen. Use this option to test your commandsand then omit it when you embed the commands in scripts. The -S and -D optionsgive the source and destination addresses. You can use the -x and -y to set sourceand destination ports. If you want to specify flags, you can use the -f option. Forexample, if you add -fS -fA to the command line, the SYN and ACK flags will beset. (Many firewalls will block packets with some combinations of SYN and ACKflags but will pass packets with different combinations. Being able to set the SYNand ACK flags can be useful in testing these firewalls.)
Here is an example setting the SYN and ACK flags and the destination port:
bsd2# nemesis-tcp -S 172.16.2.236 -D 205.153.63.30 -fS -fA -y 22
Notice the program performs silently without the -v option. A number of addi-tional options are described in the Unix manpages.
The other programs in the nemesis suite work pretty much the same way. Here isan example for sending an ICMP ECHO REQUEST:
bsd2# nemesis-icmp -v -S 172.16.2.236 -D 205.153.63.30 -i 8
ICMP Packet Injection -=- The NEMESIS Project 1.1(c) 1999, 2000 obecian <[email protected]>
[IP] 172.16.2.236 > 205.153.63.30[Type] ECHO REQUEST[Sequence number] 0

230 Chapter 9: Testing Connectivity Protocols
This is the Title of the Book, eMatter EditionCopyright © 2007 O’Reilly & Associates, Inc. All rights reserved.
[IP ID] 0[IP TTL] 254[IP TOS] 0x18[IP Frag] 0x4000
Wrote 48 bytes
ICMP Packet Injected
The -i option specifies the type field in the ICMP header. In this case, the 8 is thecode for an ECHO_REQUEST message. The destination should respond with anECHO_REPLY.
The -P option can be used to read the data for the packet from a file. Forexample, here is the syntax to send a DNS query.
bsd2# nemesis-dns -v -S 172.16.2.236 -D 205.153.63.30 -q 1 -P data.dns
DNS Packet Injection -=- The NEMESIS Project 1.1(c) 1999, 2000 obecian <[email protected]>
[IP] 172.16.2.236 > 205.153.63.30[Ports] 42069 > 53
[# Questions] 1[# Answer RRs] 0[# Authority RRs] 0[# Additional RRs] 0
[IP ID] 420[IP TTL] 254[IP TOS] 0x18[IP Frag] 0x4000[IP Options]
00 01 01 00 00 01 00 00 00 00 00 00 03 77 77 .............ww77 05 63 69 73 63 6F 03 63 6F 6D 00 00 01 00 w.cisco.com....01 .
Wrote 40 bytes
DNS Packet Injected
Although it appears the data has been sent correctly, I have seen examples whenthe packets were not correctly sent despite appearances. So, be warned! It isalways a good idea to check the output of a packet generator with a packet snifferjust to make sure you are getting what you expect.
Other tools
There are a number of other choices. ipfilter is a suite of programs for creatingfirewalls. Supplied with some operating systems, including FreeBSD, ipfilter has

Packet Injection Tools 231
This is the Title of the Book, eMatter EditionCopyright © 2007 O’Reilly & Associates, Inc. All rights reserved.
been ported to a number of other platforms. One of the tools ipfilter includes isipsend. Designed for testing firewalls, ipsend is yet another tool to constructpackets. Here is an example:
bsd2# ipsend -v -i ep0 -g 172.16.2.1 -d 205.153.63.30Device: ep0Source: 172.16.2.236Dest: 205.153.63.30Gateway: 172.16.2.1mtu: 1500
ipsend is not the most versatile of tools, but depending on what system you areusing, you may already have it installed.
Yet another program worth considering is sock. sock is described in the firstvolume of Richard W. Stevens’ TCP/Illustrated and is freely downloadable. Whilesock doesn’t give the range of control some of these other programs give, it is anice pedagogical tool for learning about TCP/IP. Beware, there are other totallyunrelated programs called sock.
Finally, some sniffers and analyzers support the capture and retransmission ofpackets. Look at the documentation for the sniffer you are using, particularly if it isa commercial product. If you decide to use this feature, proceed with care. Retrans-mission of traffic, if used indiscriminately, can create some severe problems.
Load Generators
When compared to custom packet generators, load generators are at the oppositeextreme of the continuum for packet injectors. These are programs that generatetraffic to stress-test a network or devices on a network. These tools can help youjudge the performance of your network or diagnose problems. They can also pro-duce a considerable strain on your network. You should use these tools to testsystems offline, perhaps in a testing laboratory prior to deployment or duringscheduled downtime. Extreme care should be taken before using these tools on aproduction network. Unless you are absolutely convinced that what you are doingis safe and reasonable, don’t use these tools on production networks.
Almost any application can be used to generate traffic. A few tools, such as pingand ttcp, are particularly easy to use for this purpose. For example, by startingmultiple ping sessions in the background, by varying the period between packetswith the -i option, and by varying the packet sizes with the -s option, you caneasily generate a wide range of traffic loads. Unfortunately, this won’t generate thetype of traffic you may need for some types of tests. Two tools, spray and mgen,are described here. The better known of these is probably spray. (It was intro-duced in Chapter 4.) It is also frequently included with systems so you mayalready have a copy. mgen is one of the most versatile.

232 Chapter 9: Testing Connectivity Protocols
This is the Title of the Book, eMatter EditionCopyright © 2007 O’Reilly & Associates, Inc. All rights reserved.
spray
spray is useful in getting a rough idea of a computer’s network performance, par-ticularly its interface. spray, on the local computer, communicates with the rpc.sprayd daemon on the remote system being tested. (You’ll need to make sure thisis running on the remote system.) It effectively floods the remote system with alarge number of fixed-length UDP packets. The remote daemon, generally startedby inetd, receives and counts these packets. The local copy of spray queries theremote daemon to determine the number of packets that were successfully
socket and netcatWhile they don’t fit cleanly into this or the next category, netcat (or nc) andJuergen Nickelsen’s socket are worth mentioning. (The netcat documentationidentifies only the author as Hobbit.) Both are programs that can be used toestablish a connection between two machines. They are useful for debugging,moving files, and exploring and learning about TCP/IP. Both can be used fromscripts.
You’ll need to start one copy as a server (in listen mode) on one computer:
bsd1# nc -l -p 2000
Then start another as a client on a second computer:
bsd2# nc 172.16.2.231 2000
Here is the equivalent command for socket as a server:
bsd1# socket -s 2000
Here is the equivalent command for a client:
bsd2# socket 172.16.2.231 2000
In all examples 2000 is an arbitrarily selected port number.
Here is a simple example using nc to copy a file from one system to another.The server is opened with output redirected to a file:
bsd1# nc -l -p 2000 > tmp
Then the file is piped to the client:
bsd2# cat README | nc 172.16.2.231 2000^C punt!
Finally, nc is terminated with a Ctrl-C. The contents of README on bsd1 havebeen copied to the file tmp on bsd2. These programs can be cleaner than telnetin some testing situations since, unlike telnet, they don’t attempt any sessionnegotiations when started. Play with them, and you are sure to find a numberof other uses.

Packet Injection Tools 233
This is the Title of the Book, eMatter EditionCopyright © 2007 O’Reilly & Associates, Inc. All rights reserved.
received. By comparing the number of packets sent to the number received, spraycan calculate the number of packets lost.
Here is an example of spray using default values:
bsd2# spray sol1sending 1162 packets of lnth 86 to 172.16.2.233 ... in 0.12 seconds elapsed time 191 packets (16.44%) droppedSent: 9581 packets/sec, 804.7K bytes/secRcvd: 8006 packets/sec, 672.4K bytes/sec
Command-line options allow you to set the number of packets sent (-c), the lengthof the packets sent (-l), and a delay between packets in microseconds (-d).
You should not be alarmed that packets are being dropped. The idea is to sendpackets as fast as possible so that the interface will be stressed and packets will belost. spray is most useful in comparing the performance of two machines. Forexample, you might want to see if your server can keep up with your clients. Totest this, you’ll want to use spray to send packets from the client to the server. Ifthe number of packets dropped is about the same, the machines are fairly evenlymatched. If a client is able to overwhelm a server, then you may have a potentialproblem.
In the previous example, spray was run on bsd2, flooding sol1. Here are theresults of running spray on sol1, flooding bsd2 :
sol1# spray bsd2sending 1162 packets of length 86 to 172.16.2.236 ... 610 packets (52.496%) dropped by 172.16.2.236 36 packets/sec, 3144 bytes/sec
Clearly, sol1 is faster than bsd2 since bsd2 is dropping a much larger percentage ofpackets.
Unfortunately, while spray can alert you to a problem, it is unable to differentiateamong the various reasons why a packet was lost—collision, slow interface, lackof buffer space, and so on. The obvious things to look at are the speed of thecomputer and its interfaces.
MGEN
The Multi-Generator Toolset or MGEN is actually a collection of tools for gener-ating traffic, receiving traffic, and analyzing results. The work of Brian Adamson atthe Naval Research Laboratory, this sophisticated set of tools will give you a highdegree of control over the shape of the traffic you generate. However, you aren’tgiven much control over the actual UDP packets the utility sends—that’s not theintent of the tool. For its intended uses, however, you have all the control you arelikely to need.

234 Chapter 9: Testing Connectivity Protocols
This is the Title of the Book, eMatter EditionCopyright © 2007 O’Reilly & Associates, Inc. All rights reserved.
The traffic generation tool is mgen. It can be run in command-line mode or byusing the -g option in graphical mode. At its simplest, it can be used withcommand-line options to generate traffic. Here is a simple example:
bsd2# mgen -i ep0 -b 205.153.63.30:2000 -r 10 -s 64 -d 5
MGEN: Version 3.1a3MGEN: Loading event queue ...MGEN: Seeding random number generator ...MGEN: Beginning packet generation ... (Hit <CTRL-C> to stop)Trying to set IP_TOS = 0x0MGEN: Packets Tx'd : 50MGEN: Transmission period: 5.018 seconds.MGEN: Ave Tx pkt rate : 9.964 pps.MGEN: Interface Stats : ep0 Frames Tx'd : 55 Tx Errors : 0 Collisions : 0MGEN: Done.
In this case, 10 packets per second for 5 seconds yields 50 packets.
Other options for mgen include setting the interface (-i), the destination addressand port (-b), the packet rate (-r), the packet size (-s), and the duration of the flowin seconds (-d). There are a number of other options described in the documenta-tion, such as the type of service and TTL fields.
The real strength of mgen comes when you use it with a script. Here is a verysimple example of a script called demo :
START NOW00001 1 ON 205.153.63.30:5000 PERIODIC 5 6405000 1 MOD 205.153.63.30:5000 POISSON 20 6415000 1 OFF
The first line tells mgen to start generating traffic as soon as the program is started.(An absolute start time can also be specified.) The second line creates a flow withan ID of 1 that starts 1 millisecond into a run that has port 5000 on 205.153.63.30as its destination. The traffic is 5 packets per second, and each packet is 64 bytesin length. The third line tells mgen to modify the flow with ID 1. 5000 millisec-onds (or 5 seconds) into the flow, packet generation should switch to a Poissiondistribution with a rate of 20 packets per second. The last line terminates the flowat 15,000 milliseconds. While this script has only one flow, a script can containmany.
Here is an example of the invocation of mgen with a script:
bsd2# mgen -i ep0 demo
MGEN: Version 3.1a3MGEN: Loading event queue ...

Network Emulators and Simulators 235
This is the Title of the Book, eMatter EditionCopyright © 2007 O’Reilly & Associates, Inc. All rights reserved.
MGEN: Seeding random number generator ...MGEN: Beginning packet generation ...MGEN: Packets Tx'd : 226MGEN: Transmission period: 15.047 seconds.MGEN: Ave Tx pkt rate : 15.019 pps.MGEN: Interface Stats : ep0 Frames Tx'd : 234 Tx Errors : 0 Collisions : 0MGEN: Done.
Since a Poisson distribution was used for part of the flow, we can’t expect to seeexactly 225 packets in exactly 15 seconds.
For many purposes, mgen is the only tool from the MGEN tool set that you willneed. But for some purposes, you will need more. drec is a receiver program thatcan log received data. mgen and drec can be used with RSVP (with ISI’s rsvpd).You will recall that with RSVP, the client must establish the session. drec has thiscapability. Like mgen, drec has an optional graphical interface. In addition tomgen and drec, the MGEN tool set includes a number of additional utilities thatcan be used to analyze the data collected by drec.
One last note on load generators—software load generators assume that the sys-tems they run on are fast enough to generate enough traffic to adequately load thesystem being tested. In some circumstances, this will not be true. For some appli-cations, dedicated hardware load generators must be used.
Network Emulators and SimulatorsBasically, an emulator is a device that sits on a network and mimics the behaviorof network devices or the behavior of part of a system, e.g., subnets. Actual trafficmeasurements are made on a network whose behavior is controlled, in part, bythe emulator. Simulators are software systems that model with software thebehavior of the system or networks. A simulator is a totally artificial or syntheticenvironment.
At best, network emulators and simulators are very unlikely troubleshooting tools.But for the extremely ambitious (or desperate), it is possible to investigate thebehavior of a network using these tools. Neither of these approaches is for thefainthearted or novice. Generally an expensive and complex proposition, there aretwo projects that are making these approaches more accessible. If you are reallyinterested in making the investment in time and effort needed to use emulators orsimulators, read on.
There is a continuum of approaches to investigating the behavior of a network,ranging from direct measurement at one extreme through emulation to simula-tion at the opposite extreme. It’s not unusual for emulators to provide limited

236 Chapter 9: Testing Connectivity Protocols
This is the Title of the Book, eMatter EditionCopyright © 2007 O’Reilly & Associates, Inc. All rights reserved.
simulation features or for simulators to have emulation features. This is certainlytrue for the two tools briefly described here.
We have already discussed measurement techniques. But while real measure-ments have an unquestionable authenticity, a number of problems are associatedwith real measurements. Lack of reproducibility is one problem. Scale problems,such as the cost of increasing the size of the test network, are another concern. Ifyou are considering implementation issues, then direct measurement can only bedone late in the development cycle, compounding the cost of mistakes. Emulationand simulation offer lower-cost alternatives.
Simulators have the advantages of being relatively cheap, providing highly repro-ducible results, scaling very well and inexpensively, and giving results quickly. It isgenerally very straightforward to customize the degree of detail in reports so youcan focus on just what is of interest. Simulations vary in degree of abstraction. Thegreater the degree of abstraction, the easier it is to focus on what is of interest atthe cost of lost realism. However, if a simulation is poorly designed, the resultscan have little basis in reality. Also, some simulators may be implemented prima-rily for one type of use and may not be appropriate for other uses. From a trouble-shooting perspective, you might use a simulator to further investigate a hypothesis.Simulators would provide a way to closely examine behavior to confirm or refutethe hypothesis without creating problems on a production network.
Emulators lie between simulators and live systems. They allow controlled experi-ments with a high degree of reproducibility. They make it much easier to createthe type of traffic or events of interest. They also provide a mechanism to test realsystems effectively. For example, an emulator might duplicate or approximate thebehavior of an attached device or network. A router emulator might drop traffic orinject traffic into the actual test network. On the downside, some emulators tend tobe very specialized and are usually platform specific. For troubleshooting, an emu-lator could be used to stress a network.
NISTNet
NIST Network Emulation Tool (NISTNet) is a general purpose tool that can be usedto emulate the dynamics in an IP network. It was developed by the National Insti-tute of Standards and Technology (NIST) and is implemented as an extension tothe Linux operating system through a kernel module. Unlike many emulators,NISTNet supports a fairly heterogeneous approach to emulation. And since it willrun on a fairly standard platform, it is remarkably inexpensive to set up and use.
NISTNet allows you to use a Linux system configured as a router, through an XWindow interface, to model or emulate a number of different scenarios. Forexample, you can program both fixed and variable packet delays and random

Network Emulators and Simulators 237
This is the Title of the Book, eMatter EditionCopyright © 2007 O’Reilly & Associates, Inc. All rights reserved.
reordering of packets. Packets can be dropped either randomly (uniform distribu-tion) or based on congestion.* Random duplication of packets, bandwidth limita-tions, or asymmetric bandwidth can all be programmed into NISTNet. You can alsoprogram in jitter and do basic quality-of-service measurements. NISTNet can bedriven by traces from measurements from existing networks. User-defined packethandlers can be added to the system to add timestamps, do data collection, gen-erate responses for emulated clients, and so forth.
ns and nam
If you want to consider simulations, you should first look into a pair of programs,ns and nam. ns is a network simulator, while nam is a network visualization tool.Both are under development by the Virtual InterNetwork Testbed (VINT) project, aDARPA-funded research project whose goal is to produce a simulator for studyingscale and protocol interactions. VINT is a collaborative project that involves USC,Xerox PARC, LBNL, and UCB.
ns is derived from earlier simulation projects such as REAL and has gone through acouple of incarnations. The kernel is written in C++, while user scripts are writtenin MIT’s Object Tool Command Language (OTCL), an object-oriented version ofTcl. With any simulation software, you should expect a steep learning curve, andns is no exception. You’ll need to learn how to use the product, and you will alsoneed a broad knowledge of simulations in general. To use ns, you’ll need to learnhow to write scripts in OTCL.
Fortunately, the ns project provides a wealth of documentation. The Unixmanpage is more than 30 pages and displays the typical unreadable tersenessassociated with Unix manual pages—great for looking up something you alreadyknow (arguably the intended use) but abysmal for learning something new. Thereis also a downloadable manual that runs more than 300 pages. However, the bestplace to start is with Marc Greis’s tutorial. It is a more manageable 50 pages andintroduces the scripting language in a series of readable examples.
One problem with simulations is that they can produce an overwhelming amountof information. Even worse, simulation results describe dynamic events that are dif-ficult to interpret when viewed statically. nam is a visualization tool that animatesnetwork simulations. It is hard to convey the real flavor of nam from a singleblack-and-white snapshot, but Figure 9-1 should give you some idea of its value.
This is output from one of the sample scripts that comes with the program. Thebasic topology of the network should be obvious. Packets are drawn as colored rect-angles. Different colors are used for different sources. As the animation is played,
* Gateway emulators that support this kind of behavior are sometimes less charitably called flakeways.

238 Chapter 9: Testing Connectivity Protocols
This is the Title of the Book, eMatter EditionCopyright © 2007 O’Reilly & Associates, Inc. All rights reserved.
you see the packets generated, queued at devices, move across the network, andoccasionally, dropped from the network. Node 6 in the figure shows a stack ofpackets that have been queued and one packet below the node that has beendropped. (Dropped packets fall to the bottom of the screen.) The control buttons atthe top are used just as you would expect—to play, stop, or rewind the animation.
NISTNet, ns, and nam are all described as ongoing projects. But all three are morepolished than many completed projects.
Microsoft WindowsFew of the tools described in this chapter are available for Windows. Those thatare available include some of the more ambitious tools, however. In particular, nsand nam have downloadable binaries for Windows. According to the mgen docu-mentation, a Windows “version may appear shortly.” (netcat has also been portedto Windows.)
If you are interested in traffic generation for loading purposes, you might look toipload. This is a very simple program that will flood a remote device with UDPpackets. You can specify the destination address, destination port, packet rate, andpacket payload. As the program runs, it will display a window with the elapsedtime, the number of packets sent, the packet rate, and the number of bytes persecond. ipload comes from BTT Software in the U.K. and requires no installation.
Several network-oriented benchmark programs available for Windows might alsobe of interest. In particular, you may want to look at NetBench, which can bedownloaded from Ziff Davis’s web site, http://www.zdnet.com/etestinglabs/filters/benchmarks. It is designed to test client/server performance. You’ll need to down-load both client and server versions of the software.
Figure 9-1. nam example

239This is the Title of the Book, eMatter Edition
Copyright © 2007 O’Reilly & Associates, Inc. All rights reserved.
Chapter 10
10Application-Level Tools
This chapter briefly surveys some additional tools that might be of interest. Youwill not need tools that are useful when setting up and debugging programs usingapplication-level protocols. The chapter is organized around different applicationprotocols. You will not need the tools described here often. The goal of thischapter is to make you aware of what is available should the need arise, and theapproach described here may be more useful than the specific tools mentioned.Unless you have a specific problem, you’ll probably want to just skim this chapterthe first time through.
Application-Protocols ToolsMany network applications are built upon application-level protocols rather thanbeing built directly upon network- or transport-level protocols. For example, emailreaders typically use SMTP to send email and POP2, POP3, or IMAP to receiveemail. For some applications, it is difficult to distinguish the application from theunderlying protocol. NFS is a prime example. But when an implementation sepa-rates the application from its underlying protocol, a number of advantages can berealized. First, the separation helps to ensure interoperability. A client developedon one platform can communicate effectively with server software running on adifferent system. For example, your web browser can communicate with any webserver because it uses a standardized protocol—HTTP. Tools based on the under-lying protocol can be used to obtain basic information regardless of the specificapplication being used.
Most of the tools described in this chapter collect information at the protocol level.While it is unlikely that any of these tools will provide the detailed informationyou would want for a problem with a specific application, they should help you

240 Chapter 10: Application-Level Tools
This is the Title of the Book, eMatter EditionCopyright © 2007 O’Reilly & Associates, Inc. All rights reserved.
identify where the problem lies and will help if the problem is with the protocol.Most applications will have their own approaches to solving problems, e.g., debugmodes, and log files. But you’ll want to be sure the problem is with the applica-tion before you start with these. If the problem is with the application, you’ll needto consult the specific documentation for the application.
If you are having trouble setting up a network application for the first time, youare probably better off rereading the documentation than investing time learning anew tool. But if you’ve read the directions three or four times in several differentbooks or if you have used an application many times and it has suddenly stoppedworking, then it’s probably time to look at tools. For many of the protocols, you’llhave a number of choices. You won’t need every tool, so pick the most appro-priate, convenient tool and start there.
Providing a detailed description of all available tools is beyond the scope of anyreasonable book. This would require both a detailed review of the protocol aswell as a description of the tool. For example, Hal Stern’s 400-page book, Man-aging NFS and NIS, has three chapters totaling about 125 pages on tools, debug-ging, and tuning NIS and NFS. What I’m trying to do here is provide you withenough information to get started and handle simple problems. If you need moreinformation, you should consider looking at one of the many books, like Stern’s,devoted to the specific protocol in question. A number of such books aredescribed in Appendix B.
Generally, these applications are based on a client/server model. The approachyou’ll take in debugging a client may be different from that used to debug aserver. The first step, in general, is to decide if the problem is with the client appli-cation, the server application, or the underlying protocols. If any client on anymachine can connect to a server, the server and protocols are probably operatingcorrectly. So when communications fail, the first thing you may want to try is a dif-ferent client program or a similar client on a different computer. With many proto-cols, you don’t even need a client program. Many protocols are based on theexchange of commands in NVT ASCII* over a TCP connection. You can interactwith these servers using any program that can open a TCP connection using NVTASCII. Examples include telnet and netcat.
Email protocols such as SMTP, POP2, and POP3 are perfect examples of protocolswhere telnet is the optimal tool to begin with. Here is an example using telnet to
* Network Virtual Terminal (NVT) ASCII is a 7-bit U.S. variant of the common ASCII character code. It isused throughout the TCP/IP protocol. It uses 7 bits to encode a character that is transmitted as an 8-bitbyte with the high-order bit set to 0.

Application-Protocols Tools 241
This is the Title of the Book, eMatter EditionCopyright © 2007 O’Reilly & Associates, Inc. All rights reserved.
send a brief message via SMTP. (Depending on your system, you may need toenable local echoing so that what you type will be visible.)
bsd2# telnet mail.lander.edu 25Trying 205.153.62.5...Connected to mail.lander.edu.Escape character is '^]'.220 mail.lander.edu ESMTP Sendmail 8.9.3/8.9.3; Wed, 22 Nov 2000 13:22:15 -0500helo 205.153.60.236250 mail.lander.edu Hello [205.153.60.236], pleased to meet youmail from:<[email protected]>250 <[email protected]>... Sender okrcpt to:<[email protected]>250 [email protected]... Recipient okdata354 Enter mail, end with "." on a line by itselfThis is the body of a message..250 NAA28089 Message accepted for deliveryquit221 mail.lander.edu closing connectionConnection closed by foreign host.
The process is very simple. telnet is used to connect to port 25, the SMTP port, onthe email server in question. The next four lines were returned by the server. Atthis point, we can see that the server is up and that we are able to communicatewith it. To send email, use the commands helo to identify yourself, mail from: tospecify the email source, and rcpt to: to specify the destination. Use names, not IPaddresses, to specify the destination. Notice that no password is required to sendemail. (The server is responding with the lines starting with numbers or codes.)The data command was used to signal the start of the body of the message. Thebody is one line long here but can be as long as you like. When you are doneentering the body, it is terminated with a new line that has a single period on it.The session was terminated with the quit command. Clearly the server is up andcan be reached in this example. Any problems you may be having must be withyour email client.
As noted, you had a pretty good idea the server was working as soon as it repliedand could have quit at this point. There are a couple of reasons for going throughthe process of sending a message. First, it gives a nice warm feeling seeing thateverything is truly working. More important, it confirms that the recipient is knownto the server. For example, consider the following:
rcpt to:<[email protected]>550 <[email protected]>... User unknown
This reply lets us know that the user is unknown to the system. If you havedoubts about a recipient, you can use the vrfy and expand commands. The vrfy

242 Chapter 10: Application-Level Tools
This is the Title of the Book, eMatter EditionCopyright © 2007 O’Reilly & Associates, Inc. All rights reserved.
command will confirm the recipient address is valid, as shown in the followingexample:
vrfy jsloan250 Joseph Sloan <[email protected]>vrfy freddy550 freddy... User unknown
expn fully expands an alias, giving a list of all the recipients named in the alias. Bewarned, expn and vrfy are often seen as security holes and may be disabled. (Pru-dence would dictate using vrfy and expn only on your own systems.) There areother commands, but these are enough to verify that the server is available.
Another reason for sending the email is that it gives you something to retrieve, thenext step in testing your email connection. The process of retrieving email withtelnet is similar, although the commands will vary with the specific protocol beingused. Here is an example using a POP3 server:
bsd2# telnet mail.lander.edu 110Trying 205.153.62.5...Connected to mail.lander.edu.Escape character is '^]'.+OK POP3 mail.lander.edu v7.59 server readyuser jsloan+OK User name accepted, password pleasepass xyzzy+OK Mailbox open, 1 messagesretr 1+OK 347 octetsReturn-Path: <[email protected]>Received: from 205.153.60.236 ([205.153.60.236]) by mail.lander.edu (8.9.3/8.9.3) with SMTP id NAA28089; Wed, 22 Nov 2000 13:23:14 -0500Date: Wed, 22 Nov 2000 13:23:14 -0500From: [email protected]: <[email protected]>Status:
This is the body of a message..dele 1+OK Message deletedquit+OK SayonaraConnection closed by foreign host.
As you can see, telnet is used to connect to port 110, the POP3 port. As soon asthe first message comes back, you know the server is up and reachable. Next, youidentify yourself using the user and pass commands. This is a quick way to makesure that the account exists and you have the right password. Often, email readersgive cryptic error messages when you use a bad account or password. The system

Application-Protocols Tools 243
This is the Title of the Book, eMatter EditionCopyright © 2007 O’Reilly & Associates, Inc. All rights reserved.
has informed us that there is one message waiting for this user. Next, retrieve thatmessage with the retr command. The argument is the message number. This is themessage we just sent. Delete the message and log off with the dele and quit com-mands, respectively. (As an aside, sometimes mail clients will hang with overlargeattachments. You can use the dele command to delete the offending message.)
Of course, this is how a system running POP3 or SMTP is supposed to work. If itworks this way, any subsequent problems are probably with the client, and youneed to turn to the client documentation. You can confirm this with packet cap-ture software. If your system doesn’t work properly, the problem could be withthe server software or with communications. You might try logging onto the serverand verifying that the appropriate software is listening, using ps, or, if it is startedby inetd, using netstat. Or you might try using telnet to connect to the serverdirectly from the server, i.e., telnet localhost 25. If this succeeds, you mayhave routing problems, name service problems, or firewall problems. If it fails,then look to the documentation for the software you are using on the server.
The commands used by most email protocols are described in the relevant RFCs.For SMTP, see RFC 821; for POP2, see RFC 937; for POP3, see REF 1939; and forIMAP, see RFC 1176.
HTTP
HTTP is another protocol that is based on commands in NVT ASCII sent over aTCP session. It can be fairly complicated to figure out the correct syntax, but evenan error message will tell you that the server is running and the connection works.Try typing HEAD / HTTP / 1.0 followed by two carriages returns. Here is anexample:
bsd2# telnet localhost httpTrying 127.0.0.1...Connected to localhost.lander.edu.Escape character is '^]'.HEAD / HTTP / 1.0
HTTP/1.1 200 OKDate: Sun, 22 Apr 2001 13:27:32 GMTServer: Apache/1.3.12 (Unix)Content-Location: index.html.enVary: negotiate,accept-language,accept-charsetTCN: choiceLast-Modified: Tue, 29 Aug 2000 09:14:16 GMTETag: "a4cd3-55a-39ab7ee8;3a4a1b39"Accept-Ranges: bytesContent-Length: 1370Connection: closeContent-Type: text/htmlContent-Language: en
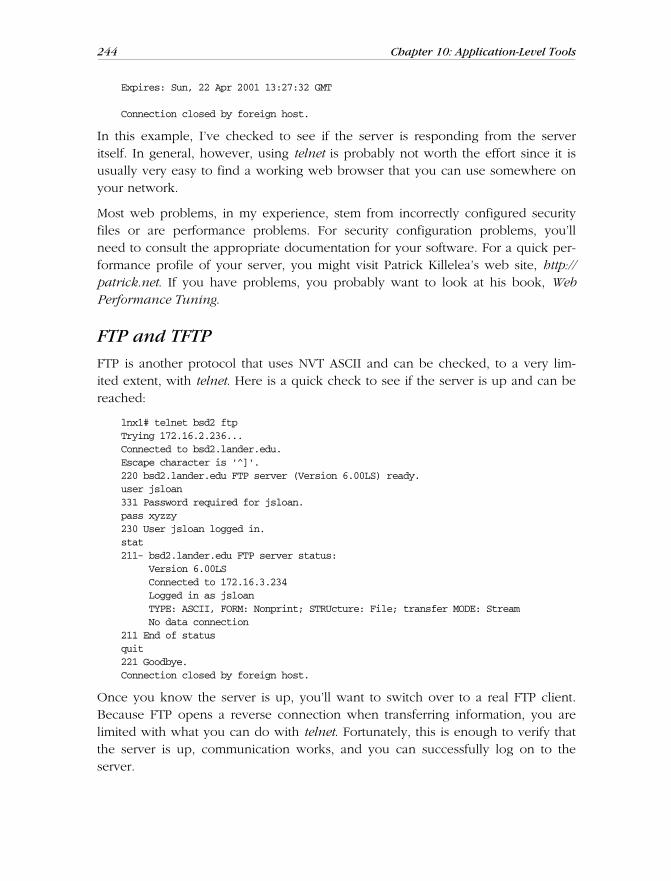
244 Chapter 10: Application-Level Tools
This is the Title of the Book, eMatter EditionCopyright © 2007 O’Reilly & Associates, Inc. All rights reserved.
Expires: Sun, 22 Apr 2001 13:27:32 GMT
Connection closed by foreign host.
In this example, I’ve checked to see if the server is responding from the serveritself. In general, however, using telnet is probably not worth the effort since it isusually very easy to find a working web browser that you can use somewhere onyour network.
Most web problems, in my experience, stem from incorrectly configured securityfiles or are performance problems. For security configuration problems, you’llneed to consult the appropriate documentation for your software. For a quick per-formance profile of your server, you might visit Patrick Killelea’s web site, http://patrick.net. If you have problems, you probably want to look at his book, WebPerformance Tuning.
FTP and TFTP
FTP is another protocol that uses NVT ASCII and can be checked, to a very lim-ited extent, with telnet. Here is a quick check to see if the server is up and can bereached:
lnx1# telnet bsd2 ftpTrying 172.16.2.236...Connected to bsd2.lander.edu.Escape character is '^]'.220 bsd2.lander.edu FTP server (Version 6.00LS) ready.user jsloan331 Password required for jsloan.pass xyzzy230 User jsloan logged in.stat211- bsd2.lander.edu FTP server status: Version 6.00LS Connected to 172.16.3.234 Logged in as jsloan TYPE: ASCII, FORM: Nonprint; STRUcture: File; transfer MODE: Stream No data connection211 End of statusquit221 Goodbye.Connection closed by foreign host.
Once you know the server is up, you’ll want to switch over to a real FTP client.Because FTP opens a reverse connection when transferring information, you arelimited with what you can do with telnet. Fortunately, this is enough to verify thatthe server is up, communication works, and you can successfully log on to theserver.

Application-Protocols Tools 245
This is the Title of the Book, eMatter EditionCopyright © 2007 O’Reilly & Associates, Inc. All rights reserved.
Unlike FTP, TFTP is UDP based. Consequently, TCP-based tools like telnet are notappropriate. You’ll want to use a TFTP client to test for connectivity. Fortunately,TFTP is a simple protocol and usually works well.
Name Services
Since name resolution is based primarily on UDP, you won’t be able to debug itwith telnet. Name resolution can be a real pain since problems are most likely toshow up when you are using other programs or services. Name service applica-tions are applications that you’ll want to be sure are working on your system. Forclients, it is one of the easiest protocols to test. For servers, however, ferreting outthat last error can be a real chore. Fortunately, there are a number of readily avail-able tools, particularly for DNS.
If you suspect name resolution is not working on a client, try using ping, alter-nating between hostnames and IP addresses. If you are consistently able to reachremote hosts with IP addresses but not with names, then you are having aproblem with name resolution. If you have a problem with name resolution on theclient side, start by reviewing the configuration files. It is probably easiest to startwith /etc/hosts and then look at DNS. Leave NIS until last.
nslookup and dig
There are several tools, such as nslookup, dig, dnsquery, and host, that are used toquery DNS servers. These are most commonly used to retrieve basic domain infor-mation such as what name goes with what IP address, aliases, or how a domain isorganized. With this information, you can map out a network, for example, at leastto the extent the DNS entries reflect the structure of the network. When trouble-shooting on the client side, it can be used to ensure the client can reach theappropriate DNS server. The real value for troubleshooting, however, is being ableto examine the information returned by servers. This allows you to check thisinformation for consistency, correctness, and completeness.
For most purposes, there is not much difference among these programs. Yourchoice will largely be a matter of personal preference. However, you should beaware that some other programs may be built on top of dig, so be sure to keep itaround even if you prefer one of the other tools.
Of these, nslookup, written by Andrew Cherenson, is the most ubiquitous and themost likely to be installed by default. It is even available under Windows. It can beused either in command-line mode or interactively. In command-line mode, youuse the name or IP address of interest as an argument:
sol1# nslookup 205.153.60.20Server: lab.lander.edu

246 Chapter 10: Application-Level Tools
This is the Title of the Book, eMatter EditionCopyright © 2007 O’Reilly & Associates, Inc. All rights reserved.
Address: 205.153.60.5
Name: ntp.lander.eduAddress: 205.153.60.20
bsd2# nslookup www.lander.eduServer: lab.lander.eduAddress: 205.153.60.5
Name: web.lander.eduAddress: 205.153.60.15Aliases: www.lander.edu
As you can see, it returns both the name and IP address of the host in question,the identity of the server supplying the information, and, in the second example,that the queried name is an alias. You can specify the server you want to use aswell as other options on the command line. You should be aware, however, that itis not unusual for reverse lookups to fail, usually because the DNS database isincomplete.
Earlier versions of nslookup required a special format for finding the names associ-ated with IP addresses. For example, to look up the name associated with 205.153.60.20, you would have used the command nslookup 20.60.153.205.in-addr.arpa. Fortunately, unless you are using a very old version of nslookup, youwon’t need to bother with this.
While command-line mode is adequate for an occasional quick query, if you wantmore information, you’ll probably want to use nslookup in interactive mode. If youknow the right combination of options, you could use command-line options. Butif you are not sure, it is easier to experiment step-by-step in interactive mode.
Interactive mode is started by typing nslookup without any arguments:
sol1# nslookupDefault Server: lab.lander.eduAddress: 205.153.60.5
>
As you can see, nslookup responds with the name of the default server and aprompt. A ? will return a list of available options. You can change the server youwant to query with the server command. You can get a listing of all machines in adomain with the ls command. For example, ls netlab.lander.edu would list all themachines in the netlab.lander.edu domain. Use the ls command with caution—itcan return a lot of information. You can use the -t option to specify a query type,i.e., a particular type of record. For example, ls -t mx lander.edu will return themail entries from lander.edu. Query types can include cname to list canonicalnames for aliases, hinfo for host information, ns for name servers for named

Application-Protocols Tools 247
This is the Title of the Book, eMatter EditionCopyright © 2007 O’Reilly & Associates, Inc. All rights reserved.
zones, soa for zone authority record, and so on. For more information, start withthe manpage for nslookup.
One useful trick is to retrieve the soa record for local and authoritative servers.Here is part of one such record retrieved in interactive mode:
> ls -t soa lander.edu[lab.lander.edu]$ORIGIN lander.edu.@ 1D IN SOA lab root ( 960000090 ; serial
The entry labeled serial is a counter that should be incremented each time theDNS records are updated. If the serial number on your local server, when com-pared to the authoritative server, is off by more than 1 or 2, the local server is notupdating its records in a timely manner. One possible cause is an old version ofbind.
Many administrators prefer dig to nslookup. While not quite as ubiquitous asnslookup, it is included as a tool with bind and is also available as a separate tool.dig is a command-line tool that is quite easy to use. It seems to have a few moreoptions and, since it is command line oriented, it is more suited for shell scripts.On the other hand, using nslookup interactively may be better if you are gropingaround and not really sure what you are looking for.
dig, short for Domain Internet Groper, was written by Steve Hotz. Here is anexample of using dig to do a simple query:
bsd2# dig @lander.edu www.lander.edu
; <<>> DiG 8.3 <<>> @lander.edu www.lander.edu; (1 server found);; res options: init recurs defnam dnsrch;; got answer:;; ->>HEADER<<- opcode: QUERY, status: NOERROR, id: 6;; flags: qr aa rd ra; QUERY: 1, ANSWER: 2, AUTHORITY: 1, ADDITIONAL: 1;; QUERY SECTION:;; www.lander.edu, type = A, class = IN
;; ANSWER SECTION:www.lander.edu. 1D IN CNAME web.lander.edu.web.lander.edu. 1D IN A 205.153.60.15
;; AUTHORITY SECTION:lander.edu. 1D IN NS lander.edu.
;; ADDITIONAL SECTION:lander.edu. 1D IN A 205.153.60.5
;; Total query time: 9 msec;; FROM: bsd2.lander.edu to SERVER: lander.edu 205.153.60.5

248 Chapter 10: Application-Level Tools
This is the Title of the Book, eMatter EditionCopyright © 2007 O’Reilly & Associates, Inc. All rights reserved.
;; WHEN: Tue Nov 7 10:26:42 2000;; MSG SIZE sent: 32 rcvd: 106
The first argument, in this case @lander.edu, is optional. It gives the name of thename server to be queried. The second argument is the name of the host you arelooking up.
As you can see, a simple dig provides a lot more information, by default at least,than does nslookup. It begins with information about the name server and resolverflags used. (The flags are documented in the manpage for bind ’s resolver.) Nextcome the header fields and flags followed by the query being answered. These arefollowed by the answer, authority records, and additional records. The format isthe domain name, TTL field, type code for the record, and the data field. Finally,summary information about the exchange is included.
You can also use dig to get other types of information. For example, the -x optionis used to do a reverse name lookup:
bsd2# dig -x 205.153.63.30
; <<>> DiG 8.3 <<>> -x;; res options: init recurs defnam dnsrch;; got answer:;; ->>HEADER<<- opcode: QUERY, status: NOERROR, id: 4;; flags: qr aa rd ra; QUERY: 1, ANSWER: 1, AUTHORITY: 1, ADDITIONAL: 1;; QUERY SECTION:;; 30.63.153.205.in-addr.arpa, type = ANY, class = IN
;; ANSWER SECTION:30.63.153.205.in-addr.arpa. 1D IN PTR sloan.lander.edu.
;; AUTHORITY SECTION:63.153.205.in-addr.arpa. 1D IN NS lander.edu.
;; ADDITIONAL SECTION:lander.edu. 1D IN A 205.153.60.5
;; Total query time: 10 msec;; FROM: bsd2.lander.edu to SERVER: default -- 205.153.60.5;; WHEN: Mon Nov 6 10:54:17 2000;; MSG SIZE sent: 44 rcvd: 127
The mx option (no hyphen) will return mail records, the soa option will returnzone authority records, and so on. See the manpage for details.
nslookup and dig are not unique. For example, host and dnsquery are other alter-natives you may want to look at. host is said to be designed as a successor fornslookup and dig. But it does everything online and can generate a lot of traffic asa result. While very useful tools, all of them rely on your ability to go back andanalyze the information returned. There are other tools that help to fill this gap.

Application-Protocols Tools 249
This is the Title of the Book, eMatter EditionCopyright © 2007 O’Reilly & Associates, Inc. All rights reserved.
doc, dnswalk, and lamers
doc is one such tool. It was originally written by Steve Hotz and Paul Mockapetriswith later modifications by Brad Knowles. Built on top of dig, doc is a script thatattempts to validate the consistency of information within a domain:
bsd2# doc lander.edu.Doc-2.1.4: doc lander.edu.Doc-2.1.4: Starting test of lander.edu. parent is edu.Doc-2.1.4: Test date - Mon Nov 6 11:55:07 EST 2000;; res_nsend to server g.root-servers.net. 192.112.36.4: Operation timed outDIGERR (UNKNOWN): dig @g.root-servers.net. for SOA of parent (edu.) failedSummary: ERRORS found for lander.edu. (count: 3) WARNINGS issued for lander.edu. (count: 1)Done testing lander.edu. Mon Nov 6 11:55:40 EST 2000
The results are recorded in a log file; in this case log.lander.edu. is the filename.(Note its trailing period.)
dnswalk, written by David Barr, is a similar tool. It is a Perl script that does a zonetransfer and checks the database for internal consistency. (Be aware that more andmore systems are disabling zone transfers from unknown sites.)
bsd2# dnswalk lander.edu.Checking lander.edu.BAD: lander.edu. has only one authoritative nameserverGetting zone transfer of lander.edu. from lander.edu...done.SOA=lab.lander.edu contact=root.lander.eduWARN: bookworm.lander.edu A 205.153.62.205: no PTR recordWARN: library.lander.edu A 205.153.61.11: no PTR recordWARN: wamcmaha.lander.edu A 205.153.62.11: no PTR recordWARN: mrtg.lander.edu CNAME elmer.lander.edu: unknown host0 failures, 4 warnings, 1 errors.
Be sure to include the period at the end of the domain name. This can produce alot of output, so you may want to redirect output to a file. A number of optionsare available. Consult the manpage.
You’ll want to take the output from these tools with a grain of salt. Even thoughthese tools do a lot of work for you, you’ll need a pretty good understanding ofDNS to make sense of the error messages. And, as you can see, for the samedomain, one found three errors and one warning while the other found one errorand four warnings for a fully functional DNS domain. There is no question thatthis domain’s database, which was being updated when this was run, has a fewminor problems. But it does work. The moral is, don’t panic when you see anerror message.
Another program you might find useful is lamers. This was written by BryanBeecher and requires both doc and dig. It is used to find lame delegations, i.e., a

250 Chapter 10: Application-Level Tools
This is the Title of the Book, eMatter EditionCopyright © 2007 O’Reilly & Associates, Inc. All rights reserved.
name server that is listed as authoritative for a domain but is not actually per-forming that service for the listed domain. This problem most often arises whenname services are moved from one machine to another, but the parent domain isnot updated. lamers is a simple script that can be used to identify this problem.
Other tools
In addition to these debugging tools, there are a number of additional tools thatare useful in setting up DNS in the first place. Some, such as make-zones, named-bootconf, and named-xfer, come with bind. Be sure to look over your port care-fully. Others, often scripts or collections of scripts, are available from othersources. Examples include h2n and dnsutl. There are a number of good tools outthere, so be sure to look around.
NIS and NIS+
NIS and its variants bring their own set of difficulties. If you are running both DNSand NIS, the biggest problem may be deciding where the problem lies. Unfortu-nately, there is no easy way to do this that will work in every case. The originalimplementation of nslookup completely bypasses NIS. If it failed, you could lookto DNS. If it succeeded, your problems were probably with NIS. Unfortunately, thenew, “improved” version of nslookup now queries NIS so this simple test is unreli-able. (For other suggestions, see Managing NFS and NIS by Hal Stern or DNS andBIND by Liu et al.)
If you are setting up NIS, your best strategy is to fully test DNS first. If you arehaving problems with NIS, there are a number of simple utilities supplied withNIS. ypcat lists an entire map, ypmatch matches a single key and prints an entry,and ypwhich identifies client bindings. But if you have read the NIS documenta-tion, you are already familiar with these.
Routing
If you are having routing problems, e.g., receiving error messages saying the hostor network is unreachable, then the first place to look is at the routing tables. Onthe local machine, you’ll use the netstat -r command as previously discussed. Forremote machines, you can use SNMP if you have SNMP access.
If you are using RIP, rtquery and ripquery are two tools that can be used toretrieve routing tables from remote systems. rtquery is supplied as part of therouted distribution, while ripquery comes with gated. The advantage of these toolsis that they use the RIP query and response mechanism to retrieve the route infor-mation. Thus, you can use either of these tools to confirm that the RIP exchangemechanism is really working, as well as to retrieve the routing tables to check forcorrectness.

Application-Protocols Tools 251
This is the Title of the Book, eMatter EditionCopyright © 2007 O’Reilly & Associates, Inc. All rights reserved.
It really doesn’t matter which of these you use, as the output from the two is basi-cally the same. Here is the output from ripquery:
bsd2# ripquery 172.16.2.184 bytes from NLCisco.netlab.lander.edu(172.16.2.1) to 172.16.2.236 version 2: 172.16.1.0/255.255.255.0 router 0.0.0.0 metric 1 tag0000 172.16.3.0/255.255.255.0 router 0.0.0.0 metric 1 tag0000 172.16.5.0/255.255.255.0 router 0.0.0.0 metric 2 tag0000 172.16.7.0/255.255.255.0 router 0.0.0.0 metric 2 tag0000
Here is the output from rtquery :
bsd2# rtquery 172.16.2.1NLCisco.netlab.lander.edu (172.16.2.1): RIPv2 84 bytes 172.16.1.0/24 metric 1 172.16.3.0/24 metric 1 172.16.5.0/24 metric 2 172.16.7.0/24 metric 2
You’ll notice that these are not your usual routing tables. Rather, these are thetables used by RIP’s distance vector algorithm. They give reachable networks andthe associated costs. Of course, you could always capture a RIP update withtcpdump or ethereal or use SNMP, but the tools discussed here are a lot easier touse.
If you are using Open Shortest Path First (OSPF) (regretfully I don’t at present),gated provides ospf_monitor. This interactive program provides a wealth of statis-tics, including I/O statistics and error logs in addition to OSPF routing tables. (Formore information on routing protocols, you might consult Routing in the Internetby Christian Huitema or Interconnections by Radia Perlman.)
NFS
With time, Network File System (NFS) has become fairly straightforward to set up.At one time, there were a number of utilities for debugging NFS problems, butfinding current ports has become difficult. At the risk of repeating myself, if youare having trouble setting up NFS, reread your documentation. Keep in mind thatthe various implementations of NFS all seem to be different, sometimes a lot dif-ferent. By itself, generic directions for NFS don’t work—be sure to consult the spe-cific documentation for your operating system!
Unlike most other protocols where a single process is started, NFS relies on anumber of different programs or daemons that vary from client to server and, tosome extent, from system to system. If you are having problems with NFS, the firststep is to consult your documentation to determine which daemons need to be

252 Chapter 10: Application-Level Tools
This is the Title of the Book, eMatter EditionCopyright © 2007 O’Reilly & Associates, Inc. All rights reserved.
running on your system. Next, make sure they are running. Be warned, the dae-mons you need and the names they go by vary from operating system to oper-ating system. For example, on most systems, mountd and nfsd, respectively,mount filesystems and access files. On some systems they go by the names rpc.mountd and rpc.nfsd. Since these rely on portmap, sometimes called rpcbind,you’ll need to make sure it is running as well. (NFS daemons are typically basedon RPC and use the portmapper daemon to provide access information.) The list ofdaemons will be different for the client and the server. For example, nfsiod (orbiod) will typically be running on the client but not the server. Keep in mind,however, that a computer may be both a client and a server.
There are a couple of ways to ensure the appropriate processes are available. Youcould log on to both machines and use ps to discover what is running. This hasthe advantage of showing you everything that is running. Another approach is touse rpcinfo to do a portmapper dump. Here is an example of querying a serverfrom a client:
bsd2# rpcinfo -p bsd1 program vers proto port 100000 2 tcp 111 portmapper 100000 2 udp 111 portmapper 100005 3 udp 1023 mountd 100005 3 tcp 1023 mountd 100005 1 udp 1023 mountd 100005 1 tcp 1023 mountd 100003 2 udp 2049 nfs 100003 3 udp 2049 nfs 100003 2 tcp 2049 nfs 100003 3 tcp 2049 nfs 100024 1 udp 1011 status 100024 1 tcp 1022 status
This has the advantage of showing that these services are actually reachable acrossthe network.
Once you know that everything is running, you should check the access files, typi-cally /etc/dfs/dfstab or /etc/exports, to make sure the client isn’t being blocked. Youcan’t just edit these files and expect to see the results immediately. Consult yourdocumentation on how to inform your NFS implementation of the changes. Begenerous with privileges if you are having problems, but don’t forget to tightensecurity once everything is working.
Finally, check your syntax. Make sure the mount point exists and has appropriatepermissions. Mount the remote system manually and verify that it is mounted withthe mount command. You should see something recognizable. Here are mounttable entries returned, respectively, by FreeBSD, Linux, and Solaris:

Application-Protocols Tools 253
This is the Title of the Book, eMatter EditionCopyright © 2007 O’Reilly & Associates, Inc. All rights reserved.
bsd1:/ on /mnt/nfs type nfs (rw,addr=172.16.2.231,addr=172.16.2.231)172.16.2.231:/ on /mnt/nfs (nfs)/mnt/nfs on 172.16.2.231:/usr read/write/remote on Thu Nov 30 09:49:52 2000
While they are not too similar, you should see a recognizable change to the mounttable before and after mounting a remote filesystem.
If you are having intermittent problems or if you suspect performance problems,you might want to use the nfsstat command. It provides a wealth of statisticsabout your NFS connection and its performance. You can use it to query theclient, the server, or both. When called without any options, it queries both clientand server. With the -c option, it queries the client. With the -s option, it queriesthe server. Here is an example of querying a client:
bsd2# nfsstat -cClient Info:Rpc Counts: Getattr Setattr Lookup Readlink Read Write Create Remove 0 0 33 2 0 21 4 0 Rename Link Symlink Mkdir Rmdir Readdir RdirPlus Access 0 0 0 0 0 8 0 66 Mknod Fsstat Fsinfo PathConf Commit GLease Vacate Evict 0 13 3 0 2 0 0 0Rpc Info: TimedOut Invalid X Replies Retries Requests 0 0 0 0 152Cache Info:Attr Hits Misses Lkup Hits Misses BioR Hits Misses BioW Hits Misses 232 36 74 33 0 0 0 21BioRLHits Misses BioD Hits Misses DirE Hits Misses 13 2 18 8 13 0
Unfortunately, it seems that every operating system has its own implementation ofnfsstat and each implementation returns a different set of statistics labeled in a dif-ferent way. What you’ll be most interested in is the number of problems in relationto the total number of requests. For example, a large number of timeouts is nocause for concern if it is a small percentage of a much larger number of totalrequests. If the timeouts are less than a couple of percent, they are probably not acause for concern. But if the percent of timeouts is large, you need to investigate.You’ll need to sort out the meaning of various numbers returned by your particularimplementation of nfsstat. And, unfortunately, the labels aren’t always intuitive.
Several other NFS tools were once popular but seem to have languished in recentyears. You probably won’t have much luck in finding these or getting them run-ning. Two of the ones that were once more popular are nhfsstone and nfswatch.nhfsstone is a benchmark tool for NFS, which seems to have been superseded withthe rather pricey SFS tool in SPEC. nfswatch is a tool that allows you to watch NFStraffic. tcpdump or ethereal, when used with the appropriate filters, provide aworkable alternative to nfswatch.

254 Chapter 10: Application-Level Tools
This is the Title of the Book, eMatter EditionCopyright © 2007 O’Reilly & Associates, Inc. All rights reserved.
Microsoft WindowsMany of the services described in this chapter are traditionally provided by Unixsystems. While more and more are becoming available, there aren’t a lot of toolsthat currently run under Windows. One exception is nslookup, which is nearlyidentical to its Unix counterpart. Of course, the telnet-based testing will work asshown. And you can always test a Windows server from a Unix client. If you wantWindows-based tools, the best place to start looking is in the appropriate Win-dows Resource Kit from Microsoft.

255This is the Title of the Book, eMatter Edition
Copyright © 2007 O’Reilly & Associates, Inc. All rights reserved.
Chapter 11
11Miscellaneous Tools
This chapter contains odds and ends that don’t really fit any of the categoriesdescribed in previous chapters. Most of the software presented here isn’t reallydesigned with network troubleshooting in mind, but it is, nonetheless, quiteuseful. These are tools that will make your life easier. With a few notable excep-tions, you should already be familiar with most of the tools described here. Conse-quently, the descriptions of the tools are, for the most part, fairly brief. Feel free tojump around in this chapter as needed.
Communications ToolsIf you are going to effectively administer remote systems, you will need to log onremotely. Even with small networks, it isn’t reasonable to jump up and run to theremote system every time you need to do this. This section has three subsections.First, a quick review of techniques you can use to record or log your activitieswhen using familiar tools like telnet, rlogin, and X Windows. Next comes a discus-sion of vnc, a tool that allows you to view a computer’s graphical displayremotely. Then I briefly discuss security concerns for these tools including a shortdescription of ssh.
Automating Documentation
This book has assumed that you are familiar with tools like telnet, rlogin, and XWindows. To use these tools effectively, you’ll want to be able to record or logyour activities from time to time. Arguably, one reason documentation is so oftenflawed is that it is usually written after the fact. This is often done from memory oran incomplete set of notes several days after changes have been made. While thebest time to write documentation is as you go, often this simply isn’t possible.

256 Chapter 11: Miscellaneous Tools
This is the Title of the Book, eMatter EditionCopyright © 2007 O’Reilly & Associates, Inc. All rights reserved.
When your network is down and management is calling every five minutes askingif it’s fixed yet, you probably won’t be pausing to write much down.
There are a few things you can do to help simplify writing documentation after thefact. First, get copious printouts at every stage, preferably with some kind of timeand date stamp. When a production system is down, it is not the time to worryabout the cost of paper. Several commands you are probably already familiar withmay be easy to overlook with the stress of dealing with a dead system.
If you are using X Windows, you can use the xwd command to capture windows.To use this command, in an xterm window, type:
bsd1# xwd -out xwdfile
You can then click on the window you want to capture. In this example, the filexwdfile will be created in the current directory. The file can be examined later orprinted using tools such as xv or gimp. Be sure to give these files meaningfulnames so that you can sort things out later.
If you are using a text-based interface and are interested in capturing the output ofa single command, you may be able to use the tee command. This commandallows you to send output from a command to both the screen and a file. Forexample, the following command will display the output of the command arp -aon the screen and write it to the file outfile:
bsd1# arp -a | tee outfile
The tee command may require special measures to work. For example, you mustuse the option -l with tcpdump if you want to use tee. An example was given inChapter 5. As with xwd, you should be careful to use meaningful filenames, partic-ularly if you are capturing windows on the fly.
An alternative to tee is script. It can be used to capture the output of a single com-mand or a series of commands. To capture a series of commands, you start scriptand then issue the commands of interest. For example, the following commandwill create the file scriptfile and return to the system prompt:
bsd1# script scriptfileScript started, output file is scriptfile
Everything that is displayed on your terminal will be logged to the file scriptfile.One advantage of logging a series of commands is that you can embed documen-tation into the file as you go. Simply type the comment character for your shell,and everything else you type on the line will be ignored. For example, with theBourne shell, you might type something like:
bsd1# #Well, the foo program didn't work. \>Let's try the bar program.

Communications Tools 257
This is the Title of the Book, eMatter EditionCopyright © 2007 O’Reilly & Associates, Inc. All rights reserved.
The “\” character was used to continue the comment on a new line.
When you are done logging a session, type exit or press Ctrl+D as in:
bsd1# exit
Script done, output file is scriptfile
You can now print or edit the file as desired.
One option that is often overlooked is to include a command with the script com-mand. For example:
bsd1# script scriptfile ifconfig -a
will run the program ifconfig -a, writing the output to the file scriptfile and dis-playing the output on the screen as well. This file will include two time and datestamps, one at the beginning and one at the end of the file.
You should be aware of a few problems with using script. First, the file can getvery big very quickly. This shouldn’t be much of a problem unless you are pressedfor disk space, but it can be painful to read after the fact. Second, it is all too easyto lose the file. For example, if a system crashes or is halted, the file may be lost inthe process. Third, commands that directly control the screen such as vi tend to fillthe output file with garbage. Finally, since a new shell is started by script, environ-mental changes made while script is running may be lost.
If you are connecting to a remote system using a variant of telnet, you may beable to log the session or print the screen. This is particularly true for PC imple-mentations of telnet. See the documentation for the version you are using.
vnc
vnc, short for virtual network computing, was developed by what is now the AT&TLaboratories at Cambridge. vnc is actually a pair of programs. One is a server,which generates and sends the local display’s contents to another computer. Theother is a viewer, which reconstructs the server’s display. You use the computerrunning the viewer program to control the remote computer running the serverprogram. An application, for example, would actually be running on the server’sCPU but controlled by the station running the viewer.
The program’s implementation is based on the concept of a remote frame buffer(i.e., remote video display memory). The server maintains the frame buffer, a pic-ture of the server’s display, and sends it to the viewer. The viewer recreates thedisplay on the local host. The updates to the remote frame buffer may be thecomplete contents of the frame buffer or, to minimize the impact on bandwidth,just what has changed since the last update.

258 Chapter 11: Miscellaneous Tools
This is the Title of the Book, eMatter EditionCopyright © 2007 O’Reilly & Associates, Inc. All rights reserved.
In a Unix environment, vnc provides a way to deliver an X Windows session to ahost that may not support a native X Windows connection. On the surface, a vncconnection probably seems a lot like an X Windows connection. There are, how-ever, some fundamental differences. vnc is designed so the viewer is a very thinclient. Unlike an X Windows, almost no work is done at the viewer, and the clientsoftware is stateless. And vnc is freely available on some non-Unix systems whereX Window isn’t.
vnc can run in one of two modes. In view only mode, the screen is displayed, butthe viewer is not given control of the server’s mouse or keyboard. If view onlymode is not selected, the viewer will share control of the mouse and keyboard.Please note, the mouse and keyboard will not necessarily be disabled at theserver.
To use vnc in a Unix environment, telnet to the remote computer and start the vncserver with the vncserver command. The first time you run it, it will create a .vncdirectory under your home directory and will query you for a connection pass-word that will be used for all future sessions. (You can change this with thevncpasswd command.)
lnx1$ vncserver
You will require a password to access your desktops.
Password:Verify:
New 'X' desktop is lnx1.lander.edu:1
Creating default startup script /home/jsloan/.vnc/xstartupStarting applications specified in /home/jsloan/.vnc/xstartupLog file is /home/jsloan/.vnc/lnx1.lander.edu:1.log
The command returns an address or hostname and a display number for the newlycreated display, in this instance lnx1.lander.edu:1. (Alternately, you could startthe vnc server while seated at the machine and then go to the client. This will benecessary if you want to run the server on a Microsoft Windows platform.)
Next, connect a viewer to the display. To start the viewer on a Unix system, startan X Window session and then use the vncviewer command with the host and dis-play number returned by the viewer program as an argument to the command. Bydefault, vncserver uses the twm X Window manager, but this can be reconfigured.*
If you are used to all the clutter that usually comes with gnome or something sim-ilar, the display may seem a little austere at first but will perform better. The basic
* To change the window manager, edit the file xstartup in the .vnc directory. For example, if you usegnome, you would change twm to exec gnome-session.

Communications Tools 259
This is the Title of the Book, eMatter EditionCopyright © 2007 O’Reilly & Associates, Inc. All rights reserved.
functionality you need will be there, and you will be able to run whichever X pro-grams you need.
vnc starts a number of processes; you’ll want to be sure that they are all stoppedwhen you are done. You can stop vnc with the -kill option as shown here:
lnx1$ vncserver -kill :1Killing Xvnc process ID 6171
Note that you need to specify only the display number, in this case :1. Youshould also be aware that this sometimes misses a process on some systems. Youmay need to do a little extra housekeeping now and then.
Once running, vnc supports sending special keystroke combinations such as Ctrl-Alt-Del. If both systems support it, you can cut and paste ASCII data betweenwindows.
vnc also provides a reasonable level of security. Once the password has been set,it is not transmitted over the network. Rather, a challenge response system is used.In addition to the password, the Microsoft Windows version of vncserver can beconfigured to accept connections from only a specific list of hosts. It can also beconfigured to use a secure shell (SSH) session. The default port can be reassignedto simplify configuration with firewalls.
The viewer and server can be on the same or different machines or can even beused on different architectures. vnc will run on most platforms. In particular, theviewer will run on just about any Microsoft Windows machine including WindowsCE. It will run under an X Window session, on Macintoshes, and as plug-ins forweb browsers. vnc is available in Java, and the server contains a small web serverthat can be accessed by some Java-aware browsers. To do this, you simply add5800 to the window number for the HTTP port number. In the previous example,the window was :1, so the HTTP port number would be :5801, and the URLwould be http://lnx1.lander.edu:5801.
There is substantial documentation available at the AT&T Laboratories web site,http://www.uk.research.att.com/vnc.
ssh
One of the problems with telnet, rlogin, rsh, and the like is a lack of security. Pass-words are sent in clear text and can be easily captured by any computer theyhappen to pass. And with the r-services, it can be very easy to mimic a trustedsystem. Attach a laptop to the network, set the IP address appropriately, and thereis a good chance you can mimic a trusted host.
One alternative is ssh, written by Tatu Ylönen, a replacement for the r-services thatuses encryption. While the original version is free, with Version 2 ssh has evolved

260 Chapter 11: Miscellaneous Tools
This is the Title of the Book, eMatter EditionCopyright © 2007 O’Reilly & Associates, Inc. All rights reserved.
into a commercial product, marketed by SSH Communications Security, Inc. How-ever, Version 2 is freely available for academic and noncommercial use. Recently,the OpenSSH project, a spin-off of the OpenBSD project, released a free port thatis compatible with both versions of ssh and is covered by the standard BSDlicense.
ssh is actually a set of programs that uses encryption to both authenticate usersand provide encrypted sessions. It provides four levels of authentication, rangingfrom trusted users and systems, like rsh and rlogin, to RSA-based authentication.By doing host authentication as well as user authentication, DNS, IP, and routespoofing attacks can be circumvented.
On the downside, ssh provides minimal protection once your systems have beencompromised. Version 1 of the SSH protocol has also been compromised by man-in-the-middle attacks when incorrectly configured. Also, some of its authenticationmethods can be relatively insecure. ssh is not trivial to configure correctly, but for-tunately, there is a fair amount of documentation available for ssh, including twobooks devoted exclusively to ssh. If you need particularly robust security, payclose attention to how you configure it or consider Version 2.
The legality of ssh is yet another question. Since encryption is sometimes the sub-ject of peculiar laws in some countries, using or exporting ssh may not be legal.The OpenBSD and OpenSSH projects avoid some of these problems by devel-oping code outside of the United States. Consequently, the distribution of theircode is not subject to the United States’ peculiar munitions export laws since it canbe obtained outside the United States.
Despite these concerns, ssh is something you should definitely consider if securityis an issue.
Log Files and AuditingA primary source of information on any system is its log files. Of course, log filesare not unique to networking software. They are simply another aspect of generalsystems management that you must master.
Some applications manage their own log files. Web servers and accounting soft-ware are prime examples. Many of these applications have specific needs thataren’t well matched to a more general approach. In dealing with these, you willhave to consult the documentation and deal with each on a case-by-case basis.Fortunately, most Unix software is now designed to use a central logging service,syslog, which greatly simplifies management.

Log Files and Auditing 261
This is the Title of the Book, eMatter EditionCopyright © 2007 O’Reilly & Associates, Inc. All rights reserved.
syslog
You are probably already familiar with syslog, a versatile logging tool written byEric Allman. What is often overlooked is that syslog can be used across networks.You can log events from your Cisco router to your Unix server. There are even anumber of Windows versions available. Here is a quick review of syslog.
An early and persistent criticism of Unix was that every application seemed to haveits own set of log files hidden away in its own directories. syslog was designed toautomate and standardize the process of maintaining system log files. The mainprogram is the daemon syslogd, typically started as a separate process duringsystem initialization. Messages can be sent to the daemon either through a set oflibrary routines or by a user command, logger. logger is particularly useful for log-ging messages from scripts or for testing syslog, e.g., checking file permissions.
Configuring syslog
syslogd ’s behavior is initialized through a configuration file, which by default is/etc/syslog.conf. An alternative file can be specified with the -f option when thedaemon is started. If changes are made to the configuration file, syslogd must berestarted for the changes to take effect. The easiest way to do this is to send it aHUP signal using the kill command. For example:
bsd1# kill -HUP 127
where 127 is the PID for syslogd, found using the ps command. (Alternately, thePID is written to the file /var/run/syslogd.pid on some systems.)
The configuration file is a text file with two fields separated by tabs, not spaces!Blank lines are ignored. Lines beginning with # in the first column are comments.The first field is a selector, and the second is an action. The selector identifies theprogram or facility sending the message. It is composed of both a facility nameand a security level. The facility names must be selected from a short list of facili-ties defined for the kernel. You should consult the manpage for syslogd for a com-plete list and description of facilities, as these vary from implementation toimplementation. The security level is also taken from a predefined list: emerg,alert, crit, err, warning, notice, info, or debug. Their meanings are just what youmight guess. emerg is the most severe. You can also use * for all or none fornothing. Multiple facilities can be combined on a single line if you separate themwith commas. Multiple selectors must be separated with semicolons.
The Action field tells where to send the messages. Messages can be sent to files,including device files such as the console or printers, logged-in users, or remotehosts. Pathnames must be absolute, and the file must exit with the appropriatepermissions. You should be circumspect in sending too much to the console. Oth-erwise, you may be overwhelmed by messages when you are using the console,

262 Chapter 11: Miscellaneous Tools
This is the Title of the Book, eMatter EditionCopyright © 2007 O’Reilly & Associates, Inc. All rights reserved.
particularly when you need the console the most. If you want multiple actions,you will need multiple lines in the configuration file.
Here are a few lines from a syslog.conf file that should help to clarify this:
mail.info /var/log/maillogcron.* /var/log/cronsecurity.* @loghost.netlab.lander.edu*.notice;news.err root*.err /dev/console*.emerg *
The first line says that all informational messages from sendmail and other mailrelated programs should be appended to the file /var/log/maillog. The second linesays all messages from cron, regardless of severity, should be appended to the file/var/log/cron. The next line says that all security messages should be sent to aremote system, loghost.netlab.lander.edu. Either a hostname or an IP address canbe used. The fourth line says that all notice-level messages and any news errormessages should be sent to root if root is logged on. The next to last line says thatall error messages, including news error messages, should be displayed on thesystem console. Finally, the last line says emergency messages should be sent toall users. It is easy to get carried away with configuration files, so remember tokeep yours simple.
One problem with syslog on some systems is that, by default, the log files areworld readable. This is a potential security hole. For example, if you log mailtransactions, any user can determine who is sending mail to whom—not neces-sarily something you want.
Remote logging
For anything but the smallest of networks, you really should consider remote log-ging for two reasons. First, there is simply the issue of managing and checkingeverything on a number of different systems. If all your log files are on a singlesystem, this task is much easier. Second, should a system become compromised,one of the first things crackers alter are the log files. With remote logging, futureentries to log files may be stopped, but you should still have the initial entries forthe actual break-in.
To do remote logging, you will need to make appropriate entries in the configura-tion files for two systems. On the system generating the message, you’ll need tospecify the address of the remote logging machine. On the system receiving themessage, you’ll need to specify a file for the messages. Consider the case in whichthe source machine is bsd1 and the destination is bsd2. In the configuration file forbsd1, you might have an entry like:
local7.* @bsd2.netlab.lander.edu

Log Files and Auditing 263
This is the Title of the Book, eMatter EditionCopyright © 2007 O’Reilly & Associates, Inc. All rights reserved.
bsd2 ’s configuration file might have an entry like:
local7.* /var/log/bsd1
Naming the file for the remote system makes it much easier to keep messagesstraight. Of course, you’ll need to create the file and enable bsd2 to receive remotemessages from bsd1.
You can use the logger command to test your configuration. For example, youmight use the following to generate a message:
bsd1# logger -p local7.debug "testing"
This is what the file looks like on bsd2:
bsd2# cat bsd1Dec 26 14:22:08 bsd1 jsloan: testing
Notice that both a timestamp and the source of the message have been included inthe file.
There are a number of problems with remote logging. You should be aware thatsyslog uses UDP. If the remote host is down, the messages will be lost. You willneed to make sure that your firewalls pass appropriate syslog traffic. syslog mes-sages are in clear text, so they can be captured and read. Also, it is very easy toforge a syslog message.
It is also possible to overwhelm a host with syslog messages. For this reason, someversions of syslog provide options to control whether information from a remotesystem is allowed. For example, with FreeBSD the -s option can be used to entersecure mode so logging requests are ignored. Alternately, the -a option can beused to control hosts from which messages are accepted. With some versions ofLinux, the -r option is used to enable a system to receive messages over the net-work. While you will need to enable your central logging systems to receive mes-sages, you should probably disable this on all other systems to avoid potentialdenial-of-service attacks. Be sure to consult the manpage for syslogd to find theparticulars for your system.
Both Linux and FreeBSD have other enhancements that you may want to con-sider. If security is a major concern, you may want to investigate secure syslog(ssyslog) or modular syslog (msyslog). For greater functionality, you may also wantto look at syslog-ng.
Log File Management
Even after you have the log files, whether created by syslog or some other pro-gram, you will face a number of problems. The first is keeping track of all thefiles so they don’t fill your filesystem. It is easy to forget fast-growing files, so I

264 Chapter 11: Miscellaneous Tools
This is the Title of the Book, eMatter EditionCopyright © 2007 O’Reilly & Associates, Inc. All rights reserved.
recommend keeping a master list for each system. You’ll want to develop apolicy of what information to keep and how long to keep it. This usually comesdown to some kind of log file rotation system in which older files are discardedor put on archival media. Be aware that what you save and for how long mayhave legal implications, depending on the nature of your organization.
Another issue is deciding how much information you want to record in the firstplace. Many authors argue, with some justification, that you should record any-thing and everything that you might want, no matter how remote the possibility. Inother words, it is better to record too much than to discover, after the fact, that youdon’t have something you need. Of course, if you start with this approach, you cancut back as you gain experience.
The problem with this approach is that you are likely to be so overwhelmed withdata that you won’t be able to find what you need. syslog goes a long way towardaddressing this problem with its support for different security levels—you can sendimportant messages one place and everything else somewhere else. Several utili-ties are designed to further simplify and automate this process, each with its ownset of strengths. These utilities may condense or display log files, often in realtime. They can be particularly useful if you are managing a number of devices.
Todd Atkins’ swatch (simple watcher) is one of the best known. Designed withsecurity monitoring in mind, the program is really suitable to monitor generalsystem activity. swatch can be run in three different ways—making a pass over alog file, monitoring messages as they are appended to a log file, or examining theoutput from a program. You might scan a log file initially to come up-to-date onyour system, but the second usage is the most common.
swatch’s actions include ignoring the line, echoing the line on the controlling ter-minal, ringing the bell, sending the message to someone by write or mail, or exe-cuting a command using the line as an argument. Behavior is determined based ona configuration file composed of up to four tab-separated fields. The first andsecond fields, the pattern expression and actions, are the most interesting. The pat-tern is a regular expression used to match messages. swatch is written in Perl, sothe syntax used for the regular expressions is fairly straightforward.
While it is a powerful program, you are pretty much on your own in setting up theconfiguration files. Deciding what you will want to monitor is a nontrivial task thatwill depend on what you think is important. Since this could be almost anything—errors, full disks, security problems such as privilege violations—you’ll have a lotof choices if you select swatch. The steps are to decide what is of interest, identifythe appropriate files, and then design your filters.
swatch is not unique. xlogmaster is a GTK+ based program for monitoring logfiles, devices, and status-gathering programs. It was written by Georg Greve and is

Log Files and Auditing 265
This is the Title of the Book, eMatter EditionCopyright © 2007 O’Reilly & Associates, Inc. All rights reserved.
available under the GNU General Public License. It provides filtering and displaysselected events with color and audio. Although xlogmaster is no longer beingdeveloped, it is a viable program that you should consider. Its successor is GNUAWACS. AWACS is new code, currently under development, that expands on thecapabilities of xlogmaster.
Another program worth looking at is logcheck. This began as a shell script writtenby Craig Rowland. logcheck is now available under the GNU license from PsionicSoftware, Inc., a company founded by Rowland. logcheck can be run by cronrather than continuously.
You should be able to find a detailed discussion of log file management in anygood book on Unix system administration. Be sure to consult Appendix B formore information.
Other Approaches to Logging
Unfortunately, many services traditionally don’t do logging, either through thesyslog facility or otherwise. If these services are started by inetd, you have acouple of alternatives.
Some implementations of inetd have options that will allow connection logging.That is, each time a connection is made to one of these services, the connection islogged. With inetd on Solaris, the -t option traces all connections. On FreeBSD,the -l option records all successful connections. The problem with this approach isthat it is rather indiscriminate.
One alternative is to replace inetd with Panos Tsirigotis’s xinetd. xinetd is anexpanded version of inetd that greatly expands inetd ’s functionality, particularlywith respect to logging. Another program to consider is tcpwrappers.
tcpwrappers
The tcpwrappers program was developed to provide additional security, includinglogging. Written by Wietse Venema, a well-respected security expert, tcpwrappersis a small program that sits between inetd (or inetd-like programs) and the ser-vices started by inetd. When a service is requested, inetd calls the wrapper pro-gram, tcpd, which checks permission files, logs its actions, and then, ifappropriate, starts the service. For example, if you want to control access to telnet,you might change the line in /etc/inetd.conf that starts the telnet daemon from:
telnet stream tcp nowait root /usr/libexec/telnetd telnetd
to:
telnet stream tcp nowait root /usr/sbin/tcpd telnetd

266 Chapter 11: Miscellaneous Tools
This is the Title of the Book, eMatter EditionCopyright © 2007 O’Reilly & Associates, Inc. All rights reserved.
Now, the wrapper daemon tcpd is started initially instead of telnetd, the telnetdaemon. You’ll need to make similar changes for each service you want to con-trol. If the service is not where tcpd expects it, you can give an absolute path asan argument to tcpd in the configuration file.
Actually, there is an alternative way of configuring tcpwrappers. Youcan leave the inetd configuration file alone, move each service to anew location, and replace the service at its default location withtcpd. I strongly discourage this approach as it can create mainte-nance problems, particularly when you upgrade your system.
As noted, tcpwrappers is typically used for two functions—logging and access con-trol.* Logging is done through syslog. The particular facility used will depend onhow tcpwrappers is compiled. Typically, mail or local2 is used. You will need toedit /etc/syslog.conf and recompile tcpwrappers if you want to change how log-ging is recorded.
Access is typically controlled through the file /etc/hosts.allow, though some systemsmay also have an /etc/hosts.deny file. These files specify which systems can accesswhich services. These are a few potential rules based on the example configuration:
ALL : localhost : allowsendmail : nice.guy.example.com : allowsendmail : .evil.cracker.example.com : denysendmail : ALL : allow
tcpwrappers uses a first match wins approach. The first rule allows all services fromthe local machine without further testing. The next three rules control the sendmailprogram. The first rule allows a specific host, nice.guy.example.com. All hosts onthe domain .evil.cracker.example.com are blocked. (Note the leading dot.) Finally,all other hosts are permitted to use sendmail.
There are a number of other forms for rules that are permitted, but these are allpretty straightforward. The distribution comes with a very nice example file. But,should you have problems, tcpwrappers comes with two utilities for testing config-uration files. tcpdchk looks for general syntax errors within the file. tcpdmatch canbe used to check how tcpd will respond to a specific action. (Kudos to Venemafor including these!)
The primary limitation to tcpwrappers is that, since it disappears after it starts thetarget service, its control is limited to the brief period while it is running. It pro-vides no protection from attacks that begin after that point.
* tcpwrappers provides additional functionality not described here, such as login banners.

NTP 267
This is the Title of the Book, eMatter EditionCopyright © 2007 O’Reilly & Associates, Inc. All rights reserved.
tcpwrappers is a ubiquitous program. In fact, it is installed by default on manyLinux systems. Incidentally, some versions of inetd now have wrappers tech-nology built-in. Be sure to review your documentation.
NTPOne problem with logging events over a network is that differences in systemclocks can make correlating events on different systems very difficult. It is notunusual for the clock on a system to have drifted considerably. Thus, there may bediscrepancies among timestamps for the same events listed in different log files.Fortunately, there is a protocol you can use to synchronize the clocks on yoursystem.
Network Time Protocol (NTP) provides a mechanism so that one system can com-pare and adjust its clock to match another system’s clock. Ideally, you should haveaccess to a very accurate clock as your starting point. In practice, you will havethree choices. The best choice is an authoritative reference clock. These devicesrange from atomic clocks to time servers that set their clocks based on time sig-nals from radios or GPS satellites.
The next best source is from a system that gets its clock setting from one of thesereference clocks. Such systems are referred to as stratum 1 servers. If you can’t getyour signal from a stratum 1 server, the next best choice is to get it from a systemthat does, a stratum 2 server. As you might guess, there is a whole hierarchy ofservers with the stratum number incrementing with each step you take away froma reference clock. There are public time servers available on the Internet withfairly low stratum numbers that you can coordinate to occasionally, but courtesydictates that you ask before using these systems.
Finally, if you are not attached to the Internet, you can elect to simply designateone of your systems as the master system and coordinate all your other systems tothat system. Your clocks won’t be very accurate, but they will be fairly consistent,and you will be able to compare system logs.
NTP works in one of several ways. You can set up a server to broadcast time mes-sages periodically. Clients then listen for these broadcasts and adjust their clocksaccordingly. Alternately, the server can be queried by the client. NTP uses UDP,typically port 123. Over the years, NTP has gone through several versions. Ver-sion 4 is the current one, but Version 3 is probably more commonly used at thispoint. There is also a lightweight time protocol, Simple Network Time Protocol(SNTP), used by clients that need less accuracy. SNTP is interoperable with NTP.
For Unix systems, the most common implementation is ntpd, formerly xntpd,which is described here. This is actually a collection of related programs including

268 Chapter 11: Miscellaneous Tools
This is the Title of the Book, eMatter EditionCopyright © 2007 O’Reilly & Associates, Inc. All rights reserved.
the daemon ntpd and support programs such as ntpq, ntpdate, and ntptrace.You’ll want to start ntpd automatically each time you boot your system. ntpd usesa configuration file, /etc/ntp.conf, to control its operation. This configuration filecan get quite complicated depending on what you want to do, but a basic configu-ration file is fairly simple. Here is a simple three-line example:
server 205.153.60.20logconfig =syncevents +peerevents +sysevents +allclockdriftfile /etc/ntp.drift
The first line identifies the server. This is the minimum you’ll need. The secondestablishes which events will be logged. The last line identifies a drift file. This isused by ntpd to store information about how the clock on the system drifts. Ifntpd is stopped and restarted, it can use the old drift information to help keep theclock aligned rather than waiting to calculate new drift information.
One minor warning about ntpd is in order. If your clock is too far off, ntpd willnot reset it. (Among other things, this prevents failures from propagatingthroughout a network.) This is rarely a problem with computers, but it is notunusual to have a networking device whose clock has never been set. Justremember that you may need to manually set your clock to something reasonablebefore you run ntpd.
ntpdate can be used to do a onetime clock set:
bsd2# ntpdate 205.153.60.20 4 Jan 10:07:36 ntpdate[13360]: step time server 205.153.60.20 offset 11.567081sec
ntpdate cannot be used if ntpd is running, but there shouldn’t be any need for it ifthat is the case.
ntpq can be used to query servers about their state:
bsd2# ntpq -p 172.16.2.1 remote refid st t when poll reach delay offset jitter==============================================================================*ntp.lander.edu .GPS. 1 u 18 64 173 5.000 -1.049 375.210 CHU_AUDIO(1) CHU_AUDIO(1) 7 - 34 64 177 0.000 0.000 125.020 172.16.3.3 0.0.0.0 16 - - 64 0 0.000 0.000 16000.0 172.16.2.2 0.0.0.0 16 u - 64 0 0.000 0.000 16000.0
In this example, we have queried a system for a list of its peers.
ntptrace can be used to discover the chain of NTP servers, i.e., who gets theirsignal from whom:
bsd2# ntptrace 172.16.2.1NLCisco.netlab.lander.edu: stratum 2, offset 0.009192, synch distance 0.00526ntp.lander.edu: stratum 1, offset 0.007339, synch distance 0.00000, refid 'GPS '

Security Tools 269
This is the Title of the Book, eMatter EditionCopyright © 2007 O’Reilly & Associates, Inc. All rights reserved.
Only two servers were involved in this example, but you should get the basicidea.
Each of these tools has other features that are documented in their manpages. NTPcan be an involved protocol if used to its fullest. Fortunately, a lot of documenta-tion is available. Whatever you want—information, software, a list of public NTPservers—the best place to start is at http://www.eecis.udel.edu/~ntp. The work ofDave Mills and others, this is a remarkable site.
Security ToolsA final group of tools that should not be overlooked is security tools. Security, ofcourse, is an essential part of systems management. While this isn’t a book on net-work security, security is so broad a topic that there is considerable overlap with itand the issues addressed in this book. Strictly speaking, a number of the toolsdescribed in this book (such as portscan, nmap, and tcpwrappers) are frequentlydescribed as security tools.
Basically, any tool that provides information about a network has both securityimplications and management potential. So don’t overlook the tools in your secu-rity toolbox when addressing other networking problems. For example, securityscanners like satan, cops, and iss can tell you a lot about how your system isconfigured.
One particularly useful group of tools is system integrity checkers. This class ofprograms tracks the state of your system and allows you to determine what ischanging—such as files, permissions, timestamps. While the security implicationsshould be obvious, management and troubleshooting implications should also beclear. Often described as tools to identify files that intruders have changed, theycan be used to identify files that have been changed or corrupted for any reason.For example, they can be used to determine exactly what is changed when youinstall a new program.
The best known of these is tripwire. It is a considerable stretch to call tripwire anetworking tool, but it is an administrative tool that can make managing a system,whether networked or not, much easier.
tripwire
tripwire was originally written by Eugene Spafford and Gene Kim. It is anotherproduct that has evolved into a commercial product. It is now marketed by Trip-wire, Inc. The original free version is still available at the company’s web site asthe Academic Source Release. The current version, in a slightly modified form, is

270 Chapter 11: Miscellaneous Tools
This is the Title of the Book, eMatter EditionCopyright © 2007 O’Reilly & Associates, Inc. All rights reserved.
also available for free download for Linux. The current version is much easier touse, but the older version is usable if you are willing to take the time to learn it.
tripwire creates a database of information about files on the system including cryp-tographic checksums. A configuration file is used to determine what information iscollected and for which files it is collected. If security is a concern, the collectedinformation should be stored offline to prevent tampering.
As a security tool, tripwire is used to identify any changes that have been made toa compromised host. It doesn’t prevent an attack, but it shows the scope to theattack and changes to the system. As a troubleshooting tool, it can be used to trackany changes to a system, regardless of the cause—hacker, virus, or bit rot. It canalso be used to verify the integrity of transferred files or the consistency of config-urations for multiple installations.
If all you want is a checksum, you might consider just using the siggen program,which comes with tripwire. siggen will generate a number of checksums for a file.Here is an example:
bsd2# siggen siggensig0: nullsig : 0sig1: md5 : 0EpNJLBbf7JJgh1yUdAPgZsig2: snefru : 25I3DS:thJ3N:16UchVdNRsig3: crc32 : 0jeUpKsig4: crc16 : 00056osig5: md4 : 02x6dNiYw7GwjSssW7IeLWsig6: md2 : 30s7ugrC1gLhk129Zo1BXWsig7: sha : EWed2qYLHGcK.i7P7bVDO2mtKvrsig8: haval : 1cqs7t9CwipMcuWPM3eRF1sig9: nullsig : 0
You can use an optional argument to limit which checksums you want. Forexample, the option -13 will calculate just the first and third checksums, the MD5digest and the 32-bit CRC checksum.
I certainly wouldn’t recommend that you install tripwire just for troubleshooting.But if you have installed it as a security tool, something I would strongly recom-mend, then don’t forget that you can use it for these other purposes. Incidentally,with some systems, such as OpenBSD, integrity checking is an integral part of thesystem.
Microsoft WindowsWhen documenting problems with Windows, the usual approach is to open aword processing file and copy and paste as needed. Unfortunately, some tools,such as Event Viewer, will not allow copying. If this is the case, you should look

Microsoft Windows 271
This is the Title of the Book, eMatter EditionCopyright © 2007 O’Reilly & Associates, Inc. All rights reserved.
to see if there is a Save option. With Event Viewer, you can save the messages to atext file and then copy and paste as needed.
If this is not possible, you can always get a screen dump. Unfortunately, the wayto do this seems to change with every version of Windows. Typically, if an indi-vidual window is selected, only that window is captured. If a window is notselected, the screen is copied. For Windows 95 and NT, Shift-PrintScreen (or Ctrl-PrintScreen) will capture the contents of the screen, while Alt-PrintScreen will cap-ture just the current window. For Windows 98, use Alt-PrintScreen. The screen iscopied on the system’s clipboard. It can be viewed with ClipBook Viewer. While itis included with the basic Windows distribution, ClipBook Viewer may not beinstalled on all systems. You may need to go to your distribution disks to install it.With Windows NT, be sure to select Clipboard on the Windows menu. Unfortu-nately, this gives a bitmapped copy of the screen that is difficult to manipulate, butit is better than nothing.
As previously noted, vnc is available for Windows. The viewer is a very small pro-gram—an executable will fit on a floppy so it is very easy to take with you.
There are a number of implementations of ssh for Windows. You might look atMetro State College of Denver’s mssh, Simon Tatham’s putty, or Robert O’Cal-lahan’s ttssh extensions to Takashi Teranishi’s teraterm communications program.If these don’t meet your need, there are a number of similar programs availableover the Web.
Although I have not used them, there are numerous commercial, shareware, andfreeware versions of syslog for Windows. Your best bet is to search the Web forsuch tools. You might look at http://www.loop-back.com/syslog.htm or search forkiwis_syslogd.exe.
ntpd can be compiled for Windows NT. Binaries, however, don’t seem to be gen-erally available. If you just want to occasionally set your clock, you might alsoconsider cyberkit. cyberkit was described in Chapter 6. Go to the Time tab, fill inthe address of your time server, select the radio button SNTP, make sure the Syn-chronize Local Clock checkbox is selected, and click on the Go button. The outputwill look something like this:
Time - Thursday, December 28, 2000 09:02:59Generated by CyberKit Version 2.5Copyright © 1996-2000 by Luc Neijens
Time Server: ntp.netlab.lander.eduProtocol: SNTP ProtocolSynchronize Local Clock: Yes
Leap Indicator 0, NTP Version 1, Mode 4Stratum Level 1 (Primary reference, e.g. radio clock)

272 Chapter 11: Miscellaneous Tools
This is the Title of the Book, eMatter EditionCopyright © 2007 O’Reilly & Associates, Inc. All rights reserved.
Poll Interval 6 (64 seconds), Precision -8 (3.90625 ms)Root Delay 0.00 ms, Root Dispersion 0.00 msReference Identifier GPSTime server clock was last synchronized on Thursday, December 28, 2000 09:02:38
Server Date & Time: Thursday, December 28, 2000 09:02:38Delta (Running slow): 1.590 msRound Trip Time 29 ms
Local clock synchronized with time server
The last line is the one of interest. It indicates that synchronization was successful.The help system includes directions for creating a shortcut that you can click on toautomatically update your clock. Go to the index and look under tips and tricksfor adding cyberkit to the startup menu and under command-line parameters fortime client parameters.
A commercial version of tripwire is available for Windows NT.
273This is the Title of the Book, eMatter Edition
Copyright © 2007 O’Reilly & Associates, Inc. All rights reserved.
Chapter 12
12Troubleshooting
Strategies
While many of the tools described in this book are extremely powerful, no onetool does everything. If you have been downloading and installing these tools asyou have read this book, you now have an extensive, versatile set of tools. Whenfaced with a problem, you should be equipped to select the best tool or tools forthe particular job, augmenting your selection with other tools as needed.
This chapter outlines several strategies that show how these tools can be usedtogether. When troubleshooting, your approach should be to look first at the spe-cific task and then select the most appropriate tool(s) based on the task. I do notdescribe the details of using the tools or show output in this chapter. You shouldalready be familiar with these from the previous chapters. Rather, this chapterfocuses on the selection of tools and the overall strategy you should take in usingthem. If you feel confident in your troubleshooting skills, you may want to skipthis chapter.
Generic TroubleshootingAny troubleshooting task is basically a series of steps. The actual steps you takewill vary from problem to problem. Later steps in the process may depend on theresults from earlier steps. Still, it is worth thinking about and mapping out thesteps since doing this will help you remain focused and avoid needless steps. Inwatching others troubleshoot, I have been astonished at how often people per-form tests with no goal in mind. Often the test has no relation to the problem athand. It is just something easy to do. When your car won’t start, what is the pointof checking the air pressure of the tires?

274 Chapter 12: Troubleshooting Strategies
This is the Title of the Book, eMatter EditionCopyright © 2007 O’Reilly & Associates, Inc. All rights reserved.
For truly difficult problems, you will need to become formal and systematic. Asomewhat general, standard series of steps you can go through follows, along witha running example. Keep in mind, this set of steps is only a starting point.
1. Document. Before you do anything else, start documenting what you aredoing. This is a real test of willpower and self-discipline. It is extremely diffi-cult to force yourself to sit down and write a problem description or takecareful notes when your system is down or crackers are running rampantthrough your system.* This is not just you; everyone has this problem. But it isan essential step for several reasons.
Depending on your circumstances, management may require a written report.Even if this isn’t the usual practice, if an outage becomes prolonged or if thereare other consequences, it might become necessary. This is particularly true ifthere are some legal consequences of the problem. An accurate log can beessential in such cases.
If you have a complex problem, you are likely to forget at some point whatyou have actually done. This often means starting over. It can be particularlyfrustrating if you appear to have found a solution, but you can’t rememberexactly what you did. A seemingly insignificant step may prove to be a keyelement in a solution.
2. Collect information and identify symptoms. Actually, this step is two inter-twined steps. But they are often so intertwined that you usually can’t sepa-rate them. You must collect information while filtering that information forindications of anomalous behavior. These two steps will be repeatedthroughout the troubleshooting process. This is easiest when you have a clearsense of direction.
As you identify symptoms, try to expand and clarify the problem. If theproblem was reported by someone else, then you will want to try to recreatethe problem so that you can observe the symptoms directly. Keep in mind, ifyou can’t recognize normal behavior, you won’t be able to recognize anoma-lous behavior. This has been a recurring theme in this book and a reason youshould learn how to use these tools before you need them.
As an example, the first indication of a problem might be a user complainingthat she cannot telnet from host bsd1 to host lnx1. To expand and clarify theproblem, you might try different applications. Can you connect using ftp? Youmight look to see if bsd1 and lnx1 are on the same network or different net-
* Compromised hosts are a special problem requiring special responses. Documentation can be abso-lutely essential, particularly if you are contemplating legal action or have liability concerns. Documen-tation used in legal actions has special requirements. For more information you might look at SimsonGarfinkel and Gene Spafford’s Practical UNIX & Internet Security or visit http://www.cert.org/nav/recovering.html.

Generic Troubleshooting 275
This is the Title of the Book, eMatter EditionCopyright © 2007 O’Reilly & Associates, Inc. All rights reserved.
works. You might see if lnx1 can reach bsd1. You might include other localand remote hosts to see the extent of the problem.
3. Define the problem. Once you have a clear idea, you can begin coming toterms with the problem. This is not the same as identifying the symptoms butis the process of combining the symptoms and making generalizations. Youare looking for common elements that allow you to succinctly describe theanomalous behavior of a system.
Your problem definition may go through several refinements. Continuing withthe previous problem, you might, over time, generate the following series ofproblem definitions:
• bsd1 can’t telnet to lnx1.
• bsd1 can’t connect to lnx1.
• bsd1 can’t connect to lnx1, but lnx1 can connect to other hosts includingbsd1.
• Hosts on the same network as lnx1 can’t connect to lnx1.
• Hosts on the same network as lnx1 can’t connect to lnx1, but hosts onremote networks can connect to lnx1.
(Yes, this was a real problem, and no, I didn’t get that last one backward.)
It is natural to try to define the problem as quickly as possible, but youshouldn’t be too tied to your definition. Try to keep an open mind and bewilling to redefine your problem as your information changes.
4. Identify systems or subsystems involved. As you collect information, as seen inthe previous example, you will define and refine not only the nature of theproblem, but also the scope of the problem. This is the step in which wedivide and hopefully conquer our problem.
In this example, we have worked outward from one system to include anumber of systems. Usually troubleshooting tries to narrow the scope of theproblem, but as seen from this example, in networking just the opposite mayhappen. You must discover the full scope of the problem before you cannarrow your focus. In this running example, realizing that remote connectionscould connect was a key discovery.
5. Develop a testable hypothesis. Of course, what you can test will depend onwhat tools you have, the rationale for this book. But don’t let tools drive yourapproach. With the definition of the problem and continual refinement comesthe generation of the hypotheses as to the cause or nature of the problem. Suchgeneralizations are relatively worthless unless they can be verified. (Rememberthose lectures on the scientific method in high school?) In this sense, devel-oping a set of tests is more important than having an exact definition of a

276 Chapter 12: Troubleshooting Strategies
This is the Title of the Book, eMatter EditionCopyright © 2007 O’Reilly & Associates, Inc. All rights reserved.
problem. In many instances, if you know the source of the problem, you cancorrect it without fully understanding the problem. For example, if you knowan Ethernet card is failing, you can replace it without ever worrying aboutwhich chip on the card malfunctioned. I’m not suggesting that you don’t wantto understand the problem, but that there are levels of understanding. Yourhypotheses must be guided by what you can test. As in science, an untestablehypothesis is worthless.
In general, you want tests that will reduce the size of the search space (i.e.,identify subsystem involved), that are easy to apply, that do not create furtherproblems, and so on.
In our running example, a necessary first step in making a connection is doingaddress resolution. This suggests that there might be some problem with theARP mechanism. Notice that this is not a full hypothesis, but rather a point offurther investigation. Having expanded the scope of the problem, we areattempting to focus in on subsystems to reduce the problem. Also notice that Ihaven’t used any fancy tools up to this point. Keep it simple as long as youcan.
6. Select and apply tests. Not all tests are created equally. Some will be mucheasier to apply, while others will provide more information. Determining theoptimal order for a set of tests is largely a judgment call. Clearly, the simpletests that answer questions decisively are the best.
Returning to our example, there are several ways we could investigatewhether the ARP mechanism is functioning correctly. One way would be touse tcpdump or ethereal to capture traffic on the network to see if the ARPrequests and responses are present. A simpler test, however, is to use the arpcommand to see if the appropriate entries are in the ARP cache on the hoststhat are trying to connect to lnx1. In this instance, it was observed that theentries were missing from all the hosts attempting to connect to lnx1. Theexception was the router on the network that had a much longer cachetimeout than did the local hosts. This also explained why remote hosts couldconnect but local hosts could not connect. The remote hosts always wentthrough the router, which had cached the Ethernet address bypassing the ARPmechanism. Note that this was not a definitive test but was done first becauseit was much easier.
7. Assess results. As you perform tests, you will need to assess the results, refineyour tests, and repeat the process. You will want new tests that confirm yourresults. This is clearly an iterative process.
With our extended example, two additional tests were possible. One was tomanually add the address of lnx1 to bsd1’s ARP table using the arp com-mand. When this was done, connectivity was restored. When the entry was

Task-Specific Troubleshooting 277
This is the Title of the Book, eMatter EditionCopyright © 2007 O’Reilly & Associates, Inc. All rights reserved.
deleted, connectivity was lost. A more revealing but largely unnecessary testusing packet-capture software to watch the exchange of packets between thebsd1 and lnx1 revealed that bsd1’s ARP requests were being ignored by lnx1.
8. Develop and assess solutions. Once you have clearly identified the problem,you must develop and assess possible solutions. With many problems, therewill be several possible solutions to consider. You should not hastily imple-ment a solution until you have thought out the consequences. With lnx1, solu-tions ranged from rebooting the system to reinstalling software. I chose thesimplest first and rebooted the system.
9. Implement and evaluate your solution. Once you have decided on a solutionand have implemented it, you should confirm the proper operation of yoursystem. Depending on the scope of the changes needed, this may mean exten-sive testing of the system and all related systems.
With our running problem, this was not necessary. Connectivity was fullyrestored when the system was rebooted. What caused the problem? That wasnever fully resolved, but since the problem never recurred, it really isn’t anissue.
If restarting the system hadn’t solved the problem, what would have been thenext step? In this case, the likely problem was corrupted system software. Ifyou are running an integrity checker like tripwire, you might try locating any-thing that has changed and do a selective reinstallation. Otherwise, you maybe faced with reinstalling the operating system.
One last word of warning. It is often tempting to seize on an overly complexexplanation and ignore simpler explanations. Frequently, problems really are com-plex, but not always. It is worth asking yourself if there is a simpler solution.Often, this will save a tremendous amount of time.
Task-Specific TroubleshootingThe guidelines just given are a general or generic overview of troubleshooting. Ofcourse, each problem will be different, and you will need to vary your approachas appropriate. The remainder of this chapter consists of guidelines for a numberof the more common troubleshooting tasks you might face. It is hoped that thesewill give you further insight into the process.
Installation Testing
Ironically, one of the best ways to save time and avoid troubleshooting is to takethe time to do a thorough job of testing when you install software or hardware.You will be testing the system when you are most familiar with the installation

278 Chapter 12: Troubleshooting Strategies
This is the Title of the Book, eMatter EditionCopyright © 2007 O’Reilly & Associates, Inc. All rights reserved.
process, and you will avoid disruptions to service that can happen when aproblem isn’t discovered until the software or hardware is in use.
This is a somewhat broad interpretation of troubleshooting, but in my experience,there is very little difference between the testing you will do when you install soft-ware and the testing you will do when you encounter a problem. Overwhelm-ingly the only difference for most people is the scope of the testing done. Mostpeople will test until they believe that a system is working correctly and then stop.Failures, particularly multiple failures, may leave you skeptical, while some peopletend to be overly optimistic when installing new software.
Firewall testing
Because of the complexities, firewall testing is an excellent example of the prob-lems that installation testing may present. Troubleshooting a firewall is ademanding task for several reasons. First, to avoid disruptions in service, initialfirewall testing should be done in an isolated environment before moving on to aproduction environment.
Second, you need to be very careful to develop an appropriate set of tests so thatyou don’t leave gaping holes in your security. You’ll need to go through a firewallrule by rule. You won’t be able to check every possibility, but you should be ableto test each general type of traffic. For example, consider a rule that passes HTTPtraffic to your web server. You will want to pass traffic to port 80 on that server. Ifyou are taking the approach of denying all traffic that is not explicitly permitted,potentially, you will want to block traffic to that host at all other ports. You willalso want to block traffic to port 80 on other hosts.* Thus, you should develop aset of three tests for this one action. Although there will be some duplicated tests,you’ll want to take the same approach for each rule. Developing an explicit set oftests is the key step in this type of testing.
The first step in testing a firewall is to test the environment in which the firewallwill function without the firewall. It can be extraordinarily frustrating to try todebug anomalous firewall behavior only to discover that you had a routingproblem before you began. Thus, the first thing you will want to do is turn off anyfiltering and test your routing. You could use tools like ripquery to retrieve routingtables and examine entries, but it is probably much simpler to use ping to checkconnectivity, assuming ICMP ECHO_REQUEST packets aren’t being blocked. (Ifthis is the case, you might try tools like nmap or hping.)
You’ll also what to verify that all concomitant software is working. This willinclude all intrusion detection software, accounting and logging software, and
* If you doubt the need for this last test, read RFC 3093, a slightly tongue-in-cheek description of how touse port 80 to bypass a firewall.

Task-Specific Troubleshooting 279
This is the Title of the Book, eMatter EditionCopyright © 2007 O’Reilly & Associates, Inc. All rights reserved.
testing software. For example, you’ll probably use packet capture software liketcpdump or ethereal to verify the operation of your firewall and will want to makesure the firewall is working properly. I hate to admit it, but I’ve started packet cap-ture software on a host that I forgot was attached to a switch and banged my headwondering why I wasn’t seeing anything. Clearly, if I had used this setup to makesure packets were blocked without first testing it, I could have been severelymisled.
Test the firewall in isolation. If you are adding filtering to a production router,admittedly this is going to be a problem. The easiest way to test in isolation is toconnect each interface to an isolated host that can both generate and capturepackets. You might use hping, nemesis, or any of the other custom packet genera-tion software discussed in Chapter 9. Work through each of your tests for eachrule with the rule disabled and enabled. Be sure you explicitly document all yourtests, particularly the syntax.
Once you are convinced that the firewall is working, it is time to move it online. Ifyou can schedule offline testing, that is the best approach. Work through yourtests again with and without the filters enabled. If offline testing isn’t possible, youcan still go through your tests with the filters enabled.
Finally, don’t forget to come back and go through these tests periodically. In par-ticular, you’ll want to reevaluate the firewall every time you change rules.
Performance Analysis and Monitoring
If a system simply isn’t working, then you know troubleshooting is needed. But inmany cases, it may not be clear that you even have a problem. Performance anal-ysis is often the first step to getting a handle on whether your system is func-tioning properly. And it is often the case that careful performance analysis willidentify the problem so that no further troubleshooting is needed.
Performance analysis is another management task that hinges on collecting infor-mation. It is a task that you will never complete, and it is important at every stagein the system’s life cycle. The most successful network administrator will take aproactive approach, addressing issues before they become problems. Chapter 7and Chapter 8 discussed the use of specific tools in greater detail.
For planning, performance analysis is used to compare systems, establish systemrequirements, and do capacity planning and forecasting. For management, it pro-vides guidance in configuring and tuning the system. In particular, the identifica-tion of bottlenecks can be essential for management, planning, andtroubleshooting.

280 Chapter 12: Troubleshooting Strategies
This is the Title of the Book, eMatter EditionCopyright © 2007 O’Reilly & Associates, Inc. All rights reserved.
There are three general approaches to performance analysis—analytical mod-eling, simulations, and measurement. Analytical models are mathematical modelsusually based on queuing theory. Simulations are computer models that attempt tomimic the behavior of the system through computer programs. Measurement is, ofcourse, the collection of data from an existing network. This book has focused pri-marily on measurement (although simulation tools were mentioned in Chapter 9).
Each approach has its role. In practice, there can be a considerable overlap inusing these approaches. Analytical models can serve as the basis for simulations,or direct measurements may be needed to supply parameters used with analyticalmodels or simulations.
Measurement has its limitations. Obviously, the system must exist before measure-ments can be made so it may not be a viable tool for planning. Measurementstend to produce the most variable results. And many things can go wrong withmeasurements. On the positive side, measurement carries a great deal of authoritywith most people. When you say you have measured something, this is treated asirrefutable evidence by many, often unjustifiably.
General steps
Measuring performance is something of an art. It is much more difficult to decidewhat to measure and how to make the actual measurements than it might appearat first glance. And there are many ways to waste time collecting data that will notbe useful for your purposes.
What follows is a fairly informal description of the steps involved in performanceanalysis. As I said before, listing the steps can be very helpful in focusing atten-tion on some parts of the process that might otherwise be ignored.* Of course,every situation is different, so these steps are only an approximation. Designingperformance analysis tests is an iterative process. You should go back throughthese steps as you proceed, refining each step as needed.
1. State your goal. This is the question you want to answer. At this point, it maybe fairly vague, but you will refine it as you progress. You need a sense ofdirection to get started. A common mistake is to allow a poorly defined goalto remain vague throughout the process, so be sure to revisit this step often.Also, try to avoid goals that bias your approach. For instance, set out to com-pare systems rather than show that one system is better than another.
As an example, a network administrator might ask if the network backbone isadequate to support current levels of traffic. While an extremely important
* If you would like a more complete discussion of the steps in performance analysis, you should get RajJain’s exceptional book, The Art of Computer Systems Performance Analysis. Jain’s book considers per-formance analysis from a broader perspective than this book.

Task-Specific Troubleshooting 281
This is the Title of the Book, eMatter EditionCopyright © 2007 O’Reilly & Associates, Inc. All rights reserved.
question, it is quite vague at this point. But stating the goal allows you to startfocusing on the problem. For example, formally stating this problem may leadyou to ask what adequate really means. Or you might go on to consider whatthe relevant time frame is, i.e., what current means.
2. Define your system. The definition of your system will vary with your goal.You will need to decide what parts of the system to include and in whatdetail. You may want to exclude those parts outside your control. If you areinterested in server performance, you will undoubtedly want to consider thevarious subsystems of the server separately—such as disks, memory, CPU, andnetwork interfaces.
With the backbone example, what exactly is the backbone? Certainly it willinclude equipment such as routers and switches, but does it include servers? Ifyou do include servers, you will want to view the server as a single entity, asource or sink for network traffic perhaps, but not component by component.
3. Identify possible outcomes. This step consists of identifying possible answersto the question you want to answer. This is a refinement of Step 1 but shouldbe addressed after the parts of the system are identified. Identifying outcomesestablishes the level of your interest, how much detail you might need, andhow much work you are going to have to do. You are determining the granu-larity of your measurements with this step.
For example, possible outcomes for the question of backbone performancemight be that performance is adequate, that the system suffers minor conges-tion during the periods of heaviest load, or that the system is usually sufferingserious congestion with heavy packet loss. For many purposes, just selectingone of these three answers might be adequate. However, in some cases, youmay want a much more descriptive answer. For example, you may want someestimation of the average utilization, maximum utilization, percent of time atmaximum utilization, or number of lost packets. Ultimately, the degree ofdetail required by the answer will determine the scope of the project. Youneed to make this decision early, or you may have to repeat the project togather additional information.
4. Identify and select what you will measure. Metrics are those system character-istics that can be quantitatively measured. The choice of a metric will dependon the services you are examining. Be careful in your selection. It is oftentempting to go with metrics based on how easy the data is to collect ratherthan on how relevant the data is to the goal. For a network backbone, thismight include throughput, delay, utilization, number of packets sent, numberof packets discarded, or average packet size.

282 Chapter 12: Troubleshooting Strategies
This is the Title of the Book, eMatter EditionCopyright © 2007 O’Reilly & Associates, Inc. All rights reserved.
5. If appropriate, identify test parameters and factors.* Parameters and factors arecharacteristics of the system that affect performance that can be changed.You’ll change these to see what effect they have on the system. Parametersinclude both system and load (or traffic) parameters. Try to be as systematic aspossible in identifying and evaluating parameters to avoid arbitrary decisions.It is very easy to overlook relevant parameters or include irrelevant ones.
For a network backbone, system parameters may include interface speeds andlink speeds or the use of load sharing. For traffic, you might use a tool likemgen to add an additional load. But for simple performance measurement,you may elect to change nothing.
6. Select tools. Once you have a clear picture of what you want to do, it is timeto select the tools of interest. It is all too easy to do this too soon. Don’t let thetools you have determine what you are going to do. Tools for backbone per-formance might include using ntop on a link or SNMP-based tools.
7. Establish measurement constraints. On a production network, establishingconstraints usually means deciding when and where to make your measure-ments. You will also need to decide on the frequency and duration of yourmeasurements. This is often more a matter of intuition than engineering. Thisis something that you will have to do iteratively, adjusting your approachbased on the results you get. Unless you have a very compelling reason, mea-surements should be taken under representative conditions.
For backbone performance, for example, router interfaces are the obviousplaces to look. Server interfaces are another reasonable choice. You may alsoneed to look at individual links as well, particularly in a switched network.You will also need to sample at different times, including in particular thosetimes when the load is heaviest. (Use mrtg or cricket to determine this.) Youwill need to ensure that your measurements have the appropriate level ofdetail. If you have isochronous applications, such as video conferencing, thatare extremely sensitive to delay, five-minute averages will not provide ade-quate information.
8. Review your experimental design. Once you have decided what you want tomeasure and how, you should look back over the process before you begin.Are there any optimizations you can make to minimize the amount of workyou will have to do? Will the measurements you make really answer yourquestions? It is wise to review these questions before you invest large amountsof time.
* Further distinctions between parameters and factors are sometimes made but don’t seem relevant whenconsidered solely from the perspective of measurements.

Task-Specific Troubleshooting 283
This is the Title of the Book, eMatter EditionCopyright © 2007 O’Reilly & Associates, Inc. All rights reserved.
9. Collect data. The single most important consideration in collecting data is thatyou adequately document what you are doing. It is an all too common experi-ence to discover that you have a wonderful collection of data, but you don’tfully know or remember the circumstances surrounding its collection. Conse-quently, you don’t know how to interpret it. If this happens, the only thing youcan do is discard the data and start over. Remember, collecting data is an itera-tive process. You must examine your results and make adjustments as needed.It is too easy to continue collecting worthless data when even a cursory exami-nation of your data would have revealed you were on the wrong track.
10. Analyze data. Once the data is collected, you must analyze, interpret, and actupon your results. This analysis will, of course, depend heavily on the con-text and goals of the investigation. But an essential element is to condense thedata and extract the needed information, presenting it in a concise form. It isoften the case that measurements will create massive amounts of data that aremeaningless until carefully analyzed.
Don’t get too carried away. Often the simplest analyses are of greater valuethan overly complex analyses. Simple analyses can often be more easilyunderstood. But whatever you conclude, you’ll need to do it all again. Systemperformance analysis is a never-ending task.
Bottleneck analysis
Since networks are composed of a number of pieces, if the pieces are not wellmatched, poor performance may depend on the behavior of a single component.Bottleneck analysis is the process of identifying this component.
When looking at performance, you’ll need to be sure you get a complete picture.Generally, one bottleneck will dominate performance statistics. Many systems, how-ever, will have multiple bottlenecks. It’s just that one bottleneck is a little worsethan the others. Correcting one bottleneck will simply shift the problem—the bot-tleneck will move from one component to another. When doing performance mon-itoring, your goal should be to discover as many bottlenecks as possible.
Often identifying a bottleneck is easy. Once you have a clear picture of your net-work’s architecture, topology, and uses, bottlenecks will be obvious. For example,if 90% of your network traffic is to the Internet and you have a gigabit backboneand a 56-Kbps WAN connection, you won’t need a careful analysis to identify yourbottleneck.
Identifying bottlenecks is process dependent. What may be a bottleneck for oneprocess may not be a problem for another. For example, if you are moving smallfiles, the delay in making a connection will be the primary bottleneck. If you aremoving large files, the speed of the link may be more important.

284 Chapter 12: Troubleshooting Strategies
This is the Title of the Book, eMatter EditionCopyright © 2007 O’Reilly & Associates, Inc. All rights reserved.
Bottleneck analysis is essential in planning because it will tell you what improve-ments will provide the greatest benefit to your network. The only real way toescape bottlenecks is to grossly overengineer your network, not something you’llnormally want to do. Thus, your goal should not be to completely eliminate bottle-necks but to minimize their impact to the point that they don’t cause any realproblems. Upgrading the network in a way that doesn’t address bottlenecks willprovide very little benefit to the network. If the bottlenecks on your network are aslow WAN connection and slow servers, upgrading from Fast Ethernet to GigabitEthernet will be a foolish waste of money. The key consideration here is utiliza-tion. If you are seeing 25% utilization with Fast Ethernet, don’t be surprised to seeutilization drop below 3% with Gigabit Ethernet. But you should be aware thateven if the utilization is low, increasing the capacity of a line will shorten down-load times for large files. Whether this is worthwhile will depend on your organi-zation’s mission and priorities.
Here is a rough outline of the steps you might go through to identify a bottleneck:
1. Map your network. The first step is to develop a clear picture of your net-work’s topology. To do this, you can use the tools described in Chapter 6.tkined might be a good choice. Often potential bottlenecks are obvious onceyou have a clear picture of your network. At the very least, you may be ableto distinguish the parts of the network that are likely to have bottlenecks fromparts that don’t need to be examined, reducing the work you will have to do.
2. Identify time-dependent behavior. The problems bottlenecks cause, unless theyare really severe, tend to come and go. The next logical step is to locate themost heavily used devices and the times when they are in greatest use. You’llwant to use a tool like mrtg or cricket to identify time-dependent behavior.(Understanding time-dependent behavior can also be helpful in identifyingwhen you can work on the problem with the least impact on users.)
3. Pinpoint the problems. At this point, you should have narrowed your focus toa few key parts of the network and a few key times. Now you will want todrill down on specific devices and links. ntop is a likely choice at this point,but any SNMP-based tool may be useful.
4. Select the tool. How you will proceed from here will depend on what youhave discovered. It is likely that you will be able to classify the problem asstemming from an edge device, such as a server or a path between devices.Doing so will simplify the decision of what to do next.
If you believe the problem lies with a path, you can use the tools described inChapter 4 to drill down to a specific device or single link. You’ll probablywant to get an idea of the nature of the traffic over the link. ntop is one

Task-Specific Troubleshooting 285
This is the Title of the Book, eMatter EditionCopyright © 2007 O’Reilly & Associates, Inc. All rights reserved.
choice, or you could use a tool like tcpdump, ethereal, or one of the tools thatanalyzes tcpdump traffic.
For a link device like a router or switch, you’ll need to look at basic perfor-mance. SNMP-based tools are the best choice here.
For end devices, you need to look at the performance of the device at eachlevel of the communications architecture. You could use spray to examine theinterface performance. For the stack, you might compare the time betweenSYN and ACK packets with the time between application packets. (Useethereal or tcpdump to collect this information.) The setup times should beindependent of the application, depending only on the stack. If the stackresponds quickly and the application doesn’t, you’ll need to focus on theapplication.
5. Fix the problem. Once you have an idea of the source of the problem, youcan then decide how to deal with it. For poor link performance, you have sev-eral choices. You can upgrade the link bandwidth or alter the networktopology to change the load on the link. Adding interfaces to a server is onevery simple solution. Attaching a server to multiple subnets is a quick way todecrease traffic between those subnets. Policy-based routing is yet anotherapproach. You can use routing priorities to ensure that important traffic is han-dled preferentially.
For an edge device such as an attached server, you’ll want to distinguishamong hardware problems, operating system problems, and application prob-lems, then upgrade accordingly.
Bottleneck analysis is something you should do on an ongoing basis. The urgencywill depend on user perceptions. If users are complaining, it doesn’t matter whatthe numbers say, you have a problem. If users aren’t complaining, your analysis isless pressing but should still be done.
Capacity planning
Capacity planning is an extremely important task. Done correctly, it is also anextremely complex and difficult task, both to learn and to do. But this shouldn’tkeep you from attempting it. The description here can best be described as acrude, first-order approximation of capacity planning. But it will give you a placeto start while you are learning.
Capacity planning is really an umbrella that describes several closely related activi-ties. Capacity management is the process of allocating resources in a cost-efficientway. It is concerned with the resources that you currently have. (As you mightguess, this is closely related to bottleneck analysis.) Trend analysis is the processof looking at system performance over time, trying to identify how it has changed

286 Chapter 12: Troubleshooting Strategies
This is the Title of the Book, eMatter EditionCopyright © 2007 O’Reilly & Associates, Inc. All rights reserved.
in the past with the goal of predicting future changes. Capacity planning attemptsto combine capacity management and trend analysis. The goal is to predict futureneeds to provide for effective planning.
The basic steps are fairly straightforward to describe, just difficult to carry out.First, decide what you need to measure. That means looking at your system inmuch the same way you did with bottleneck analysis but augmenting your anal-ysis with anything you know about the future growth of your system. You’ll needto think about your system in context to do this.
Next, select appropriate tools to collect the information you’ll need. (mrtg andcricket are the most obvious tools among those described in this book, but thereare a number of other viable tools if you are willing to do the work to archive thedata.) With the tools in place, begin monitoring your system, recording andarchiving appropriate data. Deciding what to keep and how to organize it is a tre-mendously difficult problem. Every situation is different. Each situation is largely aquestion of balancing the amount of work involved in keeping the data in anorganized and accessible manner with the likelihood that you will actually use it.This can come only from experience.
Once you have the measurements, you will need to analyze them. In general,focus on areas that show the greatest change. Collecting and analyzing data willbe an iterative process. If little is different from one measurement to the next, thencollect data less frequently. When there is high variability, collect more often.
Finally, you’ll make your predictions and adjust your system accordingly.
There are a number of difficulties in capacity planning. Perhaps the greatest diffi-culty comes with unanticipated, fundamental changes in the way your network isused. If you will be offering new services, predictions based on trends that pre-date these services will not adequately predict new needs. For example, if you areintroducing new technologies such as Internet telephony or video, trend analysisbefore the fact will be of limited value. There is a saying that you can’t predicthow many people will use a bridge by counting how many people are currentlyswimming across the river. If this is the case, about the best you can do is look toothers who have built similar bridges over similar rivers.
Another closely related problem is differential growth. If your network, like most,provides a variety of different services, then they are probably growing at dif-ferent rates. This makes it very difficult to predict aggregate performance or needif you haven’t adequately collected data to analyze individual trends.
Yet another difficulty is motivation. The key to trend analysis is keeping adequaterecords, i.e., measuring and recording information in a way that makes it acces-sible and usable. This is difficult for many people since the records won’t have

Task-Specific Troubleshooting 287
This is the Title of the Book, eMatter EditionCopyright © 2007 O’Reilly & Associates, Inc. All rights reserved.
much immediate utility. Their worth comes from being able to look back at themover time for trends. It is difficult to invest the time needed to collect and main-tain this data when there will be no immediate return on the effort and when fun-damental changes can destroy the utility of the data.
You should be aware of these difficulties, but you should not let them discourageyou. The cost of not doing capacity planning is much greater.


289This is the Title of the Book, eMatter Edition
Copyright © 2007 O’Reilly & Associates, Inc. All rights reserved.
Appendix A
ASoftware Sources
This appendix begins with a brief discussion of retrieving and installing softwaretools. It then provides a list of potential sources for the software. First I describeseveral excellent general sources for tools, then I list specific sources.
Much of this software requires root privileges and could contain dangerous code.Be sure you get your code from reliable sources. Considerable effort has beenmade to provide canonical sources, but no guarantee can be made for the trust-worthiness of the code or the sources listed here. Most of these programs areavailable as FreeBSD ports or Linux packages. I have used them, when available,for testing for this book.
Installing SoftwareI have not tried to describe how to install individual tools in this book. First, in myexperience, a set of directions that is accurate for one version of the software maynot be accurate for the next version. Even more likely, directions for one oper-ating system may fail miserably for another. This is frequently true even for dif-ferent versions of the same operating system. Consequently, trying to develop areasonable set of directions for each tool for a variety of operating systems wasconsidered unfeasible. In general, the best source of information, i.e., the onlyinformation that is likely to be reliable, is the information that comes with the soft-ware itself. Read the directions!
Having said this, I have tried to give some generic directions for installing soft-ware. At best, these are meant to augment the existing directions. They may helpclarify matters when the included directions are a little too brief. These instruc-tions are not meant as replacements.

290 Appendix A: Software Sources
This is the Title of the Book, eMatter EditionCopyright © 2007 O’Reilly & Associates, Inc. All rights reserved.
Installing software has gotten much easier in the last few years, thanks in part toseveral developments. First, GNU configure and build tools have had a tremen-dous impact in erasing the differences created by different operating systems.Second, there have been improvements in file transfer and compression tools aswell as increased standardization of the tools used. Finally, several operating sys-tems now include mechanisms to automate the process. If you can use these, yourlife will be much simpler. I have briefly described three here—the Solaris packagesystem, the Red Hat package manager, and the FreeBSD port system. Please con-sult the appropriate documentation for the details for each.
Generic Installs
Here is a quick review of basic steps you will go through in installing a program.Not every step will be needed in every case. If you have specific directions for aproduct, use those directions, not these! (Although slightly dated, a very compre-hensive discussion can be found in Porting Unix Software by Greg Lehey.)
1. Locate a reliable, trustworthy source for both the software and directions. Usu-ally, the best sources are listed on a web page managed by the author or herorganization.
2. If you can locate directions before you begin, read them first. Typically, basicdirections can be found at the software’s home page. Frequently, however, themost complete directions are included with the software distribution, so youmay need to retrieve and unpack the software to get at these.
3. Download the tool using FTP. You may be able to do this with your webbrowser. Be certain you use a binary transfer if you are doing this manually.
4. Uncompress the software if needed. If the filename ends with .tgz or .gz, usegunzip. These are the two most common formats, but there are other possibil-ities. Lehey’s book contains a detailed list of possibilities and appropriatetools.
5. Use tar to unpack the software if needed, i.e., if the filename ends with .tar.Typically, I use the -xvf options.
6. Read any additional documentation that was included with the distribution.
7. If the file is a precompiled binary, you need only move it to the correct loca-tion. In general, it is safer to download the source code and compile it your-self. It is much harder to hide Trojan horses in source code (but notimpossible).
8. If you have a very simple utility, you may need to compile it directly. Thismeans calling the compiler with the appropriate options. But for all but the

Installing Software 291
This is the Title of the Book, eMatter EditionCopyright © 2007 O’Reilly & Associates, Inc. All rights reserved.
simplest programs, a makefile should be provided. If you see a file namedMakefile, you will use the make command to build the program. It may benecessary to customize the Makefile before you can proceed. If you are lucky,the distribution will include a configure script, a file that, when executed, willautomatically make any needed changes to the Makefile. Look for this scriptfirst. If you don’t find it, look back over your directions for any neededchanges. If you don’t find anything, examine the makefile for embedded direc-tions. If all else fails, you can try running make without making any changes.
9. Finally, you may also need to run make with one or more arguments to finishthe installation, e.g., make install to move the files to the appropriate directo-ries or make clean to remove unused files such as object modules afterlinking. Look at your directions, or look for comments embedded in the make-file.
Hopefully each of these steps will be explained in detail in the documentationwith the software.
Solaris Packages
In Solaris, packages are directories of the files needed to build or run a program.This is the mechanism Sun Microsystems uses to distribute software. If you areinstalling from a CD-ROM, the files will typically be laid out just the way you needthem. You will only need to mount the CD-ROM so you can get to them. If youare downloading packages, you will typically need to unpack them first, usuallywith the tar command. You may want to do this under the default directory /var/spool/pkg, but you can override this location with command options wheninstalling the package.
Once you have the appropriate package on your system, you can use one of sev-eral closely related commands to manage it. To install a package, use the pkgaddcommand. Without any arguments, pkgadd will list the packages on your systemand give you the opportunity to select the package of interest. Alternately, you canname the package you want to install. You can use the -d option to specify a dif-ferent directory.
Other commands include the pkgrm command to remove a package, the pkginfocommand to display information on which packages are already installed on yoursystem, and pkgchk to check the integrity of the package.
For other software in package format, you might begin by looking at http://sunfreeware.com or searching the Web for Sun’s university alliance softwarerepositories. Use the string “sunsite” in your search.

292 Appendix A: Software Sources
This is the Title of the Book, eMatter EditionCopyright © 2007 O’Reilly & Associates, Inc. All rights reserved.
Red Hat Package Manager
Different versions of Linux have taken the idea of packages and expanded on it.Several different package formats are available, but the Red Hat format is probablythe most common. There are several programs for the installation of software in theRPM format. Of these, the Red Hat Package Manager (rpm) is what I generally use.Two other package management tools that provide GUIs include glint and gnorpm.
First, download the package in question. Then, to install a package, call rpm withthe options -ivh and the name of the package. If all goes well, that is all there is toit. You can use the -e option to remove a package.
A variety of packages come with many Linux distributions. Numerous sites on theWeb offer extensive collections of Linux software in RPM format. If you are usingRed Hat Linux, try http://www.redhat.com. Many of the repositories will provideyou with a list of dependencies, which you’ll need to install first.
FreeBSD Ports
Another approach to automating software installation is the port collectionapproach used by FreeBSD. This, by far, is the easiest approach to use and hasbeen adapted to other systems including OpenBSD and Debian Linux. TheFreeBSD port collection is basically a set of directions for installing software. Liter-ally thousands of programs are available.
Software is grouped by category in subdirectories in the /usr/ports directory. Youchange to the appropriate directory for the program of interest and type makeinstall. At that point, you sit back and watch the magic. The port system willattempt to locate the appropriate file in the /usr/ports/distfiles directory. If the fileis not there, it will then try downloading the file from an appropriate site via FTP.Usually the port system knows about several sites so, if it can’t reach one, it willtry another. Once it has the file, it will calculate and verify a checksum for the file.It next applies appropriate patches and checks dependencies. It will automaticallyinstall other ports as needed. Once everything is in place, it will compile the soft-ware. Finally, it installs the software and documentation. When it works, which isalmost always, it is simply extraordinary. The port collection is an installationoption with FreeBSD. Alternately, you can visit http://www.freebsd.org. The pro-cess is described in the FreeBSD Handbook.
When evaluating a new piece of software, I have the luxury of testing the soft-ware on several different platforms. In general, I find the FreeBSD port system theeasiest approach to use. If I have trouble with a FreeBSD port, I’ll look for a Linuxpackage next. If that fails, I generally go to a generic source install. In my experi-ence, Solaris packages tend to be hard to find.

Licenses 293
This is the Title of the Book, eMatter EditionCopyright © 2007 O’Reilly & Associates, Inc. All rights reserved.
Generic SourcesThe Cooperative Association for Internet Data Analysis (CAIDA) maintains anextensive listing of measurement tools on the Web. The page at http://www.caida.org/tools/measurement has a number of tables grouping tools by function. Briefdescriptions of each tool, including links to relevant sites, follow the tables. Thislisting includes both free and commercial tools and seems to be updated on a reg-ular basis. Another CAIDA page, http://www.caida.org/tools/taxonomy/, provides alisting of tools by taxonomy.
Another web site maintaining a list of network-monitoring tools is http://www.slac.stanford.edu/xorg/nmtf/nmtf-tools.html. In general, there are several collaborativeInternet measurement projects that regularly introduce or discuss measurementtools. These include CAIDA and the Stanford Linear Accelerator Center (SLAC),among others.
Other sites that you might want to look at include those that develop tools, suchas http://moat.nlanr.net, http://www-nrg.ee.lbl.gov/, and http://www.merit.edu.Don’t forget special purpose sites. Security sites like http://www.cert.org and http://www.ciac.org/ciac/ may have links to useful tools. Keep your eyes open.
Finally, several RFCs discuss tools. The most comprehensive is RFC 1470. Unfortu-nately, it is quite dated. RFC 1713, also somewhat dated, deals with DNS tools, andRFC 2398 deals with tools for testing TCP implementation.
LicensesAlthough some commercial software has been mentioned, this book has over-whelmingly focused on freely available software. But “freely available” is a veryvague expression that covers a lot of ground.
At one extreme is software that is released without any restrictions whatsoever. Youcan use it as you see fit, modify it, and, in some cases, even try to sell yourenhanced versions. Most of the software described here, however, comes withsome limitations on what you can do with it, particularly with respect to reselling it.
Some of this software is freely available to some classes of users but not to others.For example, some software distinguishes between commercial and noncommer-cial users or between commercial and academic users. For some of the tools, bina-ries are available, but source code is either not available or requires a license.Some of the software exists in multiple forms. For example, there may be bothfree and commercial versions of a tool. Other tools restrict what you do with them.For example, you may be free to use the tool, but you may be expected to shareany improvements you make.

294 Appendix A: Software Sources
This is the Title of the Book, eMatter EditionCopyright © 2007 O’Reilly & Associates, Inc. All rights reserved.
You should also be aware that licensing may change over time. It is notuncommon for a tool to move from the free category to the commercial category,particularly as new, improved versions are released. This seems to be a fairlycommon business model.
I have not attempted to describe the licensing for individual tools. I am not alawyer and do not fully understand all the subtleties of license agreements. Dif-ferent licenses will apply to different organizations in different ways. In somecases, such as when encryption is involved, different countries have laws thatimpact licenses in unusual ways. Finally, license agreements change so frequently,anything I write could be inaccurate by the time you read this.
The bottom line, then, is that you should be sure to check appropriate licensingagreements whenever you retrieve any software. Ultimately, it is your responsi-bility to ensure that your use of these tools is permissible.
Sources for ToolsThis section gives basic information on each tool discussed in this book. I havenot included built-in tools like ps. The tools are listed alphabetically. I have triedto make a note of which tools are specific to Windows, but I did not list Windowstools separately, since many tools are available for both Unix and Windows.
A few tools discussed in the book, particularly older tools, seem to have no realhome but may be available in some archives. This is generally an indication thatthe tool is fading into oblivion and should be used as a last alternative. (Some ofthese tools, however, are alive and well as Linux packages or FreeBSD ports.)While I was writing this book, a number of home pages for tools changed. Also,several of the sites seem to be down more than they are up. I have supplied themost recent information I have, but many of the tools will have moved.
These URLs are nothing more than starting points. If you can’t findthe tool at the URL given here, consider doing an Internet search. Infact, I really recommend doing your own search over using this list. Ifind that I have the most luck with searches if I do a compoundsearch with the tool’s name and the author’s last name.
That one version of a tool is safe, stable, and useful doesn’t meanthe next version won’t have severe problems. New programs areintroduced on an almost daily basis. So keep your eyes open.

Sources for Tools 295
This is the Title of the Book, eMatter EditionCopyright © 2007 O’Reilly & Associates, Inc. All rights reserved.
Analyzer—Piero VianoThis is a protocol analyzer for Windows. (Directions are available only inItalian.) http://netgroup-serv.polito.it/analyzer/
argus—Carter BullardThis is a generic IP network transaction auditing tool. ftp://ftp.sei.cmu.edu/pub/argus-1.5
arping—[email protected] ping-like program uses ARP requests to check reachability. http://synscan.nss.nu/programs.php
arpwatch—Lawrence Berkeley National LaboratoryThis tool watches for new or changed MAC addresses. ftp://ftp.ee.lbl.gov/arpwatch.tar.Z
AWACS—Georg GreveThis is log management software currently under development. http://www.gnu.org/software/awacs/awacs.html
bb—BB4 Technologies, Inc.This is web-based monitoring software. http://www.bb4.com/
bind—University of California at Berkeley and the Internet Software ConsortiumThis is the Berkeley Internet Name Daemon, i.e., domain name server soft-ware. It includes a number of testing tools. http://www.isc.org/products/BIND/
bing—Pierre BeyssacThis tool measures point-to-point bandwidth. http://www.freenix.fr/freenix/logiciels/bing.html
bluebird—Shane O’Donnell et al.This is a general network management applications framework. http://www.opennms.org/
bprobe and cprobeThese tools measure the bandwidth at the slowest link on a path. ftp://cs-www.bu.edu/carter/probes.tar.Z
cheops—Mark SpencerThis is a Linux-based network management platform. http://www.marko.net/cheops/
Chesapeake port scanner—Mentor TechnologiesThis is a simple port scanner for Windows. http://www.mentortech.com/learn/tools/pscan.shtml
clink—Allen DowneyThis is another pathchar variant, a tool for measuring the bandwidth of linkson a path. http://www.cs.colby.edu/~downey/clink/

296 Appendix A: Software Sources
This is the Title of the Book, eMatter EditionCopyright © 2007 O’Reilly & Associates, Inc. All rights reserved.
CMU SNMP—Carnegie Mellon UniversityThis set of SNMP tools has largely been superseded by NET SNMP. They arestill commonly available for Linux. http://www.gaertner.de/snmp/
cpm—CERT at Carnegie Mellon UniversityThis tool checks to see if any interfaces are in promiscuous mode. ftp://info.cert.org/pub/tools/cpm.tar.Z
cricket—Jeff AllenThis tool queries devices, collecting information over time, typically routertraffic, and graphs the collected information. http://cricket.sourceforge.net/
cyberkit—Luc NeijensThis multipurpose Windows-based tool includes ping, traceroute, scanning,and SNMP. It is postcardware. http://www.cyberkit.net
digPart of the bind distribution. This tool retrieves domain name informationfrom a server.
dnsqueryPart of the bind distribution. This tool retrieves domain name informationfrom a server.
dnsutl—Peter MillerThis is a tool to simplify DNS configuration. http://www.pcug.org.au/~millerp/dnsutl/dnsutl.html
dnswalk—David BarrThis tool retrieves and analyzes domain name information from a server. http://www.cis.ohio-state.edu/~barr/dnswalk/
doc—Steve Hotz, Paul Mockapetris, and Brad KnowlesThis tool retrieves and analyzes domain name information from a server.
dsniff—Dug SongThis is a set of utilities that can be used to test or breach the security on yoursystem. http://naughty.monkey.org/~dugsong/dsniff/
echoping—Stéphane BortzmeyerThis is an alternative to ping that uses protocols other than ICMP. ftp://ftp.internatif.org/pub/unix/echoping/
egressor—MitreThis tool set verifies that your router will not forward packets with spoofedaddresses. http://www.packetfactory.net/Projects/Egressor/
ethereal—Gerald Combs et al.This is a protocol analyzer that runs under X Window and Windows. Itrequires GTK+, which in turn requires GLIB. http://www.ethereal.com

Sources for Tools 297
This is the Title of the Book, eMatter EditionCopyright © 2007 O’Reilly & Associates, Inc. All rights reserved.
fping—Roland J. SchemersThis is a ping variant that can check multiple systems in parallel. http://www.fping.com
fressh—FreSSH OrganizationThis is another alternative to ssh. http://www.fressh.org/
getif—Philippe SimonetThis is a multipurpose Windows tool that uses SNMP. http://www.geocities.com/SiliconValley/Hills/8260/
gimpThis is an image manipulation program. It is also available for Windows. http://www.gimp.org/
GTK+—Peter Mattis, Spencer Kimball, and Josh MacDonaldThis is a GUI development toolkit. Its libraries may be needed by other tools.http://www.gtk.org/
gtkportscan—Rafael BarreroThis is a port scanner that is written in GTK+. The last reported site was http://armageddon.splorg.org/gtkportscan/.
GxSNMPThis is a network management applications framework. http://www.gxsnmp.org/
h2nThis Perl tool translates a host table to name server file format. ftp://ftp.uu.net/published/oreilly/nutshell/dnsbind/dns.tar.Z
hostPart of the bind distribution. This tool retrieves domain name informationfrom a server.
hpingSalvatore Sanfilippo. This tool sends custom packets and displays responses.http://www.kyuzz.org/antirez/software.html
iperf—Mark Gates and Alex WarshavskyThis is a tool for measuring TCP and UDP bandwidth. http://dast.nlanr.net/Projects/Iperf/
ipfilter—Darren ReedThis is a set of programs to filter TCP/IP packets. It includes ipsend, a tool tosend custom packets. http://coombs.anu.edu.au/~avalon/ip-filter.html
ipload—BTT SoftwareThis is a load generator for Windows. http://www.bttsoftware.co.uk/ipload.html

298 Appendix A: Software Sources
This is the Title of the Book, eMatter EditionCopyright © 2007 O’Reilly & Associates, Inc. All rights reserved.
ipsend—Darren ReedThis tool is part of the ipfilter package. http://coombs.anu.edu.au/~avalon/ip-filter.html
lamers—Bryan BeecherThis tool checks for lame delegations in a DNS database. Its current officiallocation is unknown. The last reported official site: ftp://terminator.cc.umich.edu/dns/lame-delegations. I found links to copies at http://www.dns.net/dnsrd/tools.html.
logcheck—Craig RowlandThis log management tool is suitable for use with syslog files. http://www.psionic.com/abacus/logcheck/
lsof—Victor AbellThis tool lists open files on a Unix system. ftp://vic.cc.purdue.edu/pub/tools/unix/lsof/
MGEN—Brian Adamson and Naval Research LaboratoryThis tool set generates and receives traffic. It is used primarily for load testing.http://manimac.itd.nrl.navy.mil/MGEN/
mon—Jim TrockiThis is a general purpose resource-monitoring system for host and serviceavailability. http://www.kernel.org/software/mon/
mrtg—Tobias Oetiker and Dave RandThis tool queries devices, collects information over time (typically routertraffic) and graphs collected information. http://ee-staff.ethz.ch/~oetiker/webtools/mrtg/
mssh—Metro State College of DenverThis is a version of ssh for Windows. http://cs.mscd.edu/MSSH/index.html
msyslog—Core SDIThis is modular syslog, a replacement for secure syslog. http://www.core-sdi.com/english/freesoft.html
nam—Steven McCanne and VINTThis is a Tcl/Tk-based network visualization and animation tool. http://www.isi.edu/nsnam/nam/
nemesis—[email protected] tool generates a wide variety of custom IP packets. http://www.packetninja.net/nemesis/
nessus—Jordan Hrycij and Renaud DeraisonThis is a security scanning and auditing tool. http://www.nessus.org/

Sources for Tools 299
This is the Title of the Book, eMatter EditionCopyright © 2007 O’Reilly & Associates, Inc. All rights reserved.
NET SNMP—Wes HardakerThis is an updated version of CMU SNMP. It is postcardware. http://net-snmp.sourceforge.net/
netcat—[email protected] simple utility reads and writes data across network connections. It isavailable for both Unix and Windows. http://www.canonware.com/canonware/and http://www.l0pht.com/~weld/netcat/
netmonSupplied with Microsoft NT Server. This is network-monitoring software. Abasic, stripped-down version of the netmon.exe program is supplied withMicrosoft NT Server. The full version is part of Microsoft’s System Manage-ment Server.
netperf—Hewlett-PackardThis is network benchmarking and performance measurement software. http://www.netperf.org/netperf/NetperfPage.html
nfswatch—Dave Curry and Jeff MogulThis is a tool for watching NFS traffic. The last known site was ftp://ftp.cerias/purdue.edu/pub/tools/unix/netutils/nfswatch/.
nhfsstone—Legato SystemsThis is a tool for benchmarking NFS traffic. Current availability is unknown,but it was originally from www.legato.com.
NIST Net—National Institute of Standards and TechnologyThis is a network emulation package that runs on Linux. http://is2.antd.nist.gov/itg/nistnet/
nmap—[email protected] is a general scanning and probing tool with lots of functionality includingOS fingerprinting. http://www.insecure.org/nmap
nocol—Netplex Technologies, Inc.This is system- and network-monitoring software. http://www.netplex-tech.com/software/nocol/
ns—Steven McCanne, Sally Floyd, and VINTThis is a network simulator for protocol performance and scaling. http://www.isi.edu/nsnam/ns/
nslookupPart of the bind distribution. This tool retrieves domain name informationfrom a server.

300 Appendix A: Software Sources
This is the Title of the Book, eMatter EditionCopyright © 2007 O’Reilly & Associates, Inc. All rights reserved.
ntop—Luca DeriThis is a versatile tool for monitoring network usage. http://www.ntop.org/ntop.html
ntpd—David MillsThis is a collection of tools to set and coordinate system clocks using NTP.http://www.eecis.udel.edu/~ntp/
opensshThis is another version of ssh. http://www.openssh.com/
p0f—Michal ZalewskiThis is a passive stack fingerprinting system. http://lcamtuf.hack.pl/p0f-1.7.tgz
pathchar—Van JacobsonThis program measures the bandwidth of the links along a network path. ftp://ftp.ee.lbl.gov/ or http://ee.lbl.gov/
pchar—Bruce MahThis tool is a reimplementation of pathchar. http://www.employees.org/~bmah/Software/pchar/
portscan—Tennessee Carmel-VeilleuxThis is a simple port scanner. http://www.ameth.org/~veilleux/portscan.html
putty—Simon TathamThis is a Windows implementation of ssh. http://www.chiark.greenend.org.uk/~sgtatham/putty/
Qcheck—GanymedeThis is a Windows network benchmarking tool. http://www.qcheck.net
queso—[email protected] is an OS fingerprinting tool. http://savage.apostols.org/projects.html
ripqueryPart of the gated distribution. This tool retrieves the routing table from asystem running RIP. http://www.gated.org/
rrd—Tobias OetikerThis is a round-robin database system useful for collecting and archiving dataover time. http://ee-staff.ethz.ch/~oetiker/webtools/rrdtool/
rtqueryPart of the routed distribution. This is a tool for retrieving the routing tablefrom a system running RIP.
samspade—Steve AtkinsThis is a multipurpose Windows tool with a wide range of features. http://samspade.org/ssw/

Sources for Tools 301
This is the Title of the Book, eMatter EditionCopyright © 2007 O’Reilly & Associates, Inc. All rights reserved.
Sanitize—Vern PaxsonThis is a set of Bourne scripts that use the standard Unix utilities sed and awk.It is used to clean up tcpdump traces to ensure privacy. http://ita.ee.lbl.gov/html/contrib/sanitize.html
scion—Merit Networks, Inc.This is network statistics collection and reporting software (also calledNetSCARF.) It is also available for Windows. http://www.merit.edu/internet/net-research/netscarf/
scotty—Jürgen SchönwälderThis provides network management extension to the Tcl/Tk language. http://wwwhome.cs.utwente.nl/~schoenw/scotty/
SFS—SPECThis is a commercial (but nonprofit) NFS benchmark. http://www.spec.org
siphon—Subterrain Security GroupThis is a passive OS fingerprinter. The last known site was http://www.subterrain.net/projects/siphon/.
sl4nt—Franz KrainerThis is a Windows replacement for syslogd. http://www.netal.com/SL4NT03.htm
SNMP for Perl 5—Simon LeinenThis is a package of Perl 5 modules providing SNMP support. http://www.switch.ch/misc/leinen/snmp/perl/
sock—W. Richard StevensThis is a tool for generating traffic. It is a companion tool for Steven’s book,TCP/IP Illustrated, vol. 1, The Protocols. ftp://ftp.uu.net/published/books/stevens.tcpipiv1.tar.Z
socket—Juergen NickelsenThis program creates a TCP socket connected to stdin and stdout. http://home.snafu.de/jn/socket/
spidermap—H. D. MooreThis is a set of Perl scripts for network scanning. http://www.secureaustin.com
sprayThis tool sends a burst of packets for load testing typically included with manysystems.
ssh—Tatu YlönenThis is a secure replacement for r-services. http://www.ssh.com/
ssyslog—Core SDIThis is a secure replacement for syslog. It has been replaced by modularsyslog. http://www.core-sdi.com/english/freesoft.html

302 Appendix A: Software Sources
This is the Title of the Book, eMatter EditionCopyright © 2007 O’Reilly & Associates, Inc. All rights reserved.
strobe—Julian AssangeThis program locates all listening TCP ports on a remote machine. The lastknown official site was ftp://suburbia.net/pub/strobe.tgz.
swatch—Todd AtkinsThis log management tool is suitable for use with syslog files. http://www.stanford.edu/~atkins/swatch/
syslog-ng—BalaBit IT Ltd.This is an enhanced syslog that features filtering and sorting logs to differentdestinations. http://www.balabit.hu/en/products/syslog-ng/
Tcl/Tk—John OusterhoutThis is a general scripting language that has been extended to support manynetwork management tasks. http://dev.scriptics.com
tcpdpriv—Greg MinshallThis program sanitizes tcpdump trace files. http://ita.ee.lbl.gov/html/contrib/tcpdpriv.html
tcpdump—Van Jacobson, Craig Leres, and Steven McCanneThis is command-line–based packet capture program. http://ee.lbl.gov/, http://www.tcpdump.org, or ftp://ftp.ee.lbl.gov/tcpdump.tar.Z
tcpflow—Jeremy ElsonThis is a capture program that separates traffic into individual flows. http://www.circlemud.org/~jelson/software/tcpflow
tcp-reduce—Vern PaxsonThe program tcp-reduce and its companion program tcp-summary are Bourneshell scripts used to selectively extract information from tcpdump trace files.http://ita.ee.lbl.gov/html/contrib/tcp-reduce.html
tcpshow—Mike RyanThis program reads and decodes tcpdump files. The official home for this isunknown, but it is available in several archives such as http://www.cerias.purdue.edu/coast/archive/.
tcpslice—Vern PaxsonThis tool is used to create subsets of tcpdump trace files. ftp://ftp.ee.lbl.gov/tcpslice.tar.Z or http://www.tcpdump.org/related.html
tcp-summary—Vern PaxsonThe program tcp-reduce and its companion program tcp-reduce are Bourneshell scripts used to selectively extract information from tcpdump trace files.http://ita.ee.lbl.gov/html/contrib/tcp-reduce.html
tcptrace—Shawn OstermannThis is a tcpdump trace analysis program. http://www.tcptrace.org

Sources for Tools 303
This is the Title of the Book, eMatter EditionCopyright © 2007 O’Reilly & Associates, Inc. All rights reserved.
tcpwrappers—Wietse VenemaThis daemon sits between user and services to log and manage connections.ftp://ftp.porcupine.org/pub/security/index.html
teraterm—T. TeranishiThis is a Windows telnet client that can be extended to support SSH. (See alsoTTSSH.) http://hp.vector.co.jp/authors/VA002416/teraterm.html
tjping—Top JimmyThis is a ping and traceroute program for Windows. http://www.topjimmy.net/tjs/
tkined—Jürgen SchönwälderThis provides a network management program based on scotty and Tcl/Tk.http://wwwhome.cs.utwente.nl/~schoenw/scotty/
tmetric—Michael BacarellaThis tool finds available bandwidth. http://netgraft.com/downloads/tmetric/
top—William LeFebvreThis displays the most active processes on a system. http://www.groupsys.com/top/about.html
traceroute—Van JacobsonThis reconstructs the route taken by packets over a network. It is probablysupplied with your system. ftp://ftp.ee.lbl.gov/ or http://ee.lbl.gov/
trafshow—Vladimir VorobyevThis full screen traffic capture program gives a continuous update on networktraffic. Its last reported site was http://www.rinetsoft.nsk.su/trafshow/index_en.html.
trayping—Mike GleasonThis is a Windows tool that monitors connectivity using ping. http://www.ncftpd.com/winstuff/trayping/
treno—Matt MathisThis is a tool to measure the bulk transfer capacity. ftp://ftp.psc.edu/pub/net_tools/
tripwire—Eugene Spafford and Gene KimThis is a system integrity checker. http://www.tripwire.com or http://www.tripwire.org
ttcp—Mike MuussThis is a load testing program for TCP. ftp://ftp.arl.mil/pub/ttcp/ttcp.c
TTSSHThis is a set of SSH extensions for Windows telnet program, teraterm. http://www.zip.com.au/~roca/ttssh.html

304 Appendix A: Software Sources
This is the Title of the Book, eMatter EditionCopyright © 2007 O’Reilly & Associates, Inc. All rights reserved.
vnc—AT&T Laboratories, CambridgeThis tool displays X Window and Windows desktops on remote systems. http://www.uk.research.att.com/vnc/
WinDump and WinDump95—Loris Degioanni, Piero Viano, and Fulvio RissoThese are ports of tcpdump to Windows NT and Windows 95/98. http://netgroup-serv.polito.it/windump/
winping—Rich MorganThis is another ping utility for Windows. http://www.cheap-price.com/winping/
xinetd—Panos TsirigotisThis is a secure replacement for the inetd utility. http://www.synack.net/xinetd/
xlogmaster—Georg GreveThis is Greve’s older log management software. You may want to check onthe status of AWACS before using it. http://www.gnu.org/software/xlogmaster/
xplot—David ClarkA tool for graphing data in an X Window environment. There are several pro-grams with this name, so be sure you have the right one. ftp://mercury.lcs.mit.edu/pub/shep/
xv—John BradleyThis is a modestly priced shareware program for the interactive display ofimages from an X Window system. You should probably try gimp first. ftp://ftp.cis.upenn.edu/pub/xv

305This is the Title of the Book, eMatter Edition
Copyright © 2007 O’Reilly & Associates, Inc. All rights reserved.
Appendix B
BResources and
References
A good network administrator is part librarian. Anyone who thinks he can learneverything he needs in this profession from a single book, or even a couple ofdozen books, is lost in a fantasy world. This appendix is designed to get you up tospeed quickly, but professional growth is a never-ending task. I am not attemptingto be exhaustive or definitive here. I’m just trying to give some starting places thathave worked for me. This is a personal overview of my favorites.
Sources of InformationWhile this appendix is devoted primarily to books, there is a variety of otherobvious resources. You should already be familiar with most, but the followingchecklist may be useful in jogging your memory. It is in no particular order.
User groupsThese seem less popular than they once were, but they still exist. For systemadministrators, USENIX at http://www.usenix.org and SAGE at http://www.sage.org are two good places to start.
Mailing listsThere are thousands of these. Finding ones that are helpful can be painful. Beprepared to subscribe, lurk, and then unsubscribe to a number of different lists(or visit their archives). Follow a list for a while before you start posting to thelist.
NewsgroupsKeep in mind that you may find an answer in related groups. Your Solarisproblem may be answered in a Linux newsgroup posting. A quick search ofDeja News can sometimes be helpful.

306 Appendix B: Resources and References
This is the Title of the Book, eMatter EditionCopyright © 2007 O’Reilly & Associates, Inc. All rights reserved.
Vendor web sitesIn networking and telecommunication, a vendor that doesn’t maintain a rea-sonable web site probably should be avoided. This is the most obvious way todisseminate information about their products. Some vendors have excellentproblem resolution sites, such as Microsoft’s TechNet. Other sites, like Cisco’s,contain such a staggering amount of information that whatever you want isthere, but it can take forever to find it. Be prepared to spend a lot of timesearching wherever you go.
Software web sitesDon’t forget the home pages for software, particularly operating systems. It iseasy to forget about sites like http://www.linux.org and http://www.freebsd.org.And even minor tools may have a site devoted exclusively to them.
ChatroomsFrankly, I don’t have time for chatrooms, but some people find them useful,particularly those devoted to specific pieces of software.
FAQ listThis is often an excellent starting point, particularly when you are installingnew software. Keep in mind these may change frequently, so make sure youare looking at a current list.
README filesIn the rush to get things running, many people skip these. If everythingappears to work, they never go back. Don’t forget to look at these even if youdon’t have a problem.
Comments in makefiles and source codeThis is a long shot, but if you are using open source software, there is an offchance you can find something of value.
Service contractsFor some reason, some timid people seem reluctant to use their service con-tracts. If you have paid for a service contract, you should not be intimidatedfrom placing reasonable calls.
I always try to get an idea of what resources the technicians are using toanswer my questions. I’ve had technicians send me some truly remarkable“internal” documents. Before I hang up, I always try to ask how I could haveresolved the question without calling them. Most technicians seem delightedto answer that question.
Formal trainingThis could be from the vendor or from a third party. This is a big business,particularly with the recent trend toward certification. Short courses can bevery focused-providing exactly what you need. Beware, these courses can be

Sources of Information 307
This is the Title of the Book, eMatter EditionCopyright © 2007 O’Reilly & Associates, Inc. All rights reserved.
quite expensive and what you learn can become dated very quickly. Somecompanies, e.g., Microsoft and Novell, now cancel certification if you don’trecertify within an established time limit.
Formal courses at colleges and universities tend to be more general and, con-sequently, often remain relevant for a much longer period of time. I wouldrecommend a formal degree over certification any day, but I’m biased. Somepotential employers may have different biases.
Printed and online vendor documentationThe undeniable trend is toward putting as much online as possible. Thisreduces costs and allows the user to search the material. With Unix, onlinemanpages accessible through the man command are universally available.Recently, there has been a movement toward alternatives such as info pages,HOWTOs, AnswerBooks, and web-based documentation. Use whatever isappropriate to your system, but consider buying printed copies. I kill a lot oftrees printing online documentation. I want something I can read in comfortand something I can write on. And then when I can’t find what I’ve printed, Iprint it again, and again, and . . . .
Diagnostic softwareThis is often provided by the vendor with the initial purchase of their soft-ware or equipment or as downloads from their web site. It can supply theanswer to your question. However, diagnostic software is often limited in whatit can test. A clean bill of health from diagnostic software does not necessarilymean that there isn’t a problem with the vendor’s product.
HelpdesksKeep in mind that many people use these in place of reading the documenta-tion. The first person you talk to probably won’t be very helpful (unless youdidn’t read the documentation). With perseverance, it is usually possible to getyour call escalated a couple of times so that you end up talking to someonewho is helpful. Be prepared to be on the phone for a while. And be polite!
Magazines and journalsFor me, these are most useful for tutorials on new topics and for productreviews. I read NetworkWorld for general news and NetworkMagazine andIEEE Computer for articles with a little more depth. Cisco’s Internet ProtocolJournal is also a favorite. I also enjoy Wired. (Just don’t believe everythingyou read in it.) Don’t overlook business magazines. Knowing what company isabout to fold can save you from making a costly mistake. Both the ACM andIEEE have online searches for registered users. For less technical information,Computer Select is an excellent (but expensive) source of information.

308 Appendix B: Resources and References
This is the Title of the Book, eMatter EditionCopyright © 2007 O’Reilly & Associates, Inc. All rights reserved.
e-magazines and magazine web sitesThere are a number of magazines or similar sites published online that youshould not forget. These include http://www.bsdtoday.com, http://www.linuxgazette.com, and http://www.oreillynet.com/meerkat/ among others. Also,many print magazines have web sites with back issues online. These sites,since the content has been edited and reviewed, are my first choice whensearching the Web. Try http://sw.expert.com, http://www.sunworld.com, http://www.networkworld.com, and http://www.networkmagazine.com for starters.Microsoft Windows users might try http://www.zdnet.com/pcmag/. There aremany, many more.
Trade showsWhile the first person you’re likely to talk to will be a sales rep, there is prob-ably a technical person lurking somewhere in the background to help outwhen the rep discovers she is out of her depth. This may be your only realchance to meet face-to-face with someone technically involved in a product.
Friends, colleagues, and teachersAsk yourself who you know who might be able to help. But remember this isa two-way street, so be prepared to help others in the future. Alwaysremember, even the best expert will sometimes provide poor advice.
Other network managers and administratorsPeople at similar institutions are often willing to share information. It’s better,of course, to build a network of contacts before you need them. In particular,your predecessor, if he left on good terms, can be an ideal contact.
While these might be obvious resources, it is not uncommon to overlook one ormore of them when trying to solve some hairy problem. You may want to high-light this list and add to it in the margin. Many of these sources have standards ofetiquette that should be observed. Don’t abuse them! Even if you are paying forthe call and your contact can’t answer your question, try to remain pleasant. Saveyour hostilities for calls from telemarketers.
References by TopicThis section describes books grouped by topic. Full bibliographical citationsfollow. Online sites like http://www.amazon.com and http://www.bn.com havereplaced Books in Print for me. They make it easy to find out what is available forwhatever topic I’m interested in. Bookstores and libraries are the best ways to seeif a book is really useful. Even well-intentioned advertisements and reviews can bevery misleading.
Often there is a lot of consistency, for better or worse, among books from thesame publisher, so you may want to visit their web sites as well. For example, the

References by Topic 309
This is the Title of the Book, eMatter EditionCopyright © 2007 O’Reilly & Associates, Inc. All rights reserved.
majority of the books mentioned here are O’Reilly books because O’Reilly & Asso-ciates has specialized in Unix tool books longer than anyone else. Addison WesleyLongman does a very good job with some of the more theoretical treatments ofprotocols. Prentice Hall is a reliable source for textbooks on network relatedtopics.
System Management
This book assumes that you understand the basics of system administration. If thisisn’t the case, you should consider several books. My top choices are Unix SystemAdministration Handbook by Nemeth et al. and Essential System Administrationby Frisch. Both provide extensive overviews of the tasks system administratorsface. For general tools, you may want to look at Unix Power Tools by Peek, et al.
TCP/IP
You aren’t going to get very far dealing with TCP/IP without a thorough under-standing of the protocols. There are actually several approaches you can take,depending on your goal. The definitive treatments are in the relevant RFCs. Theseare probably too terse for most readers. They are certainly not where you willwant to start if you are new to TCP/IP. (If you do use them, be sure to check theRFC-INDEX so that you are using the current version.)
If your goal is TCP/IP administration, then there are two paths you can take. TCP/IP Network Administration by Craig Hunt is an excellent general introduction. (PCusers should look at Networking Personal Computers with TCP/IP by Hunt.) Alter-natively, you might want to go to vendor-specific documentation for the operatingsystem you are dealing with. These won’t teach you the theory, but they will tellyou enough to get something done.
If you want a general introduction to the TCP/IP protocol, there are several rea-sonable books. One good choice is Eric Hall’s Internet Core Protocols: The Defini-tive Guide. This will give you a fairly complete picture that should meet yourneeds for quite a while. The book comes with Shomiti’s Surveyor Lite on a CD-ROM in the back. This is a good place to start for most network administrators.
If you want a treatment with all the details of the protocols, and you are willing toput out the effort needed, there are two sets of books you should consider. Inter-networking with TCP/IP by Douglas Comer et al. and TCP/IP Illustrated by W.Richard Stevens et al. Both are multi-volume sets running about 2000 pages perset. You’ll get a pretty complete picture if you just read the first volume of either.Comer is somewhat more descriptive of general behavior and gives a better senseof history. His book is also a little more current. Stevens takes a hands-on, experi-mental approach, looking closely at the behavior of the protocols. You’ll see more

310 Appendix B: Resources and References
This is the Title of the Book, eMatter EditionCopyright © 2007 O’Reilly & Associates, Inc. All rights reserved.
of the details in his book. Because of the sheer size of these, you’ll need a highdegree of commitment to make it through either.
Finally, if you want a good overview of routing algorithms, take a look at Per-lman’s Interconnections or Huitema’s Routing in the Internet. Both are consider-ably more theoretical than most of the books listed here, but quite worthwhile.
Specific Protocols
When it comes to specific protocols, there are a number of books on each andevery protocol. Here a few suggestions to get you started:
DNSFor name services, DNS and BIND by Liu et al. is the standard.
EthernetFor a complete overview of Ethernet, the place to start is Spurgeon’s Ethernet:The Definitive Guide. For Fast Ethernet and Gigabit Ethernet, you may want toadd Gigabit Etherenet by Kadambi et al. to your collection.
EmailBasic administration is discussed in the books listed under system administra-tion and will probably meet your needs. The most commonly cited book onsendmail is sendmail by Costales et al. For IMAP, you might consider Man-aging IMAP by Mullet and Mullet.
NFSFor NFS, you have a couple of choices. If you want to understand the innerworking, consider Callaghan’s NFS Illustrated. If you want to get NFS working,consider Stern’s Managing NFS and NIS.*
PPPPPP Design and Debugging by Carlson is the best book on the internals. Sun’sUsing & Managing PPP is the place to turn to get PPP up and running.
SNMPThere are a number of books on SNMP, none perfect. I think Held’s LAN Man-agement with SNMP and RMON and Network Management: A Practical Per-spective by Leinwand and Conroy are readable introductions. Udupa’s NetworkManagement Systems Essentials does a very nice job of describing the stan-dard MIB objects but is awfully dry reading. You may also want to visit http://www.simple-times.org/, an online magazine devoted to SNMP. If you are usingWindows, you’ll want to consider Murry’s Windows NT SNMP.
* At the time this was written, the current version of Stern’s book was quite dated but a second editionwas in the works and is probably now available.

References by Topic 311
This is the Title of the Book, eMatter EditionCopyright © 2007 O’Reilly & Associates, Inc. All rights reserved.
SSHGet Barrett and Silverman’s SSH, the Secure Shell: The Definitive Guide.
Web protocolsFor an overview of a number of web services, consider getting ManagingInternet Information Services by Liu et al.
There are a lot of other books out there, so keep your eyes open.
Performance
Performance is a difficult area to master and requires a lot of practical experience.Jain’s The Art of Computer Systems Performance Analysis is a truly outstandingintroduction to the theory and practice of performance analysis. But it won’tsupply you with much information on the tools you’ll need. As a network adminis-trator, you’ll need to know the basics of system administration. For a practicalintroduction, you’ll want to get Loukides’ System Performance Tuning. This is pri-marily oriented to system administrators rather than network administrators, but itis a good place to start.
Troubleshooting
The definitive book on troubleshooting has yet to be written. I doubt it ever willbe considering the breadth of the subject. One of the goals of this book is to intro-duce you to tools you can use in troubleshooting. But this is only one aspect oftroubleshooting. There are other tool books, most notably Maxwell’s Unix Net-work Management Tools. There is considerable overlap between this book andMaxwell’s. This book covers considerably more tools, but Maxwell’s providesgreater depth and a different perspective on some of the tools. Both are worthhaving.
There are several other worthwhile books. Haugdahl’s Network Analysis and Trou-bleshooting is a good overview, but more details would have been nice. Miller hasseveral useful books. Two you might want to consider are LAN TroubleshootingHandbook and Troubleshooting TCP/IP.
Wiring
While this is a little off topic for this book, you won’t get very far without goodwiring. For a general introduction, look at LAN Wiring: An Illustrated Guide toNetwork Cabling by Trulove or, my personal favorite, Cabling: The CompleteGuide to Network Wiring by Groth and McBee. For a more formal treatment, theTIA/EIA standards for cabling are available from Global Engineering Documents(http://www.global.ihs.com/). The two that are most useful are TIA/EIA–606,

312 Appendix B: Resources and References
This is the Title of the Book, eMatter EditionCopyright © 2007 O’Reilly & Associates, Inc. All rights reserved.
which discusses labeling and TIA/EIA–568–A, which discusses infrastructure.These standards are not easy reading. Visit your local library before you buy, asthey are quite expensive.
Security
For general Unix security, nothing even comes close to Practical UNIX & InternetSecurity by Garfinkel and Spafford. This is a must-have for any Unix systemadministrator. For firewalls, you have several excellent choices. For general treat-ments, consider Firewalls and Internet Security by Cheswick and Bellovin orBuilding Internet Firewalls by Zwicky et al. If you are using Linux or OpenBSD,you might consider Building Linux and OpenBSD Firewalls by Sonnernreich andYates. Don’t forget security organizations like CERT at http://www.cert.org or CIACat http://www.ciac.org/ciac/.
Scripting
Quite a few scripting languages are available for Unix. Apart from standard shellscripts, I use only Tcl and Perl, so I can’t comment on the others. For Perl, I beganwith Schwartz’s Learning Perl and now use Programming Perl by Wall et al. as areference. For more detailed guidance with system administration tasks, you mightalso consider Perl for System Administration by Blank-Edelman.
For Tcl, Ousterhout’s Tcl and the Tk Toolkit, while not necessarily the best, is thestandard introduction. He did invent the language. For network applications, youmight consider Building Networking Management Tools with Tcl/Tk by Zeltsermanand Puoplo. If you just want a quick overview of Perl or Tcl, there are a numberof tutorials on the Web.
Microsoft Windows
For Windows, you might begin by looking at Frisch’s Essential Windows NT SystemAdministration or the appropriate Windows Resource Kit from Microsoft. Frisch ismore readable and doesn’t always follow the Microsoft party line. The Microsoftdocumentation can be quite comprehensive. There are different versions for eachflavor of Windows.
ReferencesBarrett, Daniel, and Richard Silverman. SSH, the Secure Shell: The Definitive Guide.
Sebastopol, CA: O’Reilly & Associates, Inc., 1999.
Blank-Edelman, David. Perl for System Administration. Sebastopol, CA: O’Reilly &Associates, Inc., 1999.

References 313
This is the Title of the Book, eMatter EditionCopyright © 2007 O’Reilly & Associates, Inc. All rights reserved.
Callaghan, Brent. NFS Illustrated. Reading, MA: Addison Wesley Longman, 1998.
Carasik, Anne. Unix Secure Shell. New York, NY: McGraw-Hill, 1999.
Carlson, James. PPP Design and Debugging. Reading, MA: Addison WesleyLongman, 1998.
Cheswick, William, and Steven Bellovin. Firewalls and Internet Security. Reading,MA: Addison Wesley Longman, 1994.
Comer, Douglas. Internetworking with TCP/IP: Principles, Protocols, and Architec-tures, vol. 1, 4th ed. Upper Saddle River, NJ: Prentice Hall, 2000.
Costales, Bryan et al. sendmail, 2d ed. Sebastopol, CA: O’Reilly & Associates, Inc.,1997.
Frisch, Æleen. Essential System Administration. Sebastopol, CA: O’Reilly & Associ-ates, Inc., 1991.
———. Essential Windows NT System Administration. Sebastopol, CA: O’Reilly &Associates, Inc., 1998.
Garfinkel, Simson, and Gene Spafford. Practical UNIX & Internet Security. Sebas-topol, CA: O’Reilly & Associates, Inc., 1990.
Groth, David, and Jim McBee. Cabling: The Complete Guide to Network Wiring.Alameda, CA: Sybex, 2000.
Hall, Eric A. Internet Core Protocols: The Definitive Guide. Sebastopol, CA: O’Reilly& Associates, Inc., 2000.
Haugdahl, J. Scott. Network Analysis and Troubleshooting. Reading, MA: AddisonWesley Longman, 2000.
Held, Gilbert. LAN Management with SNMP and RMON. New York, NY: JohnWiley & Sons, 1996.
Huitema, Christian. Routing in the Internet, 2d ed. Upper Saddle River, NJ: Pren-tice Hall, 2000.
Hunt, Craig. Networking Personal Computers with TCP/IP, 2d ed. Sebastopol, CA:O’Reilly & Associates, Inc., 1995.
———. TCP/IP Network Administration, 2d ed. Sebastopol, CA: O’Reilly & Associ-ates, Inc., 1998.
Jain, Raj. The Art of Computer Systems Performance Analysis. New York, NY: JohnWiley & Sons, 1991.
Kadambi, Jayant, Ian Crayford, and Mohan Kalkunte. Gigabit Ethernet: Migrating toHigh-Bandwidth LANs. Upper Saddle River, NJ: Prentice Hall, 1998.
Killelea, Patrick. Web Performance Tuning. Sebastopol, CA: O’Reilly & Associates,Inc., 1998.

314 Appendix B: Resources and References
This is the Title of the Book, eMatter EditionCopyright © 2007 O’Reilly & Associates, Inc. All rights reserved.
Kurtzweil, Ray. The Age of Spiritual Machines: When Computers Exceed HumanIntelligence. New York, NY: Viking Penguin, 1999.
Lehey, Greg. Porting Unix Software. Sebastopol, CA: O’Reilly & Associates, Inc.,1995.
Leinwand, Allan, and Karen Conroy. Network Management: A Practical Perspec-tive, 2d ed. Reading, MA: Addison Wesley Longman, 1996.
Liu, Cricket et al. Managing Internet Information Services. Sebastopol, CA: O’Reilly& Associates, Inc., 1994.
Liu, Cricket, Paul Albitz, and Mike Loukides. DNS and BIND, 4th ed. Sebastopol,CA: O’Reilly & Associates, Inc., 1998.
Loukides, Mike. System Performance Tuning. Sebastopol, CA: O’Reilly & Associ-ates, Inc., 1990.
Maxwell, Steve. Unix Network Management Tools. New York, NY: McGraw-Hill,1999.
Miller, Mark. LAN Troubleshooting Handbook, 2d ed. New York, NY: M&T Books,1993.
———. Troubleshooting TCP/IP, 2d ed. New York, NY: M&T Books, 1996.
Mullet, Dianna, and Kevin Mullet. Managing IMAP. Sebastopol, CA: O’Reilly &Associates, Inc., 2000.
Murry, James. Windows NT SNMP. Sebastopol, CA: O’Reilly & Associates, Inc., CA,1998.
Nemeth, Evi et al. Unix System Administration Handbook, 3d ed. Upper SaddleRiver, NJ: Prentice Hall, 2001.
Ousterhout, John K. Tcl and the Tk Toolkit. Reading, MA: Addison WesleyLongman, 1994.
Peek, Jerry, Tim O’Reilly, and Mike Loukides. Unix Power Tools, 2d ed. Sebas-topol, CA: O’Reilly & Associates, Inc., 1998.
Perlman, Radia. Interconnections, 2d ed. Reading, MA: Addison Wesley Longman,2000.
Peter, Laurence, and Raymond Hull. The Peter Principle. New York, NY: W. Morrow,1969.
Robichaux, Paul. Managing the Windows 2000 Registry. Sebastopol, CA: O’Reilly &Associates, Inc., 2000.
Schwartz, Randal. Learning Perl. Sebastopol, CA: O’Reilly & Associates, Inc., 1993.
Sonnernreich, Wes, and Tom Yates. Building Linux and OpenBSD Firewalls. NewYork, NY: John Wiley & Sons, 2000.

References 315
This is the Title of the Book, eMatter EditionCopyright © 2007 O’Reilly & Associates, Inc. All rights reserved.
Spurgeon, Charles. Ethernet: The Definitive Guide. Sebastopol, CA: O’Reilly &Associates, Inc., 2000.
Stern, Hal. Managing NFS and NIS. Sebastopol, CA: O’Reilly & Associates, Inc.,1991.
Stevens, W. Richard. TCP/IP Illustrated, vol. 1, The Protocols. Reading, MA: Add-ison Wesley Longman, 1994.
Sun, Andrew. Using & Managing PPP. Sebastopol, CA: O’Reilly & Associates, Inc.,1999.
Thomas, Steven. Windows NT 4.0 Registry: A Professional Reference. New York,NY: McGraw-Hill, 1998.
TIA/EIA. Administration Standard for the Telecommunications Infrastructure ofCommercial Buildings (TIA/EIA–606). Englewood, CO: Global EngineeringDocuments, 1993.
———. Commercial Building Telecommunications Cabling Standard (TIA/EIA–568–A). Englewood, CO: Global Engineering Documents, 1995.
Trulove, James. LAN Wiring: An Illustrated Guide to Network Cabling. New York,NY: McGraw-Hill, 1997.
Udupa, Divakara. Network Management Systems Essentials. New York, NY:McGraw-Hill, 1996.
Wall, Larry, Tom Christiansen, and Randal Schwartz. Programming Perl, 3d ed.Sebastopol, CA: O’Reilly & Associates, Inc., 2000.
Zeltserman, Dave, and Gerard Puoplo. Building Networking Management Toolswith Tcl/Tk. Upper Saddle River, NJ: Prentice Hall, 1998.
Zwicky, Elizabeth, Simon Cooper, and D. Brent Chapman. Building Internet Fire-walls, 2d ed. Sebastopol, CA: O’Reilly & Associates, Inc., 2000.

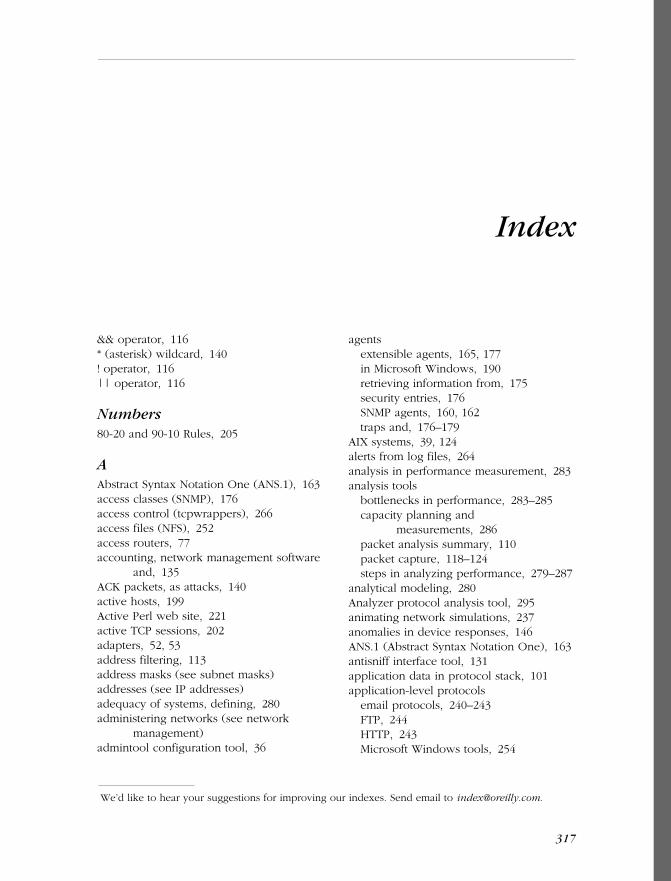
This is the Title of the Book, eMatter EditionCopyright © 2007 O’Reilly & Associates, Inc. All rights reserved.
317
We’d like to hear your suggestions for improving our indexes. Send email to [email protected].
Index
&& operator, 116* (asterisk) wildcard, 140! operator, 116|| operator, 116
Numbers80-20 and 90-10 Rules, 205
AAbstract Syntax Notation One (ANS.1), 163access classes (SNMP), 176access control (tcpwrappers), 266access files (NFS), 252access routers, 77accounting, network management software
and, 135ACK packets, as attacks, 140active hosts, 199Active Perl web site, 221active TCP sessions, 202adapters, 52, 53address filtering, 113address masks (see subnet masks)addresses (see IP addresses)adequacy of systems, defining, 280administering networks (see network
management)admintool configuration tool, 36
agentsextensible agents, 165, 177in Microsoft Windows, 190retrieving information from, 175security entries, 176SNMP agents, 160, 162traps and, 176–179
AIX systems, 39, 124alerts from log files, 264analysis in performance measurement, 283analysis tools
bottlenecks in performance, 283–285capacity planning and
measurements, 286packet analysis summary, 110packet capture, 118–124steps in analyzing performance, 279–287
analytical modeling, 280Analyzer protocol analysis tool, 295animating network simulations, 237anomalies in device responses, 146ANS.1 (Abstract Syntax Notation One), 163antisniff interface tool, 131application data in protocol stack, 101application-level protocols
email protocols, 240–243FTP, 244HTTP, 243Microsoft Windows tools, 254

This is the Title of the Book, eMatter EditionCopyright © 2007 O’Reilly & Associates, Inc. All rights reserved.
318 Index
application-level protocols (continued )name services, 245–250NFS troubleshooting, 251–253ntop results, 200routing, 250TFTP, 244troubleshooting, 239
applicationsconfiguration files, 41security files, 41testing connectivity with, 69
arbitrary source addresses, 227ARC (Attenuation to Cross-talk Ratio), 51archiving log files, 263argus auditing tool source web site, 295ARP (Address Resolution Protocol)
ARP poisoning, 129, 143arpwatch tool, 142–144filters and, 113forwarding, 38gratuitous ARP, 138lost packets and, 57nemesis tool and, 228ntop plugins for, 202tables, 30
adding entries, 30MAC/IP address pairs, 138retrieving with getif, 191retrieving with ndd, 38retrieving with tkined, 188static entries, 31unresolved entries, 31
arp command, 30, 42arping tool, 68identifying hardware, 144ping and, 62, 65
arping reachability tool, 68, 295arpredirect packet tool, 129arpwatch address tool, 130, 136, 142–144,
295writing data to files, 142
ASCII capture, 126assessing solutions in troubleshooting, 277asterisks (*), 140attachments to email, 242attenuation, testing, 50Attenuation to Cross-Talk Ratio (ARC), 51autodiscovery and classes of devices, 155automatic discovery tools, 152, 155
automating documentation ofsystems, 255–260
autoswitching hubs, 103AWACS logging tool, 264, 295
Bbackward compatibility of operating
systems, 40bandwidth measurements, 79, 80, 81–87
bing tool, 85–87bottleneck bandwidth, 81, 87emulators and, 236Microsoft Windows, 97ntop results, 201packet pair software, 87pathchar tool, 83–85ping and, 81point-to-point bandwidth, 85
banners at login, 145basic configuration files, 35Basic Encoding Rules (BER), 163bb monitoring tool, 190, 295benchmark tools, 238, 253BER (Basic Encoding Rules), 163BER.pm extension, 149Berkeley Internet Name Daemon (see bind
testing tools), 295Berkeley packet filter, disabling, 130bibliography of resources, 308–315Big Brother monitoring tool (bb), 190, 295binary search technique, 3bind testing tools
name service tools, 247, 299serial counters and, 247source web site, 295, 297
bing bandwidth tool, 83, 85–87, 295biod daemon, 251bit masks (see subnet masks)blinking lights on devices, 49blocking
CMIP packets, 156filtering packets, 58ICMP packets, 63, 65illegal packets, 227testing firewalls, 278
bluebird management framework sourceweb site, 295
books and resources, 308–315booting systems, 39, 40

This is the Title of the Book, eMatter EditionCopyright © 2007 O’Reilly & Associates, Inc. All rights reserved.
Index 319
bottleneck analysis in performancemeasurement, 283–285
bottleneck bandwidth, 81, 87bottlenecks, time-dependent behavior, 284bprobe bandwidth tool, 87, 295bridges, traffic capture and, 101broadcast addresses
configuring ICMP responses, 64duplicate packets and, 57filtering, 113in interfaces, 29matching in filters, 115ntop results, 200in routing tables, 25
BSD systemschanging kernel configuration, 39configuration files, 35rc files, 40recompiling kernel, 37(see also FreeBSD systems, OpenBSD
systems)bulk transfer capacity, 88, 92bus mastering, 52busy hours, 195, 205
Ccable testers, 48, 50cabling
books and resources, 311connectivity tests, 45–52costs of, 16installation, 46intermittent problems, 46labels, 48lengths of, 51maintenance and management, 47physical environment, 46power lines, 46swapping, 51termination, 50testers, 48, 50testing, 49–52
CAIDA (Cooperative Association forInternet Data Analysis), 293
calls to network utilities, 39capacitance, 51capacity planning, 285
capacity management, 285difficulties in, 286
local or remote traffic, 202performance measurement in, 135raw capacity of networks, 17traffic measurement, 195
capturing packets (see packet capture)capturing screens, 256, 271cards, 52, 53CERT Coordination Center web site, 293certified cable installers, 47cfgmaker utility (mrtg), 206, 221CGI scripts, 215challenge response systems, 259change logs, 7changes to systems
kernel configuration, 37logging, 7testing, 2tracking to resolve problems, 3unexpected or unauthorized changes, 6
characteristics of packets, filtering by, 115CHARGEN service, 67charting traffic data, 122, 123, 200
cricket tool, 213getif tool, 222mrtg tool, 206netmon tool, 219
chatrooms, 306checksums
checksum errors, 97cryptographic, 270siggen tool and, 270tripwire tool and, 270
Cheops management tool, 136, 295Chesapeake Port Scanner tool, 33, 44, 295CIAC (Computer Incident Advisory
Center), 293Cisco IOS, 90CiscoWorks, 156clandestine scanning, 141classes of IP addresses, 119clients
checking recipient addresses, 241client bindings, 250debugging, 240displaying remote sessions on, 258listing open files, 27name services, 245NFS and, 251
clink bandwidth tool, 83, 295

This is the Title of the Book, eMatter EditionCopyright © 2007 O’Reilly & Associates, Inc. All rights reserved.
320 Index
ClipBook Viewer, 271clocks, synchronizing, 267cloned routes in routing tables, 25CMIP packets, 156CMOS configuration information, 39CMU SNMP tools, 165, 212, 296coaxial cable, 52cold reboots, 2collecting data
packet capture (see packet capture)in performance measurement, 283privacy issues, 11as step in troubleshooting, 1, 274(see also device discovery)
collector script (cricket), 215collisions
collision lights, 49netstat results, 94, 97
commentsin makefiles and code, 306in syslog configuration, 261
commercial network managementsoftware, 137
commercial tools, 293communications tools, 255community strings (SNMP), 157, 161
access classes, 176clear text and, 162in Microsoft Windows, 190setting values and, 171tkined usage of, 189
community-based SNMPv2, 161compiling source code for tools, 290complex filters, 116, 128components, swapping, 3compound filters, 116, 128compressed software tools, 290compromised systems, 18Computer Incident Advisory Center
(CIAC), 293configuration
adapters, 52configuration programs, 36documenting, 8, 19host machines (see host configuration)NET SNMP, 167–169remote configuration, 135SNMP capabilities, 171throughput and, 88
configuration files, 35–41application files, 41configuration programs, 36kernel configuration, 36–39log files, 41mrtg files, 206security files, 41startup files and scripts, 39testing, 266
configure command (FreeBSD), 36confirming results in troubleshooting, 276connections
connecting two machines, 232connection logging, 265connection-by-connection statistics, 122displaying for hosts, 23drawing in maps, 154
connectivity protocols, 224connectivity testing
adapters, 52with applications, 69cabling, 45–52connectivity vs. functionality, 65electrical vs. network, 52emulators and simulators, 235–238Microsoft Windows tools, 69, 238over time, 61packet injection tools, 224–235ping, 53–69software tools, 53throughput tests, 56
constraints in performancemeasurement, 282
controlling terminals, 21conversation steering, 103cookies, capturing, 120Cooperative Association for Internet Data
Analysis (CAIDA), 293copper cable, 47cops security tool, 269copying traffic to other devices, 130corrupted data, 97cost management, 12–17
cabling, 46cost estimations and comparisons, 14infrastructure costs, 16initial costs, 16overengineering and, 13rates of return, 16

This is the Title of the Book, eMatter EditionCopyright © 2007 O’Reilly & Associates, Inc. All rights reserved.
Index 321
courses, 307cpm, check promiscuous mode tool, 131cpm mode-checking tool, 131, 296cprobe bandwidth tool, 87, 295CPU usage, 22, 219crackers, xi
log files and, 262ping and, 63port scanners and, 33questionable tool features and, 157
cricket graphing toolcapacity planning and, 286Microsoft Windows, 221source web site, 296uses, 212–216
cron tool, 206, 210crontab file, 211, 215crossed wires, 50crossover cables, 52, 103cryptographic checksums, 270current time frames, defining, 280custom packets generators, 225–231
capture and retransmission ofpackets, 231
hping tool, 226–228injecting packets, 224ipfilter tool, 230ipsend tool, 230nemesis tools, 228–230using packet sniffers with, 230sock tool, 231
customized network systems, 5customized systems, identifying
configuration, 18cut-through switches, 84, 85cyberkit tools, 158, 271, 296
Ddamaged packets, 57data cabling (see cabling)data collection (see collecting data)data corruption, 97data streams, capturing, 119data-dependent problems, 60datagrams, tracking, 220date stamps
on tools and documentation, 7on troubleshooting printouts, 256
DDNS (dynamic DNS), 138Debian Linux systems, 40, 292debugging (see troubleshooting)decimal dotted notation (OIDs), 163, 166,
210decoding
packets manually, 110tcpdump files, 121
decompressing software tools, 290decoy scanning, 141default routes in routing tables, 26defining problems in troubleshooting, 275defunct processes, 22deleting
data from captured packets, 119email attachments, 242packages, 291
denial-of-service attacks, 24, 63, 67dependency in users, 10designing performance measurement
test, 282destination addresses
filtering, 113MGEN settings, 234nemesis settings, 229in routing tables, 25, 26
detailed output (see verbose output)detecting
intruders, 204packet sniffers, 131
device discoveryautomatic discovery problems, 152IP address management and, 138in network management software, 135network mapping, 151–155politics and security, 156tools, 137–144
arpwatch tool, 142–144nmap tool, 139–142scripting tools, 149–151tkined tool, 155types of, 136
device monitoringMicrosoft Windows, 190–193NET SNMP tool, 165–179ports, 103scotty tool, 179–181switches in path devices, 103

This is the Title of the Book, eMatter EditionCopyright © 2007 O’Reilly & Associates, Inc. All rights reserved.
322 Index
device monitoring (continued )tkined tool, 181–189with non-SNMP applications, 190with SNMP (see SNMP)
device type identification, 146–149devices
adding to maps, 154as bottlenecks, 284configuring with SNMP, 171discovering (see device discovery)emulators, 235identifying types of, 144–149MIBs for, 167monitoring (see device monitoring, with
SNMP)mrtg information, 209polling with tkined, 188troubleshooting installation, 277unreachable, 182
DHCP (Dynamic Host ConfigurationProtocol)
arpwatch tool and, 144identifying address ranges, 152IP address management and, 138rogue servers, 32
diagnostic tools, 52, 307dial-in access, traceroute and, 77differential growth in networks, 286dig domain name tool, 247–248, 296direct measurements vs. emulation or
simulation, 236disabling Berkeley packet filter, 130discovering devices (see device discovery)discovering paths, 71disk usage information, retrieving, 176display filters in ethereal, 128divide and conquer technique, 3DMA channels in adapter settings, 52dmesg command, 39DNS (domain name system)
books and resources, 310device discovery and, 137dnsutl tool, 250dynamic DNS, 138filtering, 114generating packets with nemesis, 228h2n tool, 250identifying address ranges, 152
make-zones tool, 250named-bootconf tool, 250names-xfer tool, 250NIS and NIS+, 250ntop traffic results, 199ping dependence on, 62ping numeric output, 59static addresses and, 138tcpdump capture of exchanges, 106troubleshooting, 245–250
dnsquery domain name tool, 245, 296dnsutl configuration tool, 250, 296dnswalk domain name tool, 249, 296doc domain name tool, 249, 296documentation, vendor, 307documenting
cabling, 47networks, 6–8
configuration, 8, 19failure to document, 10process documentation, 8trend analysis and, 286
troubleshootingscreen captures, 256steps, 255–260, 274
Domain Internet Groper tool, 247–248, 296domains
graphing traffic measurements in, 202listing machines in, 246
DOS attacks (denial of service), 24, 63, 67dotted notation, 163, 166, 210drec log tool, 235drift files (time settings), 268driver configuration parameters, 38dropped packets in measurements, 233dsniff security tools, 129, 157, 296dual-port switches, 103duplicate IP addresses, 32, 138duplicate packets, 57duplicating traffic on ports, 103dynamic address allocation, 138dynamic DNS, 138
Eechoping reachability tool, 66, 296ego management, 10egressor router tool, 227, 296

This is the Title of the Book, eMatter EditionCopyright © 2007 O’Reilly & Associates, Inc. All rights reserved.
Index 323
electrical connectivity versus networkconnectivity, 52
e-magazines, 308email
attachments, deleting, 242dig tool mail records, 248listing servers with nslookup, 246protocol books and resources, 310receiving arpwatch messages, 143troubleshooting protocols, 240–243(see also sendmail)
email accounts, verifying, 242emap diagramming tool, 159emulators, 235–238
benefits, 236gateway emulators, 237NISTNet, 236
encryptioncapturing, 120packet sniffing and, 131in ssh tool, 260
end-to-end connectivity, testing, 45enterprise MIBs, 165, 172, 185ephemeral ports, 117, 120equipment (see devices; hardware)error statistics (RMON), 216escaped characters, MTU problems and, 60ethercodes.dat file, 143ethereal analysis tool, 124–129
bottleneck analysis, 284Capture window, 126capturing RIP updates, 251Microsoft Windows, 131source web site, 296watching NFS traffic, 253writing data to files, 125
etherfind analysis tool, 124Ethernet
addresses in ARP tables, 31addresses in interfaces, 26, 29books and resources, 310configuration information in
interfaces, 29filtering addresses, 113Organizationally Unique Identifier
(OUI), 31RMON capture, 218testing adapters, 52
ethical considerationsbehavior in network management, 9use of network tools, 11
evaluating solutions to problems, 277event monitoring in network management
software, 135Event Viewer, 270excluding data (see filtering)expanding subnets in diagrams, 155experimental design of performance
measurement, 282expn command (telnet), 242exponential growth in computing
speeds, 14expression matching, 172extensible agents, 165, 177
Ffactors in performance measurement, 282failure to document systems, 10FAQ lists, 306fiber splitters in patch devices, 103fiber-optic cables, 47files
arpwatch data in, 142command line output in, 256decoding tcpdump files, 121extracting data from, 121filter files, 112IP scans, 142log files, 260–267name resolution results in, 249tcpdump files, 105, 106writing data to packets, 230(see also configuration files)
filteringaddress filtering, 113blocking packets, 58compound filters, 116, 128display filters, 128ethereal tool, 125, 128ntop traffic capture, 198operators in filters, 116packet characteristics, 115port filtering, 114preventing Smurf attacks, 64protocol filtering, 114sanitize tool, 118

This is the Title of the Book, eMatter EditionCopyright © 2007 O’Reilly & Associates, Inc. All rights reserved.
324 Index
filtering (continued )SNMP traffic, 163tcpdump tool
applying filters to data files, 106filtering collected data, 107options, 112–118output, 105
testing filters, 113finding tools and software, 293finger tool (cyberkit suite), 158fingerprinting programs (see stack
fingerprinting)fire codes, cabling and, 46firewalls
books and resources, 312configuration files, 41flags and, 229personal firewalls, 156stealth scanning and, 141syslog remote logging and, 263testing with ipsend tool, 230testing with spoofed addresses, 227
flagsin ARP tables, 31nemesis settings, 229ping flags, 60in routing tables, 25
flakeways, 237flashing icons in tkined, 182flooding networks
hosts with syslog messages, 263load generators, 231–235packet injection tools, 225ping tools, 59switches, 129
fluorescent lights, cabling and, 46following TCP streams, 127forged ARP packets, 129forged IP addresses (see spoofed
addresses)forged syslog messages, 263fping packet tool, 66, 297Fraggle denial-of-service attacks, 67fragmentation
diagnosing fragmentation problems, 60fragmented stealth packets, 141packet capture and, 119traceroute and, 73
frame buffers, 257
framescapturing, 103framing errors, 103interface frame size capabilities, 29performance measurements, 80ping frame size options, 60
framework packages for networkmanagement, 136
framing types, adapters, 52FreeBSD systems
configuration programs, 36disabling Berkeley packet filter, 130NET SNMP, 165nonzero values in netstat, 96ping flags, 60ping tools, 55port collections, 292recompiling kernel, 37
“freely available” tools, 293fressh ssh tool, 297FTP (file transfer protocol), 29, 88, 145, 199
Ggated distribution, 250, 300gateway emulators, 237gateways in routing tables, 25GD library, 212generating packets (see load generators)generic troubleshooting strategies, 273–277GET_BULK_REQUEST messages
(SNMP), 163getif SNMP tool, 191, 222, 297GET_NEXT_REQUEST messages
(SNMP), 162, 166, 169GET_REQUEST messages (SNMP), 162, 166GET_RESPONSE messages (SNMP), 162GIF images of traffic patterns, 206gimp image tool, 256, 297glint package management tool, 292GNOME project, 136gnorpm package management tool, 292GNU AWACS logging tool, 264, 295goals of performance measurement, 280grapher.cgi script (cricket), 213graphing MIB trees, 185graphing traffic data, 200
cricket tool, 213getif tool, 222mrtg tool, 206

This is the Title of the Book, eMatter EditionCopyright © 2007 O’Reilly & Associates, Inc. All rights reserved.
Index 325
netmon tool, 219xplot tool, 122, 123
gratuitous ARP, 138grep command, 142groups
in MIBs, 164RMON, 216SNMP access classes, 176in tkined network display, 154, 182
growth in networks, 286GTK+ development toolkit, 297gtkportscan scanning tool, 33, 297GUI configuration applications, 36gunzip decompression tool, 290GxSNMP SNMP Manager, 136, 297.GZ files, 290
Hh2n name server tool, 250, 297hardware
discovering (see device discovery)emulators, 235hardware errors, 97identifying, 144–149inventories, 7load generator devices, 235monitoring (see device monitoring)swapping, 3
headerscapturing, 108, 125displaying in packets, 127hping settings, 227structure of, 115
hexadecimal capture, 110, 126, 228hexdump analysis tool, 111hidden transmission points, 84, 87higher-level services, filtering, 114hops
limiting number in traceroute, 74pathchar results, 84in route discovery, 72in routing tables, 25TTL counts and, 56
host configurationMicrosoft Windows, 42–44system configuration files, 35–41utilities, 20–34
host domain name tool, 245, 297hostname configuration tool, 42
hostsconfiguration (see host configuration)connectivity, 60displaying remote X Windows sessions
on, 258host authentication, 260host-monitoring tools, 196, 219link-level addresses, 62listing information with nslookup, 246ntop results, 199, 201pinging multiple hosts, 66sorting traffic display by, 199traffic capture and, 101
hping packet toolcustom packet generation, 225source web site, 297testing connectivity with, 226–228testing firewalls with, 279
hping2 packet tool, 226–228HTML pages of traffic patterns, 206HTTP (Hypertext Transfer Protocol)
monitoring devices with HTTPservers, 190
ntop traffic results, 199performance and security problems, 244ports, 140, 145secure HTTP, 204stack fingerprinting ports and, 147troubleshooting, 243
hubscompared to switches, 103point-monitoring tools and, 197security and, 129traffic capture and, 102unmanaged hubs, 152
HUP command, using with snmpd, 177hypotheses in troubleshooting, 275
IICMP (Internet Control Message Protocol)
alternatives to ping, 66blocking traffic, 63DOS attacks and, 63error messages, 57filtering traffic, 114low priorities for traffic, 65monitoring with tkined, 181–184ntop plugins for, 202ping tools and, 54

This is the Title of the Book, eMatter EditionCopyright © 2007 O’Reilly & Associates, Inc. All rights reserved.
326 Index
ICMP (continued )port scanning and, 140sending packets with hping tool, 226sending packets with nemesis, 228sequence numbers in ping results, 55tracert tool and, 97
identifying hardware types, 146–149identifying network nodes (see device
discovery)identifying paths, 71IEEE web site, 31ifconfig tool, 29, 39IGMP packets, 114, 228IMAP (Internet Message Access
Protocol), 310impedance, testing, 51indexmaker script (mrtg), 206, 211, 221inetd daemon, 21, 24, 265inetd.conf file, 35information sources for
troubleshooting, 305–315INFORM_REQUEST message (SNMP), 163infrastructure costs, 16init process in startup sequence, 39initial costs, 16injecting packets (see packet injection
tools)installation
cabling, 46firewalls, 278managing installations, 135MIBs, 167, 184port collections, 292reinstalling software to resolve
problems, 3SNMP on Microsoft Windows, 190tools and software, 289–292tracking software installations, 7troubleshooting strategies, 277
integrated network management tools, 136integrity checking, 18, 269, 270interfaces
in ARP tables, 31capturing traffic data, 101, 107, 125changing parameters, 30configuration information, 26configuration retrieval, 29discovering, 107, 209
ethereal data capture, 125graphing traffic, 206lights on, 49measuring traffic on, 95MGEN settings, 234mrtg configuration files, 206mrtg discovery, 209multihomed computers, 198ntop tool settings, 198, 203ping and, 60point-monitoring tools, 196, 197–204promiscuous mode and, 104, 108, 125,
130, 142, 197in routing tables, 25shutting down, 30snmpnetstat packet counts, 175speed, 80switching in ntop, 203tkined retrieval results, 188
intermediaries in Smurf attacks, 63intermittently blinking lights, 49Internet connections
bottleneck bandwidth, 81effects on traffic patterns, 205listing open files for, 27ping results and, 56protocol books and resources, 311public time servers, 267running traceroute over, 78
Internet Control Message Protocol (seeICMP)
Internet Message Access Protocol(IMAP), 310
Internet Service Providers (see ISPs,evaluating)
Internic registration information, 152interrupt settings, 52intrusion detection, 204, 226I/O performance, 219IP addresses
address resolution problems, 32ARP tables, 31, 32, 138arping tool and, 68arpwatch tool and, 142–144classes, 119displaying for connections, 24duplicated addresses, 32, 77, 138dynamic allocation, 138

This is the Title of the Book, eMatter EditionCopyright © 2007 O’Reilly & Associates, Inc. All rights reserved.
Index 327
filtering, 113, 116frequent changes in, 143getif and, 191headers, 89identifying, 68in interface configurations, 26, 29in-use addresses, 140management of, 138mapping, 30nemesis and, 229ntop and, 199, 201packet sniffer detection, 131ping and, 60ranges of, 152reverse name lookup, 73RMON data, 217for routers, 74scanning (see IP scanning)scrambling, 119for SNMP agents, 176static addresses, 138tcpdump tool and, 108testing, 138traceroute and, 77troubleshooting name services, 246
IP forwarding parameter, 38IP scanning, 139
getif tool, 192Microsoft Windows tools, 158nmap tool, 139–142
ipchains log tool, 196ipconfig configuration tool, 42iperf bandwidth tool, 91, 97, 297ipfilter TCP tools, 230, 297ipfw log tool, 196ipload load generator tool, 238, 297ipsend filtering tool, 230, 297iptrace capture tool, 124IRIX systems, 37, 87isolation, testing devices in, 279ISPs, evaluating, 93iss security tool, 269
JJava implementations
iperf tool, 91ttcp tool, 90vnc tool, 259
jitter, 91, 236job command (scotty), 150
Kkernel
configuration, 36–39contents of data structures, 23recompiling to prevent packet
capture, 130system parameters in, 38
Kurzweil, Raymond, 14
Llabeled form of SNMP output, 174labeling
cables, 48interfaces in mrtg graphs, 209label makers, 48map devices, 154
lame delegations, 249lamers DNS tool, 249, 298LANalyzer tool, 132LANs
mapping tools and, 152network management and, 137ping results and, 56virtual LANs, 131, 152
large packets, 64Lawrence Berkeley National Laboratory
Network Research Group, 293legal issues
ssh tool, 260use of network tools, 11
lengthsof cables, 51of packets, 115
levels of service, ISP, 93levels of usage, variations in, 195libpcap library, 104, 120, 197licensing, 7, 135, 293lights on interfaces, 49line mode (tcpdump), 105link lights, 49link-level traffic
addresses for hosts, 62fixing performance, 285header information, 110

This is the Title of the Book, eMatter EditionCopyright © 2007 O’Reilly & Associates, Inc. All rights reserved.
328 Index
link-level traffic (continued )links as bottlenecks, 284RMON and, 218
Linux systemsconfiguration programs, 36Debian Linux, 40, 292NET SNMP, 165network management tools, 136packages, 292recompiling kernel, 37startup and shutdown scripts, 40traffic results with netstat, 95
linuxconf command (Linux), 36listing
all devices on paths, 78domain machines, 246interfaces, 198name servers, 246open files on systems, 26packages, 291ranked processes, 22routing tables, 24running processes, 20
lists of software tools, 293load generators, 231–235
hardware generators, 235MGEN tools, 233–235Microsoft Windows, 238ping tools, 59spray tool, 232
loading MIBs, 167, 184local area networks (see LANs)local hosts in ntop results, 199local traffic, 202, 205log files and logging
connection logging, 265drec tool, 235host traffic, 196information in log files, 41managing and tracking files, 263Microsoft Windows, 271mrtg files, 208netmon tool, 220NTP events, 268other approaches to logging, 265remote logging files, 262saving data to SQL databases, 204saving screen display to files, 256syslog files, 261–263
tcpwrappers tool, 265telnet sessions, 257tracking troubleshooting steps, 255–260using files in troubleshooting, 260–267
logcheck management tool, 265, 298logger command (syslog), 261logging changes (see change logs)logging on
login banners, 145remotely, 255–260
logical and operator (&&), 116logical not operator (!), 116logical operators in filters, 112, 116logical or operator (||), 116login banners, 145looking glass sites, 78loopback addresses, 26loopback interfaces, 60loose source routing, 78loss, testing, 91lost packets
bing results, 86packet capture results, 103ping and, 57spray tool calculations, 232traceroute indicators, 73
lsof open file toollisting commands, 27ntop tool and, 197packet sniffer detection, 131source web site, 298uses, 26–29
MMAC addresses
ARP tables, 30, 138arping tool, 68arpwatch tool, 142–144ntop results, 201OUIs and, 31RMON statistics, 217switches and, 129
Macintosh version of vnc tool, 259macof flooding tool, 129mail (see email)mailing lists, 305maintenance
cabling, 47costs, 15

This is the Title of the Book, eMatter EditionCopyright © 2007 O’Reilly & Associates, Inc. All rights reserved.
Index 329
makefiles, 290, 306make-zones DNS tool, 250managed hubs and switches, 152Management Information Bases (see MIBs)managers, SNMP, 160, 162, 163man-in-the-middle attacks, 260manual entries
in ARP tables, 31in routing tables, 25
manufacturers (see vendors)mapping
devices and networks, 151–155bottleneck analysis and, 284features in network management
software, 135manually drawing maps, 153Microsoft Windows software, 159network addresses, 30tkined tool, 153–155types of tools, 136
MIB trees, 185traffic, 122, 123
cricket tool, 213getif tool, 222mrtg tool, 206netmon tool, 219patterns, 200
MARR (minimal acceptable rate ofreturn), 16
masks (see subnet masks)matched packets (RMON), 217matching patterns in log files, 264maximum number of hops, 74Maximum Transmission Unit (MTU), 60measuring performance (see performance
measurement)memory locations in adapter settings, 52memory usage in SNMP agent
information, 176Mentor Technologies, Inc., 33Merit Network Inc., 293messages
boottime, 39SNMP messages, 162syslog messages, 261
metering in network managementsoftware, 135
metrics in performance measurement, 281MGEN traffic tool set, 233–235, 238, 298
MIBs (Management Information Bases)browsing with tkined, 185–187charting, 185displaying with getif, 192, 222examining in tkined, 185–187groups in, 164installation, 167, 184lists of OIDs in, 171name lookups, 167private or enterprise MIBs, 165, 172, 185RMON MIB, 216SNMP usage, 163
Microsoft Exchange Server, 159Microsoft Terminal Server, 193Microsoft Visio, 159Microsoft Windows systems
application-level protocol tools, 254books and resources, 312connectivity testing, 69, 238device monitoring tools, 190–193documenting troubleshooting steps
in, 270host configuration, 42–44inconsistent or contradictory packets
and, 146integrity checkers, 272load generators, 238logging applications, 271NET SNMP, 165network benchmark programs, 238network management tools, 158–159packet analysis, 124packet capture tools, 104, 131performance measurement, 97, 219–222ping tools, 69point-monitoring tools, 219–222screen captures, 271SNMP options, 190–193ssh tool, 271syslog versions, 271tcpdump tool, 104time synchronization, 271tracert tool, 75vnc tool, 259
minimal acceptable rate of return(MARR), 16
modeling system performance, 280modular syslog tool, 263, 298mon monitoring tool, 149, 298

This is the Title of the Book, eMatter EditionCopyright © 2007 O’Reilly & Associates, Inc. All rights reserved.
330 Index
monitoring devices (see device monitoring)Moore’s Law, 14motors, cabling and, 46mount points (NFS), 252mount table entries, 252mountd daemon, 251mrtg (Multirouter Traffic Grapher)
background of graphs, 211capacity planning and, 286colors in graphs, 211configuration files, 206, 221home pages graphs, 208interval settings, 206, 210Microsoft Windows, 221MRTG-2 and -3 tools, 212rrd and, 212source web site, 298uses, 205–212
mssh ssh tool, 271, 298msyslog logging tool, 263, 298MTU (Maximum Transmission Unit)
calculating, 92escaped characters and, 60in interface configuration, 29ping functions and, 62
multicast trafficaddresses in ARP tables, 31filtering, 113, 115ntop results, 200
Multi-Generator tool set (see MGEN traffictool set)
multihomed computers, 198multipliers in Smurf attacks, 63Multirouter Traffic Grapher (see mrtg)
Nnam animation tool, 237, 238, 298name resolution
arpwatch tool, 143bing options, 87configuration files, 36disabling in pathchar, 84ethereal tool, 125failure of reverse name lookup, 246getif tool, 192hping tool, 226MIB name lookup, 167mrtg tool, 209netstat options, 24, 25
ntop results, 199OID numbers and names, 171–174ping and, 61, 62reverse name lookup, 73, 246SNMP object descriptors, 163snmpnetstat options, 175tcpdump tool, 108, 117traceroute tool, 74troubleshooting, 249
dig tool, 247–248doc tool, 249lamers tool, 249name services, 245–250NIS and NIS+, 250nslookup tool, 245–247other DNS tools, 250
name servicesdig tool, 247–248dnswalk tool, 249doc tool, 249lame delegations, 249lamers tool, 249listing name servers, 246NIS and NIS+, 250nslookup tool, 245–247other DNS tools, 250troubleshooting, 245–250
named-bootconf DNS tool, 250named-xfer DNS tool, 250NAT (Network Address Translation), 65,
152National Laboratory for Applied Network
Research (NLANR), 293NBT (NetBIOS over TCP/IP), 159nbtstat NetBIOS tool, 159nc connection tool, 232ndd kernel tool, 38Near End Cross-Talk (NEXT), 50nemesis packet tools, 225, 228–230, 279,
298nessus security tool, 33, 298NET SNMP, 165–179
agents and traps, 176–179command line options, 168configuration and options, 167–169Microsoft Windows version, 191snmpget utility, 166snmpgetnext utility, 169–170snmpnetstat utility, 174

This is the Title of the Book, eMatter EditionCopyright © 2007 O’Reilly & Associates, Inc. All rights reserved.
Index 331
snmpset utility, 171snmpstatus utility, 175snmptable utility, 169–170snmptranslate utility, 171–174snmptrap utility, 178snmptrapd utility, 178snmpwalk utility, 169–170source web site, 299
Net Watcher tool, 193NetBench tool, 238NetBIOS, 159netcat TCP tool, 232, 238, 299netdb command (scotty), 150netmon monitoring tool, 102, 132, 219, 299
interval settings, 220netperf benchmarking tool, 90, 97, 299NetSCARF statistics tool, 301netserver measurement program, 90netstat tool
comparing to inetd.conf file, 35displaying connections and
services, 23–26as host-monitoring tool, 196listing routing tables, 24Microsoft Windows, 42, 98SNMP version, 174traffic measurements, 94–97troubleshooting routing tables, 250using with tkined, 155
Network Address Translation (NAT), 65,152
network benchmark software, 225, 238network connectivity (see connectivity
testing)network emulators
benefits, 236gateway emulators, 237NISTNet, 236uses, 235–238
Network File System (see NFS)network-level protocols (see names of
specific protocols)network management
books and resources, 309cabling, 45costs and economic
considerations, 12–17documenting networks, 6–8
drawing network diagrams, 154ego management, 10heavily customized systems, 5identifying portions for performance
measurement, 281identifying systems in
troubleshooting, 275implementing troubleshooting
practices, 6IP addresses, 138legal and ethical considerations, 11log file management, 263management software tools, 135partitioned responsibilities in
organizations, 5performance (see performance
measurement)personnel problems, 10politics and, 156professionalism and, 9scalability vs. capacity, 17security and protection, 130, 156segmented network benefits, 102selecting commercial products, 137tools
device discovery, 137–144, 156device type identification, 144–149mapping tools, 151–155Microsoft Windows tools, 158–159NET SNMP tool, 165–179network-monitoring tools, 205–216RMON, 216–218scotty tool, 179–181scripting tools, 149–151sniffers, 197tkined tool, 153–155, 181–189
troubleshooting vs.management, 134–137
understanding current behavior ofsystems, 5
network managers as sources ofinformation, 308
Network Monitor tool, 132network-monitoring tools, 205–216
cricket tool, 212–216lists of, 293Microsoft Windows, 219–222mrtg tool, 205–212

This is the Title of the Book, eMatter EditionCopyright © 2007 O’Reilly & Associates, Inc. All rights reserved.
332 Index
network-monitoring tools (continued )RMON, 216–218rrd tool, 212
Network Research Group (LawrenceBerkeley National Laboratory), 293
network simulatorsanimating, 237benefits, 236ns and nam tools, 237uses, 235–238
network sniffers, 197Network Time Protocol (NTP), 158, 267,
271Network Virtual Terminal (NVT) ASCII, 240networking scripts, 40newsgroups, 305NEXT (Near End Cross-Talk), 50NFS (Network File System)
benchmark tools, 253books and resources, 310daemons, 251ntop plugins for, 202timeouts, 253tools, 253troubleshooting, 251–253
nfsd daemon, 251nfsiod daemon, 251nfsstat command (NFS), 253nfswatch monitoring tool, 253, 299nhfsstone benchmarking tool, 253, 299NIS and NIS+, 250NISTNet emulation package, 236, 299NLANR (National Laboratory for Applied
Network Research), 293nmap scanning tool
as point-monitoring tool, 136as security tool, 269device discovery, 139–142fast scan option, 142source web site, 299stack fingerprinting, 148
nocol monitoring tool, 149, 299noncommercial tools, 293nonplenum cabling, 46nonzero values in netstat, 96normal failures, 4not-accessible SNMP objects, 172
Novell protocols, 132NRG (LBNL Network Research Group), 293ns simulator tool, 237, 238, 299nslookup domain name tool
cyberkit suite, 158Microsoft Windows, 254NIS and, 250source web site, 299uses, 245–247
ntop monitoring tooldevice troubleshooting, 284interactive mode, 198Microsoft Windows, 221plugins, 202sorting results, 199source web site, 300updating results, 199, 203uses, 197–204web mode, 199
NTP (Network Time Protocol), 158, 267,271
ntpd clock tools, 267, 300ntpdate clock tool, 267ntpq clock tool, 267ntptrace clock tool, 267NTTP ports, 145numeric output
netstat results, 24ping results, 59SNMP results, 174
NVT ASCII, 240
Oobject identifiers (SNMP) (see OIDs)Object Tool Command Language
(OCL), 237objects
definitions in OIDs, 171examining MIBs in tkined, 185–187in MIBs, 163monitoring with tkined, 188object descriptors, 163retrieving with scotty, 179SNMP objects, 161tables of, 170
OCL (Object Tool CommandLanguage), 237

This is the Title of the Book, eMatter EditionCopyright © 2007 O’Reilly & Associates, Inc. All rights reserved.
Index 333
od analysis tool, 111offsets in packet headers, 115OIDs (object identifiers in SNMP)
contents, 163display options in SNMP, 168mrtg usage of, 210object descriptors for, 163syntax, 166translating names and numbers, 171–174
open files, listing for systems, 26Open Network Management Systems, 136open source network management
tools, 136OpenBSD project, 260OpenBSD systems, 270, 292OpenSSH project, 259, 260openssh ssh tool, 300operating speeds of interfaces, 209operating systems
identifying for devices, 144–149inconsistent or contradictory packets
and, 146known behaviors, 146NFS daemons and, 251OS fingerprinting, 146–149
operational costs, 17operators in filters, 112, 116Organizationally Unique Identifier
(OUI), 31OS fingerprinting (see stack fingerprinting)OSPF (Open Shortest Path First), 114, 228,
251ospf_monitor tool, 251OUI (Organizationally Unique
Identifier), 31outcomes of performance
measurement, 281out-of-order packets, 119output
hping output, 228plotting with xplot, 122SNMP formatted output, 168SNMP redirected output, 178SNMP tables, 170tcpdump files, 105, 121
overengineering networks, 13, 284overloaded networks, 50oversized packets, 64owners of processes, listing, 27
Pp0f fingerprinting tool, 147, 300packages
installed package information, 291installing in Solaris, 291integrity, 291Red Hat Package Manager, 292removing, 291
packet analyzers, 124–129(see also packet capture)
packet captureaccess to traffic, 101analysis tools, 118–124, 124–129checking email clients, 243ethereal tool, 125host-monitoring tools, 196Microsoft Windows tools, 131network-monitoring tools, 196, 205–216point-monitoring tools, 196, 197–204promiscuous mode and, 104remote packet capture, 216restricting tools and privileges, 130retransmitting captured packets, 231security and privacy issues, 100, 129–131SNMP agents, 176, 178snmpnetstat tool, 175snoop tool, 124tcpdump tool, 104–118techniques, 103traffic capture tools, 100
packet injection tools, 224–235custom packets generators, 225–231emulators, 236load generators, 231–235using packet sniffers with, 230
Packet InterNet Groper (see ping tools)packet pair software, 87packet sniffers, 100
capture and retransmission, 231detecting, 131SNMP messages and, 162switches and, 129using with packet generators, 230(see also tcpdump tool; traffic capture
tools)packet stretch measurements, 87packets
analysis summary, 110blocking, 58

This is the Title of the Book, eMatter EditionCopyright © 2007 O’Reilly & Associates, Inc. All rights reserved.
334 Index
packets (continued )capturing (see packet capture)characteristics, 115customized packets, 224, 225–231damaged, 57dropped, 233duplicate, 57fields in, 224filters, 58, 115flooding networks with, 59forged ARP packets, 129fragmentation, 60headers in, 115, 227hexadecimal, 110, 126, 228intervals between, 59length, 64, 115limiting capture, 108listing number sent, 25load generators, 224–235lost packets, 57, 73, 86, 103, 232number captured, 107, 125, 198number sent, 59, 74, 84, 226, 233offsets in headers, 115out-of-order, 119oversized packets, 64path discovery, 72patterns for data, 60performance measurements, 80ping and, 54, 57protocol trees for, 126rate of sending, 59retransmitting after capture, 231round-trip times, 54setup or teardown, 116size, 60, 64, 84, 87, 200, 227, 233, 234sniffing (see packet sniffers)SNMP packets, 169spray tool, 233timeouts for, 74timestamps in, 60truncating, 108TTL field, 72
parametersin performance measurement, 282SNMP objects as, 161
passive fingerprinting, 147passwords
SNMP community strings, 157, 161verifying for email accounts, 242
patch cabling, 52, 103patch devices, 103pathchar bandwidth tools, 83–85, 295, 300paths
available paths in routing tables, 25characteristics
listing all devices on paths, 78performance, 79–97traceroute discovery, 71–79
counting hops on, 56discovery, 74, 75ISP network access, 93performance
bandwidth measurements, 81–87measurements, 80Microsoft Windows, 97throughput measurement, 88–92traffic measurements, 94–97
unreachable networks, 58pattern expression in log files, 264patterns
for packet data, 60of usage, 195
pchar bandwidth tool, 83, 300peering arrangements, 72, 93perfmon monitoring tool, 219performance analysis
analytical modeling, 280measurement, 280simulations, 280steps in, 279–287
Performance Endpoints software, 97performance management in network
management software, 135performance measurement
bandwidth, 79, 81–87books and resources, 311bottleneck analysis, 283–285in capacity planning, 285choosing tools, 282emulators and simulators, 235–238host-monitoring tools, 196ISPs, 93load generators, 231–235Microsoft Windows, 97, 219–222mrtg and varieties, 205–216network-monitoring tools, 205–216over time, 195packet injection, 225

This is the Title of the Book, eMatter EditionCopyright © 2007 O’Reilly & Associates, Inc. All rights reserved.
Index 335
path performance, 79–97ping tools, 59point-monitoring tools, 197–204reproducibility, 236RMON, 216–218steps in, 280–283terminology, 80throughput, 79, 88–92traffic measurement, 79, 94–97, 195types of data collection, 194–196understanding current behavior, 5web servers, 244(see also performance analysis)
Performance Monitor tool, 219periodic replacement costs, 16Perl
Active Perl web site, 221books and resources, 312cricket and, 221mrtg and, 212, 221scripting with, 149
permissions, tcpwrappers tool and, 265personal firewalls, 156Peter Principle, 13Ping of Death Attack, 64ping scanners, 139ping tools
alternatives to, 66–69bandwidth measurements, 81checking client name resolution, 245cyberkit suite, 158detecting packet sniffers with, 131discovering MAC/IP address pairs, 138DOS attacks and, 63examples, 54functions, 54–58generating loads with, 231graphing round-trip delays, 222hping tool, 226interpreting results, 55Microsoft Windows, 69options, 58Ping of Death Attack, 64problems with, 62–66running, 60source web site, 296testing connectivity with, 53–69versions, 53
pkgadd command (Solaris), 291
pkgchk command (Solaris), 291pkginfo package command (Solaris), 291pkgrm command (Solaris), 291playing back captured tcpdump data, 107plenum cabling, 46plotting traffic data (see graphing traffic
data)plugins for ntop tool, 202pmon.exe tool, 44point-monitoring tools, 196, 197–204
Microsoft Windows, 219–222ntop, 197–204
point tools, 136point-to-point bandwidth, 85Poisson distribution, 235polling with tkined, 183, 188POP2 and POP3 protocols, 145, 240port 0, 226port collections, 292port scanners, 32–34
identifying hardware with, 145Microsoft Windows tools, 44nmap tool, 139
portmap NFS daemon, 251portmapper NFS daemon, 251ports
aliasing, 103displaying numbers for connections, 24duplicating traffic on, 103ephemeral, 117, 120filtering, 114, 116getif results, 192graphing usage by, 202MGEN packet settings, 234mirroring, 103mrtg setting, 212nemesis settings, 229ntop selection, 199preserving numbers in data, 119scanning (see port scanners)telnet information at login, 145traceroute starting ports, 74
portscan scanning tool, 33, 269, 300PPP (Point-to-Point Protocol), 60, 310precedence in operators, 116precompiled binary files, 290printing
screen shots of windows, 256troubleshooting details, 256

This is the Title of the Book, eMatter EditionCopyright © 2007 O’Reilly & Associates, Inc. All rights reserved.
336 Index
priorities for traffic, 65privacy issues
egos and, 10limiting bytes captured and, 108packet capture and, 100sanitize tool, 118segmented networks and, 102TCP streams and, 127tcpdpriv tool, 119use of network tools and, 11
private MIBs (enterprise), 165, 172, 185proactive nature of troubleshooting, ixprobe computers, 102process explode tool, 44process monitor tool, 44process viewer tool, 44processes
bottlenecks in, 283defunct processes, 22listing, 21, 27, 44listing users’ processes, 21lsof tool, 27Microsoft Windows, 44multiple instances, 22ranking in order of CPU usage, 22resource-hogging, 22rogue processes, 22run levels and, 40SNMP agent information, 176
processor loads in SNMP agentinformation, 176
promiscuous modearpwatch tool, 142checking interfaces, 130disabling in tcpdump, 108ethereal settings, 125ntop tool, 197packet capture and, 104
propagation delays or times, 80, 81, 82protecting networks (see security issues)protocol analyzers, 100
(see also ethereal analysis tool; trafficcapture tools)
protocol stack, application data in, 101protocols
application-level (see application-levelprotocols)
capturing traffic with snmpnetstat, 175
connectivity protocols (see connectivityprotocols)
displaying traffic by, 199displaying with netstat, 24filtering, 114network-level (see names of specific
protocols)packet capture and, 101transport-level (see names of specific
protocols), 239tree display in ethereal, 126
proxy servers, stack fingerprinting and, 147ps command, 20, 32, 177published addresses in ARP tables, 31purchasing software, 137putty ssh tool, 271, 300pviewer.exe process tool, 44pview.exe process tool, 44
QQcheck benchmarking tool, 97, 300quality of service measurements, 236queso fingerprinting tool, 147, 300queuing delays or times, 80, 82, 83, 85
Rr-services, replacing with ssh, 259RADIUS exchanges, 106rates
of load generation, 234of return, 16
rateup mrtg tool, 212, 221rc files, 40readings and references, 308–315README files, 306read-only community strings, 163read-only SNMP objects, 172read/write community strings, 163read/write SNMP objects, 172REAL simulation project, 237real time capture counts, 126Realtime Transport Protocol, 92rebooting
netstat results and, 95as quick fix, 2
receive lights, 49receive queues, 24recompiling kernels, 37, 130

This is the Title of the Book, eMatter EditionCopyright © 2007 O’Reilly & Associates, Inc. All rights reserved.
Index 337
recordingcommand sequences in
troubleshooting, 256troubleshooting steps, 255–260
Red Hat Linux systems, 40, 292reference clocks, 267reference counts in routing tables, 25references and readings, 305–315reflectors in Smurf attacks, 63Registry Editor tool, 193registry (Microsoft Windows), 44regular expression matching, 172reinstalling software, 3relational operators in filters, 112, 115, 116remote frame buffers, 257remote logging with syslog tool, 262remote logon tools, 255–260remote monitoring probes
(RMON), 216–218remote networks
monitoring devices, 190ping and, 61remote configuration in management
software, 135in routing tables, 26traffic capture, 102
remote traffic, 202, 205remote video display memory, 257removing (see deleting)replaying captured tcpdump data, 107reports
documenting troubleshooting in, 274netmon, 220
reproducibility of performancemeasurements, 236
required objects in SNMP, 172resetting
clocks, 268ntop statistics, 199, 203systems as quick fix, 2
resolver flags, 248Resource Reservation Protocol (RSVP), 235resource starvation, 22resource utilization, 135resource-hogging processes, 22resources and references, 305–315retransmitting packets after capture, 231reverse address lookup, 138reverse name lookups, 73, 246, 248
reviewing design in performancemeasurement, 282
RFC tool descriptions, 293RIP packets, 114, 228, 250ripquery routing table tool, 250, 300rlogin authentication, 260RMON probes, 102, 216–218
thresholds, 217RMON2, 218rogue DHCP servers, 32rogue processes, 22Round Robin Database (rrd), 212, 212–216round-trip times
bing results, 86calculating, 82getif tool, 222graphing, 122packets, 54ping results, 55tkined results, 183
route tool, calls to, 39routed distribution, 250, 300routers
autodiscovery, 155emulators, 236IP addresses for, 74ntop results, 202ping and, 61prioritizing traffic, 65in routing tables, 25static addresses and, 138testing with spoofed addresses, 227traffic monitoring and, 196
routingbing options, 87traceroute, 71–79troubleshooting, 250
routing tablesadding entries to, 25address ranges in, 152getif results, 191Microsoft Windows, 42netstat listing, 24SNMP retrieval, 170snmpnetstat results, 174static entries, 25tkined results, 188troubleshooting, 250
rpcbind daemon, 251

This is the Title of the Book, eMatter EditionCopyright © 2007 O’Reilly & Associates, Inc. All rights reserved.
338 Index
rpcinfo command (NFS), 252rpc.mountd daemon, 251rpc.nfsd daemon, 251rpc.sprayd daemon, 232rpm (Red Hat Package Manager), 292rrd monitoring tool, 212, 212–216, 300RSA-based authentication, 260rsh authentication, 260RSVP (Resource Reservation Protocol), 235RTP (Realtime Transport Protocol), 92rtquery routing table tool, 250, 300rules in tcpwrappers tool, 266run levels, booting into, 40
SSAGE user group, 305samspade tool, 300Sanitize privacy scripts, 118, 301satan scanning tool, 269scaling
graphs, 210scalability vs. raw capacity, 17test networks, 236
scanners, security, 269scanning tools
Microsoft Windows tools, 44security and politics, 157uses, 32–34
scheduler in initialization, 39scion statistics tool, 205, 301scotty management tool
Microsoft Windows, 159SNMP usage, 179–181source web site, 301tkined requirements, 155
scrambling addresses in data, 119screen captures, 256, 271script command file output, 105, 256scripts
books and resources, 312extensible SNMP agents, 177languages for device discovery, 136MGEN and, 234scripting tools
network management, 149–151network maps and, 152
startup, 39secure HTTP, 204secure mode in syslog, 263
secure syslog tool, 263, 298security configuration files, 41security issues
books and resources, 312challenge response systems, 259compromised ps command, 32discovery tools and, 156egos and, 10expn and vrfy telnet commands, 242levels in syslog, 261Microsoft Windows and packet capture
tools, 131network management software, 135packet capture and, 100packet capture tools and, 129–131ping and DOS attacks, 63protecting networks, 130secrecy and, 9security tools, 269
cops, 269iss, 269nmap, 269portscan, 269sanitize, 118satan, 269system integrity checkers, 269tcpdpriv tool, 119tcpwrappers, 265, 269tripwire, 269
segmented networks and, 102Smurf attacks, 63SNMP security, 161ssh tools, 259switches and, 129syslog files, 262TCP streams and, 127testing firewalls, 278web server configuration, 244
segmenting networks, 102selector fields in syslog configuration, 261send queues, displaying with netstat, 24sendmail
books and resources, 310configuration files, 41starting with scripts, 39testing, 34(see also email)
serial connections with crossovercables, 52

This is the Title of the Book, eMatter EditionCopyright © 2007 O’Reilly & Associates, Inc. All rights reserved.
Index 339
serial counters in servers, 247servers
checking email servers, 241checking FTP performance, 244checking HTTP servers, 243debugging, 240listing open files, 27name servers, 246, 249NFS and, 251serial counters, 247stack fingerprinting and, 147stratum 1 and 2 servers, 267synchronizing clocks on, 267troubleshooting name services, 245vnc servers, 257, 258zone authority records, 247, 248
service contracts, 7, 15, 306services
automatically starting services, 21differential growth and, 286displaying for hosts, 23filtering traffic, 114protecting with tcpwrappers tool, 266run levels and, 40types of in packets, 127waiting for connection requests, 24
SET_REQUEST messages (SNMP), 162, 166,171
setup packets, 116SFS benchmarking tool, 253, 301shell scripts
dig tool and, 247sanitize tool, 118tclsh tool, 150tcp-reduce tool, 120
shutdown scripts, 40shutting down interfaces, 30siggen checksum tool, 270signatures for devices, 146Simple Network Management Protocol (see
SNMP)Simple Network Time Protocol (SNTP), 267simple watcher tool, 264simulations of system performance, 280simulators
animating, 237benefits, 236ns and nam tools, 237uses, 235–238
siphon fingerprinting tool, 147, 301sl4nt syslog tool, 301SLAC (Stanford Linear Accelerator
Center), 293SMB (System Messaged Blocks), 156SMI (Structure of Management
Information), 163SMS (Systems Management Server), 132SMTP protocol, 240Smurf attacks, 63snapshots of traffic data, 123SNMP for Perl 5 package, 301SNMP Manager tool, 136SNMP (Simple Network Management
Protocol)basic operation and structures, 160–165books and resources, 310in bottleneck analysis, 285community strings, 157, 161devices lacking support for, 181examining MIBs with tkined, 185–187graphing objects, 222managers and agents, 162Microsoft Windows, 190–193mrtg usage of, 205NET SNMP tool, 165–179objects, 161performance measurements, 205ports, 145RMON extensions, 216scotty tool, 179–181security issues, 161setting values with scotty, 179SNMP Manager, 136snmp.conf file, 167SNMPv1, 161SNMPv2 Classic, v2*, v2c, and v2u, 161SNMPv3, 161timeouts, 169tkined tool, 181–189toasters controlled by, 171traps, 184troubleshooting routing tables, 250versions, 161, 165
snmp.conf file, 167snmpd agent, 176–179
preventing forking, 177snmpd.conf file, 176snmpget utility, 166

This is the Title of the Book, eMatter EditionCopyright © 2007 O’Reilly & Associates, Inc. All rights reserved.
340 Index
snmpgetnext utility, 166, 169–170snmpnetstat utility, 174SNMP_Session.pm extension, 149snmpset utility, 166, 171snmpstatus utility, 175snmptable utility, 169–170snmptranslate utility, 171–174, 217snmptrap utility, 178snmptrapd daemon, 178snmpwalk utility, 169–170snoop tool, 124SNTP (Simple Network Time Protocol), 267sntpd clock tools, 267sock traffic tool, 231, 301socket TCP tool, 232, 301sockets
buffer size, 92displaying for connections, 24snmpnetstat results, 174
softwareconnectivity, 53installation troubleshooting, 277tools (see tools, names of specific tools)
Solaris systemschanging kernel parameters, 38configuration files, 35installing packages, 291kernel directives, 37packet capture, 124ping tools, 54
Solstice AdminSuite tool, 36source addresses
arbitrary addresses in hping, 227filtering, 113nemesis settings, 229
source codecomments in, 306downloading, 290
source routing, 73, 78sources for tools, 294–304spanning ports, 103spanning tree protocols, 112SPEC SFS tool, 253spidermap scanning scripts, 149, 301spoofed addresses, 141
hping settings, 227nmap settings, 141preventing with ssh, 260
in Smurf attacks, 63source routing and, 78
spoofing syslog messages, 263spray packet tool, 95, 232, 285, 301
interval settings, 233SQL databases, logging data to, 204ssh tools, 259, 300
authentication, 260books and resources, 311extensions, 303Microsoft Windows, 271monitoring devices with, 190remote probing with, 102source web site, 298, 301vnc in ssh sessions, 259
ssyslog log tool, 263, 301stack fingerprinting
nmap tool, 139, 148passive fingerprinting, 147queso tool, 147updating files, 148uses, 146–149
standard configuration files, 35Stanford Linear Accelerator Center
(SLCA), 293starting ports for traceroute, 74startup files, 39states, booting into, 40static IP addresses, 138status lights, 49stealth port scanners, 33, 141stealth scanning, 158step size in packets, 84store-and-forward switches, 84, 85storing log files, 263strategies for troubleshooting
generic troubleshooting, 273–277installation practices and, 277task-specific strategies, 277–287
stratum 1 and 2 servers, 267streams
capturing, 119following, 127
stress-testing networks, 95, 224–235strict source routing, 78strings analysis tool, 111stripcharts in tkined, 183strobe port tool, 33, 302

This is the Title of the Book, eMatter EditionCopyright © 2007 O’Reilly & Associates, Inc. All rights reserved.
Index 341
Structure of Management Information(SMI), 163
subnet masksaddress masks in interfaces, 29in ARP tables, 31packet headers, 115port scanning and, 140in routing tables, 26stack fingerprinting, 147wildcards in (*), 140
subnetscollapsing in diagrams, 154emulators, 235ntop results and, 201
substituting subsystems, 4subsystems
identifying in troubleshooting, 275substituting, 4
subtrees in MIBs, 164displaying with getif, 192displaying with snmptranslate, 173examining with tkined, 185retrieving with scotty, 179retrieving with SNMP, 169
summarizingconnection-by-connection statistics, 122data in ethereal, 127mrtg results, 206packet captures, 120
summary web pages of mrtg results, 206suppressing graph display in mrtg, 210suspending jobs in tkined, 183swap command (ntop), 198swapper in initialization, 39swapping
adapters, 53cables, 51components, 3
swatch log tool, 264, 302switches
compared to hubs, 103cut-through, 84, 85point-monitoring tools and, 197port aliasing, 103security and, 129static addresses and, 138store-and-forward, 84, 85traffic capture and, 101traffic monitoring and, 196
types of, 85unmanaged switches, 152
symbolic form in SNMP output, 174symptoms
changes in, 4identifying, 274system failures, 4
SYN packets, blocking, 141synchronizing clocks, 267sysctl command, 39syslog, configuration action fields, 261syslog command (scotty), 150syslog tool, 261–263
arpwatch data logging, 142configuring, 261Microsoft Windows, 271modular syslog, 263remote logging, 262secure syslog, 263security holes, 262syslog-ng tool, 263, 302
syslog.conf file, 261syslogd daemon, 261syslog-ng tool, 263, 302system clocks, synchronizing, 267system configuration files, 35–41
application files, 41configuration programs, 36kernel configuration, 36–39log files, 41mrtg, 206security files, 41startup files and scripts, 39testing, 266
system integrity checkers, 269system management
books and resources, 309(see also network management)
System Messaged Blocks (SMB), 156System Monitor tool, 193System Policy Editor tool, 193System V systems, 40Systems Management Server (SMS), 132
Ttables in SNMP objects, 170.tar files, 290Task Manager (taskmgr.exe), 44

This is the Title of the Book, eMatter EditionCopyright © 2007 O’Reilly & Associates, Inc. All rights reserved.
342 Index
task-specific troubleshootingstrategies, 277–287
taxonomy of software tools, 293tclets, 149tclsh shell, 150Tcl/Tk language, 149
books and resources, 312GUI extensions, 150Microsoft Windows port, 159scotty, 150, 181source web site, 302Tk extensions, 150tkined requirements, 155
TCP trafficACK packets, 140active sessions, 202analysis, 122capturing, 119displaying service status, 24filtering, 114following streams, 127generating with nemesis, 228headers, 89opening connections with NVT
ASCII, 240plotting, 123retrieving with tkined, 188sending with hping tool, 226
TCP window size, 90, 92tcpdchk testing tool, 266tcpdmatch testing tool, 266tcpdpriv privacy tool, 119, 302tcpdump tool, 104–118
analysis tools, 106, 118–124binary files, 106background capture, 106in bottleneck analysis, 284capturing RIP updates, 251command-line options, 107–118controlling display fields, 109controlling information display, 108extracting data files from, 121controlling program behavior, 107filtering options, 112–118merging files, 121Microsoft Windows, 131NFS usage, 253number of bytes captured, 108, 125one-line summaries in files, 120
replaying captured data, 107running, 105–107source web site, 302writing data to files, 106-107
tcpflow capture tool, 119, 302TCP/IP
books and resources, 309ICMP (see ICMP)stack fingerprinting, 146–149Windows configuration, 42
tcp-reduce extraction tool, 120, 197, 302tcpshow decoding tool, 121, 302tcpslice extraction tool, 121, 302tcp-summary extraction tool, 120, 302tcptrace analysis tool, 122–123, 197, 302tcpwrappers permissions tool
configuration, 41logging in, 196, 265as security tool, 269source web site, 303
teardown packets, 116tee command, 105, 256telnet
checking FTP and TFTPperformance, 244
filtering traffic from, 116identifying hardware with, 145logging sessions, 257monitoring devices with, 190ports, 145, 147remote probing with, 102retrieving email, 242root and, 28sending email, 241stack fingerprinting and, 147tcpdump tool and, 105testing sendmail with, 34traffic in ntop results, 199troubleshooting email protocols, 240
teraterm ssh tool, 271, 303terminated connections, 24termination on cables, 50testing
adapters, 52cabling, 49–52configuration files, 266connectivity protocols (see connectivity
protocols)connectivity (see connectivity testing)

This is the Title of the Book, eMatter EditionCopyright © 2007 O’Reilly & Associates, Inc. All rights reserved.
Index 343
filters, 113firewalls, 229, 230, 278hypotheses in troubleshooting, 275IP addresses, 138parameters in performance
measurement, 282performance (see performance
measurement)software or hardware installations, 277
tethereal packet capture tool, 125.tgz files, 290thresholds
netmon, 220RMON, 217tkined settings, 183
throughput, 80achievable, 88bing results, 86of connections, 56graphing averages, 202graphs, 122measurements, 79, 88–92
iperf tool, 91Microsoft Windows, 97netperf tool, 90treno tool, 92ttcp tool, 89–90
ntop results, 198, 199time sequence graphs, 122time-series data, 212timeouts
NFS and, 253SNMP options, 169in traceroute, 74
timestampsextracting traffic data by, 121in packets, 60, 118synchronizing clocks, 267tcpdump tool, 109troubleshooting printouts, 256
time servers, 267tjping packet tool, 70, 303Tk extensions, 150, 155, 159
(see also Tcl/Tk language)tkined management tool, 149, 150
autodiscovery, 155caveats, 188changing monitoring options, 183collapsed groups, 154, 182
community strings and, 189examining MIBs, 185–187ICMP monitoring, 181–184manually drawing maps, 153mapping networks, 153–155Microsoft Windows, 159, 191monitoring SNMP objects, 188performance measurements, 205poll interval, 183polling devices, 188reports, 188requirements, 155restarting jobs, 183saving changes in, 188SNMP traps, 184SNMP usage, 181–189source web site, 303trouble menu information, 188
tmetric bandwidth tool, 83, 303tnm extensions (scotty), 150, 159toasters controlled by SNMP, 171Tool Command Language (see Tcl/Tk
language)tools
characteristics of managementsoftware, 135
datestamping and versions, 7installing, 289–292inventories of contents, 7legal and ethical considerations, 11licenses, 293network management tools in
troubleshooting, 135preparing for problems, 5(see also specific types of tools, i.e.,
packet capture)sources for, 293, 294–304taxonomy of, 293
top process display tool, 22, 197, 303topology problems, using maps to
resolve, 151traceroute routing tool
complications, 74–79cyberkit suite, 158getif and, 192identifying address ranges, 152loose source routing, 78options, 74path discovery with, 71–79

This is the Title of the Book, eMatter EditionCopyright © 2007 O’Reilly & Associates, Inc. All rights reserved.
344 Index
traceroute routing tool (continued )source web site, 296, 303timeouts, 74tracert tool, 97using with tkined, 155
tracert routing tool, 75, 97tracking
changes to systems with tripwire, 270FTP transfers, 29IP addresses, 138log files, 263open files on systems, 26software installations, 7
trafficgenerated by pathchar, 85throughput improvements and, 88understanding current behavior, 5
traffic capture tools, 100access to traffic, 101analysis tools, 118–124duplicating traffic on ports, 103ethereal tool, 125filters, 112getif tool, 222methods of capturing data, 103network-monitoring tools, 196sanitizing captures, 118security issues, 129–131snapshots of data, 123snoop tool, 124tcpdump tool, 104–118
traffic control configuration files, 41traffic graphs
daily, 210, 214hourly, 214monthly, 210, 214weekly, 210, 214yearly, 210
traffic load generation (see load generators)traffic measurement tools, 79, 94–97
busy hours and, 195, 205as first step in performance
measurement, 195host-monitoring tools, 196load generators (see load generators)local vs. remote traffic, 205Microsoft Windows, 97network-monitoring tools, 205–216
point-monitoring tools, 196, 197–204traffic intervals and locations, 195
traffic monitors (see traffic capture tools)trafshow capture tool, 123, 303transfer rates in ttcp tool, 89translating OID numbers to
names, 171–174transmission delays or times, 80transmission points, hidden or
unknown, 84, 87transmission rates, 80transmit lights, 49transport-level protocols (see names of
specific protocols)transport-level services, 114TRAP message (SNMP), 162traps, 160
alerts for network problems, 162generating, 178Microsoft Windows, 190RMON, 217scotty trap handlers, 180SNMP agents and, 176–179snmptrap utility, 178snmptrapd utility, 178tkined usage, 184
trayping packet tool, 70, 303trend analysis, 135, 216, 285, 286treno bulk transfer tool, 92, 303tripwire integrity tool, 18, 269, 272, 303troubleshooting
books and resources, 311data collection, 1developing solutions, 277diagnosing problems
breaking problems into pieces, 3changes to systems, 3data collection, 1general approaches, 2
documenting networks, 6–8documenting steps in, 255–260firewall installation, 278installation, 277logging telnet sessions, 257management practices, 6preparing for problems, 5proactive nature of, ixrecording command line sequences, 256

This is the Title of the Book, eMatter EditionCopyright © 2007 O’Reilly & Associates, Inc. All rights reserved.
Index 345
solutions in, 277, 285strategies
generic troubleshooting, 273–277task-specific strategies, 277–287
system configuration files, 35–41tools (see tools)versus network management, 134–137
truncating packets, 108trust relationships, 36, 41ttcp load testing tool
generating loads with, 231Microsoft Windows, 97source web site, 303uses, 89–90
TTL field, 55, 56, 72, 227ttssh ssh extensions, 271, 303tuning networks, 195twisted pair cable, 52
UUCD SNMP tools, 165–179, 205, 296
(see also NET SNMP)UDP (Unreliable Datagram Protocol)
bandwidth, 91filtering packets, 114hping tool, 226load generation, 232MGEN tool, 233nemesis tool, 228NTP usage of, 267syslog use of, 263throughput, 90traceroute tool, 72
unauthorized changes to systems, 6uncompressing software tools, 290unformatted timestamps, 109, 118unicast packets, 200unknown transmission points, 84unmanaged hubs and switches, 152unpacking
software, 290Solaris packages, 291
unreachable devices or hostsARP tables and, 32checking with getif, 192checking with tkined, 182ping and, 58routing troubleshooting, 250traceroute and, 73
unreachable networksping and, 58traceroute and, 73
unresolved addresses in ARP tables, 31usage patterns, 195USENIX user group, 305user groups, 305users
authentication, 260data collection, 12dissatisfaction, 194privacy of, 12
utilities (see tools)utilization statistics (RMON), 216
Vvariables
monitoring with tkined, 188SNMP objects as, 161
vendorsadapter configuration software, 52diagnostic tools, 307documentation, 307host vendor information, 201information in arpwatch tool, 143web sites, 306
verbose outputarping tool, 68bing, 87echoping, 67hping tool, 226nemesis tool, 229pathchar, 84ping tools, 59ps command, 21SNMP, 178tcpdump tool, 109traceroute tool, 74
verifying results in troubleshooting, 276versions
displaying for SNMP, 169distinguishing tools and
documentation, 7software management, 135
victims in Smurf attacks, 63view only mode (vnc), 258viewers in vnc, 257VINT (Virtual InterNetwork Testbed), 237virtual LANs, 112, 131, 152

This is the Title of the Book, eMatter EditionCopyright © 2007 O’Reilly & Associates, Inc. All rights reserved.
346 Index
virtual network computing (vnc), 257–259Visio, 159VLANs (virtual local area networks), 112,
131, 152vnc remote control tool, 192, 257–259, 271,
304processes, 263
vrfy command (telnet), 242
Wwalk operations in SNMP, 169, 187WAP traffic, 202warm reboots, 2warranties, 7web browsers, testing connectivity with, 69web ntop mode, 199web pages
cricket, 213mrtg, 208
web protocol books and resources, 311web servers
cricket and, 215port 80, 67security file configuration, 244troubleshooting, 244vnc tool and, 259
web sitesmagazine sites, 308software web sites, 306traceroute looking glass sites, 78vendor sites, 306
whois tool (cyberkit), 158wildcards in subnet masks (*), 140window screen captures, 256, 271window size, TCP, 90, 92Windows registry, 44Windows Resource Kit, 44WinDump and WinDump95 tools, 131, 304winipcfg configuration tool, 42winping packet tool, 70, 304
wire-map testing, 50wiring (see cabling)wish shell, 150working files, mrtg, 208wrapper programs, 265writing data to files, 107
command output, 256decoding files, 121interface configuration information, 207IP scans, 142name resolution data, 249
writing data to SQL databases, 204
XX Window software
capturing windows, 256displaying sessions remotely, 258ethereal tool and, 124plotting tools, 123remote probing with, 102tcpdump tool and, 105Tk extensions, 150
X.25 network files, 27xinetd inetd tool, 265, 304xlogmaster log tool, 264, 304xplot graphing tool, 122, 123, 197, 304xv image tool, 256, 304xwd command (X Window), 256
Yypcat NIS tool, 250ypmatch NIS tool, 250ypwhich NIS tool, 250
Zzeroing ntop statistics, 199, 203zone authority records, 246, 248zone transfers, 249

About the AuthorJoseph D. Sloan has been working with computers since the mid-1970s. He beganusing Unix as a graduate student in 1981, first as an applications programmer andlater as a system programmer and system administrator. Since 1988 he has taughtmathematics and computer science at Lander University. He also manages thenetworking computer laboratory at Lander, where he can usually be found testingand using the software tools described in this book.
ColophonOur look is the result of reader comments, our own experimentation, and feed-back from distribution channels. Distinctive covers complement our distinctiveapproach to technical topics, breathing personality and life into potentially drysubjects.
The animal on the cover of Network Troubleshooting Tools is a basilisk, a lizardbelonging to the iguana family. Its name comes from the mythological basilisk(also known as a cockatrice), a reptile with a deadly gaze and breath, said to havebeen hatched from a rooster’s egg by a serpent.
Though the two crests along their backs may make them look ferocious, basilisklizards aren’t deadly to anyone but the bugs and occasional worms and smallanimals they eat. They grow to about two or two and a half feet long, with mostof that length in their tail. The banded basilisk is brown with a yellow stripe alongeach side of its body, and other basilisk species are green or brown.
Unlike their mythological counterparts, real basilisks are hatched from basiliskeggs. The female basilisk digs a shallow hole in moist dirt, lays up to 18 eggs inthe hole, and covers them with dirt. Then she goes back to her swinging singlebasilisk life, leaving the eggs and later the young lizards to fend for themselves.They do this quite well, taking up residence in trees and finding their own foodsoon after hatching.
The talent that basilisks are most known for is their ability to do something thatlooks remarkably like walking on water. In reality, their webbed hind feet trap abubble of air beneath them as they run, buoying them up so that their feet don’tsink more than an inch or so below the water. A small basilisk can run like this forup to 60 feet without sinking.

Catherine Morris was the production editor and proofreader, and Norma Emorywas the copyeditor for Network Troubleshooting Tools . Sarah Jane Shangraw, EmilyQuill, and Claire Cloutier provided quality control. Jan Wright wrote the index.
Emma Colby designed the cover of this book, based on a series design by EdieFreedman. The cover image is a 19th-century engraving from the Dover PictorialArchive. Emma Colby produced the cover layout with QuarkXPress 4.1 usingAdobe’s ITC Garamond font.
Melanie Wang designed the interior layout based on a series design by NancyPriest. Anne-Marie Vaduva converted the files from Microsoft Word to FrameMaker5.5.6 using tools created by Mike Sierra. The text and heading fonts are ITC Gara-mond Light and Garamond Book; the code font is Constant Willison. Theillustrations that appear in the book were produced by Robert Romano andJessamyn Read using Macromedia FreeHand 9 and Adobe Photoshop 6. This colo-phon was written by Leanne Soylemez.
Whenever possible, our books use a durable and flexible lay-flat binding. If thepage count exceeds this binding’s limit, perfect binding is used.