
On sharpness of two-sided discrete maximum principles for reaction-diffusion problems

CHT/CFD Predictions of Impingement Cooling with Four Sided Flow Exit
Abubakar M. El-Jummah, Gordon E. Andrews and John E.J. Staggs
Energy Research Institute School of Chemical and Process Engineering
University of Leeds Leeds LS2 9JT, UK
ABSTRACT Impingement/effusion cooling has no cross-flow in the
impingement gap if all the coolant flow through the
impingement wall passes through the effusion wall. In this
investigation, the impingement part of the
impingement/effusion cooling was investigated by
minimising the cross-flow using a four sided exit
impingement cooling geometry. The impingement
geometry investigated was a square array of 10 by 10
impingement holes with a pitch to diameter, X/D, of 11,
hole density, n, of 4306m-2
, and gap to diameter ratio, Z/D,
of 7.25 for coolant mass flux G of 0.2 - 1.1 kg/sm2bar. The
impingement target and jet walls were modelled as
Nimonic-75 as used in the experimental work used for
validation of the computational methods. Conjugate heat
transfer (CHT) computational fluid dynamics (CFD) was
used with ANSYS Fluent code. The measured impingement
target wall pressure loss ∆P/P% and target wall surface
averaged heat transfer coefficient together with the heat
transfer to the impingement jet wall were all predicted in
agreement with the measurements, within the measured
error bars. The predicted surface distributions of Nu and
turbulent kinetic energy (TKE) were compared with
predictions for impingement single sided exit flow and the
impingement/effusion approach (target) walls. This showed
that the reduced crossflow with the four sided exit gave
higher surface averaged heat transfer. However, comparison
with the impingement/effusion wall heat transfer, for the
same impingement wall geometry, showed that the removal
of coolant through the effusion wall reduced the
recirculating flow in the impingement gap and this reduced
the heat transfer to the impingement jet wall, but increased it
to the target effusion wall.
INTRODUCTION Impingement/effusion heat transfer is used in both gas
turbine (GT) combustor and turbine blade cooling
applications[1-6]. In combustor impingement/effusion wall
cooling the minimum mass flux, G kg/sm2bar, is desired that
will adequately cool the combustor wall. This is because
this effusion cooling air is not availabe for lean combustion
and this means that the lean combustion zone operates richer
at higher temperature and this increases NOx emissions [7].
For turbine blades, effusion film cooling air mass flux needs
to be minimised from a cycle thermal efficiency viewpoint.
Thus for both combustor and turbine blade wall cooling the
use of effusion and impingement/effusion cooling requires
low coolant mass flow rates, G. This is the application of the
present work and the overall surface impingement cooling
was investigated at low G, which was varied from 0.2 – 1.1
kg/sm2bar. Although the present work only investigated
impingement cooling, the aim was to determine the
impingement cooling under the low G circumstances that
apply in impingement/effusion cooling. In this application,
the impingement jet wall has the bulk of the combustor
pressure loss, which combined with the low G requires a
high impingement X/D such as the 11/1 used in the present
work.
In previous CHT/CFD work on impingement cooling
with a single sided exit the authors [2-4] have investigated
high G of about 2 kg/sm2bar, which is representative of all
the combustion air being used for regenerative impingement
combustor wall cooling, which enables film cooling air to be
reduced to zero, as first suggested by Abdul Hussain and
Andrews [5] and Andrews et al. [8]. The outlet from the
impingement gap flows into the low NOx flame stabiliser.
This single sided exit geometry gives the maximum cross-
flow in the impingement gap. This high G impingement
combustor wall cooling application has to occur with a low
pressure loss and most of the available pressure loss has to
be retained for flame stabilisation and fuel and air mixing. A
high G low pressure loss application requires a low X/D
impingement geometry [2]. The first application of high G
low ∆P/P regenerative cooling for low NOx combustors
was that of Huitenga and Norster [9].
Impingement/effusion cooling has no impingement air
cross-flow in the gap, as all the impingement air flows out of
the effusion holes. The nearest impingement geometry to
this, without the effusion jets present, is for the impingement
gap to have four sided exits [6, 10-14], so that cross-flow is
minimised. From the centre hole to the gap exit edge, the
number of upstream rows of holes N in the present work
was 5, compared with 10 for the equivalent single sided exit
case. This automatically reduces the influence of cross-flow
in the impingement gap. Figure 1 was the geometry
investigated in the present work using flat surface heat
transfer, which approximates to a large diameter combustor
surface with low curvature [14-18]. This flat surface
approximation is also often used in turbine blade cooling for
the mid-chord region [18, 19].
The minimum cross-flow effect for the four sided
impingement jet flow exit geometry shown in Figure 1 [6,
11, 13, 20-22] has been shown experimentally to be
1 Copyright © 2015 by ASME
Proceedings of ASME Turbo Expo 2015: Turbine Technical Conference and Exposition GT2015
June 15 – 19, 2015, Montréal, Canada
GT2015-42256
Downloaded From: http://turbomachinery.asmedigitalcollection.asme.org/ on 08/21/2015 Terms of Use: http://www.asme.org/about-asme/terms-of-use

(a) Impingement jet wall (b) Target wall
Figure 3 Experimental test walls with range of thermocouples location [2, 11]
compatable with the impingement heat transfer in
impingement/effusion cooling [8, 22, 23]. Abdul Husain et
al. [24] have reported overall cooling effectiveness
experimental results for impingement/effusion cooling using
a hot wall test rig.
Electrically heated metal wall impingement experimental
rigs [13, 25-27], as shown in Figure 2 [1-5, 11] have been
used to determine the surface averaged heat transfer
coefficient using the lumped capacitance experimental
method with a transient cooling technique. These
measurements are used to validate the present CHT/CFD
predictions. Similar work has been carried out with
adiabatic walls [28-30].
The present CHT CFD investigates the influence of mass
flux G for a fixed X/D and Z/D of four sided impingement
jet exit flow that has been investigated experimentally [10,
11, 22] using Figure 2 test rig and flat test walls of Figure 3.
For single sided impingement flow exit, the optimum
number of impingement holes was shown to be n of
4306/m2, which is 10 rows of square array holes. For
impingement/effusion cooling a low coolant mass flux is
required, as explained above and the optimum geometry will
have the main pressure loss at the impingement jet wall, as
this gives the highest impingement jet velocities. The
effusion wall will have a low pressure loss with low jet
velocities or low blowing ratio M. This requires, for the
same n or pitch X, larger diameter effusion holes than
impingement holes or large X/D for the impingement jet
wall and low X/D for the effusion wall.
The impingement wall X/D was 11.04 in the present
work and for a design G of 0.4 kg/sm2bar, this gives a 3%
pressure loss, which is typical of combustor wall pressure
loss. The authors [2] have previously predicted the effect of
the impingement X/D for single sided exit for a high G of
1.9 kg/sm2bar. This showed the large increase in
impingement heat transfer that occurred as X/D was
increased for the same G. The range of G in the present
work was varied from 0.2 - 1.1 kg/sm2bar, which also varied
Figure 1 Four sided impingement jet flow exit geometry [6]
Figure 2 Four sided impingement gap Z exit flow
experimental test rig [10, 11]
2 Copyright © 2015 by ASME
Downloaded From: http://turbomachinery.asmedigitalcollection.asme.org/ on 08/21/2015 Terms of Use: http://www.asme.org/about-asme/terms-of-use

the jet hole Reynolds number Re from 2.1 × 10³ - 13.1 ×
103, this corresponds to the range of G in the experimental
data best used for comparison [6, 11-13].
A constant impingement gap Z of 10 mm was used as
this is a practical Z for combustor wall impingement
cooling. At the X/D of 11.04 this gives a Z/D of 7.25.
Andrews et al. [6] have shown that for an X/D of 11 the
influence of Z/D on the surface averaged heat transfer was
small over the Z/D range of 2 - 8. A feature of impingement
heat transfer that is rarely investigated is that the
impingement jet on a hot wall is heated by the surface heat
transfer and this heated jet reflects in the gap and the reverse
flow [26] impinges on the impingement jet surface and heats
it. However, the convected heat transfer to the impingement
jet surface has had few measurements, apart from that of
Andrews et al. [11, 13, 24, 31]. This work expressed the
temperature of the impingement jet surface as a dimensional
ratio to the impingement jet wall to coolant temperature
difference and this was predicted in the present work. This
impingement jet wall heat transfer was predicted for a single
sided exit flow [2-5], but the experimental results used for
comparison did not report this heat transfer, although good
agreement with the target wall surface average heat transfer
was achieved. The present work gives the first comparison
of measured and predicted normalized temperature showing
the effect of the reverse flow impingement jet wall surface
heat transfer.
EXPERIMENTAL GEOMETRIES MODELLED
The impingement wall porosity A (hole area/X2), is
related to X/D by Equation 1. The impingement jet array
coolant mass flux G and the impingement jet wall pressure
loss are related to the impingement X/D by Equation 2 [22,
23] and the impingement jet Re is given by Equation 3 and
the impingement jet velocity by Equation 4 [11]. The
crossflow velocity, Uc, for single sided impingement gap
exit flow is given by Equation 5 and its ratio to the
impingement jet velocity in Equation 6. Experimentally, the
measured pressure loss was the difference in the air plenum
static pressure from the ambient pressure. This was
corrected for the duct exit static pressure loss to give the
static pressure from the plenum to the wall static pressure of
the impingement gap discharge duct, which was the
predicted pressure loss.
)1(4
5.0
AD
X
)2(2
5.0
P
P
RTAC
RT
AVG d
j
)3(4
Re
5.0
An
G
)4(24
5.02
P
PRTC
D
XG
A
GV dj
The crossflow velocity at the impingement gap exit for
single sided exit, Uc, is fixed by G and Z, as shown in Eq. 5.
However, as the impingement jet velocity increases with
X/D then the ratio of this jet velocity to the crossflow
velocity, Vj/Uc, increases as shown by Equation 6, which
assumes that the two flow densities are the same.
ZXnGU c (5)
NAX
Z
X
Z
D
X
NU
V
c
j
241
(6)
The specific impingement geometries modelled for all G
values in the present work, are the same as that used
experimentally [10, 31] and is given in Table 1. This
geometry is a practical actual size combustor cooling
geometry and is not a scaled up model of the geometry as is
often used. The holes were manufactured using spark
erosion and thus had a practical internal surface roughness.
The flow conditions modelled were also the same as those
used experimentally, but with no specific surface roughness
procedure other than the use of wall functions.
Table 1 Geometrical Parameters
Table 2 Computational Flow Conditions
G
kg/sm2bar
Vj
(m/s)
Reh
(ρVjD/μ)
Predicted
∆P/P (%)
Measured
ΔP/P %
0.20 25.34 2380 0.74 0.63 0.30 38.02 3570 1.62 1.42 0.50 63.32 5940 4.30 3.94
0.63 79.77 7490 6.58 6.23
0.77 97.61 9160 11.71 9.35
1.10 139.36 13080 17.62 19.08
The flow conditions are summarised in Table 2, which also
gives the experimentally measured pressure loss. The range
of jets Re are all higher than the critical Re for turbulent
flow limit of > 2300. However, the jet turbulence in the
impingement jet hole that is controlled by the hole Re, is
largely irrelevant in the heat transfer as it is the impingement
on the target surface that creates the intense turbulence that
controls the heat transfer [17, 32].
The use of realistic GT combustor jet hole sizes [22] in
the present work ensures that the length scale of turbulence
is correctly modelled, as this is set by the hole diameter.
The common practice of investigating impingement heat
transfer is of the order of 10 times the jet hole size, so that
spatial resolution of the heat transfer can be achieved. This
has a problem of increased turbulence length scale, which
may influence the heat transfer. In engines impingement Re
are higher than in the present work due to the high pressure
which increases the flow density, but does not change the jet
velocity. The turbulence on the impingement target wall is
considered to be more realistically generated using actual
scale impingement geometries than in scaled up geometries.
Cd 0.80 [11, 32]
D (mm) 1.38
X (mm)
Z (mm)
15.24
10.00
L (mm)
L/D
6.35
4.60
X/D 11.04
Z/D
X/Z
7.25
1.52
A% 0.64
n ( m-2
) 4306
Array 10 × 10
3 Copyright © 2015 by ASME
Downloaded From: http://turbomachinery.asmedigitalcollection.asme.org/ on 08/21/2015 Terms of Use: http://www.asme.org/about-asme/terms-of-use

However, it does mean that experimental spatial resolution
of heat transfer is lost and for metal surfaces gives only the
locally surface average heat transfer, which was the data
used to validate the computations.
The experimental results for four sided exit impingement
heat transfer that are modelled here used the lumped
capacity method [1-5] in determining the surface averaged
heat transfer coefficient. The target wall was 6.3 mm thick
and was heated to about 353 K. The heat was removed and
the impingement flow established. There was an array of
imbedded thermocouples 25.4 mm apart in the test walls as
Figure 3 shows, where transient cooling of the target wall by
the impingement jet flow was recorded [10-12, 22, 31]. The
time constant of the cooling was determined and from this
the local surface average HTC h was determined for each
thermocouple location using Equation 7, hence the Nu in
Equation 8 could be determined. An additional experimental
technique that was used was to operate the test rig of Figure
2 at steady state with an insulated heated target wall. A
steady state heat balance then determined the locally average
target surface temperature from which h could be
determined. Overall the maximum error for h was 10% and
1% for the test wall diameter [22], which gives an 11% Nu
uncertainty. This was the technique used to measure the
surface average temperature of the impingement jet wall and
these measurements are directly predicted in this work.
)7(
TT
qh
s
Not to scale and all dimensions are in mm as shown in Table 1
Figure 4 Symmetrical elements of the model geometry
Figure 5 Model geometry computational grids
)8(fk
hDNu
)9(2X
hDLhX
4 Copyright © 2015 by ASME
Downloaded From: http://turbomachinery.asmedigitalcollection.asme.org/ on 08/21/2015 Terms of Use: http://www.asme.org/about-asme/terms-of-use
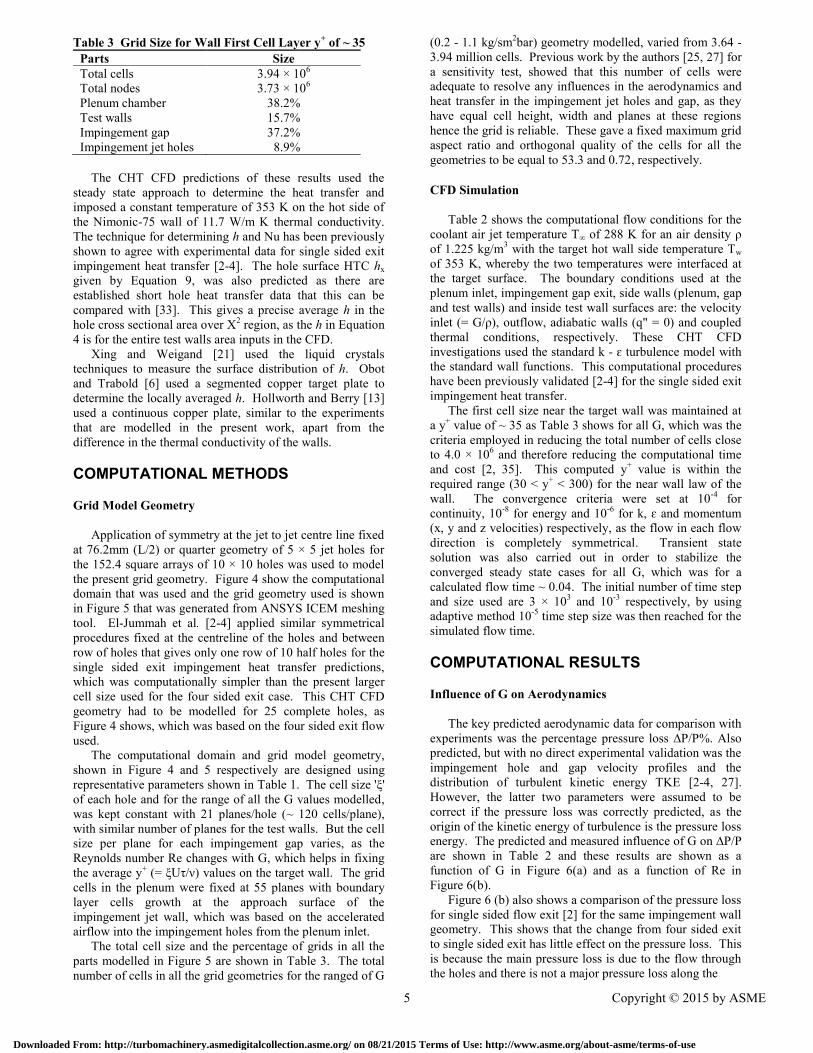
Table 3 Grid Size for Wall First Cell Layer y+ of ~ 35
The CHT CFD predictions of these results used the
steady state approach to determine the heat transfer and
imposed a constant temperature of 353 K on the hot side of
the Nimonic-75 wall of 11.7 W/m K thermal conductivity.
The technique for determining h and Nu has been previously
shown to agree with experimental data for single sided exit
impingement heat transfer [2-4]. The hole surface HTC hx
given by Equation 9, was also predicted as there are
established short hole heat transfer data that this can be
compared with [33]. This gives a precise average h in the
hole cross sectional area over X2 region, as the h in Equation
4 is for the entire test walls area inputs in the CFD.
Xing and Weigand [21] used the liquid crystals
techniques to measure the surface distribution of h. Obot
and Trabold [6] used a segmented copper target plate to
determine the locally averaged h. Hollworth and Berry [13]
used a continuous copper plate, similar to the experiments
that are modelled in the present work, apart from the
difference in the thermal conductivity of the walls.
COMPUTATIONAL METHODS
Grid Model Geometry
Application of symmetry at the jet to jet centre line fixed
at 76.2mm (L/2) or quarter geometry of 5 × 5 jet holes for
the 152.4 square arrays of 10 × 10 holes was used to model
the present grid geometry. Figure 4 show the computational
domain that was used and the grid geometry used is shown
in Figure 5 that was generated from ANSYS ICEM meshing
tool. El-Jummah et al. [2-4] applied similar symmetrical
procedures fixed at the centreline of the holes and between
row of holes that gives only one row of 10 half holes for the
single sided exit impingement heat transfer predictions,
which was computationally simpler than the present larger
cell size used for the four sided exit case. This CHT CFD
geometry had to be modelled for 25 complete holes, as
Figure 4 shows, which was based on the four sided exit flow
used.
The computational domain and grid model geometry,
shown in Figure 4 and 5 respectively are designed using
representative parameters shown in Table 1. The cell size 'ξ'
of each hole and for the range of all the G values modelled,
was kept constant with 21 planes/hole (~ 120 cells/plane),
with similar number of planes for the test walls. But the cell
size per plane for each impingement gap varies, as the
Reynolds number Re changes with G, which helps in fixing
the average y+ (= ξUτ/ν) values on the target wall. The grid
cells in the plenum were fixed at 55 planes with boundary
layer cells growth at the approach surface of the
impingement jet wall, which was based on the accelerated
airflow into the impingement holes from the plenum inlet.
The total cell size and the percentage of grids in all the
parts modelled in Figure 5 are shown in Table 3. The total
number of cells in all the grid geometries for the ranged of G
(0.2 - 1.1 kg/sm2bar) geometry modelled, varied from 3.64 -
3.94 million cells. Previous work by the authors [25, 27] for
a sensitivity test, showed that this number of cells were
adequate to resolve any influences in the aerodynamics and
heat transfer in the impingement jet holes and gap, as they
have equal cell height, width and planes at these regions
hence the grid is reliable. These gave a fixed maximum grid
aspect ratio and orthogonal quality of the cells for all the
geometries to be equal to 53.3 and 0.72, respectively.
CFD Simulation
Table 2 shows the computational flow conditions for the
coolant air jet temperature T∞ of 288 K for an air density ρ
of 1.225 kg/m3 with the target hot wall side temperature Tw
of 353 K, whereby the two temperatures were interfaced at
the target surface. The boundary conditions used at the
plenum inlet, impingement gap exit, side walls (plenum, gap
and test walls) and inside test wall surfaces are: the velocity
inlet (= G/ρ), outflow, adiabatic walls (q" = 0) and coupled
thermal conditions, respectively. These CHT CFD
investigations used the standard k - ɛ turbulence model with
the standard wall functions. This computational procedures
have been previously validated [2-4] for the single sided exit
impingement heat transfer.
The first cell size near the target wall was maintained at
a y+ value of ~ 35 as Table 3 shows for all G, which was the
criteria employed in reducing the total number of cells close
to 4.0 × 10⁶ and therefore reducing the computational time
and cost [2, 35]. This computed y+ value is within the
required range (30 < y+ < 300) for the near wall law of the
wall. The convergence criteria were set at 10-4
for
continuity, 10-8
for energy and 10-6
for k, ɛ and momentum
(x, y and z velocities) respectively, as the flow in each flow
direction is completely symmetrical. Transient state
solution was also carried out in order to stabilize the
converged steady state cases for all G, which was for a
calculated flow time ~ 0.04. The initial number of time step
and size used are 3 × 10³ and 10
-3 respectively, by using
adaptive method 10-5
time step size was then reached for the
simulated flow time.
COMPUTATIONAL RESULTS
Influence of G on Aerodynamics
The key predicted aerodynamic data for comparison with
experiments was the percentage pressure loss ∆P/P%. Also
predicted, but with no direct experimental validation was the
impingement hole and gap velocity profiles and the
distribution of turbulent kinetic energy TKE [2-4, 27].
However, the latter two parameters were assumed to be
correct if the pressure loss was correctly predicted, as the
origin of the kinetic energy of turbulence is the pressure loss
energy. The predicted and measured influence of G on ∆P/P
are shown in Table 2 and these results are shown as a
function of G in Figure 6(a) and as a function of Re in
Figure 6(b).
Figure 6 (b) also shows a comparison of the pressure loss
for single sided flow exit [2] for the same impingement wall
geometry. This shows that the change from four sided exit
to single sided exit has little effect on the pressure loss. This
is because the main pressure loss is due to the flow through
the holes and there is not a major pressure loss along the
Parts Size
Total cells
Total nodes
3.94 × 10⁶
3.73 × 10⁶
Plenum chamber
Test walls
38.2%
15.7%
Impingement gap 37.2%
Impingement jet holes 8.9%
5 Copyright © 2015 by ASME
Downloaded From: http://turbomachinery.asmedigitalcollection.asme.org/ on 08/21/2015 Terms of Use: http://www.asme.org/about-asme/terms-of-use

(a) Four sided exit flow
(b) Comparison with El-jummah et al. [2] CFD predictions
Figure 6 Comparison of predicted and measured ∆P/P
impingement gap caused by the cross-flow. Also shown in
Figure 6 (b) are the ∆P/P predictions [2] at very high G,
where the Re is varied by varying the hole diameter at
constant coolant flow rate. The same computational
procedures as in the present work were used and good
agreement with the experimental results are shown. The
present work has reasonable agreement with the
experimental pressure loss results as shown in Table 2 and
Figure 6 (a). The difference between predicted and
measured ∆P/P varied between 5 and 27%, with the best
agreement was for G = 0.6 - 1.
The measurements in Table 1 are based on the
assumption of constant Cd in Equation 2. However, the
actual experimental results [11, 32] show a dependence of
Cd on Re and at low Re of 4000 was 0.77 and at 2000 was
0.76. For high mass flux at Re > 10,000 compressibility
effects are significant and the Cd falls to 0.76. These changes
in Cd account for most of the differences in the predications
and measurement for low and high G in Figure 6 (a) as a Cd
difference of 0.76 from 0.80 is a 10% difference in pressure
loss. When this is taken into account the agreement between
measurement and predictions is all better than 10%. This
shows that the predictions of the aerodynamics were
reasonable.
Figure 7 (a and b) shows the CFD three-dimensional
(3D) predicted and two-dimensional (2D) experimental [27]
(a) CFD predictions: 3D for G of 0.5kg/sm2bar
(b) Experiment [27]: 2D
Figure 7 Impingement gap jet flow pathlines velocity
velocity pathlines. The interactions of the jets on the target
wall that creates a flow reversal jet flow, on the centreline
between the impingement holes is shown in Figure 7. This
reverse flow takes away heat from the target wall [2] and
recirculates it to heat up the impingement jet wall.
The surface distribution of turbulent kinetic energy
(TKE) for the square arrays of 100 holes and for a G of 0.5
kg/sm2bar is shown in Figure 8. The peak TKE distribution
is centred around the impingement point with low
turbulence elsewhere on the surface. Figure 8 (a) shows that
as the flow moves to the outer regions there is some
evidence of convection of the turbulence in the cross-flow
direction, but this is much lower than for single exit cross-
flow, as Figure 8 (b) shows. The central region is
unaffected by the cross-flow for the central 16 holes, which
is two rows of holes in the cross-flow direction.
The central four holes are compared with the leading
edge four holes for single sided exits in Figure 9, for the
same G of 0.5 kg/sm2bar at the same X/D and Z/D. Figure 9
(a) for the present four sided exits has lower TKE between
the impingement points. This indicates that with single sided
exit the flow for the first row of holes is affected in a way
that increased the turbulence between the impingement
points as the flow has to turn in one direction. This will be
shown later to result in better heat transfer for the single
sided exit.
Figure 9 (c) compares the impingement only predictions
of Figure 9 (a and b) with the equivalent turbulence for
impingement/effusion cooling. This prediction shows that
the surface distribution of turbulence in the inter
6 Copyright © 2015 by ASME
Downloaded From: http://turbomachinery.asmedigitalcollection.asme.org/ on 08/21/2015 Terms of Use: http://www.asme.org/about-asme/terms-of-use

Figure 8 Target surface distribution of TKE for G of 0.5
kg/sm2bar at fixed X/D of 11.04 and Z/D of 7.25
Figure 9 Comparison of target surface distribution of TKE
for G of 0.5 kg/sm2bar at X/D of 11.04 and Z/D of 7.25
impingement jet region is enhanced with very little of the
surface having the lowest turbulence level. With
impingement only flow there is a reverse jet flow, as shown
in Figure 7, but this flow is reduced with
impingement/effusion cooling due to the extraction of the
effusion flow at the location of the reverse flow jet. Thus it
forces the impingement flow to remain attached to the
surface with a consequence in the better surface distribution
of turbulence, relative to the impingement only cases.
Surface Distribution of Nusselt Number
The pattern of the predicted surface TKE distribution in
Figure 8 is shown in Figure 10 to be similar for the target
surface distribution of Nusselt number for 0.5 kg/sm2bar.
Figure 10 (a) shows for the four sided exit a minimum
downstream cross-flow influence and Figure 10 (b) shows
that the single sided exit impingement configuration
maximizes the cross-flow influence. Similar predicted
comparisons of TKE and Nu are made in Figures 9 and 11.
Figure 10 Contour of Nusselt number on target surface for
G of 0.5 kg/sm2bar at fixed X/D of 11.04 and Z/D of 7.25
Figure 11 Comparison of target surface distribution of Nu
for G of 0.5 kg/sm2bar, X/D of 11.04 and Z/D of 7.25
Figure 10 shows that the impact of the cross-flow for the
four sided exit is relatively small and is only apparent in the
outer regions. For the central region Figure 11(a) shows that
there is still some distortion of the Nu profiles in the outflow
direction, which is similar to that for the TKE profiles in
Figure 9(a). For single sided exit the Nu profiles for the
second row of holes in Figure 11(b), show a more uniform
distribution and a reduced area of the lowest Nu. For the
impingement/effusion flow, Figure 11(c) shows a much
better surface coverage of high Nu, which was due to the
flow acceleration into the effusion holes, this locally
enhances the cooling in the hole entry region. In all three
cases of Figure 11, the peak impingement Nusselt number is
the same.
The comparison of the predicted surface average NuPr1/3
with surface average experimentally measured NuPr1/3
of
Andrews and Hussain [11] is shown in Figure 12, for the
same geometry that was modelled with an X/D of 11.04.
The ± 11% error for the Nusselt number based on Equation
5 is shown for each data point in Figure 12, which shows
7 Copyright © 2015 by ASME
Downloaded From: http://turbomachinery.asmedigitalcollection.asme.org/ on 08/21/2015 Terms of Use: http://www.asme.org/about-asme/terms-of-use

Figure 12 Predicted and measured variation of surface
averaged Nusselt number v. Re for four sided exit
impingement heat transfer
good agreement between the predictions and measurements
mainly within the error bars. There was exact agreement
between prediction and measurement for Re = 2500 and
7500. There was an under prediction of the measurements
by 17% at Re = 3500, 14% at Re = 6000 and 12% at a Re of
9000, 4% over prediction at the highest Re. On average the
predictions were 6.5% lower than the measurements.
Figure 12 also compares the present predictions for four
sided exit impingement heat transfer with other
measurements for similar X/D. The differences are
significant and mainly due to the differences in X/D.
However, the results of Andrews and Hussain [11] showed a
decrease in Nu with increase in X/D. But for the same X/D
with smaller Z/D, the results of Andrews and Hussain [11]
fall in the measured error bars, except for Re of 3600 and
6500 that were slightly below the measurements. Hollworth
and Berry’s [13] results for an X/D of 15 were similar to the
present for a Re of 6500, but their Re exponent was higher.
Obot and Trabold [6] for an X/D of 9 had a similar Nu for
Re = 5000 but a larger increase in Nu with increase in Re.
Influence of G on the Impingement Jet Wall and Target
Surface Average Heat Transfer
Figure 13 shows the surface distribution of h on the
target and inside impingement jet walls for three G values.
This is the first time that heat transfer coefficient to the
impingement jet wall has been predicted and measured.
Figure 13 (ia) shows that at low G there was little surface
coverage of the enhanced impingement heat transfer and
Figure 13 (iia) shows that there were no reflected jets on the
centreline between the holes, giving heat transfer to the
impingement jet wall. However, at higher G the high heat
transfer due to the reflected jets in Figure 13 (iib and c) were
predicted to occur at the midpoint of the four jet holes. This
heat transfer was convected in the direction of the exit flow
as the flow moved to the exit and a cross-flow was
established. Figure 13 (ii) shows that the action of the
crossflow was to deflect the reflected impingement jets on
the jet wall surface diagonally at 45o
to the line of the
impingement holes. This was a feature of the four sided exit
with the flow to the two edges leading to a flow direction of
45o. It was unexpected that this flow direction would be so
(i) Target wall
(ii) Inside impingement jet wall
Figure 13 Impingement jet wall surface distribution of
HTC h for varied G at fixed X/D of 11.04 and Z/D of 7.25
Figure 14 Comparison of predicted target surface average
HTC versus G at X/D of 11.04 and Z/D of 7.25
clearly seen approaching each impingement hole but absent
after the hole. This implies that with four sided exits the
diagonal flow on the jet surfaces was entrained by the jet as
none of this flow appears on the surface after the jet, where
there is a gap of low heat transfer before the next reverse
flow impingement point occurs. Thus interaction of the
reflected flow with the impingement jet flow does not occur
with single sided exits as the crossflow is between the rows
of impingement holes [2-4].
Figure 14 show the predicted surface average h as a
function of G, with three components of the heat transfer
predicted: firstly, the impingement target wall heat transfer;
secondly, the heat transfer due to the reverse flow jets to the
impingement jet wall; thirdly, the heat transfer to the coolant
as it passes through the heated impingement jet wall. The
increase in the heat transfer coefficients with G was
8 Copyright © 2015 by ASME
Downloaded From: http://turbomachinery.asmedigitalcollection.asme.org/ on 08/21/2015 Terms of Use: http://www.asme.org/about-asme/terms-of-use

Figure 15 Comparison of the present predictions with
impingement single flow exit and impingement/effusion
predicted target surface average and X2 average HTC h.
predicted to be much greater for the target wall. The reverse
jet heat transfer to the impingement wall was 53% of the
impingement target wall heat transfer at the lowest G and
31% at the highest G. The heating of this surface by the
reverse jet was predicted to be recycled as heat transfer to
the impingement air as it flows through the walls. This
occurred on the hole approach surface and inside the holes
and there was a close balance between the reverse jet heat
transfer and the impingement jet flow heating.
Comparison of Impingement Surface Averaged h for
Different Impingement Cross-flow Configurations
Figure 15 compares the predicted surface averaged h for
different impingement wall configurations. The present
predictions for the four side exit are compared with those for
a single sided exit and for the first two holes, where
crossflow is at a minimum. Finally these three geometries
are compared with predictions for impingement/effusion
cooling for a very similar geometry. Figure 15 shows that
highest h was for impingement/effusion cooling and the
lowest, was the present predictions for four sided exit
impingement heat transfer. The difference in these two was
due to the suction effect of the effusion hole flow on the
impingement jet wall flow. This leads to more surface TKE
and higher surface heat transfer. In between these two was
the surface average heat transfer for the second row of
impingement holes, where the cross-flow effect was not
significant.
The surprising result of the predictions was the higher
surface averaged heat transfer for the single sided flow exit
compared with the four sided exit, where the crossflow
velocities were lower. This should have led to a lower effect
of the crossflow in reducing the heat transfer with distance
along the gap due to the deflection of the reverse flow jets
and convection of surface turbulence by the cross-flow [24,
26, 30]. The crossflow effect of the reverse flow jets was
shown in Figure 13 (ii) to be diagonal and not along the gap
between the rows of jets as for single sided exits. The
impingement jet surface heat transfer was due to the flow of
the reverse flow jet diagonally towards the next
impingement jet where it was entrained, leaving no cooling
downstream of the jet. This mixing of the reverse flow hot
gases with the incoming cold impingement jets did not
Figure 16 Comparison of surface Tz on impingement jet
walls for varied G at fixed X/D of 11.04 and Z/D of 7.25
)10(
TT
TTT
m
IZ
)11(*
TT
TTT
w
happen for single sided exit and the result was reduced heat
transfer due to the impingement jets being hotter at the
surface after entrainment of the hot reverse flow jets.
Heating of the Impingement Jet Wall
Andrews et al. [9], experimentally measured the
impingement jet wall heating using the dimensionless
temperature TZ of Equation 10. In the present work the
dimensionless temperature T* in Equation 11 was also
predicted, which allows the surface distribution of the
impingement jet wall metal temperature to be shown in a
dimensionless form.
The predicted values of TZ for the mean impingement jet
wall temperature are shown in Figure 16 where they are
compared with the experimental measurements [10]. The
results for lower G of 0.2 and 0.45 kg/sm2bar show good
agreement with the experiments, but for G of 0.77 and 1.1
kg/sm2bar the prediction disagrees with the measurement.
For impingement/effusion cooling it is the lower G that is of
interest. It is possible that the experimental test rig was not
as adiabatic as intended, but this would influence all the
measurements. The aerodynamics should be correct as the
predicted and measured pressure loss agree at all G. The
implication of these results is that the peak heat transfer on
the impingement jet wall in Figure 13 (iic) is over predicted.
It is also possible that the disagreement could be due to the
five thermocouples in the impingement jet wall that are not
representative of the mean surface average heat transfer
coefficient. However, the agreement with low G values
would suggest that this is not the problem. Thus there is no
clear explanation for this lack of agreement at high G.
Figure 17 shows the equivalent predictions for the
impingement jet wall as were given in Figure 15 for the
target wall. This shows the predictions for the mean heat
transfer coefficient to the impingement jet wall for the four
sided exit compared with those for a single sided exit. The
single sided exit predictions for the first two rows of holes,
9 Copyright © 2015 by ASME
Downloaded From: http://turbomachinery.asmedigitalcollection.asme.org/ on 08/21/2015 Terms of Use: http://www.asme.org/about-asme/terms-of-use

Figure 17 Comparison of the present work with
impingement single flow exit and impingement/effusion
predicted surface average and X2 average HTC h on
impingement jet plate.
where cross-flow is at a minimum, is also shown in
Figure 17. Finally these three geometries are compared with
predictions for impingement/effusion cooling for a very
similar geometry. Figure 17 shows that the predicted
surface average HTC h for the impingement jet wall was
significantly lower for the four sided exit predictions. The
reason for this is as discussed above, the diagonal flow of
the impingement jet wall resulted in entrainment into the
impingement jets of the heated reverse flow jets with a
consequence of reduced cooling of the target surface.
The big difference for the four sided exit was that the
cross-flow number of holes was reduced by a half, but also
the cross-flow area was increased by a factor of 4.
However, as crossflow deteriorates the heat transfer for
single sided exit an increase in the heat transfer with four
sided exit was expected. The authors [27] have shown that
for the single sided exit, the aerodynamics of the cross-flow
displaced the flow towards the impingement jet wall and
increased the heat transfer there [2, 3, 27]. For the four
sided exit these reverse flow jets are displaced by the
crossflow in the diagonal direction on the impingement jet
surface, as shown in Fig. 13 (ii). This leads to the
impingement of this surface flow onto the impingement jets
and entrainment into those jets. The subsequent heating of
these jets reduced the impingement cooling temperature
difference and so reduce the heat transfer.
Figure 17 shows that the highest heat transfer was for the
impingement/effusion geometry, where there is no cross-
flow. With no cross-flow to deflect the impingement jet
reverse flow the greatest impingement heat transfer occurs.
In addition to the impingement cooling there is the enhanced
cooling of the flow acceleration into the effusion holes and
the internal cooling inside the holes.
Figure 18 shows for three values of G the predicted
surface distributions of the dimensionless temperature T* for
the target wall. In Equation 11 for T*, the hot wall side
temperature Tw is 353K and T is the predicted temperature
on either the cooled target wall or the impingement jet wall.
On the target wall of Figure 18 (i) the lower T* is a
consequence of the higher h. These dimensionless
temperature plots in Figure 18 include the uncooled flange
(i) Target surface
(ii) Impingement plate Figure 18 Surface distribution of normalised temperature
T* for varied G at fixed X/D of 11.04 and Z/D of 7.25
Figure 19 Comparison of jet hole centre line contours of
normalised temperature T* for G of 0.5 kg/sm
2bar with
impingement and impingement/effusion cooling geometries.
of the test section, which can be ignored. Figure 18 (i)
shows that the target wall temperature gradients were
significant at high G, but at low G the wall was a fairly
uniform temperature. The extra cooling as G was increased
causes increased thermal gradients. In contrast, the thermal
gradients predicted on the impingement jet wall are shown
in Figure 18 (ii) to be much more uniform for all G. The
cross-flow effect in the exit region can be seen with cooler
walls, especially at low G.
Equation 11 was also used to show the heating of the air
jets and the thermal gradients in the metal walls, as shown in
Figure 19. This clearly shows the heated reversed flow jets
that causes the heat transfer to the impingement jet wall.
The deflection of the reversed flow jets by the cross-flow is
also clear. Better cooling of the target (or effusion) wall in
Figure 19c occurs for the impingement/effusion geometry,
10 Copyright © 2015 by ASME
Downloaded From: http://turbomachinery.asmedigitalcollection.asme.org/ on 08/21/2015 Terms of Use: http://www.asme.org/about-asme/terms-of-use

as there was no cross-flow to increase the wall heating, the
mean temperature was lower. Figure 19c shows an absence
of the reverse flow jets with the addition of effusion cooling.
The effusion holes are located where the reverse flow jet
originates and the heated flow is simply an outflow through
the effusion holes rather than reversing and impinging on
the impingement jet wall. This also means that the heated
coolant now flows into the effusion holes and this hotter
effusion film cooling flow will reduce the effusion film
cooling compared with no effusion air heating. The
additional heat transfer in the acceleration of the coolant
flow into the effusion holes plus the heat transfer inside the
holes is the reason that the impingement/effusion
configuration has the highest overall wall heat transfer, as
shown in Figure 17.
Figure 17 also shows the predicted thermal gradients
through the thickness of the wall. These are considerably
increased by the additional heat transfer in this surface in the
impingement/effusion configuration. These thermal
gradients are 10% of the temperature difference through the
6.35mm wall thickness. For a 700K coolant and 1300K gas
side metal temperature the thermal gradient would be 130K
or 20K/mm.
CONCLUSIONS The CHT CFD predictions for four sided exit
impingement heat transfer for G from 0.2 to 1.1 kg/sm2bar at
X/D of 11.04 and Z/D of 7.25 showed good agreement with
the measured surface average Nusselt number. The average
difference of the predictions from the measurements was
6.5% low.
The predictions of the pressure loss also showed good
agreement with the measurements, indicating that the
aerodynamics were correctly predicted.
The predictions showed that there was a reverse flow jet
from the target wall to the impingement jet wall that resulted
in heating of the wall. The predictions of this heating
showed good agreement with measured TZ at lower G, but
not at higher G.
The predictions of the impingement jet wall heat transfer
coefficient showed that it was a significant feature of the
overall impingement heat transfer process.
ACKNOWLEDGEMENTS Abubakar M. El-jummah wishes to acknowledge the
financial support from University of Maiduguri and the
Government of Nigeria. The computational work was
supported by part of an ERSRC grant.
NOMENCLATURE A Impingement hole porosity = (π D
2/4)/X
2
D Impingement air hole diameter, m
Cd Discharge coefficient
G Coolant mass flux, kg/sm2bar
h Heat transfer coefficient (HTC), W/m2K
k Thermal conductivity of fluid, W/mK
L Target wall metal thickness, m
n Number of impingement hole/unit surface area, m-2
N Number of upstream rows of impingement holes
Nu Nusselt Number
ρ Density of air, kg/m3
ΔP Impingement wall pressure loss, Pa
P Coolant supply static pressure (approx. 1bar)
Pr Prandtl number
R Gas constant for air, 287 J/kg.K
Re Impingement hole Reynolds number
T∞ Coolant temperature, 288K
T* Normalized mean temperature
T Metal wall temperature, K
TZ Impingement plate dimensionless temperature
U Velocity along the wall in y+
Uc Velocity in the impingement gap at the single exit
μ Dynamic viscosity, kg/ms
Vj Impingement jet mean velocity (or Vm), m/s
ν Kinematic viscosity, m2/s
X Impingement hole square array pitch, m
y+ Inner variable wall normal coordinate (ξUτ/ν)
Z Impingement gap, m
ξ Grid cell size, m
Subscripts
h Hole
d Discharge
j Jet
w Wall
s Surface
∞ Coolant
f fluid
I Impingement jet wall
m mean
Z gap height
REFERENCES [1] Andrews G. E., Abdul Husain R. A. A. and Mkpadi
M. C. 2006. "Enhanced Impingement Heat Transfer:
The Influence of Impingement X/D for Interrupted
Rib Obstacles (Rectangular Pin Fins)". Trans. ASME
J. Turbomachinery, 128, 321 - 331.
[2] El-jummah A. M., Abdul Hussain R. A. A., Andrews
G. E. and Staggs J. E. J. 2014. "Conjugate Heat
Transfer Computational Fluid Dynamic Predictions of
Impingement Heat Transfer: The Influence of Hole
Pitch to Diameter Ratio X/D at Constant Impingement
Gap Z". Trans. ASME J. Turbomachinery, 136 (12), 1
- 16.
[3] El-jummah A. M., Abdul Hussain R. A. A., Andrews
G. E. and Staggs J. E. J. 2014. "Conjugate Heat
Transfer CFD Predictions of Impingement Heat
Transfer: Influence of the Number of Holes for a
Constant Pitch to Diameter Ratio X/D". Proc. ASME
Gas Turbine Conference, GT-25268, 1 - 14.
[4] El-jummah, A. M., Abdul Hussain R. A. A., Andrews
G. E. and Staggs J. E. J. 2013. "Conjugate Heat
Transfer CFD Predictions of the Surface Averaged
Impingement Heat Transfer Coefficients for
Impingement Cooling with Backside Cross-flow".
Proc. ASME IMECE Conference, IMECE-63580, 1 -
14.
[5] Abdul Husain R. A. A. and Andrews G. E. 1990. "Full
Coverage Impingement Heat Transfer at High
Temperature". Proc. ASME Int. Gas Turbine &
Aeroengine Congress & Eposition, 90-GT-285, 1 - 12.
[6] Obot N. T. and Trabold T. A. 1987. "Impingement
Heat Transfer within Arrays of Circular Jets: Part 1-
Efects of Minimum, Intermediate and Complete
11 Copyright © 2015 by ASME
Downloaded From: http://turbomachinery.asmedigitalcollection.asme.org/ on 08/21/2015 Terms of Use: http://www.asme.org/about-asme/terms-of-use

Cross-Flow for Small and Large Spacings". Trans.
ASME J. Heat Transfer, 109, 872 - 879.
[7] Andrews G. E. and Kim M. N. 2001. "The Influence
of Film Cooling on Emissions of a Low NOx Radial
Swirler Gas Turbine Combustor". ASME Int. Gas
Turbine & Aeroengine Congress & Exhibition, GT-
71, 1 - 11.
[8] Andrews G. E., Alkabie H. S., Abdul Husain U. S.
and Abdul Aziz M. 1993. "Ultra Low NOx Ultra Lean
Gas Turbine Primary Zones With Liquid Fuels". Proc.
AGARD 81 Symposium of the Propulsion and
Energetics Panel of Fuels and Combustion
Technology for Advanced Aircraft Engines, 24.1 -
24.14.
[9] Huitenga H. and Norster E. R. 2014. "Development
Approach to the Dry Low Emission Combustion
System of MAN Diesel & Turbo Gas Turbines". Proc.
ASME Turbo Expo, GT-25164, 1 - 10.
[10] Andrews G. E., Asere A. A., Hussain C. I. and Mkpadi
M. C. 1985. "Transpiration and Impingement/Effusion
Cooling of Gas Turbine Combustion Chambers".
ISABE and AIAA 7th Propulsion Joint Specialist
Conference, ISABE 85-7095, 794 - 803.
[11] Andrews G. E. and Hussain C. I. 1984. "Impingement
Cooling of Gas Turbine Components". High
Temperature Technology, 2 (2), 99 - 106.
[12] Andrews G. E. and Hussain C. I. 1984. "Full
Coverage Impingement Heat Transfer: The Influence
of Impingement Jet Size". 1st UK National Heat
Transfer Conference, IChemE Symposium, Series
No.86, 1115 - 1124.
[13] Hollworth B. R. and Berry R. D. 1978. "Heat Transfer
from Arrays of Impinging Jets with Large Jet-to-Jet
Spacing". Trans. ASME J. Heat Transfer, 100, 352 -
357.
[14] Friedman S.J. and Mueller A.C. 1951. "Heat Transfer
to flat surfaces ". Proc. IMechE: General Discussions
on Heat Transfer, 138 - 142.
[158 Kercher D. M. and Tabakoff W. 1970. "Heat Transfer
by a Square Array of Round Air Jets Impinging
Perpendicular to a Flat Surface Including Effect of
Spent Air". Trans. ASME J. Eng. Power, 73 - 82.
[16] Chance J. L. 1974. "Experimental Investigation of Air
Impingement Heat Transfer Under an Array of Round
Jets". Tappi, 57 (6), 108 - 112.
[17] Huang L. and El-Genk M. 1994. "Heat Transfer of an
Impinging Jet on a Flat Surface". Elsevier Science Int.
J. Heat Mass Transfer, 37 (13), 1915 - 1923.
[18] Van Treuren K. W., Wang Z., Ireland P. T., Jones T.
V. and Kohler S. T. 1994. "Local Heat Transfer
Coefficient and Adiabatic Wall Temperature
Measurement Beneath Arrays of Staggered and Inline
Impinging Jets". Proc. ASME Int. Gas Turbine &
Aeroengine Congress & Eposition, 94-GT-181, 1 - 10.
[19] Consonni S. 1995. "Cooling Flow Prediction for Fully
Impingement Cooled Gas Turbine Blades". Proc.
ASME Int. Gas Turbine & Aeroengine Congress and
Exposition, 95-GT-22, 1 - 12.
[20] kanokjaruvijit K. and Martinez-Botas R. F. 2005. "Jet
Impingement on a Dimpled Surface With Different
Cross-Flow Schemes". Elsevier Int. J. Heat and Mass
Transfer, 48, 161 - 170.
[21] Xing Y. and Weigand B. 2013. "Optimum Jet-to-Plate
Spacing of Inline Impingement Heat Transfer for
Different Cross-Flow Schemes". Trans. ASME J. Heat
Transfer, 135 1 - 8.
[22] Andrews G. E., Durance J., Hussain C. I. and Ojobor
S. N. 1987. "Full Coverage Impingement Heat
Transfer: Influence of the Number of Holes". Trans.
ASME J. Turbomachinery, 109, 557 - 563.
[23] Al Dabagh A. M., Andrews G. E., Abdul Husain R. A.
A., Husain C. I., Nazari A. and Wu J. 1990.
"Impingement/ Effusion Cooling: The Influence of
Number of Impingement Holes and Pressure Loss on
the Heat Transfer Coefficient". Trans. ASME J.
Turbomachinery, 112, 467 - 476.
[24] Abdul Husain R. A. A., Andrews G. E., Asere A. A.
and Ndiema C. K. W. 1988. "Full Coverage
Impingement Heat Transfer: Cooling Effectiveness".
Proc. ASME Int. Gas Turbine & Aeroengine
Congress, 88-GT-270, 1 - 9.
[25] El-jummah, A. M., Andrews, G. E. and Staggs, J. E. J.
2013. "Conjugate Heat Transfer CFD Predictions of
the Influence of the Impingement Gap on the Effect of
Cross-Flow". Proc. ASME Heat Transfer Conference,
HT-17180, 1 - 12.
[26] Hollworth, B. R., Lehmann, G. and Rosiczkowski, J.
1983. "Arrays of Impinging Jets with Spent Fluid
Removal Through Vent Holes on the Target Surface,
Part 2: Local Heat transfer". Trans. ASME J. Eng.
Power, 105, 393 - 402.
[27] El-jummah, A. M., Andrews, G. E. and Staggs, J. E. J.
2013. "Conjugate Heat Transfer CFD Predictions of
Impingement Jet Array Flat Wall Cooling
Aerodynamics with Single Sided Flow Exit". Proc.
ASME Turbo Expo Conference, GT-95343, 1 - 12.
[28] Ireland P. T., Neely A. J., Gillespie D. R. H. and
Robertson A. J. 1999. "Turbulent Heat Transfer
Measurements using Liquid Crystals". Elsevier. Int. J.
Heat and Fluid Flow, 20, 355 - 367.
[29] Goldstein R. J. and Timmers J. F. 1982.
"Visualization of Heat Transfer from Arrays of
Impinging Jets". Pergamon Int. J. Heat Mass
Transfer, 25 (12), 1857 - 1868.
[30] Goldstein R. J., Behbahani A. I. and Heppelmann K.
1986. "Streamwise Distribution of the Recovery
Factor and the Local Heat Transfer Coefficient to an
Impinging Circular Airjet". Pergamon Int. J. Heat
Mass Transfer, 29 (8), 1227 - 1235.
[31] Andrews G. E., Asere A. A., Hussain C. I. and
Mkpadi M. C. 1985. "Full Coverage Impingement
Heat Transfer: The Variation in Pitch to Diameter
Ratio at a Constant Gap". Proportion and Energetics
Panel of AGARD, 65th
Symposium, 'Heat Transfer and
Cooling in Gas Turbines', Paper 26, 1 - 12.
[32] Andrews G. E. and Mpadi M. C. 1984. "Full-
Coverage Discrete Hole Wall Cooling: Discharge
Coefficients". Trans. ASME J. Eng. Gas Turbines and
Power, 106 183 - 192.
[33] Andrews G. E., Asere A. A., Hussain C. I., Mkpadi
M. C. and Nazari A. 1988. "Impingement/Effusion
Cooling: Overall Wall Heat Transfer". Proc. ASME
Int. Gas Turbine and Aeroengine Congress, 88-GT-
290, 1 - 9.
[34] Bailey J. C. and Bunker R. S. 2002. "Local Heat
Transfer and Flow Distributions for Impinging Jet
Arrays of Dence and Sparse Extent.". Proc. ASME
Turbo Expo, GT-30473, 1 - 10.
12 Copyright © 2015 by ASME
Downloaded From: http://turbomachinery.asmedigitalcollection.asme.org/ on 08/21/2015 Terms of Use: http://www.asme.org/about-asme/terms-of-use
Copyright © 2022 FDOKUMEN