Climatic reconstruction of the Weichselian Pleniglacial in northwestern and Central Europe

KA
TR
IN LA
SBE
RG
C
hronology of the Weichselian G
laciation in the southeastern sector of the Scandinavian Ice SheetTartu 2014
ISSN 1406–2658ISBN 978–9949–32–571–9
DISSERTATIONES GEOLOGICAE
UNIVERSITATIS TARTUENSIS
37
KATRIN LASBERG
Chronology of the Weichselian Glaciation in the southeastern sector of the Scandinavian Ice Sheet
DISSERTATIONES GEOLOGICAE UNIVERSITATIS TARTUENSIS 37

DISSERTATIONES GEOLOGICAE UNIVERSITATIS TARTUENSIS 37
KATRIN LASBERG
Chronology of the Weichselian Glaciation in the southeastern sector
of the Scandinavian Ice Sheet

Department of Geology, Institute of Ecology and Earth Sciences, Faculty of Science and Technology, University of Tartu, Estonia. This dissertation was accepted for the commencement of the degree of Doctor of Philosophy in Geology at the University of Tartu on 17 March, 2014 by the Scientific Council of the Institute of Ecology and Earth Sciences, University of Tartu.
Supervisors: Prof. Volli Kalm and senior reasearcher Tiit Hang, Department of Geology, University of Tartu, Estonia
Opponent: Prof. Wojciech Wysota, Department of Geology and Hydrogeology, Nicolaus Copernicus University, Poland
This thesis will be defended at the University of Tartu, Estonia, Ravila 14A, room 1019, on 9 June 2014 at 12:15.
Publication of this thesis is granted by the Institute of Ecology and Earth Sciences, University of Tartu and by the Doctoral School of Earth Sciences and Ecology created under the auspices of the European Social Fund.
ISSN 1406–2658 ISBN 978–9949–32–571–9 (print) ISBN 978–9949–32–572–6 (pdf) Copyright: Katrin Lasberg, 2014 University of Tartu Press www.tyk.ee
5
CONTENTS
LIST OF ORIGINAL PUBLICATIONS ....................................................... 6
ABBREVIATIONS ........................................................................................ 7
1. INTRODUCTION ..................................................................................... 8
2. BACKGROUND ....................................................................................... 10 2.1. Last glacial cycle and extension of the Scandinavian Ice Sheet in
its southeastern sector ........................................................................ 10
3. MATERIAL AND METHODS ................................................................ 16 3.1. Study area .......................................................................................... 16 3.2. Fieldwork and sampling .................................................................... 18 3.3. Chronological data ............................................................................. 18 3.4. Ice-flow pattern and data handling .................................................... 19
4. RESULTS AND DISCUSSION ............................................................... 21 4.1. Ice-free interval before the last Weichselian glaciation in the
western part of the East European Plain ............................................ 21 4.2. Last Weichselian glaciation ............................................................... 24
4.2.1. The advance of the last Scandinavian Ice Sheet to the western part of East European Plain ...................................... 27
4.2.2. Deglaciation and chronology of the last termination in the SE part of the Scandinavian glaciation................................... 33
5. CONCLUSIONS ....................................................................................... 40
ACKNOWLEDGEMENTS ........................................................................... 41
REFERENCES ............................................................................................... 42
SUMMARY IN ESTONIAN ......................................................................... 50
PUBLICATIONS ........................................................................................... 53
CURRICULUM VITAE ................................................................................ 95

6
LIST OF ORIGINAL PUBLICATIONS This thesis is based on the following published papers, which are referred to in the text by their Roman numerals. The papers are reprinted by kind permission of the publishers.
I. Lasberg, K., Kalm, V., Kihno, K., 2014. Ice-free intervals cor-responding to Marine Isotope Stages 4 and 3 at the Last Glacial Maxi-mum position at Kileshino, Valdaj Upland, Russia. Estonian Journal of Earth Sciences (accepted for publication).
II. Kalm, V., Raukas, A., Rattas, M., Lasberg, K., 2011. Chapter 8 – Pleistocene Glaciations in Estonia. Ehlers, J., Gibbard, P.L., Hughes, P.D. (Eds.). Quaternary Glaciations – Extent and Chronology – A Closer Look (95–104). Amsterdam, the Netherlands: Elsevier.
III. Lasberg, K., Kalm, V., 2013. Chronology of Late Weichselian gla-ciation in the western part of the East European Plain. Boreas, 42(4), 995–1007.
Author’s contribution
Paper I: The author contributed to fieldwork and sampling, was respon-sible for data analysis and interpretation and the writing of the manuscript.
Paper II: The author contributed to fieldwork and sampling for obtaining additional chronological data, was responsible for upgrading the chronological database and revision of chronostratigraphy and complemented the writing of the manuscript.
Paper III: The author was responsible for upgrading the chronological database, revision of chronological data and selection of dates for the development of chronology, data analysis and interpretation and the writing of the manuscript.

7
ABBREVIATIONS SIS Scandinavian Ice Sheet LGM Last Glacial Maximum ISC ice stream complex MIS Marine Isotope Stage SU sedimentary unit AMS refers to the radiocarbon dating by accelerator mass spectrometry 14C refers to radiocarbon 10Be refers to cosmogenic beryllium OSL refers to optically stimulated luminescence TL refers to thermoluminescence ESR refers to electron spin resonance ka thousand years m a–1 metres per year cal. 14C BP calibrated radiocarbon age (calendar years),
reported ‘Before Present’ (before year 1950)

8
1. INTRODUCTION As acknowledged by the Intergovernmental Panel on Climate Change, vulne-rability of Greenland and Antarctica to on-going global warming and related discharge feedbacks remains a major source of uncertainty in projected sea-level rise. To understand this uncertainty, determining the responses of past ice sheets to climate changes, their expansion and demise histories and effect on deglacial sea-level change are of utmost importance. The behaviour of global ice volume during the Last Termination is recorded in sea-level fluctuations in response to the collapse of ice sheets caused by warming (Fairbanks 1989; Yokoyama et al. 2000; Tarasov & Peltier 2005; Clark et al. 2009). However, the exact chronology, origin and consequences of these ice-sheet melting episo-des remain unclear (Carlson & Clark 2012; Deschamps et al. 2012), partly because of temporally poorly constrained ice volume and coverage models and because of different behaviour of individual ice sheets. As improvements in the modelling of ice sheets is possible only through the improved constraints on the ice margin histories (Lambeck et al. 2010; Shepherd et al. 2012), further work is needed to understand available chronologies and to build new, direct (if pos-sible) ones. The current thesis contributes to these activities by reviewing available and adding new chronometric data to the knowledge about the beha-viour of ice sheets on the East European Plain during the Weichselian Cold Stage, with the aim of better understanding of the unified history and forcing mechanisms of Scandinavian Ice Sheet (SIS). The study area of the thesis encompasses the SE sector of the SIS between the Baltic Sea and the Last Glacial Maximum (LGM) position in the western part of the East European Plain.
The Weichselian Glaciation is most extensively studied. Still, the occurrence of Early to Middle Weichselian glaciation in this region remains controversial because the advancing ice sheet has a great destructive potential for soft unconsolidated sediments and most of the sediments of former glaciations have been removed. However, evidence of glacial sediments attributed to the Middle Weichselian has been found in several sites in northern, central and eastern Europe: southern Finland (Nenonen 1995), Estonia (Liivrand 1991), Latvia (Zelčs & Markots 2004), Lithuania (Molodkov et al. 2010), Poland (Marks 1998, 2004) and Denmark (Houmark-Nielson 2007). Nevertheless, opinions about the extent of the SIS during the Middle Weichselian glaciation are contra-dicting. Some studies claim that the SIS reached the western part of the East European Plain during MIS 4 (74–59 ka) (Arslanov 1993; Zarrina 1991), but others suggest that the SIS did not extend beyond the Baltic Sea depression and Russian Karelia during that time (Chebotareva & Macarycheva 1982; Demidov et al. 2004; Guobyte & Satkūnas 2011; Velichko et al. 2004, 2011). Since the chronological data concerning the glaciation during the Middle Weichselian in the study area are also scanty, especially from the region close to the Valdai Upland at the LGM position, further research is required to improve the chrono-logy of the SIS advance.

9
More is known about the last glaciation as many studies have focused on the timing of the Late Weichselian ice advance and deglaciation. Most of these studies, however, are country-based contributions and chronological data are therefore unevenly distributed. For this reason the timing of the advance of the last SIS and its arrival at the position of the LGM are continuously debated. According to the most widely accepted view (Demidov et al. 2006; Rinterk-necht et al. 2006; Wysota et al. 2009; Marks 2010), the SIS did not reach the LGM position isochronously and occurred at different times in the southeastern area of the Scandinavian glaciation.
More data have been published on the recession of the last SIS than on its advance. However, studies do not cover the entire SE sector of the Scandinavian glaciation. Many authors (Kalm 2006, 2012a; Rinterknecht et al. 2006, 2007, 2008; Raukas 2009; Satkūnas et al. 2009; Guobytė & Satkūnas 2011; Zelčs et al. 2011; Bitinas 2012) have provided ages for ice recession stadials in the western part of the East European Plain over the years, but opinions concerning the positions of ice-marginal zones, their ages and correlations are controversial. The problem could partly stem from the variety of dating methods and dated material/sediments as most of the methods are indirect and reflect rather the age limits.
A persistent problem in glacial geology and geomorphology has been the acquisition of suitable material for dating and the accuracy of obtained ages. The usage of the radiocarbon (14C) method is limited because very often datable organic material is lacking in glacial terrain or specific landforms and only ages up to ~45 ka can be obtained with this method. Recent advent of optical lumi-nescence and cosmogenic dating resolves the necessity to find organic material and instead the age of the deposition of sediments and erratic boulders is eva-luated. Radiocarbon, optically stimulated luminescence (OSL), thermolumine-scence (TL) and cosmogenic beryllium (10Be) dates were available for the current review to evaluate the chronology of the Weichselian glaciation in the SE part of the SIS. However, the distribution of dates is uneven in both spatial and temporal sense in the study area; the interpretations of the ice sheet beha-viour are conflicting.
These uncertainties have necessitated the revision of the chronological data. The main goal of the current thesis was to assess the behaviour of the SIS during the Weichselian Glaciation on East European Plain through the col-lection, review and synchronozation of all available chronological data.
The specific objectives of this research were: to determine the duration of the ice-free period before the last glaciation; to establish an overall chronology for the last SIS advance; to refine a deglaciation chronology in conjunction with the current under-
standing of the ice-flow pattern; to determine overall rates of ice-sheet advance and recession necessary for
understanding the subglacial processes and further modelling of ice sheets.

10
2. BACKGROUND
2.1. Last glacial cycle and extension of the Scandinavian Ice Sheet in its southeastern sector
The last, best-studied glacial cycle is a key period for understanding the Earth’s response to orbital (Milankovitch events) and other forcing of the climate (Mangerud 1991). This cycle started about 130 ka years ago with a warm stage, named the Eemian interglacial stage in central and northern Europe (Mikulino in eastern Europe) and is traditionally correlated with Marine Isotope Stage (MIS) 5e (Fig. 1). During this interglacial stage the Eemian Sea covered a larger area than the present Baltic, White and Barents seas. This has been explained by the greater extent and thickness of the Saalian ice sheets compared to the Weichselian ice sheets and the different deglaciation histories of these periods (Ehlers 2007).
Fig. 1. Stacked marine oxygen isotope record of the last glacial cycle from Martinson et al. (1987) with marine isotope stages (MIS) and correlation with terrestrial chronostrati-graphy of the last glacial cycle in central, northern and eastern Europe. Compiled ac-cording to Behre (1989), Mangerud (1991), Arslanov (1993) and Velichko et al. (2011).
The last cold stage, known as the Weichselian in northern Europe, Würm in central Europe (Alps) and Valdai in eastern Europe, started about 117 ka ago and is correlative with the Wisconsin Glaciation in North America. During the Weichselian Glaciation, which lasted about 105 ka, the SIS advanced several times further from the glaciation centre in the northern Bothnia Bay area in Scandinavia, covering the whole of Fennoscandia, northwestern Russia and
130
100
90
80
70
60
50
40
30
20
10
110
120
0
12
24
59
74
85
93
105
117
130
0
1
2
3
4
5a
5b5c
5d
5e
6
Schalkholz stadial
Odderrade interstadial
Rederstall stadial
Brörup interstadial (Amersfoort)
Herning stadial
Eemian interglacial
Oerel interstadialEbersdorf stadial
Glinde interstadial
Moershoofd-Hengelo interstadials
Denekamp interstadial
Bölling-Alleröd interstadial
Holocene
LGM
Holocene
Ear
ly
Mi
le
dde
Lat
eh
ea
iW
ics
lian
Gl
cat
ion
central and northern Europe18ä O (‰) (normalized)
MIS
Dunaevo interstadial
Shenskoe stadial
Leningrad interstadial
Kashin stadial
Krasnogorsk interstadial
Shestikhino stadial
Mikulino interglacial
Kurgolovo stadial
Upper Volga interstadial
Lapland stadial
Kruglitsa interstadial
Bölling-Alleröd interstadial
Val
di
tin
ai G
lac
ao
Holocene
eastern Europe
ka B
P
meg
aint
erst
adia
l
LGM

11
northern continental Europe, and coalesced with the Barents and British Ice Sheets. The Weichselian Cold Stage (Weichselian Glaciation) is usually divided into the Early (Lower) Weichselian (MIS 5d-5a), Middle Weichselian (MIS 4 and 3) and Late (Upper) Weichselian (MIS 2) Substages. The climate fluctuated throughout the Weichselian Glaciation with several cold (stadial) and warm (interstadial) periods (Fig. 1).
The first advance of the SIS after the Eemian interglacial to the Russian mainland occurred as early as 80–100 ka in the Early Weichselian (MIS 5d and 5b), blocking all drainage and damming huge lakes in West Siberia and the northwestern part of Russia (Fig. 2).
Fig. 2. Extent of the Early Weichselian (MIS 5d and 5b) glaciation in northern Eurasia (Ehlers et al. 2013).
Drainage was diverted southwards towards the Caspian Sea and the Black Sea. Although the Early Weichselian SIS was most extensive in the east, a few traces of this ice sheet are also found in the western regions (Ehlers et al. 2013). Nevertheless, the SIS did not reach the western and southern parts of Finland (Lunkka et al. 2004). The Early Weichselian Substage included two inter-stadials, Brörup (MIS 5c) and Odderade (MIS 5a), when climate became slightly milder.
About 60 ka BP (MIS 4), the second advance of the SIS occurred, as the Middle Weichselian Ice Sheet covered large parts of Fennoscandia and northern areas in NW Russia and Siberia (Ehlers et al. 2013; Fig. 3). The knowledge of Middle Weichselian climatic events (MIS 4 and 3) and the extent of the SIS in eastern Europe and European Russia is quite limited and the evidence of its timing is still rather sparse (Saks 2010). Opinions about the extent of the SIS

12
during the Middle Weichselian glaciation are contradicting. Some studies claim that the SIS reached the western part of the East European Plain during MIS 4 (Zarrina 1991; Arslanov 1993), others, however, suggest that the SIS did not extend beyond the Baltic Sea depression and Russian Karelia during that time (Chebotareva & Macarycheva 1982; Demidov et al. 2004; Guobyte & Satkūnas 2011; Velichko et al. 2004, 2011).
Fig. 3. Extent of the Middle Weichselian glaciation (MIS 4) (Ehlers et al. 2013).
Nevertheless, evidence of the Middle Weichselian (MIS 4) glaciation has been reported from several sites in northern, central and eastern Europe: southern Finland (Nenonen 1995), Estonia (Liivrand 1991), Latvia (Zelčs & Markots 2004), Lithuania (Molodkov et al. 2010), Poland (Marks 1998, 2004) and Denmark (Houmark-Nielson 2007). The subsequent warm period, namely MIS 3 ‘megainterstadial’ in European Russia (Oerel to Denekamp interstadials in central Europe), is characterized by alternating warm and cold phases, while the glaciation was mostly restricted to the Scandinavian mountains mostly (Ehlers 2007; Velichko et al. 2011).
The Late Weichselian glaciation in northern Eurasia started about 28 ka ago. In the eastern part of the SIS it was restricted to the shelf areas of the Barents and Kara seas (Fig. 4). In the western part of the SIS, this was the most exten-sive Weichselian glaciation. Rapid ice-advances of the SIS across southern and central Finland into the western part of the East European Plain took place after 25 ka (Johanson et al. 2011), covering central and northern Europe and Euro-pean Russia (Ehlers 2007; Ehlers et al. 2013).

13
Fig. 4. Extent of the Late Weichselian (MIS 2) glaciation in northern Eurasia (Ehlers et al. 2013).
The SE sector of the Late Weichselian SIS reached its maximum extent between 21 and 19 ka (MIS 2) synchronously with the global record of ice volume changes, but in the SW sector of the SIS the maximum extent was reached earlier during MIS 4 and 3 (Houmark-Nielsen 2011). Thus, it is clear that the various sectors of vast continental ice sheets like the SIS exhibit complex responses to the global climate signal, with the global LGM being only one of a series of major advances of varying size (Hughes et al. 2013). Furthermore, also the SE sector of the SIS did not reach the LGM position isochronously. The LGM has been estimated to have occurred at different times: 18 OSL ka BP in the Vologda area, NW Russia (Lunkka et al. 2001); not earlier than 22.3 cal. 14C ka in NW Belarus and 19.2 cal. 14C ka BP in NE Belarus (Rinterknecht et al. 2007); 18.3 10Be ka in Lithuania (Rinterknecht et al. 2008) and not earlier than 26–20 TL ka in SE Lithuania (Guobyte & Satkunas 2011); 22–20 ka BP (OSL and cal. 14C dates) in Denmark (Houmark-Nielsen 2004, 2008); 18–20 TL ka and 19.7 36Cl ka in NE Poland close to the SW Lithuanian and NW Belarus border (Krywicki 2002; Dzierżek & Zreda 2007) and 24–19 ka BP (cal. 14C and 10Be ages) in Poland (Marks 2010). This is explained by the different ice streams and their complexes operating in the SE sector of the SIS during the Late Weichselian (Kalm 2012a; Fig. 5).

14
Fig. 5. Ice lobes and marginal positions of the last SIS southeast of the Baltic Sea (Kalm 2012a). Ice streams and their complexes are: Baltic ice stream complex (B) with Neman (B4) and Riga (B5) ice streams and Usma (B5-1), Vadakste (B5-2) and Zemgale (B5-3) sub-ice-streams; Peipsi–Pskov ice stream (D); Võrtsjärv ice stream (V); Karelian ice stream complex (E) with Ladoga–Ilmen–Lovat’ ice stream (F) and Lubana (F1), Velikaja (F2), Kunja (F3) and Msta (F4) sub-ice-streams; White Sea ice stream complex (G) with Onega (G1) ice stream and Beloye Ozero (G1-1) and Kubenskoye (G2-1) sub-ice-streams. Rybinsk (R) ice stream is located outside of the estimated LGM limit. Ice-marginal zones are: 1 – LGM (Gruda in Lithuania), 2 – Baltija (= Pomeranian or Vepsian in Karelia and western Russia), 3 – South Lithuanian (Sebezha and Krestets in Russia and Karelia), 4 – Middle Lithuanian, 5 – North Lithuanian (Haanja and Luuga in Latvia, Estonia and Russia), 6 – Otepää, 7 – Sakala (Valdemarpils in Latvia), 8 – Pandivere (Neva in Russia and Karelia), 9 – Palivere, 10 – Salpausselkä I (Rugozero in Karelia). Names of major highlands are shown in white colour.
The SIS began to retreat soon after the LGM and by the end of the Bölling–Alleröd interstadial (12 cal. 14C ka BP) the area between the Salpausselkä I ice-marginal zone in southern Finland and the LGM position in the western part of the East European Plain was deglaciated. During the last demise major ice sheet stagnations appeared, which can also be seen in the present topography where

15
different authors have distinguished up to eight ice-marginal zones in the SE sector of the SIS (Fig. 5) (Guobytė & Satkūnas 2011; Karabanov & Matveyev 2011; Zelčs et al. 2011, Kalm 2012a). Most reconstructions of the last deglaciation of the SIS show the ice limits as unbroken lines extending up to several hundreds of kilometres (Lundqvist & Saarnisto 1995; Raukas 1992; Rattas & Kalm 2005; Kalm 2012a). However, correlation of deposits and land-forms associated with particular limits is difficult and conflicts exist between many interpretations.

16
3. MATERIAL AND METHODS
3.1. Study area
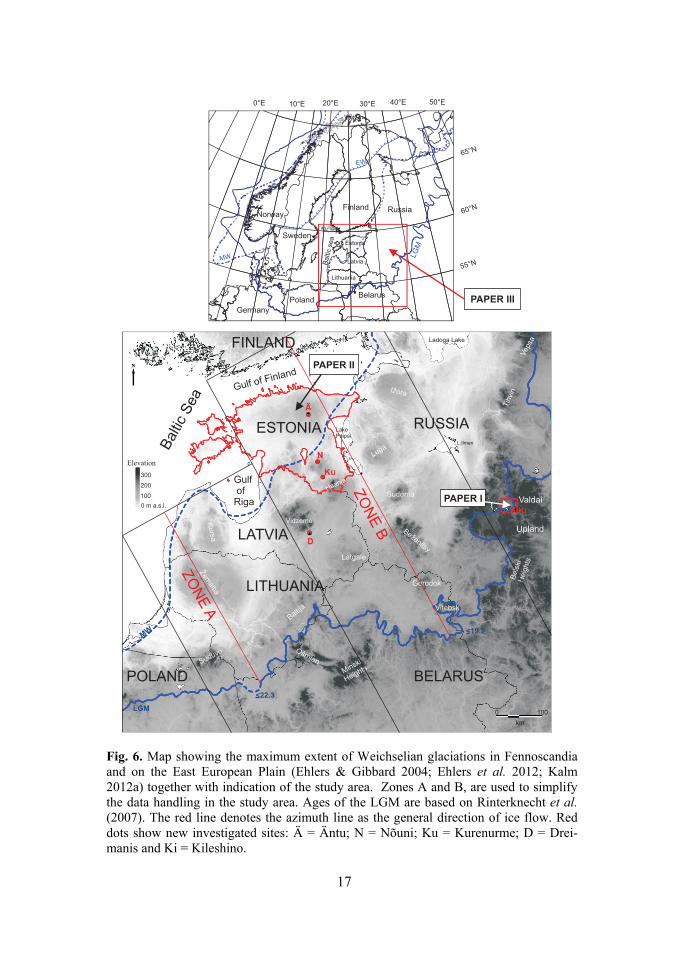
The study area encompasses the southeastern sector of the last Scandinavian Ice Sheet between the Baltic Sea and the LGM position in the western part of the East European Plain (Fig. 6).
The topography of the study area is rather flat, with average elevations between 100 and 200 m above sea level (a.s.l) and with maximum heights of about 353 m a.s.l in the Valdai region. Current glacial accumulative topography has mostly been designed by the last, Late Weichselian glaciation. Meridionally oriented glacial depressions mark the footprints of major ice lobes (Kalm 2012a), while ice divides in between are marked by the radial series of insular-like uplands. In the northern part plinth-type uplands with an outstanding bedrock core and thin (<10 m) Quaternary cover are lower (100–175 m) than the maximum of around 300 m, characteristic of the glacial-accumulative heights with a thick Quaternary cover located in the central and southern parts of the SIS extension area. A series of outstanding uplands mark also the LGM zone of the SIS.
The palaeogeographic situation before the LGM is not well documented in northern Europe, because the last glaciation has removed most of the sediments of former glaciations. The SIS did not reach the East European Plain during the Early Weichselian (MIS 5d–a) and interstadial deposits have been found and dated in few sections from of the study area (Ehlers et al. 2011). According to modelling, in the Middle Weichselian the SIS reached only the NW part of the study area along the Baltic Sea coast (Fig. 6), but the evidence of its timing and extent is still rather sparse. More is known about the Late Weichselian glaciation. The ice sheet model of the LGM shows that the thickness of the SIS was about 2200 m at the southern shores of the Baltic Sea and 100–500 m at the LGM position (Svendsen et al. 2004; Zuzevičius 2010). Two major ice stream complexes (ISC) were operating during the Late Weichselian in the study area: the Baltic ISC about 1200 km long in western Estonia, western Latvia, Lithua-nia and northwestern Belarus and the Karelian ISC about 800 km long in eastern Estonia, eastern Latvia, northeastern Belarus and Russia (Punkari 1997; Boulton et al. 2001; Karukäpp 2004; Kalm 2012a). The ice sheet advanced to the LGM position generally from the northwest and deglaciated in the opposite direction. The Baltic ice stream first followed the Baltic Sea depression to the southwest and later advanced to the southeast, to the western part of the East European Plain (Boulton et al. 2001; Kalm 2012a). The bedrock in the study area was not frozen throughout the last glacial advance and the base of the SIS probably thawed during the Late Weichselian (Jõeleht 1998; Jirakova et al. 2011). This supposition is also supported by distribution of Weichselian subglacial landforms in Estonia and Latvia, which could have been formed only in unfrozen conditions under the ice sheet (Rattas 2004; Saks 2010). Such conditions probably accelerated both the advance and decay of the last SIS (Jirakova et al. 2011).
PAPER III
65°N
6 °N0
55°N
0 E1 ° 2 °E0 30 E° 40°E0°E 05 °E
aB
ltic
sea
LG
M
Finland
Sweden
Norway
Estonia
Latvia
Lithuania
PolandBelarus
Germany
Russia
EW
MW
G lf o Finlanu f
d
Gulf ofRiga
S
Bal
tic
ea
Ladoga Lake
LakePeipsi
Valdai
Upland
Bels
kiH
eig
hts
Min
kis
Heigtsh
nHaa ja
Vidzeme
ESTONIA
LATVIA
LITHUANIA
RUSSIA
BELARUS
e
t
Þm
ai ia
Suu o
dv
Vitebsk
Oðmjan
Latgale
Beþanitsy
Gorodok
Sudoma
Luga
Kursa
Ba tijal
oraIþ
Tih
inv
L.Ilmen
Vep
sa
POLAND
FINLAND
EZO
N A
ZO
NE
B
100
200
300
Elevation
0 m a.s.l.
LGM
<22.3
<19.2
100
km
0
PAPER I
PAPER II
MW
17
Fig. 6. Map showing the maximum extent of Weichselian glaciations in Fennoscandia and on the East European Plain (Ehlers & Gibbard 2004; Ehlers et al. 2012; Kalm 2012a) together with indication of the study area. Zones A and B, are used to simplify the data handling in the study area. Ages of the LGM are based on Rinterknecht et al. (2007). The red line denotes the azimuth line as the general direction of ice flow. Red dots show new investigated sites: Ä = Äntu; N = Nõuni; Ku = Kurenurme; D = Drei-manis and Ki = Kileshino.

18
The present relief of the study area clearly reflects the topography of the bedrock surface as all larger ice streams followed the bedrock depressions (Kalm 2012b). Major ice sheet stagnations can be seen in the present topo-graphy as the zones of ice-marginal landforms. Different authors have distinguished up to eight ice-marginal zones (Guobytė & Satkūnas 2011; Kara-banov & Matveyev 2011; Zelčs et al. 2011; Kalm 2012a) in the study area.
3.2. Fieldwork and sampling
Fieldwork and sampling were performed in 2009–2011. The Kileshino outcrop close to the LGM in the Valdai Upland was described, sampled and photo-graphed, lithofacies were distinguished and sediment colour was identified according to Munsell’s colour system chart (1998). Four cores (Äntu, Kure-nurme, Dreimanis, Nõuni) from Estonia and Latvia were studied in order to obtain additional chronological data (Fig. 6). From all studied sites 23 samples were taken for radiocarbon and 4 samples for OSL age determination. Sixteen AMS samples were analysed in Poznań Radiocarbon Laboratory, Poland and 7 AMS samples in the Beta Analytic Radiocarbon Dating Laboratory, Florida, USA. The OSL samples were measured by the Risø TL-DA-12 reader and equivalent doses were estimated using a single-aliquot regenerative-dose (SAR) protocol (Murray & Wintle 2000) in the Laboratory of Chronology, University of Helsinki.
3.3. Chronological data
This thesis is based on the collected chronological data, which are organized into a database. Some portions of the earlier data have been submitted also to the DATED database (Gyllencreutz et al. 2007). Since the year 2007 the author of this thesis has been responsible since the year 2007 for collecting the chrono-logical data and upgrading the database regularly on the basis of previously and newly published articles. The database includes different types of dates (14C, OSL, TL, ESR, 10Be) from published and unpublished (Äntu, Nõuni, Kure-nurme, Dreimanis, Kileshino) sources. For the moment about 670 dates with inclusive information about the dating method, geographical coordinates, dated material and its depth from the surface, superposition, etc. are available for the time range of 74–11.7 cal. 14C ka BP (Middle and Late Weichselian). Neverthe-less, not all collected dates could be used for establishing chronology, primarily the dates concerning the development of the last glaciation. Therefore the data needed a critical revision and selection was made based on different characte-ristics as discussed below.
Interstadial MIS 3.1., with the time range of 35–28 cal. 14C ka BP, was followed by a glaciation (MIS 2, 28–11.7 cal. 14C ka BP), when the last SIS expanded from the glaciation centre into the Baltic Sea depression and further to our study area (Lambeck et al. 2010). Dates between 35.0 and 11.7 cal. 14C ka BP, marking, respectively, the MIS 3.1. and the Holocene boundary, were

19
preliminarily chosen for the development of the last SIS chronology. Although several dates in the database might reflect the Middle Weichselian or Late Weichselian ages, some mismatch is observed when these ages are considered together with the stratigraphical position of sediments in the geological section (for example, sediments dated to the Late Weichselian age lying below the Late Weichselian till). To obtain more reliable results, dates from sediments, which presumably were contaminated with old carbon (MacDonald et al. 1991) (lake marl, carbonate-rich sediments), were not used because of their possible age overestimation. While handling the data, the accuracy of some dates in com-parison with others from the same area, became questionable. For this reason not all available dates were used. The causes of under- and overestimation of ages and their rejection from further analysis are discussed in more detail in PAPER III. It should be noticed that radiocarbon dates reflect the timing of organic sedimentation synchronous with vegetation development and therefore give an indirect age for both the advance and decay of the glacier. The OSL and 10Be dates directly reflect the deposition of sediments and erratic boulders if assuming that the requirements for accurate dating are adequate. In conjunction, these dating methods cover the whole time range of interest, while the radio-carbon dating method is limited to ~45 ka.
Dates from key sites, which are directly relevant for the developed chrono-logy are reported below, in Chapter 4.2. and are presented with the indication of the dating method in the discussion. All currently used radiocarbon dates were calibrated with the IntCal09 calibration curve (Reimer et al. 2009) and the OxCal v.4.1 program (Bronk Ramsey 2009), reported here with 1σ uncertainty and rounded to the nearest 100 years.
3.4. Ice-flow pattern and data handling
As two different ice streams were operating during the Late Weichselian in the western part of the East European Plain and the last SIS did not reach the LGM synchronously, the study area was tentatively divided into two parts, where ages and ice sheet dynamics were analysed separately. The western part, the Baltic ISC area, is considered as zone A and the eastern part, the Karelian ISC area, as zone B (Fig. 6). For the chronological reconstructions of the ice margin dyna-mics, the geographical location of all used dates was marked on the map. Based on their distance and location between ice-marginal zones, the dates were converted proportionally to an overall deglaciation and probable glaciation onset azimuth line (Boulton et al. 2001; Kalm 2012a) in tentative zones A and B, separately (Fig. 7). The results are displayed as time-distance diagrams (Chapter 4.2. and PAPER III), where medians of the ages are shown and used further in the discussion.

20
Fig. 7. Sketch illustrating how the dates were converted proportionally to an overall deglaciation azimuth (red) line on the basis of their distance and location between ice-marginal zones. Red dots mark the location of dated sites, red arrows show the distance and blue lines indicate tentative ice-marginal zones.
nce
dista
0
i
overall azm
uth
1
2
gina
ice-m
arl
ozne
km1
2 km3 km
istance
d
0
1
2
e-ginal
icmar
onez
m
1k
1.5 km
1 km
km1
1.5 km2 km

21
4. RESULTS AND DISCUSSION
The duration of the ice-free period in the study area before the last Scandinavian glaciation was determined based on detailed sedimentological and chronological study at the Kileshino outcrop in the Valdai Upland (PAPER I) and on available Middle Weichselian dates (PAPERS II and III). The chronology of the last glaciation for the study area is based on the published dataset together with several new dated sites (PAPERS II and III).
4.1. Ice-free interval before the last Weichselian glaciation in the western part
of the East European Plain
The presence of non-glacial palaeoenvironments during the Early Weichselian has been determined everywhere in the study area (Ehlers et al. 2011). Data about the Middle Weichselian are not so straightforward because the last glaciation probably removed most of the sediments of former glaciations and the incomplete record of this time period has complicated the study of the SIS extent, especially in the Valdai Upland.
The Valdai Upland in the NW part of Russia (Fig. 8) was chosen for the study because the chronological data from the area are still insufficient and there have been contradictory opinions about the SIS advance during the Middle Weichselian in this region.
Detailed sedimentological studies at the Kileshino outcrop revealed nineteen lithofacies and in conjunction with dated samples, five main sedimentary units (SU1–SU5) were distinguished each expressing different climatic and sedimentological conditions (Fig. 9) (PAPER I). The lower portion of the section (SU1) comprises glaciolacustrine varved clay indicating cold periglacial conditions. However, as only one infinite 14C AMS date was available, the age of these sediments was interpreted as older than 43.5 cal. 14C ka BP. Dates (57.5 OSL to 33.8 cal. 14C ka BP) from non-glacial sediments (SU2) resting on top of varved clay indicate that during MIS 3 the Kileshino site was ice-free and SU1 could not have been deposited at that time. The OSL ages (72.2–40.8 OSL ka) obtained from the sedimentary unit SU3, which is believed to have been transported by the last SIS advance from the NW of Kileshino, express the ice-free time also for the Kileshino site during MIS 4 and 3, as the general direction of the last SIS advance was from NW to SE. Thus the SIS could not have reached further to the Kileshino site while ice-free conditions still persisted in the NW. The lowest age available below the till layer (SU4) shows the Late Weichselian (Valdai) age and indicates that the last SIS overrode the studied area after 33.8 cal. 14C ka. The above leads to the conclusion that periglacial sediments, which have been recognized in the Kileshino outcrop in the lowest sedimentary unit (SU1), are older than 72.2 OSL ka. Thus the SIS did not reach the Kileshino site during MIS 4 (74 and 59 ka), while there ice-free conditions existed there between 72.2 OSL and 33.8 cal. 14C ka BP.

22
Fig. 8. Valdai Upland and location of the Kileshino outcrop near the Kileshino village on the left bank of the Sizhina River.
100
200
300
Elevation
0 m
direction of river flow
<22.6
<19.1
0-1
82
LGM
Finland
Estonia
Lithuania
Latvia
Poland
Russia
Belarus
Russia
Valdai
upland
20°E 25°E 30°E 35°E
60°N
55°N
Lake Vlgo
o
Lake Sig
e
Selizharovka Riv
r
iSizhina R ver
LGM
Volga River
Lake l ger
Sei
na
Tikh
vi R
iver
5 km
Kileshino outcrop
Kileshino
Selizharovo

Fig.
9. D
escr
iptio
n of
the
Kile
shin
o ou
tcro
p w
ith m
ain
sedi
men
tary
uni
ts a
nd g
enet
ic i
nter
pret
atio
n. C
limat
ic-c
hron
olog
ical
sub
divi
sion
s ar
e ac
cord
ing
to V
elic
hko
et a
l. (2
011)
.
0
50
10
0
15
0
20
0
25
0
30
0
35
0
40
0
45
0
50
0
54
5>
43
.5
>4
3.5
>4
3.5
44
.8
33
.8
lam
ina
ted
silt
a
nd
sa
nd
(v
arv
ed c
lay)
lam
ina
ted s
ilt
pe
at
san
d
lam
ina
ted s
ilt
and
sa
nd
silt
dia
mic
tio
n
soil
gytt
ja
ma
ssiv
e c
lay
lam
ina
ted
sa
nd
10
YR
/5/4
to
5Y
R/4
/4
10
YR
/5/2
10
YR
/6/2
10
YR
/4/6
10
YR
/5/2
to
10
YR
/4/2
5Y
R/4
/4 t
o
10
YR
/6/4
5Y
R/5
/2
5Y
R/3
/3
10
YR
/5/4
to
75
YR
52
./
/
7.5
YR
/4/2
to
5.5
2.
YR
/2/2
10
YR
/5/3
10
YR
/2/1
7.5
YR
/3/1
2.5
YR
/5/2
10
YR
/4/2
40
.8
69
.6
72
.2
57
.5
fine
ly la
min
ate
d s
ilt a
nd
sa
nd
with
so
me
org
an
ics
ma
ssiv
e c
lay
to la
min
ate
d s
ilt a
nd
sa
nd
lam
ina
ted
fin
e s
an
d w
ith
diff
use
d p
ea
t la
yers
, b
oth
be
dd
ing
pla
ne
s a
re t
ran
sitio
na
l
we
ll-d
eco
mp
ose
d p
ea
t w
ith v
ery
th
in s
an
d la
yers
, u
pp
er
be
dd
ing
pla
ne
is w
avy
lam
ina
ted
silt
an
d s
an
d (
1–
4 c
m t
hic
k la
yers
) rh
yth
mite
s,
bo
th b
ed
din
g p
lan
es
are
tra
nsiti
on
al
lam
ina
ted
silt
an
d f
ine
sa
nd
rh
yth
mite
s w
ith s
om
e o
rga
nic
la
yers
ma
ssiv
e a
nd
blo
ckis
h s
ilt w
ith
diff
use
d o
rga
nic
s
fin
e t
o m
ed
ium
sa
nd
with
so
me
silt
laye
rs in
sid
e,
pa
ralle
l str
atifie
d,
de
form
ed
ma
ssi
ve a
nd
blo
cki
sh s
ilt w
ith
so
me
gra
ve
l (¨
3–
15
mm
) e
spe
cia
lly in
th
e lo
we
r p
art
, lo
we
r b
ed
din
g p
lan
e is
wa
vy
ma
ssiv
e a
nd
pa
tch
y s
ilt,
bo
th b
ed
din
g p
lan
es a
re w
avy
ma
ssiv
e a
nd
lo
ose
fin
e s
an
d,
up
pe
r b
ed
din
g p
lan
e is
wa
vy
silt
with
litt
le s
an
d (
loa
m)
an
d f
ew
pe
bb
les
(up
to
¨5
cm
), lo
we
r p
art
is
oxi
diz
ed
stra
tifie
d s
an
d w
ith s
om
e s
ilt la
yers
in
sid
e,
gra
vel i
n t
he
lo
we
r p
art
, lo
ose
fin
ely
lam
ina
ted
silt
with
gytt
ja,
diff
use
d o
rga
nic
s,
de
tritu
s in
th
e lo
we
r p
art
, lo
we
r b
ed
din
g p
lan
e is
tra
nsitio
na
l
fin
ely
lam
ina
ted
pe
at
an
d s
ilt,
com
pre
sse
d,
bo
th b
ed
din
g p
lan
es a
re t
ran
sitio
na
l
so
il
Se
dim
en
tary
pro
file
Lhoaies itfc cde o
ay cl
silt
sand
gravel
uC
olo
r c
ri
ta
cod
ng
o
Munse
ll u
t co
lor
char
Se
dim
en
t d
esc
rip
tion
d Se.unit
SU
1
SU
2
SU
3
SU
4
SU
5
Fl/
Sh
Fm
Sh
/Gh
Fl/
Sh
Fl
Sh
Fl/
Sh
Fl/
Sh
Fm
Sh
/F
l
Fm
/G
h
Fm
Sm
Dm
F/
B
OS
L1
4ca
l C
B
P
Ag
e,
ka 42
.4
>4
3.5
>4
3.5
P C
Cl/F
l
Ge
ne
tic in
terp
reta
tion a
nd
clim
atic-
ch
ron
olo
gic
al
sub
div
isio
n
va
rve
d c
lay
(pe
rig
lacia
l)
‘Rh
yth
mic
’ flo
od
-pla
in
limnic
sed
imen
ts(M
idd
le V
ald
ai
‘meg
ain
ters
tad
ial’
in E
uro
pe
an
Ru
ssi
a;
fro
m O
ere
l to
M
oe
rsh
oo
fd in
ters
tadia
ls
in C
en
tral E
uro
pe
)
rede
po
site
d f
luvia
l se
dim
ents
(M
iddle
Va
ldai S
he
stik
hin
o
sta
dia
l to
Le
nin
gra
dskij
inte
rsta
dia
l in
NW
Russia
; S
ch
alk
holz
st
ad
ial t
o
Mo
ers
hoo
fd-H
en
gelo
in
ters
tad
ials
in
Ce
ntr
al E
uro
pe)
till (
La
te V
ald
ai s
tag
e)
soil
(Holo
cen
e)
Mre ain soe itopstgae
1 2 3-4 >33
cm

24
Findings from the Kileshino site and lithological data from the nearby areas (Arkhanglsk region, Karelia and Vologda area), where only one till has been found above Eemian interglacial sediments (Demidov et al. 2004) show that the SIS did not reach the western part of the East European Plain. This concerns also the areas to the south of our study site as only one Weichselian till has been found in northern Belarus and it is interpreted to be of Late Weichselian age (Karabanov & Matveyev 2011).
Glacial sediments attributed to the Middle Weichselian have been found in Denmark (Houmark-Nielsen 2011), Poland (Marks 2004, 2011), Latvia (Zelčs et al. 2011), Estonia (Liivrand 1991) and Finland (Nenonen 1995). Propositions for the timing of possible Middle Weichselian glaciation in Lithuania and Latvia have been made by several authors on the basis of chronological data. Molodkov (2010) suggested that the SIS reached the coastal area of Lithuania during MIS 4 (74–59 ka) or could have even covered all of western Lithuania. Recent data from Lithuania shorten the possible time range for the Middle Weichselian glaciation as northern Lithuania was ice-free at least between 55 and 33 ka (Satkunas et al. 2012). Zelčs et al. (2011) suggested a possible early Middle Weichselian glaciation in Latvia between 74 and 59 ka when the SIS probably reached only coastal plains and, possibly, the adjoining Northern Kursa Upland in central Latvia. Additional dates from western Latvia confirm ice-free conditions at least between 52 and 26 OSL ka (Saks 2010). Chrono-logical data from Estonia (PAPER II) indicate ice-free conditions at least between 44 and 27 and together with Early Weichselian ice-free time, it leaves some 24 ka (68–44 ka) for possible early Middle Weichselian glaciation. How-ever, this conclusion is tentative, as Molodkov et al. (2007) found no evidence in the Voka outcrop, northern Estonia, suggesting the presence of glacigenic sediments deposited during the period between 115 and 31 OSL ka. If that holds true, the question arises how the second till from the surface, which is widely distributed in central and southern Estonia, and overlying Eemian interglacial deposits (Raukas 1978; Kajak 1995), should be interpreted. It is notable, that the Middle Weichselian glaciation has been recorded in western Finland between 62 and 55 ka (Salonen et al. 2008) and has been interpreted to have reached at least SE Finland (Lunkka et al. 2008).
4.2. Last Weichselian glaciation
Currently developed chronology of the last Weichselian glaciation in the study area is based on 311 radiocarbon (14C, 14C AMS), 87 OSL and 72 10Be ages from 204 different sites/sections (PAPERS II and III). Only calibrated ages are used in further discussion, while all dates (both uncalibrated and calibrated ages) from key sites (Fig. 10), which were directly used for establishing the chronology and mentioned therefore in the discussion, are reported in Table 1. Based on time-distance diagrams (Figs. 11, 12), rest of the dates concerning the advance and decay of the SIS in the study area were considered relatively young or old, nevertheless all dates are shown in the figures. Note that hereafter the

25
results are given separately for the eastern (Karelian ISC area) and western (Baltic ISC area) parts of the study area and it is advisable to follow the discussion in conjunction with the time-distance diagrams.
Fig. 10. Study area. Zones A and B, used to simplify the handling of the data and to evaluate ice sheet dynamics in different parts of the study area. The glacial maximum extent of the last SIS (Ehlers & Gibbard 2004; Kalm 2012a) is marked with a blue line and the ages are based on Rinterknecht et al. (2007). The red line denotes the azimuth line as the general direction of the ice-flow. Red dots show the dated sites mentioned in text: 1 = LAT-1; 9 = Rucava; 48 = Mančhiagine; 50 = Zervynos; 51 = Gozha; 66 = Ulmale; 67 = Baltmuiža; 72 = Turženu; 73 = Jiesia; 74 = Rokai; 75 = Jonionys; 76 = Netiesos; 88 = Pääsküla; 91 = Männiku; 97 = Pikassaare; 182 = Pehka; 99 = Haljala; 100 = Voka; 105 = Räätsma; 174 = Lozoviki; 175 = Latyshi; 196 = Smeceres sils; 197 = Drcihaluki; 202 = Chizhovka.
G lf o F n nd
u f i la
Gulf ofRiga
Bal
ti S
eac
Ladoga Lake
LakePeipsi
Valdai
Upland
iB
els
kg
Hei
hts
n M
i ski
et
High s
Haanja
Vidzeme
ESTONIA
LATVIA
LITHUANIA
RUSSIA
BELARUS
at
Þemi ia
uo
Sduv
Vitebsk
aOðmj n
Latgale
Bþ
nitsy
ea
Gorodok
Sudoma
Luga
Ku
sr a
Baltija
Iþ aor
iv
nT
hi
L.Ilmen
Ves
ap
POLAND
FINLAND
ZO
NE
A
ZO
NE
B
100
200
300
Elevation
0 m a.s.l.
LGM
<22.3
<19.2

Tab
le 1
. Lis
t of
key
dat
es.
Gd*
– an
alys
ed i
n G
liwic
e R
adio
carb
on L
abor
ator
y, n
a –l
abor
ator
y nu
mbe
r un
avai
labl
e; 14
C c
onv.
– c
onve
ntio
nal
radi
ocar
bon
met
hod
Sit
e
no.
Lab
. no
.S
ecti
on
Lat
. (°N
)L
ong.
(°W
)D
ated
mat
eria
lS
uper
posi
tion
Dat
ing
met
hod
Ori
gina
l
ages
(k
a)
Cal
. 14
C a
ges
BP,
wit
h 1ó
un
cert
ain
ty
and
ro
und
ed o
ff t
o
hun
dred
(ka
)
Med
ian
ages
(cal
. 14
C, T
L,
OS
L,
10B
e)
(ka)
Ref
eren
ces
1L
AT
-157
.352
22.7
25qu
artz
na10
Be
14.2
3 ±
1.2
91
4.2
Rin
terk
nech
t et
al.
(2
006
)
9L
uS 7
538
Ruc
ava
56.1
6221
.162
mam
mot
h m
ola
rna
14C
AM
S12
.87
5 ±
0.0
71
5.1
- 15
.61
5.4
Arp
pe &
Kar
hu (
201
0)
48V
s-5
Man
èhia
gire
54.1
3324
.450
peat
rive
r cu
t-of
f m
eand
er l
enti
l14
C c
onv.
17
.34
± 0
.84
19.
6 -
21.6
20.
8
50V
s-4
Zer
vyno
s54
.117
24.5
00m
oss
belo
w c
ut-o
ff m
eand
er
lent
il
14C
con
v.18
.35
± 0
.95
20.
6 -
23.3
22
Zim
enko
v et
al.
(1
985
)
51L
U-7
6AG
ozh
a53
.817
23.8
67pl
ant
detr
itus
fro
m a
lluv
ial
sand
14C
con
v.18
.73
± 1
.23
20.
6 -
24.1
22.
6V
igd
orch
ik
et a
l. (1
97
4)
66U
lmal
e 01
Ulm
ale
56.9
5221
.291
fine
san
dbe
low
upp
erm
ost
till
OS
L26
.00
± 4
.10
26
Sak
s (2
010
)
67B
altm
uiþa
56.9
3021
.262
fine
san
dbe
low
upp
erm
ost
till
OS
L26
.00
± 2
.60
26
Sak
s (2
010
)
72L
uS 7
528
Tur
þenu
55.0
7224
.279
mam
mot
h m
ola
rna
14C
AM
S21
.40
± 0
.12
25.
4 -
25.9
25.
6A
rppe
& K
arhu
(2
010
)
73L
uS 7
529
Jies
ia54
.859
23.9
39m
amm
oth
mo
lar
na14
C A
MS
13.8
0 ±
0.0
816
.8 -
17
16.
9A
rppe
& K
arhu
(2
010
)
74G
d*R
okai
54.8
4923
.772
pea
ty s
oil
belo
w u
pper
mos
t ti
ll14
C21
.73
± 0
.36
25.
5 -
26.7
26.
1G
aiga
las
et
al. (
200
5)
74U
G-5
564
Rok
ai54
.849
23.7
72si
ltbe
low
upp
erm
ost
till
TL
30.6
0 ±
0.5
03
0.6
Gai
gala
s et
al.
(200
5)
75L
U-1
29A
Joni
ony
s54
.159
24.1
19
peat
betw
een
two
uppe
rmos
t
till
s14
C c
onv.
20.6
7 ±
0.2
724
.4 -
25
24.
7S
ereb
ryan
nyj
(1
978
)
76U
G-5
787
Net
ieso
s54
.039
24.0
84sa
ndbe
low
gla
ciof
luvi
al
dep
osit
sT
L31
.90
± 4
.40
31.
9G
aiga
las
& F
edor
owic
z (2
00
9)
88U
a-1
531
9P
ääsk
üla
mir
e59
.354
24.6
67se
eds
fro
m h
omog
enou
s cl
ay14
C A
MS
11.4
2 ±
0.0
951
3.2
- 13
.41
3.3
Hei
nsal
u &
Ves
ki (
200
7)
91T
lnO
SL
-R-3
2M
änn
iku
59.3
6224
.719
med
ium
and
fin
e
sand
fro
m g
laci
oflu
vial
del
taO
SL
21.0
0 ±
2.5
02
1R
auka
s (2
004
)
97T
lnO
SL
-R-3
8P
ikas
aare
59.4
3825
.856
fine
san
dfr
om
kam
e fi
eld
OS
L2
3.00
± 6
23
Rau
kas
(20
04)
99U
a-3
318
7H
alja
la59
.424
26.2
95se
eds
fro
m c
laye
y si
lt14
C A
MS
23.6
5 ±
0.0
72
8.2
- 28
.62
8.4
Saa
rse
et
al. (
200
9)
100
Gli
OS
L-1
169
Vok
a59
.414
27.5
99sa
ndfr
om
sil
tO
SL
252
5R
auka
s &
Sta
nkow
ski
(20
05)
105
Ta-
687
Rää
tsm
a la
ke59
.239
27.5
54B
ryal
es m
oss
fro
m l
acus
trin
e tu
fa
14C
con
v.12
.05
± 0
.12
13.8
- 1
41
3.9
Ilve
s (1
980
)
105
Ta-
688
Rää
tsm
a la
ke59
.239
27.5
54B
ryal
es m
oss
fro
m s
and
belo
w t
ufa
14C
con
v.12
.04
± 0
.10
13.8
- 1
51
3.9
Ilve
s (1
980
)
174
IGS
B-4
64
Loz
ovik
i la
ke55
.267
28.1
17
peat
belo
w g
yttj
a14
C c
onv.
13.7
4 ±
0.8
51
5.3
- 17
.81
6.6
Zer
nits
kay
a et
al.
(20
07)
175
Lu-
617
Lat
yshi
55.0
6729
.933
plan
t de
trit
usfr
om
san
d 14
C c
onv.
13.6
3 ±
0.1
01
6.7
- 16
.91
6.8
Zim
enko
v et
al.
(1
985
)
182
Tln
OS
L-1
337
Peh
ka59
.492
26.3
38sa
ndbe
low
gla
ciof
luvi
al
dep
osit
sO
SL
26.8
0 ±
3.5
02
6.8
Kad
asti
k (
200
4)
196
LA
T05
/42
Sm
ecer
es S
ils
56.8
2726
.188
sand
fr
om
kam
e te
rrac
eO
SL
19.
60 ±
11
9.6
Rau
kas
et a
l.(2
010
)
197
Tln
-469
Dri
chal
uki
55.4
4230
.744
plan
t de
trit
us
fro
m l
ower
det
ritu
s
inte
rlay
er b
etw
een
two
uppe
rmos
t ti
lls
14C
con
v.15
.96
± 0
.18
18.
9 -
19.4
19.
1Z
imen
kov
(19
89)
202
LU
-114
8BC
hizh
ovka
54.5
8930
.640
hum
ic a
cid
sfr
acti
on s
olub
le i
n ho
t
alka
line
sol
utio
n14
C c
onv.
16.1
9 ±
0.1
219
- 1
9.5
19.
3Z
imen
kov
(19
89)
Ser
ebry
anny
j (1
97
8)

27
4.2.1. The advance of the last Scandinavian Ice Sheet to the western part of East European Plain
Baltic ISC area in the west (PAPER III) In the western Baltic ISC area, dates below the uppermost till from the western shores of Latvia (Ulmale = 66, Baltmuiža = 67 in Figs. 10, 11 and Table 1) yielded an age of 26 OSL ka (Saks 2010). Preglacial organic sediments from the adjoining area in Poland gave a similar age, 27.8–25.0 cal. 14C ka BP (Marks 2002). Dates of mammoth findings from central Sweden (39–31 cal. 14C ka BP, Ukkonen et al. 2007)) show that the SIS should have reached areas further from the glaciation centre after 31 cal. 14C ka BP. These results and dates from western Latvia indicate that the last SIS advanced to western Latvia from the Baltic Sea depression not before 26 OSL ka. Therefore the ice-free period, which started already in the Middle Weichselian, can be extended to the beginning of the last glaciation (26 OSL ka) in the western part of the current study area.
The estimation about the last SIS advance (not before 26 OSL ka) suggests a longer ice-free period for previously dated sites, where the youngest preglacial-time sediments yielded an age of 31.9 OSL ka close to the southern border of Lithuania (Netiesos = 76) and an age of 30.6 OSL ka in central Lithuania (Rokai = 74) (Figs. 10, 11; Table 1) (Gaigalas et al. 2005). Furthermore, a single 14C date below the uppermost till from central Lithuania (Rokai) is 26.1 cal. 14C ka BP (Gaigalas & Pazdur 2004). As the mentioned sites are further from the glaciation centre than sites of western Latvia, they should have been ice-free for a longer time and the last SIS should have reached central and southern Lithuania later than 26 OSL ka. This is supported by recent TL dates (26–20 TL ka) from lacustrine sand below the uppermost till from SE Lithuania, suggesting even longer ice-free conditions (Guobytė & Satkūnas 2011).
The currently presented ice advance model (time-distance diagram) for the last SIS in the western part of the study area includes two key sites in central and southern Lithuania (Turženu = 72, Jonionys = 76) and one in NW Belarus (Gozha = 51) (Figs. 10, 11; Table 1). A mammoth molar from central Lithuania (Turženu) yielded an age of 25.6 cal. 14C ka BP (Arppe & Karhu 2010) and the youngest peat samples from southern Lithuania (Jonionys) from between the two uppermost tills, gave an age of 24.7 cal. 14C ka BP (Serebryanny 1978). Plant detritus from laminated lacustrine clays in NW Belarus (Gozha site) gave an age of 22.6 cal. 14C ka BP (Vigdorchik et al. 1974; Pavlovskaya et al. 2002). Although these clays were not covered by till, the palaeobotanic studies from the same sequence suggested that the site was close to the LGM position, under periglacial conditions (Pavlovskaya et al. 2002). This has been questioned by Karabanov & Matveyev (2011) whose geomorphological studies suggested that the last SIS overrode the Gozha site, yet there is no geological evidence to confirm this view.

28
58
56555452
76
12 13 20 25
km
c.
ka
al BP
30 35NW
SE
14 15 16 17 18 19
13 20 25 30 3514 15 16 17 18 19
500
100
200
300
400
66
68
69
81
70
71
72
74
73
7851
16
77
80
1
2 3
4 5
6
78
91011 12
1314 1517
1819
20
21
2223
24 25
26 2827
2930 3
1
32 3
3
34 35
36
37
38
39
40
41
42
43
44
45
46
47
48
49
50
53
57 59
60
61
62
63
64
65
Sa
Hn
Md-
Lit
Sth
-Lit
Bal
tija
LG
M
79
GL
AC
IER
14
cal.
C
age
OS
L a
ge10 B
e ag
eS
S1
Pl
Pan
Sa
Ot
Hn
Md-
Lit
h
Vep
LG
M
- S
alpa
usse
lkä
I st
age
- P
aliv
ere
stag
e-
Pan
dive
re s
tage
- S
akal
a st
age
- O
tepää
sta
ge
- H
aanja
(N
ort
h-
L
ithua
nian
) st
age
- M
iddl
e-L
ithu
ania
n
(K
rest
ets)
sta
ge
- V
epsa
(P
omer
ania
n,
B
alti
ja)
stag
e-
Las
t G
laci
al M
axim
um
12
67
75

29
Fig. 11. Time-distance diagram in the western part of the study area (Baltic ISC area as zone A) along the azimuth line shown in Fig. 10. Dated sites: 1 = LAT-1; 2 = Lici; 3 = Ozolnieki; 4 = Sarkanais mals; 5 = Progress; 6 = Sarnate; 7 = Kaltiki; 8 = Kaulezers; 9 = Rucava; 10 = NLIT-3; 11 = NLIT-2; 12 = Rakani; 13 = NLIT-1; 14 = Vartaja; 15 = Lat-3; 16 = Lake Kašučiai; 17 = LAT-8; 18 = Ventes Ragas; 19 = Abavas Rumba; 20 = Krikmani; 21 = Lielause; 22 = MLIT-1; 23 = MLIT-3; 24 = MLIT-4; 25 = Balti-18; 26 = MLIT-5; 27 = MLIT-8´´; 28 = MLIT-6; 29 = LIT-8; 30 = Balti-7; 31 = Balti-6; 32 = Rekyva; 33 = Juodonys; 34 = Bebrjai; 35 = Balti-9; 36 = Daktarishke; 37 = Petrašiunai; 38 = Balti-2; 39 = Balti-3; 40 = Balti-4; 41 = Balti-5; 42 = LIT-2; 43 = LIT-3; 44 = LIT-9; 45 = Vievis; 46 = Bebrukas; 47 = Vilkiškes; 48 = Mančhiagire; 49 = Varenis; 50 = Zervynos; 51 = Gozha; 52 = Pamerkis; 53 = Rudnia; 54 = Gruda-1; 55 = Bel-19; 56 = Lit-1; 57 = Krokšlys; 58 = BEL-3; 59 = Lit-7; 60 = Bel-2; 61 = Naroch; 62 = Lit-5; 63 = Morino; 64 = Komaryshki; 65 = Kobuzi; 66 = Ulmate; 67 = Baltmuiža; 68 = Strante; 69 = Ecenieki; 70 = Purviai; 71 = Kvesai; 72 = Turženu; 73 = Jiesia; 74 = Rokai; 75 = Jonionys; 76 = Netiesos; 77 = Ratnycia; 78 = Plaskovsky; 79 = Ula; 80 = Kukli; 81 = Medininkai. Key sites are in Italic. Relying on the presented time-distance diagram (Fig. 11), the ice-free period before last glaciation in central and southern Lithuania could be extended up to the time range between 25.6 and 24.7 cal. 14C ka BP (Turženu, Jonionys), which indicates that the ice-free period ended 5 ka later than suggested previously on the basis of OSL dates from central Lithuania (Rokai) (Gaigalas et al. 2005). Similarly, the ice-free period in S Lithuania (Netiesos) and NW Belarus lasted presumably 6 ka longer than indicated by earlier OSL ages (Gaigalas et al. 2005) and should be prolonged to the time range of 24.7–22.6 cal. 14C ka BP (Jonionys, Gozha).
The youngest preglacial dates close to the LGM position (Jonionys) yielded an age of 24.7 cal. 14C ka BP (25–24.4cal. 14C ka BP; Table 1) in southern Lithuania (Jonionys) (Serebryanny 1978) and 22.6 cal. 14C ka BP (24.1–20.6 cal. 14C ka BP; Table 1) in NW Belarus (Gozha site) (Vigdorchik et al. 1974). As both of these sites were under periglacial conditions near the proposed LGM position during the last glaciation, the dates indicate that the last SIS should have reached the LGM position in the Baltic ISC area between 24.4 and 20.6 cal. 14C ka BP, when considering the whole time range instead of median calibrated ages. Furthermore, if two post-glacial dates also near the LGM position with the ages of 20.8 cal. 14C ka BP (Mančhiagine = 48) (Zimenkov et al. 1985) and 22 cal. 14C ka BP (Zervynos = 50) (Serebryanny 1978) are taken into account, it can be suggested that the last SIS reached and/or remained at the LGM position between 24.4 and 19.6 cal. 14C ka BP in the Baltic ISC area (Figs. 10, 11; Table 1). The TL dates from lacustrine sand below till in SE Lithuania also suggest that the SIS reached its maximum extent not earlier than 26–20 TL ka (Guobytė & Satkūnas 2011). In the adjoining area of NE Poland, the SIS reached the LGM position before 19.7 36Cl ka (Dzierżek & Zreda 2007) and between 20 and 18 TL ka (Krzywicki 2002). These dates correspond quite well with our estimated age range, considering that 36Cl or TL dates have larger errors than radiocarbon dates.

30
Karelian ISC area in the east (PAPERS II and III) The last SIS advance started about 4 OSL ka later in the eastern, Karelian ISC area than in the Baltic ISC in the west of the study area. A date from northern Estonia (Männiku = 91; Figs. 10, 12; Table 1) yielded an age of 21 (± 2.5) OSL ka (Raukas & Stankowski 2005), which expresses the time of ice-free condi-tions before the site was glaciated. Many other dated sites in northern Estonia (Pikasaare = 97, Haljala = 99, Voka = 100, Pehka = 182; Figs. 10, 12; Table 1) also confirm the ice-free period at least between 43.9 and 23 OSL ka (Kadastik 2004; Raukas & Stankowski 2005; Molodkov et al. 2007; Saarse et al. 2009). Therefore, it can be assumed that the last SIS reached the southern shores of the Gulf of Finland not before 21 OSL ka. Thus, the ice-free period which started in the Middle Weichselian can be prolonged to ca 21 OSL ka when the last SIS reached the eastern part of the study area. Based on a date from the Vidzeme Upland (Smeceres sils = 196; Figs. 10, 12; Table 1) (Raukas et al. 2010), the last SIS reached central Latvia not before 19.6 (± 1) OSL ka, which leaves about 1.4 ka for the SIS to have advanced from northern Estonia to central Latvia.
Ice streams of the Karelian ISC reached the LGM position in NE Belarus (Chizhovka site = 202 in Figs. 10, 12 and Table 1) not before 19.3 cal. 14C ka BP (Zimenkov 1989). As at some sites (Drichaluki = 197, Brigitpole = 198, Shapurovo = 200, Kasplyane = 201 in Figs, 10, 12 and Table 1) in NE Belarus, including the one from LGM position (Chizhovka = 202), the dated material originates from the same stratigraphic layer (Zubakov 1974), the youngest date among them can be used to evaluate the arrival of the last SIS to LGM position. Therefore, the dated plant detritus from Drichaluki between the two uppermost tills suggests that the last SIS should have reached the LGM position not earlier than 19.1 cal. 14C ka BP (19.4–18.9 cal. 14C ka BP; Table 1).
Considering the whole time-range of dates relevant to determining the age of the LGM, and also taking into account the ages of 16.6 cal. 14C ka BP (17.8–15.3 cal. 14C ka BP) from the Lozoviki site (Novik et al. 2010) and 16.8 cal. 14C ka BP (16.9–16.7 cal. 14C ka BP) from the Latyshi site (Zimenkov et al. 1985) of NE Belarus where the start of vegetation development after deglaciation has been dated, the last SIS should have rested at the LGM zone between 19.4 and 17.8 cal. 14C ka BP (Lozoviki = 176, Drichaluki = 197 in Figs. 10, 12 and Table 1) in the east of our study area. Comparison of the SIS advance in two parts of the study area (PAPER III) Based on chronological data and constructed time-distance diagrams, it can be concluded that the last SIS acquired a maximum extent earlier in the west, in the Baltic ISC area, than in the east, in the Karelian ISC area, even if the whole time range of the relevant dates is considered. Comparison of the SIS advance diagrams (Figs. 11, 12) shows that in the western part of the study area, the last SIS reached the LGM position in NW Belarus not earlier than 22.6 cal. 14C ka BP, while in the eastern part of the study area it had not yet reached the southern shores of the Gulf of Finland at that time. This conclusion is supported by the 14C AMS and OSL dates
31
from western, southern and eastern Finland (Nenonen 1995; Ukkonen et al. 1999; Lunkka et al. 2001; Lunkka et al. 2008) confirming the ice-free period between 35 and 25 ka in Finland, which is closer to the glaciation centre than our study area at the southern shores of the Gulf of Finland. Boulton et al. (2001) also concluded that in the southeastern sector of the Scandinavian glaciation, the maximum glacial extent reached the west earlier and the east later, and that the ice sheet was still advancing in the east whilst already retreating in the west.
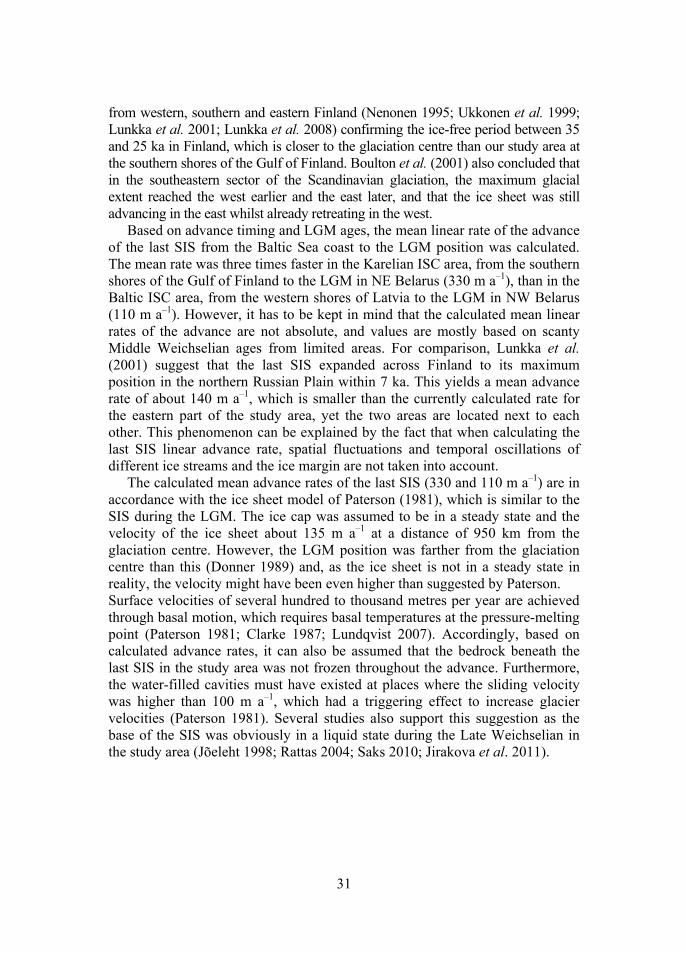
Based on advance timing and LGM ages, the mean linear rate of the advance of the last SIS from the Baltic Sea coast to the LGM position was calculated. The mean rate was three times faster in the Karelian ISC area, from the southern shores of the Gulf of Finland to the LGM in NE Belarus (330 m a–1), than in the Baltic ISC area, from the western shores of Latvia to the LGM in NW Belarus (110 m a–1). However, it has to be kept in mind that the calculated mean linear rates of the advance are not absolute, and values are mostly based on scanty Middle Weichselian ages from limited areas. For comparison, Lunkka et al. (2001) suggest that the last SIS expanded across Finland to its maximum position in the northern Russian Plain within 7 ka. This yields a mean advance rate of about 140 m a–1, which is smaller than the currently calculated rate for the eastern part of the study area, yet the two areas are located next to each other. This phenomenon can be explained by the fact that when calculating the last SIS linear advance rate, spatial fluctuations and temporal oscillations of different ice streams and the ice margin are not taken into account.
The calculated mean advance rates of the last SIS (330 and 110 m a–1) are in accordance with the ice sheet model of Paterson (1981), which is similar to the SIS during the LGM. The ice cap was assumed to be in a steady state and the velocity of the ice sheet about 135 m a–1 at a distance of 950 km from the glaciation centre. However, the LGM position was farther from the glaciation centre than this (Donner 1989) and, as the ice sheet is not in a steady state in reality, the velocity might have been even higher than suggested by Paterson. Surface velocities of several hundred to thousand metres per year are achieved through basal motion, which requires basal temperatures at the pressure-melting point (Paterson 1981; Clarke 1987; Lundqvist 2007). Accordingly, based on calculated advance rates, it can also be assumed that the bedrock beneath the last SIS in the study area was not frozen throughout the advance. Furthermore, the water-filled cavities must have existed at places where the sliding velocity was higher than 100 m a–1, which had a triggering effect to increase glacier velocities (Paterson 1981). Several studies also support this suggestion as the base of the SIS was obviously in a liquid state during the Late Weichselian in the study area (Jõeleht 1998; Rattas 2004; Saks 2010; Jirakova et al. 2011).

32
12 13 20 25
km c
. kal
aB
P
30 35NW
SE
14
15 16 17 18
19
900
100
200
300
400
500
600
700
800
9197
182
181
120
183
184
191
189
18
5
187
18
8
186
190
192
19
3
19
920020
1
202
203
20
4
101
8282
89
97
97
94
9287
98 100
96
83
83
95 99 102
103
104
105
106
107
108 1
09
110
112
113 11
4
11511
6117
11811
9
120
1211
22
12
4
125 126
127 12
8
129
13
0
13
113
1
132
133
13
4 135
136 1
37
99
195
19
7
19
4
100
198
19
6
84
8586 88
9190
841
38 138
139
140
141
14
2
14
3
144
14
514
6
14
7
1481
49
150151
15
215
3
154
155
15
6
15
7
15
8
15
9
16016
1
16
2
16
3165
16
6
16
7 168
170
169
16
9
17
1172
173
17
4
175
176
177
17
817
9
18
0
12 13 20 25 30 35
14
15 16
17 18 19
Pl
SS
1P
nS
aO
tH
nM
d-L
itV
epL
GM
111
16
41
23
GL
AC
IER
14
cal.
C a
ge
OS
L/T
L a
ge10
Be
age
SS
1P
lP
an
Sa
Ot
Hn
Md
-Lit
h
Vep
LG
M
- S
alpa
uss
elkä
I s
tag
e-
Pal
iver
e st
age
- P
andi
vere
sta
ge
- S
akal
a st
age
- O
tep
ää s
tage
- H
aan
ja (
Nor
th-L
ithu
ania
n)
s
tag
e - M
idd
le-L
ith
uan
ian
(
Kre
stet
s) s
tag
e-
Vep
sa (
Pom
eran
ian
,
Bal
tija
) st
age
- L
ast
Gla
cial
Max
imum
93

33
Fig. 12. Time-distance diagram in the eastern part of the study area (Karelian ISC area as zone B) along the azimuth line shown in Fig. 10. Dated sites: 82 = Nõva; 83 = Tabasalu; 84 = Kunda; 85 = Saha mire; 86 = Rae mire; 87 = Kuusalu; 88 = Pääsküla mire; 89 = Käsmu; 90 = Ruila lake; 91 = Männiku; 92 = Sillaotsa; 93 = Kemba; 94 = Valgejõe; 95 = Vaharu lake; 96 = Palmse; 97 = Pikasaare; 98 = Viitna; 99 = Haljala; 100 = Voka; 101 = Loobu; 102 = Udriku; 103 = Kallukse; 104 = Pannjärve; 105 = Räätsma; 106 = Iisaku; 107 = Mannjärve; 108 = Äntu; 109 = Varangu; 110 = Laiuse; 111 = Prossa; 112 = Puurmani; 113 = Elistvere; 114 = Vedu; 115 = Laeva; 116 = Peipsi; 117 = Saviku; 118 = Vasula; 119 = Naritsa; 120 = Vana-Kuuste; 121 = Kuliska; 122 = Nõuni; 123 = Lake Nakri; 124 = Nohipalu; 125 = Äidu; 126 = Kammeri; 127 = Taimeaia; 128 = Kaagvere; 129 = Lat-4; 130 = Kurenurme; 131 = Lat-3, Lat-3B; 132 = Lat-2; 133 = Viesuleni; 134 = Tamula; 135 = Līdumnieki; 136 = Solova; 137 = Remmeski; 138 = Jaanimäe; 139 = MLIT-13; 140 = EST-23; 141 = Viitka; 142 = Petruse; 143 = Veclaicene; 144 = MLIT-11; 145 = Lodesmuiža; 146 = MLIT-15; 147 = Lake Kūži; 148 = Raunis; 149 = Balti-12; 150 = MLIT-17; 151 = MLIT-19; 152 = MLIT-22; 153 = MLIT-21; 154 = MLIT-16; 155 = Dreimans; 156 = Sece; 157 = Balti-18; 158 = Lat-7; 159 = NLIT-4; 160 = Balti-15; 161 = Kurjanovas; 162 = Rudzāti; 163 = Balti-16; 164 = Lake Lielais Svētiņu; 165 = Leonovo; 166 = Balti-17; 167 = Burzava; 168 = Balti-13; 169 = Bel-15, Bel-15a; 170 = Zhizhitskoe; 171 = Bel-16; 172 = Bel-14; 173 = Bel-13; 174 = Lozoviki; 175 = Latyshi; 176 = Bel-19; 177 = Bel-9; 178 = Studenets; 179 = Sudoble; 180 = Svjatoe; 181 = Töölö; 182 = Pehka; 183 = Peedu; 184 = Tõrva; 185 = Laguja; 186 = Valga; 187 = Dores; 188 = Aabissaare; 189 = Lorupe; 190 = Mēri; 191 = Rõngu; 192 = Veselava; 193 = Misso; 194 = Dunayevo; 195 = Plavinas; 196 = Smeceres Sils; 197 = Drichaluki; 198 = Brigitpole; 199 = Borisovo; 200 = Shapurovo; 201 = Kasplyane; 202 = Chizhovka; 203 = Rubezhnitsa; 204 = Sloboda Dvina. Key sites are in Italic.
4.2.2. Deglaciation and chronology of the last termination
in the SE part of the Scandinavian glaciation
Deglaciation in the study area is mostly assessed on the basis of radiocarbon dates because these are more numerous than dates obtained by other methods. However, there was no preference among different dating methods. Radio-carbon dating has an advantage over other dating methods as it contains smaller errors and therefore also gives a smaller time range than, for example, OSL or 10Be ages. However, even on the background of radiocarbon dates, deglaciation occurred so rapidly that the dating errors often cover the time difference between neighbouring ice-marginal formations. It should also be borne in mind that radiocarbon dating reflects the start of organic deposition and vegetation development after the retreat of the ice sheet, which might have taken hundreds of years after the area became ice-free (Hodkinson et al. 2003; Amon 2011).
More dates relevant to establishing the deglaciation chronology for our study area are available from the eastern part which is better covered by chronological data than the western part. Differences and similarities between the decay of the last SIS in the western Baltic ISC area and the eastern Karelian ISC area can be observed in time-distance diagrams (Figs. 11, 12) and are discussed below.

34
Baltic ISC area in the west (PAPER III) In the Baltic ISC area, the last deglaciation started not earlier than 22.6 cal. 14C ka BP in NW Belarus close to the LGM position (Gozha = 51). Within ca 8 ka the ice margin retreated to the NW of Latvia (site 1; Figs. 10, 11; Table 1), but not before 14.2 (± 1.3) 10Be ka (Rinterknecht et al. 2006). The following six major SIS stagnations occurred in the western part of the study area during this deglaciation (starting with the oldest one): LGM, Baltija, South-Lithuanian (Sth-Lit), Middle-Lithuanian (Md-Lit), Haanja (Hn) and Sakala (Sa) (Fig. 13).
Different authors have suggested various correlations of the ice-marginal zones across the glaciated area (Kalm 2006, 2012a; Zelčs et al. 2011; Bitinas 2012). The Baltija ice-marginal zone in the western and the Vepsian ice-marginal formation in the eastern part of the study area are often correlated morphologically (Kalm 2012a), yet the synchronous timing of their formation based on the time-distance diagrams is questionable. According to our study, the Baltija ice-marginal zone appears to be about 4.5 ka older than the Vepsian ice-marginal zone. The time-distance diagram (Fig. 11) suggests that the decay of the last SIS was most rapid between the LGM and the South-Lithuanian ice-marginal zone. Karabanov & Matveyev (2011) are of the same opinion and explain this fact by wide distribution of ice-dammed lakes in front of the ice margin in NW Belarus, which provoked a relatively high rate of ice melting and calving. The calculated last SIS recession rate between the South-Lithuanian and Sakala ice-marginal zones is rather similar. Still, more dates from this area are absolutely necessary, to confirm this conclusion, as presently only two dates from mammoth remains from central Lithuania (Jiesia = 73) and SW of Latvia (Rucava = 9 in Figs. 10, 11 and Table 1) are significant for constructing the chronology of the decay of the last SIS in the Baltic ISC area (Arppe & Karhu 2010). Based on the time-distance diagram, most of the dates involving deglaciation in the western part of the study area are relatively young for assessing the decay of the last SIS. For example, some radiocarbon ages (sites 4, 5 and 7 in Fig. 11) between the Haanja and Sakala ice-marginal zones express the time of deposition of the Baltic Ice Lake sediments, as the samples for dating were taken from glaciolacustrine sands above varved clay (Danilans 1973). Furthermore, 14C dates express the onset of vegetation in a particular area and thus do not directly reflect the timing of deglaciation. Cosmogenic beryllium dates are also mostly too young for the assessment of the deglaciation chronology in this part of the study area, possibly because the dated erratic boulders were not exposed to cosmic rays immediately after deglaciation (Heyman et al. 2011) but were covered by waters of glacial lakes.

35
Fig. 13. Location of sites with dated sediments of Late Weichselian (post-LGM) age on the background of the ice-flow pattern.
Karelian ISC area in the east (PAPERS II and III) The decay of the last SIS in the Karelian ISC area started after the SIS reached the LGM position at 19.1 cal. 14C ka BP (Drichaluki = 198). The time-distance diagram (Fig. 12) indicates an approximately 2.6 ka standstill or dead ice field at the position of the maximum SIS extent, as suggested by Karabanov & Matveyev (2011), because ages from the modelled LGM position, which would fall into the time range of 19.1–16.8 cal. 14C ka BP (median age at the Dricha-luki and Latyshi sites) are lacking. The first date that can confirm deglaciation in the Karelian ISC area from the LGM position towards the southern shores of the Gulf of Finland is the one from NE Belarus, about 40 km west of the Vitebsk Upland (Latyshi = 176 in Figs. 10, 12 and Table 1), showing an age of 16.8 cal. 14C ka BP (Zimenkov et al. 1985). Within 3.5 ka the whole area from the LGM to the southern Gulf of Finland was deglaciated, as indicated by the radiocarbon age (13.3 cal. 14C ka BP) of lake deposits from northern Estonia (Pääsküla = 88; Figs. 10, 12; Table 1) (Heinsalu & Veski 2007). Thus the
dated site
19.2 - LGM age (ka)
ice-marginal zones
Gul nlandf of Fi
Gulf ofRiga
Ladoga Lake
LakePeipsi
L.Ilmen
ea
BalticS
SS1
<22.3
<19.2
Pl
PnSa
Ot
nH
Md-Lit
- tMd Li
aBaltij
Vep
MLG
Sth-Lit
ice flow direction (Ber 2000; Kalm 2012a)
ZONE A ZONE B

36
deglaciation in the Karelian ISC area was about twice as fast as in the Baltic ISC area. The faster retreat of the last SIS in the eastern part of the study area could be explained by large meltwater bodies in front of the SIS, which favoured more rapid decay of the ice margin due to calving. Eight major SIS stagnations occurred during deglaciation of the Karelian ISC area, resulting in the formation of ice-marginal zones – LGM, Vepsian (Vep), Middle-Lithuanian (Md-Lit), Haanja (Hn), Otepää (Ot), Sakala (Sa), Pandivere (Pn) and Palivere (Pl) (Fig. 13). The distance between different ice-marginal zones is mainly in the range of 20–100 km, which is much smaller than in the western part of the study area and implies a faster decay of the SIS. Although the deglaciation rate was different in the west and in the east, some ice-marginal zones such as the Middle-Lithuanian, Haanja and Sakala zones, have a similar formation-time in both parts of the study area as shown in the time-distance diagrams (Figs. 11, 12). A possible explanation is that calculation of the deglaciation rate does not take into account other features such as the possible surges or fan-shape flow of ice streams and fluctuations of the ice sheet margin.
Although it is difficult to achieve an exact timing of the formation of ice-marginal zones across the study area, an attempt has been made to determine the age for the five youngest ice-marginal zones in its eastern part, Estonia (PAPERS II and III). The modelled decay of the last SIS in Estonia is shown in Fig. 14.
Haanja ice-marginal zone The age of the oldest Estonian ice-marginal zone, Haanja, is traditionally (Pirrus & Raukas 1996; Raukas 2009) determined from dating the Raunis interstadial sediments below the Haanja till (between 15.7 and 15.9 cal 14C ka BP; Dreimanis & Zelčs 1995; Zelčs & Markots 2004) in northern Latvia (Fig. 14). After the ice front retreated from the northern slopes of the Haanja Heights, varved clay deposition started in Lake Tamula ca. 14 675 varve years ago (Sandgren et al. 1997; Kalm 2006; Raukas 2009). Consequently, dates from below and above the Haanja stadial till place the formation of the ice-marginal zone between ca 15.7 and 14.7 cal. ka BP. Raukas (2009) reported two new (10.5 and 10.4 cal 14C ka BP) dates from the Raunis section and questioned the interstadial age of the sediments there. However, even if the organic sediments in the Raunis section are not interstadial, the Haanja ice-marginal zone formed before the start of varved clay deposition in Lake Tamula, which took place before 14.7 ka BP. During the Haanja phase of deglaciation a small northeast–southwest oriented ice tongue operated between the Haanja and Otepää uplands (Karukäpp 2004; Kalm 2010). It is probably responsible for burial of pieces of wood, gyttja and sand layers under the surficial till in few locations (Kure-nurme, Kaagvere in SE Estonia).

37
Fig. 14. Modelled decay of the Late Weichselian ice in Estonia along the general azi-muth line. The sites mentioned in the discussion concerning the chronology in Estonia: 8 = Nõuni, 9 = Kurenurme , 10 = Kaagvere, 11 = Remmeski, 12 = Viitka, 13 = Petruse, 55 = Lake Peipsi , 56 = Nohipalu, 59 = Taimeaia, 70 = Kõpu, 71 = Vigala, 83 = Tamula.
11
00
0
11
50
0
12
00
0
12
50
0
13
00
0
13
50
0
14
00
0
14
50
0
15
00
0
15
50
0
16
00
0
Paliv
ere
Pan
div
ere
Saka
la
Ote
pää
NE
Latv
iaE
stonia
SW
Fin
land
Ss
I
Kopu
Vigala (> 476 varves on Pandivere)
NW
SE
Le
ge
nd
:
C d
ate
14 OS
L d
ate
10B
e d
ate
Err
or
ba
rs
Silt
& s
an
d
Va
rve
d c
lay
Ice
re
cess
ion
lin
e
5S
ite n
o in
Fig
. 1
Haanja
34
33
36
35 39
40
47
2 2
2
32
7
1
38
414
2
43
44
45
51
52
53
54
57
Tl 120 ares o aan) amua(0vvnHja
56
59
60
9
10
62
63
64
33
46
58 58
50
5353
30
48
61
4
55
5
49
3
31
6
8
Ruis an
912 13
54
45
60
10
01
40
18
02
20
26
0A
B
62
16
50
0
17
00
0
25
25
37
0
68
11
67
km
cal y
r B
P
83
83
71
70
30
0

38
The oldest 14C ages from buried organics under the Haanja till in Kurenurme (14.5 and 14.9 cal. 14C ka BP) and OSL ages of buried sand in Kurenurme and Kaagvere (12.7, 14.5 and 14.9 cal. 14C ka BP) confirm that the Haanja zone was formed before 14.9 cal. 14C ka BP. All five measured 14C ages from the Haanja Upland beyond the Haanja ice-marginal belt (between 12.8 and 14.9 cal 14C ka BP; Kalm 2006) are restricted to superficial organic deposits (Remmeski) or plant detritus and peat buried under the slope wash and debris of hummocky moraine topography (Viitka, Petruse). The first organic sediments (gyttja, peat and plant detritus) on the Haanja Upland started to accumulate at the time (≤14.9 cal. 14C ka BP) when the upland was surrounded by ice from the west, north and east.
Otepää ice-marginal zone The formation time of the Otepää ice-marginal zone is older than its direct dating from the region of the Otepää Upland. The 12.9 cal 14C ka BP age of the first lateglacial organics in the Nõuni section of lacustrine deposits (Saarse 1979), which is situated just on the proximal side of the Otepää ice-marginal zone, indicates the start of vegetation after deglaciation rather than direct deglaciation time. In addition, two 13.2 OSL ka ages from sand of the glaciofluvial delta (Taimeaia) and kame (Nohipalu) (Raukas & Stankowski 2005), located also in the proximal position relative to the Otepää ice-marginal zone, indicate an earlier retreat of the ice from that zone. Radiocarbon dates (12.9 to 13.9 cal. 14C ka; Saarse & Liiva 1995; Sohar & Kalm 2008; Kalm & Sohar 2010) and OSL ages (13.1–14.0 ka) from glaciofluvial deposits (Raukas & Stankowski 2005) between the Otepää and Pandivere ice-marginal zones, suggest ice recession from the Otepää ice-marginal zone well before 14 OSL ka.
Sakala ice-marginal zone The Sakala ice-marginal zone has been suggested to occur between the Otepää and Pandivere ice-marginal zones (Pirrus & Raukas 1996; Raukas et al. 2004; Kalm 2010). However, it is morphologically difficult to identify and accurate dating is problematic.
Pandivere ice-marginal zone Based on varve studies in eastern Estonia, Hang (2003) concluded that deglaciation of the northern part of the glacial Lake Peipsi started around 13 500 varve ka ago and ended ca 370 years later. Hang (2003) also suggested that the first 184 varves in glacial Lake Peipsi were deposited before the ice margin withdrew from the Pandivere ice-marginal zone. According to him, the start of deposition of distal varves some 13300–13320 varve years ago corresponds to the withdrawal of the ice from the Pandivere zone. Based on Saarse et al. (2009) and PAPER III, it can be concluded that ice cover of the Pandivere Upland started to perish already before 13.9 cal. 14C ka BP, that is some 0.5 ka earlier than in the depression of Lake Peipsi.

39
Palivere ice-marginal zone Hang & Sandgren (1996) counted 476 annual varves at Vigala in western Estonia between the Pandivere and Palivere ice-marginal zones and dated the Palivere marginal formations to about 11 800 years BP. With the correction of missing 875 varves according to Swedish varve chronology (Andren et al. 1999), they assigned the Palivere ice-marginal zone an age of 12.675 years BP, from which an age for the Palivere re-advance around 12.7 cal 14C ka BP was derived. However, eight 10Be ages from the Palivere ice-marginal zone have a weighted mean age of 13.6 ka (Rinterknecht et al. 2006), which predates even the 10Be age (13.1 ka) of the Haanja ice-marginal zone in SE Estonia. However, according to overall deglaciation chronology in the eastern part of the study area (the Karelian ISC area; PAPER III and Saarse et al. 2012), the Palivere ice-marginal zone formed before 13.3 cal. 14C ka BP. This result corresponds well with the suggestion by Lunkka et al. (2004) that the ice margin of the SIS reached the coastal areas of southern Finland 13.1 ka ago. Similar studies from the Vologda area, NW Russia, confirm that the Lake Onega basin between the Pandivere and Salpausselkä ice-marginal zones was deglaciated between 14.25 and 12.74 cal. 14C ka BP (Lunkka et al. 2001; Saarnisto & Saarinen 2001).
Comparison of the deglaciation in two parts of the study area The calculated linear rate of deglaciation was slower in the Baltic ISC area than in the Karelian ISC area, whereas the formation of one ice-marginal zone in each of these areas took about 1.6 ka and about 0.5 ka, respectively. The calculated linear mean rate of the last SIS recession in the western part of the study area was ca 50 m a–1, which is about two times slower than in SW Sweden, where the varve chronology suggests a retreat rate of 75–100 m a–1 (Ringberg & Erlström 1999). In the eastern part of the study area, the respective value was about 170 m a–1, i.e. about ten times faster than in the west. Compared to mean recession rates of 150 m a–1, previously suggested for the Karelian ISC area from varved clays in the Lake Peipsi depression (Hang 2001), and 110 m a–1 from the Haanja to Palivere ice-marginal zones in Estonia (Kalm 2006), the recession rate in this thesis is somewhat higher. In Russia, bordering on the eastern part of the study area, the ice-retreat rate from Kubenskoye to northern Lake Ladoga and Lake Onega was estimated to be 60–80 m a–1 (Lunkka et al. 2001). Based on varved clays, the maximum rate in the Onega area was about 200 m a–1 (Saarnisto & Saarinen 2001). This value is slightly higher, but still more or less in agreement with the calculated recession rate given in this thesis, because it is a maximum and not a mean rate.

40
5. CONCLUSIONS
The most important conclusions of this thesis are as follows:
According to chronological data available from the Valdai Upland (Ki-leshino site), ice-free conditions existed between 72.2 OSL and 33.8 cal. 14C ka BP in the western part of the East European Plain.
The Scandinavian Ice Sheet reached the Valdai Upland (Kileshino site) only once during the last 72.2 ka – during the Late Weichselian after 33.8 cal, 14C ka BP, and presumably between 19.1 cal. 14C BP and 18 OSL ka.
The last SIS in the Baltic ISC area reached the western shores of Latvia not before 26 OSL ka, advanced further to central Lithuania not before 25.6 cal. 14C ka BP and reached southern Lithuania not before 24.7 cal. 14C ka BP.
In the Karelian ISC area, the last SIS reached the southern shores of the Gulf of Finland not before 21 OSL ka and central Latvia not before 19.6 OSL ka.
The last SIS reached its maximum extent in NW Belarus not earlier than 22.6 cal. 14C ka BP and in NE Belarus not earlier than 19.1 cal. 14C ka BP.
When considering the whole time range of individual dates and the youngest dates which express the beginning of vegetation development, the last SIS could have been at its maximum extent in the Baltic ISC area between 24.4 and 19.6 cal. 14C ka BP, and in the Karelian ISC area between 19.4 and 17.8 cal. 14C ka BP.
The mean calculated linear advance rate of the last SIS in the western part of the study area was 110 m a–1 and about three times faster in the eastern part, 330 m a–1. These values, however, are tentative because of the scanty data from the Middle Weichselian. Nevertheless, the calculated relatively high speed of ice advance suggests warm-based conditions and that the bed beneath the last SIS in the study area was not frozen throughout the SIS advance.
Deglaciation in the Baltic ISC area started not earlier than 22.6 cal. 14C ka BP. By 14.2 10Be ka, the entire area between the LGM position in NW Belarus and the western shores of Latvia was deglaciated. In the Karelian ISC area, the last SIS recession started not earlier than 19.1 cal. 14C ka BP. By 13.3 cal. 14C ka BP, the whole area between the LGM position in NE Belarus and the southern shores of the Gulf of Finland was ice-free.
The last SIS recession rate in the study area was about three times faster in the east than in the west, 50 and 170 m a–1, respectively.
41
ACKNOWLEDGEMENTS I am grateful to my supervisors Prof. Volli Kalm and senior researcher Tiit Hang for their help and guidance. My colleagues from the Department of Geology, University of Tartu, especially the ‘Quaternary-team’, are warmly thanked for their constructive help and support. Anne Noor is acknowledged for language correction. This research was financed by the Estonian Research Council Project SF0180048s08, Estonian Science Foundation grants 7563 and 9107, Doctoral School of Earth Sciences and Ecology and Archimedes Foundation (Kristjan Jaak scholarship programme). Finally, my sincerest thanks go to my family and friends for their support.

42
REFERENCES Amon, L. & Saarse, L. 2010. Postglacial palaeoenvironmental changes in the area
surrounding lake Udriku in North Estonia. Geological Quarterly 54, 85–94. Amon, L. 2011. Palaeoecological reconstruction of Late-glacial vegetation dynamics in
eastern Baltic area: a view based on plant macrofossil analysis. Ph.D. thesis, Tallinn Technical University Press, 154 pp.
Andren, T., Björk, J. & Johnsen, S. 1999. Correlation of the Swedish glacial varves with the Greenland (GRIP) oxygen isotope stratigraphy. Journal of Quaternary Science 14, 361–371.
Arppe, L. & Karhu, J. A. 2010. Oxygen isotope values of precipitation and the thermal climate in Europe during the middle to late Weichselian ice age. Quaternary Science Reviews 29, 263–1275.
Arslanov, Kh. A. 1993. Late Pleistocene geochronology of European Russia. Radiocarbon 35, 421–427.
Behre, K.-E. 1989. Biostratigraphy of the last glacial period in Europe. Quaternary Science Reviews 8, 25–44.
Bitinas, A. 2012. New sights into the last deglaciation of the south-eastern flank of the Scandinavian Ice Sheet. Quaternary Science Reviews 44, 69–80.
Boulton, G. S., Dongelmans, P., Punkari, M. & Broadgate, M. 2001. Palaeoglaciology of an ice sheet through a glacial cycle: the European ice sheet through the Weichselian. Quaternary Science Reviews 20, 591–625.
Bronk Ramsey, C. 2009. Bayesian analysis of radiocarbon dates. Radiocarbon, 51, 337–360.
Carlson, A.E., Clark, P.U., 2012. Ice sheet sources of sea level rise and freshwater discharge during the last deglaciation. Reviews of geophysics 50, 1–72.
Chebotareva, N.S., Macarycheva, I.A., 1982. Geochronology of environmental evolution within the glaciated area of Eastern Europe during the Valday epoch. In: Gerasimov, I.P., Velichko, A.A. (eds.): Paleogeography of Europe in the last 100,000 Years, 36–48. Nauka, Moscow. [in Russian]
Clarke, G. K. C. 1987. Fast glacier flow: ice streams, surging and tidewater glaciers. Journal of Geophysical Research 92, 8835–8841.
Clark, P., Dyke, A., Shakun, J., Carlson, A., Clark, J., Wohlfarth, B., Mitrovica, J., Hostetler, S. & McCabe, A. 2009. The last glacial maximum. Science 325, 710–714.
Danilans, I. 1973. Chetvertichnye Otlozhenia Latvii (Quaternary Depostis of Latvia). Zinatne, Riga, 312 pp.
Demidov, I. N., Houmark-Nielsen, M., Kjær, K. H., Larsen, E., Lyså, A., Funder, S., Lunkka, J. P. & Saarnisto, M. 2004. Valdaian glacial maxima in Arkhangelsk dist-rict of northwestern Russia. In: Ehlers, J. & Gibbard, P. L., (eds): Quaternary Gla-ciations: Extent and Chronology, Part I: Europe, 321–335. Elsevier, Amsterdam.
Demidov, I., Houmark-Nielsen, M., Kjaer, K. & Larsen, E. 2006. The last Scandinavian Ice Sheet in northwestern Russia: ice flow patterns and decay dynamics. Boreas 35, 425–443.
Deschamps, P., Durand, N., Bard, E., Hamelin, B., Camoin, G., Thomas, A. L., Hender-son, G. M., Okuno, J., Yokoyama, Y., 2012. Ice-sheet collapse and sea-level rise at the Bolling warming 14,600 years ago. Nature 483 (7391), 559–564.
Donner, J. 1989. Transport distances of Finnish crystalline erratics during the Weichselian glaciation. Geological Survey of Finland, Special Paper 7, 7–13.

43
Dreimanis, A. & Zelčs, V. 1995. Pleistocene stratigraphy of Latvia. In: Ehlers, J., Kozarski, S. & Gibbard, P. (eds.): Glacial Deposits in North-East Europe, 105–113. Balkema, Rotterdam.
Dzierżek, J. & Zreda, M. 2007. Timing and style of deglaciation of northeastern Poland from cosmogenic 36Cl dating of glacial and glaciofluvial deposits. Geological Quarterly 51, 203–216.
Ehlers, J. & Gibbard, P. L. 2004. Quaternary Glaciations Extent and Chronology: Europe, Part I. Elsevier, Amsterdam, 475 pp.
Ehlers, J. 2007. Glaciations- Late Pleistocene Glaciations in Europe. In: Elias S.A. (ed.), Encyclopedia of Quaternary Science, 1023–1031. Elsevier, Amsterdam.
Ehlers, J., Gibbard, P. L., Hudges, P.D. 2011. Developments in Quaternary Science 15. Elsevier, Amsterdam, 1108 pp.
Ehlers, J., Astakhov, V., Gibbard, P. L., Mangerud, J., Svendsen, J. I. 2013. Glacia- tions – Late Pleistocene in Eurasia. In: Elias, S.A. (ed.), Encyclopedia of Quaternary Science (Second Edition), 224–235. Elsevier, Amsterdam.
Fairbanks, R. 1989. A 17,000-year glacio-eustatic sea level record: Influence of glacial melting rates on the Younger Dryas event and deep-ocean circulation. Nature 342, 637–642.
Gaigalas, A. & Pazdur, A. 2004. Radiocarbon dating of Late Quaternary in Lithuania. In Book of Abstracts, 8th International conference “Methods of absolute chronology”, 17–19 May 2004, Ustroń, Poland, 51–53.
Gaigalas, A., Fedorowicz, S. & Melesyte, M. 2005. TL dates of aquatic sandy sediments of Middle-Upper Pleistocene in Lithuania. Geologija 51, 39–49.
Gaigalas, A. & Fedorowicz, S. 2009. Co-operation between Gdansk and Vilnius Universities in Pleistocene geochronology investigations. Geologija 51, 74–85.
Guobytė, R. & Satkūnas, J. 2011. Pleistocene Glaciations in Lithuania. In Ehlers, J., Gibbard, P. L. & Hughes, P. D. (eds.): Developments in Quaternary Science 15, 231–246. Elsevier, Amsterdam.
Gyllencreutz, R., Mangerud, J., Svendsen, J. -I. & Lohne, Ø. 2007: DATED- A GIS-based Reconstruction and dating Database of the Eurasian Deglaciation. Geological Survey of Finland, Special Paper 46, 113–120.
Hang, T. & Sandgren, P. 1996. Magnetostratigraphy of varved clays. In: Meidla, T., Puura, I., Nemliher, J., Raukas, A. & Saarse, L. (eds.), The Third Baltic Stratigraphicalal Conference. Abstracts. Field Guide, Tartu, 152–154.
Hang, T. 2001. Proglacial sedimentary environment, varve chronology and Late Weichselian development of the Lake Peipsi, eastern Estonia. Ph.D. thesis, Stockholm University, 44 pp.
Hang, T. 2003. A local clay-varve chronology and proglacial sedimentary environment in glacial Lake Peipsi, eastern Estonia. Boreas, 32, 416–426.
Hang, T., Ojala, A., Kohv, M. & Tuvikene, T. 2011. Varve chronology and proglacial sedimentary environment in Pärnu area western Estonia. In: Johansson, P., Lunkka, J. P. & Sarala, P. (eds.): Late Pleistocene Glacigenic Deposits from the Central Part of the Scandinavian Ice Sheet to Younger Dryas End Moraine Zone: INQUA Peribaltic Working Group Meeting and Excursion, Northern Finland, 12–17 June 2011, Geological Survey of Finland, Rovaniemi, 94–95.
Heinsalu, A. & Veski, S. 2007. The history of the Yoldia Sea in Northern Estonia: palaeoenvironmental conditions and climatic oscillations. Geological Quarterly 51, 295–306.

44
Heyman, J., Stroeven, A. P., Harbor, J. M. & Caffe, M. W. 2011. Too young or too old: Evaluating cosmogenic exposure dating based on an analysis SIS of compiled boulder exposure ages. Earth and Planetary Science Letters 302, 71–80.
Hodkinson I. D., Coulson S. J. & Webb N. R. 2003. Community assembly along proglacial chronosequences in the high Arctic: vegetation and soil development in north-west Svalbard. Journal of Ecology 91, 651–663.
Houmark-Nielsen, M., 2004. The Pleistocene of Denmark: a review of stratigraphy and glaciation history. In: Ehlers, J. & Gibbard, P. L. (eds.): Quaternary Glaciations- Extent and Chronology. Part I: Europe, 35–46. Elsevier, Amsterdam.
Houmark-Nielson, M., 2007. Extent and age of Middle and Late Pleistocene glaciations and periglacial episodes in southern Jylland, Denmark. Bulletin of the Geological Society of Denmark 55, 9–35.
Houmark-Nielsen, M., 2008. Testing OSL failures against a regional Weichselian glaciation chronology from southern Scandinavia. Boreas 37, 660–677.
Houmark-Nielsen, M., 2011. Pleistocene Glaciations in Denmark: A Closer Look at Chronology, Ice Dynamics and Landforms. In: Ehlers, J., Gibbard, P. L. & Hughes, P. D. (eds.): Developments in Quaternary Science 15, 47–58. Elsevier, Amsterdam.
Hughes, P.D., Gibbard, P.L. & Ehlers, J. 2013. Timing of glaciation during the last glacial cycle: evaluating the concept of a global ‘Last Glacial Maximum’ (LGM). Earth-Science Reviews 125, 171–198.
Ilves, E. 1980. Verzeichnis der im Institut für Zoologie und Botanik der Akademie der Wissenschaften der Estnischen SSR mittels der Radiokohlenstoff-Methode Datieren Proben. X. Mitteilund. Proceedings of the Estonian Academy of Sciences, Biology 29, 73–79 [in Russian with German summary].
Jirakova, H., Huneau, F., Celle-Jeanton, H., Hrkal, Z. & Le Coustumer, P. 2011. Insights into palaeorecharge conditions for European deep aquifers. Hydrogeology Journal 19, 1545–1562.
Jõeleht, A. 1998. Geothermal studies of the Precambrian basement and Phanerozoic sedimentary cover in Estonia and in Finland. Ph.D. thesis, Tartu University Press, 124 pp.
Johansson, P., Lunkka, J. P. & Sarala, P. 2011. The Glaciation of Finland. In: Ehlers, J., Gibbard, P. L. & Hughes, P. D. (eds.): Developments in Quaternary Science 15, 105–116. Elsevier, Amsterdam.
Kadastik, E. 2004. Upper-Pleistocene stratigraphy and deglaciation history in northernwestern Estonia. Ph.D. thesis, Tartu University Press, 128 pp.
Kajak, K. 1995. Eesti kvaternaarisetete kaart. Mõõtkava 1:2 500 000. [Map of the Quaternary deposits of Estonia. In scale 1:2 500 000] Eesti Geoloogiakeskus. Tallinn, 26 pp. [in Estonian].
Kalm, V. 2006. Pleistocene chronostratigraphy in Estonia, southerneastern sector of Scandinavian glaciation. Quaternary Science Reviews 25, 960–975.
Kalm, V. 2012a. Ice-flow pattern and extent of the last Scandinavian Ice Sheet southeast of the Baltic Sea. Quaternary Science Reviews 44, 51–59.
Kalm, V. 2012b. Last Scandinavian Glaciation southeast of the Baltic Sea: ice-flow pattern, ice marginal positions and thickness of the Quaternary deposits in the background of bedrock topography. Quaternary International 279–280, p. 231.
Kalm, V. & Sohar, K. 2010. Oxygen isotope fractionation in three freshwater ostracod species from early Holocene lacustrine tufa in northern Estonia. Journal of Paleolimnology, 815–828.

45
Kalm, V. & Gorlach, A. 2014. Impact of bedrock surface topography on spatial distribution of Quaternary sediments and on the flow pattern of late Weichselian glaciers on the East European Craton (Russian Plain). Geomorphology 207, 1–9.
Karabanov, A. K. & Matveyev, A. V. 2011. The Pleistocene Glaciations in Belarus. In Ehlers, J., Gibbard, P. L. & Hughes, P. D. (eds.): Developments in Quaternary Science 15, 29–35. Elsevier, Amsterdam.
Karukäpp, R. 2004. Late-Glacial ice streams of the southeastern sector of the Scandi-navian Ice Sheet and the asymmetry of its landforms. Baltica 17, 41–48.
Krzywicki, T. 2002. The maximum ice sheet limit of the Vistualian Glaciation in northeastern Poland and neighbouring areas. Geological Quarterly 46, 165–188.
Lambeck, K., Purcell, A., Zhao, J. & Svensson, N-O. 2010. The Scandinavian Ice Sheet: from MIS 4 to the end of the Last Glacial Maximum. Boreas 19, 410–435.
Liivrand, E. 1991. Biostratigraphy of the Pleistocene deposits in Estonia and correlations in the Baltic Region., Ph.D.thesis, Stockholm University. Department of Quaternary Research. Report 19, 114 pp.
Lundqvist, J.; Saarnisto, M. & Rutter, N. 1995. IGCP 253 – Termination of Pleistocene – Final Report. Quaternary International 28, 201 pp.
Lundqvist, J. 2007. Surging ice and break-down of an ice dome – a deglaciation model for the Gulf of Bothnia. GFF 129, 329–336.
Lunkka, J.P., Saarnisto, M., Gey, V., Demidov, I. & Kiselova, V. 2001. Extent and age of the Last Glacial Maximum in the southeastern sector of the Scandinavian Ice Sheet. Global and Planetary Change 31, 407–425.
Lunkka, J. P., Johansson, P., Saarnisto, M. & Sallasmaa, O. 2004. Glaciation of Finland. In: Ehlers, J. & Gibbard, P. L. (eds.): Quaternary Glaciations- Extent and Chronology. Part I: Europe, 93–100. Elsevier, Amsterdam.
Lunkka, J. P., Murray, A. & Korpela, K. 2008. Weichselian sediment succession at Ruunaa, Finland, indicating a Mid-Weichselian ice-free interval in eastern Fennoscandia. Boreas 37, 234–244.
MacDonald, G. M., Beukens, R. P. & Kieser, W.E. 1991. Radiocarbon Dating of Lim-nic Sediments: A Comparative Analysis and Discussion. Ecology 72, 1150–1155.
Mangerud, J., 1991: The last interglacial/glacial cycle in Northern Europe. In: Shane, L. C. K. & Cushing, E. J. (eds.): Quaternary Landscapes, 38–75. University of Minnesota Press, Minneapolis.
Marks, L. 1997. Middle and Late Vistulian glaciation in Poland. In: Satkūnas, J. (ed.): The Late Pleistocene in Eastern Europe: Stratigraphy, Paleoenvironment and Climate. INQUA-SEQS Symposium, Lithuanian Geological Survey, Vilnius, p. 36.
Marks, L. 2002. Last Glacial Maximum in Poland. Quaternary Science Reviews 21, 103–110.
Marks, L. 2004. Pleistocene glacial limits in Poland. In: Ehlers, J., Gibbard, P.L. (eds.), Quaternary Glaciations––Extent and Chronology, Part I: Europe, 295–300. Elsevier, Amsterdam.
Marks, L. 2010. Timing of the Late Vistualian (Weichselian) glacial phases in Poland. Quaternary Science Reviews 44, 81–88.
Marks, L. 2011. Quaternary Glaciations in Poland. In: Ehlers, J., Gibbard, P. L. & Hughes, P. D., (eds.): Developments in Quaternary Science 15, 299–304. Elsevier, Amsterdam.
Martinson, D.G., Pisias, W.G., Hays, J.D., Imbrie, J., Moore, T.C., Jr., and Shackleton, N.J., 1987. Age dating of the orbital theory of the Ice Ages: Development of a high-resolution 0–300,000-year chronostratigraphy. Quaternary Research 27, 1–29.

46
Molodkov, A., Bolikhovskaya, N., Miidel, A. & Ploom, K. 2007. The sedimentary sequence recovered from the Voka outcrops, northeastern Estonia: implications for late Pleistocene stratigraphy. Estonian Journal of Earth Sciences 56, 47–62.
Molodkov, A., Bitinas, A., Damušytė, A. 2010. IR-OSL studies of till and inter-till deposits from the Lithuanian Maritime Region. Quaternary Geochronology 5 (2–3), 263–268.
Munsell Color 1998. Munsell Soil Color Charts, Revised Washable Edition. Gretag-Macbeth, New Windsor, NY.
Murray, A. & Wintle, A. 2000. Luminescence dating of quartz using an improved single-aliquot regenerative-dose protocol. Radiation Measurements 32, 57–73.
Nenonen, K. 1995. Pleistocene Stratigraphy and reference Sections in Southern and Western Finland. Ph.D. thesis, Geological Survey of Finland, 94 pp.
Novik A., Punning, J-M. & Zernitskaya, V. 2010. The development of Belarussian lakes during the Late Glacial and Holocene. Estonian Journal of Earth Sciences 59, 63–79.
Paterson, W. S. B. 1981. The Physics of Glaciers. Pergamon Press Ltd., London, 380 pp.
Pavlovskaya, I., Davydik, K., Luchina, G. & Kolkovsky, V. 2002. Evolution of the Neman valley recorded in Late Poozerian (Late Weichselian) sediments at Gozha. In: Pavlovskaya, I. (ed.): Field Symposium on Quaternary Geology and Geodyna-mics in Belarus. Excursion Guide, 58–62. Institute of Geological Sciences, Minsk, Belarus.
Pirrus, R. & Raukas, A. 1996. Late-Glacial stratigraphy in Estonia. Proceedings of the Estonian Academy of Sciences, Geology 45 (1), 34–45.
Punkari, M. 1997. Glacial and glaciofluvial deposits in the interlobate areas of the Scandinavian ice sheet. Quaternary Science Reviews 16, 741–753.
Rattas, M. 2004. Subglacial environments in the formation of drumlins - The case of the Saadjärve Drumlin Field, Estonia. Ph.D. thesis, University of Tartu, 116 pp.
Raukas, A. 1978. Pleistocene deposits of the Estonian SSR. Valgus, Tallinn, 310 pp [in Russian with English summary].
Raukas, A. 1992. Ice marginal formations of the Palivere zone in the eastern Baltic. Sveriges Geologiska Undersökning, Ca 81: 277–28.
Raukas, A. 2004. Application of OSL and 10Be techniques to the establishment of deglaciation chronology in Estonia. Proceedings of the Estonian Academy of Sciences, Geology 53, 267 - 287.
Raukas, A. 2009. When and how did the continental ice retreat from Estonia? Quarter-nary International 207, 50–57.
Raukas, A., Kalm, V., Karukäpp, R. & Rattas, M. 2004. Pleistocene Glaciations in Estonia. In: Ehlers, J., Gibbard, P.L. (eds.), Quaternary Glaciations-Extent and Chronology, Part I: Europe, 83–91. Elsevier, Amsterdam.
Raukas, A. & Stankowski, W. T. J. 2005. Influence of sedimentological composition on OSL dating of glaciofluvial deposits: examples from Estonia. Geological Quaterly 49, 463–470.
Raukas, A., Wojciech, T. J., Stankowski, V. Z. & Šinkunas, P. 2010. Chronology of the Last Deglaciation in the South-Eastern Baltic. Region on the Basis of Recent OSL Dates. Geochronometria 36, 1–8.
Reimer, P. J., Baillie, M. G. L., Bard, E., Bayliss, A., Beck, J. W., Blackwell, P. G., Bronk Ramsey, C., Buck, C. E., Burr, G. S., Edwards, R. L., Friedrich, M., Grootes, P. M., Guilderson, T. P., Hajdas, I., Heaton, T. J., Hogg, A. G., Hughen, K. A.,

47
Kaiser, K. F., Kromer, B., McCormac, F. G., Manning, S. W., Reimer, R. W., Richards, D. A., Southon, J. R., Talamo, S., Turney, C. S. M., van der Plicht, J. & Weyhenmeyer, C. E. 2009. IntCal09 and Marine09 radiocarbon age calibration curves, 0–50,000 years cal BP. Radiocarbon 51(4), 1111–1150.
Ringberg, B. & Erlström, M. 1999: Micromorphology and petrography of Late Weichselian glaciolacustrine varves in southeastern Sweden. Catena 35, 147–177.
Rinterknecht, V. R., Clark, P. U., Raisbeck, G. M., Yiou, F., Bitinas, A., Brook, E: J: Marks, L., Zelcs, V., Lunkka, J., Pavlovskaya, I. E., Piotrowski, J. A. & Raukas, A. 2006. The Last Deglaciation of the southeastern sector of the Scandinavian Ice Sheet. Science 311, 1449–1452.
Rinterknecht, V. R., Pavlovskaya, I. E., Clark, P. U., Raisbeck, G., Yiou, F. & Brook, E. J. 2007. Timing of the last deglaciation in Belarus. Boreas 36, 307–313.
Rinterknecht, V. R., Bitinas, A., Clark, P. U., Raisbeck, G. M., Yiou, F. & Brook, E. J. 2008. Timing of the last deglaciation in Lithuania. Boreas 37, 426–433.
Saarnisto, M. & Saarinen, T. 2001. Deglaciation chronology of the Scandinavian Ice Sheet from the Lake Onega basin to the Salpausselkä End Moraines. Global and Planetary Change 31, 387–405.
Saarse, L. 1979. Rasprostranenye i uslovya zaleganya ozorno-lednikovykh glinistykh otlozhenij yuzhnoi Estonij [On the distribution and bedding conditions of glaciolacustrine clayey sediments in southern Estonia], Proceedings of the Estonian Academy of Sciences, Geology 28 (4), 145–151 [in Russian with English summary].
Saarse, L. & Liiva, A. 1995. Geology of Äntu group of lakes. Proceedings of the Estonian Academy of Sciences, Geology 44, 119–132.
Saarse, L., Niinemets, E., Amon, L., Heinsalu, A., Veski, S. & Sohar, K. 2009. Development of the late glacial Baltic basin and the succession of vegetation cover as revealed at Paleolake Haljala, northern Estonia. Estonian Journal of Earth Sciences 58, 317–333.
Saarse L., Heinsalu A. and Veski S. 2012. Deglaciation chronology of the Pandivere and Palivere ice-mar ginal zones in Estonia. Geological Quarterly 56 (2), 353–362.
Saks, T. 2010: Middle and Late Weichselian paraglacial and subglacial environments in the coastal plains of Western Latvia. Ph.D. thesis, University of Latvia, 79 pp.
Salonen, V.-P., Kaakinen, A., Kultti, S., Miettinen, A., Eskola, K. O. & Lunkka, J. P. 2008. Middle Weichselian glacial event in the central part of the Scandinavian Ice Sheet recorded in the Hitura pit, Ostrobothnia, Finland. Boreas 37, 38–54.
Sandgren, P., Hang, T. & Snowball, I. 1997. A Late Weichsealian geomagnetic record from Lake Tamula, SE Estonia. GFF 119, 279–284.
Satkūnas, J., Grigiene, A., Jusiene, A., Damusyte, A. & Mazeika, J. 2009. Middle Weichselian palaeolacustrine basin in the Venta river valley and vicinity (northwest Lithuania), exemplified by the Purviai outcrop. Quaternary International 207, 14–25.
Satkūnas, J., Grigiene, A., Buynevich, I.V., & Taminskas, J. 2013. A new Early–Middle Weichselian palaeoenvironmental record from a lacustrine sequence at Svirkanciai, Lithuania. Boreas 42, 184–193.
Serebryanny, L. R. 1978. The dynamics of ice sheet and glacio-eustasy in the Late Quaternary. Nauka, Moscow, 269 pp. [in Russian].
Shepherd, A., Erik R. Ivins, E.R., A, G., Barletta, V.R., Bentley, M.J., Bettadpur, S., Briggs, H., Bromwich, D.H., Forsberg, R., Galin, N., Horwath, M., Jacobs, S., Joughin, I., King, M.A., Lenaerts, J.T.M., Li, J., Ligtenberg, S.R.M., Luckman, A., Luthcke, S.B., McMillan, M., Meister, R., Milne, G., Mouginot, J., Muir, A.,
48
Nicolas, J.P., Paden, J., Payne, A.J., Pritchard, H., Rignot, E., Rott, H., Sørensen, L.S., Scambos, T.A., Scheuchl, B., Schrama, E.J.O., Smith, B., Sundal, A.V., van Angelen, J.H., van de Berg, W.J., van den Broeke, M.R., Vaughan, D.G., Velicogna, I., Wahr, J., Whitehouse, P.L., Wingham, D.J., Yi, D., Young, D., Zwally, H.J., 2012. A Reconciled Estimate of Ice-Sheet Mass Balance. Science 338, 1183–1189.
Sohar, K. & Kalm, V. 2008. A 12.8-ka-long palaeoenvironmental record revealed by subfossil ostracod data from lacustrine freshwater tufa in Lake Sinijärv, northern Estonia. Journal of Paleolimnology 40 (3), 809–821.
Svendsen, J.I., Alexanderson, H., Astakhov, V.I., Demidov, I., Downdeswell, J.A., Funder, S., Gataulin, V., Henriksen, M., Hjort, C., Houmark-Nielsen, M., Hub-berten, H.W., Ingόlfsson, Ó., Jakobsson, M., Kjær, K.H., Larsen, E., Lokrantz, H., Lunkka, J.P., Lyså, A., Mangerud, J., Matiouchkov, A., Murray, A., Möller, P., Niessen, F., Nikolskaya, O., Polyak, L., Saarnisto, M., Siegert, C., Siegert, M.J., Spielhagen, R.F. & Stein, R. 2004. Late Quaternary ice sheet history of northern Eurasia. Quaternary Science Reviews 23, 1229–1271.
Tarasov, L. & Peltier, W. 2005. Arctic freshwater forcing of the Younger Dryas cold reversal. Nature 435, 662–665.
Ukkonen, P., Lunkka, J. P., Jungner, H. & Donner, J. 1999. New radiocarbon dates from Finnish mammoths indicating large ice-free areas in Fennoscandia during the Middle Weichselian. Journal of Quaternary Science 14, 711–714.
Ukkonen, P., Arppe, L., Houmark-Nielsen, M., Kjær, K. H. & Karhu, J. A. 2007. MIS 3 mammoth remains from Sweden – implications for faunal history, palaeoclimate and glaciation chronology. Quaternary Science Reviews 26, 3081–3098.
Velichko, A. A., Faustova, M. A., Gribchenko, Y. N., Pisareva, V. V. & Sudakova, N. G. 2004. Glaciations of the East European Plain - distribution and chronology. In: Ehlers, J. & Gibbard, P. L., (eds), Quaternary Glaciations – Extent and Chrono-logy, Part I: Europe, 337–354. Elsevier, Amsterdam.
Velichko, A. A., Faustova, M. A., Pisarea, V. V., Gribchenko, Yu. N. Sudakova, N. G. & Lavrentiev, N. V. 2011. Glaciations of the East European Plain: Distribution and Chronology. In: Ehlers, J., Gibbard, P. L. & Hughes, P. D., (eds): Developments in Quaternary Science 15, 337–359. Elsevier, Amsterdam.
Vigdorchik, M., Zarrina, E., Krasnov, I. & Auslender, V. 1974. Late Pleistocene. In: Zubakov, V. A., (ed.): Geochronology of the USSR 33, The Latest Phase, 55–75. Nedra, Leningrad. [in Russian].
Wysota, W., Molewski, P. & Sokołowski, R.J. 2009. Record of Vistula ice lobe advances in the Late Weichselian glacial sequence in north-central Poland. Quarter-nary International 207 (1–2), 26–41.
Yokoyama, Y.; Lambeck, K.; de Dekhar, P.; Johnston, P. & Fifield, L. 2000. Timing of last glacial maximum from observed sea level minima. Nature 406, 713–716.
Zarrina, E. P. 1991. Chetvertichnyie otlozsheniya severo-zapadnyih i centralnyih rayo-nov Evropeyskyj chasti SSSR (Quaternary deposits of the northwest and central regions of the European part of the USSR). Nedra, USSR Ministry of Geology, Leningrad, 127 pp. [in Russian]
Zelčs, V. & Markots, A. 2004. Deglaciation History of Latvia. In: Ehlers, J. & Gibbard, P.L. (eds.), Quaternary Glaciations - Extent and Chronology, Part I: Europe. 225–243. Elsevier, Amsterdam.
Zelčs, V., Markots, A., Nartisš, M. & Saks, T. 2011. Pleistocene Glaciations in Latvia. In: Ehlers, J., Gibbard, P. L. & Hughes, P. D. (eds.): Developments in Quaternary Science 15, 221–229. Elsevier, Amsterdam.

49
Zernitskaya, V., Maknach, N. & Kolkovskij, V. 2007. Stratigraphy of Late Glacial and Holocene deposits in Belarussian Poozerie. In: Guobytė, R. & Stančikaitė, M. (eds.): The Quaternary of Western Lithuania: from the Pleistocene glaciations to the evolution of the Baltic Sea. The INQUA Peribaltic Group Field symposium, May 27 – June 2, Lithuanian Geological Survey, Vilnius, 106–107.
Zimenkov, O, I. 1989. Vremya kulminacii poozerskogo oledeneniya na territorii Belo-russii (The timing of Poozerian Glaciation maximum in the territory of Belarus). In: (Matveev A.V., (ed.), Novoe v izuchenii kaynozoyskikh otlozheniy Belorussii i smezhnykh oblastei (New in the study of Cenozoic sediments of Belarus and adjacent regions), 30–45. Nauka i tekhnika (Science and Technology), Minsk. [in Russian].
Zimenkov, O. I., Valchik, M. A. & Kolkovski, V. M. 1985: Absolyutniy vozrast allyuviya rechnych terras i poiymy Belorusskogo Ponyemanya (Absolute age of the alluvial river terraces and floodplains of the Belarusian Ponemanya). In: Kovalev, V. A., Dromashko, S. G. & Shimanovich, S. L. (eds.) Mineralogiya i geokhimiya kaynozoyskikh otlozheniy Belorussii (Mineralogy and Geochemistry of Cenozoic in Belarus), 129–137. Nauka i tekhnika, Minsk. [in Russian].
Zubakov, V.A. 1974. Pozdniy pliocen – chetvertichnyiy period (Late Pliocene – Quaternary). In: Zubakov, V. A. (ed.): Geokhronologiya SSSR III, Noveiyshiy etаp (Geochronology of the USSR III, The latest phase), 44–84. Nedra, Leningrad. [in Russian].
Zuzevičius, A. 2010. The groundwater dynamics in the southern part of the Baltic Artesian Basin during the Late Pleistocene. Baltica 23, 1–12.

50
SUMMARY IN ESTONIAN
Weichseli jäätumise kronoloogia Skandinaavia jäätumise kagusektoris
Käesolev doktoritöö uurib Weichseli jäätumise ajalist kulgu, liustiku maksi-maalse leviku ulatust ja liustiku pealetungi ja taandumise dünaamikat jäätu-misele allunud Ida-Euroopa tasandiku lääneosas. Uuringuala hõlmab Skandi-naavia jäätumise kagusektorit Läänemerest kuni viimase jäätumise maksimaalse leviku piirini. See ala on Weichseli jäätumise jooksul mitmeid kordi allunud liustike tegevusele. Jäätumiste ja eelkõige jää taandumisega kaasnevad kliima- ja keskkonnamuutused on olnud määravaks jäätumisalade geoloogia, pinnamoe, hüdrograafia, mullastiku ja seotud taimkatte aga ka inimasustuse kujunemisel. Veelgi enam, soojeneva kliima tingimustes toimunud liustike sulamisega kaas-nenud sulaveehulgad mõjutasid märkimisväärselt ookeani veetaset ja soojus-režiimi. Paraku on andmed selle mõju ulatuse kohta puudulikud, mis omakorda takistab võimalike kliima ja veetaseme muutuste prognoose tänapäeval, mil eeldatav soojenemine võib kaasa tuua kaasaegsete jääkilpide sulamise ja ookeanitaseme tõusu. Seega on väga oluline varasemate liustike ajalis-ruumilise dünaamika selgitamine, mis võimaldaks paremini mõista ka eesootavat tule-vikku. Varasemate liustike dünaamika selgub aga eelkõige läbi pinnavormide ja setete kronoloogiliste uuringute, millega tegeleb ka käesolev doktoritöö.
Vaatamata pikaajalistele ja mitmekülgsetele uuringutele, on teadmised Weichseli jäätumise ajalis-ruumilise kulgemise kohta Ida-Euroopa tasandikul väga lünklikud ja olemasolevad andmed jäätumisala lõikes väga ebaühtlased.
Eriti puudulik info on varasemate Vara- ja Kesk-Weichseli jäätumise kohta, kuna sellele järgnenud Hilis-Weichseli liustik on varasemaid setteid ja pinna-vorme oluliselt ümber kujundanud või hoopis erodeerinud. Seetõttu on varase-mate jäätumiste setteid leitud vaid üksikutest kohtadest Põhja-, Kesk- ja Ida-Euroopast. Viimase, Hilis-Weichseli jäätumise kohta on andmeid rohkem, kuid siiani on ebaselge liustiku saabumise aeg uuringualale ja laienemine maksi-maalse leviku piirile. Aga ka viimase liustiku taandumise käik on põnevate diskussioonide teemaks. Mitmed autorid (Kalm 2006, 2012a; Rinterknecht jt. 2006, 2007, 2008; Raukas 2009; Satkūnas jt. 2009; Guobytė & Satkūnas 2011; Zelčs jt. 2011; Bitinas 2012) on pakkunud erinevaid mudeleid liustiku serva taandumise ajalist ebaühtlust väljendavate servamoodustiste vööndite paikne-mise, korrelatsiooni ja vanuse osas. Seetõttu on käesoleva töö peamisi eesmärke koondada ja kriitiliselt analüüsida Weichseli jäätumise liustike ajalis- ruumilist dünaamikat iseloomustavat kronoloogilist andmestikku Ida-Euroopa tasandiku lääneosas. Spetsiifilised eesmärgid olid: esiteks, hinnata viimasele jäätumisele eelnenud jäävaba perioodi kestvust uuringualal; teiseks, hinnata viimase Weich-seli liustiku pealetungi ajalist kestvust; kolmandaks, luua viimase jäätumise taandumise kronoloogia arvestades sealhulgas olemasoleva kronoloogilise andmestiku geograafilise paiknemise ja liustikukeelte dünaamikaga; neljandaks,
51
hinnata liustiku pealetungi ja taandumise kiirust, mis on aluseks liustiku aluste protsesside mõistmisel ja suurte jääkilpide mudelite loomisel.
Eesmärkide saavutamiseks koondati kättesaadav kronoloogiline andmestik ning korrastati see andmekoguna kuhu lisandusid käesoleva uurimuse jooksul saadud uued radisosüsiniku (14C), optiliselt stimuleeritud luminestsentsi (OSL), termoluminestsentsi (TL) ja kosmogeense berülliumi (10Be) dateeringud. Andmekogu täiendati regulaarselt uueneva kronoloogilise andmestikuga.
Kronoloogilisest andmestikust tehti valik deteeringutest, mis on sobilikud ja asjassepuutuvad liustiku pealetungi ning taandumise hindamisel. Valik piirneb dateeringutega ajavahemikus 35 ja 11,7 tuhat aastat tagasi (a.t.). 35 tuhat a.t. tähistab siinkohal viimast soojenemisperioodi, merelise isotoopstaadiumi 3.1. (Lambeck jt. 2010) algust, millele järgnes viimase Skandinaavia liustiku laienemine uuringualale u 26 tuhat a.t. ja selle lõplik taandumine 11,7 tuhat a.t. Valikust jäeti välja näiteks radiosüsiniku dateeringud, mille vanus võib olla ülehinnatud stabiilse süsinikuga rikastumise tõttu (järvelubi, karbonaatsed setted). Kokku kasutati 311 radiosüsiniku, 87 optiliselt stimuleeritud lumi-nestsents ja 72 kosmogeense berülliumi dateeringut. Valikusse alles jäänud dateeringud kanti koordinaatide järgi kaardile ja vastavalt liustikukeelte dünaa-mikale jaotati uuringuala kaheks; läänepoolne Balti jääkeelte ala ja idapoolne Karjala jääkeelte ala. Seejärel kanti kõik dateeringud proportsionaalselt üle-üldisele jäätumistsentrisse orienteeritud liustiku laienemise ja taandumise asimuudile, arvestades nende asendit servamoodustiste suhtes ning koostati selle põhjal aeg-distants mudelid, mis olid aluseks järgnevale liustike dünaa-mika analüüsile.
Kronoloogiliste ja sedimentoloogiliste tulemuste põhjal selgus, et Skandi-naavia liustik jõudis Valdai kõrgustikule (Kilešino uuringula) viimase Weich-seli jäätumise maksimaalse levikupiiri lähedale ainult ühel korral viimase 72,2 tuhande aasta jooksul. See toimus Hilis-Weichselis, hiljem kui 33,8 tuhat a.t. aga suurema tõenäosusega ajavahemikul 19,1 kalendriaastat ja 18 tuhat a.t. Ajavahemikus 72,2 tuhat ja 33,8 tuhat a.t. oli Valdai kõrgustik jäävaba.
Viimane Skandinaavia liustik liikus uuringuala lääneosasse, seal oma maksimumlevikupiirini ja ka taandus varem kui idaosas. Lääneosas jõudis Skandinaavia liustik Läti läänerannikule mitte varem kui 26 tuhat (a.t.), laienes Kesk-Leedu aladele umbes 25,6 tuhat a.t. ja Leedu lõunaosasse mitte varem kui 24,7 tuhat a.t. Uuringuala idaosas jõudis Skandinaavia liustik Soome lahe lõunarannikule mitte varem kui 21 tuhat a.t. ja Läti keskaladele mitte varem kui 19,6 tuhat a.t. Oma maksimumleviku saavutas Skandinaavia liustik uuringuala läänesoas, Loode-Valgevenes, hiljem kui 22,6 tuhat a.t. ja Kirde-Valgevenes, mitte varem kui 19,1 tuhat a.t. Liustikuserva maksimaalsel levikupiiril püsimise kestvuse hindamiseks kasutati üksikdateeringute mediaanväärtuste asemel ajavahemikke ning liustiku taandumisejärgse orgaanilise taimestiku kujunemise kõige varasemaid dateeringuid. Sellele toetuvalt võib arvata, et Skandinaavia liustik oli maksimumlevikupiiril ajavahemikus 24,4 ja 19,6 tuhat a.t. uuringuala lääneosas ja ajavahemikus 19,4 ja 17,8 tuhat a.t. uuringuala idaosas. Krono-

52
loogilise andmestiku geograafilise paiknemise analüüsile toetuva liustiku peale-tungi kiiruse arvutused näitavad, et uuringuala lääneosas oli see u 110 m/a ja idaosas 330 m/a. Toetudes varasematele uuringutele võib arvata, et selline väga kiire liustiku liikumine on võimalik saavutada vaid siis, kui liustiku basaalne kiht on sulas olekus, ja seetõttu järeldame, et jää aluspind uuringualal ei olnud külmunud kogu Weichseli jäätumise kestel.
Viimase Skandinaavia liustiku taandumine algas uuringuala lääneosas mitte varem kui 22,6 tuhat a.t. ning liustiku maksimumlevikupiiri ja Läti lääneranniku vaheline ala sai lõplikult jäävabaks 14,2 tuhat a.t. Uuringuala idaosas algas Skandinaavia liustiku taandumine hiljem ja mitte varem kui 19,1 tuhat a.t. tagasi ning kogu ala liustiku maksimumlevikupiiri ja Soome lahe vahel sai jäävabaks 13.3 tuhat a.t. Liustiku taganemiskiirus lääneosas (50 m/a) on sarnaselt pealetungi kiirusele ligikaudu 3 korda aeglasem kui idaosas (170 m/a).

PUBLICATIONS

CURRICULUM VITAE Name: Katrin Lasberg Date of birth: 13.03.1984 Address: Department of Geology, University of Tartu, Ravila 14a,
50411 Tartu, Estonia Contact: Phone: +372 737 6684 Fax: +372 737 5836 E-mail: [email protected], [email protected] Education: 2007–2013 University of Tartu, Department of Geology,
PhD student in Geology 2005–2007 University of Tartu, Department of Geology,
MSc student in Geology 2002–2005 University of Tartu, BSc student
in Environmental technology Professional employment: 2014–… University of Tartu, Department of Geology, specialist 2012–2013 University of Tartu, Department of Geology, main specialist 2008–2012 University of Tartu, Department of Geology,
laboratory assistant 2006–2007 Kobras AS, assistant Research activity: Field of research: Quaternary sediments and glaciations, dating methods, chronology Grants and scholarships: 2013 COST ’Pay-as-you-go System’ 2011 SA Archimedes (Kristjan Jaagu programme) 2010 Doctoral school of Earth Sciences and Ecology Professional development: 2013 training course – Benzene line and procedures of benzene synthesis,
held by Institute of Environmental Geochemistry of the National Aca-demy of Sciences of Ukraine and Conventional Radiocarbon Dating Laboratory, in Kyiv. Ukraine
2013 educational programme “LIDAR-based palaeogeographic reconstruc-tions of the Baltic Sea”, held by the Institute of Ecology and Earth Sciences of the University of Tartu and the Doctoral school of Earth Sciences and Ecology, Estonia
95

96
2012 participation in Summer Training School on Dating Methods and their applications, held by GFZ and GADAM Centre, in Potsdam and Gliwice, Germany and Poland
2011 training course ‘LSC Basic’, held by PerkinElmer, in Bad Orb, Germany
2011 participation in ‘Youth in Action’ Programme – Geoparc: Geoscience – Geoturism – Conservation, held by „Nationaler Geopark Eiszeitland am Oderrand”, in Germany
2011 educational programme „Modelling of Palaeoshorelines of Baltic Sea”, held by the Institute of Ecology and Earth Sciences of the University of Tartu, in Estonia
2010 participation in Geochronology Summer School – Dating Anthropo-genic and Natural Changes in a Fragile Alpine Environment, held by University of Zurich, in Switzerland
Publications: Lasberg, K., Kalm, V., Kihno, K., 2014. Ice-free intervals corresponding to
Marine Isotope Stages 4 and 3 at the Last Glacial Maximum position at Kile-shino, Valdaj Upland, Russia. Estonian Journal of Earth Sciences (accepted for publication).
Laumets, L., Kalm, V., Poska, A., Kele, S., Lasberg, K., Amon, L., 2014. Palaeoclimate inferred from δ18O and palaeobotanical indicators in fresh-water tufa of Lake Äntu Sinijärv, Estonia. Journal of Paleolimnology, 51(1), 99–111.
Lasberg, K., Kalm, V., 2013. Chronology of Late Weichselian glaciation in the western part of the East European Plain. Boreas, 42(4), 995–1007.
Lasberg, K. 2013. Viimase Skandinaavia liustiku pealetungi ja taandumise aja hindamisel kasutatavad dateerimismeetodid. Verš, E., Nemliher, R., Amon-Veskimeister, L., Truuver, K., Ehrlich, K. (Eds.). Aeg (111–114). Tartu: Eesti Looduseuurijate Selts
Kalm, V., Raukas, A., Rattas, M., Lasberg, K., 2011. Chapter 8 – Pleistocene Glaciations in Estonia. Ehlers, J., Gibbard, P.L., Hughes, P.D. (Eds.). Qua-ternary Glaciations – Extent and Chronology – A Closer Look (95–104). Amsterdam, The Netherlands: Elsevier.
Kalm, V.; Gorlach, A.; Lasberg, K.; Kalla, K., 2011. Viimase Skandinaavia jäätumise dünaamika Läänemerest kagus. Erast Parmasto, Agu Laisk, Di-mitri Kaljo (responsible eds.), Helle-Liis Help, Siiri Jakobson, Ülle Rebo, Galina Varlamova (Eds.). Teadusmõte Eestis. Elu- ja maateadused. (161– 167). Tallinn: Eesti Teaduste Akadeemia.

ELULOOKIRJELDUS
Nimi: Katrin Lasberg Sünniaeg: 13.03.1984 Aadress: Geoloogia osakond, Tartu Ülikool, Ravila 14a, 50411 Tartu, Eesti Kontakt: Tel: +372 737 6684 Faks: +372 737 5836 E-post: [email protected], [email protected] Haridus: 2007–2013 Tartu Ülikool, Geoloogia osakond, geoloogia doktorant 2005–2007 Tartu Ülikool, Geoloogia osakond, MSc geoloogias 2002–2005 Tartu Ülikool, BSc keskkonnatehnoloogias Teenistuskäik: 2014–… Tartu Ülikool, Geoloogia osakond, spetsialist 2012–2013 Tartu Ülikool, Geoloogia osakond, peaspetsialist 2008–2012 Tartu Ülikool, Geoloogia osakond, laborant 2006–2007 Kobras AS, assistent Teadustegevus: Teadustöö põhisuunad: Kvaternaari setted ja jäätumised, dateerimismeetodid, kronoloogia Saadud uurimistoetused ja stipendiumid: 2013 COST ‘Pay-as-you-go system’ 2011 SA Archimedes (Kristjan Jaagu programm) 2010 Maateaduste ja ökoloogia doktorikool Erialane enesetäiendus: 2013 koolitus – „Benzene line and procedures of benzene synthesis”, organi-
seeritud Ukraina Teaduste Akadeemia, Keskkonna Geokeemia Instituudi ja konventsionaalse radiosüsiniku dateerimislabori poolt Kiievis, Ukrainas
2013 kursus „LIDAR-based palaeogeographic reconstructions of the Baltic Sea”, korraldatud Ökoloogia ja Maateaduste doktorikooli ning TÜ Öko-loogia ja Maateaduste Insituudi poolt, Eestis
2012 osalemine „Dating Methods and their applications” suveülikoolis, orga-niseeritud GFZ & GADAM keskuse poolt Potsdamis ning Gliwice-s, Saksamaal ja Poolas
2011 koolitus „LSC Basics”, organiseeritud PerkinElmeri poolt Bad Orbis, Saksamaal
97

2011 osalemine ‘Youth in Action’ programmis – Geoparc: Geoscience – Geoturism – Conservation, organiseeritud “Nationaler Geopark Eiszeit-land am Oderrand” poolt, Saksamaal
2011 kursus „Modelling of Palaeoshorelines of Baltic Sea”, organiseeritud Tartu Ülikooli, Ökoloogia ja Maateaduste Instituudi poolt, Eestis
2010 osalemine geokronoloogia suveülikoolis “Dating Anthropogenic and Natural Changes in a Fragile Alpine Environment”, organiseeritud Zü-richi Ülikooli poolt, Šveitsis
Publikatsioonid: Lasberg, K., Kalm, V., Kihno, K., 2014. Ice-free intervals corresponding to
Marine Isotope Stages 4 and 3 at the Last Glacial Maximum position at Kile-shino, Valdaj Upland, Russia. Estonian Journal of Earth Sciences (aktsep-teeritud).
Laumets, L., Kalm, V., Poska, A., Kele, S., Lasberg, K., Amon, L., 2014. Palaeoclimate inferred from δ18O and palaeobotanical indicators in fresh-water tufa of Lake Äntu Sinijärv, Estonia. Journal of Paleolimnology, 51(1), 99–111.
Lasberg, K., Kalm, V., 2013. Chronology of Late Weichselian glaciation in the western part of the East European Plain. Boreas, 42(4), 995–1007.
Lasberg, K. 2013. Viimase Skandinaavia liustiku pealetungi ja taandumise aja hindamisel kasutatavad dateerimismeetodid. Verš, E., Nemliher, R., Amon-Veskimeister, L., Truuver, K., Ehrlich, K. (Toim.). Aeg (111–114). Tartu: Eesti Looduseuurijate Selts
Kalm, V., Raukas, A., Rattas, M., Lasberg, K., 2011. Chapter 8 – Pleistocene Glaciations in Estonia. Ehlers, J., Gibbard, P.L., Hughes, P.D. (Eds.). Quaternary Glaciations – Extent and Chronology – A Closer Look (95– 104). Amsterdam, The Netherlands: Elsevier.
Kalm, V.; Gorlach, A.; Lasberg, K.; Kalla, K., 2011. Viimase Skandinaavia jäätumise dünaamika Läänemerest kagus. Erast Parmasto, Agu Laisk, Di-mitri Kaljo (vastutavad toim.) Helle-Liis Help, Siiri Jakobson, Ülle Rebo, Galina Varlamova (Toim.). Teadusmõte Eestis. Elu- ja maateadused. (161– 167). Tallinn: Eesti Teaduste Akadeemia.
98

DISSERTATIONES GEOLOGICAE UNIVERSITATIS TARTUENSIS
1. Пээп Мянник. Конодонты в верхнеордовикских и нижнесилурийских
отложениях Эстонии. Тарту, 1992, 355 с. 2. Elvi Tavast. Fennoskandia kilbi lõunanõlva ja sellega piirnevate alade
aluspõhja reljeef. Tartu, 1992, 357 lk. 3. Kaarel Orviku. Characterisation and evolution of Estonian seashores.
Tartu, 1992, 19 p. 4. Анатолий Молодьков. ЭПР-анализ скелетного вещества моллюсков в
хроностратиграфических исследованиях позднего кайнозоя. Тарту, 1992, 33 с.
5. Jaan Lutt. Late- and postglacial deposits on the Estonian shelf. Tartu, 1993, 31 p.
6. Reet Karukäpp. Gotiglatsiaalne morfogenees Skandinaavia mandriliustiku kagusektoris. Tartu, 1997, 181 p.
7. Argo Jõeleht. Geothermal studies of the Precambrian basement and Phane-rozoic sedimentary cover in Estonia and Finland. Tartu, 1998, 125 p.
8. Jüri Nemliher. Mineralogy of Phanerozoic skeletal and sedimentary apati-tes: an XRD study. Tartu, 1999, 134 p.
9. Kalle Kirsimäe. Clay mineral diagenesis on the Lower Cambrian “Blue Clay” in the northern part of the Baltic Paleobasin. Tartu, 1999, 113 p.
10. Jüri Plado. Gravity and magnetic signatures of meteorite impact structures. Tartu, 2000, 87 p.
11. Olev Vinn. Morphogenesis and phylogenetic relationships of Clitamboni-tidines, Ordovician Brachiopods. Tartu, 2001, 127 p.
12. Leho Ainsaar. The middle Caradoc facies and faunal turnover in the late Ordovician Baltoscandian palaeobasin: sedimentological and carbon isotope aspects. Tartu, 2001, 109 p.
13. Oive Tinn. Early Ostracode evolution and Palaeoenvironmental application in the Ordovician of Baltoscandia. Tartu, 2002, 145 p.
14. Maris Rattas. Subglacial environments in the formation of drumlins — The case of the Saadjärve Drumlin Field, Estonia. Tartu, 2004, 117 p.
15. Ene Kadastik. Upper-Pleistocene stratigraphy and deglaciation history in northwestern Estonia. Tartu, 2004, 129 p.
16. Helje Pärnaste. Early Ordovician trilobites of suborder Cheirurina in Estonia and NW Russia: systematics, evolution and distribution. Tartu, 2004, 138 p.
17. Mari-Ann Mõtus. Silurian (Llandovery-Wenlock) tabulate corals of Balto-scandia: taxonomy, palaeoecology, distribution. Tartu, 2005, 167 p.
18. Alar Rosentau. Development of proglacial lakes in Estonia. Tartu, 2006, 114 p.
99

19. Evelin Verš. Development of impact-induced hydrothermal system at Kärdla impact structure. Tartu, 2006, 96 p.
20. Sigitas Radzevičius. The genus Pristiograptus in wenlock of East Baltic and the Holy Cross Mountains. Tartu, 2007, 133 p.
21. Andres Marandi. Natural chemical composition of groundwater as a basis for groundwater management in the Cambrian-Vendian aquifer system in Estonia. Tartu, 2007, 116 p.
22. Eve Niinemets. Vegetation and land-use history of the Haanja Heights (SE-Estonia) during the holocene. Tartu, 2008, 146 p.
23. Kalle-Mart Suuroja. Geology and lithology of the early palaeozoic marine impact stuctures Kärdla and Neugrund (Estonia). Tartu, 2008, 234 p.
24. Rutt Hints. Early diagenesis of Ordovician and Silurian Bentonites in the Northern Baltic Palaeobasin. Tartu, 2009, 90 p.
25. Peeter Somelar. Illitization of K-bentonites in the Baltic Basin. Tartu, 2009, 118 p.
26. Ulla Preeden. Remagnetizations in sedimentary rocks of Estonia and shear and fault zone rocks of southern Finland. Tartu, 2009, 121 p.
27. Kati Tänavsuu-Milkeviciene. Transgressive to regressive turnaround in the Middle Devonian Baltic Basin. Tartu, 2009, 106 p.
28. Valle Raidla. Chemical and isotope evolution of groundwater in the Cambrian-Vendian aquifer system in Estonia. Tartu, 2010, 134 p.
29. Kadri Sohar. Quaternary ostracods from Estonia and their application in palaeoenvironmental reconstruction. Tartu, 2010, 140 p.
30. Kristjan Urtson. Stepwise melt transport and accumulation: analogue and numerical modelling approach. Tartu, 2011, 83 p.
31. Marko Kohv. Landslides in clayey soils of western Estonia. Tartu, 2011, 116 p.
32. Nele Muttik. Post-impact alteration of impactites: Ries crater, Germany. Tartu, 2011, 78 p.
33. Annette Sedman. Strength and self-cementing properties of oil shale retorting wastes. Tartu, 2013, 82 p.
34. Arkady Tsyrulnikov. Complex seismo-acoustic and lithological study of the Lateglacial and postglacial sediments northern Gulf of Riga, eastern branch of the central Baltic Sea. Tartu, 2013, 102 p.
35. Marge Uppin. Geological sources and hydrochemistry of fluoride and boron in Silurian-Ordovician aquifer system. Tartu, 2013, 86 p.
36. Peeter Talviste. Temporal changes in weak natural and artificial soils – influence on geotechnical characteristics. Tartu, 2014, 204 p.
Copyright © 2022 FDOKUMEN