Climatic reconstruction of the Weichselian Pleniglacial in northwestern and Central Europe
27
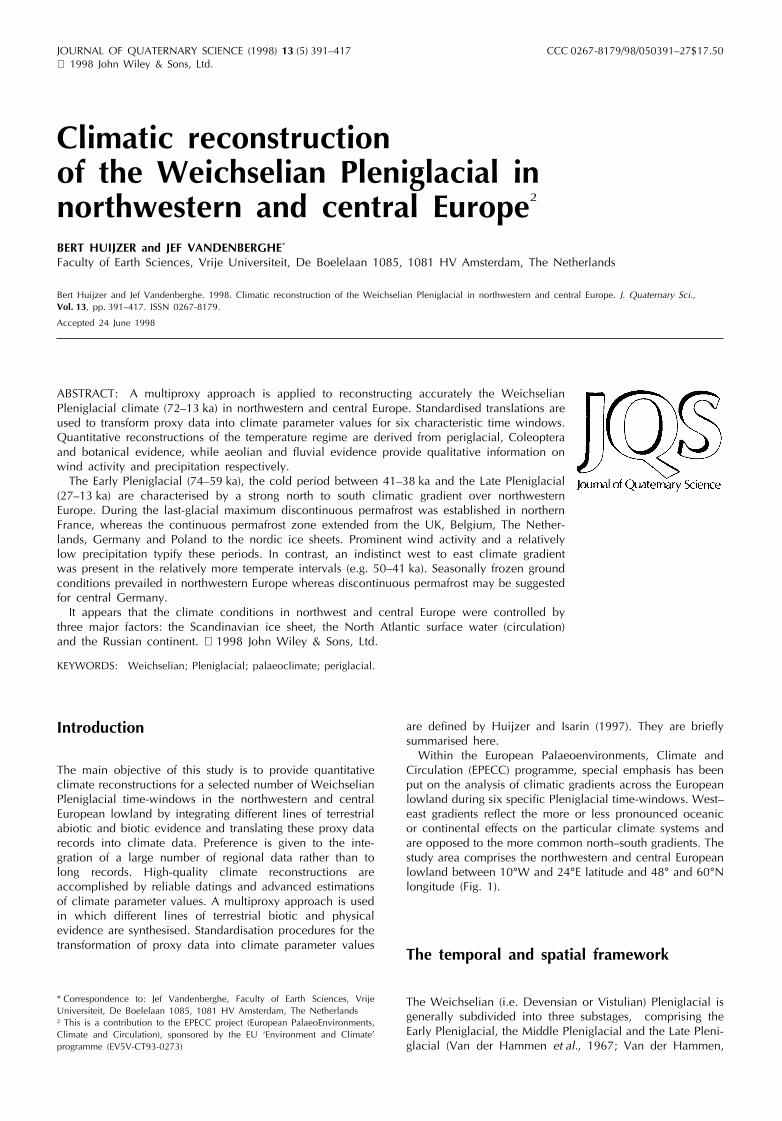
JOURNAL OF QUATERNARY SCIENCE (1998) 13 (5) 391–417 CCC 0267-8179/98/050391–27$17.50 1998 John Wiley & Sons, Ltd. Climatic reconstruction of the Weichselian Pleniglacial in northwestern and central Europe ² BERT HUIJZER and JEF VANDENBERGHE * Faculty of Earth Sciences, Vrije Universiteit, De Boelelaan 1085, 1081 HV Amsterdam, The Netherlands Bert Huijzer and Jef Vandenberghe. 1998. Climatic reconstruction of the Weichselian Pleniglacial in northwestern and central Europe. J. Quaternary Sci., Vol. 13, pp. 391–417. ISSN 0267-8179. Accepted 24 June 1998 ABSTRACT: A multiproxy approach is applied to reconstructing accurately the Weichselian Pleniglacial climate (72–13 ka) in northwestern and central Europe. Standardised translations are used to transform proxy data into climate parameter values for six characteristic time windows. Quantitative reconstructions of the temperature regime are derived from periglacial, Coleoptera and botanical evidence, while aeolian and fluvial evidence provide qualitative information on wind activity and precipitation respectively. The Early Pleniglacial (74–59 ka), the cold period between 41–38 ka and the Late Pleniglacial (27–13 ka) are characterised by a strong north to south climatic gradient over northwestern Europe. During the last-glacial maximum discontinuous permafrost was established in northern France, whereas the continuous permafrost zone extended from the UK, Belgium, The Nether- lands, Germany and Poland to the nordic ice sheets. Prominent wind activity and a relatively low precipitation typify these periods. In contrast, an indistinct west to east climate gradient was present in the relatively more temperate intervals (e.g. 50–41 ka). Seasonally frozen ground conditions prevailed in northwestern Europe whereas discontinuous permafrost may be suggested for central Germany. It appears that the climate conditions in northwest and central Europe were controlled by three major factors: the Scandinavian ice sheet, the North Atlantic surface water (circulation) and the Russian continent. 1998 John Wiley & Sons, Ltd. KEYWORDS: Weichselian; Pleniglacial; palaeoclimate; periglacial. Introduction The main objective of this study is to provide quantitative climate reconstructions for a selected number of Weichselian Pleniglacial time-windows in the northwestern and central European lowland by integrating different lines of terrestrial abiotic and biotic evidence and translating these proxy data records into climate data. Preference is given to the inte- gration of a large number of regional data rather than to long records. High-quality climate reconstructions are accomplished by reliable datings and advanced estimations of climate parameter values. A multiproxy approach is used in which different lines of terrestrial biotic and physical evidence are synthesised. Standardisation procedures for the transformation of proxy data into climate parameter values * Correspondence to: Jef Vandenberghe, Faculty of Earth Sciences, Vrije Universiteit, De Boelelaan 1085, 1081 HV Amsterdam, The Netherlands ² This is a contribution to the EPECC project (European PalaeoEnvironments, Climate and Circulation), sponsored by the EU ‘Environment and Climate’ programme (EV5V-CT93-0273) are defined by Huijzer and Isarin (1997). They are briefly summarised here. Within the European Palaeoenvironments, Climate and Circulation (EPECC) programme, special emphasis has been put on the analysis of climatic gradients across the European lowland during six specific Pleniglacial time-windows. West– east gradients reflect the more or less pronounced oceanic or continental effects on the particular climate systems and are opposed to the more common north–south gradients. The study area comprises the northwestern and central European lowland between 10°W and 24°E latitude and 48° and 60°N longitude (Fig. 1). The temporal and spatial framework The Weichselian (i.e. Devensian or Vistulian) Pleniglacial is generally subdivided into three substages, comprising the Early Pleniglacial, the Middle Pleniglacial and the Late Pleni- glacial (Van der Hammen et al., 1967; Van der Hammen,
-
Upload
independent -
Category
Documents
-
view
1 -
download
0
Transcript of Climatic reconstruction of the Weichselian Pleniglacial in northwestern and Central Europe
JOURNAL OF QUATERNARY SCIENCE (1998) 13 (5) 391–417 CCC 0267-8179/98/050391–27$17.50 1998 John Wiley & Sons, Ltd.
Climatic reconstructionof the Weichselian Pleniglacial innorthwestern and central Europe†
BERT HUIJZER and JEF VANDENBERGHE*
Faculty of Earth Sciences, Vrije Universiteit, De Boelelaan 1085, 1081 HV Amsterdam, The Netherlands
Bert Huijzer and Jef Vandenberghe. 1998. Climatic reconstruction of the Weichselian Pleniglacial in northwestern and central Europe. J. Quaternary Sci.,Vol. 13, pp. 391–417. ISSN 0267-8179.
Accepted 24 June 1998
ABSTRACT: A multiproxy approach is applied to reconstructing accurately the WeichselianPleniglacial climate (72–13 ka) in northwestern and central Europe. Standardised translations areused to transform proxy data into climate parameter values for six characteristic time windows.Quantitative reconstructions of the temperature regime are derived from periglacial, Coleopteraand botanical evidence, while aeolian and fluvial evidence provide qualitative information onwind activity and precipitation respectively.
The Early Pleniglacial (74–59 ka), the cold period between 41–38 ka and the Late Pleniglacial(27–13 ka) are characterised by a strong north to south climatic gradient over northwesternEurope. During the last-glacial maximum discontinuous permafrost was established in northernFrance, whereas the continuous permafrost zone extended from the UK, Belgium, The Nether-lands, Germany and Poland to the nordic ice sheets. Prominent wind activity and a relativelylow precipitation typify these periods. In contrast, an indistinct west to east climate gradientwas present in the relatively more temperate intervals (e.g. 50–41 ka). Seasonally frozen groundconditions prevailed in northwestern Europe whereas discontinuous permafrost may be suggestedfor central Germany.
It appears that the climate conditions in northwest and central Europe were controlled bythree major factors: the Scandinavian ice sheet, the North Atlantic surface water (circulation)and the Russian continent. 1998 John Wiley & Sons, Ltd.
KEYWORDS: Weichselian; Pleniglacial; palaeoclimate; periglacial.
Introduction
The main objective of this study is to provide quantitativeclimate reconstructions for a selected number of WeichselianPleniglacial time-windows in the northwestern and centralEuropean lowland by integrating different lines of terrestrialabiotic and biotic evidence and translating these proxy datarecords into climate data. Preference is given to the inte-gration of a large number of regional data rather than tolong records. High-quality climate reconstructions areaccomplished by reliable datings and advanced estimationsof climate parameter values. A multiproxy approach is usedin which different lines of terrestrial biotic and physicalevidence are synthesised. Standardisation procedures for thetransformation of proxy data into climate parameter values
* Correspondence to: Jef Vandenberghe, Faculty of Earth Sciences, VrijeUniversiteit, De Boelelaan 1085, 1081 HV Amsterdam, The Netherlands† This is a contribution to the EPECC project (European PalaeoEnvironments,Climate and Circulation), sponsored by the EU ‘Environment and Climate’programme (EV5V-CT93-0273)
are defined by Huijzer and Isarin (1997). They are brieflysummarised here.
Within the European Palaeoenvironments, Climate andCirculation (EPECC) programme, special emphasis has beenput on the analysis of climatic gradients across the Europeanlowland during six specific Pleniglacial time-windows. West–east gradients reflect the more or less pronounced oceanicor continental effects on the particular climate systems andare opposed to the more common north–south gradients. Thestudy area comprises the northwestern and central Europeanlowland between 10°W and 24°E latitude and 48° and 60°Nlongitude (Fig. 1).
The temporal and spatial framework
The Weichselian (i.e. Devensian or Vistulian) Pleniglacial isgenerally subdivided into three substages, comprising theEarly Pleniglacial, the Middle Pleniglacial and the Late Pleni-glacial (Van der Hammen et al., 1967; Van der Hammen,

392 JOURNAL OF QUATERNARY SCIENCE
Figure 1 Locations of Weichselian Pleniglacial (74–13 ka) sites in the study area of the northwestern and central European lowland (Albersequal-area projection). Proxy records related to the indicated sites are stored in the multiproxy database (January, 1996; for furtherexplanation see text).
1971) (Table 1). These Early, Middle and Late Pleniglacialsubstages match respectively with Oxygen Isotope Stages 4,3 and 2 of the marine d18O record (Woillard and Mook,1982; Vandenberghe, 1985). As absolute time-control ofterrestrial data of the Early Pleniglacial substage is not avail-able, the ages related to Oxygen Isotope Stage 4 are adoptedto provide an absolute time-scale: the lower age boundaryis estimated at ca. 74 ± 2.6 ka, and the top is estimated at59 ± 5.6 ka (Martinson et al., 1987). By contrast, the LatePleniglacial has its boundaries within the limits of radio-carbon dating: it starts at approximately 27 ka (cf.Vandenberghe, 1985) and terminates at the onset of theLate-glacial (ca. 13 ka; e.g. Lowe et al., 1994). All reported
Table 1 Time-windows selected for climate reconstruction and their correlation with the Weichselian chronostratigraphy, oxygen isotopestages and major events or characteristics. The Oxygen Isotope Stage 4 boundaries are based on the normalised SPECMAP time-scale(Martinson et al., 1987).
Time-window Chronostratigraphy Oxygen Isotope Stage Major event or characteristic(ka) Weichselian (boundaries in ka)
Late glacial 213
20–13 Termination of glaciationLate 2
ca. 27–20 Maximum ice advance of theLast Glacial
27
36–37 Interstadial complex(es)41–38 Pleniglacial 3 Cold intervalMiddle50–41 Interstadial complex(es)
59 ± 5.6
74–59 Early 4 Minor ice advance
74 ± 2.6Early Glacial 5a to 5d
1998 John Wiley & Sons, Ltd. J. Quaternary Sci., Vol. 13(5) 391–417 (1998)
ages from the Middle and Late Pleniglacial in this paper arein radiocarbon ages.
The climatic outline of the Weichselian Pleniglacial period(74–13 ka) in northwestern and central Europe shows a num-ber of distinct climatic events and characteristics. Theseinclude continuous permafrost conditions in the Early andLate Pleniglacial and less cold conditions during theintervening Middle Pleniglacial substage (Vandenberghe,1992; Vandenberghe and Pissart, 1993). A refinement of thisgeneral picture and the regional climatic differences withinthe study area are addressed in this study. Major climaticevents or characteristics are indicated in Table 1.
The selection of Weichselian Pleniglacial time-windows is

393WEICHSELIAN PLENIGLACIAL CLIMATE IN EUROPE
based on the regional integration of the palaeoclimatic data.The phases in which the cold Early and Late Pleniglacialreach their most severe values are distinctive time-windows.For the Late Pleniglacial also the climatic conditions after theglacial maximum have been reconstructed. For the MiddlePleniglacial three characteristic intervals have been chosen.The period between 50 and 41 ka is clearly less cold incomparison with the Early Pleniglacial. It includes the warmspike known as the Upton Warren Interstadial (Coope, 1977)around 43–42 ka. A significant cooling is demonstrated dur-ing the 41–38 ka interval. A clear warming has been dis-tinguished in The Netherlands around 38 ka (HengeloInterstadial), which is at the beginning of a period withgenerally constant and similar conditions to those before41 ka but with indications for some colder and warmeroscillations; a time-window at 36–32 ka has been chosen.
The multiproxy approach (MPA) and themultiproxy database (MPDB)
General methods
Palaeoclimatic and palaeoenvironmental evidence are pre-served indirectly in biotic and abiotic records in sedimentarysequences. For a full description of the approach referenceis made to Huijzer and Isarin (1997). In the multiproxyapproach for climate reconstruction evidence of differentorigin is collected, analysed and synthesised, and convertedinto climate parameter values by using standardised trans-lations. The advantages of this approach are described byVandenberghe et al. (1998b, this issue).
Proxy data that play a role in the reconstruction of Weich-selian Pleniglacial climates include aeolian, fluvial and gla-cial deposits and/or landforms. Periglacial structures areimportant abiotic proxy data within these sediments. Simi-larly, botanical (pollen and plant macrofossils) and faunalevidence (Coleoptera, ostracods, molluscs and vertebrates)are used as biotic proxy data from these deposits.
Mean annual temperatures
Mean annual air temperatures (MAAT) in former cold tocool climatic zones are reconstructed most appropriately byrelict periglacial features and structures. The most relevantperiglacial phenomena are sand and ice-wedge casts, frostcracks, cryoturbations of different kinds and size and specificfrost mound remnants (e.g. Vandenberghe, 1983a; Vanden-berghe and Pissart, 1993). They may be supplemented bymicromorphological structures (e.g. Van Vliet-Lanoe, 1985;Huijzer, 1993). In Table 2 diagnostic cryogenic features arerelated to their climatic threshold (Huijzer and Isarin, 1997).
It has to be stressed that periglacial proxies, like manyother proxies, only express threshold values and not singlevalues, and their occurrence is also determined by substrateand by geomorphological and hydrological site factors(Romanovskij, 1985; Pissart, 1987; Ran et al., 1990). Further-more, time-control of periglacial features with respect totheir formation and degradation requires special care. As themutual climatic range (MCR) method provides quantifiedestimates of the mean temperature of both the warmest and
1998 John Wiley & Sons, Ltd. J. Quaternary Sci., Vol. 13(5) 391–417 (1998)
coldest months, mean annual temperatures can easily becalculated from these estimates.
The mean temperature of the warmest month
Vegetation is strongly, but not solely, dependent on theavailability of summer warmth (Iversen, 1954). In the presentstudy these values are derived from individual plant indi-cators that are characterised by mean minimum summertemperature requirements. A detailed discussion may befound in Isarin and Bohncke (in press).
As the geographical distributions of specific beetle speciesare also governed by temperature requirements and in parti-cular the limits of their ranges appear to reflect their exist-ence limits, they may be used in palaeoclimatic reconstruc-tion (e.g. Coope, 1969, 1977). By plotting the distributionof individual beetle species on climate space rather thanon geographical co-ordinates a rather ragged distributioncondenses into a much tighter climatic envelope, which canbe readily stored in a data base. By overlapping the climaticenvelope of the species represented in a fossil assemblage,an area of MCR can be determined, the parameters of whichgive the limits of the acceptable palaeoclimatic conditionsin which that assemblage lived (Atkinson et al., 1987). Itshould be emphasised that this method defines the MCR ofan assemblage rather than thresholds. The MCR methodprovides boundary figures within which the palaeotempera-ture must have lain and does not imply that the actualtemperatures ranged between these limits.
The mean temperature of the coldest month
Thermal contraction cracks give also an indication of themaximum mean temperature of the coldest month. The MCRmethod applied to fossil coleopteran assemblages allows,apart from estimations of the mean temperature of the warm-est month, also the reconstruction of the mean temperatureof the coldest month, although the area of uncertainty inthe MCR is larger than that for summer temperatures.
Another way to derive the latter temperature is by usingthe minimum mean temperature of the warmest month, e.g.inferred from palaeobotanical data, and the maximum meanannual temperature, e.g. inferred from periglacial data, andassuming a symmetrical annual temperature amplitude. Thismethod also assumes that the threshold values obtained fromboth these proxies are near to the real values.
Palaeobotanical data give no substantial indications of thewinter temperature in periglacial regions. The threshold of−8°C for Armeria maritima (originally put forward by Iversen(1954) and still used by Hoek (1997)) has proved to be unre-liable.
Wind climate
Wind-flow patterns are closely related to the atmosphericcirculation patterns and thus to the position of high and lowair-pressure cells. Former effective wind directions areinferred from the spatial relation of the aeolian deposits tothe source area, the sedimentary structures in the aeoliansediments, and the form and orientation of dunes (e.g.Maarleveld, 1960; Vandenberghe, 1983b; Schwan, 1989).

394 JOURNAL OF QUATERNARY SCIENCE
The direction of these high-magnitude winds does not neces-sarily coincide with that of the average prevailing (daily)winds. In contrast to wind direction, the deduction of theexact speed of the depositional winds remains complex.
Age determinations are based mainly on the bracketingbetween dates of underlying and overlying deposits. In thisway, only maximum and minimum ages for the start, respect-ively the end of the period of dune formation are provided(Isarin et al., 1997).
Precipitation
In the present study palaeoprecipitation is estimated mainlyfrom former river activity. The main factors that define andinduce changes in the channel pattern are discharge andsediment load, which are both controlled by climate. Riverdischarge is controlled by precipitation whereas sedimentload is regulated mainly by the vegetation cover. There are,however, other factors defining the relationship betweenchannel pattern and stream power (e.g. tectonic activity andintrinsic evolution). When a change in river pattern or fluvialsedimentation versus erosion takes place over a large regionat the same time, this change would be independent oflocal factors and thus climate controlled. As a consequence,climatically driven changes in river activity may follow threebasic scenarios:
1. a temperature-dominated change in vegetation cover,which induces a shift in sediment load without the needof precipitation fluctuations (cf. Vandenberghe, 1993);
2. a precipitation-dominated change in vegetation cover,
Figure 2 Flow-chart of multiproxy data processing and management for the reconstruction of palaeoclimate maps by using the relationaldata base management system Paradox 4.0/5.0 linked to the geographic information system AtlasGIS (‘multiproxy data base forpalaeoclimate reconstruction’).
1998 John Wiley & Sons, Ltd. J. Quaternary Sci., Vol. 13(5) 391–417 (1998)
which induces a shift in sediment load without the needof major temperature fluctuations;
3. a precipitation-dominated change in discharge withoutthe need of change in vegetation cover and tempera-ture regime.
Often it is not so easy to attribute one of these possibilitiesto particular changes in a fluvial system and thereforeadditional information is required. Finally, periglacial riversare particularly characterised by peak activity at the time ofannual snow melt. Thus, at present, reconstructed pre-cipitation values derived from fluvial activity can only bequalitative.
Data quality control and data processing
It is obvious that the quality of proxy records varies consider-ably. Data quality depends on the detail and accuracy ofdata description, their palaeoclimatic significance and theirtime control.
The extensive set of existing data necessitates an adequatesystem to store the proxy data and their inferred palaeocli-matic parameter values, in order to select data and torepresent them geographically. Therefore, a ‘multiproxy database’ (MPDB) has been set up (Fig. 2). Data quality, siteinformation, dating control and source references areincluded. The MPDB contains climate conversion tables totransfer proxy data into quantitative climate parametervalues. Also several levels of data quality are determined.
Up to now 268 sites and 720 climate records withWeichselian Pleniglacial evidence from northwest and cen-

395WEICHSELIAN PLENIGLACIAL CLIMATE IN EUROPE
tral Europe have been stored in the MPDB. All the individualdata, both original and interpreted, are stored and availableon CD in the data base called CAPS (WDC-A Glaciology,Boulder, USA).
Palaeoclimatic reconstructions
Introduction
The six time-windows selected for climate reconstruction arepresented and discussed. At first, attention is paid to thequantitative reconstruction of the temperature conditions,and their gradients either in the east to west and/or thenorth to south direction. Secondly, additional evidence ispresented from proxies that provide qualitative climate infor-mation on precipitation and wind (direction). For each time-window, key sequences are introduced by a brief discussion.
The reconstruction of the ice limit during specific time-windows is based on a synthesis of literature data or pub-
Table 2 Relationship between periglacial evidence and its climatic significance expressed by the mean annual air temperature (MAAT) andthe mean temperature of the coldest month (Huijzer and Isarin, 1997)
Periglacial phenomena Climate information References
Mean annual air temperature Mean temperature of(MAAT) (°C) the coldest month (°C)
Thermal contraction cracksIce-wedge cast Fine-grained substrate: # −4 # −20 Lachenbruch (1962), PeweFossil sand wedge Coarse-grained substrate: (1962, 1966), RomanovskijComposite-wedge cast # −8 (to −6) (1976, 1985), Washburn
(1979), Burn (1990)
Seasonally frozen ground soil # −1 to 0 # −8 Maarleveld (1976), Kartewedge with primary (or secondary) (1979, 1983) (cf.infilling Romanovskij, 1985)
Periglacial involutionType 2 large-scale (amplitude Fine-grained substrate: # −4 Vandenberghe (1988),$ 0.6 m) down-sinking or Coarse-grained substrate: Vandenberghe and Pissartup-doming forms # −8 (to −6) (1993)
Type 3 small-scale (amplitude # −1 Vandenberghe (1988), 0.6 m) down-sinking orup-doming forms
Type 4 solitary forms of variable # −1 Vandenberghe (1988)amplitude in drops or diapirs
Perennial frost moundsOpen-system pingo # −3 to # −1 Washburn (1979), MackayClosed-system pingo # −6 to # −4 (1988)
Mackay (1978, 1988),Washburn (1979)
Palsa Organic: # −1 Washburn (1979)Mineral: # −6 to −4 Dewez et al. (1985)
Cryogenic microfabricsBanded fabrics # −1 to 0 This study (cf. Karte,Lenticular platy microstructures # −1 to 0 1983)Cryogenic microfabrics in cave # 0 This study (cf. Karte,deposits 1983)
Pissart et al. (1988)
1998 John Wiley & Sons, Ltd. J. Quaternary Sci., Vol. 13(5) 391–417 (1998)
lished reviews (e.g. Houmark-Nielsen, 1989). The recon-structed ice-sheet limits are incorporated within the palaeo-climate maps. Sea-level stands during these time-windowshave been estimated from global sea level curves (Bloomet al., 1974; Bloom and Yonekura, 1985; Fairbridge, 1989).They are roughly outlined on the climate maps by relatingthese values to the depth contours of −50 and −100 m frombathymetric maps.
Some European (sub)regions are poorly represented oreven unrepresented by climatically useful indicators andemphasis is more on regional climate patterns than onspecific details of local key sequences and their relatedclimate evidence. It also has to be stressed that the palaeo-temperature maps give minimum values: they are basedmainly on the presence of environmentally significant dataand not on their absence. For the most part their figuresrepresent thresholds. In regions that are poorly documented,the absence of definitive information there is a tendency toavoid extreme interpretations and, under such circumstances,the winter temperatures might be somewhat overestimatedand the summer temperatures somewhat underestimated.Furthermore, the boundaries of permafrost are possibly

396 JOURNAL OF QUATERNARY SCIENCE
Table 3 Estimates of temperature and approximations of wind action and precipitation during specific time-windows in the lowland ofnorthwest and central Europe based on multiproxy data
Time-window Temperature of Mean annual Temperature of Annual Climate Wind Precipitation(ka) warmest month temperature coldest month amplitude gradient activity
(°C) (°C) (°C) (°C)
74–59 10 to 13 −8 to −4 −26 to −20 30 to 39 North to south ++ −50–41 $ 7 to $ 10 # −4 to # −1 # −20 to # −13 23 to 27 West to east − +Upton Warren 16 to 18 4 to 9 −7.5 to 0.5 15 to 26 (?) West to east − +41–38 10 to 11 −9 to −4 −27 to −20 30 to 37 North to south + −36–32 10 −7 to −2 −20 to −16 26 to 30 − − +27–20 4 to 8 −8 to −4 −25 to −20 28 to 33 North to south + ±20–13 7 to 11 −9 to −4 −26 to −20 28 to 36 North to south ++ −
drawn conservatively and the regions with permafrost couldpossibly extend more to the south.
A synthesis of the main palaeoclimatic parameters foreach time-window is given in Table 3.
The Early Pleniglacial: time-window 74–59 ka(Oxygen Isotope Stage 4)
Introduction
In contrast to the deposits of the cold Weichselian LatePleniglacial, deposits of the Weichselian Early Pleniglacialsubstage have been described only occasionally. Althoughglacial data are still not unequivocal, there is growing evi-dence that local ice-sheets may have been present in north-western and central Europe (e.g. Houmark-Nielsen, 1989;and many others). A tentative reconstruction of the maximumextent of the Weichselian Early Pleniglacial ice sheet hasbeen made for northwestern Europe (Fig. 3).
Figure 3 Estimates of the mean annual temperature during the 74–59 ka interval based on periglacial and Coleoptera data (mutual climaticrange method). Periglacial data indicate the maximum mean annual air temperature (MAAT), whereas Coleoptera data give the rangewithin which the mean annual temperature has lain.
1998 John Wiley & Sons, Ltd. J. Quaternary Sci., Vol. 13(5) 391–417 (1998)
Key sites
Key sequences of the Weichselian Early Pleniglacial substagehave been described from The Netherlands: Alphen ‘t Zand(Vandenberghe and Krook, 1981), Amersfoort-De Liendert(Zagwijn and Paepe, 1968), Borne (Van den Berg and DenOtter, 1993), Goirle (Vandenberghe and Krook, 1985) andMaastricht-Belvedere (Vandenberghe et al., 1985). Character-istics of these type sequences include ice-wedge casts, large-scale periglacial involutions, deflation lag concentrates andaeolian deposits. Furthermore, single ice-wedge casts havebeen reported from Kirkhill in Scotland (Connell and Hall,1987), Agnaddarragh in Ireland (McCabe et al., 1987),Bełchatow (Gozdzik, 1990) and Stare Kurowo (Kozarski,1988) in Poland, and several sites in the loess area ofnorthern France (e.g. Lautridou and Somme, 1981).
Thermal evidence
One of the main sources of climate information about theWeichselian Early Pleniglacial substage comes from perigla-

397WEICHSELIAN PLENIGLACIAL CLIMATE IN EUROPE
cial evidence. It has to be stressed that the periglacialevidence represents the maximum cold during (a specific)interval of the Weichselian Early Pleniglacial substage andthat not necessarily the entire Early Pleniglacial substagewas controlled by these cold climate conditions. The occur-rence of exclusively northern, i.e. cold-adapted Coleopteraprovide numerous climatic indicator species which, usingthe MCR method, can provide figures for the mean tempera-tures of the warmest and coldest months.
The temperature of the warmest month is estimated atbetween 10 and 13°C for central London (Coope et al.,1997) and between 7°C and 11°C for Cassington, nearOxford (Maddy et al., 1998). Both these estimates are madeby the MCR method on coleopteran assemblages. Quantifiedclimatic estimates made on both palaeobotanical andcoleopteran data are available from more southern latitudes(e.g., La Grande Pile, France: Guiot et al., 1993; Ponel,1994).
Based on the presence of cryogenic phenomena, specificperiglacial zones may be interpreted and delineated for theEarly Pleniglacial substage. It is suggested that the majorsubdivision between the continuous and discontinuous per-mafrost regions is located somewhere around the Belgian–French border (Fig. 3). From the Normandy region andfurther southward no indications for permafrost are reported.From this periglacial evidence, a climatic gradient in anorth–south direction may be inferred and a detailed recon-struction of the maximum mean annual temperature can beobtained (n = 32). The maximum mean annual air tempera-ture is estimated at #−8°C in the northern part of thestudy area to #−4°C in northernmost France. The meantemperature of the coldest month is estimated from thecombined evidence of periglacial and Coleoptera records.The presence of ice-wedge casts indicates a mean tempera-ture below −20°C, whereas Coleoptera evidence suggests atemperature for the coldest month ranging from −26°C (32°C)to −10°C in the London area (Fig. 4). The combination of
Figure 4 Estimates of the mean temperature of the coldest month during the 74–59 ka interval based on periglacial and Coleoptera data(mutual climatic range method). Periglacial data indicate the maximum mean temperature of the coldest month, whereas Coleoptera dataindicate the range within which the mean temperature of the coldest month has lain.
1998 John Wiley & Sons, Ltd. J. Quaternary Sci., Vol. 13(5) 391–417 (1998)
both proxy records points to a temperature of the coldestmonth between −26°C and −20 °C.
Cold steppe mammals such as Bison priscus, Coelodontaantiquitatis and Elephas primigenius are generally thoughtof as indicative of cold steppe conditions, although in afacultative rather than obligatory sense. As climatic indi-cators, therefore, their presence may be rather equivocal.they have been found from several sites in Belgium(Vanhoorne, 1971; Gautier and Schumann, 1973; Gautier,1974; De Moor, 1975). This mammal assemblage couldhave tolerated the cold conditions inferred above during theWeichselian Early Pleniglacial interval.
Wind evidence
At Alphen ‘t Zand it was found that aeolian sand sheetdeposition took place before the maximum cold (Vandenbergheand Krook, 1981), whereas at Amersfoort-De Liendert (Zagwijnand Paepe, 1968) and Goirle (Vandenberghe and Krook, 1985)aeolian sands accumulated after the maximum cold of theEarly Pleniglacial. It therefore may seem likely that aeoliansands accumulated during the major part of this Early Plenigla-cial. In general, the Lower Pleniglacial series are covered witha gravel lag concentrate (Gilze Gravel according to Vanden-berghe (1985). This gravel lag at the top of the Lower Plenigla-cial series indicates a phase of aeolian deflation, suggestingwind action and aridity.
The transition from sand sheets in The Netherlands toloess deposits in northern France suggests an along-tracksize-sorting and wind directions from the northern quadrant.
Precipitation evidence
The base of the Lower Pleniglacial is often characterisedby fluvial incision. Subsequent aggradation is commonly

398 JOURNAL OF QUATERNARY SCIENCE
expressed by medium to coarse-grained deposits frombraided-river systems. For example, fluvial incision at thebeginning of the Early Pleniglacial followed by aggradationin braided-river systems has been identified at sites in TheNetherlands (Van Huissteden et al., 1986b; Van Huissteden,1990) and western Belgium (De Moor et al., 1978; De Moor,1981). Alluvial fan-like accumulations are suggested for sitesin the same regions. Wet conditions at the beginning of theEarly Pleniglacial may be ascertained from these morphologi-cal and sedimentary processes. In addition, the presence ofbraided-river systems points to a highly seasonal runoff,probably due to spring snow melt.
As already stated, aeolian sand sheets and desert pave-ments suggest a high aridity towards the end of the EarlyPleniglacial. This is confirmed by the rarity of organicdeposits in the study area.
The early Middle Pleniglacial: time-window50–41 ka (in Oxygen Isotope Stage 3)
Introduction
Because this time-window falls near to the acceptable limitof radiocarbon dating techniques it is often difficult to knowwhat reliance should be put on the available dates or whatcriteria should be adopted for deciding which dates areacceptable and which are not. In cases of real doubt therecords have been rejected for climate reconstruction. As aresult climate data from this interval are relatively scarce.
A chronostratigraphical equivalent of this time-window isthe Bø–Older Dosebacka–Hirtshals Interstadial in Denmarkand southern Scandinavia, as outlined by Houmark-Nielsen(1989). The limit of the ice sheet during the Bø–OlderDosebacka–Hirtshals Interstadial is located in the southernpart of Scandinavia, based on data reviewed by the sameauthor (Fig. 5). With respect to the Early Pleniglacial subst-
Figure 5 Estimates of the mean temperature of the warmest month during the 50–41 ka interval based on botanical (climate indicatorspecies method) and Coleoptera data (mutual climatic range method). Botanical data indicate the minimum mean temperature of thewarmest month, whereas Coleoptera data indicate the range within which the mean temperature of the warmest month has lain (limit ofice sheet based on Houmark-Nielsen, 1989).
1998 John Wiley & Sons, Ltd. J. Quaternary Sci., Vol. 13(5) 391–417 (1998)
age, a significant retreat of the ice sheet took place. Thesea-level during this interval is estimated to have been 50 mlower than the present-day level.
Key sites
Key sequences of the Weichselian early Middle Pleniglacialsubstage are described from several sites in the easternpart of The Netherlands (Teunissen and Teunissen-Oorschot,1974; Kolstrup and Wijmstra, 1977; Ran, 1990), the centralNetherlands (Van der Meer et al., 1984) and the southernNetherlands (Zagwijn and Paepe, 1968). From the latterregion, organic deposits of the Riel Interstadial have beenreported by Vandenberghe (1985). A detailed sedimentolog-ical analysis of fluvial deposits and periglacial featuresenabled Mol (1997a) to reconstruct the palaeoenvironmentalconditions in eastern Germany. Important sites with Coleop-tera in England include Upton Warren (Coope et al., 1961)and Isleworth (Coope and Angus, 1975). According to theradiocarbon datings the early Middle Pleniglacial sequenceat Oerel, northern Germany (Behre, 1989) also belongs partlyto this time window.
Thermal evidence
Based on palaeobotanical data, the temperature of thewarmest month may be estimated at approximately $ 7°Cto $ 11°C (n = 29). A thermal gradient may be suggestedfrom ca. 7°C in Poland rising to ca. 10°C in northwesternEurope (Fig. 5). It must be stressed, however, that in thetwo botanical records in Poland only one or two climateindicator species are present within the pollen assemblagezone. As a consequence, both these records may be qualifiedas low-quality data and the suggested thermal gradient in

399WEICHSELIAN PLENIGLACIAL CLIMATE IN EUROPE
the temperature of the warmest month towards Poland israther speculative. Further to the north, i.e. at Hirtshals,Denmark (Odgaard, 1982), the palaeobotanical data indicatea temperature for the warmest month ranging between 7°Cand 10°C.
Based on the presence of cryogenic phenomena, specificperiglacial zones may be interpreted and delineated for the50–41 ka interval (n = 9). Thermal contraction cracks havebeen identified in The Netherlands, which indicate meanannual temperatures below −1°C. In addition, periglacialfeatures suggesting more severe climatic conditions, such asice-wedge casts, have not been found so far in The Nether-lands. By contrast, small ice-wedge casts in eastern Germanyindicate at least discontinuous permafrost conditions withmaximum mean annual air temperatures of −4°C (Mol,1997b). It is suggested that the major boundary between theseasonally frozen ground in northwestern Europe and thediscontinuous permafrost zone in central Europe is locatedsomewhere in western Germany (Fig. 6).
The mean temperature of the coldest month may also bebased on periglacial data. The relatively small ice-wedgecasts in eastern Germany indicate temperatures below−20°C. For The Netherlands, a combination of periglacialdata (i.e. the maximum mean annual temperature) andpalaeobotanical records (i.e. the minimum mean temperatureof the warmest month) enables the calculation of themaximum mean temperature of the coldest month. Fromthis integration it appears that the temperature of the coldestmonth is estimated below −11.5 to −13°C in The Netherlands(Fig. 7). All these data suggest a west to east temperaturegradient.
Although Coleoptera data from the European continentare scarce with respect to the 50–41 ka interval, Coleopteraevidence from the eastern and northern Netherlands suggeststhat the temperature of the warmest month remained below10°C, as cold insect faunas (and the cold adapted notostra-can crustacean Lepidurus arcticus) are present between ca.52 and 40 ka (Brinkkemper et al., 1987; Ran, 1990; Cappers
Figure 6 Estimates of the mean annual temperature during the 50–41 ka interval based on periglacial and Coleoptera data (mutual climaticrange method).
1998 John Wiley & Sons, Ltd. J. Quaternary Sci., Vol. 13(5) 391–417 (1998)
et al., 1993). Cold climate conditions are also indicated bythe Tattershall Castle series (Girling, 1974, 1977).
A short but intense episode of climatic warming aroundca. 43–42 ka has been recorded in England (‘Upton WarrenInterstadial’, Coope and Sands, 1966). It is based largely onan extensive assemblage of Coleoptera species, all of whichhave temperate geographical ranges at the present day, andsome of which do not live as far north as England today(Isleworth dated at 43 140 ± 1520/1280 yr BP, Coope andAngus, 1975; Upton Warren dated at 41 900 ± 800 yr BP,Coope et al., 1961; Tattershall Castle Pit dated at43 000 ± 12 000 yr BP, Girling, 1974; the Ismaily Centre,London, Coope et al., 1997). The MCR estimates from thesesites point to mean temperatures of the warmest monthbetween 15°C and 18°C and mean temperatures of thecoldest month between ca. −13 and 1°C. It is interesting tonote that other biological climatic indicators such as mol-luscs and ostracods support this interpretation of temperateconditions in spite of the general treelessness of the land-scape.
It is noted that the short, relatively warm interval of theUpton Warren Interstadial occurs within this time window.The preceding and succeeding conditions were cold enoughto inhibit tree growth completely in southern England (Coopeet al., 1997). A comparison of palaeobotanical records fromthe continent with those from England is straightforward (cf.Fig. 5). It is concluded that the Upton Warren Interstadialreflects an intense, but short-lived warming, or ‘thermalspike’, which was recorded primarily in rapidly reactingbiotopes such as beetles. In general, the reaction of Coleop-tera to climate change is much quicker than the responseof the arboreal vegetation (e.g. Coope, 1987). Until furtherinvestigations of the coleopteran faunas of this age from thenearby continent have been made it is not meaningful toreconstruct temperature gradients. If the age of the UptonWarren Interstadial, however, should be slightly older thenit could correspond well with the Riel Interstadial in TheNetherlands (around 45–48 ka; Vandenberghe, 1985) and

400 JOURNAL OF QUATERNARY SCIENCE
Figure 7 Estimates of the mean temperature of the coldest month during the 50–41 ka interval based on periglacial, Coleoptera (mutualclimatic range method) and a combination of botanical and periglacial data.
the temperature gradient would be much less. Even a corre-lation with the Glinde Interstadial (Behre, 1989) should notbe excluded.
Mammals such as Mammuthus primigenius and Rangifertarandus have been described from sites in eastern Denmark,central England (Coope et al., 1961) and northern Scotlandand clearly suggest that these northern regions were notcovered by ice-sheets at that time (Selsing, 1982; Lawson,1984; Aaris-Sørensen et al., 1990; Murray et al., 1993). Thepresence of these large mammals in both cold and temperatecontexts, however, suggests that they may not be entirelyreliable as climatic indicators.
The Middle Pleniglacial cold interval: time-window 41–38 ka (in Oxygen Isotope Stage 3)
Introduction
Ran and Van Huissteden (1990) introduced the HasseloStadial for the cold phase between the traditional Moers-hoofd (ca. 50–43 ka) and Hengelo (ca. 39–37 ka) Interstadials(Van der Hammen et al., 1967; Zagwijn and Paepe, 1968).In the UK, the thermal maximum of the Upton WarrenInterstadial Complex was followed by cold continental con-ditions just before 40 ka (Coope, 1977). A comparable cold(and dry) interval around 40 ka was inferred from palaeobot-anical evidence of the continuous terrestrial sequences atLes Echets and La Grande Pile in France (Guiot et al., 1993).This cold interval is demonstrated by glacier expansion alongthe Norwegian coast between 42 and 36 ka (Mangerud,1991). It corresponds also with the Jaeren–Goteburg II–Vennebjerg Stadial around 40 ka as described by Houmark-Nielsen (1989). This cooling event around 40 ka has alsobeen found in several records outside northwestern Europe.It is striking that the recurrence interval between the three
1998 John Wiley & Sons, Ltd. J. Quaternary Sci., Vol. 13(5) 391–417 (1998)
coldest phases in the Pleniglacial (ca. 65 ka, ca. 41 ka andca. 20 ka) is around 21–23 ka.
The palaeogeographic setting is dominated by an estimatedsea-level lowering of approximately 50 m with respect tothe present level. Furthermore, the limit of the ice sheet didnot come across the Baltic Sea during this cold MiddlePleniglacial interval (Fig. 8).
Key sites
Type sequences showing deposits of this cold interval in theMiddle Pleniglacial substage are reported from sites in TheNetherlands, such as exposures around Hengelo (Zagwijn,1974; Van Huissteden, 1990; Ran et al., 1990) and Grouw(Kasse et al., 1995). Aeolian sand sheet deposits have beenreported from Øster Doense in Denmark (Jørgensen, 1988).Major Coleoptera sites in the UK include Fladbury (Coope,1962), Queensford (Briggs et al., 1985) and Oxbow (Gauntet al., 1970).
Thermal evidence
The minimum mean temperature of the warmest month isindicated by botanical climate indicator species (n = 18)ranging from 7°C to 12°C, with average temperatures around10°C (Fig. 8). Minimum values of 7°C and 8°C occurinfrequently and are based on the presence of only one ortwo climate indicator species. Comparable mean tempera-tures of the warmest month somewhere between 8°C and11°C were estimated by MCR from a high number of coleop-teran species from England and The Netherlands (n = 4).Thus the mean temperature of the warmest month at thistime based on the presence of both plant and insect specieswas between 10°C and 11°C.
The mean annual temperature is inferred from periglacialevidence (n = 13). As far as ice-wedge casts from this Middle

401WEICHSELIAN PLENIGLACIAL CLIMATE IN EUROPE
Figure 8 Estimates of the mean temperature of the warmest month during the 41–38 ka interval based on botanical (climate indicatorspecies method) and Coleoptera data (mutual climatic range method) (limit of ice sheet based on Houmark-Nielsen, 1989).
Pleniglacial interval were identified in The Netherlands, theirpresence is exclusively associated with a silty subsoil (VanHuissteden and Vandenberghe, 1988; Ran et al., 1990; VanHuissteden, 1990; Huijzer, 1993). Furthermore, incipient ice-wedge casts in fine-grained (silty) sands were reported fromthe northern Netherlands by De Mulder (undated) and Kasseet al. (1995). The southernmost Middle Pleniglacial ice-wedge casts have been reported from Belgium and datedbetween 45.5 and 38.6 ka BP (Haesaerts and Van Vliet-Lanoe, 1974; Haesaerts, 1985). As a consequence, meanannual air temperatures were under −4°C but remainedabove −8 (to −6)°C in Belgium and The Netherlands, becauseice-wedge casts have not been found in coeval sandy sub-strates. With respect to the southern part of the study area,ice-wedge casts of the Middle Pleniglacial substage havenot been identified up to now in the loess district of northernFrance (cf. Lautridou and Somme, 1981; Lautridou, 1985).It is therefore suggested that the mean annual air temperatureremained above −4°C in northern France during this interval.These climate data agree with palaeobotanical evidence fromwhich mean annual temperatures were estimated at ca. −1°Cat La Grande Pile and ca. 2°C at Les Echets in France (Guiotet al., 1993). In the northern part of the study area, acomposite wedge in a sandy substrate points to a meanmaximum annual air temperature of −8 (to −6)°C (Kolstrupand Mejdahl, 1986). As this is the southernmost occurrenceof an indicator of continuous permafrost, it is inferred thatthe southern boundary of continuous permafrost was situatedin northernmost Germany (Fig. 9).
The mean annual air temperature inferred from Coleopteraevidence (n = 4) suggests a range from −10°C to 0°C inEngland and The Netherlands. Combination of periglacialand Coleoptera evidence indicates that the mean annualtemperature was between −10°C and −4°C in the latterregion.
The maximum mean temperature of the coldest month isbased on the presence of ice-wedge casts, which indicatevalues below −20°C. Coleoptera evidence points to a meantemperature of the coldest month ranging from about −27°C
1998 John Wiley & Sons, Ltd. J. Quaternary Sci., Vol. 13(5) 391–417 (1998)
to −15°C (Fig. 10). A combination of both kinds of datagives a mean temperature of the coldest month between−27°C and −20°C. As a consequence, the annual amplituderanges from 30° to 37°C and indicates that a high degreeof continentality prevailed in Europe at that time. This isconfirmed by the coleopteran assemblages, which includemany species that today are restricted to eastern Asia, sug-gesting that the climate was very much more continentalthan it is anywhere in Europe today.
The temperature of the coldest month may alternativelybe calculated from the mean temperature of the warmestmonth (ca. 10°C), inferred from palaeobotanical and coleop-teran data, and the maximum mean annual temperature(−4°C in northwestern Europe), inferred from periglacial data.Assuming a symmetric annual temperature amplitude, themaximum mean temperature of the coldest month is esti-mated at ca. −18°C or slightly lower, which is in accordancewith the values derived above.
Mammalian evidence agrees with the cold conditions pre-vailing during the 41–38 ka interval. Radiocarbon-dated frag-ments of Mammuthus primigenius (woolly mammoth) orRangifer tarandus (reindeer) have been reported from a num-ber of sites in the UK and Denmark (e.g. Gaunt et al.,1970; Burleigh et al., 1982). These faunal remains provideadditional evidence for cold conditions, although this typeof fauna is not exclusively related to this cold interval.
In summary, periglacial data provide evidence for a tran-sition from continuous (Denmark) to discontinuous (TheNetherlands and Belgium) permafrost, while deep seasonallyfrozen ground was probably present in northern Franceduring the 41–38 ka interval. A visual inspection of the mapwith the maximum mean annual air temperatures suggests anorth to south thermal gradient along the northwest Europeanlowland during the 41–38 ka interval that was stronger thanthe present-day gradient (Fig. 9). The thermal conditionswere somewhat warmer than during the Early and LatePleniglacial, when continuous permafrost conditions domi-nated in the whole of northwestern Europe (see relevanttime slices).

402 JOURNAL OF QUATERNARY SCIENCE
Figure 9 Estimates of the mean annual temperature during the 41–38 ka interval based on periglacial and Coleoptera data (mutual climaticrange method).
Figure 10 Estimates of the mean temperature of the coldest month during the 41–38 ka interval based on periglacial and Coleoptera data(mutual climatic range method).
Wind evidence
Sandy loess deposition took place between ca. 42 and 38 kain Beerse-Dam, Belgium (Haest et al., 1986). Similarly, siltloam accumulation took place between ca. 42.5 and 38 kaat Rocourt in eastern Belgium (Wintle, 1987). It is suggestedthat the Middle Silt Loam II series at Kesselt also belongsto this cold period (Huijzer, 1993). The accumulation ofsand sheets with intercalated silty layers is described fromØster Doense in Denmark (Jørgensen, 1988). Thermolumi-nescence dating of these windblown sands provides ages of
1998 John Wiley & Sons, Ltd. J. Quaternary Sci., Vol. 13(5) 391–417 (1998)
40 and 37 ka. Furthermore, aeolian activity may be deducedfrom the presence of a composite-wedge cast in Hostrup,Denmark (Kolstrup and Mejdahl, 1986). In summary, aeoliandata suggest aridity, with sand-sheet deposition in northernregions such as Denmark, while loess deposition prevailedin the south, e.g. Belgium. The influence of a northern windcomponent may be suggested if it is supposed that along-track size-sorting results in a sand-to-loess transition (cf.Schwan, 1986).

403WEICHSELIAN PLENIGLACIAL CLIMATE IN EUROPE
Precipitation evidence
Ran et al. (1990) present palaeobotanical evidence forxerophilous taxa and the break-up of a continuous vegetationcover during the cold 41–38 ka interval. Therefore, the latterauthors even suggested that changes in vegetation develop-ment were controlled by moisture rather than temperature.This agrees with botanical evidence from France (cf. Guiotet al., 1993). The aridity during this interval is supported bythe aeolian activity discussed above. After 38 ka a precipi-tation-induced increase in the vegetation cover is recorded.
Fluvial data from the eastern part of The Netherlandssuggest incision at the end of the period under discussion(Van Huissteden, 1990; Ran et al., 1990; Van den Berg andDen Otter, 1993). As permafrost degradation implies aclimatic warming around 38 ka (Van Huissteden, 1990;Kasse et al., 1995), this incision may be explained as atemperature-triggered process of increase in river discharge,which is in accordance with the model proposed by Vanden-berghe (1993). Higher precipitation at the transition fromthe cold towards the subsequent relatively warmer period,however, has also contributed to the increase in discharge.
The late Middle Pleniglacial: time-window36–32 ka (within Oxygen Isotope Stage 3)
Introduction
Ran and Van Huissteden (1990) introduced the HuneborgInterval for the period between the classic pollen-basedHengelo Interstadial (38–36 ka) and the so-called DenekampInterstadial complex (32–26 ka; cf. Van der Hammen et al.,1967). Ran and Van Huissteden (1990) preferred the terminterval because a climatic contrast with preceding andposterior periods is not obvious. The Hengelo Interstadialreflects a relatively warm period following the cold con-ditions of the Hasselo Stadial. The climatic warming of theHengelo Interstadial is demonstrated by permafrost degra-dation at Hengelo and Grouw in The Netherlands (Ran et al.,1990; Van Huissteden, 1990; Kasse et al., 1995). Permafrostdegradation resulted in thaw lake formation and depositionof fine-grained sediments in (fluvio-)lacustrine environments.Within the loess region, landscape stability prevailed, whichresulted in soil formation maybe even characterised by clayilluviation (Vandenberghe et al., 1998b, this issue). Further-more, it may be questioned whether the temperature substan-tially declined after the Hengelo Interstadial or whether thewarming initiated during the Hengelo Interstadial remainedmore or less stable during the subsequent Huneborg Interval.According to the Greenland ice-record several thermal spikesoccurred within the Weichselian Middle Pleniglacial stage(e.g. Johnsen et al., 1992). Possibly the Hengelo Interstadial,like the Upton Warren Interstadial, represents one of them.
The Huneborg Interval partly correlates with the Sandnes–Møn-Gardslov Interstadial approximately between 35 and25 ka (Houmark-Nielsen, 1989). The limit of the ice sheetdid not extend across the Baltic Sea but stabilised in southernNorway and southern Sweden in this interval (Fig. 11).Furthermore, the palaeogeographical conditions during thisinterval were dominated by an estimated sea-level loweringof approximately 50 m.
1998 John Wiley & Sons, Ltd. J. Quaternary Sci., Vol. 13(5) 391–417 (1998)
Key sites
Lithostratigraphical sequences and related periglacial featuresfrom the 36–32 ka interval have been described from Grouw(Kasse et al., 1995), Hengelo (Van Huissteden, 1990; Ranet al., 1990), Rosbach (Kuttel et al., 1986), Lemforde(Glatthaar and Liedtke, 1986) and Kempton Park, Sunbury(Gibbard et al., 1981; Southgate, 1984). In addition, MCRdata based on Coleoptera evidence have been reported froma number of sites, i.e. Aldeneik (Gullentops et al., Unpubl.).Peelo (Coope, 1969; Ruegg, 1975), Sutton Courtenay(UK) (Briggs et al., 1985), Coleshill (UK) (Coope and Sands,1966), Brandon (UK) (Coope, 1968a) and Four Ashes, Loc.3 (UK) (Morgan, 1973a).
Thermal evidence
The minimum mean temperature of the warmest month,indicated by botanical climate indicator species, wasbetween 9.5°C and 11.5°C, although values around 10°Cpredominate (Fig. 11). This corresponds with temperatureranges inferred from Coleoptera data in England, The Nether-lands and Belgium varying on the average between 8.5°Cand 11.5°C (Fig. 11). The botanical and Coleoptera data atTilligte (The Netherlands) indicate that the mean temperatureof the warmest month lies above 9.5°C (botanical data),whereas it should be slightly lower than 10°C according tothe Coleoptera data (an inference supported by the presenceof Lepidurus arcticus Pallas). It may be concluded that themean temperature of the warmest month was about 10°Cin Britain, The Netherlands and Belgium. In addition, it maybe suggested that there is weak evidence for a north tosouth gradient, as botanical data at Rosbach (Germany)suggest a relatively high temperature (Kuttel et al., 1986): inparticular, the presence of Hippophae rhamnoides in thepollen assemblage points to a temperature of the warmestmonth higher than 11.5°C.
The mean annual temperature inferred from periglacialevidence was lower than −2 to −1°C (Fig. 12). This is basedon the presence of frost cracks (Germany, Belgium and TheNetherlands). Small-scale or incipient ice-wedge casts haveoccasionally been found in The Netherlands. It is also poss-ible that at Kesselt (on a loess substratum) ice wedges formedduring the coldest spells of this period (Vandenberghe et al.,1998b, this issue). This should mean that occasionally themean annual temperatures dropped to −4°C and otherwisewere a few degrees higher, and that the southern boundaryof the discontinuous permafrost zone shifted through TheNetherlands at several occasions during that period.
The mean annual air temperature inferred from Coleopteraevidence lay somewhere between −11°C and −2°C (Fig. 12).Despite this wide choice of options, the overlap with themean annual air temperature inferred from periglacial evi-dence is clear. As ice-wedge casts have not been identifiedin coarse-grained substrates from this interval, the meanannual air temperature should have been higher than −8°C.In combination, the range of the mean annual temperatureis confined between −8 and −2°C.
With respect to the maximum mean temperature of thecoldest month, the presence of frost cracks indicates at leastvalues below −8°C (Table 2). As well-developed ice-wedgecasts have not been identified, the mean temperature of thecoldest month should generally have been higher than −20°C(Fig. 13). Coleoptera evidence suggests a mean temperatureof the coldest month ranging from about −31°C to −16°C.Using the symmetrical annual temperature cycle by integrat-

404 JOURNAL OF QUATERNARY SCIENCE
Figure 11 Estimates of the mean temperature of the warmest month during the 36–32 ka interval based on botanical (climate indicatorspecies method) and Coleoptera data (mutual climatic range method) (limit of ice sheet based on Houmark-Nielsen, 1989).
Figure 12 Estimates of the mean annual temperature during the 36–32 ka interval based on periglacial and Coleoptera data (mutualclimatic range method).
ing botanical and periglacial evidence a mean temperatureof the coldest month of # −12°C is derived for the warmestspikes (# −1°C for the mean annual temperature and 10°Cfor the July temperature), and −26° to −18°C for the coldestspikes (−8° to −4°C for the annual mean and 10°C insummer) in The Netherlands. Combining all types of evi-dence, the mean temperature of the coldest month may beestimated between −12°C and −20°C. As a consequence,the annual amplitude is estimated to be in the range of22°C to 30°C. In summary, the thermal conditions during this
1998 John Wiley & Sons, Ltd. J. Quaternary Sci., Vol. 13(5) 391–417 (1998)
interval were slightly warmer than those prevailing during the41–38 ka interval.
Large mammals that were tolerant of cold conditions werepresent at this time, as indicated by the radiocarbon-datedfragments of Mammuthus primigenius (33 500 ± 1200 yr BP)and spotted hyena (34 300 ± 1800 yr BP) at Castlepook Cave,Ireland (Dresser and McAulay, 1974; Stuart and VanWijngaarden-Bakker, 1985). Similarly, fragments of Mam-muthus primigenius at Little Rissington, England, were radi-ocarbon dated at 34 500 ± 800 yr BP (Shotton et al., 1974).

405WEICHSELIAN PLENIGLACIAL CLIMATE IN EUROPE
Figure 13 Estimates of the mean temperature of the coldest month during the 36–32 ka interval based on periglacial, Coleoptera (mutualclimatic range method) and a combination of botanical and periglacial data.
Finally, at Lundebjerg in Denmark faunal remains of Mam-muthus primigenius were dated at 32 460 ± 970/870 yr BPby Aaris-Sørensen et al. (1990).
Estimates of other climate parameters, such as precipitationand/or wind, are difficult to make for this specific timeinterval.
The maximum cold of the Late Pleniglacial(| Last Glacial Maximum): time-window 27–20 ka (in Oxygen Isotope Stage 2)
Introduction
Time-control of climate records of the Late Pleniglacial subst-age is hard to establish. This is because biological pro-ductivity of the whole ecosystem was low, so that feworganic horizons yield material suitable for radiocarbon dat-ing. Based on a lithostratigraphical and/or cryostratigraphical(or tephrostratigraphical) correlation of proxy data a subdiv-ision of the Late Pleniglacial period in two separate time-windows is feasible, i.e. 27–20 ka and 20–13 ka. The time-window 27–20 ka includes the period of maximum coldduring the Late Pleniglacial substage, i.e. the period justbefore the maximum extent of the ice sheet (assumed at ca.20 ka). Periglacial features formed in outwash gravels andsands directly underneath till witness the climatic coolingwhen the ice sheet advanced in the northwestern and centralEuropean lowland and are linked to the maximum cold ofthe Last Glacial Maximum. The area outside the maximumextent of the ice sheet can be subdivided into two sub-environments, i.e. the coversand and loess district. Aeoliansands accumulated in, for example, The Netherlands,Belgium, northern Germany, and Poland. Permafrost featureswith a (cryo)stratigraphical position below the BeuningenGravel Bed (e.g. Van der Hammen and Wijmstra, 1971;Vandenberghe, 1977, 1985) are related to the maximum
1998 John Wiley & Sons, Ltd. J. Quaternary Sci., Vol. 13(5) 391–417 (1998)
cold of the Late Pleniglacial. Within the loess district (TheNetherlands, Belgium, Germany, southern Poland, easternEngland) loess deposits were reworked by surficial processes,such as afterflow, into weakly laminated silt loam sediments(Catt, 1977; Mucher and De Ploey, 1984; Vandenbergheet al., 1998b, this issue).
The exact position of the ice-sheet margin during the LastGlacial Maximum (LGM) is well-known compared with themaximum ice-sheet extent of the time-windows discussedpreviously (Fig. 14). It is based on data reviewed by Rozycki(1972), Liedtke (1975), Bowen et al. (1986), Eissmann (1986),Houmark-Nielsen (1987, 1989), McCabe (1987), Long et al.(1988), Petersen and Kronborg (1991) and Kozarski (1992).The LGM corresponds with the Jylland phase (Main Station-ary Line) in Denmark, the Brandenburg phase in Germany,the Leszno phase in Poland, the South Irish End Moraine inIreland and the Dimlington phase in the UK. Recently, aneven more widespread extension of the LGM ice sheet forthe North Sea Basin has been suggested by Ehlers andWingfield (1991). As a consequence, the indicated ice-sheetlimit should be considered as a minimum extent of the LGMwith respect to the North Sea area (Fig. 14).
An estimated sea-level stand of approximately 120 mbelow the present-day level is suggested for this interval.
Key sites
Typical Late Pleniglacial sequences are characterised byfluvial and fluvio-aeolian sand series and periglacial featuressuch as large ice-wedge casts and large-scale periglacialinvolutions, which have been described from the Twenteregion (Van der Hammen and Wijmstra, 1971; Vanden-berghe and Van Huissteden, 1988), the central Netherlands(Maarleveld, 1976, 1989; Kolstrup and Wijmstra, 1977), thesouthern Netherlands (Vandenberghe and Krook, 1981,1985; Mol et al., 1993) and Germany (Kellenberg-Hohersuhn: Meyer, 1981). Detailed descriptions of perigla-cial features in the surroundings of Lodz have been published

406 JOURNAL OF QUATERNARY SCIENCE
Figure 14 Estimates of the mean temperature of the warmest month during the 27–20 ka interval based on botanical (climate indicatorspecies method) and Coleoptera data (mutual climatic range method).
by Gozdzik (1973). Kolstrup (1987) described compositewedges and ice-wedge casts from Denmark. Although time-control on Late Pleniglacial proxies is scarce, dated ice-wedge casts have been reported from, for example, Vijveka-pelle, Belgium (Vandenberghe and Gullentops, 1977;Kolstrup, 1980), Somersham, England (West, 1993), Vester-baek, Denmark (Kolstrup and Mejdahl, 1986) and Belchatow,Poland (Krzyszkowski et al., 1993; Kasse et al., 1998, thisissue).
Key sites in the Dutch–Belgian loess area include Nagel-beek (Vreeken, 1984; Huijzer, 1993), Maastricht-Belvedere(Vandenberghe et al., 1985), Kesselt (Haesaerts et al., 1981;Vandenberghe et al., 1998, this issue), Harmignies (Haesaertsand Van Vliet-Lanoe, 1981), and a number of other sites(Paepe and Vanhoorne, 1967; Paepe, 1969). In the northernFrance loess area we mention sections described by Lautri-dou and Somme (1981), Lautridou (1985) and Antoine(1990). Several sites with ice-wedge casts in loess depositshave been described from the area around Lohne, Germany(Rohdenburg, 1967; Rohdenburg and Meyer, 1979).
Mutual climatic range reconstructions based on radio-carbon-dated Coleoptera faunas have been reported from sixsites, i.e. Baston Fen (Coope, unpublished), Bełchatow (Kasseet al., 1998, this issue), Konin-Maliniec (Tobolski, 1984;Coope, unpublished), Lea Valley (Coope and Tallon, 1983;Coope, unpublished), Salzgitter-Lebenstedt (Coope,unpublished) and Thrapston (Coope, unpublished). Animportant site at Bossuyt, Belgium, has yielded a coleopteranassemblage that includes a number of obligate cold adaptedspecies that are characteristic of the Arctic tundra at thepresent day (Gullentops and Coope, unpublished). Inaddition, detailed botanical records have been describedfrom, for example, Vijvekapelle (Vandenberghe and Gullen-tops, 1977; Kolstrup, 1980) and Mannheim-Wallstadt(Loscher et al., 1980, 1983).
Finally, a glaciological record from Village Bay, Hirta,Outer Hebrides is reported by Sutherland et al. (1984).
1998 John Wiley & Sons, Ltd. J. Quaternary Sci., Vol. 13(5) 391–417 (1998)
Thermal evidence
The minimum mean temperature of the warmest month, asderived from botanical climate indicator species, wasbetween 7°C and 10°C (Fig. 14). It is noted that thesetemperatures are based on the presence of only one or twoclimate indicator species in pollen assemblage zones (n = 9).Furthermore, it seems that the minimum mean temperatureof the warmest month dropped from ca. 10°C to 7°Cbetween 27 and 25 ka. Comparable coleopteran data fromEngland, Germany and Poland show that the mean tempera-tures of the warmest month lay between 9°C and 11°C.The presence of exclusively high-arctic beetle species andsensitivity tests on the MCR method (Walkling and Coope,1996) strongly suggest that the actual figure lay at the lowerend of this range. Whereas the botanical data suggest aslight summer cooling during this interval with respect tothe previous time window, the Coleoptera data (n = 7) donot show any evidence for such a temperature decrease.Based on a glaciological record from Village Bay, St Kilda,Outer Hebrides the temperature of the warmest month isestimated at 4°C (Sutherland et al., 1984). An integration ofColeoptera and botanical evidence suggests that the meantemperature of the warmest month was approximatelyaround 8°C in northwestern Europe. To the north, the meantemperature of the warmest month significantly dropped to4°C and a north to south gradient is obvious.
The mean annual temperature inferred from periglacialevidence (n = 102) ranges from about # −8°C to # −4°Cover the study region (Fig. 15). Mean annual temperaturesinferred from sites with Coleoptera data (n = 7) suggest asimilar range, i.e. −8°C to −4°C. A visual inspection of Fig.15 suggests a north to south thermal gradient along thenorthwest European lowland during the 27–20 ka interval.These climate values reflect the presence of ice-wedge castsas a function of substrate lithology. Ice-wedge casts incoarse-grained substrates (gravels and sands) and fine-grained

407WEICHSELIAN PLENIGLACIAL CLIMATE IN EUROPE
Figure 15 Estimates of the mean annual temperature during the 27–20 ka interval based on periglacial and Coleoptera data (mutualclimatic range method).
substrates (loess-derived silt loam) indicate a mean annualtemperature of # −8°C and # −4°C respectively (cf. Table2). As far as ice-wedge casts from this Late Pleniglacialsubstage have been identified in northern France, their pres-ence is associated exclusively with loess-derived silt loams(Lautridou and Somme, 1981; Lautridou, 1985; Antoine,1990), indicating a mean annual air temperature of # −4°C.More to the north, ice-wedge casts have been identifiedboth in coarse-grained sandy substrates and fine-graineddeposits. Therefore, the mean annual air temperatures wereunder ca. −8°C in The Netherlands, Belgium, England, Ger-many and Poland. As a consequence, the −4°C isotherm ofthe mean annual air temperature was situated near theFrench–Belgian border during this interval. In other words,periglacial data provide evidence for a transition from con-tinuous permafrost (The Netherlands, Belgium, England, Ger-many, Poland) to discontinuous permafrost (northern France)during the maximum cold of the Late Pleniglacial substage(e.g. Williams, 1975; Vandenberghe and Pissart, 1993).According to Kaiser (1960), Maarleveld (1976) and Velichko(1982) the southern boundary of permafrost occurred insouthern France. The derived thermal conditions are compa-rable to those in the Early Pleniglacial.
The mean temperature of the coldest month is based onthe presence of ice-wedge casts, which indicate valuesbelow −20°C. Coleoptera evidence points to a mean tem-perature of the coldest month between about −25°C and−18°C (Fig. 16). A combination of both kinds of climatedata suggests a mean temperature of the coldest monthbetween −25°C and −20°C. As a consequence, the annualamplitude ranges from 28°C to 33°C and indicates a highdegree of continentality at that time.
The temperature of the coldest month may also becalculated from the minimum mean temperature of thewarmest month and the maximum mean annual temperature.Radiocarbon-dated botanical and periglacial evidence at thesame spot is available from Vijvekapelle, Belgium(Vandenberghe and Gullentops, 1977; Kolstrup, 1980),where the mean temperature of the warmest month is esti-
1998 John Wiley & Sons, Ltd. J. Quaternary Sci., Vol. 13(5) 391–417 (1998)
mated at $ 7°C and the maximum mean annual temperatureapproximates −8°C around 24 ka, so the mean temperatureof the coldest month may be estimated at # −23°C.
From this climate reconstruction it is evident that the northto south thermal gradient over northwestern Europe wasmuch stronger than the present-day gradient. It is seenespecially in the mean annual and winter temperatures andis less pronounced in the mean summer temperature.
Mammalian evidence is in keeping with cold conditionsprevailing during the 27–20 ka interval. Radiocarbon-datedfragments of Mammuthus primigenius (woolly mammoth),Rangifer tarandus (reindeer), Dicrostonyx torquatus (collaredlemming) and Lemmus lemmus (Norwegian lemming) havebeen reported from a number of sites in Scotland (Lawson,1984; Murray et al., 1993) and Denmark (Aaris-Sørensenet al., 1990; Bennike et al., 1994). These faunal remainsprovide additional evidence for cold conditions, althoughthis type of fauna is not related exclusively to this interval.The presence of lemmings is particularly significant becausethey require snow cover during the winter, under whichthey construct their burrows and winter nests.
Wind evidence
There is ample evidence for aeolian activity during thisinterval in the northwestern European lowland. Loess-derivedsilt loams (i.e. Middle Silt Loam III) have been identified inthe southern Netherlands, Belgium, northern France andEngland (Catt, 1977; Haesaerts and Van Vliet-Lanoe, 1981;Vreeken, 1984; Lautridou, 1985; Vandenberghe et al., 1985;Wintle, 1987; Huijzer, 1993).
Similarly, aeolian sands accumulated at a large numberof sites in northwestern Europe. The major characteristicscomprise an alternating bedding of fine sand and very finesand to loamy layers, and a thickness up to several metres.Generally there is evidence for reworking by running water(e.g. small-scale cross-bedding). The stratigraphical positionof these fluvio-aeolian sands is under the Beuningen Gravel

408 JOURNAL OF QUATERNARY SCIENCE
Figure 16 Estimates of the mean temperature of the coldest month during the 27–20 ka interval based on periglacial and Coleoptera data(mutual climatic range method).
Bed or its stratigraphic equivalent in Denmark, i.e. theFrøslev Gravel (Kolstrup, 1983). Although aeolian depositionduring this period was omnipresent, the reconstruction offormer wind directions is hardly feasible as the aeolian sandsare commonly reworked.
The widespread aeolian accumulation of loess and sandsuggests some arid conditions, although there was sufficientwater available for reworking of the aeolian deposits. Inaddition, the transition from a sand belt in the north(Denmark, The Netherlands, Belgium, northern Germany) toloess deposits in the south (southern Belgium, southern partof The Netherlands, northern France) suggests an along-tracksize-sorting and wind directions from the northern quadrant.
Precipitation evidence
An important phase of fluvial incision took place at thetransition from the Middle to the Late Pleniglacial substage,as recorded in many catchments in western and centralEurope (references in Mol, 1997b). In addition, at somelocations there is evidence that the subsequent aggradationof the river changed from an anastomosing into a braidedsystem, e.g. in the Reusel and Dinkel rivers (Van Huisstedenet al., 1986a, b). In general, these river pattern changesaround 27 ka are linked to increased peak discharges and arelatively high supply of sediments into the river valley.Towards the end of the 27–20 ka interval a clear trend isvisible towards increased aeolian activity.
From these morphological and sedimentary lines of evi-dence a relatively high annual precipitation rate may bededuced for the beginning of this time interval. The highpeak discharges probably reflect the thawing of the snowaccumulated during winter. Gradually conditions becamedrier towards the end of the time-slice concerned.
1998 John Wiley & Sons, Ltd. J. Quaternary Sci., Vol. 13(5) 391–417 (1998)
The final phase of the Late Pleniglacial:time-window 20–13 ka (part of OxygenIsotope Stage 2)
Introduction
As with the previous time window, radiocarbon dates aredifficult to obtain from this period due to general low bio-logical activity. Correlations using litho- and/or cryostrati-graphical criteria enable climate reconstructions of thissecond part of the Weichselian Late Pleniglacial substage tobe made. This period after the LGM is characterised by arapidly decaying ice-sheet which progressively retreated tothe north. The retreat of the ice sheet took place in anumber of subphases. The exact positions of the variousphases are well-known in, for example, Poland (Kozarski,1988, 1992) and Germany (Eissmann, 1986), but it is alsoa very complex period because of the rapid spatial andtemporal climatic changes. Therefore, the climate reconstruc-tion gives a general impression of the temporal evolutionduring that time window rather than an exact picture at aspecific moment.
The study area may be subdivided in two major sedimen-tary environments. The area within the maximum extent ofthe Late Weichselian ice sheet is characterised by freshlydeposited glacial outwash gravels and sands. They wereaccumulated directly on top of the LGM tills. When the icesheet retreated after 20 ka, permafrost conditions were re-established in these areas, which resulted in the formationof ice and sand wedges (Kozarski, 1993; Bose, 1992). Thenon-glaciated area is typified by increasing aridity with aeol-ian accumulation of sands and silts. The two subenviron-ments that were distinguished in the first part of the LatePleniglacial, i.e. the coversand and loess district, were stillpresent in the second part of the Late Pleniglacial andextended over the regions (aeolian sands in The Netherlands,

409WEICHSELIAN PLENIGLACIAL CLIMATE IN EUROPE
Belgium, northern Germany, Poland and Denmark; loessesin northern France, England, the southern Netherlands,Belgium, Germany, southern Poland).
Thermoluminescence dating of the basal part of the UpperSilt Loam gives ages of 17.2 ± 3.5 ka and 17.5 ± 3.4 ka atMaastricht-Belvedere (Debenham, 1993) and 19.1 ± 1.7 kaat Kesselt, Belgium (Van den Haute et al., 1998, this issue).In addition, the latter authors obtained ages of 17–22 ka forthe overlying Upper Silt Loam, whereas Wintle et al. (1984)reported TL dates between 16.4 ± 1.4 ka and 12.6 ± 1.3 kafor the accumulation of the Upper Silt Loam series at Saint-Romain, Normandy, France. Southgate (1984) and Brau-kamper (1990) reported TL dates of 16.4 ± 1.5 ka and15 ± 1.4 ka for aeolian silt accumulations in England andGermany respectively. The humic material at the base ofthe Upper Silt Loam (Nagelbeek Horizon) was radiocarbondated at 22.2 ± 380 ka by Gullentops (1981). It may beconcluded that although not all dates are in conformity, thedeposition of the primary loess started at ca. 20 ka.
An estimated sea-level stand of ca. −120 m at the onsetof this interval may be inferred from the data of Fairbridge(1989), while the sea level slowly raised to approximately−105 m around 14 ka. By contrast, a significant sea-levelrise took place around ca. 12 to 13 ka (Fairbridge, 1989) atthe onset of the Weichselian Lateglacial.
Key sites
Botanical evidence is highly restricted in the 20–13 ka inter-val and only two sites have been published, namely Beerse-Dam (Haest et al., 1986) and Beetley (West, 1991). Importantsites with radiocarbon-dated Coleoptera faunas have beendescribed from the UK, for example, at Barnwell Station,Cambridge (Coope, 1968b), Dimlington (Penny et al., 1969;Rose, 1985), Glanllynnau (Coope and Brophy, 1972) andColnbrook, West London (Coope, 1982). At Ramsel, Belgiuma coleopteran assemblage with many obligate cold adaptedspecies has a radiocarbon date of 17 000 yr BP (Gullentopsand Coope, unpublished).
In contrast to the sparse biological data, periglacial evi-dence (apart from aeolian deposits) is available at a largenumber of localities in Wales (John, 1973; Saunders, 1973),England (Morgan, 1973b; West, 1993), Scotland (Greig,1981; Gemmel and Ralston, 1984; Maizels, 1986), Ireland(Lewis, 1977, 1979), Belgium (numerous sites referred to inVandenberghe (1977) and Huijzer (1993)), France (Helluinet al., 1977; Lautridou, 1985), The Netherlands (Van derHammen and Wijmstra, 1971; Maarleveld, 1976; Kolstrup,1980; Vandenberghe and Krook, 1981; Van Huissteden,1990), Denmark (Kolstrup and Mejdahl, 1986), Germany(Rohdenburg and Meyer, 1979; Glatthaar and Liedtke, 1986;Bose, 1992) and Poland (Kozarski, 1974, 1993; Gozdzik,1986).
Thermal evidence
Based on the sparse palaeobotanical data, the minimummean temperature of the warmest month may be estimatedat approximately $ 7°C to $ 10°C (n = 2). Comparable MCRestimates of the mean temperatures of the warmest month,deduced from Coleoptera data in the UK and Belgium, arebetween 8°C and 11°C (n = 4; Fig. 17).
A detailed reconstruction of the maximum mean annualtemperature is obtained from periglacial evidence (n = 64)and specific periglacial zones may be interpreted and delin-
1998 John Wiley & Sons, Ltd. J. Quaternary Sci., Vol. 13(5) 391–417 (1998)
eated (Fig. 18). A north to south thermal gradient along thenorthwest European lowland is obvious. However, becauseof the quickly changing climatic conditions a distinction hasto be made between the early and later phases of the 20–13 ka time window.
During the earlier part of the 20–13 ka time window (20to ca. 16 ka) conditions were still rigorous with indicationsfor permafrost quite far south. A small-scale ice-wedge casthas been identified in the basal part of the Upper Silt Loamin northern France (‘Niveau de Saint-Romain’, Helluin et al.(1977) and Lautridou (1985); ‘Erbenheim-5’, Huijzer (1993)).Also, thin thermal contraction cracks associated with the‘Niveau de Goderville’ palaeosol have been recognised byLautridou (1985). The age of this basal part of the Upper SiltLoam is ca. 17–20 ka (see above). The infrequent presence ofice-wedge casts implies that only under the most favourableenvironmental conditions was permafrost developed innorthern France.
In The Netherlands and Belgium, ice-wedge casts havebeen identified in equivalent loess deposits on severaloccasions indicating a mean annual temperature lower than−4°C. In that region no ice-wedge casts have been identifiedin coarse-grained sandy substrates, but well-developed frostcracks have been found associated with the Beuningen Gra-vel Bed (Vandenberghe and Pissart, 1993). Thus the meanannual air temperature is estimated to be lower than −4°Cbut above −8°C in The Netherlands, Belgium and adjacentareas.
In Ireland, the UK, Germany, Denmark and Poland ice-wedge casts have been identified in coarse-grained gravellyto sandy outwash deposits and fine-grained tills, indicatingmean annual temperatures below −8°C (Fig. 18). When theice sheet retreated, permafrost conditions were subsequentlyimposed close to its margin, which resulted in the formationof ice and sand wedges. Gozdzik (1986) was able to identifya gradual decrease in the size of ice-wedge casts in the tilldeposits of the readvance phases in a northern directionalong the Polish lowland. This may be interpreted as theexpression of a gradual climatic warming.
In summary, it is evident that during the first phase ofwarming after the LGM the southern boundary of the con-tinuous permafrost zone was marginal to the decayingWeichselian ice sheet. A zone of discontinuous permafrostextended from northern France towards northern Germany.
During the later part of the 20–13 ka time window (ca.16–13 ka) only frost fissures and small cryoturbations havebeen found in Belgium, The Netherlands and Germany(Vandenberghe, 1985), even in the silty subsoils. This meansthat the region was situated in the zone of deep seasonalfrost. However, a deeper seated relic permafrost might havebeen present (De Gans, 1981; Kasse and Bohncke, 1992). Inthe freshly deglaciated terrains in Poland ice-wedge polygonsformed (Kozarski, 1993) and probably the same happenedin Ireland, Scotland and Wales. Consequently, the zones ofcontinuous and discontinuous permafrost would have beenvery narrow.
The mean annual air temperatures in the unglaciated UKand Belgium inferred from Coleoptera evidence (n = 4) havea wide range from −9°C to 1°C for the whole time-window,which is in line with the periglacial evidence (Fig. 18).
The mean temperature of the coldest month is estimatedfrom combined evidence of periglacial and Coleoptera rec-ords and the annual temperature amplitude. The Coleopteradata point to a mean temperature of the coldest monthbetween about −26°C and −9°C (Fig. 19). In the coldestzones and periods (northernmost areas with permafrost) theice-wedge casts point to temperatures below −20°C, while

410 JOURNAL OF QUATERNARY SCIENCE
Figure 17 Estimates of the mean temperature of the warmest month during the 20–13 ka interval based on botanical (climate indicatorspecies method) and Coleoptera data (mutual climatic range method). The full line represents the ice limits of the ‘Pommeren Stage’ (ca.15 200 ka) after Liedtke (1975), Kozarski (1988) and Houmark-Nielsen (1989), the dashed line represents the maximum extent of the ice atthe LGM.
Figure 18 Estimates of the mean annual temperature during the 20–13 ka interval based on periglacial and Coleoptera data (mutualclimatic range method).
the annual temperature amplitude suggests a temperaturebelow −21°C (summer temperature 7°C and mean annualtemperature below −8°C). It follows that the mean tempera-ture of the coldest month was between −21°C and −26°C.In the zones and periods with discontinuous permafrost theannual temperature amplitude suggests a temperature below−16°C (summer temperature of 8°C and mean annual tem-perature below −4°C). In the zones and periods with deepseasonal frost combined evidence from the Coleoptera and
1998 John Wiley & Sons, Ltd. J. Quaternary Sci., Vol. 13(5) 391–417 (1998)
the annual temperature amplitude suggests a winter tempera-ture of less than −10°C (summer temperature at least 8°Cand a mean annual temperature below −1°C).
Owing to the approximately constant summer tempera-tures and the increasing winter temperatures the annualtemperature amplitude, and thus the degree of continentality,was gradually decreasing during the 20–13 ka time windowin northwestern Europe. This view is supported by the almosttotal absence of the exclusively eastern Asiatic species of

411WEICHSELIAN PLENIGLACIAL CLIMATE IN EUROPE
Figure 19 Estimates of the mean temperature of the coldest month during the 20–13 ka interval based on periglacial and Coleoptera data(mutual climatic range method).
Coleoptera that were so conspicuous in the earlier Plenigla-cial assemblages (see Coope, 1987). Similarly, the strongnorth to south thermal gradient over northwestern Europewas gradually declining.
Mammalian evidence supports the interpretation of coldconditions prevailing during the 20–13 ka interval as sug-gested by periglacial data. A radiocarbon-dated bone frag-ment of Mammuthus primigenius (woolly mammoth) hasbeen reported from the Cae Gwyn Cave in northern Wales(Rowlands, 1971).
Wind evidence
There is solid evidence for ample aeolian activity all overnorthwestern Europe during the concerned time interval.Two major areas with aeolian deposition are distinguished,namely the loess (Upper Silt Loam) and the coversand district(fine-grained aeolian sands).
Upper Silt Loams as well as aeolian sands have beenidentified at many sites. The loess deposits may reach upto 6 m (Vandenberghe et al., 1985). The major characteristicsof the aeolian sands (coversands) comprise an alternatingbedding of fine sand and very fine sand to silty layers, athickness up to ca. 1 m and, generally, no evidence forreworking by running water. These aeolian sands have alithostratigraphical position on top of the Beuningen GravelBed or the Frøslev Gravel. The Beuningen Gravel Bed atthe base of the aeolian sand sheets is a deflation horizon,pointing to strong wind action and aridity. This aeolian sandsupply is also evidenced by the presence of fossil sandwedges in Weichselian/Devensian till deposits (Worsley,1966; Gozdzik, 1986; Kolstrup and Mejdahl, 1986; Bose,1992; Kozarski, 1993; Kasse et al., 1998, this issue), whilethermal seasonal frost cracks with primary infilling formedat the level of the Beuningen Gravel Bed and in the basalpart of the aeolian sand sheets.
Although aeolian deposition during this Late Pleniglacialphase was omnipresent, the reconstruction of former wind
1998 John Wiley & Sons, Ltd. J. Quaternary Sci., Vol. 13(5) 391–417 (1998)
directions is hardly feasible from the geomorphology orsedimentary structures because the coversands are com-monly accumulated in sand sheets. The transition from sandsheets in the north (Denmark, The Netherlands, Belgium,northern Germany) to loess deposits in the south (southernBelgium, southern part of The Netherlands, northern France)suggests an along-track size-sorting and wind directions fromthe northern quadrant. Easterly wind directions areinterpreted from ventifacts in southern Scandinavia at thePleniglacial-Lateglacial transition (Svensson, 1992).
Precipitation evidence
In general, the widespread aeolian accumulation, includingaeolian sands, loess and deflation lag concentrates, impliesa high degree of aridity with low precipitation rates innorthwestern Europe (Kasse, 1997). In addition, the fluvialactivity is considered to be confined to the valleys, whereaccumulation is controlled by braided river systems withhigh peak discharges and a significant input of aeoliansediments. In comparison with the preceding Late Plenigla-cial interval (27–20 ka), fluvial activity gradually faded awayand aeolian processes became most important both on theinterfluves and on the valley floors. Consequently, precipi-tation during this interval is considered to be very low. Thismight also be a reason for the rapid retreat of the Fennos-candian ice sheet since the LGM.
Comparison of climate reconstructionsfrom different time-windows
Based on a detailed reconstruction of the climate conditionsduring six time-windows, the climatic evolution during theWeichselian Pleniglacial may be evaluated. In general, the

412 JOURNAL OF QUATERNARY SCIENCE
thermal regime during each time-window has been recon-structed in quantitative terms. By contrast, the wind actionand wind direction as well as precipitation rates are difficultto reconstruct and consequently expressed in qualitativeterms. In addition, climate gradients, either in a north tosouth or a west to east direction, have been identified.
North to south climatic gradients were clearly establishedduring the coldest parts of the Weichselian Pleniglacial,i.e. the Early Pleniglacial (74–59 ka), the Weichselian LatePleniglacial (27–13 ka), and less well expressed, the coldinterval at 41–38 ka (Hasselo Stadial). Although the amountof data is small, a slight west to east climate gradient in themean winter and mean annual temperatures appears duringthe relatively less cold interval at 50–41 ka (Table 3).
The climate conditions of the northwestern and centralEuropean continent were influenced by three principal fac-tors: the Fennoscandian ice sheet, the North Atlantic surfacewater (circulation) and the conditions on the continent.Although the precise impact of each factor is difficult toquantify, the relative contribution of each factor to theclimate conditions over northwestern Europe during theWeichselian Pleniglacial can be evaluated. Firstly, duringthe coldest periods, the build-up of the Fennoscandian icesheet affected the climate conditions in northwestern andcentral Europe predominantly. Strong climatic gradients werein place in a north to south direction. The North Atlanticsurface water played a relatively insignificant role becausethe major part of the North Sea Basin and the adjacentAtlantic ocean were frozen during these periods. As a conse-quence, the influence of the relatively warm Atlantic oceansurface water did not reach northwestern and central Europeand a continental climate with a high annual temperatureamplitude was established throughout the area. Climaticconditions on the continent were affected mainly by thecharacteristics of the Fennoscandian ice sheet, such as itsmaximum extent and its thickness, and by the North Atlanticsea-ice limit.
Secondly, during the relatively warmer interludes of theMiddle Pleniglacial, the impact of the Scandinavian ice sheeton the climate in northwestern Europe was reduced. Theconsiderably weakened north–south climatic gradient wasprobably superposed by a west to east gradient, whichsuggests that the North Atlantic surface water played animportant role in determining the climate conditions on thenearby continent, more specifically by reducing the annualtemperature amplitude. During these periods the sea-iceboundary occurred more to the north than during the coldestperiods so that the climate conditions on the continent couldbe influenced by the changing positions of the North Atlanticwater circulation.
In general, the Weichselian Pleniglacial climate seems tohave oscillated between two extremes. The most severe coldclimates were apparently associated with a Fennoscandianice sheet extending far to the south in combination with acold North Atlantic ocean. During these periods precipitationdeclined moderately to strongly, probably due to the south-ward deflection of the prevailing depression tracks. In lesscold periods and warm spikes the influence of the Fenno-scandian ice sheet was overridden by the influence of rela-tively warm Atlantic surface waters, leading to especiallyhigher winter temperatures and higher precipitation. Someof these short but intense episodes of climatic warmingprobably reflect the sudden northward excursions of temper-ate water up the western coast of Europe documented byRuddiman and McIntyre (1987).
1998 John Wiley & Sons, Ltd. J. Quaternary Sci., Vol. 13(5) 391–417 (1998)
Conclusions
Application of the multiproxy method has enabled compre-hensive reconstructions of the Weichselian Pleniglacialpalaeoclimate in six characteristic time-windows. Standard-ised translations are used to transform proxy data into climateparameter values. The most adequate proxy records in thepresent reconstruction include periglacial, aeolian, glacial,fluvial, Coleoptera and botanical evidence. Detailed descrip-tions of the records and their related climate information,as well as site information and time-control are stored in aclimate data base. This ‘Multiproxy data base (MPDB)’ con-tains 720 Pleniglacial climate records from 268 sites inthe lowland of northwest and central Europe. Quantitativereconstructions of the temperature regime are derived fromperiglacial, Coleoptera and botanical evidence, whereasaeolian and fluvial evidence provide qualitative informationon wind activity and precipitation respectively.
The Early Pleniglacial (74–59 ka) is characterised by astrong north to south climatic gradient over northwesternEurope. Discontinuous permafrost was established innorthern France, whereas the continuous permafrost zoneextended from the UK, Belgium, The Netherlands and Polandin a northern direction towards the ice-sheet margin insouthern Denmark and northern Germany.
In addition to the weakened north–south climate gradient,a west to east gradient in northwest and central Europe maybe suggested for the interval from 50 to 41 ka. Seasonallyfrozen ground conditions prevailed in northwestern Europe,whereas discontinuous permafrost may be suggested for cen-tral Germany. Thermal spikes such as those demonstratedin the Greenland ice-core record are only occasionallydetected by biotic indicators (i.e. Coleoptera during theUpton Warren Interstadial, and pollen during the RielInterstadial). In contrast to the ice core data the palaeontolog-ical data can be expressed quantitatively in climatic terms.Some of these short-term climatic oscillations may better bereflected by sedimentological proxies (Vandenberghe et al.,1998b, this issue).
During the cold period between 41 and 38 ka a north tosouth climate gradient became re-established in northwesternand central Europe. The thermal conditions may have beenslightly warmer than during the Early and Late Pleniglacialsubstages, although the north to south climatic gradient wascomparable. Discontinuous permafrost conditions dominatedThe Netherlands and Belgium, whereas seasonally frozenground prevailed in northern France. To the north, continu-ous permafrost was established in Denmark, close to theice-sheet margin of that time. Prominent wind activity anda relatively low precipitation rate typify this interval.
During the 36–32 ka interval slightly warmer conditionsoccurred in northwestern and central Europe than duringthe 41–38 ka period, although this interval was slightly col-der than the period between 50 and 41 ka. Sporadic todiscontinuous permafrost may be reconstructed for TheNetherlands during the cold spikes of this interval and prob-ably alternated with less cold phases without permafrost.
The Late Pleniglacial (27–13 ka) is again characterised bya north to south climate gradient in northwestern Europe.During the first part of that interval discontinuous permafrostwas established in northern France, whereas the continuouspermafrost zone extended from the UK, Belgium, TheNetherlands, Germany and Poland into a northern directiontowards the ice sheet of the Last Glacial Maximum. Theclimate conditions were comparable to the Early Pleniglacialstage, although the discontinuous permafrost zone may have

413WEICHSELIAN PLENIGLACIAL CLIMATE IN EUROPE
extended slightly more to the south. During the later partof the Late Pleniglacial (20–13 ka) discontinuous permafrostconditions dominated The Netherlands and Belgium,whereas sporadic permafrost prevailed in northern France.To the north, i.e. in regions where the Weichselian/ Deven-sian ice sheet retreated, continuous permafrost conditionsprevailed. During this interval a high degree of aridity domi-nated with very low precipitation.
The climatic conditions in northwest and central Europewere controlled by three major variables: the extent of theFennoscandian ice sheet, and the influences of the NorthAtlantic ocean and the continent. Although the preciseimpact of each factor is difficult to evaluate, it could beestablished that their relative contribution to the climateconditions in Europe evidently differed substantially in thecourse of the Weichselian Pleniglacial. Finally, the climatereconstruction of the Weichselian Pleniglacial time-windowsmay serve as a means to evaluate the results of GCMsimulations with respect to northwestern and central Europe.
Acknowledgements Sincere thanks go to Professor G. R. Coope forhis energetic and swift co-operation and dedicated attitude whichhas been most stimulating, and especially for his numerous sugges-tions for improvement of this text. We thank also Professor J. Rosefor providing (literature) data and demonstrating various key sites ofthe British Devensian stratigraphy, Professor Dr L. Eissmann whokindly shared his knowledge and data of the area around Leipzig,Professor Dr K.-E. Behre for attracting our attention to relevant sitesin Germany, Professor Dr W. H. Zagwijn for discussing botanicaldata and the potential of the climate indicator species method, DrK. Kasse and Dr S. Bohncke for their critical comments and fruitfuldiscussions during EPECC workshops, Dr S. Bohncke for his detailedbotanical analyses of samples from Belchatow, Dr D. Krzyszkowskiand Dr J. Gozdzik for their kind introduction to the Belchatow siteand their stimulating discussions on stratigraphy and periglacialphenomena, and for showing several key sites of the Late Quaternarystratigraphy in central Poland, and Dr J. Mol for showing the keysites of the German stratigraphy. Dr H. Witte and Drs G. Aalbersbergare thanked for their kind co-operation during the EPECC project.Dr S. G. Aalbersberg is thanked for his discussions on botanicaldata and his help with the MPDB. Finally, we are grateful to Dr R.Isarin for his fruitful discussions on handling of proxy records andthe interpretation of data, and Mr. R. Kruk for his help in reproducingthe palaeo-temperature maps.
References
AARIS-SØRENSEN, K., PETERSEN, K. S. and TAUBER, H. 1990.Danish finds of Mammoth (Mammuthus primigenius(Blumenbach)). Stratigraphical position, dating and evidence ofLate Pleistocene environment. Danmarks GeologiskeUndersøgelse, Series B, 14, 3–44.
ANTOINE, P. 1990. Chronostratigraphie et environment du Paleoli-thique du bassin de la Somme. Publications du CERP no. 2.Centre d’Etudes et de Recherches Prehistorique Universite desSciences et Techniques de Lille Flandres-Artois, 233 pp.
ATKINSON, T., BRIFFA, K. and COOPE, G. R. 1987. Seasonaltemperatures during the past 22,000 years in Britain, reconstructedusing beetle remains. Nature, 325, 587–591.
BEHRE, K.-E. 1989. Biostratigraphy of the last glacial period inEurope. Quaternary Science Reviews, 8, 25–44.
BENNIKE, O., HOUMARK-NIELSEN, M., BORCHER, J. and HEIB-ERG, E. O. 1994. A multi-disciplinary macrofossil study of MiddleWeichselian sediments at Kobbelgård, Møn, Denmark. Palaeo-geography, Palaeoclimatology, Palaeoecology, 111, 1–15.
BLOOM, A. L. and YONEKURA, N. 1985. Coastal terraces generatedby sea-level change and tectonic uplift. IN: Woldenberg, M. J.
1998 John Wiley & Sons, Ltd. J. Quaternary Sci., Vol. 13(5) 391–417 (1998)
(ed), Models in Geomorphology, 139–154. Allen and Unwin Inc.,Winchester, MA.
BLOOM, A. L., BROECKER, W. S., CHAPPELL, J. M. A., MATTHEWS,R. K., MESOLELLA, K. J. 1974. Quaternary sea level fluctuationson a tectonic coast: New 230Th/234U dates from the Huon Penin-sula, New Guinea. Quaternary Research, 4, 185–205.
BOSE, M. 1992. Late Pleistocene sand wedge formation in thehinterland of the Brandenburg stade. Sveriges GeologiskaUndersokning, Series Ca, 81, 59–63.
BOWEN, D. Q., ROSE, J., McCABE, A. M. and SUTHERLAND, D. G.1986. Correlation of Quaternary glaciations in England, Ireland,Scotland and Wales. Quaternary Science Reviews, 5, 299–340.
BRAUKAMPER, K. 1990. Zur Verbreitung periglazialer Deck-schichten in Deutschland. Dissertation Fakultat fur Geowissensch-aften., Ruhr-Universitat, Bochum, 156 pp.
BRIGGS, D. J., COOPE, G. R. and GILBERTSON, D. D. 1985. TheChronology and Environmental Framework of Early Man in theUpper Thames valley. British Archaeological Reports, Vol. 137,Oxford.
BRINKKEMPER, O., VAN GEEL, B. and WIEGERS, J. 1987. Palaeo-ecological study of a Middle-Pleniglacial deposit from Tilligte,The Netherlands. Review of Palaeobotany and Palynology, 51,235–269.
BURLEIGH, R., AMBERS, J. and MATTHEWS, K. 1982. BritishMuseum natural radiocarbon measurements XV. Radiocarbon, 24,262–290.
CAPPERS, R., BOSCH, BOTTEMA, S., COOPE, G. R., VAN GEEL,B., MOOK-KAMPS, E. and WOLDRING, H. 1993. De recon-structie van het landschap. IN: van der Sanden, W. A. B., Cappers,W. T. J., Beuker, J. R. and Mol, D. (eds), Mens en Mammoet, 27–41. Drents Museum Assen.
CATT, J. 1977. Loess and coversands. IN: Shotton, F. W. (ed.)British Quaternary Studies, Recent Advances, 221–230. ClarendonPress, Oxford.
CHRISTIANSEN, H. H. and SVENSSON, H. 1998. Windpolishedboulders as indicators of a Late Weichselian wind regime inDenmark in relation to neighbouring areas. Permafrost and Peri-glacial Processes, 9, 1–21.
CONNELL, E. R. and HALL, A. M. 1987. The periglacial history ofBuchan, north east Scotland. In: Boardman, J. (ed), PeriglacialProcesses and Landforms in Britain and Ireland. 277–285, Cam-bridge University Press, Cambridge.
COOPE, G. R. 1962. A Pleistocene coleopterous fauna with arcticaffinities from Fladbury, Worcestershire. Quarterly Journal of theGeological Society, London, 118, 103–123.
COOPE, G. R. 1968a. An insect fauna from the mid-Weichseliandeposits at Brandon, Warwickshire. Philosophical Transactions ofthe Royal Society of London, Series B, 254, 425–456.
COOPE, G. R. 1968b. Coleoptera from the “Arctic Bed” at BarnwellStation, Cambridge. Geological Magazine, 105, 482–486.
COOPE, G. R. 1969. Insect remains from Mid-Weichselian depositsat Peelo, Netherlands. Mededelingen Rijks Geologische Dienst,20, 1–5.
COOPE, G. R. 1977. Fossil coleopteran assemblages as sensitiveindicators of climatic changes during the Devensian (Last) coldstage. Philosophical Transactions of the Royal Society, B, 280,313–340.
COOPE, G. R. 1982. Coleoptera from the two Late Devensian sitesin the Lower Colne Valley, West London, England. QuaternaryNewsletter, 38, 1–6.
COOPE, G. R. 1987. Fossil beetle assemblages as evidence forsudden and intense climatic changes in the British Isles duringthe last 45,000 years. IN: Berger, W. H. and Labeyrie, L. D. (eds),Abrupt Climatic Changes, 147–150. Reidel, Dordrecht.
COOPE, G. R. and ANGUS, R. B. 1975. An ecological study of atemperate interlude in the Middle of the last glaciation based onfossil Coleoptera from Isleworth, Middlesex. Journal of AnimalEcology, 44, 365–391.
COOPE, G. R. and BROPHY, J. A. 1972. Late Glacial environmentalchanges indicated by a coleopteran succession from North Wales.Boreas, 1, 97–142.
COOPE, G. R. and SANDS, C. H. S. 1966. Insect fauna from the

414 JOURNAL OF QUATERNARY SCIENCE
last glaciation from the Tame valley, Warwickshire. ProceedingsRoyal Society London, Series B, 165, 389–412.
COOPE, G. R., SHOTTON, F. W. and STRACHAN, I. 1961. A latePleistocene flora and fauna from Upton Warren, Worcestershire.Philosophical Transactions Royal Society, Series B, 244, 379–421.
COOPE, G. R., GIBBARD, P. L., HALL, A. R., PREECE, R. C.,ROBINSON, E. J. and SUTCLIFFE, A. J. 1997. Climatic andenvironmental reconstructions based on fossil assemblages fromMiddle Devensian (Weichselian) deposits of the River Thames atSouth Kensington, Central London, UK. Quaternary ScienceReviews, 16, 1163–1195.
DEBENHAM, N. C. 1993. A short note on thermoluminescencedating of sediments from the Palaeolithic site Maastricht-Belvedere. Mededelingen Rijks Geologische Dienst, 47, 45–46.
DE GANS, W. 1981. The Drentsche Aa valley system. PhD thesis,Vrije Universiteit, Amsterdam, 132 pp.
DE MOOR, G. 1975. De afzettingen van Dendermonde en haarbetekenis voor de jong-kwartaire evolutie van de Vlaamse Vallei.Natuurwetenschappelijk Tijdschrift, 56, 45–75.
DE MOOR, G. 1981. Periglacial deposits and sedimentary structuresin the Upper Pleistocene infilling of the Flemish Valley (N.W.Belgium). Biuletyn Periglacjalny, 28, 277–290.
DE MOOR, G., HEYSE, I. and DE GROOTE, V. 1978. An outcropof Eemian and Early Weichselian deposits at Beernem (N.W.Belgium). Bulletin Societe belge de Geologie, 87, 27–36.
DE MULDER, E. F. J. (undated). Geologisch onderzoek in debouwput te Den Helder. Intern Verslag Rijks Geologische Dienst,Vol. 1, Haarlem, 23 pp.
DRESSER, P. Q. and McAULAY, I. R. 1974. Dublin radiocarbondates II. Radiocarbon, 16, 6–9.
EHLERS, J. and WINGFIELD, R. 1991. The extension of the LateWeichselian/Late Devensian ice sheets in the North Sea Basin.Journal of Quaternary Science, 6, 313–326.
EISSMANN, L. 1986. Quartargeologie und Geschiebeforschung imLeipziger Land mit einigen Schlussfolgerungen zu Stratigraphieund Vereisungsablauf im Norddeutschen Tiefland. Altenburgernaturwissenschaftliche Forschungen, 3, 105–135.
FAIRBRIDGE, R. G. 1989. A 17,000-year glacio-eustatic sea levelrecord: influence of glacial melting rates on the Younger Dryasevent and deep-ocean circulation. Nature, 342, 637–642.
GAUNT, G. D., COOPE, G. R. and FRANKS, J. W. 1970. Quaternarydeposits at Oxbow opencast Coal Site in the Aire Valley, York-shire. Proceedings Yorkshire Geological Society, 38, 176–200.
GAUTIER, A. 1974. Fossiele vliegenmaden (Protophormia terraeno-vae Robineau-Desvoidy, 1830) in een schedel van de wolharigeneushoorn (Coelodonta antiquitatis) uit het Onder-Wurm teDendermonde (Oost-Vlaanderen, Belgie). NatuurwetenschappelijkTijdschrift, 56, 76–84.
GAUTIER, A. and SCHUMANN, H. 1973. Puparia of the subarcticor black blowfly Protophormia terraenovae (Robineau-Desvoidy,1830) in a skull of a late Eemian (?) bison at Zemst, Brabant(Belgium). Palaeogeography, Palaeoclimatology, Palaeoecology,14, 119–125.
GEMMEL, A. M. D. and RALSTON, I. B. M. 1984. Some recent dis-coveries of ice-wedge cast networks in north-east Scotland. Scott-ish Journal of Geology, 20, 115–118.
GIBBARD, P. L., COOPE, G. R., HALL, A. R., PREECE, R. C. andROBINSON, J. E. 1981. Middle Devensian deposits beneath the‘Upper Floodplain Terrace of the River Thames at Kempton Park,Sunbury, England. Proceedings Geologists Association, 93, 275–289.
GIRLING, M. A. 1974. Evidence from Lincolnshire of the age andintensity of the Mid-Devensian temperate episode. Nature, 250,270.
GIRLING, M. A. 1977. Tattershall Castle and Kirby-on-Bain. IN:Catt, J. A. (ed.), Guidebook for Excursion C7. Yorkshire and Lin-colnshire, 19–21. INQUA X Congress, United Kingdom, GeoAbstracts for International Union for Quaternary Research, Nor-wich.
GLATTHAAR, D. and LIEDTKE, H. 1986. Kaltzeitliche abluale Auf-schuttungen in der Dummerniederung. Neues Jahrbuch Geologieund Palaontologie Monatshefte, 1986–3, 157–164.
GOZDZIK, J. S. 1973. Geneza i propozycja stratygraficza struktur
1998 John Wiley & Sons, Ltd. J. Quaternary Sci., Vol. 13(5) 391–417 (1998)
peryglacjalnych w srodkowej Polsce. Acta GeographicaLodziensia, 31, 1–117.
GOZDZIK, J. S. 1986. Structures de fentes a remplissage primairesableux du Vistulien en Pologne et leur importance paleogeogra-phique. Biuletyn Periglacjalny, 31, 71–105.
GOZDZIK, J. S. 1990. Etudes des Fentes de Gel en Pologne Centrale.In: Role de la Morphogenese Periglaciaire sur le Plateau de Lodz.Colloque polono-français, Lodz 29.V.-2.V1. 38–75.
GREIG, D. C. 1981. Ice-wedge cast network in eastern Berwickshire.Scottish Journal Geology, 17, 119–122.
GUIOT, J., DE BEAULIEU, J. L., CHEDDADI, R., DAVID, F., PONEL,P. and REILLE, M. 1993. The climate in Western Europe duringthe last Glacial/Interglacial cycle derived from pollen and insectremains. Palaeogeography, Palaeoclimatology, Palaeoecology,103, 73–93.
GULLENTOPS, F. About climate of the last glaciation in NW–Europe. Symposium ‘Quaternary Climatic Variations’ UniversiteCatholique de Louvain, 5 p.
GULLENTOPS, F., PAULISSEN, E. and VANDENBERHE, J. 1981.Fossil periglacial phenomena in NE-Belgium (excursions in theKempen on 26 and 27 September 1978). Biuletyn Periglacjalny,28, 345–365.
HAESAERTS, P. 1985. Les loess du Pleistocene Superieur enBelgique; comparaisons avec les sequences d’Europe Centrale.Bulletin de l’Association Francaise pour l’Etude du Quaternaire,2/3, 105–115.
HAESAERTS, P. and VAN VLIET-LANOE, B. 1974. Compte rendude l’excursion du 25 mai 1974 consacree a la stratigraphie deslimons aux environs de Mons. Annales Societe Geologique deBelgique, 97, 547–560.
HAESAERTS, P. and VAN VLIET-LANOE, B. 1981. Phenomenesperiglaciares et sols fossiles observes a Maisieres-Canal, a Har-mignies et a Rocourt. Biuletyn Periglacjalny, 28, 291–324.
HAESAERTS, P., JUVIGNE, E., KUYL, O. S., MUCHER, H. J. andROEBROEKS, W. 1981. Compte rendu de l’excursion du juin 131981, en Hesbaye et au Limbourg neerlandais, consacree a lachronostratigraphie des loess du Pleistocene superieur. AnnalesSociete Geologique de Belgique, 104, 223–240.
HAEST, R., MUNAUT, A. V., HUYSMANS, L., GULLENTOPS, F.and MOOK, W. 1986. La stratigraphie de Beerse-Dam (Belgique).Bulletin de l’Association Francaise pour l’Etude du Quaternaire,1/2, 158–167.
HELLUIN, M., LAUTRIDOU, J.-P. and OZOUF, J. C. 1977. Loess etfentes de gel de la briqueterie de Glos pres de Lisieux (Calvados).Bulletin Societe Limnologique de Normandie, 105, 45–56.
HOEK, W. 1997. Atlas to Palaeogeography of Lateglacial veg-etations. PhD Thesis, Vrije Universiteit Amsterdam, 165 pp.
HOUMARK-NIELSEN, M. 1987. Pleistocene stratigraphy and glacialhistory of the central part of Denmark. Bulletin Geological Societyof Denmark, 36, 1–189.
HOUMARK-NIELSEN, M. 1989. The last interglacial/glacial cycle inDenmark. Quaternary International, 3/4, 31–39.
HUIJZER, A. S. 1993. Cryogenic microfabrics and macrostructures:interrelations, processes and paleoclimatic significance. PhD the-sis, Vrije Universiteit, Amsterdam, 245 pp.
HUIJZER, A. S. and ISARIN, R. 1997. The multi-proxy approach tothe reconstruction of past climates with an example of the Weich-selian Pleniglacial in northwestern and central Europe. QuaternaryScience Reviews, 16, 513–533.
ISARIN, R., RENSSEN, H. and KOSTER, E. 1997. Surface windclimate during the Younger Dryas in Europe as inferred fromaeolian records and model simulations. Palaeogeography, Palaeo-climatology, Palaeoecology, 134, 127–148.
ISARIN, R. and BOHNCKE, S. in press. Summer temperatures duringthe Younger Dryas in northwestern and central Europe inferredfrom climate indicator plant species. Quaternary Research, • •
JOHNSEN, S., CLAUSEN, H. and DANSGAARD, W. 1992. Irregularglacial interstadials recorded in a new Greenland ice core. Nature,359, 311–313.
JOHN, B. S. 1973. Vistulian periglacial phenomena in south-westWales. Biuletyn Periglacjalny, 22, 185–213.
JØRGENSEN, M. 1988. TL-dated Weichselian deflation surfaces

415WEICHSELIAN PLENIGLACIAL CLIMATE IN EUROPE
from northern Jutland, Denmark. Norsk Geografisk Tidsskrift, 42,225–229.
KAISER, K. 1960. Klimazeugen des periglazialen Dauerfrostbodensin Mittel- und West-Europa. Eiszeitalter und Gegenwart, 11,121–141.
KASSE, C. 1997. Cold-climate aeolian sand-sheet formation in north-western Europe (c. 14–12.4 ka): a response to permafrost degra-dation and increased aridity. Permafrost and Periglacial Processes,8, 295–311.
KASSE, C. and BOHNCKE, S. 1992. Weichselian Upper Pleniglacialaeolian and ice-cored morphology in the southern Netherlands(Noord-Brabant, Groote Peel). Permafrost and Periglacial Pro-cesses, 3, 327–342.
KASSE, C., BOHNCKE, S. and VANDENBERGHE, J. 1995. Fluvialperiglacial environments, climate and vegetation during theMiddle Pleniglacial with special reference to the Hengelo Inter-stadial. Mededelingen Rijks Geologische Dienst, 52, 387–414.
KASSE, C., HUIJZER, A. S., KRZYSZKOWSKI, D., BOHNCKE, S. J. P.and COOPE, G. R. 1998. Weichselian Late Pleniglacial and Late-glacial depositional environments, Coleoptera and periglacial cli-matic records from central Poland (Bełchatow). Journal of QuaternaryScience, 13, 455–469.
KOLSTRUP, E. 1980. Climate and stratigraphy in North-westernEurope between 30.000 B.P. and 13.000 B.P. with special refer-ence to the Netherlands. Mededelingen Rijks Geologische Dienst,32–15, 181–253.
KOLSTRUP, E. 1983. Cover sands in southern Jutland (Denmark).Proceedings Fourth International Conference on Permafrost, Fair-banks, Alaska, 639–644, National Academy Press, Washington,DC.
KOLSTRUP, E. 1987. Frost wedge casts in western Jutland and theirpossible implications for European periglacial research. Zeitschriftfur Geomorphologie, 31, 449–461.
KOLSTRUP, E. and MEJDAHL, V. 1986. Three frost wedge castsfrom Jutland (Denmark) and TL dating of their fill. Boreas, 15,311–321.
KOLSTRUP, E. and WIJMSTRA, T. A. 1977. A palynological investi-gation of the Moershoofd, Hengelo, and Denekamp Interstadialsin The Netherlands. Geologie en Mijnbouw, 56, 85–102.
KOZARSKI, S. 1974. Evidences of Late-Wurm permafrost occur-rences in North-West Poland. Quaestiones Geographicae, 1,65–86.
KOZARSKI, S. 1988. Time and dynamics of the last scandinavianice-sheet retreat from north-western Poland. Geographia Polonica,55, 91–101.
KOZARSKI, S. 1992. Lithostratigraphy of Upper Plenivistuliandeposits in the Great Polish Lowland within the area of thelast glaciation. Sveriges Geologiska Undersokning, Series Ca, 81,157–162.
KOZARSKI, S. 1993. Late Plenivistulian deglaciation and the expan-sion of the periglacial zone in NW Poland. Geologie enMijnbouw, 72, 143–157.
KRZYSZKOWSKI, D., BALWIERZ, Z. and PYSZYNSKI, W. 1993.Aspects of Weichselian Middle Pleniglacial stratigraphy and veg-etation in central Poland. Geologie en Mijnbouw, 72, 131–142.
KUTTEL, M., LOSCHER, M. and HOLZER, A. 1986. Ergebnissepalaobotanischer Untersuchungen zur Stratigraphie und Okologiedes Wurms im Oberrheingraben zwischen Karlsruhe undMannheim. Eiszeitalter und Gegenwart, 36, 75–88.
LAUTRIDOU, J. P. 1985. Le cycle periglaciaire Pleistocene enEurope du nord-ouest et plus particulierement en Normandie.These, Centre de Geomorphologie, Universite de Caen, 908 pp.
LAUTRIDOU, J. P. and SOMME, J. 1981. L’extension des niveaux-reperes periglaciaires a grandes fentes de gel de la stratigraphiedu Pleistocene recent dans la France du Nord-Ouest. BiuletynPeriglacjalny, 28, 179–185.
LAWSON, T. J. 1984. Reindeer in the Scottish Quaternary. Quatern-ary Newsletter, 42, 1–7.
LEWIS, C. A. 1977. Ice-wedge casts in north east County Wicklow.Scientific Proceedings Royal Dublin Society, 6A, 17–35.
LEWIS, C. A. 1979. Periglacial wedge-casts and patterned groundin the midlands of Ireland. Irish Geography, 12, 10–24.
LIEDTKE, H. 1975. Die nordischen Vereisungen in Mitteleuropa.
1998 John Wiley & Sons, Ltd. J. Quaternary Sci., Vol. 13(5) 391–417 (1998)
Erlauterungen zu einer farbigen Ubersichtskarte 1:100.000. For-schungen deutschen Landeskunde, 204, Bonn, Bad Godesberg,160 pp.
LONG, D., LABAN, C., STREIF, H., CAMERON, T. D. J. and SCHUT-TENHELM, R. T. E. 1988. The sedimentary record of climaticvariation in the southern North Sea. Philosophical TransactionsRoyal Society of London, Series B, 318, 523–537.
LOSCHER, M., BECKER, B., BRUNS, M., HIERONYMUS, U., MAUS-BACHER, R., MUNNICH, M., MUNZING, K. and SCHEDLER, J.1980. Neue Ergebnisse uber das Jungquartar im Neck-arschwemmfacher bei Heidelberg. Eiszeitalter und Gegenwart, 30,89–100.
LOSCHER, M., CORDES-HIERONYMUS, U. and SCHLOSS, S. 1983.Holozane und jungpleistozane Sedimente im Oberrheingraben beiHeidelberg. Geologisches Jahrbuch, Series A, 71, 61–72.
LOWE, J. J., AMMANN, B., BIRKS, H. H., BJORCK, S., COOPE,G. R., CWYNAR, L., DE BEAULIEU, J.-L., MOTT, R. J., PETEET,D. M. and WALKER, M. J. C. 1994. Climate changes in areasadjacent to the North Atlantic during the last glacial-interglacialtransition (14–9 ka BP): a contribution to IGCP-253. Journal ofQuaternary Science, 9, 185–198.
MAARLEVELD, G. C. 1960. Wind directions and cover sands in theNetherlands. Biuletyn Periglacjalny, 8, 49–58.
MAARLEVELD, G. C. 1976. Periglacial phenomena and the meanannual air temperature during the last glacial time in The Nether-lands. Biuletyn Periglacjalny, 26, 57–78.
MAARLEVELD, G. C. 1989. Note on the geocryological palaeocli-matic reconstruction of the time between 30,000 B.P. and 10,000B.P. in the central part of The Netherlands. Review Palaeobotanyand Palynology, 60, 122–126.
MADDY, D., LEWIS, S. G., SCAIFE, R. G., et al. 1998. The UpperPleistocene deposits at Cassington near Oxford. Journal of Quat-ernary Science, 13, 205–232.
MAIZELS, J. K. 1986. The frequency of relic frost-fissures structuresand prediction of polygon patterns: a quantitative approach. Biule-tyn Periglacjalny, 30, 67–89.
MANGERUD, J. 1991. The Scandinavian Ice Sheet through the lastinterglacial/glacial cycle. IN: Frenzel, B. (ed.), KlimageschichtlicheProbleme der letzten 130000 Jahre, 307–330. Fischer, Stuttgart.
MARTINSON, D. G., PISIAS, N. G., HAYS, J. D., IMBRIE, J.,MOORE, T. C. and SCHACKLETON, N. J. 1987. Age dating andthe orbital theory of the ice ages: development of a high-resolution0 to 300,000-year chronostratigraphy. Quaternary Research, 27,1–29.
McCABE, A. M. 1987. Quaternary deposits and glacial stratigraphyin Ireland. Quaternary Science Reviews, 6, 259–299.
MEYER, H. H. 1981. Zur klamstratigraphischen und morphogenet-ischen Ausertbarkeit von Flugdecksandprofilen im norddeutschenAltmoranengebiet — erlautert an Beispiele aus der Kellenberg-Endmorane. Bochumer Geographische Arbeiten, 40, 21–30.
MOL, J. 1997a. Fluvial response to Weichselian climate changes inthe Niederlausitz (Germany). Journal of Quaternary Science 12,43–60.
MOL, J. 1997b. Fluvial response to climate variations: the lastglaciation in eastern Germany. PhD thesis, Vrije Universiteit,Amsterdam, 100 pp.
MOL, J., VANDENBERGHE, J., KASSE, C. and STEL, H. 1993.Periglacial microjointing and faulting in Weichselian fluvio-aeolian deposits. Journal of Quaternary Science, 8, 15–30.
MORGAN, A. 1973a. Late Pleistocene environmental changes indi-cated by fossil insect faunas of the English Midlands. Boreas, 2,173–212.
MORGAN, A. 1973b. The Pleistocene geology of the area northand west of Wolverhampton, Staffordshire, England. PhilosophicalTransactions Royal Society London, Series B., 265, 233–297.
MUCHER, H. and DE PLOEY, J. 1984. Formation of afterflow siltloam deposits and structural modification due to drying underwarm conditions: an experimental and micromorphologicalapproach. Earth Surface Processes and Landforms, 9, 523–531.
MURRAY, N. A., BONSALL, C., SUTHERLAND, D. G., LAWSON,T. J. and KITCHENER, A. C. 1993. Further radiocarbon determi-nations on reindeer remains of Middle and Late Devensian age

416 JOURNAL OF QUATERNARY SCIENCE
from the Creag Nan Uamh Caves, Assynt, NW Scotland. Quatern-ary Newsletter, 70, 1–10.
ODGAARD, B. V. 1982. A Middle Weichselian moss assemblagefrom Hirtshals, Denmark, and some remarks on the environment47,000 B.P. Danmarks geologiske Undersøgelse, Årbog, 1981,5–45.
PAEPE, R. 1969. Les unites litho-stratigraphiques du PleistoceneSuperieur de la Belgique. IN: La Stratigraphie des loess d’Europe,45–51. Supplement Bulletin de l’Association Francaise pourl’Etude du Quarternaire, Paris.
PAEPE, R. and VANHOORNE, R. 1967. The stratigraphy and palaeo-botany of the Late Pleistocene in Belgium. Memoires ExplicatifsCartes Geologiques de la Belgique, 8, 96 pp.
PENNY, L. F., COOPE, G. R. and CATT, J. A. 1969. Age and insectfauna of the Dimlington silts, East Yorkshire. Nature, 224, 65–67.
PETERSEN, K. S. and KRONBORG, C. 1991. Late Pleistocene historyof the inland glaciation in Denmark. IN: Frenzel, B. (ed.), Klimage-schichtliche Probleme der letzten 130000 Jahre, 331–342. GustavFischer Verlag, Stuttgart.
PISSART, A. 1987. Weichselian periglacial structures and theirenvironmental significance: Belgium, The Netherlands and north-ern France. IN: Boardman, J. (ed.), Periglacial Processes andLandforms in Britain and Ireland, 77–85. Cambridge UniversityPress, Cambridge.
PONEL, P. 1994. Les fluctuations climatiques au Pleniglacial wurm-ien deduites des assemblages d’Arthropodes fossiles a la GrandePile (Haute-Saone, France). Comptes-Rendus de l’ Academie desSciences de Paris, 319, 845–852.
RAN, E. T. H. 1990. Dynamics of vegetation and environment duringthe Middle Pleniglacial in the Dinkel Valley (The Netherlands).Mededelingen Rijks Geologische Dienst, 44–3, 139–205.
RAN, E. T. H. and VAN HUISSTEDEN, J. 1990. The Dinkel Valleyin the Middle Pleniglacial: dynamics of a tundra river system.Mededelingen Rijks Geologische Dienst, 44–3, 209–220.
RAN, E.T.H., BOHNCKE, S. J. P., VAN HUISSTEDEN, K. J. and VAN-DENBERGHE, J. 1990. Evidence of episodic permafrost conditionsduring the Weichselian Middle Pleniglacial in the Hengelo Basin(The Netherlands). Geologie en Mijnbouw, 69, 207–218.
ROHDENBURG, H. 1967. Eiskeilhorizonte in sudniedersachsischenund nordhessichen Lossprofilen. Biuletyn Periglacjalny, 15, 225–245.
ROHDENBURG, H. and MEYER, B. 1979. Zur Feinstratigraphieund Palaopedologie des Jungpleistozans nach Untersuchungenan sudniedersaschischen und nordhessischen Lossprofilen. Land-schaftgenese und Landschaftsokologie, 3 (Braunschweig), 1–89.
ROMANOVSKIJ, N.N. 1985. Distribution of recently active ice andsoil wedges in the USSR. IN: Church, M. and Slaymaker, O. (eds),Field and Theory: Lectures in Geocryology, 154–165. University ofBritish Columbia Press, Vancouver.
ROSE, J. 1985. The Dimlington Stadial/Dimlington Chronozone: aproposal for naming the main glacial episode of the Late Deven-sian in Britain. Boreas, 14, 225–230.
ROWLANDS, B. M. 1971. Radiocarbon evidence of the age of anIrish sea glaciation in the Vale of Clwyd. Nature, 230, 9–11.
ROZYCKI, S. Z. 1972. Plejstocen Polski srodkowej. PWN, Wars-zawa 315 p.
RUDDIMAN, W. and McINTYRE, A. 1987. The North AtlanticOcean during the last deglaciation. Palaeogeography, Palaeo-climatology, Palaeoecology, 35, 119–134.
RUEGG, G. H. J. 1975. Sedimentary structures and depositionalenvironments of Middle- and Upper-Pleistocene glacial timedeposits from an excavation at Peelo, near Assen, The Nether-lands. Mededelingen Rijks Geologische Dienst, 26, 17–37.
SAUNDERS, G. E. 1973. Vistulian periglacial environments in theLleyn Peninsula. Biuletyn Periglacjalny, 22, 257–269.
SCHWAN, J. 1986. The origin of horizontal alternating bedding inWeichselian aeolian sands in north-western Europe. SedimentaryGeology, 49, 73–108.
SCHWAN, J. 1989. Grain fabrics of natural and experimental low-angle aeolian sand deposits. Geologie en Mijnbouw, 68, 211–219.
SELSING, L. 1982. Radiocarbon dating of a mammoth tusk fragmentfrom Brorfelde, Denmark. Bulletin of the Geological Society ofDenmark, 31, 51–157.
1998 John Wiley & Sons, Ltd. J. Quaternary Sci., Vol. 13(5) 391–417 (1998)
SHOTTON, F. W., WILLIAMS, R. B. G. and JOHNSON, A. S. 1974.Birmingham university radiocarbon dates VIII. Radiocarbon, 16,285–303.
SOUTHGATE, G. A. 1984. Thermoluminescence dating of theKempton park silts. Quaternary Newsletter, 43, 1–13.
STUART, A. J. and VAN WIJNGAARDEN-BAKKER, L. H. 1985. Quat-ernary vertebrates. IN: Edwards, K. J. and Warren, W. P. (eds), TheQuaternary History of Ireland, 221–233. Academic Press, London.
SUTHERLAND, D. G., BALLANTYNE, C. K. and WALKER, J. C.1984. Late Quaternary glaciation and environmental change onSt. Kilda, Scotland, and their palaeoclimatic significance. Boreas,13, 261–272.
SVENSSON, H. 1992. Wind-blasted erratics in Southern Sweden.IN: Billwitz, K., Jager, K.-D. and Janke, W. (eds), JungquartareLandschaftsraume. Aktuelle Forschungen zwischen Atlantik undTienschan, 105–109. Springer-Verlag, Berlin.
TEUNISSEN, D. and TEUNISSEN-OORSCHOT, H. 1974. Eine inter-stadiale Torfschicht bei Nijmegen (Niederlande) und derenBedeutung fur die Erklarung der dortigen Landschaftmorphologie.Geologie en Mijnbouw, 53, 393–400.
TOBOLSKI, K. 1984. Vistulian fossil flora from Konin-MaliniecPoland. Dissertationes Botanicae, 72 (Festschrift Welten), 319–332.
VAN DEN BERG, M. W. and DEN OTTER, C. 1993. Toelichting bijde geologische kaart van Nederland 1: 50.000. Blad AlmeloOost/Denekamp (28O/29). Rijks Geologische Dienst, Haarlem,240 pp.
VANDENBERGHE, J. 1977. Geomorfologie van de Zuiderkempen.Verhandelingen van Koninklijke Academie voor Wetenschappen,Letteren en Schone Kunsten van Belgie, 140, 166 pp.
VANDENBERGHE, J. 1983a. Some periglacial phenomena and theirstratigraphical position in Weichselian deposits in the Netherlands.Polarforschung, 53, 97–107.
VANDENBERGHE, J. 1983b. Late Weichselian river dune formationGrote Nete Valley, Central Belgium. Zeitschrift fur Geomorpholo-gie, 45, 251–263.
VANDENBERGHE, J. 1985. Paleoenvironment and stratigraphy dur-ing the Last Glacial in the Belgium–Dutch border region. Quatern-ary Research, 24, 23–38.
VANDENBERGHE, J. 1992. Geomorphology and climate of the cooloxygen isotope stage 3 in comparison with the cold stages 2 and4 in The Netherlands. Zeitschrift fur Geomorphologie, SupplementBand, 86, 65–75.
VANDENBERGHE, J. 1993. Changing fluvial processes under chang-ing periglacial conditions. Zeitschrift fur Geomorphologie, 88,17–28.
VANDENBERGHE, J. and GULLENTOPS, F. 1977. Contribution tothe stratigraphy of the Weichselian Pleniglacial in the Belgiancoversand area. Geologie en Mijnbouw, 56, 123–128.
VANDENBERGHE, J. and KROOK, L. 1981. Stratigraphy and genesisof Pleistocene deposits at Alphen (southern Netherlands). Geologieen Mijnbouw, 60, 417–426.
VANDENBERGHE, J. and KROOK, L. 1985. La stratigraphie et lagenese de depots Pleistocenes a Goirle (Pays-Bas). Bulletin del’Association Francaise pour l’Etude du Quarternaire, 1985/4,239–247.
VANDENBERGHE, J. and VAN HUISSTEDEN, J. 1988. Fluvio-aeolian interaction in a region of continuous permafrost. 5thInternational Conference on Permafrost, Proceedings, 876–881,Tapir Publishers, Trondheim.
VANDENBERGHE, J. and PISSART, A. 1993. Permafrost changes inEurope during the Last Glacial. Permafrost and Periglacial Pro-cesses, 4, 121–135.
VANDENBERGHE, J., MUCHER, H. J., ROEBROEKS, W. andGEMKE, D. 1985. Lithostratigraphy and palaeoenvironment of thePleistocene deposits at Maastricht-Belvedere, Southern Limburg,the Netherlands. Mededelingen Rijks Geologische Dienst, 39–1,7–18.
VANDENBERGHE, J., COOPE, G.R. and KASSE, K. 1998a. Quanti-tative reconstructions of palaeoclimates during the last inter-glacial - glacial in western and central Europe: an introduction.Journal of Quaternery Science, 13, 361–366.
VANDENBERGHE, J., HUIJZER, A. S., MUCHER, H. and LAAN, W.

417WEICHSELIAN PLENIGLACIAL CLIMATE IN EUROPE
1998b. Short climatic oscillations in a west European loesssequence (Kesselt, Belgium). Journal of Quaternary Science, 13,471–485.
VAN DEN HAUTE, P. 1998. The late Pleistocene loess deposits andpalaeosols of eastern Belgium: new TL age constraints. Journal ofQuaternary Science, 13, 487–497.
VAN DER HAMMEN, T. and WIJMSTRA, T. A. (eds) (1971). TheUpper Quaternary of the Dinkel valley. Mededelingen van deRijks Geologische Dienst, 22, 59–72.
VAN DER HAMMEN, T., MAARLEVELD, G. C., VOGEL, J. C. andZAGWIJN, W. H. 1967. Stratigraphy, climatic succession andradiocarbon dating of the lastglacial in the Netherlands. Geologieen Mijnbouw, 46, 79–95.
VAN DER MEER, J., SLOTBOOM, R. T. and DE VIRES-BRUYNSTEEN, I. 1984. Lithology and palynology of Weichselianalluvial fan deposits near Eerbeek, The Netherlands. Boreas, 13,393–402.
VANHOORNE, R. 1971. De nieuwe sluis van Zemst. 3. Paleontolog-ische studie. Excavator, Mai, 15–19.
VAN HUISSTEDEN, J. 1990. Tundra rivers of the Last Glacial:sedimentation and geomorphological processes during the MiddlePleniglacial (eastern Netherlands). Mededelingen Rijks Geologis-che Dienst, 44–3, 1–138.
VAN HUISSTEDEN, J. and VANDENBERGHE, J. 1988. Changingfluvial style of periglacial lowland rivers during the WeichselianPleniglacial in the eastern Netherlands. Zeitschrift fur Geomorpho-logie, Supplement Band, 71, 131–146.
VAN HUISSTEDEN, K., VANDENBERGHE, J. and VAN GEEL, B.1986a. Late Pleistocene stratigraphy and fluvial history of theDinkel Basin (Twente, Eastern Netherlands). Eiszeitalter und Geg-enwart, 36, 43–59.
VAN HUISSTEDEN, J., VAN DER VALK, L. and VANDENBERGHE,J. 1986b. Geomorphological evolution of a lowland valley systemduring the Weichselian. Earth Surface Processes Landforms, 11,207–216.
VAN VLIET-LANOE, B. 1985. Frost effects in soils. IN: Boardman,J. (ed.), Soils and Quaternary Landscape Evolution, 117–158.Wiley, Chichester.
1998 John Wiley & Sons, Ltd. J. Quaternary Sci., Vol. 13(5) 391–417 (1998)
VELICHKO, A. 1982. Paleogeography of Europe during the lastOne Hundred Thousand Years (atlas monograph in Russian withabstracts and legends in English) (Gerasimov, I.P., ed.). Nauka,Moscow, 156 pp.
VREEKEN, W. J. 1984. (Re)deposition of loess in southern Limbourg,The Netherlands. 3. Field evidence for conditions of depositionof the middle and upper silt loam complexes, and landscapeevolution at Nagelbeek. Earth Surface Processes and Landforms,9, 1–18.
WALKLING, A. P. and COOPE, G. R. 1996. Climatic reconstructionsfrom the Eemian/Early Weichselian transition in central Europebased on the coleopteran record from Grobern (Germany). Boreas,25, 145–159.
WEST, R. G. 1991. Pleistocene palaeoecology of Central Norfolk.Cambridge University Press, Cambridge, 110 pp.
WEST, R. 1993. Devensian thermal contraction networks and cracksat Somersham, Cambridgeshire, UK. Permafrost and PeriglacialProcesses, 4, 277–300.
WILLIAMS, R. G. B. 1975. The British climate during the LastGlaciation; An interpretation based on periglacial phenomena. In:Wright, A. E. and Moseley, F. M. (eds), Ice ages: Ancient andModern, 95–120, Seel House Press, Liverpool.
WINTLE, A. G. 1987. Thermoluminescence dating of the loess atRocourt, Belgium. Geologie en Mijnbouw, 66, 35–42.
WINTLE, A. G., SHACKLETON, N. and LATRIDOU, J. P. 1984.Thermoluminescence dating of periods of loess deposition andsoil formation in Normandy. Nature, 310, 491–493.
WOILLARD, G. M. and MOOK, W. G. 1982. Carbon-14 dates atGrande Pile. Correlation of land and sea chronologies. Science,215, 159–161.
WORSLEY, P. 1966. Some Weichselian fossil frost wedges from EastCheshire. Mercian Geology, 1, 357–365.
ZAGWIJN, W. H. 1974. Vegetation, climate and radiocarbon datingsin the Late Pleistocene of The Netherlands. Part II: Middle Weich-selian. Mededelingen Rijks Geologische Dienst, 25, 101–110.
ZAGWIJN, W. H. and PAEPE, R. 1968. Die Stratigraphie der weich-selzeitlichen Ablagerungen der Niederlande und Belgiens. Eiszeit-alter und Gegenwart, 19, 129–146.