Chronic neural recordings using silicon microelectrode arrays electrochemically deposited with a...
12
INSTITUTE OF PHYSICS PUBLISHING JOURNAL OF NEURAL ENGINEERING J. Neural Eng. 3 (2006) 59–70 doi:10.1088/1741-2560/3/1/007 Chronic neural recordings using silicon microelectrode arrays electrochemically deposited with a poly(3,4-ethylenedioxythiophene) (PEDOT) film ∗ Kip A Ludwig 1 , Jeffrey D Uram 1 , Junyan Yang 2 , David C Martin 1,4,5 and Daryl R Kipke 1,3 1 Department of Biomedical Engineering, University of Michigan, Ann Arbor, MI 48109, USA 2 Dow Chemical Co., Freeport, TX 77541, USA 3 Department of Electrical Engineering and Computer Science, University of Michigan, Ann Arbor, MI 48109, USA 4 Materials Science and Engineering, University of Michigan, Ann Arbor, MI 48109, USA 5 Macromolecular Science and Engineering Center, University of Michigan, Ann Arbor, MI 48109, USA E-mail: [email protected] and [email protected] Received 21 November 2005 Accepted for publication 8 February 2006 Published 1 March 2006 Online at stacks.iop.org/JNE/3/59 Abstract Conductive polymer coatings can be used to modify traditional electrode recording sites with the intent of improving the long-term performance of cortical microelectrodes. Conductive polymers can drastically decrease recording site impedance, which in turn is hypothesized to reduce thermal noise and signal loss through shunt pathways. Moreover, conductive polymers can be seeded with agents aimed at promoting neural growth toward the recording sites or minimizing the inherent immune response. The end goal of these efforts is to generate an ideal long-term interface between the recording electrode and surrounding tissue. The goal of this study was to refine a method to electrochemically deposit surfactant-templated ordered poly(3,4-ethylenedioxythiophene) (PEDOT) films on the recording sites of standard ‘Michigan’ probes and to evaluate the efficacy of these modified sites in recording chronic neural activity. PEDOT-coated site performance was compared to control sites over a six-week evaluation period in terms of impedance spectroscopy, signal-to-noise ratio, number of viable unit potentials recorded and local field potential recordings. PEDOT sites were found to outperform control sites with respect to signal-to-noise ratio and number of viable unit potentials. The benefit of reduced initial impedance, however, was mitigated by the impedance contribution of typical silicon electrode encapsulation. Coating sites with PEDOT also reduced the amount of low-frequency drift evident in local field potential recordings. These findings indicate that electrode sites electrochemically deposited with PEDOT films are suitable for recording neural activity in vivo for extended periods. This study also provided a unique opportunity to monitor how neural recording characteristics develop over the six weeks following implantation. ∗ This work was supported by the Center for Wireless Integrated Microsystems NSF EEC-9986866 and the Whitaker Foundation. 1. Introduction Implantable electrodes designed to record action potentials from individual neurons are integral to a number of clinical 1741-2560/06/010059+12$30.00 © 2006 IOP Publishing Ltd Printed in the UK 59
Transcript of Chronic neural recordings using silicon microelectrode arrays electrochemically deposited with a...
INSTITUTE OF PHYSICS PUBLISHING JOURNAL OF NEURAL ENGINEERING
J. Neural Eng. 3 (2006) 59–70 doi:10.1088/1741-2560/3/1/007
Chronic neural recordings usingsilicon microelectrode arrayselectrochemically deposited with apoly(3,4-ethylenedioxythiophene)(PEDOT) film∗
Kip A Ludwig1, Jeffrey D Uram1, Junyan Yang2, David C Martin1,4,5
and Daryl R Kipke1,3
1 Department of Biomedical Engineering, University of Michigan, Ann Arbor, MI 48109, USA2 Dow Chemical Co., Freeport, TX 77541, USA3 Department of Electrical Engineering and Computer Science, University of Michigan, Ann Arbor,MI 48109, USA4 Materials Science and Engineering, University of Michigan, Ann Arbor, MI 48109, USA5 Macromolecular Science and Engineering Center, University of Michigan, Ann Arbor, MI 48109, USA
E-mail: [email protected] and [email protected]
Received 21 November 2005Accepted for publication 8 February 2006Published 1 March 2006Online at stacks.iop.org/JNE/3/59
AbstractConductive polymer coatings can be used to modify traditional electrode recording sites withthe intent of improving the long-term performance of cortical microelectrodes. Conductivepolymers can drastically decrease recording site impedance, which in turn is hypothesized toreduce thermal noise and signal loss through shunt pathways. Moreover, conductive polymerscan be seeded with agents aimed at promoting neural growth toward the recording sites orminimizing the inherent immune response. The end goal of these efforts is to generate an ideallong-term interface between the recording electrode and surrounding tissue. The goal of thisstudy was to refine a method to electrochemically deposit surfactant-templated orderedpoly(3,4-ethylenedioxythiophene) (PEDOT) films on the recording sites of standard‘Michigan’ probes and to evaluate the efficacy of these modified sites in recording chronicneural activity. PEDOT-coated site performance was compared to control sites over a six-weekevaluation period in terms of impedance spectroscopy, signal-to-noise ratio, number of viableunit potentials recorded and local field potential recordings. PEDOT sites were found tooutperform control sites with respect to signal-to-noise ratio and number of viable unitpotentials. The benefit of reduced initial impedance, however, was mitigated by the impedancecontribution of typical silicon electrode encapsulation. Coating sites with PEDOT alsoreduced the amount of low-frequency drift evident in local field potential recordings. Thesefindings indicate that electrode sites electrochemically deposited with PEDOT films aresuitable for recording neural activity in vivo for extended periods. This study also provided aunique opportunity to monitor how neural recording characteristics develop over the six weeksfollowing implantation.
∗ This work was supported by the Center for Wireless IntegratedMicrosystems NSF EEC-9986866 and the Whitaker Foundation.
1. Introduction
Implantable electrodes designed to record action potentialsfrom individual neurons are integral to a number of clinical
1741-2560/06/010059+12$30.00 © 2006 IOP Publishing Ltd Printed in the UK 59
K A Ludwig et al
and research applications [1–6]. The ability to record actionpotentials from individual neurons is dependent on a tradeoffbetween the geometric area of the recording site and thesite’s impedance, often referred to as the tradeoff betweenselectivity and sensitivity [7, 8]. A recording site withsmall geometric area is required to isolate the action potentialof an individual neuron from more distant neural sources(selectivity)6 [7–11]. A low-impedance recording site isnecessary because impedance is proportional to both thermalnoise and signal loss through shunt pathways (sensitivity) [7–9,11, 12]. Unfortunately, decreasing the geometric area ofa recording site causes an increase in the impedance of therecording site [7–9].
A number of studies have explored methods to reducethe impedance of small recording sites in order to alleviatethis tradeoff [7–9]. Fabricating non-planar structures ontothe surface of the recording site, iridium oxide depositionand platinum black deposition have all been used to increasethe surface area of a recording site by increasing its fractaldimensions [7–9, 12–14]. However, there are drawbacksto each of these methods. The fabrication of non-planarstructures on the surface of a recording site is limitedby photolithographic resolution and non-conformal metaldeposition. Recording sites deposited with iridium oxide andplatinum black have been reported to have unstable impedance,weak adherence to the underlying substrate and can cause driftin the open circuit potential of the site [7–9, 14]. Moreover,there has been no detailed investigation into how effectivethese methods are in improving the chronic performance ofneural recording electrodes.
More recently, investigators have focused on theuse of conductive polymers such as polypyrrole (PPy)to reduce the impedance of recording sites. Thespecificity attainable when electrochemically depositingconductive polymers facilitates the generation of conductivepolymer films that maximize surface area over a givengeometric space [15–18]. As a result, the capacitanceof the recording site dramatically increases, creating acorresponding reduction in site impedance [15–17, 19].In addition, porous conductive polymer films promoteeffective ion exchange between the recording site and thesurrounding tissue [15–17, 19]. These films transduce ioniccurrent into electronic current via an efficient redox reaction,minimizing the charge transfer resistance at the recordingsite, again lowering the impedance of the recording site[15–17, 19].
PPy can also be used to facilitate a number of innovativetechniques intended to improve neural recordings. Studieshave indicated that topographically modified surfaces arecapable of enhancing axonal and dendritic growth [20–23].Electrical stimulation through oxidized PPy has also been
6 The extracellular potential field of a neuron drops off steeply with respectto distance from the neuron. Large recording sites span multiple diminishingpotential lines, and therefore average strong signal from near the neuron, withweaker, more distal signal. Moreover, large recording sites are more likelyto be closer to additional neurons than small recording sites, and thereforemeasure unwanted competing signals. Finally, recording sites that are largerthan the neurons they record from run the risk of recording from both polesof a dipole source at once, effectively shorting the measured potential.
demonstrated to significantly increase the neurite lengths inrat PC-12 cells in vitro [24]. Furthermore, PPy can beelectrochemically deposited on microelectrode arrays andseeded with various biomolecule combinations that improvethe interface between tissue and recording site [15, 16, 18].These biomolecules can be selected to induce the attachmentof cells onto coated recording sites or alleviate the inherentimmune response.
Unfortunately, PPy is not well suited for chronic, long-term implantation [25–27]. A study by Yamato et al foundthat PPy/poly(styrene sulfonate) (PSS) retained only 5% ofits original charge after polarization at 0.4 V for 16 h [26]. Anumber of studies have suggested that a nucleophilic attack ofOH− on the α and β positions of the pyrrole rings may lead to aloss of conjugation, and consequently a loss of electrochemicalactivity [25, 27, 28].
Past studies have indicated that nodular poly(3,4-ethylenedioxythiophene) (PEDOT) can be used as a viablealternative to PPy for chronic, long-term implantations[15, 17, 19, 26]. Unlike PPy, PEDOT has a dioxyethylenebridging group across the 3- and 4-positions of theheterocycle preventing α-β ′ coupling, and as a result ismore electrochemically stable than PPy [15, 19, 26].Yamato et al reported that PEDOT/PSS retained 89% ofits original electrochemical activity when polarized at 0.4 Vfor 16 h [26]. PEDOT has also been effectivelyused as a template to incorporate the bioactive peptideDCDPGYIGSR [15]. Preferential growth of neuronal cellswas observed on the coated areas of standard acute ‘Michigan’probes coated with PEDOT/DCDPGYIGSR in vitro [15].PEDOT/DCDPGYISR-coated sites were then used to obtainhigh-quality acute neural recordings [15].
Surfactant-templated ordered PEDOT films have beenshown to possess superior electrical characteristics to themore conventional nodular PEDOT [17]. SEM micrographsindicate that surfactant-templated ordered PEDOT films havea larger surface area than nodular PEDOT or PPy filmswhen grown under the same conditions [17]. As a result,surfactant-templated ordered PEDOT films lower recordingsite impedance even further than nodular PEDOT or PPyfilms [17]. Surfactant-templated ordered PEDOT films alsodemonstrate a larger charge carrying capacity than nodularPEDOT or PPy films [17]. In addition, the charge carryingcapacity of surfactant-templated ordered PEDOT films hasbeen found to be more stable than nodular PEDOT or PPyfilms after 1000 cyclic voltammetry cycles [17].
The goal of the current study was to refine a methodto electrochemically deposit surfactant-templated orderedPEDOT films on the recording sites of standard Michiganchronic probes and to evaluate the efficacy of these modifiedsites in recording chronic neural activity [17]. Eight maleSprague-Dawley rats were implanted in motor cortex withstandard 4 × 4, 16-channel probes and neural recordingswere monitored over a six-week period. The performanceof PEDOT-coated sites was compared to control sitesin terms of impedance spectroscopy, signal-to-noise ratio,number of viable unit potentials recorded and local fieldpotential recordings. This experiment also provided a
60

Evaluation of PEDOT films for improving neural recordings
unique opportunity to systematically investigate how neuralrecording characteristics develop over the six weeks followingimplantation.
2. Methods
2.1. Silicon probes
The micromachined silicon probes used in this experimentwere provided by the University of Michigan Center for NeuralCommunications Technology. Design and fabrication of theprobes have been described in detail elsewhere [10, 29].Sixteen-channel chronic probes with 703 µm2 iridiumrecording sites were selected for use throughout this workas these probes are routinely used to record single-unit actionpotentials in motor cortex.
2.2. Electrochemical deposition and initial evaluation
Electrochemical deposition of PEDOT in this study wasaccomplished using an electrochemical potentiostat/galvanostat (Autolab PGSTAT12, Eco Chemie, Urtecht,The Netherlands) with associated General PurposeElectrochemical System (GPES) software. PEDOTdoped with tetraethylammonium perchlorate and dissolvedin 20 wt% surfactant poly(oxythylene)10-oleyl ether wasgalvanostatically deposited onto the iridium sites of the neuralprobes [17]. Test probes were first deposited with PEDOTin order to determine the optimum deposition characteristicsfor use in the chronic study. The deposition charge usedon the test probes was varied from 50 to 1000 mC cm−2 inorder to generate a wide spectrum of coating morphologiesand thicknesses [17]. Coated sites were then visuallyinspected under a microscope and impedance spectroscopymeasurements for each site were made (section 2.6). Next,each of the test probes was inserted and removed from agelatin model of rat cortex [30]. After the insertion test, thetest probes were again visually inspected under a microscopeand impedance spectroscopy measurements for each sitewere retaken (figure 1). Only PEDOT films that were grownusing the largest two deposition charges, corresponding toa coating thickness of approximately 6 µm [17], detachedpartially from the electrode site upon insertion. Smaller filmthicknesses appeared unchanged after insertion.
As a result of these preliminary tests, PEDOT filmsgenerated with a deposition charge of 260 mC cm−2 werechosen for in vivo testing. Films created with a depositioncharge of 260 mC cm−2 were found to have an impedance dropcomparable to the largest applied deposition charges, as wellas a porous morphology conducive to ion transfer. Moreover,PEDOT films generated using this deposition charge extendonly 1 µm from the recording site [17] and therefore shouldmitigate the risk of delamination upon insertion, minimizethe tissue displaced during insertion and present less of afocal point for the concentration of mechanical stress onthe electrode shank. For in vivo testing, eight sites oneach probe testing were deposited with surfactant-templatedordered PEDOT film. The deposited sites were staggered inrelative location to prevent bias due to specific shank location
Figure 1. Average recording site impedance versus polymerizationcharge. The bars denote standard error (n = 4). Impedance at 1 kHzdecreased up to a deposition charge of 260 mC cm−2 and thenremained relatively constant. Coatings made using the two largestdeposition charges often delaminated during the insertion test,causing an increase in impedance post-insertion.
(a)
(b)
Figure 2. PEDOT coating protocol. (a) Snapshot of standard16-site, 4-shank probe prior to deposition. The locations of electrodesites deposited with PEDOT have been artificially darkened forreference. (b) One shank of a probe after deposition. The darkersites have been electrochemically deposited with a PEDOT film.
(This figure is in colour only in the electronic version)
or cortical depth (figure 2). The remaining eight sites on eachprobe were left uncoated as controls for comparison.
2.3. Surgical techniques
Eight male Sprague-Dawley rats were implanted in motorcortex with a 16-channel, chronic Michigan siliconmicroelectrode array using experimental procedures outlinedpreviously [31]. Initial anesthesia was administered via intra-peritoneal injections of a mixture of 50 mg ml−1 ketamine,5 mg ml−1 xylazine and 1 mg ml−1 acepromazine at aninjection volume of 0.125 ml/100 g body weight. Updatesof 0.1 ml ketamine (50 mg ml−1) were delivered as neededduring the surgery to maintain anesthesia during the surgery.Animals were secured to a standard stereotaxic frame, andthree stainless steel bone screws were inserted into the skull.The electrode connector was grounded to a bone screwover parietal cortex using a stainless steel ground wire. Acraniotomy approximately 3 mm × 2 mm craniotomy wasmade over motor cortex. Two incisions were made in thedura mater over the target area to create four flaps, and
61

K A Ludwig et al
these flaps were subsequently folded back over the edge ofthe craniotomy. The electrodes were then hand insertedinto the approximate target cortical area (target location3.0 mm anterior to bregma, 2.5 mm lateral from bregmaand 1.4 mm deep from the surface of the brain) [31].Cortical depth was estimated using the known location ofthe electrode sites on the individual shanks in conjunctionwith the known length of the individual shanks. Next,NeuroSeal R© (NeuroNexus Technologies, Inc., Ann Arbor, MI)was applied as a dural sealant, the silicon cable connector waswrapped with GelFoam R© (Henry Schein, Inc., Miami, FL) forprotection and the entire assembly excluding the connectorwas enclosed using dental acrylic (Co-Oral-Ite, Dental Mfg.Co., Santa Monica, CA). Finally, sutures were used to closethe skin around the acrylic and triple-antibiotic ointmentwas applied. All procedures complied with the UnitedStates Department of Agriculture guidelines for the care anduse of laboratory animals and were approved by the Universityof Michigan Animal Care and Use Committee.
2.4. Data collection
After implantation, neural recordings and impedancespectroscopy for each animal were taken daily for the firsttwo weeks and every other day thereafter for the remainderof the six weeks. Animals were either awake or kept lightlysedated throughout the data collection sessions. No obvious,discernible difference in neuronal activity was noted betweenlightly sedated and awake animals. Local field potentialrecordings were taken only at the end of the study.
2.5. Neural recordings and data analysis
Recorded neural signals were acquired using a Multi-ChannelNeural Acquisition Processor (MNAP; Plexon Inc., Dallas,TX). Neural electrophysiological data for all 16 recordingchannels were amplified and bandpass filtered; single- andmulti-unit recordings were sampled at 40 kHz and bandpassfiltered from 450 to 5000 Hz, while local field potentialswere sampled at 1 kHz and bandpass filtered from 3 to90 Hz. During recording sessions, animals were placed inan electrically shielded recording booth and multiple 30 ssegments of continuous neural recordings were taken.
Neural recording segments were analyzed offlineusing custom-automated MatLab (Mathworks Inc., MA)software. Candidate action potentials were discriminated frombackground noise based on the probability distribution of thesamples in a 30 s segment. An amplitude threshold windowwas set 3.5 standard deviations above and below the mean ofthe sample distribution. For each peak exceeding the thresholdwindow, a 2.4 ms candidate waveform snippet centered on theabsolute minimum of the waveform was removed from therecorded segment and stored. The amplitude of the noisevoltage for every recording site in each recorded segment wascalculated after all candidate waveforms had been removed.
The store of candidate waveform snippets for a givenchannel was used to derive a set of orthogonal basis vectorsordered based on ability to represent the largest variation in thedata set, a technique commonly known as principal component
analysis [32–35]. The first three principal components wereused to generate the axes of a three-dimensional componentspace. Each waveform in the store was transformed intoa point in this three-dimensional space based on its scorefor each of the component axes. Individual points weregrouped into clusters using fuzzy C-means clustering [36, 37].When compared to hard clustering, fuzzy clustering reducesclassification errors resulting from the synchronous firing ofmultiple neurons [38]. In order to determine the optimumnumber of clusters, the number of clusters was iterativelyincreased until the value for the objective function calculatedfor k + 1 number of clusters was at least 55% of the value forthe objective function calculated for k number of clusters [39].
After clustering, waveforms with a cluster membershipindex of greater than 0.8 were used to determine a meanwaveform for a cluster. Contributions of white noise andwaveforms created by the simultaneous firing of multipleneurons generally do not have a membership index of greaterthan 0.8 for a particular cluster and therefore were limitedusing this procedure [38]. An interspike interval histogramfor each cluster was generated and visually inspected for anobvious absolute refractory period as an additional measureof noise rejection. Signal amplitude for a cluster was definedas the peak-to-peak amplitude of the mean waveform for eachcluster. The signal-to-noise ratio (SNR) for a given clusterwas defined as follows:
SNR = signal amplitude/
(2 × calculated RMS noise voltage for recording site).
Clusters were then separated into one of four categories basedon calculated SNR. Clusters with an SNR of greater than4 were categorized as quality units. Clusters with an SNRbetween 3 and 4 were categorized as moderate units. Clusterswith an SNR between 2 and 3 were categorized as poor units,while clusters with an SNR of less than 2 were not consideredunits. These four categories correspond well with observationsof unit quality based on signal-to-noise ratio made in similarrecording studies [40, 41].
As noted elsewhere, isolating action potentials froma specific neuron using only a single recording site as areference is prone to classification errors [35, 42]. Althoughclassification errors are inevitable, the number of neuronsdetected using the methodology presented here shouldaccurately parallel the true underlying number of neuralsources. This methodology also compared favorably withconservative manual clustering performed by experiencedresearchers on the same data sets, but with the advantage ofbeing both objective and automated.
2.6. Impedance spectroscopy measurements
Impedance spectroscopy measurements were made using anAutolab potentiostat PGSTAT12 (Eco Chemie, Utrecht, TheNetherlands) with associated frequency response analyzer(Brinkmann, Westbury, NY). Impedance measurements weremade by applying a 25 mV RMS sine wave with frequenciesvaried logarithmically from 10 Hz to 10 kHz [43]. Priorto implantation, measurements were made by immersing the
62
Evaluation of PEDOT films for improving neural recordings
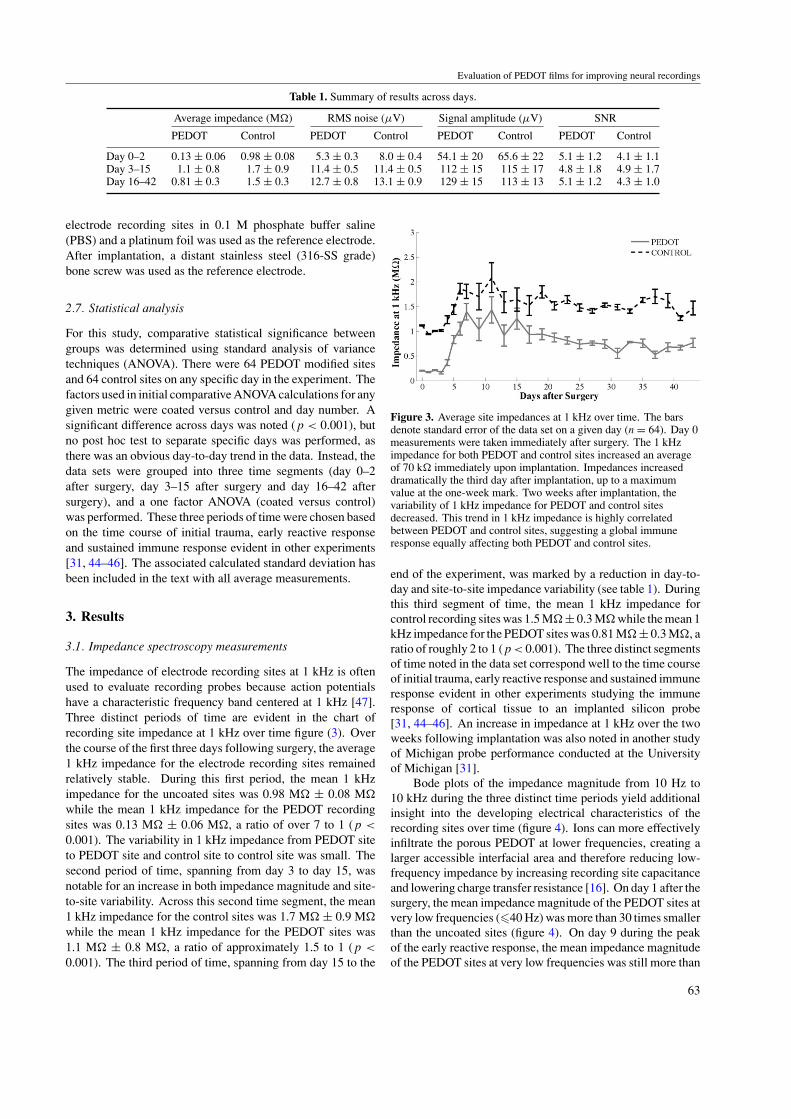
Table 1. Summary of results across days.
Average impedance (M) RMS noise (µV) Signal amplitude (µV) SNR
PEDOT Control PEDOT Control PEDOT Control PEDOT Control
Day 0–2 0.13 ± 0.06 0.98 ± 0.08 5.3 ± 0.3 8.0 ± 0.4 54.1 ± 20 65.6 ± 22 5.1 ± 1.2 4.1 ± 1.1Day 3–15 1.1 ± 0.8 1.7 ± 0.9 11.4 ± 0.5 11.4 ± 0.5 112 ± 15 115 ± 17 4.8 ± 1.8 4.9 ± 1.7Day 16–42 0.81 ± 0.3 1.5 ± 0.3 12.7 ± 0.8 13.1 ± 0.9 129 ± 15 113 ± 13 5.1 ± 1.2 4.3 ± 1.0
electrode recording sites in 0.1 M phosphate buffer saline(PBS) and a platinum foil was used as the reference electrode.After implantation, a distant stainless steel (316-SS grade)bone screw was used as the reference electrode.
2.7. Statistical analysis
For this study, comparative statistical significance betweengroups was determined using standard analysis of variancetechniques (ANOVA). There were 64 PEDOT modified sitesand 64 control sites on any specific day in the experiment. Thefactors used in initial comparative ANOVA calculations for anygiven metric were coated versus control and day number. Asignificant difference across days was noted ( p < 0.001), butno post hoc test to separate specific days was performed, asthere was an obvious day-to-day trend in the data. Instead, thedata sets were grouped into three time segments (day 0–2after surgery, day 3–15 after surgery and day 16–42 aftersurgery), and a one factor ANOVA (coated versus control)was performed. These three periods of time were chosen basedon the time course of initial trauma, early reactive responseand sustained immune response evident in other experiments[31, 44–46]. The associated calculated standard deviation hasbeen included in the text with all average measurements.
3. Results
3.1. Impedance spectroscopy measurements
The impedance of electrode recording sites at 1 kHz is oftenused to evaluate recording probes because action potentialshave a characteristic frequency band centered at 1 kHz [47].Three distinct periods of time are evident in the chart ofrecording site impedance at 1 kHz over time figure (3). Overthe course of the first three days following surgery, the average1 kHz impedance for the electrode recording sites remainedrelatively stable. During this first period, the mean 1 kHzimpedance for the uncoated sites was 0.98 M ± 0.08 M
while the mean 1 kHz impedance for the PEDOT recordingsites was 0.13 M ± 0.06 M, a ratio of over 7 to 1 ( p <
0.001). The variability in 1 kHz impedance from PEDOT siteto PEDOT site and control site to control site was small. Thesecond period of time, spanning from day 3 to day 15, wasnotable for an increase in both impedance magnitude and site-to-site variability. Across this second time segment, the mean1 kHz impedance for the control sites was 1.7 M ± 0.9 M
while the mean 1 kHz impedance for the PEDOT sites was1.1 M ± 0.8 M, a ratio of approximately 1.5 to 1 ( p <
0.001). The third period of time, spanning from day 15 to the
Figure 3. Average site impedances at 1 kHz over time. The barsdenote standard error of the data set on a given day (n = 64). Day 0measurements were taken immediately after surgery. The 1 kHzimpedance for both PEDOT and control sites increased an averageof 70 k immediately upon implantation. Impedances increaseddramatically the third day after implantation, up to a maximumvalue at the one-week mark. Two weeks after implantation, thevariability of 1 kHz impedance for PEDOT and control sitesdecreased. This trend in 1 kHz impedance is highly correlatedbetween PEDOT and control sites, suggesting a global immuneresponse equally affecting both PEDOT and control sites.
end of the experiment, was marked by a reduction in day-to-day and site-to-site impedance variability (see table 1). Duringthis third segment of time, the mean 1 kHz impedance forcontrol recording sites was 1.5 M± 0.3 M while the mean 1kHz impedance for the PEDOT sites was 0.81 M± 0.3 M, aratio of roughly 2 to 1 ( p < 0.001). The three distinct segmentsof time noted in the data set correspond well to the time courseof initial trauma, early reactive response and sustained immuneresponse evident in other experiments studying the immuneresponse of cortical tissue to an implanted silicon probe[31, 44–46]. An increase in impedance at 1 kHz over the twoweeks following implantation was also noted in another studyof Michigan probe performance conducted at the Universityof Michigan [31].
Bode plots of the impedance magnitude from 10 Hz to10 kHz during the three distinct time periods yield additionalinsight into the developing electrical characteristics of therecording sites over time (figure 4). Ions can more effectivelyinfiltrate the porous PEDOT at lower frequencies, creating alarger accessible interfacial area and therefore reducing low-frequency impedance by increasing recording site capacitanceand lowering charge transfer resistance [16]. On day 1 after thesurgery, the mean impedance magnitude of the PEDOT sites atvery low frequencies (40 Hz) was more than 30 times smallerthan the uncoated sites (figure 4). On day 9 during the peakof the early reactive response, the mean impedance magnitudeof the PEDOT sites at very low frequencies was still more than
63

K A Ludwig et al
(a)
(c)
(b)
(MΩ
)
(MΩ
)
(MΩ
)
Figure 4. Bode plot of average measured impedance versusfrequency. The dotted lines denote standard error of the data set on agiven day (n = 64). (a) Day 1 post-implantation. (b) Day 9 post-implantation. (c) Day 40 post-implantation. Initially, there was alarge difference in impedance between PEDOT and control sites atboth 1 kHz and low frequencies (10–40 Hz). On day 9, thedifference in impedance at 1 kHz was much smaller, whereas a largedifference in impedance at low frequencies was still evident. Byday 41, 1 kHz and low-frequency impedance for both PEDOT andcontrol sites had settled. A large difference in impedance at lowfrequencies between PEDOT and control sites remained; however,the difference in impedance at 1 kHz was not as dramatic as seeninitially.
ten times smaller than the uncoated sites (figure 4). On day 40,the mean impedance magnitude of the PEDOT sites returned toalmost 30 times smaller than the uncoated sites (figure 4).The trend in impedance of the PEDOT sites over time at lowfrequency also parallels the time course of initial trauma, earlyreactive response and sustained immune response.
3.2. Unit recordings
Over the course of the experiment, signals that regularlyexceeded the 3.5 standard deviation threshold were evident onall 128 recording sites. On average, 70% of the PEDOT sitesrecorded waveforms categorized as poor or better (SNR > 2),compared to 59% for the uncoated sites ( p < 0.001) (figure 5).After day 15, 78% of the PEDOT sites recorded waveformscategorized as poor or better, in contrast to 68% for thecontrol sites ( p < 0.001). The overall percentage of sitesrecording poor or better unit recordings was high initially,markedly lower for the two weeks following the surgery andthen returned to prior levels after the two-week mark. Multipleunits were evident on a number of both PEDOT and uncoatedrecording sites. An average of 1.2 ± 0.3 units of poor or betterquality were identified on PEDOT sites over the course of theexperiment, while an average of 1.0 ± 0.3 units of poor orbetter quality identified on control sites ( p < 0.001).
(a) (b)
Per
cent
age
of S
ites
Per
cent
age
of S
ites
Figure 5. Percentage of sites recording low- and high-quality unitson a given day. The bars denote standard error of the data set on agiven day (n = 8). (a) Units with SNR > 2. (b) Quality units withSNR > 4. Unit recordings tended to be unstable over the first twoweeks after implantation. During these two weeks, a noticeabledrop in measurable units occurred on both PEDOT and control sites.After two weeks, unit recordings stabilized and the recordablenumber of units became more constant on a day-to-day basis.Throughout the course of the study, sites electrochemicallydeposited with PEDOT films on average registered both more low-and high-quality units than control sites ( p < 0.001).
A more dramatic difference in performance betweenPEDOT and uncoated sites over the length of the study isevident in the percentage of sites recording high-quality units(SNR > 4) (figure 5). Over the six-week study, an averageof 41% of the uncoated recording sites at any given timeregistered at least 1 quality unit. In comparison, more than58% of the PEDOT sites registered at least 1 quality unit ( p <
0.001). PEDOT sites recorded an average of 0.75 ± 0.1 qualityunits from day to day, whereas uncoated sites recorded anaverage of 0.56 ± 0.1 quality units ( p < 0.001).
3.3. Signal to noise over recording sessions
Calculating an average signal-to-noise ratio (SNR) of unitrecordings was complicated by the fact that PEDOT sitesregistered a larger number of poor, moderate and quality units.For purposes of calculating the SNR of unit recordings, onlyunits of moderate or better quality (SNR > 3.0) were used. TheSNR of recorded units of moderate or better quality over timecan also be separated into three time periods (figure 6). Duringthe two days following surgery, the average SNR of the unitsrecorded on PEDOT sites was 5.1 ± 1.2 while the averageSNR of the units recorded on the control sites was 4.1 ±1.1 ( p < 0.001). Over the period spanning days three tofifteen following surgery, the average SNR of units recordedon PEDOT and uncoated sites was roughly the same, 4.8 ±1.8 and 4.9 ± 1.7, respectively ( p > 0.05). After day 15, theSNR of unit recordings for PEDOT and uncoated sites began todiverge again; the average SNR of units recorded on PEDOTsites was 5.1 ± 1.2, while the average SNR of units recordedon uncoated sites was 4.3 ± 1.0 ( p < 0.001).
64

Evaluation of PEDOT films for improving neural recordings
Figure 6. Average SNR over time. The bars denote standard errorof the data set on a given day (n = 64). Average SNR was calculatedusing units with an SNR of greater than 3, as PEDOT sites typicallyregistered both more low- and high-quality units. On average,PEDOT sites recorded units with greater SNR than control sites forthe first three days after implantation and from day 15 until the endof the study ( p < 0.001). Between day 3 and day 15 post-implantation, individual unit recordings varied on day-to-day (andeven hour-to-hour) basis. No significant difference in average SNRbetween PEDOT and control sites was noted during this timeframe( p > 0.05).
3.4. Local field potential recordings
Local field potentials recordings (LFPs), typically rangingfrom 3 to 90 Hz, are routinely recorded using Michiganprobes. Over the course of taking chronic LFP recordings,an undesirable low-frequency artifact often becomes evident[48–50]. LFP recordings were taken at the end of the six-week study in order to investigate the possibility that sitesdeposited with a PEDOT film would reduce low-frequencyartifact in LFP recordings. Figure 7 depicts a sample of LFPsrecorded on PEDOT and control sites. Low-frequency artifactwas intermittently evident on the control recording sites thatwas not apparent on the PEDOT sites. The magnitude of theaverage power in the band from 0.1 to 1 Hz is indicative ofthe extent of low-frequency artifact. Across all subjects, theaverage power in the frequency band from 0.1 to 1 Hz forthe control sites was 4.3 ± 0.8 times larger than the averagepower across the same band for PEDOT sites ( p < 0.001). Forboth types of sites, the low-frequency artifact was sufficientin amplitude to register despite the use of a second-orderbandpass filter with a cutoff frequency of 3 Hz.
3.5. Histological evaluation
Although detailed histological evaluation was not a focus ofthis study, cursory hematoxylin and eosin (H and E) stainingwas performed on the implanted cortical tissue from six of thesubjects at the end of the experiment (data not shown) [31, 51].Since the probes were inserted by hand, the insertion angleof the probe relative to the surface of the brain could notbe guaranteed. As a result, determining the precise locationof a specific recording site relative to a coronal section wasimpossible and therefore no specific comparison betweenimmune response at PEDOT and control sites could be made.Coronal sections were instead visually inspected for any
(a)
(b) (c)
Figure 7. Local field potential recordings. (a) Five-second segmentof local field potential recordings for one subject on day 41. The toptwo rows are local field potential recordings from control sites. Thebottom two rows are local field potential recordings from sitesdeposited with a PEDOT film over the same timeframe. Sitesdeposited with a PEDOT film registered considerably lesslow-frequency artifact (0.1–1 Hz) than control sites. (b) Averagepower versus frequency (resolution = 0.001 Hz) of PEDOT sites forsame subject on day 41. (c) Average power versus frequency(resolution = 0.001 Hz) of control sites for same subject on day 41.
abnormally large immune response. In general, the coronalsections were consistent with the modest global tissue reactionto implanted silicon probes reported elsewhere [31, 45, 52].
4. Discussion
4.1. Trend in recordings with respect to progression ofthe immune response
There have been a number of excellent studies monitoringthe progression of the immune response to an implantedsilicon probe over time [44–46, 52]. In addition, Liu andMcCreery have investigated the stability of single-unit neuralrecordings at different points in time after implantation [53].In order to place the comparative results of PEDOT andcontrol recording sites into proper context, a discussion of thetrends in recording site impedance, recorded signal amplitudeand recorded noise amplitude over the six weeks followingimplantation is necessary. The trends found in this studyfollow logically from the known progression of the immuneresponse to an implanted silicon probe and are consistent withresults from similar microelectrode studies [31, 51, 54].
Immediately upon implanting the modified probes, themeasured impedance on all recording sites increased by 70–100 k. This impedance increase may be attributed toimmediate protein adsorption on the recording sites coupledwith the change in the surrounding medium from 0.1 Mphosphate buffered saline to cortical tissue. As the individual
65

K A Ludwig et al
Figure 8. Average noise over time. The bars denote standard errorof the data set on a given day (n = 64). The recorded noise level forPEDOT sites was significantly lower than control sites over the firstthree days following implantation, presumably a result of a reducedthermal noise ( p < 0.001). The recorded noise level for bothPEDOT and control sites increased dramatically after day 3,reaching a maximum value at the one-week mark. The increase inimpedance on both PEDOT and control sites apparent after day 3should also cause an increase in thermal noise. By day 15 post-implantation, the average RMS noise on PEDOT and control siteswas not significantly different ( p > 0.05).
shanks of the Michigan probe are small in comparison to otherrecording technologies, a minimal amount of tissue should bedisrupted during their insertion. As a result, recordings withthe Michigan probe immediately after surgery tend to be strong[55, 56].
According to the literature, swelling of the tissuesurrounding an implanted biomaterial occurs not long afterimplantation [57]. Swelling around an implanted probe couldcause neurons near the recording sites to be ‘pushed away’.As a result of swelling, the neural sources of signal couldbe moved to a more distant location, theoretically causing adecrease in signal amplitude. Similarly, the noise amplitudewould decrease as the distal neural sources that generate thebiological component of measured noise are also pushed awayfrom the recording site. Consistent with this hypothesis, bothmeasured signal amplitude as well as recorded noise amplitudein this study decreased following surgery. In general, swellingsubsides between three and six days after a biomaterial isimplanted [57], theoretically allowing displaced neurons toreturn to the area around the recording site. In this study,both signal and noise amplitude increased during days three toseven, which is consistent with neurons returning to the regionnear the recording site as swelling subsides (figures 8 and 9).
Biran et al report that there is a comparable reduction inneuronal cell density in the tissue surrounding an implantedprobe at two and four weeks post-insertion [52]. Data trackingneuronal cell density surrounding a probe over the two weeksfollowing implantation is not currently available; however, itmay be possible that this reduction in neuronal cell densitydevelops immediately after a probe is inserted and remainsrelatively constant for the life of the implant. A reductionin neuronal cell density should result in an overall decreasein measured signal and biological noise and therefore couldalso account for the reduction in recorded signal and noiseamplitude that occurred after the first day after implantation.
Figure 9. Average signal amplitude over time. The bars denotestandard error of the data set on a given day (n = 64). During thefirst three days after implantation, swelling around the recordingsites may have pushed neurons away from the recording, causing anapparent reduction in signal amplitude. Average signal amplitudewas not significantly different between PEDOT and control sitesduring this timeframe ( p > 0.05). Signal amplitude increased untilseven days post-surgery. At the two-week point day-to-dayrecordings stabilized and the average signal amplitude of unitsrecorded on PEDOT sites became significantly larger in comparisonto control sites ( p < 0.001).
The reduction in recorded signal and noise amplitude as aresult of decreased neuronal cell density should be a relativelyconstant bias over time and therefore does not account for thedramatic increase in recorded signal and noise apparent afterday 3 in this study.
Unit recordings over the two weeks following surgerywere unstable. Individual unit waveforms and PCA clusterschanged dramatically on a daily, and sometimes hourly, basis.Although detailed statistical analysis on the stability of unitrecordings was not performed in this study, unit recordingswere considered unstable if large variations in the PCAcluster for a given neuron were evident, in conjunction witha noticeable change in the shape or amplitude of the recordedwaveform. Unit recordings are unstable during the earlyreactive response timeframe because the tissue surroundingthe recording sites is in a constant state of flux [46, 53]. Duringthis period, a loose sheath of cells consisting of microglia andreactive astrocytes begins to form around the shanks of therecording electrodes [46]. The impedance of the electroderecording sites at 1 kHz in this study increased up to the two-week mark (figure 3, table 1), presumably as a result of theformation of a cellular sheath.
Researchers have shown that the encapsulation around theelectrode shanks becomes more defined at the two-week mark,and the immune response begins a transition into the chronicphase [46]. Around the two-week point in this study, the day-to-day and site-to-site variability in impedance magnitude at1 kHz diminished (figure 3) [31]. Unit recordings becamemore stable; individual unit recordings changed primarily ona week-to-week basis. Liu and McCreery suggest that theencapsulation of the electrode shank anchors the recording sitein position with respect to the surrounding tissue and thereforestabilizes the day-to-day recordings [53].
By the sixth week after surgery, a well-definedencapsulating sheath of microglia and reactive astrocytes has
66

Evaluation of PEDOT films for improving neural recordings
formed around typical implanted silicon devices, and theimmune response has transitioned into the long-term chronicresponse [46]. Presumably, as a result of this encapsulatingsheath, the 1 kHz impedances at six weeks for all recordingsites in this study were between 500 and 1000 k largerthan initial in vitro impedance measurements (figure 3) [31].Consistent with the findings of Liu and McCreery, unitrecordings at six weeks became even more stable [53].
4.2. Effect of reduced impedance on recorded signal andnoise amplitude
Lowering the impedance of recording sites is purported toenhance neural recordings by reducing noise and minimizingsignal loss through shunt pathways [7, 8, 11, 12]. Noise inneural recordings is primarily comprised of thermal (Johnson)noise and small amplitude signals from diffuse neural sources[7, 8, 11]. In vitro, the largest component of recorded noise isthermal noise. The thermal noise for a recording site can becomputed as follows:
VNoise =√
4kT ZF
where k is Boltzman’s constant, T is the temperature, F isthe frequency band of interest and Z is the impedance at thefrequency band of interest [7, 8, 11]. As long as the thermalnoise remains the largest portion of the measured noise, therecorded noise should vary proportionately with the measuredimpedance over the frequency band of interest. The averagein vitro noise amplitude for PEDOT recording sites was 2.1 ±0.3 µV, compared to 5.5 ± 0.3 µV for control sites ( p < 0.001).A reduction in the impedance of an electrode site should notonly decrease thermal noise, but increase both measured signalas well as measured biological noise, due to a reduction inmeasured potential loss through shunt pathways.
The ratio of impedance at 1 kHz between uncoated sitesand PEDOT sites was approximately 7.5 to 1 over the first twodays following surgery. Consequently, the average measurednoise was 8.0 ± 0.4 µV for uncoated sites and 5.3 ± 0.3 µVfor PEDOT sites ( p < 0.001) (figure 8). This increase inmeasured noise amplitude for PEDOT and control sites withrespect to in vitro values is attributable to a 70 k increasein impedance after implantation across all sites coupled withthe addition of biological sources of noise. Over the sametimeframe, the average signal amplitude for units recorded onPEDOT sites was not significantly different from the averagesignal amplitude of units recorded on control sites ( p > 0.05)(figure 9). Therefore, the difference in SNR between PEDOTand uncoated sites over the first two days was attributableto diminished thermal noise (figure 6). Swelling around therecording site during this timeframe likely increased thedistance from the recording site to signal sources and sourcesof biological noise, mitigating the benefit of decreasedsignal loss through the shunt pathway. The increased SNRattributable to decreased thermal noise related directly to anincrease in the resolvable number of neurons (figure 5).
From day 3 to day 15, the impedance magnitude at 1 kHzincreased on both uncoated and PEDOT sites, presumably as aresult of the early reactive response to the implants. Similarly,the average noise voltage for uncoated and PEDOT sites
increased to 11.9 ± 0.6 µV and 11.4 ± 0.5 µV, respectively( p > 0.05). As the ratio of impedance at 1 kHz betweenuncoated and PEDOT sites diminished, the average noiseamplitude for both types of sites converged. The averagesignal amplitude for units recorded between day 3 and day 15increased to 112 ± 15 µV for PEDOT sites and to 115 ± 17 µVfor control sites ( p > 0.05).
As discussed earlier, the dramatic increase in bothmeasured noise and measured signal amplitude was likelyrelated to the return of neurons to the area surrounding therecording site after the insertion trauma subsided. As neuronsreturned, the contribution of the diffuse activity of neuronsnearby the recording sites to the ambient noise level beganto approach and even surpass the contribution of thermalnoise. Moreover, the thermal noise presumably increased inproportion to the increase in impedance over all sites. Becauseneither the average signal amplitude nor recorded noise forPEDOT and uncoated sites was markedly different betweendays 3 and 15, the SNR for both PEDOT and control sites wasapproximately the same. Although more units were evident onPEDOT sites during this period (figure 5), the unit recordingswere very unstable on a day-to-day (and sometimes hour-to-hour) basis during this timeframe, complicating statisticalanalysis.
After day 15, the impedance magnitude at 1 kHz settled forboth PEDOT and uncoated sites. Action potentials recordedfrom individual neurons became consistent on a week-to-weekbasis. The difference in average noise amplitude betweenPEDOT and uncoated sites remained negligible (PEDOT:12.7 ± 0.8 µV, uncoated: 13.1 ± 0.9 µV, p > 0.05). However,the average signal amplitude of units recorded on PEDOT sitesincreased to 129 ± 15 µV after day 15, while the average signalamplitude of units recorded on uncoated sites did not changesignificantly (113 ± 13 µV, p < 0.001). Consequently, theSNR of units recorded on PEDOT sites after day 15 was higherthan the SNR of units recorded on uncoated sites, correlatingdirectly to an increased number of sorted units (figure 5).
The increase in signal amplitude on PEDOT sites after day15 is most likely a function of decreased signal loss throughthe shunt impedance7. Similarly, a decrease in signal lossthrough the shunt impedance should increase the amplitude ofmeasured biological noise. As a result, the noise amplitudeacross PEDOT sites approached the noise amplitude acrosscontrol sites; the expected decrease in thermal noise causedby reduced impedance was compensated for by an increase inmeasured biological noise.
4.3. Functional significance of reduced initial impedanceon single-unit recordings
Prior to implantation and over the first three days followingsurgery, every PEDOT site in this study registered a lower
7 Additionally, conductive polymer coatings grow outward from the normallyplanar recording site to create a hemispherical electrode site, enhancing thesite’s ability to detect neurons in the periphery [16]. The rough topographyof a conductive polymer film has also been hypothesized to promote neuralgrowth in comparison to planar sites [16]. Over multiple animals, these effectsmay create an additional increase in both average signal amplitude as well asthe average measured amplitude of biological noise sources.
67

K A Ludwig et al
measured noise amplitude than the lowest measured noiseamplitude for a control site. This result is likely attributableto the large difference in 1 kHz impedance seen betweenPEDOT and control sites during this period. After day 3,there was an equivalent increase in impedance on bothPEDOT and control sites, indicating a global immune responseaffecting the electrical characteristics of PEDOT and controlsites equally. As site impedances increased by 0.5–1 M withthe encapsulation of the probe, the ratio of average impedanceat 1 kHz between control and PEDOT sites decreased fromthe 10 to 1 in vitro value to 2 to 1. Consequently, thebenefit of electrochemically depositing PEDOT films in orderto improve single-unit recordings was mitigated. This resultis not surprising considering that the expected differencein thermal noise and signal loss through shunt impedancebetween PEDOT and control sites depends on the magnitudeof this ratio.
Although a statistically significant increase in signal tonoise and number of recorded units was evident using alarge number of recording sites over an extended period oftime, the improvement in recordings for individual subjects onspecific days was not always significant. Alternative methodsintended to reduce the initial impedance of neural recordingelectrodes will also likely have their efficacy diminished bythe contribution of encapsulation to recording site impedance.Reducing initial impedance is of some benefit, but theseresults suggest that the single largest determinant in effectivelyisolating a single-unit potential in a chronic setting is distancefrom recording site to neuronal source.
There is a possibility that the PEDOT coatingsdelaminated partially in vivo, which may also cause anincrease in recording site impedance. Attempts weremade to explant the intact recording electrodes from theanimals at the end of study to examine the possibility ofdelamination, but none of these attempts were successful.Unfortunately, the process of explanting chronic recordingelectrodes (which includes dissolving the acrylic headcap with1,2-dichloroethane solution, removing the surrounding skullfrom the brain and physically extracting a probe from thesurrounding tissue that has been encapsulated with astrocytesand microglia) causes considerable strain on both the electrodeshanks and fragile silicon connecting cable. As a result, theprocess of explantation can cause delamination of PEDOTcoatings and therefore is problematic in evaluating the stabilityof PEDOT coatings in vivo.
The data in this study suggest that delamination of thePEDOT films was not a significant factor in the results.Statistically significant differences in impedance betweenPEDOT and control sites were observed across all days ofthe study, including a dramatic difference in impedance atlow frequency. Moreover, an equivalent impedance increaseat 1 kHz was observed for both PEDOT and control sites,which suggests that the source of the impedance increasesin this study was acting globally, instead of site-specificdelamination. Finally, the time course and magnitude of theimpedance increases observed across all sites were consistentwith the immune response to implanted recording devices seenin other studies [31, 46, 51].
4.4. Artifact in LFP recordings
Low-frequency noise in LFP recordings is often the resultof either motion artifact or thermal noise. As noted earlier,thermal noise is proportional to the square root of impedanceacross a frequency band. Standard iridium electrodes aredesigned to transduce ionic current into electronic currentvia the formation of a non-faradaic capacitive double layer.The impedance of this capacitive double layer at a givenfrequency is 1/jωC, where ω is the frequency and C is thedouble layer capacitance. LFP recordings typically havefrequency components in the 3–90 Hz range, much lower thanthe 350–5000 Hz range of action potentials. Not surprisingly,the impedances of iridium microelectrodes at frequenciesrelevant for LFP recordings are substantially higher than theirimpedances at 1 kHz (figure 4).
Recording sites deposited with PEDOT films in thisstudy routinely exhibited much lower impedances than iridiumcontrol sites at low frequencies (figure 4, section 3). As notedearlier, ions can more effectively infiltrate the porous PEDOTat lower frequencies, creating a larger accessible interfacialarea and therefore reducing low-frequency impedance byincreasing recording site capacitance and lowering chargetransfer resistance [16]. At the six-week mark, the ratioin average impedance at low frequency between control andPEDOT sites was still quite large (section 3). A large decreasein low-frequency impedance should correlate directly to areduction in thermal noise across lower frequency bands.However, the relative magnitude of thermal noise in proportionto the magnitude of the desired LFP signal of interest isunknown. Furthermore, thermal noise should be random innature, whereas the low-frequency artifact visually evidentacross control sites was highly correlated (Spearman’s rankcoefficient test p < 0.001) (figure 7).
Artifact that is highly correlated across multiple sitessuggests one outside source of artifact influencing therecordings on all of those sites, such as motion artifact. Motionartifact is often the result of a disturbance in the establishedcapacitive double layer at the interface between the recordingsite and the tissue. One possible source of motion artifactis movement of the electrode shanks with respect to thesurrounding tissue [58]. Movement of the electrode shankscan cause a disturbance in the ionic layer at multiple recordingssites simultaneously. Because the impedance of iridiumelectrode sites at low frequencies is quite high, disturbingthe ionic interface could result in large variations in measuredpotential. PEDOT-coated recording sites, having considerablyreduced low-frequency impedance, would therefore registersmaller variations in measured potential when the ionicinterface is disturbed.
An alternative possible explanation for the apparentresistance of PEDOT films to low-frequency artifact relatesto the mechanism by which PEDOT films transduce ioniccurrent into electronic current. Unlike non-faradaic noblemetal microelectrodes, PEDOT films are designed to transduceionic current into electronic current via a reversible faradaicredox reaction. The increased impedance of the non-faradaiccapacitive double layer at low frequencies may cause a biastoward a faradaic mechanism of conduction for PEDOT films.
68
Evaluation of PEDOT films for improving neural recordings
Faradaic electrode reactions are governed by the concentrationof product and reactants species and the mobility of electronsand ions in their respective mediums. Porous PEDOT filmsare designed to promote fast ion exchange at the interfacebetween recording site and surrounding tissue [15, 17]. As aresult, motion of the electrode with respect to the surroundingtissue may not significantly disturb the local concentration ofproduct and reactants. Consequently, LFPs taken with PEDOTsites may be more resistant to motion artifact.
Reducing the amount of low-frequency artifact in LFPrecordings has a number of potential benefits. First, removingartifact closer to the source is always preferential to digitalfiltering. Second, digital filtering of the low-frequency artifactmay not be an option for real-time applications. Third, largelow-frequency artifact can cause the recording amplifier tosaturate, preventing any viable signal from being registered.Finally, recording electrode low-frequency drift is often alimiting consideration in device design.
5. Conclusion
Over the course of the study, recording sites deposited with aPEDOT film registered 17% more quality units than controlsites, while minimizing the amount of low-frequency artifactevident in LFP recordings. The modest tissue response,typical of cortical implants, resulted in an average 700 k
increase in impedance magnitude at 1 kHz across both PEDOTand control recording sites at six weeks. Consequently, thebenefit of reduced noise and decreased signal loss through theshunt impedance as a function of lower initial impedance forPEDOT films was diminished. The dominating contributionto site impedance of the encapsulating sheath should similarlyaffect alternative methods of reducing initial recording siteimpedance. The results of this study indicate that surfactant-templated ordered PEDOT films remain suitable for obtaininghigh-quality neural recordings out to six weeks. Future studieswill investigate the long-term effectiveness of seeding PEDOTfilms with drugs tailored to alleviate the immune response andinduce neural growth toward the electrode in order to maximizerecording performance.
Acknowledgments
The authors of this paper would like to acknowledge allof members of the Neural Engineering Laboratory at theUniversity of Michigan for their assistance in this study.Specific thanks go to Elizabeth Nunamaker and Erin Purcellfor histological assistance, Rachel Miriani and Jey Subbaroyanfor surgical assistance and Rio Vetter, Matt Johnson andNick Langhals for invaluable advice throughout the courseof the study. David C Martin acknowledges partial supportprovided by NIH NINDS-N01-NS-1-2338 and NSF DMR0084304, NSF DMR 0518079.
References
[1] Abbott L F and Salinas E 1994 Vector reconstruction fromfiring rates J. Comput. Neurosci. 1 89–107
[2] Beiko J and Cain D P 1998 The effect of water maze spatialtraining on posterior parietal cortex transcallosal evokedfield potentials in the rat Cereb. Cortex 8 407–14
[3] Brown E N, Frank L M, Tang D, Quirk M C and Wilson M A1998 A statistical paradigm for neural spike train decodingapplied to position prediction from ensemble firing patternsof rat hippocampal place cells J. Neurosci. 18 7411–25
[4] Carmena J M et al 2003 Learning to control a brain–machineinterface for reaching and grasping by primates PLoSBiol. 1 e42
[5] Dobelle W H 2000 Artificial vision for the blind by connectinga television camera to the visual cortex ASAIO J. 46 3–9
[6] Serruya M D, Hatsopoulos N G, Paninski L, Fellows M R andDonoghue J P 2002 Instant neural control of a movementsignal Nature 416 141–2
[7] Kovacs G T A 1994 Introduction to the theory, design, andmodeling of thin-film microelectrodes for neural interfacesEnabling Technologies for Cultured Neural Networksed D A Stenger and T McKenna (New York: Academic)pp 121–65
[8] Schmidt E and Humphrey D R 1990 Extracellular single-unitrecording methods Neurophysiol. Tech. (Clifton, NJ:Humana Press) pp 1–64
[9] Paik S J, Park Y and Cho D I 2003 Roughened polysilicon forlow impedance microelectrodes in neural probesJ. Micromech. Microeng. 13 373–9
[10] Drake K L, Wise K D, Farraye J, Anderson D J andBeMent S L 1988 Performance of planar multisitemicroprobes in recording extracellular single-unitintracortical activity IEEE Trans. Biomed. Eng.35 719–32
[11] Shoham S and Nagarajan S 2003 The theory of central nervoussystem recording Neuroprosthetics: Theory and Practiceed KW Horch and G S Dhillon (Singapore: WorldScientific) pp 448–65
[12] Robinson D A 1968 The electrical properties of metalmicroelectrodes Proc. IEEE 56 1065
[13] Burke L D and Shannell R A 1984 An investigation of hyrdousoxide growth on iridium in base J. Electroanal. Chem.119–41
[14] Burke L, Mulcahy J K and Whelan D P 1984 Prepartion of anoxidized iridium electrode and the variation of its potentialwith pH J. Electroanal. Chem. 117–28
[15] Cui X and Martin D C 2003 Electrochemical deposition andcharacterization of poly(3,4-ethylenedioxythiophene) onneural microelectrode arrays Sensors ActuatorsB 89 92–102
[16] Cui X Y, Hetke J F, Wiler J A, Anderson D J and Martin D C2001 Electrochemical deposition and characterization ofconducting polymer polypyrrole/PSS on multichannelneural probes Sensors Actuators A 93 8–18
[17] Yang J, Kim D H, Hendricks J L, Leach M, Northey R andMartin D C 2005 Ordered surfactant-templatedpoly(3,4-ethylenedioxythiophene) (PEDOT) conductingpolymer on microfabricated neural probes ActaBiomater. 1 125–36
[18] Cui X Y et al 2001 Surface modification of neural recordingelectrodes with conducting polymer/biomolecule blendsJ. Biomed. Mater. Res. 56 261–72
[19] Bobacka J, Lewenstam A and Ivaska A 2000 Electrochemicalimpedance spectroscopy of oxidizedpoly(3,4-ethylenedioxythiophene) film electrodes inaqueous solutions J. Electroanal. Chem. 489 17–27
[20] Craighead H G, Hames C D and Turner A M P 2001 Chemicaland topographic patterning for directed cell attachmentCurr. Opin. Solid State Mater. Sci. 177–84
[21] Dowell-Mesfin N M et al 2004 Topographically modifiedsurfaces affect orientation and growth of hippocampalneurons J. Neural Eng. 1 78–90
69
K A Ludwig et al
[22] Fan Y W C F Z, Chen L N, Zhai Y, Xu Q Y and Lee I S 2002Adhesion of neural cells on silicon wafer withnano-topographical surface Appl. Surf. Sci. 187 313–8
[23] St John P M et al 1997 Preferential glial cell attachment tomicrocontact printed surfaces J. Neurosci.Methods 75 171–7
[24] Schmidt C E, Shastri V R, Vacanti J P and Langer R 1997Stimulation of neurite outgrowth using an electricallyconducting polymer Proc. Natl Acad. Sci. USA94 8948–53
[25] Beck F, Braun P and Oberst M 1987 Organic electrochemistryin the solid state-overoxidation of polypyrrole Ber.Bunsenges. Phys. Chem. Chem. Phys. 91 967–74
[26] Hitoshi Yamato M O and W Wernet 1995 Stability ofpolypyrrole and poly(3,4-ethylenedioxythiphene) forbiosensor application J. Electroanal. Chem. 397 163–70
[27] Schlenoff J B and Xu H 1992 Evolution of physical andelectrochemical properties of polypyrrole during extendedoxidation J. Electrochem. Soc. 139 2397–401
[28] Wernet W 1985 PhD Thesis Freidburg[29] Anderson D J et al 1989 Batch-fabricated thin-film electrodes
for stimulation of the central auditory system IEEE Trans.Biomed. Eng. 36 693–704
[30] Shahriari K 2001 Safe and effective techniques for surgicallyinserting flexible microelectrode arrays into the cortexThesis M S Arizona State University
[31] Vetter R J, Williams J C, Hetke J F, Nunamaker E A andKipke D R 2004 Spike recording performance of implantedchronic silicon-substrate microelectrode arrays in cerebralcortex IEEE Trans. Neural Syst. Rehabil. Eng. 52 896–904
[32] Gerstein G L, Bloom M J, Espinosa I E, Evanczuk S andTurner M R 1983 Design of a laboratory for multineuronstudies IEEE Trans. Syst. Man Cybern. 13 668–76
[33] Glaser E M 1971 Separation of Neuronal Activity by WaveformAnalysis (New York: Academic)
[34] Glaser E M and Marks W B 1968 On-line separation ofinterleaved neuronal pulse sequences Data Acquis. Process.Biol. Med. 5 137–56
[35] Lewicki M S 1998 A review of methods for spike sorting: thedetection and classification of neural action potentials Netw.Comput. Neural Syst. 9 R53–78
[36] Dunn J C 1974 A fuzzy relative of the ISODATA process andits use in detecting compact well compact well-separatedclusters J. Cybern. 3 32–57
[37] Bezdek J C 1981 Pattern Recognition with Fuzzy ObjectiveFunction Algorithms. (New York: Plenum)
[38] Zouridakis G and Tam D C 2000 Identification of reliable spiketemplates in multi-unit extracellular recordings using fuzzyclustering Comput. Methods Programs Biomed. 61 91–8
[39] Karkkainen I and Franti P 2002 Dynamic local search forclustering with unknown number of clusters Int. Conf. onPattern Recognition (August 2002, Quebec, Canada)p 240–3
[40] Henze D A, Borhegyi Z, Csicsvari J, Mamiya A, Harris K Dand Buzsaki G 2000 Intracellular features predicted byextracellular recordings in the hippocampus in vivoJ. Neurophysiol. 84 390–400
[41] Suner S, Fellows M R, Vargas-Irwin C, Nakata G K andDonoghue J P 2005 Reliability of signals from a chronically
implanted, silicon-based electrode array in non-humanprimate primary motor cortex IEEE Trans. Neural. Syst.Rehabil. Eng. 13 524–41
[42] Harris K D, Henze D A, Csicsvari J, Hirase H and Buzsaki G2000 Accuracy of tetrode spike separation as determined bysimultaneous intracellular and extracellular measurementsJ. Neurophysiol. 84 401–14
[43] Johnson M D, Otto K J and Kipke D R 2005 Repeated voltagebiasing improves unit recordings by reducing resistivetissue impedances IEEE Trans. Neural Syst. Rehabil.Eng. 13 160–5
[44] Schmidt S, Horch K and Normann R 1993 Biocompatibility ofsilicon-based electrode arrays implanted in feline corticaltissue J. Biomed. Mater. Res. 27 1393–9
[45] Szarowski D H et al 2003 Brain responses to micro-machinedsilicon devices Brain Res. 983 23–35
[46] Turner J N et al 1999 Cerebral astrocyte response tomicromachined silicon implants Exp. Neurol. 156 33–49
[47] Kuffler S W 1976 A Cellular Approach to the Function of theNervous System. (Sunderland, MA: Sinauer Associates)
[48] Brown P, Kupsch A, Magill P J, Sharott A, Harnack D andMeissner W 2002 Oscillatory local field potentials recordedfrom the subthalamic nucleus of the alert ratExp. Neurol. 177 581–5
[49] Gail A, Brinksmeyer H J and Eckhorn R 2004Perception-related modulations of local field potentialpower and coherence in primary visual cortex of awakemonkey during binocular rivalry Cereb. Cortex 14 300–13
[50] Magill P J, Sharott A, Bevan M D, Brown P and Bolam J P2004 Synchronous unit activity and local field potentialsevoked in the subthalamic nucleus by cortical stimulationJ. Neurophysiol. 92 700–14
[51] Williams J C 2001 Performance of chronic neural implants:measurement, modeling and intervention strategiesPhD Thesis Arizona State University
[52] Biran R, Martin D C and Tresco P A 2005 Neuronal cell lossaccompanies the brain tissue response to chronicallyimplanted silicon microelectrode arrays Exp. Neurol.195 115–26
[53] Liu X, McCreery D B, Carter R R, Bullara L A, Yuen T G andAgnew W F 1999 Stability of the interface between neuraltissue and chronically implanted intracorticalmicroelectrodes IEEE Trans. Rehabil. Eng. 7 315–26
[54] Williams J, Rennaker R and Kipke D 1999 Long-term neuralrecording characteristics of wire microelectrode arraysimplanted in cerebral cortex Brain Res. Brain Res.Protoc. 4 303–13
[55] Polikov V S, Tresco P A and Reichert W M 2005 Response ofbrain tissue to chronically implanted neural electrodesJ. Neurosci. Methods 148 1–18
[56] Schwartz A B 2004 Cortical neural prosthetics Annu. Rev.Neurosci. 27 487–507
[57] Black J 1999 Biological performance of materialsFundamentals of Biocompatibility 3rd edn (revised andexpanded) (New York: Dekker)
[58] Subbaroyan J, Martin D C and Kipke D R 2005 A finite-element model of the mechanical effects of implantablemicroelectrodes in the cerebral cortex J. NeuralEng. 2 103–13
70