Folate Polyglutamylation is Required for Rice Seed Development
Upload
independentCategory
view
0download
0
FINAL ACCEPTED VERSION MANUSCRIPT NUMBER (G-00542-2004.R1)
1
Chronic Ethanol Feeding and Folate Deficiency Activate Hepatic Endoplasmic Reticulum
Stress Pathway in Micropigs
Farah Esfandiari1, Jesus A. Villanueva1, Donna H. Wong1, Samuel W. French2 and Charles H.
Halsted1*
1. Department of Internal Medicine, University of California Davis, Davis, CA,
2. Department of Pathology, Harbor-UCLA Medical Center, Torrance, CA
Running head: Ethanol and folate deficiency activate liver ER stress
*Corresponding author:
Charles H. Halsted, MD
School of Medicine
University of California, Davis
Davis, CA 95616
Phone 530-752-6778; Fax: 530-752-3470; email:[email protected]
Articles in PresS. Am J Physiol Gastrointest Liver Physiol (February 10, 2005). doi:10.1152/ajpgi.00542.2004
Copyright © 2005 by the American Physiological Society.

FINAL ACCEPTED VERSION MANUSCRIPT NUMBER (G-00542-2004.R1)
2
ABSTRACT
Previously we showed that feeding micropigs ethanol with a folate deficient diet promoted the
development of hepatic injury while increasing hepatic levels of homocysteine and S-
adenosylhomocysteine (SAH) and reducing the level of S-adenosylmethionine (SAM) and the
SAM to SAH ratio. Our present goals were to evaluate mechanisms for hepatic injury using liver
specimens from the same micropigs. The effects of ethanol feeding or folate deficient diets singly
or in combination on CYP2E1 and signal pathways for apoptosis and steatosis were analyzed
using microarray, real-time PCR and immunoblotting techniques. Apoptosis was increased
maximally by the combination of ethanol feeding and folate deficiency and was correlated
positively to liver homocysteine and SAH. Liver CYP2E1 and the ER stress signals glucose-
regulated protein 78 (GRP78), caspase 12, and sterol regulatory element binding protein 1-c
(SREBP-1c) were each activated in pigs fed folate deficient or ethanol diets singly or in
combination. Liver mRNA levels of CYP2E1, GRP78, and SREBP 1-c, and protein levels of
CYP2E1, GRP78, nSREBP, and activated caspase 12 each correlated positively to liver levels of
SAH and/or homocysteine and negatively to the SAM to SAH ratio. The transcripts of lipogenic
enzymes fatty acid synthase (FAS), acetyl-CoA carboxylase (ACC) and stearoyl-CoA desaturase
(SCD) were elevated in the ethanol-fed groups, and each was positively correlated to liver
homocysteine levels. The induction of abnormal hepatic methionine metabolism through the
combination of ethanol feeding with folate deficiency is associated with the activation of CYP2E1
and enhances ER stress signals that promote steatosis and apoptosis.
Key Words: Methionine metabolism and liver injury

FINAL ACCEPTED VERSION MANUSCRIPT NUMBER (G-00542-2004.R1)
3
INTRODUCTION
Chronic ethanol feeding induces functional and structural changes in the liver that include
hepatocellular steatosis and apoptosis (36). The chronic exposure to ethanol alters hepatic
methionine metabolism findings in alcoholic patients and in several animal models of ethanol
feeding have included elevations in serum homocysteine and liver SAH with reductions in liver
SAM, and the SAM to SAH ratio (3, 12, 18, 28). At the same time, alcoholic liver disease (ALD)
is commonly associated with deficiency of folate, a vitamin that is central to methionine
metabolism by providing substrate for the transmethylation of homocysteine (16). These
observations contribute to the hypothesis that abnormal hepatic methionine metabolism plays a
role in the pathogenesis of ALD (19, 29, 30, 36). To test this hypothesis, we induced alcoholic
liver injury in a micropig model by promoting abnormal methionine metabolism by feeding folate
deficient diets with ethanol at 40% of kcal. After 14 weeks of feeding, the combined diet reduced
liver folate, the SAM to SAH ratio, and GSH while increasing plasma levels of homocysteine and
liver SAH, DNA strand breaks, and plasma aspartate transaminase (AST) by 8-fold together with
histopathologic features typical of steatohepatitis (19). Selected findings from this study are
summarized in Table 1. This demonstration of rapid promotion of alcoholic liver injury through
induction of abnormal methionine metabolism in the micropig contrasts with an earlier study in
the same animal model in which induction of the histopathology of liver injury required one year
of ethanol feeding with an otherwise nutritionally adequate diet (17).
The most studied interactive processes of alcoholic liver injury include oxidative damage
through activation of the cytochrome P450 enzyme CYP2E1 and the induction of apoptosis by
extrinsic (death receptor) and intrinsic (mitochondrial) pathways, which differ in signaling
mechanisms. The extrinsic pathway involves TNFα stimulation of its TNFR-1 receptor that

FINAL ACCEPTED VERSION MANUSCRIPT NUMBER (G-00542-2004.R1)
4
activates an apoptotic pathway with stimulation of caspase 8 and then caspase 3. In the intrinsic or
mitochondrial pathway, caspase 8 activates Bcl-2 family members, which translocate to
mitochondria and induce the mitochondrial permeability transition that results in membrane
depolarization and rupture with release of pro-apoptotic cytochrome C and subsequent activation
of caspases 9 and 3 (1, 23). Recent studies point to the endoplasmic reticulum as a third
subcellular organelle involved in alcoholic liver injury. The ER is the main organelle for protein
synthesis and modifications, calcium signaling, and the biosynthesis of lipids (5, 32). The ER
stress pathway is activated by conditions such as glucose deprivation, calcium depletion, and
oxidative stress, which can interfere with proper folding and maturation of proteins (33). The
accumulation of unfolded proteins in the ER initiates an intracellular signaling pathway known as
the unfolded protein response (UPR), which promotes either a cell survival or cell death
pathway(6, 32, 33). The survival response activates genes that encode ER-resident chaperones
such as GRP78/Bip, which uses energy from ATP hydrolysis to prevent aggregation of ER
proteins and is considered the classical marker for UPR activation (42). If the adaptive response is
inadequate, the UPR promotes apoptosis through nuclear transcription factor GADD and ER-
localized caspase 12. The UPR also initiates cellular lipid synthesis by activation of sterol
regulatory element binding proteins (SREBPs) that regulate the transcription of lipid synthesis
enzymes including FAS, ACC and SCD (2, 5, 32, 41). SREBP-1c and SREBP-2 are synthesized
as ~125 kDa precursors; upon activation, the N-terminal segments are translocated to the nuclear
membrane as proteins (~68 kDa) that activate the transcription of the target genes for lipid
synthesis. SREBP-1c plays an active role in the transcription of genes involved in hepatic
triglyceride production, whereas SREBP-2 is involved in regulation of genes in cholesterol
synthesis (7, 22).

FINAL ACCEPTED VERSION MANUSCRIPT NUMBER (G-00542-2004.R1)
5
Using frozen liver samples from our recent study (19), the goal of the present study was to
identify signaling pathways and mechanisms for alcoholic liver injury in the micropig model of
abnormal methionine metabolism induced by ethanol feeding and folate deficiency. In addition to
selective enhancement of the ER stress pathway, we found significant correlations of the levels of
activated CYP2E1 and ER stress signals to elevations in liver homocysteine and SAH. Our
findings suggest an integral role for abnormal methionine metabolism in the pathogenesis of ALD
that include activation of both CYP2E1 and the ER stress pathways.

FINAL ACCEPTED VERSION MANUSCRIPT NUMBER (G-00542-2004.R1)
6
MATERIALS AND METHODS
Animals and diets- As previously described, 24 juvenile Yucatan micropigs that were
obtained from Sinclair Farms, Columbia, MO, USA were pair fed diets that provided 90 kcal/kg
body weight, vitamin-free casein at 15%, 30 % of kcal as corn oil and 55 % as carbohydrate
(control), or diets in which carbohydrate was reduced to 15% and ethanol was substituted to 40%
of kcal (19). Folic acid was omitted or was added to diets at 14.5 µg/kg body weight, and each diet
was supplemented with a vitamin and mineral mix that include levels that were in excess of pig
requirements for choline at 60.3 mg, and methionine at 675 mg/kg body weight (35)(Dyets, Inc.
Bethlehem, Pennsylvania, USA). Thus, there were four feeding groups of 6 animals each: folate
sufficient control (FS), folate deficient only (FD), folate sufficient with ethanol (FSE), and folate
deficient with ethanol (FDE). The micropigs were housed in facilities approved by the National
Institutes of Health and were cared for following standards and procedures outlined in the National
Academy of Sciences "Guide for the Care and Use of Laboratory Animals." All procedures were
reviewed and approved by the Animal Welfare Committee of University of California Davis. After
14 weeks feeding, each pig was fasted overnight, anesthetized with isofluorane, and subjected to
surgical laparotomy. Liver tissues were removed, and inner segments of liver were placed in
formalin for subsequent blocking in paraffin, or freeze-clamped in liquid nitrogen and frozen at -
70º C for further analysis.
TUNEL Assay- To quantify the effects of the different diets on hepatocellular apoptosis,
the terminal deoxynucleotidyl transferase-mediated deoxyuridine triphosphate nick-end labeling
(TUNEL) assay was performed on liver slices from each micropig, in which apoptotic bodies were
detected by DNA fragmentation as described previously (31). For morphometric quantification of
TUNEL-positive hepatocytes, at least 10-fields per liver sections were examined in each

FINAL ACCEPTED VERSION MANUSCRIPT NUMBER (G-00542-2004.R1)
7
experiment. The 10x objective was used and counts were blinded as to the treatment groups. Only
hepatocytes were counted, and the units were numbers of TUNEL-positive cells per mm2. Liver
sections of six pigs on each experimental group were evaluated.
Microarray- To explore genome-wide expression changes associated with ethanol feeding
and folate deficiency, liver mRNA levels were examined in cRNA preparations from two liver
specimens from each group. cRNAs were hybridized with HumU133A oligo arrays (Affymetrix,
Santa Clara, CA) which contain 22,283 probe sets. Since pig-specific array is not commercially
available, we use the human array system. All Affymetrix data were filtered for those genes with
fluorescent intensity value of less than 100. Genes whose expressions in livers from the folate
deficient and ethanol fed groups were either increased or decreased by 2-fold or more (p<0.05)
compared to those in livers from the control group were considered significantly changed.
GeneChip cRNA probes used in GeneChip expressions were obtained by following a protocol
from the manufacturer. First strand cDNA was synthesized by reverse transcription of 8 µg total
RNA with superscript II reverse transcriptase (Invitrogen, Carlsbad, CA) and T7-oligo (dT) 24
primer (Genset Oligos, Boulder, CO), followed by second strand cDNA synthesis. Biotin-labeled
cRNA probes were generated by reverse transcription of double stranded cDNA using BioArray
High yield RNA transcript labeling kit (ENZO Life Sciences, Inc., Farmingdale, NY). The cRNA
probes were purified from unincorporated nucleotides by RNeasy mini column (QIAGEN,
Valencia, CA), fragmented and hybridized overnight at 680 C to the Human GeneChip array (HG
U133A, Affymetrix). The hybridized probe array was stained with streptavidin phycoerythrin
conjugate and scanned by the GeneArray scanner. To confirm the reproducibility of microarray
data, selected cRNA samples were analyzed twice. Data for the microarray experiments used in
this study can be found in the NCBI Gene Expression Omnibus (GEO), with series accession
number GSE2099.

FINAL ACCEPTED VERSION MANUSCRIPT NUMBER (G-00542-2004.R1)
8
RNA Isolation, cDNA synthesis and cloning of nucleic acids- Total RNA was isolated from
liver tissue using an RNeasy mini kit (QIAGEN, Valencia, CA) followed by DNase treatment.
Reverse transcription was carried out with oligo dT primer and superscript II reverse transcriptase
from 2 µg of total RNA following the protocol provided in the first strand cDNA synthesis kit
(Invitrogen, Calsbad, CA). Each amplified cDNA fragment was ligated to TA-pCR-2.1 TOPO
vector (TOPO TA Cloning kit, Invitrogen, Calsbad, CA), transformed into E.coli cells, sequenced
and gel purified. Primers from the authenticated pig cDNA sequence were designed using a
Primer Express program (Version 2, Applied Biosystems, Foster City, CA) to generate PCR
products of 50. Primer sequences were identified through GenBank for transcripts of genes of
interest. All the primers were designed from pig specific sequences obtained from GenBank and
specificity of PCR products were verified by agarose gel purification and sequencing. The primer
pairs included, for CYP2E1: 5’-CTACATCATCCCCAAGGGCA-3’ and 5’-
AAGACGGAGTCCAGTGTCGG-3’; for GRP78: 5’-GTGGAGATCATCGCCAACG-3’ and 5’-
CACATATGACGGCGTGATGC-3’; for SREBP-1c:5’-GGCGAAGCTGAATAAATCCG-3’and
5’-CGGATGTAGTCGATGGCCTT-3’; for FAS:5’-GACGGGTATACGCCACCATC-3’ and 5’-
TGGAACCGTCTGTGTTCGTG-3’; for ACC:5’-TCCACTCAAGCATACCTCCCA-3’and 5’-
CGTCAGCATGTCAGAAGGCA-3’; for SCD:5’-CGGTATCCTGTTGATGTGCTTC-3’ and 5’-
CAATACCAGGGCACACGATCGT-3’; for TNFR1:5’-TCTTTCCCTGGCATTCTTCC-3’ and
5’-CGTTGGTAGCGGCAAGCTAA-3’;and for β-actin:5’- TCGATCATGAAGTGCGACGT-
3’and 5’-CGTGTTGGCGTAGAGGTCCT -3’.
Real time PCR- Quantitative RT-PCR analysis was used to confirm microarray results for
selected response genes and to analyze other genes of interest in all 24 liver samples. β-actin was
used as an internal control in all mRNA expression analysis, and each reaction was performed in
triplicate using the ABI Prism 7900 sequence detection system (Applied Biosystems, Foster City,

FINAL ACCEPTED VERSION MANUSCRIPT NUMBER (G-00542-2004.R1)
9
CA). Separate standard curve cDNA dilutions were included in each PCR run and liver transcripts
were expressed as a ratio normalized to β-actin levels.
Protein Isolation and Western Blot Analysis- For total protein isolation, 100 mg of each
liver tissue sample was homogenized in ice-cold lysis buffer (50 mM Tris-HCl, pH 7.4, 150 mM
NaCl, 2 mM EDTA and 1% NP-40) containing protease inhibitor cocktail (Sigma, St.Louis, MO).
After 30 min incubation on ice, the tissue suspensions were centrifuged at 15,000 g for 15 min at
40 C. The supernatants were collected and protein concentrations were measured by the Bio Rad
protein assay (Bio Rad, Hercules, CA). For nuclear extract preparation, 100 mg of liver tissues
were homogenized in ice-cold homogenization buffer A (10 mM HEPES pH 7.9, 10 mM KCl, 0.1
mM EDTA, 0.1 mM EGTA, 1 mM DTT) containing 1% NP-40 and protease inhibitors. After 10
min incubation on ice, the tissue suspensions were centrifuged for 1 min at 40 C. The nuclear
pellets were dissolved in buffer B (20mM HEPES pH 7.9, 400 mM NaCl, and 1 mM each of DTT,
EDTA and EGTA) containing protease inhibitors, and placed on a rotatory shaker for 15 min,
followed by centrifugation at 11,000 g for 15 min at 40 C. The supernatants (nuclear extracts) were
stored at -700 C. Microsomal fractions were obtained by homogenizing 500 mg of liver tissue in 6
ml of ice-cold 0.1 M sodium phosphate buffer, pH 7.6 containing protease inhibitor cocktail
followed by centrifugation at 40,000 g for 30 min at 40 C. The supernatants were collected and
centrifuged at 100,000 g for 60 min to give microsomal pellets. The pellets were dissolved in 0.1
M sodium phosphate buffer and stored at -700 C. Total liver homogenates (100 µg), microsomes
(8 µg) and or nuclear extracts (20 µg) were separated on SDS-PAGE, electroblotted onto 0.2 µm
nitrocellulose membranes and blocked in 5% milk in TBST (Tris-buffered saline at pH 7.5
containing 0.1% Tween 20) for one hour at room temperature. Immunoblot analyses were carried
out using the following multispecies antibodies: anti-GRP78 (1:1000), anti-caspase 9 (1:1000)
(StressGen, Victoria, CA), anti-Caspase12 (1:700), anti-FADD (1:1000) (Chemicon, Temecula,

FINAL ACCEPTED VERSION MANUSCRIPT NUMBER (G-00542-2004.R1)
10
CA), anti-SREBP-1 (1:500), anti-cytochrome C (1:500) (Santa Cruz, CA) and anti-β-actin
(1:10,000) (Sigma, St. Louis, Mo). Antibody to purified liver human CYP2E1 was a gift from
J.M. Lasker. 1:5000 dilutions of horseradish peroxidase-conjugated anti-rabbit IgG (Pierce,
Rockford, IL) was used as the secondary antibody (1:10,000 dilution of anti-mouse IgG for β-
actin). After incubation with primary and secondary antibodies, blots were developed with the
HRP SuperSignal chemiluminescent detection system (Pierce, Rockford, IL). Band intensities
were quantified using ImageQuant software (Molecular Dynamics) and standardized against β-
actin.
Statistical Analyses-All values obtained from each group are expressed as mean + SEM.
Significant differences between the four feeding groups were determined by two-way ANOVA.
For these analyses, the effect of folate deficiency was determined by changes in FD and FDE
groups, the effect of ethanol by changes in FSE and FDE groups, and the interactive or additive
effects of both factors were determined by changes in FDE according to two-way ANOVA. One-
way ANOVA was used to qualify selective results. Data from the present study were correlated to
previously published values for SAH, the SAM to SAH ratio, and/or homocysteine (19) by linear
regression analysis using SPSS 10 for windows (SPSS Inc.).

FINAL ACCEPTED VERSION MANUSCRIPT NUMBER (G-00542-2004.R1)
11
RESULTS
Induction of apoptosis by ethanol feeding and folate deficiency- Hepatocellular apoptosis
was analyzed according to the appearance of TUNEL-positive hepatocytes that exhibited the
morphological features of decreased size with highly condensed and fragmented nuclei (Fig.1a),
and was induced by ethanol feeding and enhanced by the interaction of ethanol feeding with folate
deficiency (Fig.1b). According to linear regression analysis using data from all 24 micropigs, the
numbers of apoptotic nuclei were correlated separately to hepatic SAH and homocysteine levels
(Table 3).
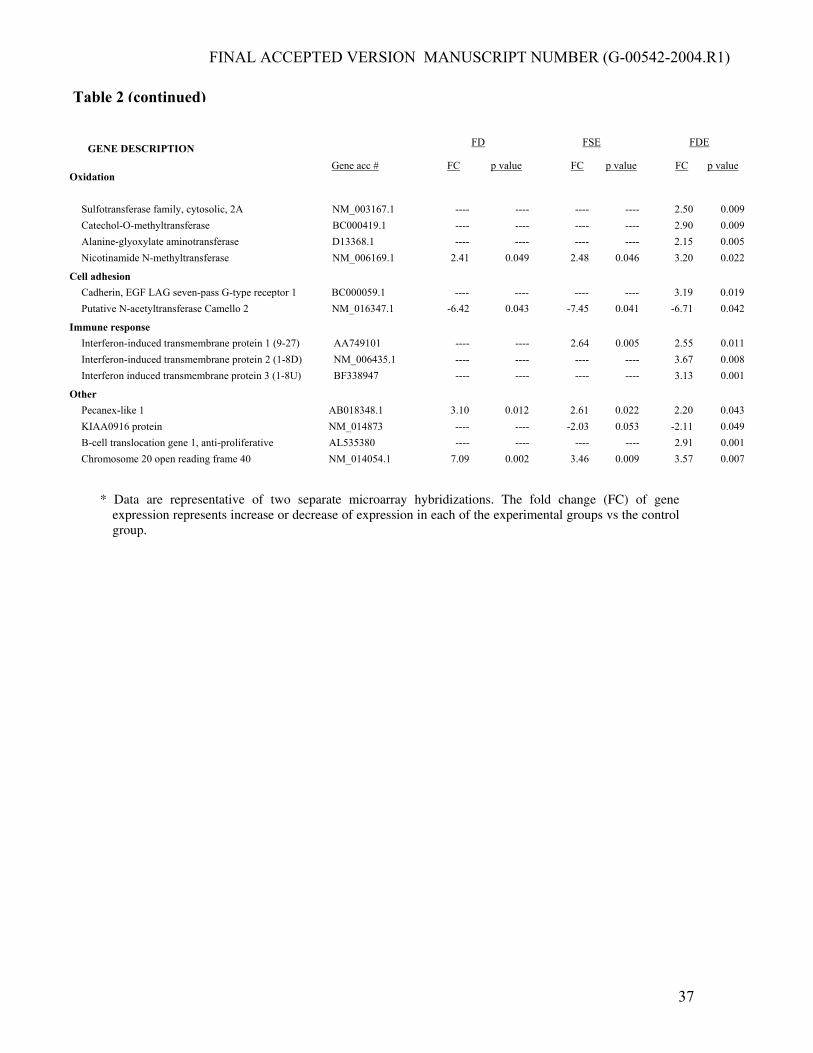
Microarray analysis of effects of folate deficiency and ethanol feeding on gene expression-
Microarray analyses of liver specimens from each group showed that more than 200 genes were
differentially expressed in the livers of animals fed the folate deficient, ethanol containing, and
combined diets by greater or lesser than 2-fold (p<0.05) compared to control group results.
Activated genes in the FD, FSE, and FDE groups included CYP2E1 and GRP 78, whereas acyl-
Coenzyme A dehydrogenase, which promotes lipid oxidation, was down-regulated in each group
(Table 2). Comparing results with microarrays from other species, hydroxyacyl-Coenzyme A
dehydrogenase type II was down-regulated in ethanol fed mice (14)and regucalcin senescence
marker protein-30 was downregulated in ethanol fed rats (13), contrary to upregulation of each
gene in the present study (Table 2).
Effects of diets on hepatic CYP2E1 levels- Confirming the microarray data, CYP2E1
transcripts were activated by folate deficiency and ethanol separately and by an interaction of the
two diets (Fig. 2a). CYP2E1 protein levels were increased independently by folate deficiency and
ethanol feeding (Fig. 2b, c). According to linear regression analyses, the hepatic levels of CYP2E1
transcripts were correlated positively to levels of SAH and negatively to the SAM to SAH ratio,

FINAL ACCEPTED VERSION MANUSCRIPT NUMBER (G-00542-2004.R1)
12
while protein levels of CYP2E1 correlated positively to both SAH and homocysteine and
negatively to the SAM to SAH ratio (Table 3).
Effects of diets on ER stress response genes- The mRNA expression of the UPR response
marker GRP78 was increased in ethanol groups, with an interaction of both factors in the
combined feeding group (Fig. 3a). GRP78 protein was induced independently by folate deficiency
and ethanol feeding (Fig. 3b, c). According to linear regression analyses, levels of both GRP78
transcripts and protein were correlated positively to liver SAH and homocysteine levels and
negatively to the SAM to SAH ratio (Table 3).
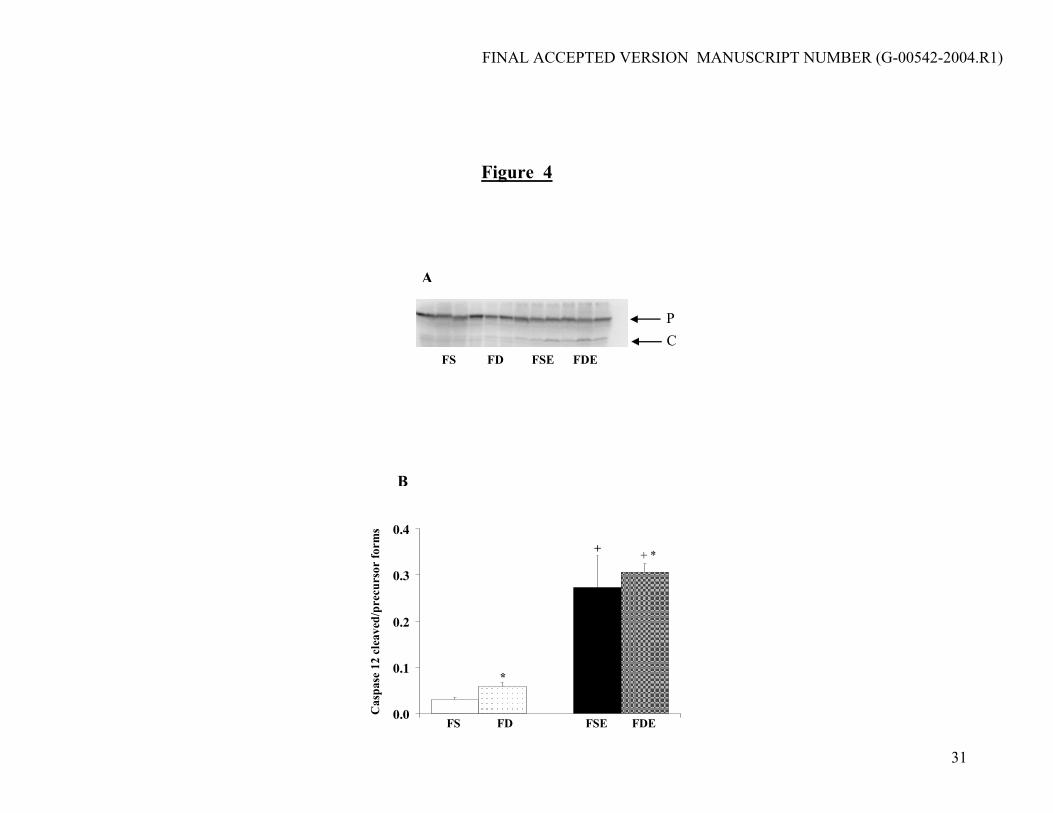
The ER signaling of apoptosis was analyzed as the ratio of the active cleaved form to its
uncleaved precursor form of caspase 12. Accordingly, caspase 12 activation was increased
independently by both folate deficiency and ethanol feeding (Fig. 4a, b). The ratio of the cleaved
to uncleaved forms of caspase 12 was correlated positively to liver homocysteine levels and
negatively to the SAM to SAH ratio (Table 3).
The ER signaling of steatosis was analyzed according to the activation of SREBP- 1c and
the expression of its nuclear protein nSREBP-1c.The mRNA transcripts of SREBP-1c were
increased independently by folate deficiency according to one-way ANOVA and by ethanol
according to 2-way ANOVA (Fig. 5a). The protein levels of nSREBP-1c protein were increased
independently by both folate deficiency and ethanol feeding (Fig. 5b, c). SREBP-1c mRNA was
correlated to SAH and homocysteine and negatively to the SAM to SAH ratio, while nuclear
SREBP-1c protein levels were correlated with liver SAH and negatively to the SAM to SAH ratio
(Table 3).
The physiological effects of SREBP-1c signaling were analyzed by measurements of the
mRNA transcripts of the lipid synthesizing genes SCD, ACC, and FAS. The transcripts of SCD
and ACC were each increased separately by folate deficiency according to one-way ANOVA and
FINAL ACCEPTED VERSION MANUSCRIPT NUMBER (G-00542-2004.R1)
13
by ethanol feeding according to two-way ANOVA (Fig. 6a, b). The transcripts of each of these
genes were correlated to levels of SAH and/or homocysteine and negatively to the SAM to SAH
ratio (Table 3). The mRNA transcripts of FAS were increased only by ethanol (Fig.6 c), but were
correlated to liver homocysteine levels (Table 3).
Extrinsic and intrinsic apoptotic pathway responses- Ethanol feeding alone increased
transcript levels of TNFR1 (data not shown). The protein levels of FADD, cytosolic cytochrome C
and the cleaved form of caspase 9 were each elevated by ethanol feeding, with no additive effect
of folate deficiency (Fig. 7).

FINAL ACCEPTED VERSION MANUSCRIPT NUMBER (G-00542-2004.R1)
14
DISCUSSION
The present study suggests that alcoholic liver injury is promoted in the micropig through
alterations in hepatic methionine metabolism that also enhance the activation of CYP2E1 and
induce the ER stress signaling pathway. Our previous evidence for involvement of abnormal
methionine metabolism in the pathogenesis of ALD included the observation that the combination
of dietary folate deficiency with chronic ethanol feeding accelerated the onset of alcoholic liver
injury in the micropig, together with increases in serum homocysteine and hepatic levels of its
SAH metabolite with reduction in hepatic SAM (Table 1) that correlated with reduced GSH (19),
in contrast to our prior studies in the micropig that showed a more delayed response to ethanol
feeding with folate sufficient diets (17, 18). Using liver samples from this recent study (19), we
measured the effects of folate deficiency and ethanol feeding on CYP2E1 and signal pathways for
apoptosis and steatosis. Analysis of the microarray data showed marked elevation in CYP2E1 and
modest elevation of the ER stress marker GRP78 in all three experimental groups (Table 2). Of
potential importance, the microarray also demonstrated modest down-regulation of acyl-coenzyme
A dehydrogenase, in keeping with other studies that showed reduced mRNA levels of this
peroxisome proliferator-activated receptor alpha (PPARα) - mediated gene in ethanol fed mice
(15). In analyzing the individual gene expression data, we considered that the effect of one or
more abnormal methionine metabolites on CYP2E1 or an ER stress signal was suggested by a
separate effect of the folate deficient diet (FD), an interactive effect of folate deficient diet
combined with ethanol feeding (FDE), a positive correlation of an effect with elevated levels of
either homocysteine or SAH, and/or a negative correlation with the ratio of SAM to SAH. Our
data show that these criteria for the effect of abnormal methionine metabolism applied to the
activations of CYP2E1 and GRP78 according to microarray analysis (Table 2), the numbers of

FINAL ACCEPTED VERSION MANUSCRIPT NUMBER (G-00542-2004.R1)
15
TUNEL- positive apoptotic bodies in hepatocytes (Fig. 1 and Table 3), hepatic transcript and
protein levels of CYP2E1 (Fig. 2, and Table 3), and several critical markers of ER stress pathways
(Figs. 3, 4, and 5, Table 3). These effects appeared to be specific for the ER stress pathway, since
there were no apparent effects of folate deficiency, either with or without ethanol feeding, to
changes in selected signals in the extrinsic and intrinsic pathways for apoptosis. On the other hand,
these signals were elevated, as anticipated, in the two ethanol fed groups (Fig. 7).
While our data suggest that SAH and/or homocysteine act as mediators for the activation
of CYP2E1 and ER stress signals, the experiments do not clearly establish cause and effect, since
the data are associative and are based on results from tissues that were obtained at one point in
time. Also, certain other experimental limitations could impact on the strength of our findings.
Since all pig liver samples were collected after an 18 hour fast, potential acute ethanol effects on
CYP2E1 or ER signal pathways would not have been detected. Also, the levels of CYP2E1 might
have been influenced by ethanol withdrawal (4), or overnight fasting (8). In the absence of pig-
specific markers, we used the human Affimatrix chip in our microarray studies, which may
account for the fact that many relevant genes that were up-regulated according to real time PCR
transcript analyses (Fig. 2-6) were undetected by microarray (Table 2). Also, in the absence of pig
specific antibodies, we relied on human antibody to CYP2E1 or multispecies specific antibodies in
our other immunoblotting studies, which were effective in all experiments except for the
quantification of the three lipid synthesis enzymes.
Our findings on the CYP2E1 activation response pattern to the different diets with similar
effects of folate deficiency and ethanol feeding (Fig. 2) is not consistent with the findings of
progressive oxidative liver injury (19) and apoptosis (Fig. 1) that occurred with maximal effect of
the combined diet (Table 1) (19). These comparisons suggest that the potential oxidative and
apoptotic responses to CYP2E1 may differ in response to ethanol feeding and to folate deficiency

FINAL ACCEPTED VERSION MANUSCRIPT NUMBER (G-00542-2004.R1)
16
which, rather than adding to the ethanol effect, modulated the ethanol effect through its interaction
(Fig. 2). Furthermore, CYP2E1 is but one of several mechanisms for apoptosis, as shown in one of
our prior studies that demonstrated an apoptotic response to ethanol feeding with a folate sufficient
diet. Without invoking a CYP2E1 effect, this prior study related the apoptotic response to the
effects of lowered SAM to SAH ratio on dysregulation of DNA synthesis (18).
Data from other studies indicate potential roles for methionine metabolites in the oxidative
injury response to ethanol feeding. Studies in CYP2E1 over expressing HepG2 cells have shown
that the ethanol induced activation of CYP2E1 produces hydroxyethyl radical which promotes
lipid peroxidation, mitochondrial damage, and decreased cell viability (9) that is aggravated by
depletion of GSH (39). Others found that SAM plays an important role in the regulation of GSH
levels and mitochondrial antioxidant defense (11, 26). While ours is the first study to show that
CYP2E1 can be induced by folate deficiency alone (Fig. 2), others showed that CYP2E1 was
activated by a methionine and choline deficient (MCD) diet (25). Others found that the MCD diet
enhances the TNFα and liver injury response to LPS in association with low hepatic SAM; all of
which were attenuated by the addition of SAM to the diet (10, 30). A subsequent study found that
SAM attenuated the LPS - mediated transcription of TNFα in cultured murine macrophages (38).
Most recently, elevated SAH levels were induced together with TNFα in ethanol-fed mice, and in
vitro induction of SAH enhanced the apoptosis response to TNFα in HepG2 cells (34).
Potential mechanisms to relate abnormal methionine metabolism to the activation of
CYP2E1 are speculative. Since SAM is the principal methyl donor for DNA, RNA, and proteins,
and its effects are opposed by its product SAH, the SAM to SAH ratio is regarded as an index of
methylation potential (21, 40). While the expression of rat CYP2E1 is developmentally regulated
by hypomethylation in the 5’ promoter region (37), others showed that overall cellular mRNA
synthesis in HepG2 cells was enhanced by hypomethylation that was induced by SAH hydrolase

FINAL ACCEPTED VERSION MANUSCRIPT NUMBER (G-00542-2004.R1)
17
inhibitors that decreased the SAM to SAH ratio (21). Although the promoter sequence of pig
CYP2E1 is unknown, our finding that transcript levels of CYP2E1 were correlated negatively to
the SAM to SAH ratio (Table 3) suggests a hypomethylation mechanism for its activation in our
animal model. The same mechanism could apply to the activation of ER stress pathway observed
in the present experiments.
Our data provide substantial evidence that both apoptosis and steatosis were mediated
through the ER stress pathway in the micropig model, and that activation of this pathway was
mediated positively by homocysteine or SAH, or negatively by the SAM to SAH ratio. The
finding that the UPR chaperone GRP78 was activated in response to ethanol feeding and folate
deficiency (Fig. 3; Table 2) is consistent with prior evidence that SAH and/or homocysteine are
activators of the ER survival pathway (2, 33). At the same time, we found up-regulation of the
proapoptotic pathway, as represented by enhanced production of the cleaved and active form of
caspase 12 (Fig. 4). Our findings are also consistent with the SREBP activation mechanism for
steatosis and suggest that this pathway is under regulatory control by abnormal methionine
metabolism. The activation of SREBP 1-c transcripts and the translocation of its mature protein to
the nuclear membrane were up regulated by both folate deficiency and ethanol feeding, while the
levels of both transcripts and nuclear protein correlated to levels of SAH (Fig. 5, Table 3).
Furthermore, two SREBP 1-c- regulated lipid synthesis genes, SCD and ACC, were activated both
by folate deficiency and ethanol (Fig. 6), while transcript levels of each of these genes as well as
FAS were correlated to liver SAH or homocysteine (Table 3). The findings that levels of selected
signals in the extrinsic and intrinsic pathways of apoptosis were only influenced by ethanol
feeding (Fig. 7) underscores the specificity of the ER stress pathway for activation by abnormal
methionine metabolites.

FINAL ACCEPTED VERSION MANUSCRIPT NUMBER (G-00542-2004.R1)
18
Others showed that SREBP-1c activation can be induced by ethanol feeding as a
mechanism for alcoholic steatosis. Mice fed 27.5% of kcal as ethanol with a low fat diet for 4
weeks developed fatty liver with 3.5-fold increase in triglyceride, together with increased levels of
the mature nuclear form of SREBP-1c and increased transcripts of SREBP-1c targeted triglyceride
synthesis genes FAS, ACC and SCD. Acetaldehyde may be central to the SREBP response to
ethanol, since complementary experiments in rat hepatoma cells showed that the SREBP-1
promoter was activated and protein levels of nuclear SREBP-1 were increased by graded
concentrations of ethanol but blocked by 4-methylpyrazole (41). Others showed that SREBP-1c is
a negative inhibitor of the transcription of cytosolic alcohol dehydrogenase (ADH-1), so that a
decrease in SREBP allows an increase in the expression of ADH-1 (20) , whereas SREBP-1c was
induced in HepG2 cells exposed to increasing concentrations of acetaldehyde (27). Another in
vivo mouse study linked the effects of ethanol induced ER stress to methionine metabolism,
whereby elevated liver SREBP-1 and caspase 12 were associated with hepatic steatosis and
hepatocellular apoptosis, all of which were attenuated by the concurrent feeding of betaine, a
compound that is known to reduce homocysteine levels (24).
Acknowledgments-We are grateful to Dr. Jerome M. Lasker, Senior Scientist, Bell Atlantic
Laboratories, for providing the antibody to human CYP2E1.
Grants- This work was supported by a grant from the National Institutes of Health, number AA
14145-02 to CHH and AA 08116-12 to SWF.

FINAL ACCEPTED VERSION MANUSCRIPT NUMBER (G-00542-2004.R1)
19
Disclosures- None of the authors have any intellectual or financial conflict of interest with this
work.

FINAL ACCEPTED VERSION MANUSCRIPT NUMBER (G-00542-2004.R1)
20
REFERENCE LIST
1. Adachi M and Ishii H. Role of mitochondria in alcoholic liver injury(1)(2). Free Radic
Biol Med 32: 487-491, 2002.
2. Austin RC, Lentz SR, and Werstuck GH. Role of hyperhomocysteinemia in endothelial
dysfunction and atherothrombotic disease. Cell Death Differ 11 Suppl 1: S56-64, 2004.
3. Barak AJ, Beckenhauer HC, Tuma DJ, and Badakhsh S. Effects of prolonged ethanol
feeding on methionine metabolism in rat liver. Biochem Cell Biol 65: 230-233, 1987.
4. Bardag-Gorce F, Li J, French BA, and French SW. Ethanol withdrawal induced
CYP2E1 degradation in vivo, blocked by proteasomal inhibitor PS-341. Free Radic Biol Med 32:
17-21, 2002.
5. Breckenridge DG, Germain M, Mathai JP, Nguyen M, and Shore GC. Regulation of
apoptosis by endoplasmic reticulum pathways. Oncogene 22: 8608-8618, 2003.
6. Brostrom MA and Brostrom CO. Calcium dynamics and endoplasmic reticular function
in the regulation of protein synthesis: implications for cell growth and adaptability. Cell Calcium
34: 345-363, 2003.
7. Brown MS and Goldstein JL. The SREBP pathway: regulation of cholesterol metabolism
by proteolysis of a membrane-bound transcription factor. Cell 89: 331-340, 1997.
8. Caro AA and Cederbaum AI. Oxidative stress, toxicology, and pharmacology of
CYP2E1. Annu Rev Pharmacol Toxicol 44: 27-42, 2004.
9. Cederbaum AI, Wu D, Mari M, and Bai J. CYP2E1-dependent toxicity and oxidative
stress in HepG2 cells. Free Radic Biol Med 31: 1539-1543, 2001.

FINAL ACCEPTED VERSION MANUSCRIPT NUMBER (G-00542-2004.R1)
21
10. Chawla RK, Watson WH, Eastin CE, Lee EY, Schmidt J, and McClain CJ. S-
adenosylmethionine deficiency and TNF-alpha in lipopolysaccharide- induced hepatic injury. Am
J Physiol 275: G125-129, 1998.
11. Colell A, Garcia-Ruiz C, Miranda M, Ardite E, Mari M, Morales A, Corrales F,
Kaplowitz N, and Fernandez-Checa JC. Selective glutathione depletion of mitochondria by
ethanol sensitizes hepatocytes to tumor necrosis factor. Gastroenterology 115: 1541-1551, 1998.
12. Cravo ML and Camilo ME. Hyperhomocysteinemia in chronic alcoholism: relations to
folic acid and vitamins B(6) and B(12) status. Nutrition 16: 296-302, 2000.
13. Deaciuc IV, Arteel GE, Peng X, Hill DB, and McClain CJ. Gene expression in the liver
of rats fed alcohol by means of intragastric infusion. Alcohol 33: 17-30, 2004.
14. Deaciuc IV, Doherty DE, Burikhanov R, Lee EY, Stromberg AJ, Peng X, and de
Villiers WJ. Large-scale gene profiling of the liver in a mouse model of chronic, intragastric
ethanol infusion. J Hepatol 40: 219-227, 2004.
15. Fischer M, You M, Matsumoto M, and Crabb DW. Peroxisome proliferator-activated
receptor alpha (PPARalpha) agonist treatment reverses PPARalpha dysfunction and abnormalities
in hepatic lipid metabolism in ethanol-fed mice. J Biol Chem 278: 27997-28004, 2003.
16. Halsted CH. Nutrition and alcoholic liver disease. Semin Liver Diseases 24: 289-304,
2004.
17. Halsted CH, Villanueva J, Chandler CJ, Ruebner B, Munn RJ, Parkkila S, and
Niemelä O. Centrilobular distribution of acetaldehyde and collagen in the ethanol-fed micropig.
Hepatology 18: 954-960, 1993.
18. Halsted CH, Villanueva J, Chandler CJ, Stabler SP, Allen RH, Muskhelishvili L,
James SJ, and Poirier L. Ethanol feeding of micropigs alters methionine metabolism and
increases hepatocellular apoptosis and proliferation. Hepatology 23: 497-505, 1996.

FINAL ACCEPTED VERSION MANUSCRIPT NUMBER (G-00542-2004.R1)
22
19. Halsted CH, Villanueva JA, Devlin AM, Niemela O, Parkkila S, Garrow TA, Wallock
LM, Shigenaga MK, Melnyk S, and James SJ. Folate deficiency disturbs hepatic methionine
metabolism and promotes liver injury in the ethanol-fed micropig. Proc Natl Acad Sci U S A 99:
10072-10077, 2002.
20. He L, Simmen FA, Ronis MJ, and Badger TM. Post-transcriptional regulation of sterol
regulatory element-binding protein-1 by ethanol induces class I alcohol dehydrogenase in rat liver.
J Biol Chem 279: 28113-28121, 2004.
21. Hermes M, Osswald H, Mattar J, and Kloor D. Influence of an altered methylation
potential on mRNA methylation and gene expression in HepG2 cells. Exp Cell Res 294: 325-334,
2004.
22. Horton JD, Goldstein JL, and Brown MS. SREBPs: activators of the complete program
of cholesterol and fatty acid synthesis in the liver. J Clin Invest 109: 1125-1131, 2002.
23. Jaeschke H and Lemasters JJ. Apoptosis versus oncotic necrosis in hepatic
ischemia/reperfusion injury. Gastroenterology 125: 1246-1257, 2003.
24. Ji C and Kaplowitz N. Betaine decreases hyperhomocysteinemia, endoplasmic reticulum
stress, and liver injury in alcohol-fed mice. Gastroenterology 124: 1488-1499, 2003.
25. Leclercq IA, Farrell GC, Field J, Bell DR, Gonzalez FJ, and Robertson GR. CYP2E1
and CYP4A as microsomal catalysts of lipid peroxides in murine nonalcoholic steatohepatitis. J
Clin Invest 105: 1067-1075, 2000.
26. Lieber CS, Casini A, DeCarli LM, Kim CI, Lowe N, Sasaki R, and Leo MA. S-
adenosyl-L-methionine attenuates alcohol-induced liver injury in the baboon. Hepatology 11: 165-
172, 1990.

FINAL ACCEPTED VERSION MANUSCRIPT NUMBER (G-00542-2004.R1)
23
27. Lluis JM, Colell A, Garcia-Ruiz C, Kaplowitz N, and Fernandez-Checa JC.
Acetaldehyde impairs mitochondrial glutathione transport in HepG2 cells through endoplasmic
reticulum stress. Gastroenterology 124: 708-724, 2003.
28. Lu SC, Huang ZZ, Yang H, Mato JM, Avila MA, and Tsukamoto H. Changes in
methionine adenosyltransferase and S-adenosylmethionine homeostasis in alcoholic rat liver. Am J
Physiol Gastrointest Liver Physiol 279: G178-185, 2000.
29. Mato JM, Corrales FJ, Lu SC, and Avila MA. S-Adenosylmethionine: a control switch
that regulates liver function. Faseb J 16: 15-26, 2002.
30. McClain CJ, Hill DB, Song Z, Chawla R, Watson WH, Chen T, and Barve S. S-
Adenosylmethionine, cytokines, and alcoholic liver disease. Alcohol 27: 185-192, 2002.
31. Morgan K, French SW, and Morgan TR. Production of a cytochrome P450 2E1
transgenic mouse and initial evaluation of alcoholic liver damage. Hepatology 36: 122-134, 2002.
32. Rao RV, Ellerby HM, and Bredesen DE. Coupling endoplasmic reticulum stress to the
cell death program. Cell Death Differ, 2004.
33. Rutkowski DT and Kaufman RJ. A trip to the ER: coping with stress. Trends Cell Biol
14: 20-28, 2004.
34. Song Z ZZ, Uriarte S, Wang L, Kang YJ, Chen T, Barve S, McClain CJ. S-
adenosylhomocysteine sensitizes to TNF-alpha hepatotoxicity in mice and liver cells: a possible
etiological factor in alcoholic liver disease. Hepatology 40: 989-997, 2004.
35. Subcommittee on Swine Nutrition and Committee on Animal Nutrition NRC. Nutrient
Requirements of Swine, 10th Revised Edition (10th ed.). Washington, DC: National Academy
Press, 1998, p. 210 pp.
36. Tsukamoto H and Lu SC. Current concepts in the pathogenesis of alcoholic liver injury.
Faseb J 15: 1335-1349., 2001.

FINAL ACCEPTED VERSION MANUSCRIPT NUMBER (G-00542-2004.R1)
24
37. Umeno M, Morris S, Matsunaga E, Gelboin HV, and Gonzalez FJ. Sequence of the 5'
end of the developmentally regulated rat P450 PB1 (P450IIC6) gene. Nucleic Acids Res 16: 6249,
1988.
38. Watson WH, Zhao Y, and Chawla RK. S-adenosylmethionine attenuates the
lipopolysaccharide-induced expression of the gene for tumour necrosis factor alpha. Biochem J
342 ( Pt 1): 21-25, 1999.
39. Wu D and Cederbaum A. Glutathione Depletion in CYP2E1-Expressing Liver Cells
Induces Toxicity Due to the Activation of p38 Mitogen-Activated Protein Kinase and Reduction
of Nuclear Factor-{kappa}B DNA Binding Activity. Mol Pharmacol 66: 749-760, 2004.
40. Yi P, Melnyk S, Pogribna M, Pogribny IP, Hine RJ, and James SJ. Increase in plasma
homocysteine associated with parallel increases in plasma S-adenosylhomocysteine and
lymphocyte DNA hypomethylation. J Biol Chem 275: 29318-29323., 2000.
41. You M, Fischer M, Deeg MA, and Crabb DW. Ethanol induces fatty acid synthesis
pathways by activation of sterol regulatory element-binding protein (SREBP). J Biol Chem 277:
29342-29347, 2002.
42. Zhang K and Kaufman RJ. Signaling the unfolded protein response from the
endoplasmic reticulum. J Biol Chem 279: 25935-25938, 2004.

FINAL ACCEPTED VERSION MANUSCRIPT NUMBER (G-00542-2004.R1)
25
FIGURE LEGENDS
Figure 1. Effects of diets on hepatocyte apoptosis. Liver sections from animals fed folate
deficient, ethanol or combined diets were processed for the detection of DNA fragmentation by
the TUNEL assay. a) Note the presence of several nuclei positively stained for fragmented DNA
(arrows) in the ethanol fed and more significantly in the ethanol fed/folate deficient animals. For
quantification, b) apoptotic nuclei were counted in 10 fields in each liver sample to obtain average
values for each specimen. + Ethanol effect; p<0.002; § Interaction with folate deficiency (p<0.04).
Figure 2. Effects of diets on the hepatic expressions of CYP2E1. (a) CYP2E1 transcript levels
were quantified by real time RT-PCR. * Folate effect (p<0.01); + Ethanol effect (p<0.02); §
Interaction (p<0.04). (b) Immunoblot analysis of CYP2E1 in microsomal extracts from livers of
four experimental groups. Aliquots of liver microsomal fractions (8 �g) from each animal were
resolved in 14% SDS-polyacrylamide gel, transferred to nitrocellulose membrane, and probed
with anti-human CYP2E1. (c) Quantification of immunoblot results using ImageQuant software. *
Folate effect (p<0.02); + Ethanol effect (p<0.04)
Figure 3. Effects of diets on expression of GRP78 in liver. (a) GRP78 transcript levels by real
time RT PCR. + Ethanol effect (p<0.001); § Interaction (p<0.04). (b) Immunoblots of GRP78 (100
µg of protein) with anti-GRP78 polyclonal antibody. (c) Quantification of GRP78 protein bands
using ImageQuant. * Folate effect (p<0.03); + Ethanol effect (p<0.001).
Figure 4. Effects of diets on Caspase 12 activation. (a) Analysis of caspase 12 activation by
western blotting using 100 ug of liver cytosolic extracts. P, precursor; C, cleaved form of Caspase

FINAL ACCEPTED VERSION MANUSCRIPT NUMBER (G-00542-2004.R1)
26
12. (b) Quantification of caspase 12 activation as ratio of cleaved to precursor form. * Folate
effect (p<0.04); + Ethanol effect (p<0.001).
Figure 5. Effects of diets on expression of hepatic SREBP-1c. (a) SREBP-1c transcript levels by
real-time RT-PCR. * Folate effect by one-way ANOVA; + Ethanol effect (p<0.006). (b) SREBP-
1c activation by immunoblot (20 �g of nuclear extract). (c) Quantification of nSREBP-1c protein
levels by ImageQuant. * Folate effect (p<0.005); + Ethanol effect (p<0.01).
Figure 6. Effects of diets on transcripts of lipogenic enzymes. (a) SCD, * Folate effect (p<0.05,
one-way ANOVA); + Ethanol effect (p<0.03,). (b) ACC, * Folate effect (p<0.05,); + Ethanol effect
(p<0.002, two-way ANOVA). (c) FAS, + Ethanol effect (p<0.002,).
Figure 7. Effects of diets on proteins of extrinsic and intrinsic (mitochondrial) apoptotic
pathways. Immunoblots of representative proteins are shown. There were ethanol effects but no
effect of folate deficiency on the levels of cytochrome C (p<0.05), FADD (p<0.05) and the
cleaved form caspase 9 (p<0.05).

FINAL ACCEPTED VERSION MANUSCRIPT NUMBER (G-00542-2004.R1)
27
Figure 1a

FINAL ACCEPTED VERSION MANUSCRIPT NUMBER (G-00542-2004.R1)
28
0
20
40
60
80
FS FD FSE FDE
§#
of A
popt
otic
live
r ce
lls/m
m2
+
+
Figure 1b
A

FINAL ACCEPTED VERSION MANUSCRIPT NUMBER (G-00542-2004.R1)
29
Figure 2
CYP2E1β-actin
FS FD FSE FDE
B
0.0
0.5
1.0
1.5
2.0
CY
P2E
1 tr
ansc
ript
/β-a
ctin
FS FD FSE FDE
*§+*+
0.0
0.5
1.0
1.5
2.0
2.5
3.0
CY
P2E
1 pr
otei
n/β-
actin
FS FD FSE FDE
*+ +*
A C

FINAL ACCEPTED VERSION MANUSCRIPT NUMBER (G-00542-2004.R1)
30
GRP78
β-actin
FS FD FSE FDE
Figure 3
B
0.0
0.3
0.6
0.9
FS FD FSE FDE
*
+
GR
P78
prot
ein/β-
actin
+*
AC
0
1
2
3
4
GR
P78
tra
nscr
ipt/β-
acti
n
FS FD FSE FDE
§+
+
FINAL ACCEPTED VERSION MANUSCRIPT NUMBER (G-00542-2004.R1)
31
FS FD FSE FDE
PC
Figure 4
A
B
0.0
0.1
0.2
0.3
0.4
Cas
pase
12 c
leav
ed/p
recu
rsor
form
s
FS FD FSE FDE
+
*
+ *

FINAL ACCEPTED VERSION MANUSCRIPT NUMBER (G-00542-2004.R1)
32
nSREBP-1c
β-actin
FS FD FSE FDE
Figure 5
B
A C
SRE
BP
-1c
tran
scri
pt/β
-act
in
0.0
0.5
1.0
1.5
2.0
2.5
3.0
FS FD FSE FDE
+
+
*
*
0
10
20
30
40
50
60
nSR
EB
P-1
c pr
otei
n/β-
acti
n
FS FD FSE FDE
+
+*
*

FINAL ACCEPTED VERSION MANUSCRIPT NUMBER (G-00542-2004.R1)
33
Figure 6
0
5
10
15
FS FD FSE FDE
+
+
FAS
tran
scri
pt/β
-act
inA
B
C
0
1
2
3
4
SCD
tra
nscr
ipt/β-
acti
n
FS FD FSE FDE
++
*
*
0
1
2
3
4
AC
C t
rans
crip
t/β-
acti
n
FS FD FSE FDE
++
*
*

FINAL ACCEPTED VERSION MANUSCRIPT NUMBER (G-00542-2004.R1)
34
Figure 7
Cytochrome C
Cleaved Caspase 9
FADD
FS FD FSE FDE
β-actin

FINAL ACCEPTED VERSION MANUSCRIPT NUMBER (G-00542-2004.R1)
35
Table 1. Selected findings in micropig livers on metabolic effects of ethanol feeding with and without folate deficiency (16)
Diet
Folate, µg/g
Homocysteine,
mnol/mg
protein
SAM, pmol/mg
protein
SAH, pmol/mg
protein
SAM/SAH Plasma AST,
units liter
FS 4.56 ± 1.23 0.77 ± 0.12 364 ± 30 136 ± 10 2.74 ± 0.21 42.0 ± 2.7
FD 2.30 ± 0.49* 0.93 ± 0.05 298 ± 10 243 ± 10* 1.23 ± 0.04* 47.7 ± 2.4
FSE 6.83 ± 0.66 1.10 ± 0.05† 261 ± 40† 218 ± 20† 1.18 ± 0.10† 108.6 ± 22.2†
FDE 2.52 ± 0.37* 1.13 ± 0.05† 246 ± 50† 291 ± 20*†‡ 0.83 ± 0.11*†‡ 350.8 ± 97.4†‡
P, folate
P, ethanol
P,FDE > FSE
p<0.001
p<0.003
p<0.03
p<0.001
p<0.001
p<0.02
p<0.001
p<0.001
p<0.04
p<0.01
p<0.04

FINAL ACCEPTED VERSION MANUSCRIPT NUMBER (G-00542-2004.R1)
36
Table 2. Gene expression profile in ethanol-fed/folate-
deficient pig liver as compared with control *
GENE DESCRIPTION
FD FSE FDE
Oxidation Gene acc # FC
p value FC p value FC p value
Cytochrome P450, subfamily IIE (ethanol-inducible) AF182276.1 22.08 0.001 8.53 0.010 12.41 0.004 Cytochrome P450, subfamily IIA (phenobarbital-inducible)
NM_000762.2 3.05 0.030 6.30 0.004 7.85 0.002
Peroxiredoxin 4 NM_006406.1 ---- ---- ---- ---- 2.10 0.003
Apoptosis Caspase 6, apoptosis-related cysteine protease BC000305.1 2.00 0.050 4.55 0.003 4.72 0.003 Programmed cell death 4 NM_005016.1 ---- ---- 2.00 0.038 4.54 0.004 Gelsolin (amyloidosis, Finnish type) BE675337 ---- ---- ---- ---- 2.24 0.008
Cell signaling Insulin-like growth factor binding protein 2, 36kDa NM_000597.1 ---- ---- 3.12 0.027 2.60 0.047 STAT induced STAT inhibitor-2 AB004903.1 ---- ---- ---- ---- 2.15 0.048 Regucalcin (senescence marker protein-30) D31815.1 ---- ---- 2.57 0.015 2.69 0.015 SOCS box-containing WD protein SWiP-1 NM_015626.1 ---- ---- ---- ---- 2.20 0.018 Follistatin NM_013409.1 ---- ---- ---- ---- 2.23 0.008 Guanine nucleotide binding protein (G protein) NM_005273.1 --- ---- ---- ---- 2.40 0.047 Thyroid hormone receptor interactor 12 NM_004238 ---- ---- ---- ---- -4.35 0.016 Brain abundant, membrane attached signal protein 1 NM_006317 ---- ---- ---- ---- -2.95 0.041 Annexin A2 NM_004039.1 -2.42 0.010 -2.00 0.014 -2.02 0.012 v-kit Hardy-Zuckerman 4 feline sarcoma viral oncogene NM_000222.1 ---- ---- ---- ---- 2.37 0.009
Cytoskeletal Gelsolin (amyloidosis, Finnish type) BE675337 ---- ---- ---- ---- 2.24 0.008 Adducin 2 (beta) NM_017482.1 ---- ---- ---- ---- 2.39 0.007 Ankyrin 3, node of Ranvier (ankyrin G) NM_020987.1 ---- ---- -2.18 0.041 -2.21 0.040
Transcription factor Transcription factor IIB NM_013242.1 ---- ---- ---- ---- 3.02 0.025 ZAP3 protein AI952986 ---- ---- ---- ---- 2.93 0.003 v-maf musculoaponeurotic fibrosarcoma oncogene NM_005461.1 -2.75 0.006 -2.66 0.008 -2.10 0.013 RAR-related orphan receptor A L14611.1 -5.68 0.028 -4.29 0.033 -4.75 0.031
Translation/post-translational Poly(rC) binding protein 2 NM_005016.1 ---- ---- 2.00 0.038 4.54 0.004 Ribosomal protein, large, P0 AA555113 ---- ---- 2.24 0.048 2.40 0.038 Eukaryotic translation initiation factor 3 BC000733.1 ---- ---- ---- ---- 2.12 0.015 Heat shock 70kDa protein 1A NM_005345.3 ---- ---- ---- ---- 2.21 0.020 Heat shock 70kDa protein 8 AB034951.1 ---- ---- ---- ---- 2.13 0.036 Ribosomal protein L7a NM_000972.1 ---- ---- ---- ---- 2.09 0.017 Glucose-regulated protein, 78kDa AF216292.1 2.06 0.043 4.30 0.030 2.00 0.030 Arginine-glutamic acid dipeptide (RE) repeats AB036737.1 -2.13 0.006 -2.00 0.009 -2.29 0.005
Lipid metabolism Hydroxyacyl-Coenzyme A dehydrogenase, type II NM_004493.1 ---- ---- ---- ---- 2.25 0.006 Acyl-Coenzyme A dehydrogenase, long chain AI367275 -2.10 0.022 -2.44 0.015 -2.50 0.016 Farnesyl diphosphate synthase NM_002004 -3.60 0.022 -4.80 0.027 -7.39 0.013 Solute carrier family 27 (fatty acid transporter), member 2 NM_003645.1 ----- ---- ---- ---- 2.83 0.002
Other metabolism Lactate dehydrogenase B NM_002300.1 ---- ---- 2.71 0.030 2.70 0.032 Carboxypeptidase A2 (pancreatic) NM_001869.1 ---- ---- ---- ---- 2.48 0.017
FINAL ACCEPTED VERSION MANUSCRIPT NUMBER (G-00542-2004.R1)
37
Table 2 (continued)
GENE DESCRIPTION
FD FSE FDE
Oxidation Gene acc # FC
p value FC p value FC p value
Sulfotransferase family, cytosolic, 2A NM_003167.1 ---- ---- ---- ---- 2.50 0.009 Catechol-O-methyltransferase BC000419.1 ---- ---- ---- ---- 2.90 0.009 Alanine-glyoxylate aminotransferase D13368.1 ---- ---- ---- ---- 2.15 0.005 Nicotinamide N-methyltransferase NM_006169.1 2.41 0.049 2.48 0.046 3.20 0.022
Cell adhesion Cadherin, EGF LAG seven-pass G-type receptor 1 BC000059.1 ---- ---- ---- ---- 3.19 0.019 Putative N-acetyltransferase Camello 2 NM_016347.1 -6.42 0.043 -7.45 0.041 -6.71 0.042
Immune response Interferon-induced transmembrane protein 1 (9-27) AA749101 ---- ---- 2.64 0.005 2.55 0.011 Interferon-induced transmembrane protein 2 (1-8D) NM_006435.1 ---- ---- ---- ---- 3.67 0.008 Interferon induced transmembrane protein 3 (1-8U) BF338947 ---- ---- ---- ---- 3.13 0.001
Other Pecanex-like 1 AB018348.1 3.10 0.012 2.61 0.022 2.20 0.043 KIAA0916 protein NM_014873 ---- ---- -2.03 0.053 -2.11 0.049 B-cell translocation gene 1, anti-proliferative AL535380 ---- ---- ---- ---- 2.91 0.001 Chromosome 20 open reading frame 40 NM_014054.1 7.09 0.002 3.46 0.009 3.57 0.007
* Data are representative of two separate microarray hybridizations. The fold change (FC) of gene
expression represents increase or decrease of expression in each of the experimental groups vs the control group.

FINAL ACCEPTED VERSION MANUSCRIPT NUMBER (G-00542-2004.R1)
38
Table 3. Correlations of findings with methionine metabolites
SAM/SAH SAH Homocysteine
r p r p r p
Apoptosis -0.4 0.056 0.530 0.008 0.425 0.038
CYP2E1
mRNA -0.57 0.003 0.604 0.002 0.351 0.09
Protein -0.631 0.002 0.548 0.008 0.534 0.01
GRP78
mRNA -0.44 0.032 0.666 0.001 0.434 0.034
Protein -0.68 0.001 0.536 0.007 0.571 0.004
Caspase 12
Cleaved/
precursor -0.6 0.002 0.39 0.06 0.662 0.001
SREBP-1c
mRNA -0.44 0.033 0.510 0.01 0.442 0.03
Protein -0.45 0.027 0.576 0.008 0.392 0.058
FAS
mRNA -0.367 0.078 0.16 0.46 0.548 0.006
SCD
mRNA -0.41 0.050 0.32 0.14 0.596 0.003
ACC
mRNA -0.52 0.013 0.54 0.01 0.492 0.002
Copyright © 2022 FDOKUMEN