Chromosome Conformation Capture (from 3C to 5C) and Its ChIP-Based Modification
18
UNCORRECTED PROOF Chapter 12 Chromosome Conformation Capture (from 3C to 5C) and Its ChIP-Based Modification Alexey Gavrilov, Elvira Eivazova, Iryna Priozhkova, Marc Lipinski, Sergey Razin, and Yegor Vassetzky Abstract Chromosome conformation capture (3C) methodology was developed to study spatial organization of long genomic regions in living cells. Briefly, chromatin is fixed with formaldehyde in vivo to cross-link interacting sites, digested with a restriction enzyme and ligated at a low DNA concentration so that ligation between cross-linked fragments is favored over ligation between random fragments. Ligation products are then analyzed and quantified by PCR. So far, semi-quantitative PCR methods were widely used to estimate the ligation frequencies. However, it is often important to estimate the ligation frequencies more precisely which is only possible by using the real-time PCR. At the same time, it is equally necessary to monitor the specificity of PCR amplification. That is why the real-time PCR with TaqMan probes is becoming more and more popular in 3C studies. In this chapter, we describe the general protocol for 3C analysis with the subsequent estimation of ligation frequencies by using the real-time PCR technology with TaqMan probes. We discuss in details all steps of the experimental procedure paying special attention to weak points and possible ways to solve the problems. A special attention is also paid to the problems in interpretation of the results and necessary control experiments. Besides, in theory, we consider other approaches to analysis of the ligation products used in frames of the so-called 4C and 5C methods. The recently developed chromatin immunoprecipitation (ChIP)-loop assay representing a combination of 3C and ChIP is also discussed. Key words: 3C, ChIP-loop assay, 4C, 5C, TaqMan probes, real-time PCR, chromatin, genome spatial organization. 1. Introduction It becomes increasingly evident that spatial organization of the eukaryotic genome plays an important role in regulation of gene activity. Hence, it is very important to have a reliable experimental approach permitting to find out whether two remote genomic SPB-152001 12 May 2, 2009 Time: 16:40 Proof 1 1 2 3 4 5 6 7 8 9 10 11 12 13 14 15 16 17 18 19 20 21 22 23 24 25 26 27 28 29 30 31 32 33 34 35 36 37 38 39 40 41 42 43 44 45 46 47 48 Philippe Collas (ed.), Chromatin Immunoprecipitation Assays, Methods in Molecular Biology 567 DOI 10.1007/978-1-60327-414-2_12, ª Humana Press, a part of Springer Science+Business Media, LLC 2009
Transcript of Chromosome Conformation Capture (from 3C to 5C) and Its ChIP-Based Modification

UNCORRECTEDPROOF
Chapter 12
Chromosome Conformation Capture (from 3C to 5C)and Its ChIP-Based Modification
Alexey Gavrilov, Elvira Eivazova, Iryna Priozhkova, Marc Lipinski,Sergey Razin, and Yegor Vassetzky
Abstract
Chromosome conformation capture (3C) methodology was developed to study spatial organization oflong genomic regions in living cells. Briefly, chromatin is fixed with formaldehyde in vivo to cross-linkinteracting sites, digested with a restriction enzyme and ligated at a low DNA concentration so that ligationbetween cross-linked fragments is favored over ligation between random fragments. Ligation products arethen analyzed and quantified by PCR. So far, semi-quantitative PCR methods were widely used to estimatethe ligation frequencies. However, it is often important to estimate the ligation frequencies more preciselywhich is only possible by using the real-time PCR. At the same time, it is equally necessary to monitor thespecificity of PCR amplification. That is why the real-time PCR with TaqMan probes is becoming moreand more popular in 3C studies. In this chapter, we describe the general protocol for 3C analysis with thesubsequent estimation of ligation frequencies by using the real-time PCR technology with TaqManprobes. We discuss in details all steps of the experimental procedure paying special attention to weakpoints and possible ways to solve the problems. A special attention is also paid to the problems ininterpretation of the results and necessary control experiments. Besides, in theory, we consider otherapproaches to analysis of the ligation products used in frames of the so-called 4C and 5C methods. Therecently developed chromatin immunoprecipitation (ChIP)-loop assay representing a combination of 3Cand ChIP is also discussed.
Key words: 3C, ChIP-loop assay, 4C, 5C, TaqMan probes, real-time PCR, chromatin, genomespatial organization.
1. Introduction
It becomes increasingly evident that spatial organization of theeukaryotic genome plays an important role in regulation of geneactivity. Hence, it is very important to have a reliable experimentalapproach permitting to find out whether two remote genomic
SPB-152001 12 May 2, 2009 Time: 16:40 Proof 1
1
2
3
4
5
6
7
8
9
10
11
12
13
14
15
16
17
18
19
20
21
22
23
24
25
26
27
28
29
30
31
32
33
34
35
36
37
38
39
40
41
42
43
44
45
46
47
48
Philippe Collas (ed.), Chromatin Immunoprecipitation Assays, Methods in Molecular Biology 567DOI 10.1007/978-1-60327-414-2_12, ª Humana Press, a part of Springer Science+Business Media, LLC 2009

UNCORRECTEDPROOF
sites interact with each other in the nuclear space. In model sys-tems, such as plasmid constructs or phage DNA, it is sometimespossible to answer this question using electron microscopy. Withthe development of fluorescent in situ hybridization (FISH), itbecame possible to determine location of specific genomic ele-ments in the nuclear space and thus to find out if these elementsco-localize or not. However, this approach is far from being pre-cise. Localization of two signals in the same voxel does not neces-sarily mean that the corresponding genomic elements interact witheach other. Additional information can be obtained by usingfluorescence resonance energy transfer (FRET). This approachwas successfully used to study protein–protein interactions. How-ever, the possibility of using FRET in the studies of the spatialorganization of the genome has not yet been demonstrated even inmodel systems. Thus the so-called 3C technology is presently theonly experimental approach proven to permit identification ofdistant genomic regions interacting with each other in the nuclearspace.
The basic principle of the 3C protocol is shown in Fig. 12.1.Cells are treated with formaldehyde to cross-link proteins toother proteins nearby and DNA. After lysis of nuclei by SDSand solubilization of proteins that were not cross-linked, theresulting DNA–protein network is subjected to cleavage by arestriction enzyme(s), which is followed by ligation at a low
SPB-152001 12 May 2, 2009 Time: 16:40 Proof 1
This
figure
will
be
pri
nte
din
b/w
Fig. 12.1. A scheme representing the main principles of 3C technology. Cells are treatedwith formaldehyde and lysed. Non-linked proteins are removed by SDS, and cross-linkedchromatin is digested with a restriction enzyme(s), followed by ligation at a low DNAconcentration. Ligation products are analysed by PCR (with one primer pair one of fourpossible ligation products is examined). Two interacting restriction fragments are shownas framed light lines.
Gavrilov et al.
49
50
51
52
53
54
55
56
57
58
59
60
61
62
63
64
65
66
67
68
69
70
71
72
73
74
75
76
77
78
79
80
81
82
83
84
85
86
87
88
89
90
91
92
93
94
95
96

UNCORRECTEDPROOF
DNA
AQ1
concentration. Under such conditions, ligations betweencross-linked DNA fragments are strongly favored over ligationsbetween random fragments. After ligation, the cross-links arereversed, and ligation products are detected and quantified bypolymerase chain reaction (Fig. 12.1). The cross-linking fre-quency of two specific restriction fragments, as measured by theamount of corresponding ligation product, is proportional to thefrequency with which these two genomic sites interact. Thus, 3Canalysis provides information about the spatial organization ofchromosomal regions in vivo (1, 2).
Developed on the yeast system (1), 3C technology was thenadopted to analyze spatial organization of genomic loci in highereukaryotes. Successfully analyzed were both relatively small geno-mic domains such as mouse interferon gamma gene domain(25 Kb) (3), the mouse immunoglobulin kappa (Ig) gene domain(30 Kb) (4), chicken alpha globin gene domain (40 Kb) (5), andlonger areas such as the T-helper type 2 cytokine locus (140 Kb),(6) mammalian alpha and beta globin gene domains (up to200 Kb) (2, 7–10), and others. 3C was also used to detect transinteractions between functionally related elements located on dif-ferent chromosomes (11, 12). In these and other studies, it wasclearly demonstrated that spatial structure of genomic domainsdynamically changed upon activation/repression of gene expres-sion and other process taking place in cell nucleus.
In this chapter, we discuss a protocol for 3C analysis using real-time PCR with TaqMan probes. In the introduction sectionAQ2 belowwe also give an overview of methods based on the 3C technology,namely the 4C, 5C and chromatin immunoprecipitation (ChIP)-loop assays.
1.1. 4C and 5C Nowadays, 3C technology is getting more and more widespread,and is gradually a routine method to study interactions of genomicelements. In parallel, derivative methods adopting the same ideaare being developed. In this way, improving technology of DNAmicro-arrays and quantitative DNA sequencing resulted in appear-ance of the so-called 4C and 5C methods adopted for full genomescreening of interaction partners for some selected genome site.Differences between 3C, 4C, and 5C concern only ligation pro-duct analysis.
4C was independently developed in two variants differing innames but not in abbreviations. The first one is designated ascircular chromosome conformation capture. Ligation productsfirst are amplified by PCR. The strategy is aimed at amplificationof circular DNA molecules originated from cross-ligation of bothends of cross-linked restriction fragments (Fig. 12.2A). Two PCRprimers are designed to anneal at the opposite ends of a restrictionfragment of interest, facing outwards. In such a way, all DNAfragment ligated with the fragment of interest at both ends are
SPB-152001 12 May 2, 2009 Time: 16:40 Proof 1
Chromosome Conformation Capture (from 3C to 5C)
97
98
99
100
101
102
103
104
105
106
107
108
109
110
111
112
113
114
115
116
117
118
119
120
121
122
123
124
125
126
127
128
129
130
131
132
133
134
135
136
137
138
139
140
141
142
143
144
UNCORRECTEDPROOF
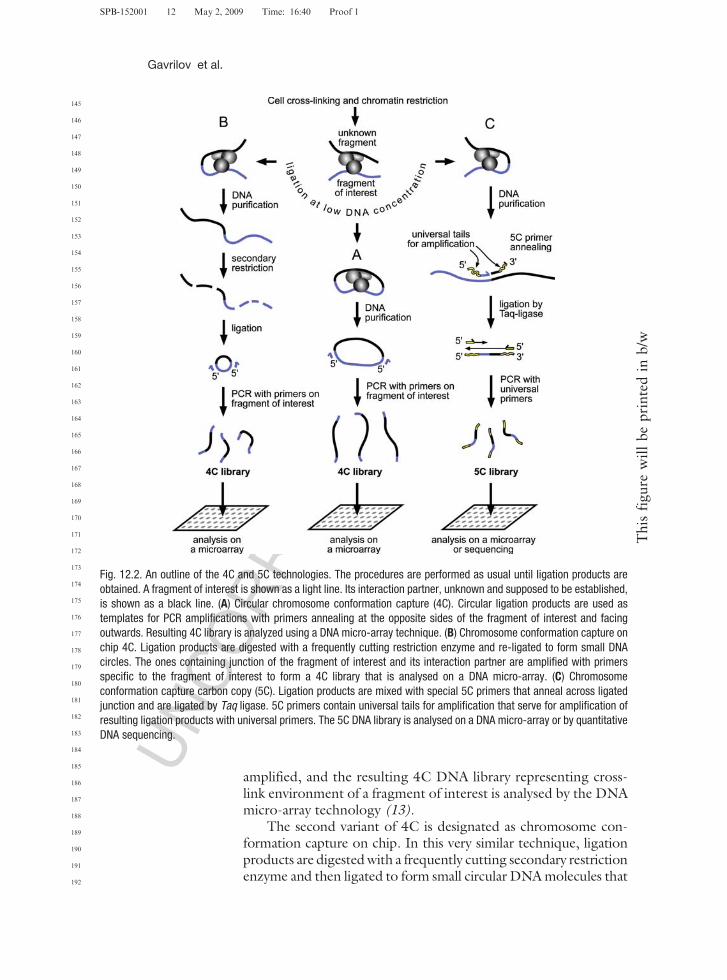
amplified, and the resulting 4C DNA library representing cross-link environment of a fragment of interest is analysed by the DNAmicro-array technology (13).
The second variant of 4C is designated as chromosome con-formation capture on chip. In this very similar technique, ligationproducts are digested with a frequently cutting secondary restrictionenzyme and then ligated to form small circular DNA molecules that
SPB-152001 12 May 2, 2009 Time: 16:40 Proof 1
This
figure
will
be
pri
nte
din
b/w
Fig. 12.2. An outline of the 4C and 5C technologies. The procedures are performed as usual until ligation products areobtained. A fragment of interest is shown as a light line. Its interaction partner, unknown and supposed to be established,is shown as a black line. (A) Circular chromosome conformation capture (4C). Circular ligation products are used astemplates for PCR amplifications with primers annealing at the opposite sides of the fragment of interest and facingoutwards. Resulting 4C library is analyzed using a DNA micro-array technique. (B) Chromosome conformation capture onchip 4C. Ligation products are digested with a frequently cutting restriction enzyme and re-ligated to form small DNAcircles. The ones containing junction of the fragment of interest and its interaction partner are amplified with primersspecific to the fragment of interest to form a 4C library that is analysed on a DNA micro-array. (C) Chromosomeconformation capture carbon copy (5C). Ligation products are mixed with special 5C primers that anneal across ligatedjunction and are ligated by Taq ligase. 5C primers contain universal tails for amplification that serve for amplification ofresulting ligation products with universal primers. The 5C DNA library is analysed on a DNA micro-array or by quantitativeDNA sequencing.
Gavrilov et al.
145
146
147
148
149
150
151
152
153
154
155
156
157
158
159
160
161
162
163
164
165
166
167
168
169
170
171
172
173
174
175
176
177
178
179
180
181
182
183
184
185
186
187
188
189
190
191
192

UNCORRECTEDPROOF
are amplified with primers facing outwards, specific to the restric-tion fragment of interest (Fig. 12.2B). The resulting 4C DNAlibrary is analyzed by DNA micro-array (chip) technology (14).
5C designates chromosome conformation capture carbon copy.Ligation products in this case are mixed with special primers that aredesigned to anneal at the very ends of restriction fragments, onesfacing outwards and the others inwards, so that an end of eachprimer covers exactly a half of a restriction site. In such a way,outward and inward primers anneal tail-to-head across ligated junc-tion of definite ligation products and then ligated with Taq ligase(Fig. 12.2C). Additionally, these primers contain universal tails foramplification. Such amplification having been done, resulting 5CDNA library is analyzed using either micro-arrays or quantitativeDNA sequencing. The 3C library determines which 5C ligationproducts are generated and how frequently. As a result, the 5Clibrary is a quantitative ‘‘carbon copy’’ of a part of the 3C library,as determined by the collection of 5C primers (15).
1.2. ChIP-Loop Assay Chromatin immunoprecipitation and chromosome conforma-tion capture methods operate with the same principle of fixingDNA–protein contacts in vivo, but are meant to address differentissues. The first gives information of which proteins bind to oneor another genomic site. The second is aimed to show whichgenomic sites interact in the nuclear space. While ChIP datamay be frequently interpreted without any concerns on DNAspatial organization, 3C data is regarded to some degree asincomplete as long as it is not supplemented with the knowledgeof which proteins are involved in interactions of sites of a locusunder study. That is why many studies involving 3C analysis havebeen assisted by ChIP experiments (4, 8, 10).
Recently, a method was developed to, at the same time, allowdetermining which genomic sites interact and suggesting candi-date proteins mediating the interaction. This method was called aChIP-loop assay (16). It is a combination of 3C and ChIP and isperformed as follows. Cells are fixed with formaldehyde, lysed, andthe cross-linked chromatin is purified of free proteins by ureagradient ultracentrifugation (16). Purified cross-linked chromatinis digested with a restriction enzyme and subjected to precipitationwith specific antibodies including standard for ChIP steps of pre-clearing with protein-A/G beads, incubation with specific (or pre-immune) antibodies, and final washing of the beads. Then thebeads with precipitated chromatin are resuspended in ligationbuffer, and the chromatin is ligated by T4 DNA ligase. Ligationproducts are then purified and analyzed as in usual 3C experiments(Fig. 12.3) (16–18).
Thus, ChIP-loop assay allows segregating from a panel oftested proteins those that may take part in DNA loop organization.However, it should be understood that a protein being cross-
SPB-152001 12 May 2, 2009 Time: 16:40 Proof 1
Chromosome Conformation Capture (from 3C to 5C)
193
194
195
196
197
198
199
200
201
202
203
204
205
206
207
208
209
210
211
212
213
214
215
216
217
218
219
220
221
222
223
224
225
226
227
228
229
230
231
232
233
234
235
236
237
238
239
240

UNCORRECTEDPROOF
linked to interacting DNA fragments is not sufficient for assumingprotein participation in DNA loop formation; the protein maybind DNA nearby interacting sites but do not mediate the inter-action. To that end, additional experiments may be helpful, forexample blocking protein expression and examining if the char-acteristic spatial configuration of the DNA region under study islost (19). Nevertheless in some aspects, ChIP-loop assay provides abetter insight than 3C and ChIP do when used apart. It concernsthe situation when a positive ChIP signal originates from a cellsubpopulation where the locus examined has a linear configura-tion, whereas a positive 3C signal corresponds to another cellsubpopulation in which the protein does not bind to the corre-sponding DNA sites.
2. Materials
2.1. Cell Fixation
and Lysis1. Equipment for cell culturing.
2. Materials necessary for single-cell suspension preparation.
3. PBS/FBS: PBS supplemented with 10% fetal bovine serum(FBS; if fixation is not carried out in cell growth medium).
4. Fix solution: solution of formaldehyde in the cell suspensionbuffer.
5. 2.5 M glycine.
6. PBS.
7. Cell lysis buffer: 10 mM Tris-HCl (pH 8.0), 10 mM NaCl,0.2% NP-40, fresh protease inhibitor cocktail.
SPB-152001 12 May 2, 2009 Time: 16:40 Proof 1
Fig. 12.3. The main steps of ChIP-loop assay. In 3C analysis the antibody precipitationstep is omitted that is shown by an arrow with a dotted stem.
Gavrilov et al.
241
242
243
244
245
246
247
248
249
250
251
252
253
254
255
256
257
258
259
260
261
262
263
264
265
266
267
268
269
270
271
272
273
274
275
276
277
278
279
280
281
282
283
284
285
286
287
288

UNCORRECTEDPROOF
2.2. Treatment of DNA
Cross-Linked
to Proteins
with Restriction
Endonuclease(s)
1. Highly concentrated restriction enzyme(s) of choice.
2. 10X restriction buffer.
3. 20% SDS (w/v).
4. 20% Triton-X-100 (v/v).
2.3. Ligation of DNA
Cross-Linked
to Proteins
1. 20% Triton-X-100 (v/v).
2. T4 DNA ligase.
3. 10X ligation buffer.
2.4. Cross-Link
Reversion and DNA
Purification
1. Proteinase K.
2. RNase A.
3. Phenol (pH 8.0).
4. Chloroform.
5. 3 M sodium acetate (pH 5.2).
6. Ethanol.
7. 10 mM Tris-HCl (pH 7.5).
2.5. TaqMan Real-Time
PCR Analysis
of Ligation Products
1. Primers.
2. TaqMan probes.
3. dNTPs.
4. 10X Taq polymerase buffer.
5. Hot-start Taq DNA polymerase.
3. Methods
3.1. Cell Fixation
and LysisSee Note 1 about fixation principle.
1. Prepare single-cell suspensioncontaining1 � 107 cells in2–8mLof growth medium or PBS/FBS (see Note 2).
2. Add freshly made fix solution to obtain a final volume of10 mL and formaldehyde concentration of 2% and incubatefor 10 min at room temperature with slow agitation (seeNote 3).
3. Stop fixation by adding 2.5 M glycine to a concentration of0.125 M and cool the sample on ice.
4. Harvest the cells by centrifugation for 5–10 min at 200–300gand 4�C, wash with 10 mL of cold PBS and harvest again.
5. Resuspend the cell pellet in 5 mL of cold lysis buffer andincubate for 10 min on ice to release nuclei (see Note 4).
6. Harvest the nuclei by centrifugation for 5 min at 600g at 4�C(see Note 5).
SPB-152001 12 May 2, 2009 Time: 16:40 Proof 1
Chromosome Conformation Capture (from 3C to 5C)
289
290
291
292
293
294
295
296
297
298
299
300
301
302
303
304
305
306
307
308
309
310
311
312
313
314
315
316
317
318
319
320
321
322
323
324
325
326
327
328
329
330
331
332
333
334
335
336

UNCORRECTEDPROOF
3.2. Treatment of DNA
Cross-Linked
to Proteins
with Restriction
Endonuclease(s)
See Note 6 about choosing appropriate restriction enzymes andbuffers.
1. Suspend the nuclear pellet in 0.5 mL of 1.2X restrictionbuffer.
2. Add 20% SDS to a final concentration of 0.3% and incubateat 37�C for 1 h with vigorous shaking (for example,1,400 rpm on a temperature-controlled shaker, Eppendorf)(see Note 7).
4. Add 20% Triton-X-100 to a concentration of 1.8% and incu-bate at 37�C for 1 h with shaking (1,400 rpm) to sequesterthe SDS.
5. Add 400–1,500 units of a highly concentrated restrictionenzyme and carry out restriction overnight at 37�C withshaking (1,400 rpm) (see Note 8).
6. Inactivate the enzyme by addition of 20% SDS to a con-centration of 1.3% and incubation at 65�C for 20 min (seeNote 9).
3.3. Ligation of DNA
Cross-Linked
to Proteins
1. Mix the ‘‘restriction’’ solution with 7 mL of 1X ligation bufferin a 50 mL tube (see Note 10).
2. Add 20% Triton-X-100 to a final concentration of 1% andincubate at 37�C for 1 h with shaking (for example, 400 rpmin a bacterial incubator, the tube set upright) to sequester theSDS.
3. Add 100 units of T4 DNA ligase and incubate first for 4–5 hat 16�C and then for 30 min at room temperature with slowagitation.
3.4. Cross-Link
Reversion and DNA
Purification
1. Reverse cross-links by overnight incubation of the wholesample (�8 mL) at 65�C in the presence of 300 mg of protei-nase K.
2. Add 300 mg of RNase A and digest the RNA at 37�C for30–45 min.
3. Extract the solution successively with 7 mL of phenol, phenol–chloroform, and chloroform in a 15 mL tube. Centrifugationat each step is performed for 10 min at 2,000–3,000g androom temperature.
4. Mix the solution with the same volume of pure water in a 50mL tube (see Note 11).
5. Add 3 M sodium acetate (pH 5.2) to a concentration of0.2 M, 2 volumes of 96% ethanol and incubate overnight at–70�C for DNA precipitation.
6. Precipitate the DNA by centrifugation for 1 h at 3,200g and4�C (see Note 12).
SPB-152001 12 May 2, 2009 Time: 16:40 Proof 1
Gavrilov et al.
337
338
339
340
341
342
343
344
345
346
347
348
349
350
351
352
353
354
355
356
357
358
359
360
361
362
363
364
365
366
367
368
369
370
371
372
373
374
375
376
377
378
379
380
381
382
383
384

UNCORRECTEDPROOF
7. Wash the DNA pellet with 10 mL of cold 70% ethanol andcentrifuge for 20 min at 3,200g and 4�C.
8. Dry the DNA pellet and dissolve in 150 mL of 10 mMTris-HCl (pH 7.5) carefully washing the tube bottom (seeNote 13).
3.5. TaqMan Real-Time
PCR Analysis
of Ligation Products
1. Design primers and TaqMan probes for analysis of ligationproducts (see Note 14). Annealing temperatures of primersand TaqMan probes should be 56–60�C and 68–70�C,respectively, and the size of PCR products should be withinthe range of 50–250 bp.
2. Prepare a reaction mixture that should contain in a finalvolume of 20 mL a DNA matrix, 1X PCR buffer, 0.5 mM ofeach primer, 0.25 mM of TaqMan probe, 0.2 mM of eachdNTP, and 0.75 unit of hot-start Taq DNA polymerase. ThePCR is carried out as follows: initial denaturation for 5 min at94�C; 50–60 cycles of 15 s at 94�C, 60 s at 60�C, plate read.As a matrix, use a 3C template in parallel with a randomligation template (see Notes 15–17).
3. Determine a relative amount of corresponding ligation pro-duct in a 3C template.
3.6. Random Ligation
Matrix Preparation
1. Set up a 100 mL restriction reaction including 5–10 mg ofBAC (YAC), 1X restriction buffer and 25–50 units of arestriction enzyme(s) used for 3C analysis, and digest theDNA for 3 h at 37�C.
2. Extract the solution successively with one volume of phenol,phenol:chloroform, and chloroform (use centrifugation for3 min at 12,000g and room temperature at each step).
3. Add 3 M sodium acetate (pH 5.2) to a concentration of0.2 M, 2 volumes of 96% ethanol and incubate for at least1 h at –70�C for DNA precipitation.
4. Precipitate the DNA by centrifugation for 15 min at 12,000g.
5. Wash the DNA pellet with 0.5 mL of 70% ethanol and cen-trifuge for 5 min at 12,000g.
6. Dissolve the DNA pellet in 50 mL of 1X ligation buffer, add20 units of T4 DNA ligase, and incubate for 4 h at 16�C.
7. Dilute the solution with 1 volume of pure water and repeatphenol–chloroform extraction and ethanol precipitation asdescribed above.
8. Dilute the DNA pellet in 100 mL of 10 mM Tris-HCl (pH 7.5).
9. In the same way digest and religate pure genomic DNA oforganism under study and use it for adjusting DNA concentra-tion in BAC (YAC) random ligation templates (see Note 15).
SPB-152001 12 May 2, 2009 Time: 16:40 Proof 1
Chromosome Conformation Capture (from 3C to 5C)
385
386
387
388
389
390
391
392
393
394
395
396
397
398
399
400
401
402
403
404
405
406
407
408
409
410
411
412
413
414
415
416
417
418
419
420
421
422
423
424
425
426
427
428
429
430
431
432

UNCORRECTEDPROOF
3.7. 3C Control
Experiments
3.7.1. Control of Restriction
Efficiency
Usually restriction does not go to completion because of severityof reaction conditions. Efficiency of digestion as a rule does notexceed 80–90%. Besides, it may differ from site to site because ofblocking of sites by the proteins cross-linked nearby or due tosome other reasons, and if so it will influence the amount ofspecific ligation products. Mixed digestion of 3C templates withtwo different restriction enzymes producing compatible DNAends may cause additional problems. Therefore, the efficiency ofdigestion should be checked for different sites throughout thelocus under study. For this purpose, Southern blot analysis orPCR-stop analysis of restriction products can be used.
3.7.2. Control
of Measurement
of Cross-Linking
Frequencies by the Amount
of Ligation Products
Measuring of cross-linking efficiency by the amount of the corre-sponding ligation product seems to depend on a condition of thetwo DNA ends whose ligation is regarded – their lengths, integrityof ligation sites, and presence of cross-linked proteins. Theseproperties determine mobility of cross-linked DNA fragmentsand their ability to reach each other, as well as accessibility of thecohesive ends to DNA ligase. So, it is desirable to repeat 3Cexperiments with primers designed to anneal at the other side ofrestriction fragments or/and with another restriction enzyme andto see whether the results are similar.
3.7.3. Control of Quality and
Quantity of a 3C Template
If 3C analysis is carried out on different types of cells, it should betaken into consideration that quality and quantity of 3C DNA mayvary depending on the cell type: differences in internal cellularconditions may cause variations in efficiency of fixation, restrictionand ligation as well as simply in degree of integrity of DNA sub-jected to degradation by cellular enzymes. So, as an internal con-trol of quality of experimental procedures, 3C analysis isperformed on a locus that can reasonably be assumed to havesimilar spatial organization in all cell types used. Housekeepinggenes transcribed at the same level in different cell types are usuallyselected as such control loci (2, 4, 6). It is recommended that thecontrol locus is located far from loci that are known to havedifferent transcriptional status in the cells under study. It is betterto perform 3C analysis for several pairs of restriction fragments of acontrol locus: if differences (or absence of differences) in cross-linking frequencies observed in different cell types are reproducedindependently of a fragment combination, then the results can bethought reliable (5). If so, cross-linking frequencies measured fordifferent fragment combinations within a cell type are averagedand the resulting figure is considered as the relative cross-linkingvalue of 1.
Another way of getting such an internal control is based on theassumption that adjacent restriction fragments must exhibit similarcross-linking frequencies independently of a cell type and geneactivity (4). Thus, a cross-linking frequency of adjacent restriction
SPB-152001 12 May 2, 2009 Time: 16:40 Proof 1
Gavrilov et al.
433
434
435
436
437
438
439
440
441
442
443
444
445
446
447
448
449
450
451
452
453
454
455
456
457
458
459
460
461
462
463
464
465
466
467
468
469
470
471
472
473
474
475
476
477
478
479
480

UNCORRECTEDPROOF
fragments can be used to normalize the data of 3C analysisobtained for different cell types. In this case, too, it is recom-mended to measure cross-linking frequencies of several pairs offragments and average the results. Again it should be checked thatdifferences (or absence of differences) observed in different celltypes are reproduced independently of a fragment pair.
3.7.4. Mock Controls Mock controls are usually done by omitting one of three importantsteps of the analysis – fixation (when formaldehyde is not added),restriction (a restriction enzyme is not added), or ligation (ligase isnot added). In the first case amplification products, if any, must bedetected in noticeably smaller amounts comparing with the nor-mal experiment; in the second and third cases there must not beany amplification products at all.
3.8. Interpretation
of 3C Data
Data of 3C analysis are usually represented as a graph of dependenceof relative cross-linking frequency of an anchor restriction fragment(i.e., the fragment bearing an anchor primer) and other fragmentson position of these fragments in a locus (Fig. 12.4). Cross-linkingfrequencies are then conceived as frequencies with which genomicsites interact in nuclear space. However, it should be taken intoconsideration that different nucleoprotein complexes may be
SPB-152001 12 May 2, 2009 Time: 16:40 Proof 1
This
figure
will
be
pri
nte
din
b/w
Fig. 12.4. Representation and interpretation of 3C data. A hypothetical case is illustrated.The graph shows the dependence of relative cross-linking frequency of one selectedrestriction fragment (anchor fragment, dark shadowing) and other fragments (testfragments, light shadowing) on position of the test fragments in the locus. Black verticallines show positions of restriction sites. A primer array used for PCR is shown above thegraph. The anchor primer is marked by an oval. Next to it the site of TaqMan probeannealing is shown. The results presented on the graph are interpreted as shown fromthe right. The curve with unfilled points reflects the situation when site ‘‘a’’ interacts withsites ‘‘b’’ and ‘‘c’’. However, this curve does not answer the question whether it issimultaneous interaction (‘‘a+b+c’’) or only superposition of ‘‘a+b’’ and ‘‘a+c’’ interac-tions. The curve with filled points reflects the situation when the locus has a linearconfiguration.
Chromosome Conformation Capture (from 3C to 5C)
481
482
483
484
485
486
487
488
489
490
491
492
493
494
495
496
497
498
499
500
501
502
503
504
505
506
507
508
509
510
511
512
513
514
515
516
517
518
519
520
521
522
523
524
525
526
527
528

UNCORRECTEDPROOF
composed of different proteins and DNA sequences and have dif-ferent structure. So efficiency of formaldehyde fixation of one com-plex may not be just the same as efficiency of fixation of anothercomplex even if these two complexes are characterized by similarlifetime.
To interpret adequately the results of 3C analysis it is neces-sary to take into account some more important moments. First,restriction fragments located nearby in DNA sequence or adja-cent to fragments containing really interacting sites are situatedclose to each other in nuclear space and may get casually cross-linked. This results in appearance of ligation products that do notcorrespond to specific spatial interactions. Ligation products ofeven very remote in DNA sequence fragments are usuallydetected in the amounts exceeding random ligation background.The closer the DNA sequence fragments are, the higher cross-linking frequency these fragments demonstrate independently oftheir involvement in the formation of chromatin hubs, and themore difficult it is to discriminate between a specific interactionand an accidental one. So, the results of 3C analysis become lessand less reliable with the decrease in distance between analyzedrestriction fragments.
Second, as we mentioned before, restriction usually does notgo to completion. Hence some fragments may get to be in onenucleoprotein complex as a result of their not being cut fromcross-linked fragments. Obviously, such ‘‘false’’ cross-linking con-cerns mainly the fragments that are situated in the neighborhoodof interacting fragments but do not participate in the interactionthemselves. Cross-linking frequencies measured for these frag-ments are thus overestimated, while the other cross-linking fre-quencies are underestimated because of incomplete restriction. Asa result, peaks of 3C curves smear.
Additional problems may be caused by inequality of diges-tion efficiency for different sites of a locus under study. Thesimplest way to correct for this is to compare each cross-linkingfrequency with digestion efficiencies for the correspondingrestriction sites.
If digestion efficiency is low, the situation is additionally com-plicated when the anchor fragment or test fragment or both ofthem are followed by one or several small restriction fragments. Ifnot digested from the analyzed DNA fragments, these short frag-ments may give rise to additional (longer) amplicons. PCR signalsfrom amplicons of different size are summarized and cannot bediscriminated when real-time PCR is employed. As a result, corre-sponding cross-linking frequencies may be overestimated.
Moreover, 3C analysis allows estimating only relative prob-abilities of interaction of different restriction fragments within thearea under study. The possibility of existence of an alternatingthree-dimensional configuration of a studied locus in the same
SPB-152001 12 May 2, 2009 Time: 16:40 Proof 1
Gavrilov et al.
529
530
531
532
533
534
535
536
537
538
539
540
541
542
543
544
545
546
547
548
549
550
551
552
553
554
555
556
557
558
559
560
561
562
563
564
565
566
567
568
569
570
571
572
573
574
575
576

UNCORRECTEDPROOF
cells should be taken into account. In addition, it should beconsidered that three-dimensional organization of this locus candiffer in two copies of homologous chromosomes in the same cellsand also in different cells present in the population.
4. Notes
1. Cross-linking of protein and DNA, such as they are in livingcells, is performed by treatment of cells with formaldehydethat reacts with amino and imino groups of DNA and proteinsforming DNA–protein and protein–protein links.
2. Fixation is performed directly in growth medium or aftersome manipulations needed; e.g., for separation of cells ofinterest from other cells or cell dissociation if tissue is oper-ated. Some protocols propose to perform fixation on isolatednuclei (1), but we think that the less influences cells undergobefore fixation, the less probability that the specific spatialorganization of chromatin is disturbedAQ3 .
3. Formaldehyde concentration and time of incubation may bevaried to get more or less fixed chromatin.
4. The process of lysis can be monitored by staining cells withtrypan blue.
5. The nuclear pellet can be frozen in liquid nitrogen and storedat –70�C.
6. When selecting a restriction enzyme, the following should beconsidered:(a) A size of a restriction fragment to be analyzed should not
to be very small (less than 0.1 Kb) or very big (more than15 Kb).
(b) DNA ends produced must not be blunt.
(c) It is acceptable to digest DNA with more than one restric-tion enzyme if resulting DNA ends are compatible (i.e.,can be cross-ligated).
(d) Because fixed chromatin but not pure DNA is subjectedto treatment with restriction enzymes, SDS is used todisperse chromatin via removal of unlinked proteins andprovide access of the enzyme to DNA. SDS is thensequestered by Triton-X-100, but some restrictionenzymes do not work well or do not work at all in theresulting solution. Hind III, EcoRI, and Bgl II workcorrectly; BamH I, SpeI, PstI, and NdeI work with lesserefficiency (20); enzymes preferring low-salt buffers, forexample SacI, as a rule do not work. Moreover, when
SPB-152001 12 May 2, 2009 Time: 16:40 Proof 1
Chromosome Conformation Capture (from 3C to 5C)
577
578
579
580
581
582
583
584
585
586
587
588
589
590
591
592
593
594
595
596
597
598
599
600
601
602
603
604
605
606
607
608
609
610
611
612
613
614
615
616
617
618
619
620
621
622
623
624

UNCORRECTEDPROOF
SPB-152001 12 May 2, 2009 Time: 16:40 Proof 1
UNCORRECTEDPROOF
low-salt restriction buffer is used, the nuclei tend to forman insoluble pellet. The efficiency of restriction of cross-linked templates with the selected enzyme(s) should betested experimentally (see Section 3.7.1).
7. It is possible to decrease concentration of SDS if it helpsto achieve better efficiency of restriction. However, the con-centration of SDS should not be lower than 0.1%. Otherwisethe solubilization of non-cross-linked proteins will beincomplete.
8. Even very intense shaking (1,400 rpm) does not affectenzyme work, but on the contrary provides proper mixingthe suspension which, as a rule, is quite heterogeneous untilthe cross-link reversion step.
9. Most cross-links are thought to be preserved after incubationat 65� C for such a short period of time as 20 min (Dr. ErikSplinter, personal communication).
10. Dilution in the ligation buffer gives DNA concentration ofabout several ng per mL that is enough to provide preferablyintramolecular ligation (ligation between cross-linked DNAfragments) (20).
11. Dilution by water before ethanol precipitation is aimed toreduce precipitation of DTT, a component of the ligationbuffer, during centrifugation (Dr. Erik Splinter, personalcommunication). Replacement of DTT by b-mercaptoetha-nol in the ligation buffer might solve this problem, but it stillremains to check whether ligase works normally in suchbuffer.
12. It was shown that centrifugation at 3,200g is sufficient toprecipitate 3C DNA. Perform centrifugation at that forceusing a cellular centrifuge if you do not have at your disposala suitable high-speed centrifuge to carry out DNA precipita-tion from 50 mL of solution.
13. The DNA pellet may be spread on the conical bottom of a50 mL tube and invisible.
14. Ligation products are usually present in 3C templates in suchlow amounts that it is more reliable to quantify them by real-time PCR rather than by semi-quantitative PCR methodsusing ethidium bromide staining or radioactively labeled pri-mers (10, 19, 21). Primers for PCR are designed to anneal atthe same ends (left or right) of restriction fragments and faceoutwards. In this way head-to-head ligation products areanalyzed. One primer is selected as an anchor primer whichis sequentially used to carry out PCR with all other primers.Unidirectionality of the primers eliminates the possibility ofgenerating PCR products because of partial digestion andsubsequent ligation through circularization. It is desirable
Gavrilov et al.
625
626
627
628
629
630
631
632
633
634
635
636
637
638
639
640
641
642
643
644
645
646
647
648
649
650
651
652
653
654
655
656
657
658
659
660
661
662
663
664
665
666
667
668
669
670
671
672

UNCORRECTEDPROOF
that any primer combination is operable. Therefore, all pri-mers should have similar annealing temperature and shouldnot form strong homo- and heterodimers. To design such aprimer set is not at all a simple task. A possibility remains thatone primer pair or another will not work well producing, forexample, considerable background of non-specific PCR pro-ducts. That is why it is preferable to carry out real-time PCRusing sequence-specific DNA probes, such as TaqMan, ratherthan non-specific DNA dyes (SYBRgreen, etc.).
A TaqMan probe is an oligonucleotide that is designed toanneal between PCR primers and bears a fluorescent dye at the5’ end and a quencher dye inside or at the 3’ end. When Taqpolymerase meets with the probe, the enzyme cleaves it, whichresults in separation of the fluorescent and quencher dyes andthus in increase of fluorescence (see Fig. 12.5D). In the 3C assaya TaqMan probe is designed to anneal downstream to the anchorprimer within the same restriction fragment (Fig. 12.4). In such
SPB-152001 12 May 2, 2009 Time: 16:40 Proof 1
This
figure
will
be
pri
nte
din
b/w
Fig. 12.5. Determination of DNA quantity by real-time PCR with TaqMan probes. A generalized experiment is discussed.(A) and (B). The dependences of the intensity of reporter fluorescence on a number of amplification cycles; A – normalscale, B – logarithmic scale. The six thin curves of different colour intensity illustrate the results of six real-time PCRamplifications carried out on five-fold dilutions of a standard DNA of known quantity. The thick curve corresponds to thetest-sample with unknown DNA quantity that is supposed to be measured. The shadowing shows an exponential phase ofthe fluorescence growth for the PCR carried out on non-diluted standard template (A). This region is seen as a linear partof the curve when the logarithmic scale is used (B). A dotted line indicates the fluorescence level corresponding to themiddle of the exponential phase (threshold fluorescence, FlT). An amplification cycle by which the threshold fluorescenceis achieved is called threshold cycle CT. The threshold cycle for the sample with unknown DNA quantity is designated astest CT (CTtest). (C) A calibration curve showing dependence of a threshold cycle on a common logarithm of the start DNAquantity. The points representing successive dilutions of the DNA standard are indicated by decreasing of intensity offilling of the corresponding circles on the calibration curve. Applying CTtest to the graph gives the relative amount of DNAin the sample. (D) The principle of real-time PCR with TaqMan probes. A TaqMan probe bears a fluorescence and aquencher dye and anneals between PCR primers. Cleavage of the probe by Taq-polymerase results in the separation ofthe fluorophore from the quencher, and consequently in a fluorescence increase.
Chromosome Conformation Capture (from 3C to 5C)
673
674
675
676
677
678
679
680
681
682
683
684
685
686
687
688
689
690
691
692
693
694
695
696
697
698
699
700
701
702
703
704
705
706
707
708
709
710
711
712
713
714
715
716
717
718
719
720

UNCORRECTEDPROOF
a way, the same TaqMan probe can be used for all PCR with thegiven anchor primer. The direction of the TaqMan probe isrecommended to be opposite to the anchor primer (19).
15. To judge an amount of specific DNA by the amount of theamplification product, once again it should be taken intoaccount that different primer pairs may work with differentefficiency. To correct for this, all primer pairs should be testedon the matrix in which for each primer pair there is an equalamount of the target DNA sequence to amplify. An equimo-lar mix of all possible ligation products can be used as such amatrix. Originally, in the yeast system, this kind of matrix wasprepared by restriction and religation of pure genomic DNA(1). But genomes of higher eukaryotes are frequently thou-sands times larger, and restriction and religation of the wholegenome will result in appearance of uncountable amount ofligation product variants, each variant being present in minuteamounts very difficult to amplify. The problem is solved byusing DNA of bacterial or yeast artificial chromosomes bear-ing the locus of interest. The BAC (or YAC) is digested with aselected restriction enzyme(s) and, after inactivation orremoval of the restriction enzyme(s), religated at a highDNA concentration (hundreds of ng per mL) to allow inter-molecular ligation (20, 22). Another way to prepare a randomligation matrix is to amplify the DNA fragments bearingrestriction sites of interest, purify the amplification products,mix them in equimolar amounts, digest, and religate (20).This way seems to be much more time-consuming.
The PCR is performed, individually for each primer pair, onseries of successive dilutions of the random ligation matrix(we usually used six five-fold dilutions of BAC starting with1,250 pg per reaction and finishing with 0.4 pg), and thedependence of intensity of reporter fluorescence on a cycle ofamplification is plotted (Fig. 12.5A). For each dilution athreshold cycle CT is determined, the cycle at which thefluorescence achieves some selected value within an exponen-tial phase of fluorescence growth, for example correspondingto the middle of this phase. It is easier to operate with thegraph on a logarithmic scale of fluorescence. In that case, theexponential phase is seen as a linear part of the curve(Fig. 12.5B). After CTs have been determined, the calibra-tion curve is plotted representing the dependence of loga-rithm of DNA quantity on CT. Theoretically, such a curvemust be a descending line (Fig. 12.5C). In parallel, PCR isperformed on several dilutions of a 3C template (for example,5, 15, and 45 ng of DNA per reaction), and the rate of PCRproduct accumulation, in terms of CT, is applied to the cali-bration curve in order to determine a relative amount of
SPB-152001 12 May 2, 2009 Time: 16:40 Proof 1
Gavrilov et al.
721
722
723
724
725
726
727
728
729
730
731
732
733
734
735
736
737
738
739
740
741
742
743
744
745
746
747
748
749
750
751
752
753
754
755
756
757
758
759
760
761
762
763
764
765
766
767
768

UNCORRECTEDPROOF
the corresponding ligation product in the 3C template(Fig. 12.5C). The values obtained should not exceed theframes of the calibration curve. The digested and religatedpure genomic DNA is added to each reaction with the randomligation matrix so that final DNA concentration is adjusted tothe amount of DNA used for PCR with 3C templates (forexample, 20 ng (20))AQ4 , because PCR amplification is influencedby the amount of genomic DNA present in 3C templates. To besure that the calibration curve is reliable, one may check if thevalues obtained for any two dilutions of 3C templates indeeddiffer as much as the amounts of DNA in these two dilutions.
16. To maintain conditions of amplification, all components ofreal-time PCR, including water, should be aliquoted andstored at –20�C.
17. Each PCR is carried out in a triple or quadruple repeat andcorresponding results are averaged.
References
1. Dekker, J., Rippe, K., Dekker, M. and Kleck-ner, N. (2002) Capturing chromosome con-formation. Science 295, 1306–1311.
2. Tolhuis,B.,Palstra,R. J., Splinter,E.,Grosveld,F. and de Laat, W. (2002) Looping and inter-action between hypersensitive sites in the activebeta-globin locus. Mol. Cell 10, 1453–1465.
3. Eivazova, E. R. and Aune, T. M. (2004)Dynamic alterations in the conformation ofthe Ifng gene region during T helper celldifferentiation. Proc. Natl. Acad. Sci.U.S.A. 101, 251–256.
4. Liu, Z. and Garrard, W. T. (2005) Long-range interactions between three transcrip-tional enhancers, active V gene promoters,and a 3’ boundary sequence spanning 46kilobases. Mol. Cell. Biol. 25, 3220–3231.
5. Gavrilov, A. A. and Razin, S. V. (2008) Spa-tial configuration of the chicken �-globingene domain: immature and active chroma-tin hubs Nucleic Acids Res 36, 4629–40.
6. Spilianakis, C. G. and Flavell, R. A. (2004)Long-range intrachromosomal interactionsin the T helper type 2 cytokine locus. Nat.Immunol. 5, 1017–1027.
7. Palstra, R. J., Tolhuis, B., Splinter, E.,Nijmeijer, R., Grosveld, F. and de Laat, W.(2003) The beta-globin nuclear compart-ment in development and erythroid differ-entiation. Nat. Genet. 35, 190–194.
8. Vakoc, C., Letting, D. L., Gheldof, N.,Sawado, T., Bender, M. A., Groudine, M.,Weiss, M. J., Dekker, J. and Blobel, G. A.
(2005) Proximity among distant regulatoryelements at the beta-globin locus requiresGATA-1 and FOG-1. Mol. Cell 17, 453–462.
9. Zhou, G. L., Xin, L., Song, W., Di, L. J.,Liu, G., Wu, X. S., Liu, D. P. and Liang, C.C. (2006) Active chromatin hub of themouse alpha-globin locus forms in a tran-scription factory of clustered housekeepinggenes. Mol. Cell Biol. 26, 5096–5105.
10. Vernimmen, D., De Gobbi, M., Sloane-Stanley, J. A., Wood, W. G. and Higgs, D.R. (2007) Long-range chromosomal inter-actions regulate the timing of the transitionbetween poised and active gene expression.EMBO J. 26, 2041–2051.
11. Spilianakis, C. G., Lalioti, M. D., Town, T.,Lee, G. R. and Flavell, R. A. (2005) Inter-chromosomal associations between alterna-tively expressed loci. Nature 435, 637–645.
12. Ling, J. Q., Li, T., Hu, J. F., Vu, T. H., Chen,H. L., Qiu, X. W., Cherry, A. M. and Hoff-man, A. R. (2006) CTCF mediates inter-chromosomal colocalization between Igf2/H19 and Wsb1/Nf1. Science 312, 269–272.
13. Zhao, Z., Tavoosidana, G., Sjolinder, M.,Gondor, A., Mariano, P., Wang, S., Kanduri,C., Lezcano, M., Sandhu, K. S., Singh, U.,Pant, V., Tiwari, V., Kurukuti, S. and Ohls-son, R. (2006) Circular chromosome confor-mation capture (4C) uncovers extensivenetworks of epigenetically regulated intra-and interchromosomal interactions Nat.Genet. 38, 1341–1347.
SPB-152001 12 May 2, 2009 Time: 16:40 Proof 1
Chromosome Conformation Capture (from 3C to 5C)
769
770
771
772
773
774
775
776
777
778
779
780
781
782
783
784
785
786
787
788
789
790
791
792
793
794
795
796
797
798
799
800
801
802
803
804
805
806
807
808
809
810
811
812
813
814
815
816

UNCORRECTEDPROOF
14. Simonis, M., Klous, P., Splinter, E., Moshkin,Y., Willemsen, R., de Wit, E., van Steensel, B.and de Laat, W. (2006) Nuclear organizationof active and inactive chromatin domainsuncovered by chromosome conformationcapture-on-chip (4C). Nat. Genet. 38,1348–1354.
15. Dostie, J., Richmond, T. A., Arnaout, R. A.,Selzer, R. R., Lee, W. L., Honan, T. A.,Rubio, E. D., Krumm, A., Lamb, J., Nus-baum, C., Green, R. D. and Dekker, J.(2006) Chromosome Conformation Cap-ture Carbon Copy (5C): a massively parallelsolution for mapping interactions betweengenomic elements. Genome Res. 16,1299–1309.
16. Horike, S., Cai, S., Miyano, M., Cheng, J. F.and Kohwi-Shigematsu, T. (2005) Loss ofsilent-chromatin looping and impairedimprinting of DLX5 in Rett syndrome.Nat. Genet. 37, 31–40.
17. Cai, S., Lee, C. C. and Kohwi-Shigematsu,T. (2006) SATB1 packages densely looped,transcriptionally active chromatin for coor-dinated expression of cytokine genes. Nat.Genet. 38, 1229–1230.
18. Kurukuti, S., Tiwari, V. K., Tavoosidana, G.,Pugacheva, E., Murrell, A., Zhao, Z., Loba-nenkov, V., Reik, W. and Ohlsson, R. (2006)CTCF binding at the H19 imprinting con-trol region mediates maternally inheritedhigher-order chromatin conformation torestrict enhancer access to Igf2. Proc. Natl.Acad. Sci. U.S.A. 103, 10684–10689.
19. Splinter, E., Heath, H., Kooren, J., Palstra,R. J., Klous, P., Grosveld, F., Galjart, N. andde Laat, W. (2006) CTCF mediates long-range chromatin looping and local histonemodification in the beta-globin locus. GenesDev. 20, 2349–2354.
20. Splinter, E., Grosveld, F. and de Laat, W.(2004) 3C technology: Analyzing the spatialorganization of genomic loci in vivo. Meth-ods Enzymol. 375, 493–507.
21. Wurtele, H. and Chartrand, P. (2006) Gen-ome-wide scanning of HoxB1-associated lociin mouse ES cells using an open-ended Chro-mosome Conformation Capture methodol-ogy. Chromosome Res. 14, 477–495.
22. Dekker, J. (2006) The 3 C’s of Chromo-some Conformation Capture: controls, con-trols, controls. Nat. Methods 3, 17–21.
SPB-152001 12 May 2, 2009 Time: 16:40 Proof 1
Gavrilov et al.
817
818
819
820
821
822
823
824
825
826
827
828
829
830
831
832
833
834
835
836
837
838
839
840
841
842
843
844
845
846
847
848
849
850
851
852
853
854
855
856
857
858
859
860
861
862
863
864


![Problems with a conformation assignment of aryl-substituted resorc[4]arenes](https://static.fdokumen.com/doc/165x107/6324d12685efe380f30661c8/problems-with-a-conformation-assignment-of-aryl-substituted-resorc4arenes.jpg)