South-South cooperation – policy and practice by the Export Import Bank of China
Upload
khangminh22Category
view
1download
0
China Development Report on South-South Cooperation
2017
—Trade and Investment Relations between China and Asian Developing Countries
Edited by Li, Ronglin and Zheng, Zhaoyang
China Commerce and Trade Press

China Development Report on South-South Cooperation 2017中国南南合作发展报告 2017—中国与亚洲发展中国家之间的贸易投资合作
ZHONGGUO NANNANHEZUO FAZHAN BAOGAO 2017
主编 李荣林 郑昭阳 Edited by Li, Ronglin and Zheng, Zhaoyang
出 版:中国商务出版社
地 址:北京市东城区安定门外大街东后巷 28 号 邮编: 100710
责任部门:教育培训事业部(010-64243016 [email protected] )
责任编辑:刘姝辰
总 发 行:中国商务出版社发行部 (010-64208388 64515150 )
网购零售:中国商务出版社考培部 (010-64286917)
网 址:http://www.cctpress.com
网 店:https://shop162373850.taobao.com/
开 本:787 毫米 ×980 毫米 1/16
印 张:23.50 字 数:440 千字
版 次:2018 年 12 月第 1 版 2018 年 12 月第 1 次印刷
书 号:ISBN 978-7-5103-2677-6
定 价:69.00 元
凡所购本版图书有印装质量问题,请与本社总编室联系(电话:010-64212247)
版权所有 盗版必究 (盗版侵权举报可发邮件到此邮箱:[email protected] 或致电:010-64286917)
图书在版编目(CIP)数据
中国南南合作发展报告 . 2017 : 英文 / 李荣林 , 郑
昭阳主编 . -- 北京 : 中国商务出版社 , 2018.12
ISBN 978-7-5103-2677-6
Ⅰ. ①中… Ⅱ . ①李… ②郑… Ⅲ . ①南南合作-研
究报告-中国- 2017 -英文②对外贸易关系-研究报告-
中国- 2017 -英文 Ⅳ . ① F114.43 ② F752.7
中国版本图书馆 CIP 数据核字 (2018) 第 258839 号

Acknowledgement
China Development Report on South-South Cooperation 2017: Trade and
Investment Relations between China and Asian Developing Countries is the fifth annual
development report delivered by Study Center for South-South Cooperation of Nankai
University (SCSSC-NKU). It reports the economic relations between China and all Asian
developing countries and transitional economies in Asia from the perspective of trade,
investment, foreign aid, and regional economic cooperation. It also reports the relations in
different regions of South, Southeast, West, and Central Asia respectively. By providing
empirical evidences with possible detailed statistics and specific cases, the report is to
reveal the overall situation, achievements, challenges and encountered problems of south-
south cooperation between China and Asian countries.
The report is written by professors and experts at Nankai University and from other
institutes. Some PhD students and graduates in the Institute of International Economics
(IIE), Nankai University and SCSSC-NKU also involve in the task. I would like to
acknowledge their chapter contribution as the following:
Chapter one: Introduction is written by Mr. Ronglin Li, Professor at SCSSC of
NanKai University, and Mr. Zhaoyang Zheng, Associate Professor at IIE, Nankai
University; Chapter Two: Trade Relations between China and Asian Developing
Countries, written by Mr. Ronglin Li and Ms. Huiling Zhang, PhD at IIE, Nankai
University; Chapter Three: Investment Relations between China and Asian Developing
Countries, by Mr. Tong Zhu, Professor at IIE, and Ms. Nana Fan, PhD at SCSSC of
NanKai University; Chapter Four: China’s Foreign Assistance to Asian Developing
Countries, by Mr. Zhaoyang Zheng, Associate professor at IIE, Nankai University;
Chapter Five: Regional Economic Cooperation between China and Developing Countries
in Asia, by Mrs. Wei Geng, Professor at Tianjin Finance and Economic University, and
Mr. Bangdong Xu, PhD at IIE and SCSSC of NanKai University; Chapter Six: South-
South Cooperation between China and Southeast Asian Countries, by Dr. Jianzhong Li

China Development Report on South-South Cooperation 2017
2
and Mr. Kai Feng and Ms. Yuxin Zhan, PhD and graduate at IIE and SCSSC, NanKai
University; Chapter Seven: South-South Cooperation between China and South Asian
Countries, by Mr. Xin Gu, Associate Professor at Zhejiang Industry and Commerce
University and Mr. Zeyu Zhang, graduate at IIE, NanKai University; Chapter Eight:
South-South Cooperation between China and West Asian Developing Countries, by Mrs.
Mingyan Yu, Associate Professor at Tianjin Municipal Party School, and Ms. Mingwang
Yang, graduate at IIE, NanKai University; Chapter Nine: South-South Cooperation
between China and Central Asian Countries, by Mrs. Weiwei Wang, Associate Professor
at Tianjin Finance and Economic University, and Ms. Xiaohui Dai, graduate at IIE,
NanKai University; and Chapter Ten: Belt and Road Initiative and Asian Economic
Development is written by Mr. Tong Zhu, Professor at NanKai University, and Ms. Lilin
Yuan, PhD at SCSSC of NanKai University. The report is generally co-edited by Mr.
Ronglin Li and Zhangyao Zheng, and the English version of the report is translated and
edited by Mr. Xin Gu. I would like to sincerely thank all of them for their contribution
and excellent work.
The report has as always supported by the United Nation Office of South-South
Cooperation and China International Center for Economic and Technology Exchange,
Ministry of Commerce, as well as China Commerce and Trade Press. Let me thank in
particular Mr. Yongli Zhao, Mrs. Wei Zhang, Mr. Xuexin Li, and Mrs. Xingguang Xie for
their strong backing to the study and publication of the report.
The Study Center for South-South Cooperation, Nankai University conducts the
report and all the possible mistakes are attributed to the center, however, the points of
view in the Chapters are belong to author themselves. We sincerely welcome critiques
and comments.
Ronglin Li
Professor and Director
The Study Center for South-South Cooperation
Nankai University
November 4, 2018

1
CONTENTS
1. Introduction .............................................................................................................1
1.1 Basic Situations of Asian Countries .......................................................................1
1.2 A History of China- Asia Cooperation ...............................................................4
1.3 Structure of This Report ........................................................................................10
2. Trade Relations between China and Asian Developing Countries ...................................................................................................................................12
2.1 The Scale and Growth ..........................................................................................12
2.2 The Structure or Pattern of Trade .........................................................................16
2.3 The Structure of Trade in Different Regional in Asia ...........................................23
2.4 Trade Competitiveness and Complementarity .....................................................27
2.5 Summary ...............................................................................................................38
3. Investment Relations Between China and Asian Developing Countries ................................................................................................................40
3.1 General Features of China’s OFDI in Asian Countries .........................................40
3.2 China’s OFDI in Asia by Region and Country ......................................................45
3.3 Industrial Characteristics of China’s OFDI in Asia ..............................................58
3.4 Asian Countries’ Direct Investment in China ........................................................65
3.5 Two-Way Investment between China and Asian Countries ..................................71
3.6 Summary ...............................................................................................................73
4. China’s Foreign Assistance to Asian Countries ...............................75
4.1 Concepts and Ways of the Assistance ...................................................................75
4.2 History of China’s Assistance to Asian Countries .................................................78
4.3 Characteristics of China’s Assistance to Asian Countries .....................................87

2
China Development Report on South-South Cooperation 2017
4.4 Economic and Social Effects of the Assistance ..................................................102
4.5 Problems and Challenges ...................................................................................107
4.6 Summary .............................................................................................................112
5. Regional Economic Cooperation between China and Developing Countries in Asia ....................................................................115
5.1 China’s Regional Trade Agreements in Asia .......................................................115
5.2 Sub-Regional Cooperation between China and Asian Developing Countries ....126
6. South-South Cooperation between China and Southeast Asian Countries ...............................................................................................................148
6.1 The Trade Relations between China and Southeast Asian Countries ..................148
6.2 Investment Relationship between China and Southeast Asian Countries ...........170
6.3 China’s Foreign Assistance to Southeast Asian Countries ..................................177
7. South-South cooperation between China and South Asian countries ...............................................................................................................182
7.1 Trade relations between China and South Asian countries .................................182
7.2 Investment relations between China and South Asian Countries ........................205
7.3 China’s Assistance to South Asian Countries ......................................................214
8. South-South Cooperation between China and West Asian Developing Countries ....................................................................................219
8.1 Trade relations between China and West Asian countries ...................................219
8.2 Investment relationship between China and West Asian countries .....................240
8.3 China’s assistance to West Asian countries .........................................................248
9. South-South Cooperation between China and Central Asian Countries ..............................................................................................................252
9.1 Trade relations between China and Central Asian countries ...............................252

3
CONTENTS
9.2 Investment Relationship between China and Central Asian Countries ...............266
9.3 China’s Assistance to Central Asian Countries ...................................................274
10. Belt and Road Initiative and Asian Economic Development .282
10.1 Main contents of China’s “Belt and Road Initiative” ........................................282
10.2 “Belt and Road” and productivity cooperation .................................................291
10.3 “Belt and Road” and Infrastructure Cooperation ..............................................302
10.4 The Opportunities and challenges .....................................................................316
Annex ..........................................................................................................................319
Annex 1: Basic situation of Asian Countries ............................................................319
Annex 2: Classification of Asian Countries by income .............................................321
Annex 3: Global Competitiveness of Asian Countries .............................................322
Annex 4: Import and export of Asian countries with G7 and China .........................324


1
1. Introduction
1.1 Basic Situations of Asian Countries Asia is the largest continent, with 44.570 million square meters in land, accounting
for 29.4% of the land around the world. Asia is also the most populous continent in the
world. Based on statistics of United Nations Economic and Social Council (ECOSOC),
in 2016 the overall population in Asia is around 4.462 billion, accounting for 59.8%
of global population. There are 48 sovereign countries. Only Japan is the developed
countries, while the rest are developing countries.
Geographical Location of Asian CountriesGeographically, we can divide Asia into East Asia, Southeast Asia, South Asia,
Middle Asia and West Asia, those five regions. East Asia contains China, Japan, South
Korea, Mongolia and North Korea five countries. East Asia covers 11.7 million square
meters, amounting to 26.24% of Asia. The topography of East Asia is complicated. It
has the “roof of the world” locating at Qinghai-Tibet Plateau in southwest of East Asia,
temperate grass land in its northwest, temperate regions and subtropical monsoon regions
in its east. East Asia has 1.642 billion people, accounting for 36.8% of total population.
Southeast Asia contains Vietnam, Laos, Cambodia, Myanmar, Thailand, Malaysia,
Singapore, Indonesia, Philippines, Brunei, Timor-Leste those 11 countries. Southeast
Asia covers 4.48 million square meters of land, amounting to 10.05% of total land. The
topography of Southeast Asia includes Indo-China Peninsula and Malay Archipelago two
parts, which has the world’s largest number of volcanos. It has tropical rainforest climate,
and the north part of Indo-China Peninsula has subtropical forest climate. The population
is 642 million, accounting for 14.4% in Asia.
South Asia includes Sri Lanka, Maldives, Pakistan, India, Bangladesh, Nepal and
Bhutan those seven countries. It covers 4.37 million square meters of land in Asia,

China Development Report on South-South Cooperation 2017
2
accounting for 9.8%. In its north, it is mountainous area south to Himalaya. It is Deccan
Highland in the southern part of India Peninsula. In its middle, it has Indus-Ganges River
Plateau. The topography of South Asia contains subtropical and tropical areas. It includes
subtropical forest climate, subtropical grassland climate, tropical grassland climate,
and tropical rain forest climate. It is the most populous region in Asia, has 1.732 billion
people, accounting to 38.8% of all Asian population.
West Asia includes Iran, Turkey, Cyprus, Syria, Lebanon, Palestine, Israel, Jordan,
Iraq, Kuwait, Saudi Arabia, Yemen, Omen, United Arab Emirates (UAE), Qatar, Bahrain,
Georgia, Armenia and Azerbaijan those 19 countries. It covers 7.23 million square meters,
amounting to 16.22% of Asia. The main topography in this region is highlands. In its
middle, it lies Mesopotamian Plateau, the origin of ancient civilization. The majority of
this region has few rainfalls. The total population of it is 343 million, accounting for 7.7%
of Asian population. The residents are Arabians, Persians, Turkish and Jews.
Middle Asia includes Turkmenistan, Uzbekistan, Kyrgyzstan, Kazakhstan and
Afghanistan those 5 countries. It covers 4.65 million square meters, amounting to
10.43%. In southeast, it has mountainous areas with high likelihood of earthquakes, and is
mountain climate. The rest of it are plateaus and hills with desert coverage in most of the
area. It includes temperate desert and subtropical desert and grassland climates. The total
population of this region is 104 million, only accounting for 2.3% of Asian population.
The residents are mainly Kazak, Turks, Uzbeks, Kyrgyz, Puthtu, and Russian and Slavic
immigrants during the Soviet Union era.
Natural Resources in Asia Asia has huge amount of natural resources; however, the stock of different natural
resources varies greatly. Of those resources, the stock of oil, natural gas, and coal stand
out and ranks top among seven continents. In 2016, the oil stock in West Asia accounts
for 47.7% around the globe. Adding that in East Asia and Southeast Asia, the weight of
oil stock is over 50%. Of those countries, Saudi Arabia, Iran, Iraq, Kuwait and UAE’s
oil stocks are all above 10 billion tons. In 2016, exploited natural gas stock in Asian
countries amounts to 60.4% in the world. That in West Asia is 42.5%, Middle Asia is

1. Introduction
3
10.5%, and 7.4% in East Asia, South Asia and Southeast Asia, respectively. China and
India have the largest amount of coal stock in Asia. In 2016, the exploited tin ores amount
to 49% around the world, and they are mainly in China, Indonesia, Malaysia, Thailand
and Vietnam. Tungsten ores amount to 64% in the world, and mainly locates at China and
Vietnam. Yet, the stocks of mental resources, e.g. coper, iron, aluminum and manganese,
are less than 20% compared to other regions.
Economic Development in Asian CountriesThe economic development level varies among Asian countries significantly.
According to categorization from UN Industrial Development OrganizationA, Asia still
has the eight least developed countries, which are Afghanistan, Bangladesh, Bhutan,
Cambodia, Laos, Myanmar, Nepal and Yemen. In 2016, GDP per capita in Afghanistan
is only US$565 and economic growth turned to -8.1%. In addition, there are middle low-
income countries in Asia, which are Vietnam, Philippines, Indonesia, Mongolia, India,
Pakistan, Sri Lanka, Kyrgyzstan, Uzbekistan, Syria, Armenia, and Yemen. There are 12
middle high-income countries in Asia, which are Azerbaijan, Iran, Iraq, Jordan, Lebanon,
Turkey, China, Malaysia, Thailand, Maldives, Kazakhstan and Turkmenistan. There are
10 high-income countries in Asia, which are Japan, South Korea, Brunei, Israel, Bahrain,
Kuwait, Omen, Qatar, Saudi Arabia, and UAE. In 2016, oil production country Qatar’s
GDP per capita is as high as $60,786, which is over 100 times as in Afghanistan.
In 2016, top 10 countries in terms of GDP in Asia are China, Japan, India, South
Korea, Indonesia, Turkey, Saudi Arabia, Thailand, Iran and UAE. China’s GDP is $11.2
trillion, and GDP of UAE, the last country in the top 10, is $37.1 billion. The top 10
countries in terms of GDP per capita are Qatar, Singapore, Japan, UAE, Israel, Brunei,
Kuwait, Bahrain and Saudi Arabia. The top one, Qatar’s GDP per capita is $60,786, while
that of Saudi Arabia, ranked the tenth position, is $20,150 (details in Appendix 1) B.
AUN Industrial Development Organization reports do not list Palestine, Timor-Leste and North Korea. Based on GDP per capita, North Korea is a low-income country, Palestine and Timor-Leste are middle low-income countries.
B Source: IMF, World Economic Outlook, April, 2017.
China Development Report on South-South Cooperation 2017
4
The economic development in Asia is highly unbalanced. Asia has a developed
country, high-income countries with oil exports, and also least developed countries. In
particular, the least developed countries and middle low-income countries are desperate
for an effective way to stimulate economic development, and to alleviate poverty. In
terms of economic growth rate, the difference between the least developed countries and
middle low-income countries are substantial. In 2016, the economic growth rate in Iraq
reached 10.1%. Ten countries’ economic growth is above 6% and they include China,
India, Bangladesh, Bhutan, Cambodia, Laos, Myanmar, Philippines, Vietnam, Iran,
Kyrgyzstan and Turkmenistan. However, the economic growth rate of Yemen, Azerbaijan
and Brunei was negative. Yemen was disrupted by interwar and its economic growth rates
were -28.1% and -9.8% in 2015 and 2016, respectively. Therefore, Asian countries should
confront with economic development from various perspectives. In addition to take full
utilization of external aids, they need to improve internal environment, optimize industrial
structure, take advantage of resources, and focus on backbone industries, to promote fast
and stable economic growth.
1.2 A History of China- Asia Cooperation
1.2.1 Development Stages of the Cooperation International economic cooperation between China and other Asian developing
countries can be traced back for quite a long history. It can be divided into ancient,
modern and contemporary stage.
1. Trade of Goods in Ancient TimeThe trade between China and other Asian countries, in ancient time, was mainly
conducted through two ways: Silk Road and Maritime Silk Road. Since 139 BC when
Zhang, Qian took an adventure to exploit western area of China as the envoy, China had
established trade relationship with many Asian countries. The Conventional Silk Road
has three routines: the first is “Northwest Silk Road” exploited by Zhang, Qian in Western
Han Dynasty. It connected countries like Afghanistan, Iran, Iraq and Syria, and reached
1. Introduction
5
Mediterranean area; the second is “Grassland Silk Road” that passed from Mongolian
highland in the north, and through Mountain Tianshan in its west; and the third started
from Chang’an to Chengdu and to India, named “Southwest Silk Road”. The Silk Road
is considered as the cross road that bridges Western and Oriental cultures. Businessmen
traveled along this road tirelessly, largely increasing trade volume between China and
other Asian countries at that time.
Maritime Silk Road was formed up from Han Wu Emperor, almost 2,000 years
ago. Based on Geography Record of “Han History”, Chinese businessmen then traveled
overseas, and visited countries with modern names as Vietnam, Thailand, Myanmar, India
and Sri Lanka. During Wei Dynasty and Jin Dynasty, China did not only connect its close
trade relationship with Southeast Asian countries, but also expanded its trade to region in
Indian Ocean, the Red Sea and Persian Bay. In Sui Dynasty and Tang Dynasty (from 6
AD to 7 AD), Maritime Silk Road was more than Silk Road, due to endless wars in areas
covering Silk Road. This trend continued till the era when Zheng, He traveled southeast.
Maritime Silk Road also covers the routine that reached Korea Peninsula and Japanese
islands, and this routine played a secondary role in trade development.
2. International Trade in Modern TimeAfter 15 century, maritime trade dominated the international trade in modern time.
At this stage, Zheng, He had started trade relationship with countries in Southeast Asia,
South Asia and Arab Peninsula within 28 years (from 1405 to 1433). As the increasingly
number of countries became trade partners with China, China had become the great
power in trade during that time. However, after Zheng’s adventure, administrations from
Ming Dynasty to Qing Dynasty preferred the “close-door” policy, gradually weakening
the influence of China’s maritime trade. From the first Opium War to the foundation of
People’s Repu, China had lost her independence in international trade, and was forced to
trade with only a few western countries. At this stage, the economic and trade cooperation
between China and other Asian countries was limited.

China Development Report on South-South Cooperation 2017
6
3. Economic Cooperation in Contemporary EraSince the foundation of People’s Republic of China, the friendship has been
strengthened between Chinese and people from Asia, Africa and Latin America, in the
process of fighting against colonialism and invasion. The trade cooperation between
China and other Asian countries can be divided into three periods.
The first period: from the foundation of People’s Republic of China to the economic
reform in 1978. People’s Republic of China administration actively engaged in
international trade with many countries with the principles of equality and mutual benefit.
Till 1956, due to the blockade by western countries, the main trade partners of China
then were Soviet Union, countries in East Europe and some Asian countries. China’s
imports from developing countries and regions in AsiaA increased from $301 million in
1950 to $614 million in 1956B. In April 1955, Premier Zhou, Enlai led Chinese delegation
to attend Asia-Africa Conference in Indonesia, expanding China’s influence on Asian
and African countries, and strengthening trade cooperation between China and those
Asian countries. By the end of 1950s and in the early of 1960s, the China-Soviet Union
relationship worsened. China expanded its trade with Asian developing countries. The
trade volume between China and other Asian countries had increased from $591 million
in 1957 to $1.306 billion in 1966C. In “Culture Revolution” between 1966 and 1976,
China’s international trade slowed down. The imports and exports in 1966 ranked 16 and
20, respectively, in the world. Those dropped to 35 and 33, respectively, in 1976D. After
that, China was breeding the force of economic reforms, and international trade took off.
The commodity trade volume between China and other Asian countries in this time had
increased from $3.9 billion in 1976 to $5.32 billion in 1978E.
The second period: from 1978 economic reforms to 2001 before China’s entry to
A Based on statistics by UN, Hong Kong (China), Macau (China) and Taiwan (China) are independent tax identity, considered as developing economies. Without further specification, developing countries and regions in this chapter include those independent tax identities.
B Source: China Foreign Trade Yearbook (1984).
C Ibid.
D Source: History of China’s Foreign Trade, China Commerce and Trade Press, 2015.
E Source: China Foreign Trade Yearbook (1984).

1. Introduction
7
World Trade Organization (WTO). In this period, China’s economy transmitted from
planned economy to “planned economy dominated and market economy supported”,
and quickly to market economy. In international trade, China involved in globalization
effectively, and extended economic and trade cooperation with developing countries
in Asia. The commodity trade volume between China and other Asian countries had
increased from $7.054 billion in 1979 to $154.609 billion in 2000, with average annual
growth rate of 15.84%. It was above the world average growth rate. In addition, China
and other Asian countries and regions experienced Southeast Asian financial crisis that
took place in 1997-1998. China stood up as a responsible country to support its currency
value stable so that the regional economic stability was ensured. To that end, however,
China suffered a great pressure and substantial cost. China’s action was pivotal for
economic and financial stability globally and regionally.
The third period: entry to WTO till now. On December 11, 2001, China became
the member of WTO finally, which was marked as international consensus of China’s
economic development and reforms. It also promotes the trade and economic
development within the region. In this period, China has obtained mountainous progresses
in trade development with developing countries in Asia. In commodity trade, the imports
and exports increased from $160.751 billion in 2001 to $1.35 trillion in 2016. Affected
by Subprime Crisis in USA, the trade volume in 2008 between China and other Asian
countries slide significantly. In 2015 and 2016, trade volume between China and other
Asian countries picked up in the context of global recession. In this period, China does
not only utilize the foreign direct investment from Asian countries and regions to develop
domestic economy, but also start overseas investment in this area. In 2016, investment
flows from China to other Asian countries and regions worth $130.252 billion, accounting
for 66.4% of total foreign direct investment of China in that year. By the end of 2016, the
investment stock from China to Asia was $909.45 billion, amounting to 67% of China’s
foreign investment stock.
1.2.2 Opportunities and Challenges With decade’s effort, China has made a great leap in economic cooperation with

China Development Report on South-South Cooperation 2017
8
Asian developing countries and regions, and also confront with great opportunities. China
proposed “One Belt One Road Initiative” to concentrate on the following five areas:
policy communication, infrastructure connection, trade facilitation, funding support, and
people binding. It lies the solid foundation for further South-South cooperation between
China and other Asian developing countries. In policy communication, China tirelessly
pursues to get different policies of countries and regions compatible. Various countries’
development plans, for example, Kazakhstan’s “Bright Avenue”, Mongolia’s “Grassland
Road”, Russia’s “Cross Asia-Europe Passthrough Construction”, and Indonesia’s “Global
Maritime Support” are compatible with China’s “One Belt One Road Initiative”. In
infrastructure connection, infrastructure like transportation, energy, telecommunication
and electricity are the key sectors. In trade facilitation, China is actively promoting Free
Trade Agreements among Asian countries, to enhance trade and investment facilitation. In
funding support, China has established Asia Infrastructure Investment Bank (AIIB) and
provided $40 billion as Silk Road Fund in 2014, to address the problem of insufficient
funds among Asian developing countries, and provided financial support for Asia’s
economic development. In people biding, China continues to improve people-to-people
exchange mechanism, high-level visits, student exchange, visa facilitation, and offers
good opportunities for cultural exchanges between China and other Asian countries.
No doubt that there are still many challenges ahead. First, there is a huge imbalance
in trade between China and other Asian countries. China runs substantial trade deficits
with some countries in East Asia, while China runs significant trade surplus with
countries in South Asia, for example, with India. Trade imbalance builds up barriers in
further economic cooperation with China. Second, the imbalanced trade structure between
China and other Asian developing countries is obvious. Exports from China mainly are
from labor-intensive and capital-intensive production sectors, imports for China is mainly
in resource-intensive sector. Third, investment from China to other Asian countries varies.
Volatility of investment stock is not negligible in some countries and regions.
1. Introduction
9
1.2.3 Benefits for Economic and Trade Cooperation
1. Benefits for ChinaFirstly, it is good for China to improve its industrial structure in economic trade
cooperation with other Asian developing countries. China has experienced 30-year
fast economic growth, and had a complete set of manufacturing system. So far, China
is in the key period of economic transition. On the one hand, China needs to import
more advanced technology to increase its industrialization level. On the other hanl, the
great number of abundant productive capacity, advanced equipment and technologies
accumulate from those years have become the main source of international capacity
export. Among those developing countries in Asia, some countries and regions have more
advanced industrialization than China, and some desperately demand for more capacity
for they are in the course of industrialization. China and other Asian countries cooperation
in economic development is mutual benefit.
Secondly, China could increase its independence as cooperating with other Asian
countries. China is highly relied on imports such as oil, and the economy is vulnerable
for shocks of such imports. Many Asian countries possess comparative advantages in
energy field over China, and are close to China in geography. They could become reliable
sources for China’s demand, weakening the volatility of international shocks to economic
development.
Thirdly, Asian countries are the indispensable part of China’s “One Belt One Road
Initiative”. This Initiative provides China with many new opportunities in foreign trade.
Asian countries take a pivotal position in this Initiative, and many countries locate at
significant pots in Silk Road and Maritime Silk Road. South-South cooperation between
China and other Asian countries is possible for China to succeed in “One Belt One Road”
building.
2. Benefits for Other Asian Developing CountriesFirstly, less developed countries could take a faster stride in industrialization and
economic development. China’s industrialization has been undertaken by 60 years, has

China Development Report on South-South Cooperation 2017
10
many experiences and solid economic foundation. Thus, China is able to provide support
for those countries in industrialization either financially, technologically or human
resource side. Policy suggestions are also available. In particular, cooperation in areas of
infrastructure and capacity cooperation, China’s advanced technology and management
experience could increase those developing countries’ independence and promote
industrialization.
Secondly, South-South cooperation between China and other Asian countries
is good for optimization of Asian developing countries industrial structure. Some
developing countries in Asia are low-income countries, with simple industrial structure
and low-quality products. China, with years development, has many technologies that
are compatible with its development, which is valuable for those Asian developing
countries. The positive spillovers of knowledge and technology transfer are beneficial for
developing countries in Asia to breed capacity and upgrade industrial structure.
Thirdly, it provides the chance for Asian developing countries to take full advantage
of resources in “One Belt One Road”. South-South cooperation between China and other
Asian countries and “One Belt One Road” are compatible, and generate a good “feedback
loop”. Asian countries could use Silk Road Fund and AIIB when participating in “One
Belt One Road” construction, to promote local economic development.
1.3 Structure of This ReportThis report is No. 5 China South-South Cooperation Report, focusing on cooperation
in Asia, between China and other Asian countries. The rest of the report can be broken
down into three parts.
The first part (including Chapter 2 to Chapter 5) gives a bird view of South-South
cooperation between China and Asian developing countries and regions, including trade
cooperation, investment cooperation, foreign aid and regional economic cooperation.
Chapter 2, from the trade scale, commodity structure in trade, geographical distribution
in trade and trade compatibility and competitiveness, analyzes China’s trade promotion
and deepening in Asia. Chapter 3, based on the analysis of China’s investment to other

1. Introduction
11
Asian countries, further discusses the national characteristics, regional characteristics,
investment modules. It shows the upward trend of China’s investment in Asia and also
indicates that China is the key area for Asian countries’ investment. However, investments
are highly concentrated and have large volatilities. In the future, China should be more
aware of the structural adjustment in investment, to realize balanced investment with
other Asian countries. Chapter 4 takes an overview of China’s foreign aids first, and
focuses on China’s foreign aid since the 21st century in Asian countries. It analyzes the
effectiveness of China’s foreign aids in terms of economic growth, social development,
income increase, poverty alleviation, and environmental protection. Chapter 5, from the
perspective of regional economic cooperation, analyzes South-South cooperation between
China and other Asian countries. It mainly contains the signed and on-negotiating free
trade agreements, border economic cooperation zones, cross-border economic cooperation
areas with other Asian countries. These regional and sub-regional economic cooperation
is vital for South-South cooperation in this area.
The second part (including Chapter 6 to Chapter 9) introduces the features of
cooperation from the geographical perspective, i.e., China’s cooperation with countries in
Southeast Asia, South Asia, West Asia and Middle Asia. This part does not only introduce
the general characteristics of China’s South-South cooperation with countries in those
regions, but also analyzes the specific features in cooperation.
Chapter 10 is taken as the third part of this report. It looks forward to future
development in South-South cooperation given China’s “One Belt One Road Initiative”.
The purpose of this Initiative is to promote economic cooperation between China and
countries related. It is in an attempt to build policy communication, infrastructure
connection, trade facilitation, funding support, and people binding. In detail, productive
capacity and infrastructure are the two important areas in cooperation, and AIIB and Silk
Road Fund offer necessary financial support for this Initiative.
12
2. Trade Relations between China and Asian Developing Countries
Since the reform and opening up, with the rapid growth of China’s economic
strength, the economic relations between China and developing countries and regions in
Asia have been strengthened, and trade relations have been comprehensively enhanced
and deepened.
2.1 The Scale and Growth Developing countries in Asia are important trading partners of China and have
always been an important source of import and export destinations for China. This section
will analyze the trade relations between China and Asian developing countries and
regions in terms of trade scale and growth rate.
2.1.1 The Scale of TradeRegarding the scale of trade between China and Asian developing countries and
regions, this report reveals the import volume and its proportion of China’s total imports,
the amount of exports and its share in China’s total exports, and the total trade. From
these aspects, the report demonstrates a general overview of trade between China and
Asian developing countries and regions from 1998 to 2016.
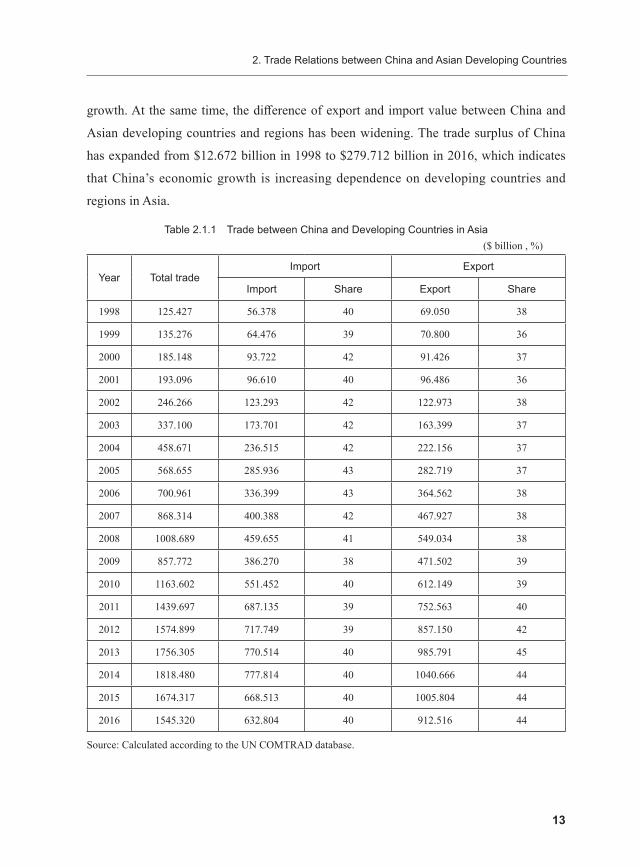
As can be seen from Table 2.1.1, the total trade volume between China and Asian
developing countries and regions has surged from $125.427 billion in 1998 to $1545.320
billion in 2016, an increase of about 12 times. In terms of imports, the import value
was $56.378 billion in 1998, which reached $632.804 billion in 2016. And for exports,
the export value was $69.050 billion in 1998 and reached $912.516 billion in 2016. It
indicates that with the expansion of trade between China and Asian developing countries
and regions, the volume of exports and imports also showed a trend of simultaneous
2. Trade Relations between China and Asian Developing Countries
13
growth. At the same time, the difference of export and import value between China and
Asian developing countries and regions has been widening. The trade surplus of China
has expanded from $12.672 billion in 1998 to $279.712 billion in 2016, which indicates
that China’s economic growth is increasing dependence on developing countries and
regions in Asia.
Table 2.1.1 Trade between China and Developing Countries in Asia ($ billion , %)
Year Total tradeImport Export
Import Share Export Share
1998 125.427 56.378 40 69.050 38
1999 135.276 64.476 39 70.800 36
2000 185.148 93.722 42 91.426 37
2001 193.096 96.610 40 96.486 36
2002 246.266 123.293 42 122.973 38
2003 337.100 173.701 42 163.399 37
2004 458.671 236.515 42 222.156 37
2005 568.655 285.936 43 282.719 37
2006 700.961 336.399 43 364.562 38
2007 868.314 400.388 42 467.927 38
2008 1008.689 459.655 41 549.034 38
2009 857.772 386.270 38 471.502 39
2010 1163.602 551.452 40 612.149 39
2011 1439.697 687.135 39 752.563 40
2012 1574.899 717.749 39 857.150 42
2013 1756.305 770.514 40 985.791 45
2014 1818.480 777.814 40 1040.666 44
2015 1674.317 668.513 40 1005.804 44
2016 1545.320 632.804 40 912.516 44
Source: Calculated according to the UN COMTRAD database.

China Development Report on South-South Cooperation 2017
14
In terms of the proportion of imports and exports, China’s imports from developing
countries and regions in Asia accounted for about 40% of China’s total imports. China’s
exports to developing countries and regions in Asia accounted for a significant change
in China’s total exports around 2010. From 1998 to 2000, China’s exports to Asian
developing countries accounted for less than 40% of China’s total exports, and after 2011
they were all above 40%. It is worth noting that the scale of trade between China and
Asian developing countries and regions is expanding, which accounts for more than 40%
of China’s import and export volume. However, from a trend perspective, from 1998
to 2016, China’s share of imports and exports to developing countries and regions in
Asia did not fluctuate significantly and continued to fluctuate around 40%. It shows that
due to geographical and cultural factors, China has maintained a high trade dependence
on developing countries and regions in Asia for a long time. South-South cooperation
between China and Asian developing countries and regions has a solid trade base.
2.1.2 The Growth RateFurther, from the perspective of trade growth rate, we intend to reveal the
development trend in trade between China and Asian developing countries and regions in
order to fully reflect its overall situation. We are going to make the analysis based on two
kinds of growth, e.g. fixed-base growth and chain growth (or year-on-year growth).
In terms of the chain growth, China’s trade with developing countries and regions
in Asia has experienced three stages of rapid development. The first stage is from 1999
to 2000. Imports increased by 45.36% in 2000, and exports grew by as much as 29.13%.
This is mainly because China had not yet joined the WTO at this stage, and the degree
of international openness is still not high, and the impact of the Asian financial crisis that
began in 1997 was small, also at the same time China began to revitalize the country’s
economy. The second stage is from 2000 to 2010. In this stage, China entered into the
WTO, both import and export grew very fast with reaching 41% and 33% respectively
in 2003. The third stage is from 2010 to 2011, when import and export trade between
China and Asian developing countries and regions continually grew at smaller rate even
though the subprime mortgage crisis broke out in 2007 and continued until 2009 when

2. Trade Relations between China and Asian Developing Countries
15
trade growth was suppressed. After the rapid growth in 2011, the growth rate of trade was
further reduced by the emergence of the European sovereign debt crisis in 2012, which
slowed the growth of trade in the context of slowing global trade growth. It is worth
noting that in 2015 and 2016, both China and Asian developing countries and regions
experienced negative growth in both imports and exports. This was mainly due to the
weak global economic recovery and the deepening of international trade which inhibited
import and export trade.Table 2.1.2 Trade between China and Developing Countries in Asia
(%)
YearImport Export
Chain growth Fixed-Base Growth Chain growth Fixed-Base Growth
1999 14.36 14.36 2.54 2.54
2000 45.36 66.24 29.13 32.41
2001 3.08 71.36 5.53 39.73
2002 27.62 118.69 27.45 78.09
2003 40.88 208.10 32.87 136.64
2004 36.16 319.52 35.96 221.73
2005 20.90 407.18 27.26 309.44
2006 17.65 496.69 28.95 427.97
2007 19.02 610.19 28.35 577.67
2008 14.80 715.31 17.33 695.13
2009 -15.97 585.15 -14.12 582.85
2010 42.76 878.14 29.83 786.53
2011 24.60 1118.81 22.94 989.89
2012 4.46 1173.11 13.90 1141.35
2013 7.35 1266.70 15.01 1327.65
2014 0.95 1279.65 5.57 1407.13
2015 -14.05 1085.78 -3.35 1356.64
2016 -5.34 1022.44 -9.27 1221.54
Source: Calculated according to the UN COMTRAD database.

China Development Report on South-South Cooperation 2017
16
In terms of the fixed-base growth, China’s imports from developing countries in Asia
generally show a rapid growth trend. Based on 1998, the fixed base growth was 14.36%
in 1999 and 1022.44% in 2016, an increase of about 10 times. In view of China’s exports
to developing countries and regions in Asia, based on 1998, the fixed base growth in 1999
was 2.54% and reaching 1221.54% in 2016, an increase of about 12 times. Trade between
China and Asian developing countries and regions showed a strong growth trend.
2.2 The Structure or Pattern of Trade This section examines the structural characteristics of commodity trade between
China and Asian developing countries from a variety of perspectives, classifying
commodity trade structure according to Standard International Trade Classification (SITC),
Economic Big Classification (BEC) and Factor Intensity.
2.2.1 The Structure of Trade by SITCAccording to the first digit of SITC, traded products can be divided into 10
categories, including food and live animals (SITC-0), beverages and tobacco (SITC-
1), non-edible raw materials (SITC-2), fossil fuels (SITC-3), animal and vegetable
oils (SITC-4), chemicals (SITC-5), manufactured goods (SITC-6), machinery and
transportation vehicles (SITC-7), miscellaneous products (SITC-8) and other unclassified
products (SITC-9).
Table 2.2.1-1 shows the product trade structure classified by SITC first digit, which
reflects the export value, import value and their proportion in total trade between China
and developing countries in Asia. As can be seen from the Table, the export between
China and Asian developing countries is mainly concentrated on finished products of raw
materials (SITC-6), machinery and transportation equipment (SITC-7) and miscellaneous
products (SITC-8). For these three categories of products, total exports value in 2000,
2005, 2010 and 2015 were $74.914 billion, $244.25 billion, $530.06 billion and $883.418
billion, respectively. However, in 2016, exports of these three major categories declined
to $791.552 billion. In terms of proportion or share, SITC-6, SITC-7 and SITC-8 as

2. Trade Relations between China and Asian Developing Countries
17
a total account for more than 80% of total exports, specifically, the proportions in
2000, 2005, 2010, 2015 and 2016 were 81.93%, 86.49%, 86.68%, 87.83% and 86.75%
respectively, further illustrating that China’s exports to developing countries in Asia are
highly concentrated in these three categories of products.
Table 2.2.1-1 The Export Structure by SITC (US$ billion, %)
Year 0 1 2 3 4 5 6 7 8 9
2000$ 4.455 0.578 1.584 4.293 0.082 5.094 20.033 32.642 22.239 0.426
% 4.87 0.63 1.73 4.70 0.09 5.57 21.91 35.70 24.32 0.47
2005$ 7.946 0.871 2.382 10.579 0.153 15.555 57.637 136.046 50.842 0.708
% 2.81 0.31 0.84 3.74 0.05 5.50 20.39 48.12 17.98 0.25
2010$ 16.263 1.381 4.757 18.444 0.217 40.129 108.416 319.235 102.955 0.351
% 2.66 0.23 0.78 3.01 0.04 6.56 17.71 52.15 16.82 0.06
2015$ 28.556 2.622 6.435 19.851 0.271 62.371 188.400 504.197 190.821 2.279
% 2.84 0.26 0.64 1.97 0.03 6.20 18.73 50.13 18.97 0.23
2016$ 30.892 2.837 6.056 19.328 0.270 58.190 172.712 453.439 165.401 3.391
% 3.39 0.31 0.66 2.12 0.03 6.38 18.93 49.69 18.13 0.37
Source: Calculated according to the UN COMTRAD database.
Note: 0 to 9 in the first row refers to SITC-0 to SITC-9 respectively. $ and % in second column refers to the
value of trade and its share in the total.
Table 2.2.1-2 The Import Structure by SITC ($ billion, %)
Year 0 1 2 3 4 5 6 7 8 9
2000$ 1.015 0.018 5.320 14.616 0.628 14.930 21.322 31.441 4.288 0.144
% 1.08 0.02 5.68 15.60 0.67 15.93 22.75 33.55 4.58 0.15
2005$ 2.023 0.026 16.556 37.951 2.167 39.676 34.223 122.037 30.841 0.437
% 0.71 0.01 5.79 13.27 0.76 13.88 11.97 42.68 10.79 0.15
2010$ 5.671 0.168 44.225 106.588 6.267 75.528 43.359 210.843 55.410 3.394
% 1.03 0.03 8.02 19.33 1.14 13.70 7.86 38.23 10.05 0.62

China Development Report on South-South Cooperation 2017
18
Year 0 1 2 3 4 5 6 7 8 9
2015$ 12.303 0.560 31.869 118.361 5.535 83.960 49.201 295.865 56.725 14.134
% 1.84 0.08 4.77 17.71 0.83 12.56 7.36 44.26 8.49 2.11
2016$ 11.924 0.572 30.732 99.784 4.846 77.384 43.869 286.611 52.340 24.742
% 1.88 0.09 4.86 15.77 0.77 12.23 6.93 45.29 8.27 3.91
Source: Calculated according to the UN COMTRAD database.
Note: 0 to 9 in the first row refers to SITC-0 to SITC-9 respectively. $ and % in second column refers to the
value of trade and its share in the total.
As far as the imported structure is concerned, China’s imports from developing
countries in Asia account for the largest proportion of machinery and transportation
equipment (SITC-7), and its share has increased from 31.42% in 2000 to 45.6% in 2016.
In view of China’s exports to developing countries in Asia, the proportion of exports
of machinery and transportation equipment also reached 52.15%. This means that the
international vertical specialization of machinery and transportation equipment is clear.
China’s trade characteristics on such products are mainly importing spare parts and export
the finished goods.
From 2000 to 2016, the proportion of fossil fuels, lubricants and related raw
materials (SITC-3) and unspecified chemicals and related products (SITC-5) staid
generally stable, of which the proportion of fossil fuels, lubricants and related raw
materials reached a maximum of 19.33% in 2010. Moreover, the proportion of their
imports far exceeds the proportion of their exports. This means that China is highly
dependent on the energy supply of developing countries and regions in Asia. The most
fluctuated proportion of imported products, which are mainly classified by raw materials
(SITC-6), fell from 22.75% in 2000 to 6.93% in 2016, reflecting the decline in demand
for such products in China.
2.2.2 The Structure of Trade by BECNow we look at the structure of trade between China and Asian developing countries
according to the Economic Broad Classification (BEC). In the first digit of the BEC, the
Continued

2. Trade Relations between China and Asian Developing Countries
19
trade products can be divided into 7 categories, e.g. food and beverage, uncategorized
industrial supplies, fuels and lubricants, capital goods (excluding transportation
equipment) and their spare parts, transportation equipment and its spare parts and
uncategorized consumer products.
Overall, the largest trade between China and Asian developing countries and
regions is the uncategorized industrial supplies (BEC-2) and capital goods (excluding
transportation equipment) and their spare parts (BEC-4). The import and export trade
volume of uncategorical industrial supplies increased from $71.704 billion in 2000 to
$426.641 billion in 2016, an increase of about 6 times. The import and export trade
volume of capital goods (excluding transportation equipment) and its spare parts
increased from $57.503 billion in 2000 to $715.86 billion in 2016, an increase of
approximately 12.4 times. In terms of exported products, the proportion of these two
products in the total product was 59.7% in 2000 and reached 72.1% in 2016. Similarly,
in terms of imported products, the proportion of these two products in total products was
79.6% in 2000 and fell to 76.4% in 2016. This shows that in the trade with developing
countries and regions in Asia, although the import and export of industrial supplies and
capital goods account for a large proportion, however, with the development of China’s
economy, China’s imports of industrial supplies and capital goods are decreasing while
exports are increasing.
Table 2.2.2-1 The Export Structure by BEC
(US$ billion, %)
Year BEC-1 BEC-2 BEC-3 BEC-4 BEC-5 BEC-6 BEC-7
2000Export 3.848 27.833 4.175 26.771 4.7 23.64 0.458
% 4.21 30.44 4.57 29.28 5.14 25.86 0.5
2005Export 7.648 77.209 10.249 124.511 12.674 49.614 0.814
% 2.71 27.31 3.63 44.04 4.48 17.55 0.29
2010Export 16.889 156.782 17.778 284.642 40.739 94.234 1.086
% 2.76 25.61 2.9 46.5 6.66 15.39 0.18
2015Export 30.262 270.604 19.099 459.507 53.945 171.452 0.933
% 3.01 26.9 1.9 45.69 5.36 17.05 0.09

China Development Report on South-South Cooperation 2017
20
Year BEC-1 BEC-2 BEC-3 BEC-4 BEC-5 BEC-6 BEC-7
2016Export 32.654 247.822 18.767 410.341 46.522 153.705 2.706
% 3.58 27.16 2.06 44.97 5.1 16.84 0.3
Source: Calculated according to the UN COMTRAD database.
Table 2.2.2 The Import Structure by BEC
(US$ billion, %)
Year BEC-1 BEC-2 BEC-3 BEC-4 BEC-5 BEC-6 BEC-7
2000Import 1.492 43.871 14.354 30.732 0.732 2.396 0.146
% 1.59 46.81 15.32 32.79 0.78 2.56 0.16
2005Import 3.955 94.678 37.078 140.22 4.129 5.438 0.438
% 1.38 33.11 12.97 49.04 1.44 1.9 0.15
2010Import 11.108 175.386 102.304 240.396 9.408 9.453 3.397
% 2.01 31.8 18.55 43.59 1.71 1.71 0.62
2015Import 17.08 189.13 108.292 314.93 10.85 21.157 7.074
% 2.55 28.29 16.2 47.11 1.62 3.16 1.06
2016Import 15.905 178.819 92.33 304.745 10.394 18.935 11.675
% 2.51 28.26 14.59 48.16 1.64 2.99 1.84
Source: Calculated according to the UN COMTRAD database.
Regarding to the balance of trade, China suffer a trade deficit in fuel and lubricants
(BEC-3) and uncategorical consumer products (BEC-6). Among them, the export trade
of fuels and lubricants is much smaller than the import, and the difference is constantly
expanding. China has large trade deficits in energy products with Asian developing
countries and relies on their energy supply. For uncategorical consumer goods, the
export volume is much larger than the import volume, and the trade surplus is gradually
increasing, which compensates for the trade deficit of energy products to some extent.
These explain that, except for the trade of uncategorized industrial supplies and capital
goods (excluding transportation equipment) and their spare parts, China mainly imports
energy while Asian developing countries mainly import Chinese consumer goods.
Continued

2. Trade Relations between China and Asian Developing Countries
21
2.2.3 The Trade Structure by Factor IntensityAccording to the theory of comparative advantage, the basis of international trade
is the relative difference in factor endowments owned by countries. Trade products can
be divided into resource-intensive, labor-intensive, and capital-and-technology-intensive
products according to Factor Intensity.A The structure of import and export are analyzed
in this section based upon factor intensity.
In general, labor-intensive products account for more than 50% of the import
and export between China and Asian developing countries, and resource-intensive
products account for the smallest proportion. In terms of labor-intensive products, it
takes a proportion of 56.95% in 2000 and reached 61.9% in 2016. The share of capital
and technology-intensive products fell from 25.45% in 2000 to 24.684% in 2016. The
proportion of resource-intensive products also showed a tendency of decline, from 17.6%
in 2000 to 13.41% in 2016. It shows that China’s trade with developing countries in Asia
is mainly concentrated in labor-intensive products.
Table 2.2.3 Trade Structure Classified by Factor Intensity
(US$ billion)
YearResource-intensive Products Labor-Intensive Products
Capital- and Technology-Intensive Products
Export Import Export Import Export Import
2000 10.993 21.596 52.675 52.763 27.759 19.363
2001 11.283 19.791 57.896 55.332 27.307 21.487
2002 12.876 20.778 76.445 74.667 33.651 27.848
2003 15.714 31.068 103.294 102.988 44.391 39.645
2004 16.824 47.167 147.921 130.863 57.412 58.485
2005 21.931 58.723 193.682 156.26 67.106 70.954
2006 22.724 75.461 257.614 179.567 84.225 81.371
2007 28.214 96.471 327.307 205.805 112.406 98.112
A This report defines resource-intensive products as SITC-0 to SITC-4 products based on SITC first digit. Labor-intensive products are defined as SITC-6 and SITC-7 products, capital and technology-intensive product are defined as SITC-5, SITC-8 and SITC-9 products.

China Development Report on South-South Cooperation 2017
22
YearResource-intensive Products Labor-Intensive Products
Capital- and Technology-Intensive Products
Export Import Export Import Export Import
2008 33.793 148.675 386.346 205.73 128.896 105.25
2009 31.684 104.334 329.761 187.23 110.057 94.706
2010 41.063 162.919 427.651 254.201 143.435 134.332
2011 49.131 240.264 516.262 287.603 187.17 159.268
2012 49.308 250.317 573.158 305.158 234.683 162.273
2013 57.283 255.98 660.062 345.509 268.446 169.025
2014 62.663 248.596 680.412 365.765 297.591 163.452
2015 57.734 168.627 692.597 345.067 255.472 154.819
2016 59.383 147.858 626.151 330.479 226.982 154.466
Source: Calculated according to the UN COMTRAD database.
From the perspective of both import and export, before 2005, China’s imports of
labor-intensive products from developing countries in Asia were slightly higher than
exports, showing a small trade deficit. However, since 2005, China’s exports of labor-
intensive products have significantly exceeded imports, and the trade balance has
gradually expanded, showing a trade surplus. For capital and technology intensive
products, China’s exports to developing countries in Asia have been greater than their
imports since 2006, showing a trade surplus. In terms of resource-intensive products,
China’s imports were greater than exports from 2000 to 2016, during which the value
of exports increased only from $10.993 billion to $59.383 billion, while imports were
$21.596 billion in 2000 and rose to $147.858 billion in 2016. It shows that with the
development of China’s economy, China’s dependence on resource-intensive exports has
gradually decreased, but import demand has increased. Such a trade structure has also
enabled other developing countries and regions in Asia, especially those with relatively
backward industries, to take advantage of the increase in import demand brought about by
China’s economic growth to expand exports and achieve economic growth.
Continued

2. Trade Relations between China and Asian Developing Countries
23
2.3 The Structure of Trade in Different Regional in AsiaDue to the different geographical location, income level and stage of economic
development of Asian countries, the trade structure between China and other Asian
regions will also have different characteristics. In view of this, this section mainly
examines the trade structure characteristics between China and different regions of Asia,
countries with different levels of development and major trading partners in order to
further reveal the trade characteristics between China and different types of developing
countries and regions in Asia.
2.3.1 Trade Structure by RegionAsia can be divided into East Asia, South Asia, Southeast Asia, West Asia and
Central Asia by region.A Based on the geographical division, we will examine China’s
import and export trade scale and the growth rate of trade in various regions of Asia and
explore the trade structure between China and other parts of Asia. Table 2.3.1 shows the
trade profiles of China and Asian developing countries and regions from 1998 to 2016.
In terms of trade scale, China’s trade with developing countries and regions in Asia
is mainly concentrated in East Asia and Southeast Asia. This on the one hand is due to
the similar geographical proximity, cultural homology and similar level of economic
development in East Asia, Southeast Asia and China. On the other hand, there is a lot
of entrepot trade with Hong Kong (China), Macao (China) and Taiwan (China). As far
as Hong Kong (China), Macao (China) and Taiwan (China) regions are concerned, the
average annual export volume of China mainland to Hong Kong (China), Macao (China)
and Taiwan (China) was $203.44 billion from 1998 to 2016, while the average annual
import volume was $93.346 billion. Due to the existence of entrepot trade, the export
volume of China mainland with Hong Kong (China), Macao (China) and Taiwan (China)
is far greater than the import value.
From the perspective of trade growth, although the export volume of China and
A East Asia here includes Taiwan (China), Hong Kong (China), Macau (China), South Korea, Mongolia and North Korea.

China Development Report on South-South Cooperation 2017
24
Central Asia, South Asia and West Asia is limited, the average ring growth rate of export
volume is very impressive, showing great trade potential. In terms of imports, import
volume growth of China with West Asia and Central Asia is the fastest, with an average
annual growth rate of 27.44% and 23.79%, respectively. This is mainly because China
imports a large amount of energy, mineral and other resource products from West Asia
and Central Asia. Although the average annual growth rate of trade between China and
East Asia and Southeast Asia is not high, it is still an important source of imports and an
export market country due to its large base.
Table 2.3.1 China’s Trade with Different Regions in Asia: 1999-2016
(US$ billion, %)
Southeast Asia East Asia South Asia West Asia Central Asia
Average Export 113.74 258.3 39.236 58.349 11.358
Average growth rate of exports 19.9 13.76 23.56 20.8 29.18
Proportion in the total exports 23.65 53.7 8.16 12.13 2.36
Average import 108.071 200.917 12.75 64.864 9.152
Average growth rate of imports 17.84 13.44 18.02 27.44 23.79
Proportion in the total import 27.31 50.77 3.22 16.39 2.31
Source: Calculated according to UN COMTRAD database.
We can see that mainly trade with East Asia and Southeast Asia. In terms of China’s
export, East Asia and Southeast Asia accounted for 53.7% and 23.65% respectively, and
the two regions accounted for 77.35% of China’s total exports to Asia. In terms of China’s
import, East Asia and Southeast Asia accounted for 50.77% and 27.31% respectively, and
the two regions accounted for 78.08% of China’s total import in Asia. This means that
East Asia and Southeast Asia are important trading partners of China in Asia, and China’s
trade with Central Asia, South Asia and West Asia shows great potential.
2.3.2 Trade Structure by Level of DevelopmentAccording to the income level, developing countries in Asia are divided into high-
income, middle-income and low-income countries respectively. With which, we can
2. Trade Relations between China and Asian Developing Countries
25
examine the trade structure between China and the country group with different levels
of development. The criteria for the division of income levels are based on the 2011
UNCTAD Statistical Manual and the World Bank’s division criteria.A
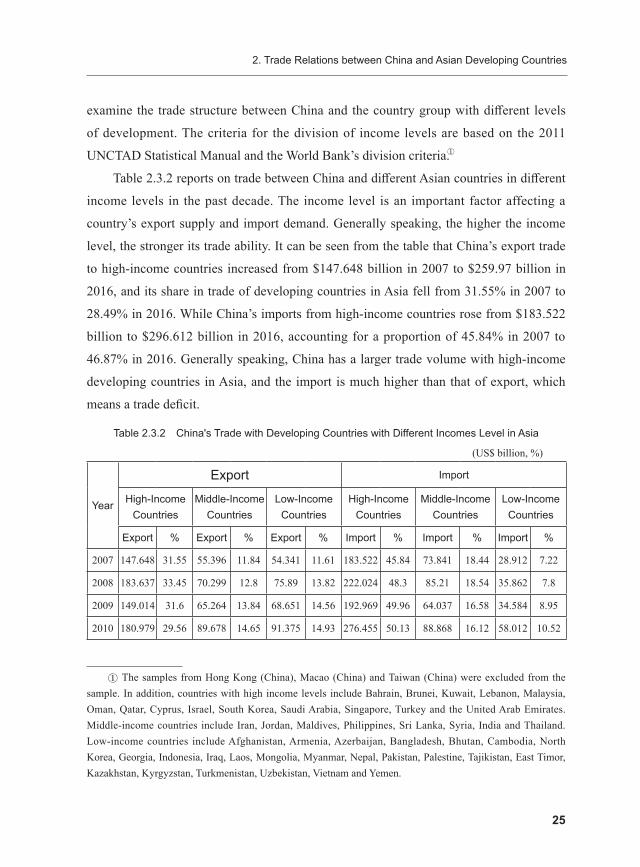
Table 2.3.2 reports on trade between China and different Asian countries in different
income levels in the past decade. The income level is an important factor affecting a
country’s export supply and import demand. Generally speaking, the higher the income
level, the stronger its trade ability. It can be seen from the table that China’s export trade
to high-income countries increased from $147.648 billion in 2007 to $259.97 billion in
2016, and its share in trade of developing countries in Asia fell from 31.55% in 2007 to
28.49% in 2016. While China’s imports from high-income countries rose from $183.522
billion to $296.612 billion in 2016, accounting for a proportion of 45.84% in 2007 to
46.87% in 2016. Generally speaking, China has a larger trade volume with high-income
developing countries in Asia, and the import is much higher than that of export, which
means a trade deficit.
Table 2.3.2 China's Trade with Developing Countries with Different Incomes Level in Asia
(US$ billion, %)
Year
Export Import
High-Income Countries
Middle-Income Countries
Low-Income Countries
High-Income Countries
Middle-Income Countries
Low-Income Countries
Export % Export % Export % Import % Import % Import %
2007 147.648 31.55 55.396 11.84 54.341 11.61 183.522 45.84 73.841 18.44 28.912 7.22
2008 183.637 33.45 70.299 12.8 75.89 13.82 222.024 48.3 85.21 18.54 35.862 7.8
2009 149.014 31.6 65.264 13.84 68.651 14.56 192.969 49.96 64.037 16.58 34.584 8.95
2010 180.979 29.56 89.678 14.65 91.375 14.93 276.455 50.13 88.868 16.12 58.012 10.52
A The samples from Hong Kong (China), Macao (China) and Taiwan (China) were excluded from the sample. In addition, countries with high income levels include Bahrain, Brunei, Kuwait, Lebanon, Malaysia, Oman, Qatar, Cyprus, Israel, South Korea, Saudi Arabia, Singapore, Turkey and the United Arab Emirates. Middle-income countries include Iran, Jordan, Maldives, Philippines, Sri Lanka, Syria, India and Thailand. Low-income countries include Afghanistan, Armenia, Azerbaijan, Bangladesh, Bhutan, Cambodia, North Korea, Georgia, Indonesia, Iraq, Laos, Mongolia, Myanmar, Nepal, Pakistan, Palestine, Tajikistan, East Timor, Kazakhstan, Kyrgyzstan, Turkmenistan, Uzbekistan, Vietnam and Yemen.

China Development Report on South-South Cooperation 2017
26
Year
Export Import
High-Income Countries
Middle-Income Countries
Low-Income Countries
High-Income Countries
Middle-Income Countries
Low-Income Countries
Export % Export % Export % Import % Import % Import %
2011 218.925 29.09 113.267 15.05 114.922 15.27 346.619 50.44 111.173 16.18 88.777 12.92
2012 245.891 28.69 114.432 13.35 133.896 15.62 363.293 50.62 102.331 14.26 101.75 14.18
2013 273.163 27.71 122.714 12.45 161.611 16.39 386.816 50.2 99.422 12.9 111.277 14.44
2014 296.621 28.5 144.564 13.89 186.533 17.92 390.306 50.18 103.693 13.33 118.974 15.3
2015 296.525 29.48 149.883 14.9 179.448 17.84 330.084 49.38 86.11 12.88 96.184 14.39
2016 259.97 28.49 150.312 16.47 171.614 18.81 296.612 46.87 83.008 13.12 97.497 15.41
Source: Calculated according to the UN COMTRAD database.
While China’s export trade to middle-income and low-income countries is generally
growing with a slight upward trend of the proportion in the total. In terms of import
and export, China’s trade with middle-income and low-income countries showed an
increasing trend in general, trade volume reaching the maximum in 2014, followed a
downward trend from 2015 to 2016 due to the global trade decline.
2.3.3 China’s Major Trading Partners in AsiaWe are going to use the average annual import and export data from 1998 to 2016
to analyze the trade structure of China with its major trading partners in Asia by both
country and region. China’s top ten trading partners in Asia are Hong Kong (China),
South Korea, Taiwan (China), Malaysia, Singapore, Thailand, India, Saudi Arabia,
Vietnam and the United Arab Emirates.
Table 2.3.3 Top Ten Trading Partners of China in in Asia: 1998-2016
(US$ billion, %)
Countries/RegionsExport Import
Rank Export Proportion Rank Import Proportion
Hong Kong (China) 1 271.640 35.66 10 13.835 2.35
India 3 44.371 5.85 11 17.007 2.96
Continued
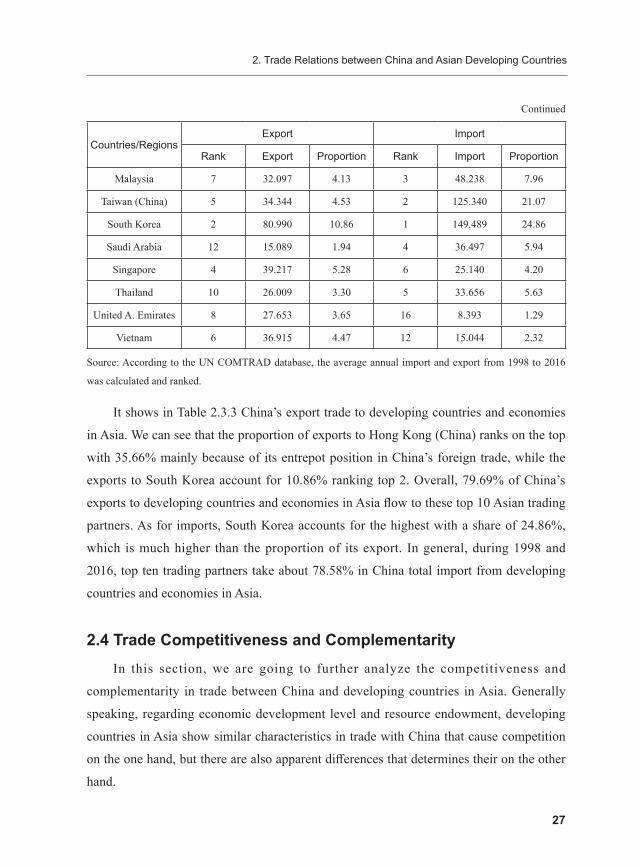
2. Trade Relations between China and Asian Developing Countries
27
Countries/RegionsExport Import
Rank Export Proportion Rank Import Proportion
Malaysia 7 32.097 4.13 3 48.238 7.96
Taiwan (China) 5 34.344 4.53 2 125.340 21.07
South Korea 2 80.990 10.86 1 149.489 24.86
Saudi Arabia 12 15.089 1.94 4 36.497 5.94
Singapore 4 39.217 5.28 6 25.140 4.20
Thailand 10 26.009 3.30 5 33.656 5.63
United A. Emirates 8 27.653 3.65 16 8.393 1.29
Vietnam 6 36.915 4.47 12 15.044 2.32
Source: According to the UN COMTRAD database, the average annual import and export from 1998 to 2016
was calculated and ranked.
It shows in Table 2.3.3 China’s export trade to developing countries and economies
in Asia. We can see that the proportion of exports to Hong Kong (China) ranks on the top
with 35.66% mainly because of its entrepot position in China’s foreign trade, while the
exports to South Korea account for 10.86% ranking top 2. Overall, 79.69% of China’s
exports to developing countries and economies in Asia flow to these top 10 Asian trading
partners. As for imports, South Korea accounts for the highest with a share of 24.86%,
which is much higher than the proportion of its export. In general, during 1998 and
2016, top ten trading partners take about 78.58% in China total import from developing
countries and economies in Asia.
2.4 Trade Competitiveness and Complementarity In this section, we are going to further analyze the competitiveness and
complementarity in trade between China and developing countries in Asia. Generally
speaking, regarding economic development level and resource endowment, developing
countries in Asia show similar characteristics in trade with China that cause competition
on the one hand, but there are also apparent differences that determines their on the other
hand.
Continued

China Development Report on South-South Cooperation 2017
28
Complementarity refers to the trade structure compatibility between two countries. If
a country’s imports happen to be exports from another country, the two countries are said
to be fully complementary in trade. Obviously, the degree of complementarity depends
on the resource endowment and technical differences between the two countries, that is,
the comparative advantage of the two. In general, the greater the resource endowment
and technological differences between countries, the stronger the complementarity
of trade, and vice versa. The Trade Complementarity Index is the most used index to
measure complementarity, and the Trade Integration index can also intuitively reflect
the closeness of trade links between the two countries and economies. Revealed
Comparative Advantage and the Intra-industry Trade Index can also clearly reflect the
degree and source of complementarity. Therefore, we use these four indices to analyze
the complementarity and source of trade between China and Asian developing countries
and regions. Regarding to the fact that the trade between China and Asian developing
countries is not only complementary but also competitive, we are going to use the
Trade Competitiveness Index to measure the level of competition between China and
developing countries and regions in Asia.
2.4.1 Revealed Comparative AdvantageRevealed Comparative Advantage (RCA), also known as the Export Performance
Index, is a measure of whether a product in a country or region has a comparative
advantage. The indicator can be calculated as the ratio of the proportion of a country’s
exports to its total exports and the proportion of such goods in the world to the world’s
total exports. If a country’s RCA on a product is greater than 1, it indicates that the
country has a revealed comparative advantage on such goods; if the RCA is less than
1, it indicates that the country does not have a revealed comparative advantage on the
commodity. The formula for calculating the RCA is as follows:
(2.1)
In the formula, Xi indicates the export value of a commodity in China, Xt indicates
the China’s total export value of the commodity, Wi indicates the value of a commodity
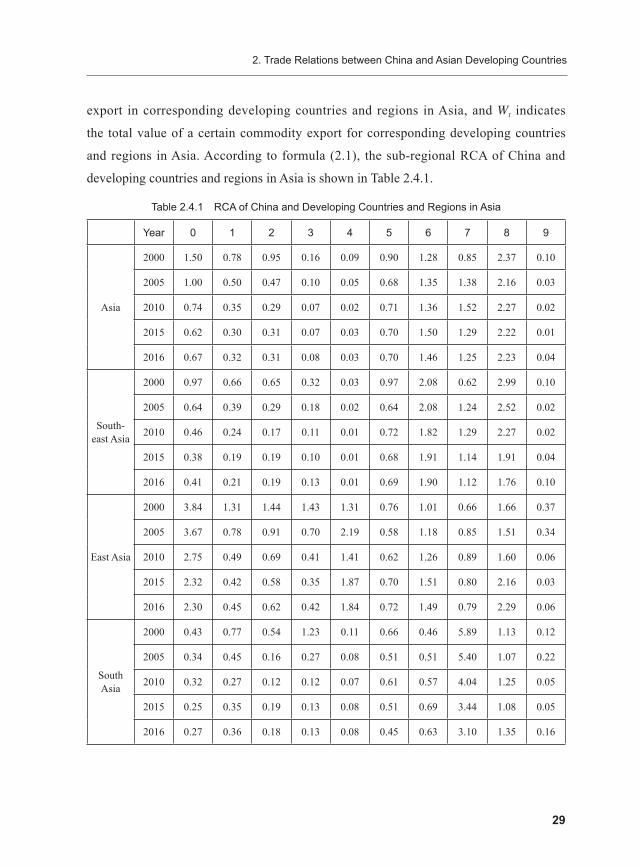
2. Trade Relations between China and Asian Developing Countries
29
export in corresponding developing countries and regions in Asia, and Wt indicates
the total value of a certain commodity export for corresponding developing countries
and regions in Asia. According to formula (2.1), the sub-regional RCA of China and
developing countries and regions in Asia is shown in Table 2.4.1.
Table 2.4.1 RCA of China and Developing Countries and Regions in Asia
Year 0 1 2 3 4 5 6 7 8 9
Asia
2000 1.50 0.78 0.95 0.16 0.09 0.90 1.28 0.85 2.37 0.10
2005 1.00 0.50 0.47 0.10 0.05 0.68 1.35 1.38 2.16 0.03
2010 0.74 0.35 0.29 0.07 0.02 0.71 1.36 1.52 2.27 0.02
2015 0.62 0.30 0.31 0.07 0.03 0.70 1.50 1.29 2.22 0.01
2016 0.67 0.32 0.31 0.08 0.03 0.70 1.46 1.25 2.23 0.04
South-east Asia
2000 0.97 0.66 0.65 0.32 0.03 0.97 2.08 0.62 2.99 0.10
2005 0.64 0.39 0.29 0.18 0.02 0.64 2.08 1.24 2.52 0.02
2010 0.46 0.24 0.17 0.11 0.01 0.72 1.82 1.29 2.27 0.02
2015 0.38 0.19 0.19 0.10 0.01 0.68 1.91 1.14 1.91 0.04
2016 0.41 0.21 0.19 0.13 0.01 0.69 1.90 1.12 1.76 0.10
East Asia
2000 3.84 1.31 1.44 1.43 1.31 0.76 1.01 0.66 1.66 0.37
2005 3.67 0.78 0.91 0.70 2.19 0.58 1.18 0.85 1.51 0.34
2010 2.75 0.49 0.69 0.41 1.41 0.62 1.26 0.89 1.60 0.06
2015 2.32 0.42 0.58 0.35 1.87 0.70 1.51 0.80 2.16 0.03
2016 2.30 0.45 0.62 0.42 1.84 0.72 1.49 0.79 2.29 0.06
South Asia
2000 0.43 0.77 0.54 1.23 0.11 0.66 0.46 5.89 1.13 0.12
2005 0.34 0.45 0.16 0.27 0.08 0.51 0.51 5.40 1.07 0.22
2010 0.32 0.27 0.12 0.12 0.07 0.61 0.57 4.04 1.25 0.05
2015 0.25 0.35 0.19 0.13 0.08 0.51 0.69 3.44 1.08 0.05
2016 0.27 0.36 0.18 0.13 0.08 0.45 0.63 3.10 1.35 0.16

China Development Report on South-South Cooperation 2017
30
Year 0 1 2 3 4 5 6 7 8 9
West Asia
2000 1.85 0.53 1.40 0.05 0.37 1.20 1.80 5.20 7.09 0.06
2005 1.14 0.43 1.11 0.04 0.20 1.00 1.70 5.73 5.54 0.02
2010 0.88 0.45 0.63 0.03 0.20 0.86 1.72 6.40 6.28 0.01
2015 0.85 0.38 0.53 0.03 0.17 0.82 1.76 4.66 4.65 0.00
2016 0.94 0.38 0.52 0.03 0.15 0.84 1.67 4.57 4.12 0.01
Central Asia
2000 4.68 0.92 0.32 0.06 2.00 15.01 4.03 34.74 65.50 0.01
2005 1.26 0.70 0.14 0.03 1.18 2.49 1.02 34.09 67.37 0.13
2010 0.74 0.76 0.14 0.02 0.36 1.30 1.24 67.68 71.49 0.03
2015 0.60 0.38 0.12 0.02 0.31 0.91 1.24 28.10 37.10 0.05
2016 0.53 0.38 0.09 0.02 0.22 0.97 0.96 21.87 16.29 0.12
Source: Calculated according to the UN COMTRAD database.
Note: 0 to 9 in the first row refers to SITC-0 to SITC-9 respectively.
According to the calculation results of the reveled comparative advantage, we can
find the following characteristics:
Firstly, China’s comparative advantage is mainly reflected in SITC-6, -7 and -8. The
comparative advantages of SITC-6 and SITC-8 products illustrate China’s advantages in
labor-intensive products. The RCA of SITC-7 products increased from 0.85 in 2000 to 1.25
in 2016, which shows that China has gradually demonstrated comparative advantages
in capital and technology-intensive products, which is consistent with China’s industrial
transformation and development.
Secondly, in terms of regions, China’s labor-intensive products, capital and
technology-intensive products have shown comparative advantages in trade with South
Asia, Southeast Asia, West Asia and Central Asia. Southeast Asia, West Asia and Central
Asia are mainly represented by comparative advantages in primary products and resource
products showing a relatively high complementarity.
Thirdly, in the trade with East Asia, China’s comparative advantages are mainly on
the products of food and live animals, animal and vegetable oils, manufactured goods
and miscellaneous products. However, there is no comparative advantage in the capital
Continued
2. Trade Relations between China and Asian Developing Countries
31
and technology-intensive products. This shows that the trade complementarity between
China and East Asia mainly comes from the mutual trade of labor-intensive products and
technology-intensive products.
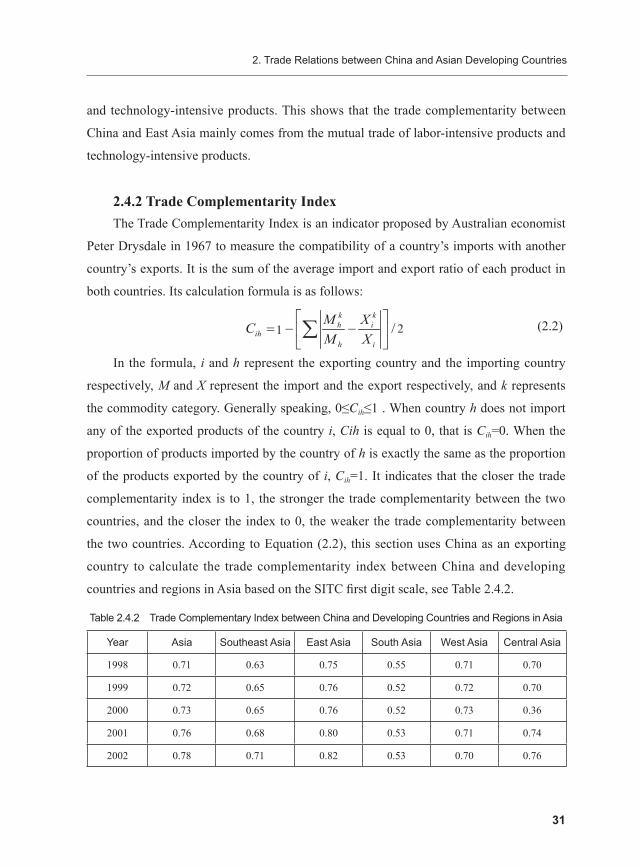
2.4.2 Trade Complementarity IndexThe Trade Complementarity Index is an indicator proposed by Australian economist
Peter Drysdale in 1967 to measure the compatibility of a country’s imports with another
country’s exports. It is the sum of the average import and export ratio of each product in
both countries. Its calculation formula is as follows:
(2.2)
In the formula, i and h represent the exporting country and the importing country
respectively, M and X represent the import and the export respectively, and k represents
the commodity category. Generally speaking, 0≤Cih≤1 . When country h does not import
any of the exported products of the country i, Cih is equal to 0, that is Cih=0. When the
proportion of products imported by the country of h is exactly the same as the proportion
of the products exported by the country of i, Cih=1. It indicates that the closer the trade
complementarity index is to 1, the stronger the trade complementarity between the two
countries, and the closer the index to 0, the weaker the trade complementarity between
the two countries. According to Equation (2.2), this section uses China as an exporting
country to calculate the trade complementarity index between China and developing
countries and regions in Asia based on the SITC first digit scale, see Table 2.4.2.
Table 2.4.2 Trade Complementary Index between China and Developing Countries and Regions in Asia
Year Asia Southeast Asia East Asia South Asia West Asia Central Asia
1998 0.71 0.63 0.75 0.55 0.71 0.70
1999 0.72 0.65 0.76 0.52 0.72 0.70
2000 0.73 0.65 0.76 0.52 0.73 0.36
2001 0.76 0.68 0.80 0.53 0.71 0.74
2002 0.78 0.71 0.82 0.53 0.70 0.76

China Development Report on South-South Cooperation 2017
32
Year Asia Southeast Asia East Asia South Asia West Asia Central Asia
2003 0.77 0.75 0.84 0.53 0.67 0.74
2004 0.77 0.75 0.83 0.54 0.67 0.73
2005 0.72 0.68 0.81 0.54 0.69 0.75
2006 0.69 0.65 0.78 0.51 0.66 0.76
2007 0.72 0.74 0.77 0.50 0.69 0.77
2008 0.68 0.69 0.73 0.48 0.69 0.69
2009 0.69 0.72 0.76 0.51 0.65 0.65
2010 0.69 0.71 0.76 0.49 0.64 0.68
2011 0.66 0.67 0.72 0.48 0.64 0.68
2012 0.65 0.68 0.70 0.43 0.67 0.68
2013 0.65 0.67 0.69 0.44 0.67 0.66
2014 0.67 0.68 0.72 0.44 0.70 0.71
2015 0.70 0.73 0.78 0.52 0.65 0.67
2016 0.73 0.76 0.80 0.55 0.67 0.66
Source: Calculated according to UN COMTRAD database on SITC first digit basis, with China as exporting
country.
Generally speaking, China’s trade complementarity with developing countries
and regions in Asia is relatively high. From 1998 to 2016, the trade complementarity
index remained steadily at around 0.7. In terms of regions, South Asia has the smallest
complementarity index, but its index remains at around 0.5. East Asia has the largest
complementarity index around 0.7 to 0.8. In addition, China’s trade complementarity
index with Southeast Asia, West Asia and Central Asia have remained at a relatively high
level and fluctuated within a small range, but there is no significant difference between
regions. This is mainly because the different in development. All developing countries
and regions in Asia can be divided into group with higher levels of development and
lower levels of development. Compared with countries with higher levels of development,
China has comparative advantages in labor-intensive products, while countries with high
levels of development have comparative advantages in capital and technology-intensive
Continued
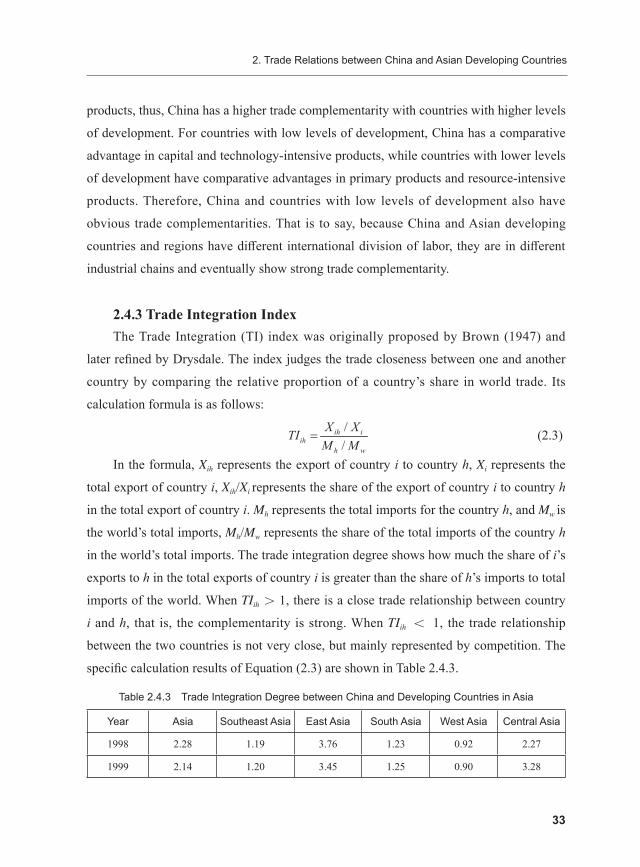
2. Trade Relations between China and Asian Developing Countries
33
products, thus, China has a higher trade complementarity with countries with higher levels
of development. For countries with low levels of development, China has a comparative
advantage in capital and technology-intensive products, while countries with lower levels
of development have comparative advantages in primary products and resource-intensive
products. Therefore, China and countries with low levels of development also have
obvious trade complementarities. That is to say, because China and Asian developing
countries and regions have different international division of labor, they are in different
industrial chains and eventually show strong trade complementarity.
2.4.3 Trade Integration IndexThe Trade Integration (TI) index was originally proposed by Brown (1947) and
later refined by Drysdale. The index judges the trade closeness between one and another
country by comparing the relative proportion of a country’s share in world trade. Its
calculation formula is as follows:
(2.3)
In the formula, Xih represents the export of country i to country h, Xi represents the
total export of country i, Xih/Xi represents the share of the export of country i to country h
in the total export of country i. Mh represents the total imports for the country h, and Mw is
the world’s total imports, Mh/Mw represents the share of the total imports of the country h
in the world’s total imports. The trade integration degree shows how much the share of i’s
exports to h in the total exports of country i is greater than the share of h’s imports to total
imports of the world. When TIih> 1, there is a close trade relationship between country
i and h, that is, the complementarity is strong. When TIih < 1, the trade relationship
between the two countries is not very close, but mainly represented by competition. The
specific calculation results of Equation (2.3) are shown in Table 2.4.3.
Table 2.4.3 Trade Integration Degree between China and Developing Countries in Asia
Year Asia Southeast Asia East Asia South Asia West Asia Central Asia
1998 2.28 1.19 3.76 1.23 0.92 2.27
1999 2.14 1.20 3.45 1.25 0.90 3.28

China Development Report on South-South Cooperation 2017
34
Year Asia Southeast Asia East Asia South Asia West Asia Central Asia
2000 1.97 1.22 3.10 1.22 0.84 2.55
2001 2.05 1.27 3.38 1.32 0.81 1.76
2002 2.08 1.30 3.46 1.29 0.86 2.70
2003 2.33 2.02 3.43 1.19 0.92 3.98
2004 2.04 1.34 3.38 1.30 0.81 3.51
2005 1.99 1.31 3.29 1.16 0.89 3.94
2006 2.00 1.34 3.29 1.24 0.93 3.87
2007 2.04 1.43 3.22 1.42 1.08 4.18
2008 1.93 1.38 3.10 1.25 1.08 5.70
2009 1.94 1.51 2.96 1.28 1.14 5.01
2010 1.78 1.40 2.76 1.26 0.98 4.95
2011 1.80 1.41 2.83 1.17 1.07 3.68
2012 1.85 1.49 2.99 1.04 1.05 3.43
2013 1.93 1.65 3.12 1.10 1.00 3.12
2014 1.93 1.74 2.89 1.26 1.08 3.94
2015 1.90 1.81 2.79 1.31 1.05 3.01
2016 1.91 1.77 2.67 1.68 1.02 3.86
Source: Calculated according to the UN COMTRAD database.
The trade integration degree between China and Asian developing countries is far
greater than 1, indicating a close trade relationship between tow parties. In terms of sub-
regions, except for West Asia, China’s trade integration degree with Southeast Asia, East
Asia, South Asia and Central Asia is all greater than 1. Among them, the highest is with
East Asia and Central Asia, and the closest relationship exists. This is mainly due to the
high degree of trade links between China and East Asia and Central Asia. In particular,
Central Asia has comparative advantages in primary products and resource products,
while China has shown relative comparative advantages in labor-intensive products,
capital and technology-intensive products, and the two countries have formed close trade
Continued

2. Trade Relations between China and Asian Developing Countries
35
relations. In the trade between China and West Asia, the trade integration degree was
less than 1 before 2007, showing a relatively loose trade relationship between the two
countries. However, after 2007, the trade integration degree rose to around 1, and the
trade relationship between the two countries was strengthened. It can be seen that both
developing countries in Asia as a whole and sub-region have shown relatively close trade
relations with China.
2.4.4 Intra-industry Trade IndexIntra-industry trade corresponds to inter-industry trade and describes trade between
similar or identical products within the same industry. The greater the difference in
technology or resource endowments between countries, the more likely it is inter-
industry trade, otherwise is intra-industry trade. The similarities in technology, resource
endowments and mutual needs, as well as differences in economies of scale between two
countries would lead to intra-industry trade between them. Intra-industry trade is a trade
complementarity relationship on varieties based on economies of scale and imperfect
competition.
The most widely used indicator for measuring the level of intra-industry trade is the
Intro-industry Trade Index proposed by Lolyd Crubel (1975). This indicator measures the
extent to which the absolute value of a product’s exports is offset by imports of similar
products. It is the proportion of the import and export trade of each product in the same
industry to the total import and export trade of the product. Its calculation formula is as
follows:
(2.4)
In the formula, i represent the product category at the first digit level. The value of
the intra-industry trade index is between 0 and 100. The greater the index, the higher
the degree of intra-industry trade. According to Equation (2.4), the intra-industry trade
indices of developing countries and sub-regions in Asia with China are shown in Table
2.4.4.

China Development Report on South-South Cooperation 2017
36
Table 2.4.4 Intra-industry Trade Index between China and Developing Countries and sub-Regions in Asia
Region Year 0 1 2 3 4 5 6 7 8 9
Asia
2000 37.10 6.05 45.89 45.40 23.16 50.88 96.88 98.13 32.33 50.60
2005 40.58 5.81 25.16 43.60 13.18 56.33 74.51 94.57 75.51 76.34
2010 51.71 21.73 19.43 29.50 6.69 69.39 57.14 79.55 69.98 18.76
2015 60.22 35.19 33.60 28.72 9.32 85.25 41.42 73.96 45.83 27.78
2016 55.70 33.55 32.92 32.45 10.54 85.84 40.51 77.46 48.08 24.11
Southeast Asia
2000 73.51 14.81 25.50 55.82 2.44 65.88 90.19 93.24 38.87 22.10
2005 83.44 2.83 15.34 73.97 3.86 65.60 51.47 74.67 59.23 93.88
2010 80.64 29.33 13.89 56.56 1.97 83.29 46.79 88.83 41.94 63.85
2015 86.67 40.83 21.02 56.93 2.72 95.03 29.56 90.50 38.54 10.08
2016 80.48 43.81 21.08 63.38 3.32 90.30 28.23 96.09 50.01 22.47
East Asia
2000 12.47 2.49 68.85 94.85 24.93 38.40 88.04 98.61 35.31 75.40
2005 15.03 6.79 61.79 94.39 33.71 43.88 89.46 90.26 89.38 78.08
2010 16.24 19.49 61.12 91.37 28.80 48.81 80.88 79.64 96.73 13.60
2015 23.27 34.01 54.31 99.92 13.62 58.34 67.75 79.65 66.49 49.78
2016 23.97 31.05 56.97 92.63 14.67 57.63 67.15 83.93 65.99 25.33
South Asia
2000 96.50 16.90 62.55 18.04 5.87 56.63 81.57 11.70 25.59 —
2005 75.91 39.35 9.23 17.85 7.82 61.16 63.55 12.55 15.29 15.91
2010 78.96 21.25 9.97 73.62 3.61 25.72 45.13 6.71 14.54 35.87
2015 76.80 80.66 45.92 44.54 4.35 22.46 48.31 6.13 16.73 53.35
2016 69.23 13.79 45.02 21.62 5.05 21.80 42.57 5.58 19.17 80.91
West Asia
2000 18.30 83.38 51.78 2.30 0.01 66.16 17.59 17.37 4.16 0.03
2005 14.02 1.78 31.43 3.30 3.83 55.46 15.52 8.39 6.22 26.37
2010 26.14 3.86 17.94 2.30 32.03 52.04 10.92 7.68 4.58 12.97
2015 22.94 18.61 38.51 2.68 28.22 56.44 7.38 5.98 4.62 4.02
2016 18.91 25.29 35.42 2.67 64.43 59.00 8.84 7.91 6.53 39.45

2. Trade Relations between China and Asian Developing Countries
37
Region Year 0 1 2 3 4 5 6 7 8 9
Central Asia
2000 4.99 0.01 1.35 25.36 — 45.57 47.41 0.98 0.05 —
2005 2.13 0.10 2.55 21.25 — 80.55 88.13 0.41 0.07 —
2010 8.01 24.15 1.54 2.07 — 55.61 74.65 0.05 0.06 —
2015 27.86 94.67 6.26 2.19 24.84 61.94 62.16 0.20 0.04 65.03
2016 37.79 23.08 5.17 0.44 12.19 64.75 68.90 0.51 0.02 87.81
Source: Calculated according to the UN COMTRAD database. “—” in the table indicates the absence of export
or import data for a certain category of products.
Note: 0 to 9 in the first row refers to SITC-0 to SITC-9 respectively.
In general, China and Asian developing countries show high intra-industry trade
indices in chemicals (SITC5), manufactured goods (SITC6), machinery and transportation
(SITC7) and miscellaneous products (SITC8). This means that the trade on these products
highly depends on the international labor division within the industry. In terms of change,
the index on non-edible raw materials (SITC2), fossil fuels (SITC3) and manufactured
goods (SITC6) showed a downward trend, indicating that importance of intra-industry
trade in primary products, mineral products and finished products tends to decline, and the
complementarity of trade is increasingly dependent on inter-industry trade depending on
comparative advantage. However, the index on food and live animals (SITC0), beverages
and tobacco (SITC1) and chemicals (SITC5) is increasingly rising implying that the trade
complementarity is increasingly dependent on the international labor division within the
industry.
For sub-regions, China and South Asia, West Asia and Central Asia have high indices
in the primary products and manufactured goods, while lower indices appear in the
machinery and transportation and miscellaneous products industries. This shows the fact
that capital-intensive products trade are mainly inter-industry trade based on comparative
advantage, while trade in resource-intensive products is mainly intra-industry trade based
on economies of scale between China and these sub-regions. Comparatively, China has
a high intra-industry trade index of 0.9 with Southeast Asia in the food and live animals,
chemicals and machinery and transportation industries. In addition, it also shows high
Continued

China Development Report on South-South Cooperation 2017
38
levels of intra-industry trade in fossil fuels, manufactured goods and technology-intensive
industries between China and East Asia.
2.5 SummaryAccording to above analysis, China has maintained close trade relations with
developing countries and sub-regions in Asia. About 40% of China’s imports come from
developing countries and regions in Asia, and a higher proportion of exports are targeted
at Asia as well. From 1998 to 2016, China’s import and export with developing countries
and regions in Asia stay stable around 40%. It shows that due to geopolitical and cultural
factors, China has maintained trade dependence on developing countries and regions in
Asia for a long time. However, in terms of growth rate, the import and export in 2016
were more than ten times that of 1998, showing a fast growth.
There are two features in bilateral trade between China and developing countries
and sub-regions in Asia. First is the high concentration on import and export products.
Export is mainly concentrated on three types of products: finished goods classified by raw
materials, machinery and transportation equipment and miscellaneous products. These
three categories account for more than 80% of total export. While for import trade, the
machinery and transportation equipment products account for the largest proportion, and
increased from 31.42% in 2000 to 45.6% in 2016. It shows a clear vertical specialization
for China by importing parts and then exporting the final product after assembly. Second
is the high trade concentration on countries in East Asia and Southeast Asia. This, on the
one hand, is due to the similar geographical location, cultural homology and similar level
of economic development between East Asia, Southeast Asia and China. On the other
hand, East Asia and Southeast Asia have a lot of entrepot trades with Hong Kong (China),
Macao (China) and Taiwan (China). The average annual export and import between
Mainland China and three independent tariff entities from 1998 to 2016 are $203.44
billion and $93.346 billion respectively showing a huge trade surplus.
China and Asian developing countries and regions have high trade complementarities.
In trade with South Asia, Southeast Asia, West Asia and Central Asia, China has shown
2. Trade Relations between China and Asian Developing Countries
39
comparative advantages in labor-intensive products, capital and technology-intensive
products and comparative disadvantages in primary products and resources products.
In the trade with East Asia, China’s comparative advantages are mainly food and live
animals, animal and vegetable oils, manufactured goods and miscellaneous products. At
the same time, China and Asian developing countries and regions also have a high level
of intra-industry trade. And China’s intra-industry trade with South Asia, West Asia and
Central Asia mainly exists in the primary products and finished goods industries. Intra-
industry trade with Southeast Asia is concentrated in the food and live animals, chemicals,
and machinery and transportation industries while with East Asia is mainly concentrated
in fossil fuels, manufactured goods and technology-intensive industries.

40
3. Investment Relations Between China and Asian Developing Countries
Since the implementation of the “going out” strategy, China’s foreign direct
investment has maintained a rapid growth momentum. As a major destination for China’s
Outward Foreign Direct Investment (OFDI), China’s investment in Asia is not only
significant, but also growing rapidly. And developing countries and regions in Asia are
the main destinations of China’s OFDI. As of the end of 2016, China’s investment in
Asian developing countries and regions accounted for more than 99%A of China’s total
investment stock in Asia. This chapter will detail China’s investment characteristics in
developing countries and regions in Asia, and further analyze the two-way investment
relationship between the two.
3.1 General Features of China’s OFDI in Asian Countries
3.1.1 The Overall Situation of China’s OFDI in Asian Countries
1. General OverviewAsia is the main destination for China’s foreign direct investment. As of the end
of 2016, China’s investment in Asian developing countries and regions accounted for
66.74% of China’s total investment, mainly in Hong Kong (China), Singapore, Indonesia,
Macau (China), Kazakhstan, Laos, United Arab Emirates, Myanmar, Pakistan, India,
Mongolia, South Korea, Cambodia, Thailand, Iran, etc. Among them, Hong Kong (China)
is a major investment destination. At the end of 2016, China’s investment in Hong Kong
(China) accounted for 86.15% of Asia’s total stock of investment. As can be seen from
A This chapter is aimed at developing countries and regions in Asia in a broad sense, including both developing countries and regions in the traditional sense, as well as the Asian Tigers. In addition, the Asian countries mentioned below refer to developing countries and regions in Asia in a broad sense if not specified.

3. Investment Relations Between China and Asian Developing Countries
41
Figure 3.1.1-1, China’s investment stocks in Asian countries accounted for more than
60% of China’s total foreign direct investment all the time. Affected by the 2008 financial
crisis, China shifted some of its overseas investment to neighboring Asian countries,
so that the investment stock in 2009 accounted for more than 75%, reaching its highest
value. From the perspective of investment flows, proportion of China’s direct investment
flows to Asian countries had a large fluctuation. In 2006, the proportion of flows was
43.31%, and reached 74.26% in 2015 with a fall to 66.44% in 2016.
20
30
40
50
60
70
80
90
2006 2007 2008 2009 2010 2011 2012 2013 2014 2015 2016 year
Share in Flow Share in Stock
wei
gnt(
%)
Figure 3.1.1-1 China’s Direct Investment to Asia in Share of China’s OFDI
Source: 2006-2016 China Statistical Foreign Direct Investment Bulletin.
2. China’s OFDI Flow to AsiaIn 2016, China’s direct investment flows to Asian countries were $130.252 billion,
a year-on-year increase of 20.41%, accounting for 66.4% of China’s total foreign direct
investment flows. The investment flow to Hong Kong (China) was $114.233 billion,
accounting for 87.7% of the investment flows to Asia. Figure 3.1.1-2 shows the flow
characteristics and growth rate of China’s direct investment in Asian countries. It can
be seen from the figure that China’s direct investment flows to Asian countries show an
overall upward trend, with an increase of nearly 17.05 times in 2016 compared with 2006.
From the perspective of investment growth rate, China’s investment in Asian countries
maintained a relatively high growth rate from 2006 to 2008, and the growth rate in 2008
reached 162.25%. Affected by the financial crisis, the investment growth rate in 2009

China Development Report on South-South Cooperation 2017
42
dropped sharply to -7.28%, and then began to rise steadily.
Figure 3.1.1-2 The Flow and Growth of China’s OFDI in Asia
Source: 2006-2016 China Statistical Foreign Direct Investment Bulletin.
3. China’s OFDI Stock in AsiaFigure 3.1.1-3 reflects China’s stock characteristics of direct investment in Asian
countries and changes in growth rates. In 2006, China’s investment stock in Asian
countries was $47.798 billion. As of the end of 2016, China’s investment stock in Asian
countries reached $906.484 billion, increasing about 18.97 times. Although China’s
investment in Asian countries increased rapidly in 2008, China’s investment flows to Asia
declined in 2009 compared to 2008, thus the stock growth rate declined significantly in
2009, but has stabilized after 2010.
0
15
30
45
60
75
0
2000
4000
6000
8000
10000
2006 2007 2008 2009 2010 2011 2012 2013 2014 2015 2016
grow
th r
ate(
%)
100
mill
ion
USD
year
Stock Growth Rate
Figure 3.1.1-3 The Stock and Growth of China’s OFDI in Asia
Source: 2006-2016 China Statistical Foreign Direct Investment Bulletin.
3. Investment Relations Between China and Asian Developing Countries
43
3.1.2 China’s Direct Investment Approach to Asian CountriesCross-border M&A and green-field investment are two main methods of enterprises’
foreign direct investment. The early investment activities of Chinese enterprises mainly
focused on greenfield investment. However, in recent years, companies have increasingly
favored cross-border M&A when investing abroad. In the foreign direct investment
initiated by Chinese enterprises in 2016, cross-border M&A are more than greenfield
investment from the perspective of the overall scale of investment, and enterprises that
choose to enter the host country by merger and acquisition are mainly state-owned large
enterprises.
1. Cross-Border mergers and acquisitionsCross-border M&A refer to the acquisition of technology, research and development,
marketing networks and brands of acquired companies by acquiring all or part of the
assets and equity of existing foreign companies. Cross-border M&A theory believes that
M&A is the most effective way to obtain resources from host countries. By acquiring
local enterprises, multinational companies can quickly integrate into the host country
market based on their existing production facilities, management teams and marketing
channels accumulated over many years to realize the operation strategic objectives of
multinational companies. Chinese companies mainly carry out the following two ways
when making cross-border M&A investments in Asian countries:
Firstly, Acquire part of the equity of the host country enterprises and realize
cooperative operations. This approach is conducive to Chinese companies to obtain
key knowledge resources of local enterprises, reduce the risks faced by independent
operations, and accelerate the market layout in the host country. By acquiring some of the
shares, Chinese companies have certain control over the host country’s enterprises and
cooperate with them. For example, in 2014, China Mobile International Holdings Co.,
Ltd., a wholly-owned subsidiary of China Mobile Communications Corporation, acquired
an 18% stake in Thai telecom operator True Corp for $880 million and became the
second largest shareholder of True Corp. True Corp is Thailand’s only national integrated
telecommunications operator, and China Mobile will cooperate with it in technology

China Development Report on South-South Cooperation 2017
44
and network construction, procurement sharing, market development and other fields.
In 2016, Shandong Hengyuan Petrochemical Co., Ltd. acquired 51% of the shares of
Shell Malaysian Refining Company for $66.3 million, thus having absolute control over
the company. This is the first overseas merger case completed by Chinese local refining
companies. The successful merger and acquisition of Hengyuan Company has realized
the complementary advantages of both parties: On the one hand, Shandong Hengyuan can
export the domestic excess capacity of refined oil after obtaining the refined oil export
qualification; on the other hand, according to the China-ASEAN Free Trade Agreement,
Shandong Hengyuan can also import low-cost chemical products in Malaysia at low
prices.
Secondly, Acquire the entire equity of the host country enterprise and complete
the merger. Through wholly-owned acquisition of host country enterprises, Chinese
companies can have full control of the company and help to fully implement the parent
company’s development strategy. For example, in 2008, Huaneng Power International
Co., Ltd. acquired 100% equity of Singapore Temasek subsidiary Tuas Power Co.,
Ltd. which is one of the three largest power companies in Singapore for $3.04 billion.
Huaneng then occupies about 25% of the market share of the Singapore power market
after its acquisition. In 2014, Intercontinental Oil and Gas Co., Ltd. completed a share
purchase of Ma Teng Petroleum Co., Ltd. in Kazakhstan, which is the largest investment
by Chinese private enterprises in Kazakhstan’s oil and gas sector. Following this
investment project, Intercontinental Oil and Gas Co., Ltd. purchased 100% of the shares
of Kazakhstan’s Keshan Company in 2015.
2. Greenfield investmentGreenfield investment refers to the establishment of new enterprises in the host
country by means of sole proprietorship or joint venture, and form new production
capacity. Through greenfield investment, original enterprises have high control over the
resources and technical knowledge of newly established companies, but at the same time
they must also afford fixed investment costs. Specifically, Chinese companies mainly
choose joint ventures and sole proprietorships to set up factories in host countries when

3. Investment Relations Between China and Asian Developing Countries
45
they invest in green-field in Asian countries:
Firstly, Establish a joint venture and cooperate in production. Among some projects
with relatively large investment scales, Chinese companies have chosen to jointly
set up factories with local enterprises, and there are relatively few projects with sole
proprietorship. For example, in 2011, China Merchants Group Co., Ltd. and Sri Lanka
Aitken Spence PLC Group Corporation and Sri Lanka Port Authority jointly invested
more than $500 million to build a new container terminal in Colombo Port, which was
put into operation in 2013. The project is the largest overseas investment project of China
Merchants Group Co., Ltd, of which China Merchants Group Co., Ltd. owns 55% and is
mainly responsible for the design, construction and management of the chip.
Secondly, Establish a sole proprietorship enterprise and operate on its own. In 2016,
the project to build an oil refinery in Tuwa (Derin Dayi, Myanmar), led by Guangdong
Zhenyu Energy Co., Ltd., was officially approved by the Myanmar Investment
Committee. Guangdong Zhenyu Energy Co., Ltd. will invest $3 billion to build a refinery
with an annual processing capacity of 5 million tons of crude oil. The commissioning of
the project is expected to change the status quo that Myanmar’s fuel consumption almost
imports entirely.
3.2 China’s OFDI in Asia by Region and Country
3.2.1 China’s OFDI by Region in AsiaThere are obvious differences of China’s investment among different Asian sub-
regions. China’s investment in Asia is mainly concentrated in East Asia, followed by
Southeast Asia, West Asia, South Asia and Central Asia. Table 3.2.1-1 shows the regional
composition of China’s direct investment in Asia in 2016. In terms of investment flows,
in 2016, China’s direct investment in Asia mainly flowed to East Asia and Southeast Asia,
which accounted for as much as 97.47%. From the perspective of investment stocks,
China’s investment in East Asia and Southeast Asia accounted for 95.83% of the total
Asian stocks in 2016. Specifically, China’s investment in East Asia is mainly concentrated
in Hong Kong (China), and investment in Southeast Asia is mainly concentrated in the

China Development Report on South-South Cooperation 2017
46
10 ASEAN countries. Regardless of investment flows or investment stocks, China’s
investment in West Asia, South Asia and Central Asia is relatively small, with investment
flows and stocks of all three regions less than 5%.
Table 3.2.1-1 China’s OFDI in Asia’s Sub-region in 2016
RegionAmount (US$ Billion) Growth rate Share (%)
Flows Stocks Flows Stocks Flows Stocks
East Asia 116.582 797.266 26.06 18.70 89.53 87.92
Southeast Asia 10.334 71.702 -29.40 14.15 7.94 7.91
West Asia 1.819 19.632 -18.43 32.17 1.40 2.16
South Asia 0.742 9.068 -35.70 0.09 0.57 1.00
Central Asia 0.741 9.144 131.87 13.02 0.57 1.01
Source: 2016 China Statistical Foreign Direct Investment Bulletin.
3. China’s OFDI in East Asia East Asia is the region with the most concentrated sub-region of China’s OFDI,
with the highest level of investment in Hong Kong (China). As can be seen from Table
3.2.1-2, China’s investment flows to East Asia account for more than 80% of China’s
total investment flows to Asia, and over 90% in several individual years. In 2007,
China’s direct investment flows to East Asia were $14.051 billion. In 2016, China’s
investment in Central Asia reached $116.582 billion, surpassing $100 billion for the
first time, an increase of 8 times. However, growth rate of China’s investment flows in
East Asia is highly volatile, with even negative growth in 2009 and 2011. Table 3.2.1-3
reflects China’s stock of direct investment in East Asia. Overall, between 2007 and 2016,
China’s investment stock in East Asia accounted for a smaller proportion of China’s
total investment stock in Asian countries, but it remained over 85% at all times. In 2007,
China’s stock of direct investment in East Asia was $71.566 billion. In 2016, the stock of
investment reached $797.26 billion, increasing by 11 times.

3. Investment Relations Between China and Asian Developing Countries
47
Table 3.2.1-2 China’s OFDI Flows in East Asia
(Unit: US$ Billion, %)
Year Amount Growth rate Share Year Amount Growth rate Share
2007 14.051 100.46 84.84 2012 53.324 45.23 82.49
2008 39.660 182.26 91.18 2013 64.139 20.28 85.21
2009 36.604 -7.71 90.76 2014 72.751 13.43 85.76
2010 38.103 4.09 85.45 2015 92.480 27.12 85.49
2011 36.718 -3.64 80.94 2016 116.582 26.06 89.51
Source: 2007-2016 China Statistical Foreign Direct Investment Bulletin.
Table 3.2.1-3 China’s OFDI Stocks in East Asia
(Unit: US$ Billion, %)
Year Amount Growth rate Share Year Amount Growth rate Share
2007 71.566 61.94 90.92 2012 315.895 17.87 87.02
2008 119.271 66.66 91.13 2013 386.754 22.43 86.74
2009 169.057 41.74 91.41 2014 521.595 34.86 87.07
2010 203.616 20.44 89.63 2015 671.647 28.77 87.63
2011 268.006 31.62 88.68 2016 797.266 18.70 87.92
Source: 2007-2016 China Statistical Foreign Direct Investment Bulletin.
4. China’s OFDI in Southeast AsiaSoutheast Asia is China’s second largest destination for outward foreign direct
investment in Asia. China’s investment in the region is mainly concentrated in the 10
ASEAN countries, especially Singapore, Indonesia, Laos and Myanmar. As can be seen
from Table 3.2.1-4, China’s direct investment flows to Southeast Asia showed varying
degrees of growth during 2007 to 2016, with rapid growth in 2007 and 2008, but then
the growth is more volatile. In 2016, China’s investment flows to Southeast Asia reached
$10.334 billion. As can be seen from the investment stock situation in Table 3.2.1-5,
China’s investment in Southeast Asia accounts for an overall upward trend in China’s
total stock of Asia and rose to 7.91% in 2016.
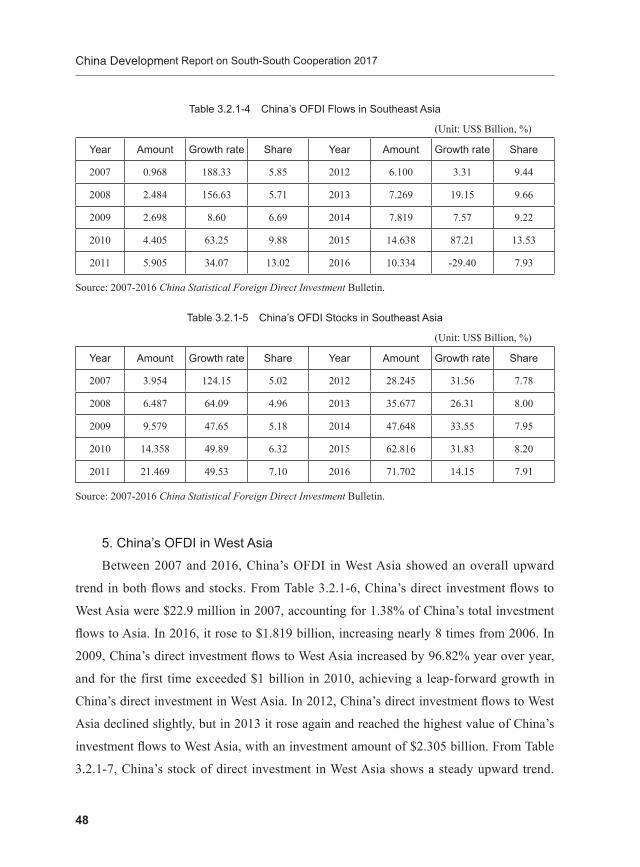
China Development Report on South-South Cooperation 2017
48
Table 3.2.1-4 China’s OFDI Flows in Southeast Asia
(Unit: US$ Billion, %)
Year Amount Growth rate Share Year Amount Growth rate Share
2007 0.968 188.33 5.85 2012 6.100 3.31 9.44
2008 2.484 156.63 5.71 2013 7.269 19.15 9.66
2009 2.698 8.60 6.69 2014 7.819 7.57 9.22
2010 4.405 63.25 9.88 2015 14.638 87.21 13.53
2011 5.905 34.07 13.02 2016 10.334 -29.40 7.93
Source: 2007-2016 China Statistical Foreign Direct Investment Bulletin.
Table 3.2.1-5 China’s OFDI Stocks in Southeast Asia
(Unit: US$ Billion, %)
Year Amount Growth rate Share Year Amount Growth rate Share
2007 3.954 124.15 5.02 2012 28.245 31.56 7.78
2008 6.487 64.09 4.96 2013 35.677 26.31 8.00
2009 9.579 47.65 5.18 2014 47.648 33.55 7.95
2010 14.358 49.89 6.32 2015 62.816 31.83 8.20
2011 21.469 49.53 7.10 2016 71.702 14.15 7.91
Source: 2007-2016 China Statistical Foreign Direct Investment Bulletin.
5. China’s OFDI in West AsiaBetween 2007 and 2016, China’s OFDI in West Asia showed an overall upward
trend in both flows and stocks. From Table 3.2.1-6, China’s direct investment flows to
West Asia were $22.9 million in 2007, accounting for 1.38% of China’s total investment
flows to Asia. In 2016, it rose to $1.819 billion, increasing nearly 8 times from 2006. In
2009, China’s direct investment flows to West Asia increased by 96.82% year over year,
and for the first time exceeded $1 billion in 2010, achieving a leap-forward growth in
China’s direct investment in West Asia. In 2012, China’s direct investment flows to West
Asia declined slightly, but in 2013 it rose again and reached the highest value of China’s
investment flows to West Asia, with an investment amount of $2.305 billion. From Table
3.2.1-7, China’s stock of direct investment in West Asia shows a steady upward trend.

3. Investment Relations Between China and Asian Developing Countries
49
At the end of 2007, China’s stock of direct investment in West Asia was $1.066 billion,
and reached $3.829 billion in 2010, achieving the largest increase of 67.82% year over
year. As of the end of 2016, China’s stock of direct investment in West Asia was $19.632
billion, accounting for 2.16% of China’s total Asian investment stock, increasing more
than 18 times compared with the end of 2007.
Table 3.2.1-6 China’s OFDI Flows in West Asia
(Unit: US$ Billion, %)
Year Amount Growth rate Share Year Amount Growth rate Share
2007 0.229 -12.42 1.38 2012 1.419 -15.20 2.19
2008 0.317 38.15 0.73 2013 2.305 62.44 3.06
2009 0.623 96.82 1.54 2014 2.227 -3.37 2.63
2010 1.091 75.07 2.45 2015 2.230 0.13 2.06
2011 1.673 53.41 3.69 2016 1.819 -18.43 1.40
Source: 2007-2016 China Statistical Foreign Direct Investment Bulletin.
Table 3.2.1-7 China’s OFDI Stocks in West Asia
(Unit: US$ Billion, %)
Year Amount Growth rate Share Year Amount Growth rate Share
2007 1.066 -8.92 1.35 2012 7.302 30.01 2.01
2008 1.560 46.37 1.19 2013 9.244 26.59 2.07
2009 2.281 46.22 1.23 2014 11.881 28.53 1.98
2010 3.829 67.82 1.69 2015 14.853 25.02 1.94
2011 5.617 46.71 1.86 2016 19.632 32.17 2.16
Source: 2007-2016 China Statistical Foreign Direct Investment Bulletin.
6. China’s OFDI in South AsiaTable 3.2.1-8 reflects China’s OFDI flows to South Asia. China’s direct investment
flows to South Asia were highly volatile from 2007 to 2016. In 2007, China’s direct
investment flows to South Asia amounted to $936 million, accounting for 5.65% of
China’s total investment flows to Asia, which accounted for the highest proportion, but

China Development Report on South-South Cooperation 2017
50
then fell sharply in 2008 and 2009, with investment flows of $381 million and $62 million
respectively, and started to rise after 2010. China’s direct investment flows to South Asia
reached $1.487 billion in 2014, but then declined gradually. China’s investment flows to
South Asia for 2015 and 2016 were $1.154 billion and $742 million respectively. From
Table 3.2.1-9, China’s stock of direct investment in South Asia shows a steady upward
trend. At the end of 2007, China’s stock of direct investment in South Asia was $1.248
billion, exceeding $1 billion for the first time. As of the end of 2016, China’s stock of
direct investment in South Asia was $9.068 billion, accounting for 1% of China’s total
investment in Asia, increasing by 7 times from the end of 2006.
Table 3.2.1-8 China’s OFDI Flows to South Asia
(Unit: US$ Billion, %)
Year Amount Growth rate Share Year Amount Growth rate Share
2007 0.936 1950.06 5.65 2012 0.0423 -31.02 0.65
2008 0.381 -59.31 0.88 2013 0.462 9.24 0.61
2009 0.062 -83.61 0.15 2014 1.487 221.60 1.75
2010 0.415 565.50 0.93 2015 1.154 -22.41 1.07
2011 0.613 47.73 1.35 2016 0.742 -35.70 0.57
Source: 2007-2016 China Statistical Foreign Direct Investment Bulletin.
Table 3.2.1-9 China’s OFDI Stocks to South Asia
(Unit: US$ Billion, %)
Year Amount Growth rate Share Year Amount Growth rate Share
2007 1.248 452.76 1.59 2012 3.732 21.00 1.03
2008 1.624 30.09 1.24 2013 5.317 42.46 1.19
2009 1.770 8.99 0.96 2014 7.807 46.83 1.30
2010 2.464 39.24 1.08 2015 9.059 16.05 1.18
2011 3.084 25.18 1.02 2016 9.068 0.09 1.00
Source: 2007-2016 China Statistical Foreign Direct Investment Bulletin.

3. Investment Relations Between China and Asian Developing Countries
51
7. China’s OFDI in Central AsiaSince 2007, China’s OFDI in Central Asia has been highly volatile with frequent
increases and declines. From the investment flow of Table 3.2.1-10, China’s direct
investment flow to Central Asia was $37.7 million dollars in 2007, and exceeded $3
billion dollars in 2012. The sharp jump-up trend is very obvious, but then shrinks. In
2015, China’s investment flows to Central Asian countries showed negative values, which
was mainly due to lower investment in Kazakhstan. Kazakhstan is the one that accepts the
most direct investment from China, followed by Kyrgyzstan and Tajikistan. Therefore, the
volatility of China’s investment in Central Asia is mainly affected by China’s investment
in Kazakhstan. From the investment stock of 3.2.1-11, China’s investment stock in
Central Asia has maintained rapid growth between 2007 and 2014, but it declined in
2015. In 2007, China’s stock of direct investment in Central Asia was only $88.1 million
dollars, accounting for 1.12% of China’s total investment in Asia in that year, and reached
$7.824 billion dollars in 2012, which is the largest share of China’s investment stock in
Asia for Central Asia for 2.16%. In 2014, China’s stock of direct investment in Central
Asia exceeded $10 billion for the first time, but declined in 2015.
Table 3.2.1-10 China’s OFDI Flows in Central Asia
(Unit: US$ Billion, %)
Year Amount Growth rate Share Year Amount Growth rate Share
2007 0.377 362.03 2.28 2012 3.377 643.88 5.22
2008 0.656 73.93 1.51 2013 1.099 -67.46 1.46
2009 0.345 -47.42 0.86 2014 0.551 -49.89 0.65
2010 0.580 68.07 1.30 2015 -2.326 -522.39 -2.15
2011 0.454 -21.70 1.00 2016 0.741 131.87 0.57
Source: 2007-2016 China Statistical Foreign Direct Investment Bulletin.
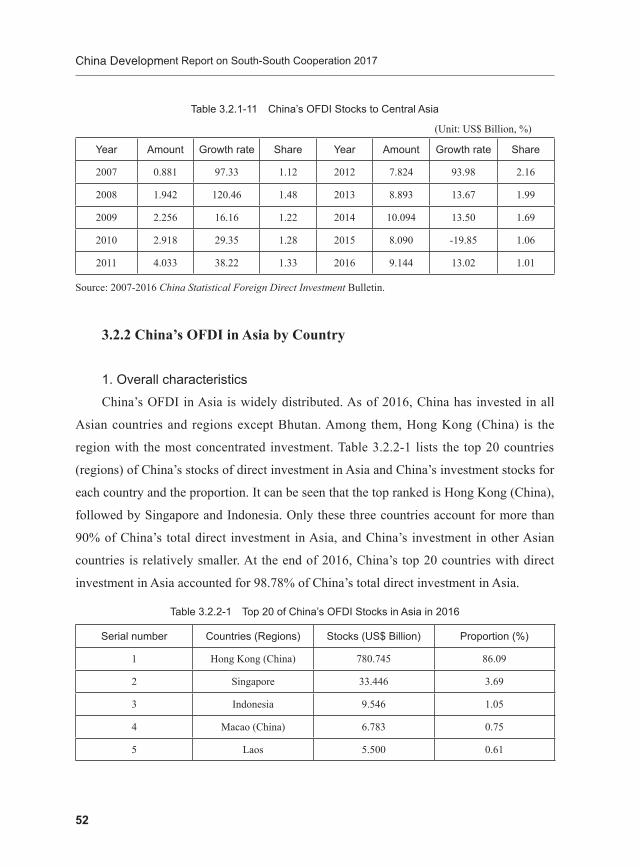
China Development Report on South-South Cooperation 2017
52
Table 3.2.1-11 China’s OFDI Stocks to Central Asia
(Unit: US$ Billion, %)
Year Amount Growth rate Share Year Amount Growth rate Share
2007 0.881 97.33 1.12 2012 7.824 93.98 2.16
2008 1.942 120.46 1.48 2013 8.893 13.67 1.99
2009 2.256 16.16 1.22 2014 10.094 13.50 1.69
2010 2.918 29.35 1.28 2015 8.090 -19.85 1.06
2011 4.033 38.22 1.33 2016 9.144 13.02 1.01
Source: 2007-2016 China Statistical Foreign Direct Investment Bulletin.
3.2.2 China’s OFDI in Asia by Country
1. Overall characteristics China’s OFDI in Asia is widely distributed. As of 2016, China has invested in all
Asian countries and regions except Bhutan. Among them, Hong Kong (China) is the
region with the most concentrated investment. Table 3.2.2-1 lists the top 20 countries
(regions) of China’s stocks of direct investment in Asia and China’s investment stocks for
each country and the proportion. It can be seen that the top ranked is Hong Kong (China),
followed by Singapore and Indonesia. Only these three countries account for more than
90% of China’s total direct investment in Asia, and China’s investment in other Asian
countries is relatively smaller. At the end of 2016, China’s top 20 countries with direct
investment in Asia accounted for 98.78% of China’s total direct investment in Asia.
Table 3.2.2-1 Top 20 of China’s OFDI Stocks in Asia in 2016
Serial number Countries (Regions) Stocks (US$ Billion) Proportion (%)
1 Hong Kong (China) 780.745 86.09
2 Singapore 33.446 3.69
3 Indonesia 9.546 1.05
4 Macao (China) 6.783 0.75
5 Laos 5.500 0.61

3. Investment Relations Between China and Asian Developing Countries
53
Serial number Countries (Regions) Stocks (US$ Billion) Proportion (%)
6 Kazakhstan 5.432 0.60
7 Vietnam 4.984 0.55
8 United Arab Emirates 4.888 0.54
9 Pakistan 4.759 0.52
10 Myanmar 4.620 0.51
11 Thailand 4.533 0.50
12 Cambodia 4.369 0.48
13 Korea 4.237 0.47
14 Israel 4.230 0.47
15 Mongolia 3.839 0.42
16 Malaysia 3.634 0.40
17 Iran 3.331 0.37
18 India 3.108 0.34
19 Saudi Arabia 2.607 0.29
20 Kyrgyzstan 1.238 0.14
Sum 895.828 98.78
Source: 2016 China Statistical Foreign Direct Investment Bulletin.
2. China’s OFDI in major Asian economies(1) Hong Kong (China)
In 2016, China’s OFDI flows to Asian countries were $130.252 billion, of which
investment in Hong Kong (China) accounted for 87.7% of total investment in Asian
countries, and Hong Kong (China) became the economy with the largest destination of
Mainland China’s OFDI. In 2016, Mainland China’s investment flows to Hong Kong
(China) exceeded $100 billion for the first time, reaching $114.23 billion with year over
year increased by 27.2%. By the end of 2016, Mainland China had established nearly
12,000 companies in Hong Kong (China), with a stock of $780.745 billion dollars at the
end of the year, accounting for 86.1% of China’s total investment in Asia.
Continued
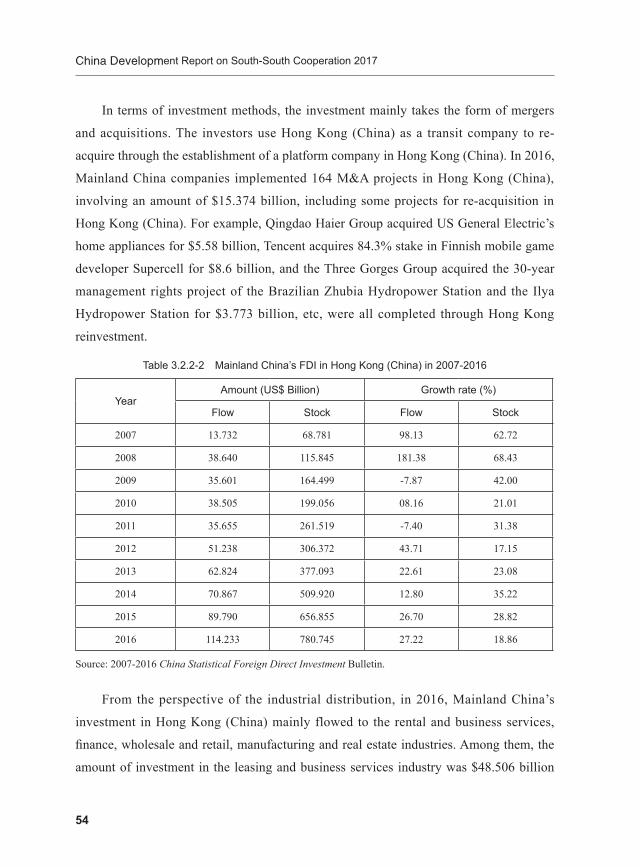
China Development Report on South-South Cooperation 2017
54
In terms of investment methods, the investment mainly takes the form of mergers
and acquisitions. The investors use Hong Kong (China) as a transit company to re-
acquire through the establishment of a platform company in Hong Kong (China). In 2016,
Mainland China companies implemented 164 M&A projects in Hong Kong (China),
involving an amount of $15.374 billion, including some projects for re-acquisition in
Hong Kong (China). For example, Qingdao Haier Group acquired US General Electric’s
home appliances for $5.58 billion, Tencent acquires 84.3% stake in Finnish mobile game
developer Supercell for $8.6 billion, and the Three Gorges Group acquired the 30-year
management rights project of the Brazilian Zhubia Hydropower Station and the Ilya
Hydropower Station for $3.773 billion, etc, were all completed through Hong Kong
reinvestment.
Table 3.2.2-2 Mainland China’s FDI in Hong Kong (China) in 2007-2016
YearAmount (US$ Billion) Growth rate (%)
Flow Stock Flow Stock
2007 13.732 68.781 98.13 62.72
2008 38.640 115.845 181.38 68.43
2009 35.601 164.499 -7.87 42.00
2010 38.505 199.056 08.16 21.01
2011 35.655 261.519 -7.40 31.38
2012 51.238 306.372 43.71 17.15
2013 62.824 377.093 22.61 23.08
2014 70.867 509.920 12.80 35.22
2015 89.790 656.855 26.70 28.82
2016 114.233 780.745 27.22 18.86
Source: 2007-2016 China Statistical Foreign Direct Investment Bulletin.
From the perspective of the industrial distribution, in 2016, Mainland China’s
investment in Hong Kong (China) mainly flowed to the rental and business services,
finance, wholesale and retail, manufacturing and real estate industries. Among them, the
amount of investment in the leasing and business services industry was $48.506 billion

3. Investment Relations Between China and Asian Developing Countries
55
accounting for 42.5% of the total investment flow, followed by the financial industry,
with an investment amount of $15.806 billion accounting for 13.8%. The investment in
wholesale and retail trade also reached more than 10% with investment amount $14.931
billion, accounting for 13.1%. In terms of the growth rate of investment flows, although
the investment in residential service/repair and other service industries takes a relatively
low proportion, but the year-to-year growth rate rose to 244.8%, making it the fastest
growing industry. At the same time, investment in the mining industry has experienced
negative growth.
Table 3.2.2-3 Industries of China’s Direct Investment in Hong Kong (China) in 2016
(Unit: US$ Billion, %)
Industry Flow Proportion Stock Proportion
Leasing and Business Services 48.506 42.5 372.493 47.7
Financial Industry 15.806 13.8 105.046 13.5
Wholesale and Retail Trade 14.931 13.1 103.934 13.3
Mining Industry -3.023 -2.6 47.806 6.1
Manufacturing 10.697 9.4 39.095 5.0
Transportation / Warehousing and Postal Services 1.453 1.3 29.795 3.8
Real Estate Industry 9.244 8.1 27.453 3.5
Information Transmission / Software and Information Technology Services 5.162 4.5 16.879 2.2
Resident Services / Repair and Other Services 4.479 3.9 13.164 1.7
Electricity / Heat / Gas and Water Production and Supply 1.743 1.5 6.866 0.9
Scientific Research and Technical Services 0.893 0.8 4.794 0.6
Construction Industry 0.939 0.8 4.566 0.6
Culture / Sports and Entertainment 1.306 1.1 3.800 0.5
Agriculture, Forestry, Animal Husbandry and Fishery 0.788 0.7 1.879 0.2
Water Conservancy / Environment and Public Facilities Management 0.618 0.5 1.669 0.2
Other Industries 0.689 0.6 1.506 0.2
Sum 114.233 100.0 780.745 100.0
Source: 2016 China Statistical Foreign Direct Investment Bulletin.
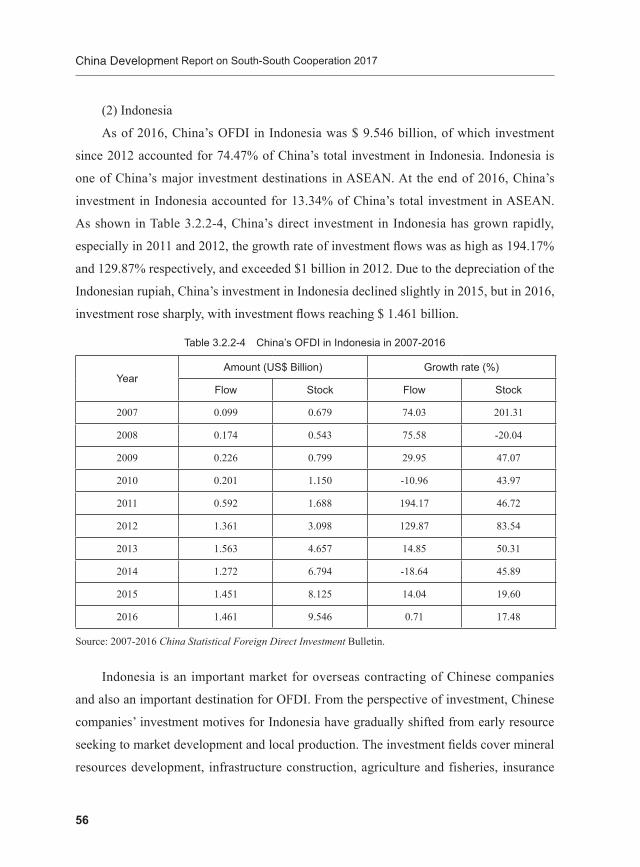
China Development Report on South-South Cooperation 2017
56
(2) Indonesia
As of 2016, China’s OFDI in Indonesia was $ 9.546 billion, of which investment
since 2012 accounted for 74.47% of China’s total investment in Indonesia. Indonesia is
one of China’s major investment destinations in ASEAN. At the end of 2016, China’s
investment in Indonesia accounted for 13.34% of China’s total investment in ASEAN.
As shown in Table 3.2.2-4, China’s direct investment in Indonesia has grown rapidly,
especially in 2011 and 2012, the growth rate of investment flows was as high as 194.17%
and 129.87% respectively, and exceeded $1 billion in 2012. Due to the depreciation of the
Indonesian rupiah, China’s investment in Indonesia declined slightly in 2015, but in 2016,
investment rose sharply, with investment flows reaching $ 1.461 billion.
Table 3.2.2-4 China’s OFDI in Indonesia in 2007-2016
YearAmount (US$ Billion) Growth rate (%)
Flow Stock Flow Stock
2007 0.099 0.679 74.03 201.31
2008 0.174 0.543 75.58 -20.04
2009 0.226 0.799 29.95 47.07
2010 0.201 1.150 -10.96 43.97
2011 0.592 1.688 194.17 46.72
2012 1.361 3.098 129.87 83.54
2013 1.563 4.657 14.85 50.31
2014 1.272 6.794 -18.64 45.89
2015 1.451 8.125 14.04 19.60
2016 1.461 9.546 0.71 17.48
Source: 2007-2016 China Statistical Foreign Direct Investment Bulletin.
Indonesia is an important market for overseas contracting of Chinese companies
and also an important destination for OFDI. From the perspective of investment, Chinese
companies’ investment motives for Indonesia have gradually shifted from early resource
seeking to market development and local production. The investment fields cover mineral
resources development, infrastructure construction, agriculture and fisheries, insurance

3. Investment Relations Between China and Asian Developing Countries
57
and financial services, etc. Indonesia’s backward infrastructure has become the biggest
obstacle to its economic development. With relatively mature technical equipment and
construction experience, China has reached a series of agreements with the Indonesian
government in the field of infrastructure construction. China will actively participate in
Indonesian railways, highways, ports and terminals, dams, airports, bridges and other
infrastructure and interconnection construction. For example, the Yawan high-speed rail
project signed by China and Indonesia in 2015 is one of the projects that give full play
to China’s advantages in infrastructure construction, and it is also the first full-system
and full-industry chain of China’s high-speed rail to go into world. For the traditional
resource and energy sector, due to Indonesian technology and funding constraints, it is
difficult to maximize the advantages of its resources. Compared with Indonesia, China’s
energy technology is advanced and capital is sufficient. The cooperation between the
two countries in the energy field has gradually deepened, and the investment field has
shifted from traditional resource development to new energy cooperation. In 2014,
China Huadian Group’s Bali Phase I coal-fired power plant project in Indonesia was
an important manifestation of two countries’ deepening cooperation in the energy field.
The total installed capacity of the power plant reached 3×142 MW, using efficient clean
coal technology that has completely changed the status quo of power and fuel power
generation in Bali relying on Java Island.
Table 3.2.2-5 China’s Investment Projects in Indonesia
(Unit: US$ Billion)
Investment Field Project NameChinese Investment
(Joint Venture) EnterpriseProjection Location
Investment Scale
Energy Field
Coal-Fired Power Plant China Huadian Corporation Java Island 0.63
Clean Coal Project China Shenhua Energy Co., Ltd. Java Island 1.88
Clean Coal Project China Shenhua Energy Co., Ltd. Sumatra 0.8
Infrastructure
Yawan High Speed Rail China Railway Corporation, etc Java Island 4.7
Power China Xidian Group Jakarta 0.05

China Development Report on South-South Cooperation 2017
58
Investment Field Project NameChinese Investment
(Joint Venture) EnterpriseProjection Location
Investment Scale
Manufacturing Automotive Manufacturing
SAIC-GM-Wuling Automobile Co., Ltd. Java Island 0.7
Natural ResourcesAlumina Project China Hongqiao Group Kalimantan 1
Steel Project Qingshan Iron and Steel Co., Ltd Moro Valley 0.98
Source: China Business Foreign Economic Statistics Cooperation Materials.
3.3 Industrial Characteristics of China’s OFDI in Asia
3.3.1 Overall Industrial CharacteristicsChina’s OFDI in Asia is widely distributed, covering all sectors of the national
economy. As of 2016, there are five industries in China with foreign direct investment
stocks worth hundreds of billions of dollars, including leasing and business services,
finance, wholesale and retail, mining and manufacturing. Among them, the leasing and
business services industry ranked first, with a stock of investment of $473.99 billion,
accounting for 34.9% of China’s foreign direct investment stock; followed by financial
industry $177.34 billion, accounting for 13.1%, and wholesale and retail industry $169.17
billion, accounting for 12.5 %; mining industry $152.37 billion, accounting for 11.2%;
manufacturing industry $108.11 billion, only the investment stocks of these five industries
accounted for 79.6% of China’s foreign direct investment stock. China’s direct investment
in Asia is also mainly distributed in these five industries. Table 3.3.1-1 shows the top
five industries in China’s direct investment in Asia at the end of 2016. 42.4% of China’s
direct investment in Asia was in the leasing and business services industries, followed
by the financial industry, wholesale and retail, mining and manufacturing. These top five
industries accounted for 83.2% of China’s direct investment in Asia.
Continued

3. Investment Relations Between China and Asian Developing Countries
59
Table 3.3.1-1 Top Five Industries in China’s OFDI in Asia by 2016
Industry Stock (US$ Billion) Proportion (%)
Leasing and Business Services 385.5 42.4
Finance 118.95 13.1
Wholesale and Retail 117 12.9
Mining 71.72 7.9
Manufacturing 62.4 6.9
Sum 755.57 83.2
Source: 2016 China Statistical Foreign Direct Investment Bulletin.
Table 3.3.1-2 lists the industry distribution of China’s direct investment stocks in
Hong Kong (China) and ASEAN. In 2016, Hong Kong (China) and ASEAN accounted
for nearly 94% of China’s direct investment flows to Asia. As can be seen from the table,
as of 2016, China’s top three direct investment stocks in Hong Kong (China) are leasing
and business services, finance, and wholesale and retail, with investment in leasing
and business services accounting for as high as 47.7% of investment stock. China’s
investment in ASEAN is mainly concentrated in manufacturing, leasing and business
services, mining, wholesale and retail, and electricity, heat, gas and water production and
supply. China’s investment in these industries accounts for 87.3%.
Table 3.3.1-2 The Top Five Industries in China’s Investment in Hong Kong (China) and ASEAN by 2016
(Unit: US$ Billion, %)
Industry Flow Proportion Stock Proportion
Hong Kong (China)
Leasing and Business Services 48.506 42.5 372.493 47.7
Finance 15.806 13.8 105.046 13.5
Wholesale and Retail 14.931 13.1 103.934 13.3
Mining -3.023 -2.6 47.806 6.1
Manufacturing 10.697 9.4 39.095 5
Transportation/Warehousing and Postal Services 1.453 1.3 29.795 3.8
Real Estate 9.244 8.1 27.453 3.5
Sum 97.614 85.6 725.623 92.9

China Development Report on South-South Cooperation 2017
60
Industry Flow Proportion Stock Proportion
ASEAN
Manufacturing 3.544 34.5 13.150 18.4
Leasing and Business Services 1.371 13.3 11.223 15.7
Mining 0.241 2.3 10.169 14.2
Wholesale and Retail 1.963 19.1 9.690 13.5
Electricity/Heat/Gas and Water production and Supply 0.664 6.5 9.121 12.7
Finance 0.454 4.4 4.573 6.4
Construction 0.635 6.2 4.507 6.4
Sum 8.872 86.3 62.433 87.3
Source: 2016 China Statistical Foreign Direct Investment Bulletin.
3.3.2 Investment in infrastructureMost Asian developing countries have strong economic development advantages
and good complementarity with the Chinese economy. However, at the same time the
infrastructure of these countries is relatively backward, which restricts deep cooperation
and development with China to some extent. With the advancement of the “One Belt
One Road” and the importance that governments attach to infrastructure investment, China’s
infrastructure investment in developing countries in Asia is gradually increasing. The
following is an example of Central Asia, focusing on China’s investment in infrastructure such
as transportation, electricity and telecommunications in the five Central Asian countries.
1. TransportationThe Central Asian countries are landlocked countries and an important region of
the China-Central Asia-West Asia Economic Corridor. The transportation infrastructure
construction of the five Central Asian countries will greatly affect their foreign economic
ties and the depth of integration into economic globalization. The transportation
infrastructure of the five Central Asian countries is weak, the international air routes
are insufficient, the port operation capacity is limited, roads and railway facilities are
lacking, and transportation constructions in Uzbekistan and Turkmenistan are even
Continued

3. Investment Relations Between China and Asian Developing Countries
61
seriously inadequate. Therefore, China and Central Asia are actively cooperating in the
transportation fields such as roads and railways. At present, China has undertaken a large
number of cooperation projects such as roads and railways in Central Asian countries.
Since the second Eurasia Continental Bridge was completed in 1990, the transportation
cooperation between China and the five Central Asian countries has been developing
rapidly, and the investment entities are mainly state-owned enterprises and large-scale
joint-stock companies.
China and Kazakhstan, Uzbekistan and Kyrgyzstan have achieved certain
achievements in railway transportation cooperation, and the cooperation effect with
Kazakhstan is the most obvious. The cooperation between China and the five Central
Asian countries in transportation is mainly in the following three aspects: (1) Road
transportation. Road transportation is the earliest transportation sector in China and
Central Asian countries. The “New Silk Road” transportation cooperation between China
and Central Asian countries has achieved good results after long-term cooperation. The
passage of the “China-Central Asia Highway Belt” has greatly facilitated the economic
ties between China and the five Central Asian countries. In addition, as early in 2006,
China and Kazakhstan jointly proposed the construction of the “Europe West-West
China” highway traffic corridor (West-West Highway). This project was launched in
2008 and officially started construction in 2016. (2) Railway transportation. The unique
geographical location of Central Asian countries determines that rail transport is the
most convenient means of transportation. Among the railway transportation cooperation
between China and Central Asian countries, the representative projects include the New
Asia-Europe Continental Bridge and the “Chongqing-Xinjiang-Europe” International
Railway. The countries and regions through which the New Eurasian Continental Bridge
passes have strong economic interdependence and complementary advantages, and
show good prospects for mutually beneficial cooperation. The “Chongqing- Xinjiang-
Europe” International Railway is a transportation project for China to further optimize
and improve the international logistics channel on the basis of the New Asia-Europe
Continental Bridge. (3) Pipeline transportation. Central Asia is rich in oil and natural gas
resources, but relatively poor in energy infrastructure and low in energy resource output.
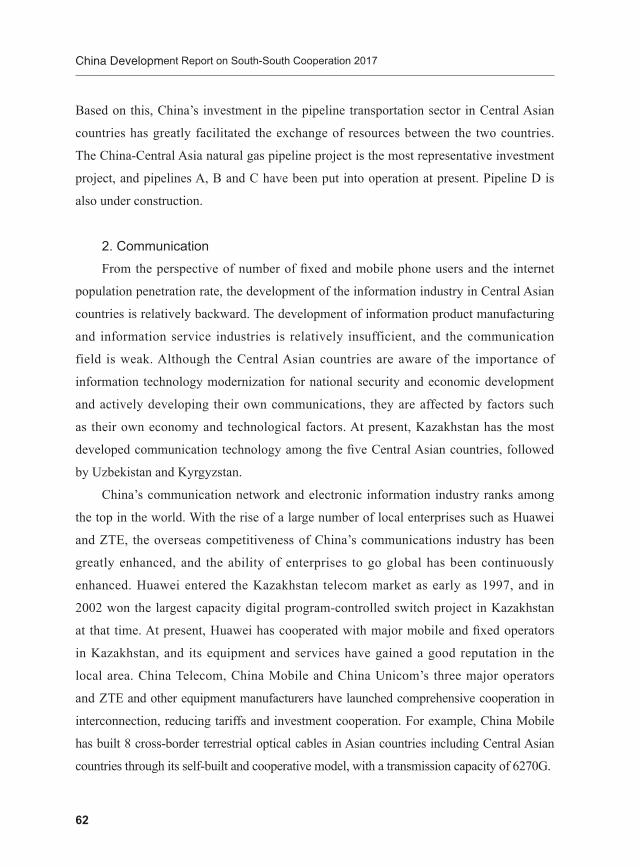
China Development Report on South-South Cooperation 2017
62
Based on this, China’s investment in the pipeline transportation sector in Central Asian
countries has greatly facilitated the exchange of resources between the two countries.
The China-Central Asia natural gas pipeline project is the most representative investment
project, and pipelines A, B and C have been put into operation at present. Pipeline D is
also under construction.
2. CommunicationFrom the perspective of number of fixed and mobile phone users and the internet
population penetration rate, the development of the information industry in Central Asian
countries is relatively backward. The development of information product manufacturing
and information service industries is relatively insufficient, and the communication
field is weak. Although the Central Asian countries are aware of the importance of
information technology modernization for national security and economic development
and actively developing their own communications, they are affected by factors such
as their own economy and technological factors. At present, Kazakhstan has the most
developed communication technology among the five Central Asian countries, followed
by Uzbekistan and Kyrgyzstan.
China’s communication network and electronic information industry ranks among
the top in the world. With the rise of a large number of local enterprises such as Huawei
and ZTE, the overseas competitiveness of China’s communications industry has been
greatly enhanced, and the ability of enterprises to go global has been continuously
enhanced. Huawei entered the Kazakhstan telecom market as early as 1997, and in
2002 won the largest capacity digital program-controlled switch project in Kazakhstan
at that time. At present, Huawei has cooperated with major mobile and fixed operators
in Kazakhstan, and its equipment and services have gained a good reputation in the
local area. China Telecom, China Mobile and China Unicom’s three major operators
and ZTE and other equipment manufacturers have launched comprehensive cooperation in
interconnection, reducing tariffs and investment cooperation. For example, China Mobile
has built 8 cross-border terrestrial optical cables in Asian countries including Central Asian
countries through its self-built and cooperative model, with a transmission capacity of 6270G.

3. Investment Relations Between China and Asian Developing Countries
63
3.3.3 Investment in Resources and EnergyAs a close neighbor of China and a country along the “One Belt and One Road”,
many developing countries in Asia and China are increasingly connected in the field of
resources and energy. Resource and energy cooperation have become one of the key areas
for foreign investment. The effective cooperation between China and Asian countries has
achieved remarkable results.
1. China-Central Asia Resource and Energy CooperationThe development of oil and gas resources is closely related to the economic
development of Central Asian countries. Resources and energy are priority development
areas. The abundant resource reserves are an important basis for energy cooperation
between China and Central Asian countries. The energy cooperation between China
and Central Asian countries began in 1997. PetroChina purchased a 60.3% stake in the
Aktobinsk oil project in Kazakhstan and entered the oil and gas area along the Caspian
Sea in Central Asia for mining. Early China’s investment in resources and energy in
Central Asian countries was mainly devoted to the development of resources, such
as PetroChina, Sinopec, CNOOC, Daqing Oilfield Company and Xinjiang Petroleum
Bureau, which invested in Central Asian countries mainly engaged in oil and gas
exploitation and other business in Central Asian countries. With the promotion of the “One
Belt and One Road” construction and China’s accumulated experience in energy and
infrastructure, Chinese companies are increasingly focusing on maintaining sustainable
resources and mutual benefit for their investment in Central Asian countries. On the basis
of strengthening cooperation in the field of resources and energy, the investment field has
gradually turned to new energy cooperation and energy infrastructure cooperation. For
example, in 2006, China and Turkmenistan signed an agreement to develop natural gas
cooperation. To ensure the smooth implementation of natural gas cooperation, starting in
2008, China assisted Central Asian countries in building natural gas pipelines connecting
China and Central Asia and improving related energy infrastructure. At the end of 2009,
China-Central Asia natural gas pipeline A was built and ventilated. The natural gas B and
C lines were put into operation in 2010 and 2014 respectively. The natural gas pipeline D

China Development Report on South-South Cooperation 2017
64
line started in 2014 and is currently under construction. The China-Central Asia Natural
Gas Pipeline Project will help multi-party win-win for resource countries, transit countries
and consuming countries. It is also of great significance for improving the energy
infrastructure construction of Central Asian countries and realizing the diversification
strategy of Central Asia’s natural gas export.
2. China-South Asia Resource and Energy CooperationSouth Asian countries are China’s important neighbors. Although South Asia’s
resource reserves are not abundant, the region is the only way for China to import energy
and the oil and gas pipeline. Strengthening energy cooperation with South Asian countries
is vital to both China and South Asian countries. China’s energy investment in South
Asian countries mainly includes technology and labor export, third-party cooperation
and energy transportation cooperation. Take India as an example, China’s investment in
India’s resources and energy sector is relatively small. The energy cooperation between
the two countries is mainly based on third-party cooperation and have cooperation
projects in Africa, Central Asia and Russia. China’s direct investment in India’s energy
sector, such as Sany Group Co., Ltd., will invest $3 billion in India’s renewable energy
industry between 2016 and 2020. Among the countries in South Asia, China has invested
the most in Pakistan’s resources and energy sector. The cooperation between the two
countries in the energy sector is mainly based on China’s investment in Pakistan. In 2013,
China and Pakistan proposed an initiative to build a China-Pakistan economic corridor,
of which energy cooperation is the focus of the China-Pakistan economic corridor. In
2014, the two countries formulated the energy cooperation plan for the China-Pakistan
economic corridor, which included 14 priority implementation projects and 7 active
promotion projects with a total investment of approximately $30.5 billion. By the end
of 2016, 11 projects have started, with an investment of about $16 billion. After the
project is completed and put into production, it will basically solve the power shortage
problem in Pakistan. The Davao Wind Power Project is one of the 14 priority projects
implemented by China-Brazil Energy Cooperation with an investment of $115 million,
and entered commercial operation in 2017. In addition, Pakistan is a gateway for South

3. Investment Relations Between China and Asian Developing Countries
65
Asia, the Middle East and Central Asia to the west of China, and the two countries will
also strengthen cooperation in the construction of energy transportation pipelines.
3.4 Asian Countries’ Direct Investment in China
3.4.1 Overall Characteristics of the InvestmentAfter joining the WTO and with the improvement of the domestic investment
environment, China’s use of foreign capital grew rapidly, and became the world’s largest
foreign capital inflow country in 2002 for the first time. Figure 3.4.1-1 shows that China’s
absorption of foreign direct investment has maintained a steady and rapid growth. During
the financial crisis, due to the global economic downturn and the financial supervision
of developed countries, the willingness and investment capacity of multinational
corporations to invest abroad have fallen sharply, and the amount of foreign capital used
by China has dropped briefly. Later, in order to cope with the transfer of manufacturing
of multinational companies to China, local governments increased their policy support
for resource integration and investment environment optimization, and the scale of
investment began to rise. In 2010, China’s foreign investment increased by $15.072
billion from 2009, and exceeded $100 billion for the first time. In 2016, China’s actual
use of foreign capital reached $126.01 billion.
0
200
400
600
800
1000
1200
1400
2006 2007 2008 2009 2010 2011 2012 2013 2014 2015 2016
100
mill
ion
USD
year
Asia World
Figure 3.4.1-1 IFDI from the World and Asian Countries to China
Source: 2006-2016 China Statistical Foreign Direct Investment Bulletin.

China Development Report on South-South Cooperation 2017
66
Figure 3.4.1 also reflects the inward foreign direct investment of Asian developing
countries in China. From the graphic trend, the direct investment amount of China’s
absorption of Asian countries in 2006-2016 has shown a steady upward trend. Table
3.4.1-1 reports on the direct investment of Asian countries in China from 2007 to 2016. In
2007, the actual investment of Asian countries in China was $38.528 billion. In 2015, the
investment of Asian countries reached $100.965 billion, with an average growth rate of
14.9%. However, the amount of investment decreased in 2016. The proportion of Asian
countries’ investment in China to China’s total receiving of foreign investment has been
rising. In 2007, the ratio was 51.53%, and reached 75.98% in 2016.
Table 3.4.1 IFDI from Asian Countries and the World to China
(Unit: US$ Billion, %)
Year Direct Investment from Asian Countries Direct Investment from the World Proportion
2007 38.528 74.768 51.53
2008 52.693 92.395 57.03
2009 56.518 90.033 62.77
2010 73..08 105.732 69.52
2011 83.185 116.010 71.70
2012 79.344 111.716 71.02
2013 87.614 117.586 74.51
2014 94.324 119.562 78.89
2015 100.965 126.266 79.96
2016 95.735 126.001 75.98
Source: 2008-2017 China Statistical Yearbook.
3.4.2 Industrial Characteristics of InvestmentFirstly, from the perspective of amount of foreign investment attracted by China in
2015, the actual use of foreign capital in the tertiary industry was the highest, reaching
$81.138 billion, accounting for 64.26% of the total actual use of foreign capital in China
that year. Secondly, the actual use of foreign capital in the secondary industry and the
primary industry was $43.595 billion and $1.534 billion, accounting for 34.53% and
3. Investment Relations Between China and Asian Developing Countries
67
1.21% respectively. In the terms of foreign capital stocks, the secondary industry was the
industry with the largest amount of foreign capital actually utilized at the end of 2015.
The actual use of foreign capital totaled $694.767 billion, accounting for 53.69% of the
actual amount of foreign investment in the country. The tertiary industry grew fastest,
the total amount of foreign capital absorbed was $579.464 billion at the end of 2015,
accounting for 44.78%, and the total actual foreign investment in the primary industry
was $19.742 billion, accounting for 1.53%.
Asian countries and regions are important sources of foreign investment for China.
(1) Agricultural field. Foreign direct investment attracted by China’s agricultural sector
mainly comes from Hong Kong (China), Taiwan (China) and Singapore. In 2015, Hong
Kong’s (China) direct investment in China’s agricultural sector was $1.008 billion,
accounting for 65.72% of the total foreign investment in agriculture. And Taiwan’s
(China) and Singapore’s investment in agriculture was $117 million and $96 million
respectively. (2) Manufacturing field. In 2015, Hong Kong (China) invested most in
China’s manufacturing sector, followed by South Korea and Singapore. Among them,
the number of enterprises in the manufacturing sector invested by Hong Kong in China
was 2,216, with the total amount of $19.697 billion. Hong Kong (China) ranked first for
number of investment enterprises and actual investment, and the investment accounting
for 49.81% of the total actual use of foreign capital in manufacturing sector. (3) Service
industry. Foreign direct investment in the service industry mainly comes from Hong Kong
(China) and Singapore. In 2015, investment from Hong Kong (China) and Singapore
accounted for more than 80% of the total actual use of foreign capital in China’s service
industry. Hong Kong (China) established 10,636 enterprises in the service sector in 2015,
with an actual investment of $65.867 billion; and Singapore established 647 enterprises in
the service sector, with an actual investment of $5.430 billion.
Continued

China Development Report on South-South Cooperation 2017
68
Table 3.4.2 Industry Distribution of China’s IFDI in 2015
Industry Country/RegionNumber of Enterprises
Proportion of Enterprises
Amount (US$ Billion)
Proportion of Amount (%)
Agriculture
Hong Kong (China) 333 54.68 1.008 65.72
Taiwan (China) 167 27.42 0.117 7.64
Singapore 10 1.64 0.096 6.24
Manufacturing
Hong Kong (China) 2216 49.17 19.697 49.81
South Korea 452 10.03 3.492 8.83
Singapore 104 2.31 1.428 3.61
ServicesHong Kong (China) 10636 49.33 65.867 77.15
Singapore 647 3 5.430 6.36
Source: 2016 China Foreign Direct Investment Report
3.4.3 Top Countries and Economies of China’s IFDITable 3.4.3-1 is the top 15 Asian countries and economies in China’s IFDI in 2016.
In 2016, there were four Asian countries and economies with direct investment in China
exceeding $1 billion, namely Hong Kong (China), Singapore, South Korea and Taiwan
(China), which accounted for 98.42% of total Asian direct investment in China. In
addition, the total direct investment in China by Macao (China) and Malaysia in China
was $81.8 million and $22.1 million in 2016 respectively. The 15 Asian countries’
(regions’) direct investment in China accounted for 99.98% of the total direct investment
of Asian countries in China.
Table 3.4.3-1 Top 15 Asian Countries (Economies) in China IFDI in 2016
Serial Number Country/RegionActual Investment
Amount (US$ Billion)Proportion (%)
1 Hong Kong (China) 81.465 85.09
2 Singapore 6.047 6.32
3 Korea 4.751 4.96
4 Taiwan (China) 1.963 2.05
5 Macaw (China) 0.818 0.85
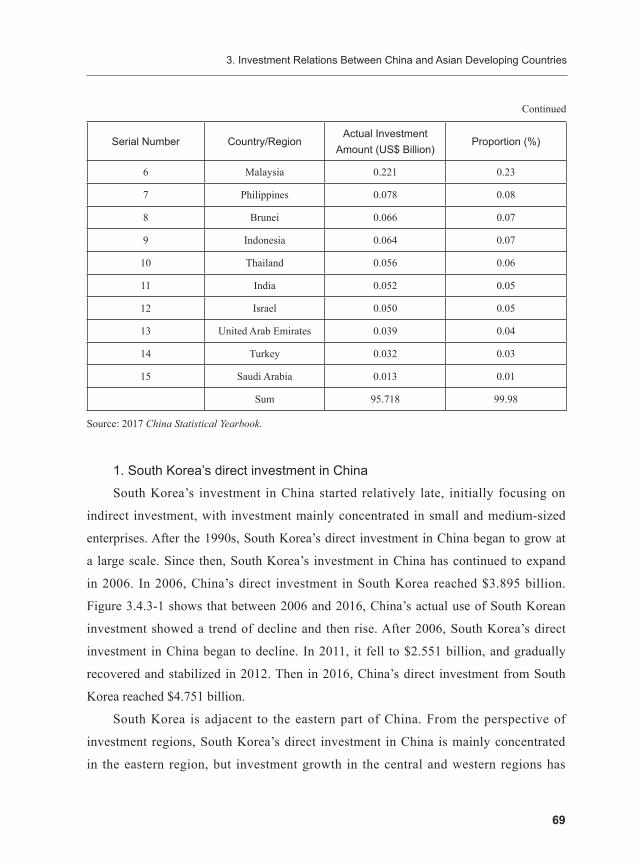
3. Investment Relations Between China and Asian Developing Countries
69
Serial Number Country/RegionActual Investment
Amount (US$ Billion)Proportion (%)
6 Malaysia 0.221 0.23
7 Philippines 0.078 0.08
8 Brunei 0.066 0.07
9 Indonesia 0.064 0.07
10 Thailand 0.056 0.06
11 India 0.052 0.05
12 Israel 0.050 0.05
13 United Arab Emirates 0.039 0.04
14 Turkey 0.032 0.03
15 Saudi Arabia 0.013 0.01
Sum 95.718 99.98
Source: 2017 China Statistical Yearbook.
1. South Korea’s direct investment in ChinaSouth Korea’s investment in China started relatively late, initially focusing on
indirect investment, with investment mainly concentrated in small and medium-sized
enterprises. After the 1990s, South Korea’s direct investment in China began to grow at
a large scale. Since then, South Korea’s investment in China has continued to expand
in 2006. In 2006, China’s direct investment in South Korea reached $3.895 billion.
Figure 3.4.3-1 shows that between 2006 and 2016, China’s actual use of South Korean
investment showed a trend of decline and then rise. After 2006, South Korea’s direct
investment in China began to decline. In 2011, it fell to $2.551 billion, and gradually
recovered and stabilized in 2012. Then in 2016, China’s direct investment from South
Korea reached $4.751 billion.
South Korea is adjacent to the eastern part of China. From the perspective of
investment regions, South Korea’s direct investment in China is mainly concentrated
in the eastern region, but investment growth in the central and western regions has
Continued
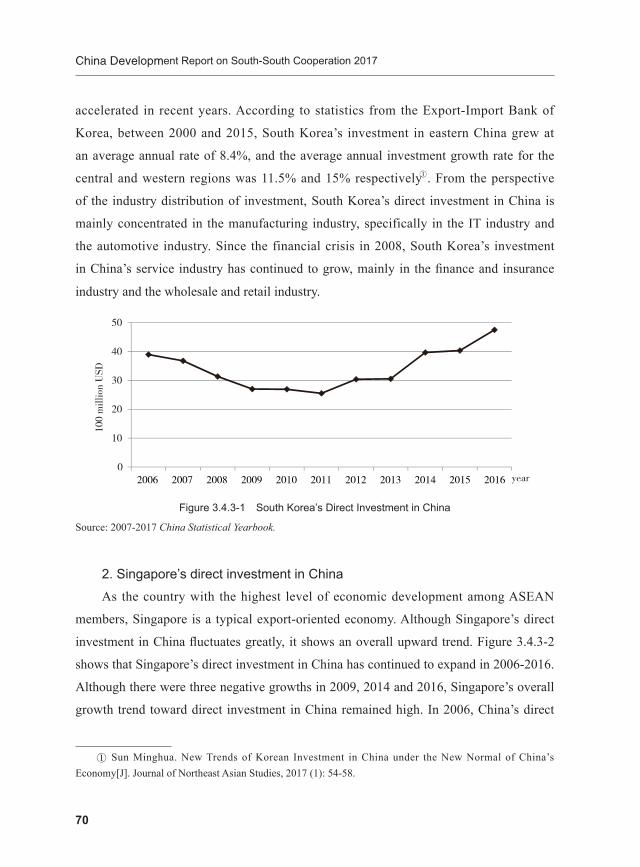
China Development Report on South-South Cooperation 2017
70
accelerated in recent years. According to statistics from the Export-Import Bank of
Korea, between 2000 and 2015, South Korea’s investment in eastern China grew at
an average annual rate of 8.4%, and the average annual investment growth rate for the
central and western regions was 11.5% and 15% respectivelyA. From the perspective
of the industry distribution of investment, South Korea’s direct investment in China is
mainly concentrated in the manufacturing industry, specifically in the IT industry and
the automotive industry. Since the financial crisis in 2008, South Korea’s investment
in China’s service industry has continued to grow, mainly in the finance and insurance
industry and the wholesale and retail industry.
0
10
20
30
40
50
2006 2007 2008 2009 2010 2011 2012 2013 2014 2015 2016
100
mill
ion
USD
year
Figure 3.4.3-1 South Korea’s Direct Investment in China
Source: 2007-2017 China Statistical Yearbook.
2. Singapore’s direct investment in ChinaAs the country with the highest level of economic development among ASEAN
members, Singapore is a typical export-oriented economy. Although Singapore’s direct
investment in China fluctuates greatly, it shows an overall upward trend. Figure 3.4.3-2
shows that Singapore’s direct investment in China has continued to expand in 2006-2016.
Although there were three negative growths in 2009, 2014 and 2016, Singapore’s overall
growth trend toward direct investment in China remained high. In 2006, China’s direct
A Sun Minghua. New Trends of Korean Investment in China under the New Normal of China’s Economy[J]. Journal of Northeast Asian Studies, 2017 (1): 54-58.

3. Investment Relations Between China and Asian Developing Countries
71
investment from Singapore amounted to $2.06 billion and rose to $6.904 billion in 2015,
with an average annual growth rate of 15.72%. In 2016, Singapore’s investment in China
fell to $6.047 billion.
2006 2007 2008 2009 2010 2011 2012 2013 2014 2015 20160
10
20
30
40
50
60
70
80
100
mill
ion
USD
year
Figure 3.4.3-2 Singapore’s Direct Investment in China
Source: 2007-2017 China Statistical Yearbook.
3.5 Two-Way Investment between China and Asian CountriesChina’s two-way investment refers to the total of IFDI from Asian countries and
OFDI to other countries economies. As the largest developing country, China has close
ties with developing countries in the investment field. It is of great significance to study
the two-way investment relationship between China and Asian developing countries
to strengthen South-South cooperation. This section mainly analyzes the two-way
investment between China and Asian developing countries and economies. China’s
investment in Asia Tigers is more than 90%. If we only use Asian developing countries
and economies including Asian Tigers as samples, we can hide the two-way investment
status between China and other Asian developing countries when analyzing the bilateral
investment between China and Asian countries. Therefore, this section considers two
situations when analyzing the bilateral investment between China and Asian countries and
regions, including the bilateral investment including and excluding the Asian Tigers.
With the implementation of China’s “going out” strategy and increasing foreign
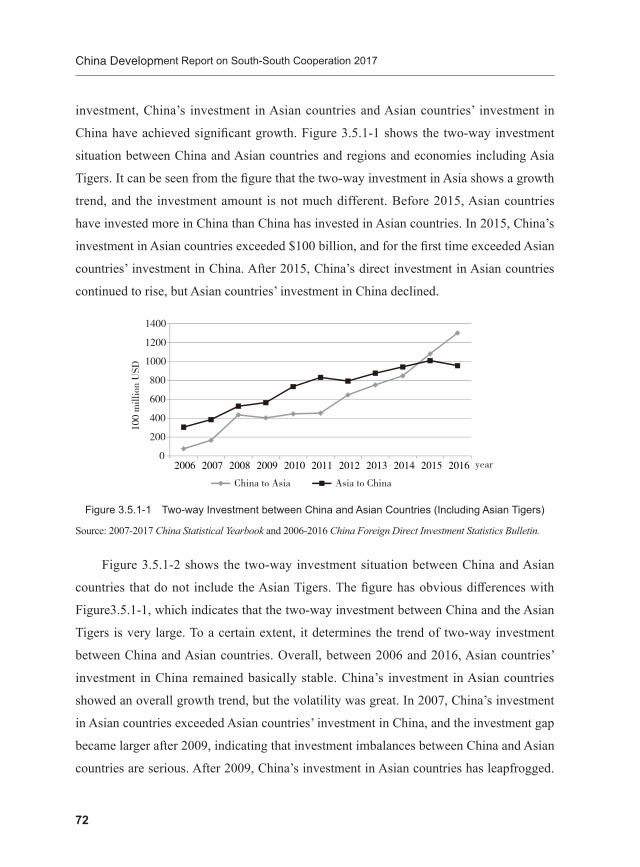
China Development Report on South-South Cooperation 2017
72
investment, China’s investment in Asian countries and Asian countries’ investment in
China have achieved significant growth. Figure 3.5.1-1 shows the two-way investment
situation between China and Asian countries and regions and economies including Asia
Tigers. It can be seen from the figure that the two-way investment in Asia shows a growth
trend, and the investment amount is not much different. Before 2015, Asian countries
have invested more in China than China has invested in Asian countries. In 2015, China’s
investment in Asian countries exceeded $100 billion, and for the first time exceeded Asian
countries’ investment in China. After 2015, China’s direct investment in Asian countries
continued to rise, but Asian countries’ investment in China declined.
0
200
400
600
800
1000
1200
1400
2006 2007 2008 2009 2010 2011 2012 2013 2014 2015 2016
100
mill
ion
USD
year
China to Asia Asia to China
Figure 3.5.1-1 Two-way Investment between China and Asian Countries (Including Asian Tigers)
Source: 2007-2017 China Statistical Yearbook and 2006-2016 China Foreign Direct Investment Statistics Bulletin.
Figure 3.5.1-2 shows the two-way investment situation between China and Asian
countries that do not include the Asian Tigers. The figure has obvious differences with
Figure3.5.1-1, which indicates that the two-way investment between China and the Asian
Tigers is very large. To a certain extent, it determines the trend of two-way investment
between China and Asian countries. Overall, between 2006 and 2016, Asian countries’
investment in China remained basically stable. China’s investment in Asian countries
showed an overall growth trend, but the volatility was great. In 2007, China’s investment
in Asian countries exceeded Asian countries’ investment in China, and the investment gap
became larger after 2009, indicating that investment imbalances between China and Asian
countries are serious. After 2009, China’s investment in Asian countries has leapfrogged.

3. Investment Relations Between China and Asian Developing Countries
73
Although China’s investment in Asian countries declined in 2015, investment in 2016
began to rise.
0
20
40
60
80
100
120
2006 2007 2008 2009 2010 2011 2012 2013 2014 2015 2016
100
mill
ion
USD
year
China to Asia Asia to China
Figure 3.5.1-2 Two-Way Investment between China and Asian Countries and regions (Excluding Asian Tigers)
Source: 2007-2017 China Statistical Yearbook and 2006-2016 China Foreign Direct Investment Statistics Bulletin.
3.6 SummaryThis chapter analyzes the investment relationship between China and Asian
developing countries and regions. The analysis is mainly conducted from three aspects.
Firstly, we analyze China’s investment in Asian countries as a whole, and further explores
the country characteristics and regional characteristics of investment. Secondly, we
analyze the industry distribution and main ways of China’s investment in Asian countries,
focused on the cooperation between China and Asian countries in the field of resources
and energy and infrastructure. Finally, we analyze the trend of China’s investment in
Asian countries, and on this basis, study the bilateral investment between China and
Asian countries.
Asia is the main destination of China’s foreign direct investment and an important
source of China’s direct foreign investment. It is of great significance to strengthen
investment links with Asian countries. On the whole, China’s investment in Asian
countries and China’s investment from Asian countries show an increasing trend. While
actively going out, China also pays attention to increasing the introduction of foreign

China Development Report on South-South Cooperation 2017
74
investment, which is conducive to promoting mutual benefit and win-win between China
and Asian developing countries. However, it is worth noting that the investment between
China and Asian countries is mostly between China and thus the Asian Tigers and the
investment in China and Asian countries is too concentrated. When considering excluding
Asian Tigers, the bilateral investment between China and other Asian developing
countries and regions is not only volatile, but still in an unbalanced stage. Therefore, in
the future investment policy, China should pay more attention to the structural adjustment
of investment to achieve balanced development of investment between developing
countries in China and Asia.

75
4. China’s Foreign Assistance to Asian Countries
Foreign aid is a long-standing political and economic phenomenon in international
relations. After the founding of People’s Republic of China, foreign aid has always been
an indispensable part of China’s diplomacy and an important part of China’s fulfillment
of its international obligations. China is a developing country that helps other developing
countries while accepting foreign aid for its own development. China’s economic and
technological assistance to Asian countries began in the 1950s. Whether in the early days
of the founding of the country, or during the Cultural Revolution period when the “extreme
left” trend of thought flourished, and even in the new era since the reform and opening
up, China has always been unswervingly adhered to economic and technical assistance
to Asian countries. After more than 60 years of development, China’s motives for Asian
countries’ assistance have gradually changed from the initial ideological field to the
economic development field. The way of aid has also gradually changed from donating
money and materials to economic cooperation, and has continued to succeed in different
industries. In the 21st century, China’s internal affairs and diplomacy have demonstrated
a new situation. Adhering to the good neighbors and partners, deepening the mutually
beneficial cooperation with developing countries in Asia, and striving to make its own
development better to benefit the neighboring countries is our consistent mission and
good expectation.
4.1 Concepts and Ways of the Assistance
4.1.1 Concept of Economic and Technical AssistanceForeign economic and technical assistance (referred to as foreign aid) refers to
the assistance of the aiding countries and their affiliated institutions, social groups
and individuals in providing political, economic, humanitarian and other motives in
a preferential manner to provide financial, material, technical or human resources to

China Development Report on South-South Cooperation 2017
76
recipient countries to help other developing countries’ economy and raise the level of
social welfare.A Foreign economic and technical assistance includes both economic
assistance and technical assistance. Economic assistance is the support and assistance
of funds and materials, while technical assistance is the support and assistance of
intelligence, skills, materials and technology.
The main body of assistance in foreign aid can be the state, aid organizations, social
groups or individuals. So foreign aid can be either official or unofficial. The recipient
of assistance in foreign aid can be either the central or local government of the recipient
country or its resident. There are many objects of foreign aid, including economic
assistance and technical assistance. This kind of aid often refers to physical assistance,
but does not include political support or moral support.
4.1.2 Ways of Economic and Technical AssistanceAccording to different classification criteria, foreign aid can be divided into various
types. According to the different channels of aid circulation, foreign aid can be divided
into bilateral aid and multilateral aid; according to different aid methods, foreign aid can
be divided into financial aid and technical assistance; according to different conditions
of aid, foreign aid can be divided into free aid and loan assistance; according to the
different ways of using aid, foreign aid can be divided into project assistance and program
assistance; according to the nature of aid behavior, foreign aid can be divided into military
assistance, economic assistance and humanitarian assistance. In the practice of foreign
aid of many countries, in order to achieve the goal of aid, different types of assistance are
often used or several types of assistance are cross-utilized, so the types of assistance are
staggered and there is no absolute limit.
According to the classifications listed in China’s Foreign Aid 2011, China’s foreign
aid methods mainly include the following eight typesB:
A Li Ronglin. China South-South Cooperation Development Report 2015 [M]. Beijing: Wuzhou Communication Publishing House, 2016.
B State Council Information Office of the People’s Republic of China. China’s Foreign Aid [M]. Beijing: People’s Publishing House, 2011.

4. China’s Foreign Assistance to Asian Countries
77
(1) Complete sets of projects. Complete project assistance means that China assists
recipient countries in the construction of production and civil projects by providing aids
such as grants and interest-free loans. The Chinese side is responsible for all or part of
the process of project inspection, survey, design and construction, providing all or part of
equipment and building materials, and dispatching engineering and technical personnel to
organize and direct construction, to install and make trial production. After the project is
completed, it will be handed over to the recipient country for use.
(2) General materials. General material assistance means that under the aid funds,
China provides the recipient countries with the necessary production and living materials,
technical products or individual equipment, and undertakes the necessary supporting
technical services.
(3) Technical cooperation. Technical cooperation means that experts are dispatched
by China to provide technical guidance for the subsequent production, operation or
maintenance of completed complete sets of projects, to train management and technical
personnel of recipient countries on the spot; to help developing countries to carry out trial
cultivation, trial cultivation, trial production, teach Chinese agriculture and traditional
handicraft techniques, and to help developing countries complete a professional
investigation, exploration, planning, research, and consultation, etc.
(4) Human resources development cooperation. Human resources development
cooperation refers to China’s various forms of government official training, academic
degree education, professional technical training and other personnel exchange programs
for developing countries through multi-bilateral channels.
(5) Foreign aid medical team. The foreign aid medical team refers to China sending
a team of medical personnel to the recipient countries, providing some medical equipment
and medicines free of charge, and conducting fixed-point or patrol medical services in the
recipient countries.
(6) Emergency humanitarian assistance. Emergency humanitarian assistance means
that China, in the case of various serious natural disasters or humanitarian disasters in
the countries and regions concerned, actively or responds to the request of the affected
countries to provide emergency relief supplies, and remittances or rescue personnel to

China Development Report on South-South Cooperation 2017
78
alleviate the loss of life and property of the people in the disaster areas, helping affected
countries cope with the difficult situation caused by disasters.
(7) Foreign aid volunteers. Foreign aid volunteers refer to China’s selection of
volunteers to other developing countries to provide services to local people in the fields of
education, health care and other social development.
(8) Debt relief. Debt relief refers to China exempting some developing countries
from defaulting on government debt to China.
4.2 History of China’s Assistance to Asian Countries
4.2.1 Initial Stage of China’s Assistance to Asia (1949-1959) A
After the end of the Second World War, with the defeat of the fascist countries,
the differences between the United States and the Soviet Union in international affairs
continued to deepen, and the wartime alliances collapsed and gradually moved toward the
Cold War confrontation. Under such a historical background, “a country does not stand
in the camp led by the United States, then it stands in the camp led by the Soviet Union.
There is no middle road”. BDuring the war, the Chinese Communist Party (CCP) was
assisted by the Soviet Union and shared the same guiding ideology with the Soviet Union.
All this made China decide to stand on the Soviet side and implement the “one-sided”
strategy. This “one-sided” diplomatic strategy has played a very important role in the
Asian aid policy in the early days of the founding of People’s Republic of China. It has
determined that the aid of People’s Republic of China must be a country in the socialist
camp that needs assistance.
In 1950, China began to provide great assistance to Vietnam. In addition to military
A China does not have a unified standard for the division of economic and technical assistance to Asian countries. Based on the criteria for the classification of Zhang Yuhui (2006) and Yu Yongquan (2016), this report combines the transformation of China’s foreign policy with China and on the basis of Aid 2011, China’s economic and technical assistance to Asian countries is divided into five stages, and the start and end time of each stage is different from the reference documents.
B [United States] Paul Kennedy, Translated by Baocun Wang and so on. The Rise and Fall of Big Countries [M]. Beijing: Qiushi Publishing House, 1988.
4. China’s Foreign Assistance to Asian Countries
79
assistance, China also provided the Vietnamese government with urgently needed
materials such as grain, oil, and medicine, with a total value of about 170 million yuanA.
In addition, China also aided Vietnam in the form of trade. China exports a large amount
of cotton textiles, vehicles, medical equipment and medicines to Vietnam. After the war,
China paid 600 million yuan to Vietnam free of charge to help the Vietnamese people
heal the wounds of long-term war and restore and develop the national economy. After
the outbreak of the Korean War in 1950, in addition to providing military assistance to
North Korea, China also provided North Korea with a large amount of economic aid such
as food, daily necessities, industrial and mining products to meet the needs of the Korean
war and people’s lives, the total value of which is about 729.52 million yuanB. In the
context of the Cold War, China’s assistance to Vietnam and North Korea had considered
more about the needs of national security.
In April 1955, the first Asian-African conference was held in Bandung, Indonesia.
Premier Zhou Enlai attended the meeting with a Chinese delegation. The meeting
promoted mutual understanding between China and Asian countries. After the meeting,
China further expanded its assistance to Asian nationalist countries. The assistance
in this period was mainly concentrated in Cambodia, Nepal, and Yemen, etc. In June
1956, the Chinese government signed an economic assistance agreement with the
Cambodian government. In the two years between 1956 and 1957, China would provide
Cambodia with a grant of about 8 million pounds of free aid used to provide materials
and construction of textile mills, plywood factories, paper mills, cement plants and other
complete sets of projects.C The agreement clearly stipulated that the assistance provided
by the Chinese government was not subject to any conditions. In addition, during the
three years from 1957 to 1959, China also provided Nepal with a total of 60 million
A Shi Lin. Contemporary Foreign Economic Cooperation of China [M]. Beijing: China Social Sciences Press, 1989.
B Shi Lin. Contemporary Foreign Economic Cooperation of China [M]. Beijing: China Social Sciences Press, 1989.
C Liu Hongwu, Huang Meibo, etc. China’s Foreign Aid and International Responsibility Strategy Research [M]. Beijing: China Social Sciences Press, 2013.
China Development Report on South-South Cooperation 2017
80
Indian rupeesA for free assistance. The Chinese government and the Yemeni Kingdom
(later renamed the Arab Republic of Yemen) signed an agreement on economic and
technological cooperation in January 1958. In February 1959, Yemen suffered an early
disaster and China aided 10,000 tons of wheat for free.
Moreover, China has provided economic and technical assistance to Pakistan,
Ceylon (now known as Sri Lanka), Indonesia, Laos, and Syria.
4.2.2 Development Stage of China’s Aid to Asia (1960-1969)Since the late 1950s, the Soviet Union had changed its diplomatic strategy and
advocated a change in the model of comprehensive confrontation with the West.
Khrushchev had put the improvement of relations with the United States in the first
place. The differences between China and the Soviet Union in terms of national interests,
diplomatic strategy and ideology were growing, and Sino-Soviet relations were gradually
deteriorating. As a result, the Soviet Union unilaterally recalled experts in China in July
1960, tearing up many agreements and scientific and technological cooperation projects
of the two governments. Sino-Soviet relations were close to rupture. During this period,
the United States still adopted a hostile policy toward China, and China had to pursue a
diplomatic strategy that was both anti-American and anti-Soviet. In order to alleviate the
unprecedented pressure on diplomacy, China had placed its breakthrough on the emerging
nationalist countries in Asia, Africa and Latin America, and had given tremendous
assistance to the national liberation movement of Asian countries.
During the Vietnam War, China provided a large amount of economic assistance to
the Vietnamese in addition to military assistance. From 1964 to 1970, China provided
a total of 180 million yuan in cash assistance to Vietnam. Since 1965, China has signed
economic and technical assistance agreements with Vietnam on a regular basis every year
to determine the assistance plan for the second year. During this period, China adopted
the form of material assistance for Vietnam’s economic assistance. During the 10-year
war between Vietnam and the United States, China provided Vietnam with production
A Yan Jianzhang. Diplomatic History of the People’s Republic of China 1949-1956 [M]. Beijing: World Knowledge Press, 1994.

4. China’s Foreign Assistance to Asian Countries
81
and living materials which worth more than 8.6 billion yuan, mainly including food,
cotton, and Asphalt, fertilizer and steel, etc. During this period, China also freely carried
out transit transport of aid materials from the Soviet Union and other socialist countries.
During the Vietnam War against the United States, the aid of other socialist countries that
were transported through Chinese railways reached 750 trains with 5,750 wagons.
In addition, during this period, China also provided North Korea with complete sets
of projects, materials and cash assistance to help complete 25 programs in total, including
building sugar factories, industrial fabric workshops, knitting factories, steel cold
rolling equipment, power stations, electronic tube factories, radio parts factories, radio
communication equipment factories, radio stations and TV stations, etc.
In addition to Vietnam and North Korea, another focus of China’s assistance to
Asian countries is Pakistan. With the resolution of the Sino-Pakistani border issue and
the rapid improvement of China-Pakistan relations, China’s assistance to Pakistan has
gradually increased. In February 1965, China and Pakistan signed the first economic
and technological agreement in Karachi. Later, they signed an agreement to jointly build
the Karakoram Highway. This road crosses the Pakistan-controlled Kashmir region and
is the main thoroughfare for the northern part of Pakistan to the capital Islamabad and
the southern coastal region. It is of great significance to Pakistan’s national security
and the links between the regions. During the second India-Pakistan conflict, China
provided weapons and equipments to the Pakistan and a long-term interest-free loan
of $60 millionA, which played an important role in promoting the ceasefire between
India and Pakistan. After the second India-Pakistan conflict, China continued to provide
military and economic assistance to the Pakistan to help them strengthen national defense
construction and develop the economy in order to prevent another Indian aggression and
US-Soviet interference. In addition, China has provided Pakistan with a total of $340
million economic assistance, focusing on packaged project assistance.B
A Hu Zhiyong. South Asian International Relations during the Cold War [M]. Beijing: Xinhua Publishing House, 2009.
B Yu Yongquan. Foreign Aid Status Study of China (1949-2010) [D]. Jilin University, 2016.

China Development Report on South-South Cooperation 2017
82
4.2.3 Growth Stage of China’s Aid to Asia (1970-1978)In the mid-to-late period of the 1960s, Sino-Soviet relations continued to deteriorate.
The Soviet Union placed a large number of troops on the Sino-Soviet border and China-
Mongolia border, posing a great threat to China’s national security. Since then China
began to consider improving relations with the United States and Western countries and
strengthening its resistance to the Soviet Union. With the normalization of diplomatic
relations between China and the United States, China has officially established the
principle of “lineup against Soviet Union” in foreign diplomacy strategy. In line with the
diplomatic strategy of “lineup against Soviet Union”, while continuing to support the
Asian-African national liberation movement, China focused on assisting countries that
have been subjected to Soviet aggression and threats, strengthening international anti-
Soviet forces and pursuing a world revolutionary strategy.
In 1971, the 26th United Nations General Assembly resumed China’s legitimate seat
in the United Nations. China’s foreign relations have developed greatly. The number of
Asian countries that required China’s assistance had been increasing. China had ushered
in a climax of aid to Asian countries. From 1970 to 1975, China’s economic assistance to
Asia was $31 billion, which was 1.8 times of that from 1961 to 1969. It can be seen that
the amount of aid has increased significantly at this stage.A
From 1970 to 1975, China and Vietnam signed 14 economic and military material
assistance agreements and 8 scientific, cultural, and health agreements. In 1971 alone,
China signed 7 grant assistance agreements with Vietnam, amounting to 3.614 billion
yuan, which accounts for 48.67% of the total amount of China’s foreign aid agreements
for the year. From 1971 to May 1972, only two years of aid materials, in terms of military
assistance alone, exceeded the total amount of the past 20 years. From 1971 to 1973,
China’s economic and military assistance to Vietnam exceeded 9 billion yuan. In 1974,
total aid reached 2.5 billion yuan, including $130 million of spot exchanges, and this was
the year in which China supported the highest amount in Vietnam. In 1975, China had
provided Vietnam with a total of 850 million yuan in aid and $50 million assistance in
A Zhang Yuhui. Foreign Aid Study of China [D]. CPC Central Party School, 2006.

4. China’s Foreign Assistance to Asian Countries
83
cash.A
Although the amount of China’s aid to Vietnam has increased sharply during this
period, Sino-Vietnamese relations were deteriorating. After Vietnam’s reunification
between the North and the South, and with the support of the Soviet Union, Vietnam’s
ambitions continued to expand and began to regard China as “the most dangerous and
direct enemy”. While changing its policy toward China, Vietnam had continuously
set off an anti-Chinese movement, and had continuously created frictions on the Sino-
Vietnamese border. The two countries had serious differences on various issues, and
finally turned against each other. On July 3, 1978, the Chinese government decided to
stop all aid projects and withdraw all engineering and technical personnel from Vietnam.
China’s assistance to Vietnam at this stage ended.
Laos is also one of China’s key aid countries at this stage. From 1959 to 1979,
China’s assistance to Laos reached 1 billion yuan, which were almost free aid except for
foreign exchange loans of 50 million yuan. In the five years since March 1970, China had
also given strong support to Cambodia which was led by Sihanouk, and providing a total
of 310 million yuan in economic assistance to Cambodia.B
4.2.4 Adjustment Stage of China’s Aid to Asia (1979-1994)In the 1970s, China was in the turmoil of the “Cultural Revolution”, and the national
economy was greatly destroyed, almost on the verge of collapse. The growth of aid to
Asian countries had greatly exceeded the affordability of the state. It is imperative to
adjust the old foreign aid system. It was decided to transfer the work center to economic
construction during the Third Plenary Session of the Eleventh Central Committee of the
Party, held in December 1978. In 1982, the 12th National Congress of the Communist
Party of China officially proposed an independent and non-aligned foreign policy,
marking a major change in China’s foreign policy. The purpose of diplomacy has changed
A People’s Republic of China Ministry of Foreign Affairs. The 21st episode of the Treaty of the People’s Republic of China [M]. Beijing: People’s Publishing House, 1981.
B Shi Lin. Contemporary Foreign Economic Cooperation of China [M]. Beijing: China Social Sciences Press, 1989.

China Development Report on South-South Cooperation 2017
84
into creating a peaceful and stable international environment for China’s economic
construction. As a result, China began to reduce foreign aid on a large scale, concentrated
limited resources on domestic economic construction, and also carried out a series of
adjustments on specific foreign aid measures to strengthen the economic benefits of
foreign aid.
Changes in the international and domestic situation had also brought about changes
in China’s foreign aid guiding ideology. On the basis of inheriting the eight principles of
foreign aid proposed by Premier Zhou Enlai in 1964, combined with the new historical
conditions and actual conditions, four principleA of foreign aid guiding ideology that was
more in line with the requirements of the times was put forward. The new four principles
paid more attention to the economic benefits of aid, emphasizing the two-way nature and
commonality of aid. In particular, it was proposed that assistance should be triggered from
the actual needs and possible conditions of both parties to achieve common development
of both sides.
Since the 1970s, China had always adopted the construction department
responsibility system for foreign aid management. The system mainly relied on
administrative means to manage foreign aid projects. Therefore, there were inevitably
disadvantages such as the failure of the project implementation unit to implement the
responsibility and the reimbursing expenses on time. After the Third Plenary Session
of the 11th Central Committee, in order to avoid the shortcomings of the construction
department responsibility system, the Ministry of Foreign Economic Relations, in
A The four principles of foreign aid include: First, follow the principle of unity, friendship, equality and mutual benefit. Respect each other’s sovereignty. Do not interfere in each other’s internal affairs. Do not attach any political conditions. Do not require any privileges; Second, starting from the actual needs and possible conditions of both parties, exerting their respective strengths and potentials, striving for less investment, short construction period, quick results, and good economic returns; Third, the methods can be varied and tailored to local conditions, including providing technical services, training technology and management personnel, conducting scientific and technological exchanges, contracting projects, cooperative production, joint ventures, and so on. The Chinese side is responsible for compliance, quality assurance, small profits, and righteousness for the cooperation projects undertaken. Experts and technicians sent by the Chinese side do not require special treatment; Fourth, the purpose of the above cooperation is to learn from each other’s strengths and help each other in order to enhance the self-reliance of the two sides and promote the development of their respective national economies.
4. China’s Foreign Assistance to Asian Countries
85
accordance with the spirit of the national economic system reform, tried to implement the
investment contracting system and contract responsibility system, exploring the use of
economic and administrative means to manage economic aid projects.
During this period, China’s assistance to Asian countries was significantly reduced.
Due to Vietnam’s anti-China policy, China’s assistance to Vietnam was resumed after the
normalization of relations between the two countries in 1991. In 1992, China signed an
economic and technological cooperation agreement with Vietnam to provide Vietnam with
an interest-free loan of 80 million yuan. As Laos followed Vietnam’s anti-China policy,
China also stopped aid to Laos until February 1990 when it resumed aid and promised to
provide Laos with 2 million yuan in aid. Due to Vietnam’s invasion of Cambodia, China’s
assistance to Cambodia was suspended in January 1979. Until November 1989, China
promised to provide 3 million yuan in emergency assistance to Cambodia, and China’s
assistance to Cambodia was restored.A
4.2.5 Reform Stage of China’s Aid to Asia (1995-Present)In the 1990s, with the end of the Cold War, the former Soviet Union and Eastern
European countries successively abandoned the socialist system and promoted economic
restructuring with the goal of privatization, liberalization, and marketization. The wave
of economic marketization has swept the whole world and has had a huge impact on
developing countries. While accepting foreign aid, developing countries are eager to
attract more foreign investment, develop foreign trade, increase income and employment
and promote economic development. Economic liberalization and privatization in
developing countries urgently require China to reform its foreign aid approach.
In September 1995, the State Council issued the “Reply on Issues Concerning the
Reform of Foreign Aid Work” and made specific instructions on the reform of foreign
aid. The foreign aid reform mainly includes the following contents: mainly expanding
the scale of government discount loans and increasing the proportion of free aid in the
aid structure; focusing on the small and medium-sized production projects needed by
A Zhang Yuhui. Foreign Aid Study of China [D]. CPC Central Party School, 2006.

China Development Report on South-South Cooperation 2017
86
recipient countries in project selection; promoting foreign aid projects in aid mode of
joint venture and cooperation; in terms of funding channels, the government’s foreign
aid funds will be combined with bank loans, and the funds of relevant enterprises will
be appropriately absorbed into the implementation of foreign aid projects. In addition to
the implementation of the interest-free loan agreement that has been signed, China will
generally no longer provide new interest-free loans to recipient countries.
At the end of 2004, a severe earthquake and tsunami disaster occurred in the Indian
Ocean, causing heavy losses to Southeast Asian and South Asian countries along the
coast. After the disaster, China immediately provided a large amount of emergency
humanitarian assistance to the countries concerned. According to statistics, China had
provided a total of 66.38 million yuan of cash assistance to the affected countries plus
material assistance worth 21.63 million yuan. What is more worth mentioning is that in
this assistance, the non-government forces were widely involved, and their donations
were uniformly accepted by the Chinese Red Cross Society and the local Red Cross
Society, the China Charity Federation and local charities. As of June of 2005, the total
amount of private assistance had reached 4.9794 trillion yuan. Since January 2005, at
required by the affected countries of Indian Ocean earthquake and tsunami, China helped
build simple schools, earthquake monitoring and tsunami warning systems in Indonesia,
and build simple house in Thailand, repair Sri Lankan fishing docks, and build Maldivian
residential houses. In 2010, Pakistan suffered from a rare historical flood. According to
the needs of the Pakistan, China participated in post-disaster reconstruction in the areas of
disaster relief and transportation infrastructure. China provided cash assistance supporting
the Pakistani government’s “Compensation Plan for Victims”, and also undertook the
restoration of the national highway network of 340 kilometers in the affected area.A
During this period, China’s multilateral assistance to Asian countries increased
significantly. The Asian Development Bank is also an important platform for China to
implement multilateral foreign aid. Since joining the Asian Development Bank, China not
only obtained development funds, but also has donated funds to the intergovernmental
A The information comes from the Department of Foreign Aid of the Ministry of Commerce of the People’s Republic of China, http://yws.mofcom.gov.cn/article/c/201512/20151201214720.shtml.

4. China’s Foreign Assistance to Asian Countries
87
financial development institutions that have made poverty alleviation as the primary
strategic goal, and promoted infrastructure construction and regional development in Asia.
After entering the new century, China’s contribution has increased significantly. In 2004,
China donated $30 million to the Asian Development Fund of the Asian Development
Bank, and then decided to donate an additional $20 million to the Asian Development
Bank and set up a special fund for poverty alleviation and regional cooperation in China
at the Asian Development Bank to support poverty alleviation and regional cooperation
in the Asia-Pacific region. In addition, China has strengthened its cooperation with the
Asian Development Bank, the most representative of which is the Greater Mekong Sub-
region (including Myanmar, Vietnam, Thailand, Laos and Cambodia) and the Central
Asian Economic Cooperation Project which strengthen assistance to relevant countries
and regions.A
By the end of 2009, China had aided 30 Asian developing countries, and the total
amount of assistance provided reached 84 billion yuan. From 2010 to 2012, Asia remained
the main area for China’s foreign aid. China’s aid scale continued to increase, with a total
aid amount of 27.2 billion yuan. At the same time, China has repeatedly announced a
series of foreign aid measures related to Asian countries at the United Nations High-level
Meeting on Financing for Development, the UN High-level Meeting on the Millennium
Development Goals, the China-ASEAN Leaders Meeting, and the China-Pacific Island
Countries Economic Development Cooperation Forum. Moreover, China’s assistance to
Asian countries has entered a new period of development.
4.3 Characteristics of China’s Assistance to Asian Countries
4.3.1 Scale and Scope of AssistanceIn the 21st century, China’s diplomacy has demonstrated a new situation. China
has always adhered to the principle of being good neighbors and partners, deepening
mutually beneficial cooperation, and vigorously expanding good-neighborly and friendly
A Lu Guangsheng, Xiong Xin. China’s Assistance to the Countries of the Greater Mekong Subregion[J]. Public Diplomacy Quarterly 2011(8):39-45.

China Development Report on South-South Cooperation 2017
88
relations with neighboring countries, striving to make its own development better benefit
the surrounding countries.
Asian countries have always been the main area of aid from China. Soon after the
founding of People’s Republic of China, it began to aid neighboring Asian countries.
According to the White Paper on China’s Foreign Aid 2011, as of the end of 2009, China
has helped 161 countries and more than 30 international and regional organizations.
There are 123 developing countries that regularly receive Chinese assistance, including
30 countries in Asia. China’s accumulated external assistance amounted to 256.29 billion
yuan, of which 106.2 billion yuan was for free assistance, 76.54 billion yuan for interest-
free loans, and 73.55 billion yuan for preferential loans, of which 32.8%A were invested in
Asia. In the Foreign Aid of China 2014 white paper, from 2010 to 2012, China aided 121
countries, including 30 countries in Asia; China’s foreign aid amounted to 89.34 billion
yuan, of which 30.5%B of aid funds flowed to Asia.
China’s assistance to Asian countries fully reflects China’s role as a responsible
big country. On the one hand, China’s assistance to Asian countries has promoted
the historical process of the national liberation movements of neighboring countries,
safeguarded peace and stability in the Asian region, and supported the economic and
social development of neighboring countries. On the other hand, China’s assistance to
Asian countries has also won a good development environment for itself and contributes
to the common development of China and its neighbors.
4.3.2 Main Approaches of AidAccording to the classification in the White Paper of Foreign Aid of China 2011,
there are eight kinds of foreign aid approaches in China, including complete sets of
projects, general materials, technical cooperation, human resources development
A State Council Information Office of the People’s Republic of China. Foreign Aid of China 2011 [M]. Beijing: People'’s Publishing House, 2011.
B State Council Information Office of the People’s Republic of China. Foreign Aid of China 2014 [M]. Beijing: People'’s Publishing House, 2014.

4. China’s Foreign Assistance to Asian Countries
89
cooperation, foreign aid medical teams, emergency humanitarian assistance, foreign aid
volunteers and debt relief. These eight forms of foreign aid are carried out in aid to Asia.
The complete set of projects is the most important form of aid, and the proportion of
general material assistance and emergency humanitarian assistance is also significant.
1. Complete sets of projectsComplete project assistance is China’s most important means of assistance to Asia.
In this way, China has built a large number of infrastructures in Asian countries, including
road traffic, energy facilities and civil infrastructure. Among them, railway construction
projects are the most mature.
In December 2016, Friendship Bridge, which was built in the Maldives, officially
started construction. The China-Malaysia Friendship Bridge is the largest infrastructure
project of Malaysia to date and is also a landmark project of China-Malaysia in the “21st
Century Maritime Silk Road” field. The bridge will become an important link between
the two countries and will surely benefit people of the two countries and promote peace,
stability and prosperity in the region.A
In addition to railway construction projects, China’s hydropower project construction
projects in Myanmar have also achieved great success. The largest hydropower station
built by China in Southeast Asia, the Banglang Power Station is also the largest in
Myanmar, of which the last generating unit was hoisted on February 14, 2005. The
Banglang Power Station project started construction in 1999 with a total installed capacity
of 280,000 kilowatts. There are 4 generator sets with an annual generating capacity of
910 million kW·h. In January 2007, development and operation joint venture agreement
of Myanmar Shweli I Hydropower Station was signed in Naypyidaw, Myanmar, which is
China’s first hydropower BOT project invested in Myanmar. The Shweli I Hydropower
Station project has an annual generating capacity of 4.033 billion kWh, and will send
electricity to Myanmar and China after completed.
As China’s infrastructure assistance to Asian countries matures, China has begun
A The information comes from the Department of Foreign Aid of the Ministry of Commerce of the People’s Republic of China, http://yws.mofcom.gov.cn/article/c/201601/20160101225870.shtml.

China Development Report on South-South Cooperation 2017
90
to turn to large-scale projects such as roads and hydropower, and has begun to turn to
civilian infrastructure projects that assist local residents. From 1996 to 2002, the Chinese
government had digged 1,000 water wells for civilian in rural areas of Cambodia for free,
and solved the problem of drinking water for more than 200,000 people. On December 2,
2010, the handover ceremony of Mongolian National Stadium project assisted by China
was held. China once built a gymnasium for Mongolia in 1958 and built the first modern
gymnasium in Mongolia this time and received thanks from representatives from all
walks of life in Mongolia.A
2. General materialsGeneral material assistance is mainly carried out in cooperation with the construction
of complete sets of projects. The materials provided involve mechanical equipment,
medical equipment, testing equipment, transportation equipment, office supplies, food,
medicine and many other fields.
For example, on August 5, 2008, the handover ceremony of the Uzbekistan excavator
project assisted by Chinese government was held in Tashkent, the capital of Uzbekistan.
This is also another batch of water conservancy and soil improvement machinery and
equipment that the Chinese government has provided to Uzbekistan under the aid of
free aid and preferential loans in recent years, which has played an important role in the
development of Uzbekistan.
In 2013, China donated $6.57 million to the United Nations World Food Program
(WFP), and invested $1 million in WFP “Bangladesh National Plan”, of which $500,000
was used to purchase food for local extremely poor people and the remaining $500,000
is spent on the vulnerability protection program, which is expected to help 200 extremely
poor women out of poverty. China donated $1 million to North Korea to invest in
the WFP “Continuous Disaster Reduction and Recovery Plan”. WFP used the above
donations to purchase 834 tons of cooking oil, of which 540 tons of cooking oil were
distributed directly to about 615,000 orphans and pregnant women, and the remaining 294
A The information comes from the Department of Foreign Aid of the Ministry of Commerce of the People’s Republic of China, http://yws.mofcom.gov.cn/article/b/201012/20101207292973.shtml.

4. China’s Foreign Assistance to Asian Countries
91
tons of cooking oil were used to make biscuits, which can be supplied to approximately
112,000 students for 13 consecutive months.A
On September 12, 2014, the ceremony for the signing of the 200 ambulances for
China’s assistance to Cambodia was held in Phnom Penh. Many hospitals in Cambodia,
especially in remote areas, urgently need ambulances to improve the efficiency of
transshipment. The 200 ambulances assisted by China will greatly enhance the emergency
treatment capacity of Cambodian hospitals, play a key role at key moments, and reflect
the Chinese people’s deep friendship with the Cambodian people.B
3. Technical cooperationTechnical cooperation is an important means of cooperation for China to help
recipient countries enhance their capacity for independent development. The hybrid
rice breeding and planting techniques invented by Academician Yuan Longping have a
wide range of influences. At present, Yuan Longping’s hybrid rice varieties have been
successfully planted in Vietnam, Indonesia and Philippines, becoming most influential
technical support project of China in Southeast Asia. In early 2005, Academician Yuan
Longping also implemented a rice trial project in Malaysia. He introduced several rice
varieties in Malaysia for trial production to screen high-yield varieties, and conducted
hybridization tests between imported varieties and local varieties to cultivate rice varieties
that are truly suitable for Malaysia’s climate and soil.
In January 2008, the first phase of China’s aid to East Timor hybrid rice agricultural
technology cooperation was officially launched. As of June 2015, the two parties have
implemented a total of three phases projects, which will be implemented by Yuan
Longping Agricultural High-Tech Co., Ltd. Since the project was launched, the two
sides have carried out a series of cooperation in the fields of high-yield cultivation
demonstration of hybrid rice, seed breeding trials, large-scale demonstration and
A The information comes from the Department of Foreign Aid of the Ministry of Commerce of the People’s Republic of China, http://yws.mofcom.gov.cn/article/u/201510/20151001146615.shtml.
B The information comes from the Department of Foreign Aid of the Ministry of Commerce of the People’s Republic of China, http://yws.mofcom.gov.cn/article/b/201510/20151001150072.shtml.

China Development Report on South-South Cooperation 2017
92
promotion, technical training and agricultural planning consultation. With the help of
the China, the planting area of Chinese hybrid rice in East Timor has been continuously
expanded, and a total of more than 2,000 hectares have been planted; there is a bumper
harvest every year, and the output per hectare is increased from 3.5 tons in 2010 to
the current 5 to 7 tons. China’s new breeding, throwing and other agricultural planting
techniques have been displayed and recognized and welcomed by local farmers; China’s
new agriculture machinery has been demonstrated, applied and promoted; hybrid rice
seeds have been successfully produced and produced. The Chinese side has established an
agricultural laboratory for the East Timor Ministry of Agriculture to monitor soil fertility
for 8 years. Chinese agricultural experts have also trained more than 3,000 agricultural
technicians and farmers for East Timor, and trained more than 500 agricultural and
technical personnel. In order to carry out this cooperation project, the Chinese government
has sent dozens of Chinese agricultural experts to East Timor.A
4. Human resources development cooperationChina began implementing human resources development cooperation projects
in 1953. In 2005, the Ministry of Commerce held 229 foreign aid training courses
throughout the year, training 5,667 various talents involving training courses for Asian
countries, including ASEAN national tourism officials training courses, ASEAN
national e-commerce officials training classes, ASEAN countries SME development
training Class, ASEAN national measurement standards officials training class, national
customs officer training course in the Greater Mekong river basin, national inspection
and quarantine department training course in the Greater Mekong River Basin, ASEAN
agricultural new technology training course, Philippine rice technology training course
(foreign class), etc. After that, 50 training classes were added to train 1,470 talents of
various types in developing countries, including ASEAN countries’ telecom terminal
equipment technical assessment seminars.
In 2006, the Foreign Aid Department of the Ministry of Commerce held two
A The information comes from the Department of Foreign Aid of the Ministry of Commerce of the People’s Republic of China, http://yws.mofcom.gov.cn/article/zt_obor/subjecte/201512/20151201214663.shtml.
4. China’s Foreign Assistance to Asian Countries
93
seminars for officials of the “Investment Promotion Seminar” and “Trade and Economic
Cadre Seminar” using foreign aid training funds. North Korean officials who participated
in the training said that they have broadened their horizons and increased their knowledge
by participating in the training, and they have benefited a lot. At the same time, they also
expressed their gratitude to the organizers for their thoughtful arrangements in terms of
training and living.A
In 2009, the Ministry of Commerce held 226th multi- and bilateral training courses
under the aid of foreign aid training, involving projects in Southeast Asia, including the
ASEAN national botanical garden and advanced development seminar on sustainable
development, ASEAN national road network construction planning and urbanization
traffic seminars, ASEAN national education officials seminars, ASEAN countries
economic management seminars, China-ASEAN economic and trade relations seminars,
etc. The participants in the training course not only learn relevant professional knowledge,
but also participate in the activities of China and ASEAN. On the one hand, they promote
communication between the two countries, on the other hand, they introduce the social
situation in Southeast Asia to Chinese society.
Furthermore, China and ASEAN also launched the “Double 100,000 Student
Mobility Plan” in 2010. In the long run, as international students gradually become the
backbone of society, their understanding of China’s feelings and culture will gradually
exert influence in society. This is also an important channel for the people of the recipient
countries to understand China.
5. Foreign aid medical teamsThe foreign aid medical team generally works in backward areas of aided countries
where lack medical care and medicine and conditions are very difficult. The foreign
aid medical team cured a large number of common diseases and frequently-occurring
diseases, and used acupuncture, massage and integrated Chinese and Western medicine
diagnosis and treatment methods to diagnose and treat many difficult and serious diseases,
A The information comes from the Department of Foreign Aid of the Ministry of Commerce of the People’s Republic of China, http://yws.mofcom.gov.cn/article/b/200701/20070104269152.shtml.

China Development Report on South-South Cooperation 2017
94
saving many dying patients’ lives. The foreign aid medical team also taught medical
technology to local medical staff, which promoted the improvement of local medical and
health standards. With the exquisite medical skills, good medical ethics and a high sense
of responsibility and mission, the foreign aid medical team had fully served the people
of the recipient countries and won the respect and praise of the recipient government and
people.
On April 27, 2015, within two days after the earthquake in Nepal, the first 60
members of the Chinese government medical team arrived in the Dulik area of Nepal
to carry out rescue work. Within 13 days, the medical team treated 694 injured people
and conducted 2,603 medical visits. The Chinese government medical and epidemic
prevention team consisting of 59 people also went to the earthquake-stricken area in
Nepal on April 29 to carry out post-disaster medical epidemic prevention and rescue. The
Chinese Red Cross International rescue team, the Chinese National People’s Liberation
Army Chengdu Military Region national earthquake rescue team and medical team, and
more than ten Chinese civilian rescue teams also rescued disasters in Nepal.A
In this rescue, China sent a total of 1088 rescue forces, 8 rescue forces including
international rescue team, air force transport unit, helicopter unit, medical and epidemic
prevention team, transportation unit, etc. 8 transport aircraft, 3 helicopters and 190
construction machinery were used to participate in the rescue. The rescue team searched
and rescued 2 survivors, transported 22 people who were trapped, treated 2,387
people, excavated 18 bodies of victims, anti-epidemic washout 800,000 square meters,
transported aid materials 416 tons by air, and opened up road for 36 kilometers. This
is also the largest scale of China’s international humanitarian relief operations since
1949. At the International Rescue Coordination Meeting held by Nepal with China,
the United States, Britain, Germany and Indonesia, the Nepal government commented
that the Chinese government medical team was the earliest, best-cooperating and most
contributing medical team.
On May 26, 2015, the donation ceremony for the 2015 Chinese medicine aid to the
A The information comes from the Department of Foreign Aid of the Ministry of Commerce of the People’s Republic of China, http://yws.mofcom.gov.cn/article/c/201512/20151201214720.shtml.

4. China’s Foreign Assistance to Asian Countries
95
East Timor Medical Team was held at the National Hospital of Timor-Leste. Since 2004,
the Chinese government has dispatched six batches of medical teams to East Timor, more
than 70 person-times, treating more than 200,000 patient-times, and donating 12 batches
of medical equipment to the East Timor, worth more than $700,000. Chinese medical
team members carried forward the spirit of internationalism, saved lives in East Timor,
and made positive contributions to promoting the friendship between China and East
Timor.A
6. Emergency humanitarian assistanceIn recent years, China has provided nearly 100 batches of emergency relief materials
for natural disasters such as the Indian Ocean tsunami, the Japanese earthquake, the Haiti
earthquake, the Cambodian catastrophic flood, the Myanmar earthquake, and the Pakistan
flood. China actively participates in external emergency rescue operations and plays an
increasingly important role in the international emergency humanitarian rescue cause. It
has been highly recognized by the international community and fully demonstrates the
image of the Chinese government as a responsible big country.
On December 26, 2004, an earthquake of magnitude 8.7 occurred off the coast of
Sumatra, Indonesia, and caused a large-scale tsunami. Many countries in Southeast Asia
and South Asia were severely attacked by the earthquake and tsunami, and Indonesia
was the worst. On the third day after the disaster, the Chinese government announced
that it would provide 21.63 million yuan of materials and cash assistance to the affected
countries. The 35-member China International Rescue Team organized by the State
Seismological Bureau took a charter flight from Beijing and arrived in the Indonesian
disaster area and started rescue work on the evening of 30th. Since then, the Chinese
government has repeatedly increased the scale of aid, eventually reaching 690 million
yuan (equivalent to $83 million), which is China’s largest foreign aid to date. The
Ministry of Health also organized 15 epidemiological and infectious medical personnel
from Shanghai to arrive in Phuket, and organized 12 thaumaturgical medical personnel
A The information comes from the Department of Foreign Aid of the Ministry of Commerce of the People’s Republic of China, http://yws.mofcom.gov.cn/article/b/201512/20151201214892.shtml.
China Development Report on South-South Cooperation 2017
96
from Guangdong Province to help Thailand.
On November 14, 2006, the Chinese government provided Philippine government
with typhoon relief materials worth 5 million yuan, including 930 tents, 3,000 mattresses,
3,000 sheets and 3,000 towels. On December 5, 2006, Chinese Ambassador to the
Philippine, Li Jinjun handed over the $200,000 cash assistance provided by the Chinese
government to Philippine Foreign Minister Romulo for the disaster area of typhoon
“Durian”.
In May 2008, after a severe tropical storm in Myanmar, the Chinese government
immediately provided the Myanmar government with $500,000 cash assistance and
$500,000 in humanitarian emergency supplies on May 3. On May 8, the Chinese
government decided to provide another 30 million yuan in assistance to the Myanmar
government.
In 2010, Pakistan suffered from a rare historical flood. The Chinese government
quickly launched a multi-channel and all-round rescue operation, and participated in post-
disaster reconstruction in the areas such as victim rescue, disaster relief and transportation
infrastructure in accordance with the needs of the Pakistan. China provided cash
assistance to support the Pakistan government’s “compensation plan for the victims”.
China had undertaken a 340-kilometer national highway network repair project in the
affected area, with a radiation benefit of 150 million people.
7. International volunteers The earliest international volunteers of China came from volunteer organizations of
the United Nations. Since the 1980s, China has also begun to send volunteers overseas,
mainly to provide services in Chinese language teaching in Southeast Asia.
In May 2002, China dispatched five young volunteers to Laos for the first time, and
launched a half-year volunteer service in the fields of education and health care.
On December 24, 2002, six volunteers went out of China to Myanmar to teach
Chinese. After half a year, two of them returned to China as planned. The other four
continued to work in Myanmar until the end of December 2003.
Since 2006, the school of foreign languages of Guangxi University for Nationalities

4. China’s Foreign Assistance to Asian Countries
97
has selected Chinese language teacher volunteers from non-universal language majors,
Chinese as a foreign language and Chinese language literature majors to work in
Southeast Asia for Chinese language promotion. In 2008, 38 Chinese language teacher
volunteers were sent to Thailand and 24 to the Philippines for volunteer service. In 2009,
more 87 and 29 volunteers were sent to Thailand and Philippines respectively.
In July 2006, 15 foreign aid volunteers dispatched to Myanmar successfully
completed a half-year volunteer service and returned to the motherland. These 15
volunteers dispatched to Myanmar were composed of 11 agricultural technicians and 4
sports professionals. The volunteers arrived in Myanmar in January 2006 to carry out
volunteer work in agricultural science and technology development and sports training.
In the spirit of “dedication, friendship, mutual assistance, progress”, they overcame the
difficulties of hot and humid climate, difficult conditions and language barriers, gave full
play to their professional skills, united and cooperated with the Myanmar personnel, and
successfully completed the task, which won the high praise of the Myanmar and made
new contributions to the friendship between China and Myanmar.A
8. Debt reliefDebt relief refers to China exempting some developing countries from repaying
government debt to China. The Chinese government has never imposed repayment
pressure on the debts of the recipient countries. When the recipient country encounters
difficulties in repaying the interest-free loan, the Chinese government has always adopted
a flexible approach to extend the repayment period through bilateral negotiations.
In order to further alleviate the debt burden of countries with financial difficulties,
since 2002, China has implemented the “Asia Debt Relief Program”, which reduced all
of Cambodia’s debts due in 2002, and reduced Laos’ three interest-free loan debts due
in 2003 and Laos government’s interest-free loan debts in 2004. Also, Myanmar’s two
interest-free loans due to China expired in 2001 was reduced in 2003. In 2010, China also
exempted Cambodia from more than $200 million debt. China’s debt relief actions have
A The information comes from the Department of Foreign Aid of the Ministry of Commerce of the People’s Republic of China, http://yws.mofcom.gov.cn/article/b/200607/20060702735318.shtml.

China Development Report on South-South Cooperation 2017
98
alleviated the debt burden of the economically backward countries in the Greater Mekong
Subregion, which is an inherent requirement of the responsibility and obligation of the
big country, and an important way for China to declare its identity as a big country, fully
demonstrating the image of a responsible big country.
4.3.3 Focus Areas of AssistanceChina’s economic and technical assistance projects for Asian countries are mainly
distributed in the fields of agriculture, industry, economic infrastructure, public facilities,
education and health care, focusing on helping recipient countries to improve industrial
and agricultural production capacity, strengthening the foundation of economic and social
development, and improving the foundation education and medical conditions. Among
them, agriculture, industry, economic infrastructure and public facilities are the key areas
of China’s assistance to Asian countries.
1. AgriculturalChina makes promoting agriculture and rural development in developing countries
and alleviation of poverty as priority areas for foreign aid. The contents of agricultural
assistance mainly include: construction of farms, agricultural technology demonstration
centers, agricultural technology test stations and extension stations; construction of
farmland water conservancy projects; provision of agricultural machinery, agricultural
product processing equipment and related agricultural materials; dispatching agricultural
technicians and senior agricultural experts to teach agricultural production. Technology
and advice on agricultural development; training of agricultural talents for recipient
countries, etc. The agricultural projects aided by China have promoted the development
of agricultural production in recipient countries, increased the output of food and cash
crops, and provided raw materials for the development of light industry.
At present, bilateral cooperation in agriculture between China and Asian countries
is mainly based on intergovernmental cooperation. By the end of 2014, China had signed
bilateral agricultural cooperation agreements with more than 20 Asian countries including
India, the Philippines, Myanmar, Kazakhstan and Pakistan. Under the framework of

4. China’s Foreign Assistance to Asian Countries
99
bilateral cooperation, China has mainly carried out agricultural technology demonstration
projects with ASEAN and Central Asian countries; has exchanged seeds, seedlings and
animal breeding materials; has exchanged experts, scholars and technicians, and carried
out agricultural research, scientific investigations and management personnel training and
other exchange activities.
2. IndustryIndustrial assistance occupied an important position in the early stage of China’s
foreign aid. From the 1950s to the 1970s, China helped many independent Asian
countries to build a number of industrial projects, which laid the foundation for the
industrial development of recipient countries. Many projects filled the gaps in the national
industries of recipient countries. For example, from 1956 to 1957, China donated a total
of 8 million pounds of materials to Cambodia to provide materials to construct textile
mills, plywood factories, paper mills, cement plants and other complete sets of projects.
From 1964 to 1970, China assisted Cambodia to build industrial facilities such as the
Battambang Textile Factory, the Glassware Factory, and the Cambodia Cement Plant. In
1961, China provided a long-term interest-free loan of 30 million pounds to Myanmar
in accordance with the agreement, and assisted the Meiktila Textile Mill, Ruidong Paper
Mill, Bilin Sugar Refinery, Brush Plywood Factory and other complete industrial projects.
Industrial aid developed rapidly in the 1970s and was once one of the important
components of China’s complete project assistance. Since the mid-to-late 1980s,
the privatization process of many developing countries has accelerated, and China’s
assistance to this area has gradually decreased. The industrial projects aided by China
have played a positive role in promoting the production and economic development of
recipient countries, increasing employment and taxation, and prospering the market.
3. Economic infrastructureEconomic infrastructure construction has always been an important part of China’s
foreign aid. Although aid funds are limited, China has fully utilized the advantages of
mature technology and relatively low labor costs to help other developing countries build
China Development Report on South-South Cooperation 2017
100
a number of infrastructure projects such as transportation, communications and electricity.
Since the 1980s, China has built total six friendship bridges to Bangladesh. For
Bangladesh who has a dense river network, these friendship bridges have played an
important role in promoting local economic development and improving people’s
livelihood.
On December 12, 2009, Chinese Vice President Xi Jinping visited Cambodia. The
two countries signed 8 projects worth $400 million, including Highway 5 expansion
project, 6A highway expansion project, Da Jin Ou Bridge and Connected Highway
Project, Phnom Penh Port Terminal Expansion Project, Highway 41 Construction Project,
Bodhisattva River Water Conservancy Development Project (mainly No. 3 and No. 4
dams), rural transmission grid project and Oudon Stadai Water Conservancy System
Project.
On December 15, 2015, Maldivian President Yaming and Chinese Ambassador to
the Maldives Wang Fukang went to Lamu Atoll, south of Maldives, laying the foundation
for the Chinese government’s assistance to the Maldives Lamu Atoll Connected Highway
Project. The project is a new achievement of cooperation between the two countries under
the framework of the 21st Century Maritime Silk Road. And it will become a real road of
cooperation, development and friendship after complement.A
There are still many infrastructure projects that China has built in Asia, such as
the Sanaa-Holland Highway in Yemen, the Karakoram Highway and Gwadar Port
in Pakistan, the Laos section of the Kunming Highway, the Greater Mekong Sub-
region Information Highway in Myanmar, Tajikistan Projects Shar-Shar Tunnel and the
Cambodia Highway 7. These infrastructure assistance projects have improved the living
and production environment of recipient countries and created better conditions for the
economic and social development of recipient countries.
4. Public facilitiesPublic facilities are a distinctive area of China’s foreign aid. The public facilities
A The information comes from the Department of Foreign Aid of the Ministry of Commerce of the People’s Republic of China, http://yws.mofcom.gov.cn/article/b/201510/20151001151583.shtml.

4. China’s Foreign Assistance to Asian Countries
101
projects aided by China mainly include municipal facilities, civil buildings, well water
supply, conference buildings, sports venues, cultural venues, and science and education
facilities.
On January 5, 2009, the handover ceremony for the completion of Mongolian
Chamber of Commerce and Industry building assisted by Chinese government was held
in Ulaanbaatar. The project covers an area of 1.04 hectares with a total construction
area of 5,340 square meters. It is the office for the Mongolian Chamber of Commerce
and Industry and the venue for exhibition. Mongolia is grateful to China for its free
assistance.A
On October 19, 2010, the Cambodian government office building, which was built
by China, was officially opened. The main function of the building is state-level concierge
reception, press release, conference, office, etc. The building area is 33,970 square meters,
which is a smart, energy-saving, green-type integrated office building. This building is not
only a landmark project for China’s aid building in Cambodia, but also a monument to
China-Cambodia friendship. It was named “Friendship Building” by the Prime Minister
of the Cambodian government.
In June 2010, China held a handover ceremony for the Myanmar International
Conference Center project. The Myanmar International Convention Center is located
in Naypyidaw, the new capital of Myanmar. The total construction area of the project
is about 30,000 square meters. It mainly includes a large international conference hall
capable of 1900 seats, various small and medium-sized conference halls, banquet halls,
office buildings and other auxiliary housing, which will become an important venue for
various meetings in Myanmar. This conference center is currently China’s largest package
of aid projects to Myanmar.
A The information comes from the Department of Foreign Aid of the Ministry of Commerce of the People’s Republic of China, http://yws.mofcom.gov.cn/article/b/200901/20090105995614.shtml.

China Development Report on South-South Cooperation 2017
102
4.4 Economic and Social Effects of the Assistance
4.4.1 Foreign Aid and Economic Growth of Recipient CountriesThe impact of China’s foreign aid on the economic growth of recipient countries can
be divided into direct and indirect aspects.
1. Direct ImpactsThe direct impact is mainly achieved through the aid of infrastructure. Infrastructure
construction can improve production and living conditions internally, and can optimize
the investment environment externally, thus creating better conditions for social and
economic development. China’s domestic infrastructure construction has made the
wings for China’s reform and opening up. It is based on domestic experience that China
put a lot interest in infrastructure of foreign aid. China’s assistance to Asian countries’
infrastructure mainly involves transportation, energy, information and other aspects, and
has played a positive role in the economic development of recipient countries.
Taking Southeast Asian countries as an example, most Southeast Asian countries
have weak economic foundations. In the process of economic construction, there are
problems of backward technology, insufficient funds, and lack of talents, which have
become the bottleneck restricting economic development. China’s generous assistance
to these countries has greatly helped the recipient countries to develop their economies,
improve their living standards, and enhance their self-reliance and support for the
economic growth of Southeast Asian countries. During the Asian economic crisis of
1997, China’s assistance to Southeast Asian countries helped these countries tided over
the difficulties and stabilized the regional economic situation. China’s repeated debt relief
for many countries in Southeast Asia has also eased the burden of economic development
in these countries. In 2012, China helped hundreds of Southeast Asian countries build
various projects which have greatly improved the infrastructure of recipient countries,
effectively improved national income and quality of life, and effectively promoted local
economic development. While helping the recipient countries to complete the project,
China also trains local personnel to master the technology and manage the operation.

4. China’s Foreign Assistance to Asian Countries
103
2. Indirect ImpactsThe indirect impact mainly shares development experience and practical technology
with other developing countries, to help developing countries cultivate talents and
enhance the hematopoietic function of independent development through technical
cooperation, human resources development cooperation, and volunteer services. The
lack of technology and talents constrains the economic development of Asian countries,
and technical cooperation and talent exchange are important means to improve this
situation. China and most of Asia’s recipient countries are both developing countries.
China’s technology and experience are more acceptable and practical to other developing
countries, and the enthusiasm of cooperation between the two sides is very high.
Taking the promotion of hybrid rice as an example, China based on the bases
of Hunan and Hainan provinces, under the guidance of the “going out” strategy, has
extensively carried out hybrid rice aid project with Indonesia, Vietnam, the Philippines,
Uzbekistan, Cambodia, Brunei and other countries. The aid project has established
hybrid rice demonstration bases in these countries to display and promote Chinese
hybrid rice technology, which has achieved great success. With the approval and funding
of the Ministry of Science and Technology of China, Hunan province has organized
a number of technical training courses such as “hybrid rice technology” “pesticide
application technology” and “tea cultivation and processing technology” for developing
countries, which has effectively promoted the development of foreign aid for science and
technology.
4.4.2 Foreign Aid and Social Development in Recipient CountriesSocial development includes many aspects. The focus here is on the impact of
China’s social development on Asian countries in terms of poverty alleviation and
environmental protection in recipient countries.
1. The poverty alleviation of recipient countries It is the main content of China’s foreign aid to Support other developing countries
to reduce poverty and improve people’s livelihood. Aid for Trade can help poor countries

China Development Report on South-South Cooperation 2017
104
implement development strategies, and ensure that export growth benefits benefit poor
areas and people through employment; infrastructure assistance can improve the local
economic development environment of recipient countries; technical cooperation provides
economic development with technical support, which all plays a positive role in the
economic development of recipient countries, thus driving the economic development of
recipient countries and reducing poverty. Moreover, China also supports the construction
of people’s livelihood in recipient countries, promotes agricultural development in
recipient countries, improves education, improves medical services, and builds social
welfare facilities. China also exchange experience about poverty alleviation with recipient
countries, and shares the direct experience of itself’s development problems with the use
of foreign aid funds, improving the effectiveness and efficiency of aid.
The most typical project in terms of increasing income and reducing poverty is
poppy alternative cultivation. Located in the border area of Thailand, Myanmar and
Laos, the “Golden Triangle” region is famous for its drugs and is the world’s largest
poppy plantation area. The Chinese government has devoted a lot of manpower, material
resources and financial resources, and anti-drug struggle finally ended with good results.
However, the cost is heavy and drugs are not completely banned. In order to eliminate
drugs from the source, China began to assist to cultivate alternative plantation of
poppy in Myanmar and northern Laos since 1990. After 2000, the State Council gave
special preferential policies for the market access for agricultural products, reduced and
exempted import tariffs and import value-added tax for alternative agricultural projects,
and proposed a goal of radically eradicating drugs from Myanmar and northern Laos in
10 to 15 years. At the same time, it proposed that it would increase financial and credit
support, and an annual special fund of 50 million yuan would be arranged to support the
replacement of overseas poppy plants in 2006 to 2009. According to the overseas poppy
alternative cropping work conference held in Kunming in September 2010, as of August
2010, more than 100 enterprises in Yunnan province have carried out alternative planting
and developed alternative industries in Myanmar and northern Laos. In addition to
providing all kinds of grain and cash crop seeds and various economic seedlings for free
or at low price, Yunnan province also sent various experts and technicians to the banned
4. China’s Foreign Assistance to Asian Countries
105
areas to help train local professional and technical personnel.
China’s alternative planting in the north of Myanmar and north of Laos not only
effectively reduced the area of planted poppy, but also opened up new channels for local
residents to generate income. According to incomplete statistics, between 2006 and 2009,
the annual income per capita of the replacement project areas in Myanmar and northern
Laos increased from 200 yuan to about 1,000 yuan, of which the labor income increased
to 3,000 yuan. In addition, alternative planting companies have also built a number of
infrastructure facilities in these areas. According to statistics, since 2006, alternative
planting companies have built more than 3,000 kilometers of simple roads in Myanmar
and northern Laos, and have built 18 bridges, more than 500 kilometers of canals,
more than 30 pools, 6 new substations, 18 new schools, 13 new health centers and 13
health clinics, which have effectively promoted the construction of local transportation,
communication, water conservancy, tourism, trade and other infrastructure. These all
promoted the local economy and social progress, and greatly eased the vicious circle
of that the poor cultivate poppy and get poorer. China’s support has rapidly reduced the
number of poor people in Southeast Asia (only that of Cambodia has fallen by more than
20% between 1994 and 2008) and plays significant roles in the improvement of poverty
throughout Southeast Asia.
2. Environmental Protection in Recipient CountriesSince the infrastructure and energy facilities (power plants, power grids, etc.)
aided by China have always followed the environmental standards of China or recipient
countries, rather than the standards of developed countries, the environmental protection
issues in the Chinese government’s foreign aid projects have always been criticized by
western society. Since 2000, China has continuously raised environmental standards.
The Chinese Ministry of Environmental Protection adopted the Equator Principles in
January 2008, which shows that the Chinese government is paying more attention to
environmental issues and is directly reflected in China’s foreign aid. The Chinese Ministry
of Environmental Protection drafted environmental guidelines for China enterprises that
engaged in foreign aid and overseas investment business. As the largest fund financier

China Development Report on South-South Cooperation 2017
106
for China’s foreign aid, The Export-Import Bank of China issued new social and
environmental assessment guidelines in July 2008, as well as the Chinese government’s
“green credit” policy, which all reflects that Chinese government recognizes that it should
adopt a more responsible approach to foreign aid and protect the environmental protection
appeals of recipient countries.
On August 26, 2015, the official handover ceremony of Bangladesh Kazterke
Highway Bridge (the seventh bridge) aided by China was held in the Bangladesh
Ministry of Communications. The aided bridge project (Asmat Alihan Highway Bridge),
which is generally east-west and eastward across the Arierkan River, was built by Anhui
Construction Engineering Group Co., Ltd. The total length of the highway bridge is
4.96km, and the design of level-two road is equipped with complicated technology.
Since the start of construction, there have been no safety responsibility accidents and
environmental pollution accidents. The project takes “off-site landscape and on-site
standardization” as the management objective, and regards the beautification, purification
and greening of the construction site as the key points of civilized construction
management, ensuring that the construction site is clean and orderly, and the signs are
complete and eye-catching. In March 2015, Mr. Kader, the minister of Transport of
Bangladesh, inspected project on-site, and not only gave a high evaluation of the quality
of the project, but also greatly appreciated the whole construction site where the project
was safe, civilized and clean.
China attaches great importance to local environmental protection in the process
of assistance to Asian countries. It not only pays great attention to the environmental
protection issues of recipient countries in the foreign aid legislation, but also actively
promotes environmental responsibility at the enterprise level. At the same time, in the
specific implementation, China has provided environmental assistance to recipient
countries through aid projects, providing materials, and building capacity, and has
achieved significant results.

4. China’s Foreign Assistance to Asian Countries
107
4.5 Problems and Challenges China’s assistance to Asian countries started almost at the same time as the
establishment of People’s Republic of China. From the Aid-Vietnam Resist France War
and Korean war in the early days of People’s Republic of China, to the assistance of
national liberation movement of the Asian countries in the 1960s and 1970s, and then to
reformation the foreign aid mode after the reform and opening-up, and then increasing
aid to the least developed countries after the 21st century, China’s aid to Asian countries
has gone through more than half a century of ups and downs. China’s assistance to Asian
countries has guaranteed national security, expanded the diplomatic dimension, promoted
economic development, and strengthened national strength with also important strategic
diplomatic significance. China has paid enormous costs and national sacrifices in its
assistance to Asian countries. Therefore, the historical thickness and experience of foreign
aid is no less than that of any mature Western aid.
Although China has gained a lot of useful experience in the sixty years of assistance
to Asian countries, it has also learned many lessons of failure. China’s assistance to
Asian countries in the new era is still an important part of China’s diplomatic work. It
is an important manifestation for China to fulfill major responsibilities and international
obligations as a big country. It is also an important step for China to strengthen its
relations with neighboring countries and enhance its own strength. Nowadays, China’s
assistance to Asian countries still faces a series of problems and challenges. Whether it
can solve these problems smoothly and meet these challenges is of vital importance to
China’s success or failure in aid to Asian countries.
4.5.1 Democratic Participation in Foreign AidForeign aid that lacks democratic participation is hard to understand by the domestic
people in the implementation process. Due to the rapid development of the Internet,
ordinary people have a wide range of access to information. With the continuous
advancement of political civilization and the enhancement of civic awareness, people are
increasingly concerned about government affairs. Whenever the government announces

China Development Report on South-South Cooperation 2017
108
to provide financial assistance or debt relief to other Asian countries, there will always
be many voices of opposition. On the one hand, China is also a developing country, and
income per capita is still at a low level. On the other hand, many Asian countries have
anti-China actions or faults and are not worthy of assistance. China’s aid to other Asian
countries accounts for only a small portion of fiscal expenditure. Foreign aid is both a
cooperation with other countries and a responsibility for a big country. China’s assistance
to Asian countries is just and in line with its own interests. However, due to the lack of
democratic participation, the transparency of foreign aid in terms of purpose, content,
and use of funds has made ordinary people feel doubtful, and hence it has given some
opportunities for foreign hostile forces to take the opportunity to discredit China.
4.5.2 National Image in Foreign AidChina’s assistance to Asian countries is China’s initiative to help develop national
economy, strengthen social construction, and improve the welfare of the people.
It is China’s action to fulfill its international responsibility and show its national
image. However, China’s inappropriate practices in the aid process and the lack of
communication between the two sides led to conflicts. These contradictions can
undermine the effectiveness of China’s foreign aid, damage China’s national image, and
make the hard work of the previous-years greatly reduced or even lost. Therefore, China
must attach importance to the country image in foreign aid.
With the continuous opening up and the implementation of the “going out” strategy,
more and more Chinese companies have begun to participate in China’s assistance to
Asian countries, especially in some complete sets of projects. However, some companies’
profit-seeking practice is seriously damaging China’s image in the recipient countries.
Although the level of economic development of many countries in Asia is not high, the
relevant legislation is sound, however, some companies have reduced wages and made
environmental damage, thus causing many conflicts. Moreover, China and some Asian
countries have great differences in language, culture, and religion, which has caused
many problems in communication with local people and led China to be misunderstood
easily.
4. China’s Foreign Assistance to Asian Countries
109
China’s current government-led foreign aid system has many problems itself. After
the end of the Cold War, the political system of many Asian countries began to transit
to the western multi-party system, and the domestic economy began the process of
liberalization and marketization. This change has made many Asian countries no longer
favor the highly official Chinese aid. Contrary to China, in many countries in Europe
and the United States, non-governmental organizations and individuals have played
an important role in foreign aid and the government is solely responsible for policy
formulation, which is carried out by non-governmental organizations and individuals.
For example, the “American Peace Corps” established in the 1960s carried out foreign
aid activities in various fields such as culture education, agriculture, health care and
environmental protection, greatly improved the image of the United States in third world
countries. In addition, International Development Assistance Agency of the United States,
as a major public diplomacy, actively carried out foreign aid activities to promote the
development of American public diplomacy.
China’s past foreign aid system also limited the scope to the government, and has
paid insufficient attention to ordinary people’s livelihood projects. For example, in recent
years, China’s assistance to countries in the Greater Mekong subregion are still based on
government projects, such as the Cambodian government building, the Lao government
system and the Lao National Sports Center. This kind of assistance is conducive to the
development of friendship between China and other governments, but ordinary people
directly benefit little from these projects, and it is difficult to establish a good image in
their minds which affecting the aid effect to a certain extent. Unlike China’s aid, Japan’s
assistance to the countries of the Greater Mekong subregion is mostly aimed to improve
the infrastructure of the people’s livelihood in recipient countries. For example, Japan
repaired Hanoi-Ho Chi Minh City train lines, renovated and improved the water supply
and drainage systems of some provinces and cities in Vietnam; in Cambodia, its assistance
focused on improving education and health, comprehensive environmental governance
and basic guarantees for people’s lives; in Myanmar, it aided schools, medical equipment
and helped construct drinking water pipelines and road. These practices of Japan have
benefited the people of recipient countries and improved its image to local people. In
China Development Report on South-South Cooperation 2017
110
view of this, China should pay more attention to mobilizing and developing the strength
of non-governmental organizations and individuals in the future assistance to Asian
countries, drawing on the practices of other developed countries, paying more attention
to people’s livelihood issues and enhancing aid in specific projects and maintains the
national image better.
4.5.3 International Responsibility in Foreign AidSince the founding of People’s Republic of China, China has always adhered to
the principle of non-interference in the internal affairs of other countries. This is clearly
reflected in the Five Principles of Peaceful Coexistence and is one of the basic contents
of modern international law. Under the guidance of this thinking, an important principle
of China’s foreign aid is that it “does not attach any political conditions”. It will never
use the opportunity of aid to threaten aiding country and interfere in the internal affairs.
The principle of not attaching any political conditions was clearly defined in the Eight
Principles of Foreign Economic and Technical Assistance proposed by Premier Zhou
Enlai in 1964 and the Four Principles of Foreign Aid proposed by Premier Zhao Ziyang
in 1983. This approach has won wide international acclaim for China, but with the wave
of liberalization and democratization that has sprung up around the world after the end of
the Cold War, this principle of good starting point has been questioned.
After the end of the Cold War, the concept of human rights and good governance has
attracted widespread attention from Western countries. The so-called good governance
is the social management process that maximizes the public interest. Western countries
hope to promote the human rights and good governance of recipient countries through
foreign aid, and therefore often attached a series of reform conditions to their foreign aid,
“mainly in the aspects of human rights, democracy and government governance”. For
example, to promote economic system reform in the economic aspect and implement a
market economy; to speed up the democratic process in the country in politics and control
corruption, strengthen the rule of law, and protect human rights. Only if the recipient
countries meet the set of reform conditions proposed can they receive the assistance.
In this way, Western countries hope to exert reform pressure on recipient countries to
4. China’s Foreign Assistance to Asian Countries
111
overcome the insufficiency of blood transfusion assistance and force them to meet the
standards of Western countries in terms of human rights and good governance. And those
dictators who refuse to accept the conditions for reform will not be able to receive the
international assistance, eventually be forced to make concessions or lead to the collapse
of their regime. Therefore, many Western countries believe that China’s foreign aid
without any political conditions actually undermines their purpose. When some countries
refuse to accept domestic reforms and cannot receive assistance from western countries,
these authoritarian governments can turn to China for help. The result is that China’s
foreign aid is “a threat to the sustainable development of health and creates a more
corrupt, noisy and authoritarian world”.
As China’s comprehensive national strength continues to increase, there are more
and more voices in the international community that require China to assume more
international responsibilities and play a greater role in hotspots regions and hotspot
issues. “Without peace and stability and the people’s recognition of the government, all
aid will be wasted”. How China’s foreign aid can have a positive impact on the reform of
some countries under the principle of non-interference in internal affairs is a difficult and
worth-thinking problem.
4.5.4 “New Colonialism” in Foreign AidAfter the reform and opening up, China took economic construction as the center
and foreign policy also served for it. China’s foreign aid began to emphasize mutually
beneficial cooperation with recipient countries. Many Asian countries that receive
Chinese aid are rich in natural resources, but domestic manufacturing of these countries
is at a very early stage. China, on the one hand, needs to ensure the sufficiency and
stability of domestic natural resources, and on the other hand, it must seek export markets
for manufactured goods. Therefore, the trade between China and recipient countries is
mainly based on importing natural resources and exporting manufactured goods. The
two sides rationally apply comparative advantages in the aid process and take advantage
of the characteristics of international division of labor. As China’s influence in aiding
countries continues to rise, many Western countries smeared that China was aimed to

China Development Report on South-South Cooperation 2017
112
obtain strategic resources for domestic development through foreign aid and its pragmatic
economic and trade policies had damaged their interests and undermined the fairness of
international trade. The argument of China’s “new colonialism” is rampant.
Although this accusation is ridiculous, China should not underestimate its influence
on public opinion. Because of the misconduct of many Chinese companies and the
insufficient publicity of foreign aid, there are a lot of people holding this opinion. For
example, with the development of the economy and the strength, China’s assistance to
the countries of the Greater Mekong Subregion has expanded in scale and scope and has
caused some doubts and concerns of the international community. Some believes that
China’s assistance to these countries is aimed to obtain resources and only considers its
own interests but neglect the environmental protection of recipient countries, which is
“new colonialism” for these Asian countries. In fact, China’s assistance to countries in the
Greater Mekong Subregion has played an important role in improving the poverty of local
people and promoting local society and economy development. In recent years, China’s
assistance in this region has also begun to increasingly invest in the people’s livelihood
field, but the results have not been well publicized. China’s good tradition of “just actions
and no talk” or “speaking less and doing more” may not be suitable for today’s society.
Therefore, China should increase its counterattack against these “new colonialism”
accusations and at the same time, promote their aid ideas and achievements to the
international community through a variety of diplomatic channels, to dispel the doubts of
recipient countries and the international community and then improve the efficiency of
aid to Asian countries.
4.6 Summary Asian countries are China’s close neighbors, and aid to those Asian countries
has always been the focus of China’s foreign aid in the process of People’s Republic
of China’s foreign aid for more than 60 years. China’s assistance to Asian countries is
constantly changing as China’s foreign policy changes. In the 30 years before the reform
and opening up, China’s foreign policy changed from the initial “one-sided” to the “two
4. China’s Foreign Assistance to Asian Countries
113
fists hit” in the 1960s and then to the “lineup against Soviet Union” in the 1970s, at the
same time, its aid to Asian countries was marked with political overtones, countries of
the socialist camp received a lot of assistance. China had provided substantial support to
the national independence and national liberation movement of many Asian countries,
and had paid enormous human and material and national sacrifices. During this period,
the amount of assistance to Asia continued to grow. Many aids were dedicated to the
outside world ignoring the cost. Such assistance put tremendous pressure on the domestic
economic development, and was in urgent need of change. In the 30 years after the reform
and opening up, China has made comprehensive adjustments to foreign aid, stressing the
effectiveness of aid. Since then, China’s assistance to Asian countries has entered a new
period of development.
Asian countries have always been the main area of aid to China. China’s assistance to
Asian countries is dominated by developing countries. It starts with neighboring countries
and continues to expand to other Asian countries, mainly covering most countries and
regions in East Asia, Southeast Asia, South Asia and Central Asia. Southeast Asia is top
priority in China’s aid to Asia, which has a special status and shows distinct regional
and contemporary characteristics. The Foreign Aid of China 2011 white paper divides
China’s foreign aid methods into eight categories, including complete sets of projects,
general supplies, technical cooperation, human resources development cooperation,
foreign aid medical teams, emergency humanitarian assistance, foreign aid volunteers,
and debt relief. These eight forms of foreign aid are all carried out in China’s assistance
to Asia, and the complete set of projects is the most important form while the proportion
of general material assistance and emergency humanitarian assistance is also large. In the
field of aid, China’s assistance to Asian countries is mainly concentrated in agriculture,
industry, economic infrastructure and public facilities.
China’s assistance to Asian countries has achieved good economic and social effects
and has had a direct and indirect impact on the economic development of recipient
countries and promoted the development of the domestic economy of recipient countries
through the aid of infrastructure, technical cooperation with recipient countries, human
resources development cooperation and volunteer services. At the same time, China’s
China Development Report on South-South Cooperation 2017
114
assistance also pays attention to Asian countries’ social development, and has achieved
great success in increasing income, reducing poverty and environmental protection.
Although China’s assistance to Asian countries has achieved many gratifying results,
it is undeniable that we still face some problems and challenges. First of all, China still
lacks scientific and democratic decision-making when foreign aid. The domestic people
lack the participation and supervision of foreign aid and many of them do not understand
the government’s aid resolutions. Secondly, some foreign aid companies put profit first
and damaged China’s long-term good image established in foreign aid and also damaged
the good relations between two countries. In addition, China’s government-led aid system
and intergovernmental assistance also affect China to establish international image.
Thirdly, China should properly assume more international responsibilities in foreign
aid and coordinate the relationship between not attaching any political conditions and
promoting domestic reforms in recipient countries. Finally, although China’s assistance
to Asian countries is full of praise, there are still many voices of opposition. China
must work hard to eliminate the Western defamation of China’s “new colonialism” and
eliminate the misunderstandings and doubts of the recipient countries.
In short, China’s economic and technical assistance to Asian countries has achieved
certain results. Through assistance to Asian countries, China has helped recipient
countries improve domestic conditions and promote the economic development and the
living standards of local people. At the same time, China’s assistance has also enabled
more countries to understand Chinese culture and China’s influence, and has improved
its image in the eyes of many other countries. China’s assistance to Asian countries will
continue to grow in the future, and China will become an important force for maintaining
regional peace and stability and will enjoy the fruits of peaceful development and achieve
economic development and social progress together with recipient countries.

115
5. Regional Economic Cooperation between China and Developing Countries in Asia
5.1 China’s Regional Trade Agreements in AsiaRegional trade agreements (RTAs) refer to international treaties concluded between
two or more countries, or between different tariff entities, in order to eliminate various
trade barriers among members and to regulate trade and cooperation relations between
them. Since the mid-1990s, the regional economic integration in free trade area as the
main form has developed rapidly. Against this background, China also actively cooperates
with other countries and regions in the form of free trade area. In Asia, China not only
has established regional economic cooperation organizations such as free trade area with
some countries and regions, but also is actively seeking to establish free trade area with
other developing countries in Asia. Some of them have entered the stage of negotiation
or official feasibility study. These realistic and potential free trade area form an important
part of regional economic cooperation between China and developing countries.
5.1.1 Free Trade Agreement SignedWith the development of science and technology, the process of economic
globalization accelerates obviously, and it is becoming evident that there is a trend
of regional economic integration. In the contemporary world, the process of regional
economic integration begins with the establishment of free trade zones. Free trade area
refers to the trade area composed of the members of the free trade agreement. The trade
tariff and quantity restriction of the trade in goods are abolished among the members in
the region, so that the goods of the members in the region can flow completely freely. The
economic situation of developing countries and regions in Asia is quite different, but the
cooperation between them can promote higher quality and faster economic growth.

China Development Report on South-South Cooperation 2017
116
By 2017, China had signed 16 free trade area agreements with other countries, of
which seven are Asian developing countries. They are the China-ASEAN Free Trade area
Agreement, China-Pakistan Free Trade area Agreement, China-Singapore Free Trade
area Agreement, China-Georgia Free Trade area Agreement, China-South Korea Free
Trade area Agreement, China-Maldives Free Trade area Agreement and China-ASEAN
(“10+1”) upgrade. The China-ASEAN Free Trade area Agreement, the China-Pakistan
Free Trade area Agreement and the China-Singapore Free Trade area Agreement have
been introduced in the China South-South Cooperation Development Report 2013. This
section focuses on the upgrading of the China-Georgia Free Trade area Agreement, the
China-Korea Free Trade area Agreement, the China-Maldives Free Trade area Agreement
and the China-ASEAN Free Trade Agreement (“10+1”).
1. Upgrading of China-ASEAN Free Trade AgreementOn November 22, 2015, Minister of Commerce Gao Hucheng and Minister of ten
ASEAN countries officially signed the outcome document of the China-ASEAN Free
Trade Zone upgrading negotiations, Protocol between the People’s Republic of China and
the Association of Southeast Asian Nations on Amending “China-ASEAN Comprehensive
Economic Cooperation Framework Agreement” and Partial Agreements, in Kuala
Lumpur, Malaysia. This is the first upgrade agreement signed by China on the basis of the
established free trade zone.
As a developing country, ASEAN also has development needs and strategic
objectives. The signing of the upgrade agreement has also promoted further profitability
of ASEAN. The facilitation of trade cooperation will promote the expansion of the
interests of both parties. The contents of the upgrade agreement cover the areas of trade
in goods, trade in services, investment, economic and technological cooperation, etc., and
have been enriched, improved, supplemented and upgraded on the basis of the original
agreements, providing greater cooperation space in traditional service trade, modern
service trade and investment facilitation.
In the field of rules of origin, both China and ASEAN have optimized the rules of
origin and improved the relevant implementation procedures, which will further enhance

5. Regional Economic Cooperation between China and Developing Countries in Asia
117
the implementation effect of the liberalization of goods trade in the China-ASEAN Free
Trade Area and promote the trade and development of related industries. The existing
rules of origin of goods trade in the China-ASEAN Free Trade Area are based on “40%
of regional value”, the standards are relatively simple, and the identification of origin is
relatively complicated. In this upgrade negotiation, the two parties agreed to apply the
“four tax changes” and “40% regional value” standards to most of the 46 chapters of the
industrial products, involving more than 3,000 products, including minerals, chemicals,
wood, paper products, base metal products, textiles and miscellaneous products, many of
which are products with strong competitive advantages in China. Enterprises can choose
to apply these two standards of origin, which will greatly facilitate the relevant enterprises
to use the preferential policies of the free trade zone.
In the field of customs procedures and trade facilitation, the China-ASEAN Free
Trade Area Agreement did not originally contain this aspect. The upgrade negotiations
between China and ASEAN countries have included relevant content based on the
development of trade between the two sides. The two sides agreed to further simplify
customs clearance procedures, ensure that the relevant laws and regulations of both
parties are open and transparent, use automated systems, risk management and other
means to provide efficient and convenient customs clearance services for both enterprises,
solve customs clearance barriers, facilitate legal trade, and reach consensus on pre-
arbitration, reconsideration and litigation systems, and periodic review of the procedures
in this chapter to ensure the smooth flow of goods and jointly improve the level of
facilitation.
As the first and largest free trade zone for China’s foreign negotiations, the China-
ASEAN Free Trade Area has achieved tremendous growth in bilateral trade. In 2017,
the bilateral trade volume between China and ASEAN reached $514.8 billion, increasing
13.8% over the previous year. Among which, China exported $279.1 billion to ASEAN
with a 9% increase over the previous year and imported $235.7 billion, increasing 20%
over the previous year. China’s main export destinations are Vietnam, Singapore and
Malaysia; the main import countries are Malaysia, Vietnam and Thailand. At present,
China is ASEAN’s largest trading partner, and ASEAN is China’s third largest trading
China Development Report on South-South Cooperation 2017
118
partner. The mutual investment between the two sides has exceeded $150 billion.
2. China - Georgia Free Trade AgreementThe Free Trade Agreement between the Government of the People’s Republic of
China and the Government of Georgia initiated negotiations in December 2015, officially
signed in May 2017, and entered into force on January 1, 2018.
The agreement covers 17 chapters on trade in goods, trade in services, rules of
origin, customs procedures and trade facilitation, sanitary and phytosanitary measures,
technical barriers to trade, trade remedies, intellectual property rights and cooperation. In
terms of openness, Georgia immediately implemented zero tariffs on 96.5% of China’s
products, covering 99.6% of China’s total imports; and China imposed zero tariffs on
93.9% of Georgia’s products, covering 93.8% of China’s total imports from Georgia, of
which 90.9 % of the products are immediately subject to zero tariffs, and the remaining
3% of the products are tax-deferred for a period of five years. In the field of service trade,
the two sides have made high-quality open commitments to many service departments.
Among them, the Georgian has met the Chinese key concerns in the fields of finance,
transportation, natural person movement, and Chinese medicine services. China has
met the key concerns of the Georgian side in the fields of tourism, shipping, and law. In
addition, the agreement further perfected the trade rules, stipulating that the parties should
not use third-party substitute prices when conducting anti-dumping investigations, and at
the same time clarified the key areas for strengthening cooperation in the future.
The establishment of the China-Georgia Free Trade Area is of great significance.
Georgia is located at the important node of the “One Belt and One Road” and has a good
business environment. It is an important economic and trade partner of China in the
Eurasian region and the first country in this region to sign a free trade agreement with
China. The Free Trade Agreement between the Government of the People’s Republic
of China and the Government of Georgia is the first free trade agreement initiated
and reached by China after the “One Belt and One Road” initiative. According to the
content of the agreement, the two sides canceled the tariffs on most of the tangible goods
trade products, and made a high-quality market opening commitment to many service
5. Regional Economic Cooperation between China and Developing Countries in Asia
119
departments, and improved the rules on intellectual property rights, environmental
protection, e-commerce and competition. The establishment of the China-Georgia Free
Trade Zone has created a more open, convenient and stable business environment for both
companies to provide consumers with more quality and cheap products and services.
3. China-Korea Free Trade AgreementThe negotiation of the China-Korea Free Trade Agreement was launched in May
2012. The Free Trade Agreement between the Government of the People’s Republic
of China and the Government of the Republic of Korea was officially signed On June
1, 2015 and entered into force on December 20, 2015. The China-Korea Free Trade
Agreement is the free trade zone with the widest coverage in China’s foreign negotiations
and involving the largest amount of trade. In terms of the level of openness, the
proportion of liberalization goods trade between the two sides exceeds 90% in tariff items
and 85% of the trade volume. The agreement covers 17 areas of trade in goods, trade in
services, investment and rules, including e-commerce, competition policy, government
procurement, and the environment.
According to the China-Korea Free Trade Agreement, China implemented the
first step of tax reduction on December 20, 2015 and the second step of tax reduction
on January 1, 2016. According to the tariff reduction plan of the China-South Korea
agreement, based on the 2012 data, the Chinese zero-tariff products would eventually
reach 91% of the tax number and 85% of the import value, and the Korean products with
zero tariffs would eventually reach 92% of the tax number and 91% of the import value.
On January 1, 2016, the proportion of tax tariffs for zero tariffs in China would reach
20%, mainly including some electronic products, chemical products, mineral products,
etc.; the proportion of tax tariffs for zero tariffs in Korea would reach 50%, mainly
including some electromechanical Products, steel products, chemical products, etc.
In terms of market opening, China and South Korea will provide reciprocal
treatment to the other financial enterprises entering the domestic capital market, which
means that the relevant approval process will be simplified and the entry threshold for
financial markets of both parties is expected to decrease. The agreement also includes

China Development Report on South-South Cooperation 2017
120
that Korean construction companies in the Shanghai Pilot Free Trade Zone can undertake
cooperation projects in Shanghai without the restrictions on foreign investment. The
Chinese side considers allowing Korean travel agencies to recruit tourists from South
Korea or third countries in China. In addition, China and South Korea also pledged to
continue the service trade negotiations with a negative list model after the signing of the
agreement, and to conduct investment negotiations based on pre-entry national treatment
and negative list models.
The scale of trade between China and South Korea is expanding. The bilateral trade
volume between China and South Korea in 2017 was $239.97 billion, increased 13.5%
over the previous year. Among them, China’s exports to South Korea reached $97.86
billion with an increase of 12.5% over the previous year. And China’s imports to South
Korea were $142.12 billion, increased 14.2% over the previous year. At present, China
has become Korea’s largest trading partner.
4. China-Maldives Free Trade AgreementThe China-Maldives Free Trade Agreement negotiations were launched in December
2015. After five rounds of negotiations and a ministerial consultation, the negotiations
were officially concluded in September 2017. On December 7, 2017, the two sides signed
the Free Trade Agreement between the Government of the People’s Republic of China
and the Government of the Republic of Maldives in Beijing.
The China-Maldives Free Trade Agreement has 15 chapters, which are general
rules, general applicable definitions, trade in goods, rules of origin and implementation
procedures, customs procedures and trade facilitation, technical barriers to trade and
sanitary and phytosanitary measures, trade remedies, service trade, investment, economic
and technical cooperation, transparency, management and institutional terms, dispute
resolution, exceptions, final clauses. In addition, the agreement also includes nine annexes
such as the tariff guide for goods trade, the specific commitment schedule for service
trade, and the product-specific rules of origin.
In the field of trade in goods, the China-Maldives Free Trade Agreement has
achieved high levels of tariff concessions, and both parties have promised zero tariff

5. Regional Economic Cooperation between China and Developing Countries in Asia
121
products with a tax rate of more than 95%. Since China is the first country to sign a
bilateral free trade agreement with the Maldives, Chinese companies will receive more
favorable market access treatment than other countries after the implementation of the
agreement.
For the Maldives, the final zero-tariff products will reach 95.6% of all taxable
items, covering 95.1% of China’s imports, and the tax reduction period will not exceed 8
years. Among them, the products that account for 70.3% of the tax rate will be cancelled
immediately after the agreement takes effect, and another 20.3% and 5% of the products
will be gradually eliminated within 5 years and 8 years respectively. In terms of specific
products, the Maldivian side will eliminate tariffs on industrial products with a tax rate
of 97.3%, and at the same time, eliminate tariffs on agricultural and aquatic products that
are imported from China, such as flowers, vegetables, and processed fish products. For
China, the final zero-tariff product will reach 95.4% of all taxable items, covering 96.4%
of imports from Maldives, and the tax reduction period will not exceed 5 years. Among
them, the products that account for 91.1% of our tax items will be cancelled immediately
after the agreement takes effect, and another 4.3% of the products will be gradually
eliminated within 5 years. In terms of specific products, China will eliminate tariffs on
industrial products with a tax rate of 95.8% and agricultural products with a tax rate of
93.6%, including most of the fish and aquatic products that the Maldivian side focuses on.
In terms of rules of origin, the China-Maldives Free Trade Agreement uses a
combination of 40% of the regional value component and a short product-specific rules
of origin to develop a country of origin standard, targeting only some of the agricultural
products that we focus on with relatively strict standards. Most of the goods can be
deemed to have the original qualifications as long as they meet the general rules. For
goods that both parties wish to promote exports but are unable to meet the regional value
component standards, the tariff classification changes are also flexibly set according to
the actual situation of the industry. The selection of standards or processing procedures
and other standards is convenient for both companies to apply and to consider the special
demands of both parties on some products.
In terms of technical barriers to trade and sanitary and phytosanitary measures,

China Development Report on South-South Cooperation 2017
122
the China-Maldives Free Trade Agreement reaffirms the rights and obligations of the
two parties in the WTO and incorporates the Agreement on Technical Barriers to Trade
and the Agreement on the Implementation of Sanitary and Phytosanitary Measures of
WTO. The agreement ensures that the two sides implement the relevant WTO principles
well. At the same time, the China-Maldives Free Trade Agreement puts forward higher
requirements for the transparency of relevant laws and regulations of the two countries,
and regulates the transparency of port enforcement through border measures, and sets up
a consultation mechanism to solve technical problems arising in bilateral trade in a timely
manner. It also clarified relevant areas of cooperation and provided a platform for the
competent authorities of the two countries to deepen cooperation. These provisions will
further facilitate bilateral trade and reduce the impact of non-tariff measures on trade.
5.1.2 Negotiations and Proposed Free Trade AgreementsThe signing of a trade agreement generally involves three links. the first is that
the bilateral leaders reach a consensus or sign a framework agreement; the second is to
conduct an official feasibility study; the third is the formal negotiations and signing of
the agreement. Free trade agreement negotiations between China and Asian developing
countries include China-GCC Free Trade Agreement, China-Israel Free Trade Area,
China-Pakistan Free Trade Agreement Phase II Negotiations, China-Mongolia Free
Trade Area, China-Nepal Freedom Trade Zone, China-Bangladesh Free Trade Area and
Regional Comprehensive Economic Partnership Agreement. Among them, the China-
GCC Free Trade Agreement has been introduced in the China South-South Cooperation
Development Report 2013, which is not stated in this section.
1. China-Pakistan free trade agreement phase II negotiationsThe China-Pakistan Free Trade Agreement was signed in 2006 and came into effect
in 2007. The two sides launched the second phase of negotiations in 2011. Pakistan is
an important country along the “One Belt and One Road” and an important partner in
China’s strategy of accelerating the implementation of the Free Trade Area. In recent
years, China-Pakistan economic and trade relations have developed rapidly. The bilateral
5. Regional Economic Cooperation between China and Developing Countries in Asia
123
trade volume in 2017 was $20.09 billion, increased.9% over the previous year. In 2007,
the bilateral trade volume between the two countries was only $25 million.
On December 6, 2017, the seventh meeting of the second phase of the China-
Pakistan Free Trade Agreement was held in Islamabad, Pakistan. The two sides held
consultations on the tax reduction model for goods trade of the second phase of the free
trade agreement, Pakistan’s adjustment of taxes, services and investment in the areas of
further opening up, customs data exchange cooperation and inspection and quarantine
measures for some products from Pakistan.
The second phase of the China-Pakistan Free Trade Agreement negotiations is of
great significance. On the one hand, Pakistan has become an important economic corridor
on the “One Belt and One Road”. The China-Pakistan Free Trade Agreement can be
linked to the “One Belt and One Road” in many aspects to comprehensively strengthen
bilateral economic and trade cooperation. On the other hand, China and Pakistan are at
different stages of industrial development. The two economies are highly complementary.
As the second largest country in South Asia, Pakistan has a large population and great
potential for economic growth, but it is still in the initial stage of industrialization.
China’s overall development level is relatively high, and it is in the middle and late
stages of industrialization. It is urgent to adjust and optimize the industrial structure by
strengthening international cooperation. Both China and Pakistan will also strengthen
investment facilitation and international capacity cooperation, support industrial
development, and promote the development of trade in goods and services. The “China-
Pakistan Economic Corridor” can connect China’s central and western regions with the
Indian Ocean, and channel traffic and oil pipeline traffic, making China a new “going out”
channel. It is of great significance for China to expand its friendly relations with countries
along the Indian Ocean through the China-Pakistan Free Trade Agreement, and it will
also accelerate the process of economic globalization.
2. China-Mongolia free trade agreementChina has maintained Mongolia’s largest trading partner for more than a decade.
In 2016, bilateral trade volume was $4.61 billion, accounting for 60% of Mongolia’s

China Development Report on South-South Cooperation 2017
124
total foreign trade, with direct investment in Mongolian finance $240 million. China’s
investment in Mongolia has grown steadily, and China has become the second largest
source of foreign investment in Mongolia and Mongolia’s largest trading partner.
China and Mongolia are important neighbors to each other with strong economic
complementarities and huge potential for cooperation. The construction of a free trade
zone is conducive to further expanding bilateral trade and investment, and will enhance
the level of regional economic integration in Northeast Asia and East Asia.
On May 12, 2017, China and Mongolia jointly signed the Memorandum of
Understanding between the Ministry of Commerce of the People’s Republic of China and
the Ministry of Foreign Affairs of Mongolia on Launching the Joint Feasibility Study
of the China-Mongolia Free Trade Agreement, and announced the launch of the Joint
Feasibility Study on the Free Trade Agreement, officially opening the process of building
a bilateral free trade zone.
3. China-Nepal free trade agreementIn 2017, the total trade volume between China and Nepal was $990 million,
increased 11.2% over the previous year, among which, China exported $970 million to
Nepal, increased 12% year-on-year. China imported $0.2 billion from Nepal, decreased
20.4% year-on-year. And China has become Nepal’s second largest trading partner and
main source of investment. The construction of the China-Nepal Free Trade Zone is
conducive to further expanding bilateral trade and investment, and will inject new vitality
into the economic and trade relations between the two countries.
The establishment of a free trade zone between China and Nepal is of great
significance. On the one hand, we will carry out capacity cooperation in the post-
earthquake reconstruction in Nepal, and strengthen cooperation in the fields of building
materials, water conservancy and hydropower development and organic agriculture. On
the other hand, we will also expand cooperation in the fields of petroleum product trade,
oil and gas exploration and refining, and renewable energy.
On March 21, 2016, Chinese minister of commerce Gao Hucheng and Nepalese
minister of commerce Deepak Bohra signed the Memorandum of Understanding

5. Regional Economic Cooperation between China and Developing Countries in Asia
125
between the Ministry of Commerce of the People’s Republic of China and the Ministry of
Commerce of Nepal on Launching the Joint Feasibility Study of the China-Mongolia Free
Trade Agreement in Beijing, announced the official launch of the joint feasibility study
for the bilateral free trade agreement.
4. China-Bangladesh Free Trade AgreementChina and Bangladesh are neighbors and the two economies are highly
complementary with great potential for cooperation. China is shifting its low-end labor-
intensive industries to Bangladesh and other countries, thus bringing more foreign
investment to these countries. In recent years, China has become Bangladesh’s largest
trading partner, and Bangladesh is China’s third largest trading partner and third largest
engineering contracting market in South Asia. In 2016, the bilateral trade volume between
China and Bangladesh was $15.17 billion, increased 3.1% over the previous year. As of
July 2017, China’s cumulative direct investment in Bangladesh was $239 million, and the
total amount of engineering contracted contracts was $30.1 billion. China has become the
country with the most investment in Bangladesh.
Bangladesh is one of the few countries in the world that has not signed a free
trade agreement. In March 2018, Bangladesh was qualified to graduate from the least
developed countries, and it will lose its current preferential treatment for market access in
developed and developing economies in 2024. In response to the above potential threats,
the Bangladeshi government decided to open negotiations on the FTA with its major
trading partners.
The Bangladesh government sent a delegation to Beijing in June 2018 to hold a first
working group meeting with the Chinese side on the joint feasibility study of the FTA
to discuss the potential impact of the free trade zone on bilateral economic and trade
relations.
5. Regional Comprehensive Economic Partnership The Regional Comprehensive Economic Partnership (RCEP) was initiated by the
10 ASEAN countries and invited China, Japan, South Korea, Australia, New Zealand

China Development Report on South-South Cooperation 2017
126
and India to participate (“10+6”), and establish a free trade agreement for a unified
market in 16 countries by reducing tariffs and non-tariff barriers. It is the first regional
economic integration cooperation initiated by ASEAN countries in recent years and was
led by ASEAN. It is an organizational form in which member states open markets and
implement regional economic integration. If the RCEP is successful, it will cover about 3.5
billion people, and the total GDP will reach $23 trillion, accounting for 1/3 of the global
total. The covered area will also become the world’s largest free trade zone.
The goal of RCEP is to eliminate internal trade barriers, create and improve a free
investment environment, expand service trade, and also cover various areas such as
intellectual property protection and competition policy. The degree of liberalization will
be higher than the free trade agreement that ASEAN has reached with these six countries.
RCEP has a population of about half of the world’s total population, with a GDP that
accounts for one-third of the world’s annual GDP. The RCEP is proposed to address the
development of economic globalization and regional economic integration. As the WTO
negotiations to promote global free trade are blocked, in the face of some negative effects
in economic globalization, in order to remain invincible and have new developments in
the current world economy, it is necessary to strengthen regional economic integration.
Thus, some countries have implemented “zero” tariffs, open markets to each other, and
cooperate closely to seek cooperation and development. This is the relevant situation of
ASEAN’s proposal to build RCEP.
5.2 Sub-Regional Cooperation between China and Asian Developing Countries
5.2.1 Characteristics and Significance of Sub-regional CooperationSub-regional economic cooperation is relative to regional economic cooperation. It
refers to the long-term economic cooperation activities carried out by natural persons or
legal persons across borders between several countries and regions, based on the principle
of equality and mutual benefit, through the flow of various factors of production. From the
perspective of economic development, its essence is the tendency of production factors to

5. Regional Economic Cooperation between China and Developing Countries in Asia
127
liberalize within the geographical scope of the “sub-region”, which leads to the effective
allocation of production factors and corresponding improvement in production efficiency,
mainly manifested in the liberalization of trade and investment within this geographical
area. Therefore, in the economic category, it belongs to the category of regional economic
integration.
According to the level of cooperation, it can be divided into vertical cooperation and
horizontal cooperation. For example, the Zhuhai-Hong Kong-Macau economic zone is
vertical, while the Lancang-Mekong region is horizontal. According to the cooperation
content, it can be divided into investment cooperation, technical cooperation, service
cooperation, labor cooperation, engineering construction cooperation and economic policy
cooperation, etc. Generally speaking, the higher the level of economic cooperation, the
richer the cooperation content. Sub-regional cooperation has the following characteristics:
(1) It usually only involves a part of the territory of a member state; therefore, the
political risk of its failure is dispersed;
(2) Its establishment has greater flexibility, and a country can participate in several
sub-regional economic cooperation organizations at the same time;
(3) It has different openness from the trading group, and its product market and
investment capital are mainly or chiefly dependent on the regions outside the subregion,
and do not discriminate against non-member countries;
(4) Different from export processing zones, the scope of cooperation is very
wide, usually including trade, investment, tourism, infrastructure, human resources,
environmental protection, etc.;
(5) The cross-border movement of production factors depends mainly on the
“coordination” between the participants;
(6) Local governments are the mainstay of sub-regional cooperation.
At present, sub-regional cooperation between China and developing countries
mainly includes three-party-based regional content: first is regional cooperation based on
the Border Economic Cooperation Zone; second is a Cross Border Economic Cooperation
Zone with neighboring countries; third is the overseas economic and trade cooperation
zone. This section analyzes the development of these three forms of sub-regional
China Development Report on South-South Cooperation 2017
128
cooperation and its impact and challenges.
5.2.2 Border Economic Cooperation ZoneThe border economic cooperation zone is a state-level economic development zone
established by China in the border areas and an important policy to promote economic
opening up in the border areas. The development of border areas and cities is different
from that of the coastal areas. Its economic and trade exchanges mainly rely on border
trade and mutual trade with neighboring countries, so the scope and scale are small.
The purpose of establishing a border economic cooperation zone is to use policy and
geographical and resource advantages to attract the accumulation of resources such as
people, logistics, and capital technology in other regions and abroad, thereby not only
promoting the cooperation but also driving economic development in a wider area.
Since 1992, the State Council of China has approved 17 border economic
cooperation zones that have played a positive and important role in developing economic
and trade relations with neighboring countries and regions and promoting good neighborly
relations and promoting economic development in ethnic minority areas. China’s border
economic cooperation is mainly located in the border areas of the northeast, northwest
and southwest, where economic development is relatively backward.
1. Ruili Border Economic Cooperation ZoneRuili border economic cooperation zone is a state-level border economic cooperation
zone approved by the State Council in June 1992. The administrative area of the
cooperative zone is 13.45 square kilometers, and the planned development area is 6 square
kilometers. It is a comprehensive development zone based on the import and export
processing industry, developed with hot zone resources and equipped with trade, finance,
tourism and other industries, and enjoys provincial economic management authority.
The first batch of national development zones that passed the audit announcement in
September 2005.

5. Regional Economic Cooperation between China and Developing Countries in Asia
129
2. Manchuria Border Economic Cooperation ZoneThe Manchuria Border Economic Cooperation Zone is located in the southeastern
part of Manchuria city. It is one of 14 state-level border economic cooperation zones
approved by the State Council Special Administrative Region Office in March 1992
according to the National Letter No. 21, covering an area of 70.1 square kilometers. In
the past 18 years since its establishment, the cooperation zone has developed into the
main urban area of Manchuria City, which has a Manchuria import resource processing
park, one of the 45 industrial parks under the jurisdiction of the autonomous region, and
administrative districts, commercial and trade districts, residential areas and Manchuria
import resources processing park. The population of the district has reached 100 thousand.
The total investment in urban infrastructure construction has reached 1.37 billion yuan,
achieving “seven connections and one leveling”.
The Manchuria import resource processing park, which was approved in July 2003
and under the jurisdiction of the cooperation zone, was listed as one of the 20 industrial
parks in the region by the Inner Mongolia Autonomous Region in 2004. In 2009, it was
designated as the “Circular Economy Demonstration Park by the Autonomous Region”.
After 7 years of construction and development, the park has formed an industrial base
and industrial cluster mainly based on imported wood processing, ranking first among
domestic border ports. Its timber products are mainly sold to all parts of the country and
Europe, America, Japan, Korea and Southeast Asia.
3. Helong Border Economic Cooperation ZoneOn March 3, 2015, the State Council officially approved the establishment of
a border economic cooperation zone in Jilin province, named the Helong Border
Economic Cooperation Zone, and implemented the current policy of the Border
Economic Cooperation Zone. The Helong Border Economic Cooperation Zone is
the second state-level border economic cooperation zone approved by Jilin Province
since the state council approved the establishment of the Hunchun National Border
Economic Cooperation Zone in 1992. The Helong Border Economic Cooperation
Zone officially launched its application in December 2011 with a planned area of 4.06

China Development Report on South-South Cooperation 2017
130
square kilometers, divided into an import resource conversion zone, an export product
processing zone, a trade logistics bonded zone, and a southwest living zone. The Helong
Border Economic Cooperation Zone closely focuses on the development and opening up
along the border and the “One Belt and One Road”. It will be built into an international
comprehensive economic cooperation zone integrating border trade, regional processing
and manufacturing, domestic and overseas resources cooperation development and
production, comprehensive bonded, financial services, international logistics distribution
and procurement, and tourism. It will promote regional cooperation among countries in
northeast Asia and promote the rapid development of the foreign economy in Helong City
and even Yanbian and Jilin province, forming a new strategy pattern that is centered on
Yanji and with Helong and Hunchun as the fulcrums of the “South and North” exports of
China and Mongolia, and striving to build a free trade zone of China, Mongolia, Russia,
Korea, Japan and North Korea supported by Yanji, Hunchun and Helong.
4. Erenhot City Border Economic Cooperation ZoneThe Erenhot City Border Economic Cooperation Zone is a development zone
approved by the State Council Special Administrative Region Office in 1993. It is
located in the north of the north end of the windbreak forest belt in the urban area of
Erenhot, south of the warehouse inspection and transportation company, and to the west
of the Guomen highway. The total control planning development area is about 3 square
kilometers, and the approved area is 1 square kilometer. The quality of the site is good.
With 1 kilometer from the city center and 2.5 kilometers from the national border, the
transportation and communication are convenient. It is adjacent to the highway port joint
inspection building and warehouse company inspection warehouse, close to the urban
area; the terrain is flat. It is the best place for domestic and foreign merchants to invest in
the port, and an ideal base for Mongolia and the commonwealth of independent states to
enter the East and West Europe.
The export-oriented economy of the Erenhot City Border Economic Cooperation
Zone is the main mode. It is guided by domestic and foreign markets, especially the
international market. It focuses on high-tech and emerging industries, takes the advanced

5. Regional Economic Cooperation between China and Developing Countries in Asia
131
industry as the main body, takes into account the development of trade and tourism,
and takes the road of combining technology and trade with development. Through
construction and development, the cooperative zone will be built into a comprehensive
and multi-functional modern urban new district and a new economic growth point with
good investment environment, high capital and technology intensity, developed tertiary
industry and operating according to international practices. It will become a model for
deepening reform, expanding the window of opening, connecting the inside and outside
ties, and the fulcrum of the International Trade City.
5. Suifen River Border Economic Cooperation ZoneThe Suifen River Border Economic Cooperation Zone is a state-level border
economic cooperation zone approved by the State Council Special Administrative
Region Office in March 1992. The approved planned area is 5 square kilometers. The
establishment of the Border Economic Cooperation Zone in Suifen River city intends
to use the domestic and overseas resources and two markets to develop a characteristic
economy with comparative advantages and competitive advantages, enhance the level
of opening up along the border, enhance cooperation and exchanges with neighboring
countries, create economic growth points in the border areas, and promote national unity
and social stability in the border areas.
The Suifen River Border Economic Cooperation Zone relies on the original
foundation, exerts comparative advantages, highlights the joint advantages of the industry,
and forms an integrated development direction. We will build an industrial structure
that is based on import and export and that is diversified in economic development;
adopt a unified planning, district construction, government guidance, and market-
oriented construction mode; implement the mode of one-stop service before the start
of construction, a full range of services under construction, economic services after the
commissioning. The cooperation zone is centered on Russian resources and the needs of
the Russian market, focusing on industries such as wood processing, electromechanical
appliance production, electronic product processing, light industrial product processing,
food processing, petroleum equipment manufacturing, petrochemical refining, and new

China Development Report on South-South Cooperation 2017
132
energy and new material processing, providing efficient project approval services and
merchandising services.
6. Wanding Border Economic Cooperation ZoneThe Wanding Border Economic Cooperation Zone is located in the southern part of
the Dehong Dai Jingpo Autonomous Prefecture. It is separated from the neighboring state
of Myanmar by a river and faces the Jiugu city, a major town in the north of Myanmar.
It has a total area of 103 square kilometers and a border line of 28.646 kilometers. It
is located at the end of National Highway 320. It is the throat of China’s land route to
Myanmar and Southeast Asian countries, and the national level port. The Wanding Border
Economic Cooperation Zone was established in 1992 with a planned area of 5 square
kilometers. The water, electricity, road, communication and transportation infrastructure
conditions are all good. Functional positioning is to make full use of the raw materials
and markets of China and Myanmar, and can engage in international trade, foreign trade,
border trade, border trade processing, agricultural resource development, international
economic labor and technology cooperation and tourism development.
7. Tacheng Border Economic Cooperation ZoneThe Tacheng Border Economic Cooperation Zone is one of the 14 state-level border
economic cooperation zones established in 1992 in accordance with the spirit of the
documents Reply on the Establishment of Border Economic Cooperation Zones in Yining
City, Bole City and Tacheng City of the Office of the State Council. The cooperation
zone is located in the east of the city, bound by the garden street, and the western border
checkpoint is the natural dry river ditch. The approved area is 29.16 square kilometers.
It is located on the north side of the city racecourse, on both sides of the Kalangur River,
between the East Canal and the West Canal of Kalangur River, south to the racecourse,
and north to North Ring Road; there are 32 administrative institutions and 61 registered
enterprises in the jurisdiction. The cooperation zone focuses on the construction of export
processing industry, high-tech industry and tertiary industry, and develops an export-
oriented economy, optimizes the export structure, and builds the cooperation zone into a

5. Regional Economic Cooperation between China and Developing Countries in Asia
133
comprehensive industrial zone and import and export base with advanced technology and
excellent environment.
5.2.3 Cross Border Economic Cooperation ZoneThe cross-border economic cooperation zone (CBECZ) refers to the delineation of
specific areas near the border between the two countries, giving the region special fiscal
and taxation, investment and trade, and supporting industrial policies. It also conducts
special supervision of cross-border customs in some areas of the region, attracting people
and logistics. Various production factors such as capital flow, technology flow, and
information flow are gathered here to accelerate the development of the region, and then
drive the development of surrounding areas through radiation effects. A cross-border
economic cooperation zone refers to a sub-regional economic cooperation zone that
enjoys preferential policies such as export processing zones, bonded zones, and free trade
zones jointly promoted by two or more governments in the border areas.
The construction of a cross-border economic cooperation zone is generally based
on an agreement between the two countries. At present, China has reached agreements
with Laos, Myanmar and Vietnam at the national or local government level to form
five cross-border economic cooperation zones. They are China Mohan-Laos Moding
Cross-border Economic Cooperation Zone, China Ruili-Myanmar Muse Cross-border
Economic Cooperation Zone, China Red River-Vietnam Lao Cai Cross-border Economic
Cooperation, China Estuary-Vietnam Laos Cross-border Economic Cooperation Zone,
China Dongxing-Vietnam Mans Cai Cross-border Economic Cooperation Zone. In the
China South-South Cooperation Development Report 2013, the China Mohan-Laos
Grinding Cross-border Economic Cooperation Zone, China Ruili-Myanmar Muse Cross-
border Economic Cooperation Zone and China Red River-Vietnam Lao Cai Cross-border
Economic Cooperation Zone have been introduced. Therefore, this section focuses on
China’s Hekou-Vietnam Old Street Cross-border Economic Cooperation Zone, China
Dongxing-Vietnam Mans Cai Cross-border Economic Cooperation Zone.

China Development Report on South-South Cooperation 2017
134
1. China Red River-Vietnam Laos CBECZChina and Vietnam have a long history of trade, and the trade structure has been
continuously optimized. The total trade volume has increased year by year. In particular,
in recent years, China and Vietnam, as well as Southeast Asia, South Asia and other
countries and regions in the economic, cultural, scientific and technological fields have
continued to deepen cooperation, diverse forms of cooperation and rich cooperation.
In addition, according to the relevant agreements between China and ASEAN that
have established a free trade zone, after a five-year transition period, more than 70,000
products trade between China and Vietnam will receive a zero-tariff reduction policy. The
bilateral trade volume between China and Vietnam was $32 million in 1991. In 2011, it
exceeded $40 billion, an increase of more than 1,000 times. The two countries also strive
to increase bilateral trade by $60 billion by 2015. China is both Vietnam’s largest trading
partner and Vietnam’s largest trade deficit country.
As the border area between China and Vietnam, the development of Hekou county
and the old market has always been valued by the two governments. They have set up
special economic zones on the border and enjoy special support policies. On June 8,
2010, the Yunnan Provincial People’s Government and the People’s Committee of Lao
Cai Province of Vietnam signed the Framework Agreement on Accelerating the Research
and Construction Cooperation of China’s Estuarine-Vietnam Old Market Cross-border
Economic Cooperation Zone in Kunming.
Red River Prefecture and Lao Cai Province are quite complementary in resources
and other industries. The construction of China’s Red River-Vietnam Old Street Cross-
Border Economic Cooperation Zone should be preceded by the service industry,
including logistics, warehousing and processing, financial services, exhibitions and other
modern service industries, as well as catering and accommodation, tourism and other
life services; Taking the lead in the development of the service industry, it will drive
the flow of people, logistics, capital flow and technology to the region, so as to give full
play to the complementary advantages of resources and industries of Red River and Lao
Cai, promote the development of their respective advantageous industries, and finally
realize the development and prosperity of the border areas, and the border residents will

5. Regional Economic Cooperation between China and Developing Countries in Asia
135
get rid of poverty and become rich. In the development of leading industries, relying on
the opportunities of international large-channel construction and the function of port, we
will vigorously develop the logistics industry and drive the development of the service
industry with the logistics industry. Relying on the advantages of abundant energy
resources and the advantages of economic complementarity, we will vigorously develop
the processing industry and promote the development of the manufacturing industry with
the processing industry.
The China Red River-Vietnam Laos Cross-border Economic Cooperation Zone
project is divided into three phases: the first phase is to cooperate to establish the “China-
Vietnam Red River Trade City”; the second phase is the establishment of “China Red
River-Vietnam Lao Cai Economic Cooperation Zone” by China-Vietnam Cooperation;
the third phase is to rely on the construction of the Kunming, Red River and Haikou
Economic Corridor to promote the all-round development of the China Red River-
Vietnam Lao Cai Economic Cooperation Zone. The cross-border economic cooperation
zone is a closed area composed of adjacent areas on the respective sides of the border line
between China and Vietnam, built together by fences and interconnected by cross-border
means of transport. It is formed by the 285-square-kilometer international port area of
Estuary County, Red River Prefecture, China, and the 25-square-kilometer Jincheng
Business District of the old market in Lao Cai Province, across the Red River and is
connected by the Sino-Vietnamese Red River Highway Bridge which is totaling 5.35
square kilometers.
2. China Dongxing-Vietnam Mons Cai CBECZIn November 2015, under the joint witness of General Secretary of the CPC
Central Committee Xi Jinping and General Secretary of the Central Committee of the
Communist Party of Vietnam, Guangxi (China) and Guangning (Vietnam) provinces
signed the Agreement on the Establishment of Friendly Local Organizations between
the Committee of the Guangxi Zhuang Autonomous Region of the Communist Party of
China and the Guangning Provincial Committee of the Communist Party of Vietnam,
proposing to strengthen and deepen cooperation between the two provinces and regions
China Development Report on South-South Cooperation 2017
136
and accelerate the construction of the cross-border economic cooperation zone between
China and Vietnam. In October 2013, during Premier Li Keqiang’s visit to Vietnam,
China and Vietnam reached a consensus and decided to build a special supervision zone
of about 10 square kilometers on both sides of the Beilun River to build a cross-border
economic cooperation zone in Dongxing-Vietnam Mans Cai. The two sides jointly
determine the spatial layout, industrial planning, infrastructure arrangements, etc. of the
cross-border economic cooperation zone, and each is responsible for the implementation
of the development and construction of the region. The party committee and government
of the autonomous region attach great importance to the construction of the cross-border
economic cooperation zone of Dongxing-Vietnam Mans Cai in China. Secretary Peng
Qinghua has made important instructions for the development and construction of the
cross-border economic cooperation zone for five consecutive times since 2016, requiring
the Dongxing Experimental Zone to wait, taking the cross-border cooperation zone as
a breakthrough, and speeding up the opening of the second bridge port comprehensive
service area and the development and construction of the park. Chairman Chen Wu also
repeatedly instructed to accelerate the development and construction of cross-border
cooperation zones and to produce a physical image as soon as possible.
China Dongxing-Vietnam Mans Cai Cross-border Economic Cooperation Zone
has a planned total area of 84 square kilometers, including one core area (10.2 square
kilometers) and seven supporting parks (74 square kilometers, including respectively one
Border Trade Center, three Industrial Parks, two Logistics Parks, and New City area).
The core area of 10.2 square kilometers is divided into three sections and completed
within 3 to 5 years. It will implement the management method of “one zone in two
countries beyond custom, free trade and closing operation” to achieve “full open frontier
to the world, recession of custom, and efficient operation”; use China and ASEAN “two
resources and two markets”; and develop cross-border specialty industries such as import
and export processing trade, cross-border finance, cross-border tourism, and cross-border
e-commerce.
China’s Dongxing-Vietnam Moncay Cross-border Economic Cooperation Zone is
an important node of the national “One Belt and One Road” strategy and an important

5. Regional Economic Cooperation between China and Developing Countries in Asia
137
platform for China’s open cooperation with ASEAN. It is extremely important for
promoting the “three positioning” and “dual-core driving” strategies that the central
government has given to Guangxi. In the future, the cross-border cooperation zone will
focus on the work objectives of “playing foundation in one year, having image in 2 years,
making great changes in 3 years”, and do a good job in the five major battles of land
acquisition and demolition, infrastructure construction, public facilities construction,
project financing and investment promotion, and will accelerate the development and
construction of the first district (starting area) of 2.06 square kilometers. At present,
the Chinese part of the second bridge of Beilun River in China and Vietnam has passed
the acceptance check on December 25, 2016. A number of road projects such as the
Friendship Avenue, Riverside Avenue and the Crossing Road in the cross-border
cooperation zone have been basically completed, and the road network in the core area
has taken shape. A number of key projects such as Gate Tower and standard factory
buildings were speeded up. The Gate Tower project was capped on November 28,
2016 and will be completed and put into use in September this year. The 9 standard
plants will be completed in the first half of this year. A number of industrial projects
and infrastructure projects such as Venture Capital Building, International Commodity
Exhibition and Trading Center, Trade and Tourism Service Center, Port Inspection Field
and Nanmu Hill Avenue are accelerating the preliminary work and will start construction
in the first half of this year. In the next step, the cross-border cooperation zone will
follow the principle of “step by step” with project construction as the focus and reform
and innovation as the new engine, making great efforts to rationalize the system and
mechanism, continuously expanding open cooperation and striving to build a flagship
project for Sino-Vietnamese economic and trade investment cooperation, a demonstration
zone for China-ASEAN economic and trade cooperation, and a demonstration zone for
opening up to the outside world.
5.2.4 Overseas Economic and Trade Cooperation ZoneThe overseas economic and trade cooperation zones invested and constructed by
Chinese enterprises abroad are based on enterprises and based on commercial operations,
China Development Report on South-South Cooperation 2017
138
with the aim of promoting mutual benefit and win-win target, decided mainly by
investment entities based on market conditions, host country investment environment and
investment policies. Through the construction of the cooperation zone, the investment
entity will attract more enterprises to invest and build factories in the host country,
increase employment and taxation in the host country, expand foreign exchange earnings
through exports, upgrade the technological level and promote common economic
development.
The Chinese government supports powerful enterprises to carry out various forms of
mutually beneficial cooperation abroad to promote common development with the host
country. By the end of 2017, a total of 20 cooperation zonesA were established by Chinese
investment entities and confirmed by the Ministry of Commerce. They are distributed
along the “One Belt and One Road” countries and African countries, and become the
important platform for Chinese enterprises to participate in the “One Belt and One Road”
and the industrialization cooperation strategy and foreign investment of China and Asian
countries.
1. Cambodia Sihanoukville Special Economic Zone The Sihanoukville Special Economic Zone in Cambodia is a state-level economic
and trade cooperation zone jointly led by the Hongdou Group and jointly developed
by the four Chinese and Cambodian enterprises in Sihanoukville, Cambodia. It is
the first cooperation zone to sign a bilateral government agreement and establish a
bilateral coordination mechanism. The cooperation zone is also a landmark project on
A They are Cambodia Sihanoukville Special Economic Zone, Thailand Taizhong Rayong Industrial Park, Vietnam Longjiang Industrial Park, Pakistan Haier-Rouba Economic Zone, Zambia China Economic and Trade Cooperation Zone, Egypt Suez Economic and Trade Cooperation Zone, Nigerian Leki Freedom Trade Zone, Ethiopian Oriental Industrial Park, Russia Ussuriysk Economic and Trade Cooperation Zone, China Russia Tomsk Timber Industry and Trade Cooperation Zone, China Russia Modern Agriculture Industry Cooperation Zone, Russia Longyue Forestry Economic and Trade Cooperation, Hungary Central European Trade Logistics Park, China Indonesia Julong Agricultural Industry Cooperation Zone, China-Indonesia Economic and Trade Cooperation Zone, China-Hungary-Baosid Economic and Trade Cooperation Zone, Uzbekistan Pengsheng Industrial Park, Vientiane Sai Tower Comprehensive Development Zone, Kyrgyzstan Asia Star Agricultural Industry Cooperation Zone, China Indonesia Integrated Industrial Park Qingshan Park.
5. Regional Economic Cooperation between China and Developing Countries in Asia
139
the “One Belt and One Road” and has been highly recognized by the leaders of China
and Cambodia. Located in Southeast Asia, Cambodia is an important country along
the “21st Century Maritime Silk Road”. Cambodia has ample labor and low costs. In
2004, Cambodia joined the WTO and is one of the countries with the highest degree
of economic freedom in the world. At the same time, Cambodia can also enjoy special
trade preferential policies and additional tariff reductions offered by developed countries
such as Europe and the United States. The Westport Special Zone, where the cooperation
zone is located, is the largest special economic zone in Cambodia with a total planned
area of 11.13 square kilometers. It is consistent with the development characteristics of
Cambodia’s industrial development in terms of development orientation, ensuring the
sustainable development of the special admirative region construction. In the early stage,
textiles and garments, luggage and leather goods, hardware machinery, and wood products
were the main development industries. In the later period, the advantages of port-side
will be exerted, and machinery, equipment, building materials and other industries will be
introduced.
As an ASEAN member country, Cambodia has joined the market of nearly 600
million people in ten countries. The comprehensive completion of the China-ASEAN Free
Trade Area provides a strategic opportunity for Chinese companies to enter the ASEAN
countries. In addition, ASEAN has signed a free trade agreement with South Korea,
Japan, India, New Zealand and Australia to invest in Cambodia. And the enterprises will
also have a large market of “10+6” zero tariffs in ASEAN.
The Westport Special Economic Zone is the only Sino-Cambodian national
special economic zone identified by the Chinese and Cambodian governments. It is
also the first cooperation zone to sign a bilateral government agreement and establish
a bilateral government coordination mechanism. Since the foundation of the Westport
Special Zone in 2008, with the strong support of the Chinese and Cambodian bilateral
government departments, the Westport Special Zone has completed the first five-square-
kilometer park prototype, and initially completed the access, power supply, water supply,
communication, sewage disposal and peaceful construction with 100 workshops; there is
also a comprehensive service center building, a staff dormitory, a bazaar market, a living

China Development Report on South-South Cooperation 2017
140
service area and other infrastructures that integrate office, residence, catering, culture and
entertainment, becoming the largest and best environmental industrial park in Cambodia.
2. China-Vietnam Economic and Trade Cooperation ZoneChina Vietnam (Shenzhen-Haiphong) Economic and Trade Cooperation Zone is
located in Haiphong City, the largest port city in northern Vietnam. It is invested by
Shenzhen Investment Holdings Co., Ltd., the largest state-owned enterprise in Shenzhen.
It is located in Haiphong, the largest port city in northern Vietnam, with a total investment
of $175 million. The first phase of the planned area is 196 hectares. The cooperation zone
is specifically responsible for the construction and operation of Shenzhen Vietnam United
Investment Co., Ltd. Haiphong City, where it is located, is not only the third largest city
in Vietnam, but also the center of the “two corridors and one circle” of the Vietnam-China
economy. It is the largest deep-water port and logistics center in northern Vietnam. There
are 20 main berths in the port area with a maximum water depth of about 9 meters, which
can be used to dock 10,000-ton ships. The Shenzhen-Vietnam Cooperation Zone is 20
kilometers away from Haiphong International Cat Bi Airport and 100 kilometers away
from Hanoi International Airport. The two airports have direct flights to Beijing, Hong
Kong, Macau, Guangzhou and Shanghai. China Vietnam (Shenzhen-Haiphong) Economic
and Trade Cooperation Zone is an overseas cooperation zone approved by the Ministry of
Commerce.
China Vietnam (Shenzhen-Haiphong) economic and trade cooperation zone is
pursuing the national “One Belt and One Road” initiative, creating an international
capacity cooperation model of “China headquarters + overseas factory” and building
an important platform for Chinese enterprises to “go global”. Its initial development
area is 60 hectares, and the first phase of investment construction was completed by the
end of 2017. The second phase of development covers an area of 111 hectares and will
be completed in 2019. The third phase of the development area of 15 hectares is aimed
to constructing public service areas and supporting living areas which is planned to be
completed by the end of 2022. The cooperation zone is equipped with a variety of modern
standard factory buildings, office buildings and residential buildings. The ecological

5. Regional Economic Cooperation between China and Developing Countries in Asia
141
parks, commercial and public service facilities, and water circuit bridge infrastructure
are advanced and fully equipped, and the needs of technology-oriented enterprises that
focus on green environmental protection are fully considered. The industrial positioning
of the cooperation zone is mainly based on light industry manufacturing, focusing on the
introduction of green technology enterprises with brand recognition and international
competitiveness, and the Shenzhen-Vietnam Cooperation Zone has become an excellent
enterprise gathering area and famous product display area representing “Made in
Shenzhen” and “Made in China”.
The tax rate paid by Vietnamese enterprises is 20%. The enterprises that enter the
park can receive the preferential treatment of “two exemptions and four reductions”, that
is, tax exemption for two years from the year of profit, and the tax rate for the next four
years is 50% of the tax payable; projects that meet the high-tech enterprises identified in
Vietnam can receive preferential policies such as “four exemptions and nine reductions”,
that is, four years from the year of profit-free tax, and the subsequent nine-year tax rate
is 50% of the tax payable; trade with countries such as Europe and the United States
enjoys more preferential tariffs and quotas. Imported raw materials for export purposes
are exempt from customs duties, and most of the goods imported and exported in the 10
ASEAN regions are subject to zero tariffs.
3. China Indonesia Julong Agricultural Industry Cooperation ZoneChina Indonesia Julong Agricultural Industry Cooperation Zone is located in
Kalimantan Island, Indonesia. It was invested and constructed by Tianjin Bangzhu
Trading Co., Ltd., a wholly-owned subsidiary of Tianjin Julong Jiahua Investment
Group Co., Ltd. in 2011, and the main overseas construction enterprise is Indonesia
Graha Company, and Bangzhu Company holds 95% of the shares. In August 2016,
the cooperation zone was confirmed by the Ministry of Commerce and the Ministry of
Finance, and was officially approved as a national-level overseas economic and trade
cooperation zone.
China Indonesian Julong Agricultural Industry Cooperation Zone has adopted
the “one district, multiple parks” model, including the Central Kalimantan Park on the
China Development Report on South-South Cooperation 2017
142
Kalimantan Island in Indonesia, the South Kalimantan Park, the West Kalimantan Park,
the North Kalimantan Park, and the Lampung Port Park in Lampung Province, Sumatra,
Indonesia. Among them, the Central Kalimantan Park, the South Kalimantan Park, the
West Kalimantan Park and the North Kalimantan Park can radiate 10 plantations in
Kalimantan, and the Lampung Park can take advantage of its geographical transportation
as a deep processing center for palm oil and an international logistics center.
As for policy of the two countries, China and India signed the Investment Protection
Agreement, the Maritime Agreement, the Double Taxation Avoidance Agreement,
and signed a memorandum of understanding on cooperation in agriculture, forestry,
and fisheries, providing protection for Chinese companies to invest in Indonesia. Up
to now, the cooperation area has completed a total investment of $115.178 million.
The infrastructure in the district has been continuously optimized and perfected.
Infrastructures such as roads, water supply, power supply, drainage, communication
and leveling of land have been completed. At the same time, office spaces, employee
apartments, sports fitness, dining and entertainment facilities have also been established.
Up to now, the cooperation area has completed a total investment of $115.178 million.
4. Uzbekistan Pengsheng Industrial ParkUzbekistan Pengsheng Industrial Park is located in the Syr State of the Republic
of Uzbekistan. It was approved by the Ministry of Commerce of China in March 2009
and was invested by Wenzhou Jinsheng Trading Co., Ltd. In March 2013, the park was
approved by the Ukrainian government as the division of the Dzizak Industrial Zone in
the Syr River. In August 2016, it was confirmed by the Ministry of Commerce and the
Ministry of Finance as China’s national-level overseas economic and trade cooperation
zone, and has been invested a total of about $99.4 million. The park covers an area of 102
hectares and is about 70 kilometers away from the capital city of Tashkent. Uzbekistan
is located in the hinterland of Central Asia. Its population accounts for more than half
of the five Central Asian countries. Uzbekistan has been an important node on the Silk
Road since ancient times and has a long history of cultural and economic exchanges with
China.

5. Regional Economic Cooperation between China and Developing Countries in Asia
143
The park planning and industrial positioning is a manufacturing park. The park
construction relies on Uzbekistan’s superior resources and uses China’s mature technology
and private capital to produce products suitable for local, neighboring countries and
China. At present, the park has settled in enterprises such as ceramic tiles, tanning,
shoes, faucet valves, sanitary ware, pet food and casing products. Among the entering
enterprises, Pengsheng Ceramics Factory is the first enterprise to be put into production
in the park. It reached the annual production capacity of 6 million square meters of
various types of ceramic tiles by the end of 2010, and has achieved good economic and
social benefits. In July 2016, the company launched a new ceramic tile production line.
The ceramic tile products currently produced have an absolute market share in the local
market of Uzbekistan, and some products are exported to neighboring countries and
regions such as Kazakhstan and Kyrgyzstan. The faucet valve and sanitary ware factory
is a joint venture with Uzbekistan’s state-owned Al Marek Mining and Metallurgical
Company, and it is the latest company entering the park. Uzbekistan’s copper reserves
and production are among the highest in the world, and copper and zinc are of good
quality and competitive price. The joint venture company introduces mature technology
and equipment from China, and produces faucets, valves, water separators, bathroom
accessories and other products locally. At this stage, the annual output can reach 2 million
faucets, 30 million valves and 200,000 water separators. The products are mainly sold in
Uzbekistan as well as Central Asian countries, the Commonwealth of Independent States
and China. The joint venture company also established a national laboratory for faucet
bathroom products with the National Bureau of Standards of Uzbekistan, and jointly
established Uzbekistan’s national standards for the industry.
5. China-Indonesia Economic and Trade Cooperation ZoneThe China-Indonesia Economic and Trade Cooperation Zone was established in
2008. Its construction enterprises are Guangxi Agricultural Reclamation Group Co., Ltd.
and Indonesian Bumi Baraba Automobile Assembly Company. The China-Indonesia
Economic and Trade Cooperation Zone is located on the industrial promenade in the
eastern capital of Jakarta, Indonesia. It is strategically located 37 km from Jakarta, 65 km
China Development Report on South-South Cooperation 2017
144
from Sukarno International Airport and 50 km from Jakarta International Port – Tanjung
Priok Port and 128 km from Bandung. The Yawan Expressway under construction has a
site near the cooperation zone, and one can enter the park 37 kilometers from the Yawan
Expressway. The China-Indonesia Economic and Trade Cooperation Zone is the first
national-level comprehensive industrial park set up by China in Indonesia, integrating
industrial production, warehousing and trade. It is also the first economic and trade
cooperation zone established by Guangxi Province outside China. The industrial corridor
of the China-Indonesia Economic and Trade Cooperation Zone in China-Indonesia
Economic and Trade Cooperation Zone has attracted famous enterprises from China,
Japan, South Korea, Taiwan (China) and other countries and regions, such as Shanghai
Automotive Industry Corporation, General Motors, Wuling, Honda, Mitsubishi, HANKO
Tire, Haier, etc. The industrial agglomeration effect is obvious. In August 2016, the
cooperation zone confirmed the assessment through the Ministry of Commerce and the
Ministry of Finance.
The overall planning area of the cooperation zone is 455 hectares, of which 205
hectares are planned for the first phase. The main functions and industrial positioning
are auto parts manufacturing, machinery manufacturing, deep processing of agricultural
products, building materials, warehousing and logistics services, etc. For the second
phase, it is planned to build 255 hectares. The main functions and industries are
positioned as bonded logistics, fine manufacturing, intelligent manufacturing, commercial
catering and hotel support. The overall goal is to transform the cooperation zone into
a modern international economic and trade cooperation zone integrating industrial
production, commerce, warehousing and service, and an important production, sales and
distribution center of China’s advantageous industries in Indonesia.
In terms of preferential policies, foreign companies use mechanical equipment, spare
parts and auxiliary equipment and other basic materials exempt from import duties and
value-added tax; foreign companies produce raw materials for self-use for 2 years exempt
from import duties and fees; raw materials for export products can be returned for import
duties; expenditure for research and development, scholarships, education and training,
and waste disposal by foreign companies can be included in the cost and deducted from
5. Regional Economic Cooperation between China and Developing Countries in Asia
145
gross income; it can provide 8-10 years of loss carryover or increase the depreciation
rate of equipment and buildings for key areas encouraged by the government. Since
2010, Indonesia has adopted a flat rate of 25%. Listed companies that meet 40% of the
minimum listing requirements and other conditions are entitled to a standard rate of
5%, and provide them with a 20% effective tax rate. Small businesses, that is corporate
taxpayers with an annual turnover of no more than 50 billion rupees, are entitled to a
50% discount on the standard rate. Taxable income is levied on a pro rata basis for a total
turnover of up to 4.8 billion rupees.
The China-Indonesia Economic and Trade Cooperation Zone has completed a total
investment of $160 million. In the first phase, it completed 205 hectares of earthwork
leveling and completed the construction of roads, water supply, sewage, electricity,
telecommunications, gas and other infrastructure, and has the conditions for enterprises to
settle in the construction. The cooperation zone completed the construction of supporting
facilities such as 20,366 square meters of standard factory buildings and 3,841 square
meters of office buildings. The land for the second phase of the project is carrying out
land acquisition work, and at the same time, the preparatory work for the project land use
planning is carried out. Up to now, there have been 34 enterprises in the cooperation zone,
including 12 Chinese-funded or Chinese-funded holding enterprises, mainly including
China Oilfield Services Limited, China Western Power Group, Haipai Technology,
Nantong Kangqiao Grease Company and other well-known enterprises. And also other
companies that come from different countries and regions such as Indonesia, Japan,
France, New Zealand, Finland, and Malaysia.
6. Kyrgyzstan Asia Star Agricultural Industry Cooperation ZoneKyrgyzstan’s Asia Star Agricultural Industry Cooperation Zone is located in Iskra
Town, Chuy District, Chuy Prefecture, Kyrgyzstan. The founding company is Asia Star
Co., Ltd., and Henan Guiyou Industrial Group Co., Ltd. owns 100% shares. In August
2016, the cooperation zone passed the assessment of the “Outside Economic and Trade
Cooperation Zone” of the Ministry of Commerce and the Ministry of Finance. The
cooperation zone is located 60 kilometers east of Bishkek and 916 meters above sea

China Development Report on South-South Cooperation 2017
146
level. The cooperation zone is 3 kilometers away from the border crossing of Jihakarasu,
with the Jiha Expressway in the north and the Bishkek-Tokmak-Balkek Railway in the
south. The geographical position is superior and the transportation is convenient. It
covers an area of 5.67 square kilometers and a building area of 190,000 square meters.
Kyrgyzstan Asia Star Agricultural Industry Cooperation Zone has been built adopting
the development model of “introduction and outreach, group development, industrial
chain integration”, including agricultural planting, livestock and poultry breeding, feed
processing, slaughtering and processing, quick-frozen food, logistics and warehousing,
agricultural machinery parts, agricultural free trade bonded areas, and international trade.
Based on Kyrgyzstan’s geographical policy advantages, the cooperation zone is
geared to the needs of international markets such as Central Asia and Russia, making full
use of Kyrgyz’s good agricultural and animal husbandry resources and China’s technical
capital advantages; following the circular economy concept of the livestock and poultry
industry; establishing animal epidemic prevention and product traceability systems;
building a comprehensive industrial chain covering livestock and poultry breeding
slaughtering and processing, food deep processing, and international trade logistics;
creating a comprehensive agricultural industry cooperation integrating breeding, large-
scale breeding, slaughtering and processing, deep processing of agricultural and livestock
products, warehousing and logistics, and international marketing; realizing the gathering
of overseas agricultural industries; and forming an international capacity cooperation
platform for agricultural fields with international influence in Central Asia, and a bonded
platform for agricultural products processing trade in China-Central Asia.
The development of the cooperation zone should be adapted to local conditions, give
play to regional advantages, make full use of the existing facilities of the park, enlarge
and strengthen the leading industries, extend the industrial chain, focus on improving the
comprehensive benefits of the industrial park, form a unique agricultural product breeding
area and industrial belt, and build an intensive, comprehensive, open and efficient modern
agricultural industrial park with high, new, excellent and special characteristics. Based
on the principle of ecological suitability, the cooperation zone develops modern animal
husbandry, promotes industrialization, focuses on introducing enterprises with advantages
5. Regional Economic Cooperation between China and Developing Countries in Asia
147
in technology, production and management; and unifies import, breeding, processing
and sales, vigorously develops large-scale enterprises with professional division of
industry chain; uses the policy advantages of the cooperation zone platform to establish
an efficient and sufficient market network, provides various information and services for
producers, operators and managers and creates multiple multinational agricultural brands
to improve the comparative income of the industrial park industry.

148
6. South-South Cooperation between China and Southeast Asian Countries
China and Southeast Asian countries are quite rootedA. It is not only geographically
close, but also has a long history of economic and trade exchanges. From the perspective
of development, the vast majority of Southeast Asian countries are in the developing
stage as same as China. This chapter analyzes South-South cooperation between China
and Southeast Asian countries from three aspects of trade, investment and foreign aid
relations.
6.1 The Trade Relations between China and Southeast Asian CountriesIn recent years, China and Southeast Asian countries have close trade links, mainly
in the cooperation between China and ASEAN countries. The closeness of cooperation
has been strengthened with the continuous deepening of the China-ASEAN Free Trade
Area. In November 2004, China and ASEAN signed the China-ASEAN Free Trade
Area Agreement on Goods Trade, which marked the official start of free trade in the
China-ASEAN Free Trade Area. In July 2005, the tax cuts on more than 7,000 lines of
commodities in the Goods Trade Agreement were gradually implemented. On January
1, 2010, the China-ASEAN Free Trade Area was formally established. After the official
completion of the China-ASEAN Free Trade Area, in October 2013, Premier Li Keqiang
proposed for the first time at the China-ASEAN Leaders Summit to build an “upgraded
version” of the China-ASEAN Free Trade Agreement. On November 22, 2015, the
leaders of the 11 countries signed the “Protocol of the People’s Republic of China and
the Association of Southeast Asian Nations on Amending the Framework Agreement on
A There are 11 countries in ASEAN and 11 countries in East Timor. Due to the small scale of East Timor’s economy and the lack of statistical data, the Southeast Asian countries analyzed in this chapter refer only to 10 ASEAN countries.

6. South-South Cooperation between China and Southeast Asian Countries
149
Comprehensive Economic Cooperation” between China and ASEAN and the Protocols
under the Agreement. This is also the first “upgraded” version of the agreement between
China and other countries or regions on the establishment of a free trade area, which
is mainly aimed to improve, upgrade and deepen the original ASEAN Free Trade Area
Agreement.
In the context of the continuous deepening of the China-ASEAN Free Trade Area,
this section will study the trade relations between China and Southeast Asian countries
in terms of trade scale and growth, the pattern of trade, and trade competitiveness and
complementarity.
6.1.1 Bilateral Trade and Growth
1. The overall tradeThe trade in goods between China and Southeast Asian countries has grown rapidly
since 2000, and the total trade volume has reached record highs. Specifically, the total
trade volume between China and Southeast Asian countries showed some fluctuations
while increasing overall from 2000 to 2016, which was mainly reflected in the decline
in the total trade volume of China and Southeast Asian countries in 2009, 2015 and
2016, due to the decline in the total global merchandise trade in the past three years.
Even under such volatility, the total trade volume between China and Southeast Asian
countries increased from $35.9 billion in 2000 to $455.3 billion in 2016, increased about
11.6 times. The proportion of trade with Southeast Asian countries to the trade of China
and the world also showed a clear upward trend, rising from 8.46% in 2000 to 12.27% in
2016. Comparing the import and export situation, in 2000, China’s exports to Southeast
Asian countries only accounted for 6.96% of China’s total exports, and this proportion
showed a clear upward trend increasing to 12.20% by 2016. In contrast, China’s imports
from Southeast Asian countries account for a slightly different proportion of China’s total
imports. Since the implementation of the China-ASEAN Free Trade Area Early Harvest
Program, the proportion of China’s imports from Southeast Asian countries to China’s
total imports has been relatively stable, basically ranging from 11.13% to 12.66%.

China Development Report on South-South Cooperation 2017
150
Moreover, in most years since 2000, China’s imports from Southeast Asian countries
accounted for a greater proportion of total imports than that of China’s exports to
Southeast Asian countries, and the proportion difference in imports and exports of some
years exceeded 5%.
Since 2000, the trade in goods between China and Southeast Asian countries has
grown rapidly. The average annual growth rate of China’s exports to Southeast Asian
countries is 18.3%, and the average annual growth rate of China’s imports from Southeast
Asian countries is 14.6%. With the 2008 global financial crisis as the dividing line, the
trade growth rate of China and Southeast Asian countries before 2008 is significantly
higher than that after the financial crisis. The reason for the rapid growth of trade between
China and ASEAN countries before 2008 was mainly due to the fact that the two parties
signed the trade agreement in 2004 and cut tariffs sharply from 2005, which significantly
contributed to the rapid growth of commodity trade. After 2009, in the context of
weak global trade growth, the growth rate of trade between China and Southeast Asian
countries is inevitably affected, so the growth rate is significantly lower than that before
2008. Despite this, the share of Southeast Asian countries in China’s import and export
trade has increased since 2009, reflecting the increasingly close trade links between the
two sides.
Table 6.1.1-1 China’s Overall Trade with Southeast Asia
(US$ Billion, %)
Year Total trade Share Total Export Share Total Import share
2000 39.522 8.46 17.341 6.96 22.181 10.18
2001 41.591 8.30 18.376 6.91 23.215 9.89
2002 54.781 9.04 23.584 7.24 31.197 11.13
2003 78.255 9.48 30.927 7.06 47.328 12.21
2004 105.867 9.49 42.899 7.23 62.967 12.05
2005 130.361 9.54 55.367 7.27 74.994 12.40
2006 160.838 9.53 71.311 7.36 89.527 12.47
2007 203.226 9.72 94.717 7.76 108.509 12.47
2008 231.320 9.36 114.317 7.99 117.003 11.25
6. South-South Cooperation between China and Southeast Asian Countries
151
Year Total trade Share Total Export Share Total Import share
2009 213.011 10.04 106.297 8.85 106.714 11.61
2010 292.838 10.21 138.160 8.76 154.678 12.00
2011 363.096 10.32 170.076 8.96 193.021 11.91
2012 400.143 10.74 204.274 9.97 195.868 11.69
2013 443.599 11.09 244.040 11.05 199.559 11.13
2014 480.286 11.55 272.046 11.61 208.240 11.48
2015 471.766 12.38 277.291 12.20 194.475 12.66
2016 452.308 12.27 256.001 12.20 196.307 12.36
Source: Calculated according to the UN COMTRAD database.
2. Trade balance and its changes According to Figure 6.1.1-1, the trade balance between China and Southeast Asian
countries has changed significantly. From 2000 to 2012, China’s trade with Southeast
Asian countries has been in a deficit, with the deficit amount reaching a maximum of $22.9
billion in 2011. After 2012, China’s trade balance with Southeast Asian countries turned
into a surplus and reached a peak of $82.8 billion in 2015. The main reason for the shift
in trade balance between China and Southeast Asian countries from deficit to surplus is
the shift in global production and trade patterns. After China’s accession to the WTO, it
quickly integrated into the global production system, importing intermediate products
and raw materials in a large number of global value chain divisions, and exporting final
products. In this division of value chain, the intermediate products and raw materials
exported by Southeast Asian countries to China had increased rapidly, making China’s
foreign trade show a “triangular trade” pattern of trade deficits with Southeast Asian
countries and trade surplus with Europe and the United States. However, after the global
financial crisis in 2008, the degree of division of labor in the global value chain has
declined. In addition, China’s economic growth has slowed since 2013, and the demand
for imports from Southeast Asian countries has grown relatively slowly. China’s trade
deficit with Southeast Asian countries has gradually disappeared.
Continued
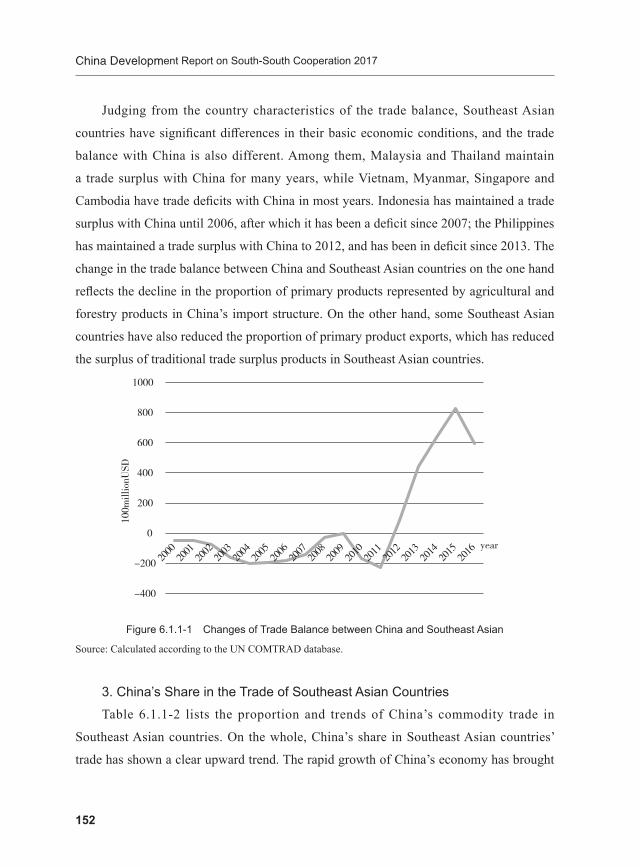
China Development Report on South-South Cooperation 2017
152
Judging from the country characteristics of the trade balance, Southeast Asian
countries have significant differences in their basic economic conditions, and the trade
balance with China is also different. Among them, Malaysia and Thailand maintain
a trade surplus with China for many years, while Vietnam, Myanmar, Singapore and
Cambodia have trade deficits with China in most years. Indonesia has maintained a trade
surplus with China until 2006, after which it has been a deficit since 2007; the Philippines
has maintained a trade surplus with China to 2012, and has been in deficit since 2013. The
change in the trade balance between China and Southeast Asian countries on the one hand
reflects the decline in the proportion of primary products represented by agricultural and
forestry products in China’s import structure. On the other hand, some Southeast Asian
countries have also reduced the proportion of primary product exports, which has reduced
the surplus of traditional trade surplus products in Southeast Asian countries.
6
-400
-200
0
200
400
600
800
1000
2000
2001
2002
2003
2004
2005
2006
2007
2008
2009
2010
2011
2012
2013
2014
2015
201
100m
illionU
SD
year
Figure 6.1.1-1 Changes of Trade Balance between China and Southeast Asian
Source: Calculated according to the UN COMTRAD database.
3. China’s Share in the Trade of Southeast Asian CountriesTable 6.1.1-2 lists the proportion and trends of China’s commodity trade in
Southeast Asian countries. On the whole, China’s share in Southeast Asian countries’
trade has shown a clear upward trend. The rapid growth of China’s economy has brought
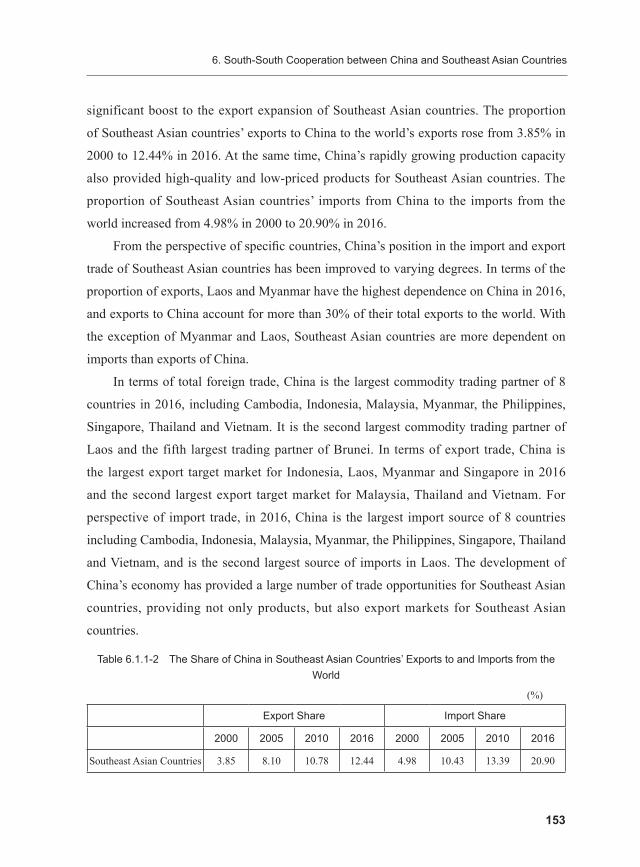
6. South-South Cooperation between China and Southeast Asian Countries
153
significant boost to the export expansion of Southeast Asian countries. The proportion
of Southeast Asian countries’ exports to China to the world’s exports rose from 3.85% in
2000 to 12.44% in 2016. At the same time, China’s rapidly growing production capacity
also provided high-quality and low-priced products for Southeast Asian countries. The
proportion of Southeast Asian countries’ imports from China to the imports from the
world increased from 4.98% in 2000 to 20.90% in 2016.
From the perspective of specific countries, China’s position in the import and export
trade of Southeast Asian countries has been improved to varying degrees. In terms of the
proportion of exports, Laos and Myanmar have the highest dependence on China in 2016,
and exports to China account for more than 30% of their total exports to the world. With
the exception of Myanmar and Laos, Southeast Asian countries are more dependent on
imports than exports of China.
In terms of total foreign trade, China is the largest commodity trading partner of 8
countries in 2016, including Cambodia, Indonesia, Malaysia, Myanmar, the Philippines,
Singapore, Thailand and Vietnam. It is the second largest commodity trading partner of
Laos and the fifth largest trading partner of Brunei. In terms of export trade, China is
the largest export target market for Indonesia, Laos, Myanmar and Singapore in 2016
and the second largest export target market for Malaysia, Thailand and Vietnam. For
perspective of import trade, in 2016, China is the largest import source of 8 countries
including Cambodia, Indonesia, Malaysia, Myanmar, the Philippines, Singapore, Thailand
and Vietnam, and is the second largest source of imports in Laos. The development of
China’s economy has provided a large number of trade opportunities for Southeast Asian
countries, providing not only products, but also export markets for Southeast Asian
countries.
Table 6.1.1-2 The Share of China in Southeast Asian Countries’ Exports to and Imports from the World
(%)
Export Share Import Share
2000 2005 2010 2016 2000 2005 2010 2016
Southeast Asian Countries 3.85 8.10 10.78 12.44 4.98 10.43 13.39 20.90

China Development Report on South-South Cooperation 2017
154
Export Share Import Share
2000 2005 2010 2016 2000 2005 2010 2016
Brunei — 2.32* 6.59 4.67 — 7.86* 7.84 13.04
Cambodia 1.74 0.47 1.16 6.05 7.96 16.62 24.20 36.79
Indonesia 4.46 7.78 9.95 11.62 6.09 10.18 15.07 22.73
Laos — — 11.67 36.12 — — 9.79 18.24
Malaysia 3.08 6.56 12.60 12.54 3.99 11.63 12.57 20.38
Myanmar — — 6.25 40.84 — — 27.10 34.42
Philippines 1.74 9.88 11.12 11.00 2.37 6.33 8.47 18.53
Singapore 3.90 8.58 10.33 12.99 5.29 10.24 10.83 14.28
Thailand 4.09 8.30 10.99 11.04 5.51 9.55 13.46 21.91
Vietnam 10.61 10.01 10.72 12.43 8.96 16.05 23.81 28.60
Source: Calculated according to the UN COMTRAD database.
Note: — represents data missing, * is 2006 data.
4. Trade growth and changes In recent years, China’s foreign trade has grown rapidly, and as of 2016, China’s
total merchandise trade to the world is equivalent to 789% of that in 2000. Exports and
imports are equivalent to 842% and 729% in 2000, with an average annual growth rate
of 14.2% and 13.2%, respectively. In 2016, the total trade volume between China and
Southeast Asian countries was equivalent to 1144% of that in 2000. The export and
import were equivalent to 1476% and 885% respectively of that in 2000, and the average
annual growth rate was about 18.3% and 14.6% respectively (Figure 6.1.1-2). Before
2012, the development of China’s trade with Southeast Asian countries was basically the
same as that of China’s overall foreign trade, both showed rapid growth before 2009 with
a significant decline due to the financial crisis, and followed an obvious recovery in 2010-
2011. After 2012, China’s growth rate of imports from the world and exports to the world
have slowed, and there was a significant decline in 2015 and 2016. China’s import trends
from Southeast Asian countries are basically the same as China’s imports from the world,
Continued
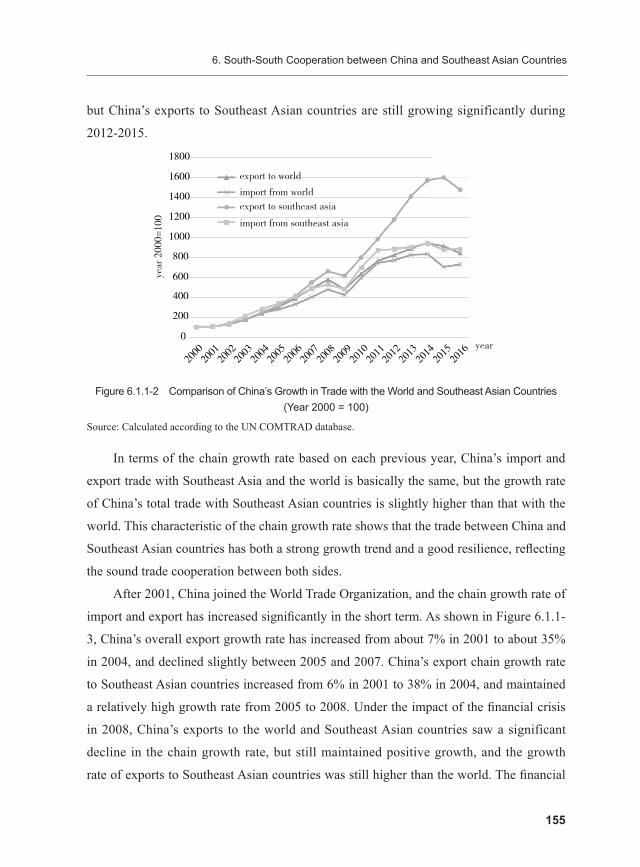
6. South-South Cooperation between China and Southeast Asian Countries
155
but China’s exports to Southeast Asian countries are still growing significantly during
2012-2015.
1800
1600
1400
1200
1000
800
600
400
200
0
2000
2001
2002
2003
2004
2005
2006
2007
2008
2009
2010
2011
2012
2013
2014
2015
2016
year
year
200
0=10
0
export to world
import from worldexport to southeast asia
import from southeast asia
Figure 6.1.1-2 Comparison of China’s Growth in Trade with the World and Southeast Asian Countries (Year 2000 = 100)
Source: Calculated according to the UN COMTRAD database.
In terms of the chain growth rate based on each previous year, China’s import and
export trade with Southeast Asia and the world is basically the same, but the growth rate
of China’s total trade with Southeast Asian countries is slightly higher than that with the
world. This characteristic of the chain growth rate shows that the trade between China and
Southeast Asian countries has both a strong growth trend and a good resilience, refl ecting
the sound trade cooperation between both sides.
After 2001, China joined the World Trade Organization, and the chain growth rate of
import and export has increased signifi cantly in the short term. As shown in Figure 6.1.1-
3, China’s overall export growth rate has increased from about 7% in 2001 to about 35%
in 2004, and declined slightly between 2005 and 2007. China’s export chain growth rate
to Southeast Asian countries increased from 6% in 2001 to 38% in 2004, and maintained
a relatively high growth rate from 2005 to 2008. Under the impact of the fi nancial crisis
in 2008, China’s exports to the world and Southeast Asian countries saw a significant
decline in the chain growth rate, but still maintained positive growth, and the growth
rate of exports to Southeast Asian countries was still higher than the world. The fi nancial
China Development Report on South-South Cooperation 2017
156
crisis caused a negative growth in China’s exports in 2009, and rebounded sharply in
2010. Since 2011, the chain growth rate of China’s total export to the world has slowed
down, but China’s exports to Southeast Asian countries have been growing at a higher
rate than that to the world. And during 2012-2013, growth rate of China’s export to the
world dropped sharply while China’s export growth rate to Southeast Asian countries did
not drop significantly.
-20
-10
0
10
20
30
40
50
2001
2002
2003
2004
2005
2006
2007
2008
2009
2010
2011
2012
2013
2014
2015
2016Y
ear-
on-y
ear
grow
th r
ates
export to world export to southeast asia
year
Figure 6.1.1-3 Comparison of China’s Export Chain Growth Rate to the World and to Southeast Asian Countries
Source: Calculated according to the UN COMTRAD database.
Regarding to China’s imports, the chain growth rate is basically the same as that
of exports, but the fluctuation is even greater. After China joined the WTO in 2001,
China’s import growth rate from the world has remained at a double-digit level during
2002-2008, with a highest of 38% in 2003. At the same time, China’s import growth rate
from Southeast Asian countries also maintained higher level, with the highest of 51% in
2003. However, China’s import growth from the world and Southeast Asian countries
experienced a sharp fluctuation from 2009 to 2011, and turned into slow growth since
2012. In 2015, the imports from the world and Southeast Asian countries declined in line
with the global trade.
It is worth noting that the chain growth of trade between China and Southeast Asian
countries has slowed down in recent years, and there is a risk of insufficient stamina. First
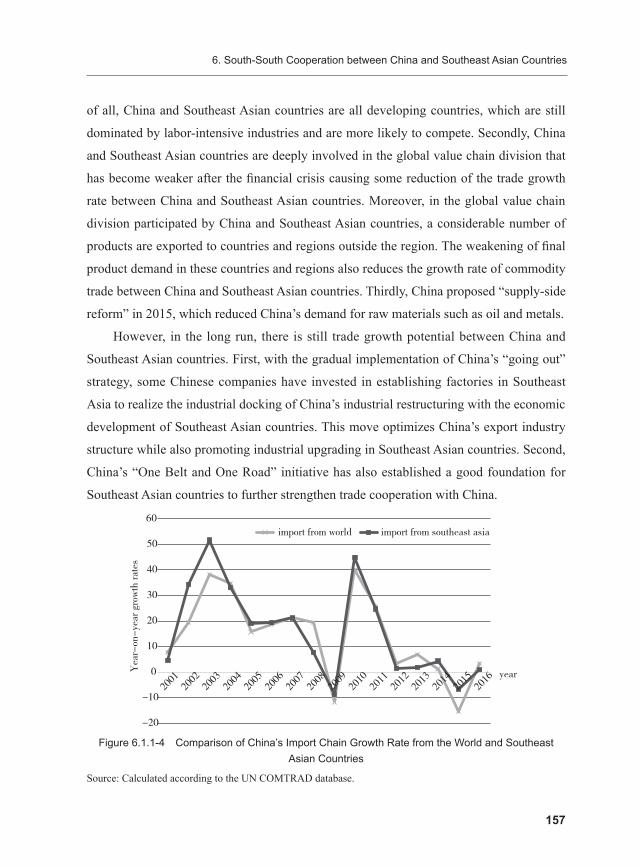
6. South-South Cooperation between China and Southeast Asian Countries
157
of all, China and Southeast Asian countries are all developing countries, which are still
dominated by labor-intensive industries and are more likely to compete. Secondly, China
and Southeast Asian countries are deeply involved in the global value chain division that
has become weaker after the financial crisis causing some reduction of the trade growth
rate between China and Southeast Asian countries. Moreover, in the global value chain
division participated by China and Southeast Asian countries, a considerable number of
products are exported to countries and regions outside the region. The weakening of final
product demand in these countries and regions also reduces the growth rate of commodity
trade between China and Southeast Asian countries. Thirdly, China proposed “supply-side
reform” in 2015, which reduced China’s demand for raw materials such as oil and metals.
However, in the long run, there is still trade growth potential between China and
Southeast Asian countries. First, with the gradual implementation of China’s “going out”
strategy, some Chinese companies have invested in establishing factories in Southeast
Asia to realize the industrial docking of China’s industrial restructuring with the economic
development of Southeast Asian countries. This move optimizes China’s export industry
structure while also promoting industrial upgrading in Southeast Asian countries. Second,
China’s “One Belt and One Road” initiative has also established a good foundation for
Southeast Asian countries to further strengthen trade cooperation with China.
-20
-10
0
10
20
30
40
50
60
2001
2002
2003
2004
2005
2006
2007
2008
2009
2010
2011
2012
2013
2014
2015
2016
Yea
r-on
-yea
r gr
owth
rat
es
year
import from world import from southeast asia
Figure 6.1.1-4 Comparison of China’s Import Chain Growth Rate from the World and Southeast Asian Countries
Source: Calculated according to the UN COMTRAD database.

China Development Report on South-South Cooperation 2017
158
6.1.2 The Pattern of Trade between China and Southeast Asian CountriesWe are going to analyze the country pattern of trade between China and Southeast
Asian countries, firstly, and then the commodity trade structure according to the product,
factor density and technology intensity classification.
1. Country structure of China’s trade with Southeast Asian countriesThe country structure of China’s trade with Southeast Asian countries is characterized
as the following: Firstly, the former ASEAN countries (Singapore, Malaysia, Thailand,
Indonesia, the Philippines, and Brunei) accounted for 95.0% and 77.9% of the imports
and exports between Southeast Asian countries and China in 2000, and fell to 87.1% and
71.0% respectively in 2016. Among them, the proportions of imports and exports trade
with Singapore and Indonesia have dropped significantly. The proportion of import and
export trade with Malaysia’s has not changed significantly, and the proportion of imports
and exports in the Philippines has increased. Secondly, the import and export proportions
of new ASEAN members (Vietnam, Laos, Myanmar, Cambodia) in Southeast Asia and
China increased from 5.0% and 12.9% in 2000 to 22.1% and 29.0% in 2016, respectively.
Among the new members of ASEAN, Vietnam accounts for the most significant
increase in the proportion of trade between China and Southeast Asian countries. As the
least developed countries in Southeast Asia, Laos, Myanmar and Cambodia have also
significantly increased their trade cooperation with China, despite their small economies
and low levels of development. In 2016, the proportion of import and export with Laos,
Myanmar and Cambodia to the imports and exports between China and Southeast Asian
countries have all increased compared with that in 2000.
Table 6.1.2-1 Country Structure of Import and Export between China and Southeast Asian Countries
(%)
Export Proportion Import Proportion
Year 2000 2005 2010 2016 2000 2005 2010 2016
Brunei 0.1 0.1 0.3 0.2 0.3 0.3 0.4 0.1
Cambodia 0.9 1.0 1.0 1.5 0.3 0.0 0.1 0.4
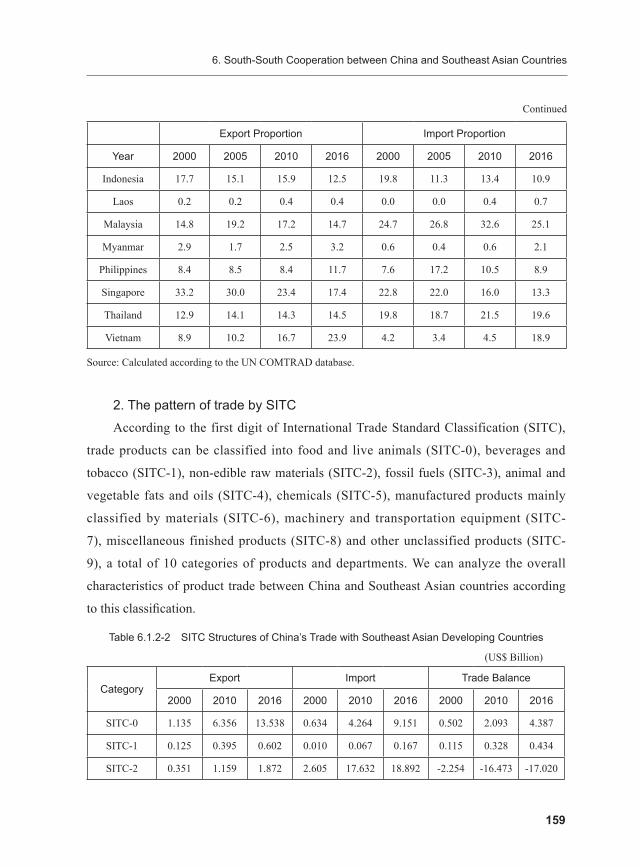
6. South-South Cooperation between China and Southeast Asian Countries
159
Export Proportion Import Proportion
Year 2000 2005 2010 2016 2000 2005 2010 2016
Indonesia 17.7 15.1 15.9 12.5 19.8 11.3 13.4 10.9
Laos 0.2 0.2 0.4 0.4 0.0 0.0 0.4 0.7
Malaysia 14.8 19.2 17.2 14.7 24.7 26.8 32.6 25.1
Myanmar 2.9 1.7 2.5 3.2 0.6 0.4 0.6 2.1
Philippines 8.4 8.5 8.4 11.7 7.6 17.2 10.5 8.9
Singapore 33.2 30.0 23.4 17.4 22.8 22.0 16.0 13.3
Thailand 12.9 14.1 14.3 14.5 19.8 18.7 21.5 19.6
Vietnam 8.9 10.2 16.7 23.9 4.2 3.4 4.5 18.9
Source: Calculated according to the UN COMTRAD database.
2. The pattern of trade by SITCAccording to the first digit of International Trade Standard Classification (SITC),
trade products can be classified into food and live animals (SITC-0), beverages and
tobacco (SITC-1), non-edible raw materials (SITC-2), fossil fuels (SITC-3), animal and
vegetable fats and oils (SITC-4), chemicals (SITC-5), manufactured products mainly
classified by materials (SITC-6), machinery and transportation equipment (SITC-
7), miscellaneous finished products (SITC-8) and other unclassified products (SITC-
9), a total of 10 categories of products and departments. We can analyze the overall
characteristics of product trade between China and Southeast Asian countries according
to this classification.
Table 6.1.2-2 SITC Structures of China’s Trade with Southeast Asian Developing Countries
(US$ Billion)
CategoryExport Import Trade Balance
2000 2010 2016 2000 2010 2016 2000 2010 2016
SITC-0 1.135 6.356 13.538 0.634 4.264 9.151 0.502 2.093 4.387
SITC-1 0.125 0.395 0.602 0.010 0.067 0.167 0.115 0.328 0.434
SITC-2 0.351 1.159 1.872 2.605 17.632 18.892 -2.254 -16.473 -17.020
Continued

China Development Report on South-South Cooperation 2017
160
CategoryExport Import Trade Balance
2000 2010 2016 2000 2010 2016 2000 2010 2016
SITC-3 1.370 8.121 9.029 3.519 21.715 20.434 -2.149 -13.595 -11.405
SITC-4 0.007 0.060 0.081 0.587 5.908 4.488 -0.579 -5.848 -4.407
SITC-5 1.356 10.635 19.853 2.750 14.936 16.486 -1.394 -4.300 3.366
SITC-6 3.318 29.233 70.586 2.659 8.734 11.471 0.659 20.499 59.115
SITC-7 7.941 63.283 99.214 9.085 78.388 91.972 -1.144 -15.105 7.242
SITC-8 1.839 20.309 40.540 0.462 5.458 13.656 1.376 14.851 26.884
SITC-9 0.009 0.057 1.675 0.083 0.126 13.212 -0.074 -0.069 -11.536
Source: Calculated according to the UN COMTRAD database.
Table 6.1.2-2 is the structure of imports and exports between China and Southeast
Asian countries, which reflects the share of 10 categories of traded products and presents
the following characteristics:
Firstly, the largest import and export volume among the 10 categories of traded
products between China and Southeast Asian countries is machinery and transportation
equipment (SITC-7), of which the import and export proportions are the highest in all
years, and the growth of total trade volume is fastest. In 2016, China’s imports and
exports of machinery and transportation equipment products to Southeast Asian countries
were $19.172 billion and $99.214 billion respectively, accounting for 46.0% and 38.6%
of total imports and exports of all products.
Secondly, China’s export product structure to Southeast Asian countries has
undergone some changes from 2000 to 2016, mainly reflected in the significant decline
in the proportions of SITC0-4 products which represent primary products in exports. And
proportions of SITC5-8 products, representing finished products in exports increased. At
the same time, the overall structure of China’s imports from Southeast Asian countries
has changed little.
Thirdly, the product trade pattern between China and Southeast Asian countries
shows co-existence of intra-industry trade and inter-industry trade. In 2016, for example,
Continued

6. South-South Cooperation between China and Southeast Asian Countries
161
in the four categories of non-edible raw materials (SITC-2), fossil fuels (SITC-3), animal
and vegetable oils (SITC-4), and miscellaneous finished products (SITC-8), exports to
southeast Asian countries are small while imports are large, showing a clear trade deficit.
But on the two major categories of finished products (SITC-6) and miscellaneous finished
products (SITC-8), China has a significant trade surplus with Southeast Asian countries.
For the category of machinery and transportation equipment (SITC-7), China and
Southeast Asian countries have high mutual import and export amounts, reflecting strong
intra-industry trade characteristics.
3. The pattern of trade by final useIn order to further reveal the trade relationship between China and Southeast
Asian countries, referring to the classification in term of the final use, we classified
pattern of trade into four categories including raw materials, intermediate products,
consumer products and capital products. Based on this, we further examine the structural
characteristics of product trade between China and Southeast Asian countries.
Table 6.1.2-3 describes the trade structure between China and Southeast Asian
countries by final use. As can be seen from the table, China’s largest proportion of export
to Southeast Asian countries are capital products, accounting for 37.60% of China’s total
exports to Southeast Asia, followed by intermediate products and consumer products,
with both shares of nearly 30%. And China’s exports to Southeast Asian countries have
the lowest proportion of raw materials, accounting for only 3.50% of China’s total
exports. As for China’s imports from Southeast Asian countries, the proportion of capital
products reached 51.67%, which not only accounted for the highest proportion of all
major categories of products, but also exceeded the proportion of capital products in
China’s exports to Southeast Asian countries. The second largest category of products for
China imported from Southeast Asian countries is intermediate products, while consumer
products and raw materials account for a lower proportion of imports.

China Development Report on South-South Cooperation 2017
162
Table 6.1.2-3 Trade Structures between China and Southeast Asian Developing Countries by Final Use in 2016
(%)
Export Import
RM IP CG CP RM IP CG CP
All countries 3.50 29.37 29.53 37.60 12.86 22.16 13.30 51.67
Brunei 1.75 25.49 48.99 23.77 59.04 26.35 14.59 0.01
Cambodia 0.24 65.19 17.56 17.01 6.31 24.38 48.23 21.08
Indonesia 4.39 34.96 24.69 35.96 33.00 33.81 26.20 6.99
Laos 1.08 25.80 13.07 60.04 74.62 22.97 2.08 0.33
Malaysia 4.07 22.34 36.99 36.61 5.51 13.01 8.96 72.51
Myanmar 2.51 36.16 21.67 39.66 40.26 13.82 45.03 0.88
Philippines 2.71 30.21 42.50 24.58 13.64 6.16 2.69 77.50
Singapore 0.93 11.73 36.42 50.92 0.24 36.31 15.96 47.49
Thailand 5.85 29.14 24.14 40.87 14.11 29.93 8.83 47.12
Vietnam 3.92 40.42 21.11 34.54 14.13 16.16 17.04 52.68
Source: Calculated according to the UN COMTRAD database.
Note: RM refers to Row Materials; IP refers to Intermediate Products; CG refers to Consumer goods; and CP
refers to Capital Products respectively in second line of the table.
The trade structures between China and different Southeast Asia countries are
also quite different. And this phenomenon is particularly prominent in China’s imports,
reflecting the different characteristics of Southeast Asian countries. Among them, Laos
and Brunei’s exports to China are mainly raw materials; Myanmar and Cambodia’s
exports are mainly primary processed consumer products; and the Philippines, Malaysia,
Vietnam, Singapore and Thailand’s exports are mainly capital products; while Indonesia’s
exports to China are concentrated on raw materials, intermediate products and consumer
products with the very low proportion of capital products.
4. The Pattern of Trade by technology levelLall (2000) classifies traded goods in term of embodied technology into five
categories based on the third digit of SITC as primary products (PP), resource products
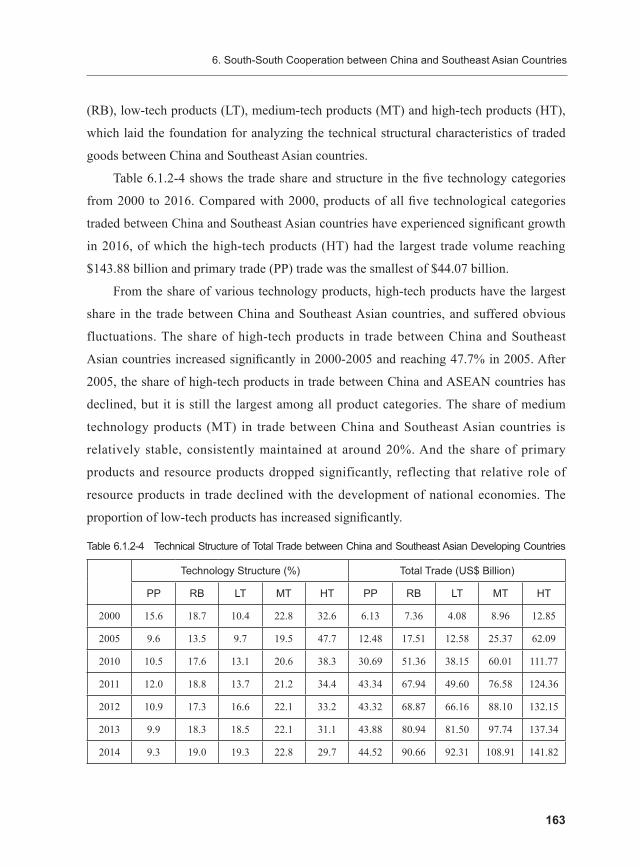
6. South-South Cooperation between China and Southeast Asian Countries
163
(RB), low-tech products (LT), medium-tech products (MT) and high-tech products (HT),
which laid the foundation for analyzing the technical structural characteristics of traded
goods between China and Southeast Asian countries.
Table 6.1.2-4 shows the trade share and structure in the five technology categories
from 2000 to 2016. Compared with 2000, products of all five technological categories
traded between China and Southeast Asian countries have experienced significant growth
in 2016, of which the high-tech products (HT) had the largest trade volume reaching
$143.88 billion and primary trade (PP) trade was the smallest of $44.07 billion.
From the share of various technology products, high-tech products have the largest
share in the trade between China and Southeast Asian countries, and suffered obvious
fluctuations. The share of high-tech products in trade between China and Southeast
Asian countries increased significantly in 2000-2005 and reaching 47.7% in 2005. After
2005, the share of high-tech products in trade between China and ASEAN countries has
declined, but it is still the largest among all product categories. The share of medium
technology products (MT) in trade between China and Southeast Asian countries is
relatively stable, consistently maintained at around 20%. And the share of primary
products and resource products dropped significantly, reflecting that relative role of
resource products in trade declined with the development of national economies. The
proportion of low-tech products has increased significantly.
Table 6.1.2-4 Technical Structure of Total Trade between China and Southeast Asian Developing Countries
Technology Structure (%) Total Trade (US$ Billion)
PP RB LT MT HT PP RB LT MT HT
2000 15.6 18.7 10.4 22.8 32.6 6.13 7.36 4.08 8.96 12.85
2005 9.6 13.5 9.7 19.5 47.7 12.48 17.51 12.58 25.37 62.09
2010 10.5 17.6 13.1 20.6 38.3 30.69 51.36 38.15 60.01 111.77
2011 12.0 18.8 13.7 21.2 34.4 43.34 67.94 49.60 76.58 124.36
2012 10.9 17.3 16.6 22.1 33.2 43.32 68.87 66.16 88.10 132.15
2013 9.9 18.3 18.5 22.1 31.1 43.88 80.94 81.50 97.74 137.34
2014 9.3 19.0 19.3 22.8 29.7 44.52 90.66 92.31 108.91 141.82

China Development Report on South-South Cooperation 2017
164
Technology Structure (%) Total Trade (US$ Billion)
PP RB LT MT HT PP RB LT MT HT
2015 8.9 14.8 20.4 24.0 31.8 41.31 68.50 94.29 110.63 146.96
2016 10.1 14.1 19.7 23.1 33.0 44.07 61.50 85.85 100.95 143.88
Source: Calculated according to the UN COMTRAD database.
From the share of exports of various technology products, China’s exports to
Southeast Asian countries are mainly low-tech products and medium-tech products, with
the share of 29.6% and 29.4% respectively in 2016. Primary products have the smallest
share accounting for only 6.4% in 2016. The proportion of high-tech products exported
by China to Southeast Asian countries declined after reaching a high point in 2005 and
accounted for 22.9% in 2016. The proportion of China’s resource products exported to
Southeast Asian countries has remained relatively stable. In terms of the share of imports,
high-tech products imported by China from Southeast Asian countries accounted for
the highest proportion in all years and reaching 44.8% in 2016. Among those high-tech
products imported from Southeast Asian countries, the components of electronic products
account for a considerable proportion. In most years, resource products and raw materials
accounted for the second and third places among the five categories of products imported
from Southeast Asia. The share of low-tech products in China’s imports from Southeast
Asian countries is always the lowest.
In summary, China and Southeast Asian countries have strong complementary
features in products of different technology categories. Southeast Asian countries have
obvious advantages in raw materials, resource products and high-tech products, while
China has comparative advantages in low-tech products and medium-tech products.
Table 6.1.2-5 Technical Structures by Import and Export between China and Southeast Asian Developing Countries
China Export (%) China Import (%)
PP RB LT MT HT PP RB LT MT HT
2000 11.9 13.3 18.2 27.8 28.8 18.5 22.9 4.2 18.8 35.6
2005 6.8 13.2 18.2 25.6 36.3 11.7 13.7 3.4 15.0 56.2
Continued
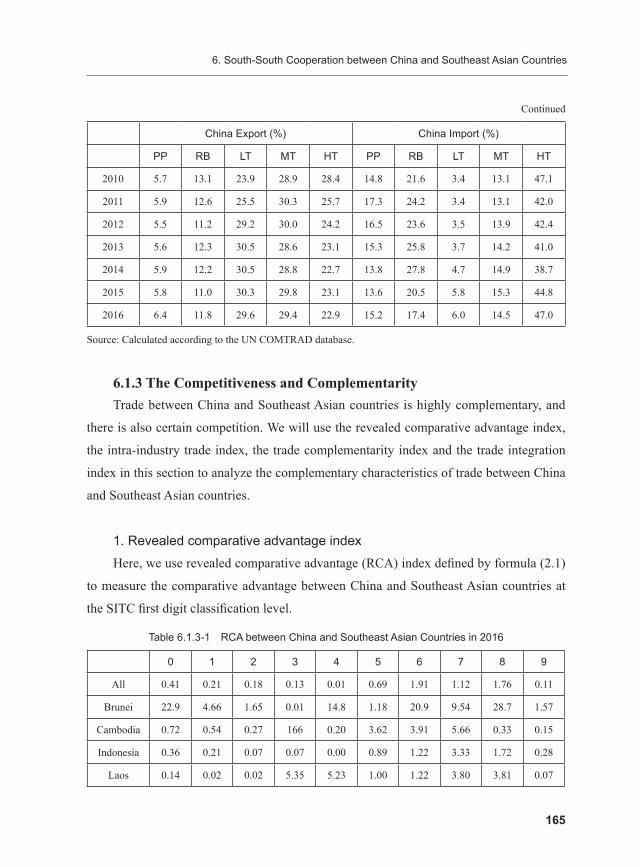
6. South-South Cooperation between China and Southeast Asian Countries
165
China Export (%) China Import (%)
PP RB LT MT HT PP RB LT MT HT
2010 5.7 13.1 23.9 28.9 28.4 14.8 21.6 3.4 13.1 47.1
2011 5.9 12.6 25.5 30.3 25.7 17.3 24.2 3.4 13.1 42.0
2012 5.5 11.2 29.2 30.0 24.2 16.5 23.6 3.5 13.9 42.4
2013 5.6 12.3 30.5 28.6 23.1 15.3 25.8 3.7 14.2 41.0
2014 5.9 12.2 30.5 28.8 22.7 13.8 27.8 4.7 14.9 38.7
2015 5.8 11.0 30.3 29.8 23.1 13.6 20.5 5.8 15.3 44.8
2016 6.4 11.8 29.6 29.4 22.9 15.2 17.4 6.0 14.5 47.0
Source: Calculated according to the UN COMTRAD database.
6.1.3 The Competitiveness and Complementarity Trade between China and Southeast Asian countries is highly complementary, and
there is also certain competition. We will use the revealed comparative advantage index,
the intra-industry trade index, the trade complementarity index and the trade integration
index in this section to analyze the complementary characteristics of trade between China
and Southeast Asian countries.
1. Revealed comparative advantage indexHere, we use revealed comparative advantage (RCA) index defined by formula (2.1)
to measure the comparative advantage between China and Southeast Asian countries at
the SITC first digit classification level.
Table 6.1.3-1 RCA between China and Southeast Asian Countries in 2016
0 1 2 3 4 5 6 7 8 9
All 0.41 0.21 0.18 0.13 0.01 0.69 1.91 1.12 1.76 0.11
Brunei 22.9 4.66 1.65 0.01 14.8 1.18 20.9 9.54 28.7 1.57
Cambodia 0.72 0.54 0.27 166 0.20 3.62 3.91 5.66 0.33 0.15
Indonesia 0.36 0.21 0.07 0.07 0.00 0.89 1.22 3.33 1.72 0.28
Laos 0.14 0.02 0.02 5.35 5.23 1.00 1.22 3.80 3.81 0.07
Continued
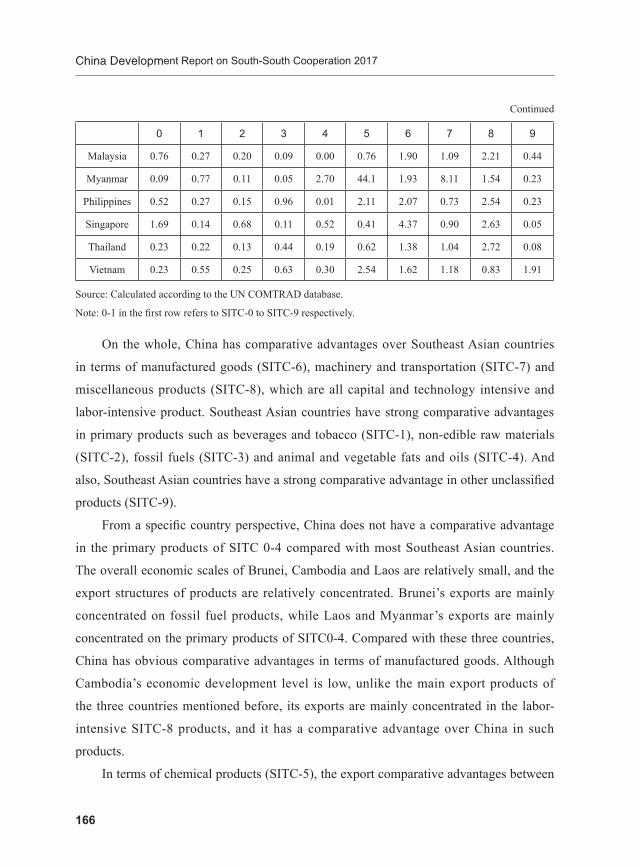
China Development Report on South-South Cooperation 2017
166
0 1 2 3 4 5 6 7 8 9
Malaysia 0.76 0.27 0.20 0.09 0.00 0.76 1.90 1.09 2.21 0.44
Myanmar 0.09 0.77 0.11 0.05 2.70 44.1 1.93 8.11 1.54 0.23
Philippines 0.52 0.27 0.15 0.96 0.01 2.11 2.07 0.73 2.54 0.23
Singapore 1.69 0.14 0.68 0.11 0.52 0.41 4.37 0.90 2.63 0.05
Thailand 0.23 0.22 0.13 0.44 0.19 0.62 1.38 1.04 2.72 0.08
Vietnam 0.23 0.55 0.25 0.63 0.30 2.54 1.62 1.18 0.83 1.91
Source: Calculated according to the UN COMTRAD database.
Note: 0-1 in the first row refers to SITC-0 to SITC-9 respectively.
On the whole, China has comparative advantages over Southeast Asian countries
in terms of manufactured goods (SITC-6), machinery and transportation (SITC-7) and
miscellaneous products (SITC-8), which are all capital and technology intensive and
labor-intensive product. Southeast Asian countries have strong comparative advantages
in primary products such as beverages and tobacco (SITC-1), non-edible raw materials
(SITC-2), fossil fuels (SITC-3) and animal and vegetable fats and oils (SITC-4). And
also, Southeast Asian countries have a strong comparative advantage in other unclassified
products (SITC-9).
From a specific country perspective, China does not have a comparative advantage
in the primary products of SITC 0-4 compared with most Southeast Asian countries.
The overall economic scales of Brunei, Cambodia and Laos are relatively small, and the
export structures of products are relatively concentrated. Brunei’s exports are mainly
concentrated on fossil fuel products, while Laos and Myanmar’s exports are mainly
concentrated on the primary products of SITC0-4. Compared with these three countries,
China has obvious comparative advantages in terms of manufactured goods. Although
Cambodia’s economic development level is low, unlike the main export products of
the three countries mentioned before, its exports are mainly concentrated in the labor-
intensive SITC-8 products, and it has a comparative advantage over China in such
products.
In terms of chemical products (SITC-5), the export comparative advantages between
Continued

6. South-South Cooperation between China and Southeast Asian Countries
167
different Southeast Asian countries and China are significantly different. Among them,
Singapore, Thailand, Malaysia and Indonesia have comparative advantages over China,
while China has comparative advantages over other countries. In terms of machinery and
transportation equipment (SITC-7), China has a comparative advantage compared with
Southeast Asian countries, but it is not very obvious. Singapore and the Philippines have
a weak comparative advantage in terms of machinery and transportation equipment over
China, while China only shows a weak comparative advantage over Malaysia, Vietnam
and Thailand. In terms of miscellaneous manufactured goods (SITC-8) which represents
typical labor-intensive products, China has a clear comparative advantage over most
Southeast Asian countries with the RCA index exceeding 1.5, but it is relatively inferior if
compared to Cambodia and Vietnam.
2. Trade complementarity indexThe trade complementarity (TC) index is an indicator for measuring the
complementarity of one country’s imports with another country’s exports. We use formula
(2.2) to calculate the trade complementarity index between China and Southeast Asian
countries with China as the exporting country and China as the importing country. The
results are shown in Table 6.1.3-2.
Table 6.1.3-2 TC Index between China and Southeast Asian Countries
China as Importing Country China as Exporting Country
2000 2005 2010 2016 2000 2005 2010 2016
All 0.70 0.77 0.73 0.76 0.63 0.68 0.68 0.72
Brunei - - 0.20 0.21 - - 0.55 0.56
Cambodia 0.11 0.12 0.17 0.28 0.47 0.43 0.46 0.47
Indonesia 0.58 0.54 0.58 0.53 0.46 0.44 0.57 0.60
Laos - - 0.32 0.47 - - 0.50 0.54
Malaysia 0.66 0.71 0.69 0.73 0.60 0.67 0.68 0.71
Myanmar - - 0.22 0.31 - - 0.50 0.52
Philippines 0.54 0.58 0.61 0.65 0.60 0.61 0.63 0.69
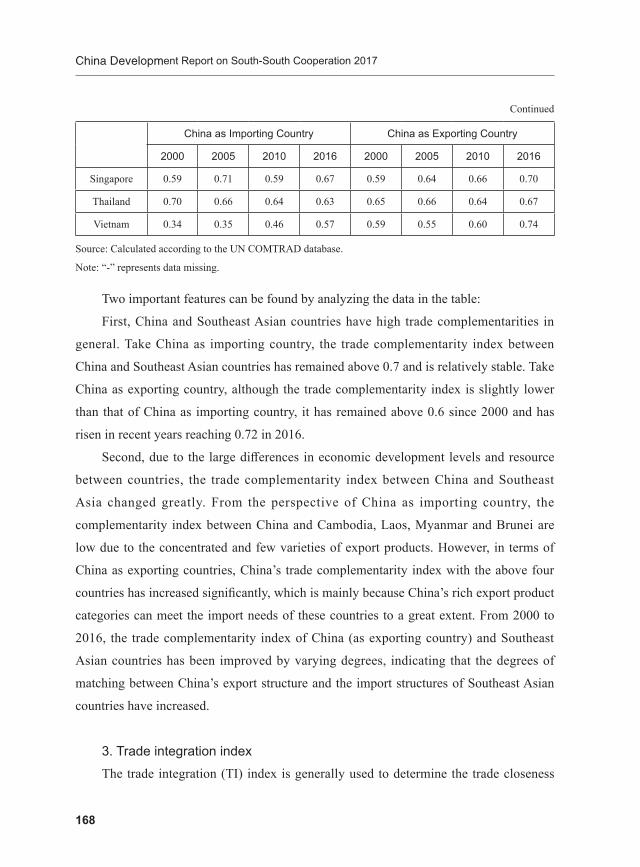
China Development Report on South-South Cooperation 2017
168
China as Importing Country China as Exporting Country
2000 2005 2010 2016 2000 2005 2010 2016
Singapore 0.59 0.71 0.59 0.67 0.59 0.64 0.66 0.70
Thailand 0.70 0.66 0.64 0.63 0.65 0.66 0.64 0.67
Vietnam 0.34 0.35 0.46 0.57 0.59 0.55 0.60 0.74
Source: Calculated according to the UN COMTRAD database.
Note: “-” represents data missing.
Two important features can be found by analyzing the data in the table:
First, China and Southeast Asian countries have high trade complementarities in
general. Take China as importing country, the trade complementarity index between
China and Southeast Asian countries has remained above 0.7 and is relatively stable. Take
China as exporting country, although the trade complementarity index is slightly lower
than that of China as importing country, it has remained above 0.6 since 2000 and has
risen in recent years reaching 0.72 in 2016.
Second, due to the large differences in economic development levels and resource
between countries, the trade complementarity index between China and Southeast
Asia changed greatly. From the perspective of China as importing country, the
complementarity index between China and Cambodia, Laos, Myanmar and Brunei are
low due to the concentrated and few varieties of export products. However, in terms of
China as exporting countries, China’s trade complementarity index with the above four
countries has increased significantly, which is mainly because China’s rich export product
categories can meet the import needs of these countries to a great extent. From 2000 to
2016, the trade complementarity index of China (as exporting country) and Southeast
Asian countries has been improved by varying degrees, indicating that the degrees of
matching between China’s export structure and the import structures of Southeast Asian
countries have increased.
3. Trade integration indexThe trade integration (TI) index is generally used to determine the trade closeness
Continued
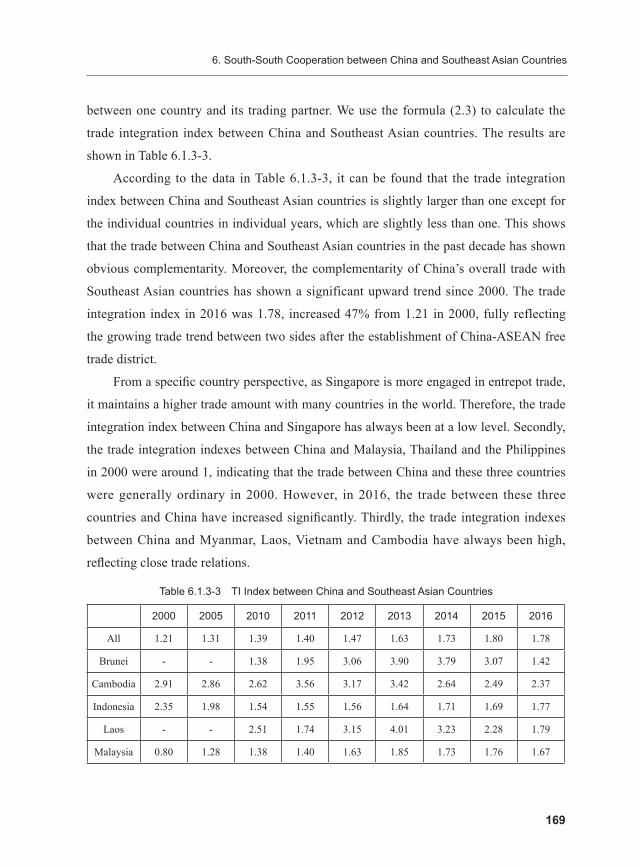
6. South-South Cooperation between China and Southeast Asian Countries
169
between one country and its trading partner. We use the formula (2.3) to calculate the
trade integration index between China and Southeast Asian countries. The results are
shown in Table 6.1.3-3.
According to the data in Table 6.1.3-3, it can be found that the trade integration
index between China and Southeast Asian countries is slightly larger than one except for
the individual countries in individual years, which are slightly less than one. This shows
that the trade between China and Southeast Asian countries in the past decade has shown
obvious complementarity. Moreover, the complementarity of China’s overall trade with
Southeast Asian countries has shown a significant upward trend since 2000. The trade
integration index in 2016 was 1.78, increased 47% from 1.21 in 2000, fully reflecting
the growing trade trend between two sides after the establishment of China-ASEAN free
trade district.
From a specific country perspective, as Singapore is more engaged in entrepot trade,
it maintains a higher trade amount with many countries in the world. Therefore, the trade
integration index between China and Singapore has always been at a low level. Secondly,
the trade integration indexes between China and Malaysia, Thailand and the Philippines
in 2000 were around 1, indicating that the trade between China and these three countries
were generally ordinary in 2000. However, in 2016, the trade between these three
countries and China have increased significantly. Thirdly, the trade integration indexes
between China and Myanmar, Laos, Vietnam and Cambodia have always been high,
reflecting close trade relations.
Table 6.1.3-3 TI Index between China and Southeast Asian Countries
2000 2005 2010 2011 2012 2013 2014 2015 2016
All 1.21 1.31 1.39 1.40 1.47 1.63 1.73 1.80 1.78
Brunei - - 1.38 1.95 3.06 3.90 3.79 3.07 1.42
Cambodia 2.91 2.86 2.62 3.56 3.17 3.42 2.64 2.49 2.37
Indonesia 2.35 1.98 1.54 1.55 1.56 1.64 1.71 1.69 1.77
Laos - - 2.51 1.74 3.15 4.01 3.23 2.28 1.79
Malaysia 0.80 1.28 1.38 1.40 1.63 1.85 1.73 1.76 1.67

China Development Report on South-South Cooperation 2017
170
2000 2005 2010 2011 2012 2013 2014 2015 2016
Myanmar - - 7.95 5.31 6.31 5.05 4.51 4.02 3.89
Philippines 1.01 1.29 1.88 2.11 2.24 2.50 2.71 2.67 2.59
Singapore 1.09 1.13 0.99 0.92 0.94 1.02 1.04 1.23 1.17
Thailand 0.94 0.91 1.04 1.07 1.11 1.09 1.19 1.35 1.44
Vietnam 2.51 2.09 2.59 2.57 2.63 3.04 3.37 2.80 2.60
Source: Calculated according to the UN COMTRAD database.
Note: “-” represents data missing.
6.2 Investment Relationship between China and Southeast Asian CountriesThis section mainly introduces China’s outward direct investment relationship
(OFDI) to Southeast Asian countries, including three parts: First, China’s total amount of
OFDI in Southeast Asian countries and the changes; Second, national characteristics of
China’s OFDI in Southeast Asian countries; Third, the industry characteristics of China’s
OFDI in Southeast Asian countries.
6.2.1 Overall Characteristics With the development of China’s economy, the initiative to conduct outward oriented
direct investment has also become an important part of China’s development of South-
South Cooperation. Since 2007, the flow and stock of China’s foreign direct investment
have maintained a growing trend. China’s investment in Southeast Asian countries
not only shows a growth trend in both terms of flow and stock, but the proportion of
Southeast Asian countries in China’s foreign direct investment is also on the rise. As
can be seen from Table 6.2.1, China’s investment flows to Southeast Asian countries
increased from $96.8 million in 2007 to $10.279 billion in 2016, with an average annual
growth rate of 30%, exceeding the growth speed of China’s direct global investment over
the same period. Among them, the proportion of China’s foreign direct investment flows
to Southeast Asian countries has also increased, and reached a peak of 10.03% in 2015.
Continued

6. South-South Cooperation between China and Southeast Asian Countries
171
China’s foreign direct investment stock in Southeast Asian countries rose from $3.953
billion in 2007 to $71.554 billion in 2016, with an average annual growth rate of 38%,
higher than the average annual growth rate of China’s global direct foreign investment
flows of 31%. The proportion of China’s investment in Southeast Asian countries to that
of global direct foreign has also increased, from 3.35% in 2007 to 5.27% in 2016.
Table 6.2.1 China’s OFDI to Southeast Asian Countries and the World by Flows and Stock
(US$ billion, %)
China's OFDI flows China’s OFDI stock
Southeast Asia World Share Southeast Asia World Share
2007 0.968 26.506 3.65 3.953 117.911 3.35
2008 2.484 55.907 4.44 6.487 183.971 3.53
2009 2.698 56.529 4.77 9.571 245.755 3.89
2010 4.405 68.811 6.4 14.35 317.211 4.52
2011 5.905 74.654 7.91 21.462 424.781 5.05
2012 6.1 87.804 6.95 28.238 531.941 5.31
2013 7.267 107.844 6.74 35.668 660.478 5.4
2014 7.809 123.12 6.34 47.633 882.642 5.4
2015 14.604 145.667 10.03 62.716 1097.865 5.71
2016 10.279 196.15 5.24 71.554 1357.39 5.27
Source: China Foreign Direct Investment Statistics Bulletin 2015, 2016.
6.2.2 Country Characteristics of the InvestmentChina has close investment relations with Southeast Asian countries and has direct
investments in all 10 countries, although the scale of investment is relatively concentrated.
Considering from the country characteristics of China’s direct investment in Southeast
Asian countries, Southeast Asian countries occupies an important position both in terms
of stocks and flows.
In terms of flows in 2016, Singapore is the country that absorbs most of China’s
foreign direct investment among Southeast Asian countries, followed by Malaysia,
Indonesia, Vietnam and Thailand. The above five countries accounted for more than 85%

China Development Report on South-South Cooperation 2017
172
of China’s direct investment flows to Southeast Asian countries in 2016, reflecting the
obvious concentration characteristics. Moreover, the above five countries are all in the
top 20 countries (regions) of China’s foreign direct investment flows in 2016. Among
them, Singapore ranked sixth, Malaysia, Indonesia, Vietnam and Thailand ranked tenth,
fourteenth, sixteenth and nineteenth respectively.
In terms of China’s direct investment stock in Southeast Asia, Singapore is still
the country with the most investment from China, accounting for nearly half of China’s
investment in Southeast Asia, and ranked fifth in China’s foreign direct investment stock
at the end of 2016. For other Southeast Asian countries, except for the low proportion
of Brunei and the Philippines stock, the share of other countries’ investment stock from
China all exceeded 5%. Indonesia, Laos and Vietnam ranked in the top 20 in China’s
foreign direct investment stocks at the end of 2016, ranking eleventh, sixteenth and
nineteenth respectively.
Table 6.2.2 Country Characteristics of China’s OFDI in Southeast Asian Countries in 2016
(US$ billion, %)
FlowsProportion of China’s FDI Flows to
Southeast AsianStock
Proportion of China’s FDI Stock to Southeast Asian
Brunei 0.142 1.38 0.204 0.29
Cambodia 0.626 6.09 4.369 6.11
Indonesia 1.461 14.21 9.546 13.34
Laos 0.328 3.19 5.500 7.69
Malaysia 1.83 17.80 3.634 5.08
Myanmar 0.288 2.80 4.620 6.46
Philippines 0.032 0.31 0.719 1.00
Singapore 3.172 30.86 33.446 46.74
Thailand 1.121 10.91 4.533 6.33
Vietnam 1.279 12.44 4.984 6.97
Sum 10.279 100 71.555 100
Source: China Foreign Direct Investment Statistics Bulletin 2015, 2016. China Ministry of Commerce 2017
Version of the Foreign Investment Cooperation Country (Region) Guide.

6. South-South Cooperation between China and Southeast Asian Countries
173
6.2.3 Industry Characteristics of the InvestmentIn terms of industry distribution of flows, China direct invested most in
manufacturing industry in Southeast Asia with the investment flows of $3.544 billion in
2016, increasing by year on year rate of 34.3%, mainly in Indonesia, Vietnam, Thailand,
Malaysia; invested $1.963 billion in wholesale and retail industry, accounting for 19.1%,
and mainly in Singapore, Thailand; invested $1.371 billion in leasing and business
services industry, accounting for 13.3%, mainly in Singapore; invested $1.246 billion in
real estate industry, accounting for 12.1%, mainly in Malaysia, Singapore; invested $664
million in electricity / heat / gas and water production and supply industry, accounting
for 6.5%, mainly in Vietnam, Indonesia, Thailand; invested $0.635 billion in construction
industry, accounting for 6.2%, mainly in Malaysia, Indonesia; invested $454 million in
financial industry, accounting for 4.4%, mainly in Indonesia, Malaysia; and invested $374
million in agriculture / forest / animal husbandry / fishery, accounting for 3.6%, mainly
distributed in Myanmar, Laos, Singapore, Cambodia.
From the industry distribution of China’s investment stock in ASEAN in 2016,
the manufacturing industry had the share of $13.15 billion, and is the industry with
the most China’s investment stock in ASEAN, accounting for 18.4%. Countries with a
total investment of more than $1 billion includes Indonesia ($2.887 billion), Vietnam
($2.479 billion), Thailand ($2.119 billion), Singapore ($2.049 billion) and Malaysia
($1.239 billion). Investment stock in leasing and business services reached $11.23
billion, accounting for 15.7%, mainly in Singapore, Indonesia, Laos, Vietnam, Malaysia.
Investment stock in mining industry was $10.169 billion, accounting for 14.2%, mainly
distributed in Singapore, Indonesia, Myanmar, Laos. Investment stock in the wholesale
and retail industry reached $9.69 billion, accounting for 13.5%, mainly in Singapore,
Indonesia, Thailand, Vietnam, Malaysia, and the Philippines. Investment stock in
electricity/heat/gas and water production and supply industry was $9.121 billion,
accounting for 12.7%, mainly in Singapore, Myanmar, Indonesia, Laos, Cambodia.
Investment stock in the financial industry was $4.573 billion, accounting for 6.4%, mainly
in Singapore, Thailand, Indonesia, and Vietnam. Investment stock in the construction
industry reached $4.507 billion, accounting for 6.4%, mainly in Singapore, Cambodia,
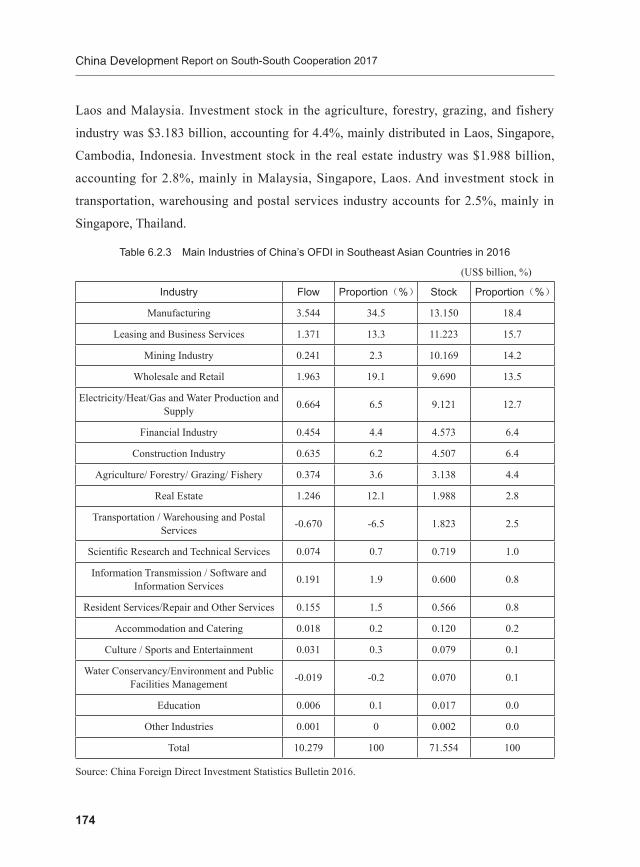
China Development Report on South-South Cooperation 2017
174
Laos and Malaysia. Investment stock in the agriculture, forestry, grazing, and fishery
industry was $3.183 billion, accounting for 4.4%, mainly distributed in Laos, Singapore,
Cambodia, Indonesia. Investment stock in the real estate industry was $1.988 billion,
accounting for 2.8%, mainly in Malaysia, Singapore, Laos. And investment stock in
transportation, warehousing and postal services industry accounts for 2.5%, mainly in
Singapore, Thailand.
Table 6.2.3 Main Industries of China’s OFDI in Southeast Asian Countries in 2016
(US$ billion, %)
Industry Flow Proportion(%) Stock Proportion(%)
Manufacturing 3.544 34.5 13.150 18.4
Leasing and Business Services 1.371 13.3 11.223 15.7
Mining Industry 0.241 2.3 10.169 14.2
Wholesale and Retail 1.963 19.1 9.690 13.5
Electricity/Heat/Gas and Water Production and Supply 0.664 6.5 9.121 12.7
Financial Industry 0.454 4.4 4.573 6.4
Construction Industry 0.635 6.2 4.507 6.4
Agriculture/ Forestry/ Grazing/ Fishery 0.374 3.6 3.138 4.4
Real Estate 1.246 12.1 1.988 2.8
Transportation / Warehousing and Postal Services -0.670 -6.5 1.823 2.5
Scientific Research and Technical Services 0.074 0.7 0.719 1.0
Information Transmission / Software and Information Services 0.191 1.9 0.600 0.8
Resident Services/Repair and Other Services 0.155 1.5 0.566 0.8
Accommodation and Catering 0.018 0.2 0.120 0.2
Culture / Sports and Entertainment 0.031 0.3 0.079 0.1
Water Conservancy/Environment and Public Facilities Management -0.019 -0.2 0.070 0.1
Education 0.006 0.1 0.017 0.0
Other Industries 0.001 0 0.002 0.0
Total 10.279 100 71.554 100
Source: China Foreign Direct Investment Statistics Bulletin 2016.

6. South-South Cooperation between China and Southeast Asian Countries
175
6.2.4 Projects Contract and Labor Services CooperationThe foreign contracted projects dispatch labor services and exported labor
services through international projects contracting. After obtaining the contracting or
subcontracting tasks of foreign engineering projects, domestic expatriate enterprises will
dispatch various laborers for the implementation of the project. Chinese engineering
expatriate laborers are known for their technical proficiency, low wages, hard work and
easy management. And China’s foreign contracted projects and labor cooperation are
closely related to China’s foreign investment and foreign economic and technological
assistance, and are also an important part of strengthening cooperation between
developing countries between China and Southeast Asia.
Table 6.2.4 Project Contract and Labor Service Cooperation of China in Southeast Asia in 2016
Number of Newly Signed
Contracts
Amount of Newly Signed Contracts
(US$ Billion)
Completed Turnover
(US$ Billion)
Number of People Dispatched
(Person)
Year-End Labor Stock
(Person)
Brunei 65 0.037 0.548 303 400
Cambodia 443 2.133 1.656 3874 6744
Indonesia 856 10.725 4.089 11646 16435
Laos 96 6.712 2.947 9583 11488
Malaysia 666 11.24 4.78 12900 19200
Myanmar 157 2.808 1.917 4404 4633
Philippines 280 2.983 1.662 1517 1789
Singapore 381 2.468 3.756 37724 100612
Thailand 388 3.843 2.936 2485 3261
Vietnam 325 3.789 3.324 5879 12418
Total 3657 46.738 27.615 90315 176980
Source: Compiled according to official statistic of MOFCOM.
The contracting projects carried out by Chinese companies in Cambodia involve
various fields of Cambodian society and have played a positive role in promoting
Cambodia’s economic construction and development. As of the end of 2016, the

China Development Report on South-South Cooperation 2017
176
cumulative contract amount of Cambodian hydropower project reached $2.719 billion.
The projects in Cambodia that have been completed and in progress include the Kirirom
No.1 Hydropower Project, the Kampot Kamchay Hydropower Project, the Kirirom
No. 3 Hydropower Station, the Koh Kong Tatay Hydropower Station, the Stung Atay
Hydropower Station, the Russei Hydropower Project, the Sangriver Hydropower Station
in Stung Treng province and the West Harbor Coal-fired Power Plant.
In Indonesia, the main projects invested and contracted by Chinese enterprises
include the first phase construction of the Central Kalimantan coal railway special line
project, the wind power station, the Java No.7 Power Station, the Nansu No.1 Power
Station, the Qingshan Ferronickel Industrial Park and the Xidian Electric Transducer
production project, etc.
In Myanmar, the engineering contracting projects of Chinese-funded enterprises
mainly include Yangon International Airport reconstruction and expansion project,
Myanmar Minbu 220MW Ground Photovoltaic Power Plant, and Yangon Taketa Gas and
Steam Combined Cycle Power Plant.
In Laos, China’s engineering contracting projects mainly include four Laos South
Russia Hydropower Stations, Sino-Laos Railway, Nanmajiang Cascade Hydropower
Station, Luang Prabang Conch Cement Project, East Sahong Hydropower Station and
Nanpu Hydropower Station.
In Malaysia, China’s engineering contracting mainly includes the East Coast Railway
Project, the Gemas-South Johor Bahru Railway Project, the Sabah Natural Gas Pipeline
Project, the Kuala Lumpur MRT Subway Line 1, Line 2, the Bahraini Power Station, and
the Muruo Hydropower Station.
In Vietnam, the first and second phases of the Cam Phu Thermal Power Plant
constructed by China were officially handed over to Vietnam in September 2011; the Ca
Mau Fertilizer Plant was completed and put into operation in January 2012; the Yongxing
Phase II Thermal Power Plant has been handed over to Vietnam. The newly signed
projects mainly include the Haiyang Power Plant Project General Contracting Project, the
Yongxin Phase I Coal-fired Power Plant Project, and the Vietnam Coastal Thermal Power
Project.

6. South-South Cooperation between China and Southeast Asian Countries
177
Judging from China’s engineering contracting and labor dispatch in Southeast
Asian countries, a large number of cooperation projects focus on the construction of
telecommunications, transportation, energy and other infrastructure industries urgently
needed in Southeast Asian countries, which have a significant role in promoting the
economic development of these countries. For the economically backward countries of
Myanmar, Laos, Cambodia and Vietnam, the importance of these infrastructures is even
more pronounced.
6.3 China’s Foreign Assistance to Southeast Asian CountriesSince 21st century, China’s foreign assistance to South-East Asia has been dominated
by development assistance and has focused on capacity building in recipient countries,
shifting from low-level development needs to high levels of development cooperation.
China’s development assistance to Southeast Asia has led to the further development of
bilateral economic and trade relations. And at the same time, China has provided a lot of
humanitarian assistance in the event of an emergency in Southeast Asian countries.
6.3.1 The Overall SituationSince 2000, with the continuous improvement of economic strength, China’s aid to
Southeast Africa countries has also increased rapidly. According to the Chinese Official
Finance to Asia Dataset released by the Global Development Center and the AidData
project of the William and Mary College of the United States, from 2000 to 2014, China
had totally assisted 468 projects in Southeast Asian countries, valuing $39.2 billion at the
constant prices in 2014. The changes in each year are shown in Figure 6.3.1.

China Development Report on South-South Cooperation 2017
178
0
5
10
15
20
25
30
35
40
45
50
0.00
10.00
20.00
30.00
40.00
50.00
60.00
70.00
80.00
90.00
100.00
2000 2001 2002 2003 2004 2005 2006 2007 2008 2009 2010 2011 2012 2013 2014
Project Number,Right Axis Amount,100millionUSD,Left Axis
year
Figure 6.3.1 The Scale and Number of Projects of China’s Assistance to Southeast Asian countries in 2000-2014
Source: AidData’s Chinese Official Finance to Asia Dataset, Version 1.0.
Note: Based on the price in 2014.
In order to improve the development level of Southeast Asian countries, China
announced in 2009 that it would provide $15 billion of credit to ASEAN countries in
the next 3-5 yearsA. China Import and Export Bank initiated and established the China-
ASEAN Investment Cooperation Fund (hereinafter referred to as the ASEAN Investment
Fund) in 2010, which aims to invest in the infrastructure, energy and natural resources of
the ASEAN regions and consolidate the economic, trade and strategic partnership between
China and the 10 ASEAN countries.B In November 2011, Chinese Premier Wen Jiabao
stated that China would provide $10 billion of loans to ASEAN countries to help build
infrastructure.C The implementation of the credit projects mentioned above has provided
strong support for the construction of large-scale infrastructure projects, development of
A Press Conference of the State Council Information Office,http://www.gov.cn/wszb/zhibo529/wzsl.htm.
B China Free Trade Zone Service Network, http://fta.mofcom.gov.cn/article/shidianyj/201312/14802_1.html.
C China Ministry of Commerce,http://www.mofcom.gov.cn/aarticle/i/jyjl/j/201111/20111107838358.html.
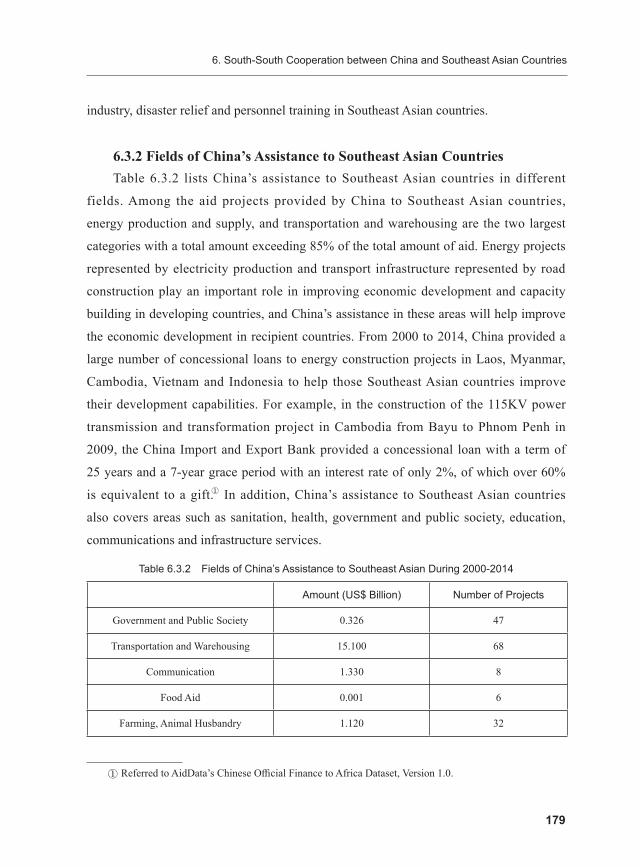
6. South-South Cooperation between China and Southeast Asian Countries
179
industry, disaster relief and personnel training in Southeast Asian countries.
6.3.2 Fields of China’s Assistance to Southeast Asian CountriesTable 6.3.2 lists China’s assistance to Southeast Asian countries in different
fields. Among the aid projects provided by China to Southeast Asian countries,
energy production and supply, and transportation and warehousing are the two largest
categories with a total amount exceeding 85% of the total amount of aid. Energy projects
represented by electricity production and transport infrastructure represented by road
construction play an important role in improving economic development and capacity
building in developing countries, and China’s assistance in these areas will help improve
the economic development in recipient countries. From 2000 to 2014, China provided a
large number of concessional loans to energy construction projects in Laos, Myanmar,
Cambodia, Vietnam and Indonesia to help those Southeast Asian countries improve
their development capabilities. For example, in the construction of the 115KV power
transmission and transformation project in Cambodia from Bayu to Phnom Penh in
2009, the China Import and Export Bank provided a concessional loan with a term of
25 years and a 7-year grace period with an interest rate of only 2%, of which over 60%
is equivalent to a gift.A In addition, China’s assistance to Southeast Asian countries
also covers areas such as sanitation, health, government and public society, education,
communications and infrastructure services.
Table 6.3.2 Fields of China’s Assistance to Southeast Asian During 2000-2014
Amount (US$ Billion) Number of Projects
Government and Public Society 0.326 47
Transportation and Warehousing 15.100 68
Communication 1.330 8
Food Aid 0.001 6
Farming, Animal Husbandry 1.120 32
A Referred to AidData’s Chinese Official Finance to Africa Dataset, Version 1.0.

China Development Report on South-South Cooperation 2017
180
Amount (US$ Billion) Number of Projects
Energy Production and Supply 17.300 48
Emergency Assistance 0.094 77
Education 0.012 57
Health 0.030 38
Infrastructure and Services 0.217 22
Debt-Related Actions 0.949 4
Water Supply and Sanitation 0.253 4
Other Departmental Assistance 0.598 34
Source: AidData’s Chinese Official Finance to Asia Dataset, Version 1.0.
Note: Based on the price in 2014.
6.3.3 China’s Emergency Assistance to Southeast Asian CountriesWhen Southeast Asian countries suffers from various serious natural disasters
and humanitarian disasters, China always take the initiative or as required by affected
countries to provide emergency relief materials, cash or send rescue workers to alleviate
the loss of life and property of the people in the disaster areas and help the affected
countries to cope with difficult situation due to the disasters. Natural disasters occur
frequently in Southeast Asia countries as they are surrounded by the sea, with many
mountains and rivers inland. China has actively extended a helping hand in the natural
disasters in Southeast Asian countries to help the affected countries rebuild their homes.
The statistics of China’s emergency assistance to Southeast Asian countries from 2000 to
2014 are shown in Figure 6.3.3.
Continued

6. South-South Cooperation between China and Southeast Asian Countries
181
0.00
500.00
1000.00
1500.00
2000.00
2500.00
3000.00
2000
2002
2003
2004
2005
2006
2007
2008
2009
2010
2011
2012
2013
2014
Am
ount
of a
ssis
tanc
e(U
S$ m
illio
n)
year
Figure 6.3.3 China’s Emergence Assistance to Southeast Asian Countries
Source: AidData’s Chinese Official Finance to Asia Dataset, Version 1.0.
Note: Based on the price in 2014.
As can be seen from Figure 6.3.3, China’s humanitarian emergency assistance to
Southeast Asian countries varied greatly in different years during 2000 to 2014, which
also illustrates the characteristics of humanitarian emergency assistance that aided amount
increases when emergency happens. The Indian Ocean tsunami spread to Southeast Asian
countries in 2004, and China carried out various forms of emergency assistance such as
materials, funds, medical teams, and volunteers to Southeast Asian countries including
Indonesia, Myanmar, Thailand, and Malaysia. In 2008, Myanmar was affected by severe
tropical cyclones, causing heavy casualties and property damage. China has repeatedly
provided Myanmar with tents, towels, compressed biscuits, medicines and water purification
equipment, and provided 30 million yuan of free assistance.A In 2010, when Southeast
Asia suffered severe floods, China provided 50 million yuan in emergency assistance to
CambodiaB, provided Thailand with $1 million in cash assistance and 10 million yuan in
material assistanceC. In 2015, Myanmar suffered a flood disaster, and Chinese government
provided two batches of emergency aid worth 30 million yuan to MyanmarD.
A China Ministry of Commerce, http://yws.mofcom.gov.cn/article/b/200805/20080505521428.shtml.
B China News Network, http://www.chinanews.com/gj/2011/10-10/3378485.shtml.
C Chinese Government Network, http://www.gov.cn/jrzg/2011-10/08/content_1963676.htm.
D China Ministry of Commerce, http://yws.mofcom.gov.cn/article/b/201607/20160701361567.shtml.

182
7. South-South cooperation between China and South Asian countries
South Asia countries include Sri Lanka, Maldives, Pakistan, India, Bangladesh,
Nepal, Bhutan, while the economic developments of these seven countries present a
distinct imbalance. With regard to the economic development of the countries of South
Asia, India, Pakistan and Sri Lanka have developed rapidly in the overall economic
development in recent years, especially in India. It enjoys rapid economic growth,
strong national strength, with bigger influence on the region and the world at large. Its
economy drove into the fast lane. Pakistan has also basically completed restructuring of
the economy, set up a more complete economic system, and the economic development
is accelerating. Sri Lanka has basically set up an industrial system. The economic
development goal is clear, also it has achieved good results. However, because of the
low level of economic development in Bangladesh and Nepal, in recent years domestic
political instability has had a great impact on economic development.
China and South Asian countries have been closely linked through the Southern Silk
Road and the Tea-Horse Road since ancient times. South Asian countries and China are
all developing countries and face an important mission of economic development. This
chapter will analyze South-South cooperation between China and South Asian countries
from three aspects: trade relations, investment relations and foreign aid relations.
7.1 Trade relations between China and South Asian countriesChina became an observer for the South Asian Association for Regional Cooperation
in 2005, making the relationship between China and South Asia closer. As of 2016, China
and South Asian countries have established a number of cooperative exchange platforms
such as China-South Asia Business Council, China-South Asia International Cooperation
Seminar, China-South Asia Business Forum, China-South Asia Fair, China-South Asian

7. South-South cooperation between China and South Asian countries
183
Economic and Trade Association, etc. These dialogues help deepen economic and trade
cooperation between China and South Asia. In addition, the China-Pakistan Economic
Corridor and multi-country economic pass through Bangladesh, China, India and
Myanmar are underway and greatly promoted. The Belt and Road Initiative will provide
opportunities for a higher level of trade cooperation between China and South Asian
countries.
7.1.1 The Trade and Its growth
1. Trade between China and South Asian countriesThe overall situation of trade between China and South Asian countries from 2000
to 2016 is shown in Table 7.1.1-1. With regard to total trade, China’s total imports and
exports of South Asia increased by nearly 19.5 times from $5.661 billion in 2000 to
$110.252 billion in 2016. During this period, the total import and export of China and
South Asian countries exceeded $10 billion in 2003, it exceeded $100 billion in 2014.
Although the total import and export of China and South Asian countries declined slightly
between 2008 and 2009, the trade volume of China and South Asian countries was on
the rise since 2000. A similar conclusion can be drawn from the status of South Asian
countries in China import and export trade. China’s imports and exports to South Asia in
China’s share of the world’s total import and export grew from 1.21% in 2000 to 2.99%
in 2016, which also suggests that China and South Asian countries are getting closer
together.
For China’s imports to South Asian countries, it accounted for 0.86% of China’s total
imports from the world in 2000, and the value reached 2.06% in 2008, while in 2016 the
value fell to 0.93%. However, in terms of exports, it is on a steady rise in the proportion
of China’s total exports to the world from 2000 to 2016, from 1.52% to 4.55%.

China Development Report on South-South Cooperation 2017
184
Table 7.1.1-1 Overall Trade between China and South Asia
(US$ billion,%)
YearTotal trade Imports Exports Balance of
trade Value Share Value Share Value Share
2000 56.61 1.21 18.85 0.86 37.76 1.52 18.92
2001 65.17 1.30 23.13 0.98 42.05 1.58 18.92
2002 83.08 1.37 28.83 1.03 54.25 1.67 25.42
2003 120.50 1.46 48.85 1.26 71.65 1.63 22.80
2004 195.35 1.75 83.61 1.60 111.74 1.88 28.13
2005 266.33 1.95 107.23 1.77 159.10 2.09 51.87
2006 347.20 2.06 114.27 1.59 232.93 2.40 118.66
2007 509.38 2.44 158.99 1.83 350.39 2.87 191.40
2008 657.04 2.66 214.66 2.06 442.38 3.09 227.73
2009 568.37 2.68 151.91 1.65 416.46 3.47 264.55
2010 803.92 2.80 229.60 1.78 574.32 3.64 344.72
2011 971.78 2.76 261.07 1.61 710.71 3.74 449.65
2012 925.95 2.49 226.09 1.35 699.86 3.42 473.77
2013 959.15 2.40 209.96 1.17 749.19 3.39 539.24
2014 1056.05 2.54 201.69 1.11 854.36 3.65 652.66
2015 1108.33 2.91 169.51 1.10 938.82 4.13 769.31
2016 1102.52 2.99 148.42 0.93 954.10 4.55 805.67
Source: Compiled according to UN COMTRADE database.
In terms of trade balance between China and South Asian countries, China has
maintained a trade surplus. As is seen from Table 7.1.1-1, China’s trade surplus with
South Asian countries has increased from $1.892 billion in 2000 to $80.567 billion in
2016.
In summary, the total volume and size of bilateral trade between China and South
Asia has been on a steady rise. This is because China and South Asia have a total
population of 3 billion, with large markets and great potential. At the same time, the

7. South-South cooperation between China and South Asian countries
185
implementation of the China-Pakistan Economic Corridor, the Bangladesh-China-India-
Burma Economic Corridor and “the Belt and Road Initiative” have also promoted trade
between China and South Asian countries.
2. Trade between China and different countries in South AsiaImports and exports between China and South Asian countries are shown in Table
7.1.1-2.
Table 7.1.1-2 Trade between China and South Asia Countries in 2016
(US$ billion,%)
YearTotal trade Imports Exports Balance of
trade Value Share Value Share Value Share
India 693.99 11.25 604.83 16.96 89.16 3.42 -515.67
Maldives 2.85 12.60 2.85 13.42 0.001 0.08 -2.85
Pakistan 152.25 22.67 136.51 29.17 15.73 7.73 -120.77
Sri Lanka 44.69 15.04 42.70 21.90 1.99 1.95 -40.71
Bangladesh 110.64 13.87 103.49 21.53 7.15 2.25 -96.34
Nepal 9.31 12.81 9.20 13.91 0.11 1.74 -9.08
Bhutan 0.24 1.63 0.24 2.51 0.0001 0.01 -0.24
Source: Compiled according to UN COMTRADE database.
As can be seen from Table 7.1.3-2, the trade between China and South Asian
countries shows a clear imbalance in the country structure. This situation is related to the
uneven development of South Asian countries.
In 2016, the total imports and exports between China and India was $69.399 billion,
accounting for 11.25% of India’s total import and exports. This proportion indicates that
China plays an important role in India’s foreign trade. India’s imports from China in 2016
reach $60.483 billion, accounting for 16.96% of India’s imports, indicating that China
is India’s main source of imports; but India’s exports to China are only $8.916 billion,
accounting for only 3.42% of India’s exports to the world. Based on the data, there is a
clear trade gap between China and India.

China Development Report on South-South Cooperation 2017
186
In 2016, the total imports and exports between Pakistan and China were $15.225
billion, accounting for 22.67% of Pakistan’s total foreign trade. It indicates that China’s
trade with Pakistan is relatively close, and China plays an important role in Pakistan’s foreign
trade. Specifically, in 2016, Pakistan’s imports from China amounted to $13.651 billion,
accounting for 29.17% of Pakistan’s total imports from the world, indicating that China is the
main source of Pakistan’s imports; but Pakistan’s exports to China only account for 7.73% of
its exports. Pakistan’s trade deficit with China for the year was $12.077 billion.
In terms of trade between China and Sri Lanka, the total import and exports between
China and Sri Lanka in 2016 stood at $4.469 billion, accounting for 15.04% of Sri Lanka’s
foreign trade. Sri Lanka’s imports from China were $4.27 billion, but Sri Lanka’s exports to
China were only $199 million. There is also a significant trade deficit with China.
In terms of trade between China and Bangladesh, the bilateral trade between China
and Bangladesh has grown rapidly. At present, Bangladesh has become China’s third
largest trading partner in South Asia. Bangladesh’s imports from China are $10.349
billion, accounting for 21.53% of Bangladesh’s total imports.
Compared with the above-mentioned four countries, Nepal, Maldives and Bhutan
are small economies and have relatively less trade volume with China. China’s trade
with South Asian countries is relatively close, especially with India, Pakistan, Sri
Lanka, Bangladesh and other countries, but the trade links with Bhutan are not close.
From the perspective of commodity trade, South Asian countries' exports to China are
significantly fewer than their imports from China, and there is a clear trade deficit. This
trade imbalance will, to some extent, make South Asian countries more cautious while
deepening their trade relations with China.
(2) The growth rate and changes of the trade
In recent years, trade between China and South Asian countries has grown rapidly.
From 2000 to 2016, China’s imports from South Asian countries increased by 6.8
times, exports increased by 24.2 times, and annual growth rates were 13.7% and 22.3%
respectively. In contrast, China’s total imports increased by 6.3 times from 2000 to 2016,
and exports increased by 7.4 times. It can be seen from Figure 7.1.1-1 that the changes in
the total volume of imports and exports between China and South Asia and the trend of

7. South-South cooperation between China and South Asian countries
187
China’s total imports and exports are almost the same. Both showed rapid growth before
2009, but in 2009, due to the impact of the financial crisis, trade between them showed
a significant decline, and the growth after 2009 significantly slowed down. At the same
time, the change of China’s exports to South Asia is similar to that of its total exports.
Both began to pick up in 2009. However, China’s imports from South Asia have different
changes. China’s imports from South Asia showed rapid growth before 2009, while in
2009, the growth rate dropped significantly, but it continued to increase in 2009-2011.
From 2012 to 2016, China imports from South Asia have seen a year-on-year decline.
100300500700900
110013001500170019002100230025002700
2001
2000
2002
2003
2004
2005
2006
2007
2008
2009
2010
2011
2012
2013
2014
2015
2016
(%
)
China’s import from South Asia China’s export to South Asia
China’s import from World China’s export to World
year
Figure 7.1.1-1 China’s fixed-based growth rate of import and export with South Asia and the world (Year 2000 = 100)
Source: Compiled according to UN COMTRADE database.
Figure 7.1.1-2 is a fixed-base growth rate of China’s foreign trade and total trade
with South Asia. It can be seen that the fixed base growth rate of China’s total trade with
South Asia between 2001 and 2004 is basically the same as that of China’s total trade
with the world. However, the growth rate of China’s total trade with South Asia began to
be significantly higher than that of China and the rest of the world in 2005. Specifically,
after 2004 the growth rate of total imports and exports of China and South Asia’s is
significantly higher than that of China and the rest of the world, and the growth rate of
world trade is significantly different.

China Development Report on South-South Cooperation 2017
188
100
300
500
700
900
1100
1300
1500
1700
1900
2100
2001
2000
2002
2003
2004
2005
2006
2007
2008
2009
2010
2011
2012
2013
2014
2015
2016
(%
)
year
China’s total trade with South Asia China’s total trade with World
Figure 7.1.1-2 China’s Fix-based growth rate of total trade with South Asia and rest of the world (Year 2000 = 100)
Source: Compiled according to UN COMTRADE database.
Due to the small size as a whole, the trade volume between Bhutan, Maldives and China
have fluctuated greatly sometimes. For example, the growth rate of Bhutan’s imports in
2009 stood at 5719.78%, month-on-month increase of Mal Duff in 2006 reached 2107.17%.
Therefore, Figure 7.1.1-3 only includes the growth rate (month-on-month) of imports between
China and South Asia, Bangladesh, India, Nepal, Pakistan and Sri Lanka.
-70.00-60.00-50.00-40.00-30.00-20.00-10.00
0.0010.0020.0030.0040.0050.0060.0070.0080.0090.00
100.00110.00
2001
2002
2003
2004
2005
2006
2007
2008
2009
2010
2011
2012
2013
2014
2015
2016
YE
AR
-ON
-YE
AR
GR
OW
TH R
ATE
S
South Asia Bangladesh IndiaNepal Pakistan Sri Lanka
year
Figure 7.1.1-3 Comparison of China's imports chain growth from South Asia
Source: Compiled according to UN COMTRADE database.

7. South-South cooperation between China and South Asian countries
189
It can be seen from Figure 7.1.1-3 that excluding Bhutan and Maldives, the
fluctuation of China’s imports and exports from South Asian countries is still relatively
large; the year-on-year or chain growth rate of China’s imports from Nepal has changed
a lot. In 2008, its growth rate was -60%, and in 2010 and 2012, its growth rate reached
115% and 112% respectively. The amount of trade between China and India, the largest
country in South Asia, has also fluctuated. In 2003, China’s imports from India grew by
more than 80%, while in 2009 China’s imports from India fell by 32%. The year-on-year
growth rate of China’s imports from Bangladesh is also relatively high. It has reached
93% at highest and the lowest growth rate is -11%. In general, the year-on-year growth
rate of China’s imports from India, that from Nepal, and that from Bangladesh have wider
fluctuations than that from South Asia as a whole. The fluctuations of China’s imports
from Pakistan and Sri Lanka are less than that of China’s total imports from South Asia.
-70.00
-40.00
-10.00
20.00
50.00
80.00
110.00
140.00
2001
2002
2003
2004
2005
2006
2007
2008
2009
2010
2011
2012
2013
2014
2015
2016
YE
AR
-ON
-YE
AR
GR
OW
TH R
ATE
S
South Asia Bangladesh India Maldives
Nepal Pakistan Sri Lanka
year
Figure 7.1.1-4 The chain growth rate of China's exports to South Asian and South Asian countries
Source: Compiled according to UN COMTRADE database.
As can be seen from Figure 7.1.1-4, the fluctuation of China’s exports to South Asia
is slightly lower than that China’s imports from South Asian countries. Among them,

China Development Report on South-South Cooperation 2017
190
China’s exports to Maldives and Nepal are highly volatile, but the fluctuations of China’s
exports to Bangladesh, Pakistan, and Sri Lanka are lower than that of China’s exports to
South Asia. The month-on-month rate is between -15% and 50%.
In summary, we can see that although the growth rate of trade between China and
South Asia far exceeds that of China and the rest of the world, the higher growth rate
comes with the greater volatility of trade in South Asian countries.
7.1.2 The Pattern of Trade between China and South Asian Countries
1. Pattern of trade by country in South AsiaIn China’s imports from South Asia, Bhutan and Maldives account for a very low
proportion of less than 0.10%. Therefore, in Figure 7.1.2-1 below, only the share of
imports from Bangladesh, India, Pakistan, Sri Lanka and Nepal are included.
5.86%
79.26%
0.15%
12.89% 1.84%Bangladesh
India
Nepal
Pakistan Sri Lanka
Figure 7.1.2-1 The Pattern of trade by Country in South Asia
Source: Compiled according to UN COMTRADE database.
As can be seen from Figure 7.1.2-1, China’s imports from South Asia are not
balanced. The main source of China’s imports is India. In 2016, India accounted for
79.26% of China’s total imports from South Asia, while other South Asian countries’ total
share was only 20.74%. As the second largest source of China’s imports in South Asia,
Pakistan only accounts for 12.89%. Bangladesh and Sri Lanka have a smaller share of
imports, with 5.86% and 1.84% respectively.

7. South-South cooperation between China and South Asian countries
191
15.04%
61.42%
0.91%
18.12%
4.51% Bangladesh
India
Nepal
Pakistan
Sri Lanka
Figure 7.1.2-2 Composition of China’s exports to South Asian countries.
Source: Compiled according to UN COMTRADE database.
Since Bhutan and Maldives account for less than 0.5% of China’s exports to South
Asia, in Figure 7.1.2-2, only China’s exports to Bangladesh, India, Pakistan, Sri Lanka
and Nepal are included. It can be seen that China’s exports to South Asian countries
are similar to China’s imports from them, and both are uneven. India is still the main
destination of China’s exports. China’s exports to India account for 61.42% of the total
exports to South Asia, exceeding the share of other South Asian countries. Pakistan also
accounts for a large proportion of China’s exports to South Asia, at 18.12%. Bangladesh’s
share of exports exceeds its share of imports, with a gap of 15.04%. Sri Lanka’s share is
still low, only 4.51%.
2. The pattern of trade by productsDue to the small size of Maldives, Nepal and Bhutan, the following analysis will
focus on the structure of import and exports between China and Bangladesh, India,
Pakistan and Sri Lanka.
(1)Trade pattern classified by final use of the products
As is shown in Table 7.1.2-1, in 2000-2004, China’s imports from Bangladesh were
mainly intermediate goods, which account for more than half and reached 79.68% at
highest in 2001. In 2005, China’s most primary imported products from Bangladesh are

China Development Report on South-South Cooperation 2017
192
raw materials, accounting for 49.35%, followed by intermediate goods at 41.55%. From
2007 to 2010, the products China imported from Bangladesh were mainly raw materials,
the proportion of which exceeded 50%, while the proportion of intermediate goods was
getting smaller and smaller, and the proportion of consumer goods gradually increased.
By 2013, the proportion of consumer goods exceeded 50% for the first time. In 2014-
2016, the proportion of consumer goods continued to increase, reaching 68.38% in 2016,
while the share of intermediate goods and raw materials was smaller and smaller. In
2000-2016, China rarely imported capital goods from Bangladesh, and its proportion was
always less than 2%.
Table 7.1.2-1 The Pattern of Trade between China and Bangladesh
(%)
YearImports Exports
RM IP CG CP RM IP CG CP
2000 17.78 50.30 30.91 1.01 2.67 62.05 9.98 25.30
2001 11.47 79.68 8.04 0.81 2.38 59.14 10.72 27.77
2002 25.29 68.53 6.06 0.12 3.34 59.33 11.90 25.43
2003 26.91 57.86 14.91 0.32 2.62 66.69 10.44 20.24
2004 33.41 51.94 14.56 0.09 1.11 63.24 9.56 26.09
2005 49.35 41.55 8.96 0.14 1.66 65.21 9.30 23.83
2006 46.80 40.33 12.60 0.28 1.89 62.81 10.03 25.27
2007 53.12 31.68 15.01 0.20 2.26 62.83 10.75 24.17
2008 52.92 31.29 15.53 0.27 1.88 62.97 10.48 24.66
2009 51.19 25.42 23.35 0.03 3.15 60.33 12.84 23.67
2010 55.49 19.37 25.05 0.09 2.76 55.81 13.46 27.98
2011 45.85 18.08 35.87 0.20 2.42 59.33 12.98 25.27
2012 35.05 20.90 43.48 0.57 2.05 60.81 14.45 22.70
2013 26.50 21.15 51.18 1.16 1.89 57.58 17.61 22.92
2014 21.16 20.03 57.62 1.19 2.01 52.83 21.18 23.98
2015 13.56 18.20 67.23 1.01 1.68 53.46 21.39 23.48

7. South-South cooperation between China and South Asian countries
193
YearImports Exports
RM IP CG CP RM IP CG CP
2016 12.48 17.97 68.38 1.18 1.89 52.03 21.41 24.67
Source: Compiled according to UN COMTRADE database.
Note: RM refers to Row Materials; IP refers to Intermediate Products; CG refers to Consumer goods;
and CP refers to Capital Products respectively in second line of the table.
The product structure of China’s exports to Bangladesh has been relatively stable,
and the most important one is intermediate goods, the proportion of which is between
50% and 68%; followed by capital goods, with a share of 20% to 30%; then that of
consumer goods is between 9% and 22%; the proportion of raw materials is the lowest. It
is less than 5%.
Table 7.1.2-2 The Pattern of Trade between China and India
(%)
YearImports Exports
RM IP CG CP RM IP CG CP
2000 40.76 51.92 4.03 3.28 22.21 48.19 11.67 17.94
2001 42.90 49.67 4.06 3.38 18.62 49.64 11.93 19.81
2002 34.98 58.21 2.13 4.68 11.64 47.83 12.02 28.50
2003 37.66 57.49 1.18 3.67 8.18 51.46 13.57 26.80
2004 61.49 33.75 1.28 3.48 6.85 45.05 13.25 34.85
2005 61.40 32.70 2.02 3.88 5.78 44.35 13.49 36.37
2006 62.78 31.53 1.42 4.26 3.44 41.81 11.85 42.90
2007 69.21 25.84 1.12 3.82 1.83 40.10 11.82 46.25
2008 78.44 17.01 1.91 2.64 1.79 37.85 12.53 47.84
2009 64.88 28.17 1.74 5.20 1.43 31.15 12.94 54.47
2010 68.05 25.10 2.71 4.14 1.27 36.75 15.11 46.87
2011 59.76 33.75 2.07 4.42 1.28 37.51 15.83 45.38
2012 43.29 46.59 4.90 5.22 1.25 35.78 18.67 44.30
2013 31.71 57.93 3.94 6.41 1.19 34.99 21.68 42.14
Continued

China Development Report on South-South Cooperation 2017
194
YearImports Exports
RM IP CG CP RM IP CG CP
2014 24.45 62.80 5.12 7.62 1.10 38.66 21.99 38.24
2015 15.81 68.88 7.15 8.16 1.34 35.92 22.73 40.01
2016 20.03 63.68 6.64 9.65 1.01 30.39 21.93 46.67
Data source: Compiled according to UN COMTRADE database.
Note: RM refers to Row Materials; IP refers to Intermediate Products; CG refers to Consumer goods;
and CP refers to Capital Products respectively in second line of the table.
As can be seen from Table 7.1.2-2, in 2000-2003, what China imported from India
was mainly intermediate products, the proportion of which was more than 50%, and
reached its peak in 2002, with a share of 58.21%. In 2004, the proportion of intermediate
goods plummeted, while the raw materials surged, accounting for 61.4%. From 2005
to 2011, the main products that China imported from India were raw materials, all of
which accounted for more than 50%. In 2012, the imports of intermediate goods again
exceeded that of raw materials. In 2013-2016, China’s main imports from India were
intermediates, with an annual weight of more than 50%. Although the proportion of
intermediate goods and raw materials China imported from India has risen and fallen, the
sum of their proportion has always been higher than 80%. Though increasing after 2010,
the proportion of consumer goods and that of the capital goods are less than 10%.
From the perspective of export structure, China’s exports to India were dominated
by intermediate goods in 2000-2005, and the proportion of consumer goods and capital
goods was small. In 2006, China’s exports of capital to India accounted for more than
intermediate products, and it remained the largest product category in terms of exports
from 2006 to 2016. Since 2008, the proportion of China’s exports of consumer goods to
India has steadily increased, while the raw materials have remained at a low level below
2%.
From the perspective of product category, goods exported to China from India are
mainly the raw materials and intermediate goods, while capital goods and consumer goods
are little. Goods exported to India from China are mainly the capital goods and consumer
Continued
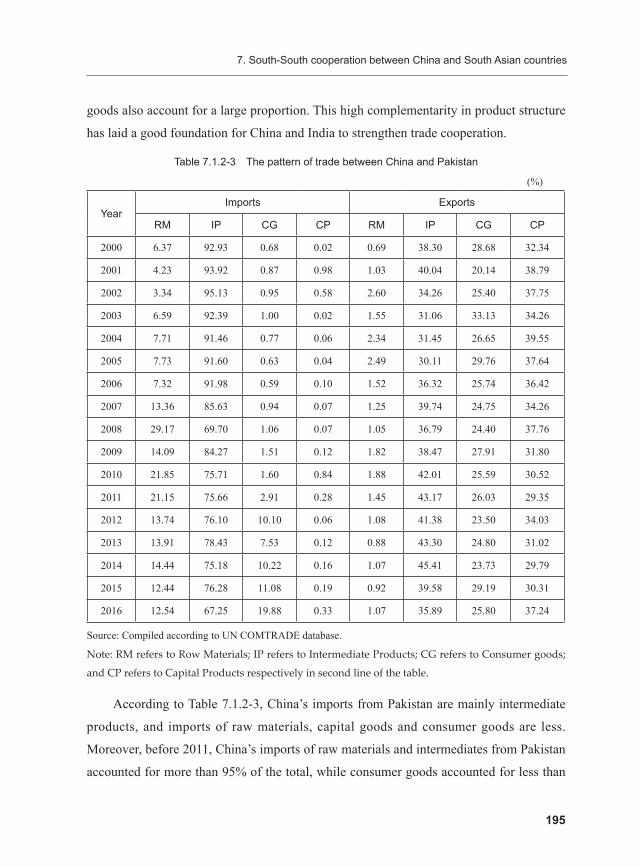
7. South-South cooperation between China and South Asian countries
195
goods also account for a large proportion. This high complementarity in product structure
has laid a good foundation for China and India to strengthen trade cooperation.
Table 7.1.2-3 The pattern of trade between China and Pakistan
(%)
YearImports Exports
RM IP CG CP RM IP CG CP
2000 6.37 92.93 0.68 0.02 0.69 38.30 28.68 32.34
2001 4.23 93.92 0.87 0.98 1.03 40.04 20.14 38.79
2002 3.34 95.13 0.95 0.58 2.60 34.26 25.40 37.75
2003 6.59 92.39 1.00 0.02 1.55 31.06 33.13 34.26
2004 7.71 91.46 0.77 0.06 2.34 31.45 26.65 39.55
2005 7.73 91.60 0.63 0.04 2.49 30.11 29.76 37.64
2006 7.32 91.98 0.59 0.10 1.52 36.32 25.74 36.42
2007 13.36 85.63 0.94 0.07 1.25 39.74 24.75 34.26
2008 29.17 69.70 1.06 0.07 1.05 36.79 24.40 37.76
2009 14.09 84.27 1.51 0.12 1.82 38.47 27.91 31.80
2010 21.85 75.71 1.60 0.84 1.88 42.01 25.59 30.52
2011 21.15 75.66 2.91 0.28 1.45 43.17 26.03 29.35
2012 13.74 76.10 10.10 0.06 1.08 41.38 23.50 34.03
2013 13.91 78.43 7.53 0.12 0.88 43.30 24.80 31.02
2014 14.44 75.18 10.22 0.16 1.07 45.41 23.73 29.79
2015 12.44 76.28 11.08 0.19 0.92 39.58 29.19 30.31
2016 12.54 67.25 19.88 0.33 1.07 35.89 25.80 37.24
Source: Compiled according to UN COMTRADE database.
Note: RM refers to Row Materials; IP refers to Intermediate Products; CG refers to Consumer goods;
and CP refers to Capital Products respectively in second line of the table.
According to Table 7.1.2-3, China’s imports from Pakistan are mainly intermediate
products, and imports of raw materials, capital goods and consumer goods are less.
Moreover, before 2011, China’s imports of raw materials and intermediates from Pakistan
accounted for more than 95% of the total, while consumer goods accounted for less than

China Development Report on South-South Cooperation 2017
196
2%. After 2012, the proportion of China’s imports of consumer goods from Pakistan
began to rise significantly, and in 2016 it increased to nearly 20%. This change reflects
the improvement in the level of Pakistan’s exports to China.
Among the products exported from China to Pakistan, capital goods, consumer
goods and intermediate goods all accounted for a high proportion, while the proportion
of raw materials exports was always less than 5%. For developing countries such as
Pakistan, which are in the process of industrialization, the import of capital goods from
China will help them develop domestic industries.
Table 7.1.2-4 The pattern of trade between China and Sri Lanka
(%)
Imports Exports
Year RM IP CG CP RM IP CG CP
2000 12.11 32.38 14.48 41.03 4.03 53.92 20.95 21.10
2001 26.61 20.34 17.93 35.12 6.96 51.54 19.52 21.98
2002 41.76 22.67 18.25 17.32 4.94 54.70 24.71 15.65
2003 28.53 31.32 15.80 24.34 5.52 58.00 22.28 14.20
2004 51.00 10.89 17.93 20.18 2.07 61.07 21.52 15.35
2005 57.91 9.22 17.13 15.74 1.84 56.66 21.00 20.50
2006 46.06 9.36 23.62 20.96 2.11 52.21 20.83 24.85
2007 27.30 31.75 22.43 18.52 2.59 51.59 19.49 26.34
2008 22.56 31.39 31.09 14.96 1.57 50.35 18.39 29.69
2009 18.48 43.80 26.81 10.91 2.40 45.61 18.76 33.23
2010 15.82 42.68 30.78 10.72 3.41 47.37 23.01 26.22
2011 26.21 34.03 30.62 9.15 2.55 41.50 25.66 30.29
2012 21.82 30.84 37.77 9.57 1.86 42.01 25.70 30.43
2013 16.45 31.83 42.29 9.42 1.45 40.54 30.92 27.10
2014 8.96 41.58 42.08 7.38 2.38 41.69 31.83 24.10
2015 9.85 34.39 47.30 8.47 2.54 43.20 32.86 21.39
2016 7.19 29.05 54.59 9.16 3.31 39.86 32.49 24.33
Source: Compiled according to UN COMTRADE database.
Note: RM refers to Row Materials; IP refers to Intermediate Products; CG refers to Consumer goods;
and CP refers to Capital Products respectively in second line of the table.

7. South-South cooperation between China and South Asian countries
197
According to Table 7.1.2-4, the product structure of China’s imports from Sri
Lanka is relatively balanced, and there is no dominating commodity. It can be seen that
the proportion of China’s imports of capital goods from Sri Lanka is decreasing, while
that of consumer goods is rising. The proportion of imports of raw materials and that of
intermediates products are relatively volatile. From the perspective of export structure,
China’s exports to Sri Lanka are mainly intermediate products and consumer products
and China’s exports of capital goods to Sri Lanka are slightly lower than those exported
to Pakistan and India.
(2)Trade pattern of products classified by SITC
According to the theory of comparative advantage, the basis of international trade is
the relative difference in factor endowments owned by countries. According to the factor
density, trade products can be divided into energy-intensive products, labor-intensive
products, and capital and technology-intensive products. According to the classification
of international trade standards, in general, the 0-4th categories in the SITC 1-digit code
are resource-intensive products, and the 5th and 7th are capital and technology-intensive
products, the 6th and the 8th are labor-intensive products. Table 7.1.2-5 lists the structure
of goods imported by China from South Asia classified by SITC 1-digit in 2016.
Table 7.1.2-5 Structure of China’s import from South Asia in 2016
(%)
Bangladesh Bhutan India Maldives Nepal Pakistan Sri Lanka
SITC0 9.57 0.49 1.46 83.52 0.12 19.38 16.03
SITC1 0.02 0.00 0.01 0.00 0.00 0.00 0.01
SITC2 7.63 0.00 21.35 0.98 0.23 8.32 13.30
SITC3 0.00 0.00 1.49 0.00 0.00 0.68 0.00
SITC4 0.11 0.00 2.57 0.00 0.01 0.00 0.12
SITC5 3.94 0.88 13.63 0.00 2.24 1.80 3.80
SITC6 17.19 93.34 45.14 0.08 58.88 65.18 18.84
SITC7 0.75 0.46 9.62 8.76 0.19 0.33 11.74
SITC8 60.68 2.05 4.64 3.72 25.71 4.23 36.01
SITC9 0.10 2.77 0.10 2.96 12.62 0.08 0.13
Source: Compiled according to UN COMTRADE database.
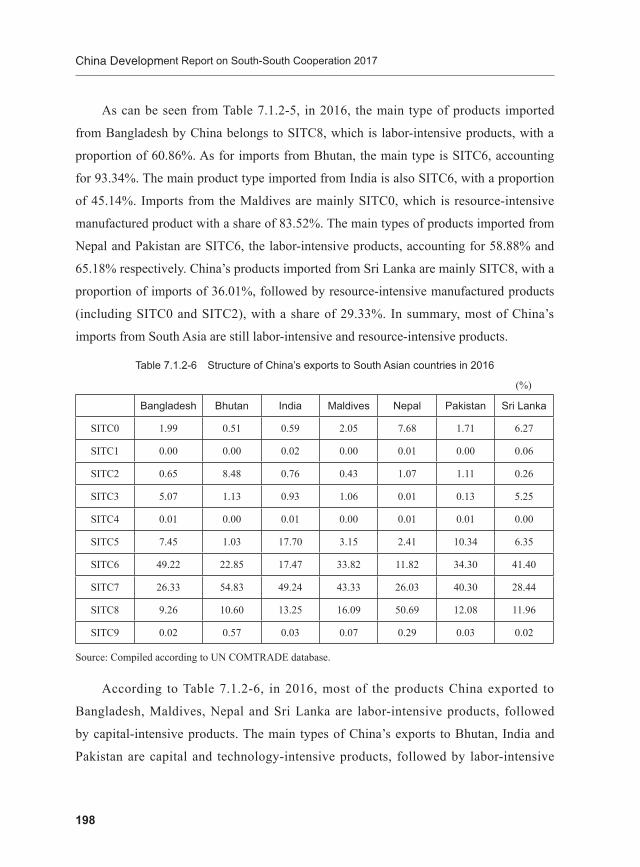
China Development Report on South-South Cooperation 2017
198
As can be seen from Table 7.1.2-5, in 2016, the main type of products imported
from Bangladesh by China belongs to SITC8, which is labor-intensive products, with a
proportion of 60.86%. As for imports from Bhutan, the main type is SITC6, accounting
for 93.34%. The main product type imported from India is also SITC6, with a proportion
of 45.14%. Imports from the Maldives are mainly SITC0, which is resource-intensive
manufactured product with a share of 83.52%. The main types of products imported from
Nepal and Pakistan are SITC6, the labor-intensive products, accounting for 58.88% and
65.18% respectively. China’s products imported from Sri Lanka are mainly SITC8, with a
proportion of imports of 36.01%, followed by resource-intensive manufactured products
(including SITC0 and SITC2), with a share of 29.33%. In summary, most of China’s
imports from South Asia are still labor-intensive and resource-intensive products.
Table 7.1.2-6 Structure of China’s exports to South Asian countries in 2016
(%)
Bangladesh Bhutan India Maldives Nepal Pakistan Sri Lanka
SITC0 1.99 0.51 0.59 2.05 7.68 1.71 6.27
SITC1 0.00 0.00 0.02 0.00 0.01 0.00 0.06
SITC2 0.65 8.48 0.76 0.43 1.07 1.11 0.26
SITC3 5.07 1.13 0.93 1.06 0.01 0.13 5.25
SITC4 0.01 0.00 0.01 0.00 0.01 0.01 0.00
SITC5 7.45 1.03 17.70 3.15 2.41 10.34 6.35
SITC6 49.22 22.85 17.47 33.82 11.82 34.30 41.40
SITC7 26.33 54.83 49.24 43.33 26.03 40.30 28.44
SITC8 9.26 10.60 13.25 16.09 50.69 12.08 11.96
SITC9 0.02 0.57 0.03 0.07 0.29 0.03 0.02
Source: Compiled according to UN COMTRADE database.
According to Table 7.1.2-6, in 2016, most of the products China exported to
Bangladesh, Maldives, Nepal and Sri Lanka are labor-intensive products, followed
by capital-intensive products. The main types of China’s exports to Bhutan, India and
Pakistan are capital and technology-intensive products, followed by labor-intensive

7. South-South cooperation between China and South Asian countries
199
products.
In summary, compared with South Asia’s exports to China, which are mainly labor-
intensive and resource-intensive products, China’s main products exported to South
Asian countries are capital-intensive products and labor-intensive products. In the SITC-
7 category, the machinery and transportation equipment, the share of China’s exports to
South Asia is significantly higher than that of South Asia’s exports to China.
(3) Trade pattern classified by technical level
Here, we divide the SITC 3-digit level products into five categories according to
the technical characteristics: primary products (PP), resource products (RB), low-tech
products (LT), and medium-tech products (MT) and high technology products (HT). This
classification will be used to analyze the characteristics of structure of traded good with
different technical level between China and South Asian countries.
Table 7.1.2-7 Total trade and technical level between China and South Asia
Trade technology structure (%) Total trade amount ($ billion)
PP RB LT MT HT PP RB LT MT HT
2000 13.43 23.43 29.66 23.07 10.42 7.42 12.95 16.40 12.75 5.76
2005 6.91 33.90 20.66 23.98 14.55 18.19 89.23 54.37 63.12 38.31
2010 7.33 25.63 18.65 28.10 20.29 58.90 205.99 149.85 225.79 163.07
2011 9.17 21.73 20.93 29.49 18.68 89.10 211.17 203.35 286.53 181.51
2012 10.22 16.88 24.42 29.45 19.04 94.87 156.71 226.73 273.43 176.83
2013 8.71 15.86 28.24 27.73 19.45 83.66 152.27 271.16 266.25 186.70
2014 8.10 16.09 28.43 28.75 18.62 85.68 170.12 300.65 304.03 196.87
2015 6.08 14.54 29.32 29.48 20.58 67.41 161.22 325.17 326.90 228.28
2016 4.84 15.18 26.53 29.31 24.13 53.44 167.57 292.76 323.53 266.33
Source: Compiled according to UN COMTRADE database.
Table 7.1.2-7 shows the trade amount and proportion of products in five technical
level from 2000 to 2016. Compared with 2000, the trade volume of trade goods in all five
technical level between China and South Asia has increased significantly in 2016, and the

China Development Report on South-South Cooperation 2017
200
trade of medium technology products (MT) was largest, reaching $32.353 billion. The
primary trade (PP) trade volume was the smallest, with $5.344 billion.
From the share of products in various technical level, the MT accounted the most
and its proportion increased steadily. The share of HT products increased significantly
between 2000 and 2010, reaching 20.29% in 2010. Between 2010 and 2014, the
proportion declined, but not large. In 2015, the share began to rise, reaching 24.13% in
2016. The share of primary products and that of resource products in the trade between
China and South Asian countries have dropped significantly, reflecting that the relative
role of resource products in trade becomes weaker with the development of economies.
The share of LT products of the trade between China and developing countries in South
Asia has been greater than 20%, and was only below 20% in 2010.
Table 7.1.2-8 Structure of China’s imports from South Asian countries classified by technical level in 2016
(%)
Bangladesh Bhutan Maldives Nepal Pakistan Sri Lanka India
HT 1.23 0.45 7.63 0.69 0.32 13.32 4.71
MT 5.78 98.72 1.52 1.43 2.42 4.96 13.88
LT 75.17 0.00 2.86 93.98 63.61 42.23 16.37
PP 11.63 0.52 86.19 0.41 27.19 18.74 19.25
RB 6.18 0.31 1.80 3.49 6.46 20.74 45.79
Source: Compiled according to UN COMTRADE database.
Table 7.1.2-8 shows the structure of China’s imports from South Asian countries by
technical level. It can be seen that in 2016, China’s imports from Bangladesh were mainly
LT, with a proportion of 75.17%. While as for Bhutan, China imported MT mainly,
with a proportion of 98.72%. China’s imports from the Maldives are mainly PP, with a
proportion of 86.19%. China’s imports from Nepal, Pakistan, and Sri Lanka are mainly
LT, accounting for 93.98%, 63.61%, and 42.33%, respectively. The goods imported
by China from India are mainly RB. In summary, China’s imports from South Asian
countries are dominated by low value-added products such as primary products, low-tech
products and resource products.
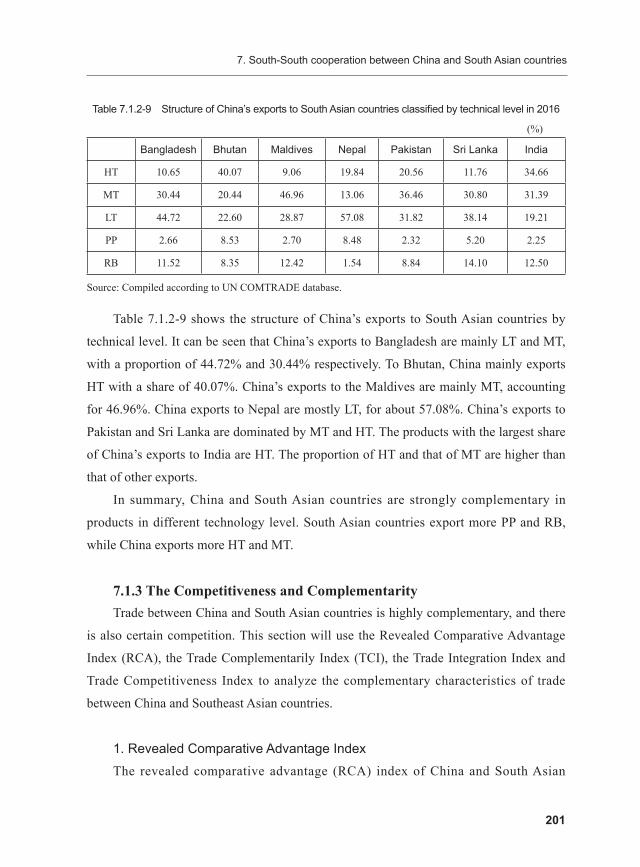
7. South-South cooperation between China and South Asian countries
201
Table 7.1.2-9 Structure of China’s exports to South Asian countries classified by technical level in 2016
(%)
Bangladesh Bhutan Maldives Nepal Pakistan Sri Lanka India
HT 10.65 40.07 9.06 19.84 20.56 11.76 34.66
MT 30.44 20.44 46.96 13.06 36.46 30.80 31.39
LT 44.72 22.60 28.87 57.08 31.82 38.14 19.21
PP 2.66 8.53 2.70 8.48 2.32 5.20 2.25
RB 11.52 8.35 12.42 1.54 8.84 14.10 12.50
Source: Compiled according to UN COMTRADE database.
Table 7.1.2-9 shows the structure of China’s exports to South Asian countries by
technical level. It can be seen that China’s exports to Bangladesh are mainly LT and MT,
with a proportion of 44.72% and 30.44% respectively. To Bhutan, China mainly exports
HT with a share of 40.07%. China’s exports to the Maldives are mainly MT, accounting
for 46.96%. China exports to Nepal are mostly LT, for about 57.08%. China’s exports to
Pakistan and Sri Lanka are dominated by MT and HT. The products with the largest share
of China’s exports to India are HT. The proportion of HT and that of MT are higher than
that of other exports.
In summary, China and South Asian countries are strongly complementary in
products in different technology level. South Asian countries export more PP and RB,
while China exports more HT and MT.
7.1.3 The Competitiveness and ComplementarityTrade between China and South Asian countries is highly complementary, and there
is also certain competition. This section will use the Revealed Comparative Advantage
Index (RCA), the Trade Complementarily Index (TCI), the Trade Integration Index and
Trade Competitiveness Index to analyze the complementary characteristics of trade
between China and Southeast Asian countries.
1. Revealed Comparative Advantage IndexThe revealed comparative advantage (RCA) index of China and South Asian

China Development Report on South-South Cooperation 2017
202
countries can be calculated by formula (2.1). The results are shown in Table 7.1.3-1.
Table 7.1.3-1 RCA Index (RCA) of China and South Asian countries
India Maldives Nepal Pakistan Sri Lanka Bangladesh Bhutan
SITC-0 0.3 0.03 0.12 0.16 0.13 1.08 0.41
SITC-1 0.36 - 0.44 2.49 0.13 0.62 0.2
SITC-2 0.18 0.54 0.18 0.23 0.19 0.62 0.09
SITC-3 0.12 143.8 44710 1.69 0.8 2.2 0.05
SITC-4 0.08 12.57 0.1 0.11 0.03 0.52 1.08
SITC-5 0.4 97.99 0.87 1.41 3.29 12.96 0.8
SITC-6 0.65 818.3 0.39 0.39 1.28 2.6 0.36
SITC-7 2.82 183.8 61.44 51.85 10.78 37.23 2128
SITC-8 1.55 4324.5 1.17 0.84 0.49 0.29 105.39
SITC-9 0.14 97.73 11.74 8.67 9.56 16.23 32.63
Source: Compiled according to UN COMTRADE database.
Note: Bangladesh uses 2015 data, Bhutan uses 2012 data, and the rest of the countries use 2016 data, indicating
missing values.
If the country’s RCA>1 on a certain product, the country has a revealed comparative
advantage on such goods. If the RCA<1, the country has no revealed comparative
advantage on that good. Table 7.1.3-1 shows that China’s comparative advantages to
India are on the mechanical and transportation equipment (STIC-7) and miscellaneous
products (STIC-8). The data shows that, China’s has surprisingly large RCA on certain
commodities to Maldives, Nepal and Bhutan, because these countries have almost no
exports in this category, and the proportion of these exports is close to zero. So, China
shows huge revealed comparative advantage to these countries on certain products
categories. Specifically, China has RCA to Maldives that are all exceed 90 in fossil fuels,
lubricants and related materials (SITC-3), chemicals and related products (SITC-5),
manufactured products by source (SITC-6) ), machinery and transportation equipment
(SITC-7), miscellaneous products (SITC-8) and other commodities (SITC-9) all exceed
90, indicating that the Maldives’s exports expect for RB are very little, which is consistent

7. South-South cooperation between China and South Asian countries
203
with Maldives’s current economic situation, dominated by tourism and lack of resources.
It is not a unique instance that there is a shortage of fossil fuel in Nepal, which makes
China’s RCA to Nepal on SITC-3 greater than 4,000. From the RCA to Bhutan, China
has obvious comparative advantages in machinery and transportation equipment and
miscellaneous products. In the trade with Pakistan, Sri Lanka and Bangladesh, China has
a strong comparative advantage in machinery and transportation equipment.
On the export of labor-intensive products, China’s RCA to South Asian countries has
distinctly different characteristics. In the SITC-8 category representing labor-intensive
products, China’s RCA to Pakistan, Sri Lanka and Bangladesh are all less than 1, while in
SITC-6 products, China’s RCA for India Pakistan, Nepal and Bhutan are also less than 1.
This means that China and South Asian countries have their own comparative advantages
in different types of labor-intensive products, and the two sides can still trade with each
other.
In categories of food and live animals (SITC-0), beverages and tobacco (SITC-
1), non-edible raw materials (SITC-2), and animal and vegetable fats and oils (SITC-
4), most South Asian countries have obvious comparative advantages to China.
In summary, in the trade with South Asia, China has strong international competitiveness
in high value-added products such as machinery and transportation equipment, which
is closely related to China’s efforts to support technological innovation and continuous
economic development in recent years.
2. Trade complementarity indexThe trade complementarity (TC) index is an indicator to measure the compatibility
of a country’s imports with another country’s exports. We use formula (2.2) to calculate
the TCI between China and South Asian countries with China as the exporting country
and China as the importing country respectively. The results are shown in Table 7.1.3-2.

China Development Report on South-South Cooperation 2017
204
Table 7.1.3-2 TC Index between China and South Asian Countries
China’s imports China’s exports
Bangladesh 0.11 0.47
Bhutan 0.36 0.50
India 0.47 0.50
Sri Lanka 0.23 0.53
Maldives 0.21 0.54
Nepal 0.29 0.46
Pakistan 0.22 0.53
Source: Compiled according to UN COMTRADE database.
Note: Bangladesh uses data for 2015, Bhutan uses data for 2012, and the rest of the countries are 2016 data.
It can be analyzed from the Table 7.1.3-2 that: firstly, from the perspective of China’s
exports, the TCI between China and South Asian countries is around 0.5, indicating
that the compatibility of product structure of China’s exports and product structure of
South Asian countries is modest. Secondly, the TCI of China’s imports is significantly
lower than that of exports. This shows that there is a big difference between the product
structure of South Asian countries' exports and the product structure demand of China’s
imports. This restricts the export expansion of South Asian countries to China to a certain
extent, and partly leads to the trade deficit of South Asian countries to China.
3. Trade Integration IndexThe trade integration (TI) index between China and South Asia can be obtained by
formula (2.3). The results are shown in Table 7.1.3-3.
Table 7.1.3-3 TI Index between China and South Asian Countries
2000 2005 2010 2011 2012 2013 2014 2015 2016
South Asia 1.47 1.08 1.20 1.12 0.98 1.05 1.20 1.24 1.55
Bangladesh - 2.42 2.03 1.72 1.83 2.19 - 1.94 -
Bhutan - 0.02 0.02 0.15 0.13 - - - -
India 0.70 0.81 1.06 0.99 0.81 0.83 0.88 1.00 1.15

7. South-South cooperation between China and South Asian countries
205
2000 2005 2010 2011 2012 2013 2014 2015 2016
Maldives 0.08 0.29 0.53 0.62 0.41 0.45 0.39 0.61 1.06
Nepal 3.01 - 1.30 1.81 2.73 2.75 2.26 0.85 0.69
Pakistan - 1.74 1.68 1.76 1.77 2.02 2.09 2.53 2.59
Sri Lanka 1.72 1.44 1.47 1.38 1.40 1.54 1.48 1.53 1.55
Source: Compiled according to UN COMTRADE database.
Note: “-”represents data missing.
According to the data in Table 7.1.3-3, the overall trade integration index between
China and South Asia, except for slightly less than 1 in 2012, is greater than 1, indicating
that China and South Asian countries have close trade links in the past decade. As for
specific country, China’s trade integration index with Pakistan, Sri Lanka and Bangladesh
has been greater than 1 from 2000 to 2016, indicating that China’s trade with these three
countries is relatively close. In particular, the China-Pakistan trade integration index
has increased significantly since 2013, which is closely related to the China-Pakistan
Economic Corridor and the construction of the China-Pakistan Free Trade Zone. The
index between China and Sri Lanka is stable around 1.5.Similarly, China enjoys a close
trade link with Bangladesh, and its index moves around 2.0.However, China’s trade
integration index with India, the largest developing country in South Asia, is not big,
and it was below 1 in most years before 2014.Thought increasing significantly in 2015
and 2016, reaching 1.15 in 2016, the trade integration index between China and India
is still at a low level among South Asian countries. Although the trade integration index
between China and Maldives was very low from 2000 to 2015, the value reached 1.06 in
2016, indicating that China-Malaysia trade is strengthening, which has much to do with
the Maldives-China Free Trade Agreement. However, the trade integration index between
China and Nepal has declined in recent years, and has fallen below 1 in 2016, while the
trade integration index between China and Bhutan remains below 1.
Continued
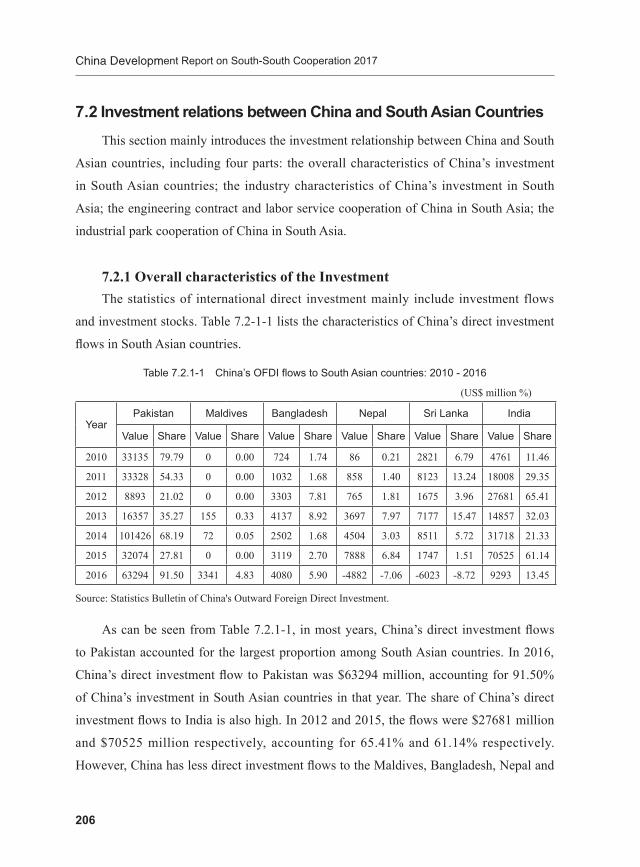
China Development Report on South-South Cooperation 2017
206
7.2 Investment relations between China and South Asian CountriesThis section mainly introduces the investment relationship between China and South
Asian countries, including four parts: the overall characteristics of China’s investment
in South Asian countries; the industry characteristics of China’s investment in South
Asia; the engineering contract and labor service cooperation of China in South Asia; the
industrial park cooperation of China in South Asia.
7.2.1 Overall characteristics of the InvestmentThe statistics of international direct investment mainly include investment flows
and investment stocks. Table 7.2-1-1 lists the characteristics of China’s direct investment
flows in South Asian countries.
Table 7.2.1-1 China’s OFDI flows to South Asian countries: 2010 - 2016
(US$ million %)
YearPakistan Maldives Bangladesh Nepal Sri Lanka India
Value Share Value Share Value Share Value Share Value Share Value Share
2010 33135 79.79 0 0.00 724 1.74 86 0.21 2821 6.79 4761 11.46
2011 33328 54.33 0 0.00 1032 1.68 858 1.40 8123 13.24 18008 29.35
2012 8893 21.02 0 0.00 3303 7.81 765 1.81 1675 3.96 27681 65.41
2013 16357 35.27 155 0.33 4137 8.92 3697 7.97 7177 15.47 14857 32.03
2014 101426 68.19 72 0.05 2502 1.68 4504 3.03 8511 5.72 31718 21.33
2015 32074 27.81 0 0.00 3119 2.70 7888 6.84 1747 1.51 70525 61.14
2016 63294 91.50 3341 4.83 4080 5.90 -4882 -7.06 -6023 -8.72 9293 13.45
Source: Statistics Bulletin of China's Outward Foreign Direct Investment.
As can be seen from Table 7.2.1-1, in most years, China’s direct investment flows
to Pakistan accounted for the largest proportion among South Asian countries. In 2016,
China’s direct investment flow to Pakistan was $63294 million, accounting for 91.50%
of China’s investment in South Asian countries in that year. The share of China’s direct
investment flows to India is also high. In 2012 and 2015, the flows were $27681 million
and $70525 million respectively, accounting for 65.41% and 61.14% respectively.
However, China has less direct investment flows to the Maldives, Bangladesh, Nepal and
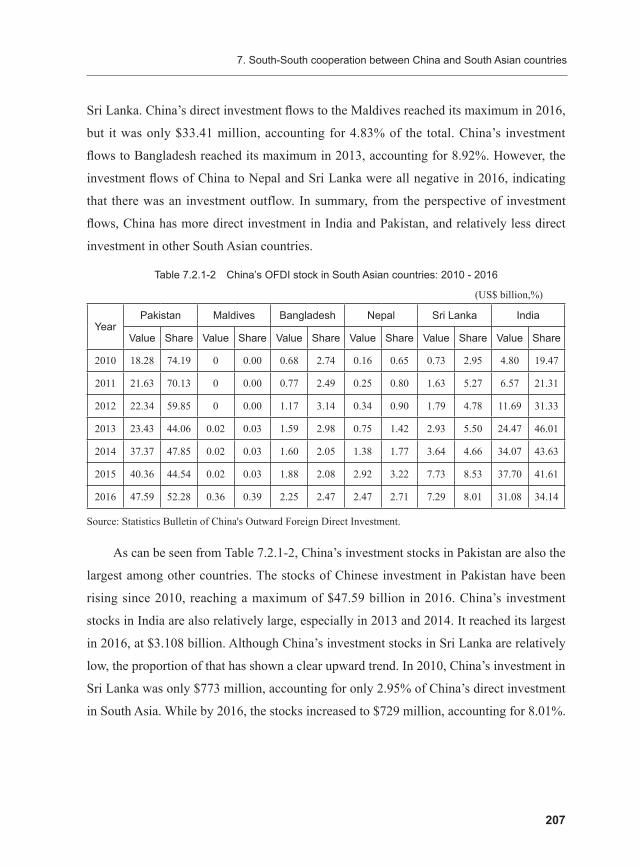
7. South-South cooperation between China and South Asian countries
207
Sri Lanka. China’s direct investment flows to the Maldives reached its maximum in 2016,
but it was only $33.41 million, accounting for 4.83% of the total. China’s investment
flows to Bangladesh reached its maximum in 2013, accounting for 8.92%. However, the
investment flows of China to Nepal and Sri Lanka were all negative in 2016, indicating
that there was an investment outflow. In summary, from the perspective of investment
flows, China has more direct investment in India and Pakistan, and relatively less direct
investment in other South Asian countries.
Table 7.2.1-2 China’s OFDI stock in South Asian countries: 2010 - 2016
(US$ billion,%)
YearPakistan Maldives Bangladesh Nepal Sri Lanka India
Value Share Value Share Value Share Value Share Value Share Value Share
2010 18.28 74.19 0 0.00 0.68 2.74 0.16 0.65 0.73 2.95 4.80 19.47
2011 21.63 70.13 0 0.00 0.77 2.49 0.25 0.80 1.63 5.27 6.57 21.31
2012 22.34 59.85 0 0.00 1.17 3.14 0.34 0.90 1.79 4.78 11.69 31.33
2013 23.43 44.06 0.02 0.03 1.59 2.98 0.75 1.42 2.93 5.50 24.47 46.01
2014 37.37 47.85 0.02 0.03 1.60 2.05 1.38 1.77 3.64 4.66 34.07 43.63
2015 40.36 44.54 0.02 0.03 1.88 2.08 2.92 3.22 7.73 8.53 37.70 41.61
2016 47.59 52.28 0.36 0.39 2.25 2.47 2.47 2.71 7.29 8.01 31.08 34.14
Source: Statistics Bulletin of China's Outward Foreign Direct Investment.
As can be seen from Table 7.2.1-2, China’s investment stocks in Pakistan are also the
largest among other countries. The stocks of Chinese investment in Pakistan have been
rising since 2010, reaching a maximum of $47.59 billion in 2016. China’s investment
stocks in India are also relatively large, especially in 2013 and 2014. It reached its largest
in 2016, at $3.108 billion. Although China’s investment stocks in Sri Lanka are relatively
low, the proportion of that has shown a clear upward trend. In 2010, China’s investment in
Sri Lanka was only $773 million, accounting for only 2.95% of China’s direct investment
in South Asia. While by 2016, the stocks increased to $729 million, accounting for 8.01%.

China Development Report on South-South Cooperation 2017
208
7.2.2 Industries of China’s OFDI in South Asian CountriesTable 7.2.2 lists the main areas of China’s investment in South Asian countries.
Specifically, China’s major investment industries in Pakistan are communications,
finance, energy and transportation. In January 2007, China Mobile purchased 88.88%
of Pakistan mobile communications company Paktel for $460 million, and then wholly
purchased it, and spent hundreds of millions of dollars to rebuild and expand network
facilities. In May 2014, China Mobile became the buyer of Pakistan’s 3G and 4G
licenses. In 2008, China Development Bank and the Ministry of Finance of Pakistan
jointly invested $200 million to establish Pak-China Investment Company Limited
(PCICL). In May 2011, Industrial and Commercial Bank of China (ICBC) invested $50
million to set up branches in Karachi and Islamabad, Pakistan. In September 2011, United
Energy GP, a Hong Kong-listed company controlled by China Oriental group, acquired
all the assets of BP Pakistan, with its total actual investment in Pakistan exceeding $1
billion. The China-Pakistan Economic Corridor will create good opportunities for China
to expand its direct investment in Pakistan. The core of China’s large-scale infrastructure
construction in Pakistan the China-Pakistan Economic Corridor, which includes big
projects such as railways and road networks, natural gas pipelines, industrial parks and
Gwadar Port. The corridor will connect the western part of China and Pakistan to promote
regional connectivity and economic growth. As of 2016, major projects invested by
Chinese companies in Pakistan include: China Mobile CMPAK Mobile Communications
Corporation, United Energy Pakistan, Pak-China Investment Company Limited (PCICL),
Haier-ruba Economic Zone (Industrial Park), Industrial and Commercial Bank of China
Karachi Branch and Islamabad Branch, Plame-Qingqi Motorcycle Company, Xinjiang
Sinotrans Pak-China Sust Port Co., Ltd., SVA Ruba Electric Company, SVA Ruba
Moulding Company, China Yuncheng Plate Making Co., Ltd. Lahore Branch, Changhong
- Ruba trading company and several energy-related companies.

7. South-South cooperation between China and South Asian countries
209
Table 7.2.2 Main industries of China’s investment in South Asia in 2016
Country Industry
Pakistan Communication, finance, energy appliances, transportation
Maldives Infrastructure construction, housing construction
Bangladesh Textile and related machinery and equipment
Nepal Hydropower stations, aviation, restaurants, hotels, minerals, Chinese medicine clinics, food processing
Sri Lanka Terminal, port, housing
India Telecommunications, electrical equipment, household appliances, steel, machinery and equipment, construction machinery
Source: China Foreign Investment Cooperation Country Guide.
China’s main investment projects in the Maldives are infrastructure and housing
construction. Under the Belt and Road Initiative, more Chinese companies explore the
market in Maldives. Especially since President Xi Jinping successfully visited Malaysia
in 2014, China and Malaysia have deeply cooperated in the field of infrastructure and
housing construction.
China’s main investment projects in Bangladesh are textile and apparel and related
machinery and equipment. As of the end of 2016, China’s direct investment in Bangladesh
involved clothing, textiles, ceramics, decoration, drinking water, medical, aquaculture,
printing, home appliances, light industry, etc., but mainly concentrated in textile and
apparel and related machinery and equipment. The main investment companies are Liz
Fashion Co., Ltd., Bangladesh New Century Garment Co., Ltd., New Hope Bangladesh
Co., Ltd., Bangladesh Tongwei Co., Ltd., etc.
As of 2016, China has invested in more than 100 Chinese-funded enterprises in
Nepal, mainly in hydropower stations, aviation, restaurants, hotels, minerals, Chinese
medicine clinics, food processing and other industries. Due to the unstable factors in
investment environment, China’s investment in Nepal is still in its infancy, and most
of the invested companies are small private enterprises. At the end of 2012, the Upper
Marsyangdi-A Electricity Generation invested by Sinohydro Resources Ltd. (with a
total investment of $160 million) and the Upper Madi Electricity Generation Project

China Development Report on South-South Cooperation 2017
210
invested by CWE (with a total investment of $58.3 million) came into operation, after
years of preparation, which opened the curtain for the investment of large domestic
enterprises in Nepal. In addition, private enterprises have also made breakthroughs in
investing in Nepal’s electricity generation. The Phokoshi Hydropower Station invested
by Sichuan Huani Energy Investment Co., Ltd. (with a total investment of $180 million)
has completed the expansion approval. In the future, with the stabilization of the political
situation in Nepal and the rapid development of the economy, the scale of investment by
Chinese-funded enterprises in Nepal will gradually expand.
China’s main investment projects in Sri Lanka are terminals, ports and housing. In
recent years, Chinese enterprises have made leaps and bounds in investment in Sri Lanka,
and many large-scale investment projects have been signed. China’s investment projects
in Sri Lanka mainly include Colombo International Container Terminal (CICT) invested
by China Merchants Group, Port City Colombo invested by China Communications
Construction Co., LTD.,Colombo Kollupitiya invested by AVIC International(Hong
Kong) Holding Corporation. Chinese private enterprises have invested rapidly in Sri
Lanka, involving hotels, tourism, agricultural products processing, fisheries, furniture
manufacturing, textiles, feed, biomass power generation, bicycles, warehousing and
logistics.
At present, China’s main investment areas in India include telecommunications,
electrical equipment, household appliances, steel, machinery and equipment, and
construction machinery. Huawei Technologies Co., Ltd., BYD Co., Ltd., TBEA Co., Lt.,
Highly Group, ZTE Corporation, Sany Heavy Industry Co., Ltd., LiuGong Machinery
Co., Ltd.,Haier Group are actively investing in India. However, in general, the scale of
investment in India is still small, lacking intensive investment, and its investment model
and fields are relatively single. It is not commensurate with the economic scale and
economic and trade cooperation between the two countries.
7.2.3 The Project Contracting and Labor Service Cooperation Foreign contracted projects and expatriate labor are another important area for
South-South cooperation between China and developing countries. Table 7.2.3 lists the
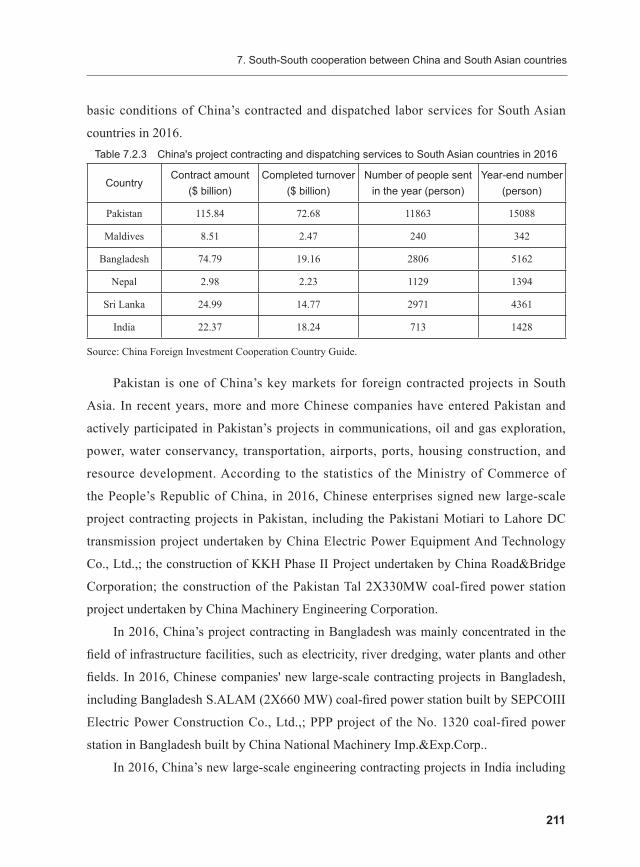
7. South-South cooperation between China and South Asian countries
211
basic conditions of China’s contracted and dispatched labor services for South Asian
countries in 2016.Table 7.2.3 China's project contracting and dispatching services to South Asian countries in 2016
CountryContract amount
($ billion)Completed turnover
($ billion)Number of people sent
in the year (person)Year-end number
(person)
Pakistan 115.84 72.68 11863 15088
Maldives 8.51 2.47 240 342
Bangladesh 74.79 19.16 2806 5162
Nepal 2.98 2.23 1129 1394
Sri Lanka 24.99 14.77 2971 4361
India 22.37 18.24 713 1428
Source: China Foreign Investment Cooperation Country Guide.
Pakistan is one of China’s key markets for foreign contracted projects in South
Asia. In recent years, more and more Chinese companies have entered Pakistan and
actively participated in Pakistan’s projects in communications, oil and gas exploration,
power, water conservancy, transportation, airports, ports, housing construction, and
resource development. According to the statistics of the Ministry of Commerce of
the People’s Republic of China, in 2016, Chinese enterprises signed new large-scale
project contracting projects in Pakistan, including the Pakistani Motiari to Lahore DC
transmission project undertaken by China Electric Power Equipment And Technology
Co., Ltd.,; the construction of KKH Phase II Project undertaken by China Road&Bridge
Corporation; the construction of the Pakistan Tal 2X330MW coal-fired power station
project undertaken by China Machinery Engineering Corporation.
In 2016, China’s project contracting in Bangladesh was mainly concentrated in the
field of infrastructure facilities, such as electricity, river dredging, water plants and other
fields. In 2016, Chinese companies' new large-scale contracting projects in Bangladesh,
including Bangladesh S.ALAM (2X660 MW) coal-fired power station built by SEPCOIII
Electric Power Construction Co., Ltd.,; PPP project of the No. 1320 coal-fired power
station in Bangladesh built by China National Machinery Imp.&Exp.Corp..
In 2016, China’s new large-scale engineering contracting projects in India including

China Development Report on South-South Cooperation 2017
212
to build India Telecom undertaken by Huawei Technologies Co., Ltd., the UGC-01&07
section of Mumbai Metro undertaken by Shanghai Tunnel Engineering Co., Ltd, the four-
lane highway of Bihar National Road 31 La Giuli to the Berktiapur section undertaken by
Sinohydro Corporation Ltd.
In 2016, Chinese companies mainly engaged in commercial activities such as
contracting projects, investment and trade in Sri Lanka. In 2016, Chinese enterprises
signed new large-scale project contracting projects in Sri Lanka including CAMCE
Engineering Co., Ltd. to build the right-wing development project of Sri Madulu River;
China 20 smelting Group Co., Ltd. undertook the third phase project of Sri Lanka Outer
Ring Expressway Project; China Machinery Equipment Engineering Co., Ltd. undertook
the construction of the Atana Water Plant Project in Sri Lanka.
China’s engineering contracting in the Maldives is mainly concentrated in the
construction sector. In 2016, new large contracting project in the Maldives included 3,000
sets of housing projects of MCC International Maldives built by China Metallurgical
Group Corp., Ltd., the IRUFEN Island Resort Hotel built by China Communcations
Construction Co., LTD., the Nasandhura Hotel and apartment complex built by Zhongtian
Group Corp., Ltd.
China’s engineering contracting in Nepal is mainly focused on infrastructure and
communication facilities. In 2016, the newly-signed large contracting project included
Zhongding International Engineering Co., Ltd. to build the 134.9-kilometer highway with
bidirectional four-lane of Darang-Hasta-hahtoda undertaken by Zhongding International
Construction Group Co., Ltd., the Nepal Telecom undertaken by Huawei Technologies
Co., Ltd., the Gaochi-Tersuri-Maling Highway undertaken by China Overseas
Engineering Group Co., Ltd.. At present, Chinese large enterprises invest in Nepal mainly
by acquiring local enterprises to obtain project ownership, and assisting development
projects through local agency companies.
7.2.4 China’s industrial cooperation park in South AsiaThe industrial cooperation park in which China has passed the confirmation
assessment in South Asia is only the Haier-Ruba economic zone in Pakistan.
7. South-South cooperation between China and South Asian countries
213
The industrial park was established on November 26, 2006, and was personally
opened by President Hu Jintao. It is China’s first opened national-level overseas economic
cooperation zone. This industrial park provides a new platform for Chinese companies to
invest and start businesses in Pakistan and promotes economic and trade between the two
countries. Located in Lahore, Pakistan’s second largest city, this park is one of the first
“China’s Overseas Economic and Trade Cooperation Zones” approved by the Ministry
of Commerce of the People’s Republic of China. It is also the “Pakistan China Special
Economic Zone” approved by the Pakistani government and one of the key projects of
the Five-year plan of China-Pak cooperation. The park is constructed by Qingdao Haier
Group Electric Appliance Industry Co., Ltd., with a planned investment of $129 million
and a planned area of 2.33 square kilometers. It focuses on small household appliances
and power generation equipment, automobile and motorcycle parts and accessories,
chemicals and packaging, printing, etc.
After the first phase put into operation, seven companies have been stationed, with
an annual turnover of about $400 million, bringing about 5,000 direct jobs and an annual
profit of about $90 million. It directly drives the local economy, promotes the local
infrastructure construction, increases the local purchasing power. At the same time, the
first phase of the industrial park has formed an upstream and downstream industrial chain
for home appliances. The national-level home appliance testing platform in the industrial
park is open to all enterprises entering the zone.
The establishment of the Haier-Ruba Economic Zone has spurred investment
in China’s investment in equipment industry and related industries in Pakistan. After
the economic zone is put into production, the products can also be exported to South
Asia, West Asia and the Gulf region in addition to sales in Pakistan. In addition to the
development of the economic zone itself, under the 'Belt and Road' initiative, it also
promoted the upgrading of surrounding supporting enterprises and the establishment of
industrial conformation. At present, it has established a series of supporting facilities
and enterprises such as power plants, warehousing, hotels and catering. . Undoubtedly,
the establishment of the cooperation zone will effectively promote economic and
technological cooperation between China and Pakistan, attract more Chinese enterprises

China Development Report on South-South Cooperation 2017
214
to invest in Pakistan, increase local employment and tax revenue, expand export earnings,
train skilled workers, and introduce technology and management experience. And it can
also provide a platform for the majority of SMEs in China who are willing to invest and
cooperate abroad.
7.3 China’s Assistance to South Asian CountriesThis section will explain China’s assistance to South Asian countries in two aspects:
First, the scale and type of China’s assistance to South Asian countries and emergency
assistance. The second is to explain China’s assistance to major South Asian countries in
the new era.
7.3.1 Scale and Type of China's Assistance to South Asian CountriesThe scale of China’s foreign aid to South Asian countries is shown in Table 7.3.1-1.
Overall, China’s aid to South Asia has been increasing. In 2000, China’s aid to South Asia
was $331.31 million. By 2014, it had reached $138.3744 billion. From the perspective
of the country, China has the largest amount of aid to Pakistan, which reached its
maximum in 2014, at $119.7493 billion. China’s development assistance to Sri Lanka and
Bangladesh is smaller than that of Pakistan, ranking second and third among South Asian
countries. Since India’s economic development level is higher in South Asian countries
and it has a relatively complete industrial system, in most years, China did not aid India.Table 7.3.1-1 China's assistance to South Asian countries in 2000-2014
(US$ million )
Year Bangladesh India Maldives Nepal Pakistan Sri Lanka Total
2000 303.63 0.00 0.00 7.31 20.37 0.00 331.31
2001 188.10 0.05 0.00 61.58 841.38 77.03 1168.15
2002 19.33 0.00 0.00 0.00 18.83 2.61 40.77
2003 0.00 0.00 0.00 0.00 460.52 6.90 467.43
2004 0.95 0.00 0.00 0.00 0.05 18.12 19.12
2005 0.00 0.00 0.92 2.86 92.44 338.04 434.26

7. South-South cooperation between China and South Asian countries
215
Year Bangladesh India Maldives Nepal Pakistan Sri Lanka Total
2006 216.00 0.00 3.30 2.51 530.38 630.00 1382.19
2007 1.01 0.00 8.91 8.02 400.63 0.00 418.58
2008 53.64 750.00 5.96 4.02 1047.77 38.69 1900.09
2009 921.29 98.00 0.00 214.24 853.63 2971.96 5059.12
2010 114.77 3500.00 71.05 10.58 2052.73 762.67 6511.80
2011 94.31 0.00 0.00 311.07 1655.85 979.15 3040.38
2012 290.80 0.00 155.65 41.32 0.00 2070.15 2557.91
2013 664.00 0.00 3.87 130.76 492.00 1003.86 2294.49
2014 311.00 0.00 57.50 215.98 11974.93 1278.03 13837.44
Source: AidData. 2017. Global Chinese Official Finance Dataset, Version 1.0.
China’s classification of foreign aid to South Asian countries is shown in Table 7.3.1-
2. The main project of China’s aid projects to South Asia is loans, which are mainly used
for development projects in South Asian countries. In 2010-2014, such development loans
totaled $23.761 billion, mainly in Pakistan, Sri Lanka, India and Bangladesh. Export
credit also plays an important role in China’s assistance to South Asian countries, mainly
in Pakistan and Sri Lanka. In addition, Pakistan, Nepal and Bangladesh accept a large
amount of donations from China in terms of donations to recipient countries.
Table 7.3.1-2 China’s Foreign Aid Classification Unit for South Asian countries during 2000-2014
(US$ billion)
Assistance type Bangladesh India Maldives Nepal Pakistan Sri Lanka Total
Debt exemption 0.93 0.00 0.00 0.00 0.00 0.00 0.93
Debt rescheduling 0.07 0.00 0.00 0.00 0.00 0.00 0.07
Export credit 4.56 6.98 0.00 0.35 81.19 51.67 144.76
Technical assistance 0.00 0.00 0.00 0.33 0.00 0.00 0.33
Donation 1.24 0.00 0.20 2.55 6.20 0.71 10.90
The Loan 24.99 36.50 2.87 6.83 117.03 49.39 237.61
Source: AidData 2017. Global Chinese Official Finance Dataset, Version 1.0.
Continued

China Development Report on South-South Cooperation 2017
216
7.3.2 China's major aid projects to South Asian countries in the new eraIn order to help South Asian countries, resist natural disasters and improve economic
development, the Chinese government has repeatedly provided various types of assistance
to them.
For example, during the difficult economic times in Pakistan, China tried its best
to provide Pakistan with financial assistance within its capabilities. In 2005, a strong
earthquake struck northern Pakistan. The Chinese government quickly dispatched
rescue teams and medical teams to help in front-line of the disaster area. It also provided
$20.5 million in supplies and cash, and provided $300 million in preferential export
buyer’s credit to rebuild the affected area. In addition, China has helped Pakistan build
a number of projects which have great importance to the national economy and the
people’s livelihood, such as Karakoram Highway, Taksima Heavy Machinery Plant,
Jinnah Stadium, Gwadar Port, Pak-China Friendship Center, the repair of water-damaged
road, solar photovoltaic power generation in parliamentary. All of these have played
an important role in Pakistan’s economic construction. Of course, China’s assistance to
Pakistan has not stopped. In 2010, Pakistan suffered a big flood. China lost no time in
offering a helping hand. The army and air aided. The large-scale fleet and helicopters
were deployed to carry out rescue missions for the first time. In addition to providing
emergency relief, China also played an important role in post-disaster reconstruction.
In April 2012, an avalanche occurred on a side of Siaqin Glacier which was garrisoned
by Pakistani Army. The Chinese military sent relevant technical equipment to Pakistan
in a timely manner and dispatched experts to provide technical guidance. In April 2012,
the second batch of China’s ‘China-Pakistan Friendship Bringing-light Tour’ medical
treatment departed for Pakistan. It can be said that as long as Pakistan encounters
economic difficulties and threats, China always insists on standing on the side of Pakistan
and provides economic and technical assistance within its capacity.
Since the beginning of the new century, with the improvement of China’s
comprehensive national strength, along with the adjustment of China’s foreign aid
policy, China’s assistance to Bangladesh has been characterized by diversification of
aid methods and economization of aid purposes. In addition to previous technical and

7. South-South cooperation between China and South Asian countries
217
material assistance, China’s aid has gradually expanded to include aiding projects,
technical cooperation, human resources cooperation, volunteering, emergency
humanitarian assistance, and debt relief. In terms of agricultural production, China’s
assistance to Bangladesh included: China signed a cooperation document on agriculture
and water conservancy in Bangladesh in April and August 2005, and China’s Embassy
in Bangladesh donated agricultural machinery to the Bangladesh disaster area in January
2008. In terms of infrastructure construction, China has provided a lot of help in the
areas of urban infrastructure, transportation and ports. For example, in January 2005, the
Chinese government aided the construction of the Sixth China-Bangladesh Friendship
Bridge; in September 2005, the Chinese company undertook the construction of a
power station project; in March 2010, the Chinese government agreed to undertake the
construction of the Seventh China-Bangladesh Friendship bridge in Kaztertek. In terms of
humanitarian assistance, China’s major aid project to Bangladesh includes: in December
2004, the Chinese government donated relief supplies to the Bangladesh government;
in August 2007, China transferred the civil flood relief assistance to Bangladesh and the
China’s Embassy in Bangladesh donated to the affected people; in November 2007, the
Chinese Red Cross provided emergency assistance of $50000 to the disaster-stricken
areas, and Chinese government decided to provide $1 million in emergency relief
assistance.
In the new era, China has also provided emergency assistance to countries such
as Sri Lanka, India and Maldives. On the morning of December 26, 2004, a strong
earthquake struck the Indian Ocean and triggered a tsunami that was rare in the world.
A huge wave of more than ten meters high, plunging into the sea, rushing to the island,
rushing to the mainland, ravaged places, causing huge natural disasters to Sri Lanka,
India, Malaysia, Maldives and other countries. The Chinese government and people
extended a friendly hand in no time and organized a large-scale foreign aid operation. On
December 27, 2004, the Ministry of Commerce announced that the Chinese government
will provide humanitarian assistance totaling ¥21.63 million to India, Sri Lanka and Maldives.
On December 29, 2004, China’s humanitarian relief materials worth about ¥10 million
and 100 tons were delivered to Colombo, the capital of Sri Lanka. On December 31, the

China Development Report on South-South Cooperation 2017
218
Chinese government announced that it would provide another ¥500 million in aid to the
earthquake-stricken and tsunami-affected countries. In short, during this tsunami, China
actively assisted these suffering countries.
China has also made substantial economic assistance to Nepal in the new era.
In 2015, an earthquake of magnitude 8.1 and several strong aftershocks occurred in
Nepal, causing heavy casualties and property losses. After the earthquake, the Chinese
government assisted Nepal’s emergency humanitarian materials in three rounds. The
first round of aid materials focused on solving the problems of housing, including urgent
needs in the disaster areas including tents, blankets and generators, and helping the
Nigerian side to carry out resettlement work. The second round of assistance focused on
solving the post-earthquake health and safety issues, and the Chinese government has
increased the provision of water purification equipment and first-aid kits. After another
7.5-magnitude earthquake struck Nepal on May 12, China provided a third round of
assistance, including epidemic blankets, tents, and family health kits. The total value of
the three rounds of assistance is ¥140 million.
In summary, in the new era, China has also carried out a large amount of foreign aid
to South Asian countries. In the foreign aid in the new era, China’s foreign aid includes
economic, technological, material, talent and management assistance activities. China’s
foreign aid is a comprehensive aid. China’s current aid work includes both people’s
livelihood assistance and economic cooperation. The essence is cooperation in an aid
manner with an aim of development.

219
8. South-South Cooperation between China and West Asian Developing Countries
West Asia includes Iran, Turkey, Cyprus, Syria, Lebanon, Palestine, Israel, Jordan,
Iraq, Kuwait, Saudi Arabia, Yemen, Oman, United Arab Emirates, Qatar, Bahrain,
Georgia, Armenia and Azerbaijan. The West Asia region is one of the important
cooperation areas in China’s “the Belt and Road” initiative. This chapter will analyze
South-South cooperation between China and West Asian countries from three aspects:
trade relations, investment relations and foreign aid relations between China and West
Asia.
8.1 Trade relations between China and West Asian countries
8.1.1 The Total Trade and Growth Rate
1. Total trade and the balanceThe West Asian countries are China’s important trading partners. They are also the
important destination markets for China’s export and the source of import expansion.
Table 8.1.1-1 lists the overall status of trade between China and West Asia in 2000-2016.
Table 8.1.1-1 China’s trade with West Asian countries and its share in the total trade with developing countries
(US$10 billion, %)
YearChina’s import China’s export Total trade
Value Share (%) Value Share (%) Value Share (%)
2000 101.24 4.50 73.95 2.97 175.19 3.69
2001 94.07 3.86 78.99 2.97 173.06 3.40

China Development Report on South-South Cooperation 2017
220
YearChina’s import China’s export Total trade
Value Share (%) Value Share (%) Value Share (%)
2002 97.76 3.31 109.32 3.36 207.08 3.34
2003 150.04 3.64 157.79 3.60 307.83 3.62
2004 223.04 3.97 201.33 3.39 424.37 3.68
2005 316.9 4.80 270.25 3.55 587.15 4.13
2006 416.39 5.26 376.99 3.89 793.38 4.51
2007 492.1 5.15 558.93 4.58 1051.03 4.83
2008 819.73 7.24 716.41 5.01 1536.14 5.99
2009 581.22 5.78 614.45 5.11 1195.67 5.42
2010 900.33 6.45 771.98 4.89 1672.31 5.62
2011 1375.3 7.89 982.65 5.18 2357.95 6.47
2012 1490.99 8.20 1042.64 5.09 2533.63 6.55
2013 1604.08 8.23 1176.68 5.33 2780.76 6.69
2014 1655.08 8.45 1396.61 5.96 3051.69 7.09
2015 1050.16 6.25 1308.54 5.76 2358.7 5.97
2016 887.49 5.59 1144.1 5.45 2031.59 5.51
Source: China National Bureau of Statistics on foreign economic and trade
From Table 8.1.1-1, we can see that the total trade volume between China and West
Asian countries has surged from $17.519 billion in 2000 to $203.159 billion in 2016.
The proportion of trade with West Asian countries in China’s total trade also increased
significantly, from 3.69% in 2000 to a high of 7.09% in 2014. In 2015 and 2016, the
proportion dropped, but it also reached 5.97% and 5.51%, significantly higher than the
2000 level. On the whole, the trade between China and West Asia grows obviously,
and the proportion of trade with West Asian countries in China’s total trade increases.
The proportion of trade with West Asian countries in China’s total trade fluctuated
significantly. The main reason is that the products of the West Asian countries exporting
to China are relatively simple, which are mostly the fossil fuels such as petroleum, and
the international price of these commodities fluctuates a lot. The proportion of exports to
Continued
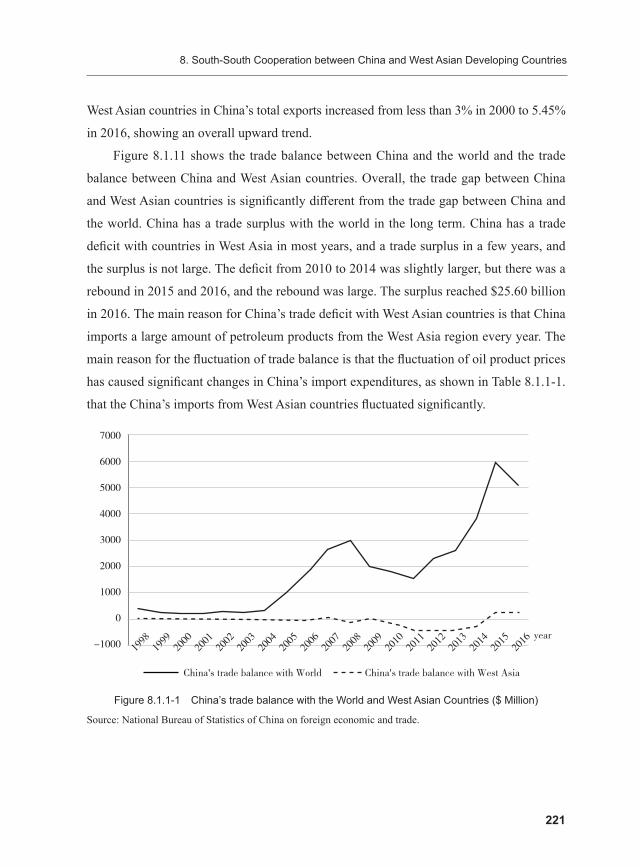
8. South-South Cooperation between China and West Asian Developing Countries
221
West Asian countries in China’s total exports increased from less than 3% in 2000 to 5.45%
in 2016, showing an overall upward trend.
Figure 8.1.11 shows the trade balance between China and the world and the trade
balance between China and West Asian countries. Overall, the trade gap between China
and West Asian countries is significantly different from the trade gap between China and
the world. China has a trade surplus with the world in the long term. China has a trade
deficit with countries in West Asia in most years, and a trade surplus in a few years, and
the surplus is not large. The deficit from 2010 to 2014 was slightly larger, but there was a
rebound in 2015 and 2016, and the rebound was large. The surplus reached $25.60 billion
in 2016. The main reason for China’s trade deficit with West Asian countries is that China
imports a large amount of petroleum products from the West Asia region every year. The
main reason for the fluctuation of trade balance is that the fluctuation of oil product prices
has caused significant changes in China’s import expenditures, as shown in Table 8.1.1-1.
that the China’s imports from West Asian countries fluctuated significantly.
7000
6000
5000
4000
3000
2000
1000
0
-1000 2001
2000
1999
1998
2002
2003
2004
2005
2006
2007
2008
2009
2010
2011
2012
2013
2014
2015
2016
China's trade balance with World China's trade balance with West Asia
year
Figure 8.1.1-1 China’s trade balance with the World and West Asian Countries ($ Million)
Source: National Bureau of Statistics of China on foreign economic and trade.
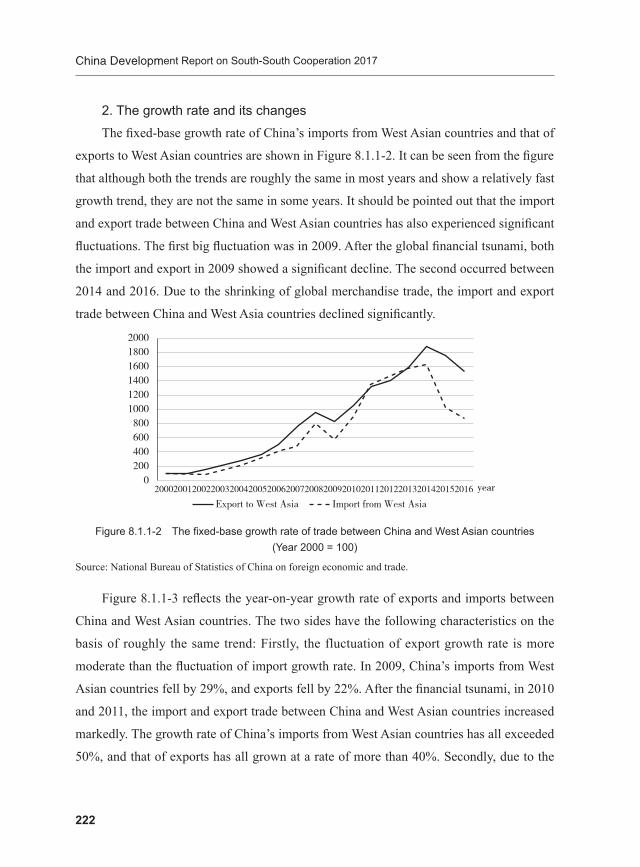
China Development Report on South-South Cooperation 2017
222
2. The growth rate and its changes The fixed-base growth rate of China’s imports from West Asian countries and that of
exports to West Asian countries are shown in Figure 8.1.1-2. It can be seen from the figure
that although both the trends are roughly the same in most years and show a relatively fast
growth trend, they are not the same in some years. It should be pointed out that the import
and export trade between China and West Asian countries has also experienced significant
fluctuations. The first big fluctuation was in 2009. After the global financial tsunami, both
the import and export in 2009 showed a significant decline. The second occurred between
2014 and 2016. Due to the shrinking of global merchandise trade, the import and export
trade between China and West Asia countries declined significantly.
200018001600140012001000
800600400200
0
Export to West Asia Import from West Asia20002001200220032004200520062007200820092010201120122013201420152016 year
Figure 8.1.1-2 The fixed-base growth rate of trade between China and West Asian countries (Year 2000 = 100)
Source: National Bureau of Statistics of China on foreign economic and trade.
Figure 8.1.1-3 reflects the year-on-year growth rate of exports and imports between
China and West Asian countries. The two sides have the following characteristics on the
basis of roughly the same trend: Firstly, the fluctuation of export growth rate is more
moderate than the fluctuation of import growth rate. In 2009, China’s imports from West
Asian countries fell by 29%, and exports fell by 22%. After the financial tsunami, in 2010
and 2011, the import and export trade between China and West Asian countries increased
markedly. The growth rate of China’s imports from West Asian countries has all exceeded
50%, and that of exports has all grown at a rate of more than 40%. Secondly, due to the
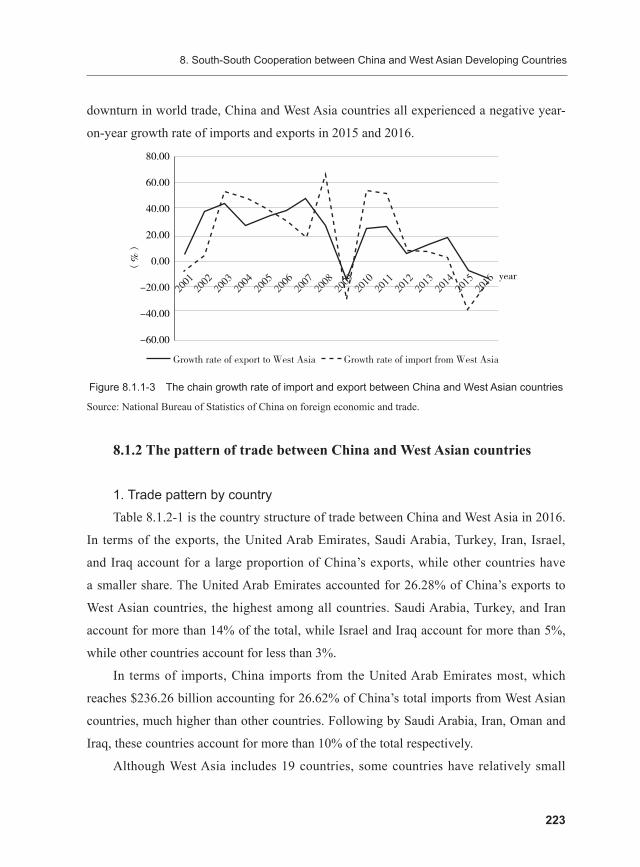
8. South-South Cooperation between China and West Asian Developing Countries
223
downturn in world trade, China and West Asia countries all experienced a negative year-
on-year growth rate of imports and exports in 2015 and 2016.
2001
2002
2003
2004
2005
2006
2007
2008
2009
2010
2011
2012
2013
2014
2015
2016
80.00
60.00
40.00
20.00
0.00
-20.00
-40.00
-60.00
(%
)
Growth rate of export to West Asia Growth rate of import from West Asia
year
Figure 8.1.1-3 The chain growth rate of import and export between China and West Asian countries
Source: National Bureau of Statistics of China on foreign economic and trade.
8.1.2 The pattern of trade between China and West Asian countries
1. Trade pattern by countryTable 8.1.2-1 is the country structure of trade between China and West Asia in 2016.
In terms of the exports, the United Arab Emirates, Saudi Arabia, Turkey, Iran, Israel,
and Iraq account for a large proportion of China’s exports, while other countries have
a smaller share. The United Arab Emirates accounted for 26.28% of China’s exports to
West Asian countries, the highest among all countries. Saudi Arabia, Turkey, and Iran
account for more than 14% of the total, while Israel and Iraq account for more than 5%,
while other countries account for less than 3%.
In terms of imports, China imports from the United Arab Emirates most, which
reaches $236.26 billion accounting for 26.62% of China’s total imports from West Asian
countries, much higher than other countries. Following by Saudi Arabia, Iran, Oman and
Iraq, these countries account for more than 10% of the total respectively.
Although West Asia includes 19 countries, some countries have relatively small

China Development Report on South-South Cooperation 2017
224
amounts of import and export with China due to their small economies, which makes
the import and export between China and West Asian countries relatively concentrated.
Among the countries with a large share of trade with China, the United Arab Emirates,
Saudi Arabia, Iran, Iraq and Kuwait are typical oil exporting countries.
Table 8.1.2-1 Trade pattern by country in 2016
Export (US$ billion)
Share in China’s exports to West Asia
(%)
Import (US$ billion)
Share in China’s imports from West Asia
(%)
United Arab Emirates 300.72 26.28 236.26 26.62
Saudi Arabia 186.55 16.31 148.27 16.71
Turkey 166.89 14.59 120.41 13.57
Iran 164.18 14.35 106.63 12.02
Israel 81.81 7.15 99.94 11.26
Iraq 75.49 6.60 63.70 7.18
Kuwait 30.02 2.62 40.12 4.52
Jordan 29.55 2.58 31.70 3.58
Oman 21.48 1.88 27.85 3.14
Lebanon 21.00 1.84 4.12 0.46
Yemen, 16.92 1.48 2.80 0.32
Qatar 15.16 1.33 2.11 0.24
Syria 9.15 0.80 1.66 0.19
Bahrain 7.91 0.69 0.64 0.07
Georgia 7.45 0.65 0.54 0.06
Cyprus 4.62 0.40 0.48 0.05
Azerbaijan 3.46 0.30 0.18 0.02
Armenia 1.11 0.10 0.03 0.00
Palestine 0.59 0.05 0.00 0.00
Source: China National Bureau of Statistics on foreign economic and trade
2. Trade pattern classified by SITCTrade products can be classified into food and live animals (SITC-0), beverages and

8. South-South Cooperation between China and West Asian Developing Countries
225
tobacco (SITC-1), non-edible raw materials (SITC-2), fossil fuels (SITC-3), animal and
vegetable fats and oils (SITC-4), chemicals (SITC-5), manufactured products mainly
classified by materials (SITC-6), machinery and transportation equipment (SITC-7),
miscellaneous finished products (SITC-8), other unclassified products (SITC-9), a total of
10 categories of products and departments, according to the International Trade Standard
Classification.
According to the theory of comparative advantage, the basis of international trade is
the relative difference in factor endowments owned by countries. According to the factor
density, trade products can be divided into energy-intensive products, labor-intensive
products, and capital and technology-intensive products. Based on the SITC-1-digit
classification, this report defines resource-intensive products as final products of SITC-
0 to SITC-4; labor-intensive products as products of SITC-6, SITC-8 and SITC-9; capital
and technology-intensive products as SITC-5, and SITC-7 products. Then the general
characteristics of product trade between China and West Asian countries can be analyzed.
Table 8.1.2-2 Trade pattern classified by SITC
(US$ billion)
SectorExports Imports Trade balance
2000 2010 2016 2000 2010 2016 2000 2010 2016
SITC-0 2.86 14.82 17.88 0.27 2.10 2.10 2.59 12.72 15.78
SITC-1 0.16 0.89 1.55 0.02 0.02 0.09 0.13 0.88 1.46
SITC-2 0.82 5.95 10.39 2.33 60.93 45.29 -1.51 -54.98 -34.89
SITC-3 1.12 9.20 9.25 86.95 689.07 639.50 -85.83 -679.87 -630.25
SITC-4 0.01 0.17 0.14 0.00 0.81 0.26 0.01 -0.65 -0.13
SITC-5 4.86 48.27 70.52 8.33 127.83 156.08 -3.46 -79.56 -85.55
SITC-6 23.12 236.87 341.96 2.08 13.04 14.49 21.03 223.83 327.46
SITC-7 26.32 352.76 491.21 2.13 12.54 18.11 24.19 340.22 473.10
SITC-8 26.31 190.33 334.17 0.52 4.34 10.46 25.79 185.99 323.71
SITC-9 2.16 0.08 0.53 0.00 0.91 2.01 2.16 -0.83 -1.47
Source: Compiled according to UN COMTRADE database.

China Development Report on South-South Cooperation 2017
226
Table 8.1.2-2 shows the structure of imports and exports between China and West
Asian countries, which reflect the share of the top 10 categories of imports and exports.
Characteristics are as follow:
The trade of products between China and West Asia are complementary. The
products imported by China from West Asian countries are mainly fossil fuels (SITC-
3), while China’s exports on it are little. China’s exports to the West Asian countries are
mainly the finished products (SITC-6), machinery and transportation equipment (SITC-7),
and miscellaneous finished products (SITC-8), which are mainly classified by materials,
while the imports are less.
Due to the abundant oil resources of the West Asian countries, China mainly imports
resource-intensive products from West Asia, of which China mainly imports a large
amount of fossil fuel (SITC-3) products from West Asia. The imports rose from $8.7
billion in 2000 to $64 billion in 2016, a seven-fold increase. In 2016, SITC3 products
accounted for nearly 93% of the resource-intensive products imported from West Asia in
China. It can also be seen that oil has an important position in the trade between China
and the West Asian countries. In 2016, China had a trade deficit of $63.025 billion only in
fossil fuels (SITC-3).
In the trade of capital and technology-intensive products, China and West Asian
countries have mutual imports. China mainly imports chemical products (SITC-5) from
West Asia, from $830 million in 2000 to $15.6 billion in 2016, an increase of nearly 20
times. The exports are mainly machinery and transportation equipment (SITC-7), and in
2016, the amount reached $49.121 billion.
As can be seen from the whole, China’s largest exports to West Asia is labor-
intensive products, which means a relatively large advantage in these products for China
in the trade with West Asian countries. It is mainly embodied in two types of products,
namely, finished products classified by materials (SITC-6) and miscellaneous finished
products (SITC-8). Among them, the finished products classified by materials (SITC-6)
increased from $2.312 billion in 2000 to $34.196 billion in 2016, an increase of nearly 15
times. The miscellaneous manufactured products (SITC-8) increased from $2.63 billion
in 2000 to $33.42 billion in 2016, an increase of nearly 13 times.
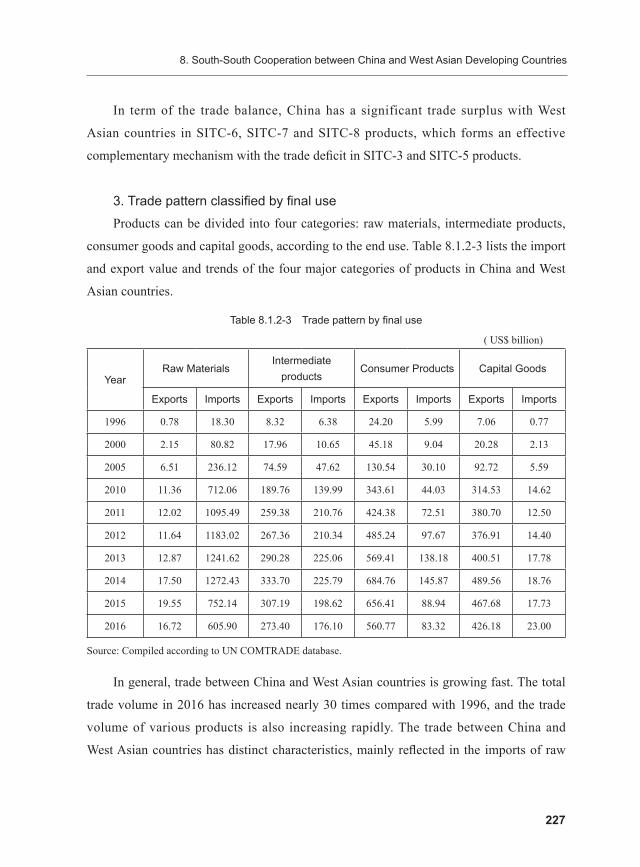
8. South-South Cooperation between China and West Asian Developing Countries
227
In term of the trade balance, China has a significant trade surplus with West
Asian countries in SITC-6, SITC-7 and SITC-8 products, which forms an effective
complementary mechanism with the trade deficit in SITC-3 and SITC-5 products.
3. Trade pattern classified by final useProducts can be divided into four categories: raw materials, intermediate products,
consumer goods and capital goods, according to the end use. Table 8.1.2-3 lists the import
and export value and trends of the four major categories of products in China and West
Asian countries.
Table 8.1.2-3 Trade pattern by final use
( US$ billion)
YearRaw Materials
Intermediate products
Consumer Products Capital Goods
Exports Imports Exports Imports Exports Imports Exports Imports
1996 0.78 18.30 8.32 6.38 24.20 5.99 7.06 0.77
2000 2.15 80.82 17.96 10.65 45.18 9.04 20.28 2.13
2005 6.51 236.12 74.59 47.62 130.54 30.10 92.72 5.59
2010 11.36 712.06 189.76 139.99 343.61 44.03 314.53 14.62
2011 12.02 1095.49 259.38 210.76 424.38 72.51 380.70 12.50
2012 11.64 1183.02 267.36 210.34 485.24 97.67 376.91 14.40
2013 12.87 1241.62 290.28 225.06 569.41 138.18 400.51 17.78
2014 17.50 1272.43 333.70 225.79 684.76 145.87 489.56 18.76
2015 19.55 752.14 307.19 198.62 656.41 88.94 467.68 17.73
2016 16.72 605.90 273.40 176.10 560.77 83.32 426.18 23.00
Source: Compiled according to UN COMTRADE database.
In general, trade between China and West Asian countries is growing fast. The total
trade volume in 2016 has increased nearly 30 times compared with 1996, and the trade
volume of various products is also increasing rapidly. The trade between China and
West Asian countries has distinct characteristics, mainly reflected in the imports of raw
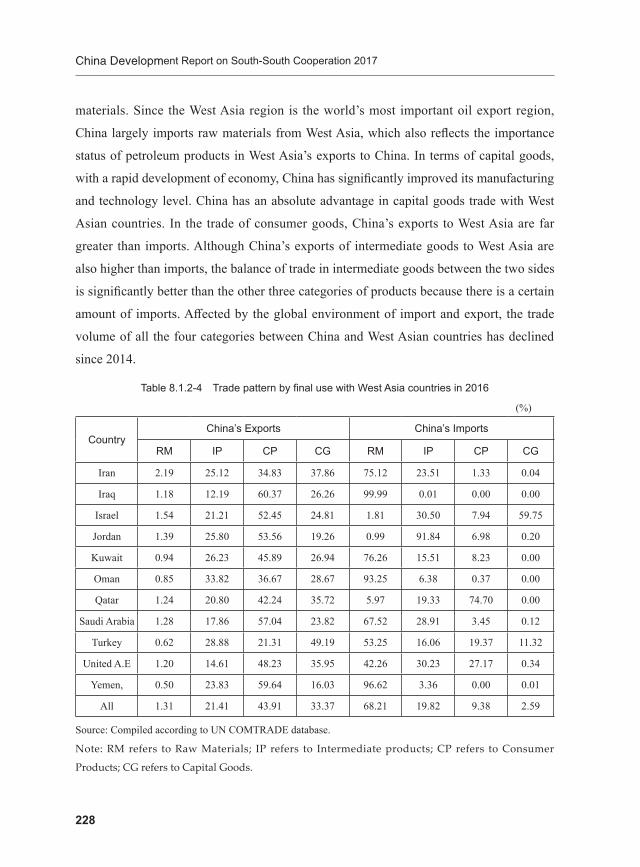
China Development Report on South-South Cooperation 2017
228
materials. Since the West Asia region is the world’s most important oil export region,
China largely imports raw materials from West Asia, which also reflects the importance
status of petroleum products in West Asia’s exports to China. In terms of capital goods,
with a rapid development of economy, China has significantly improved its manufacturing
and technology level. China has an absolute advantage in capital goods trade with West
Asian countries. In the trade of consumer goods, China’s exports to West Asia are far
greater than imports. Although China’s exports of intermediate goods to West Asia are
also higher than imports, the balance of trade in intermediate goods between the two sides
is significantly better than the other three categories of products because there is a certain
amount of imports. Affected by the global environment of import and export, the trade
volume of all the four categories between China and West Asian countries has declined
since 2014.
Table 8.1.2-4 Trade pattern by final use with West Asia countries in 2016
(%)
CountryChina’s Exports China’s Imports
RM IP CP CG RM IP CP CG
Iran 2.19 25.12 34.83 37.86 75.12 23.51 1.33 0.04
Iraq 1.18 12.19 60.37 26.26 99.99 0.01 0.00 0.00
Israel 1.54 21.21 52.45 24.81 1.81 30.50 7.94 59.75
Jordan 1.39 25.80 53.56 19.26 0.99 91.84 6.98 0.20
Kuwait 0.94 26.23 45.89 26.94 76.26 15.51 8.23 0.00
Oman 0.85 33.82 36.67 28.67 93.25 6.38 0.37 0.00
Qatar 1.24 20.80 42.24 35.72 5.97 19.33 74.70 0.00
Saudi Arabia 1.28 17.86 57.04 23.82 67.52 28.91 3.45 0.12
Turkey 0.62 28.88 21.31 49.19 53.25 16.06 19.37 11.32
United A.E 1.20 14.61 48.23 35.95 42.26 30.23 27.17 0.34
Yemen, 0.50 23.83 59.64 16.03 96.62 3.36 0.00 0.01
All 1.31 21.41 43.91 33.37 68.21 19.82 9.38 2.59
Source: Compiled according to UN COMTRADE database.
Note: RM refers to Raw Materials; IP refers to Intermediate products; CP refers to Consumer
Products; CG refers to Capital Goods.

8. South-South Cooperation between China and West Asian Developing Countries
229
Table 8.1.2-4 lists the product trade structure of China and Western Asia in 2016
by end-use. It can be seen that China’s exports to Saudi Arabia are mainly consumer
goods. In 2016, China’s exports of consumer goods to Saudi Arabia reached $16 billion,
accounting for 57.4% in total exports, much higher than other types of products. From the
perspective of imports, raw materials dominate China’s import from Saudi Arabia, which
are mainly oil. From 1996 to 2012, China’s imports of raw materials from Saudi Arabia
have been increasing year by year. Despite the decline from 2013 to 2016, petroleum
products have always occupied an important part of Saudi Arabia’s exports to China. In
2016, petroleum products accounted for 67.52% of Saudi Arabia’s exports to China.
The situation in the UAE is similar to that in Saudi Arabia. China also mainly
exports consumer goods to it. In 2016, the exports reached $15 billion, accounting for
nearly 50%. Unlike Saudi Arabia, China’s exports of capital goods to the United AE also
account for a considerable proportion. In 2016, China’s exports of capital goods to the
UAE reached $11 billion, accounting for 35.95%. China’s imports from the United AE are
still dominated by raw materials, but intermediate goods and consumer goods also occupy
a considerable share. China’s imports of capital goods from the United AE are relatively
small. In 2016, it was only more than $34 million, accounting for less than 1%. From
the historical data, the trade between China and the United Arab Emirates has shown an
upward trend, and the import of raw materials has fluctuated greatly in recent years.
The difference in the proportion of intermediate goods, consumer goods and capital
goods exported by China to Iran is not very large. Data in 2016 shows that capital goods
account a little more. China’s exports of raw materials to Iran are relatively low, only
$36 million in 2016, accounting for only 2.19%. From the perspective of imports, China
mainly imports raw materials from Iran, and it is also mainly based on oil. In 2014, it
reached a maximum of $25 billion. In 2016, although China’s imports of petroleum
products from Iran have declined, the proportion still exceeded 75%. The second largest
category of China’s imports from Iran is intermediate goods, accounting for 23.51% in
2016, while the combined proportion of consumer goods and capital goods is less than 2%.
The amount of intermediate goods and consumer goods exported by China to
Oman is relatively close. From the historical data, the export value of the two products is

China Development Report on South-South Cooperation 2017
230
increasing. In 2012, the export value of the two products has increased substantially. The
exports of capital goods are almost increasing year by year. Only in 2011 and 2016, there
was a small decline. In 2016, the exports of capital goods reached $616 million. In terms
of imports, China’s imports from Oman are raw materials, which increased year by year
by 2015 and decreased in 2015. The amount in 2016 was $11.2 billion.
China mainly exports capital goods to Turkey. In 2016, China’s capital goods
exported to Turkey reached $8.2 billion, accounting for nearly 50%. The proportion of
intermediate goods and consumer goods exported by China to Turkey is similar, while the
exports of raw materials are the least. In terms of imports, China’s imports from Turkey
are raw materials, which were $1.48 billion in 2016, accounting for more than 50%.
China mainly exports consumer goods to Iraq. In 2016, the exports reached $4.56
billion, accounting for more than 60%. Next is capital goods and in 2016 the exports of
capital goods were $1.99 billion, accounting for 26.26%. In term of imports, China’s
imports from Iraq are dominated by raw materials. Due to the war, the amount of raw
materials imported from Iraq in 2003 fell in a cliff-like manner and then returned to
normal. In 2014, China imported $20.76 billion raw materials from Iraq, followed by a
decrease, and in 2016 the figure was $10.67 billion. In 2016, China’s imports from Iraq
were almost petroleum products, accounting for more than 99%.
China mainly exports consumer goods to Israel, which accounts for 52.45% of the
total, and intermediate goods and capital goods each accounts for more than 20%. China
mainly imports capital goods and intermediate goods from Israel. Among them, the
proportion of capital goods reaches 59.75%, which is obviously different from that of
other countries in West Asia.
From the overall situation of China and West Asia’s import and export, the volume
of consumer goods is the largest among other products exported by China, which
accounts for 43.91%, followed by capital goods, a 33.37% of the total. Among the exports
of China to the vast majority of West Asian countries, both two categories of products
occupy an important position. China’s imports from West Asian countries are mainly raw
materials, accounting for 68.21% in 2016. For countries that rely heavily on oil exports,
such as Yemen, Oman and Iraq, more than 90% of their exports are petroleum products.

8. South-South Cooperation between China and West Asian Developing Countries
231
Among the products imported by China from most west Asian countries, consumer
goods and capital goods both take an extremely small proportion, which is obviously a
complementary to China’s main exports of consumer goods and capital goods to West
Asia.
4. Trade pattern by product technical levelAccording to the different level of R&D investment, LALL (2000) classifies the
products with three-digit coding in SITC into five categories, namely primary products
(PP), resource-intensive manufactured products (RB), low-tech products (LT), medium-
tech products (MT), and high-tech products (HT). According to this product classification,
we have summarized the technical structure of import and export trade between China
and West Asia. The results are shown in Table 8.1.2-5 and Table 8.1.2-6.
Table 8.1.2-5 China’s exports to West Asian countries by technical levels
Proportion (%) Exports ($ billion)
PP RB LT MT HT PP RB LT MT HT
1996 3.09 14.84 44.92 27.44 9.71 1.25 5.98 18.10 11.06 3.91
2000 3.96 10.07 41.72 32.46 11.79 3.39 8.61 35.68 27.77 10.09
2005 3.39 11.22 35.53 33.84 16.03 10.29 34.09 107.97 102.85 48.71
2010 2.84 10.25 34.26 33.74 18.92 24.39 87.85 293.71 289.27 162.18
2011 2.72 10.83 34.45 34.22 17.79 29.16 116.31 369.98 367.51 191.10
2012 2.53 10.95 36.55 32.27 17.71 28.77 124.72 416.08 367.38 201.58
2013 2.33 10.69 38.56 31.65 16.79 29.55 135.69 489.60 401.85 213.16
2014 2.21 9.87 38.96 31.22 17.73 33.55 150.14 592.64 474.90 269.74
2015 2.52 9.66 39.38 31.15 17.28 36.46 139.82 569.79 450.74 250.09
2016 2.41 9.57 37.72 32.31 17.99 30.69 121.88 480.57 411.68 229.22
Source: Compiled according to UN COMTRADE database.
Overall, China’s exports to West Asia have seen great growth in all kinds of products.
Among them, medium and low-tech products are the most, which grow at the fastest
speed. These two types of products account for about 70%, a much higher proportion

China Development Report on South-South Cooperation 2017
232
than other products. Among these two types of products, the proportion of low-tech
products has declined, from 44.92% in 1996 to 37.72% in 2016, while the proportion of
high-tech products has increased significantly. In 1996, high-tech products accounted for
only 9.71% of China’s exports to West Asia. By 2016, this figure had doubled to 17.99%.
The proportion of resource products has been around 10% since 2000. As for the trend,
it can be seen that the structural changes in China’s export products to West Asia mainly
occurred before 2010, and since 2010, the proportion of products of all technical levels in
exports has been basically stable.
Table 8.1.2-6 China’s imports from West Asian countries by technical levels
Proportion (%) Imports ($ billion)
PP RB LT MT HT PP RB LT MT HT
1996 74.29 4.85 2.25 17.19 1.42 23.35 1.52 0.71 5.40 0.45
2000 85.45 3.29 0.44 8.68 2.15 87.70 3.38 0.45 8.91 2.20
2005 78.33 7.51 0.74 11.88 1.55 250.19 23.99 2.36 37.93 4.94
2010 77.22 9.67 0.54 11.24 1.33 703.21 88.05 4.95 102.34 12.07
2011 79.30 8.62 0.51 10.89 0.68 1103.18 119.91 7.16 151.54 9.40
2012 81.28 7.40 0.50 10.07 0.75 1223.57 111.42 7.50 151.57 11.28
2013 79.88 8.56 0.51 10.13 0.91 1296.18 138.92 8.34 164.42 14.72
2014 81.51 7.02 0.53 10.07 0.88 1355.23 116.76 8.74 167.42 14.60
2015 75.82 7.85 0.89 14.13 1.31 799.79 82.84 9.36 149.04 13.85
2016 73.00 9.12 0.95 14.97 1.96 646.98 80.84 8.42 132.70 17.34
Source: Compiled according to UN COMTRADE database.
China’s imports from West Asia have obvious characteristics that China imports
more primary products than other type of products. These types of products account for
more than 70% of China’s total imports from West Asian countries, and even more than
80% in some years. Imports increased from $2.335 billion in 1996 to $64.698 billion
in 2016. China’s imports of MT and RB from West Asian countries have also increased
slightly. The proportion of the former has remained above 10% since 2010, and the
proportion of the later fluctuated between 7% and 10%. The proportion of LT and HT is

8. South-South Cooperation between China and West Asian Developing Countries
233
extremely low. Since 2000, the sum of the proportion of the two kinds of products has
always been less than 3%. Comparing the import and export structure between China
and West Asia countries, the complementarity between China and West Asian countries
is relatively strong, mainly reflected in China’s imports of PP and RB from West Asian
countries and exports of LT and HT to them.
8.1.3 The Competitiveness and complementarity
1. Revealed Comparative Advantage Index We use formula (2.1) to calculate the revealed comparative advantage index of China
and West Asian countries in the products with 1-digit coding in SITC. The results are
shown in Table 8.1.3-1.
Table 8.1.3-1 RCA Index between China and West Asia Countries in 2016
SITC-0 SITC-1 SITC-2 SITC-3 SITC-4 SITC-5 SITC-6 SITC-7 SITC-8 SITC-9
Armenia 0.36 0.01 0.02 0.34 0.63 3.67 0.86 23.58 2.51 1.89
Azerbaijan 0.55 0.55 1.2 0.01 0.19 3.04 5.68 40.66 153.62 4.36
Bahrain 1.25 0.76 0.07 0.02 4.66 1.07 0.75 27.62 8.07 0.22
Cyprus 0.09 0.26 0.11 0.07 0.1 0.23 2.34 7.67 9.99 0.19
Georgia 0.14 0.01 0.02 0.35 0.05 0.74 1.03 16.43 4.38 0.16
Israel 1.12 2.11 0.44 0.93 0.57 0.25 0.53 1.64 2.86 0.13
Jordan 0.17 0.11 0.07 12.03 0.2 0.19 1.97 11.64 0.87 5.99
Kuwait 3.06 1.98 1.72 0.01 1.76 1.23 22.4 19.18 33.87 0.89
Lebanon 0.12 0.05 0.09 2.09 0.02 0.35 1.09 3.00 1.71 0.79
Oman 0.7 0.34 0.51 0.02 0.04 0.68 2.33 12.57 26.35 0.02
S. Arabia 1.89 1.99 1.19 0.02 0.25 0.47 7.18 14.83 40.39 1.66
Turkey 0.29 0.18 0.21 0.58 0.05 1.04 0.66 1.52 1.28 0.15
United A. E 2.61 0.61 0.84 0.06 0.29 2.20 4.00 60.27 8.05 0.00
West Asia 0.95 0.44 0.47 0.03 0.15 0.79 1.88 5.55 4.82 0.01
Source: Compiled according to UN COMTRADE database.
China Development Report on South-South Cooperation 2017
234
First of all, on the whole, China’s comparative advantages are mainly reflected in the
finished products (SITC-6), machinery and transportation (SITC-7) and miscellaneous
products (SITC-8). Among them, China’s exports of SITC-6 and SITC-8 are mainly
labor-intensive products. Of course, as the industrial structure and export commodity
structure continue to change, China’s comparative advantage in labor-intensive products
has descended, but the comparative advantage in labor-intensive products is still obvious.
The reason for this phenomenon is that since the reform and opening up, China has made
full use of its abundant and cheap labor to develop manufacturing industry, leading to
a large number of exports. China represents a comparative advantage to all West Asian
countries in terms of capital and technology-intensive products like machinery and
transportation equipment (SITC-7).
Secondly, China does not have a comparative advantage in the PP of SITC-0 to
SITC-4 to the West Asian countries as a whole, but the situation in specific countries is
slightly different. In terms of chemical products (SITC-5), the comparative advantages of
different West Asian countries to China in export are significantly different. Among them,
China has a comparative advantage over Qatar and the United Arab Emirates, Turkey,
Armenia, Azerbaijan and other countries, but has no comparative advantage for other
countries.
It can be clearly seen from the table that China has no advantage in the SITC-3
products. Since the West Asia region has the largest oil export volume in the world, and
China is an important oil importer in the world, the two sides have great potential for
cooperation in petroleum products.
2. Trade integration index The trade integration index is generally used to determine the trade interaction
between a country and its trading partner. We use the formula (2.3) to calculate the trade
integration index between China and West Asian countries. The results are shown in Table
8.1.3-3.
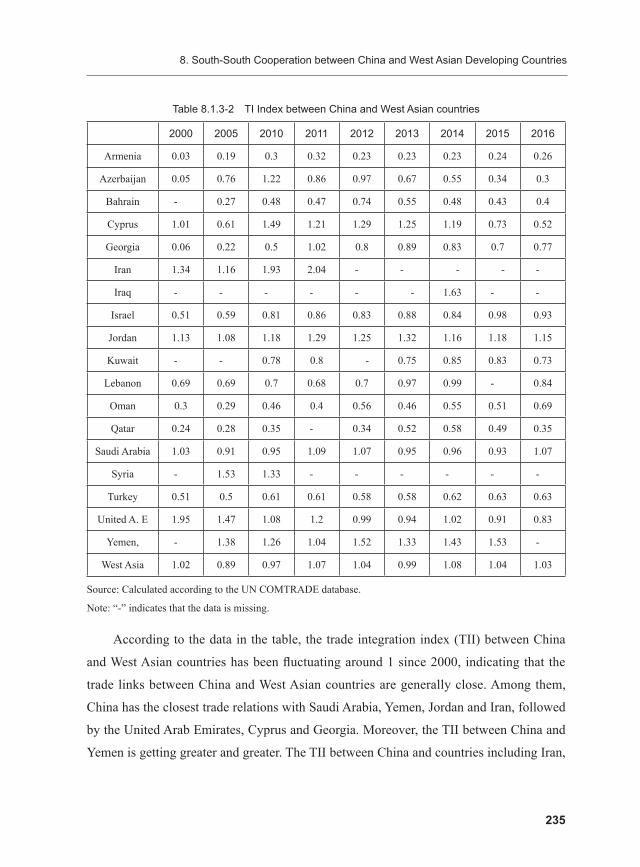
8. South-South Cooperation between China and West Asian Developing Countries
235
Table 8.1.3-2 TI Index between China and West Asian countries
2000 2005 2010 2011 2012 2013 2014 2015 2016
Armenia 0.03 0.19 0.3 0.32 0.23 0.23 0.23 0.24 0.26
Azerbaijan 0.05 0.76 1.22 0.86 0.97 0.67 0.55 0.34 0.3
Bahrain - 0.27 0.48 0.47 0.74 0.55 0.48 0.43 0.4
Cyprus 1.01 0.61 1.49 1.21 1.29 1.25 1.19 0.73 0.52
Georgia 0.06 0.22 0.5 1.02 0.8 0.89 0.83 0.7 0.77
Iran 1.34 1.16 1.93 2.04 - - - - -
Iraq - - - - - - 1.63 - -
Israel 0.51 0.59 0.81 0.86 0.83 0.88 0.84 0.98 0.93
Jordan 1.13 1.08 1.18 1.29 1.25 1.32 1.16 1.18 1.15
Kuwait - - 0.78 0.8 - 0.75 0.85 0.83 0.73
Lebanon 0.69 0.69 0.7 0.68 0.7 0.97 0.99 - 0.84
Oman 0.3 0.29 0.46 0.4 0.56 0.46 0.55 0.51 0.69
Qatar 0.24 0.28 0.35 - 0.34 0.52 0.58 0.49 0.35
Saudi Arabia 1.03 0.91 0.95 1.09 1.07 0.95 0.96 0.93 1.07
Syria - 1.53 1.33 - - - - - -
Turkey 0.51 0.5 0.61 0.61 0.58 0.58 0.62 0.63 0.63
United A. E 1.95 1.47 1.08 1.2 0.99 0.94 1.02 0.91 0.83
Yemen, - 1.38 1.26 1.04 1.52 1.33 1.43 1.53 -
West Asia 1.02 0.89 0.97 1.07 1.04 0.99 1.08 1.04 1.03
Source: Calculated according to the UN COMTRADE database.
Note: “-” indicates that the data is missing.
According to the data in the table, the trade integration index (TII) between China
and West Asian countries has been fluctuating around 1 since 2000, indicating that the
trade links between China and West Asian countries are generally close. Among them,
China has the closest trade relations with Saudi Arabia, Yemen, Jordan and Iran, followed
by the United Arab Emirates, Cyprus and Georgia. Moreover, the TII between China and
Yemen is getting greater and greater. The TII between China and countries including Iran,
China Development Report on South-South Cooperation 2017
236
Iraq, and Saudi Arabia is bigger than 1, showing a strong trade relationship. However, the
China’s TII with Bahrain, Israel, Lebanon, Turkey and other countries are all less than 1,
indicating a weak trade link.
It can be seen that the trade relationship between China and West Asian countries is
relatively strong overall, with a TII that is greater than 1 in most years, and is relatively
stable. However, the index is only slightly greater than 1 in most years, indicating that
the trade links between China and West Asian countries are only slightly higher than the
average level of China’s trade links with the world. In this sense, there is still much room
for development in China’s trade links with West Asian countries.
3. Trade Competitiveness Index The Trade Competitiveness Index is the share of trade differences between the two
countries in total trade. Since trade competitiveness is closely linked to trade balances,
this index could reflect the competition of trade between China and West Asian countries.
The formula for calculating the trade competitiveness index between China and West
Asian countries is:
(8.1)
In the formula (8.1), Xij represents the exports of West Asian countries to China
and Mij represents the imports of West Asian countries from China. Generally speaking,
-1≤TCij≤1. A close-to-1 index indicates a large trade surplus of the West Asian country
with China on such products, that is, the West Asian country is more competitive than
China in such products. Conversely, if the index is close to -1, China is more competitive
on such products. A close-to-0 index means that the imports and exports of West Asian
countries and China are roughly equivalent, and they do not have a competitive advantage
against each other.
According to formula (8.1), the trade competitiveness index of China and West Asian
countries since 2000 is calculated and shown in Table 8.1.3-3. The trade competitiveness
index of different countries in West Asia in 2016 is shown in Table 8.1.3-4.

8. South-South Cooperation between China and West Asian Developing Countries
237
Table 8.1.3-3 TC Index by SITC between China and West Asia
0 1 2 3 4 5 6 7 8 9
2000 0.83 0.73 -0.48 -0.97 0.68 -0.26 0.83 0.85 0.96 1.00
2001 0.82 0.91 -0.57 -0.96 0.77 -0.39 0.78 0.80 0.94 1.00
2002 0.87 0.72 -0.56 -0.96 0.58 -0.39 0.81 0.90 0.94 0.84
2003 0.86 0.98 -0.59 -0.96 0.76 -0.42 0.74 0.91 0.96 0.95
2004 0.81 0.92 -0.63 -0.97 0.54 -0.42 0.81 0.88 0.93 0.84
2005 0.86 1.00 -0.72 -0.97 0.81 -0.40 0.85 0.92 0.94 0.78
2006 0.84 1.00 -0.76 -0.97 0.83 -0.30 0.90 0.93 0.94 0.89
2007 0.82 0.98 -0.75 -0.97 0.21 -0.21 0.93 0.93 0.96 0.75
2008 0.86 0.98 -0.84 -0.98 0.74 -0.19 0.94 0.94 0.96 -0.63
2009 0.89 0.87 -0.76 -0.97 -0.29 -0.35 0.85 0.95 0.97 0.82
2010 0.75 0.96 -0.82 -0.97 -0.66 -0.45 0.90 0.93 0.96 -0.83
2011 0.85 0.87 -0.78 -0.99 0.39 -0.49 0.88 0.95 0.95 0.86
2012 0.82 0.93 -0.79 -0.98 -0.79 -0.48 0.89 0.94 0.96 0.77
2013 0.84 0.90 -0.81 -0.98 -0.89 -0.46 0.90 0.93 0.96 -0.96
2014 0.82 0.88 -0.72 -0.98 -0.77 -0.41 0.93 0.94 0.96 -0.96
2015 0.76 0.80 -0.60 -0.97 -0.65 -0.41 0.93 0.94 0.96 -0.94
2016 0.79 0.89 -0.63 -0.97 -0.32 -0.38 0.92 0.93 0.94 -0.58
Source: Compiled according to UN COMTRADE database.
Note: 0-9 refer to SITC-1 to SITC-9 respectively.
Table 8.1.3-4 TC Index by SITC with West Asia Countries in 2016
0 1 2 3 4 5 6 7 8 9
Bahrain 1.00 1.00 -0.23 0.30 - 0.34 0.88 1.00 1.00 0.89
Cyprus -0.01 -0.87 -0.10 1.00 0.13 -0.05 1.00 1.00 0.99 0.82
Iran 0.77 1.00 -0.74 -0.99 1.00 -0.46 0.92 1.00 1.00 0.95
Iraq 0.97 - 0.97 -1.00 1.00 1.00 1.00 1.00 1.00 0.51
Israel 0.71 -0.30 0.11 0.63 0.26 0.07 0.61 0.25 0.65 0.82
Jordan 0.99 1.00 0.76 1.00 1.00 -0.05 1.00 1.00 0.97 0.77
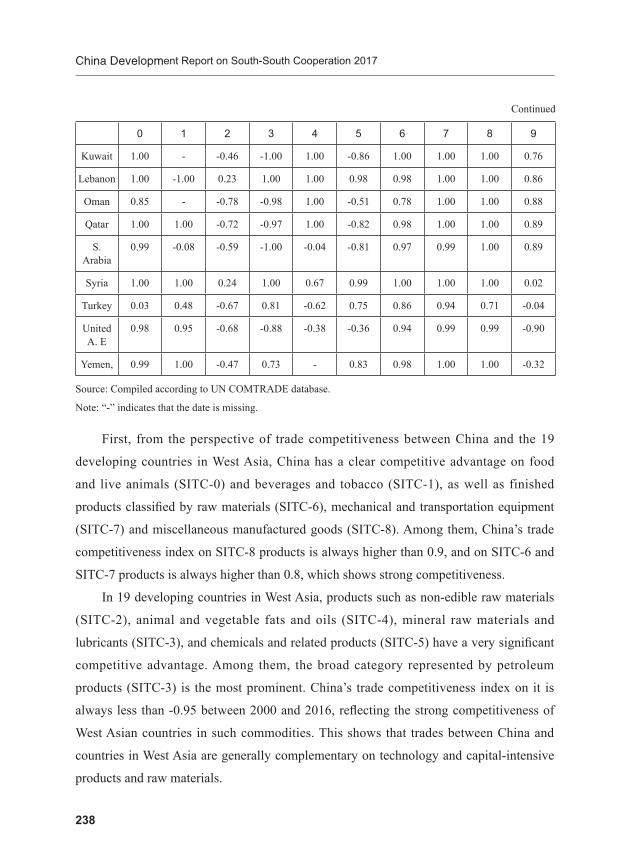
China Development Report on South-South Cooperation 2017
238
0 1 2 3 4 5 6 7 8 9
Kuwait 1.00 - -0.46 -1.00 1.00 -0.86 1.00 1.00 1.00 0.76
Lebanon 1.00 -1.00 0.23 1.00 1.00 0.98 0.98 1.00 1.00 0.86
Oman 0.85 - -0.78 -0.98 1.00 -0.51 0.78 1.00 1.00 0.88
Qatar 1.00 1.00 -0.72 -0.97 1.00 -0.82 0.98 1.00 1.00 0.89
S. Arabia
0.99 -0.08 -0.59 -1.00 -0.04 -0.81 0.97 0.99 1.00 0.89
Syria 1.00 1.00 0.24 1.00 0.67 0.99 1.00 1.00 1.00 0.02
Turkey 0.03 0.48 -0.67 0.81 -0.62 0.75 0.86 0.94 0.71 -0.04
United A. E
0.98 0.95 -0.68 -0.88 -0.38 -0.36 0.94 0.99 0.99 -0.90
Yemen, 0.99 1.00 -0.47 0.73 - 0.83 0.98 1.00 1.00 -0.32
Source: Compiled according to UN COMTRADE database.
Note: “-” indicates that the date is missing.
First, from the perspective of trade competitiveness between China and the 19
developing countries in West Asia, China has a clear competitive advantage on food
and live animals (SITC-0) and beverages and tobacco (SITC-1), as well as finished
products classified by raw materials (SITC-6), mechanical and transportation equipment
(SITC-7) and miscellaneous manufactured goods (SITC-8). Among them, China’s trade
competitiveness index on SITC-8 products is always higher than 0.9, and on SITC-6 and
SITC-7 products is always higher than 0.8, which shows strong competitiveness.
In 19 developing countries in West Asia, products such as non-edible raw materials
(SITC-2), animal and vegetable fats and oils (SITC-4), mineral raw materials and
lubricants (SITC-3), and chemicals and related products (SITC-5) have a very significant
competitive advantage. Among them, the broad category represented by petroleum
products (SITC-3) is the most prominent. China’s trade competitiveness index on it is
always less than -0.95 between 2000 and 2016, reflecting the strong competitiveness of
West Asian countries in such commodities. This shows that trades between China and
countries in West Asia are generally complementary on technology and capital-intensive
products and raw materials.
Continued
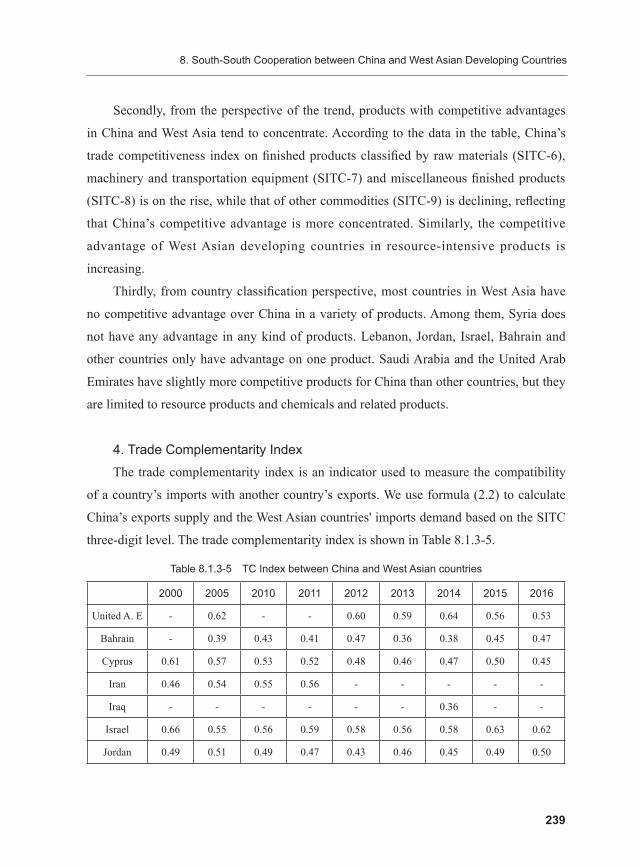
8. South-South Cooperation between China and West Asian Developing Countries
239
Secondly, from the perspective of the trend, products with competitive advantages
in China and West Asia tend to concentrate. According to the data in the table, China’s
trade competitiveness index on finished products classified by raw materials (SITC-6),
machinery and transportation equipment (SITC-7) and miscellaneous finished products
(SITC-8) is on the rise, while that of other commodities (SITC-9) is declining, reflecting
that China’s competitive advantage is more concentrated. Similarly, the competitive
advantage of West Asian developing countries in resource-intensive products is
increasing.
Thirdly, from country classification perspective, most countries in West Asia have
no competitive advantage over China in a variety of products. Among them, Syria does
not have any advantage in any kind of products. Lebanon, Jordan, Israel, Bahrain and
other countries only have advantage on one product. Saudi Arabia and the United Arab
Emirates have slightly more competitive products for China than other countries, but they
are limited to resource products and chemicals and related products.
4. Trade Complementarity Index The trade complementarity index is an indicator used to measure the compatibility
of a country’s imports with another country’s exports. We use formula (2.2) to calculate
China’s exports supply and the West Asian countries' imports demand based on the SITC
three-digit level. The trade complementarity index is shown in Table 8.1.3-5.
Table 8.1.3-5 TC Index between China and West Asian countries
2000 2005 2010 2011 2012 2013 2014 2015 2016
United A. E - 0.62 - - 0.60 0.59 0.64 0.56 0.53
Bahrain - 0.39 0.43 0.41 0.47 0.36 0.38 0.45 0.47
Cyprus 0.61 0.57 0.53 0.52 0.48 0.46 0.47 0.50 0.45
Iran 0.46 0.54 0.55 0.56 - - - - -
Iraq - - - - - - 0.36 - -
Israel 0.66 0.55 0.56 0.59 0.58 0.56 0.58 0.63 0.62
Jordan 0.49 0.51 0.49 0.47 0.43 0.46 0.45 0.49 0.50
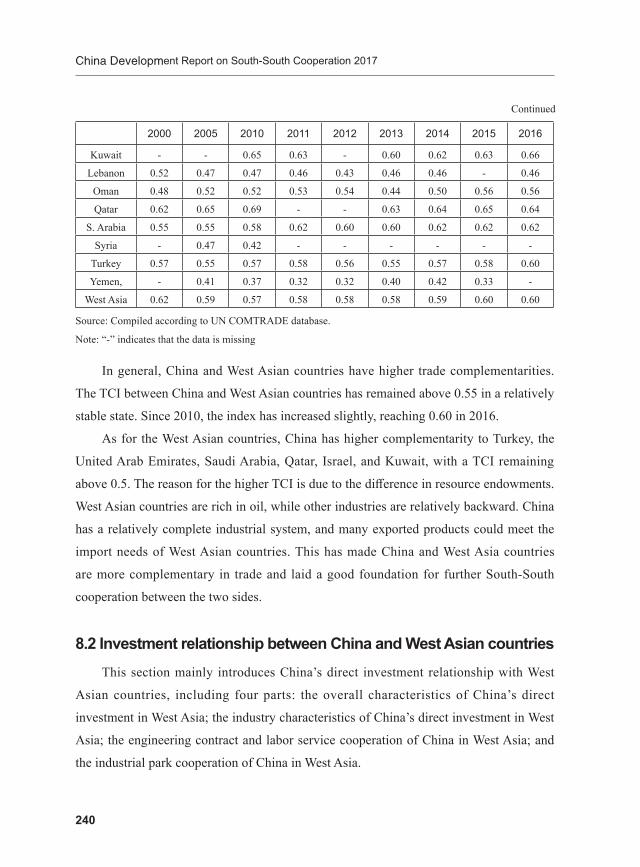
China Development Report on South-South Cooperation 2017
240
2000 2005 2010 2011 2012 2013 2014 2015 2016
Kuwait - - 0.65 0.63 - 0.60 0.62 0.63 0.66
Lebanon 0.52 0.47 0.47 0.46 0.43 0.46 0.46 - 0.46
Oman 0.48 0.52 0.52 0.53 0.54 0.44 0.50 0.56 0.56
Qatar 0.62 0.65 0.69 - - 0.63 0.64 0.65 0.64
S. Arabia 0.55 0.55 0.58 0.62 0.60 0.60 0.62 0.62 0.62
Syria - 0.47 0.42 - - - - - -
Turkey 0.57 0.55 0.57 0.58 0.56 0.55 0.57 0.58 0.60
Yemen, - 0.41 0.37 0.32 0.32 0.40 0.42 0.33 -
West Asia 0.62 0.59 0.57 0.58 0.58 0.58 0.59 0.60 0.60
Source: Compiled according to UN COMTRADE database.
Note: “-” indicates that the data is missing
In general, China and West Asian countries have higher trade complementarities.
The TCI between China and West Asian countries has remained above 0.55 in a relatively
stable state. Since 2010, the index has increased slightly, reaching 0.60 in 2016.
As for the West Asian countries, China has higher complementarity to Turkey, the
United Arab Emirates, Saudi Arabia, Qatar, Israel, and Kuwait, with a TCI remaining
above 0.5. The reason for the higher TCI is due to the difference in resource endowments.
West Asian countries are rich in oil, while other industries are relatively backward. China
has a relatively complete industrial system, and many exported products could meet the
import needs of West Asian countries. This has made China and West Asia countries
are more complementary in trade and laid a good foundation for further South-South
cooperation between the two sides.
8.2 Investment relationship between China and West Asian countriesThis section mainly introduces China’s direct investment relationship with West
Asian countries, including four parts: the overall characteristics of China’s direct
investment in West Asia; the industry characteristics of China’s direct investment in West
Asia; the engineering contract and labor service cooperation of China in West Asia; and
the industrial park cooperation of China in West Asia.
Continued
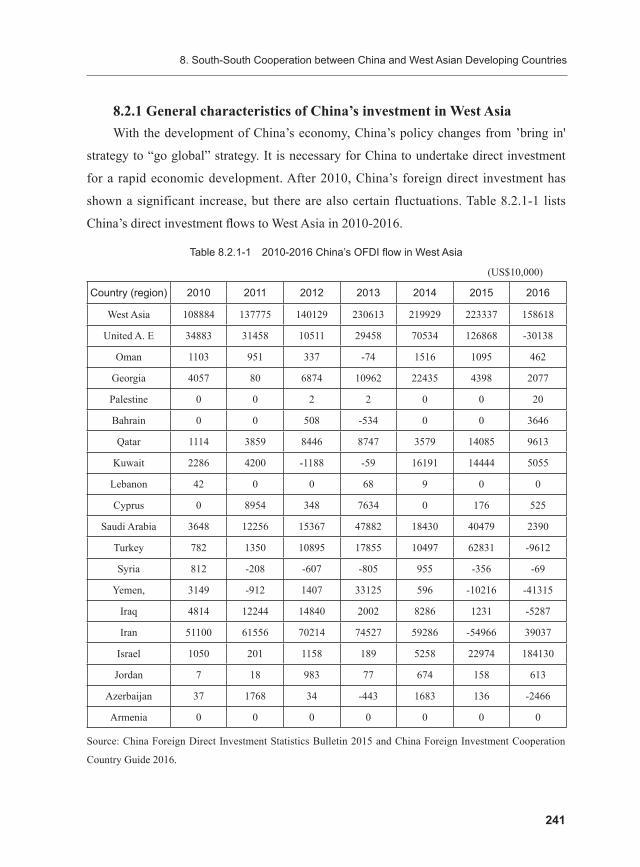
8. South-South Cooperation between China and West Asian Developing Countries
241
8.2.1 General characteristics of China’s investment in West AsiaWith the development of China’s economy, China’s policy changes from ’bring in'
strategy to “go global” strategy. It is necessary for China to undertake direct investment
for a rapid economic development. After 2010, China’s foreign direct investment has
shown a significant increase, but there are also certain fluctuations. Table 8.2.1-1 lists
China’s direct investment flows to West Asia in 2010-2016.
Table 8.2.1-1 2010-2016 China’s OFDI flow in West Asia
(US$10,000)
Country (region) 2010 2011 2012 2013 2014 2015 2016
West Asia 108884 137775 140129 230613 219929 223337 158618
United A. E 34883 31458 10511 29458 70534 126868 -30138
Oman 1103 951 337 -74 1516 1095 462
Georgia 4057 80 6874 10962 22435 4398 2077
Palestine 0 0 2 2 0 0 20
Bahrain 0 0 508 -534 0 0 3646
Qatar 1114 3859 8446 8747 3579 14085 9613
Kuwait 2286 4200 -1188 -59 16191 14444 5055
Lebanon 42 0 0 68 9 0 0
Cyprus 0 8954 348 7634 0 176 525
Saudi Arabia 3648 12256 15367 47882 18430 40479 2390
Turkey 782 1350 10895 17855 10497 62831 -9612
Syria 812 -208 -607 -805 955 -356 -69
Yemen, 3149 -912 1407 33125 596 -10216 -41315
Iraq 4814 12244 14840 2002 8286 1231 -5287
Iran 51100 61556 70214 74527 59286 -54966 39037
Israel 1050 201 1158 189 5258 22974 184130
Jordan 7 18 983 77 674 158 613
Azerbaijan 37 1768 34 -443 1683 136 -2466
Armenia 0 0 0 0 0 0 0
Source: China Foreign Direct Investment Statistics Bulletin 2015 and China Foreign Investment Cooperation
Country Guide 2016.
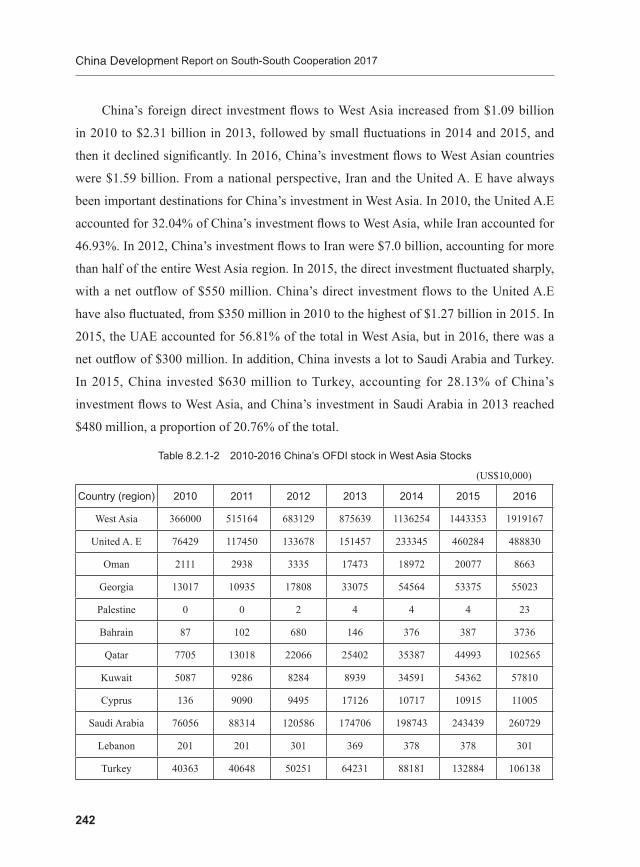
China Development Report on South-South Cooperation 2017
242
China’s foreign direct investment flows to West Asia increased from $1.09 billion
in 2010 to $2.31 billion in 2013, followed by small fluctuations in 2014 and 2015, and
then it declined significantly. In 2016, China’s investment flows to West Asian countries
were $1.59 billion. From a national perspective, Iran and the United A. E have always
been important destinations for China’s investment in West Asia. In 2010, the United A.E
accounted for 32.04% of China’s investment flows to West Asia, while Iran accounted for
46.93%. In 2012, China’s investment flows to Iran were $7.0 billion, accounting for more
than half of the entire West Asia region. In 2015, the direct investment fluctuated sharply,
with a net outflow of $550 million. China’s direct investment flows to the United A.E
have also fluctuated, from $350 million in 2010 to the highest of $1.27 billion in 2015. In
2015, the UAE accounted for 56.81% of the total in West Asia, but in 2016, there was a
net outflow of $300 million. In addition, China invests a lot to Saudi Arabia and Turkey.
In 2015, China invested $630 million to Turkey, accounting for 28.13% of China’s
investment flows to West Asia, and China’s investment in Saudi Arabia in 2013 reached
$480 million, a proportion of 20.76% of the total.
Table 8.2.1-2 2010-2016 China’s OFDI stock in West Asia Stocks
(US$10,000)
Country (region) 2010 2011 2012 2013 2014 2015 2016
West Asia 366000 515164 683129 875639 1136254 1443353 1919167
United A. E 76429 117450 133678 151457 233345 460284 488830
Oman 2111 2938 3335 17473 18972 20077 8663
Georgia 13017 10935 17808 33075 54564 53375 55023
Palestine 0 0 2 4 4 4 23
Bahrain 87 102 680 146 376 387 3736
Qatar 7705 13018 22066 25402 35387 44993 102565
Kuwait 5087 9286 8284 8939 34591 54362 57810
Cyprus 136 9090 9495 17126 10717 10915 11005
Saudi Arabia 76056 88314 120586 174706 198743 243439 260729
Lebanon 201 201 301 369 378 378 301
Turkey 40363 40648 50251 64231 88181 132884 106138
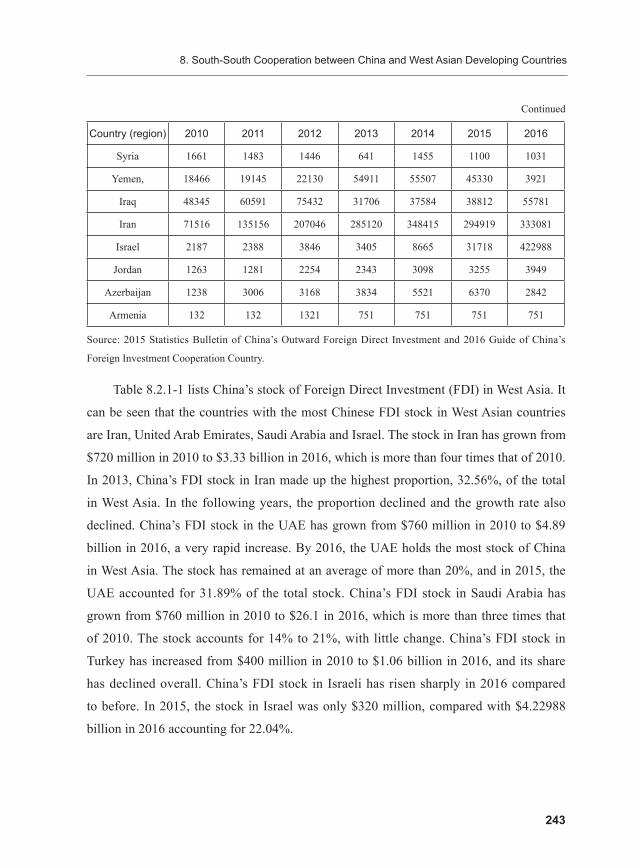
8. South-South Cooperation between China and West Asian Developing Countries
243
Country (region) 2010 2011 2012 2013 2014 2015 2016
Syria 1661 1483 1446 641 1455 1100 1031
Yemen, 18466 19145 22130 54911 55507 45330 3921
Iraq 48345 60591 75432 31706 37584 38812 55781
Iran 71516 135156 207046 285120 348415 294919 333081
Israel 2187 2388 3846 3405 8665 31718 422988
Jordan 1263 1281 2254 2343 3098 3255 3949
Azerbaijan 1238 3006 3168 3834 5521 6370 2842
Armenia 132 132 1321 751 751 751 751
Source: 2015 Statistics Bulletin of China’s Outward Foreign Direct Investment and 2016 Guide of China’s
Foreign Investment Cooperation Country.
Table 8.2.1-1 lists China’s stock of Foreign Direct Investment (FDI) in West Asia. It
can be seen that the countries with the most Chinese FDI stock in West Asian countries
are Iran, United Arab Emirates, Saudi Arabia and Israel. The stock in Iran has grown from
$720 million in 2010 to $3.33 billion in 2016, which is more than four times that of 2010.
In 2013, China’s FDI stock in Iran made up the highest proportion, 32.56%, of the total
in West Asia. In the following years, the proportion declined and the growth rate also
declined. China’s FDI stock in the UAE has grown from $760 million in 2010 to $4.89
billion in 2016, a very rapid increase. By 2016, the UAE holds the most stock of China
in West Asia. The stock has remained at an average of more than 20%, and in 2015, the
UAE accounted for 31.89% of the total stock. China’s FDI stock in Saudi Arabia has
grown from $760 million in 2010 to $26.1 in 2016, which is more than three times that
of 2010. The stock accounts for 14% to 21%, with little change. China’s FDI stock in
Turkey has increased from $400 million in 2010 to $1.06 billion in 2016, and its share
has declined overall. China’s FDI stock in Israeli has risen sharply in 2016 compared
to before. In 2015, the stock in Israel was only $320 million, compared with $4.22988
billion in 2016 accounting for 22.04%.
Continued
China Development Report on South-South Cooperation 2017
244
8.2.2 The Industries of China’s OFDI in West Asian CountriesGenerally speaking, China’s direct investment in West Asia is mainly distributed in
the fields of energy, transportation, and non-ferrous metals, but country varies with their
own characteristics.
China’s investment in the United A.E mainly flows to the fields of energy, steel,
building materials, construction machinery, hardware, and chemicals. In recent years,
there have been several large-scale investment projects, such as Al Yasat jointly
established by Adnoc and PetroChina, Tianjin Pipe Plant’s new branch in Dubai Jeb Ali
Free Zone which costed ¥1.5 billion, and the gas field project in United A.E invested by
Sinochem which costed about $ billion.
Saudi Arabia is China’s most important economic and trade cooperation partner
in the entire West Asia region. The direct investment of Chinese companies into Saudi
Arabia focused on the oil and energy industry at the first and later extended to the
construction industry and manufacturing. With the opening of the Saudi Arabian market
and the development of Chinese companies in recent years, China’s investment in Saudi
Arabia has spread across industries, not only in the traditional industrial sector, but also in
the sunrise industry, including the use of new energy and services.
Iran is also a major investment host for China in the West Asia region. Compared
with Iran, China has a strong advantage in economic and technological strength. In
addition to the energy sector, light industry, road infrastructure construction, machinery
manufacturing and agriculture also occupy a share in China’s investment to Iran.
In 2015, under the guidance of the 'Belt and Road' initiative, Chinese companies
accelerated their investment in Turkey. For example, the Industrial and Commercial Bank
of China spent $450 million to acquire the Turkish Textile Bank. Later, COSCO Pacific,
China Merchants International and China Investment International jointly invested $1
billion to acquire Turkey’s third largest container terminal, which also set a new record
for China’s investment in Turkey.

8. South-South Cooperation between China and West Asian Developing Countries
245
8.2.3 China’s project contracting and labor service cooperation with West Asian countries
After obtaining the contracting or subcontracting tasks of foreign engineering
projects, Chinese enterprises send various laborers for the implementation of the project.
Chinese laborers are known for their technical proficiency, low wages, hard-work and
manageable. China’s foreign contracted projects and labor cooperation are closely related
to China’s foreign investment and foreign economic and technological assistance, and
are also an important part of strengthening cooperation between China and developing
countries in West Asia. Table 8.2.3 lists China’s engineering contracting and labor
dispatch in major West Asian countries.
Table 8.2.3 China’s Project contracting and labor services cooperation with some countries in West Asia in 2016
CountryNewly signed
project amount ($ billion)
Completed business amount
($ billion)
Number of labor sent in 2016
(person)
Total Number by the year (person)
Iran 86.18 22.47 1006 2126
Iraq 55.29 34.55 12541 8148
Saudi Arabia 50.29 94.82 29423 42069
Qatar 2.68 11.99 1343 4411
United A. E 50.47 22.46 2247 10075
Turkey 6.55 21.45 5751 7949
Oman 8.19 8.06 156 605
Source: China Foreign Investment Cooperation Country Guide by Ministry of Commerce People’s Republic of
China.
China’s engineering contracting and labor dispatch in West Asia involves multiple
areas. For example, in 2016, China’s new contracted project in Saudi Arabia included
the fifth phase of the Saudi military barracks development project undertaken by China
Railway 14th Bureau Group Co., LTD.; the Maaden phosphate fertilizer project public
works and infrastructure constructed by Sinopec Engineering (Group) Co., Ltd.; the Saudi
Jizan City Commercial Port Project undertaken by China Harbour Engineering Co., LTD..

China Development Report on South-South Cooperation 2017
246
In the United A.E, the new projects signed in 2016 include the Dubai Hassyan
4X600MW Clean Coal Power Plant Installation constructed by Harbin Electric
International Co., Ltd.; the UAE drilling and workover service project constructed by
CNPC Greatwall Drilling Company; the Dubai Silicon Park constructed by China State
Construction Engineering Corporation (CSCEC).
In Iraq, China’s newly signed project in 2016 included Rumaila 730MW Combined
Cycle Power Plant project constructed by SINOHYDRO Corporation Limited; Shatt Al-
Basra Combined Cycle Power Plant Conversion 650MW Power Plant Project constructed
by China Machinery Engineering Corporation; the overall contract on drilling in Iraq
undertaken by CNPC Greatwall Drilling Company.
In Turkey, the newly signed project contracting projects in 2016 mainly consisted of
the TurkTelekom contracted by Huawei Technologies Co., Ltd.; KAZAN Cogenaration
Power Plant Project constructed by Hydro Electric Power System Engineering Company
(HEPSEC); the Turkey drilling engineering services.
In Oman, the newly signed project contracting projects include the IBIR Independent
Power Project in the Sultanate of Oman; the Omantel undertaken by Huawei Technologies
Co., Ltd.; and the Oman Drilling Service.
In Qatar, new contracted projects include Qatar’s Doha Road and Municipal Works;
Qatar’s NFA EPIC project.
In Iran, the newly signed project contracting projects include the Iranian Kerman
water delivery project constructed by China Ge Zhou Ba Group Co.,Ltd.; the exploration
and construction of the Iranian Azandegan block undertaken by Xinjiang Xhengtong
Oil&Gas Co., Ltd.; the Iran PPS S2 light hydrocarbon recovery plant project constructed
by China Nonferrous Metal Industry’s Foreign Engineering and Construction CO., LTD..
It can be seen from the above that China’s engineering contracting in West Asia
is mainly power station, telecommunications, energy and infrastructure construction.
These projects have a strong role in promoting the economic development of West Asian
countries.

8. South-South Cooperation between China and West Asian Developing Countries
247
8.2.4 China’s industrial park cooperation in West AsiaChinese enterprises have cooperated with Saudi Arabia, Oman and the
United Arab Emirates to build characteristic industrial parks. They have become
important carriers for capacity cooperation between China and West Asia. The
China-Saudi (Jizane) Industrial Park and the China-Oman (Dukum) Industrial
Park under construction in Ningxia are two representatives among them.
In September 2015, the government of Ningxia Hui Autonomous Region and the
government of Oman Duqm Special Economic Zone signed an framework agreement on
investment cooperation. On May 23, 2016, China-Oman (Duqm) Industrial Park signed the
contract. The China-Oman (Duqm) Industrial Park was listed by the National Development
and Reform Commission as one of the 20 key international capacity demonstration
parks. On April 19, 2017, the opening ceremony and signing ceremony were held by
Ningxia Government, and 10 companies signed the agreement to build plants in the park.
The development policy of the Park is that under the government guidance, the Park is
operated by market with corporate entities as the main players, encouraging companies
go global as a cluster. The industrial park is mainly operated by enterprises. China-
Arab Wanfang Investment Management (Ningxia) Co. Ltd established by some of the
investment enterprises in the Park undertakes the planning, construction and operation of
the Park. The total planned investment of the proposed project is ¥67 billion, covering
9 fields On May 16, 2018, the China-UAE “Belt and Road” Capacity Cooperation Park
officially started construction. The park is located in the Khalifa Industrial Zone in Abu
Dhabi, UAE. The start-up area is 2.2 square kilometers and the reserved land is 10 square
kilometers. It is invested and constructed and operated by Jiangsu Overseas Cooperation
Investment Co., Ltd. 15 enterprises have signed investment framework agreement with
the Park. The framework agreement, involving building materials, chemicals, new energy
and other industries, with a total investment of more than ¥6 billion, will create more
than 2,500 jobs for the local. The high-quality construction of the Park is an important
part of consensus between President Hao Xi and the Crown Prince of Abu Dhabi Sheikh
Mohammed on strengthening the pragmatic cooperation within the framework of “the
Belt and Road” initiative. The Park is centered on realizing the link of China’s “Belt and

China Development Report on South-South Cooperation 2017
248
Road” initiative and the UEA’s “Economic Diversification” strategy. It fully leverages and
integrates the advantages of both parties, and innovate the cooperation mode of financial
service entities. Based on the UAE, the influence will radiate to the Middle East. It has a
positive demonstration effect on the 'Belt and Road' capacity cooperation in the new era.
8.3 China’s assistance to West Asian countries
8.3.1 Scale of China's assistanceFigure 8.3.1 depicts the changes in the amount of China’s aid to West Asian
countries. It can be seen that China’s assist significantly to West Asia every year. There
were 12 aid projects in 2014, amounted to $2.17 billion; in 2007, there were 11 aid
projects, reaching $1.25 billion. When assisting countries in West Asia, China fully
considers the actual needs of recipient countries and helps recipient countries to carry out
infrastructure and improve people’s lives. For example, in 2007, China provided a loan
of ¥86 million ($11.3 million) to Syria to build a bridge on the Euphrates River to solve
0
2
4
6
8
10
12
14
16
18
0.00
5.00
10.00
15.00
20.00
25.00
2001
2000
2002
2003
2004
2005
2006
2007
2008
2009
2010
2011
2012
2013
2014
Amount,100millionUSD,Left Axis Project Number,Right Axis
year
Figure 8.3.1 Scale of China’s assistance to West Asian countries over the years
Source: AidData. 2017. Global Chinese Official Finance Dataset, Version 1.0.
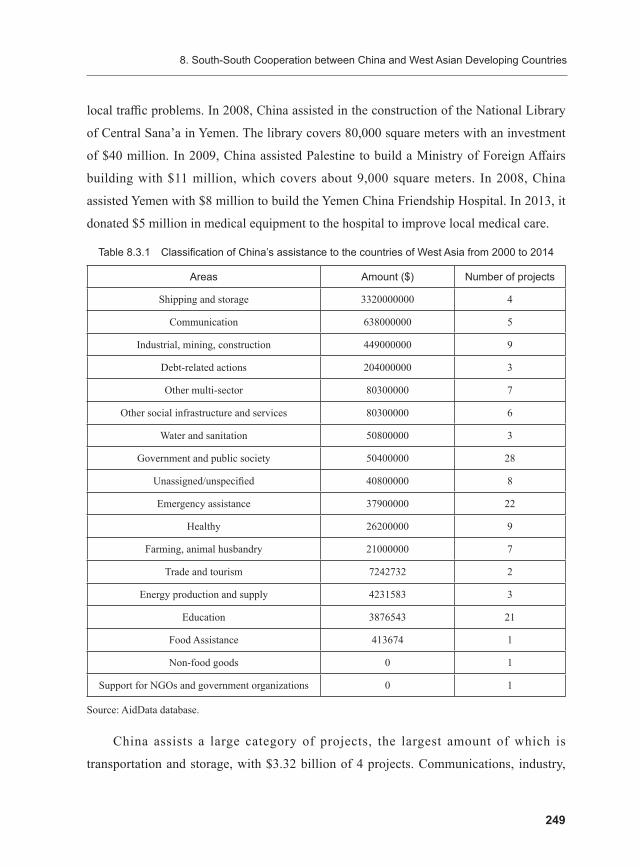
8. South-South Cooperation between China and West Asian Developing Countries
249
local traffic problems. In 2008, China assisted in the construction of the National Library
of Central Sana’a in Yemen. The library covers 80,000 square meters with an investment
of $40 million. In 2009, China assisted Palestine to build a Ministry of Foreign Affairs
building with $11 million, which covers about 9,000 square meters. In 2008, China
assisted Yemen with $8 million to build the Yemen China Friendship Hospital. In 2013, it
donated $5 million in medical equipment to the hospital to improve local medical care.
Table 8.3.1 Classification of China’s assistance to the countries of West Asia from 2000 to 2014
Areas Amount ($) Number of projects
Shipping and storage 3320000000 4
Communication 638000000 5
Industrial, mining, construction 449000000 9
Debt-related actions 204000000 3
Other multi-sector 80300000 7
Other social infrastructure and services 80300000 6
Water and sanitation 50800000 3
Government and public society 50400000 28
Unassigned/unspecified 40800000 8
Emergency assistance 37900000 22
Healthy 26200000 9
Farming, animal husbandry 21000000 7
Trade and tourism 7242732 2
Energy production and supply 4231583 3
Education 3876543 21
Food Assistance 413674 1
Non-food goods 0 1
Support for NGOs and government organizations 0 1
Source: AidData database.
China assists a large category of projects, the largest amount of which is
transportation and storage, with $3.32 billion of 4 projects. Communications, industry,

China Development Report on South-South Cooperation 2017
250
mining, construction, and debt-related operations follow, with aid amounts of $638
million, $449 million, and $204 million, respectively. Government and public society
projects are the most, with 28 projects, followed by emergency aids (22) and education
(21). For example, in the field of energy production and supply, in March 2010, China
provided 600 sets of solar water heaters to Lebanon to mitigate the effects of blackouts
and encourage the use of clean energy. In the health field, in 2013, China provided
medical equipment and furniture to the Yemeni-China Friendship Hospital in Sana‘a, and
helped the hospital to set up and dispatch medical teams. In the field of water supply and
sanitation, in 2010 China provided Jordan with a $5 million zero-interest loan to improve
the water supply network. On April 14, 2010, Chinese Ambassador Yu Hongyang
launched the project at a ceremony held in Zaka. The project aims to improve the water
conditions of local residents to improve their living standards.
8.3.2 China’s emergency assistance to West Asian countriesUnder various serious natural disasters or humanitarian disasters in West Asian,
China shall take the initiative or at the request of the affected country to sent in emergency
assistance, cash or send rescue workers to alleviate the loss of life and property of the
people in the disaster areas and help the affected countries to cope with the difficulties.
When the West Asian countries face the natural disasters and wars, China actively offers
help to the affected countries to rebuild their homes.
The complicated political and religious situation in West Asia and the long-
term military intervention by the United States in this region have caused people in
some parts of West Asia to suffer a lot. Between 2000 and 2014, China’s humanitarian
emergency assistance to West Asian countries varied widely in different years, which
also illustrates the characteristics of humanitarian emergency assistance that the amount
of aid would increase in emergencies. For example, in 2006, the conflict caused a large
number of casualties in Lebanon, and Chinese government urgently assisted Lebanon
with humanitarian relief supplies totaling 150 tons, worth $2.5 million in response.
The supplies include tents which were the most urgently needed, generators, medical
equipment and medicines, as well as daily necessities such as blankets and sheets. In
8. South-South Cooperation between China and West Asian Developing Countries
251
2008, in response to the crisis in the Gaza Strip, China provided $500,000 in emergency
humanitarian assistance to the Palestinian national authority. In October 2011, the
Chinese government provided $1 million to the Turkish government after the magnitude
7.2 earthquake in eastern Turkey. In 2012, the Chinese government provided Syria with
$2 million in emergency humanitarian assistance through the International Committee of
the Red Cross, based in Geneva, Switzerland, and entrusted the ICRC to use the above-
mentioned aid for procurement of supplies and household items in accordance with the
actual situation and needs of Syria and distribute to the people. In 2014, China delivered
a total of ¥20 million worth of humanitarian aid to Syria, including quilts, blankets and
other supplies urgently needed by the refugees.
252
9 South-South Cooperation between China and Central Asian Countries
Central Asia includes six countries: Turkmenistan, Uzbekistan, Kyrgyzstan,
Tajikistan, Kazakhstan and Afghanistan. The Central Asian countries are located in the
economic belt of the Silk Road. They have a close relationship with China in history,
also face an important mission of economic development as China. This chapter analyzes
South-South cooperation between China and Central Asian countries from three aspects:
trade relations, investment relations and foreign aid relations between China and Central
Asian countries.
9.1 Trade relations between China and Central Asian countriesThis section will study the trade relations between China and Southeast Asian
countries in terms of trade scale and speed, trade structure, and trade competitiveness and
complementarity.
9.1.1 The Scale and Growth Rate
1. Total trade and the balanceIt can be seen from Figure 9.1.1-1 and Figure 9.1.1-2 that the import and export
between China and Central Asian countries is showing a trend of scale expansion,
especially for exports, with a large increase. Among the six Central Asian countries,
Kazakhstan and Kyrgyzstan are the most exported, and Kazakhstan and Turkmenistan
are the most imported. China’s imports and exports to Tajikistan and Uzbekistan are
relatively flat and there are no major ups and downs.

9 South-South Cooperation between China and Central Asian Countries
253
0
2000
4000
6000
8000
10000
12000
14000
2001
2000
2002
2003
2004
2005
2006
2007
2008
2009
2010
2011
2012
2013
2014
2015
2016
export -Afghanistan export -Kazakhstan export -Kyrgyz
export -Tajikistan export -Turkmenistan export -Uzbekistan
year
Figure 9.1.1-1 China’s Export to the Central Asian Countries (US$ million)
Source: Calculated according to the UN COMTRADE database.
02000400060008000
1000012000140001600018000
2001
2000
2002
2003
2004
2005
2006
2007
2008
2009
2010
2011
2012
2013
2014
2015
2016
Import -Afghanistan Import -Kazakhstan Import -Kyrgyz
Import -Tajikistan Import -Turkmenistan Import -Uzbekistan
year
Figure 9.1.1-2 China’s Import from the Central Asian Countries (US$ million)
Source: Calculated according to the UN COMTRADE database.
Table 9.1.1-1 shows the status of China’s imports and exports, total import and export
volume, and import and export balances for Central Asian countries in 2016. In 2016, the
country with the largest proportion of China’s imports in Central Asia was Turkmenistan,
followed by Kazakhstan; the largest share of China’s exports was Kazakhstan, followed
by Kyrgyzstan; the country with the largest share of imports and exports was Kazakhstan.
Turkmenistan is the only country in Central Asia where its import and export balances

China Development Report on South-South Cooperation 2017
254
are negative, and China’s imports exceed its exports. The total trade volume between
China and Afghanistan is the lowest in Central Asia. In particular, China’s imports
from Afghanistan are only US$0.05 billion, which is related to the political turmoil and
economic sluggishness in Afghanistan for many years. The instability of the political and
economic environment will inevitably lead to low consumption power and decrease in
trade.
Table 9.1.1-1 China’s import and export with Central Asian countries in 2016
(US$ billion)
Country China’s imports China’s exports Total trade Trade balance
Turkmenistan 55.63 3.38 59.02 -52.24
Uzbekistan 16.07 20.07 36.14 4.00
Kyrgyzstan 0.71 56.05 56.77 55.34
Tajikistan 0.31 17.25 17.56 16.93
Kazakhstan 48.05 82.92 130.97 34.87
Afghan 0.05 4.30 4.35 4.26
Source: Calculated according to the UN COMTRADE database.
2. The growth rate and its change (1) Fixed-base Growth
The total merchandise trade between China and Central Asian countries showed
a significant rapid growth trend from 2000 to 2013, peaking in 2013, and has declined
since 2016. Imports and exports totaled in line with it. Although the scale of trade in 2009
has plummeted, it has generally shown a growth trend. Based on the year 2000, the total
merchandise trade between China and Central Asian countries increased by about 15
times in 2016, with imports increasing by about 10 times and exports increasing by about
20 times.

9 South-South Cooperation between China and Central Asian Countries
255
0
500
1000
1500
2000
2500
3000
3500
2001
2000
2002
2003
2004
2005
2006
2007
2008
2009
2010
2011
2012
2013
2014
2015
2016
China’s exports to Central Asian countries
China’s exports from Central Asian countries
Total Imports and Exports of China and Central Asian Countries
year
Figure 9.1.1-3 Fixed-base growth rate of import and export with Central Asia countries (2000 = 100)
Source: Calculated according to the UN COMTRADE database.
From a specific trend, the growth rate of China-Africa trade with China and Central
Asia from 2000 to 2006 was relatively stable. From 2006 to 2013, it was a period of rapid
growth, although in 2009 it was affected by the US financial crisis and declined, but due
to the continued growth of the developing economies, the trade growth rate in 2010 has
rebounded sharply, surpassing the growth rate before the crisis. However, from 2013 to
2016, China’s growth rate of import and export trade to Central Asian countries showed a
slowdown, which was mainly affected by the slowdown in world trade growth during the
same period.
(2) Chain Growth Rate
The changes in the chain growth rate of export and import between China and
Central Asian countries are shown in Figure 9.1.1-4. Among the growth, there are three
abnormal points deserved attention: firstly, the negative growth of import and export
trade in 2001, which is mainly due to the legacy of the Asian financial crisis, leading to
decline in production and trade between China and Central Asian countries. Secondly,
in 2009, due to the global economic crisis, trade suddenly fell to negative growth, which
was the year with the largest decline during the sample period. Due to the crisis, the

China Development Report on South-South Cooperation 2017
256
prices of bulk goods such as energy and food increased, and imports also experienced
negative growth. Thirdly, in 2015, the growth rate of the chain began to slow down from
2010, and it dropped to negative growth in 2015. It can be seen that the trade growth
between China and Central Asian countries is highly volatile, indicating that the trade
development between China and Central Asian countries is not particularly stable due to
the relative backwardness of the economic aggregates and market environment. Although
the trade development potential is huge, it is easily affected by the international market
environment.
-0.6
-0.4
-0.2
0
0.2
0.4
0.6
0.8
1
1.2
1.4
2001
2000
2002
2003
2004
2005
2006
2007
2008
2009
2010
2011
2012
2013
2014
2015
2016
Export growth rate Import growth rate Ring growth rate
year
Figure 9.1.1-4 The chain growth rate of import and export with Central Asia countries
Source: Calculated according to the UN COMTRADE database.
9.1.2 The Pattern of trade between China and Central Asian countries
1. Trade pattern by countryThe five Central Asian countries are the core areas along the “Silk Road Economic
Belt”, and the trade relationship between China and Central Asian countries is close.
China’s bilateral trade with Kazakhstan, Tajikistan, Kyrgyzstan, Turkmenistan and
Uzbekistan has become closer and more frequent over time. Under the framework of the
Shanghai Cooperation Organization, the cooperation between China and Central Asia is
stable and the exchanges of high-level visits are frequent. On many international issues,

9 South-South Cooperation between China and Central Asian Countries
257
China and the five countries share common interests and the parties are willing to develop
long-term, mutually beneficial and friendly relations with China. Due to years of war,
Afghan has relatively weak trade links with China.
From Figure 9.1.2-1, we can see the national structure of trade imports between
China and Central Asian countries in 2016. Among the six countries in Central Asia,
China has the largest share of imports from Turkmenistan, accounting for 46% of the
total of the six countries. China has maintained Turkmenistan’s position as the largest
trading partner for six consecutive years. China’s share of imports from Kazakhstan
accounts for 40%, and imports from Uzbekistan account for 13%. While China’s imports
from Kyrgyzstan, Tasakstan and Afghanistan are small, Kyrgyzstan accounts for 1%, and
Tasakstan and Afgstan are both less than 1%.
13%
0%
46%
1%
40%
0%Uzbekistan
Afghan
Turkmenistan
Kyrgyzstan
Kazakhstan
Tajikistan
Figure 9.1.2-1 Import Structures by country in 2016
Source: Calculated according to the UN COMTRADE database.
Figure 9.1.2-2 reflects the structural relationship of China’s trade exports to Central
Asian countries in 2016. Among the six countries in Central Asia, China has the largest
share of exports to Kazakhstan, accounting for 45% of the total of the six countries, 31%
of the total exports to Kyrgyzstan, and exports to Uzbekistan and Tajikistan, respectively
11% and 9%. China’s share of exports to Turkmenistan and Afghanistan is small,
accounting for 2% and 2% of the total of the six countries respectively. It can be seen

China Development Report on South-South Cooperation 2017
258
that both exports and imports between China and Kazakhstan are relatively large, while
Turkmenistan, which has a large share of imports, has a smaller share of exports, and
Kyrgyzstan, which has a smaller share of imports, has a larger share of exports.
2%
45%
31%
9%
2%11%
Afghan
Kazakhstan
Kyrgyzstan
Tajikistan
TurkmenistanUzbekistan
Figure 9.1.2-2 Export Structures by country in 2016
Source: Calculated according to the UN COMTRADE database.
2. Trade Patternby products(1) Classified by final use
We refer to the United Nations Conference on Trade and Development (UNCTAD)
to further examine the structural characteristics of product trade between China and
Central Asian countries according to the classification of the final use of commodities
from the four categories: raw materials, intermediate products, consumer products and
capital products.
In the trade between China and Central Asia in 2016, the performance of consumer
goods was outstanding. What is particularly striking is that most of the trade between
China and Turkmenistan is consumer goods, which occupied the first place in trade
between China and Kazakhstan and Kyrgyzstan. Correspondingly, the trade of
intermediate goods also has a large weight. The six Central Asian countries have the
largest trade in intermediate goods with Kazakhstan, followed by Uzbekistan. In general,
the amount of trade with the Afghan for all classifications is small.
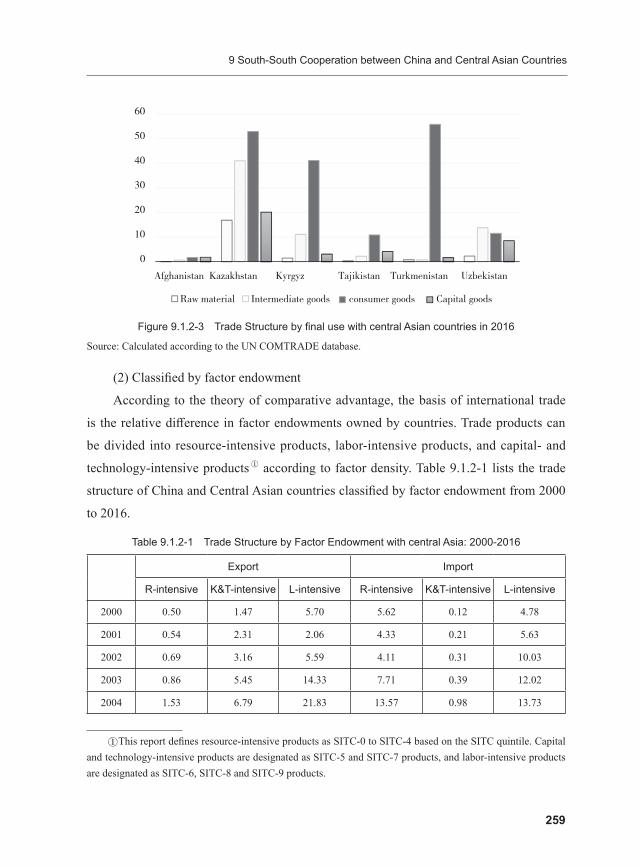
9 South-South Cooperation between China and Central Asian Countries
259
0
10
20
30
40
50
60
Raw material Intermediate goods consumer goods Capital goods
Afghanistan Kazakhstan Kyrgyz Tajikistan Turkmenistan Uzbekistan
Figure 9.1.2-3 Trade Structure by final use with central Asian countries in 2016
Source: Calculated according to the UN COMTRADE database.
(2) Classified by factor endowment
According to the theory of comparative advantage, the basis of international trade
is the relative difference in factor endowments owned by countries. Trade products can
be divided into resource-intensive products, labor-intensive products, and capital- and
technology-intensive products A according to factor density. Table 9.1.2-1 lists the trade
structure of China and Central Asian countries classified by factor endowment from 2000
to 2016.
Table 9.1.2-1 Trade Structure by Factor Endowment with central Asia: 2000-2016
Export Import
R-intensive K&T-intensive L-intensive R-intensive K&T-intensive L-intensive
2000 0.50 1.47 5.70 5.62 0.12 4.78
2001 0.54 2.31 2.06 4.33 0.21 5.63
2002 0.69 3.16 5.59 4.11 0.31 10.03
2003 0.86 5.45 14.33 7.71 0.39 12.02
2004 1.53 6.79 21.83 13.57 0.98 13.73
AThis report defines resource-intensive products as SITC-0 to SITC-4 based on the SITC quintile. Capital and technology-intensive products are designated as SITC-5 and SITC-7 products, and labor-intensive products are designated as SITC-6, SITC-8 and SITC-9 products.

China Development Report on South-South Cooperation 2017
260
Export Import
R-intensive K&T-intensive L-intensive R-intensive K&T-intensive L-intensive
2005 1.86 10.48 39.94 17.65 1.18 16.16
2006 1.86 17.00 58.52 26.08 1.86 15.26
2007 2.62 32.64 91.66 44.35 1.36 23.99
2008 3.82 38.51 183.63 58.91 1.53 21.83
2009 3.15 34.25 129.30 42.32 5.72 20.73
2010 4.01 39.41 121.88 93.80 15.21 26.80
2011 4.76 51.60 129.49 167.19 16.66 26.35
2012 5.16 69.27 138.62 204.39 14.80 27.19
2013 6.25 73.82 152.34 221.71 21.22 27.40
2014 7.25 72.57 160.71 168.25 19.09 22.25
2015 6.16 58.79 110.67 111.76 18.04 20.74
2016 4.21 47.49 127.99 82.30 15.49 23.00
Source: Calculated according to the UN COMTRADE database.
From the data in Table 9.1.2-1, it can be seen that China’s overall exports to Central
Asian countries are mainly labor-intensive products, supplemented by capital and
technology-intensive products, and the export volume of capital and technology-intensive
products is increasing. China’s overall imports from Central Asian countries are mainly
resource-intensive products, and the number of capital-intensive products and labor-
intensive products is relatively small. The following is an example of Kazakhstan and
Turkmenistan to illustrate the trade product structure between China and Central Asian
countries.
Kazakhstan is one of China’s important trading partners and is the country with the
closest trade relationship between Central Asian countries and China. China’s import
and export trade with Kazakhstan is also at an evolving stage. Among China’s exports
to Kazakhstan, most of the proportion is labor-intensive and technology-intensive; in
China’s import trade from Kazakhstan, most of the proportion is resource-intensive
products, the other three types of products are relatively small.
Labor-intensive products occupy a high position in China’s trade exports to
Continued

9 South-South Cooperation between China and Central Asian Countries
261
Turkmenistan. China’s trade imports to Turkmenistan are dominated by resource-
intensive products and occupy an absolute dominant position. Turkmenistan is China’s
second largest trading partner and largest natural gas supplier in Central Asia. China’s
natural gas imports from Turkmenistan account for more than 40% of China’s total
natural gas imports and China’s natural gas imports from Turkmenistan account for 70%
of Turkmenistan’s total exports.
(3) Classified by technical level
We analyze of the technical structure of trade between China and Central Asian
countries according to technical level classification in sixth chapter. The technical
structures of export and import trade between China and Central Asian countries are
shown in Table 9.1.2-2 and Table 9.1.2-3 respectively.
From the structural classification of China’s exports to Central Asian countries,
medium and low-tech products account for China’s major share of exports to Central
Asian countries. Among them, China’s exports of low-tech products to Kyrgyzstan,
Kazakhstan and Tajikistan accounted for more than 50% of the total, and the proportion
of low-tech products exported to Kyrgyzstan was as high as 82%. For Afghan and
Turkmenistan and Uzbekistan, medium technology products are the largest in its structure.
China’s exports of high-tech products to Central Asian countries are generally low, and
the proportion of primary products and resource-based manufactured goods is lower.
Table 9.1.2-2 Export Structure by technology level in 2016
(US$ billion, %)
High-tech products
Medium-tech products
Low-tech products
Primary products
Resource products
$ % $ % $ % $ % $ %
Afghan 0.90 21 1.58 37 1.15 27 0.18 4 0.49 11
Kazakhstan 7.26 9 21.31 26 48.86 59 1.67 2 3.60 4
Kyrgyzstan 1.25 2 6.98 12 46.01 82 0.99 2 0.70 1
Tajikistan 1.16 7 4.96 29 10.14 59 0.15 1 0.83 5
Turkmenistan 0.40 12 1.95 58 0.50 15 0.15 5 0.38 11
Uzbekistan 3.48 17 9.38 47 4.49 22 0.52 3 2.15 11
Source: Calculated according to the UN COMTRADE database.
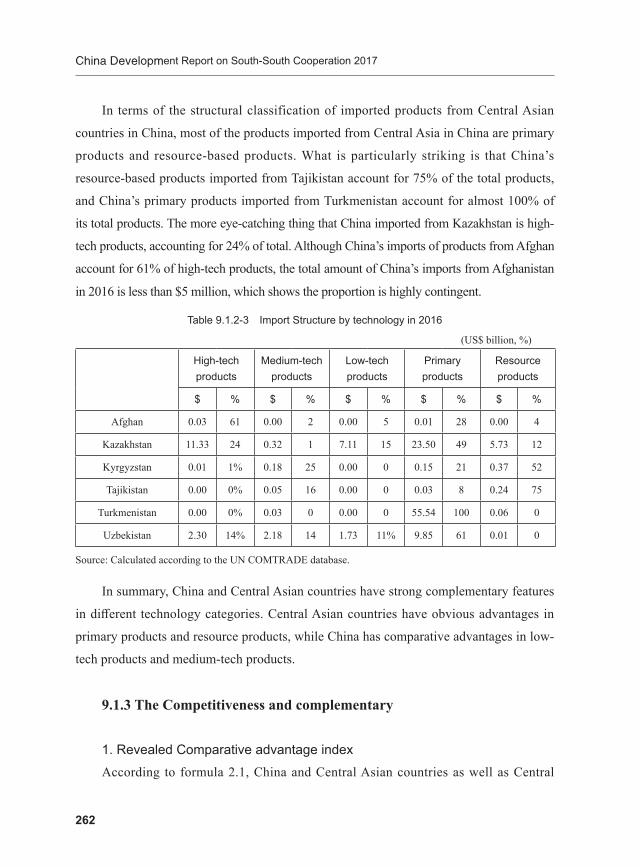
China Development Report on South-South Cooperation 2017
262
In terms of the structural classification of imported products from Central Asian
countries in China, most of the products imported from Central Asia in China are primary
products and resource-based products. What is particularly striking is that China’s
resource-based products imported from Tajikistan account for 75% of the total products,
and China’s primary products imported from Turkmenistan account for almost 100% of
its total products. The more eye-catching thing that China imported from Kazakhstan is high-
tech products, accounting for 24% of total. Although China’s imports of products from Afghan
account for 61% of high-tech products, the total amount of China’s imports from Afghanistan
in 2016 is less than $5 million, which shows the proportion is highly contingent.
Table 9.1.2-3 Import Structure by technology in 2016
(US$ billion, %)
High-tech products
Medium-tech products
Low-tech products
Primary products
Resource products
$ % $ % $ % $ % $ %
Afghan 0.03 61 0.00 2 0.00 5 0.01 28 0.00 4
Kazakhstan 11.33 24 0.32 1 7.11 15 23.50 49 5.73 12
Kyrgyzstan 0.01 1% 0.18 25 0.00 0 0.15 21 0.37 52
Tajikistan 0.00 0% 0.05 16 0.00 0 0.03 8 0.24 75
Turkmenistan 0.00 0% 0.03 0 0.00 0 55.54 100 0.06 0
Uzbekistan 2.30 14% 2.18 14 1.73 11% 9.85 61 0.01 0
Source: Calculated according to the UN COMTRADE database.
In summary, China and Central Asian countries have strong complementary features
in different technology categories. Central Asian countries have obvious advantages in
primary products and resource products, while China has comparative advantages in low-
tech products and medium-tech products.
9.1.3 The Competitiveness and complementary
1. Revealed Comparative advantage indexAccording to formula 2.1, China and Central Asian countries as well as Central
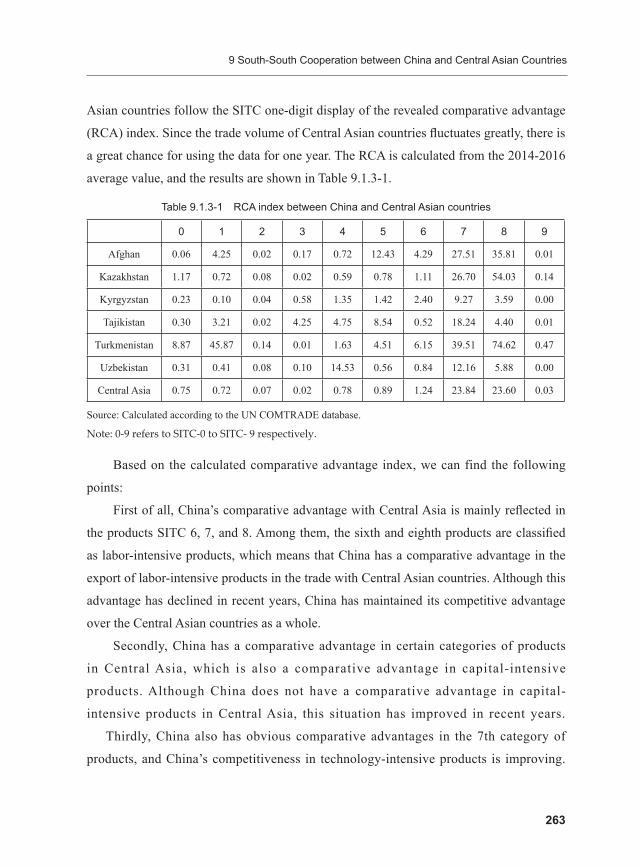
9 South-South Cooperation between China and Central Asian Countries
263
Asian countries follow the SITC one-digit display of the revealed comparative advantage
(RCA) index. Since the trade volume of Central Asian countries fluctuates greatly, there is
a great chance for using the data for one year. The RCA is calculated from the 2014-2016
average value, and the results are shown in Table 9.1.3-1.
Table 9.1.3-1 RCA index between China and Central Asian countries
0 1 2 3 4 5 6 7 8 9
Afghan 0.06 4.25 0.02 0.17 0.72 12.43 4.29 27.51 35.81 0.01
Kazakhstan 1.17 0.72 0.08 0.02 0.59 0.78 1.11 26.70 54.03 0.14
Kyrgyzstan 0.23 0.10 0.04 0.58 1.35 1.42 2.40 9.27 3.59 0.00
Tajikistan 0.30 3.21 0.02 4.25 4.75 8.54 0.52 18.24 4.40 0.01
Turkmenistan 8.87 45.87 0.14 0.01 1.63 4.51 6.15 39.51 74.62 0.47
Uzbekistan 0.31 0.41 0.08 0.10 14.53 0.56 0.84 12.16 5.88 0.00
Central Asia 0.75 0.72 0.07 0.02 0.78 0.89 1.24 23.84 23.60 0.03
Source: Calculated according to the UN COMTRADE database.
Note: 0-9 refers to SITC-0 to SITC- 9 respectively.
Based on the calculated comparative advantage index, we can find the following
points:
First of all, China’s comparative advantage with Central Asia is mainly reflected in
the products SITC 6, 7, and 8. Among them, the sixth and eighth products are classified
as labor-intensive products, which means that China has a comparative advantage in the
export of labor-intensive products in the trade with Central Asian countries. Although this
advantage has declined in recent years, China has maintained its competitive advantage
over the Central Asian countries as a whole.
Secondly, China has a comparative advantage in certain categories of products
in Central Asia, which is also a comparative advantage in capital-intensive
products. Although China does not have a comparative advantage in capital-
intensive products in Central Asia, this situation has improved in recent years.
Thirdly, China also has obvious comparative advantages in the 7th category of
products, and China’s competitiveness in technology-intensive products is improving.
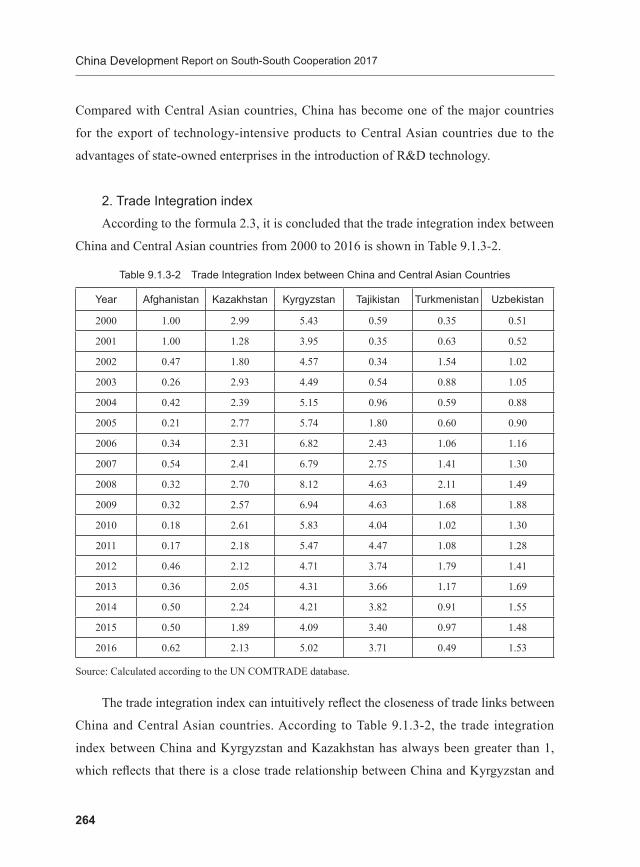
China Development Report on South-South Cooperation 2017
264
Compared with Central Asian countries, China has become one of the major countries
for the export of technology-intensive products to Central Asian countries due to the
advantages of state-owned enterprises in the introduction of R&D technology.
2. Trade Integration indexAccording to the formula 2.3, it is concluded that the trade integration index between
China and Central Asian countries from 2000 to 2016 is shown in Table 9.1.3-2.
Table 9.1.3-2 Trade Integration Index between China and Central Asian Countries
Year Afghanistan Kazakhstan Kyrgyzstan Tajikistan Turkmenistan Uzbekistan
2000 1.00 2.99 5.43 0.59 0.35 0.51
2001 1.00 1.28 3.95 0.35 0.63 0.52
2002 0.47 1.80 4.57 0.34 1.54 1.02
2003 0.26 2.93 4.49 0.54 0.88 1.05
2004 0.42 2.39 5.15 0.96 0.59 0.88
2005 0.21 2.77 5.74 1.80 0.60 0.90
2006 0.34 2.31 6.82 2.43 1.06 1.16
2007 0.54 2.41 6.79 2.75 1.41 1.30
2008 0.32 2.70 8.12 4.63 2.11 1.49
2009 0.32 2.57 6.94 4.63 1.68 1.88
2010 0.18 2.61 5.83 4.04 1.02 1.30
2011 0.17 2.18 5.47 4.47 1.08 1.28
2012 0.46 2.12 4.71 3.74 1.79 1.41
2013 0.36 2.05 4.31 3.66 1.17 1.69
2014 0.50 2.24 4.21 3.82 0.91 1.55
2015 0.50 1.89 4.09 3.40 0.97 1.48
2016 0.62 2.13 5.02 3.71 0.49 1.53
Source: Calculated according to the UN COMTRADE database.
The trade integration index can intuitively reflect the closeness of trade links between
China and Central Asian countries. According to Table 9.1.3-2, the trade integration
index between China and Kyrgyzstan and Kazakhstan has always been greater than 1,
which reflects that there is a close trade relationship between China and Kyrgyzstan and

9 South-South Cooperation between China and Central Asian Countries
265
Kazakhstan, and trade links are strong. The trade integration index between China and
Kyrgyzstan is the largest among the six Central Asian countries, which means that China
has the closest trade links with it. In addition, the trade integration index between China
and Afghan is less than one, which means that the trade relationship between China
and Afghan is not very close and there is much room for development. It is noteworthy
that the trade integration index between China and Afghan is generally strengthened,
indicating that the trade closeness between China and Afghan is gradually strengthening.
The trade integration index between China and Uzbekistan has been increasing greater
than one from less than one. From 2004 to 2009, the trade integration index has been
continuously improved, the trade links between the two countries are strengthening, and
trade relations are developing in an increasingly close direction. Although there have
been fluctuations in 2010-2016, they have remained at a level greater than 1, and the degree
of trade integration is relatively high. The change in the trade integration index between China
and Tajikistan is striking, from initially less than 1, to later reaching more than 4, and then
to stability between 3-4, with great progress, which shows the trade relationship between
Tajikistan in China is gradually strengthening, and the closeness of trade links is deepening.
3. Trade competitiveness indexCalculated according to formula 2.4 and set China as an exporter, trade
competitiveness index between China and Central Asia in 2016 as shown in Table 9.1.3-3.
Table 9.1.3-3 Trade Competitiveness Index between China and Central Asian Countries
0 1 2 3 4 5 6 7 8 9
Afghan 0.94 -1.00 -0.95 -0.49 0.27 0.98 0.97 1.00 1.00 0.90
Kazakhstan 0.55 0.90 -0.99 -0.98 -0.99 -0.56 -0.03 1.00 1.00 -0.27
Kyrgyzstan 0.94 -1.00 -0.95 -0.49 0.27 0.98 0.97 1.00 1.00 0.90
Tajikistan 0.96 -1.00 -0.84 0.05 1.00 1.00 0.98 1.00 1.00 0.81
Turkmenistan 0.99 0.00 -0.85 -1.00 1.00 0.51 0.95 1.00 1.00 0.96
Uzbekistan 0.17 -1.00 -0.89 -0.99 1.00 -0.25 0.37 0.98 1.00 0.78
Source: Calculated according to the UN COMTRADE database.
Note: 0-9 refers to SITC-0 to SITC-9 respectively.

China Development Report on South-South Cooperation 2017
266
In general, the trade competitiveness index between China and Central Asian
countries shows an obvious one-way trade in many types of products. For example,
in SITC7 and SITC8, China has a clear one-way trade for all Central Asian countries,
with almost only exports and no imports. In SITC5, SITC6 and SITC9, China has a
strong competitive advantage for most Central Asian countries. In the second and third
categories of products, Chinese products are relatively uncompetitive, which refers to
non-edible unprocessed materials, fossil fuels, lubricating oils and related substances
except fuel. With the rich oil and gas resources of Central Asian countries, China imports
a large amount of oil and gas products from some Central Asian countries. That’s why
Chinese products are relatively uncompetitive in Product 2 and 3.
9.2 Investment Relationship between China and Central Asian Countries
9.2.1 The Overall Characteristics of China’s investmentIn the process of China’s economic development, absorbing foreign direct investment
is an important driving force for China to promote economic growth and technological
progress. China has always been an important country for foreign investment. With the
further development of China’s economy, active outward-oriented direct investment has
gradually played an important role in China’s rapid economic growth. Driven by the rapid
development of overall foreign investment, China’s foreign investment in Central Asian
countries has also developed rapidly. Although China’s foreign direct investment accounts
for an increasing proportion of the world’s foreign direct investment, China’s foreign
direct investment in Central Asian countries is relatively ups and downs.
From the flow perspective, China’s direct investment in Central Asian countries has
experienced relatively large fluctuations. In 2007-2009, the proportion of China’s direct
investment flows in Central Asia to China’s all investment flows dropped from 1.42%
to 0.64%. From 2010 to 2012, it rose from 0.85% to 3.87%. But then in 2013-2016,
this proportion has dropped significantly. Even a negative value appeared in 2015. This
negative value represents the outflow of Chinese investment in Central Asian countries. In

9 South-South Cooperation between China and Central Asian Countries
267
2016, although China’s direct investment in Central Asian countries returned to a positive
value, Central Asia’s share of China’s foreign direct investment was only 0.59%.
From the stock perspective, China’s foreign direct investment in Central Asian
countries is still relatively small. China’s stock of direct investment in Central Asian
countries showed an upward trend between 2010 and 2014. Despite this, China’s share of
investment stocks in Central Asian countries is still relatively low. In 2012, Central Asian
countries accounted for the highest proportion of China’s foreign direct investment stocks,
but accounting for only 1.56%. After 2012, although China’s stock of direct investment in
Central Asian countries still fluctuates in amount, its share has been declining. This shows
that while China’s foreign direct investment continues to expand, the growth rate of direct
investment in Central Asia is less than the growth rate of overall foreign investment.
China has direct investment in all six countries, but the scale of investment is
concentrated. Judging from the country characteristics of China’s direct investment
in Central Asian countries, Kazakhstan has the largest proportion of foreign direct
investment in China.
Table 9.2.1-1 China’s Overall Direct Investment in Central Asian Countries
(US$ billion, %)
China’s OFDI flows in China’s OFDI stock in
1.Central Asia 2.The world 1/2 1.Central Asia 2.The world 1/2
2007 3.77 265.06 1.42 8.82 1179.11 0.75
2008 7.70 559.07 1.38 20.57 1839.71 1.12
2009 3.61 565.29 0.64 24.37 2457.55 0.99
2010 5.82 688.11 0.85 30.87 3172.11 0.97
2011 7.50 746.54 1.00 44.98 4247.81 1.06
2012 33.95 878.04 3.87 83.06 5319.41 1.56
2013 10.98 1078.44 1.02 93.80 6604.78 1.42
2014 5.79 1231.20 0.47 106.12 8826.42 1.20
2015 -23.29 1456.67 -1.60 85.10 10978.65 0.78
2016 10.76 1961.50 0.59 86.37 13573.90 0.67
Source: China's Foreign Direct Investment Statistics Bulletin 2015, 2016. China's Ministry of Commerce, 2017
edition of the Foreign Investment Cooperation Country (Region) Guide.

China Development Report on South-South Cooperation 2017
268
In 2016, Kazakhstan was the country that absorbed the most foreign investment
in China among Central Asian countries, accounting for 45.33% of the total investment
flows of Central Asian countries, followed by Tajikistan, Uzbekistan and Kyrgyzstan.
These countries accounted for more than 95% of China’s direct investment flows to
Central Asian countries in 2016. In 2016, China’s direct investment flows to Afghan were
small, and there was a small net outflow to Turkmenistan.
In terms of China’s stock of direct foreign investment in Central Asia, Kazakhstan
remains the country with the largest stock of Chinese investment. In 2016, China’s
investment in Kazakhstan exceeded US$5 billion, accounting for more than 60% of
China’s investment in Central Asia. China’s investment in Kazakhstan mainly includes oil
exploration and development, Kazakhstan oil company equity mergers and acquisitions,
gas station network operations, electricity, agricultural and sideline products processing,
telecommunications, leather processing, food and accommodation, and trade. At present,
China’s major projects invested in Kazakhstan include: Sino-Kazakhstan oil pipeline
project, PK project, ADM project, KAM project, Aktobe project, North Buzza project,
Ken-A Northwest pipeline project, Lihai Darhan block Project, Sinopec FIOC and
Central Asia Project, Astana Beijing Building Project, Karazhamba Oilfield Project, Sino-
Kazakhstan Uranium Mining Project, Aketao Asphalt Plant and Lutnick Hydropower
Project.
In 2016, China’s investment stocks in Tajikistan and Uzbekistan also exceeded
$1 billion. Among them, China’s main investment enterprises in Tajikistan are: Zijin
Mining, Tazhong International, Huaxin Cement, and the Haili Company established by
the Xinjiang Construction Corps in Tajikistan. It mainly involved in mining, agriculture,
telecommunications, cement and other fields. China’s investment stocks in Afghanistan,
Kyrgyzstan and Turkmenistan are relatively small, with a stock of less than US$500
million at the end of 2016.
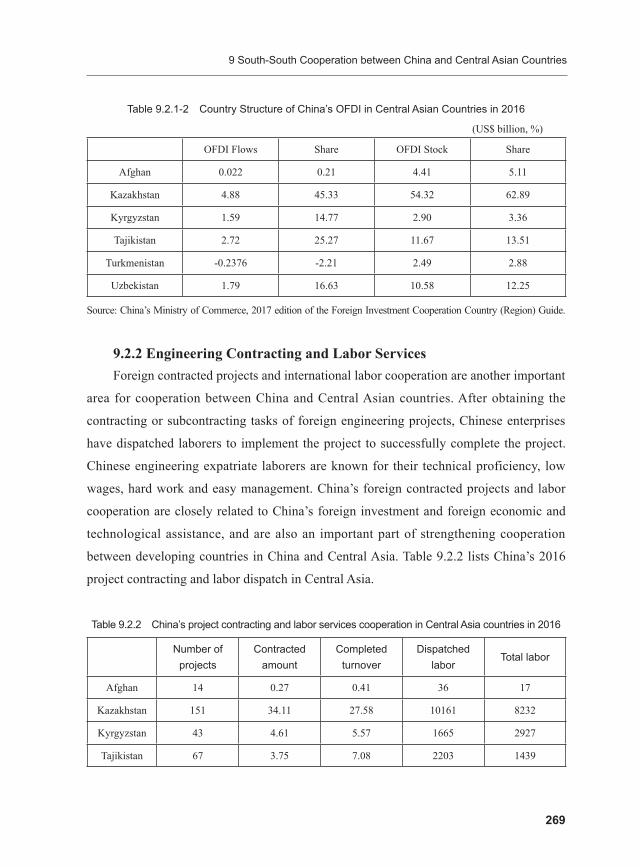
9 South-South Cooperation between China and Central Asian Countries
269
Table 9.2.1-2 Country Structure of China’s OFDI in Central Asian Countries in 2016
(US$ billion, %)
OFDI Flows Share OFDI Stock Share
Afghan 0.022 0.21 4.41 5.11
Kazakhstan 4.88 45.33 54.32 62.89
Kyrgyzstan 1.59 14.77 2.90 3.36
Tajikistan 2.72 25.27 11.67 13.51
Turkmenistan -0.2376 -2.21 2.49 2.88
Uzbekistan 1.79 16.63 10.58 12.25
Source: China’s Ministry of Commerce, 2017 edition of the Foreign Investment Cooperation Country (Region) Guide.
9.2.2 Engineering Contracting and Labor Services Foreign contracted projects and international labor cooperation are another important
area for cooperation between China and Central Asian countries. After obtaining the
contracting or subcontracting tasks of foreign engineering projects, Chinese enterprises
have dispatched laborers to implement the project to successfully complete the project.
Chinese engineering expatriate laborers are known for their technical proficiency, low
wages, hard work and easy management. China’s foreign contracted projects and labor
cooperation are closely related to China’s foreign investment and foreign economic and
technological assistance, and are also an important part of strengthening cooperation
between developing countries in China and Central Asia. Table 9.2.2 lists China’s 2016
project contracting and labor dispatch in Central Asia.
Table 9.2.2 China’s project contracting and labor services cooperation in Central Asia countries in 2016
Number of projects
Contracted amount
Completed turnover
Dispatched labor
Total labor
Afghan 14 0.27 0.41 36 17
Kazakhstan 151 34.11 27.58 10161 8232
Kyrgyzstan 43 4.61 5.57 1665 2927
Tajikistan 67 3.75 7.08 2203 1439

China Development Report on South-South Cooperation 2017
270
Number of projects
Contracted amount
Completed turnover
Dispatched labor
Total labor
Turkmenistan 666 112.4 47.80 12900 19200
Uzbekistan 29 10.64 4.91 630 2040
Source: China’s Ministry of Commerce, 2017 edition of the Foreign Investment Cooperation Country (Region) Guide.
Turkmenistan is China’s largest contracting and labor cooperation in Central Asia.
In 2016, China signed a new large-scale project contracting project in Turkmenistan
including CNPC Great Wall Drilling Engineering Co. Ltd. to undertake a Turkmenistan
logging project; China Petroleum Engineering Construction Co., Ltd. undertook the
Samangepe booster station EPCC project; Sinopec Shengli Petroleum Project Ltd.
undertakes the construction of the Turkmen Baghdarek drilling project. In addition,
Chinese companies in Turkmenistan are also actively involved in the cooperation
of important local projects, including: China National Natural Gas Pipeline Project
undertaken by China National Petroleum Corporation, local oil well repair and drilling
projects implemented by Sinopec Shengli Petroleum Administration, and China Petroleum
Technology Development Corporation exports oil and gas equipment to Turkmenistan
projects, Huawei Technologies Co. Ltd. exports logistics equipment and network facilities
renovation to Turkmenistan projects.
Kazakhstan is the second country in China for engineering contracting and labor
cooperation in Central Asia. In 2016, China’s newly signed large-scale project contracting
projects in Kazakhstan included CITIC Construction Co., Ltd. to undertake the TKU
section of the Kazakhstan Highway Reconstruction Project; China Railway Second
Bureau Group Co., Ltd. undertook the construction of the Kazakhstan Astana Light Rail
Phase I project; China Hydropower Engineering Consultant Group Co., Ltd. undertook
the construction of the Badansha 200MW wind power project in Kazakhstan.
In 2016, China signed a new large-scale contracting project in Kyrgyzstan including
China Road and Bridge Engineering Co., Ltd. to undertake the construction of the
Bishkek municipal road repair project; Xinjiang Beixin Road and Bridge Group Co., Ltd.
undertook the construction of the sixth phase of the second phase of Kyrgyzstan’s North
Continued

9 South-South Cooperation between China and Central Asian Countries
271
and South Second Road; Construction Group Henan Engineering Company undertakes
the construction of the B-section of the 2X150MW main project of Kyrgyzstan Bishkek.
China’s newly signed large-scale project contracting projects in Tajikistan include Suzhou
Sinoma Construction Co., Ltd. to construct the construction of clinker cement production
line of Moyil Cement Co., Ltd.; China Railway Fifth Bureau Group Co., Ltd. to build
the Tajikistan Central Asia road connection project; Xinjiang Beixin Road and Bridge
Group The company has undertaken the construction of the overpass intersection project
at the intersection of the 82nd district of Tajik Shanbe. China’s newly signed large-
scale engineering contracting projects in Uzbekistan include China Global Engineering
Co., Ltd. to build Uzbekistan’s Navoi polyvinyl chloride, caustic soda and methanol
production complex project; CAMCE Engineering Co., Ltd. undertook Uzbekistan’s 800-
ton flat glass production and Deep processing project; China National Technology Import
and Export Corporation undertakes the construction of Uzbekistan advanced meter
project.
9.2.3 China’s industrial park cooperation in Central AsiaChina’s cooperation parks in Kazakhstan that is under construction include the
Zhonghajin Land High-tech Industrial Park and the Kazakhstan Agricultural Products
Processing Logistics Park. There are four major sections in the Zhonghajin Land High-
tech Industrial Park. One is to set up Jinluo Group Co., Ltd. in Kazakhstan to carry
out camel industrial production and operation; the second is to establish Zhonghajin
Land Water Saving Irrigation Equipment Co., Ltd. in Kazakhstan. The existing surplus
production line of Golden Land was transferred to Kazakhstan to help it build high-
efficiency water-saving irrigation agriculture; the third was to establish Sino-Kazakh
Agricultural Science and Technology Development Co., Ltd. to provide agricultural and
agricultural machinery and technology to help Kazakhstan build a modern agricultural
industry demonstration park; fourth was an investment of $25 million to build a clean
energy project with 12 stations from Khorgos to Frankfurt. In addition, during the
second meeting between Chinese and Israeli Prime Ministers in December 2014, the two
governments reached a consensus on capacity cooperation. On August 31, 2015, the two

China Development Report on South-South Cooperation 2017
272
sides signed an intergovernmental “Framework Agreement on Strengthening Capacity
and Investment Cooperation”, which is intended to strengthen production capacity
and investment cooperation in building materials (cement, Flat glass, etc., metallurgy
(steel, etc.), nonferrous metals, oil and gas processing, chemical engineering, machinery
manufacturing, electric power, infrastructure construction (railway, highway, water
and aviation, etc.), light industry (wool processing), agricultural product processing,
transportation, tourism, food processing, consumer goods production and mutually agreed
areas.
China and Tajikistan’s capacity cooperation areas have also been continuously
expanded. The construction of cooperation zones such as Tazhong Mining Industrial
Industrial Park, Zhongtai Xinsi Road Textile Park and Henan Huangfan District
Agricultural Demonstration Park has been steadily advanced. China Road and Bridge and
Tower Aluminum are actively exploring the construction of Tajikistan National Industrial
Park." Among them, Zhongta Industrial Park was invested by Tazhong Mining and its
shareholder Tacheng International Resources Co., Ltd. The total investment of the project
is 400 million US dollars. It was signed in September 2014 under the witness of the
leaders of China and Tajikistan. The Zhongta Industrial Park was laid on April 3, 2014
in Istiklal, in the north. Zhongta Industrial Park implements the “One Park and Multi-
Zone” development plan, taking the lead-zinc mining and industrial zone as the strategic
foundation, taking the smelting industrial zone as the strategic extension, and taking the
Sogget Free Economic Zone as the strategic support, gradually establishing a number of
industrial zones in scientific layout in each state. It actively promoted the investment of
Chinese-funded enterprises into the park by attracting China’s advantageous production
capacity. Attach importance to the backbone of investment projects to support the rapid
growth of tax revenue, vigorously hatch medium-sized and small enterprises to contribute
to full employment. The resource industry (smelting) area of Zhongta Industrial Park
covers an area of 690,000 square meters. It will mainly smelt non-ferrous metals such
as lead and zinc, and combine the output by-products to extend the comprehensive
processing industry chain, involving smelting, chemical, building materials and other
industries. The Sino-Thai New Silk Road Tajikistan Agricultural Textile Industrial Park
9 South-South Cooperation between China and Central Asian Countries
273
Project is one of Tajikistan’s largest investment projects. It produces 25,000 tons of cotton
yarn and 50 million meters of cotton cloth. It will plant 200,000 mu of cotton and produce
80,000 tons of seed cotton annually. The construction period of the project is 3 years
and will be implemented in two phases. The first phase of the project includes planting
200,000 mu of cotton, 160,000 spindles and 3 ginning mills. The second phase will invest
40,000 spindles, weaving, dyeing and deep processing. After the project is completed, it
can realize annual sales income of 2 billion yuan and solve the employment of more than
3,000 local people. Ensuring food security is one of Tajikistan’s three major development
strategies, but the level and efficiency of agricultural production technology in the
country is relatively low. The agricultural cultivation model is “reap-once-a-year” and
the food demand gap is large. After more than two years of exploration, the agricultural
development company established by the Henan Province Panyu District Industrial Group
Co., Ltd. in Tajikistan has successfully carried out the wheat-corn “twice-a-year” planting
test. This will change Tajikistan’s “reap-once-a-year” agricultural planting model,
which will help solve country’s food security issue, and also lay a foundation for further
strengthening the deep agricultural cooperation between China and Tajikistan. Since
2012, the provincial Huangpan District Industrial Group Co., Ltd. has taken advantage of
the advantages of improved seed, technology, management, and agricultural machinery
to actively integrate into the national “Belt and Road” strategy, and established a research
and development company in the Tajikistan. It demonstrated the promotion of advanced
agricultural technology and upgraded the level of local planting.
The Kyrgyzstan Asia Star Agricultural Industry Cooperation Zone was established
by the Chinese company Henan Guiyou Industrial Group Co., Ltd., with a total area of 5.67
square kilometers and a construction area of 190,000 square meters. The cooperation zone
is located in Iskra Town, Chuhe District, Chuhe Prefecture. The leading industries include
agricultural planting, livestock and poultry breeding, feed processing, slaughtering and
processing, quick-frozen food, logistics and warehousing, and agricultural machinery
parts. In August 2016, the cooperation zone passed the confirmation assessment of the “Outside
Economic and Trade Cooperation Zone” of the Ministry of Commerce and the Ministry of
Finance. It is currently an agricultural industrial cooperation zone with complete industrial

China Development Report on South-South Cooperation 2017
274
chain and complete infrastructure in “the Belt and Road” Central Asia region.
Pengsheng Industrial Park, invested and built by Wenzhou Jinsheng Trading Co.,
Ltd., is located in the Syr Darya district of Syrhe State, Uzbekistan. Construction started
in 2009 and was included in the Syr Darya district of the Uzbekistan Gizak Industrial
Zone in 2013. It enjoyed the preferential policies provided by the Ukrainian government,
and was designated as provincial-level overseas industrial parks by the Zhejiang
Provincial People’s Government in 2014. In August 2016, they were rated as China’s
national-level overseas economic cooperation zones. By the end of 2016, Pengsheng
Industrial Park had invested a total of 99.4 million US dollars, and 10 Chinese enterprises
settled in the park, involving ceramics, valves, mobile phone manufacturing, enteral
farmers, leather and other fields. In 2016, the sales revenue was 96.21 million US dollars,
and the export was 34.54 million US dollars, taxing 9.5 million US dollars, creating 1156
jobs for the local.
9.3 China’s Assistance to Central Asian Countries
9.3.1 The Scale and Its Changes China’s assistance to Central Asia is subordinate to Central Asia’s overall strategy
of safeguarding national security and promoting regional stability; developing economic
and trade cooperation and promoting common prosperity; conducting energy diplomacy
and broadening energy supply channels. Under the overall strategic guidance, China’s
assistance to Central Asia can be divided into four stages: the first stage was from 1994 to
1997, China provided a small amount of unpaid assistance to build diplomatic relations
with Central Asian countries. In 1996, when Jiang Zemin visited the three countries of
Central Asia, he provided 3 million yuan of free aid and general supplies to Kazakhstan,
Uzbekistan and Kyrgyzstan. The second phase was from 1997 to 2001, China began to
gradually increase its assistance to Central Asian countries. In addition to free assistance,
China has also provided concessional loans to Central Asian countries. The third phase,
from 2001 to 2013, China began to provide various types of assistance to Central
Asian countries within the framework of the Shanghai Cooperation Organization, and

9 South-South Cooperation between China and Central Asian Countries
275
the funding for assistance has further increased. In the fourth stage, from 2013 to the
present, China’s investment and assistance to Central Asian countries began to increase
substantially under the initiative of “One Belt, One Road”.
Since 2000, with the continuous improvement of China’s economic strength,
assistance to Central Asian countries has also increased rapidly. From 2000 to 2014,
China’s Central Asian countries assisted 158 projects, and the total amount of aid was
equivalent to US$27.044 billion as constant price in 2014.
0
2
4
6
8
10
12
14
16
18
20
0
10
20
30
40
50
60
70
80
90
100
2001
2000
2002
2003
2004
2005
2006
2007
2008
2009
2010
2011
2012
2013
2014
Project Number,Right Axis Amount,100millionUSD,Left Axis
year
Figure 9.3.1 Scale of China’s assistance to Central Asian countries and the number of projects from 2000 to 2014
Source: AidData’s Chinese Official Finance to Asia Dataset, Version 1.0
Note: The US dollar price is based on 2014.
9.3.2 China’s Assistance to Central Asian Countries by SectorAccording to the following table, we can find that the most important aid for China
in Central Asia is for industry, mining and construction. From 2000 to 2014, the amount A
of assistance from China to Central Asian countries in this category is $172.22 billion,
A Aiddata’s database of foreign aid includes statistics on concessional loans, which are necessary for developing countries to improve their economic development under conditions of shortage of funds. To this end, we use Aiddata statistics here and include concessional loans in foreign aid.
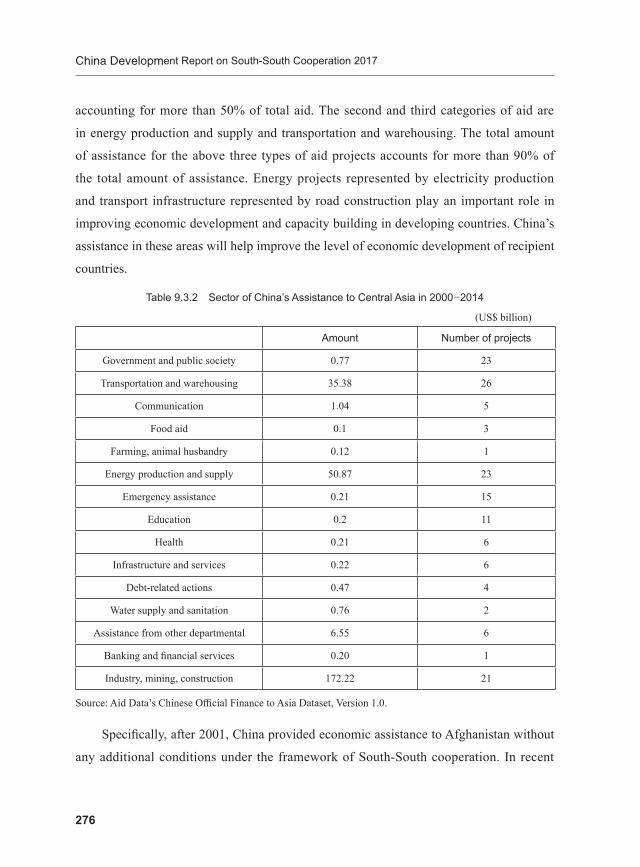
China Development Report on South-South Cooperation 2017
276
accounting for more than 50% of total aid. The second and third categories of aid are
in energy production and supply and transportation and warehousing. The total amount
of assistance for the above three types of aid projects accounts for more than 90% of
the total amount of assistance. Energy projects represented by electricity production
and transport infrastructure represented by road construction play an important role in
improving economic development and capacity building in developing countries. China’s
assistance in these areas will help improve the level of economic development of recipient
countries.
Table 9.3.2 Sector of China’s Assistance to Central Asia in 2000-2014
(US$ billion)
Amount Number of projects
Government and public society 0.77 23
Transportation and warehousing 35.38 26
Communication 1.04 5
Food aid 0.1 3
Farming, animal husbandry 0.12 1
Energy production and supply 50.87 23
Emergency assistance 0.21 15
Education 0.2 11
Health 0.21 6
Infrastructure and services 0.22 6
Debt-related actions 0.47 4
Water supply and sanitation 0.76 2
Assistance from other departmental 6.55 6
Banking and financial services 0.20 1
Industry, mining, construction 172.22 21
Source: Aid Data’s Chinese Official Finance to Asia Dataset, Version 1.0.
Specifically, after 2001, China provided economic assistance to Afghanistan without
any additional conditions under the framework of South-South cooperation. In recent

9 South-South Cooperation between China and Central Asian Countries
277
years, China’s assistance to Afghanistan has increased significantly. During President
Ghani’s visit to China in October 2014, the Chinese government announced that in 2014-
2017, China will provide 500 million yuan of unpaid assistance to Afghanistan every
year. In addition, in 2015-2019, China will train 3,000 talents for the Arab side. In March
2017, the Chinese government provided $1 million in cash assistance to Afghanistan to
provide humanitarian relief to refugees in Afghanistan.
Concessional loans are an important means for China to assist Central Asian
countries. In 2002, the Export-Import Bank of China provided 250 million yuan of export
seller credit to support the Chinese railway materials company to export four sets of oil
rigs to Turkmenistan. China also supports and helps the infrastructure sector in Central
Asia. In March 2006, the Government of Tajikistan and the Export-Import Bank of the
People’s Republic of China signed a memorandum of understanding. The Chinese side
endorsed the construction of three major planning schemes “Rolzor-Hartlon” and “South-
North” high-voltage transmission and transformation lines, as well as the construction
of Dushanbe-Bitter-Jonak highway. The project was tendered in Chinese enterprises.
The total amount of concessional loans allocated by China was US$900 million, and
Tajikistan received US$600 million. The large-scale projects aided by China in Tajikistan
are mainly in the transportation sector, with plans to build and repair transportation. In
July 2006, the Dushanbe-Chanak road repair and reconstruction project was carried out
with the Chinese government’s preferential loan. The “Dushanbe-Cenak” highway is a
major component of the Central Asian road network, with a total length of 357 km. This
project will link the north and south of the Tarim Basin and east-west channel and connect
the capital Dushanbe with the central Khujand in the north and the city of Junak on the
border of Uzbekistan. In Tajikistan, China actively assists the country in infrastructure
construction in the power sector. The main projects are: 1. “Lolazor-Hartlon” and “South-
North” high-voltage transmission line construction; 2. “Zelafushang” hydropower station
construction plan (northwest of Tajikistan, Khatlon); Construction of the “Nurabad 1”
hydropower station on the Hinghb River (Khingob (a tributary of the Vahsh River), with
a power of 350 MW and a cost of US$ 650 million; 4. At Dushanbe A thermal power
plant with a power of 200 MW/year was built with a project cost of US$400 million. The

China Development Report on South-South Cooperation 2017
278
implementation of the "Lolazol-Hartlon" project began in May 2006 and was completed
in June 2008. “Zhongte Special Electric Co., Ltd.” built a 90-kilometer 220-kV line
between Dangara and Kulyab. The total value of the project is approximately $58 million,
of which $55.1 million is for Chinese loans and $2.99 million is for the Tajik government.
China’s “Tension Electric Co., Ltd.” undertook the construction of a 350-kilometer
"South-North" transmission line. The project began in May 2006 and the Export-Import
Bank of China provided $267 million in loans. On May 15, 2009, the Tajik government
and the Export-Import Bank of China signed a loan agreement in Beijing. According
to the agreement, the Export-Import Bank of China provided Tajikistan with a loan of
US$51 million for the implementation of supplementary construction of the 500 kV
“South-North” and 220 kV “Lolazor-Hartlon” transmission lines.
In order to improve the level of agricultural production and the self-sufficiency of
food in Central Asian countries, China has carried out a large number of agricultural
technical assistance to Central Asian countries in recent years. In 2012-2016, Chinese
institutions held two training courses on crop planting techniques and one training course
on agricultural machinery technology in Tajikistan; one agricultural management and
technology seminar in Turkmenistan; and 10 selected Uzbekistan personnel participated
in the modern agricultural management training class held by China; organized training
courses on agricultural irrigation and breeding technology in Kyrgyzstan; invited 26
participants from 10 countries including Kyrgyzstan, Kazakhstan and Tajikistan to
participate in Xinjiang Tianye (Group) Co., Ltd. “2016 International Training Course on
Agricultural Efficient Water Saving Irrigation Technology”. Talent training and technical
exchange have produced good economic and social benefits for promoting the sustained
and rapid development of agriculture and rural economy in Central Asian countries.
China and Central Asian countries carry out diversified food science and technology
exchanges and cooperation, covering the exchange of germplasm resources, scientific and
technological information exchange, technology introduction, cooperative research, and
construction of agricultural information exchange network platform. The Institute of Food
Science of Xinjiang Academy of Agricultural Sciences introduced winter wheat and spring
wheat variety resources from Kazakhstan, and selected the main varieties of Xinjiang

9 South-South Cooperation between China and Central Asian Countries
279
“New Winter” and “New Spring” series; Hunan Yuanlongping Agricultural High-tech
Co., Ltd. and Uzbekistan National Rice Research Center jointly implemented The “Hybrid
Rice and Soybean Demonstration Center and the introduction of advanced hybrid rice and
soybean production technology and equipment” project; Henan and Xinjiang provinces
(regions) and other enterprises and scientific research institutions established agricultural
demonstration planting bases in Tajikistan, focusing on cooperation of carrying out good
seed trial, and promoted high-yield cultivation techniques. Cooperation in the field of
science and technology has achieved good results and played a positive role in promoting
the development of food in both countries.
9.3.3 China’s Emergency Assistance to Central Asian Countries From 2000 to 2014, China adheres to maintaining good relations with neighboring
countries, deepens mutually beneficial cooperation, and strives to make its own
development better to benefit neighboring countries. Foreign aid serves as a diplomatic
tool and serves the strategy and policy of China’s diplomacy. Central Asian countries
have always been the target of our assistance. In addition to regular assistance, emergency
assistance is also concerned. The following are emergency assistance from China to
Central Asian countries from 2000 to 2014. Among them, China has the most emergency
assistance to Afghan.
China has had several international emergency aids to Afghanstan. In July 2000,
China announced that it would provide $500,000 in humanitarian aid to Afghanistan
through the UN drought relief organization. In December 2001, China pledged to provide
30 million yuan in emergency material assistance to the Afghan interim government.
The Afghan government received a donation at the end of March 2002, indicating
that the project has been completed. As of June 2015, the project was completed in
accordance with information compiled by the United Nations Office for the Coordination
of Humanitarian Affairs (UNOCHA). In 2001, the Chinese government promised to
provide UNHCR with assistance worth one million yuan. This assistance is to help solve
the Afghan refugee problem. On August 31, 2007, Chinese Ambassador to Afghanistan
Yang Houlan signed an agreement with Afghan Deputy Minister of Refugees, Ahadi,
China Development Report on South-South Cooperation 2017
280
and China will donate 1.3 million US dollars to Afghanistan for poverty alleviation.
This assistance will cover areas such as infrastructure, education, and health care. This is
part of a $1.5 million aid program, and another part of the program is $200,000 in cash
assistance. In June 2010, China provided $250,000 worth of humanitarian assistance to
internally displaced persons and refugees in Jawzjan Province. Donated items include
food, blankets, tents and other utilities.
On June 21, 2010, China provided 22 tons of humanitarian aid to Uzbekistan,
including food, blankets, generators, mobile showers and medicines. The value of this
donation is 3 million yuan. This assistance will ease the pressure on Uzbekistan to resettle
refugees fleeing the turmoil in the Osh region of Kyrgyzstan.
On September 20, 2004, Chinese Ambassador to Tajikistan Wu Hongbin presented
humanitarian assistance to the Ministry of Emergency Situations of Tajikistan, including
tents and children’s clothing. Officials from the Tajik Emergency Department expressed
gratitude to the embassy officials for providing such unconditional assistance. The
assistance provided will be used in the event of a natural disaster. In 2012, the weather
was abnormal in the Tajikistan, the unusually heavy snow and the subsequent rapid rise
in temperature caused several avalanches and significant losses to crops and animal
husbandry. Chinese government provided Tajikistan with humanitarian assistance such
as 220 tons of rice, 120 tons of vegetable oil, tents and bed sheets to support Tajikistan in
natural disasters.
On May 20, 2003, the Chinese Embassy in Kyrgyzstan provided $50,000 in
disaster relief assistance to the Kyrgyz Red Crescent Society. The money will be used to
purchase food and other necessities for 300 families in the Sogot village of Osh Oblast.
On October 13, 2008, the Information Office of the Chinese Embassy in Bishkek stated
that the Chinese government provided $150,000 in assistance to earthquake victims in
southern Kyrgyzstan. The Chinese Embassy said in this news that we sincerely share
the pain and sorrow with the families who died in the earthquake and wish the injured
to recover as soon as possible. On June 17, 2010, in order to help Kyrgyzstan restore
stability and promote the normalization of living and work order in the southern region,
the Chinese government provided Kyrgyzstan with emergency humanitarian aid worth
9 South-South Cooperation between China and Central Asian Countries
281
5 million yuan. On June 30, 2010, China decided to provide Kyrgyzstan with a batch of
humanitarian aid worth 3 million yuan, including rice, cooking oil, biscuits, black tea,
milk powder, blankets, clothes, stationery and daily necessities. China hopes that this
aid will help Kyrgyzstan to resettle its refugees. On April 7, 2011, the two sides signed
an agreement, and China agreed to provide Kyrgyzstan with $5 million untied economic
assistance to restore the southern part of the country. On October 7, 2014, the Ministry of
Emergency Situations of Kyrgyzstan received 93,000 cubic meters of building materials.
These building materials were obtained through Chinese grants under the framework of
the Economic and Technical Cooperation Agreement signed by the Kyrgyz government
and the Chinese government on September 13, 2005. The Emergency Department
was instructed to use these materials during emergency repairs and other emergency
operations in current and immigration areas.

282
10. Belt and Road Initiative and Asian Economic Development
At present, regional cooperation in Asia has become a shining star in the context of
anti-globalization. China’s “Belt and Road Initiative”, which covers most of the countries
and regions in Asia, is of great significance for achieving regional integration and
cooperation in Asia.
10.1 Main contents of China’s “Belt and Road Initiative”
10.1.1 The Proposal of “Belt and Road Initiative” During President Xi Jinping’s visit to Kazakhstan in September 2013, he pointed
out that “in order to make economic ties closer, mutual cooperation deeper and
development space wider, we can use innovative cooperation models to jointly build the
Silk Road Economic Belt, from a point-to-area, line to sheet, and gradually form regional
integration.” A In October 2013, during a visit to Indonesia, President Xi added: “China
is willing to strengthen maritime cooperation with ASEAN countries, make good use of
the China-ASEAN Maritime Cooperation Fund established by the Chinese government,
and develop a good maritime partnership to build 21st-Century Maritime Silk Road
together.” B This indicated the initial formation of The Belt and Road Initiative. In
November 8, 2014, at the mutual connection dialogue, President Xi compared “the Belt
and Road” to the two wings of Asia’s rise. He announced that he would focus on Asian
countries and uphold the concept of “kindness, integrity, benefits and tolerance”, take
A Xi Jinping. Promoting People’s Friendship and Building the Silk Road Economic Belt Together. People’s Daily, September 8, 2013, 1st Edition.
B Xi Jinping, China is willing to work together with ASEAN countries to build the “Maritime Silk Road” in twenty-first Century, people’s network, October 3, 2013. http://politics.people.com.cn/n/2013/1003/c1001-23101127.html.
10. Belt and Road Initiative and Asian Economic Development
283
the lead in realizing the interconnection and interconnection of Asian countries. Xi also
announced that he would invest 40 billion US dollars as a Silk Road Fund to promote the
connectivity with neighboring countries, build a community of destiny with neighboring
countries, and achieve common developmentA. On March 28, 2015, the national
development and Reform Commission, the Ministry of foreign affairs and the Ministry of
Commerce jointly issued “Joining Hands to Build a Silk Road Economic Belt and a 21st-
Century Maritime Silk Road -- Vision and Actions”. The “the Belt and Road” initiative
has become a new form of mutually beneficial cooperation between Asian and European
countries. The first Belt and Road Forum for International Cooperation was launched
from May 14 to 15, 2017, which was the highest-level forum since “the Belt and Road”
raised, and is of great significance for promoting international and regional cooperation.
10.1.2 Connotation of “Belt and Road Initiative”Since its introduction, “the Belt and Road” initiative has always been adhering to the
principle of mutual benefit and win-win development, giving full play to the historical
symbolic function of the ancient Silk Road, promoting economic and trade cooperation
between China and the countries and regions along the lines, and building the political
mutual trust, economic integration, cultural inclusion community of interest, destiny and
responsibility. However, the international community still has some misunderstandings
of the “one belt and one road” construction. In 2018, people’s network expounded the
connotation of “one belt and one road” B.
1. “Belt and Road” is an open and tolerant regional cooperation initiative rather than an exclusive and closed “small circle” belong to China.
With the development of economic globalization, the world economy has become
more and more closely linked. Opening up brings progress, and closure leads to
A Xi Jinping Unicom leads development partners to focus on cooperation, people’s daily, November 9, 2014, first edition.
B Chen Jimin. Correct understanding of “one belt and one road”, people’s network, February 26, 2018 http://theory.people.com.cn/n1/2018/0226/c40531-29834263.html.
China Development Report on South-South Cooperation 2017
284
backwardness has become a regular pattern. The painful lesson of self-confidence and
arrogance is just like yesterday’s. In the face of the ever-changing world pattern, only
with a more open and tolerant attitude can China seize the opportunity in an increasingly
competitive international environment and better share its development experience with
developing countries. “the Belt and Road Initiative” is to transform the opportunities
of the world into China’s opportunities and transform China’s opportunities into the
opportunities of the world. It closely links China with the rest of the world. On the basis
of this cognition and vision, “the Belt and Road” initiative is aimed at promoting a wider,
higher level and deeper regional cooperation with development of regional economy
by establishing and strengthening partnerships of infrastructure such as transportation,
energy and network. This means that the essential feature of “the Belt and Road” is
pluralism, openness and inclusiveness.
2. “Belt and Road” is a platform for pragmatic cooperation rather than a geopolitical tool of China.
The Silk Road spirit of “peace and cooperation, openness and inclusiveness, mutual
learning and mutual benefits” is the historical wealth shared by mankind. “the Belt and
Road” is an important proposal to promote the common development of the regional
countries along the line according to the current global economic development and
the Silk Road spirit. From the very beginning, “the Belt and Road" initiative has been
insisting on equality and peace. Under this framework, all countries are equal participants
and beneficiaries, and finally formed a regional community of shared interests, rather
than the relationship between the appendages of the geopolitical factors and the vassal
relations. It means “the Belt and Road” should not and cannot be reduced to a political
contest of great powers, and will not repeat the old way of geopolitical game. On the “the
Belt and Road”, all countries can strengthen all-round exchanges and cooperation, make
full use of the comparative advantages of all countries, so as to realize the integrated
development of regional economy.
10. Belt and Road Initiative and Asian Economic Development
285
3.“Belt and Road” is a joint development initiative for sharing business and cooperation, rather than China's foreign aid plan.
As Wang Yi, Minister of foreign affairs, proposed at the thirteen session of the
National People’s Congress, “the Belt and Road” is a sunshine initiative. Planning
together, building together and benefiting together is the golden rule of promoting “the
Belt and Road”. Planning together, that is, the planning blueprint for “the Belt and
Road” plan or the specific implementation project, is being discussed by the participants
and operated transparently. building together means that none of the partners is single,
and all participate are in an equal status and jointly build. benefiting together is not the
winner take all, the strong dominate, but mutual benefit and win-win progress. Under the
framework of “the Belt and Road”, the market and enterprises are in the leading position.
The government only plays a proper role in guiding and supporting. Therefore, it is not
China’s foreign aid plan, and there is no nature of assistance.
4. “Belt and Road” is a connection and complementarity for existing systems instead of substitution.
Countries along the Belt and Road have their own resource advantages and their
economies are mutually complementary. There is obvious difference of comparative
advantage, so they have strong complementarity. For example, some countries have
abundant energy resources but insufficient development efforts, some have abundant
labor but insufficient employment, some have vast market space but weak industrial
base, and some have strong demand for infrastructure construction but lack of funds.
Since the reform and opening up, with the rapid development of China’s economy, more
and more dominant industries have accumulated considerable experience in the field of
infrastructure construction and equipment manufacturing. Therefore, China has certain
advantages in terms of capital, technology and other hard conditions, as well as personnel
and management soft conditions. This will provide a realistic need and a great opportunity
for China to carry out industrial connection and complementary advantages with other
“The Belt and Road” participants. The core content of the “one belt and one road” is to
promote infrastructure construction and interconnection, and to link up the policies and
China Development Report on South-South Cooperation 2017
286
development strategies of all countries so as to deepen pragmatic cooperation, promote
coordinated and coordinated development and achieve common prosperity. Obviously, it
is not a substitute for the existing regional cooperation system, but a complementary and
mutually reinforcing systems.
5.The construction of “Belt and Road” is a bridge to promote cultural exchanges rather than a trigger to conflicts between civilizations.
The spirit of “Silk Road” supports” the Belt and Road" initiative, enabling countries
of different races, religions and cultures to coexist peacefully and develop together. It
brings a mutual exchange of civilizations instead of a clash of civilizations. As the former
Prime Minister of France, De Villepin said, “the construction of “the Belt and Road” is
very important. It is a bridge of political, economic and cultural ties, so that people can
better communicate across national boundaries.”
10.1.3 Key Points of Cooperation on “Belt and Road”During President Xi’s state visits to Turkmenistan, Kazakhstan, Uzbekistan,
Kyrgyzstan and attending the Bishkek Summit of the Shanghai Cooperation Organization
from September 3 to 13, 2013, he proposed to strengthen the “five links”: policy
communication, facilities links, trade smoothness, financing and popular support, which
is the key point of “one belt and one road” cooperation.
1. Policy coordinationEnhancing policy coordination is an important guarantee for implementing the
Initiative. We should promote intergovernmental cooperation, build a multilevel
intergovernmental macro policy exchange and communication mechanism, expand shared
interests, enhance mutual political trust, and reach new cooperation consensus. Countries
along the Belt and Road may fully coordinate their economic development strategies
and policies, work out plans and measures for regional cooperation, negotiate to solve
cooperation-related issues, and jointly provide policy support for the implementation of
practical cooperation and large-scale projects.

10. Belt and Road Initiative and Asian Economic Development
287
2. Facilities connectivityFacilities connectivity is a priority area for implementing the Initiative. Perfect and
comprehensive infrastructure network is the basic support for closely linking countries
and realizing regional linkage development along the road. In order to realize road
Unicom, we should first promote the comprehensive development of the sea, land and
air corridors along the line, establish a unified transport coordination mechanism, equip
with specialized facilities, and gradually form a transport network connecting East, West
and South Asia, so as to facilitate international transport. Secondly, we should promote
cooperation in the connectivity of energy infrastructure, work in concert to ensure the
security of oil and gas pipelines and other transport routes, build cross-border power
supply networks and power-transmission routes, and cooperate in regional power grid
upgrading and transformation. Finally, we should jointly advance the construction of
cross-border optical cables and other communications trunk line networks, improve
international communications connectivity, and create an Information Silk Road.
3. Unimpeded tradeSmooth trade is a major task in building the Belt and Road. The population along
the belt road is more than 3 billion, and the market size and potential are unique. The
countries along the route are more complementary and competitive in the field of trade
and investment, with great potential for cooperationA. Therefore, the countries along
the route should actively explore and make appropriate arrangements on Trade and
investment facilitation, eliminate trade barriers, reduce trade and investment costs,
improve the speed and quality of regional economic cycle to achieve mutual benefit and
double win.
4. Financial integrationFinancial integration is an important underpinning for implementing the Belt and
A Li Jing, Chen Ni, Wan Guanghua and Chen Shu, “competition complementary relationship and dynamic change of goods trade along the” one belt along the road -- Based on network analysis method, “management world”, fourth issue, 2017, page 10-19.
China Development Report on South-South Cooperation 2017
288
Road Initiative. On the one hand, we should deepen financial cooperation, and make more
efforts in building a currency stability system, investment and financing system and credit
information system in Asia. We should focus on promoting the construction of the Silk
Road Fund and sub investment bank to provide financial support for the development of
the countries along the route. On the other hand, we should strengthen financial regulation
cooperation, encourage the signing of MOUs on cooperation in bilateral financial
regulation, and establish an efficient regulation coordination mechanism in the region.
5. People-to-people bondPeople-to-people bond provides the public support for implementing the
Initiative. By inheriting and carrying forward the spirit of friendship and cooperation
along the Silk Road, we can win public support for deepening bilateral and multilateral
cooperation. Specific ways of cooperation between the people include: cooperation in
running schools, strengthening tourism cooperation, strengthening information exchange
and technical cooperation.
10.1.4 Asian Developing Countries Covered by "Belt and Road"According to the Belt and Road Portal, 72 countries along the routes have signed
“Belt and Road” cooperation agreements, including 45 Asian countries. A According to the
regional division: the Asian Pacific region consists of 14 countries, including Mongolia,
South Korea, New Zealand, East Timor and 10 ASEAN countries (Singapore, Malaysia,
Thailand, Indonesia, Philippines, Brunei, Cambodia, Myanmar, Laos and Vietnam); and
the Central Asia region consists of 6 countries, including Kazakhstan, Ukraine. Zbekistan,
Turkmenistan, Tajikistan, Kyrgyzstan and Afghanistan; West Asia comprises 18 countries,
including Georgia, Azerbaijan, Armenia, Iran, Iraq, Turkey, Syria, Jordan, Lebanon,
Israel, Palestine, Saudi Arabia, Yemen, Oman, and Afghanistan The United Emirates,
Qatar, Kuwait and Bahrain; South Asia comprises seven countries, including India,
A “The Belt and Road” trade cooperation data released as of March 2018, there are 71 “Belt and Road” countries (excluding China). The 72 mentioned in this article is the addition of Austria in April 8, 2018.
10. Belt and Road Initiative and Asian Economic Development
289
Pakistan, Bangladesh, Sri Lanka, Maldives, Nepal and BhutanA. Under the "big sample",
the rest of the world are developing countries, except New Zealand and Israel. Under the
“small sample”, it is necessary to remove Korea and Singapore.
Among the 45 countries, there’re 18 countries signed the Memorandum of
understanding on “one belt and one road” including Mongolia, South Korea, New
Zealand, East Timor, Singapore, Malaysia, Burma, Laos, Tajikistan, Iran, Turkey,
Lebanon, Saudi Arabia, Pakistan, Afghanistan, Maldives and Kazakhstan. Stan, Nepal
and other 18 countries. Eight countries have signed memorandums of understanding in
some areas: Brunei, Cambodia, Uzbekistan, Kyrgyzstan, Azerbaijan, Israel, Palestine and
Bahrain. Turkmenistan, Yemen, Qatar and Kuwait are the countries that join the “one
belt and one way” in the way of government or leaders' statements or wishes. Countries
that cooperate with China in specific areas include Thailand, Indonesia, the Philippines,
Vietnam, Georgia, Armenia, Iraq, Syria, Jordan, Oman, the United Arab Emirates and
Sri Lanka. At present, only India and Bhutan have not made a clear response to whether
or not to join the “one belt and one road” initiative. Specially, from the perspective of
project cooperation, India has joined the “the Belt and Road” financing mechanism such
as the Asian infrastructure investment bank (AIB) and BRICs Development Bank, and is
now working with China, Bangladesh and Burma to jointly build the economic corridor
of Bangladesh, China and India. But at the same time, India resists even hostile towards
the “one belt and one road” initiative in the aspect of geopolitics, security and national
strategy.
10.1.5 The Significance of the “Belt and Road Initiative”
1. Conducive to promoting balanced economic development in Asian countries along the route
Asia, the largest and most populous of the seven continents, plays an important
role in the balanced development of the global economy. At present, the economic
A “The Belt and Road” trade cooperation big data report 2018.

China Development Report on South-South Cooperation 2017
290
development of Asian countries is quite different. In 2016, GDP per capita of Afghanistan
is only $561.8, while that of Qatar is as high as $59,324.3, which is nearly 106 timesA the
difference. In the slow recovery of global economic, China’s economy is “outstanding”,
creating a miracle of economic growth, accumulated a wealth of capital, technology,
experience. The implementation of the “the Belt and Road Initiative” has provided a
possibility for the developing countries in Asia to take the “free ride” of China’s economy,
and has effectively promoted the extensive development of South-South cooperation.
In addition, the “the Belt and Road Initiative” is highly consistent with the economic
development strategy in many countries, such as Indonesia’s global marine fulcrum
development plan, Kazakhstan Guangming Road Economic Development Strategy, and
Mongolia’s prairie road initiative. Therefore, a good connection between “the Belt and
Road Initiative” and the development strategy of Asian countries will help to provide a
new platform for balanced and sustainable development in the Asian region.
2. Conducive to the balance of supply and demand in the Asian region along the line
International Production Capacity Cooperation is an important area of “the Belt
and Road” construction. At present, many countries in the Asian region along “the belt
and road” are in the process of industrialization and modernization, and there is huge
demand for capacity. China’s abundant production capacity can make up for this gap.
“the Belt and Road” seeks to integrate the needs of developing countries at the early
stage of industrialization with the strong supply of China at the intermediate stage of
industrialization. By building the link of international production capacity cooperation
and basing on China’s abundant production capacity, it promotes the industrialization
transformation and upgrading of all countries along the route, builds a more complete
industry and achieve win-win resultsB.
A Data Source: World Bank Database.
B Zhang Ruiliang, “the belt and road” and the opening of the Chinese era and the Asian century. Arabia world studies, first issue, 2016, page 97-107.

10. Belt and Road Initiative and Asian Economic Development
291
3. Conducive to the improvement of infrastructure construction along the Asian region
“The Belt and Road” focuses on infrastructure construction, aiming at establishing a
comprehensive interconnected traffic network consisting of railways, highways, aviation,
navigation, oil and gas pipelines, transmission lines and communication networks,
and promoting the connectivity of Asian countries along the routeA. Most of the Asian
countries along “the belt and road” are emerging economies and developing countries.
Poor infrastructure with the small number of railways, highways, bridges, airports and
ports is one of the main constraints for economic developmentB. “the Belt and Road
initiative” has provided opportunities for the countries along the route to improve their
infrastructure. China’s advanced infrastructure capability has effectively compensated for
the shortage of Asian countries along the line.
4. Conducive to safeguarding the Geopolitical Security in the Asian region along the line
“Belt and Road initiative” is based on the principles of peaceful development
and win-win cooperation, and will take the initiative to deepen and upgrade practical
cooperation in wider areas with countries along the line. The implementation of “the Belt
and Road” initiative will place all the participating countries in an equal position, so as
to create a community of common destiny and contribute to building a common security
environment for Asia.
10.2 “Belt and Road” and productivity cooperationInternational capacity cooperation is an important form of “the Belt and Road”
cooperation. Strengthening productivity cooperation with Asian countries and regions
along “the Belt and Road” is not only an effective way to expand China’s capacity to
A Liu Xiangfeng, “Asia Pacific Regional Economic Cooperation under the initiative of “one belt and one road”, “ Asia Pacific economy”, second issue, 2018, page 5-10.
B Miu Linyan, implementing the strategy of “one belt along the road” and financial support for interconnection infrastructure construction, international engineering and services, third issue, 25-28, 2015.
China Development Report on South-South Cooperation 2017
292
expand the market, but also an important guarantee for the industrialization of developing
countries along the route. Therefore, it can be said that the capacity cooperation of
the countries along the belt and the road is the general trend, and is also a win-win
cooperation to give full play to their comparative advantages. At present, China, as a big
manufacturing country, the middle-level capacity is more abundant compared with the
high-level capacity, and has the potential of export. The output of these mid end capacity
is needed for many industrialized countries along the “one belt” in Asian regionA.
Therefore, capacity cooperation among countries along the belt and road is an inevitable
choice of supply and demand complementarity.
10.2.1 The Basic Meaning of Productivity Cooperation Capacity cooperation refers to the joint action of transnational or transregional
allocations of capacity supply and demand between two countries or regions with
willingness and need. Generally speaking, capacity cooperation is usually carried out
in two channels: either by means of product output or by means of industrial transfer.
However, the current productivity cooperation is mostly industrial transferB. At present,
the economic development level of the countries along the belt and road is uneven, and
their resources are different. However, each country has its own comparative advantages.
Therefore, it is possible to achieve mutual benefit and win-win through productive
cooperationC.
After “the Belt and Road initiative” was proposed, China’s foreign investment
grew rapidly. In 2013, China’s foreign direct investment flows amounted to US$107.84
billion, ranked third globally, and the investment stock amounted to US$660.48 billion
and global ranking eleventh. By 2016, China’s outward FDI flows had risen to $1961.5
billion, ranking second in the world, with an investment stock of $1357.39 billion,
A Wang Zhiming, “China and Kazakhstan productivity cooperation and its spillover effect” under the background of “one belt and one road”, “Northeast Asia Forum”, first issue, 2017, page 41-52.
B Xinhua website, the “one belt and one way” transnational capacity cooperation should be concentrated and be cautious, December 30, 2015. http://www.xinhuanet.com/politics/2015-12/30
C Wang Zhiming, “China and Kazakhstan productivity cooperation and its spillover effect” under the background of “one belt and one road”, “Northeast Asia Forum”, first issue, 2017, page 41-52.

10. Belt and Road Initiative and Asian Economic Development
293
ranking sixth in the worldA. Table 10.2.1 reports the specific classification of China’s
investment patterns in 2016. Among them, the non-financial investment flows accounted
for 92.4%, which shows that the non-financial investment has become the main form of
China’s foreign investment cooperation. From the perspective of investment area, Asia is
the main outflow of China’s foreign direct investment. In 2016, China’s FDI flows to Asia
amounted to $130.27 billion, accounting for 66.4% of total outward investment flows.
Table 10.2.1 the specific classification of China’s investment in 2016
(US$ billion,%)
Indexflow stock
Amount Growth rate Share Amount Share
Total 1961.5 34.7 100.0 13573.9 100.0
Financial 149.2 -38.5 7.6 1773.4 13.1
Non-financial 1812.3 49.3 92.4 11800.5 86.9
The data sources are derived from “China external statistics bulletin 2016”.
Note: Finance refers to the direct investment of domestic investors in overseas financial enterprises; non-finance
refers to the direct investment of domestic investors in overseas non-financial enterprises.
10.2.2 Main Areas of Productivity CooperationInternational capacity cooperation is an important starting point and platform for the
construction of “one belt and one way”. With the “one belt and one road” initiative, the
capacity cooperation between China and Asian countries is showing new characteristics,
from the traditional industry output to the traditional and high-end industriesB. In
May 2015, the State Council issued the Guiding Opinion on Promoting International
Cooperation in Production Capacity and Equipment Manufacturing, which calls for
“international cooperation in production capacity based on domestic advantages and
combined with local market demand”, “steel, non-ferrous metals, building materials,
railways, electric power, chemical industry, light textiles, automobiles, communications,
A Data source: China external statistics bulletin 2016.
B http://fec.mofcom.gov.cn/article/tjgjcnhz/xgzxhlj/201708/20170802623295.shtml.
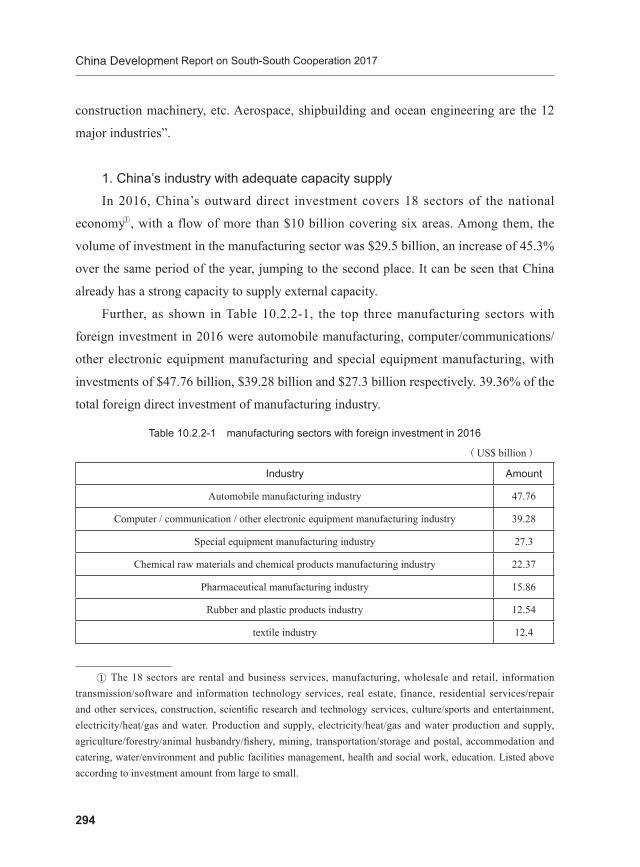
China Development Report on South-South Cooperation 2017
294
construction machinery, etc. Aerospace, shipbuilding and ocean engineering are the 12
major industries”.
1. China’s industry with adequate capacity supplyIn 2016, China’s outward direct investment covers 18 sectors of the national
economyA, with a flow of more than $10 billion covering six areas. Among them, the
volume of investment in the manufacturing sector was $29.5 billion, an increase of 45.3%
over the same period of the year, jumping to the second place. It can be seen that China
already has a strong capacity to supply external capacity.
Further, as shown in Table 10.2.2-1, the top three manufacturing sectors with
foreign investment in 2016 were automobile manufacturing, computer/communications/
other electronic equipment manufacturing and special equipment manufacturing, with
investments of $47.76 billion, $39.28 billion and $27.3 billion respectively. 39.36% of the
total foreign direct investment of manufacturing industry.
Table 10.2.2-1 manufacturing sectors with foreign investment in 2016
(US$ billion)
Industry Amount
Automobile manufacturing industry 47.76
Computer / communication / other electronic equipment manufacturing industry 39.28
Special equipment manufacturing industry 27.3
Chemical raw materials and chemical products manufacturing industry 22.37
Pharmaceutical manufacturing industry 15.86
Rubber and plastic products industry 12.54
textile industry 12.4
A The 18 sectors are rental and business services, manufacturing, wholesale and retail, information transmission/software and information technology services, real estate, finance, residential services/repair and other services, construction, scientific research and technology services, culture/sports and entertainment, electricity/heat/gas and water. Production and supply, electricity/heat/gas and water production and supply, agriculture/forestry/animal husbandry/fishery, mining, transportation/storage and postal, accommodation and catering, water/environment and public facilities management, health and social work, education. Listed above according to investment amount from large to small.

10. Belt and Road Initiative and Asian Economic Development
295
Industry Amount
manufacturing industry 12.17
Leather / fur feathers and their products and footwear industry 10.19
Railway / ship / aerospace and other equipment manufacturing industry 8.62
Food manufacturing industry 8.1
Electronic machinery and equipment manufacturing industry 6.91
Metal products industry 6.62
Nonmetallic mineral products industry 5.87
Nonferrous metal smelting and depressurized processing industry 5.59
General equipment manufacturing industry 4.43
Ferrous metal smelting and depressurized processing industry 4.29
Textile clothing / apparel industry 4.03
The data sources are derived from “China external statistics bulletin 2016”.
Note: investment in other manufacturing industries is not listed.
2. Industries with strong productivity demand along the Belt and RoadFrom the perspective of capacity demand, most of the Asian developing countries
along “the Belt and Road” are still in or will be in the process of industrialization, so
they have great demand potential. The following is a detailed analysis of China’s Asian
developing countries with the top 10 of “the belt and road” investment stock A and the top
10 of investment flows B, as shown in table 10.2.2-2. From the perspective of the demand
of Asian developing countries for foreign direct investment, the manufacturing industries
of special equipment, energy, chemical raw materials and chemicals, transportation
A Singapore, Russian Federation, Indonesia, Laos, Kazakhstan, Vietnam, United Arab Emirates, Pakistan, Myanmar, Thailand. Russian Federation is a European country and is not considered in this part. Data Sources: Ministry of Commerce, State Bureau of Statistics and State Administration of Foreign Exchange, China Foreign Direct Investment Statistics Bulletin 2016.
B Singapore, Israel, Malaysia, Indonesia, Russian Federation, Vietnam, Thailand, Pakistan, Cambodia, Kazakhstan. Russian Federation is a European country and Israel is a developed country. It is not considered in this part. Data sources: Ministry of Commerce, State Bureau of Statistics and State Administration of Foreign Exchange, China Foreign Direct Investment Statistics Bulletin 2016.
Continued

China Development Report on South-South Cooperation 2017
296
equipment, information and communication industry, metal smelting industry and food
manufacturing industry are all industries in which countries encourage foreign direct
investment, which is directly related to China. The industry structure of investment is
matched to a large extent. It can be seen that there is huge room for capacity cooperation
between China and the developing countries in Asia along the Belt and Road.
Table 10.2.2-2 Production capacity demand in Asian developing countries along the Belt and Road
Country Sector encouraged
Singapore Manufacturing industry
Indonesia Metals, oil refining, natural gas, organic basic chemistry, renewable energy and telecommunications equipment, steel industry
Laos Infrastructure construction, production of important industrial raw materials and equipment
Kazakhstan
Black metallurgy, non-ferrous metallurgy, oil refining, petrochemical, food, pesticides, industrial chemicals, transportation and accessories and engine manufacturing, petroleum refining and mining machinery and equipment manufacturing, mining machinery and equipment manufacturing, petroleum refining and mining machinery and equipment early manufacturing, building materials
Vietnam Production of machinery and equipment for construction industry, new energy industry, iron and steel industry, service agriculture, forestry and fishery.
United Arab Emirates Aerospace and new energy
Pakistan except weapons, high-strength explosives, radioactive substances, Securities printing and minting and alcohol production industries
Myanmar Construction of agricultural products processing industry, power industry, logistics industry and industrial park.
ThailandAgricultural Products Processing, Mining, Ceramics and Metals, Light Industry, Metal Products, Machinery and Transportation Tools Manufacturing, Electronics and Electrical Industry, Chemical Products, Plastics and Paper Industry
Malaysia Food processing industry, information and communication industry, biotechnology
Cambodia Agriculture and Tourism
Sources: Derived from Country (Regional) Guidelines for Foreign Investment Cooperation - Singapore,
Indonesia, Laos, Kazakhstan, Vietnam, United Arab Emirates, Pakistan, Myanmar, Thailand, Malaysia,
Cambodia.
According to table 10.2.2-1 and table 10.2.2-2, from the perspective of investment,
China can cooperate with Asian developing countries along “the belt and road” in

10. Belt and Road Initiative and Asian Economic Development
297
certain areas, including special equipment manufacturing, communication equipment
manufacturing, railway and aerospace manufacturing, chemical raw materials and
chemical products manufacturing, food manufacturing, and metal smelting.
10.2.3 The Choice of Key Countries for Productivity CooperationThe comparative advantage and economic development level of developing countries
along the belt and road are different, and the degree of cooperation with China is also
different. Therefore, China should focus on different levels of cooperation in the process
of cooperation with the countries along the route.
1.Overall choiceFirst of all, from the perspective of investment cooperation, “the belt and road
investment promotion research report” considers the economic and social development
basis of various countries along the belt, the comprehensive business operation
environment, the foundation of bilateral political and economic and trade relations, and
the response to “the belt and road” policy. Country. 17 countries in Asia are selected as
key countries, which are Singapore, Indonesia, Malaysia, Vietnam, Thailand, Brunei,
India, Sri Lanka, Kazakhstan, Turkmenistan, the United Arab Emirates, Saudi Arabia,
Qatar, Kuwait, Oman, Mongolia and Azerbaijan.
2.National characteristicsAll things considered, the choice of key countries involves cooperation between
China and other countries in all aspects, without focusing on cooperation in the field
of production capacity. Therefore, in this part, we will specifically analyze the capacity
development of the countries to be selected, and select the countries with capacity
cooperation space with China as the final choice of the key countries. As shown in table
10.2.3, it reports the pillar industries closely related to China. Generally speaking, pillar
industries are currently the key industries in a country and play an important role in the
development of its national economy. Among them, the bold part is the 12 key industries
of China’s external capacity cooperation. As can be seen from the table, there is a large

China Development Report on South-South Cooperation 2017
298
degree of matching between China and the developing countries in Asia along “the
belt and road” in the development of key industries. In particular, Indonesia, Malaysia,
Thailand, India, Kazakhstan, Saudi Arabia, Iran and other countries, all have at least five
matching industries with China. Therefore, they can serve as key countries for China to
develop international capacity cooperation. In addition, considering the diplomatic and
geographic uncertainties between China and India, India can be temporarily dismissed as
a key country.
Table 10.2.3 Pillar industries of Asian developing countries along “the Belt and Road”
Country Pillar industry
IndonesiaPetroleum and natural gas, mining, industrial manufacturing (textile, wood processing, steel, machinery, automobiles, paper, pulp, chemical, rubber processing, leather, shoes, food, beverages)
Malaysia Mining, manufacturing, electronics, petroleum, chemicals, machinery, steel, automobiles, and construction.
Vietnam Cement, automobile industry, power industry, oil and gas industry
Thailand Manufacturing (automotive assembly, electronics, plastics, textiles, food processing, toys, building materials, petrochemical), automotive industry
India Textile, Pharmaceutical, Food, Chemical, Iron and Steel, Cement, Mining, Petroleum, Machinery, Automobile, Electronic Products Manufacturing, Aerospace
Sri LankaConstruction, textile and garment, leather, food, beverage, tobacco, chemical industry, petroleum, rubber, plastics, non-metallic products processing industry, mining and quarrying industry
Kazakhstan
Mining, construction, processing industries (petroleum and chemical processing, light textile industry, household electrical appliances and automobile manufacturing, machinery and non-ferrous metal material production, tobacco, wine and food, pharmaceutical industry)
TurkmenistanIndustry (petroleum processing, chemical industry, building materials, carpet, machinery manufacturing and metal processing), oil and gas industry, electric power industry, textile industry
The United Arab Emirates
Natural gas, non-petroleum, aluminum smelting, real estate and construction, aviation, pharmaceutical, plastic, textile and clothing industries
Saudi Arabia Petroleum industry, steel industry, non-ferrous industry, building materials industry, railway industry, electric power, chemical industry, construction machinery industry
Qatar Energy, chemical, steel, building materials, telecommunications
Kuwait petrochemical industry

10. Belt and Road Initiative and Asian Economic Development
299
Oman Petroleum and natural gas, petrochemical industry, plastics industry
Mongolia Mining industry and processing industry
Azerbaijan Oil and natural gas exploitation and related industries, highways, railways, pipeline transportation
The Philippines Mining, construction, electric energy, electronics, food
Iran
Mining, Refining, Petrochemical, Iron and Steel, Electric Power, Textile, Automobile Tractor Assembly, Motorcycle Assembly, Food Processing, Building Materials, Mechanical Processing, Blankets, Household Appliances, Chemical Industry, Nonferrous Metallurgy, Papermaking, Pharmaceutical, Cement, Automobile Industry, Electronic Communication Industry
Pakistan Textile industry, leather industry, cement industry, sugar industry and fertilizer industry.
Source: Derived from Country Guidelines for Foreign Investment Cooperation - Indonesia, Malaysia, Vietnam,
Thailand, India, Sri Lanka, Kazakhstan, Turkmenistan, United Arab Emirates, Saudi Arabia, Qatar, Kuwait,
Oman, Mongolia, Azerbaijan, Philippines, Iran, Pakistan.
Note: Bold lettering is the 12 key industry of China’s external capacity cooperation.
3. SummaryConsidering the existing cooperation between China and the developing countries
in Asia along the belt and the industrial foundation of all countries, the countries with
priority cooperation include Indonesia, Malaysia, Thailand, Saudi Arabia and the
United Arab Emirates. These countries are not only countries with better investment
environment, but also countries with close trade relations with China. Therefore, they
have a good foundation for cooperation. At the same time, the pillar industries of these
countries and China’s export capacity of supply and demand are well matched, therefore,
there is a great space for cooperation. Further, countries can be expanded to more
regions, such as Vietnam, Sri Lanka, Kazakhstan, and so on. These countries have many
cooperative industrial options and good investment environment.
10.2.4 Important Policy Support for Capacity CooperationAs the commonly used international cooperation mode, productivity cooperation is
closely related to the support of national policies. At present, the capacity cooperation
under the “the Belt and Road” initiative has the following supporting measures, including
Continued

China Development Report on South-South Cooperation 2017
300
the support of specialized cooperative funds, the support of the park construction, and the
strategic connection of the national economic development policy.
1. Productivity Cooperation FundFor the sake of a better productivity cooperation between China and the developing
countries along the belt, China has set up a series of bilateral productivity cooperation
funds. According to reports, the Sino-foreign capacity Cooperation Fund has exceeded
120 billion US dollars, becoming an important channel for China to “go out” of high-
quality production capacityA. At present, there are China-Kazakhstan Productivity Fund
and China-Pakistan Expansion of Productivity Cooperation Fund which specialize in
investing in Asian developing countries. The China-Kazakhstan Productivity Fund was
registered in Beijing in December 2016 with a fund size of US$2 billion. It focuses on
supporting Sino-Kazakhstan capacity cooperation and investment projects in related
fields. The China-Pakistan Extended Capacity Cooperation Fund (EPCF) was launched
on May 30, 2007, with a scale of US$20 billion, of which China has invested US$15
billion. According to statistics, as the pioneers of national capacity cooperation, China and
Kazakhstan have formed 52 early harvest projects by August 2016, with a total amount of
27 billion US dollarsB.
2. The construction of overseas economic and trade cooperation zonesThe construction of overseas economic and trade cooperation zones can provide
effective platform support for productivity cooperation between countries. Up to now,
there are 20 overseas economic and trade cooperation zones certified by the Ministry
of Commerce in China and the countries along the belt. Half of them belong to Asian
countries, including Cambodia’s Sihanouk Port Economic Zone, Thailand’s Taizhong
Luoyong Industrial Zone, Vietnam’s Longjiang Industrial Zone, Pakistan’s Haier-Ruba
A China Securities Journal official website: productivity cooperation fund to help China’s high quality production go out, June 6, 2017 http://www.cs.com.cn/sylm/zjyl_1/201706/t20170606_5310340.html.
B Xinhua: Wang Yi: “along the way” construction has made a series of heavy early harvest, August 3, 2016. http://www.xinhuanet.com/world/2016-08/03/c_129201423.htm.

10. Belt and Road Initiative and Asian Economic Development
301
Economic Zone, Kyrgyzstan’s Asia Star Agricultural Cooperation Zone, Laos’Vientiane
Seta Comprehensive Development Zone and Uzbekistan’s Pengsheng Industrial Zone.
Industrial Park, China-Indonesia Economic and Trade Cooperation Zone, China-Indonesia
Comprehensive Industrial Park Qingshan Park and China-Indonesia Julong Agricultural
Industry Cooperation ZoneA. These zones have created a good environment for Chinese
enterprises to “go out”. It provides the developing countries along the line with high-
quality and low-cost high-end production capacity, promote their industrialization. At the
same time, through the factories built by the enterprises’ “going out”, it provides more
employment opportunities, learning opportunities, and promotes the development of local
infant enterprises.
3. Strategic connection policyThe beginning of “the Belt and Road Initiative” is to achieve cooperation on the
basis of mutual benefit and win-win results based on the needs of all countries. Therefore,
in many respects, the initiative is well connected with the development strategy of the
countries along the belt and achieves common development in cooperation. For example,
on March 23, 2016, the heads of China, Thailand, Cambodia, Laos, Myanmar and
Vietnam issued “the Joint Statement on Productivity Cooperation of Lancang-Mekong
Countries”. They hoped that under the current situation of deepening industrialization
and urbanization in various countries, they would strengthen power, power grid,
automobiles, metallurgy, building materials and supporting workers. Capacity cooperation
in the fields of industry, light industry and textile, medical equipment, information
and communication, rail transit, waterway transportation, air transport, equipment
manufacturing, renewable energy, agriculture, agricultural products and aquatic products
processing. On September 17, the same year, China and ASEAN countries issued “the
Joint Statement on China-ASEAN Capacity Cooperation”, indicating that the two
sides have obvious complementary advantages in the field of capacity cooperation, and
that capacity cooperation is the only way to accelerate the industrialization of the two
A Source: Ministry of Commerce’s official website. http://fec.mofcom.gov.cn/article/jwjmhzq/article01.shtml.
China Development Report on South-South Cooperation 2017
302
regions. In addition, on May 12, 2017, China and the United Arab Emirates signed “the
Framework Agreement between the National Development and Reform Commission of
the People’s Republic of China and the Ministry of Economy of the United Arab Emirates
on Enhancing Cooperation in Productivity and Investment”. The two sides agreed on
Strengthening cooperation in the fields of oil and gas processing, non-ferrous, building
materials, communications, renewable energy and new energy, light industrial textiles and
so on.
Statistics show that China has signed production capacity cooperation documents
with more than 30 developing countries in AsiaA, including Kazakhstan, Malaysia,
Cambodia, Laos, Mongolia, Pakistan, Azerbaijan, Indonesia, Saudi Arabia, Uzbekistan,
the United Arab Emirates and Kyrgyzstan. Strategic connection provides a system
guarantee for China’s capacity cooperation with Asian developing countries along
“the belt and road” effectively and the smooth development of multi bilateral capacity
cooperation projects along the line.
10.3 “Belt and Road” and Infrastructure CooperationThe connectivity of infrastructure is the priority development area of “the Belt and
Road Initiative” and an important foundation for unimpeded trade in all countries. Up till
now, most countries along the belt and road have problems such as weak infrastructure,
lack of capital strength and insufficient basic technical support. According to statistics,
more than 400 million people in Asia are short of electricity supply, more than 300
million people do not have access to drinking water, about 1.5 billion people do not have
access to basic sanitation facilities, and the generally backward railways, highways and
portsB. According to the latest estimates of the Asian Development Bank, the region’s
infrastructure investment needs will reach $22.6 trillion, $1.5 trillion a year, by 2030.
Considering the cost needed to tackle climate change, the investment will be up to $26
A CNR network: “one belt and one road” capacity cooperation fruitful cooperation signed with more than 30 countries, May 12, 2017. http://finance.cnr.cn/jjgd/20170513/t20170513_523753221.shtml.
B Li Xiangyang. The outstanding problems and solutions facing all sides of the area. International trade, fourth issue, 2017, page 4-9.

10. Belt and Road Initiative and Asian Economic Development
303
trillion, or $1.7 trillion a yearA. China seems to be well capitalized and have sufficient
advantages in high-end technologies such as roads, high-speed rail, aviation, nuclear
power, information and communications. Therefore, through the interconnection of "the
Belt and Road" infrastructure, we can promote the orderly flow of economic elements
along the line, efficient allocation of resources and deep market integrationB, laying a firm
foundation for the common development of the regional economy along the line.
10.3.1 Basic Meaning of “the Belt and Road” Infrastructure CooperationIn 1994, the World Bank defined the scope of infrastructure in its “World
Development Report 1994: Infrastructure for Development”. According to the report,
infrastructure refers to economic infrastructure construction, which can be divided into
three categories: public facilities, public works and other transport parts. Among them,
public facilities include electricity, telecommunications, tap water, sanitation and sewage,
solid waste collection and treatment, gas pipelines; public works include highways,
dams, irrigation and drainage channels; other transport departments include urban and
inter-urban railways, urban transport, ports and waterways, airports, and so onC. In this
report, combined with the industries in which the infrastructure is located, the above
three categories are divided into four categories: the first category is traffic infrastructure
construction, which includes other transport infrastructure and highway construction in
public works; the second category is communications infrastructure construction, that is,
telecommunications facilities in public facilities; the third category is traffic infrastructure
construction. Energy infrastructure construction, that is, gas pipeline construction in
public facilities, in addition to considering the development of natural gas and other
energy, including the construction of natural gas and oil and gas pipelines. The fourth
category is urban infrastructure construction, including power, tap water, dams, irrigation
A Li Xiangyang. The outstanding problems and solutions facing all sides of the area. International trade, fourth issue, 2017, page 4-9.
B Fan Zuojun, he Huan. “One belt and one road” national infrastructure interoperability “cut in” strategy, “world economic and political forum”, sixth issue, 2016, page 129-142.
C World Bank, Translated by Mao Xiaowei et al. World Development Report 1994: Infrastructure for Development, Beijing: China Fiscal and Economic Press, 1994.
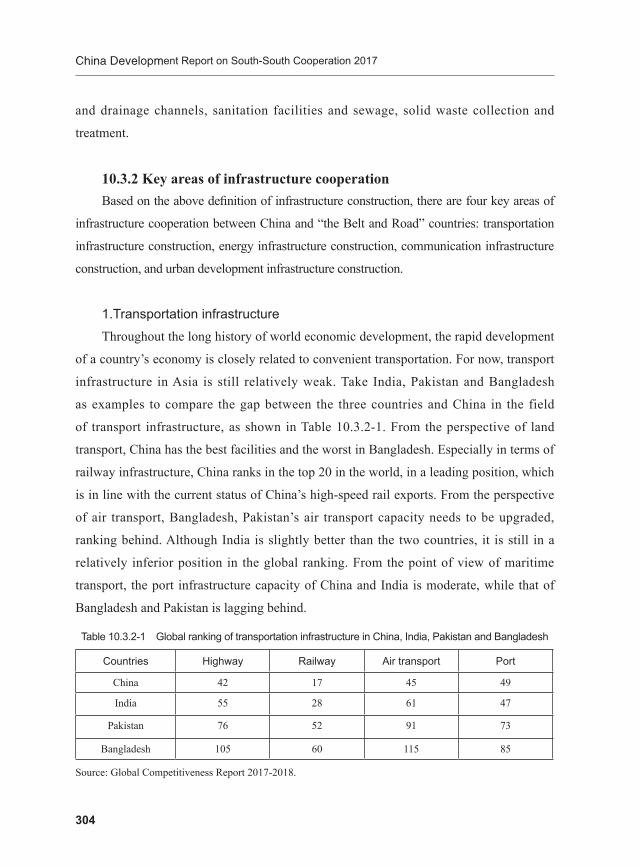
China Development Report on South-South Cooperation 2017
304
and drainage channels, sanitation facilities and sewage, solid waste collection and
treatment.
10.3.2 Key areas of infrastructure cooperationBased on the above definition of infrastructure construction, there are four key areas of
infrastructure cooperation between China and “the Belt and Road” countries: transportation
infrastructure construction, energy infrastructure construction, communication infrastructure
construction, and urban development infrastructure construction.
1.Transportation infrastructureThroughout the long history of world economic development, the rapid development
of a country’s economy is closely related to convenient transportation. For now, transport
infrastructure in Asia is still relatively weak. Take India, Pakistan and Bangladesh
as examples to compare the gap between the three countries and China in the field
of transport infrastructure, as shown in Table 10.3.2-1. From the perspective of land
transport, China has the best facilities and the worst in Bangladesh. Especially in terms of
railway infrastructure, China ranks in the top 20 in the world, in a leading position, which
is in line with the current status of China’s high-speed rail exports. From the perspective
of air transport, Bangladesh, Pakistan’s air transport capacity needs to be upgraded,
ranking behind. Although India is slightly better than the two countries, it is still in a
relatively inferior position in the global ranking. From the point of view of maritime
transport, the port infrastructure capacity of China and India is moderate, while that of
Bangladesh and Pakistan is lagging behind.
Table 10.3.2-1 Global ranking of transportation infrastructure in China, India, Pakistan and Bangladesh
Countries Highway Railway Air transport Port
China 42 17 45 49
India 55 28 61 47
Pakistan 76 52 91 73
Bangladesh 105 60 115 85
Source: Global Competitiveness Report 2017-2018.

10. Belt and Road Initiative and Asian Economic Development
305
2.Energy infrastructureMost countries in the Asian countries along “the belt and road” have abundant
resources, especially in Central Asia and Western Asia. The five Central Asian countries
have the third largest energy reserves in the world, while the Western Asian countries
are known as the “world oil treasure house”. However, although these countries have a
comparative advantage in resource reserves, most of them are facing technical difficulties
in the process of exploitation, refining and transportation. At present, China has
accumulated a certain amount of experience in the field of energy exploitation. Through
the export of technology, personnel and experience, it can promote the rapid development
of energy industry in these countries. At the same time, China’s oil and gas dependence
is relatively high. Under the initiative of “the Belt and Road”, China has strengthened
the construction of energy transmission pipelines with Asian countries, which can not
only promote the energy output of the countries along the line, but also fill the market
vacancies in China, so as to achieve a win-win situation in the energy sector between
China and the region along the line.
3.Communication infrastructureSince the beginning of 21st century, the world has entered the era of information
economy. The combination of traditional economy and Internet has become one of the
main trends of economic development. However, the communication capacity of Asian
countries along the “the Belt and Road” is uneven. As shown in table 10.3.2-2, the
Internet penetration rate in more than half of the countries is lower than that in China.
South Asian countries in particular, in 2013, the region’s average penetration rate was
13.76%, to 2016, although improved, but still far below the average level of the rest
of Asia. Pakistan, for example, ranks very low in its communications infrastructure,
seriously affecting the daily communication and normal trade between local residents.
In 2007, China Mobile acquired the Pakistani operator Baktar and renamed it Simbaco,
greatly enhancing the country’s social informatization capabilities. In addition, in order
to compensate for the technical lag in the field of satellite launching in Pakistan, China
successfully launched the Pakistan Communications Satellite 1R into orbit with the Long
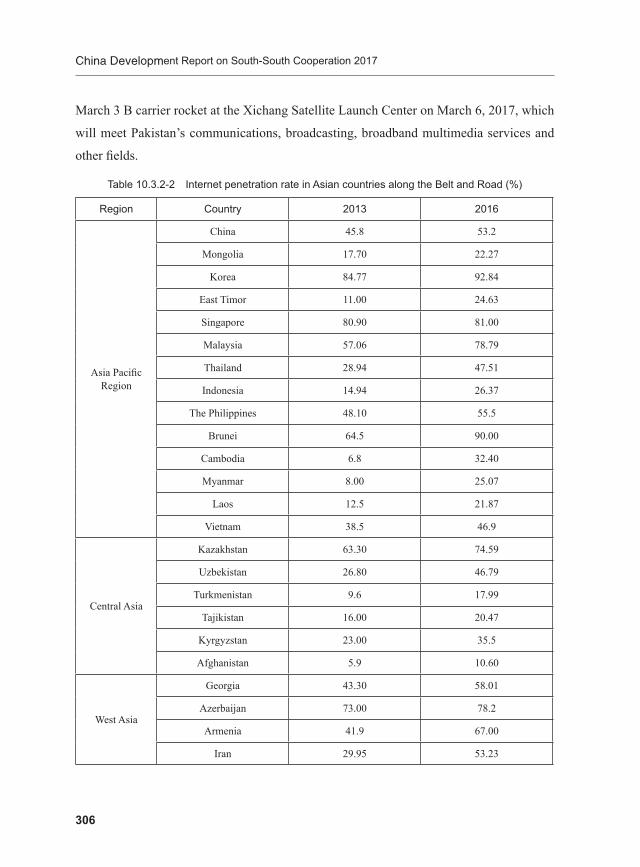
China Development Report on South-South Cooperation 2017
306
March 3 B carrier rocket at the Xichang Satellite Launch Center on March 6, 2017, which
will meet Pakistan’s communications, broadcasting, broadband multimedia services and
other fields.
Table 10.3.2-2 Internet penetration rate in Asian countries along the Belt and Road (%)
Region Country 2013 2016
Asia Pacific Region
China 45.8 53.2
Mongolia 17.70 22.27
Korea 84.77 92.84
East Timor 11.00 24.63
Singapore 80.90 81.00
Malaysia 57.06 78.79
Thailand 28.94 47.51
Indonesia 14.94 26.37
The Philippines 48.10 55.5
Brunei 64.5 90.00
Cambodia 6.8 32.40
Myanmar 8.00 25.07
Laos 12.5 21.87
Vietnam 38.5 46.9
Central Asia
Kazakhstan 63.30 74.59
Uzbekistan 26.80 46.79
Turkmenistan 9.6 17.99
Tajikistan 16.00 20.47
Kyrgyzstan 23.00 35.5
Afghanistan 5.9 10.60
West Asia
Georgia 43.30 58.01
Azerbaijan 73.00 78.2
Armenia 41.9 67.00
Iran 29.95 53.23

10. Belt and Road Initiative and Asian Economic Development
307
Region Country 2013 2016
West Asia
Iraq 9.2 21.23
Turkey 46.25 58.35
Syria 26.2 31.89
Jordan 41.4 62.30
Lebanon 70.5 76.11
Palestine 46.6 61.18
Saudi Arabia 60.5 73.75
Yemen 20.00 24.58
Oman 66.45 69.93
The United Arab Emirates 88.00 90.6
Qatar 69.00 80.32
Kuwait 75.46 78.37
Bahrain 90.00 98.00
South Asia
India 15.1 29.55
Pakistan 10.9 15.52
Bangladesh 6.63 18.25
Sri Lanka 21.9 30.05
Maldives 44.1 59.05
Nepal 13.3 16.69
Bhutan 22.4 41.77
Data source: World Bank WDI database (2017).
4. Urban development infrastructureThe level of urban development infrastructure is closely related to the level of
happiness of residents, and also closely related to the development of urban economy.
Taking electricity supply as an example, as shown in table 10.3.2-3, the electricity rate
and per capita electricity consumption of Asian developing countries along “the Belt and
Road" are shown. From the electricity rate, it can be seen from the table that there are still
Continued

China Development Report on South-South Cooperation 2017
308
15 countries in Asia which have not achieved 100% electricity rate, of which 7 countries
are in the Asia-Pacific region and 6 countries are in South Asia. From the point of view of
urban and rural areas, there are still great differences in power supply between cities and
rural areas in different countries, which is manifested by the weak construction of power
facilities in rural areas, and the rural power rate of four countries in the whole region is
less than 50%. From a single country point of view, Cambodia’s overall electricity rate
is the lowest, and the country’s overall electricity rate is less than 50%. The main reason
is that the electricity rate in rural areas is too low, ranking last in all countries. From the
perspective of power supply capability, the consumption level of countries over 1/2 is
relatively low, especially in South Asian countries. The lower the per capita consumption
level of telecommunications, indicating that the country’s power supply capacity is lower,
further reflects the lack of adequate power support in the process of industrialization in
the region, to a large extent, hindered the smooth progress of industrialization.
Table 10.3.2-3 The basic situation of electricity development in Asian developing countries along “the Belt and Road” in 2016
Region CountryElectricity
rateUrban electricity
rateRural electricity
ratePer capita electricity
consumption
Asia Pacific Region
China 100 100 100 4047
Mongolia 81.78 95.81 44.17 2064
Korea 100 100 100 10558
East Timor 63.39 91.67 49.22 —
Singapore 100 100 — 8949
Malaysia 100 100 100 4656
Thailand 100 99.88 100 2621.07
Indonesia 97.62 100 94.77 823
The Philippines 90.98 96.92 86.26 744
Brunei 100 100 100 9293
Cambodia 49.77 100 36.46 328
Myanmar 57.01 89.48 39.79 249

10. Belt and Road Initiative and Asian Economic Development
309
Region CountryElectricity
rateUrban electricity
rateRural electricity
ratePer capita electricity
consumption
Asia Pacific Region
Laos 87.10 97.38 80.34 —
Vietnam 100 100 100 1534.37
Central Asia
Kazakhstan 100 100 100 5774
Uzbekistan 100 100 100 1638.49
Turkmenistan 100 100 100 3058.8
Tajikistan 100 100 100 1547.39
Kyrgyzstan 99.99 100 99.99 1831
Afghanistan 84.14 98.04 78.96 —
West Asia
Georgia 100 100 100 2734
Azerbaijan 100 100 100 2245
Armenia 100 100 100 1901
Iran 100 100 100 2988
Iraq 100 100 100 1218
Turkey 100 100 100 2959.24
Syria 100 100 100 811.16
Jordan 100 99.99 100 2288
Lebanon 100 100 100 2861
Palestine — — — —
Saudi Arabia 100 100 100 9926
Yemen 71.64 97.34 57.69 147.36
Oman 100 100 100 6588
The United Arab Emirates 100 100 100 12915.47
Qatar 100 100 100 17460
Kuwait 100 100 100 14951
Bahrain 100 100 100 20190
Continued
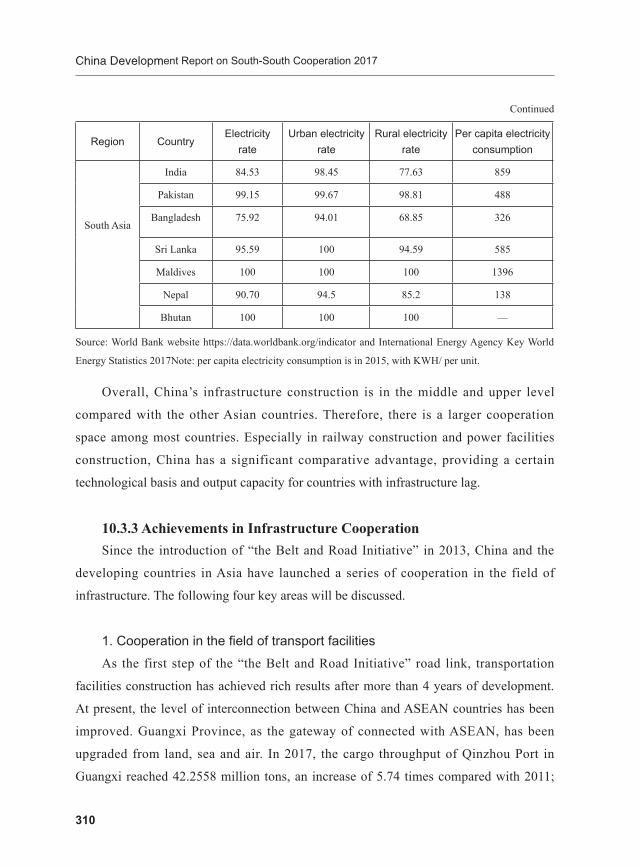
China Development Report on South-South Cooperation 2017
310
Region CountryElectricity
rateUrban electricity
rateRural electricity
ratePer capita electricity
consumption
South Asia
India 84.53 98.45 77.63 859
Pakistan 99.15 99.67 98.81 488
Bangladesh 75.92 94.01 68.85 326
Sri Lanka 95.59 100 94.59 585
Maldives 100 100 100 1396
Nepal 90.70 94.5 85.2 138
Bhutan 100 100 100 —
Source: World Bank website https://data.worldbank.org/indicator and International Energy Agency Key World
Energy Statistics 2017Note: per capita electricity consumption is in 2015, with KWH/ per unit.
Overall, China’s infrastructure construction is in the middle and upper level
compared with the other Asian countries. Therefore, there is a larger cooperation
space among most countries. Especially in railway construction and power facilities
construction, China has a significant comparative advantage, providing a certain
technological basis and output capacity for countries with infrastructure lag.
10.3.3 Achievements in Infrastructure CooperationSince the introduction of “the Belt and Road Initiative” in 2013, China and the
developing countries in Asia have launched a series of cooperation in the field of
infrastructure. The following four key areas will be discussed.
1. Cooperation in the field of transport facilitiesAs the first step of the “the Belt and Road Initiative” road link, transportation
facilities construction has achieved rich results after more than 4 years of development.
At present, the level of interconnection between China and ASEAN countries has been
improved. Guangxi Province, as the gateway of connected with ASEAN, has been
upgraded from land, sea and air. In 2017, the cargo throughput of Qinzhou Port in
Guangxi reached 42.2558 million tons, an increase of 5.74 times compared with 2011;
Continued

10. Belt and Road Initiative and Asian Economic Development
311
the container throughput reached 1.769 million standard boxes, an increase of 4.4 times,
of which the foreign trade container throughput reached 419,600 standard boxes, an
increase of 24.39 times. Up to now, the port has opened 45 container routes, covering
South Korea, Malaysia, Thailand, the United Arab Emirates and other major ports in
East Asia, Southeast Asia, South Asia and other countries and regions, and started direct
flights to Singapore Qinzhou bonded port area “daily shift” A. In addition, in October
2017, Qinhuangdao opened a South-East Asian route B, connecting the three countries
of Azerbaijani, Georgia and Turkey, the Baku-Tbilisi-Carls transnational railway in the
capital Baku opening ceremony C.
In November 2017, Vietnam’s first light rail will be officially operated by Chinese
enterprises in 2018 D. COSCO Maritime Port Limited (COSCO Maritime Port) held a
formal commencement ceremony and lease signing ceremony of COSCO Maritime Port
Abu Dhabi Terminal in Abu Dhabi Khalifa Port, United Arab Emirates, and is scheduled
to operate by the end of 2018 E. In November 2017, the longest railway tunnel in Georgia,
built by Chinese enterprises, was opened on the 19th, marking a breakthrough in the
modernization project of the Georgian railway. The completion of the project will shorten
the running time of trains from Tbilisi, the capital of Georgia, to Batumi, an important city
in the Black Sea, from more than five hours to three hours, and increase the annual freight
capacity by 100%, which is of great significance to the future economic development
A Guangxi Beibu Gulf Network: Guangxi Qinzhou Bonded Port Area: China-Singapore Interconnection Southward Passage Land-Sea Hub Port, May 30, 2018. http://www.bbw.gov.cn/Article_Show.asp?ArticleID=62501.
B Xinhua website: Qinhuangdao port opens Southeast Asia route, October 27, 2017. http://www.xinhuanet.com/photo/2017-10/27/c_1121868681.htm.
C China Belt and Road Network: Baku-Tbilisi-Carls Transnational Railway officially opened on October 31, 2017. https://www.yidaiyilu.gov.cn/xwzx/hwxw/32341.htm.
D Guangming Daily: Vietnamese people wait for China light rail, November 4, 2017. http://epaper.gmw.cn/gmrb/html/2017-11/04/nw.D110000gmrb_20171104_1-08.htm.
EXinhua website: COSCO Abu Dhabi terminal starts in November 6, 2017. http://www.xinhuanet.com/world/2017-11/06/c_129733868.htm.

China Development Report on South-South Cooperation 2017
312
of GeorgiaA. In December 2017, the opening ceremony of the first and second bidding
sections of Pakistan’s E35 Expressway, which was constructed by Gezhouba Group of
China, was held. It is expected that the entire route will benefit more than 100,000 local
people after completionB.
In December 2017, Ganzhou Port, Jiangxi Province, the first train in Afghanistan,
was opened with a total of 58 containers worth US$3.63 million. It transported such
Chinese superior products as daily necessities, power generation equipment, cables,
hardware, motorcycle accessories and children’s toysC. In December 2017, the Central
Asia (Kaiyuan - Coastal Defense) international freight train was launched. This is the first
international freight train of meter gauge in China. It will lay a firm foundation for China
Railway to carry out railway international freight business in Central AsiaD.
In December 2017, the No. 2 Wangmen Village Tunnel, which was constructed by
the Tenth Five-Year Plan Bureau of Electricity, Construction and Hydropower of China,
was successfully completed on the 12th, making it the first tunnel to be run through in the
whole line of the China-Lao Railway Project. The China-Laos Railway (Laos Section)
starts from the Sino-Laos border in the north and reaches Vientiane, the capital of Laos,
in the south. It is 414 kilometers long and designed to run at 160 kilometers per hour
according to Chinese technical standards and equipment. It is planned to open to use in
December 2021E.
A Xinhua: Chinese enterprises build the longest railway tunnel in Georgia to achieve connectivity, November 21, 2017. http://www.xinhuanet.com/photo/2017-11/21/c_1121989326.htm.
B China Belt and Road Network: The opening of Pakistan’s major transport arteries by Chinese enterprises will benefit more than 100,000 local people, December 28, 2017. ttps://www.yidaiyilu.gov.cn/xwzx/hwxw/41420.htm.
C China Belt and Road Network: Ganzhou Port, Jiangxi Province - Afghanistan First Line Opened, Full Load of 58 Containers Value 3.63 million U.S. dollars, Dec. 21, 2017. https://www.yidaiyilu.gov.cn/xwzx/dfdt/40439.htm.
D China’s regional network: Central Asia (Kaiyuan Haiphong) international freight forwarding starts in December 20, 2017. https://www.yidaiyilu.gov.cn/xwzx/gnxw/40274.htm.
E Xinhua website: the first tunnel of China Laos railway is fully connected, in December 13, 2017. http://www.xinhuanet.com/photo/2017-12/13/c_1122106920.htm.

10. Belt and Road Initiative and Asian Economic Development
313
2. Cooperation in the field of energy facilitiesThe cooperation between China and the Asian countries along “the belt and road”
is mainly concentrated in Southeast Asia, Central Asia and Western Asia. The existing
cooperation projects include: the Memorandum of Understanding on Cooperation in
the Development of Clean Energy signed by China Guangzhou Nuclear Group and
Kazakhstan National Atomic Energy CorporationA; the comprehensive refining and
chemical project of Brunei Damora Island (PMB) of Hengyi Petrochemical Company,
Zhejiang Province, with a total investment of 15 billion US dollars, implemented in two
phases. After the completion and commissioning of the project, additional crude oil will
be added. The industrial capacity will reach 22 million tonsB. China has joined hands with
Indonesia to build an “Asia-Pacific Oil and Gas Cooperation Zone” to help Indonesia
through the oil and gas adjustment period with China’s oil capital and technologyC;
Turkmenistan-China natural gas pipeline project, which is expected to deliver 25-30
billion cubic meters of natural gas annually from Turkmenistan to China, has enabled
China to implement the project. Direct investment in the tower economy exceeds US$3
billionD.
3. Cooperation in the field of communication facilitiesIn order to keep pace with the information age, China’s cooperation with the
communication facilities along the “one belt” along the Asian countries is also in full
swing. In September 2014, China and the 10 ASEAN countries reached an initiative
to jointly build the China-ASEAN Information Port, aiming to turn the China-ASEAN
Information Port into an information hub for building the 21st century “Maritime Silk
A Wang Lu, China Guangdong Nuclear and other Kazakhstan to promote the “one belt” strategy aimed at energy infrastructure, economic reference daily, May 15, 2015.
B Xinhua: Brunei’s largest Chinese capital project will be completed by the end of 2018, January 3, 2018. http://www.xinhuanet.com/overseas/2018-01/03/c_129781834.htm.
C Li Xinmin, China and Indonesia Build “Asia-Pacific Oil and Gas Cooperation Zone”, Economic Reference, January 24, 2018.
D Ministry of Commerce website: Foreign media reported that Turkmenistan’s natural gas pipeline to China via Tajikistan was completed in 2016, October 22, 2014.

China Development Report on South-South Cooperation 2017
314
Road” and an important platform for building a China-ASEAN destiny communityA. In
January 2018, China Telecom Group and Nepal Telecom held a cross-border optical cable
opening ceremony, marking the formal access of Nepal to the Internet through China’s
linesB, will change the Nepal’s Unstable network, high fees and other issues.
4. Cooperation in hydropower facilitiesChina and the Asian countries along “the belt and road” have many cooperation in
the field of hydropower, covering many sections, such as hydroelectric power generation,
traditional energy generation, and new energy power generation. At present, IndonesiaC,
VietnamD, LaosE, TurkeyF, BangladeshG, TajikistanH, MyanmarI, PakistanJ and other
countries that cooperate with China in the field of electricity have solved the problem
of electricity consumption for residents and industrial development in these countries
to a great extent. Countries that involved in the cooperation of water resources are more
A Xinhua website: the construction of China ASEAN Information Port promotes the “one belt and one road" to take root in September 16, 2015.
B Yuan Jirong, China and Nepal cross border Internet optical cable was officially opened, people’s daily, January 15, 2018.
C China Belt and Road Network: Indonesian Coal-fired Power Stations Contracted by Chinese Enterprises Operated ahead of schedule, won the Excellent Performance Award from the Owners, December 30, 2017. https://www.yidaiyilu.gov.cn/xwzx/hwxw/41798.htm.
D Ministry of Commerce Website: The First Unit of Vietnam Yongxin BOT Power Plant Project Invested by Chinese Enterprises to Fully Power Generation, May 3, 2018. http://www.mofcom.gov.cn/article/i/jyjl/j/201805/20180502739179.shtml.
E China energy construction company: China can build Gezhouba Group contracted Laos Nanjian Hydropower Station two units through trial operation, February 24, 2018. http://www.ceec.net.cn/art/2018/2/24/art_11019_1584907.html.
F Xinhua website: Sino Turkish cooperation natural soda processing and supporting power station project put into operation in January 18, 2018. http://www.xinhuanet.com/energy/2018-01/17/c_1122269306.htm.
G Xinhua website: Asian investment bank financing to help Bangladesh new rural millions of meters, January 22, 2018. http://www.xinhuanet.com/overseas/2018-01/22/c_129796228.htm.
H Li Man, Zhou Hanbo, Xie Yahong and so on, “project of the people’s heart brings warmth and brightness”. People’s Daily, April 30, 2018.
I Sun Guangyong, “Chinese friend, let us light up here”, people’s daily, April 17, 2018.
J Ding Xuezhen, Chinese Enterprises Contracting to Connect Power Generation of Pakistan Hydropower Station Project, People’s Daily, April 14, 2018.

10. Belt and Road Initiative and Asian Economic Development
315
concentrated in Africa, such as Nigeria.
10.3.4 Exploration on Infrastructure Cooperation ModeAt present, the lack of long-term financial support is one of the main problems faced
by “the Belt and Road” countries in the process of infrastructure construction. Although
there are financing channels such as the Asian infrastructure investment bank and the Silk
Road Fund, there is still a certain gap compared with the funding gap of infrastructure
development in the developing countries along the line. Therefore, we should actively
innovate the investment and financing mechanism and encourage private capital to join
in the early development of infrastructure construction to make up for the shortage of
funds in the construction process. At the policy level, China has made some attempts, for
example, the Ministry of Finance has set up a PPP financing support fund of 180 billion
yuanA, the Development and Reform Commission jointly with the Ministry of Finance
has issued “the Notice on Government Investment Supporting Social Investment Projects
(Development and Reform Investment [2015] 823)”, and the United Banking Regulatory
Commission and the Insurance Regulatory Commission have issued “the Notice on
Banking Support. Guiding Opinions on Major Engineering Construction in Key Areas
(Banking Regulatory Commission No. 43, 2015)” and “Guiding Opinions on Matters
Related to Insurance Industry Supporting Major Engineering Construction (No. 2179,
Development and Reform Investment, 2015)” promote the development of PPP model
from the aspects of government investment, development finance, commercial banks
and insurance institutions. At the practical level, we should further speed up the platform
construction, improve the contract system construction, improve the reasonable risk
sharing mechanism, and attract more funds into the infrastructure construction along “the
Belt and Road”.
A Xinhua website: Vice Minister of Finance: China will set up a PPP financing support fund with a total scale of 180 billion yuan, December 21, 2015. http://www.xinhuanet.com/finance/2015-12/21/c_128551873.htm.

China Development Report on South-South Cooperation 2017
316
10.4 The Opportunities and challengesThe proposal of “the Belt and Road Initiative” has injected fresh blood into the
economic development of Asia and provided a new way for regional coordinated
development. The construction of “the Belt and Road” has fully considered the interests
and endowments of all countries, and there is huge room for development. However, in
the process of gaming, friction and conflict are inevitable, and they bring challenges to
the development of “the Belt and Road”.
10.4.1 Opportunities
1. Promoting win-win cooperation among developing “The Belt and Road Initiative” is based on equality and development, creating a
good environment for win-win cooperation among developing countries along the route.
Although the rules of trade globalization advocated by developed countries can also
provide opportunities for the development of developing countries along the line, the
high-end norms have always been firmly in the hands of developed countries, and cannot
bring about substantial changes in the poverty and backwardness of less developed
countries. As of 2015, there were 44 UN least developed countries in the United Nations,
of which 9 were in Asia, namely Afghanistan, Bangladesh, Bhutan, Laos, Kampuchea,
East Timor, Burma, Nepal and Yemen, all of which belong to the “the Belt and Road”. “The
Belt and Road Initiative” focuses on infrastructure construction and supports China’s
economic development through the export of China’s rich production capacity and
advanced technology. Therefore, “the Belt and Road Initiative” provides a possibility for
the countries along the line to ride the “free ride” of China’s economic development, and
can promote the win-win development of the countries along the line.
2. Asia is in urgent need of new industrial layout.Since joining WTO, China has become the preferred place for manufacturing
industry transfer in developed countries by means of cheap labor force and vast market,

10. Belt and Road Initiative and Asian Economic Development
317
and gradually established the status of world factory. However, with the disappearance
of China’s demographic dividend, the domestic labor costs are rising, and the traditional
production advantages are gradually weakening. It is urgent to optimize the economic
growth mechanism through industrial upgrading. At the same time, most of the
developing countries in Asia are in a critical period of industrialization development, and
need to diversify their domestic superior industries by importing capacity to improve the
overall stability of the industry. It can be said that the shift of the world factory in Asia
is the inevitable trend of building a new pattern of Asian industry in the new era, which
coincides with the direction of the development of “the Belt and Road Initiative”.
10.4.2 Challenges
1. Complex geopolitical risks“The Belt and Road” covers all developing countries in Asia except North Korea,
including the entire Asian plate, and the intricate geopolitical environment has brought
some risks to the smooth development of the initiative. In particular, Central Asia and
Southeast Asia are hot spots in the world. The conflict between some countries and
regions caused by religious, cultural and historical factors will have a negative impact
on all aspects of the construction of “the Belt and Road”. For example, the strong
opposition of India in South Asia to the Sino Pakistani economic corridor, the Palestinian
Israeli territorial dispute in Western Asia, the civil war in Syria, the dispute between the
central region of Kyrgyzstan and the enclave between Tajikistan and Uzbekistan have all
restricted the development of the “the Belt and Road” construction.
2. Expanding investment and trade risksThe problem of weak infrastructure and weak industrial structure in developing
countries in Asia along “the belt and road” has made the uncertainty of foreign direct
investment and trade increasing. According to the latest risk monitoring and research
results released by China Export and Credit Insurance Corp, the overall risk level of the
countries along “the Belt and Road” is relatively high. The risk rating from low to high

China Development Report on South-South Cooperation 2017
318
level 1 to 9 shows that the average value of these countries is 5.54A. Among them, the
countries with 5 risk level in Asia are Vietnam and Iran, with a risk of 6. Bangladesh,
Pakistan, Myanmar, Cambodia, and Laos and Sri Lanka are the countries at riskB. The
increase of investment and trade risks in the countries along the route restricts the input of
capital and technology to a certain extent, and has a negative impact on the growth of the
national economy.
3. Lack of stable and long-term financial support mechanismAt present, the most urgent need for Asian developing countries along the belt and
road is to improve their national infrastructure. However, infrastructure construction is
facing the problems of large investment, long payback period and large investment risk,
and is not favored by investors. Although China has invested huge capital costs in the
construction of “the Belt and Road”, it is a drop in the bucket compared to the whole
project. Therefore, the lack of stable and long-term financial support mechanism is one of
the great challenges in the construction of “the Belt and Road”.
A Wang Yiwei, opportunities and challenges of “one belt and one road": Beijing: People’s publishing house, 2015.
B Report on facilitation of country investment and operation (2016)
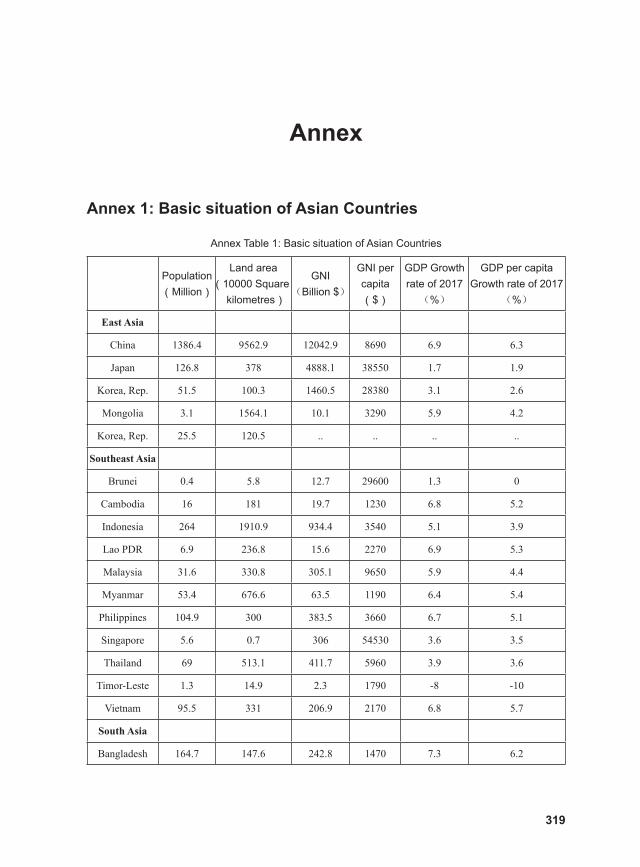
319
Annex
Annex 1: Basic situation of Asian Countries
Annex Table 1: Basic situation of Asian Countries
Population(Million)
Land area(10000 Square
kilometres)
GNI(Billion $)
GNI per capita($)
GDP Growth rate of 2017
(%)
GDP per capita Growth rate of 2017
(%)
East Asia
China 1386.4 9562.9 12042.9 8690 6.9 6.3
Japan 126.8 378 4888.1 38550 1.7 1.9
Korea, Rep. 51.5 100.3 1460.5 28380 3.1 2.6
Mongolia 3.1 1564.1 10.1 3290 5.9 4.2
Korea, Rep. 25.5 120.5 .. .. .. ..
Southeast Asia
Brunei 0.4 5.8 12.7 29600 1.3 0
Cambodia 16 181 19.7 1230 6.8 5.2
Indonesia 264 1910.9 934.4 3540 5.1 3.9
Lao PDR 6.9 236.8 15.6 2270 6.9 5.3
Malaysia 31.6 330.8 305.1 9650 5.9 4.4
Myanmar 53.4 676.6 63.5 1190 6.4 5.4
Philippines 104.9 300 383.5 3660 6.7 5.1
Singapore 5.6 0.7 306 54530 3.6 3.5
Thailand 69 513.1 411.7 5960 3.9 3.6
Timor-Leste 1.3 14.9 2.3 1790 -8 -10
Vietnam 95.5 331 206.9 2170 6.8 5.7
South Asia
Bangladesh 164.7 147.6 242.8 1470 7.3 6.2

China Development Report on South-South Cooperation 2017
320
Population(Million)
Land area(10000 Square
kilometres)
GNI(Billion $)
GNI per capita($)
GDP Growth rate of 2017
(%)
GDP per capita Growth rate of 2017
(%)
Bhutan 0.8 38.4 2.2 2720 6.8 5.5
India 1339.2 3287.3 2430.8 1820 6.6 5.4
Maldives 0.4 0.3 4.2 9570 8.8 6.7
Nepal 29.3 147.2 23.3 790 7.5 6.3
Pakistan 197 796.1 311.7 1580 5.7 3.7
Sri Lanka 21.4 65.6 82.4 3840 3.1 2
West Asia
Armenia 2.9 29.7 11.7 4000 7.5 7.3
Azerbaijan 9.9 86.6 40.2 4080 0.1 -1
Bahrain 1.5 0.8 30.2 20240 3.9 -0.8
Cyprus 1.2 9.3 20.4 23720 3.9 3.1
Georgia 3.7 69.7 14.1 3790 5 5
Iran 81.2 1745.2 438.4 5400 4.3 3.2
Iraq 38.3 435.1 182.6 4770 -0.8 -3.6
Israel 8.7 22.1 324.7 37270 3.3 1.4
Jordan 9.7 89.3 38.7 3980 2 -0.6
Kuwait 4.1 17.8 130 31430 -2.9 -4.8
Lebanon 6.1 10.5 50.5 8310 2 0.8
Oman 4.6 309.5 66.9 14440 -0.3 -4.8
Qatar 2.6 11.6 161.2 61070 1.6 -1.1
Saudi Arabia 32.9 2149.7 661.5 20080 -0.7 -2.7
Syrian Arab Republic 18.3 185.2 .. .. .. ..
Turkey 80.7 785.4 882.9 10930 7.4 5.8
United Arab Emirates 9.4 83.6 367.8 39130 0.8 -0.6
Yemen 28.3 528 28.3 1030 -34.3 -35.9
Continued

Annex
321
Population(Million)
Land area(10000 Square
kilometres)
GNI(Billion $)
GNI per capita($)
GDP Growth rate of 2017
(%)
GDP per capita Growth rate of 2017
(%)
Middle Asia
Afghanistan 35.5 652.9 20.2 570 2.6 0.1
Kazakhstan 18 2724.9 142.3 7890 4 2.6
Kyrgyz Republic 6.2 199.9 7 1130 4.6 2.5
Tajikistan 8.9 141.4 8.8 990 7.1 4.9
Turkmenistan 5.8 488.1 38.3 6650 6.5 4.7
Uzbekistan 32.4 447.4 64.2 1980 5.3 3.5
Source: World Bank, World Development Indicators. http://wdi.worldbank.org/tables
Annex 2: Classification of Asian Countries by incomeThe World Bank assigns the world’s economies into four income groups — high,
upper-middle, lower-middle, and low. World Bank bases this assignment on GNI per
capita.
Low-income economies (6), GNI per capita < 995USD
Afghanistan; Korea, Dem. People’s Rep.; Syrian Arab Republic; Tajikistan; Nepal;
Yemen.
Lower-middle income economies (16), GNI per capita 996-3895USD
Indonesia; Bangladesh; Philippines; Bhutan; Kyrgyz Republic; Sri Lanka;
Cambodia; Lao PDR; Timor-Leste; Mongolia; Uzbekistan; Myanmar; Vietnam; Georgia;
India; Pakistan.
Upper-middle income economies (13), GNI per capita 3896-12055USD
Armenia; Azerbaijan; Iran, Islamic Rep.; Iraq; Jordan; Kazakhstan; Lebanon; China;
Thailand; Malaysia; Maldives; Turkey; Turkmenistan.
High-income economies (12), GNI per capita >12055USD
Oman; Qatar; Bahrain; Saudi Arabia; Israel; Singapore; Korea, Rep.; Kuwait;
Cyprus; United Arab Emirates; Japan; ;Brunei Darussalam.
Continued

China Development Report on South-South Cooperation 2017
322
Annex 3: Global Competitiveness of Asian Countries
Annex Table 2. The Global Competitiveness Index and Rankings of Asian Countries
2017 2014 2010
Ranking Score Ranking Score Ranking Score
Singapore 3 5.71 2 5.65 3 5.48
Japan 9 5.49 6 5.47 6 5.37
Israel 16 5.31 27 4.95 24 4.91
United Arab Emirates 17 5.30 12 5.33 25 4.89
Malaysia 23 5.17 20 5.16 26 4.88
Qatar 25 5.11 16 5.24 17 5.10
Korea, Rep. 26 5.07 26 4.96 22 4.93
China 27 5.00 28 4.89 27 4.84
Saudi Arabia 30 4.83 24 5.06 21 4.95
Thailand 32 4.72 31 4.66 38 4.51
Azerbaijan 35 4.69 38 4.53 57 4.29
Indonesia 36 4.68 34 4.57 44 4.43
India 40 4.59 71 4.21 51 4.33
Bahrain 44 4.54 44 4.48 37 4.54
Brunei 46 4.52 - - 28 4.75
Kuwait 52 4.43 40 4.51 35 4.59
Turkey 53 4.42 45 4.46 61 4.25
Vietnam 55 4.36 68 4.23 59 4.27
Philippines 56 4.35 52 4.40 85 3.96
Kazakhstan 57 4.35 50 4.42 72 4.12
Oman 62 4.31 46 4.46 34 4.61
Cyprus 64 4.30 58 4.31 40 4.50
Jordan 65 4.30 64 4.25 65 4.21
Georgia 67 4.28 69 4.22 93 3.86
Iran 69 4.27 83 4.03 69 4.14
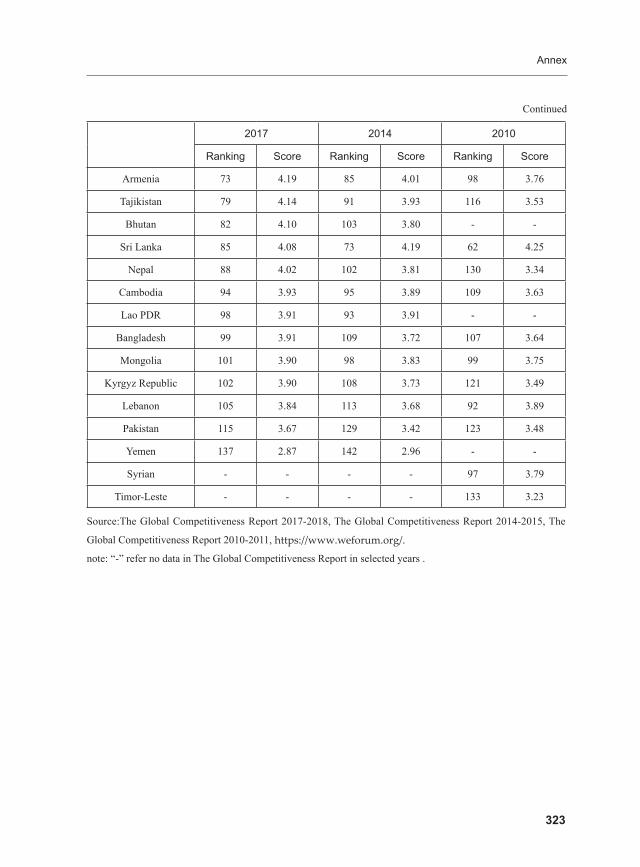
Annex
323
2017 2014 2010
Ranking Score Ranking Score Ranking Score
Armenia 73 4.19 85 4.01 98 3.76
Tajikistan 79 4.14 91 3.93 116 3.53
Bhutan 82 4.10 103 3.80 - -
Sri Lanka 85 4.08 73 4.19 62 4.25
Nepal 88 4.02 102 3.81 130 3.34
Cambodia 94 3.93 95 3.89 109 3.63
Lao PDR 98 3.91 93 3.91 - -
Bangladesh 99 3.91 109 3.72 107 3.64
Mongolia 101 3.90 98 3.83 99 3.75
Kyrgyz Republic 102 3.90 108 3.73 121 3.49
Lebanon 105 3.84 113 3.68 92 3.89
Pakistan 115 3.67 129 3.42 123 3.48
Yemen 137 2.87 142 2.96 - -
Syrian - - - - 97 3.79
Timor-Leste - - - - 133 3.23
Source:The Global Competitiveness Report 2017-2018, The Global Competitiveness Report 2014-2015, The
Global Competitiveness Report 2010-2011, https://www.weforum.org/.
note: “-” refer no data in The Global Competitiveness Report in selected years .
Continued

China Development Report on South-South Cooperation 2017
324
Annex 4: Import and export of Asian countries with G7 and China
1. AfghanistanExport to G7 and China
(million USD)
Year Unit France German Italy Canada Japan UK USA G7 total China Total Export
2000Amount 0.03 2.19 0.00 0.00 0.22 16.10 0.07 18.60 4.83 149.42
% 0.02 1.46 0.00 0.00 0.14 10.77 0.05 12.45 3.23 100.00
2005Amount 0.03 1.44 0.00 0.00 1.25 1.11 1.66 5.49 1.32 184.63
% 0.02 0.78 0.00 0.00 0.68 0.60 0.90 2.97 0.72 100.00
2010Amount 0.26 1.88 0.55 0.48 0.31 2.05 3.66 9.20 11.69 396.39
% 0.07 0.48 0.14 0.12 0.08 0.52 0.92 2.32 2.95 100.00
2015Amount 0.25 5.68 2.38 0.77 0.01 0.52 2.71 12.32 10.15 581.61
% 0.04 0.98 0.41 0.13 0.00 0.09 0.47 2.12 1.75 100.00
2016Amount 1.41 4.41 0.14 0.61 0.08 1.69 1.31 9.64 4.75 615.02
% 0.23 0.72 0.02 0.10 0.01 0.27 0.21 1.57 0.77 100.00
2017Amount 0.62 3.98 0.19 0.57 0.05 1.26 0.57 7.23 3.42 851.78
% 0.07 0.47 0.02 0.07 0.01 0.15 0.07 0.85 0.40 100.00
Import from G7 and China
(million USD)
Year Unit France German Italy Canada Japan UK USA G7 total China Total Import
2000Amount 0.33 5.60 0.09 0.12 250.11 0.40 0.42 257.08 52.97 517.59
% 0.06 1.08 0.02 0.02 48.32 0.08 0.08 49.67 10.23 100.00
2005Amount 1.82 53.23 2.26 26.05 275.08 2.02 9.85 370.30 140.69 1645.88
% 0.11 3.23 0.14 1.58 16.71 0.12 0.60 22.50 8.55 100.00
2010Amount 3.75 422.29 9.65 35.30 494.37 31.80 78.48 1075.64 703.85 5208.23
% 0.07 8.11 0.19 0.68 9.49 0.61 1.51 20.65 13.51 100.00
2015Amount 9.77 30.98 4.77 2.58 292.08 7.78 251.53 599.49 1044.00 7750.71
% 0.13 0.40 0.06 0.03 3.77 0.10 3.25 7.73 13.47 100.00
2016Amount 5.40 29.43 5.42 6.70 248.69 8.00 73.43 377.08 1092.71 6558.90
% 0.08 0.45 0.08 0.10 3.79 0.12 1.12 5.75 16.66 100.00
2017Amount 5.53 45.84 9.31 5.85 222.16 10.22 75.35 374.25 1372.56 6826.53
% 0.08 0.67 0.14 0.09 3.25 0.15 1.10 5.48 20.11 100.00
Source:IMF Direction of Trade Statistics,
http://data.imf.org/?sk=9D6028D4-F14A-464C-A2F2-59B2CD424B85.

Annex
325
2. AzerbaijanExport to G7 and China
(million USD)
Year Unit France German Italy Canada Japan UK USA G7 total China Total Export
2000Amount 205.19 8.29 762.54 0.56 0.12 18.79 8.00 1003.50 4.88 1742.93
% 11.77 0.48 43.75 0.03 0.01 1.08 0.46 57.58 0.28 100.00
2005Amount 406.72 34.80 1315.74 0.31 0.02 4.50 43.16 1805.24 99.24 4347.04
% 9.36 0.80 30.27 0.01 0.00 0.10 0.99 41.53 2.28 100.00
2010Amount 1856.52 9.91 7044.15 317.07 0.16 6.44 1706.57 10940.83 338.85 21360.21
% 8.69 0.05 32.98 1.48 0.00 0.03 7.99 51.22 1.59 100.00
2015Amount 864.16 1223.96 2254.33 223.72 0.87 10.67 416.30 4994.01 53.19 11003.31
% 7.85 11.12 20.49 2.03 0.01 0.10 3.78 45.39 0.48 100.00
2016Amount 493.64 610.83 1559.98 62.16 1.65 57.24 80.65 2866.16 271.52 9143.13
% 5.40 6.68 17.06 0.68 0.02 0.63 0.88 31.35 2.97 100.00
2017Amount 136.30 450.46 2625.37 407.80 4.36 9.74 61.19 3695.22 443.81 11191.25
% 1.22 4.03 23.46 3.64 0.04 0.09 0.55 33.02 3.97 100.00
Import from G7 and China
(million USD) Year Unit France German Italy Canada Japan UK USA G7 total China Total Import
2000Amount 18.96 67.55 28.10 3.88 16.39 58.87 117.71 311.47 23.09 1171.33
% 1.62 5.77 2.40 0.33 1.40 5.03 10.05 26.59 1.97 100.00
2005Amount 121.81 256.34 94.61 13.87 70.61 384.95 141.28 1083.46 173.81 4210.37
% 2.89 6.09 2.25 0.33 1.68 9.14 3.36 25.73 4.13 100.00
2010Amount 136.44 607.07 118.35 15.28 146.30 302.76 206.34 1532.54 587.62 6600.40
% 2.07 9.20 1.79 0.23 2.22 4.59 3.13 23.22 8.90 100.00
2015Amount 212.25 690.08 587.96 16.63 558.10 553.33 848.19 3466.54 511.90 9195.70
% 2.31 7.50 6.39 0.18 6.07 6.02 9.22 37.70 5.57 100.00
2016Amount 150.41 399.19 332.19 13.97 282.65 495.22 471.58 2145.20 703.90 8531.74
% 1.76 4.68 3.89 0.16 3.31 5.80 5.53 25.14 8.25 100.00
2017Amount 154.73 443.69 318.69 15.64 170.37 239.86 720.79 2063.76 854.53 8781.94
% 1.76 5.05 3.63 0.18 1.94 2.73 8.21 23.50 9.73 100.00
Source:IMF Direction of Trade Statistics,
http://data.imf.org/?sk=9D6028D4-F14A-464C-A2F2-59B2CD424B85.

China Development Report on South-South Cooperation 2017
326
3. Armenia
Export to G7 and China
(million USD)
Year Unit France German Italy Canada Japan UK USA G7 total China Total Export
2000Amount 0.47 12.92 2.68 0.98 0.21 10.10 37.86 65.22 0.57 301.33
% 0.15 4.29 0.89 0.33 0.07 3.35 12.56 21.65 0.19 100.00
2005Amount 2.02 152.11 25.59 11.48 1.12 0.42 109.51 302.25 9.25 976.95
% 0.21 15.57 2.62 1.18 0.11 0.04 11.21 30.94 0.95 100.00
2010Amount 7.49 132.62 4.81 29.56 0.18 0.38 82.90 257.94 30.87 1041.05
% 0.72 12.74 0.46 2.84 0.02 0.04 7.96 24.78 2.97 100.00
2015Amount 6.06 145.13 49.08 112.21 3.53 1.62 54.58 372.21 165.32 1486.89
% 0.41 9.76 3.30 7.55 0.24 0.11 3.67 25.03 11.12 100.00
2016Amount 4.12 135.13 31.51 133.12 0.38 1.58 39.19 345.03 99.66 1797.45
% 0.23 7.52 1.75 7.41 0.02 0.09 2.18 19.20 5.54 100.00
2017Amount 4.50 132.48 37.43 13.23 0.49 5.17 68.47 261.76 123.75 2242.87
% 0.20 5.91 1.67 0.59 0.02 0.23 3.05 11.67 5.52 100.00
Import from G7 and China
(million USD)
Year Unit France German Italy Canada Japan UK USA G7 total China Total Import
2000Amount 17.56 36.49 25.71 5.40 3.82 59.48 102.68 251.13 5.41 884.66
% 1.98 4.12 2.91 0.61 0.43 6.72 11.61 28.39 0.61 100.00
2005Amount 47.42 141.36 60.03 18.65 23.72 11.28 111.49 413.95 65.58 1800.77
% 2.63 7.85 3.33 1.04 1.32 0.63 6.19 22.99 3.64 100.00
2010Amount 76.74 210.71 122.16 21.38 83.30 37.81 111.25 663.34 404.02 3748.95
% 2.05 5.62 3.26 0.57 2.22 1.01 2.97 17.69 10.78 100.00
2015Amount 65.13 201.87 148.54 14.28 57.52 26.57 108.48 622.39 315.99 3253.37
% 2.00 6.20 4.57 0.44 1.77 0.82 3.33 19.13 9.71 100.00
2016Amount 52.52 160.43 127.40 11.89 32.38 28.01 79.10 491.73 363.47 3225.58
% 1.63 4.97 3.95 0.37 1.00 0.87 2.45 15.24 11.27 100.00
2017Amount 77.65 206.52 163.32 76.72 81.06 36.38 136.32 777.97 480.73 4182.46
% 1.86 4.94 3.90 1.83 1.94 0.87 3.26 18.60 11.49 100.00
Source:IMF Direction of Trade Statistics,
http://data.imf.org/?sk=9D6028D4-F14A-464C-A2F2-59B2CD424B85.

Annex
327
4. BahrainExport to G7 and China
(million USD)
Year Unit France German Italy Canada Japan UK USA G7 total China Total Export
2000Amount 11.98 13.35 37.86 5.47 93.55 10.78 375.46 548.45 24.81 1660.78
% 0.72 0.80 2.28 0.33 5.63 0.65 22.61 33.02 1.49 100.00
2005Amount 15.53 14.65 38.34 0.60 96.09 22.30 262.27 449.79 37.50 2509.67
% 0.62 0.58 1.53 0.02 3.83 0.89 10.45 17.92 1.49 100.00
2010Amount 49.51 51.74 103.37 1.14 25.10 18.97 236.28 486.12 173.22 4958.75
% 1.00 1.04 2.08 0.02 0.51 0.38 4.76 9.80 3.49 100.00
2015Amount 41.08 19.93 45.13 20.69 1968.66 125.42 710.76 2931.65 314.99 16512.22
% 0.25 0.12 0.27 0.13 11.92 0.76 4.30 17.75 1.91 100.00
2016Amount 45.51 17.20 49.62 15.64 1115.96 205.92 1412.11 2861.96 534.64 12765.47
% 0.36 0.13 0.39 0.12 8.74 1.61 11.06 22.42 4.19 100.00
2017Amount 118.24 14.71 69.98 6.58 661.80 144.82 1681.00 2697.14 1019.21 15184.29
% 0.78 0.10 0.46 0.04 4.36 0.95 11.07 17.76 6.71 100.00
Import from G7 and China
(million USD)
Year Unit France German Italy Canada Japan UK USA G7 total China Total Import
2000Amount 79.67 163.65 109.30 23.36 175.70 181.44 197.97 931.10 122.91 4655.00
% 1.71 3.52 2.35 0.50 3.77 3.90 4.25 20.00 2.64 100.00
2005Amount 175.29 380.55 194.21 25.04 571.34 289.96 342.08 1978.47 378.72 9376.13
% 1.87 4.06 2.07 0.27 6.09 3.09 3.65 21.10 4.04 100.00
2010Amount 270.73 538.75 240.61 85.10 753.91 379.18 717.56 2985.84 1178.04 16038.40
% 1.69 3.36 1.50 0.53 4.70 2.36 4.47 18.62 7.35 100.00
2015Amount 237.99 544.14 318.84 105.16 1119.01 420.18 1151.54 3896.84 1571.37 16437.34
% 1.45 3.31 1.94 0.64 6.81 2.56 7.01 23.71 9.56 100.00
2016Amount 264.53 464.07 326.80 49.88 895.86 480.11 1275.12 3756.35 1429.74 14804.16
% 1.79 3.13 2.21 0.34 6.05 3.24 8.61 25.37 9.66 100.00
2017Amount 404.00 601.89 368.84 97.84 807.64 373.90 975.00 3629.11 1653.77 13156.73
% 3.07 4.57 2.80 0.74 6.14 2.84 7.41 27.58 12.57 100.00
Source:IMF Direction of Trade Statistics,
http://data.imf.org/?sk=9D6028D4-F14A-464C-A2F2-59B2CD424B85.

China Development Report on South-South Cooperation 2017
328
5. Bhutan
Export to G7 and China
(million USD)
Year Unit France German Italy Canada Japan UK USA G7 total China Total Export
2000Amount 0.00 0.00 0.00 0.00 0.02 0.53 0.09 0.64 0.00 11.37
% 0.01 0.03 0.00 0.00 0.19 4.63 0.76 5.63 0.00 100.00
2005Amount 0.00 0.00 0.00 0.00 0.16 0.11 0.09 0.36 0.00 258.76
% 0.00 0.00 0.00 0.00 0.06 0.04 0.03 0.14 0.00 100.00
2010Amount 0.01 0.01 0.34 0.01 2.90 0.00 0.17 3.43 0.00 414.00
% 0.00 0.00 0.08 0.00 0.70 0.00 0.04 0.83 0.00 100.00
2015Amount 0.01 20.09 2.68 0.00 0.15 0.00 1.20 24.14 0.54 603.06
% 0.00 3.33 0.44 0.00 0.02 0.00 0.20 4.00 0.09 100.00
2016Amount 0.00 0.71 0.09 0.00 0.95 0.00 1.40 3.15 0.32 498.97
% 0.00 0.14 0.02 0.00 0.19 0.00 0.28 0.63 0.06 100.00
2017Amount 0.00 2.13 2.91 0.00 1.23 0.00 0.41 6.68 0.36 432.62
% 0.00 0.49 0.67 0.00 0.28 0.00 0.10 1.54 0.08 100.00
Import from G7 and China
(million USD)
Year Unit France German Italy Canada Japan UK USA G7 total China Total Import
2000Amount 0.06 0.91 2.79 0.00 5.92 2.77 0.77 13.23 3.31 115.41
% 0.05 0.79 2.42 0.00 5.13 2.40 0.67 11.47 2.87 100.00
2005Amount 3.53 4.55 2.84 0.15 14.73 0.93 1.86 28.60 4.14 387.16
% 0.91 1.18 0.73 0.04 3.80 0.24 0.48 7.39 1.07 100.00
2010Amount 4.29 7.91 4.08 0.91 18.51 1.42 3.39 40.50 13.35 854.37
% 0.50 0.93 0.48 0.11 2.17 0.17 0.40 4.74 1.56 100.00
2015Amount 0.08 65.07 7.67 0.24 28.88 1.96 2.77 106.67 16.99 1744.90
% 0.00 3.73 0.44 0.01 1.66 0.11 0.16 6.11 0.97 100.00
2016Amount 0.16 5.67 4.74 0.10 18.94 2.76 2.00 34.38 8.58 1715.00
% 0.01 0.33 0.28 0.01 1.10 0.16 0.12 2.00 0.50 100.00
2017Amount 0.21 2.66 4.96 0.41 10.15 2.96 2.53 23.88 10.38 1689.35
% 0.01 0.16 0.29 0.02 0.60 0.18 0.15 1.41 0.61 100.00
Source:IMF Direction of Trade Statistics,
http://data.imf.org/?sk=9D6028D4-F14A-464C-A2F2-59B2CD424B85.

Annex
329
6. Bangladesh
Export to G7 and China
(million USD)
Year Unit France German Italy Canada Japan UK USA G7 total China Total Export
2000Amount 288.60 607.80 227.94 96.61 66.88 439.53 1779.49 3506.85 9.56 5589.58
% 5.16 10.87 4.08 1.73 1.20 7.86 31.84 62.74 0.17 100.00
2005Amount 544.53 1143.72 326.23 275.36 64.36 794.78 2003.48 5152.46 46.33 8494.40
% 6.41 13.46 3.84 3.24 0.76 9.36 23.59 60.66 0.55 100.00
2010Amount 997.69 2074.95 561.16 552.83 164.98 1243.94 3247.49 8843.05 190.98 16496.95
% 6.05 12.58 3.40 3.35 1.00 7.54 19.69 53.60 1.16 100.00
2015Amount 1503.96 3857.42 1170.86 780.10 614.22 2656.67 4164.91 14748.14 675.08 29924.64
% 5.03 12.89 3.91 2.61 2.05 8.88 13.92 49.28 2.26 100.00
2016Amount 1549.89 3837.89 1159.28 770.01 692.42 2588.74 3962.32 14560.54 716.12 30195.28
% 5.13 12.71 3.84 2.55 2.29 8.57 13.12 48.22 2.37 100.00
2017Amount 1585.02 4030.68 1277.45 786.61 665.81 2726.91 3826.11 14898.58 691.43 31327.78
% 5.06 12.87 4.08 2.51 2.13 8.70 12.21 47.56 2.21 100.00
Import from G7 and China
(million USD)
Year Unit France German Italy Canada Japan UK USA G7 total China Total Import
2000Amount 63.97 176.81 149.90 100.25 849.66 238.72 213.94 1793.26 667.50 8861.12
% 0.72 2.00 1.69 1.13 9.59 2.69 2.41 20.24 7.53 100.00
2005Amount 55.80 316.32 156.77 62.53 570.99 322.73 326.54 1811.68 1870.35 13836.36
% 0.40 2.29 1.13 0.45 4.13 2.33 2.36 13.09 13.52 100.00
2010Amount 98.90 530.58 242.54 506.06 1162.71 354.82 534.10 3429.70 4681.43 27771.16
% 0.36 1.91 0.87 1.82 4.19 1.28 1.92 12.35 16.86 100.00
2015Amount 222.62 672.37 413.81 680.72 1533.48 293.07 940.16 4756.23 8848.85 39412.98
% 0.56 1.71 1.05 1.73 3.89 0.74 2.39 12.07 22.45 100.00
2016Amount 197.27 823.67 522.05 713.30 1835.91 320.21 861.29 5273.69 10028.79 41248.20
% 0.48 2.00 1.27 1.73 4.45 0.78 2.09 12.79 24.31 100.00
2017Amount 162.53 874.02 564.86 573.13 1671.92 361.28 1435.28 5643.02 10433.75 47751.48
% 0.34 1.83 1.18 1.20 3.50 0.76 3.01 11.82 21.85 100.00
Source:IMF Direction of Trade Statistics,
http://data.imf.org/?sk=9D6028D4-F14A-464C-A2F2-59B2CD424B85.

China Development Report on South-South Cooperation 2017
330
7. Brunei Darussalam
Export to G7 and China
(million USD)
Year Unit France German Italy Canada Japan UK USA G7 total China Total Export
2000Amount 0.51 5.75 0.06 0.81 1011.19 5.78 342.88 1366.97 101.97 2803.93
% 0.02 0.21 0.00 0.03 36.06 0.21 12.23 48.75 3.64 100.00
2005Amount 1.02 1.81 0.19 0.74 2341.26 7.22 533.95 2886.20 183.88 7357.01
% 0.01 0.02 0.00 0.01 31.82 0.10 7.26 39.23 2.50 100.00
2010Amount 0.72 4.25 0.23 0.62 3862.87 10.34 14.19 3893.21 585.49 8886.91
% 0.01 0.05 0.00 0.01 43.47 0.12 0.16 43.81 6.59 100.00
2015Amount 0.43 5.60 0.10 0.66 2308.67 12.66 52.63 2380.75 94.93 6352.68
% 0.01 0.09 0.00 0.01 36.34 0.20 0.83 37.48 1.49 100.00
2016Amount 1.71 3.19 0.25 0.49 1741.23 31.89 9.88 1788.64 225.99 4912.55
% 0.03 0.07 0.01 0.01 35.44 0.65 0.20 36.41 4.60 100.00
2017Amount 0.59 3.31 1.51 0.88 1634.68 11.34 28.74 1681.04 269.05 5586.89
% 0.01 0.06 0.03 0.02 29.26 0.20 0.51 30.09 4.82 100.00
Import from G7 and China
(million USD)
Year Unit France German Italy Canada Japan UK USA G7 total China Total Import
2000Amount 12.36 23.45 16.25 1.35 55.46 42.83 100.52 252.21 20.87 882.91
% 1.40 2.66 1.84 0.15 6.28 4.85 11.38 28.57 2.36 100.00
2005Amount 11.37 29.99 22.48 8.76 129.34 27.71 104.56 334.21 96.22 1142.04
% 1.00 2.63 1.97 0.77 11.33 2.43 9.16 29.26 8.43 100.00
2010Amount 11.98 77.63 20.87 8.48 252.21 109.30 246.28 726.74 198.91 2526.90
% 0.47 3.07 0.83 0.34 9.98 4.33 9.75 28.76 7.87 100.00
2015Amount 26.60 112.75 63.82 5.31 246.09 85.51 341.49 881.56 376.96 3230.26
% 0.82 3.49 1.98 0.16 7.62 2.65 10.57 27.29 11.67 100.00
2016Amount 30.56 76.88 30.30 11.15 114.82 86.50 308.53 658.73 347.90 2664.46
% 1.15 2.89 1.14 0.42 4.31 3.25 11.58 24.72 13.06 100.00
2017Amount 27.02 173.83 22.65 5.24 120.57 130.66 290.19 770.15 645.16 3081.51
% 0.88 5.64 0.74 0.17 3.91 4.24 9.42 24.99 20.94 100.00
Source:IMF Direction of Trade Statistics,
http://data.imf.org/?sk=9D6028D4-F14A-464C-A2F2-59B2CD424B85.

Annex
331
8. Cambodia
Export to G7 and China
(million USD)
Year Unit France German Italy Canada Japan UK USA G7 total China Total Export
2000Amount 27.71 66.00 2.09 4.87 10.74 81.62 738.98 932.01 23.78 1368.30
% 2.02 4.82 0.15 0.36 0.79 5.96 54.01 68.11 1.74 100.00
2005Amount 52.24 225.36 6.56 107.15 62.90 124.21 1597.43 2175.85 14.26 3020.13
% 1.73 7.46 0.22 3.55 2.08 4.11 52.89 72.04 0.47 100.00
2010Amount 57.30 112.26 49.94 274.23 89.51 235.16 1903.41 2721.82 65.02 5583.70
% 1.03 2.01 0.89 4.91 1.60 4.21 34.09 48.75 1.16 100.00
2015Amount 298.26 748.37 197.41 551.04 571.55 869.04 2136.78 5372.45 405.52 8578.25
% 3.48 8.72 2.30 6.42 6.66 10.13 24.91 62.63 4.73 100.00
2016Amount 362.70 903.84 212.27 654.75 827.19 953.23 2147.05 6061.02 609.28 10100.57
% 3.59 8.95 2.10 6.48 8.19 9.44 21.26 60.01 6.03 100.00
2017Amount 405.11 925.48 225.61 722.50 821.38 962.97 2306.78 6369.84 743.35 10790.85
% 3.75 8.58 2.09 6.70 7.61 8.92 21.38 59.03 6.89 100.00
Import from G7 and China
(million USD)
Year Unit France German Italy Canada Japan UK USA G7 total China Total Import
2000Amount 39.00 7.66 9.89 7.07 58.39 19.07 32.77 173.85 112.88 1412.46
% 2.76 0.54 0.70 0.50 4.13 1.35 2.32 12.31 7.99 100.00
2005Amount 176.78 8.65 3.27 1.75 100.21 7.63 36.19 334.48 423.51 2545.93
% 6.94 0.34 0.13 0.07 3.94 0.30 1.42 13.14 16.63 100.00
2010Amount 50.47 16.42 12.92 4.17 156.35 6.48 129.73 376.54 1184.71 4889.67
% 1.03 0.34 0.26 0.09 3.20 0.13 2.65 7.70 24.23 100.00
2015Amount 65.47 106.18 35.93 30.76 422.95 32.19 229.49 922.97 3926.20 11215.14
% 0.58 0.95 0.32 0.27 3.77 0.29 2.05 8.23 35.01 100.00
2016Amount 64.66 163.14 39.70 49.79 528.27 35.03 173.55 1054.14 4550.95 12900.20
% 0.50 1.26 0.31 0.39 4.10 0.27 1.35 8.17 35.28 100.00
2017Amount 51.20 285.77 46.73 62.11 584.22 70.72 191.94 1292.71 5494.86 16078.09
% 0.32 1.78 0.29 0.39 3.63 0.44 1.19 8.04 34.18 100.00
Source:IMF Direction of Trade Statistics,
http://data.imf.org/?sk=9D6028D4-F14A-464C-A2F2-59B2CD424B85.
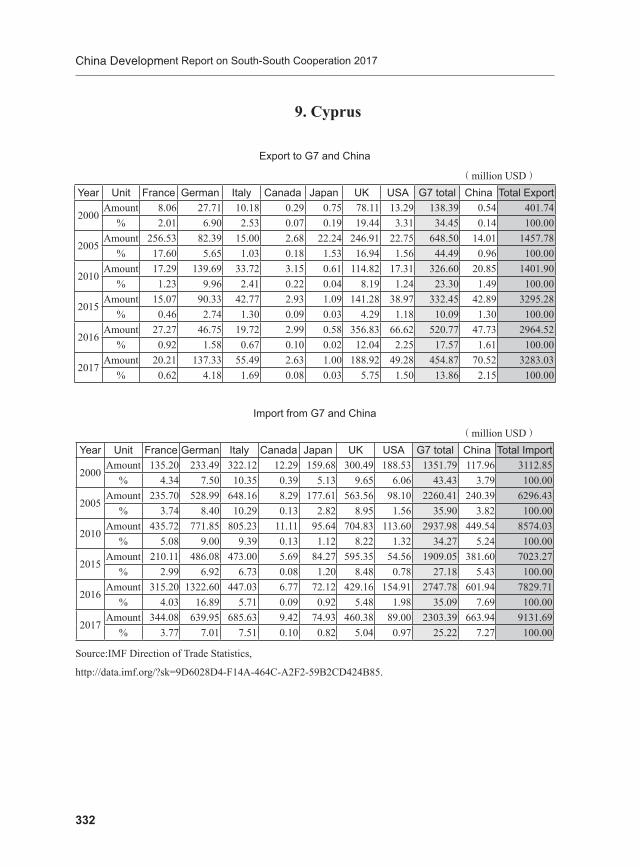
China Development Report on South-South Cooperation 2017
332
9. Cyprus
Export to G7 and China
(million USD)
Year Unit France German Italy Canada Japan UK USA G7 total China Total Export
2000Amount 8.06 27.71 10.18 0.29 0.75 78.11 13.29 138.39 0.54 401.74
% 2.01 6.90 2.53 0.07 0.19 19.44 3.31 34.45 0.14 100.00
2005Amount 256.53 82.39 15.00 2.68 22.24 246.91 22.75 648.50 14.01 1457.78
% 17.60 5.65 1.03 0.18 1.53 16.94 1.56 44.49 0.96 100.00
2010Amount 17.29 139.69 33.72 3.15 0.61 114.82 17.31 326.60 20.85 1401.90
% 1.23 9.96 2.41 0.22 0.04 8.19 1.24 23.30 1.49 100.00
2015Amount 15.07 90.33 42.77 2.93 1.09 141.28 38.97 332.45 42.89 3295.28
% 0.46 2.74 1.30 0.09 0.03 4.29 1.18 10.09 1.30 100.00
2016Amount 27.27 46.75 19.72 2.99 0.58 356.83 66.62 520.77 47.73 2964.52
% 0.92 1.58 0.67 0.10 0.02 12.04 2.25 17.57 1.61 100.00
2017Amount 20.21 137.33 55.49 2.63 1.00 188.92 49.28 454.87 70.52 3283.03
% 0.62 4.18 1.69 0.08 0.03 5.75 1.50 13.86 2.15 100.00
Import from G7 and China
(million USD)
Year Unit France German Italy Canada Japan UK USA G7 total China Total Import
2000Amount 135.20 233.49 322.12 12.29 159.68 300.49 188.53 1351.79 117.96 3112.85
% 4.34 7.50 10.35 0.39 5.13 9.65 6.06 43.43 3.79 100.00
2005Amount 235.70 528.99 648.16 8.29 177.61 563.56 98.10 2260.41 240.39 6296.43
% 3.74 8.40 10.29 0.13 2.82 8.95 1.56 35.90 3.82 100.00
2010Amount 435.72 771.85 805.23 11.11 95.64 704.83 113.60 2937.98 449.54 8574.03
% 5.08 9.00 9.39 0.13 1.12 8.22 1.32 34.27 5.24 100.00
2015Amount 210.11 486.08 473.00 5.69 84.27 595.35 54.56 1909.05 381.60 7023.27
% 2.99 6.92 6.73 0.08 1.20 8.48 0.78 27.18 5.43 100.00
2016Amount 315.20 1322.60 447.03 6.77 72.12 429.16 154.91 2747.78 601.94 7829.71
% 4.03 16.89 5.71 0.09 0.92 5.48 1.98 35.09 7.69 100.00
2017Amount 344.08 639.95 685.63 9.42 74.93 460.38 89.00 2303.39 663.94 9131.69
% 3.77 7.01 7.51 0.10 0.82 5.04 0.97 25.22 7.27 100.00
Source:IMF Direction of Trade Statistics,
http://data.imf.org/?sk=9D6028D4-F14A-464C-A2F2-59B2CD424B85.

Annex
333
10. Georgia
Export to G7 and China
(million USD)
Year Unit France German Italy Canada Japan UK USA G7 total China Total Export
2000Amount 1.06 34.07 12.05 0.00 0.38 10.24 7.14 64.94 0.91 325.91
% 0.32 10.45 3.70 0.00 0.12 3.14 2.19 19.93 0.28 100.00
2005Amount 11.55 28.46 33.55 35.64 1.44 31.93 26.75 169.32 5.60 850.19
% 1.36 3.35 3.95 4.19 0.17 3.76 3.15 19.92 0.66 100.00
2010Amount 10.92 34.99 26.05 118.74 8.18 18.20 187.23 404.30 26.76 1677.38
% 0.65 2.09 1.55 7.08 0.49 1.08 11.16 24.10 1.60 100.00
2015Amount 21.08 75.81 74.41 70.17 3.30 21.46 104.18 370.41 125.80 2203.65
% 0.96 3.44 3.38 3.18 0.15 0.97 4.73 16.81 5.71 100.00
2016Amount 25.11 85.35 72.74 41.26 2.67 15.20 68.28 310.61 174.33 2112.83
% 1.19 4.04 3.44 1.95 0.13 0.72 3.23 14.70 8.25 100.00
2017Amount 27.01 45.39 69.49 2.37 7.36 13.20 121.79 286.61 201.70 2735.53
% 0.99 1.66 2.54 0.09 0.27 0.48 4.45 10.48 7.37 100.00
Import from G7 and China
(million USD)
Year Unit France German Italy Canada Japan UK USA G7 total China Total Import
2000Amount 11.29 55.40 20.85 3.64 7.32 23.49 69.60 191.57 2.91 721.81
% 1.56 7.68 2.89 0.50 1.01 3.25 9.64 26.54 0.40 100.00
2005Amount 97.38 206.76 64.43 7.11 8.34 70.21 148.31 602.54 46.71 2490.24
% 3.91 8.30 2.59 0.29 0.33 2.82 5.96 24.20 1.88 100.00
2010Amount 75.08 333.44 136.88 18.32 170.43 66.32 180.95 981.43 335.21 5255.54
% 1.43 6.34 2.60 0.35 3.24 1.26 3.44 18.67 6.38 100.00
2015Amount 117.39 431.26 197.71 11.64 206.01 89.96 251.52 1305.49 586.99 7724.37
% 1.52 5.58 2.56 0.15 2.67 1.16 3.26 16.90 7.60 100.00
2016Amount 120.05 420.36 262.74 44.37 188.44 143.76 214.71 1394.44 547.69 7288.06
% 1.65 5.77 3.61 0.61 2.59 1.97 2.95 19.13 7.51 100.00
2017Amount 134.82 433.50 217.99 30.39 138.82 98.72 268.23 1322.48 732.95 7939.16
% 1.70 5.46 2.75 0.38 1.75 1.24 3.38 16.66 9.23 100.00
Source:IMF Direction of Trade Statistics,
http://data.imf.org/?sk=9D6028D4-F14A-464C-A2F2-59B2CD424B85.

China Development Report on South-South Cooperation 2017
334
11. Iraq
Export to G7 and China
(million USD)
Year Unit France German Italy Canada Japan UK USA G7 total China Total Export
2000Amount 1240.81 40.15 1578.00 459.69 623.48 0.09 5987.92 9930.14 610.99 15773.22
% 7.87 0.25 10.00 2.91 3.95 0.00 37.96 62.96 3.87 100.00
2005Amount 486.23 2.04 1902.82 994.56 417.41 1.66 9101.13 12905.85 392.76 17833.90
% 2.73 0.01 10.67 5.58 2.34 0.01 51.03 72.37 2.20 100.00
2010Amount 1243.06 197.58 3891.10 1861.89 3232.63 1.80 11908.68 22336.74 5912.40 49106.65
% 2.53 0.40 7.92 3.79 6.58 0.00 24.25 45.49 12.04 100.00
2015Amount 844.33 469.52 3517.56 0.20 943.04 74.94 4106.22 9955.81 11939.93 51497.86
% 1.64 0.91 6.83 0.00 1.83 0.15 7.97 19.33 23.19 100.00
2016Amount 167.56 610.55 3082.42 1.10 1036.18 9.63 5627.41 10534.85 10017.13 46390.64
% 0.36 1.32 6.64 0.00 2.23 0.02 12.13 22.71 21.59 100.00
2017Amount 129.67 1031.98 3010.32 53.02 952.65 6.55 10137.38 15321.57 12947.20 64253.75
% 0.20 1.61 4.69 0.08 1.48 0.01 15.78 23.85 20.15 100.00
Import from G7 and China
(million USD)
Year Unit France German Italy Canada Japan UK USA G7 total China Total Import
2000Amount 378.32 134.30 252.40 54.81 45.13 81.46 11.55 957.97 346.89 3364.69
% 11.24 3.99 7.50 1.63 1.34 2.42 0.34 28.47 10.31 100.00
2005Amount 279.02 359.08 383.91 66.34 138.25 242.56 1454.43 2923.59 432.58 10125.83
% 2.76 3.55 3.79 0.66 1.37 2.40 14.36 28.87 4.27 100.00
2010Amount 749.73 1253.56 626.32 242.43 328.65 313.07 1744.87 5258.63 3815.70 25977.95
% 2.89 4.83 2.41 0.93 1.27 1.21 6.72 20.24 14.69 100.00
2015Amount 522.42 1167.40 1074.56 147.33 532.28 450.30 2087.82 5982.11 8402.57 36307.09
% 1.44 3.22 2.96 0.41 1.47 1.24 5.75 16.48 23.14 100.00
2016Amount 369.46 815.11 724.79 103.03 363.42 314.88 1344.86 4035.55 8207.67 30475.11
% 1.21 2.67 2.38 0.34 1.19 1.03 4.41 13.24 26.93 100.00
2017Amount 399.01 800.07 685.22 59.13 302.35 440.97 1269.45 3956.20 8854.82 34479.67
% 1.16 2.32 1.99 0.17 0.88 1.28 3.68 11.47 25.68 100.00
Source:IMF Direction of Trade Statistics,
http://data.imf.org/?sk=9D6028D4-F14A-464C-A2F2-59B2CD424B85.
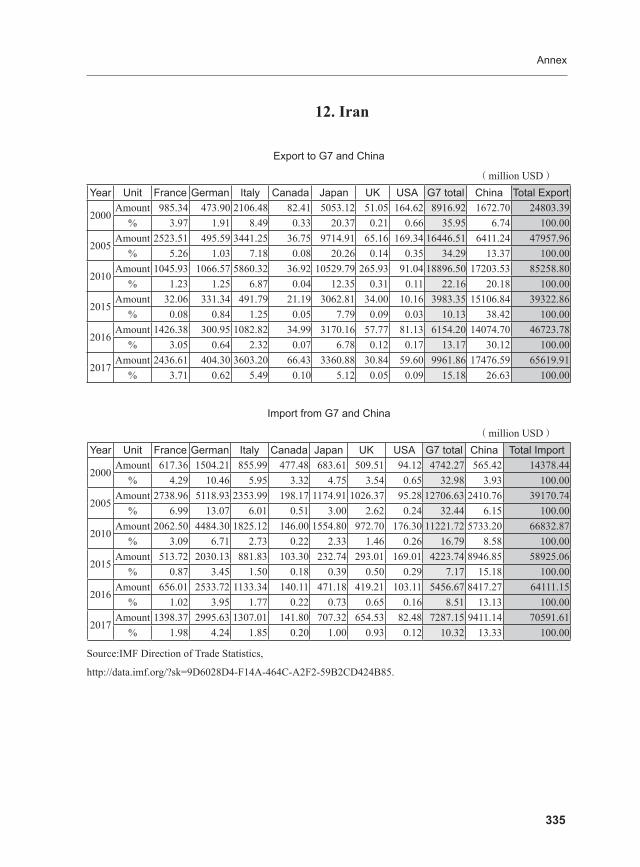
Annex
335
12. Iran
Export to G7 and China
(million USD)
Year Unit France German Italy Canada Japan UK USA G7 total China Total Export
2000Amount 985.34 473.90 2106.48 82.41 5053.12 51.05 164.62 8916.92 1672.70 24803.39
% 3.97 1.91 8.49 0.33 20.37 0.21 0.66 35.95 6.74 100.00
2005Amount 2523.51 495.59 3441.25 36.75 9714.91 65.16 169.34 16446.51 6411.24 47957.96
% 5.26 1.03 7.18 0.08 20.26 0.14 0.35 34.29 13.37 100.00
2010Amount 1045.93 1066.57 5860.32 36.92 10529.79 265.93 91.04 18896.50 17203.53 85258.80
% 1.23 1.25 6.87 0.04 12.35 0.31 0.11 22.16 20.18 100.00
2015Amount 32.06 331.34 491.79 21.19 3062.81 34.00 10.16 3983.35 15106.84 39322.86
% 0.08 0.84 1.25 0.05 7.79 0.09 0.03 10.13 38.42 100.00
2016Amount 1426.38 300.95 1082.82 34.99 3170.16 57.77 81.13 6154.20 14074.70 46723.78
% 3.05 0.64 2.32 0.07 6.78 0.12 0.17 13.17 30.12 100.00
2017Amount 2436.61 404.30 3603.20 66.43 3360.88 30.84 59.60 9961.86 17476.59 65619.91
% 3.71 0.62 5.49 0.10 5.12 0.05 0.09 15.18 26.63 100.00
Import from G7 and China
(million USD)
Year Unit France German Italy Canada Japan UK USA G7 total China Total Import
2000Amount 617.36 1504.21 855.99 477.48 683.61 509.51 94.12 4742.27 565.42 14378.44
% 4.29 10.46 5.95 3.32 4.75 3.54 0.65 32.98 3.93 100.00
2005Amount 2738.96 5118.93 2353.99 198.17 1174.91 1026.37 95.28 12706.63 2410.76 39170.74
% 6.99 13.07 6.01 0.51 3.00 2.62 0.24 32.44 6.15 100.00
2010Amount 2062.50 4484.30 1825.12 146.00 1554.80 972.70 176.30 11221.72 5733.20 66832.87
% 3.09 6.71 2.73 0.22 2.33 1.46 0.26 16.79 8.58 100.00
2015Amount 513.72 2030.13 881.83 103.30 232.74 293.01 169.01 4223.74 8946.85 58925.06
% 0.87 3.45 1.50 0.18 0.39 0.50 0.29 7.17 15.18 100.00
2016Amount 656.01 2533.72 1133.34 140.11 471.18 419.21 103.11 5456.67 8417.27 64111.15
% 1.02 3.95 1.77 0.22 0.73 0.65 0.16 8.51 13.13 100.00
2017Amount 1398.37 2995.63 1307.01 141.80 707.32 654.53 82.48 7287.15 9411.14 70591.61
% 1.98 4.24 1.85 0.20 1.00 0.93 0.12 10.32 13.33 100.00
Source:IMF Direction of Trade Statistics,
http://data.imf.org/?sk=9D6028D4-F14A-464C-A2F2-59B2CD424B85.

China Development Report on South-South Cooperation 2017
336
13. Israel
Export to G7 and China
(million USD)
Year Unit France German Italy Canada Japan UK USA G7 total China Total Export
2000Amount 748.10 1521.40 803.60 283.30 838.70 1358.40 11733.60 17287.10 261.60 31911.70
% 2.34 4.77 2.52 0.89 2.63 4.26 36.77 54.17 0.82 100.00
2005Amount 886.30 1353.20 877.80 478.30 792.40 1643.30 15497.60 21528.90 743.20 42506.50
% 2.09 3.18 2.07 1.13 1.86 3.87 36.46 50.65 1.75 100.00
2010Amount 1270.40 1701.00 1252.80 749.00 656.90 2267.60 18487.80 26385.50 2046.40 58415.27
% 2.17 2.91 2.14 1.28 1.12 3.88 31.65 45.17 3.50 100.00
2015Amount 1684.50 1434.60 877.00 552.80 766.90 4008.00 18126.40 27450.20 3245.40 66037.99
% 2.55 2.17 1.33 0.84 1.16 6.07 27.45 41.57 4.91 100.00
2016Amount 1454.00 1519.51 958.17 594.58 759.03 3908.94 17597.52 26791.76 3327.63 60165.04
% 2.42 2.53 1.59 0.99 1.26 6.50 29.25 44.53 5.53 100.00
2017Amount 1756.20 1672.50 943.80 649.60 867.90 4895.20 17278.90 28064.10 3257.20 60016.88
% 2.93 2.79 1.57 1.08 1.45 8.16 28.79 46.76 5.43 100.00
Import from G7 and China
(million USD)
Year Unit France German Italy Canada Japan UK USA G7 total China Total Import
2000Amount 1157.60 2673.20 1720.70 340.70 1186.70 2714.60 6645.50 16439.00 602.30 36802.00
% 3.15 7.26 4.68 0.93 3.22 7.38 18.06 44.67 1.64 100.00
2005Amount 1203.70 2894.70 1733.40 320.10 1238.10 2552.00 6041.50 15983.50 1888.20 44936.70
% 2.68 6.44 3.86 0.71 2.76 5.68 13.44 35.57 4.20 100.00
2010Amount 1516.80 3678.40 2425.40 398.40 1779.00 2245.70 6700.40 18744.10 4736.40 59198.89
% 2.56 6.21 4.10 0.67 3.01 3.79 11.32 31.66 8.00 100.00
2015Amount 1604.90 3809.70 2490.40 262.70 1161.40 2272.10 8079.90 19681.10 5767.60 62003.00
% 2.59 6.14 4.02 0.42 1.87 3.66 13.03 31.74 9.30 100.00
2016Amount 1690.58 4069.37 2693.66 283.17 2354.22 3669.79 8097.67 22858.47 5896.15 66614.59
% 2.54 6.11 4.04 0.43 3.53 5.51 12.16 34.31 8.85 100.00
2017Amount 1754.60 4719.80 2777.60 298.20 2081.30 4301.50 8090.10 24023.10 6527.70 69090.90
% 2.54 6.83 4.02 0.43 3.01 6.23 11.71 34.77 9.45 100.00
Source:IMF Direction of Trade Statistics,
http://data.imf.org/?sk=9D6028D4-F14A-464C-A2F2-59B2CD424B85.

Annex
337
14. India
Export to G7 and China
(million USD)
Year Unit France German Italy Canada Japan UK USA G7 total China Total Export
2000Amount 998.90 1865.30 1261.55 636.95 1767.22 2233.05 9083.25 17846.23 758.22 42463.55
% 2.35 4.39 2.97 1.50 4.16 5.26 21.39 42.03 1.79 100.00
2005Amount 1995.85 3396.15 2460.78 982.88 2392.92 4714.85 16475.21 32418.64 6473.30 97898.38
% 2.04 3.47 2.51 1.00 2.44 4.82 16.83 33.11 6.61 100.00
2010Amount 4912.14 5997.47 4197.86 1253.32 4812.81 6421.50 23611.47 51206.57 17518.98 222906.89
% 2.20 2.69 1.88 0.56 2.16 2.88 10.59 22.97 7.86 100.00
2015Amount 4828.60 7033.87 4241.94 2092.97 4734.94 8902.02 40400.33 72234.67 9689.94 266162.81
% 1.81 2.64 1.59 0.79 1.78 3.34 15.18 27.14 3.64 100.00
2016Amount 4864.37 7174.13 4488.89 1824.42 3827.25 9022.20 41950.54 73151.80 8946.78 261861.69
% 1.86 2.74 1.71 0.70 1.46 3.45 16.02 27.94 3.42 100.00
2017Amount 5032.52 8241.53 5628.73 2319.55 4503.71 9026.43 46065.27 80817.74 12520.12 296211.90
% 1.70 2.78 1.90 0.78 1.52 3.05 15.55 27.28 4.23 100.00
Import from G7 and China
(million USD)
Year Unit France German Italy Canada Japan UK USA G7 total ChinaTotal
Import
2000Amount 661.05 1780.10 726.35 392.95 2015.60 3052.77 3152.25 11781.08 1448.60 50259.70
% 1.32 3.54 1.45 0.78 4.01 6.07 6.27 23.44 2.88 100.00
2005Amount 3562.85 5521.56 1735.00 883.83 3854.61 3839.27 8848.42 28245.54 9925.53 139666.58
% 2.55 3.95 1.24 0.63 2.76 2.75 6.34 20.22 7.11 100.00
2010Amount 3827.73 11471.57 4310.88 2072.21 8282.05 5181.00 19135.63 54281.07 41332.61 350780.18
% 1.09 3.27 1.23 0.59 2.36 1.48 5.46 15.47 11.78 100.00
2015Amount 3439.66 11895.47 4113.89 3878.50 9638.08 5384.15 20701.16 59050.91 61592.82 392229.82
% 0.88 3.03 1.05 0.99 2.46 1.37 5.28 15.06 15.70 100.00
2016Amount 3621.49 11485.20 3843.33 2778.13 9842.91 3865.69 20574.52 56011.27 60539.51 356320.28
% 1.02 3.22 1.08 0.78 2.76 1.08 5.77 15.72 16.99 100.00
2017Amount 5859.43 12808.69 4377.43 4836.48 10469.42 4333.71 24064.04 66749.20 71955.71 442982.73
% 1.32 2.89 0.99 1.09 2.36 0.98 5.43 15.07 16.24 100.00
Source:IMF Direction of Trade Statistics,
http://data.imf.org/?sk=9D6028D4-F14A-464C-A2F2-59B2CD424B85.

China Development Report on South-South Cooperation 2017
338
15. Indonesia
Export to G7 and China
(million USD)
Year Unit France German Italy Canada Japan UK USA G7 total China Total Export
2000Amount 729.60 1443.13 757.96 403.91 14415.19 1507.94 8488.94 27746.67 2767.71 62096.02
% 1.17 2.32 1.22 0.65 23.21 2.43 13.67 44.68 4.46 100.00
2005Amount 643.08 1781.58 1008.53 464.35 18049.14 1291.48 9889.20 33127.35 6662.35 85579.18
% 0.75 2.08 1.18 0.54 21.09 1.51 11.56 38.71 7.79 100.00
2010Amount 1150.66 2984.67 2370.48 731.91 25781.81 1693.16 14301.88 49014.57 15692.61 157779.11
% 0.73 1.89 1.50 0.46 16.34 1.07 9.06 31.07 9.95 100.00
2015Amount 1003.23 2663.82 1873.11 722.34 18014.35 1527.09 16266.94 42070.87 15044.66 150393.23
% 0.67 1.77 1.25 0.48 11.98 1.02 10.82 27.97 10.00 100.00
2016Amount 887.49 2638.68 1572.12 732.45 16098.59 1590.38 16172.02 39691.72 16790.80 136845.66
% 0.65 1.93 1.15 0.54 11.76 1.16 11.82 29.00 12.27 100.00
2017Amount 1003.62 2669.46 1937.66 822.06 17790.81 1407.59 17810.48 43441.69 23049.30 168773.43
% 0.59 1.58 1.15 0.49 10.54 0.83 10.55 25.74 13.66 100.00
Import from G7 and China
(million USD)
Year Unit France German Italy Canada Japan UK USA G7 total China Total Import
2000Amount 402.08 1244.67 345.13 638.33 5397.25 557.33 3393.27 11978.06 2021.97 33499.69
% 1.20 3.72 1.03 1.91 16.11 1.66 10.13 35.76 6.04 100.00
2005Amount 707.61 1780.83 568.90 698.03 6906.26 645.35 3885.80 15192.77 5842.86 57698.43
% 1.23 3.09 0.99 1.21 11.97 1.12 6.73 26.33 10.13 100.00
2010Amount 1340.87 3006.66 909.73 1108.42 16965.80 937.86 9416.00 33685.34 20424.22 135663.28
% 0.99 2.22 0.67 0.82 12.51 0.69 6.94 24.83 15.06 100.00
2015Amount 1337.70 3471.69 1368.24 1609.25 13263.52 819.16 7616.76 29486.33 29410.89 142694.78
% 0.94 2.43 0.96 1.13 9.30 0.57 5.34 20.66 20.61 100.00
2016Amount 1362.34 3159.49 1387.20 1383.03 12984.77 893.84 7319.16 28489.84 30800.46 135550.87
% 1.01 2.33 1.02 1.02 9.58 0.66 5.40 21.02 22.72 100.00
2017Amount 1497.85 3271.89 1486.22 1860.78 14133.61 1025.03 8216.32 31491.70 34520.73 160716.78
% 0.93 2.04 0.92 1.16 8.79 0.64 5.11 19.59 21.48 100.00
Source:IMF Direction of Trade Statistics,
http://data.imf.org/?sk=9D6028D4-F14A-464C-A2F2-59B2CD424B85.

Annex
339
16. Jordan
Export to G7 and China
(million USD)
Year Unit France German Italy Canada Japan UK USA G7 total China Total Export
2000Amount 2.79 6.36 6.75 0.71 13.08 11.28 63.25 104.23 46.54 1265.67
% 0.22 0.50 0.53 0.06 1.03 0.89 5.00 8.24 3.68 100.00
2005Amount 6.08 10.64 23.10 4.63 26.46 16.93 1125.65 1213.49 41.50 4301.24
% 0.14 0.25 0.54 0.11 0.62 0.39 26.17 28.21 0.96 100.00
2010Amount 4.14 5.63 65.70 13.14 57.32 18.17 923.73 1087.83 110.72 5939.26
% 0.07 0.09 1.11 0.22 0.97 0.31 15.55 18.32 1.86 100.00
2015Amount 6.60 9.73 47.45 54.01 22.77 25.02 1411.35 1576.92 210.81 6757.00
% 0.10 0.14 0.70 0.80 0.34 0.37 20.89 23.34 3.12 100.00
2016Amount 5.59 12.70 32.55 54.86 19.62 21.30 1365.69 1512.32 78.93 5415.97
% 0.10 0.23 0.60 1.01 0.36 0.39 25.22 27.92 1.46 100.00
2017Amount 9.29 16.25 24.42 61.07 25.97 23.69 1566.94 1727.64 137.07 6299.29
% 0.15 0.26 0.39 0.97 0.41 0.38 24.87 27.43 2.18 100.00
Import from G7 and China
(million USD)
Year Unit France German Italy Canada Japan UK USA G7 total China Total Import
2000Amount 174.88 529.21 167.39 30.22 180.21 209.13 454.14 1745.18 177.21 4597.19
% 3.80 11.51 3.64 0.66 3.92 4.55 9.88 37.96 3.85 100.00
2005Amount 250.26 842.26 352.19 33.71 296.77 295.12 588.14 2658.44 968.54 10492.39
% 2.39 8.03 3.36 0.32 2.83 2.81 5.61 25.34 9.23 100.00
2010Amount 347.40 1026.70 534.19 75.94 483.82 266.73 867.08 3601.84 1674.08 15562.95
% 2.23 6.60 3.43 0.49 3.11 1.71 5.57 23.14 10.76 100.00
2015Amount 383.97 944.14 805.00 52.11 596.29 280.57 1260.08 4322.17 2640.35 20466.18
% 1.88 4.61 3.93 0.25 2.91 1.37 6.16 21.12 12.90 100.00
2016Amount 389.03 803.11 787.80 47.12 475.30 242.65 1227.81 3972.83 2334.29 16715.50
% 2.33 4.80 4.71 0.28 2.84 1.45 7.35 23.77 13.96 100.00
2017Amount 395.44 900.37 808.28 60.23 570.01 359.16 2000.35 5093.83 2763.63 20316.53
% 1.95 4.43 3.98 0.30 2.81 1.77 9.85 25.07 13.60 100.00
Source:IMF Direction of Trade Statistics,
http://data.imf.org/?sk=9D6028D4-F14A-464C-A2F2-59B2CD424B85.
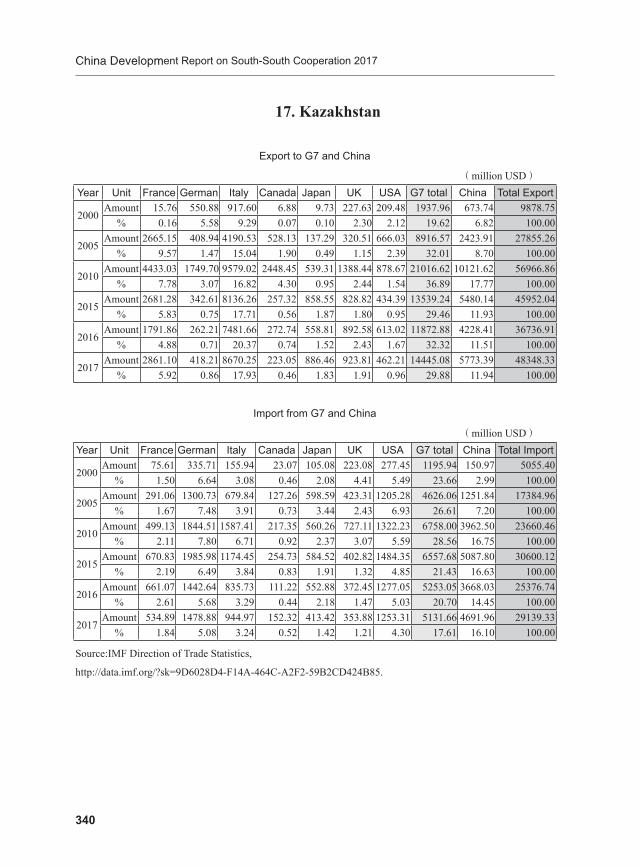
China Development Report on South-South Cooperation 2017
340
17. Kazakhstan
Export to G7 and China
(million USD)
Year Unit France German Italy Canada Japan UK USA G7 total China Total Export
2000Amount 15.76 550.88 917.60 6.88 9.73 227.63 209.48 1937.96 673.74 9878.75
% 0.16 5.58 9.29 0.07 0.10 2.30 2.12 19.62 6.82 100.00
2005Amount 2665.15 408.94 4190.53 528.13 137.29 320.51 666.03 8916.57 2423.91 27855.26
% 9.57 1.47 15.04 1.90 0.49 1.15 2.39 32.01 8.70 100.00
2010Amount 4433.03 1749.70 9579.02 2448.45 539.31 1388.44 878.67 21016.62 10121.62 56966.86
% 7.78 3.07 16.82 4.30 0.95 2.44 1.54 36.89 17.77 100.00
2015Amount 2681.28 342.61 8136.26 257.32 858.55 828.82 434.39 13539.24 5480.14 45952.04
% 5.83 0.75 17.71 0.56 1.87 1.80 0.95 29.46 11.93 100.00
2016Amount 1791.86 262.21 7481.66 272.74 558.81 892.58 613.02 11872.88 4228.41 36736.91
% 4.88 0.71 20.37 0.74 1.52 2.43 1.67 32.32 11.51 100.00
2017Amount 2861.10 418.21 8670.25 223.05 886.46 923.81 462.21 14445.08 5773.39 48348.33
% 5.92 0.86 17.93 0.46 1.83 1.91 0.96 29.88 11.94 100.00
Import from G7 and China
(million USD)
Year Unit France German Italy Canada Japan UK USA G7 total China Total Import
2000Amount 75.61 335.71 155.94 23.07 105.08 223.08 277.45 1195.94 150.97 5055.40
% 1.50 6.64 3.08 0.46 2.08 4.41 5.49 23.66 2.99 100.00
2005Amount 291.06 1300.73 679.84 127.26 598.59 423.31 1205.28 4626.06 1251.84 17384.96
% 1.67 7.48 3.91 0.73 3.44 2.43 6.93 26.61 7.20 100.00
2010Amount 499.13 1844.51 1587.41 217.35 560.26 727.11 1322.23 6758.00 3962.50 23660.46
% 2.11 7.80 6.71 0.92 2.37 3.07 5.59 28.56 16.75 100.00
2015Amount 670.83 1985.98 1174.45 254.73 584.52 402.82 1484.35 6557.68 5087.80 30600.12
% 2.19 6.49 3.84 0.83 1.91 1.32 4.85 21.43 16.63 100.00
2016Amount 661.07 1442.64 835.73 111.22 552.88 372.45 1277.05 5253.05 3668.03 25376.74
% 2.61 5.68 3.29 0.44 2.18 1.47 5.03 20.70 14.45 100.00
2017Amount 534.89 1478.88 944.97 152.32 413.42 353.88 1253.31 5131.66 4691.96 29139.33
% 1.84 5.08 3.24 0.52 1.42 1.21 4.30 17.61 16.10 100.00
Source:IMF Direction of Trade Statistics,
http://data.imf.org/?sk=9D6028D4-F14A-464C-A2F2-59B2CD424B85.

Annex
341
18. Kyrgyz
Export to G7 and China
(million USD)
Year Unit France German Italy Canada Japan UK USA G7 total China Total Export
2000Amount 3.40 144.60 1.00 0.00 0.70 18.70 2.90 171.30 44.10 503.61
% 0.68 28.71 0.20 0.00 0.14 3.71 0.58 34.01 8.76 100.00
2005Amount 0.92 4.10 0.90 22.51 0.39 2.27 3.27 34.36 26.57 633.96
% 0.15 0.65 0.14 3.55 0.06 0.36 0.52 5.42 4.19 100.00
2010Amount 38.18 5.78 1.14 16.71 0.82 9.35 90.30 162.27 28.25 1494.24
% 2.56 0.39 0.08 1.12 0.05 0.63 6.04 10.86 1.89 100.00
2015Amount 0.32 7.03 0.23 0.22 1.66 1.80 1.14 12.41 35.88 1427.18
% 0.02 0.49 0.02 0.02 0.12 0.13 0.08 0.87 2.51 100.00
2016Amount 1.43 6.38 0.39 0.47 0.26 32.01 0.43 41.38 79.70 1424.39
% 0.10 0.45 0.03 0.03 0.02 2.25 0.03 2.91 5.60 100.00
2017Amount 0.73 4.36 0.48 1.70 0.29 191.17 0.95 199.67 97.47 1788.27
% 0.04 0.24 0.03 0.10 0.02 10.69 0.05 11.17 5.45 100.00
Import from G7 and China
(million USD)
Year Unit France German Italy Canada Japan UK USA G7 total China Total Import
2000Amount 5.70 25.10 3.80 11.30 10.20 5.60 53.80 115.50 36.90 557.10
% 1.02 4.51 0.68 2.03 1.83 1.01 9.66 20.73 6.62 100.00
2005Amount 6.15 37.59 5.61 14.99 11.70 4.66 67.24 147.94 102.91 1119.14
% 0.55 3.36 0.50 1.34 1.05 0.42 6.01 13.22 9.20 100.00
2010Amount 31.40 88.62 10.46 18.99 86.42 16.65 191.25 443.80 666.30 3245.65
% 0.97 2.73 0.32 0.59 2.66 0.51 5.89 13.67 20.53 100.00
2015Amount 23.03 92.90 22.70 11.21 61.44 13.00 122.07 346.34 1029.11 4097.85
% 0.56 2.27 0.55 0.27 1.50 0.32 2.98 8.45 25.11 100.00
2016Amount 21.78 62.41 25.44 10.50 18.95 9.23 153.61 301.91 1464.96 3873.85
% 0.56 1.61 0.66 0.27 0.49 0.24 3.97 7.79 37.82 100.00
2017Amount 26.82 67.49 27.09 6.16 34.45 14.53 155.22 331.76 1493.69 4504.59
% 0.60 1.50 0.60 0.14 0.76 0.32 3.45 7.37 33.16 100.00
Source:IMF Direction of Trade Statistics,
http://data.imf.org/?sk=9D6028D4-F14A-464C-A2F2-59B2CD424B85.
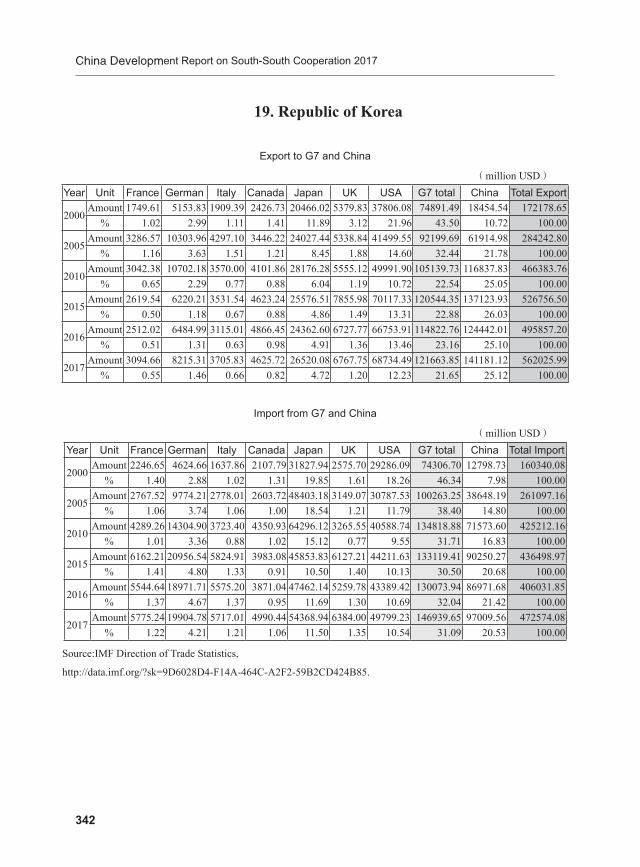
China Development Report on South-South Cooperation 2017
342
19. Republic of Korea
Export to G7 and China
(million USD)
Year Unit France German Italy Canada Japan UK USA G7 total China Total Export
2000Amount 1749.61 5153.83 1909.39 2426.73 20466.02 5379.83 37806.08 74891.49 18454.54 172178.65
% 1.02 2.99 1.11 1.41 11.89 3.12 21.96 43.50 10.72 100.00
2005Amount 3286.57 10303.96 4297.10 3446.22 24027.44 5338.84 41499.55 92199.69 61914.98 284242.80
% 1.16 3.63 1.51 1.21 8.45 1.88 14.60 32.44 21.78 100.00
2010Amount 3042.38 10702.18 3570.00 4101.86 28176.28 5555.12 49991.90 105139.73 116837.83 466383.76
% 0.65 2.29 0.77 0.88 6.04 1.19 10.72 22.54 25.05 100.00
2015Amount 2619.54 6220.21 3531.54 4623.24 25576.51 7855.98 70117.33 120544.35 137123.93 526756.50
% 0.50 1.18 0.67 0.88 4.86 1.49 13.31 22.88 26.03 100.00
2016Amount 2512.02 6484.99 3115.01 4866.45 24362.60 6727.77 66753.91 114822.76 124442.01 495857.20
% 0.51 1.31 0.63 0.98 4.91 1.36 13.46 23.16 25.10 100.00
2017Amount 3094.66 8215.31 3705.83 4625.72 26520.08 6767.75 68734.49 121663.85 141181.12 562025.99
% 0.55 1.46 0.66 0.82 4.72 1.20 12.23 21.65 25.12 100.00
Import from G7 and China
(million USD)
Year Unit France German Italy Canada Japan UK USA G7 total China Total Import
2000Amount 2246.65 4624.66 1637.86 2107.79 31827.94 2575.70 29286.09 74306.70 12798.73 160340.08
% 1.40 2.88 1.02 1.31 19.85 1.61 18.26 46.34 7.98 100.00
2005Amount 2767.52 9774.21 2778.01 2603.72 48403.18 3149.07 30787.53 100263.25 38648.19 261097.16
% 1.06 3.74 1.06 1.00 18.54 1.21 11.79 38.40 14.80 100.00
2010Amount 4289.26 14304.90 3723.40 4350.93 64296.12 3265.55 40588.74 134818.88 71573.60 425212.16
% 1.01 3.36 0.88 1.02 15.12 0.77 9.55 31.71 16.83 100.00
2015Amount 6162.21 20956.54 5824.91 3983.08 45853.83 6127.21 44211.63 133119.41 90250.27 436498.97
% 1.41 4.80 1.33 0.91 10.50 1.40 10.13 30.50 20.68 100.00
2016Amount 5544.64 18971.71 5575.20 3871.04 47462.14 5259.78 43389.42 130073.94 86971.68 406031.85
% 1.37 4.67 1.37 0.95 11.69 1.30 10.69 32.04 21.42 100.00
2017Amount 5775.24 19904.78 5717.01 4990.44 54368.94 6384.00 49799.23 146939.65 97009.56 472574.08
% 1.22 4.21 1.21 1.06 11.50 1.35 10.54 31.09 20.53 100.00
Source:IMF Direction of Trade Statistics,
http://data.imf.org/?sk=9D6028D4-F14A-464C-A2F2-59B2CD424B85.
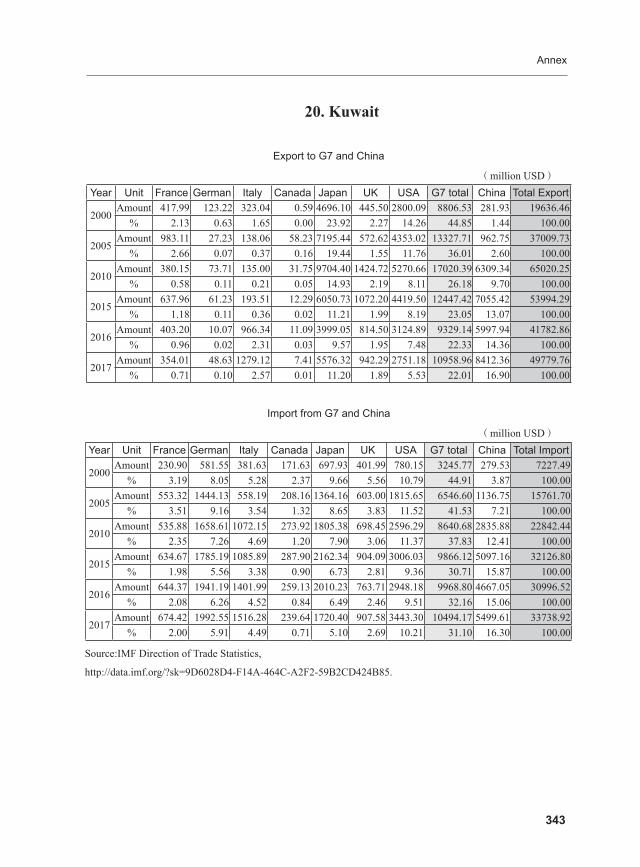
Annex
343
20. Kuwait
Export to G7 and China
(million USD)
Year Unit France German Italy Canada Japan UK USA G7 total China Total Export
2000Amount 417.99 123.22 323.04 0.59 4696.10 445.50 2800.09 8806.53 281.93 19636.46
% 2.13 0.63 1.65 0.00 23.92 2.27 14.26 44.85 1.44 100.00
2005Amount 983.11 27.23 138.06 58.23 7195.44 572.62 4353.02 13327.71 962.75 37009.73
% 2.66 0.07 0.37 0.16 19.44 1.55 11.76 36.01 2.60 100.00
2010Amount 380.15 73.71 135.00 31.75 9704.40 1424.72 5270.66 17020.39 6309.34 65020.25
% 0.58 0.11 0.21 0.05 14.93 2.19 8.11 26.18 9.70 100.00
2015Amount 637.96 61.23 193.51 12.29 6050.73 1072.20 4419.50 12447.42 7055.42 53994.29
% 1.18 0.11 0.36 0.02 11.21 1.99 8.19 23.05 13.07 100.00
2016Amount 403.20 10.07 966.34 11.09 3999.05 814.50 3124.89 9329.14 5997.94 41782.86
% 0.96 0.02 2.31 0.03 9.57 1.95 7.48 22.33 14.36 100.00
2017Amount 354.01 48.63 1279.12 7.41 5576.32 942.29 2751.18 10958.96 8412.36 49779.76
% 0.71 0.10 2.57 0.01 11.20 1.89 5.53 22.01 16.90 100.00
Import from G7 and China
(million USD)
Year Unit France German Italy Canada Japan UK USA G7 total China Total Import
2000Amount 230.90 581.55 381.63 171.63 697.93 401.99 780.15 3245.77 279.53 7227.49
% 3.19 8.05 5.28 2.37 9.66 5.56 10.79 44.91 3.87 100.00
2005Amount 553.32 1444.13 558.19 208.16 1364.16 603.00 1815.65 6546.60 1136.75 15761.70
% 3.51 9.16 3.54 1.32 8.65 3.83 11.52 41.53 7.21 100.00
2010Amount 535.88 1658.61 1072.15 273.92 1805.38 698.45 2596.29 8640.68 2835.88 22842.44
% 2.35 7.26 4.69 1.20 7.90 3.06 11.37 37.83 12.41 100.00
2015Amount 634.67 1785.19 1085.89 287.90 2162.34 904.09 3006.03 9866.12 5097.16 32126.80
% 1.98 5.56 3.38 0.90 6.73 2.81 9.36 30.71 15.87 100.00
2016Amount 644.37 1941.19 1401.99 259.13 2010.23 763.71 2948.18 9968.80 4667.05 30996.52
% 2.08 6.26 4.52 0.84 6.49 2.46 9.51 32.16 15.06 100.00
2017Amount 674.42 1992.55 1516.28 239.64 1720.40 907.58 3443.30 10494.17 5499.61 33738.92
% 2.00 5.91 4.49 0.71 5.10 2.69 10.21 31.10 16.30 100.00
Source:IMF Direction of Trade Statistics,
http://data.imf.org/?sk=9D6028D4-F14A-464C-A2F2-59B2CD424B85.
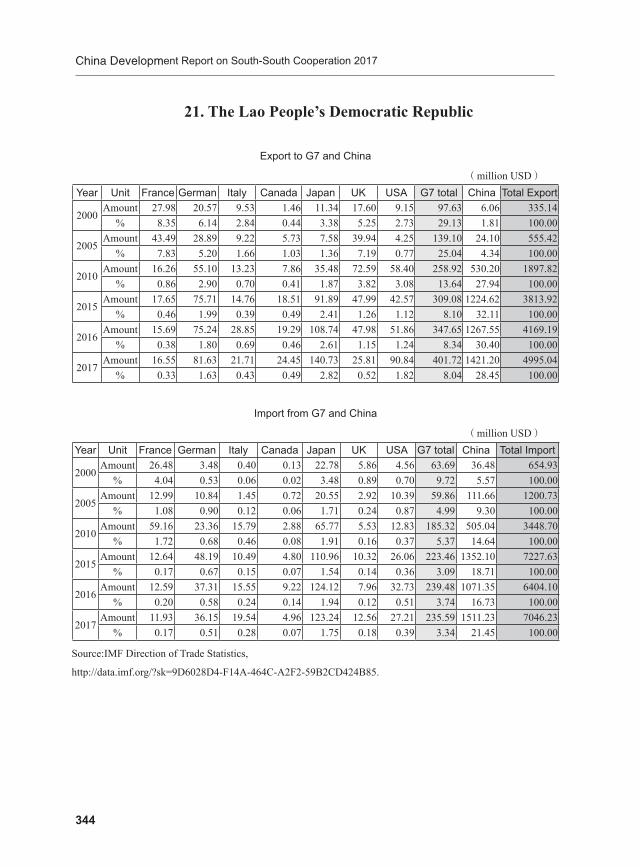
China Development Report on South-South Cooperation 2017
344
21. The Lao People’s Democratic Republic
Export to G7 and China
(million USD)
Year Unit France German Italy Canada Japan UK USA G7 total China Total Export
2000Amount 27.98 20.57 9.53 1.46 11.34 17.60 9.15 97.63 6.06 335.14
% 8.35 6.14 2.84 0.44 3.38 5.25 2.73 29.13 1.81 100.00
2005Amount 43.49 28.89 9.22 5.73 7.58 39.94 4.25 139.10 24.10 555.42
% 7.83 5.20 1.66 1.03 1.36 7.19 0.77 25.04 4.34 100.00
2010Amount 16.26 55.10 13.23 7.86 35.48 72.59 58.40 258.92 530.20 1897.82
% 0.86 2.90 0.70 0.41 1.87 3.82 3.08 13.64 27.94 100.00
2015Amount 17.65 75.71 14.76 18.51 91.89 47.99 42.57 309.08 1224.62 3813.92
% 0.46 1.99 0.39 0.49 2.41 1.26 1.12 8.10 32.11 100.00
2016Amount 15.69 75.24 28.85 19.29 108.74 47.98 51.86 347.65 1267.55 4169.19
% 0.38 1.80 0.69 0.46 2.61 1.15 1.24 8.34 30.40 100.00
2017Amount 16.55 81.63 21.71 24.45 140.73 25.81 90.84 401.72 1421.20 4995.04
% 0.33 1.63 0.43 0.49 2.82 0.52 1.82 8.04 28.45 100.00
Import from G7 and China
(million USD)
Year Unit France German Italy Canada Japan UK USA G7 total China Total Import
2000Amount 26.48 3.48 0.40 0.13 22.78 5.86 4.56 63.69 36.48 654.93
% 4.04 0.53 0.06 0.02 3.48 0.89 0.70 9.72 5.57 100.00
2005Amount 12.99 10.84 1.45 0.72 20.55 2.92 10.39 59.86 111.66 1200.73
% 1.08 0.90 0.12 0.06 1.71 0.24 0.87 4.99 9.30 100.00
2010Amount 59.16 23.36 15.79 2.88 65.77 5.53 12.83 185.32 505.04 3448.70
% 1.72 0.68 0.46 0.08 1.91 0.16 0.37 5.37 14.64 100.00
2015Amount 12.64 48.19 10.49 4.80 110.96 10.32 26.06 223.46 1352.10 7227.63
% 0.17 0.67 0.15 0.07 1.54 0.14 0.36 3.09 18.71 100.00
2016Amount 12.59 37.31 15.55 9.22 124.12 7.96 32.73 239.48 1071.35 6404.10
% 0.20 0.58 0.24 0.14 1.94 0.12 0.51 3.74 16.73 100.00
2017Amount 11.93 36.15 19.54 4.96 123.24 12.56 27.21 235.59 1511.23 7046.23
% 0.17 0.51 0.28 0.07 1.75 0.18 0.39 3.34 21.45 100.00
Source:IMF Direction of Trade Statistics,
http://data.imf.org/?sk=9D6028D4-F14A-464C-A2F2-59B2CD424B85.

Annex
345
22. Lebanon
Export to G7 and China
(million USD)
Year Unit France German Italy Canada Japan UK USA G7 total China Total Export
2000Amount 36.92 17.67 17.96 7.58 5.46 11.04 2.13 98.76 2.04 664.57
% 5.56 2.66 2.70 1.14 0.82 1.66 0.32 14.86 0.31 100.00
2005Amount 33.34 18.29 17.26 14.49 4.44 28.83 0.03 116.70 26.03 1807.22
% 1.85 1.01 0.96 0.80 0.25 1.60 0.00 6.46 1.44 100.00
2010Amount 52.53 48.86 30.66 15.17 13.58 48.67 0.00 209.47 49.95 3839.94
% 1.37 1.27 0.80 0.40 0.35 1.27 0.00 5.45 1.30 100.00
2015Amount 69.15 53.22 76.10 21.32 2.90 46.81 66.38 335.87 162.08 3981.03
% 1.74 1.34 1.91 0.54 0.07 1.18 1.67 8.44 4.07 100.00
2016Amount 72.62 64.35 51.42 20.72 12.40 38.26 59.18 318.95 244.84 3929.85
% 1.85 1.64 1.31 0.53 0.32 0.97 1.51 8.12 6.23 100.00
2017Amount 65.79 43.46 30.05 22.56 5.88 41.13 77.07 285.93 443.21 4025.71
% 1.63 1.08 0.75 0.56 0.15 1.02 1.91 7.10 11.01 100.00
Import from G7 and China
(million USD)
Year Unit France German Italy Canada Japan UK USA G7 total China Total Import
2000Amount 527.23 519.62 680.09 29.93 210.92 243.36 457.63 2668.78 287.12 6200.56
% 8.50 8.38 10.97 0.48 3.40 3.92 7.38 43.04 4.63 100.00
2005Amount 788.77 657.31 975.95 34.89 306.95 323.23 548.60 3635.70 734.44 9243.21
% 8.53 7.11 10.56 0.38 3.32 3.50 5.94 39.33 7.95 100.00
2010Amount 1196.24 1259.44 1397.95 57.62 622.09 526.72 1918.68 6978.74 1637.95 17933.15
% 6.67 7.02 7.80 0.32 3.47 2.94 10.70 38.92 9.13 100.00
2015Amount 1123.69 1237.77 1348.93 102.14 411.81 588.24 1311.44 6124.03 2083.30 18948.10
% 5.93 6.53 7.12 0.54 2.17 3.10 6.92 32.32 10.99 100.00
2016Amount 730.17 1187.18 1421.79 119.38 416.02 512.07 1417.27 5803.88 2100.11 19361.01
% 3.77 6.13 7.34 0.62 2.15 2.64 7.32 29.98 10.85 100.00
2017Amount 786.56 1239.07 1787.97 145.57 376.93 485.43 1460.87 6282.40 1885.04 19895.84
% 3.95 6.23 8.99 0.73 1.89 2.44 7.34 31.58 9.47 100.00
Source:IMF Direction of Trade Statistics,
http://data.imf.org/?sk=9D6028D4-F14A-464C-A2F2-59B2CD424B85.

China Development Report on South-South Cooperation 2017
346
23. Maldives
Export to G7 and China
(million USD)
Year Unit France German Italy Canada Japan UK USA G7 total China Total Export
2000Amount 0.01 6.90 0.54 0.16 3.18 5.52 33.70 50.01 0.00 76.67
% 0.02 9.00 0.71 0.21 4.14 7.20 43.95 65.22 0.00 100.00
2005Amount 4.20 4.75 1.74 0.10 22.50 12.41 0.77 46.47 0.04 103.42
% 4.07 4.59 1.68 0.10 21.75 12.00 0.74 44.93 0.04 100.00
2010Amount 8.08 2.10 6.88 0.00 1.29 7.08 0.50 25.92 0.30 73.66
% 10.97 2.85 9.34 0.00 1.75 9.61 0.68 35.19 0.41 100.00
2015Amount 15.13 10.03 8.08 0.54 4.72 8.29 14.68 61.46 0.03 147.74
% 10.24 6.79 5.47 0.37 3.19 5.61 9.93 41.60 0.02 100.00
2016Amount 12.27 12.19 6.87 0.26 2.97 5.77 12.37 52.70 0.11 140.83
% 8.71 8.66 4.88 0.18 2.11 4.10 8.78 37.42 0.08 100.00
2017Amount 13.30 10.69 6.45 0.08 2.85 8.41 13.10 54.87 0.29 230.19
% 5.78 4.65 2.80 0.03 1.24 3.65 5.69 23.84 0.12 100.00
Import from G7 and China
(million USD)
Year Unit France German Italy Canada Japan UK USA G7 total China Total Import
2000Amount 5.74 5.81 5.27 5.77 13.16 9.47 8.64 53.86 1.06 389.78
% 1.47 1.49 1.35 1.48 3.38 2.43 2.22 13.82 0.27 100.00
2005Amount 16.26 15.01 10.67 5.44 13.38 33.53 8.48 102.76 16.01 744.04
% 2.18 2.02 1.43 0.73 1.80 4.51 1.14 13.81 2.15 100.00
2010Amount 11.46 20.16 14.59 7.41 10.24 9.94 27.93 101.73 31.57 1101.70
% 1.04 1.83 1.32 0.67 0.93 0.90 2.54 9.23 2.87 100.00
2015Amount 19.01 35.70 23.48 15.39 16.89 17.78 37.45 165.70 147.34 1908.95
% 1.00 1.87 1.23 0.81 0.88 0.93 1.96 8.68 7.72 100.00
2016Amount 17.49 51.69 33.59 15.09 20.83 19.17 42.22 200.08 285.64 2138.13
% 0.82 2.42 1.57 0.71 0.97 0.90 1.97 9.36 13.36 100.00
2017Amount 27.39 61.87 39.00 29.37 24.53 20.47 46.11 248.74 256.93 2351.60
% 1.16 2.63 1.66 1.25 1.04 0.87 1.96 10.58 10.93 100.00
Source:IMF Direction of Trade Statistics,
http://data.imf.org/?sk=9D6028D4-F14A-464C-A2F2-59B2CD424B85.

Annex
347
24. Malaysia
Export to G7 and China
(million USD)
Year Unit France German Italy Canada Japan UK USA G7 total China Total Export
2000Amount 731.87 2455.98 544.67 801.20 12780.24 3045.57 20161.58 40521.09 3028.16 98154.12
% 0.75 2.50 0.55 0.82 13.02 3.10 20.54 41.28 3.09 100.00
2005Amount 1847.82 2973.48 706.66 751.93 13181.20 2500.72 27763.49 49725.31 9303.10 140972.90
% 1.31 2.11 0.50 0.53 9.35 1.77 19.69 35.27 6.60 100.00
2010Amount 2250.70 5405.12 1074.50 973.22 20781.82 2236.47 18986.69 51708.52 24912.05 198747.79
% 1.13 2.72 0.54 0.49 10.46 1.13 9.55 26.02 12.53 100.00
2015Amount 1488.47 5021.74 927.98 785.67 18999.05 2386.76 18879.77 48489.43 25986.96 199957.68
% 0.74 2.51 0.46 0.39 9.50 1.19 9.44 24.25 13.00 100.00
2016Amount 1415.52 5373.42 965.01 704.49 15250.31 2106.22 19353.88 45168.85 23753.27 188709.88
% 0.75 2.85 0.51 0.37 8.08 1.12 10.26 23.94 12.59 100.00
2017Amount 1368.51 6171.51 1058.39 815.66 17304.48 2257.51 20576.24 49552.31 29188.47 217382.37
% 0.63 2.84 0.49 0.38 7.96 1.04 9.47 22.79 13.43 100.00
Import from G7 and China
(million USD)
Year Unit France German Italy Canada Japan UK USA G7 total China Total Import
2000Amount 1361.22 2441.40 554.05 379.17 17330.66 1606.07 13668.14 37340.72 3237.14 82205.20
% 1.66 2.97 0.67 0.46 21.08 1.95 16.63 45.42 3.94 100.00
2005Amount 1495.09 5088.07 1239.17 563.16 16634.21 1722.03 14789.11 41530.84 13176.56 113608.73
% 1.32 4.48 1.09 0.50 14.64 1.52 13.02 36.56 11.60 100.00
2010Amount 1957.77 6647.93 1416.86 891.69 20725.92 1811.08 17526.14 50977.41 20682.18 164735.65
% 1.19 4.04 0.86 0.54 12.58 1.10 10.64 30.94 12.55 100.00
2015Amount 2237.22 6009.42 1330.10 702.62 13785.39 1834.67 14193.52 40092.94 33155.16 175967.13
% 1.27 3.42 0.76 0.40 7.83 1.04 8.07 22.78 18.84 100.00
2016Amount 2287.39 5732.44 1387.87 666.61 13733.98 1579.06 13418.64 38805.97 34306.47 178109.89
% 1.28 3.22 0.78 0.37 7.71 0.89 7.53 21.79 19.26 100.00
2017Amount 2985.65 6073.38 1669.00 702.82 14692.48 1577.45 16046.64 43747.41 38040.31 206744.36
% 1.44 2.94 0.81 0.34 7.11 0.76 7.76 21.16 18.40 100.00
Source:IMF Direction of Trade Statistics,
http://data.imf.org/?sk=9D6028D4-F14A-464C-A2F2-59B2CD424B85.

China Development Report on South-South Cooperation 2017
348
25. Mongolia
Export to G7 and China
(million USD)
Year Unit France German Italy Canada Japan UK USA G7 total China Total Export
2000Amount 1.81 1.94 14.54 0.79 8.11 17.46 130.24 174.89 267.07 535.83
% 0.34 0.36 2.71 0.15 1.51 3.26 24.31 32.64 49.84 100.00
2005Amount 0.65 12.45 24.59 122.05 5.78 87.02 150.05 402.59 507.07 1053.82
% 0.06 1.18 2.33 11.58 0.55 8.26 14.24 38.20 48.12 100.00
2010Amount 1.08 18.41 41.52 182.01 14.64 70.23 17.61 345.50 2505.95 2951.15
% 0.04 0.62 1.41 6.17 0.50 2.38 0.60 11.71 84.91 100.00
2015Amount 7.34 10.81 43.40 1.63 20.32 337.68 18.73 439.90 3897.42 4668.39
% 0.16 0.23 0.93 0.03 0.44 7.23 0.40 9.42 83.49 100.00
2016Amount 6.94 43.39 33.58 3.72 14.03 786.88 10.46 898.99 3883.13 4908.33
% 0.14 0.88 0.68 0.08 0.29 16.03 0.21 18.32 79.11 100.00
2017Amount 5.74 11.65 43.30 2.36 14.82 660.54 8.30 746.69 5269.01 6200.66
% 0.09 0.19 0.70 0.04 0.24 10.65 0.13 12.04 84.97 100.00
Import from G7 and China
(million USD)
Year Unit France German Italy Canada Japan UK USA G7 total China Total Import
2000Amount 8.35 29.73 2.97 0.91 73.32 5.96 28.41 149.65 109.52 614.46
% 1.36 4.84 0.48 0.15 11.93 0.97 4.62 24.35 17.82 100.00
2005Amount 29.17 33.36 3.27 16.78 82.19 8.30 36.04 209.11 317.85 1160.30
% 2.51 2.87 0.28 1.45 7.08 0.71 3.11 18.02 27.39 100.00
2010Amount 59.90 101.83 15.57 12.58 497.92 23.10 313.85 1024.75 1692.97 4322.97
% 1.39 2.36 0.36 0.29 11.52 0.53 7.26 23.70 39.16 100.00
2015Amount 27.48 124.43 33.27 19.63 274.64 23.68 116.37 619.50 1360.71 3817.54
% 0.72 3.26 0.87 0.51 7.19 0.62 3.05 16.23 35.64 100.00
2016Amount 19.51 120.02 31.99 19.18 330.61 28.20 139.38 688.89 1040.23 3350.18
% 0.58 3.58 0.95 0.57 9.87 0.84 4.16 20.56 31.05 100.00
2017Amount 32.44 128.35 45.85 29.87 363.15 29.36 208.56 837.59 1412.63 4335.18
% 0.75 2.96 1.06 0.69 8.38 0.68 4.81 19.32 32.59 100.00
Source:IMF Direction of Trade Statistics,
http://data.imf.org/?sk=9D6028D4-F14A-464C-A2F2-59B2CD424B85.

Annex
349
26. Myanmar
Export to G7 and China
(million USD)
Year Unit France German Italy Canada Japan UK USA G7 total China Total Export
2000Amount 29.39 0.00 20.37 27.58 85.52 64.95 488.69 716.51 133.82 2471.59
% 1.19 0.00 0.82 1.12 3.46 2.63 19.77 28.99 5.41 100.00
2005Amount 16.37 0.00 25.80 6.16 144.84 54.62 1.69 249.47 289.14 4291.34
% 0.38 0.00 0.60 0.14 3.38 1.27 0.04 5.81 6.74 100.00
2010Amount 1.30 0.00 5.82 0.01 215.15 34.77 1.69 258.74 476.27 7702.63
% 0.02 0.00 0.08 0.00 2.79 0.45 0.02 3.36 6.18 100.00
2015Amount 15.13 79.42 24.54 8.09 486.59 39.24 69.51 722.51 4830.84 12246.56
% 0.12 0.65 0.20 0.07 3.97 0.32 0.57 5.90 39.45 100.00
2016Amount 40.98 172.36 43.87 32.48 663.43 68.76 150.30 1172.18 4766.68 11724.82
% 0.35 1.47 0.37 0.28 5.66 0.59 1.28 10.00 40.65 100.00
2017Amount 69.80 360.35 96.70 60.57 903.03 288.87 278.01 2057.33 5398.07 13904.07
% 0.50 2.59 0.70 0.44 6.49 2.08 2.00 14.80 38.82 100.00
Import from G7 and China
(million USD)
Year Unit France German Italy Canada Japan UK USA G7 total China Total Import
2000Amount 18.20 80.45 10.00 0.05 304.24 19.31 74.84 507.10 310.42 3226.56
% 0.56 2.49 0.31 0.00 9.43 0.60 2.32 15.72 9.62 100.00
2005Amount 13.63 0.00 2.09 0.35 117.14 7.23 10.81 151.25 616.42 2729.14
% 0.50 0.00 0.08 0.01 4.29 0.26 0.40 5.54 22.59 100.00
2010Amount 24.51 0.00 8.35 0.61 218.81 11.03 24.79 288.09 1128.48 4278.05
% 0.57 0.00 0.20 0.01 5.11 0.26 0.58 6.73 26.38 100.00
2015Amount 108.10 91.48 53.82 10.40 1534.26 24.11 103.12 1925.29 6432.33 17131.99
% 0.63 0.53 0.31 0.06 8.96 0.14 0.60 11.24 37.55 100.00
2016Amount 78.78 76.75 47.48 25.78 1254.70 27.83 216.45 1727.78 5403.10 15920.60
% 0.49 0.48 0.30 0.16 7.88 0.17 1.36 10.85 33.94 100.00
2017Amount 209.73 209.71 126.52 57.54 1055.10 48.45 694.75 2401.81 6115.76 19535.64
% 1.07 1.07 0.65 0.29 5.40 0.25 3.56 12.29 31.31 100.00
Source:IMF Direction of Trade Statistics,
http://data.imf.org/?sk=9D6028D4-F14A-464C-A2F2-59B2CD424B85.

China Development Report on South-South Cooperation 2017
350
27. Democratic People's Republic of Korea
Export to G7 and China
(million USD)
Year Unit France German Italy Canada Japan UK USA G7 total China Total Export
2000Amount 2.97 19.29 4.32 0.31 236.93 1.87 0.09 265.78 35.11 1117.70
% 0.27 1.73 0.39 0.03 21.20 0.17 0.01 23.78 3.14 100.00
2005Amount 1.41 13.12 0.65 0.04 124.80 1.75 0.00 141.77 468.41 1642.60
% 0.09 0.80 0.04 0.00 7.60 0.11 0.00 8.63 28.52 100.00
2010Amount 0.84 22.94 0.94 0.12 0.00 2.26 0.00 27.10 1120.62 2128.52
% 0.04 1.08 0.04 0.01 0.00 0.11 0.00 1.27 52.65 100.00
2015Amount 0.31 1.37 0.37 0.15 0.00 0.45 0.00 2.65 2343.34 2913.76
% 0.01 0.05 0.01 0.01 0.00 0.02 0.00 0.09 80.42 100.00
2016Amount 0.31 1.24 0.19 0.05 0.00 0.52 0.00 2.31 2553.76 2952.05
% 0.01 0.04 0.01 0.00 0.00 0.02 0.00 0.08 86.51 100.00
2017Amount 0.26 0.02 0.14 0.08 0.00 0.08 0.00 0.58 1607.31 1865.65
% 0.01 0.00 0.01 0.00 0.00 0.00 0.00 0.03 86.15 100.00
Import from G7 and China
(million USD)
Year Unit France German Italy Canada Japan UK USA G7 total China Total Import
2000Amount 9.33 56.40 13.24 15.83 216.95 26.86 2.76 341.37 477.89 1931.37
% 0.48 2.92 0.69 0.82 11.23 1.39 0.14 17.68 24.74 100.00
2005Amount 8.12 65.80 12.61 18.79 66.21 0.55 6.04 178.12 1149.81 3230.73
% 0.25 2.04 0.39 0.58 2.05 0.02 0.19 5.51 35.59 100.00
2010Amount 3.15 23.86 45.23 11.39 0.00 0.09 2.01 85.73 2414.48 3868.07
% 0.08 0.62 1.17 0.29 0.00 0.00 0.05 2.22 62.42 100.00
2015Amount 3.53 8.44 1.75 0.00 0.00 0.30 5.04 19.06 3123.25 3719.16
% 0.09 0.23 0.05 0.00 0.00 0.01 0.14 0.51 83.98 100.00
2016Amount 2.33 6.72 1.32 0.05 0.00 0.08 0.15 10.65 3388.61 3724.71
% 0.06 0.18 0.04 0.00 0.00 0.00 0.00 0.29 90.98 100.00
2017Amount 2.11 4.61 0.28 0.19 0.00 0.30 0.00 7.49 3527.75 3869.42
% 0.05 0.12 0.01 0.00 0.00 0.01 0.00 0.19 91.17 100.00
Source:IMF Direction of Trade Statistics,
http://data.imf.org/?sk=9D6028D4-F14A-464C-A2F2-59B2CD424B85.

Annex
351
28. Nepal
Export to G7 and China
(million USD)
Year Unit France German Italy Canada Japan UK USA G7 total China Total Export
2000Amount 10.70 108.70 4.30 4.10 10.20 17.30 198.00 353.30 0.00 721.72
% 1.48 15.06 0.60 0.57 1.41 2.40 27.43 48.95 0.00 100.00
2005Amount 8.60 43.30 8.10 7.30 7.40 14.60 105.10 194.40 0.70 814.16
% 1.06 5.32 0.99 0.90 0.91 1.79 12.91 23.88 0.09 100.00
2010Amount 16.68 35.73 9.53 11.33 8.19 17.67 54.65 153.79 13.63 899.70
% 1.85 3.97 1.06 1.26 0.91 1.96 6.07 17.09 1.51 100.00
2015Amount 10.06 26.76 9.04 6.95 8.37 20.66 70.40 152.24 11.48 691.86
% 1.45 3.87 1.31 1.00 1.21 2.99 10.18 22.00 1.66 100.00
2016Amount 11.62 29.44 10.91 8.30 11.20 24.65 88.48 184.60 18.11 757.28
% 1.53 3.89 1.44 1.10 1.48 3.26 11.68 24.38 2.39 100.00
2017Amount 11.07 29.10 12.06 8.26 9.65 25.36 82.60 178.10 22.33 769.21
% 1.44 3.78 1.57 1.07 1.25 3.30 10.74 23.15 2.90 100.00
Import from G7 and China
(million USD)
Year Unit France German Italy Canada Japan UK USA G7 total China Total Import
2000Amount 27.80 21.70 13.20 6.70 41.90 21.20 24.80 157.30 120.80 1571.99
% 1.77 1.38 0.84 0.43 2.67 1.35 1.58 10.01 7.68 100.00
2005Amount 9.30 21.80 2.60 3.80 35.60 20.20 24.50 117.80 114.60 2075.91
% 0.45 1.05 0.13 0.18 1.71 0.97 1.18 5.67 5.52 100.00
2010Amount 29.88 29.31 13.72 11.17 76.31 35.59 73.95 269.94 561.20 5143.38
% 0.58 0.57 0.27 0.22 1.48 0.69 1.44 5.25 10.91 100.00
2015Amount 74.51 88.80 15.48 59.35 52.39 18.74 96.04 405.31 920.00 6633.80
% 1.12 1.34 0.23 0.89 0.79 0.28 1.45 6.11 13.87 100.00
2016Amount 66.44 41.57 13.01 49.49 84.22 22.71 95.23 372.67 1247.16 8906.05
% 0.75 0.47 0.15 0.56 0.95 0.25 1.07 4.18 14.00 100.00
2017Amount 155.34 51.89 14.26 86.55 55.58 24.66 81.90 470.16 1267.43 10088.59
% 1.54 0.51 0.14 0.86 0.55 0.24 0.81 4.66 12.56 100.00
Source:IMF Direction of Trade Statistics,
http://data.imf.org/?sk=9D6028D4-F14A-464C-A2F2-59B2CD424B85.

China Development Report on South-South Cooperation 2017
352
29. Oman
Export to G7 and China
(million USD)
Year Unit France German Italy Canada Japan UK USA G7 total China Total Export
2000Amount 7.41 16.62 3.36 2.81 1944.47 73.57 124.95 2173.19 3114.64 10659.02
% 0.07 0.16 0.03 0.03 18.24 0.69 1.17 20.39 29.22 100.00
2005Amount 10.44 25.45 15.64 6.28 2484.54 70.37 376.96 2989.67 4253.13 18662.12
% 0.06 0.14 0.08 0.03 13.31 0.38 2.02 16.02 22.79 100.00
2010Amount 53.91 48.41 73.02 4.81 3453.58 105.05 862.56 4601.35 9263.55 36528.94
% 0.15 0.13 0.20 0.01 9.45 0.29 2.36 12.60 25.36 100.00
2015Amount 14.04 59.56 68.51 19.47 1051.75 54.92 532.29 1800.54 14724.71 34731.84
% 0.04 0.17 0.20 0.06 3.03 0.16 1.53 5.18 42.40 100.00
2016Amount 124.91 35.15 60.97 5.89 1023.02 38.64 791.81 2080.38 11185.53 26775.73
% 0.47 0.13 0.23 0.02 3.82 0.14 2.96 7.77 41.77 100.00
2017Amount 22.84 47.18 36.78 1.95 58.12 113.69 340.23 620.79 14075.74 28042.76
% 0.08 0.17 0.13 0.01 0.21 0.41 1.21 2.21 50.19 100.00
Import from G7 and China
(million USD)
Year Unit France German Italy Canada Japan UK USA G7 total China Total Import
2000Amount 100.33 187.43 93.12 16.28 912.53 293.31 270.44 1873.43 94.62 5039.29
% 1.99 3.72 1.85 0.32 18.11 5.82 5.37 37.18 1.88 100.00
2005Amount 185.78 605.70 176.10 22.97 1388.76 384.30 542.97 3306.58 212.79 8823.47
% 2.11 6.86 2.00 0.26 15.74 4.36 6.15 37.47 2.41 100.00
2010Amount 448.17 727.21 322.52 112.77 3307.07 445.67 974.14 6337.55 957.06 19773.67
% 2.27 3.68 1.63 0.57 16.72 2.25 4.93 32.05 4.84 100.00
2015Amount 267.72 862.93 599.10 89.19 1725.01 536.87 1460.29 5541.11 1518.34 29007.30
% 0.92 2.97 2.07 0.31 5.95 1.85 5.03 19.10 5.23 100.00
2016Amount 184.33 509.30 293.79 52.39 1045.39 389.82 1085.36 3560.37 1184.38 23110.77
% 0.80 2.20 1.27 0.23 4.52 1.69 4.70 15.41 5.12 100.00
2017Amount 254.39 379.25 446.18 60.76 340.93 475.07 834.46 2791.04 1561.26 26461.38
% 0.96 1.43 1.69 0.23 1.29 1.80 3.15 10.55 5.90 100.00
Source:IMF Direction of Trade Statistics,
http://data.imf.org/?sk=9D6028D4-F14A-464C-A2F2-59B2CD424B85.

Annex
353
30. Pakistan
Export to G7 and China
(million USD)
Year Unit France German Italy Canada Japan UK USA G7 total China Total Export
2000Amount 271.65 508.45 217.61 186.87 234.24 586.04 2236.91 4241.76 237.26 8876.49
% 3.06 5.73 2.45 2.11 2.64 6.60 25.20 47.79 2.67 100.00
2005Amount 363.29 724.62 582.82 211.74 143.37 907.63 3978.75 6912.22 435.59 16049.33
% 2.26 4.51 3.63 1.32 0.89 5.66 24.79 43.07 2.71 100.00
2010Amount 357.60 981.22 642.24 227.88 123.38 1113.87 3674.48 7120.67 1435.94 21485.24
% 1.66 4.57 2.99 1.06 0.57 5.18 17.10 33.14 6.68 100.00
2015Amount 360.63 1146.26 618.15 216.45 182.28 1572.80 3661.59 7758.16 1934.93 22139.54
% 1.63 5.18 2.79 0.98 0.82 7.10 16.54 35.04 8.74 100.00
2016Amount 372.96 1186.25 667.29 220.07 171.22 1557.63 3429.74 7605.16 1590.86 20547.14
% 1.82 5.77 3.25 1.07 0.83 7.58 16.69 37.01 7.74 100.00
2017Amount 389.42 1266.00 700.52 243.61 186.98 1625.94 3551.78 7964.25 1459.74 21503.68
% 1.81 5.89 3.26 1.13 0.87 7.56 16.52 37.04 6.79 100.00
Import from G7 and China
(million USD)
Year Unit France German Italy Canada Japan UK USA G7 total China Total Import
2000Amount 212.62 388.62 175.20 82.63 607.46 345.32 653.08 2464.92 537.86 10721.95
% 1.98 3.62 1.63 0.77 5.67 3.22 6.09 22.99 5.02 100.00
2005Amount 297.21 1145.01 437.37 213.40 1633.47 720.89 1531.84 5979.19 2348.74 25410.79
% 1.17 4.51 1.72 0.84 6.43 2.84 6.03 23.53 9.24 100.00
2010Amount 399.53 985.59 566.71 463.73 1594.71 635.57 1627.80 6273.64 5247.71 37537.03
% 1.06 2.63 1.51 1.24 4.25 1.69 4.34 16.71 13.98 100.00
2015Amount 416.62 972.15 443.52 440.73 1725.91 610.55 1916.78 6526.26 11019.01 43989.64
% 0.95 2.21 1.01 1.00 3.92 1.39 4.36 14.84 25.05 100.00
2016Amount 443.98 996.46 527.47 771.34 1961.40 623.12 2006.82 7330.59 13680.15 46998.27
% 0.94 2.12 1.12 1.64 4.17 1.33 4.27 15.60 29.11 100.00
2017Amount 669.36 1108.98 602.99 628.04 2283.62 762.86 2773.31 8829.16 15356.32 57286.16
% 1.17 1.94 1.05 1.10 3.99 1.33 4.84 15.41 26.81 100.00
Source:IMF Direction of Trade Statistics,
http://data.imf.org/?sk=9D6028D4-F14A-464C-A2F2-59B2CD424B85.

China Development Report on South-South Cooperation 2017
354
31. Philippines
Export to G7 and China
(million USD)
Year Unit France German Italy Canada Japan UK USA G7 total China Total Export
2000Amount 295.05 1328.62 172.11 343.31 5608.67 1506.31 11405.68 20659.76 663.29 38216.22
% 0.77 3.48 0.45 0.90 14.68 3.94 29.85 54.06 1.74 100.00
2005Amount 186.73 1345.57 166.29 264.84 7203.24 436.15 7429.25 17032.07 4076.68 41221.24
% 0.45 3.26 0.40 0.64 17.47 1.06 18.02 41.32 9.89 100.00
2010Amount 413.30 2657.31 349.38 333.62 7827.50 394.96 7568.16 19544.23 5701.50 51431.68
% 0.80 5.17 0.68 0.65 15.22 0.77 14.71 38.00 11.09 100.00
2015Amount 416.17 2646.46 187.14 563.50 12381.20 477.82 8811.43 25483.71 6393.07 58648.33
% 0.71 4.51 0.32 0.96 21.11 0.81 15.02 43.45 10.90 100.00
2016Amount 726.78 2293.13 162.69 523.92 11674.11 475.80 8670.65 24527.08 6192.43 56125.86
% 1.29 4.09 0.29 0.93 20.80 0.85 15.45 43.70 11.03 100.00
2017Amount 791.30 2620.77 304.28 516.84 10229.72 480.56 9214.80 24158.28 6992.77 63130.65
% 1.25 4.15 0.48 0.82 16.20 0.76 14.60 38.27 11.08 100.00
Import from G7 and China
(million USD)
Year Unit France German Italy Canada Japan UK USA G7 total China Total Import
2000Amount 369.92 770.95 174.60 220.85 6511.26 367.61 6412.84 14828.03 785.95 34490.87
% 1.07 2.24 0.51 0.64 18.88 1.07 18.59 42.99 2.28 100.00
2005Amount 397.94 1131.45 178.73 235.18 8071.08 392.88 9104.94 19512.19 2972.59 47414.75
% 0.84 2.39 0.38 0.50 17.02 0.83 19.20 41.15 6.27 100.00
2010Amount 691.63 1223.36 230.69 451.07 7421.86 312.63 6451.87 16783.10 5069.72 60192.97
% 1.15 2.03 0.38 0.75 12.33 0.52 10.72 27.88 8.42 100.00
2015Amount 1140.27 2761.09 468.12 407.94 7022.95 425.98 7940.39 20166.74 11915.23 73354.57
% 1.55 3.76 0.64 0.56 9.57 0.58 10.82 27.49 16.24 100.00
2016Amount 1006.01 2009.69 511.24 418.00 10196.48 513.40 7680.90 22335.72 15916.07 91427.51
% 1.10 2.20 0.56 0.46 11.15 0.56 8.40 24.43 17.41 100.00
2017Amount 906.40 1923.93 563.69 627.02 10555.15 506.86 7417.93 22500.97 16831.89 92839.36
% 0.98 2.07 0.61 0.68 11.37 0.55 7.99 24.24 18.13 100.00
Source:IMF Direction of Trade Statistics,
http://data.imf.org/?sk=9D6028D4-F14A-464C-A2F2-59B2CD424B85.

Annex
355
32. Qatar
Export to G7 and China
(million USD)
Year Unit France German Italy Canada Japan UK USA G7 total China Total Export
2000Amount 10.35 7.00 1.78 62.29 5215.72 16.95 360.51 5674.60 316.60 11586.88
% 0.09 0.06 0.02 0.54 45.01 0.15 3.11 48.97 2.73 100.00
2005Amount 52.40 13.55 19.61 1.19 10303.86 15.60 318.25 10724.45 376.96 25741.19
% 0.20 0.05 0.08 0.00 40.03 0.06 1.24 41.66 1.46 100.00
2010Amount 1176.72 64.26 93.67 72.41 21484.40 3535.52 793.90 27220.89 2225.22 74530.18
% 1.58 0.09 0.13 0.10 28.83 4.74 1.07 36.52 2.99 100.00
2015Amount 827.61 159.83 1603.58 13.74 16032.72 3472.31 915.48 23025.26 5289.81 76201.72
% 1.09 0.21 2.10 0.02 21.04 4.56 1.20 30.22 6.94 100.00
2016Amount 301.04 280.47 1104.30 16.75 10935.05 1875.83 683.46 15196.90 4485.83 57707.89
% 0.52 0.49 1.91 0.03 18.95 3.25 1.18 26.33 7.77 100.00
2017Amount 422.48 225.67 1363.70 10.07 11573.69 1588.56 882.17 16066.35 7244.97 67498.17
% 0.63 0.33 2.02 0.01 17.15 2.35 1.31 23.80 10.73 100.00
Import from G7 and China
(million USD)
Year Unit France German Italy Canada Japan UK USA G7 total China Total Import
2000Amount 178.11 265.68 218.59 28.23 358.31 252.55 335.08 1636.54 97.24 3235.14
% 5.51 8.21 6.76 0.87 11.08 7.81 10.36 50.59 3.01 100.00
2005Amount 425.08 923.61 649.64 45.12 1171.15 575.92 1162.74 4953.25 519.85 10059.62
% 4.23 9.18 6.46 0.45 11.64 5.73 11.56 49.24 5.17 100.00
2010Amount 1108.45 1684.17 1510.85 159.92 1750.87 1184.26 2745.28 10143.80 2103.91 22438.26
% 4.94 7.51 6.73 0.71 7.80 5.28 12.23 45.21 9.38 100.00
2015Amount 1245.92 2442.48 1451.04 166.07 2134.19 1853.11 3575.70 12868.51 3765.19 31629.16
% 3.94 7.72 4.59 0.53 6.75 5.86 11.31 40.69 11.90 100.00
2016Amount 1031.08 2970.44 1290.27 329.90 2140.02 1315.03 4606.49 13683.23 3320.17 32292.69
% 3.19 9.20 4.00 1.02 6.63 4.07 14.26 42.37 10.28 100.00
2017Amount 931.30 2075.61 1329.59 163.96 1582.51 1390.99 4888.43 12362.38 3395.76 29913.62
% 3.11 6.94 4.44 0.55 5.29 4.65 16.34 41.33 11.35 100.00
Source:IMF Direction of Trade Statistics,
http://data.imf.org/?sk=9D6028D4-F14A-464C-A2F2-59B2CD424B85.
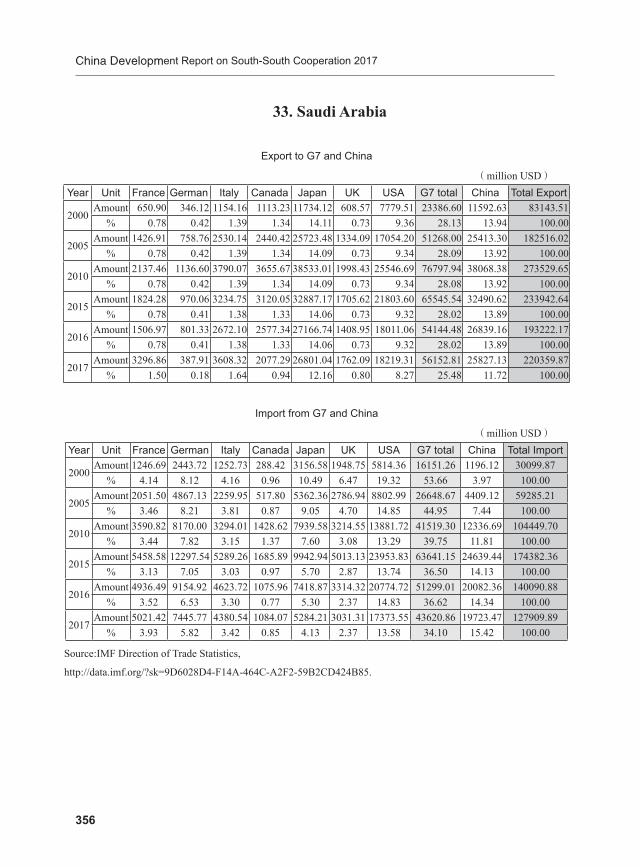
China Development Report on South-South Cooperation 2017
356
33. Saudi Arabia
Export to G7 and China
(million USD)
Year Unit France German Italy Canada Japan UK USA G7 total China Total Export
2000Amount 650.90 346.12 1154.16 1113.23 11734.12 608.57 7779.51 23386.60 11592.63 83143.51
% 0.78 0.42 1.39 1.34 14.11 0.73 9.36 28.13 13.94 100.00
2005Amount 1426.91 758.76 2530.14 2440.42 25723.48 1334.09 17054.20 51268.00 25413.30 182516.02
% 0.78 0.42 1.39 1.34 14.09 0.73 9.34 28.09 13.92 100.00
2010Amount 2137.46 1136.60 3790.07 3655.67 38533.01 1998.43 25546.69 76797.94 38068.38 273529.65
% 0.78 0.42 1.39 1.34 14.09 0.73 9.34 28.08 13.92 100.00
2015Amount 1824.28 970.06 3234.75 3120.05 32887.17 1705.62 21803.60 65545.54 32490.62 233942.64
% 0.78 0.41 1.38 1.33 14.06 0.73 9.32 28.02 13.89 100.00
2016Amount 1506.97 801.33 2672.10 2577.34 27166.74 1408.95 18011.06 54144.48 26839.16 193222.17
% 0.78 0.41 1.38 1.33 14.06 0.73 9.32 28.02 13.89 100.00
2017Amount 3296.86 387.91 3608.32 2077.29 26801.04 1762.09 18219.31 56152.81 25827.13 220359.87
% 1.50 0.18 1.64 0.94 12.16 0.80 8.27 25.48 11.72 100.00
Import from G7 and China
(million USD)
Year Unit France German Italy Canada Japan UK USA G7 total China Total Import
2000Amount 1246.69 2443.72 1252.73 288.42 3156.58 1948.75 5814.36 16151.26 1196.12 30099.87
% 4.14 8.12 4.16 0.96 10.49 6.47 19.32 53.66 3.97 100.00
2005Amount 2051.50 4867.13 2259.95 517.80 5362.36 2786.94 8802.99 26648.67 4409.12 59285.21
% 3.46 8.21 3.81 0.87 9.05 4.70 14.85 44.95 7.44 100.00
2010Amount 3590.82 8170.00 3294.01 1428.62 7939.58 3214.55 13881.72 41519.30 12336.69 104449.70
% 3.44 7.82 3.15 1.37 7.60 3.08 13.29 39.75 11.81 100.00
2015Amount 5458.58 12297.54 5289.26 1685.89 9942.94 5013.13 23953.83 63641.15 24639.44 174382.36
% 3.13 7.05 3.03 0.97 5.70 2.87 13.74 36.50 14.13 100.00
2016Amount 4936.49 9154.92 4623.72 1075.96 7418.87 3314.32 20774.72 51299.01 20082.36 140090.88
% 3.52 6.53 3.30 0.77 5.30 2.37 14.83 36.62 14.34 100.00
2017Amount 5021.42 7445.77 4380.54 1084.07 5284.21 3031.31 17373.55 43620.86 19723.47 127909.89
% 3.93 5.82 3.42 0.85 4.13 2.37 13.58 34.10 15.42 100.00
Source:IMF Direction of Trade Statistics,
http://data.imf.org/?sk=9D6028D4-F14A-464C-A2F2-59B2CD424B85.

Annex
357
34. Sri Lanka
Export to G7 and China
(million USD)
Year Unit France German Italy Canada Japan UK USA G7 total China Total Export
2000Amount 114.16 230.17 69.08 71.12 229.71 736.72 2192.56 3643.52 5.11 5302.49
% 2.15 4.34 1.30 1.34 4.33 13.89 41.35 68.71 0.10 100.00
2005Amount 121.36 271.83 199.62 78.76 144.61 777.26 1988.09 3581.53 29.41 6068.04
% 2.00 4.48 3.29 1.30 2.38 12.81 32.76 59.02 0.48 100.00
2010Amount 158.54 399.65 466.38 92.55 176.40 989.18 1697.66 3980.37 69.60 9571.48
% 1.66 4.18 4.87 0.97 1.84 10.33 17.74 41.59 0.73 100.00
2015Amount 192.04 474.78 433.98 180.52 214.32 1030.90 2803.41 5329.96 0.00 9744.51
% 1.97 4.87 4.45 1.85 2.20 10.58 28.77 54.70 0.00 100.00
2016Amount 156.77 498.37 427.95 179.13 199.98 1043.84 2808.61 5314.65 195.88 10045.96
% 1.56 4.96 4.26 1.78 1.99 10.39 27.96 52.90 1.95 100.00
2017Amount 190.77 538.42 529.37 208.92 206.96 1035.17 2911.46 5621.07 232.52 11164.52
% 1.71 4.82 4.74 1.87 1.85 9.27 26.08 50.35 2.08 100.00
Import from G7 and China
(million USD)
Year Unit France German Italy Canada Japan UK USA G7 total China Total Import
2000Amount 81.68 156.96 63.37 47.17 646.06 311.44 254.91 1561.58 251.10 6526.37
% 1.25 2.40 0.97 0.72 9.90 4.77 3.91 23.93 3.85 100.00
2005Amount 142.08 177.97 150.57 80.53 379.69 276.49 204.52 1411.85 630.56 8621.03
% 1.65 2.06 1.75 0.93 4.40 3.21 2.37 16.38 7.31 100.00
2010Amount 151.16 253.20 200.49 253.37 586.94 266.98 168.21 1880.36 1.24 10501.87
% 1.44 2.41 1.91 2.41 5.59 2.54 1.60 17.90 0.01 100.00
2015Amount 116.72 345.69 209.62 292.88 1392.05 365.61 471.57 3194.14 0.00 15124.49
% 0.77 2.29 1.39 1.94 9.20 2.42 3.12 21.12 0.00 100.00
2016Amount 147.81 435.39 276.11 252.16 951.10 327.71 539.28 2929.56 4270.21 19238.59
% 0.77 2.26 1.44 1.31 4.94 1.70 2.80 15.23 22.20 100.00
2017Amount 159.94 400.60 304.87 227.06 1038.56 267.89 493.67 2892.59 3949.90 20747.95
% 0.77 1.93 1.47 1.09 5.01 1.29 2.38 13.94 19.04 100.00
Source:IMF Direction of Trade Statistics,
http://data.imf.org/?sk=9D6028D4-F14A-464C-A2F2-59B2CD424B85.
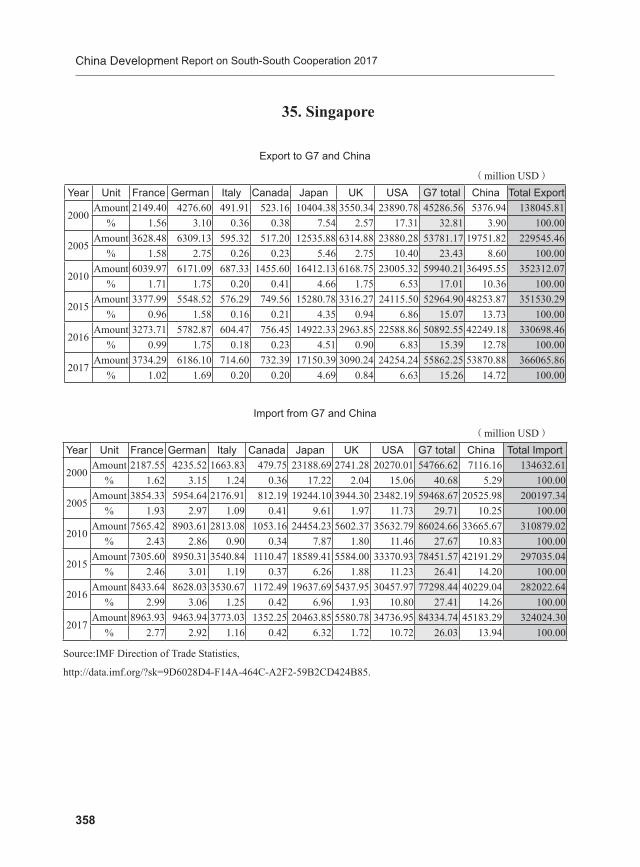
China Development Report on South-South Cooperation 2017
358
35. Singapore
Export to G7 and China
(million USD)
Year Unit France German Italy Canada Japan UK USA G7 total China Total Export
2000Amount 2149.40 4276.60 491.91 523.16 10404.38 3550.34 23890.78 45286.56 5376.94 138045.81
% 1.56 3.10 0.36 0.38 7.54 2.57 17.31 32.81 3.90 100.00
2005Amount 3628.48 6309.13 595.32 517.20 12535.88 6314.88 23880.28 53781.17 19751.82 229545.46
% 1.58 2.75 0.26 0.23 5.46 2.75 10.40 23.43 8.60 100.00
2010Amount 6039.97 6171.09 687.33 1455.60 16412.13 6168.75 23005.32 59940.21 36495.55 352312.07
% 1.71 1.75 0.20 0.41 4.66 1.75 6.53 17.01 10.36 100.00
2015Amount 3377.99 5548.52 576.29 749.56 15280.78 3316.27 24115.50 52964.90 48253.87 351530.29
% 0.96 1.58 0.16 0.21 4.35 0.94 6.86 15.07 13.73 100.00
2016Amount 3273.71 5782.87 604.47 756.45 14922.33 2963.85 22588.86 50892.55 42249.18 330698.46
% 0.99 1.75 0.18 0.23 4.51 0.90 6.83 15.39 12.78 100.00
2017Amount 3734.29 6186.10 714.60 732.39 17150.39 3090.24 24254.24 55862.25 53870.88 366065.86
% 1.02 1.69 0.20 0.20 4.69 0.84 6.63 15.26 14.72 100.00
Import from G7 and China
(million USD)
Year Unit France German Italy Canada Japan UK USA G7 total China Total Import
2000Amount 2187.55 4235.52 1663.83 479.75 23188.69 2741.28 20270.01 54766.62 7116.16 134632.61
% 1.62 3.15 1.24 0.36 17.22 2.04 15.06 40.68 5.29 100.00
2005Amount 3854.33 5954.64 2176.91 812.19 19244.10 3944.30 23482.19 59468.67 20525.98 200197.34
% 1.93 2.97 1.09 0.41 9.61 1.97 11.73 29.71 10.25 100.00
2010Amount 7565.42 8903.61 2813.08 1053.16 24454.23 5602.37 35632.79 86024.66 33665.67 310879.02
% 2.43 2.86 0.90 0.34 7.87 1.80 11.46 27.67 10.83 100.00
2015Amount 7305.60 8950.31 3540.84 1110.47 18589.41 5584.00 33370.93 78451.57 42191.29 297035.04
% 2.46 3.01 1.19 0.37 6.26 1.88 11.23 26.41 14.20 100.00
2016Amount 8433.64 8628.03 3530.67 1172.49 19637.69 5437.95 30457.97 77298.44 40229.04 282022.64
% 2.99 3.06 1.25 0.42 6.96 1.93 10.80 27.41 14.26 100.00
2017Amount 8963.93 9463.94 3773.03 1352.25 20463.85 5580.78 34736.95 84334.74 45183.29 324024.30
% 2.77 2.92 1.16 0.42 6.32 1.72 10.72 26.03 13.94 100.00
Source:IMF Direction of Trade Statistics,
http://data.imf.org/?sk=9D6028D4-F14A-464C-A2F2-59B2CD424B85.

Annex
359
36. The Syrian Arab Republic
Export to G7 and China
(million USD)
Year Unit France German Italy Canada Japan UK USA G7 total China Total Export
2000Amount 4280.80 559.67 6080.47 27.78 51.35 266.16 201.21 11467.43 0.00 19011.22
% 22.52 2.94 31.98 0.15 0.27 1.40 1.06 60.32 0.00 100.00
2005Amount 1133.61 101.08 1925.05 2.58 25.35 259.85 306.24 3753.76 15.84 6434.81
% 17.62 1.57 29.92 0.04 0.39 4.04 4.76 58.34 0.25 100.00
2010Amount 484.93 1477.11 1520.20 3.31 69.70 125.18 399.55 4079.98 81.41 11424.62
% 4.24 12.93 13.31 0.03 0.61 1.10 3.50 35.71 0.71 100.00
2015Amount 4.62 11.10 24.92 0.24 0.41 6.94 5.77 54.01 71.71 906.48
% 0.51 1.22 2.75 0.03 0.04 0.77 0.64 5.96 7.91 100.00
2016Amount 4.02 14.28 8.44 0.35 0.48 5.74 5.90 39.22 71.49 829.76
% 0.48 1.72 1.02 0.04 0.06 0.69 0.71 4.73 8.62 100.00
2017Amount 4.29 15.57 8.28 0.31 0.28 6.47 6.24 41.45 69.56 883.45
% 0.49 1.76 0.94 0.03 0.03 0.73 0.71 4.69 7.87 100.00
Import from G7 and China
(million USD)
Year Unit France German Italy Canada Japan UK USA G7 total China Total Import
2000Amount 746.22 1067.88 982.90 45.38 603.95 392.40 1057.89 4896.62 843.47 17283.64
% 4.32 6.18 5.69 0.26 3.49 2.27 6.12 28.33 4.88 100.00
2005Amount 183.73 235.02 299.90 30.62 249.84 65.98 255.62 1320.71 636.00 8347.84
% 2.20 2.82 3.59 0.37 2.99 0.79 3.06 15.82 7.62 100.00
2010Amount 349.66 738.63 1292.61 70.25 230.40 152.37 572.46 3406.38 1545.91 18059.63
% 1.94 4.09 7.16 0.39 1.28 0.84 3.17 18.86 8.56 100.00
2015Amount 44.86 39.07 101.68 2.98 5.19 7.25 3.82 204.85 647.98 7963.76
% 0.56 0.49 1.28 0.04 0.07 0.09 0.05 2.57 8.14 100.00
2016Amount 26.10 32.47 52.09 3.68 12.56 5.39 4.16 136.46 614.66 6346.84
% 0.41 0.51 0.82 0.06 0.20 0.08 0.07 2.15 9.68 100.00
2017Amount 43.60 50.83 70.31 19.18 9.07 8.83 8.02 209.85 700.44 7365.71
% 0.59 0.69 0.95 0.26 0.12 0.12 0.11 2.85 9.51 100.00
Source:IMF Direction of Trade Statistics,
http://data.imf.org/?sk=9D6028D4-F14A-464C-A2F2-59B2CD424B85.

China Development Report on South-South Cooperation 2017
360
37. Tajikistan
Export to G7 and China
(million USD)
Year Unit France German Italy Canada Japan UK USA G7 total China Total Export
2000Amount 1.90 0.40 21.40 0.00 0.00 6.00 0.60 30.30 3.40 782.18
% 0.24 0.05 2.74 0.00 0.00 0.77 0.08 3.87 0.43 100.00
2005Amount 0.00 0.50 15.60 0.00 0.10 1.30 0.20 17.70 5.70 939.26
% 0.00 0.05 1.66 0.00 0.01 0.14 0.02 1.88 0.61 100.00
2010Amount 0.34 2.05 17.95 0.00 0.05 0.09 0.14 20.61 446.96 1275.55
% 0.03 0.16 1.41 0.00 0.00 0.01 0.01 1.62 35.04 100.00
2015Amount 0.04 1.38 27.85 0.00 0.00 0.82 3.12 33.21 188.58 1083.41
% 0.00 0.13 2.57 0.00 0.00 0.08 0.29 3.07 17.41 100.00
2016Amount 0.07 0.83 45.01 0.00 0.00 1.15 0.08 47.16 114.17 843.47
% 0.01 0.10 5.34 0.00 0.00 0.14 0.01 5.59 13.54 100.00
2017Amount 0.24 1.26 12.91 0.01 0.00 0.91 0.09 15.43 169.00 962.20
% 0.03 0.13 1.34 0.00 0.00 0.09 0.01 1.60 17.56 100.00
Import from G7 and China
(million USD)
Year Unit France German Italy Canada Japan UK USA G7 total China Total Import
2000Amount 0.10 6.70 17.30 0.80 0.30 0.00 0.00 25.20 11.90 677.83
% 0.01 0.99 2.55 0.12 0.04 0.00 0.00 3.72 1.76 100.00
2005Amount 3.90 17.40 51.70 0.30 5.90 6.60 11.70 97.50 92.50 1338.08
% 0.29 1.30 3.86 0.02 0.44 0.49 0.87 7.29 6.91 100.00
2010Amount 4.27 49.85 10.33 0.63 2.57 2.92 94.95 165.52 238.17 2657.18
% 0.16 1.88 0.39 0.02 0.10 0.11 3.57 6.23 8.96 100.00
2015Amount 8.18 42.18 30.44 1.35 9.74 2.42 31.37 125.68 389.62 3216.68
% 0.25 1.31 0.95 0.04 0.30 0.08 0.98 3.91 12.11 100.00
2016Amount 9.43 36.60 65.35 0.40 6.65 3.57 35.81 157.81 373.76 3100.22
% 0.30 1.18 2.11 0.01 0.21 0.12 1.16 5.09 12.06 100.00
2017Amount 3.84 54.03 22.07 0.27 10.75 1.73 29.95 122.64 288.98 3119.48
% 0.12 1.73 0.71 0.01 0.34 0.06 0.96 3.93 9.26 100.00
Source:IMF Direction of Trade Statistics,
http://data.imf.org/?sk=9D6028D4-F14A-464C-A2F2-59B2CD424B85.

Annex
361
38. Thailand
Export to G7 and China
(million USD)
Year Unit France German Italy Canada Japan UK USA G7 total China Total Export
2000Amount 893.19 1640.02 838.02 777.90 10164.16 2356.53 14705.72 31375.54 2806.15 68962.67
% 1.30 2.38 1.22 1.13 14.74 3.42 21.32 45.50 4.07 100.00
2005Amount 1289.47 1994.10 1245.21 1028.42 14979.11 2784.49 16949.70 40270.49 9105.15 110161.77
% 1.17 1.81 1.13 0.93 13.60 2.53 15.39 36.56 8.27 100.00
2010Amount 1762.88 3304.44 1707.90 1428.72 20316.62 3661.42 20242.57 52424.55 21478.85 193361.23
% 0.91 1.71 0.88 0.74 10.51 1.89 10.47 27.11 11.11 100.00
2015Amount 1575.36 4220.25 1309.37 1343.56 19742.70 3757.71 23681.67 55630.62 23356.27 210684.84
% 0.75 2.00 0.62 0.64 9.37 1.78 11.24 26.40 11.09 100.00
2016Amount 1542.41 4448.77 1539.23 1333.37 20353.08 3822.87 24333.63 57373.36 23625.28 213761.91
% 0.72 2.08 0.72 0.62 9.52 1.79 11.38 26.84 11.05 100.00
2017Amount 1774.82 5034.25 1646.86 1427.33 22023.15 4073.61 26518.86 62498.88 29447.42 235925.10
% 0.75 2.13 0.70 0.60 9.33 1.73 11.24 26.49 12.48 100.00
Import from G7 and China
(million USD)
Year Unit France German Italy Canada Japan UK USA G7 total China Total Import
2000Amount 765.17 1946.66 561.02 343.85 15315.22 945.08 7291.13 27168.14 3376.92 61923.47
% 1.24 3.14 0.91 0.56 24.73 1.53 11.77 43.87 5.45 100.00
2005Amount 1868.12 3202.78 1133.01 523.37 26025.77 1280.52 8723.55 42757.11 11153.31 118143.09
% 1.58 2.71 0.96 0.44 22.03 1.08 7.38 36.19 9.44 100.00
2010Amount 1458.79 4684.65 1475.07 923.37 38319.79 1930.53 10885.45 59677.64 24526.18 185121.17
% 0.79 2.53 0.80 0.50 20.70 1.04 5.88 32.24 13.25 100.00
2015Amount 2698.30 5523.49 1915.97 923.39 31125.78 2539.67 13814.97 58541.56 40901.88 201790.34
% 1.34 2.74 0.95 0.46 15.42 1.26 6.85 29.01 20.27 100.00
2016Amount 2820.26 5899.64 1896.40 908.97 30840.71 2025.77 12103.76 56495.51 42247.08 195102.78
% 1.45 3.02 0.97 0.47 15.81 1.04 6.20 28.96 21.65 100.00
2017Amount 3517.37 6135.81 2087.06 793.22 32386.12 2957.32 14957.12 62834.02 44700.69 223707.35
% 1.57 2.74 0.93 0.35 14.48 1.32 6.69 28.09 19.98 100.00
Source:IMF Direction of Trade Statistics,
http://data.imf.org/?sk=9D6028D4-F14A-464C-A2F2-59B2CD424B85.

China Development Report on South-South Cooperation 2017
362
39. Turkey
Export to G7 and China
(million USD)
Year Unit France German Italy Canada Japan UK USA G7 total China Total Export
2000Amount 1657.11 5179.84 1789.31 173.39 149.49 2036.83 3139.21 14125.17 96.01 27774.91
% 5.97 18.65 6.44 0.62 0.54 7.33 11.30 50.86 0.35 100.00
2005Amount 3805.95 9455.05 5616.75 364.79 234.23 5917.16 4942.47 30336.40 549.76 73306.85
% 5.19 12.90 7.66 0.50 0.32 8.07 6.74 41.38 0.75 100.00
2010Amount 6056.87 11479.07 6507.05 479.50 272.22 7235.86 3840.69 35871.25 2269.18 113883.22
% 5.32 10.08 5.71 0.42 0.24 6.35 3.37 31.50 1.99 100.00
2015Amount 5850.23 13417.48 6887.78 670.63 334.81 10556.86 6407.67 44125.46 2414.79 143844.07
% 4.07 9.33 4.79 0.47 0.23 7.34 4.45 30.68 1.68 100.00
2016Amount 6022.49 13998.65 7580.84 729.49 354.38 11685.79 6623.35 46994.98 2328.04 142529.58
% 4.23 9.82 5.32 0.51 0.25 8.20 4.65 32.97 1.63 100.00
2017Amount 6584.20 15118.91 8473.47 1045.60 411.53 9603.19 8654.27 49891.16 2936.26 156992.94
% 4.19 9.63 5.40 0.67 0.26 6.12 5.51 31.78 1.87 100.00
Import from G7 and China
(million USD)
Year Unit France German Italy Canada Japan UK USA G7 total China Total Import
2000Amount 3531.82 7198.21 4332.79 256.43 1620.56 2747.75 3913.24 23600.79 1344.73 54502.82
% 6.48 13.21 7.95 0.47 2.97 5.04 7.18 43.30 2.47 100.00
2005Amount 5883.70 13619.80 7561.06 444.25 3107.25 4690.13 5374.78 40680.98 6867.86 116527.04
% 5.05 11.69 6.49 0.38 2.67 4.02 4.61 34.91 5.89 100.00
2010Amount 8178.11 17549.11 10204.48 915.32 3297.80 4680.61 12323.00 57148.43 17180.81 185544.33
% 4.41 9.46 5.50 0.49 1.78 2.52 6.64 30.80 9.26 100.00
2015Amount 7597.69 21351.88 10641.58 929.04 3140.06 5541.28 11143.35 60344.88 24873.46 207235.63
% 3.67 10.30 5.14 0.45 1.52 2.67 5.38 29.12 12.00 100.00
2016Amount 7364.72 21474.99 10218.39 1062.96 3943.60 5320.24 10867.79 60252.68 25441.43 198618.24
% 3.71 10.81 5.14 0.54 1.99 2.68 5.47 30.34 12.81 100.00
2017Amount 8070.90 21301.87 11304.72 2167.00 4281.47 6548.62 11951.74 65626.31 23370.62 233799.65
% 3.45 9.11 4.84 0.93 1.83 2.80 5.11 28.07 10.00 100.00
Source:IMF Direction of Trade Statistics,
http://data.imf.org/?sk=9D6028D4-F14A-464C-A2F2-59B2CD424B85.
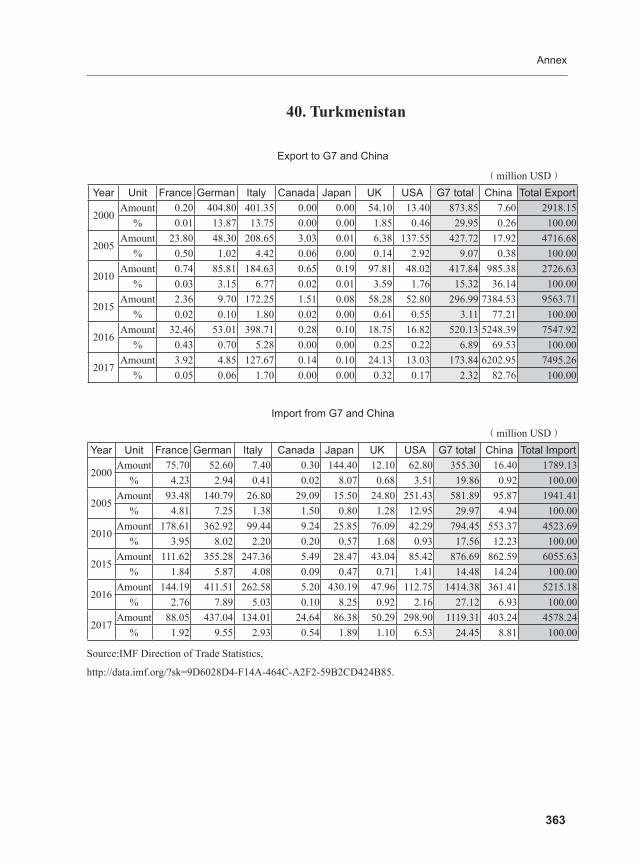
Annex
363
40. Turkmenistan
Export to G7 and China
(million USD)
Year Unit France German Italy Canada Japan UK USA G7 total China Total Export
2000Amount 0.20 404.80 401.35 0.00 0.00 54.10 13.40 873.85 7.60 2918.15
% 0.01 13.87 13.75 0.00 0.00 1.85 0.46 29.95 0.26 100.00
2005Amount 23.80 48.30 208.65 3.03 0.01 6.38 137.55 427.72 17.92 4716.68
% 0.50 1.02 4.42 0.06 0.00 0.14 2.92 9.07 0.38 100.00
2010Amount 0.74 85.81 184.63 0.65 0.19 97.81 48.02 417.84 985.38 2726.63
% 0.03 3.15 6.77 0.02 0.01 3.59 1.76 15.32 36.14 100.00
2015Amount 2.36 9.70 172.25 1.51 0.08 58.28 52.80 296.99 7384.53 9563.71
% 0.02 0.10 1.80 0.02 0.00 0.61 0.55 3.11 77.21 100.00
2016Amount 32.46 53.01 398.71 0.28 0.10 18.75 16.82 520.13 5248.39 7547.92
% 0.43 0.70 5.28 0.00 0.00 0.25 0.22 6.89 69.53 100.00
2017Amount 3.92 4.85 127.67 0.14 0.10 24.13 13.03 173.84 6202.95 7495.26
% 0.05 0.06 1.70 0.00 0.00 0.32 0.17 2.32 82.76 100.00
Import from G7 and China
(million USD)
Year Unit France German Italy Canada Japan UK USA G7 total China Total Import
2000Amount 75.70 52.60 7.40 0.30 144.40 12.10 62.80 355.30 16.40 1789.13
% 4.23 2.94 0.41 0.02 8.07 0.68 3.51 19.86 0.92 100.00
2005Amount 93.48 140.79 26.80 29.09 15.50 24.80 251.43 581.89 95.87 1941.41
% 4.81 7.25 1.38 1.50 0.80 1.28 12.95 29.97 4.94 100.00
2010Amount 178.61 362.92 99.44 9.24 25.85 76.09 42.29 794.45 553.37 4523.69
% 3.95 8.02 2.20 0.20 0.57 1.68 0.93 17.56 12.23 100.00
2015Amount 111.62 355.28 247.36 5.49 28.47 43.04 85.42 876.69 862.59 6055.63
% 1.84 5.87 4.08 0.09 0.47 0.71 1.41 14.48 14.24 100.00
2016Amount 144.19 411.51 262.58 5.20 430.19 47.96 112.75 1414.38 361.41 5215.18
% 2.76 7.89 5.03 0.10 8.25 0.92 2.16 27.12 6.93 100.00
2017Amount 88.05 437.04 134.01 24.64 86.38 50.29 298.90 1119.31 403.24 4578.24
% 1.92 9.55 2.93 0.54 1.89 1.10 6.53 24.45 8.81 100.00
Source:IMF Direction of Trade Statistics,
http://data.imf.org/?sk=9D6028D4-F14A-464C-A2F2-59B2CD424B85.

China Development Report on South-South Cooperation 2017
364
41. United Arab Emirates
Export to G7 and China
(million USD)
Year Unit France German Italy Canada Japan UK USA G7 total China Total Export
2000Amount 238.04 182.03 147.04 96.60 13976.20 854.76 940.47 16435.14 392.52 42916.01
% 0.55 0.42 0.34 0.23 32.57 1.99 2.19 38.30 0.91 100.00
2005Amount 1587.52 1099.99 306.69 54.18 23750.18 2058.76 1454.34 30311.66 1929.68 99428.58
% 1.60 1.11 0.31 0.05 23.89 2.07 1.46 30.49 1.94 100.00
2010Amount 1073.31 548.71 561.26 147.17 27619.22 1499.17 1128.11 32576.95 4116.20 174579.10
% 0.61 0.31 0.32 0.08 15.82 0.86 0.65 18.66 2.36 100.00
2015Amount 1098.60 872.83 891.54 110.43 22181.73 1430.48 2323.48 28909.09 10641.91 189106.79
% 0.58 0.46 0.47 0.06 11.73 0.76 1.23 15.29 5.63 100.00
2016Amount 1089.03 834.19 993.40 96.76 16321.85 1509.42 3166.03 24010.68 9373.88 188576.32
% 0.58 0.44 0.53 0.05 8.66 0.80 1.68 12.73 4.97 100.00
2017Amount 1175.81 1108.77 1104.56 146.60 19557.78 2625.85 4078.61 29797.98 11497.05 208408.03
% 0.56 0.53 0.53 0.07 9.38 1.26 1.96 14.30 5.52 100.00
Import from G7 and China
(million USD)
Year Unit France German Italy Canada Japan UK USA G7 total China Total Import
2000Amount 1864.30 1677.20 1413.90 245.50 2433.70 2054.10 2002.50 11691.20 2054.10 25426.74
% 7.33 6.60 5.56 0.97 9.57 8.08 7.88 45.98 8.08 100.00
2005Amount 2393.40 4501.77 2321.33 352.54 4677.11 4403.60 5120.09 23769.84 6891.00 81497.96
% 2.94 5.52 2.85 0.43 5.74 5.40 6.28 29.17 8.46 100.00
2010Amount 3481.81 8081.54 4125.51 959.85 7760.81 4694.02 11259.63 40363.18 13588.91 188355.28
% 1.85 4.29 2.19 0.51 4.12 2.49 5.98 21.43 7.21 100.00
2015Amount 4661.97 11931.54 5501.74 1737.38 10396.85 6171.68 19334.45 59735.61 22845.15 288976.51
% 1.61 4.13 1.90 0.60 3.60 2.14 6.69 20.67 7.91 100.00
2016Amount 4454.56 12594.49 5411.37 1542.54 9659.32 5196.70 20587.01 59446.01 22424.49 272717.99
% 1.63 4.62 1.98 0.57 3.54 1.91 7.55 21.80 8.22 100.00
2017Amount 6280.16 11882.10 6811.11 1921.75 13982.78 6781.78 23307.79 70967.48 48245.39 257713.38
% 2.44 4.61 2.64 0.75 5.43 2.63 9.04 27.54 18.72 100.00
Source:IMF Direction of Trade Statistics,
http://data.imf.org/?sk=9D6028D4-F14A-464C-A2F2-59B2CD424B85.
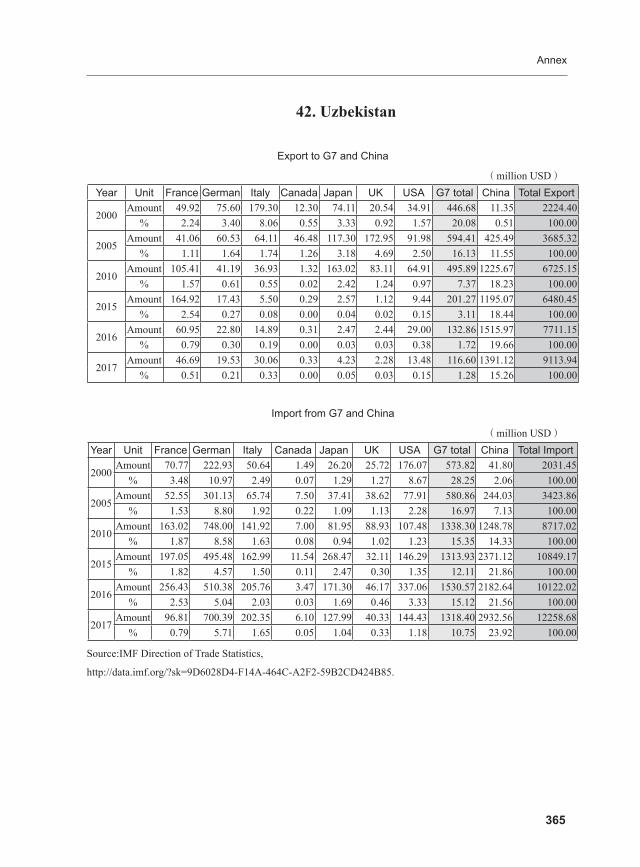
Annex
365
42. Uzbekistan
Export to G7 and China
(million USD)
Year Unit France German Italy Canada Japan UK USA G7 total China Total Export
2000Amount 49.92 75.60 179.30 12.30 74.11 20.54 34.91 446.68 11.35 2224.40
% 2.24 3.40 8.06 0.55 3.33 0.92 1.57 20.08 0.51 100.00
2005Amount 41.06 60.53 64.11 46.48 117.30 172.95 91.98 594.41 425.49 3685.32
% 1.11 1.64 1.74 1.26 3.18 4.69 2.50 16.13 11.55 100.00
2010Amount 105.41 41.19 36.93 1.32 163.02 83.11 64.91 495.89 1225.67 6725.15
% 1.57 0.61 0.55 0.02 2.42 1.24 0.97 7.37 18.23 100.00
2015Amount 164.92 17.43 5.50 0.29 2.57 1.12 9.44 201.27 1195.07 6480.45
% 2.54 0.27 0.08 0.00 0.04 0.02 0.15 3.11 18.44 100.00
2016Amount 60.95 22.80 14.89 0.31 2.47 2.44 29.00 132.86 1515.97 7711.15
% 0.79 0.30 0.19 0.00 0.03 0.03 0.38 1.72 19.66 100.00
2017Amount 46.69 19.53 30.06 0.33 4.23 2.28 13.48 116.60 1391.12 9113.94
% 0.51 0.21 0.33 0.00 0.05 0.03 0.15 1.28 15.26 100.00
Import from G7 and China
(million USD)
Year Unit France German Italy Canada Japan UK USA G7 total China Total Import
2000Amount 70.77 222.93 50.64 1.49 26.20 25.72 176.07 573.82 41.80 2031.45
% 3.48 10.97 2.49 0.07 1.29 1.27 8.67 28.25 2.06 100.00
2005Amount 52.55 301.13 65.74 7.50 37.41 38.62 77.91 580.86 244.03 3423.86
% 1.53 8.80 1.92 0.22 1.09 1.13 2.28 16.97 7.13 100.00
2010Amount 163.02 748.00 141.92 7.00 81.95 88.93 107.48 1338.30 1248.78 8717.02
% 1.87 8.58 1.63 0.08 0.94 1.02 1.23 15.35 14.33 100.00
2015Amount 197.05 495.48 162.99 11.54 268.47 32.11 146.29 1313.93 2371.12 10849.17
% 1.82 4.57 1.50 0.11 2.47 0.30 1.35 12.11 21.86 100.00
2016Amount 256.43 510.38 205.76 3.47 171.30 46.17 337.06 1530.57 2182.64 10122.02
% 2.53 5.04 2.03 0.03 1.69 0.46 3.33 15.12 21.56 100.00
2017Amount 96.81 700.39 202.35 6.10 127.99 40.33 144.43 1318.40 2932.56 12258.68
% 0.79 5.71 1.65 0.05 1.04 0.33 1.18 10.75 23.92 100.00
Source:IMF Direction of Trade Statistics,
http://data.imf.org/?sk=9D6028D4-F14A-464C-A2F2-59B2CD424B85.
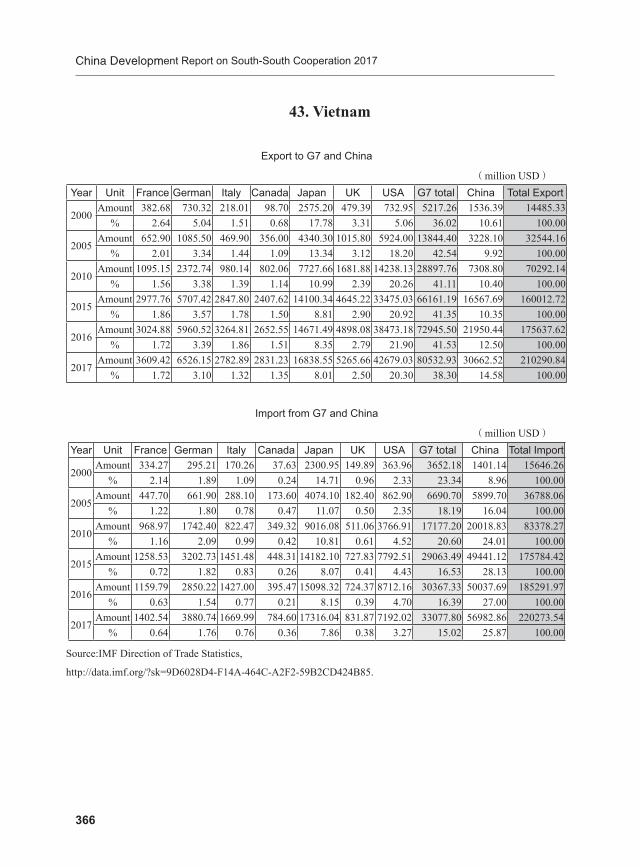
China Development Report on South-South Cooperation 2017
366
43. Vietnam
Export to G7 and China
(million USD)
Year Unit France German Italy Canada Japan UK USA G7 total China Total Export
2000Amount 382.68 730.32 218.01 98.70 2575.20 479.39 732.95 5217.26 1536.39 14485.33
% 2.64 5.04 1.51 0.68 17.78 3.31 5.06 36.02 10.61 100.00
2005Amount 652.90 1085.50 469.90 356.00 4340.30 1015.80 5924.00 13844.40 3228.10 32544.16
% 2.01 3.34 1.44 1.09 13.34 3.12 18.20 42.54 9.92 100.00
2010Amount 1095.15 2372.74 980.14 802.06 7727.66 1681.88 14238.13 28897.76 7308.80 70292.14
% 1.56 3.38 1.39 1.14 10.99 2.39 20.26 41.11 10.40 100.00
2015Amount 2977.76 5707.42 2847.80 2407.62 14100.34 4645.22 33475.03 66161.19 16567.69 160012.72
% 1.86 3.57 1.78 1.50 8.81 2.90 20.92 41.35 10.35 100.00
2016Amount 3024.88 5960.52 3264.81 2652.55 14671.49 4898.08 38473.18 72945.50 21950.44 175637.62
% 1.72 3.39 1.86 1.51 8.35 2.79 21.90 41.53 12.50 100.00
2017Amount 3609.42 6526.15 2782.89 2831.23 16838.55 5265.66 42679.03 80532.93 30662.52 210290.84
% 1.72 3.10 1.32 1.35 8.01 2.50 20.30 38.30 14.58 100.00
Import from G7 and China
(million USD)
Year Unit France German Italy Canada Japan UK USA G7 total China Total Import
2000Amount 334.27 295.21 170.26 37.63 2300.95 149.89 363.96 3652.18 1401.14 15646.26
% 2.14 1.89 1.09 0.24 14.71 0.96 2.33 23.34 8.96 100.00
2005Amount 447.70 661.90 288.10 173.60 4074.10 182.40 862.90 6690.70 5899.70 36788.06
% 1.22 1.80 0.78 0.47 11.07 0.50 2.35 18.19 16.04 100.00
2010Amount 968.97 1742.40 822.47 349.32 9016.08 511.06 3766.91 17177.20 20018.83 83378.27
% 1.16 2.09 0.99 0.42 10.81 0.61 4.52 20.60 24.01 100.00
2015Amount 1258.53 3202.73 1451.48 448.31 14182.10 727.83 7792.51 29063.49 49441.12 175784.42
% 0.72 1.82 0.83 0.26 8.07 0.41 4.43 16.53 28.13 100.00
2016Amount 1159.79 2850.22 1427.00 395.47 15098.32 724.37 8712.16 30367.33 50037.69 185291.97
% 0.63 1.54 0.77 0.21 8.15 0.39 4.70 16.39 27.00 100.00
2017Amount 1402.54 3880.74 1669.99 784.60 17316.04 831.87 7192.02 33077.80 56982.86 220273.54
% 0.64 1.76 0.76 0.36 7.86 0.38 3.27 15.02 25.87 100.00
Source:IMF Direction of Trade Statistics,
http://data.imf.org/?sk=9D6028D4-F14A-464C-A2F2-59B2CD424B85.

Annex
367
44. Yemen
Export to G7 and China
(million USD)
Year Unit France German Italy Canada Japan UK USA G7 total China Total Export
2000Amount 10.36 0.62 32.33 0.03 84.28 1.60 0.00 129.20 774.31 3772.26
% 0.27 0.02 0.86 0.00 2.23 0.04 0.00 3.43 20.53 100.00
2005Amount 3.67 2.95 6.08 0.16 354.88 5.97 182.46 556.18 1978.89 5597.05
% 0.07 0.05 0.11 0.00 6.34 0.11 3.26 9.94 35.36 100.00
2010Amount 27.19 19.19 9.18 0.70 66.60 72.02 148.35 343.22 1429.66 6405.46
% 0.42 0.30 0.14 0.01 1.04 1.12 2.32 5.36 22.32 100.00
2015Amount 2.04 10.92 3.82 0.52 27.84 8.98 12.02 66.15 6.91 467.88
% 0.44 2.33 0.82 0.11 5.95 1.92 2.57 14.14 1.48 100.00
2016Amount 1.00 2.40 2.38 0.19 0.85 3.41 0.60 10.82 1.28 172.04
% 0.58 1.39 1.38 0.11 0.49 1.98 0.35 6.29 0.74 100.00
2017Amount 1.16 3.34 5.89 0.17 0.59 3.50 2.37 17.03 5.07 484.98
% 0.24 0.69 1.21 0.03 0.12 0.72 0.49 3.51 1.05 100.00
Import from G7 and China
(million USD)
Year Unit France German Italy Canada Japan UK USA G7 total China Total Import
2000Amount 105.85 70.95 61.86 7.11 73.84 74.02 103.16 496.79 81.50 2301.83
% 4.60 3.08 2.69 0.31 3.21 3.22 4.48 21.58 3.54 100.00
2005Amount 105.73 137.40 68.23 14.48 96.15 133.90 216.17 772.06 295.11 4853.14
% 2.18 2.83 1.41 0.30 1.98 2.76 4.45 15.91 6.08 100.00
2010Amount 328.40 165.70 130.61 58.58 492.38 101.10 446.96 1723.73 731.74 9296.34
% 3.53 1.78 1.40 0.63 5.30 1.09 4.81 18.54 7.87 100.00
2015Amount 126.37 164.75 41.31 9.04 204.05 31.20 214.84 791.56 708.49 6579.92
% 1.92 2.50 0.63 0.14 3.10 0.47 3.27 12.03 10.77 100.00
2016Amount 110.08 107.52 31.16 6.92 183.96 33.61 205.33 678.59 841.03 7089.27
% 1.55 1.52 0.44 0.10 2.59 0.47 2.90 9.57 11.86 100.00
2017Amount 87.57 76.73 38.17 16.77 112.45 32.34 254.89 618.93 844.34 7042.86
% 1.24 1.09 0.54 0.24 1.60 0.46 3.62 8.79 11.99 100.00
Source:IMF Direction of Trade Statistics,
http://data.imf.org/?sk=9D6028D4-F14A-464C-A2F2-59B2CD424B85.
Copyright © 2022 FDOKUMEN


![The BRICS and the South Atlantic: Emerging arena for South–South cooperation [South African Journal of International Affairs, 2014]](https://static.fdokumen.com/doc/165x107/631fe47418429976e405f443/the-brics-and-the-south-atlantic-emerging-arena-for-southsouth-cooperation-south.jpg)