Improved Palliation of Cerebral Metastases in Epithelial ...
Upload
independentCategory
view
3download
0
Chemotherapy Response Monitoring ofColorectal Liver Metastases by Dynamic Gd-DTPA–Enhanced MRI Perfusion Parametersand 18F-FDG PET Metabolic Rate
Dennis Vriens1, Hanneke W.M. van Laarhoven2, Jack J.A. van Asten3, Paul F.M. Krabbe4, Eric P. Visser1,Arend Heerschap3, Cornelis J.A. Punt2, Lioe-Fee de Geus-Oei1, and Wim J.G. Oyen1
1Department of Nuclear Medicine, Radboud University Nijmegen Medical Centre, Nijmegen, The Netherlands; 2Department ofMedical Oncology, Radboud University Nijmegen Medical Centre, Nijmegen, The Netherlands; 3Department of Radiology, RadboudUniversity Nijmegen Medical Centre, Nijmegen, The Netherlands; and 4Department of Epidemiology, Biostatistics, and HealthTechnology Assessment, Radboud University Nijmegen Medical Centre, Nijmegen, The Netherlands
In this study, we examined the in vivo relationship betweenfunctional tumor vasculature, determined by dynamic con-trast-enhanced (DCE-) MRI, and tumor metabolism, determinedby dynamic 18F-FDG PET, during cytotoxic treatment of pa-tients with colorectal liver metastases. Methods: Twenty-threepatients underwent DCE-MRI (using gadolinium dimeglumine)and dynamic 18F-FDG PET at baseline and after 3 treatment cy-cles, unless treatment was terminated because of toxicity. Pa-rameters for vasculature (rate constant between extravascularextracellular space and blood plasma [kep] and volume transferconstant [Ktrans]), extracellular space (ve), tumor size (the maxi-mal axial diameter of each included lesion [MAD]), and metabo-lism (glucose metabolic rates [MRglc]) were derived, andchanges during treatment were correlated. Overall survival(OS) and progression-free survival (PFS) served as outcomemeasures for the predictive abilities of pretreatment parametersand of treatment-related parameter changes. Results: Pre-treatment MRglc and MAD were individually predictive for OSand PFS. During treatment, Ktrans increased significantly, butthis increase could not be confirmed in a lesion-by-lesion anal-ysis. MRglc decreased significantly (P , 0.001). No correlationswere found for changes in DCE-MRI parameters and DMRglc.No relationship was found between changes in DCE-MRI pa-rameters and OS or PFS. DMRglc was able to predict OS (P 5
0.008) after correction for confounders. Conclusion: The effi-cacy of cytotoxic chemotherapy assessed by reduction in tu-mor metabolism does not depend on pretreatment propertiesof the tumor vasculature determined by DCE-MRI. Cytotoxicchemotherapy does not alter DCE-MRI–derived properties oftumor vasculature but decreases glucose consumption of tu-mor cells.
Key Words: colorectal carcinoma; DCE-MRI; 18F-FDG; PET;chemotherapy; therapy monitoring; survival
J Nucl Med 2009; 50:1777–1784DOI: 10.2967/jnumed.109.064790
Chemotherapy is usually the treatment of choice inpatients with advanced colorectal cancer (CRC). Advancesin cytotoxic treatment have improved the median survivalfrom 8 mo to more than 20 mo (1). Unfortunately, chemo-therapy is only effective in a subset of patients. Earlyresponse prediction would enable individualized treatmentand prevent side effects and costs due to futile treatment ofnonresponders.
The efficacy of chemotherapy depends on the deliveryof cytotoxic drugs by the tumor vasculature, uptake andretention of the drug in tumor cells, metabolic activation ofprodrugs, intrinsic chemosensitivity of tumor cells, andcatabolism and excretion of drugs. Capillary perfusion andpermeability of the vessel wall can be measured in vivo bydynamic contrast-enhanced MRI (DCE-MRI) using gado-linium dimeglumine (Gd-DTPA) as the contrast agent (2).Glucose metabolic activity can be assessed in vivo by PETusing the radionuclide-labeled glucose analog 18F-FDG (3).
Pharmacokinetic analysis of DCE-MRI data yields pa-rameters for perfused capillaries including blood flow,permeability, and the total surface area. Assuming thatvascularity, as reflected by these parameters, is also relevantfor the delivery of relatively small cytotoxics to the tumor,it may be hypothesized that these parameters can be usedfor the prediction of treatment response. The value of base-line DCE-MRI parameters to predict treatment outcome hasbeen shown for several tumor types including CRC (4,5),and its significance in the early monitoring of treatment
Received Apr. 1, 2009; revision accepted Aug. 17, 2009.For correspondence or reprints contact: Dennis Vriens, Department of
Nuclear Medicine, Internal Postal Code 444, Radboud University,Nijmegen Medical Centre, P.O. Box 9101, 6500 HB Nijmegen, TheNetherlands.
E-mail: [email protected] ª 2009 by the Society of Nuclear Medicine, Inc.
RESPONSE MONITORING OF LIVER METASTASES • Vriens et al. 1777
by University of Groningen on June 19, 2015. For personal use only. jnm.snmjournals.org Downloaded from

response has been shown for rectal (5) and breast (6–8)cancer.
18F-FDG uptake is increased in malignant tumors. An ade-quate vascular supply and the presence of several membrane-bound glucose transport proteins are necessary for thedelivery of glucose to tumor cells, and intracellular hexoki-nase is necessary for subsequent phosphorylation. 18F-FDGuptake can be quantified by glucose metabolic rates (MRglc)derived from dynamic 18F-FDG PET data. The value ofbaseline MRglc as a predictive parameter for treatmentoutcome has been shown for several tumor types, includingnon–small cell lung carcinoma and CRC (9), and its pre-dictive value using changes in MRglc for the early evaluationof response during chemotherapy has been shown in manytumor types, including non–small cell lung carcinoma (10)and CRC (11).
Because DCE-MRI and 18F-FDG PET assess 2 differentdeterminants of chemotherapy efficacy, their combinationcould aid in the unraveling of the principles of chemo-sensitivity. In this prospective study, we investigated thepredictive value of pretreatment pharmacokinetic parame-ters and the value of (early) cytotoxic therapy–inducedchanges in pharmacokinetic parameters of Gd-DTPAand 18F-FDG with respect to overall survival (OS) andprogression-free survival (PFS).
MATERIALS AND METHODS
PatientsPatients with liver metastases of histologically proven CRC
who underwent a diagnostic work-up before the start of cytotoxicchemotherapy between June 2002 and September 2005 wereeligible. Liver metastases were established during routine stagingor during follow-up by abdominal CT (n 5 21), ultrasound (n 5
1), or MRI (n 5 1). Follow-up included a 3-monthly ultrasonog-raphy or CT scan. Patients with diabetes mellitus, severe claus-trophobia, or implanted electrical devices and with (multiple)small (,1 cm) lesions, in whom the limited spatial resolution ofthe PET scanner would pose technical difficulties for quantifica-tion, were excluded. The study was approved by the institutionalreview board of the Radboud University Nijmegen MedicalCentre, and all patients gave written informed consent.
Thirty-three patients with liver metastases of CRC were in-cluded in this prospective study. For 5 patients, DCE-MRI datawere not complete because of technical problems (n 5 2) or theunavailability of a pretherapy scan (n 5 1) or a follow-up scan(n 5 2); for 4 patients, 18F-FDG PET data were not completebecause of technical problems during the follow-up dynamicacquisition (n 5 1) or the unavailability of a follow-up scan(n 5 3). For 1 patient, both DCE-MRI and 18F-FDG PET atfollow-up were inaccessible. Therefore, complete datasets of 2DCE-MRI and two 18F-FDG PET scans were available for 23patients for analysis of treatment response. Patient characteristicsare listed in Table 1. Thirty-one lesions in total could be matchedfor lesion-by-lesion analysis on MRI (34 lesions visible) and 18F-FDG PET (56 lesions visible because of the larger axial field ofview [FOV] of PET than MRI) by 2 experienced observers. In 4patients, metastases visible on DCE-MRI could not be identified
as separate lesions on 18F-FDG PET. Therefore, the MRglc of thecombined lesion was used.
Nine patients received chemotherapy in the first, 11 in thesecond, 2 in the third, and 1 in fourth lines. The median intervalbetween the last day of the previous-line chemotherapy and thebaseline scan for patients treated in the second or higher line was39 d (interquartile range [IQR], 23–150 d). None of these 14patients had been treated with antiangiogenic agents beforeinclusion in the study. The treatment regimens were irinotecan(n 5 7), capecitabine (n 5 5), capecitabine/irinotecan (n 5 4),capecitabine/oxaliplatin (n 5 3), 5-fluorouracil (5-FU)/folinicacid/oxaliplatin (FOLFOX; n 5 3), and 5-FU/folinic acid (n 5 1).
No patients were lost to follow-up. Median OS was 1.5 y (1-,2-, and 3-y proportions, 70%, 26%, and 9%, respectively), andmedian PFS was 5.3 mo. At the closeout date, 2 patients werealive (follow-up, 4.3 and 5.6 y, respectively). All patients showedprogression of disease.
DCE-MRI and 18F-FDG PET were performed before the startand after 3 cycles of chemotherapy (cycle duration, 21 d, exceptfor FOLFOX, which lasted 14 d). When treatment was terminatedbefore 3 cycles (n 5 6; range, 0.5–2.0 cycles), the follow-up scanwas performed earlier. The median duration of treatment was 50 d(IQR, 30–56 d). The median interval between the last treatmentday and the follow-up scan was 6 d (IQR, 2.5–15.5 d).
DCE-MRIQuantitative DCE-MRI Data Acquisition and Reconstruction.
Measurements were performed on a 1.5-T Siemens MRI scanner,using a body phased-array coil. After conventional T1- andT2-weighted imaging, 15 mL of 0.5 M Gd-DTPA (Magnevist;Schering) was administered intravenously at an injection rate of2.5 mL�s21 by a Spectris MR injection system (Medrad Inc.). Anaxial T1-weighted fast low-angle shot sequence was used tomonitor Gd-DTPA uptake in the tumor and the bolus passage invessels in the spleen (repetition time [TR], 21 ms; echo time [TE],
TABLE 1. Patient Characteristics
Characteristic Value
No. of patients 23Demographic
Mean age (y) 61.5
Range (y) 44.8–78.9No. of men 17 (74%)
Matched lesions per patient
Mean 1.3
Range 1–5Patients . 1 matched lesion 5 (22%)
Median lesion MAD (mm) 56
IQR (mm) 38–75
HistologyAdenocarcinoma 22 (96%)
Mucinous adenocarcinoma 1 (4%)
Location of primary tumor
Sigmoid 9 (39%)Rectum 6 (26%)
Colon 5 (22%)
Colon and rectum 3 (13%)Presenting stage
Stage II 3 (13%)
Stage III 4 (17%)
Stage IV 16 (70%)
1778 THE JOURNAL OF NUCLEAR MEDICINE • Vol. 50 • No. 11 • November 2009
by University of Groningen on June 19, 2015. For personal use only. jnm.snmjournals.org Downloaded from

1.5–1.57 ms; flip angle, 45�; slice thickness, 7 mm, 4–6 slices;matrix size, 256 · 125 pixels; FOV, 284 · 350 mm; total acquisitiontime, 90 s). The fast acquisition scheme was performed multislice;that is, 4–6 slices were acquired simultaneously within the TR,realized by short TE and short pulse duration. The acquisitionmatrix was 256 · 125 pixels per slice. Application of the partialFourier technique (factor, 6/8) reduced the number of phase-encoding steps to 94, which in turn led to a net temporal resolutionof 94 · approximately 21 ms 5 approximately 2 s. If the 4–6 slicesin the axial FOV did not fully cover the tumor in the axial direction,slices were positioned in such a way that the largest diameter of thetumor (on the coronal view) was covered. During the acquisition,patients were instructed to breathe quietly and shallowly.
Immediately before the Gd-DTPA injection, proton density–weighted images were recorded with the same sequence param-eters as those for the DCE-MRI, except for a flip angle of 10� anda TR of 250 ms. Data from these images were combined with theDCE-MRI data to calculate the concentration of Gd-DTPA inarbitrary units, using the methods described by Hittmair et al. (12).
MRI Data Analysis. For the analysis of DCE-MRI, a vascularnormalization function was obtained from pixels in the spleenusing an algorithm based on the concentration of Gd-DTPA (highin blood vessels) and time to bolus passage (short in arteries) asdescribed earlier (13). Using a physiologic pharmacokineticmodel (14), we analyzed the Gd-DTPA concentration versus timecurves of the pixels in all MRI slices (256 · 125 pixels) containingtumor tissue, and the kep (s21) of Gd-DTPA uptake was calculatedaccording to the formula ctðtÞ 5 Ktrans � e2kep · t5cpðtÞ, in whichct is the tissue concentration of Gd-DTPA, kep is the rate constantof contrast agent exchange between the extracellular extravascularspace and the plasma compartment, Ktrans is the volume transferconstant between these compartments (s21), cp is the concen-tration of contrast agent in plasma of a capillary, and 5 denotesa convolution operation (2). In Larsson’s model (14), theGd-DTPA uptake rate constant (kep) is directly related to tumorblood flow, the product of the permeability, and the total surfacearea of perfused capillaries, according to kep 5 ð12e2P · S · TBF21Þ ·TBF · v21
e 5 Ktrans · v21e , in which ve is the volume of extravascu-
lar extracellular space per unit volume of tissue, P is the perme-ability of capillaries (cm�s21), S is the total surface area of thevessels (cm2), and TBF is the tumor blood flow (mL�s21). Previousreports have confirmed that there is a moderately strong positivecorrelation between kep and microvessel density in liver metastases(r 5 0.458, P 5 0.037) (15).
The spatial distribution of the pharmacokinetic parameters wasrepresented as a map. On a T1-weighted MR image recordeddirectly before Gd-DTPA injection, a region of interest (ROI)was drawn that comprised the metastases. Only large lesions(i.e., .15 mm) that were totally covered by the FOV of the ac-quired images and were not disturbed by artifacts of inflow of Gd-DTPA in the abdominal aorta (i.e., lesions directly ventral to theaorta) were included. Six lesions were smaller than 30 mm. ThisROI was applied to the map of pharmacokinetic parameters toselect the single values of kep, Ktrans, and ve for all tumor pixels.Whole-tumor values were calculated after log transformation ofall voxels within the ROI, thereby excluding voxels for which kep,Ktrans, and ve 5 0 s21, which are assumed to represent necrotictissue or fit artifacts. Mean tumor values and 95% confidenceintervals were obtained by backtransformation (13). To obtaina whole-patient value, a mean value, weighted by lesion volume,of all lesions within the FOV was determined by:
parameterwhole-patient 5 +ðparameterlesion · volumelesionÞ=+volumelesion:
The coronal T1-weighted images were used to measure themaximal axial diameter of each included lesion (MAD, in mm) toevaluate morphologic treatment response. Patient-based MADswere calculated by the sum of all included lesions.
18F-FDG PETQuantitative Dynamic 18F-FDG PET Data Acquisition and
Reconstruction. Dynamic PET was performed on an ECAT-EXACT 47 dedicated PET scanner (Siemens/CTI) using theECAT 7.2.1 software for 2-dimensional reconstruction. Patientsfasted for at least 6 h before imaging. Intake of sugar-free liquidswas permitted. Blood glucose levels (hexokinase method) (Aero-set; Abbott Diagnostics) were determined. The median fastingglucose level was 5.3 mmol�L21 (maximum, 9.2 mmol�L21). Thelocation for the dynamic acquisition in the axial FOV (162 mm in47 planes) of the scanner was based on whole-body 18F-FDG PETand CT scans obtained for routine clinical work-up, including asmany measurable tumor lesions as possible. A 20-min trans-mission scan was made, using the internal 68Ge/68Ga sources, tocorrect for photon attenuation. Approximately 200 MBq (mean 6
SD, 202 6 40 MBq) of 18F-FDG (Covidien) was injected intra-venously using constant infusion by a remote-controlled pump(Medrad Inc.). The dynamic data acquisition, performed in2-dimensional mode, was started simultaneously with the in-jection of 18F-FDG and consisted of 16 time frames with variableduration (10 · 30, 3 · 300, and 3 · 600 s) for a total time of50 min. During the acquisition, patients were instructed to breathequietly and shallowly. Correction for decay, randoms, and scatterwas performed. Attenuation-corrected images were reconstructedin 128 · 128 matrices using filtered backprojection with a gaussianfilter of 4 mm in full width at half maximum. This resulted inforty-seven 3.375-mm slices for each time frame, with voxeldimensions of 3.432 · 3.432 · 3.375 mm and a spatial resolutionof 6 mm in full width at half maximum in the reconstructedimages.
18F-FDG PET Data Analysis. 18F-FDG PET data were ana-lyzed as described before (16). In brief, a plasma time–activityconcentration curve was obtained by serial arterial sampling.When arterial sampling was not feasible or was contraindicated,an image-derived input function of the abdominal aorta was used(48% of forty-six 18F-FDG PET scans). Tumor time–activityconcentration curves were obtained by determination of volume-weighted mean activity concentration within ROIs. These ROIswere placed semiautomatically over the metastases using 50% ofthe maximum voxel value within the lesion on the summed imagesof frames 14–16 (20–50 min after injection). For therapy responsemonitoring, the lesion-specific ROI with the largest volume wascopied to the other scan (17). Using Patlak graphical analysis (3,18),we determined MRglc, using a lumped constant of 1 and a fractionalblood volume of 0. A volume-weighted mean value for all lesionscorresponding with DCE-MRI was obtained as patient-based datausing the same equation as the one used for DCE-MRI data.
Clinical Follow-UpFollow-up was performed according to a stringent protocol for
3 y in accordance with standard clinical care. Tumor response forclinical decision making was evaluated by experienced radiologists,
RESPONSE MONITORING OF LIVER METASTASES • Vriens et al. 1779
by University of Groningen on June 19, 2015. For personal use only. jnm.snmjournals.org Downloaded from

without knowledge of DCE-MRI or dynamic 18F-FDG PETresults, according to Response Evaluation Criteria in SolidTumors (19). Changes in the DCE-MRI parameters (kep, Ktrans,ve), MAD, and 18F-FDG PET parameter MRglc during treatmentwere calculated as:
Dparameter 5 ðparameterfollow-up 2 parameterbaselineÞ· parameter 2 1
baseline · 100%:
The date of progression was defined as the earliest date atwhich disease progression was confirmed. Survival and progres-sion were measured from the date of baseline 18F-FDG PET orDCE-MRI (whichever was performed first) to the date of, re-spectively, disease-related death or progression. For patients whowere alive (n 5 2) at the closeout date (May 2009), survival wascensored.
The median interval between all DCE-MRI and 18F-FDG PETscans was 0 d (IQR, 0–1 d). The mean interval between thebaseline and the first follow-up PET scan was 59.1 6 11.3 d.
Statistical AnalysisBoth patient-based analysis and lesion-by-lesion analysis were
performed. DCE-MRI, T1-weighted MRI, and 18F-FDG PET datawere analyzed separately, and the results were masked. Variableswere assessed for normality by Shapiro–Wilk statistics. Means(6SD) for normally distributed data or medians (IQR) are pre-sented. Differences were assessed for significance by the Mann–Whitney U test and by the paired t test (normally distributed) orWilcoxon signed rank test for paired data. Correlations weredetermined by the nonparametric Spearman r.
Cancer-related OS and PFS were calculated using Kaplan–Meier estimates. Both univariate and multivariate analyses wereperformed by the Cox proportional hazards model. The relation-ship between DCE-MRI and 18F-FDG PET parameters and OSand PFS was assessed for both pretreatment values (predictivevalue of tumor parameters) and changes in parameter valuesduring treatment (predictive value of early treatment response).Separate (univariate) analysis was performed for the relationshipbetween OS and PFS and the following covariates: number oflesions, patient age, TNM classification, tumor differentiation,histology or localization, chemotherapy line (first line vs. secondor higher lines), and regimen and the number of chemotherapycycles before the follow-up scan. Hazard ratios (HRs) arepresented with their 95% confidence intervals (Wald x2 test).Multivariate analysis was performed using imaging parametersand significant covariates in a backwardly designed conditionalCox proportional hazards model, removing variables when P wasgreater than 0.100.
All statistical analyses were performed with SPSS software(version 16.0.2 for Mac; SPSS Inc.). Statistical tests were based ona 2-sided significance level set at P 5 0.050 for all tests.
RESULTS
Predictive Value of Pretreatment DCE-MRI and18F-FDG PET
An example of DCE-MRI and 18F-FDG PET data isdisplayed in Figure 1. No statistically different pretreatmentparameters for tumor size and vascular parameters werefound for patients who were treated in the first line (n 5 9)versus patients who had been treated with cytotoxic therapy
previously (n 5 14). MRglc was slightly lower in the patientswho were treated in the first line. This, however, did not reachsignificance (median MRglc, 0.1095 mmol�mL21�min21 vs.0.1373 mmol�mL21�min21, P 5 0.072).
Patient-based analysis of the pretreatment scans showeda significant positive correlation between the tumor size(MAD) and the fraction of extravascular extracellular space(ve) (r 5 0.426, P 5 0.043). Neither the patient-basedanalysis nor the lesion-by-lesion analysis yielded signifi-cant correlations between pretreatment DCE-MRI and 18F-FDG PET parameters. The correlation between baseline kep
and MRglc was 20.028 (P 5 0.880).Univariate Cox regression analysis established an OS and
PFS benefit in patients with low baseline MRglc values.Baseline MAD showed a minor but significant relationshipwith OS as well, but chemotherapy line (first line vs. higherlines) showed no significant relationship with either OS orPFS in this group of patients. None of the DCE-MRIparameters for vascularity showed a significant relationshipwith either OS or PFS. When these variables were used inmultivariate analysis, correction for MAD increased the HRof MRglc for OS and PFS, but additional correction forchemotherapy line did not improve the predictive ability ofthe model as a whole (Table 2).
Lesion-by-Lesion Analysis of Changesin Scan Parameters
A significant change in median MRglc (0.138 mmol�mL21�min21 to 0.059 mmol�mL21�min21, P , 0.001) wasfound at the follow-up, but no significant changes were
FIGURE 1. Example of 78-y-old man with intermediatelydifferentiated adenocarcinoma of sigmoid (T3N1M1) withmetachronous liver metastases. (Left, top to bottom)Conventional T1-weighted MR image (before Gd-DTPA)and fused parametric image of kep values with T1-weightedMR image. (Right, top to bottom) 18F-FDG PET uptakeimage (20–50 min after injection) and parametric image ofMRglc.
1780 THE JOURNAL OF NUCLEAR MEDICINE • Vol. 50 • No. 11 • November 2009
by University of Groningen on June 19, 2015. For personal use only. jnm.snmjournals.org Downloaded from
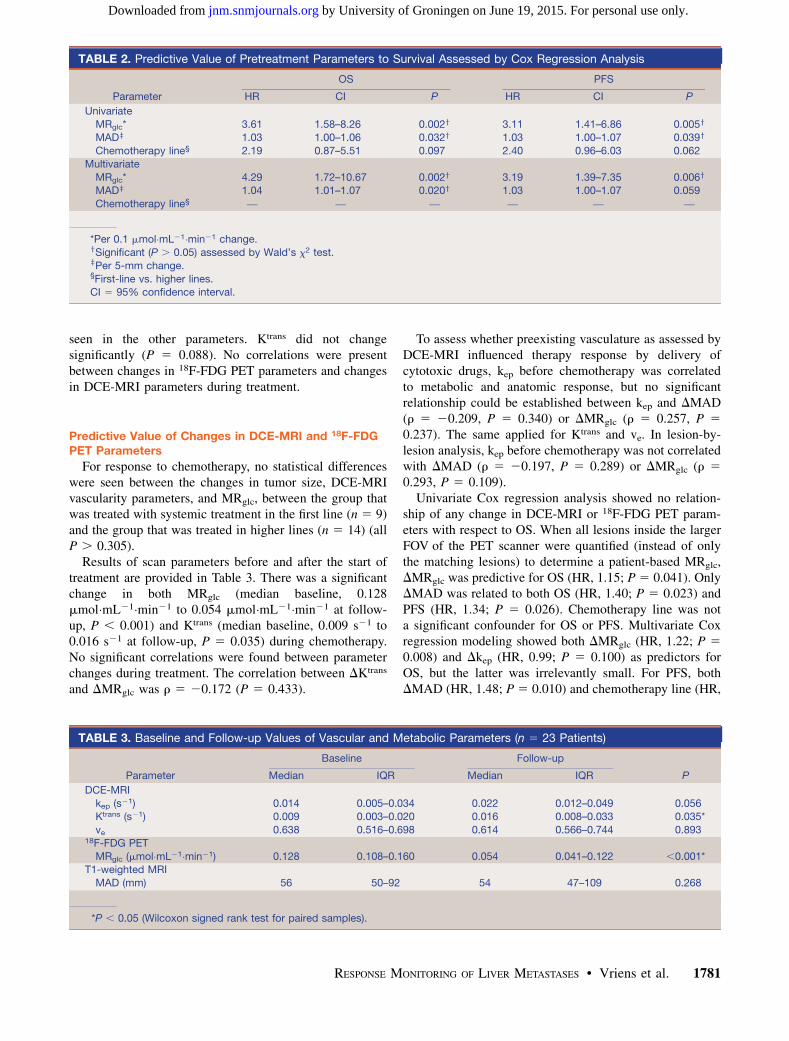
seen in the other parameters. Ktrans did not changesignificantly (P 5 0.088). No correlations were presentbetween changes in 18F-FDG PET parameters and changesin DCE-MRI parameters during treatment.
Predictive Value of Changes in DCE-MRI and 18F-FDGPET Parameters
For response to chemotherapy, no statistical differenceswere seen between the changes in tumor size, DCE-MRIvascularity parameters, and MRglc, between the group thatwas treated with systemic treatment in the first line (n 5 9)and the group that was treated in higher lines (n 5 14) (allP . 0.305).
Results of scan parameters before and after the start oftreatment are provided in Table 3. There was a significantchange in both MRglc (median baseline, 0.128mmol�mL21�min21 to 0.054 mmol�mL21�min21 at follow-up, P , 0.001) and Ktrans (median baseline, 0.009 s21 to0.016 s21 at follow-up, P 5 0.035) during chemotherapy.No significant correlations were found between parameterchanges during treatment. The correlation between DKtrans
and DMRglc was r 5 20.172 (P 5 0.433).
To assess whether preexisting vasculature as assessed byDCE-MRI influenced therapy response by delivery ofcytotoxic drugs, kep before chemotherapy was correlatedto metabolic and anatomic response, but no significantrelationship could be established between kep and DMAD(r 5 20.209, P 5 0.340) or DMRglc (r 5 0.257, P 5
0.237). The same applied for Ktrans and ve. In lesion-by-lesion analysis, kep before chemotherapy was not correlatedwith DMAD (r 5 20.197, P 5 0.289) or DMRglc (r 5
0.293, P 5 0.109).Univariate Cox regression analysis showed no relation-
ship of any change in DCE-MRI or 18F-FDG PET param-eters with respect to OS. When all lesions inside the largerFOV of the PET scanner were quantified (instead of onlythe matching lesions) to determine a patient-based MRglc,DMRglc was predictive for OS (HR, 1.15; P 5 0.041). OnlyDMAD was related to both OS (HR, 1.40; P 5 0.023) andPFS (HR, 1.34; P 5 0.026). Chemotherapy line was nota significant confounder for OS or PFS. Multivariate Coxregression modeling showed both DMRglc (HR, 1.22; P 5
0.008) and Dkep (HR, 0.99; P 5 0.100) as predictors forOS, but the latter was irrelevantly small. For PFS, bothDMAD (HR, 1.48; P 5 0.010) and chemotherapy line (HR,
TABLE 2. Predictive Value of Pretreatment Parameters to Survival Assessed by Cox Regression Analysis
OS PFS
Parameter HR CI P HR CI P
Univariate
MRglc* 3.61 1.58–8.26 0.002y 3.11 1.41–6.86 0.005y
MADz 1.03 1.00–1.06 0.032y 1.03 1.00–1.07 0.039y
Chemotherapy line§ 2.19 0.87–5.51 0.097 2.40 0.96–6.03 0.062
Multivariate
MRglc* 4.29 1.72–10.67 0.002y 3.19 1.39–7.35 0.006y
MADz 1.04 1.01–1.07 0.020y 1.03 1.00–1.07 0.059
Chemotherapy line§ — — — — — —
*Per 0.1 mmol�mL21�min21 change.ySignificant (P . 0.05) assessed by Wald’s x2 test.zPer 5-mm change.§First-line vs. higher lines.CI 5 95% confidence interval.
TABLE 3. Baseline and Follow-up Values of Vascular and Metabolic Parameters (n 5 23 Patients)
Baseline Follow-up
Parameter Median IQR Median IQR P
DCE-MRI
kep (s21) 0.014 0.005–0.034 0.022 0.012–0.049 0.056Ktrans (s21) 0.009 0.003–0.020 0.016 0.008–0.033 0.035*
ve 0.638 0.516–0.698 0.614 0.566–0.744 0.89318F-FDG PET
MRglc (mmol�mL21�min21) 0.128 0.108–0.160 0.054 0.041–0.122 ,0.001*T1-weighted MRI
MAD (mm) 56 50–92 54 47–109 0.268
*P , 0.05 (Wilcoxon signed rank test for paired samples).
RESPONSE MONITORING OF LIVER METASTASES • Vriens et al. 1781
by University of Groningen on June 19, 2015. For personal use only. jnm.snmjournals.org Downloaded from

3.15; P 5 0.023) were of predictive relevance. Results areshown in Table 4.
DISCUSSION
Pretreatment Parameters for Vascularityand Metabolism
No association was seen between vascularity, assessed byDCE-MRI, and glucose metabolism, assessed by 18F-FDGPET. Our results confirm those of Brix et al. (20), whofound no correlation between kep and 18F-FDG uptake(standardized uptake value [SUV]) in breast cancer. Sempleet al. (21), however, found a positive correlation betweenkep and SUV (r 5 0.5) and a positive, though nonsignif-icant, correlation between Ktrans and SUV in breast carci-noma patients before the commencement of treatment.They suggested that 18F-FDG delivery was restricted bythe blood flow dynamics of the tumor. In a previous study(15), we found a negative correlation between kep and 18F-FDG uptake (tumor-to-nontumor ratios) in CRC.
The different relationships between vascular and meta-bolic tumor parameters described in the literature couldimply that tumor vasculature is not related to MRglc.However, a more complex relationship between vasculatureand MRglc, mediated by acute and chronic tumor hypoxia,could also play a role: Chronic hypoxia and diminisheddelivery of glucose could be caused by a low blood flow,a low permeability, or a small surface area of tumor bloodvessels resulting in low values for kep. All these vascularparameters may result in a decreased supply of nutrientssuch as glucose and oxygen to the tumor, similar to thedecreased delivery of Gd-DTPA, which would lead todecreased cell proliferation as an energy-saving method(22) or to necrosis or apoptosis. This situation would resultin a positive correlation between kep and MRglc. Con-versely, (transient) hypoxia due to poor vascular function(as measured by a low value for kep) might induce higher
glucose uptake in the tumor for anaerobic glycolysis(15,23,24). The latter explanation would result in a negativecorrelation between kep and MRglc. Therefore, the opposite,combined, complex effects of acute and chronic hypoxiaand nutrient supply could explain the lack of correlationbetween kep and MRglc. Another reason for this lack ofcorrelation could be nonspecificity of Ktrans and kep, whichmay represent flow, vessel permeability, or surface area ora combination of these. Finally, imprecision in the de-termination of the DCE-MRI or PET parameters combinedwith the limited study size might explain the lack ofcorrelation.
Both pretreatment tumor metabolism (MRglc) and size(MAD) were associated with higher hazards for death andprogression. This confirms previous data (9), which showedthat a 1-unit increase in SUV results in a 17% increase inthe risk of death. Multivariate analysis showed no influenceof chemotherapy line (first- vs. higher-line treatment) forthe predictive abilities of MRglc and MAD.
Previously, Semple et al. (25) had observed a significantcorrelation (P , 0.05) between pretreatment kep and DSUVduring chemotherapy of 17 breast cancer patients andconcluded that the reduction of measured metabolismmay be partly attributable to pretherapy vascular delivery(kep). Because Gd-DTPA and phenylacetate (which hasa size similar to 5-FU) are similarly distributed in theinterstitium of tumor tissue (26), a restriction of Gd-DTPAdelivery to the interstitium reflects a restriction of 5-FUdelivery to the immediate neighborhood of tumor cells. Wecould not confirm these findings in patients with CRC.
Early Changes in Metabolic and Vascularity ParametersDuring Treatment
We have found no significant treatment-induced changesin kep, ve, and MAD, whereas MRglc and Ktrans, respec-tively, significantly decreased and increased on a patientlevel. On a lesion level, the increase in Ktrans could not be
TABLE 4. Predictive Value of Therapy-Induced Parameter Changes for Early Response Evaluation, Assessed by CoxRegression Analysis
OS PFS
Parameter HR CI P* HR CI P*
Univariate
DMRglc (all in FOV)y 1.15 1.01–1.32 0.041 — — —
DMADy 1.40 1.06–1.85 0.023 1.34 1.04–1.74 0.026Chemotherapy linez — — — — — —
Multivariate
DMRglc (all in FOV)y 1.22 1.05–1.41 0.008 — — —
Dkepy 0.99 0.98–1.00 0.100 — — —
DMADy — — — 1.48 1.10–1.99 0.010
Chemotherapy linez — — — 3.15 1.17–8.49 0.023
*Significance assessed by Wald x2 test.yPer 10% change.zFirst line vs. higher lines.CI 5 95% confidence interval; all in FOV 5 estimated including all lesions in FOV of PET scanner.
1782 THE JOURNAL OF NUCLEAR MEDICINE • Vol. 50 • No. 11 • November 2009
by University of Groningen on June 19, 2015. For personal use only. jnm.snmjournals.org Downloaded from

reproduced. Our results suggest that the observed reductionin MRglc during chemotherapy cannot be explained bychanges in tumor vasculature (Dkep). The antivasculareffect of cytotoxic drugs is small and marginally influencescell metabolism and patient survival. It seems that directcytotoxic effects leading to necrosis and apoptosis causedisease response and improved survival and that possibleeffects of chemotherapeutic agents on nutrient delivery playa minor role.
The reduction in kep during therapy has been describedin breast cancer (27,28), and reduction in Ktrans duringtreatment has been described in rectal (5) and breast(6,7,29) cancer. Some authors explained these changes bythe direct antivascular effect of the cytotoxic drugs (7,29)or by the loss of immature tumor vessels (5). Our results,however, do not suggest an effect of cytotoxic drugs ontumor vasculature in CRC.
We found no relationship between vascular parametersand clinical outcome. This confirms the results of our pre-vious study showing no evident relevance of pretreatmentkep, Ktrans, or ve for OS and PFS in colorectal liver me-tastases or any change in these parameters during first-linechemotherapy (30). In the present study, we observed apositive relationship between DMRglc and hazards for deathbut not for progression, which was mainly predicted bychemotherapy line and DMAD.
Because DCE-MRI and 18F-FDG PET both addressdifferent aspects of tumor physiology, they might be usedcomplementarily in treatment-response evaluation. Thechoice for a specific imaging modality should depend onthe treatment regimen. The cytotoxic drugs given to ourpatients interfere with DNA synthesis and stabilization,eventually leading to cell death. Therefore, the directinteraction with tumor vascularity is limited, as is suggestedby our data, showing no change in DCE-MRI parametersduring cytotoxic treatment. When antiangiogenic drugs areused, response might be predicted by DCE-MRI, as shownby 2 studies (31,32) in clear cell renal cell carcinomapatients treated with sorafenib. Response might be moni-tored by DCE-MRI, showing a decrease of kep (33), butresults are still contradictory (32). The effect of cytotoxicdrugs on cell metabolism can be monitored by 18F-FDGPET. Tumor metabolic response has predictive value (11),which is also shown by our data. Early disease-relateddeaths did occur in the group of metabolic responders.Therefore, a reduction in metabolism during therapy doesnot guarantee a long survival, and more effects presumablyplay a role.
Study Limitations
Patients were treated in different lines of chemotherapyusing different chemotherapy regimens; thus, the includedpopulation was heterogeneous. Furthermore, currentlycombinations of cytotoxic treatment with antiangiogenictreatment are standard in first-line treatment. DCE-MRImay have a role as a tool for response evaluation in those
patients who are being treated with antiangiogenics. Pre-vious chemotherapy might already have influenced bothmetabolism and vascularity. However, subgroup analysis ofthe 9 patients treated with first-line chemotherapy did notchange our conclusions.
Only a selection of lesions could be analyzed because ofthe limited FOV of the acquired images and the limitedspatial resolution of (especially) the PET system, whichmight have caused some bias during selection.
The parameters for vascularity as derived from DCE-MRI were not verified by histologic quantification ofmicrovessel density, because biopsies of stage IV patientsare taken only in exceptional circumstances. However, wehave previously described a relationship between bothhistology and DCE-MRI parameters (15). An advantageof DCE-MRI over histology is that DCE-MRI measuresfunctional vasculature only, whereas the quantification ofhistologic staining of endothelial cells also includes non-perfused vessels.
CONCLUSION
Dynamic Gd-DTPA–enhanced MRI parameters of tumorvasculature showed no relationship to tumor metabolicresponse on dynamic 18F-FDG PET or to patient survivalduring cytotoxic chemotherapy either before or duringtreatment. Therefore, a decrease in metabolic activity andan increase in OS and PFS during chemotherapy cannot beattributed to changes in tumor vascularity, resulting in thealtered delivery of drugs or nutrients of the same size asGd-DTPA. The present study underlines the potential of18F-FDG PET for response monitoring. The main conclu-sions of the article are valid for patients not receivingvascular-targeted therapy, and further study is required inthe subset of patients who do receive additional antiangio-genic agents.
ACKNOWLEDGMENTS
This study was presented at the 56th annual meeting ofthe Society of Nuclear Medicine, Toronto, Ontario, Canada,June 15, 2009.
REFERENCES
1. Punt CJ. New options and old dilemmas in the treatment of patients with
advanced colorectal cancer. Ann Oncol. 2004;15:1453–1459.
2. Tofts PS, Brix G, Buckley DL, et al. Estimating kinetic parameters from
dynamic contrast-enhanced T1-weighted MRI of a diffusable tracer: standard-
ized quantities and symbols. J Magn Reson Imaging. 1999;10:223–232.
3. Patlak CS, Blasberg RG, Fenstermacher JD. Graphical evaluation of blood-to-
brain transfer constants from multiple-time uptake data. J Cereb Blood Flow
Metab. 1983;3:1–7.
4. Devries AF, Griebel J, Kremser C, et al. Tumor microcirculation evaluated by
dynamic magnetic resonance imaging predicts therapy outcome for primary
rectal carcinoma. Cancer Res. 2001;61:2513–2516.
5. George ML, Dzik-Jurasz AS, Padhani AR, et al. Non-invasive methods of
assessing angiogenesis and their value in predicting response to treatment in
colorectal cancer. Br J Surg. 2001;88:1628–1636.
6. Pickles MD, Lowry M, Manton DJ, Gibbs P, Turnbull LW. Role of dynamic
contrast enhanced MRI in monitoring early response of locally advanced
RESPONSE MONITORING OF LIVER METASTASES • Vriens et al. 1783
by University of Groningen on June 19, 2015. For personal use only. jnm.snmjournals.org Downloaded from

breast cancer to neoadjuvant chemotherapy. Breast Cancer Res Treat. 2005;91:
1–10.
7. Delille JP, Slanetz PJ, Yeh ED, Halpern EF, Kopans DB, Garrido L. Invasive
ductal breast carcinoma response to neoadjuvant chemotherapy: noninvasive
monitoring with functional MR imaging pilot study. Radiology. 2003;228:63–69.
8. Thukral A, Thomasson DM, Chow CK, et al. Inflammatory breast cancer:
dynamic contrast-enhanced MR in patients receiving bevacizumab—initial
experience. Radiology. 2007;244:727–735.
9. de Geus-Oei LF, Wiering B, Krabbe PF, Ruers TJ, Punt CJ, Oyen WJ. FDG-PET
for prediction of survival of patients with metastatic colorectal carcinoma. Ann
Oncol. 2006;17:1650–1655.
10. de Geus-Oei LF, van der Heijden HF, Visser EP, et al. Chemotherapy response
evaluation with 18F-FDG PET in patients with non-small cell lung cancer. J Nucl
Med. 2007;48:1592–1598.
11. de Geus-Oei LF, van Laarhoven HW, Visser EP, et al. Chemotherapy response
evaluation with FDG-PET in patients with colorectal cancer. Ann Oncol.
2008;19:348–352.
12. Hittmair K, Gomiscek G, Langenberger K, Recht M, Imhof H, Kramer J. Method
for the quantitative assessment of contrast agent uptake in dynamic contrast-
enhanced MRI. Magn Reson Med. 1994;31:567–571.
13. van Laarhoven HW, Rijpkema M, Punt CJ, et al. Method for quantitation of
dynamic MRI contrast agent uptake in colorectal liver metastases. J Magn Reson
Imaging. 2003;18:315–320.
14. Larsson HB, Stubgaard M, Frederiksen JL, Jensen M, Henriksen O, Paulson OB.
Quantitation of blood-brain barrier defect by magnetic resonance imaging and
gadolinium-DTPA in patients with multiple sclerosis and brain tumors. Magn
Reson Med. 1990;16:117–131.
15. van Laarhoven HW, de Geus-Oei LF, Wiering B, et al. Gadopentetate
dimeglumine and FDG uptake in liver metastases of colorectal carcinoma as
determined with MR imaging and PET. Radiology. 2005;237:181–188.
16. de Geus-Oei LF, Visser EP, Krabbe PF, et al. Comparison of image-derived and
arterial input functions for estimating the rate of glucose metabolism in therapy-
monitoring 18F-FDG PET studies. J Nucl Med. 2006;47:945–949.
17. Vriens D, de Geus-Oei LF, van Laarhoven HWM, et al. Comparison of two
region of interest definition methods for metabolic response evaluation with
[18F]FDG-PET. Q J Nucl Med Mol Imaging. 2009;53:224–244.
18. Willemsen AT, van den Hoff J. Fundamentals of quantitative PET data analysis.
Curr Pharm Des. 2002;8:1513–1526.
19. Therasse P, Arbuck SG, Eisenhauer EA, et al. New guidelines to evaluate the
response to treatment in solid tumors. European Organization for Research and
Treatment of Cancer, National Cancer Institute of the United States, National
Cancer Institute of Canada. J Natl Cancer Inst. 2000;92:205–216.
20. Brix G, Henze M, Knopp MV, et al. Comparison of pharmacokinetic MRI and
[18F] fluorodeoxyglucose PET in the diagnosis of breast cancer: initial
experience. Eur Radiol. 2001;11:2058–2070.
21. Semple SI, Gilbert FJ, Redpath TW, et al. The relationship between vascular and
metabolic characteristics of primary breast tumours. Eur Radiol. 2004;14:2038–
2045.
22. Evans SM, Hahn SM, Magarelli DP, Koch CJ. Hypoxic heterogeneity in human
tumors: EF5 binding, vasculature, necrosis, and proliferation. Am J Clin Oncol.
2001;24:467–472.
23. Burgman P, Odonoghue JA, Humm JL, Ling CC. Hypoxia-induced increase in
FDG uptake in MCF7 cells. J Nucl Med. 2001;42:170–175.
24. Clavo AC, Brown RS, Wahl RL. Fluorodeoxyglucose uptake in human cancer
cell lines is increased by hypoxia. J Nucl Med. 1995;36:1625–1632.
25. Semple SI, Staff RT, Heys SD, et al. Baseline MRI delivery characteristics
predict change in invasive ductal breast carcinoma PET metabolism as
a result of primary chemotherapy administration. Ann Oncol. 2006;17:
1393–1398.
26. Artemov D, Solaiyappan M, Bhujwalla ZM. Magnetic resonance pharmacoan-
giography to detect and predict chemotherapy delivery to solid tumors. Cancer
Res. 2001;61:3039–3044.
27. Wasser K, Klein SK, Fink C, et al. Evaluation of neoadjuvant chemotherapeutic
response of breast cancer using dynamic MRI with high temporal resolution. Eur
Radiol. 2003;13:80–87.
28. Wasser K, Sinn HP, Fink C, et al. Accuracy of tumor size measurement in breast
cancer using MRI is influenced by histological regression induced by
neoadjuvant chemotherapy. Eur Radiol. 2003;13:1213–1223.
29. Hayes C, Padhani AR, Leach MO. Assessing changes in tumour vascular
function using dynamic contrast-enhanced magnetic resonance imaging. NMR
Biomed. 2002;15:154–163.
30. van Laarhoven HW, Klomp DW, Rijpkema M, et al. Prediction of chemother-
apeutic response of colorectal liver metastases with dynamic gadolinium-DTPA-
enhanced MRI and localized 19F MRS pharmacokinetic studies of 5-fluorouracil.
NMR Biomed. 2007;20:128–140.
31. Flaherty KT, Rosen MA, Heitjan DF, et al. Pilot study of DCE-MRI to predict
progression-free survival with sorafenib therapy in renal cell carcinoma. Cancer
Biol Ther. 2008;7:496–501.
32. Hahn OM, Yang C, Medved M, et al. Dynamic contrast-enhanced magnetic
resonance imaging pharmacodynamic biomarker study of sorafenib in metastatic
renal carcinoma. J Clin Oncol. 2008;26:4572–4578.
33. Wedam SB, Low JA, Yang SX, et al. Antiangiogenic and antitumor effects of
bevacizumab in patients with inflammatory and locally advanced breast cancer.
J Clin Oncol. 2006;24:769–777.
1784 THE JOURNAL OF NUCLEAR MEDICINE • Vol. 50 • No. 11 • November 2009
by University of Groningen on June 19, 2015. For personal use only. jnm.snmjournals.org Downloaded from

Doi: 10.2967/jnumed.109.064790Published online: October 16, 2009.
2009;50:1777-1784.J Nucl Med. Heerschap, Cornelis J.A. Punt, Lioe-Fee de Geus-Oei and Wim J.G. OyenDennis Vriens, Hanneke W.M. van Laarhoven, Jack J.A. van Asten, Paul F.M. Krabbe, Eric P. Visser, Arend
F-FDG PET Metabolic Rate18Enhanced MRI Perfusion Parameters and −Gd-DTPA Chemotherapy Response Monitoring of Colorectal Liver Metastases by Dynamic
http://jnm.snmjournals.org/content/50/11/1777This article and updated information are available at:
http://jnm.snmjournals.org/site/subscriptions/online.xhtml
Information about subscriptions to JNM can be found at:
http://jnm.snmjournals.org/site/misc/permission.xhtmlInformation about reproducing figures, tables, or other portions of this article can be found online at:
(Print ISSN: 0161-5505, Online ISSN: 2159-662X)1850 Samuel Morse Drive, Reston, VA 20190.SNMMI | Society of Nuclear Medicine and Molecular Imaging
is published monthly.The Journal of Nuclear Medicine
© Copyright 2009 SNMMI; all rights reserved.
by University of Groningen on June 19, 2015. For personal use only. jnm.snmjournals.org Downloaded from
Copyright © 2022 FDOKUMEN


![Development of N-[3-(2′,4′-dichlorophenoxy)-2-18F-fluoropropyl]-N-methylpropargylamine (18F-fluoroclorgyline) as a potential PET radiotracer for monoamine oxidase-A](https://static.fdokumen.com/doc/165x107/63364f54a1ced1126c0b2979/development-of-n-3-24-dichlorophenoxy-2-18f-fluoropropyl-n-methylpropargylamine.jpg)


![Usefulness of [18F]-DA and [18F]-DOPA for PET imaging in a mouse model of pheochromocytoma](https://static.fdokumen.com/doc/165x107/6325a7d9852a7313b70e9a7d/usefulness-of-18f-da-and-18f-dopa-for-pet-imaging-in-a-mouse-model-of-pheochromocytoma.jpg)
![A rapid solid-phase extraction method for measurement of non-metabolised peripheral benzodiazepine receptor ligands, [18F]PBR102 and [18F]PBR111, in rat and primate plasma](https://static.fdokumen.com/doc/165x107/63349cad6c27eedec605ce97/a-rapid-solid-phase-extraction-method-for-measurement-of-non-metabolised-peripheral.jpg)