Crosslinkable polyester/isocyanate compositions suitable for ...
Upload
independentCategory
view
3download
0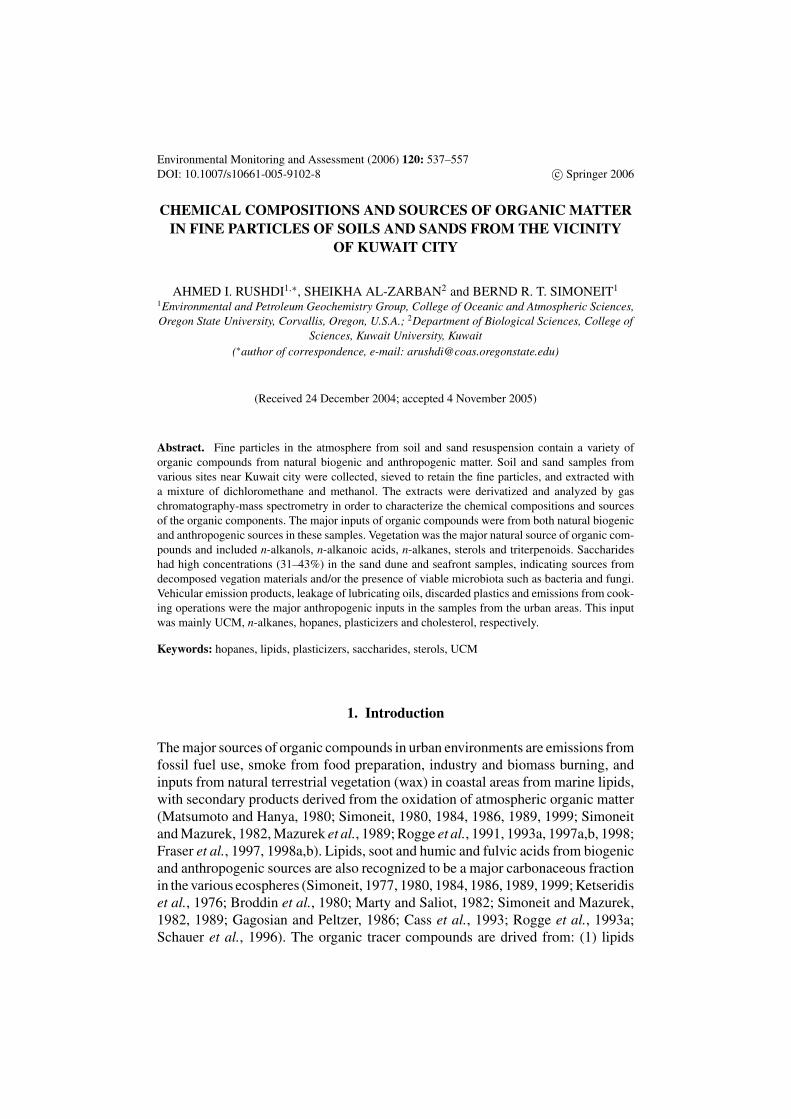
Environmental Monitoring and Assessment (2006) 120: 537–557
DOI: 10.1007/s10661-005-9102-8 c© Springer 2006
CHEMICAL COMPOSITIONS AND SOURCES OF ORGANIC MATTERIN FINE PARTICLES OF SOILS AND SANDS FROM THE VICINITY
OF KUWAIT CITY
AHMED I. RUSHDI1,∗, SHEIKHA AL-ZARBAN2 and BERND R. T. SIMONEIT1
1Environmental and Petroleum Geochemistry Group, College of Oceanic and Atmospheric Sciences,Oregon State University, Corvallis, Oregon, U.S.A.; 2Department of Biological Sciences, College of
Sciences, Kuwait University, Kuwait(∗author of correspondence, e-mail: [email protected])
(Received 24 December 2004; accepted 4 November 2005)
Abstract. Fine particles in the atmosphere from soil and sand resuspension contain a variety of
organic compounds from natural biogenic and anthropogenic matter. Soil and sand samples from
various sites near Kuwait city were collected, sieved to retain the fine particles, and extracted with
a mixture of dichloromethane and methanol. The extracts were derivatized and analyzed by gas
chromatography-mass spectrometry in order to characterize the chemical compositions and sources
of the organic components. The major inputs of organic compounds were from both natural biogenic
and anthropogenic sources in these samples. Vegetation was the major natural source of organic com-
pounds and included n-alkanols, n-alkanoic acids, n-alkanes, sterols and triterpenoids. Saccharides
had high concentrations (31–43%) in the sand dune and seafront samples, indicating sources from
decomposed vegation materials and/or the presence of viable microbiota such as bacteria and fungi.
Vehicular emission products, leakage of lubricating oils, discarded plastics and emissions from cook-
ing operations were the major anthropogenic inputs in the samples from the urban areas. This input
was mainly UCM, n-alkanes, hopanes, plasticizers and cholesterol, respectively.
Keywords: hopanes, lipids, plasticizers, saccharides, sterols, UCM
1. Introduction
The major sources of organic compounds in urban environments are emissions fromfossil fuel use, smoke from food preparation, industry and biomass burning, andinputs from natural terrestrial vegetation (wax) in coastal areas from marine lipids,with secondary products derived from the oxidation of atmospheric organic matter(Matsumoto and Hanya, 1980; Simoneit, 1980, 1984, 1986, 1989, 1999; Simoneitand Mazurek, 1982, Mazurek et al., 1989; Rogge et al., 1991, 1993a, 1997a,b, 1998;Fraser et al., 1997, 1998a,b). Lipids, soot and humic and fulvic acids from biogenicand anthropogenic sources are also recognized to be a major carbonaceous fractionin the various ecospheres (Simoneit, 1977, 1980, 1984, 1986, 1989, 1999; Ketseridiset al., 1976; Broddin et al., 1980; Marty and Saliot, 1982; Simoneit and Mazurek,1982, 1989; Gagosian and Peltzer, 1986; Cass et al., 1993; Rogge et al., 1993a;Schauer et al., 1996). The organic tracer compounds are drived from: (1) lipids
538 A. I. RUSHDI ET AL.
of terrestrial higher plants, marine biota and urban activities (e.g., cooking); (2)sugar-derivatives, methoxyphenols and resin acids from biomass burning; (3) n-alkanes and n-alkanols from higher plant waxes; (4) dicarboxylic acids and otherpolar oxidation products; and (5) polynuclear aromatic hydrocarbons (PAH) fromcombustion processes (Simoneit, 1980, 1984, 1986, 1989; Simoneit and Mazurek,1982; Gagosian et al., 1987; Standley and Simoneit, 1987; Simoneit et al., 1988,1990, 1991a,b,c, 1993, 1999; Rogge et al., 1991, 1993a–e, 1994, 1996, 1998; Abaset al., 1995; Abas and Simoneit, 1996; Fraser et al., 1997; 1998a,b).
Soil resuspension by natural and man-made processes is another source of inputof organic matter to the atmosphere (e.g., Simoneit 1980; Rogge et al., 1993c;Al-Mutlaq et al., 2002; 2005; Rushdi et al., 2005). This can occur by local particleresuspension, agriculture and construction related operations, road dust in urban andrural areas, as well as transport from desert and semi-arid regions such as the ArabianPeninsula. Surface soils, sands and road dusts contain organic matter derived frommany sources, which have not been characterized for the Kuwait region. Thus,the major purpose of this paper is to identify the higher molecular weight organictracers in the fine particles of surface soils and sands from Kuwait city. It is anattempt to evaluate one potential source of organic matter in the atmosphere of thisregion.
2. Experimental Methods
2.1. SAMPLING AND EXTRACTION PROCEDURE
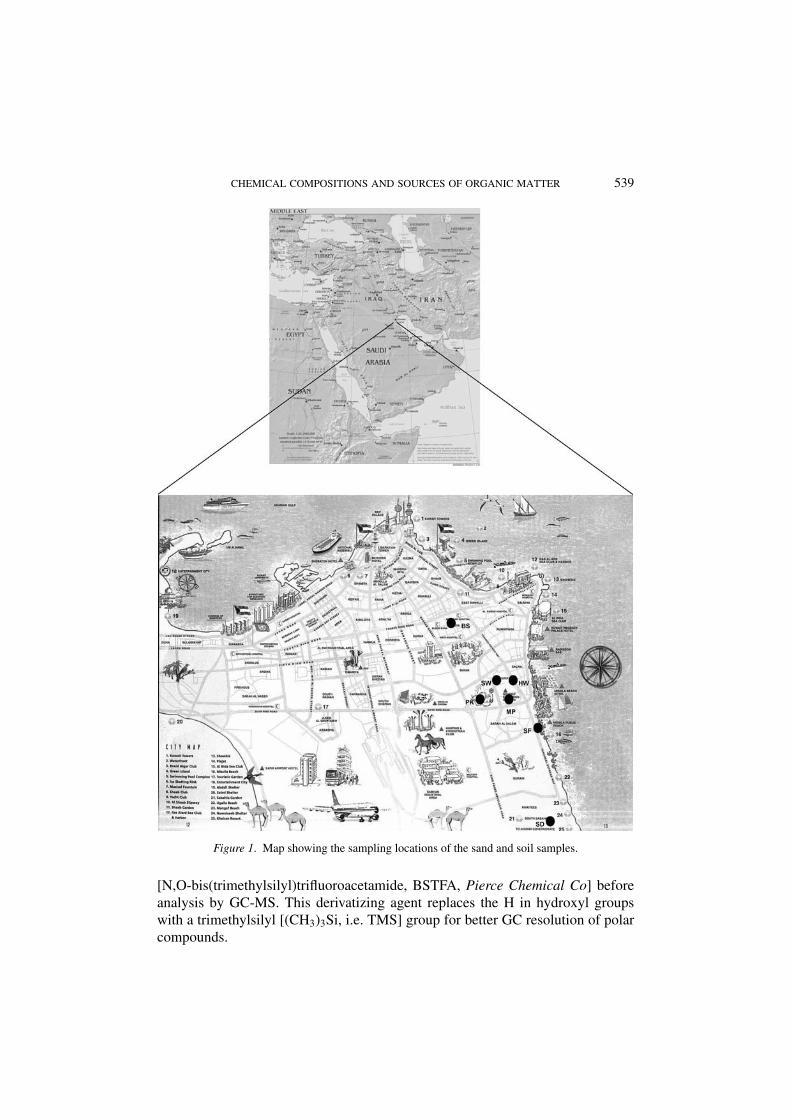
Seven soil and sand samples were collected from the surrounding area of Kuwaitcity in Feberuary 2004 to characterize their organic matter contents by gaschromatography-mass spectrometry (GC-MS) analysis. The locations and the de-scriptions of the samples are shown in Figure 1 and Table I. The samples werecollected from sites outside the main city, which represent rural areas ranging frompopulated with different human activities such as public markets (MP) and heavyvehicular traffic (HW and BS) sites to public parks (PK) and seafront places (SF)where human activities are limited to leisure time. One sample was collected froma sand dune in a less populated area of the city (SD).
The samples were treated the same way as described by Rushdi et al. (2005).Each sample was sieved to obtain fine particles (<125 μm) before total organicmatter extraction. The extraction was conducted twice by adding a mixture ofmethylene chloride/methanol (3:1 v/v) to about 2–5 g of the sieved fine particles ofeach sample and ultrasonicating for 20 min. The extracts were filtered through
pre-extracted glass microfiber filters (WhatmanR©
, GF/A filters) before solventcollection. Each total extract was then concentrated under nitrogen blow-downat room temperature to approximately 1.0–1.5 mL before GC-MS analysis. Analiquot (50–100 μL) of each total extract was derivatized with silylating reagent
CHEMICAL COMPOSITIONS AND SOURCES OF ORGANIC MATTER 539
Figure 1. Map showing the sampling locations of the sand and soil samples.
[N,O-bis(trimethylsilyl)trifluoroacetamide, BSTFA, Pierce Chemical Co] beforeanalysis by GC-MS. This derivatizing agent replaces the H in hydroxyl groupswith a trimethylsilyl [(CH3)3Si, i.e. TMS] group for better GC resolution of polarcompounds.
540 A. I. RUSHDI ET AL.
TABLE I
Descriptions and locations of the soil and sand samples collected from rural Kuwait city
Sample code Location Description
HW Highway outside the city Mixture of soil and sand
MP Market place in rural area of the city Mostly soil
PK Public park outside the city Mostly soil
BS Bus station in the vicinity of the city Mixture of soil and sand
SW Side walk in the rural area of the city Mixture of soil and sand
SF Sea front outside the city Sand
SD Sand dune outside the city Sand
2.2. INSTRUMENTAL ANALYSIS
The analysis of the extracts was carried out by GC-MS, using a Hewlett-Packard6890 GC coupled to a 5973 Mass Selective Detector with a DB-5MS (Agilent)fused silica capillary column (30 m × 0.25 mm i.d., 0.25 μm film thickness) andhelium as carrier gas. The GC was temperature programmed from 65◦ C (2 mininitial time) to 300◦ C at 6◦ C min−1 (isothermal for 20 min final time). The MSwas operated in the electron impact mode at 70 eV ion source energy. Data wereacquired and processed with a Hewlett-Packard ChemStation.
Compounds were identified by GC retention index and MS comparison with au-thentic standards, literature and library data, and characterized mixtures. Unknowncompounds were characterized by interpretation of the fragmentation pattern oftheir mass spectra. The concentrations of the compounds in ng g−1 sample wereestimated from ratios peak areas in the total ion current traces.
3. Results
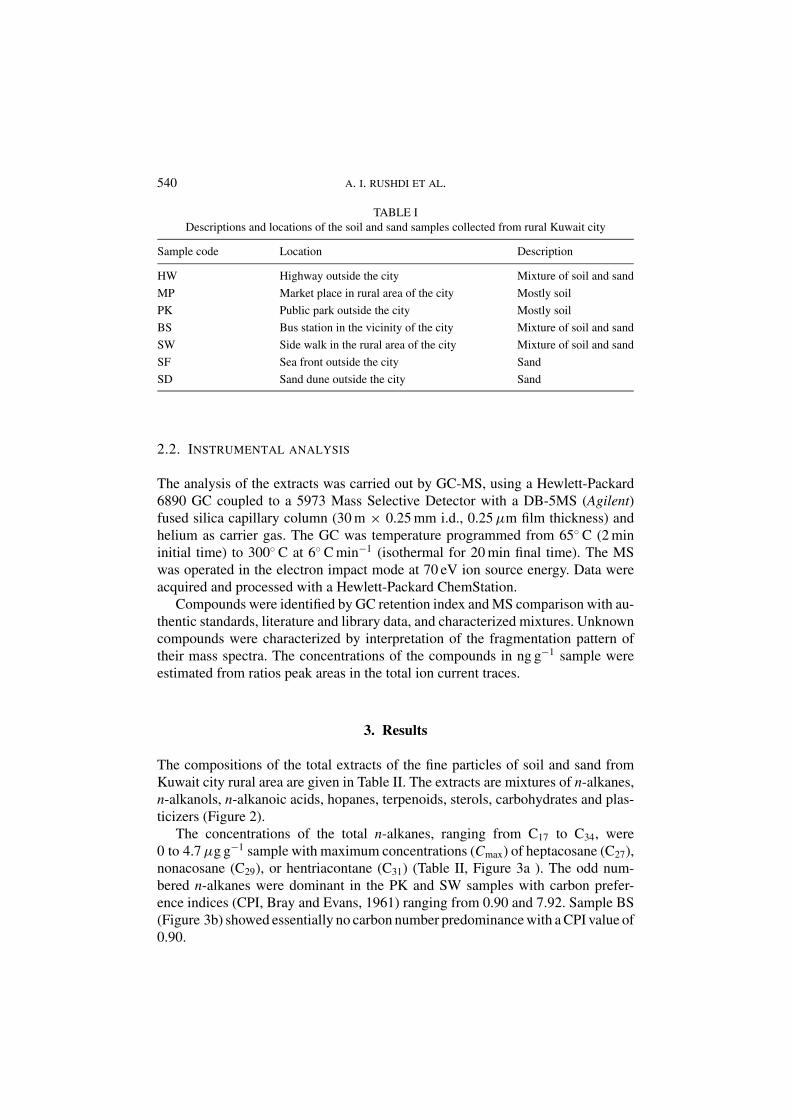
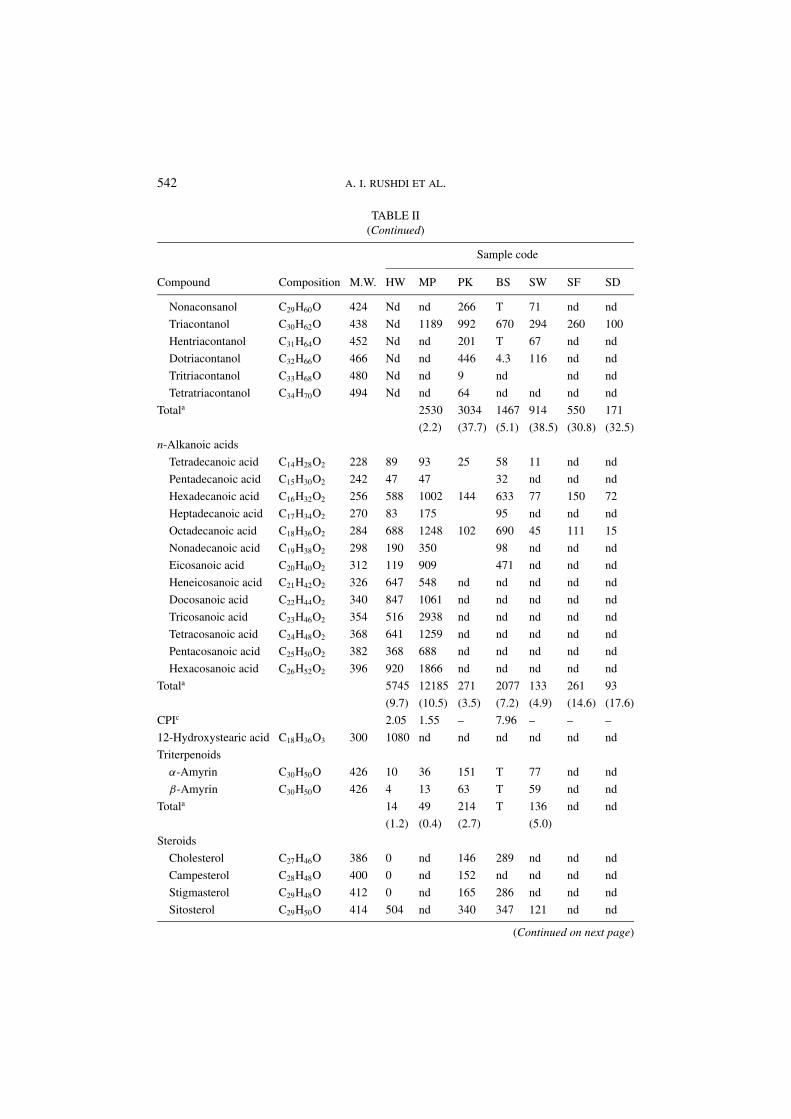
The compositions of the total extracts of the fine particles of soil and sand fromKuwait city rural area are given in Table II. The extracts are mixtures of n-alkanes,n-alkanols, n-alkanoic acids, hopanes, terpenoids, sterols, carbohydrates and plas-ticizers (Figure 2).
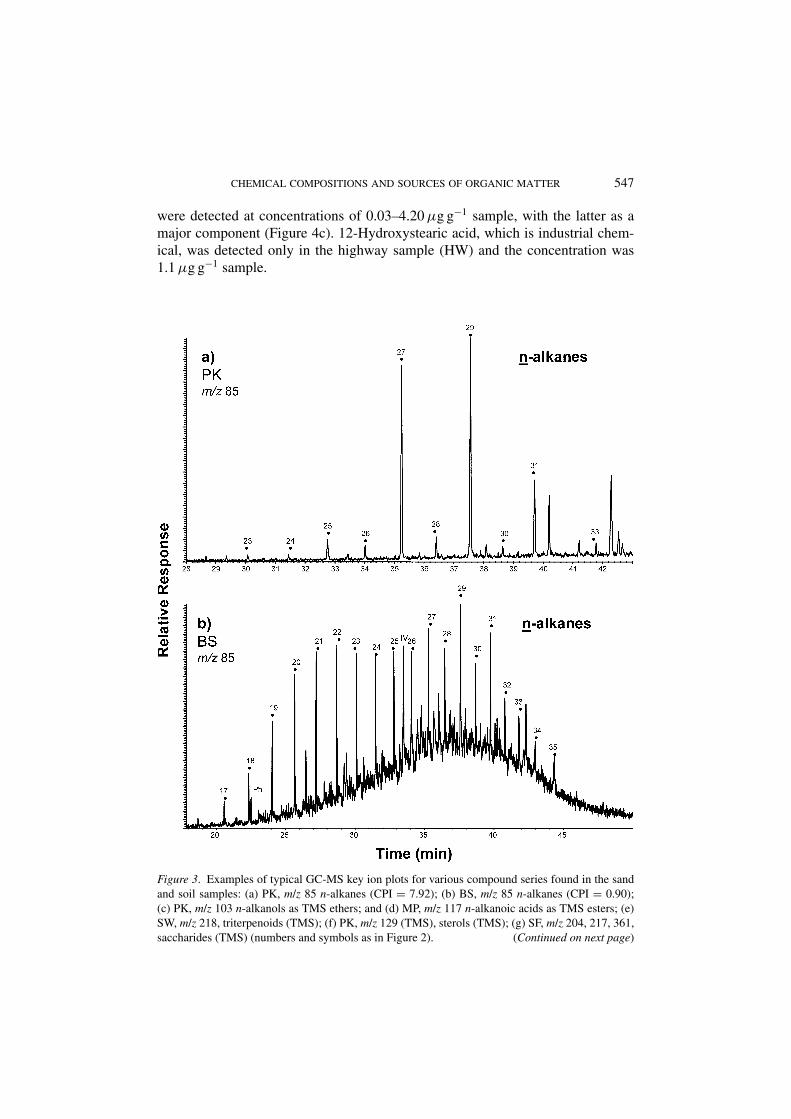
The concentrations of the total n-alkanes, ranging from C17 to C34, were0 to 4.7 μg g−1 sample with maximum concentrations (Cmax) of heptacosane (C27),nonacosane (C29), or hentriacontane (C31) (Table II, Figure 3a ). The odd num-bered n-alkanes were dominant in the PK and SW samples with carbon prefer-ence indices (CPI, Bray and Evans, 1961) ranging from 0.90 and 7.92. Sample BS(Figure 3b) showed essentially no carbon number predominance with a CPI value of0.90.
CHEMICAL COMPOSITIONS AND SOURCES OF ORGANIC MATTER 541
TABLE II
Composition, concentration (ng g−1 sample) and various parameters of solvent-extractable organic
matter of sands and soil fine particles from the vicinity of Kuwait city
Sample code
Compound Composition M.W. HW MP PK BS SW SF SD
n-Alkanes
Heptadecane C17H36 240 T T nd 6 nd nd nd
Octadecane C18H38 256 T T nd 17 nd nd nd
Nonadecane C19H40 268 T T nd 43 nd nd nd
Eicosane C20H42 282 T T nd 64 nd nd nd
Heneicosane C21H44 296 T T nd 72 nd nd nd
Docosane C22H46 310 T T nd 104 nd nd nd
Tricosane C23H48 324 T T nd 188 nd nd nd
Tetracosane C24H50 338 T T nd 260 nd nd nd
Pentacosane C25H52 352 T T 19 289 nd nd nd
Hexacosane C26H54 366 T T 9 22.5 nd nd nd
Heptacosane C27H56 380 T T 159 231 20 nd nd
Octacosane C28H58 394 T T 2 739 T nd nd
Nonacosane C29H60 408 T T 267 451 49 nd nd
Triacontane C30H62 422 T T 74 682 T nd nd
Hentriacontane C31H64 436 T T 225 592 62 nd nd
Dotriacontane C32H66 450 T T nd 349 T nd nd
Tritriacontane C33H68 464 T T nd 384 nd nd nd
Tetratriacontane C34H70 478 T T nd 43 nd nd nd
Totala T T 750 4740 132 nd nd
(9.6) (17.7) (4.8)
CPI (o/e)b 7.92 0.91
Pristane C19H40 268 nd nd nd 6 Nd nd nd
Phytane C20H42 282 nd nd nd 23 Nd nd nd
Pr/Ph 0.25
n-Alkanols
Hexadecanol C16H34O 242 Nd nd T nd nd nd nd
Octadecanol C18H38O 270 Nd nd T nd nd nd nd
Eicosanol C20H42O 298 Nd nd T nd T nd nd
Docosanol C22H46O 326 Nd nd T nd T nd nd
Tetracosanol C24H50O 354 Nd nd 54 nd 17 nd nd
Pentaconsanol C25H52O 368 Nd nd 38 nd 8 nd nd
Hexacosanol C26H54O 382 Nd nd 172 347 62 nd nd
Heptacosanol C27H56O 396 Nd nd 196 T 57 0 nd
Octacosanol C28H58O 410 Nd 1340 597 407 220 201 71
(Continued on next page)
542 A. I. RUSHDI ET AL.
TABLE II
(Continued)
Sample code
Compound Composition M.W. HW MP PK BS SW SF SD
Nonaconsanol C29H60O 424 Nd nd 266 T 71 nd nd
Triacontanol C30H62O 438 Nd 1189 992 670 294 260 100
Hentriacontanol C31H64O 452 Nd nd 201 T 67 nd nd
Dotriacontanol C32H66O 466 Nd nd 446 4.3 116 nd nd
Tritriacontanol C33H68O 480 Nd nd 9 nd nd nd
Tetratriacontanol C34H70O 494 Nd nd 64 nd nd nd nd
Totala 2530 3034 1467 914 550 171
(2.2) (37.7) (5.1) (38.5) (30.8) (32.5)
n-Alkanoic acids
Tetradecanoic acid C14H28O2 228 89 93 25 58 11 nd nd
Pentadecanoic acid C15H30O2 242 47 47 32 nd nd nd
Hexadecanoic acid C16H32O2 256 588 1002 144 633 77 150 72
Heptadecanoic acid C17H34O2 270 83 175 95 nd nd nd
Octadecanoic acid C18H36O2 284 688 1248 102 690 45 111 15
Nonadecanoic acid C19H38O2 298 190 350 98 nd nd nd
Eicosanoic acid C20H40O2 312 119 909 471 nd nd nd
Heneicosanoic acid C21H42O2 326 647 548 nd nd nd nd nd
Docosanoic acid C22H44O2 340 847 1061 nd nd nd nd nd
Tricosanoic acid C23H46O2 354 516 2938 nd nd nd nd nd
Tetracosanoic acid C24H48O2 368 641 1259 nd nd nd nd nd
Pentacosanoic acid C25H50O2 382 368 688 nd nd nd nd nd
Hexacosanoic acid C26H52O2 396 920 1866 nd nd nd nd nd
Totala 5745 12185 271 2077 133 261 93
(9.7) (10.5) (3.5) (7.2) (4.9) (14.6) (17.6)
CPIc 2.05 1.55 – 7.96 – – –
12-Hydroxystearic acid C18H36O3 300 1080 nd nd nd nd nd nd
Triterpenoids
α-Amyrin C30H50O 426 10 36 151 T 77 nd nd
β-Amyrin C30H50O 426 4 13 63 T 59 nd nd
Totala 14 49 214 T 136 nd nd
(1.2) (0.4) (2.7) (5.0)
Steroids
Cholesterol C27H46O 386 0 nd 146 289 nd nd nd
Campesterol C28H48O 400 0 nd 152 nd nd nd nd
Stigmasterol C29H48O 412 0 nd 165 286 nd nd nd
Sitosterol C29H50O 414 504 nd 340 347 121 nd nd
(Continued on next page)
CHEMICAL COMPOSITIONS AND SOURCES OF ORGANIC MATTER 543
TABLE II
(Continued)
Sample code
Compound Composition M.W. HW MP PK BS SW SF SD
Totala 504 804 921 121 nd nd
(0.9) (10.3) (3.2) (4.4)
Saccharides
α-Fructose C6H12O6 180 T T nd T nd 2 nd
β-Fructose C6H12O6 180 T T nd T nd 12 nd
α-Glucose C6H12O6 180 30 23 nd 14 nd 22 nd
β-Glucose C6H12O6 180 24 35 nd 32 nd 20 nd
Sucrose C12H22O11 342 398 1388 nd 598 nd 170 120
Mycose C12H22O11 342 760 1807 129 589 274 321 102
Totala 1223 3253 129 1233 274 546 222
(2.1) (2.8) (1.7) (4.3) (10.6) (30.6) (41.9)
Hopane biomarkers
Trisnorneohopane C27H46 370 659 1492 T 231 0.3 nd nd
17α(H)-Trisnorhopane C27H46 370 617 1294 T 321 0.3 nd nd
17α(H),21β(H)-
Norhopane
C29H50 398 1941 3906 T 869 57 90 nd
17α(H),21β(H)-
Hopane
C30H52 412 1893 3218 T 489 38 48 nd
17α(H),21β(H)-22S-
Homohopane
C31H54 426 1045 1586 nd 352 36 39 nd
17α(H),21β(H)-22R-
Homohopane
C31H54 426 1163 1737 nd 479 54 27 nd
17α(H),21β(H)-22S-
Bishomohopane
C32H56 440 1234 1924 nd 338 28 42 nd
17α(H),21β(H)-22R-
Bishomohopane
C32H56 440 611 886 nd 208 26 44 nd
17α(H),21β(H)-22S-
Trishomohopane
C33H58 454 629 1283 nd 142 nd nd nd
17α(H),21β(H)-22R-
Trishomohopane
C33H58 454 861 711 nd 130 nd nd nd
17α(H),21β(H)-22S-
Tetrakishomohopane
C34H60 468 374 490 nd 92 nd nd nd
17α(H),21β(H)-22R-
Tetrakishomohopane
C34H60 468 475 361 nd 90 nd nd nd
17α(H),21β(H)-22S-
Pentakishomohopane
C35H62 482 225 303 nd 87 nd nd nd
17α(H),21β(H)-22R-
Pentakishomohopane
C35H62 482 101 47 nd 75 nd nd nd
Total 11828 19239 nd 3902 239 315 nd
(19.9) (16.5) (13.2) (8.8) (17.7)
(Continued on next page)
544 A. I. RUSHDI ET AL.
TABLE II
(Continued)
Sample code
Compound Composition M.W. HW MP PK BS SW SF SD
C31 S/(R+S) 0.47 0.48 0.42 0.39 2.35
C32 S/(R+S) 0.67 0.68 0.62 0.52 1.67
Steranes
14β,17β-20R-
Cholestane
C27H48 372 T 2227 T T T nd nd
14β,17β-20R-
Methylcholestane
C28H50 386 nd 1901 nd nd nd nd nd
14α,17α-20S-24-
Ethylcholestane
C29H52 400 nd 1329 nd nd nd nd nd
14β,17β-20R-24-
Ethylcholestane
C29H52 400 nd 1259 nd nd nd nd nd
14β,17β-20S-24-
Ethylcholestane
C29H52 400 nd 3556 nd nd nd nd nd
14α,17α-20R-24-
Ethylcholestane
C29H52 400 nd nd nd nd nd nd
Totala T 10272 T T T nd nd
(8.8)
Plasticizers
Diethyl phthalate C12H14O4 222 T T T 14 T T T
Dibutyl phthalates C16H22O4 278 T T T 38 T T T
Benzyl-butyl
Phthalate
C19H20O4 312 nd nd nd 321
Dioctyl phthalates C24H38O4 390 4196 2542 350 1753 105 70 32
Dinonyl phthalates C26H42O4 418 5045 6075 T 1872 105 70 32
Totala 9241 8617 350 3998 105 70 32
(15.6) (7.4) (4.5) (13.8) (3.9) (3.9) (6.0)
UCM 29566 60749 247851 10903 694 36 10
(49.82) (52.1) (30.6) (37.8) (25.5) (2.0) (1.8)
Total all compounds 59401 117335 7821 29068 2725 1820 533
aThe relative concentrations of the compound groups are given in parentheses.bCPI = ∑
(nC17 + · · · + nC33)/∑
(nC18 + · · · + nC34).cCPI = ∑
(nC16 + · · · + nC26)/∑
(nC15 + · · · + nC25).
nd: not detected.
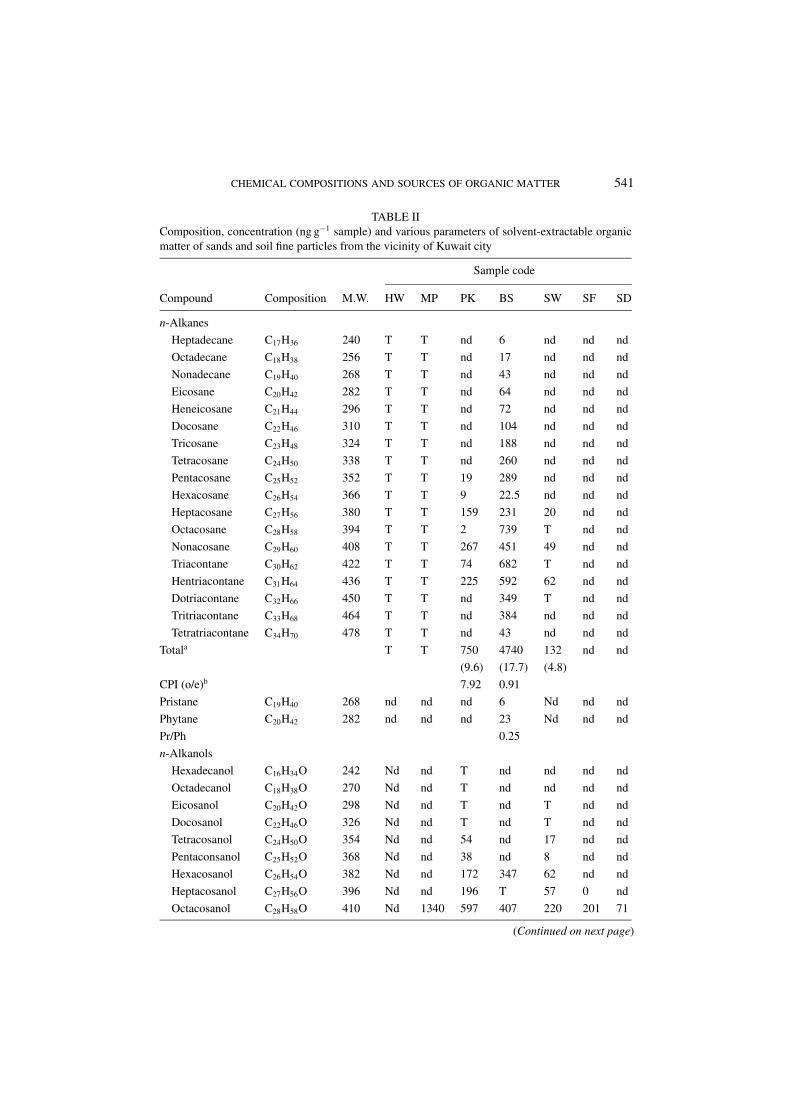
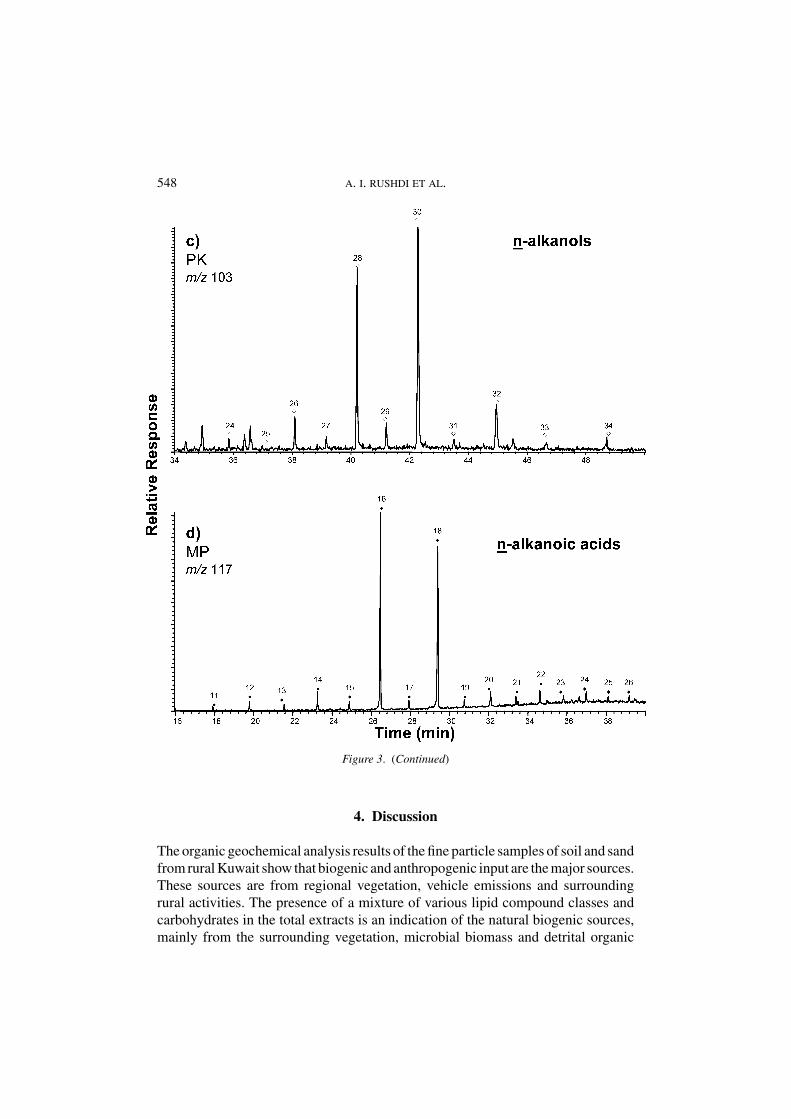
The n-alkanols were major compounds with total concentrations ranging from0 to 2.5 μg g−1 sample, extending from C24 to C34 (Figure 3c), with Cmax ofhexacosanol (C26), octacosanol (28) or nonacosan-10-ol (29). The n-alkanoic acidconcentrations varied from 0.1 to 12.0 μg g−1 sample (Table II), ranging from C11 toC26, and with a Cmax of hexadecanoic (16) and octadecanoic (18) acids (Figure 3d).The even carbon numbered homologs of the n-alkanoic acids and n-alkanols were
CHEMICAL COMPOSITIONS AND SOURCES OF ORGANIC MATTER 545
dominant (Table II). Methyl n-alkanoates and n-alkan-2-ones were not found inthese samples.
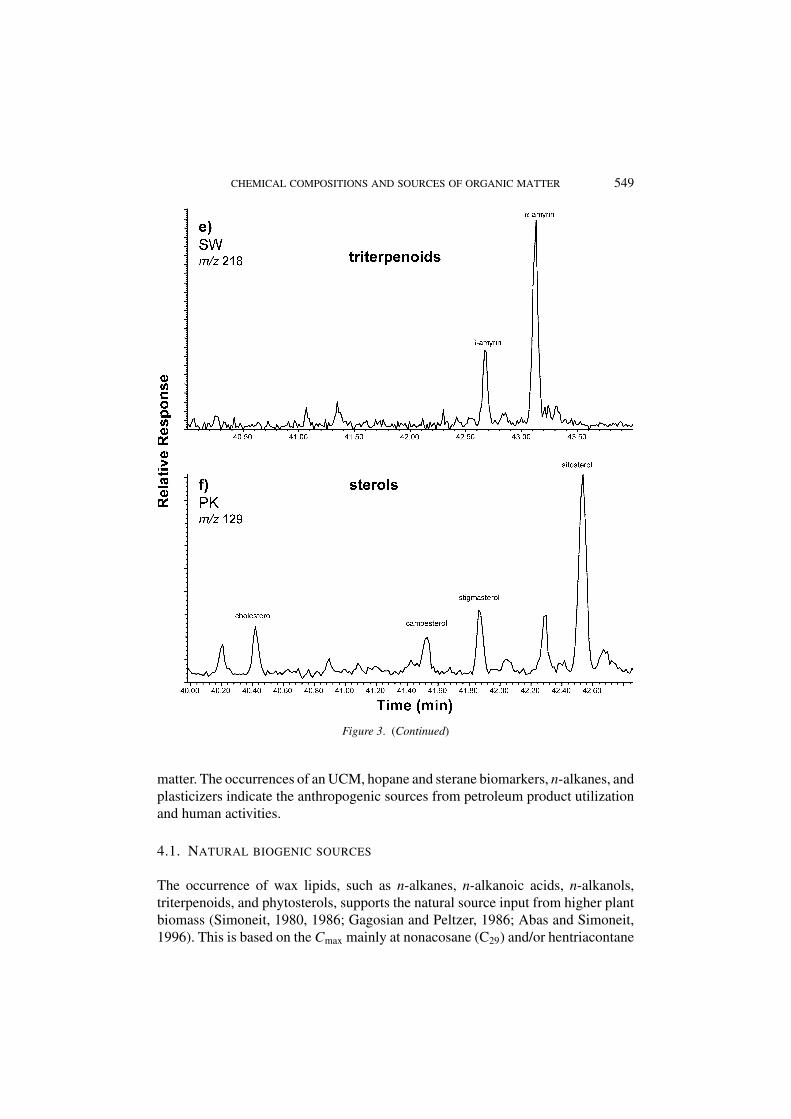
α- and β-Amyrins were present in these samples (Figure 3e), with concen-trations of 0–214 ng g−1 sample. Steroids, comprised of cholesterol, campesterol,stigmasterol and sitosterol, were significant only in sample PK (Figure 3f) and attraces in the other samples from the city. Saccharides (carbohydrates) were principal
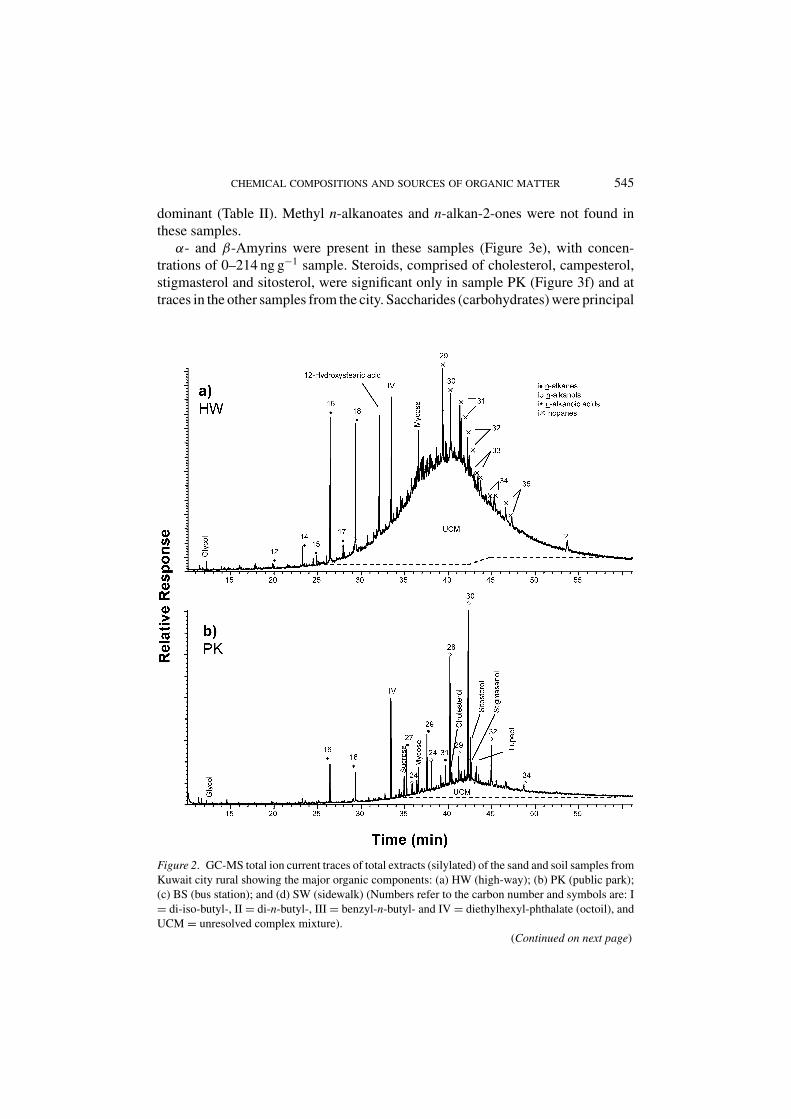
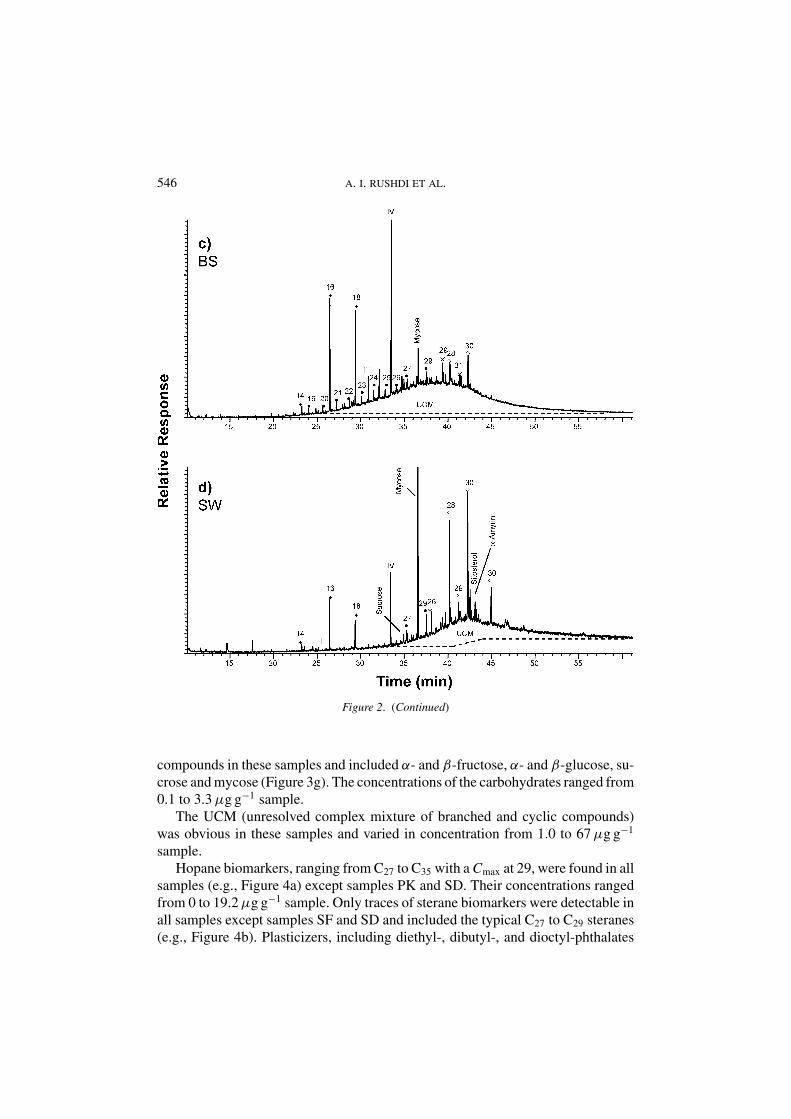
Figure 2. GC-MS total ion current traces of total extracts (silylated) of the sand and soil samples from
Kuwait city rural showing the major organic components: (a) HW (high-way); (b) PK (public park);
(c) BS (bus station); and (d) SW (sidewalk) (Numbers refer to the carbon number and symbols are: I
= di-iso-butyl-, II = di-n-butyl-, III = benzyl-n-butyl- and IV = diethylhexyl-phthalate (octoil), and
UCM = unresolved complex mixture).
(Continued on next page)
546 A. I. RUSHDI ET AL.
Figure 2. (Continued)
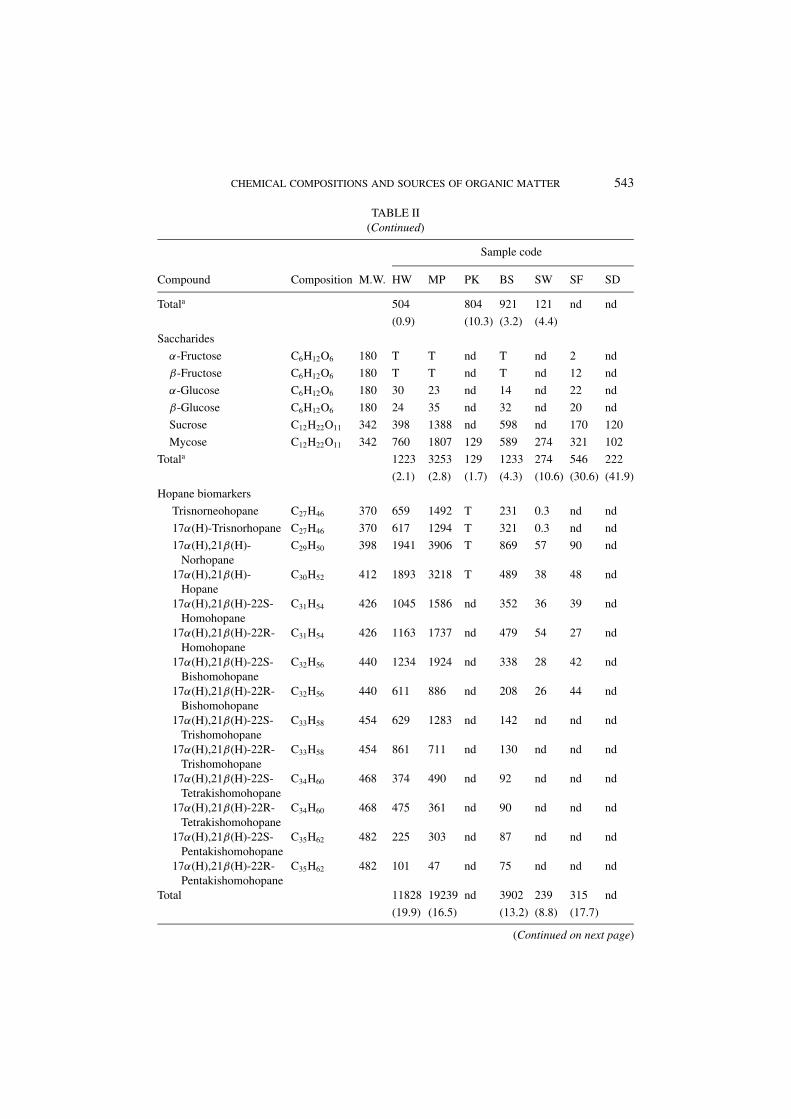
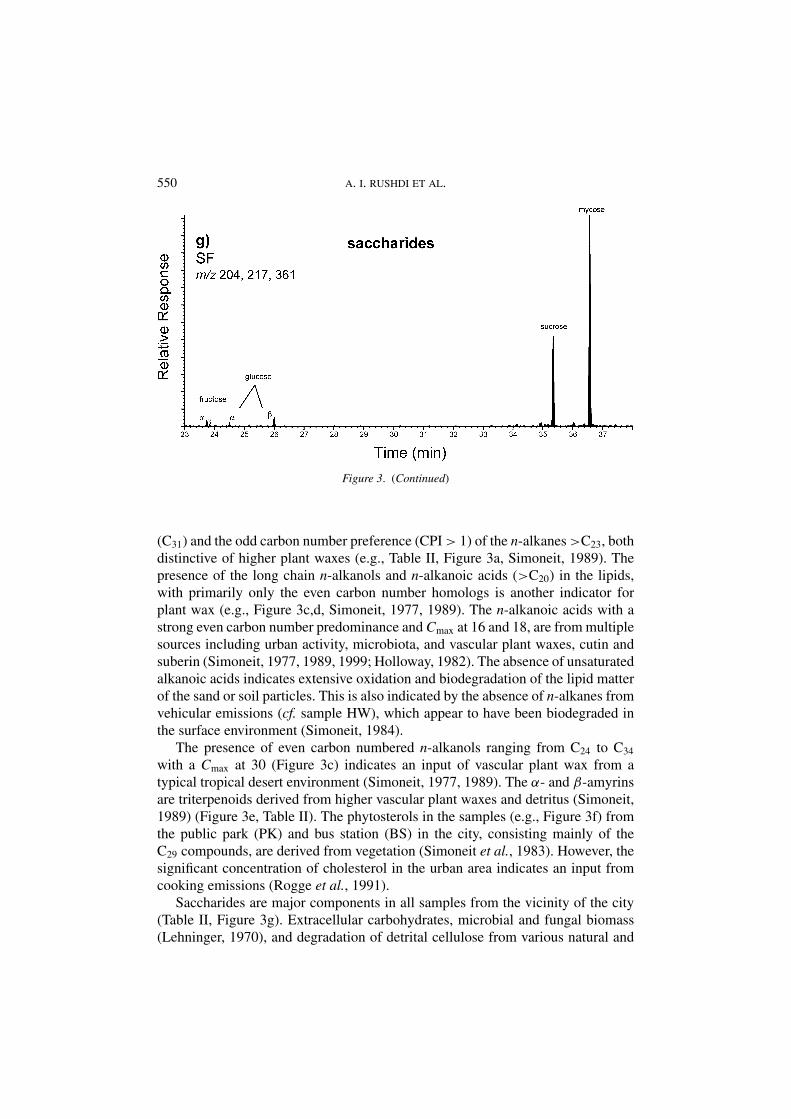
compounds in these samples and included α- and β-fructose, α- and β-glucose, su-crose and mycose (Figure 3g). The concentrations of the carbohydrates ranged from0.1 to 3.3 μg g−1 sample.
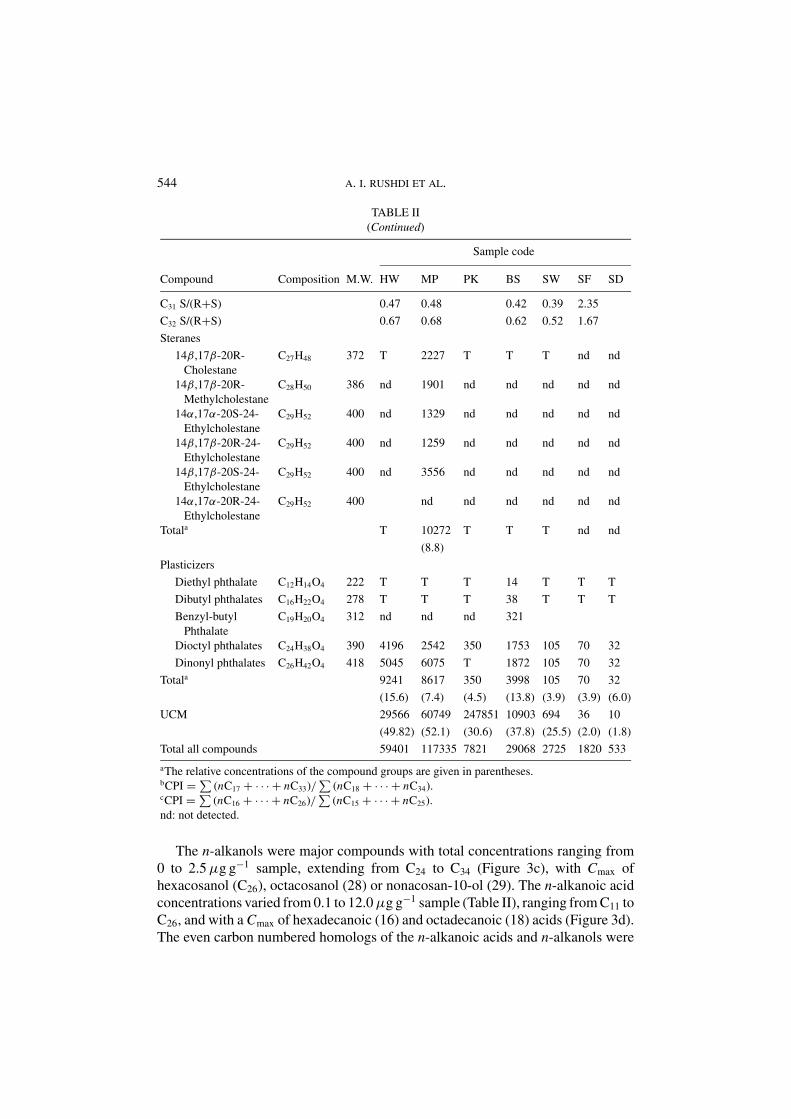
The UCM (unresolved complex mixture of branched and cyclic compounds)was obvious in these samples and varied in concentration from 1.0 to 67 μg g−1
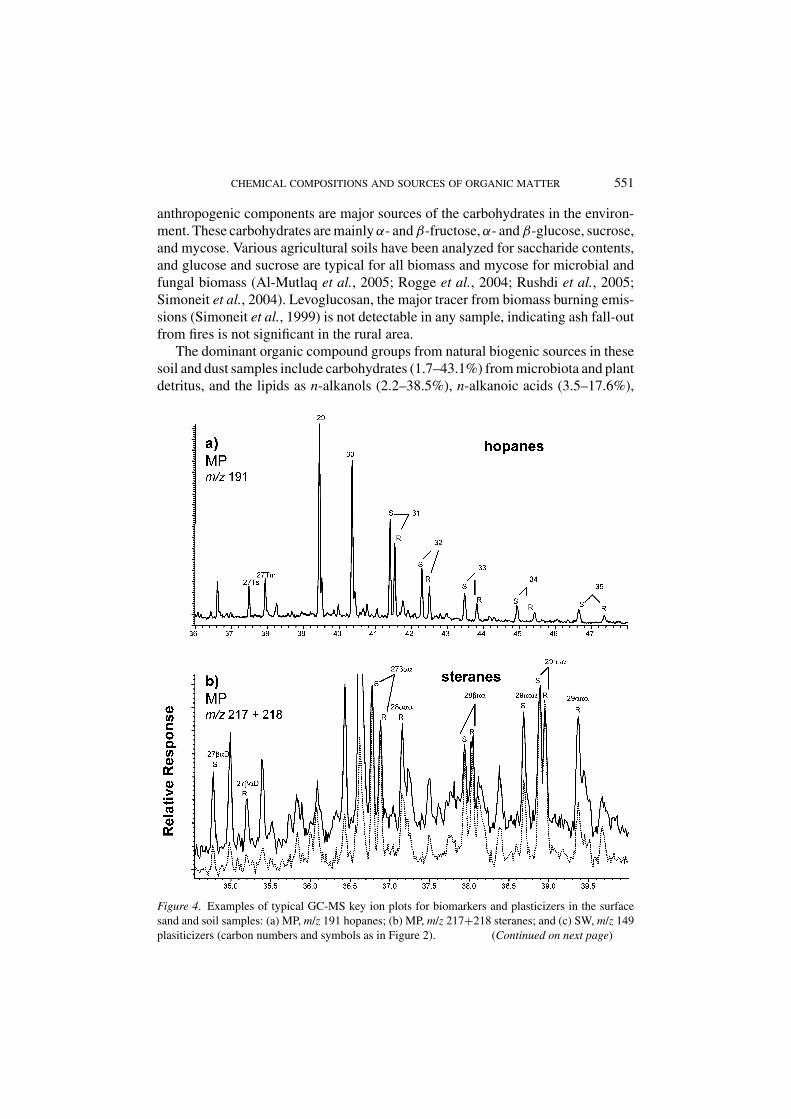
sample.Hopane biomarkers, ranging from C27 to C35 with a Cmax at 29, were found in all
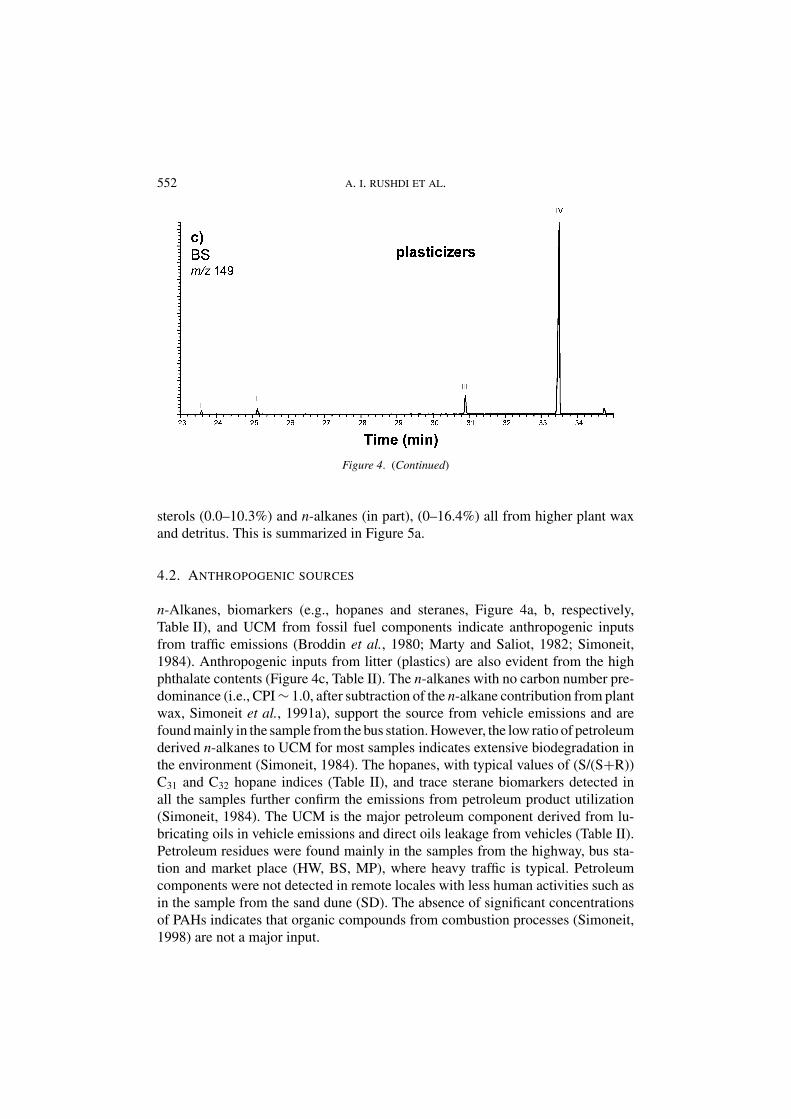
samples (e.g., Figure 4a) except samples PK and SD. Their concentrations rangedfrom 0 to 19.2 μg g−1 sample. Only traces of sterane biomarkers were detectable inall samples except samples SF and SD and included the typical C27 to C29 steranes(e.g., Figure 4b). Plasticizers, including diethyl-, dibutyl-, and dioctyl-phthalates
CHEMICAL COMPOSITIONS AND SOURCES OF ORGANIC MATTER 547
were detected at concentrations of 0.03–4.20 μg g−1 sample, with the latter as amajor component (Figure 4c). 12-Hydroxystearic acid, which is industrial chem-ical, was detected only in the highway sample (HW) and the concentration was1.1 μg g−1 sample.
Figure 3. Examples of typical GC-MS key ion plots for various compound series found in the sand
and soil samples: (a) PK, m/z 85 n-alkanes (CPI = 7.92); (b) BS, m/z 85 n-alkanes (CPI = 0.90);
(c) PK, m/z 103 n-alkanols as TMS ethers; and (d) MP, m/z 117 n-alkanoic acids as TMS esters; (e)
SW, m/z 218, triterpenoids (TMS); (f) PK, m/z 129 (TMS), sterols (TMS); (g) SF, m/z 204, 217, 361,
saccharides (TMS) (numbers and symbols as in Figure 2). (Continued on next page)
548 A. I. RUSHDI ET AL.
Figure 3. (Continued)
4. Discussion
The organic geochemical analysis results of the fine particle samples of soil and sandfrom rural Kuwait show that biogenic and anthropogenic input are the major sources.These sources are from regional vegetation, vehicle emissions and surroundingrural activities. The presence of a mixture of various lipid compound classes andcarbohydrates in the total extracts is an indication of the natural biogenic sources,mainly from the surrounding vegetation, microbial biomass and detrital organic
CHEMICAL COMPOSITIONS AND SOURCES OF ORGANIC MATTER 549
Figure 3. (Continued)
matter. The occurrences of an UCM, hopane and sterane biomarkers, n-alkanes, andplasticizers indicate the anthropogenic sources from petroleum product utilizationand human activities.
4.1. NATURAL BIOGENIC SOURCES
The occurrence of wax lipids, such as n-alkanes, n-alkanoic acids, n-alkanols,triterpenoids, and phytosterols, supports the natural source input from higher plantbiomass (Simoneit, 1980, 1986; Gagosian and Peltzer, 1986; Abas and Simoneit,1996). This is based on the Cmax mainly at nonacosane (C29) and/or hentriacontane
550 A. I. RUSHDI ET AL.
Figure 3. (Continued)
(C31) and the odd carbon number preference (CPI > 1) of the n-alkanes >C23, bothdistinctive of higher plant waxes (e.g., Table II, Figure 3a, Simoneit, 1989). Thepresence of the long chain n-alkanols and n-alkanoic acids (>C20) in the lipids,with primarily only the even carbon number homologs is another indicator forplant wax (e.g., Figure 3c,d, Simoneit, 1977, 1989). The n-alkanoic acids with astrong even carbon number predominance and Cmax at 16 and 18, are from multiplesources including urban activity, microbiota, and vascular plant waxes, cutin andsuberin (Simoneit, 1977, 1989, 1999; Holloway, 1982). The absence of unsaturatedalkanoic acids indicates extensive oxidation and biodegradation of the lipid matterof the sand or soil particles. This is also indicated by the absence of n-alkanes fromvehicular emissions (cf. sample HW), which appear to have been biodegraded inthe surface environment (Simoneit, 1984).
The presence of even carbon numbered n-alkanols ranging from C24 to C34
with a Cmax at 30 (Figure 3c) indicates an input of vascular plant wax from atypical tropical desert environment (Simoneit, 1977, 1989). The α- and β-amyrinsare triterpenoids derived from higher vascular plant waxes and detritus (Simoneit,1989) (Figure 3e, Table II). The phytosterols in the samples (e.g., Figure 3f) fromthe public park (PK) and bus station (BS) in the city, consisting mainly of theC29 compounds, are derived from vegetation (Simoneit et al., 1983). However, thesignificant concentration of cholesterol in the urban area indicates an input fromcooking emissions (Rogge et al., 1991).
Saccharides are major components in all samples from the vicinity of the city(Table II, Figure 3g). Extracellular carbohydrates, microbial and fungal biomass(Lehninger, 1970), and degradation of detrital cellulose from various natural and
CHEMICAL COMPOSITIONS AND SOURCES OF ORGANIC MATTER 551
anthropogenic components are major sources of the carbohydrates in the environ-ment. These carbohydrates are mainly α- and β-fructose, α- and β-glucose, sucrose,and mycose. Various agricultural soils have been analyzed for saccharide contents,and glucose and sucrose are typical for all biomass and mycose for microbial andfungal biomass (Al-Mutlaq et al., 2005; Rogge et al., 2004; Rushdi et al., 2005;Simoneit et al., 2004). Levoglucosan, the major tracer from biomass burning emis-sions (Simoneit et al., 1999) is not detectable in any sample, indicating ash fall-outfrom fires is not significant in the rural area.
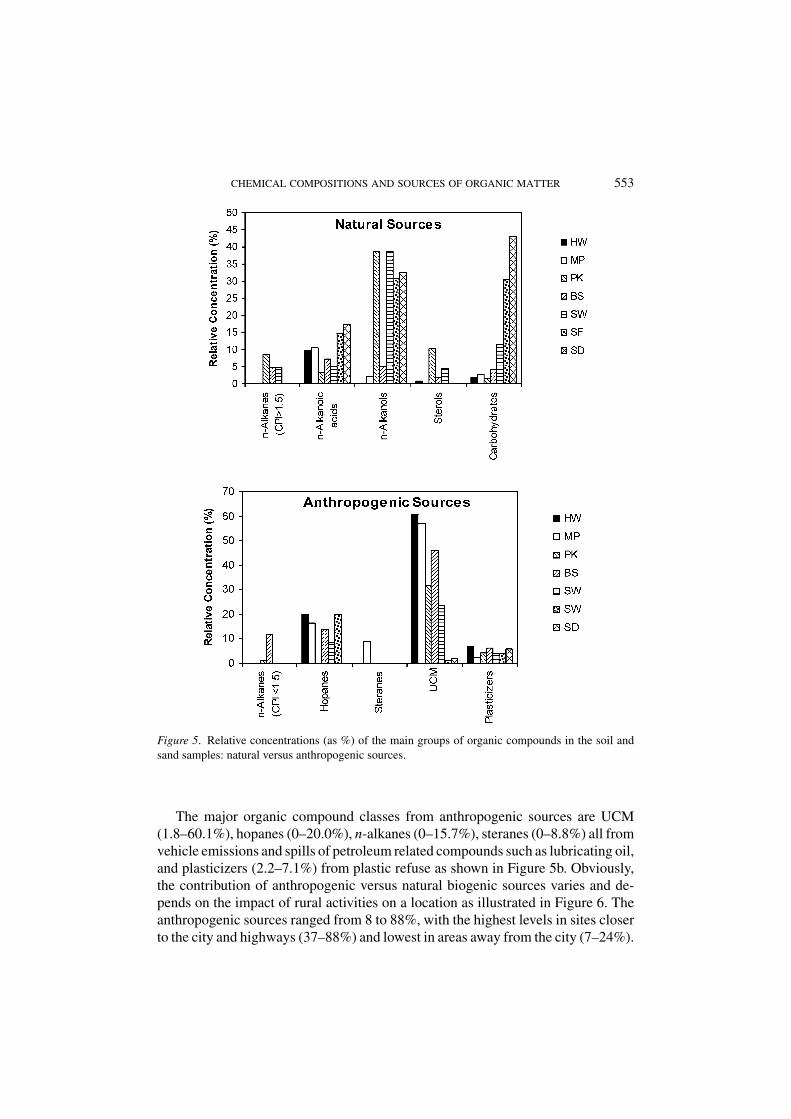
The dominant organic compound groups from natural biogenic sources in thesesoil and dust samples include carbohydrates (1.7–43.1%) from microbiota and plantdetritus, and the lipids as n-alkanols (2.2–38.5%), n-alkanoic acids (3.5–17.6%),
Figure 4. Examples of typical GC-MS key ion plots for biomarkers and plasticizers in the surface
sand and soil samples: (a) MP, m/z 191 hopanes; (b) MP, m/z 217+218 steranes; and (c) SW, m/z 149
plasiticizers (carbon numbers and symbols as in Figure 2). (Continued on next page)
552 A. I. RUSHDI ET AL.
Figure 4. (Continued)
sterols (0.0–10.3%) and n-alkanes (in part), (0–16.4%) all from higher plant waxand detritus. This is summarized in Figure 5a.
4.2. ANTHROPOGENIC SOURCES
n-Alkanes, biomarkers (e.g., hopanes and steranes, Figure 4a, b, respectively,Table II), and UCM from fossil fuel components indicate anthropogenic inputsfrom traffic emissions (Broddin et al., 1980; Marty and Saliot, 1982; Simoneit,1984). Anthropogenic inputs from litter (plastics) are also evident from the highphthalate contents (Figure 4c, Table II). The n-alkanes with no carbon number pre-dominance (i.e., CPI ∼ 1.0, after subtraction of the n-alkane contribution from plantwax, Simoneit et al., 1991a), support the source from vehicle emissions and arefound mainly in the sample from the bus station. However, the low ratio of petroleumderived n-alkanes to UCM for most samples indicates extensive biodegradation inthe environment (Simoneit, 1984). The hopanes, with typical values of (S/(S+R))C31 and C32 hopane indices (Table II), and trace sterane biomarkers detected inall the samples further confirm the emissions from petroleum product utilization(Simoneit, 1984). The UCM is the major petroleum component derived from lu-bricating oils in vehicle emissions and direct oils leakage from vehicles (Table II).Petroleum residues were found mainly in the samples from the highway, bus sta-tion and market place (HW, BS, MP), where heavy traffic is typical. Petroleumcomponents were not detected in remote locales with less human activities such asin the sample from the sand dune (SD). The absence of significant concentrationsof PAHs indicates that organic compounds from combustion processes (Simoneit,1998) are not a major input.
CHEMICAL COMPOSITIONS AND SOURCES OF ORGANIC MATTER 553
Figure 5. Relative concentrations (as %) of the main groups of organic compounds in the soil and
sand samples: natural versus anthropogenic sources.
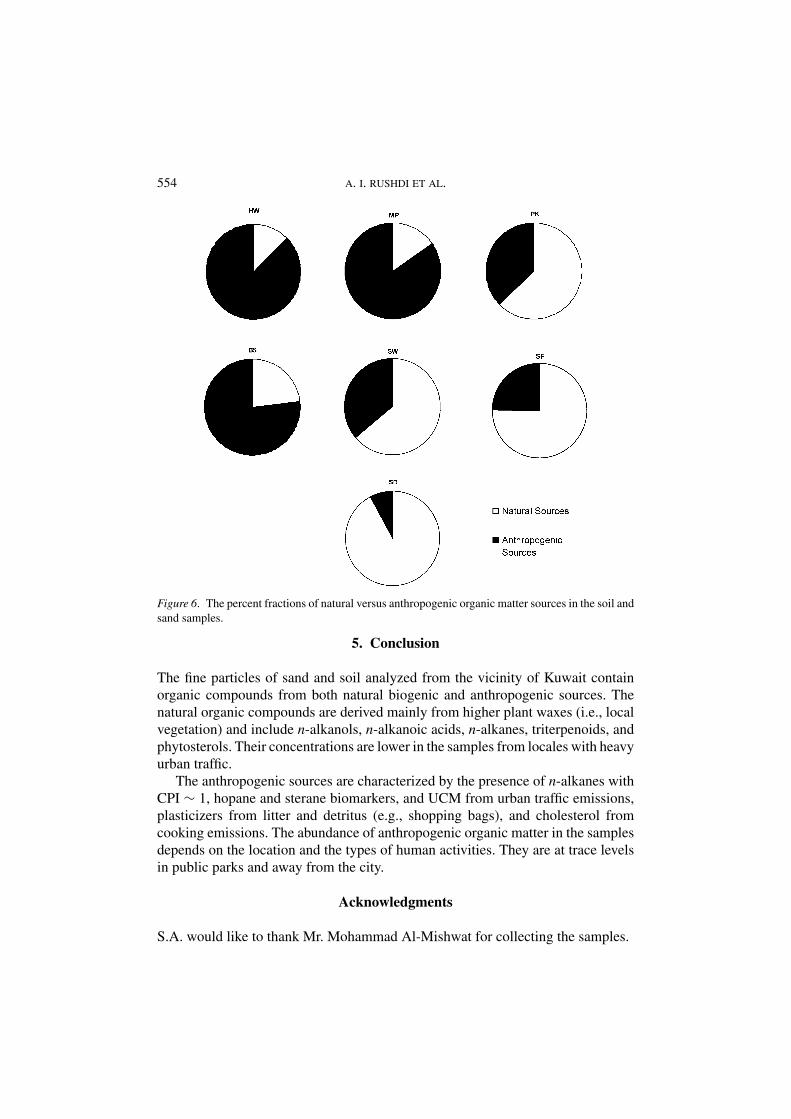
The major organic compound classes from anthropogenic sources are UCM(1.8–60.1%), hopanes (0–20.0%), n-alkanes (0–15.7%), steranes (0–8.8%) all fromvehicle emissions and spills of petroleum related compounds such as lubricating oil,and plasticizers (2.2–7.1%) from plastic refuse as shown in Figure 5b. Obviously,the contribution of anthropogenic versus natural biogenic sources varies and de-pends on the impact of rural activities on a location as illustrated in Figure 6. Theanthropogenic sources ranged from 8 to 88%, with the highest levels in sites closerto the city and highways (37–88%) and lowest in areas away from the city (7–24%).
554 A. I. RUSHDI ET AL.
Figure 6. The percent fractions of natural versus anthropogenic organic matter sources in the soil and
sand samples.
5. Conclusion
The fine particles of sand and soil analyzed from the vicinity of Kuwait containorganic compounds from both natural biogenic and anthropogenic sources. Thenatural organic compounds are derived mainly from higher plant waxes (i.e., localvegetation) and include n-alkanols, n-alkanoic acids, n-alkanes, triterpenoids, andphytosterols. Their concentrations are lower in the samples from locales with heavyurban traffic.
The anthropogenic sources are characterized by the presence of n-alkanes withCPI ∼ 1, hopane and sterane biomarkers, and UCM from urban traffic emissions,plasticizers from litter and detritus (e.g., shopping bags), and cholesterol fromcooking emissions. The abundance of anthropogenic organic matter in the samplesdepends on the location and the types of human activities. They are at trace levelsin public parks and away from the city.
Acknowledgments
S.A. would like to thank Mr. Mohammad Al-Mishwat for collecting the samples.
CHEMICAL COMPOSITIONS AND SOURCES OF ORGANIC MATTER 555
References
Abas, M. and Simoneit, B. R. T.: 1996, ‘Composition of extractable organic matter of air particles
from Malaysia: An initial study’, Atmos. Environ. 30, 2779–2793.
Abas, M., Simoneit, B. R. T., Elias, V. O., Cabral, J. A. and Cardoso, J. N.: 1995, ‘Composition of
higher molecular weight organic matter in smoke aerosol from biomass combustion in Amazonia’,
Chemosphere 30, 995–1015.
Al-Mutlaq, K., Rushdi, A. I. and Simoneit, B. R. T.: 2002, ‘Characteristics and sources of organic
matter in desert sand samples from the Riyadh and Al-Qasim areas of Saudi Arabia: Preliminary
results’, Arab Gulf J. Sci. Res. 20(3), 141–155.
Al-Mutlaq, K., Rushdi, A. I. and Simoneit, B. R. T.: 2005, ‘Organic compound tracers of fine soil and
sand particles during summer in the metropolitan area of Riyadh, Saudi Arabia’, Water, Air andSoil Pollut. (submitted)
Bray, E. E. and Evans, E. D.: 1961, ‘Distribution of n-paraffins as a clue to recognition of source
beds’, Geochimica et Cosmochimica Acta 22, 2–15.
Broddin, G., Cautreels, W. and van Cauwenberghe, D.: 1980, ‘On the aliphatic and polyaromatic
hydrocarbon levels in urban and background aerosols from Belgium and the Netherlands’, Atmos.Environ. 14, 895–910.
Cass, G. R., Rogge, W. F., Gray, H. A., Hildemann, L. M., Markowski, G. R., Mazurek, M.A. and
Simoneit, B. R. T.: 1993, ‘Source contributions to atmospheric carbon particle concentrations’,
in: Southern California Air Quality Study, Data Analysis, Air & Waste Management Assoc.,Pittsburgh, PA, pp. 110–115.
Fraser, M. P., Cass, G. R., Simoneit, B. R. T. and Rasmussen, R. A.: 1997, ‘Air quality model evaluation
data for organics: 4. C2 to C36 non-aromatic hydrocarbons’, Environ. Sci. Technol. 31, 2356–
2367.
Fraser, M. P., Cass, G. R. and Simoneit, B. R. T.: 1998a, ‘Gas-phase and particle-phase organic
compounds emitted from motor vehicle traffic in a Los Angeles roadway tunnel’, Environ. Sci.Technol. 32, 2051–2060.
Fraser, M. P., Cass, G. R., Simoneit, B. R. T. and Rasmussen, R. A.: 1998b, ‘Air quality model
evaluation data for organics: 5. C6–C22 nonpolar and semipolar aromatic compounds’, Environ.Sci. Technol. 32, 1760–1770.
Gagosian, R. B. and Peltzer, E. T.: 1986, ‘The importance of atmospheric input of terrestrial organic
material to deep sea sediments’, Org. Geochem. 10, 661–669.
Gagosian, R. B., Peltzer, E. T. and Merrill, J. T.: 1987, ‘Long-range transport of terrestrially derived
lipids in aerosols from the South Pacific’, Nature 325, 800–803.
Holloway, P. J., 1982, ‘The chemical contribution of plant cutins’, in: D. F. Cutler, K. L. Alvin and
C. E. Price (eds.), The Plant Cuticle, Linnean Soc., Academic Press, London, pp. 45–85.
Ketseridis, G., Hahn, J., Jaenicke, R. and Junge, C.: 1976, ‘Organic constituents of atmospheric
particulate matter’, Atmos. Environ. 10, 603–610.
Lehninger, A. L.: 1970, Biochemistry, Worth Publishers, Inc. New York, 833 pp.
Marty, J.-C. and Saliot, A.: 1982, ‘Aerosols in equatorial Atlantic air: n-alkanes as a function of
particle size’, Nature 298, 144–147.
Matsumoto, G. and Hanya, T.: 1980. ‘Organic constituents in atmospheric fallout in the Tokyo area’,
Atmos. Environ. 14, 1409–1419.
Mazurek, M. A., Simoneit, B. R. T. and Cass, G. R.: 1989, ‘Interpretation of high-resolution gas
chromatography and high resolution gas chromatography/mass spectrometry data acquired from
atmospheric organic aerosol samples’, Aerosol Sci. Technol. 10, 408–420.
Rogge, W. F., Hildemann, L. M., Mazurek, M. A., Cass, G. R. and Simoneit, B. R. T.: 1991, ‘Sources
of fine organic aerosol: 1 – Charbroilers and meat cooking operations’, Environ. Sci. Technol. 25,
1112–1125.
556 A. I. RUSHDI ET AL.
Rogge, W. F., Mazurek, M. A., Hildemann, L. M., Cass, G. R. and Simoneit, B. R. T.: 1993a,
‘Quantification of organic aerosols on a molecular level: Identification, abundance and seasonal
variation’, Atmosph. Environ. 27A, 1309–1330.
Rogge, W. F., Hildemann, L. M., Mazurek, M. A., Cass, G. R. and Simoneit, B. R. T.: 1993b, ‘Sources
of fine organic aerosol: 2. Noncatalyst and catalyst-equipped automobiles and heavy-duty diesel
trucks’, Environ. Sci. Technol. 27, 636–651.
Rogge, W. F., Hildemann, L. M., Mazurek, M. A., Cass, G. R. and Simoneit, B. R. T.: 1993c, ‘Sources
of fine organic aerosol. 3. Road dust, tire debris, and organometallic brake lining dust: Roads as
sources and sinks’, Environ. Sci. Technol. 27, 1892–1904.
Rogge, W. F., Hildemann, L. M., Mazurek, M. A., Cass, G. R. and Simoneit, B. R. T.: 1993d,
‘Sources of fine organic aerosol: 4. Particulate abrasion products from leaf surfaces of urban
plants’, Environ. Sci. Technol. 27, 2700–2711.
Rogge, W. F., Hildemann, L. M., Mazurek, M. A., Cass, G. R. and Simoneit, B. R. T.: 1993e,
‘Sources of fine organic aerosol: 5. Natural gas home appliances’, Environ. Sci. Technol. 27, 2736–
2744.
Rogge, W. F., Hildemann, L. M., Mazurek, M. A., Cass, G. R. and Simoneit, B. R. T.: 1994, ‘Sources
of fine organic aerosol: 6. Cigarette smoke in the urban atmosphere’, Environ. Sci. Technol. 28,
1375–1388.
Rogge, W. F., Hildemann, L. M., Mazurek, M. A., Cass, G. R. and Simoneit, B. R. T.: 1996, ‘Mathemat-
ical modeling of atmospheric fine particle-associated primary organic compound concentrations’,
J. Geophys. Res. 101(D14), 19379–19394.
Rogge, W. F., Hildemann, L. M., Mazurek, M. A., Cass, G. R. and Simoneit, B. R. T.: 1997a, ‘Sources
of fine organic aerosol: 7. Hot asphalt roofing tar pot fumes’, Environ. Sci. Technol. 31, 2726–2730.
Rogge, W. F., Hildemann, L. M., Mazurek, M. A., Cass, G. R. and Simoneit, B. R. T.: 1997b, ‘Sources
of fine organic aerosol: 8. Boilers burning No. 2 distillate fuel oil’, Environ. Sci. Technol. 31, 2731–
2737.
Rogge, W. F., Hildemann, L. M., Mazurek, M. A., Cass, G. R. and Simoneit, B. R. T.: 1998, ‘Sources of
fine organic aerosol: 9. Pine, oak and synthetic log combustion in residential fireplaces’, Environ.Sci. Technol. 32, 13–22.
Rogge, W. F., Medeiros, P. M. and Simoneit, B. R. T.: 2004, ‘Saccharides and other organic tracers
in soil samples from the Fugitive Dust Characterization Study’, Atmos. Environ. to be submitted.
Rushdi, A. I., Al-Mutlaq K. and Simoneit, B. R. T. 2005, ‘Sources of organic compounds in fine soil
and sand particles during winter in the metropolitan area of Riyadh, Saudi Arabia’, Arch. Environ.Contam. Toxicol. 49, 547–470.
Schauer, J. J., Rogge, W. F., Hildemann, L. M., Mazurek, M. A., Cass, G. R. and Simoneit, B .R. T.:
1996, ‘Source apportionment of airborne particulate matter using organic compounds as tracers’,
Atmos. Environ. 30, 3837–3855.
Simoneit, B. R. T.: 1977, ‘Organic matter in eolian dusts over the Atlantic Ocean’, Mar. Chem. 5,
443–464.
Simoneit, B. R. T.: 1980, ‘Eolian particulates from oceanic and rural areas – Their lipids, fulvic
and humic acids and residual carbon’, in: A. G. Douglas and J. R. Maxwell (eds.), Advances inOrganic Geochemistry 1979, Pergamon Press, Oxford, pp. 343–352.
Simoneit, B. R. T.: 1984, ‘Organic matter of the troposphere – III. Characterization and sources of
petroleum and pyrogenic residues in aerosols over the western United States’, Atmos. Environ.18, 51–67.
Simoneit, B. R. T.: 1986, ‘Characterization of organic constituents in aerosols in relation to their
origin and transport: A review’, Int. J. Environ. Anal. Chem. 23, 207–237.
Simoneit, B. R. T.: 1989, ‘Organic matter of troposphere – V: Application of molecular marker
analysis to biogenic emissions into the troposphere for source reconciliations’, J. Atmos. Chem.8, 251–275.
CHEMICAL COMPOSITIONS AND SOURCES OF ORGANIC MATTER 557
Simoneit, B. R. T.: 1998, ‘Biomarker PAHs in the environment’, in: A. H. Neilson (ed.), The Handbookof Environmental Chemistry, vol. 3, Part I, Springer Verlag, Berlin, pp. 175–221.
Simoneit, B. R. T.: 1999, ‘A review of biomarker compounds as source indicators and tracers for air
pollution’, Environ. Sci. Pollut. Res. 6, 153–163.
Simoneit, B. R. T. and Mazurek, M. A.: 1982, ‘Organic matter of the troposphere – II. Natural
background of biogenic lipid matter in aerosols over the rural western United States’, Atmos.Environ. 16, 2139–2159.
Simoneit, B. R. T. and Mazurek, M. A.: 1989, ‘Organic tracers in ambient aerosols and rain’, AerosolSci Technol. 10, 267–291.
Simoneit, B. R. T., Mazurek, M. A. and Reed, W. E.: 1983, ‘Characterization of organic matter in
aerosols over rural sites: Phytosterols’, in: M. Bjorøy et al. (eds.), Advances in Organic Geochem-istry 1981, J. Wiley and Sons Ltd., Chichester, pp. 355–361.
Simoneit, B. R. T., Cox, R. E. and Standley, L. J.: 1988, ‘Organic matter of the troposphere – IV:
Lipids in Harmattan aerosols of Nigeria’, Atmosph. Environment 22, 983–1004.
Simoneit, B. R. T., Cardoso, J. N. and Robinson, N.: 1990, ‘An assessment of the origin and compo-
sition of higher molecular weight organic matter in aerosols over Amazonia’, Chemosphere 21,
1285–1301.
Simoneit, B. R. T., Crisp, P. T., Mazurek, M. A. and Standley, L. J.: 1991a, ‘Composition of extractable
organic matter of aerosols from the Blue Mountains and southeast coast of Australia’, Environ.Internat. 17, 405–419.
Simoneit, B. R. T., Sheng, G., Chen, X., Fu, J., Zhang, J. and Xu, Y.: 1991b, ‘Molecular marker study
of extractable organic matter in aerosols from urban areas of China’, Atmosph. Environ. 25A,
2111–2129.
Simoneit, B. R. T., Cardoso, J. N. and Robinson, N.: 1991c, ‘An assessment of terrestrial higher
molecular weight lipid compounds in air particulate matter over the South Atlantic from about
30–70◦S′, Chemosphere, 23, 447–465.
Simoneit, B. R. T., Rogge, W. F., Mazurek, M. A., Standley, L. J., Hildemann, L. M. and Cass, G. R.:
1993, ‘Lignin pyrolysis products, lignans and resin acids as specific tracers of plant classes in
emissions from biomass combustion’, Environ. Sci. Technol. 27, 2533–2541.
Simoneit, B. R. T., Schauer, J. J., Nolte, C. G., Oros, D. R., Elias, V. O., Fraser, M. P., Rogge W. F.
and Cass, G. R.: 1999, ‘Levoglucosan, a tracer for cellulose in biomass burning and atmospheric
particles’, Atmosph. Environ. 33, 173–182.
Simoneit, B. R. T., Elias, V. O., Kobayashi, M., Kawamura, K., Rushdi, A. I., Medeiros, P. M.,
Rogge, W. F. and Didyk, B. M.: 2004, ‘Sugars – dominant water-soluble organic compounds in
soils and characterization as tracers in atmospheric particulate matter’, Environ. Sci. Technol. 38,
5939–5949.
Standley, L. J. and Simoneit, B. R. T.: 1987, ‘Composition of extractable plant wax, resin and thermally
matured components in smoke particles from prescribed burns’, Environ. Sci. Technol. 21, 163–
169.
Copyright © 2022 FDOKUMEN