Optimal interpolation to re-analyse PM10 concentration modelling simulations
Upload
independentCategory
view
2download
0
Dynamic Article LinksC<Journal ofEnvironmentalMonitoringCite this: J. Environ. Monit., 2012, 14, 3000
www.rsc.org/jem PAPER
Chemical composition, sources, and deposition fluxes of water-solubleinorganic ions obtained from precipitation chemistry measurements collectedat an urban site in northwest China
Zhenxing Shen,*ab Leiming Zhang,c Junji Cao,b Jing Tian,a Li Liu,a Geihui Wang,b Zhuzi Zhao,b Xin Wang,a
Renjian Zhangd and Suixin Liub
Received 11th June 2012, Accepted 30th August 2012
DOI: 10.1039/c2em30457k
Precipitation samples were collected at an urban site in Xi’an, northwest China during March to
November in 2009 and were then analyzed to determine the pH and concentrations of water-soluble
inorganic ions (Na+, NH4+, K+, Mg2+, Ca2+, SO4
2�, NO3�, Cl�, and F�) in precipitation. The pH of
precipitation ranged from 4.1 to 7.6 for all of the samples with an annual volume-weighted mean of 6.4.
While a large portion of the precipitation events were weakly acidic or alkaline, around 30% of the
precipitation events in the autumn were strongly acidic. Precipitation events with air masses from
the northeast and the southeast were weakly acidic while those with air masses from the northwest and
the southwest were alkaline. SO42�, Ca2+, NH4
+, and NO3� were dominant ions in the precipitation,
accounting for 37%, 25%, 18%, and 9%, respectively, of the total analyzed ions. Ca2+ and NH4+ were
found to be the major neutralizers of precipitation acidity; however, the contribution of Mg2+,
although much lower than those of Ca2+ and NH4+, was important, in many cases, in changing the
precipitation from weakly acidic to weakly alkaline. Enrichment factor analysis confirmed that SO42�
and NO3� were produced from anthropogenic sources, Ca2+, K+, and 80% Mg2+ were from crustal
sources, and Na+, Cl�, and�20% of Mg2+ were from marine sources. The annual wet depositions were
estimated to be 3.5 t km�2 per year for sulfur; 2.3 t km�2 per year for nitrogen, of which 0.8 t km�2
per year was oxidized nitrogen and 1.5 t km�2 per year was reduced nitrogen; and 3.0 t km�2 per year
for Ca2+.
aDepartment of Environmental Science and Engineering, Xi’an JiaotongUniversity, Xi’an 710049, China. E-mail: [email protected] Laboratory of Aerosol, SKLLQG, Institute of Earth Environment,Chinese Academy of Sciences, Xi’an 710075, ChinacAir Quality Research Division, Science and Technology Branch,Environment Canada, Toronto, CanadadKey Laboratory of Regional Climate-Environment Research forTemperate East Asia, Institute of Atmospheric Physics, ChineseAcademy of Sciences, Beijing 100029, China
Environmental impact
In this manuscript we investigated the chemical composition, sou
precipitation observed in Xi’an, Northwest China. The pH in precip
volume-weighted mean of 6.4. SO42�, Ca2+, NH4
+ and NO3� were d
from anthropogenic sources, Ca2+, K+, and 80% Mg2+ were from
marine sources. The annual wet deposition of sulfur at Xi’an was in
were available. The annual nitrogen deposition was in the lower ra
locations. It is likely that the benefit of nitrogen deposition in this r
much higher deposition of ammonium than that of nitrate.
3000 | J. Environ. Monit., 2012, 14, 3000–3008
1. Introduction
Atmospheric precipitation, one important part of the natural
water cycle, plays a significant role in carrying chemical pollut-
ants from the atmosphere to the earth’s surface.1,2 Water-soluble
inorganic ions constitute a significant portion of total particulate
matter and precipitation samples and thus have direct and indi-
rect impacts on air quality, climate and ecosystems.2–5 To address
various issues related to these ions, their concentrations in air
rces, and deposition fluxes of water-soluble inorganic ions in
itation ranged from 4.1 to 7.6 for all the samples with an annual
ominant ions in precipitation. SO42� and NO3
� were produced
crustal sources, and Na+, Cl�, and �20% of Mg2+ were from
the medium range among the major Chinese cities where data
nge among the Chinese cities but much higher than a few rural
egion is more than its damage to the ecosystem considering the
This journal is ª The Royal Society of Chemistry 2012
and in precipitation and the sources and chemical mechanisms
producing those ions need to be understood at local, regional,
and global scales. To date, many studies around the world have
revealed the source types, formation mechanisms, chemical and
physical characteristics, and dry and wet deposition of the major
water-soluble inorganic ions.2,6–10
The rapid economic growth in China during the past three
decades has caused many environmental pollution problems. For
example, one third of the Chinese territory has been affected by
acid rain, with some megacities in southern China experiencing
rain with an annual mean pH as low as 3.11 A significant number
of studies on precipitation have been focused on water-soluble
inorganic ions, especially in the heavily polluted regions of
China, e.g., Pearl River Delta region, Yangtze Delta region, and
Beijing–Tianjin region.12–14 Earlier studies have mostly focused
on acid rain12,14,15 while recent studies have also included other
ambient data, especially on size-segregated ions.16,17
However, studies in the northwest region of China are still
limited. Xi’an is the largest city in northwest China, with an
urban area of 1066 km2 and a population of 5.1 million.
Increased aerosol concentrations due to rapid increase in the
number of motor vehicles and energy consumption has a strong
impact on air quality.16,18–22 To fill the knowledge gaps on
precipitation chemistry in this city, precipitation samples were
collected during March to November in 2009. This study pres-
ents the analysis results of the collected precipitation samples
focusing on precipitation acidity, the ions’ concentrations in the
precipitation, and their sources, transportation, and annual wet
deposition. The results generated from this study are expected to
be useful in making emission-control policies.
2. Methodology
2.1 Data collection
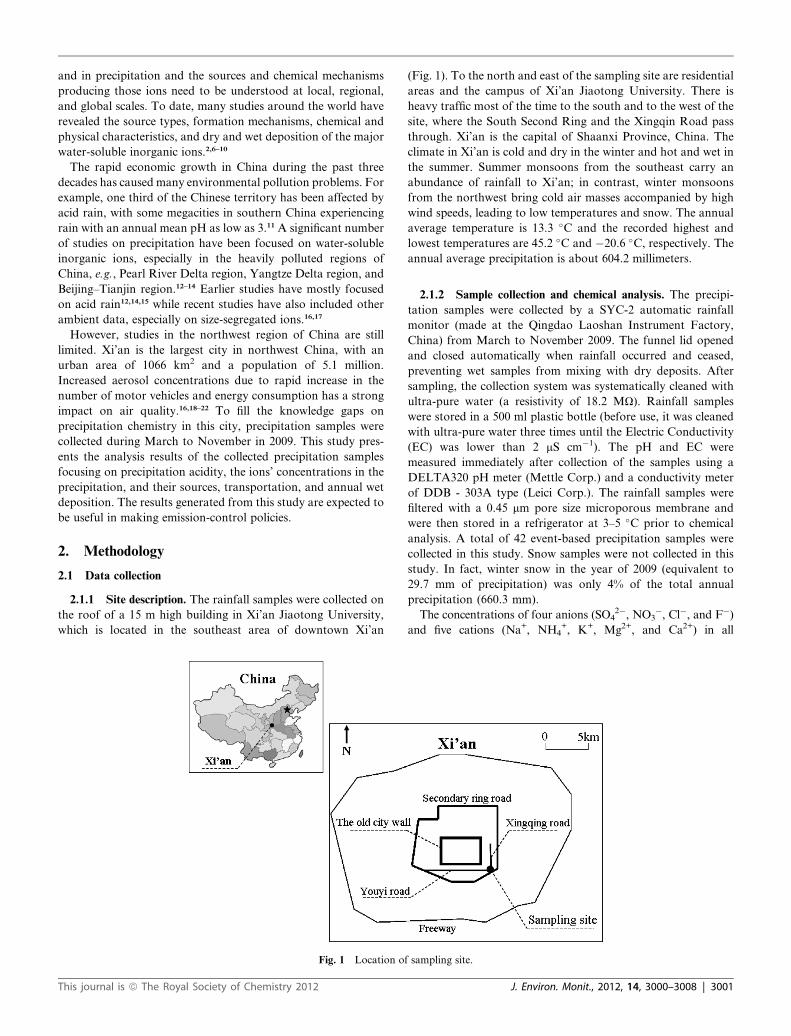
2.1.1 Site description. The rainfall samples were collected on
the roof of a 15 m high building in Xi’an Jiaotong University,
which is located in the southeast area of downtown Xi’an
Fig. 1 Location o
This journal is ª The Royal Society of Chemistry 2012
(Fig. 1). To the north and east of the sampling site are residential
areas and the campus of Xi’an Jiaotong University. There is
heavy traffic most of the time to the south and to the west of the
site, where the South Second Ring and the Xingqin Road pass
through. Xi’an is the capital of Shaanxi Province, China. The
climate in Xi’an is cold and dry in the winter and hot and wet in
the summer. Summer monsoons from the southeast carry an
abundance of rainfall to Xi’an; in contrast, winter monsoons
from the northwest bring cold air masses accompanied by high
wind speeds, leading to low temperatures and snow. The annual
average temperature is 13.3 �C and the recorded highest and
lowest temperatures are 45.2 �C and �20.6 �C, respectively. Theannual average precipitation is about 604.2 millimeters.
2.1.2 Sample collection and chemical analysis. The precipi-
tation samples were collected by a SYC-2 automatic rainfall
monitor (made at the Qingdao Laoshan Instrument Factory,
China) from March to November 2009. The funnel lid opened
and closed automatically when rainfall occurred and ceased,
preventing wet samples from mixing with dry deposits. After
sampling, the collection system was systematically cleaned with
ultra-pure water (a resistivity of 18.2 MU). Rainfall samples
were stored in a 500 ml plastic bottle (before use, it was cleaned
with ultra-pure water three times until the Electric Conductivity
(EC) was lower than 2 mS cm�1). The pH and EC were
measured immediately after collection of the samples using a
DELTA320 pH meter (Mettle Corp.) and a conductivity meter
of DDB - 303A type (Leici Corp.). The rainfall samples were
filtered with a 0.45 mm pore size microporous membrane and
were then stored in a refrigerator at 3–5 �C prior to chemical
analysis. A total of 42 event-based precipitation samples were
collected in this study. Snow samples were not collected in this
study. In fact, winter snow in the year of 2009 (equivalent to
29.7 mm of precipitation) was only 4% of the total annual
precipitation (660.3 mm).
The concentrations of four anions (SO42�, NO3
�, Cl�, and F�)and five cations (Na+, NH4
+, K+, Mg2+, and Ca2+) in all
f sampling site.
J. Environ. Monit., 2012, 14, 3000–3008 | 3001
precipitation samples were determined by a DX 500 ion chro-
matograph (IC, Dionex Corp, Sunnyvale, CA). Cation concen-
trations were determined using a CS12A column (Dionex Corp.)
with 20 mMmethanesulfonate as an eluent. Anions were separated
by an AS11-HC column (Dionex Corp.) using 20 mMKOH as the
eluent. Standard reference materials produced by the National
Research Center for Certified Reference Materials, China, were
analyzed for quality assurance purposes. The maximum relative
precisions were 1.8% for Na+, 0.9% for NH4+, 0.6% for K+, 4.0%
for Ca2+, 1.0% forMg2+, 1.2% for SO42�, 2.6% for NO3
�, 0.3% for
Cl�, and 1.4% for F�. Strong linear correlations existed between
the EC and total ion concentration (R ¼ 0.95), suggesting reliable
sampling and determination methods. H+ concentrations were
obtained from the pH values. Accordingly, the average pH in any
period can be calculated from the volume-weighted average
concentration of H+, i.e. pH ¼ �logH+.
2.2 Data analysis
2.2.1 Ion balance. Ion balance provides a useful tool to
evaluate the reliability of the ionic determination method and to
explain the acid–base balance of rainfall samples. The cation and
anion microequivalents were calculated as follows:
C (cation microequivalents) ¼ Na+/23 + NH4+/18
+ K+/39 + Mg2+/12 + Ca2+/20 + H+/1 (1)
A (anion microequivalents) ¼ F�/19 + Cl�/35.5+ NO3
�/62 + SO42�/48 (2)
2.2.2 Neutralization factor. The neutralization factor (NF)
can be used to describe the interaction between cations and
anions.23 The NF of Ca2+, NH4+, and Mg2+ were calculated
using their equivalent concentrations:
NFCa2þ ¼ Ca2þ
SO42� þNO3
� (3)
NFNH4þ ¼ NH4
þ
SO42� þNO3
� (4)
NFMg2þ ¼ Mg2þ
SO42� þNO3
� (5)
2.2.3 Enrichment factor. Enrichment Factor (EF) analysis is
commonly used to distinguish the relative contributions of
crustal or marine sources from other sources for aerosol samples
or precipitation samples.24–26 In this study, Ca2+ and Na+ were
selected as the references for the crustal and marine sources,
respectively.27,28 The EF was calculated according to:
Emarine ¼ [x/CNa+]rainwater/[x/CNa+]marine (6)
Ecrust ¼ [x/CCa2+]rainwater/[x/CCa2+]crust (7)
In these equations, x/CNa+ was taken from Keene et al.28 and
x/CCa2+ was taken from Safai et al.27 An EF value smaller than 10
3002 | J. Environ. Monit., 2012, 14, 3000–3008
suggests that the chemical species was mainly from crustal or
marine sources; otherwise, it had been heavily influenced by
anthropogenic sources.
The contribution of sea salt (SS) and non-sea salt (NSS)
sources to an ionic species can also be separated according to:
Xmarine ¼ [CNa+]rainwater � [x/CNa+]seawater (8)
SS ¼ (Xmarine/Xrain) � 100% (9)
NSS ¼ 1 � SS (10)
where Xmarine is the sea salt origin concentration of the ionic
component of X, and Xrain is the concentration of the ionic
component of X in rainwater.
2.2.4 Air mass back-trajectory analysis. Air mass back-
trajectory is another useful tool to identify the possible sources
and transport pathways of air pollution and precipitation.2,9 In
this study, a 48 h air mass back-trajectory was generated using
the NOAA HYSPLIT 4 trajectory model to help analyze the
sources of ionic species in the collected precipitation samples.
Precipitation events from the air masses of the same directions
will be defined as the same trajectory cluster.
2.2.5 Estimation of wet deposition of ionic species. The wet
deposition flux of an ionic species can be estimated as the product
of the precipitation amount (P) and ionic concentration in
precipitation (C). The annual wet deposition is then calculated as:
Fw ¼Xn
i¼1
CiPi (11)
3. Results and discussion
3.1 Precipitation acidity
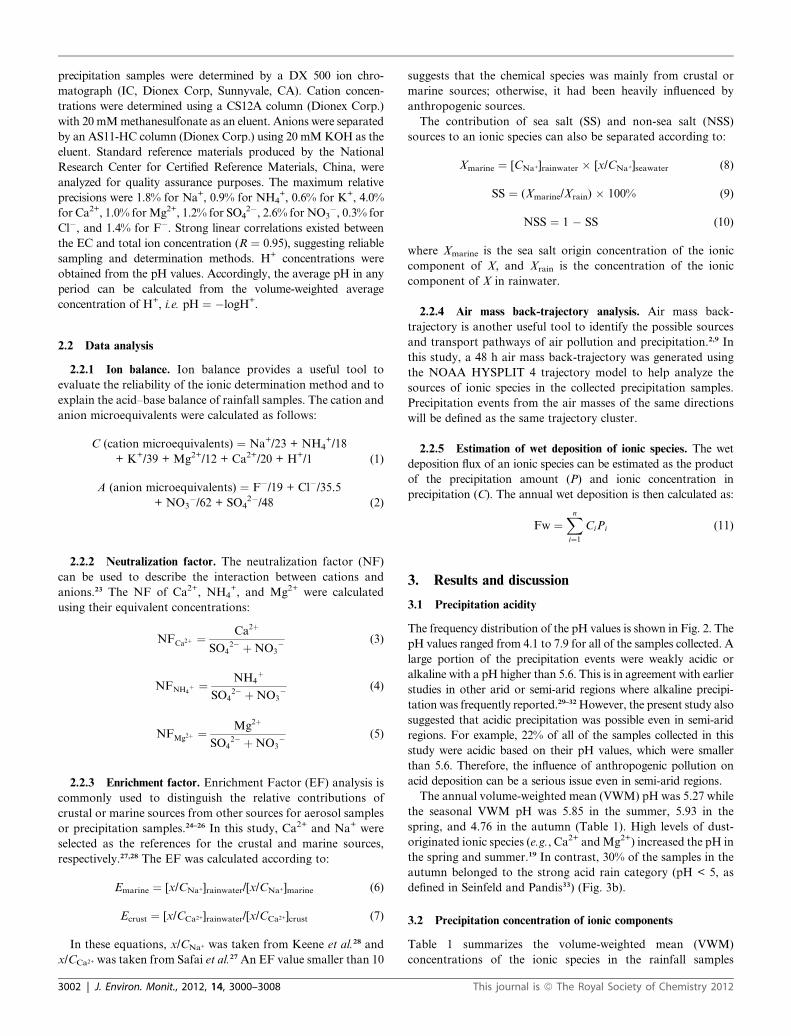
The frequency distribution of the pH values is shown in Fig. 2. The
pH values ranged from 4.1 to 7.9 for all of the samples collected. A
large portion of the precipitation events were weakly acidic or
alkaline with a pH higher than 5.6. This is in agreement with earlier
studies in other arid or semi-arid regions where alkaline precipi-
tation was frequently reported.29–32However, the present study also
suggested that acidic precipitation was possible even in semi-arid
regions. For example, 22% of all of the samples collected in this
study were acidic based on their pH values, which were smaller
than 5.6. Therefore, the influence of anthropogenic pollution on
acid deposition can be a serious issue even in semi-arid regions.
The annual volume-weighted mean (VWM) pH was 5.27 while
the seasonal VWM pH was 5.85 in the summer, 5.93 in the
spring, and 4.76 in the autumn (Table 1). High levels of dust-
originated ionic species (e.g., Ca2+ andMg2+) increased the pH in
the spring and summer.19 In contrast, 30% of the samples in the
autumn belonged to the strong acid rain category (pH < 5, as
defined in Seinfeld and Pandis33) (Fig. 3b).
3.2 Precipitation concentration of ionic components
Table 1 summarizes the volume-weighted mean (VWM)
concentrations of the ionic species in the rainfall samples
This journal is ª The Royal Society of Chemistry 2012
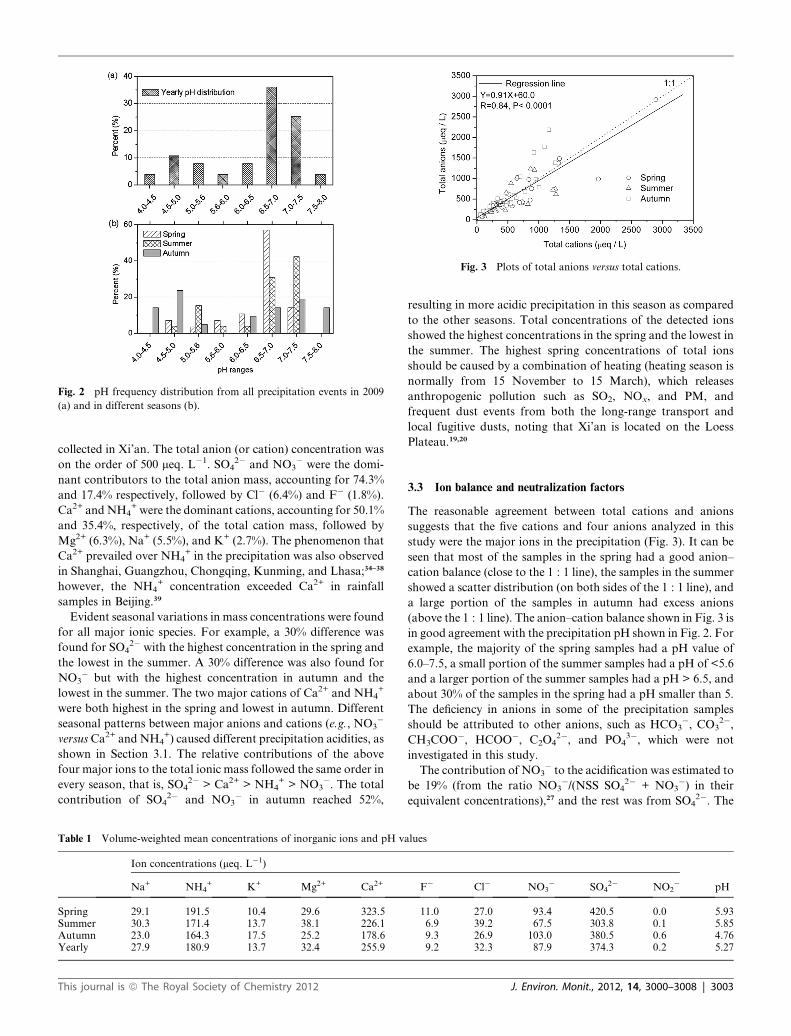
Fig. 2 pH frequency distribution from all precipitation events in 2009
(a) and in different seasons (b).
Fig. 3 Plots of total anions versus total cations.
collected in Xi’an. The total anion (or cation) concentration was
on the order of 500 meq. L�1. SO42� and NO3
� were the domi-
nant contributors to the total anion mass, accounting for 74.3%
and 17.4% respectively, followed by Cl� (6.4%) and F� (1.8%).
Ca2+ and NH4+ were the dominant cations, accounting for 50.1%
and 35.4%, respectively, of the total cation mass, followed by
Mg2+ (6.3%), Na+ (5.5%), and K+ (2.7%). The phenomenon that
Ca2+ prevailed over NH4+ in the precipitation was also observed
in Shanghai, Guangzhou, Chongqing, Kunming, and Lhasa;34–38
however, the NH4+ concentration exceeded Ca2+ in rainfall
samples in Beijing.39
Evident seasonal variations in mass concentrations were found
for all major ionic species. For example, a 30% difference was
found for SO42� with the highest concentration in the spring and
the lowest in the summer. A 30% difference was also found for
NO3� but with the highest concentration in autumn and the
lowest in the summer. The two major cations of Ca2+ and NH4+
were both highest in the spring and lowest in autumn. Different
seasonal patterns between major anions and cations (e.g., NO3�
versusCa2+ and NH4+) caused different precipitation acidities, as
shown in Section 3.1. The relative contributions of the above
four major ions to the total ionic mass followed the same order in
every season, that is, SO42� > Ca2+ > NH4
+ > NO3�. The total
contribution of SO42� and NO3
� in autumn reached 52%,
Table 1 Volume-weighted mean concentrations of inorganic ions and pH va
Ion concentrations (meq. L�1)
Na+ NH4+ K+ Mg2+ Ca2+
Spring 29.1 191.5 10.4 29.6 323.5Summer 30.3 171.4 13.7 38.1 226.1Autumn 23.0 164.3 17.5 25.2 178.6Yearly 27.9 180.9 13.7 32.4 255.9
This journal is ª The Royal Society of Chemistry 2012
resulting in more acidic precipitation in this season as compared
to the other seasons. Total concentrations of the detected ions
showed the highest concentrations in the spring and the lowest in
the summer. The highest spring concentrations of total ions
should be caused by a combination of heating (heating season is
normally from 15 November to 15 March), which releases
anthropogenic pollution such as SO2, NOx, and PM, and
frequent dust events from both the long-range transport and
local fugitive dusts, noting that Xi’an is located on the Loess
Plateau.19,20
3.3 Ion balance and neutralization factors
The reasonable agreement between total cations and anions
suggests that the five cations and four anions analyzed in this
study were the major ions in the precipitation (Fig. 3). It can be
seen that most of the samples in the spring had a good anion–
cation balance (close to the 1 : 1 line), the samples in the summer
showed a scatter distribution (on both sides of the 1 : 1 line), and
a large portion of the samples in autumn had excess anions
(above the 1 : 1 line). The anion–cation balance shown in Fig. 3 is
in good agreement with the precipitation pH shown in Fig. 2. For
example, the majority of the spring samples had a pH value of
6.0–7.5, a small portion of the summer samples had a pH of <5.6
and a larger portion of the summer samples had a pH > 6.5, and
about 30% of the samples in the spring had a pH smaller than 5.
The deficiency in anions in some of the precipitation samples
should be attributed to other anions, such as HCO3�, CO3
2�,CH3COO�, HCOO�, C2O4
2�, and PO43�, which were not
investigated in this study.
The contribution of NO3� to the acidification was estimated to
be 19% (from the ratio NO3�/(NSS SO4
2� + NO3�) in their
equivalent concentrations),27 and the rest was from SO42�. The
lues
pHF� Cl� NO3� SO4
2� NO2�
11.0 27.0 93.4 420.5 0.0 5.936.9 39.2 67.5 303.8 0.1 5.859.3 26.9 103.0 380.5 0.6 4.769.2 32.3 87.9 374.3 0.2 5.27
J. Environ. Monit., 2012, 14, 3000–3008 | 3003
contribution of SO42� to the precipitation acidification was much
higher than the global average (60–70%).40,41 This is mainly
because China consumes 25% of the world’s total coal
consumption, and coal produces 70% of its national energy
budget.42
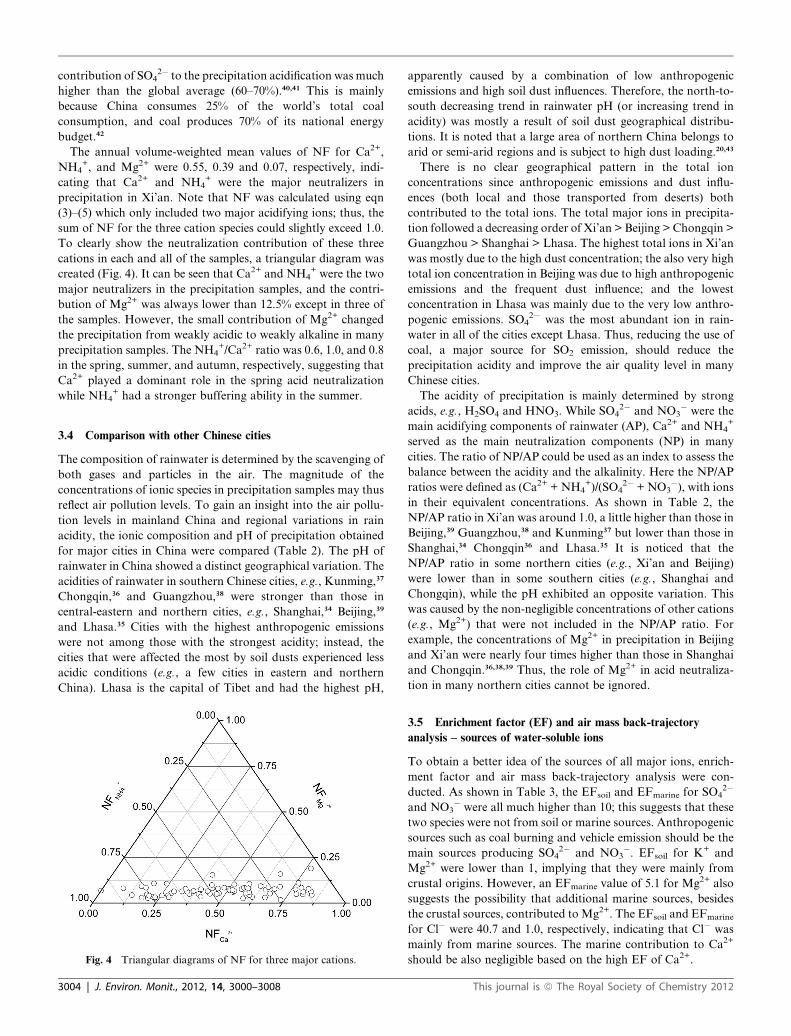
The annual volume-weighted mean values of NF for Ca2+,
NH4+, and Mg2+ were 0.55, 0.39 and 0.07, respectively, indi-
cating that Ca2+ and NH4+ were the major neutralizers in
precipitation in Xi’an. Note that NF was calculated using eqn
(3)–(5) which only included two major acidifying ions; thus, the
sum of NF for the three cation species could slightly exceed 1.0.
To clearly show the neutralization contribution of these three
cations in each and all of the samples, a triangular diagram was
created (Fig. 4). It can be seen that Ca2+ and NH4+ were the two
major neutralizers in the precipitation samples, and the contri-
bution of Mg2+ was always lower than 12.5% except in three of
the samples. However, the small contribution of Mg2+ changed
the precipitation from weakly acidic to weakly alkaline in many
precipitation samples. The NH4+/Ca2+ ratio was 0.6, 1.0, and 0.8
in the spring, summer, and autumn, respectively, suggesting that
Ca2+ played a dominant role in the spring acid neutralization
while NH4+ had a stronger buffering ability in the summer.
3.4 Comparison with other Chinese cities
The composition of rainwater is determined by the scavenging of
both gases and particles in the air. The magnitude of the
concentrations of ionic species in precipitation samples may thus
reflect air pollution levels. To gain an insight into the air pollu-
tion levels in mainland China and regional variations in rain
acidity, the ionic composition and pH of precipitation obtained
for major cities in China were compared (Table 2). The pH of
rainwater in China showed a distinct geographical variation. The
acidities of rainwater in southern Chinese cities, e.g., Kunming,37
Chongqin,36 and Guangzhou,38 were stronger than those in
central-eastern and northern cities, e.g., Shanghai,34 Beijing,39
and Lhasa.35 Cities with the highest anthropogenic emissions
were not among those with the strongest acidity; instead, the
cities that were affected the most by soil dusts experienced less
acidic conditions (e.g., a few cities in eastern and northern
China). Lhasa is the capital of Tibet and had the highest pH,
Fig. 4 Triangular diagrams of NF for three major cations.
3004 | J. Environ. Monit., 2012, 14, 3000–3008
apparently caused by a combination of low anthropogenic
emissions and high soil dust influences. Therefore, the north-to-
south decreasing trend in rainwater pH (or increasing trend in
acidity) was mostly a result of soil dust geographical distribu-
tions. It is noted that a large area of northern China belongs to
arid or semi-arid regions and is subject to high dust loading.20,43
There is no clear geographical pattern in the total ion
concentrations since anthropogenic emissions and dust influ-
ences (both local and those transported from deserts) both
contributed to the total ions. The total major ions in precipita-
tion followed a decreasing order of Xi’an > Beijing > Chongqin >
Guangzhou > Shanghai > Lhasa. The highest total ions in Xi’an
was mostly due to the high dust concentration; the also very high
total ion concentration in Beijing was due to high anthropogenic
emissions and the frequent dust influence; and the lowest
concentration in Lhasa was mainly due to the very low anthro-
pogenic emissions. SO42� was the most abundant ion in rain-
water in all of the cities except Lhasa. Thus, reducing the use of
coal, a major source for SO2 emission, should reduce the
precipitation acidity and improve the air quality level in many
Chinese cities.
The acidity of precipitation is mainly determined by strong
acids, e.g., H2SO4 and HNO3. While SO42� and NO3
� were the
main acidifying components of rainwater (AP), Ca2+ and NH4+
served as the main neutralization components (NP) in many
cities. The ratio of NP/AP could be used as an index to assess the
balance between the acidity and the alkalinity. Here the NP/AP
ratios were defined as (Ca2+ + NH4+)/(SO4
2� + NO3�), with ions
in their equivalent concentrations. As shown in Table 2, the
NP/AP ratio in Xi’an was around 1.0, a little higher than those in
Beijing,39 Guangzhou,38 and Kunming37 but lower than those in
Shanghai,34 Chongqin36 and Lhasa.35 It is noticed that the
NP/AP ratio in some northern cities (e.g., Xi’an and Beijing)
were lower than in some southern cities (e.g., Shanghai and
Chongqin), while the pH exhibited an opposite variation. This
was caused by the non-negligible concentrations of other cations
(e.g., Mg2+) that were not included in the NP/AP ratio. For
example, the concentrations of Mg2+ in precipitation in Beijing
and Xi’an were nearly four times higher than those in Shanghai
and Chongqin.36,38,39 Thus, the role of Mg2+ in acid neutraliza-
tion in many northern cities cannot be ignored.
3.5 Enrichment factor (EF) and air mass back-trajectory
analysis – sources of water-soluble ions
To obtain a better idea of the sources of all major ions, enrich-
ment factor and air mass back-trajectory analysis were con-
ducted. As shown in Table 3, the EFsoil and EFmarine for SO42�
and NO3� were all much higher than 10; this suggests that these
two species were not from soil or marine sources. Anthropogenic
sources such as coal burning and vehicle emission should be the
main sources producing SO42� and NO3
�. EFsoil for K+ and
Mg2+ were lower than 1, implying that they were mainly from
crustal origins. However, an EFmarine value of 5.1 for Mg2+ also
suggests the possibility that additional marine sources, besides
the crustal sources, contributed to Mg2+. The EFsoil and EFmarine
for Cl� were 40.7 and 1.0, respectively, indicating that Cl� was
mainly from marine sources. The marine contribution to Ca2+
should be also negligible based on the high EF of Ca2+.
This journal is ª The Royal Society of Chemistry 2012
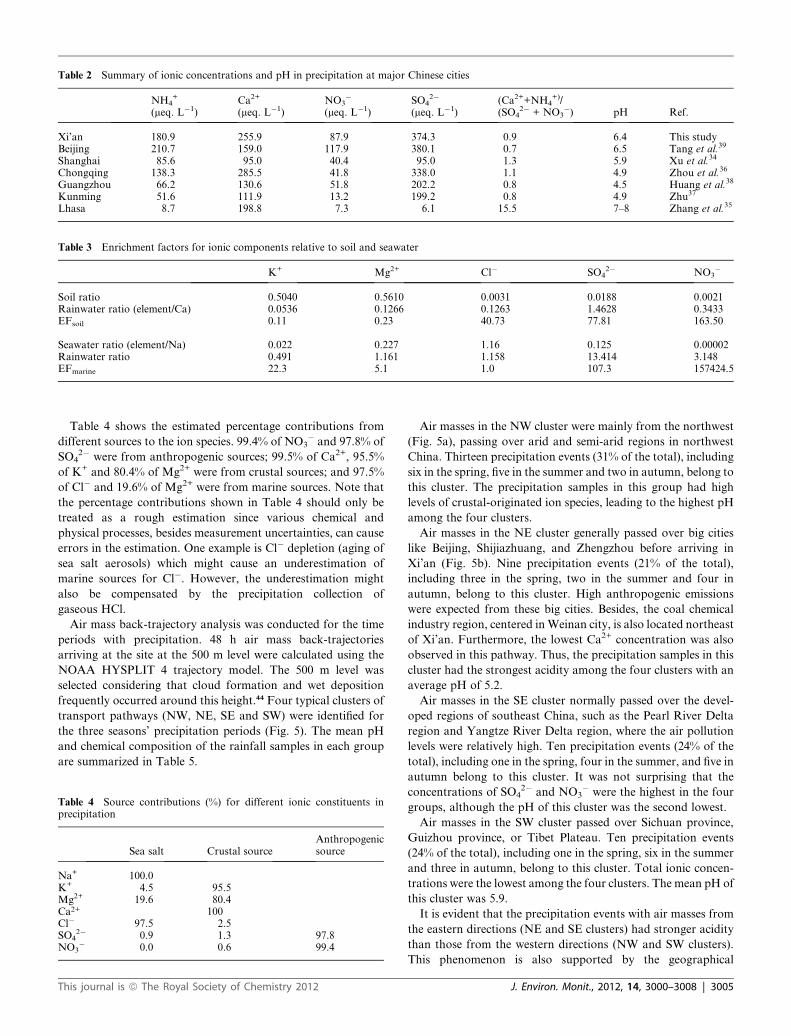
Table 2 Summary of ionic concentrations and pH in precipitation at major Chinese cities
NH4+
(meq. L�1)Ca2+
(meq. L�1)NO3
�
(meq. L�1)SO4
2�
(meq. L�1)(Ca2++NH4
+)/(SO4
2� + NO3�) pH Ref.
Xi’an 180.9 255.9 87.9 374.3 0.9 6.4 This studyBeijing 210.7 159.0 117.9 380.1 0.7 6.5 Tang et al.39
Shanghai 85.6 95.0 40.4 95.0 1.3 5.9 Xu et al.34
Chongqing 138.3 285.5 41.8 338.0 1.1 4.9 Zhou et al.36
Guangzhou 66.2 130.6 51.8 202.2 0.8 4.5 Huang et al.38
Kunming 51.6 111.9 13.2 199.2 0.8 4.9 Zhu37
Lhasa 8.7 198.8 7.3 6.1 15.5 7–8 Zhang et al.35
Table 3 Enrichment factors for ionic components relative to soil and seawater
K+ Mg2+ Cl� SO42� NO3
�
Soil ratio 0.5040 0.5610 0.0031 0.0188 0.0021Rainwater ratio (element/Ca) 0.0536 0.1266 0.1263 1.4628 0.3433EFsoil 0.11 0.23 40.73 77.81 163.50
Seawater ratio (element/Na) 0.022 0.227 1.16 0.125 0.00002Rainwater ratio 0.491 1.161 1.158 13.414 3.148EFmarine 22.3 5.1 1.0 107.3 157424.5
Table 4 shows the estimated percentage contributions from
different sources to the ion species. 99.4% of NO3� and 97.8% of
SO42� were from anthropogenic sources; 99.5% of Ca2+, 95.5%
of K+ and 80.4% of Mg2+ were from crustal sources; and 97.5%
of Cl� and 19.6% of Mg2+ were from marine sources. Note that
the percentage contributions shown in Table 4 should only be
treated as a rough estimation since various chemical and
physical processes, besides measurement uncertainties, can cause
errors in the estimation. One example is Cl� depletion (aging of
sea salt aerosols) which might cause an underestimation of
marine sources for Cl�. However, the underestimation might
also be compensated by the precipitation collection of
gaseous HCl.
Air mass back-trajectory analysis was conducted for the time
periods with precipitation. 48 h air mass back-trajectories
arriving at the site at the 500 m level were calculated using the
NOAA HYSPLIT 4 trajectory model. The 500 m level was
selected considering that cloud formation and wet deposition
frequently occurred around this height.44 Four typical clusters of
transport pathways (NW, NE, SE and SW) were identified for
the three seasons’ precipitation periods (Fig. 5). The mean pH
and chemical composition of the rainfall samples in each group
are summarized in Table 5.
Table 4 Source contributions (%) for different ionic constituents inprecipitation
Sea salt Crustal sourceAnthropogenicsource
Na+ 100.0K+ 4.5 95.5Mg2+ 19.6 80.4Ca2+ 100Cl� 97.5 2.5SO4
2� 0.9 1.3 97.8NO3
� 0.0 0.6 99.4
This journal is ª The Royal Society of Chemistry 2012
Air masses in the NW cluster were mainly from the northwest
(Fig. 5a), passing over arid and semi-arid regions in northwest
China. Thirteen precipitation events (31% of the total), including
six in the spring, five in the summer and two in autumn, belong to
this cluster. The precipitation samples in this group had high
levels of crustal-originated ion species, leading to the highest pH
among the four clusters.
Air masses in the NE cluster generally passed over big cities
like Beijing, Shijiazhuang, and Zhengzhou before arriving in
Xi’an (Fig. 5b). Nine precipitation events (21% of the total),
including three in the spring, two in the summer and four in
autumn, belong to this cluster. High anthropogenic emissions
were expected from these big cities. Besides, the coal chemical
industry region, centered inWeinan city, is also located northeast
of Xi’an. Furthermore, the lowest Ca2+ concentration was also
observed in this pathway. Thus, the precipitation samples in this
cluster had the strongest acidity among the four clusters with an
average pH of 5.2.
Air masses in the SE cluster normally passed over the devel-
oped regions of southeast China, such as the Pearl River Delta
region and Yangtze River Delta region, where the air pollution
levels were relatively high. Ten precipitation events (24% of the
total), including one in the spring, four in the summer, and five in
autumn belong to this cluster. It was not surprising that the
concentrations of SO42� and NO3
� were the highest in the four
groups, although the pH of this cluster was the second lowest.
Air masses in the SW cluster passed over Sichuan province,
Guizhou province, or Tibet Plateau. Ten precipitation events
(24% of the total), including one in the spring, six in the summer
and three in autumn, belong to this cluster. Total ionic concen-
trations were the lowest among the four clusters. The mean pH of
this cluster was 5.9.
It is evident that the precipitation events with air masses from
the eastern directions (NE and SE clusters) had stronger acidity
than those from the western directions (NW and SW clusters).
This phenomenon is also supported by the geographical
J. Environ. Monit., 2012, 14, 3000–3008 | 3005
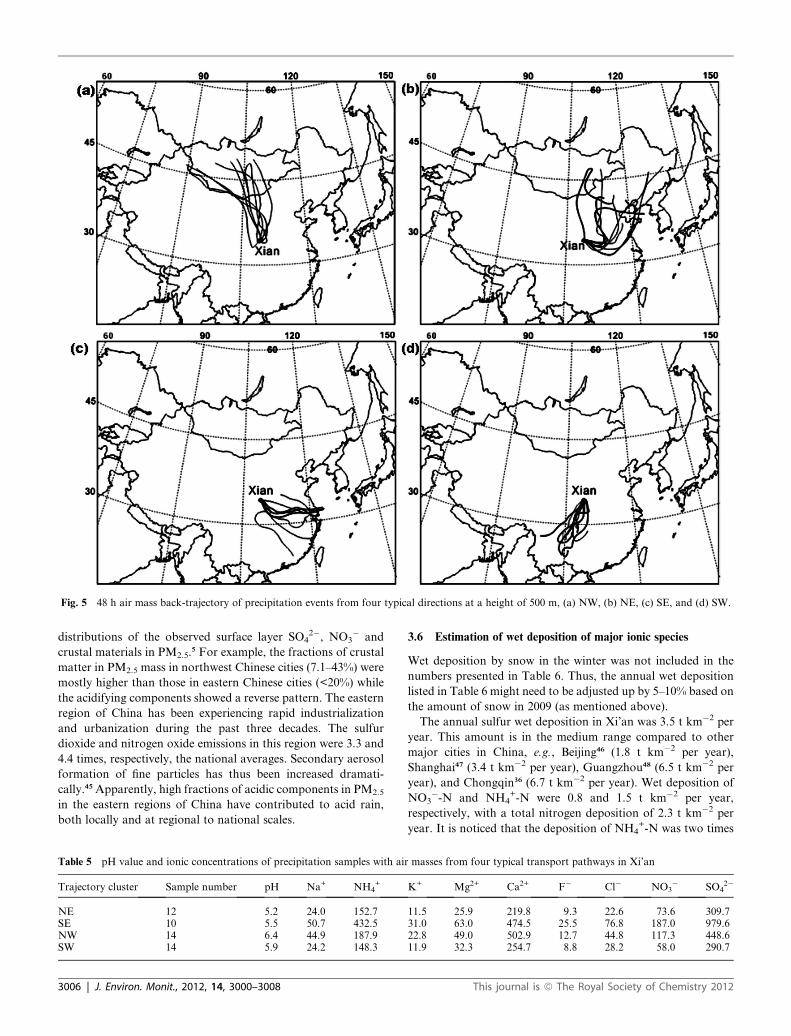
Fig. 5 48 h air mass back-trajectory of precipitation events from four typical directions at a height of 500 m, (a) NW, (b) NE, (c) SE, and (d) SW.
distributions of the observed surface layer SO42�, NO3
� and
crustal materials in PM2.5.5 For example, the fractions of crustal
matter in PM2.5 mass in northwest Chinese cities (7.1–43%) were
mostly higher than those in eastern Chinese cities (<20%) while
the acidifying components showed a reverse pattern. The eastern
region of China has been experiencing rapid industrialization
and urbanization during the past three decades. The sulfur
dioxide and nitrogen oxide emissions in this region were 3.3 and
4.4 times, respectively, the national averages. Secondary aerosol
formation of fine particles has thus been increased dramati-
cally.45 Apparently, high fractions of acidic components in PM2.5
in the eastern regions of China have contributed to acid rain,
both locally and at regional to national scales.
Table 5 pH value and ionic concentrations of precipitation samples with air
Trajectory cluster Sample number pH Na+ NH4+
NE 12 5.2 24.0 152.7SE 10 5.5 50.7 432.5NW 14 6.4 44.9 187.9SW 14 5.9 24.2 148.3
3006 | J. Environ. Monit., 2012, 14, 3000–3008
3.6 Estimation of wet deposition of major ionic species
Wet deposition by snow in the winter was not included in the
numbers presented in Table 6. Thus, the annual wet deposition
listed in Table 6 might need to be adjusted up by 5–10% based on
the amount of snow in 2009 (as mentioned above).
The annual sulfur wet deposition in Xi’an was 3.5 t km�2 per
year. This amount is in the medium range compared to other
major cities in China, e.g., Beijing46 (1.8 t km�2 per year),
Shanghai47 (3.4 t km�2 per year), Guangzhou48 (6.5 t km�2 per
year), and Chongqin36 (6.7 t km�2 per year). Wet deposition of
NO3�-N and NH4
+-N were 0.8 and 1.5 t km�2 per year,
respectively, with a total nitrogen deposition of 2.3 t km�2 per
year. It is noticed that the deposition of NH4+-N was two times
masses from four typical transport pathways in Xi’an
K+ Mg2+ Ca2+ F� Cl� NO3� SO4
2�
11.5 25.9 219.8 9.3 22.6 73.6 309.731.0 63.0 474.5 25.5 76.8 187.0 979.622.8 49.0 502.9 12.7 44.8 117.3 448.611.9 32.3 254.7 8.8 28.2 58.0 290.7
This journal is ª The Royal Society of Chemistry 2012
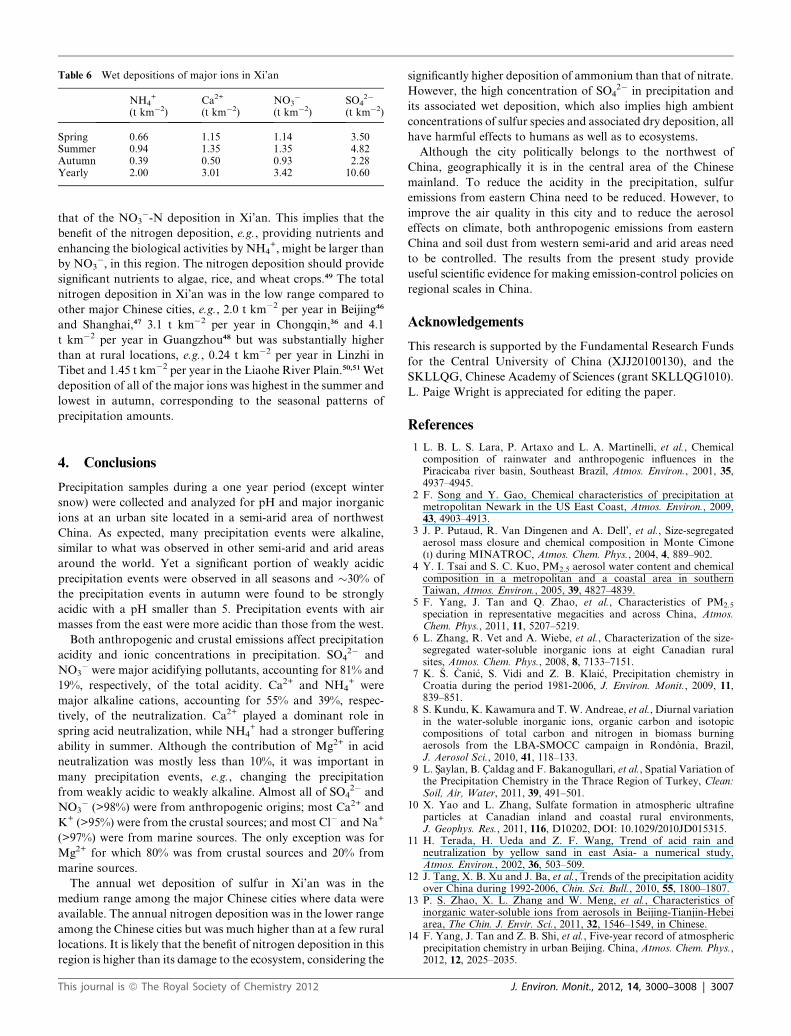
Table 6 Wet depositions of major ions in Xi’an
NH4+
(t km�2)Ca2+
(t km�2)NO3
�
(t km�2)SO4
2�
(t km�2)
Spring 0.66 1.15 1.14 3.50Summer 0.94 1.35 1.35 4.82Autumn 0.39 0.50 0.93 2.28Yearly 2.00 3.01 3.42 10.60
that of the NO3�-N deposition in Xi’an. This implies that the
benefit of the nitrogen deposition, e.g., providing nutrients and
enhancing the biological activities by NH4+, might be larger than
by NO3�, in this region. The nitrogen deposition should provide
significant nutrients to algae, rice, and wheat crops.49 The total
nitrogen deposition in Xi’an was in the low range compared to
other major Chinese cities, e.g., 2.0 t km�2 per year in Beijing46
and Shanghai,47 3.1 t km�2 per year in Chongqin,36 and 4.1
t km�2 per year in Guangzhou48 but was substantially higher
than at rural locations, e.g., 0.24 t km�2 per year in Linzhi in
Tibet and 1.45 t km�2 per year in the Liaohe River Plain.50,51 Wet
deposition of all of the major ions was highest in the summer and
lowest in autumn, corresponding to the seasonal patterns of
precipitation amounts.
4. Conclusions
Precipitation samples during a one year period (except winter
snow) were collected and analyzed for pH and major inorganic
ions at an urban site located in a semi-arid area of northwest
China. As expected, many precipitation events were alkaline,
similar to what was observed in other semi-arid and arid areas
around the world. Yet a significant portion of weakly acidic
precipitation events were observed in all seasons and �30% of
the precipitation events in autumn were found to be strongly
acidic with a pH smaller than 5. Precipitation events with air
masses from the east were more acidic than those from the west.
Both anthropogenic and crustal emissions affect precipitation
acidity and ionic concentrations in precipitation. SO42� and
NO3� were major acidifying pollutants, accounting for 81% and
19%, respectively, of the total acidity. Ca2+ and NH4+ were
major alkaline cations, accounting for 55% and 39%, respec-
tively, of the neutralization. Ca2+ played a dominant role in
spring acid neutralization, while NH4+ had a stronger buffering
ability in summer. Although the contribution of Mg2+ in acid
neutralization was mostly less than 10%, it was important in
many precipitation events, e.g., changing the precipitation
from weakly acidic to weakly alkaline. Almost all of SO42� and
NO3� (>98%) were from anthropogenic origins; most Ca2+ and
K+ (>95%) were from the crustal sources; and most Cl� and Na+
(>97%) were from marine sources. The only exception was for
Mg2+ for which 80% was from crustal sources and 20% from
marine sources.
The annual wet deposition of sulfur in Xi’an was in the
medium range among the major Chinese cities where data were
available. The annual nitrogen deposition was in the lower range
among the Chinese cities but was much higher than at a few rural
locations. It is likely that the benefit of nitrogen deposition in this
region is higher than its damage to the ecosystem, considering the
This journal is ª The Royal Society of Chemistry 2012
significantly higher deposition of ammonium than that of nitrate.
However, the high concentration of SO42� in precipitation and
its associated wet deposition, which also implies high ambient
concentrations of sulfur species and associated dry deposition, all
have harmful effects to humans as well as to ecosystems.
Although the city politically belongs to the northwest of
China, geographically it is in the central area of the Chinese
mainland. To reduce the acidity in the precipitation, sulfur
emissions from eastern China need to be reduced. However, to
improve the air quality in this city and to reduce the aerosol
effects on climate, both anthropogenic emissions from eastern
China and soil dust from western semi-arid and arid areas need
to be controlled. The results from the present study provide
useful scientific evidence for making emission-control policies on
regional scales in China.
Acknowledgements
This research is supported by the Fundamental Research Funds
for the Central University of China (XJJ20100130), and the
SKLLQG, Chinese Academy of Sciences (grant SKLLQG1010).
L. Paige Wright is appreciated for editing the paper.
References
1 L. B. L. S. Lara, P. Artaxo and L. A. Martinelli, et al., Chemicalcomposition of rainwater and anthropogenic influences in thePiracicaba river basin, Southeast Brazil, Atmos. Environ., 2001, 35,4937–4945.
2 F. Song and Y. Gao, Chemical characteristics of precipitation atmetropolitan Newark in the US East Coast, Atmos. Environ., 2009,43, 4903–4913.
3 J. P. Putaud, R. Van Dingenen and A. Dell’, et al., Size-segregatedaerosol mass closure and chemical composition in Monte Cimone(I) during MINATROC, Atmos. Chem. Phys., 2004, 4, 889–902.
4 Y. I. Tsai and S. C. Kuo, PM2.5 aerosol water content and chemicalcomposition in a metropolitan and a coastal area in southernTaiwan, Atmos. Environ., 2005, 39, 4827–4839.
5 F. Yang, J. Tan and Q. Zhao, et al., Characteristics of PM2.5
speciation in representative megacities and across China, Atmos.Chem. Phys., 2011, 11, 5207–5219.
6 L. Zhang, R. Vet and A. Wiebe, et al., Characterization of the size-segregated water-soluble inorganic ions at eight Canadian ruralsites, Atmos. Chem. Phys., 2008, 8, 7133–7151.
7 K. �S. �Cani�c, S. Vidi and Z. B. Klai�c, Precipitation chemistry inCroatia during the period 1981-2006, J. Environ. Monit., 2009, 11,839–851.
8 S. Kundu, K. Kawamura and T. W. Andreae, et al., Diurnal variationin the water-soluble inorganic ions, organic carbon and isotopiccompositions of total carbon and nitrogen in biomass burningaerosols from the LBA-SMOCC campaign in Rondonia, Brazil,J. Aerosol Sci., 2010, 41, 118–133.
9 L. Sxaylan, B. Caldag and F. Bakanogullari, et al., Spatial Variation ofthe Precipitation Chemistry in the Thrace Region of Turkey, Clean:Soil, Air, Water, 2011, 39, 491–501.
10 X. Yao and L. Zhang, Sulfate formation in atmospheric ultrafineparticles at Canadian inland and coastal rural environments,J. Geophys. Res., 2011, 116, D10202, DOI: 10.1029/2010JD015315.
11 H. Terada, H. Ueda and Z. F. Wang, Trend of acid rain andneutralization by yellow sand in east Asia- a numerical study,Atmos. Environ., 2002, 36, 503–509.
12 J. Tang, X. B. Xu and J. Ba, et al., Trends of the precipitation acidityover China during 1992-2006, Chin. Sci. Bull., 2010, 55, 1800–1807.
13 P. S. Zhao, X. L. Zhang and W. Meng, et al., Characteristics ofinorganic water-soluble ions from aerosols in Beijing-Tianjin-Hebeiarea, The Chin. J. Envir. Sci., 2011, 32, 1546–1549, in Chinese.
14 F. Yang, J. Tan and Z. B. Shi, et al., Five-year record of atmosphericprecipitation chemistry in urban Beijing. China, Atmos. Chem. Phys.,2012, 12, 2025–2035.
J. Environ. Monit., 2012, 14, 3000–3008 | 3007
15 Y. Li, J. Tang and X. Yu, et al., Characteristics of precipitationchemistry at Lushan Mountain, East China: 1992-2009, Environ.Sci. Pollut. Res., 2012, 19, 2329–2343.
16 Y. Liu,W. Zhang andW. Xu, et al., The analysis of water-soluble ionsand inorganic elements in atmospheric particulates, Chancheng,Foshan, China, Adv. Mater. Res., 2011, 281, 215–222.
17 J. Zhao, F. Zhang and Y. Xu, et al., Characterization of water-solubleinorganic ions in size-segregated aerosols in coastal city, Xiamen,Atmos. Res., 2011, 99, 546–562.
18 J. J. Cao, F. Wu and J. C. Chow, et al., Characterization and sourceapportionment of atmospheric organic and elemental carbon duringfall and winter of 2003 in Xi’an, China, Atmos. Chem. Phys., 2005,5, 3561–3593.
19 Z. X. Shen, R. Arimoto and J. J. Cao, et al., Seasonal variations andevidence for the effectiveness of pollution controls on water-solubleinorganic species in total Suspended particulates and fine particulatematter from Xi’an, China, J. Air Waste Manage. Assoc., 2008, 58,1560–1570.
20 Z. X. Shen, J. J. Cao, R. Arimoto and S. Tanaka, et al., Ioniccomposition of TSP and PM2.5 during dust storms and air pollutionepisodes at Xi’an, China, Atmos. Environ., 2009, 43, 2911–2918.
21 Z. X. Shen, J. J. Cao and R. Arimoto, et al., Chemical characteristicsof fine particles (PM1) fromXi’an, China,Aerosol Sci. Technol., 2010,44, 461–472.
22 Z. X. Shen, J. J. Cao and S. X. Liu, et al., Chemical composition ofPM10 and PM2.5 collected at ground level and 100 meters during astrong winter-time pollution episode in Xi’an, China, J. Air WasteManage. Assoc., 2011, 61, 1150–1159.
23 U. C. Kulshrestha, A. K. Sarkar and S. S. Srivastava, et al., Wet-onlyand bulk deposition studies at New Delhi (India), Water, Air, SoilPollut., 1995, 85, 2137–2142.
24 A. Chabas and R. A. Lefevre, Chemistry and microscopy ofatmospheric particulates at Delos (CycladesdGreece), Atmos.Environ., 2000, 34, 225–238.
25 C. Okay, B. O. Akkoyunlu and M. Tayanc, Composition of wetdeposition in Kaynarca, Turkey, Environ. Pollut., 2002, 118, 401–410.
26 Z. X. Shen, J. J. Cao and R. Arimoto, et al., Chemical compositionand source characterization of spring aerosol over Horqin sandland in northeastern China, J. Geophys. Res, 2007, 112, D14315,DOI: 10.1029/2006JD007991.
27 P. D. Safai, P. S. P. Rao and G. A. Momin, et al., Chemicalcomposition of precipitation during 1984–2002 at Pune, India,Atmos. Environ., 2004, 38, 1705–1714.
28 W. C. Keene, A. P. Pszenny and J. N. Galloway, Sea salt correctionand Interpretation of constituent ratios in marine precipitation, J.Geophys. Res., 1986, 91, 6647–6658.
29 R. Kumar, A. Rani and S. P. Singh, et al., A long term study onchemical composition of rainwater at Dayalbagh, a suburban site ofsemiarid region, J. Atmos. Chem., 2002, 41, 265–279.
30 O. A. Al-Khashman, Ionic composition of wet precipitation in thePetra Region, Jordan, Atmos. Res., 2005, 78, 1–12.
31 P. C. Mouli, S. V. Mohan and S. J. Reddy, Rainwater chemistry at aregional representative urban site: influence of terrestrial source onionic composition, Atmos. Environ., 2005, 39, 999–1008.
32 Z. F. Xu, Y. S. Li and Y. Tang, et al., Chemical and strontium isotopecharacterization of rainwater at an urban site in Loess Plateau,Northwest China, Atmos. Res., 2009, 94, 481–490.
3008 | J. Environ. Monit., 2012, 14, 3000–3008
33 J. H. Seinfeld and S. N. Pandis, Atmospheric Chemistry and Physics:From Air Pollution to Climate Change, Wiley, New York, America,1998.
34 Q. Xu, W. Zhang and H. Peng, et al., Study on the acid rain inShanghai between 1998 and 1999, Environ. Monit. China, 2000, 16,5–7, in Chinese.
35 D. D. Zhang, M. R. Peart and C. Y. Jim, Alkaline rains on theTibetan Plateau and their implication for the original pH of naturalrainfall, J. Geophys. Res., 2002, 107(14), 1–6.
36 Z. Y. Zhou, D. R. Chen and J. Ying, et al., The chemical compositionof precipitation analysis in Chongqing city, Chongqing EnvironmentalScience, 2003, 25(11), 112–114, in Chinese.
37 E. Z. Zhu, Analysis on acid rain situation in Kunming Panlongdistrict,Yunnan Environmental Science, 2003, 22, 172–174, in Chinese.
38 D. Y. Huang, G. Xu and P. A. Peng, et al., Chemical composition andseasonal variation of acid deposition in Guangzhou, South China:comparison with precipitation in other major Chinese cities,Environ. Pollut., 2009, 157, 35–41.
39 A. Tang, G. Zhuang and Y. Wang, et al., The chemistry ofprecipitation and its relation to aerosol in Beijing, Atmos. Environ.,2005, 39, 3397–3406.
40 I. F. Al-Momani, O. Y. Ataman and M. A. Anwari, et al., Chemicalcomposition of precipitation near an industrial area at Izmir, Turkey,Atmos. Environ., 1995, 29, 1131–1143.
41 D. Migliavacca, E. C. Teixeira and F. Wiegand, et al., Atmosphericprecipitation and chemical composition of an urban site, GuaibaHydrographic basin, Brazil, Atmos. Environ., 2005, 39, 1829–1844.
42 J. G. Liu and J. Diamond, China’s environment in a globalizingworld, Nature, 2005, 435, 1179–1186.
43 J. J. Cao, S. C. Lee and X. Y. Zhang, et al., Characterization ofairborne carbonate over a site near Asian dust source regionsduring spring 2002 and its climatic and environmental significance,J. Geophys. Res., 2005b, 110, D03203, DOI: 10.1029/2004JD005244.
44 J. T. Alker, V. P. Aneja andD. A. Dickey, Atmospheric transport andwet deposition of ammonium in North Carolina, Atmos. Environ.,2000, 20, 3407–3418.
45 M. Fang, C. K. Chan and X. H. Yao, Managing air quality in arapidly developing nation: China, Atmos. Environ., 2009, 43, 79–86.
46 F. M. Yang, K. B. He and Y. Lei, et al., Chemical characters ofatmospheric precipitation in Beijing in years of 2001–2003, Chin. J.Environ. Sci., 2004, 24(5), 538–541, in Chinese.
47 K. Huang, G. S. Zhuang and C. Xu, et al., The chemistry of the severeacidic precipitation in Shanghai, China, Atmos. Res., 2008, 89, 149–160.
48 D. Y. Huang, Y. G. Xu and B. Zhou, et al., Wet deposition ofnitrogen and sulfur in Guangzhou, a subtropical area in SouthChina, Environ. Monit. Assess., 2010, 171, 429–439.
49 Y. X. Xie, Z. Q. Xiong and G. X. Xing, et al., Source of nitrogen inwet deposition to a rice agroecosystem at Tai lake region, Atmos.Environ., 2008, 42, 5182–5192.
50 J. Y. Jia, Y. Zhang and X. B. Cai, et al., A dynamic changes of wetdeposition of nitrogen in southeast Tibet: taking Linzhi experimentstation as an example, Acta Ecol. Sin., 2009, 29, 1907–1913, inChinese.
51 W. T. Yu, C. M. Jiang and Q. Ma, et al., Observation of the nitrogendeposition in the lower Liaohe River Plain, Northeast China andassessing its ecological risk, Atmos. Res., 2011, 101, 460–468.
This journal is ª The Royal Society of Chemistry 2012
Copyright © 2022 FDOKUMEN