New Materials for the Coating of Outdoor Bronze Erik Andreas ...
Upload
independentCategory
view
1download
0
Chemical and Physical Characteristics of Pulverized Tejon Lookout
Granite Adjacent to the San Andreas and Garlock Faults: Implications for
Earthquake Physics
THOMAS ROCKWELL,1 MATTHEW SISK,1 GARY GIRTY,1 ORY DOR,2,3 NETA WECHSLER,2 and
YEHUDA BEN-ZION2
Abstract—We present new detailed analyses of samples of pulverized Tejon Lookout granite collected from
sections adjacent to the San Andreas and Garlock faults in southern California. The Tejon Lookout granite is
pulverized in all exposures within about 100 m from both faults. Chemical analyses indicate no or little
weathering in the collected samples, although XRD analysis shows the presence of smectite, illite, and minor
kaolinite in the clay-size fraction. Weathering products may dominate in the less than 1 micron fraction. The
average grain size in all samples of pulverized Tejon Lookout granite ranges between 26 and 208 microns (silt to
fine sand), with the particle size distribution in part a function of proximity to the primary slip zone. The San
Andreas fault samples that we studied are generally finer grained than those collected from adjacent to the
Garlock fault. The particle size distribution for each studied sample from both faults follows a pseudo-power law
with a continuously changing exponent, which suggests that pulverization is not simply a consequence of direct
shear. The average particle size that we determined for our samples is considerably coarser than reported in
previous investigations, which we attribute to possible measurement errors in the prior work. Our data and
observations suggest that dynamic fracturing in the wall rock of the San Andreas and Garlock faults only
accounts for about 1% or less of the earthquake energy budget.
Key words: Pulverized rocks, particle size distribution, rock weathering, fault-zone structure, earthquake
physics.
1. Introduction
The structural and material properties of damaged fault zone rocks can reveal
important information pertaining to various aspects of earthquake mechanics, including
the amount of fracture surface energy contained in the rocks, the type (shear vs. tensile)
and amplitude of the likely generating stress field, and the possible relationship to the
statistically-preferred propagation direction of earthquake ruptures. Geological mapping
indicates that fault zones contain a hierarchical damage structure, with a narrow core of
1 Department of Geological Sciences, San Diego State University, San Diego, CA 92182, U.S.A.
E-mail: [email protected] Department of Earth Sciences, University of Southern California, Los Angeles, CA 90089, U.S.A.3 Department of Geological Sciences, Brown University, Providence, RI 02912, U.S.A.
Pure appl. geophys. 166 (2009) 1725–1746 � Birkhauser Verlag, Basel, 2009
0033–4553/09/101725–22
DOI 10.1007/s00024-009-0514-1Pure and Applied Geophysics
slip localization that accommodates most of the motion across the fault, and damaged
rocks with various crack densities in the adjacent regions (e.g., BEN-ZION and SAMMIS,
2003; CHESTER et al., 2005; ROCKWELL and BEN-ZION, 2007).
Recent studies have shown that large continental strike-slip fault structures have belts
of pulverized rocks that are about *100–300 m wide and exist primarily on one side of
the fault. This was documented along the Mojave section of the San Andreas fault
(WILSON et al., 2005; DOR et al., 2006a), portions of the Garlock (SISK et al., 2005) and
San Jacinto faults (STILLINGS, 2007) in California, and in a section of the Arima-Takatsuki
fault in Japan (MITCHELL et al., 2008). Rock pulverization is assumed to be the result of a
dynamic reduction of normal stress during earthquake ruptures (e.g., BRUNE et al., 1993;
BEN-ZION, 2001), and its asymmetric distribution along a fault may indicate a preferred
direction of rupture propagation (BEN-ZION and SHI, 2005; DOR et al., 2006b, 2008).
Studies of the Particle Size Distribution (PSD) of fault zone rocks have tended to fit
the results to power laws. SAMMIS et al. (1987) and later studies concluded that the PSD of
damaged rocks is associated with fractal statistics, having exponent values of non-
cumulative distribution in planar sections of 1.6. CHESTER et al. (2005) analyzed the PSD
of grains in the slip localization zone of the Punchbowl fault in California and obtained
an exponent of non-cumulative statistics in planar sections of 2.0. HEILBRONNER and
KEULEN (2006) and KEULEN et al. (2007) found that the PSD of naturally and
experimentally deformed fault rocks requires two slopes, with the break in slope marking
the transition between shearing and fracturing. SAMMIS and BEN-ZION (2008) provided a
review of various mechanisms that can lead to grain size reduction.
It is generally accepted (e.g., MCGARR, 1999; ABERCROMBIE et al., 2006; SHI et al.,
2008) that over 90% of the change of the elastic strain energy during earthquake ruptures
is converted to heat associated with dissipative motions. Such motions occur primarily in
the slip localization region but may include sliding between grain boundaries and crack
surfaces in the entire damage structure. The portions of energy involving the radiation
and fracturing processes are on the order of a few percent each. However, WILSON et al.
(2005) argued, based on analysis of PSD from an outcrop of pulverized Tejon Lookout
granite in Tejon Pass, adjacent to the slip zone of the San Andreas fault, that the energy
dissipated in fracturing surfaces may be 50% or more of the earthquake energy budget.
The analysis of WILSON et al. (2005) of pulverized Tejon Lookout granite led them to
conclude that: (1) Pulverization is apparently the result of a mechanical process since no
significant amount of weathering product was found in the analyzed samples; and (2) the
PSD of these rocks is time dependent when measured in a laser particle analyzer. WILSON
et al. (2005) attributed this latter result to an apparent slow disaggregation of particle
aggregates in the circulating fluids. The final PSD obtained by WILSON et al. (2005) was
peaked and centered in the sub-micron scale. This result was the basis for their inference
that the fracture energy that is contained in fault zone rocks is considerably larger than prior
estimates.
In the present work we provide a detailed characterization of the chemistry and PSD
of pulverized Tejon Lookout granite along the San Andreas fault, and from Tejon Ranch
1726 T. Rockwell et al. Pure appl. geophys.,

along the Garlock fault. The former locality is the same studied by WILSON et al. (2005).
The results of our work indicate that weathering products account for some of the smaller
(<4 microns) fraction, but that overall the rocks are not significantly weathered. Our PSD
analyses, which include measurements using sieves, pipette, and laser analyzer methods,
show that the distributions of the examined samples have exponents that change with
increasing particle size (rather than being associated with a single power-law exponent),
and that the mean grain sizes of the pulverized rocks are significantly larger than were
reported by WILSON et al. (2005). The temporal evolution of PSD observed by WILSON
et al. (2005) appears to result from sedimentation of the heavier particles during the long
experiment rather than disaggregation. Our results are in agreement with many previous
studies, that only minor dissipation of energy into surface area creation occurs during
seismic ruptures.
2. Methods and Results
2.1. Sampling and Laboratory Techniques
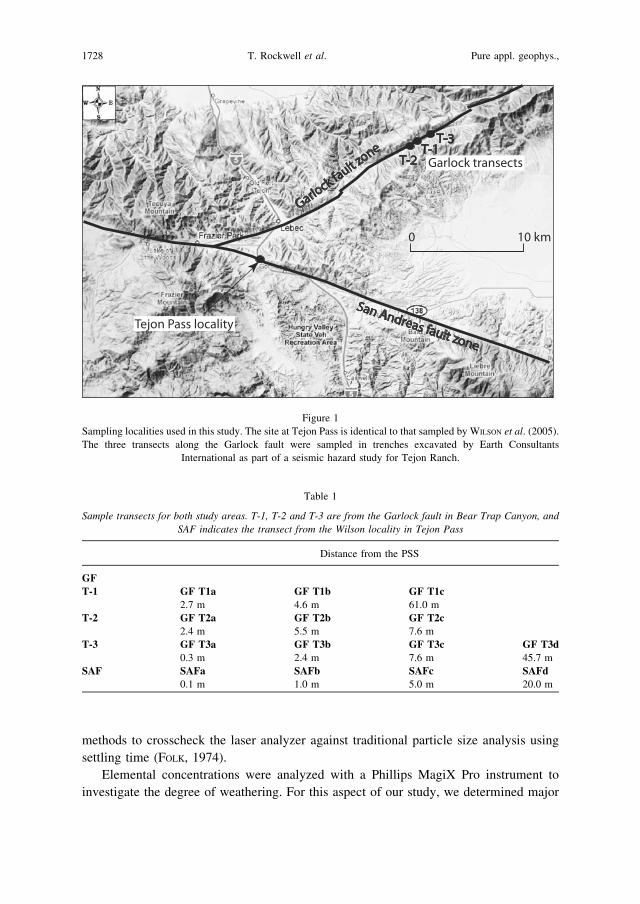
Along the Garlock fault in Bear Trap Canyon, we collected nonoriented samples from
trenches that were excavated by Earth Consultants International (ECI) as part of a
geotechnical study for Tejon Ranch (Fig. 1). In granite along the south side of the fault,
samples were collected along three fault normal traverses beginning at the principal slip
surface and then moving outward to the ends of the trenches. These three separate
transects are referred to herein as T-1, T-2, and T-3 (Table 1). North of the fault, non
pulverized foliated metamorphic rocks (Pelona Schist) were exposed. Though non
pulverized, the schists are extensively fractured at approximately the 5–10 cm scale.
Such rocks do not afford the same type of analysis reported herein as they are still
lithified and relatively undamaged.
Along the San Andreas fault, we sampled the same locality studied by WILSON et al.
(2005) at Tejon Pass: A road cut along the old highway above the I-5 freeway (Fig. 1).
Our initial study of the properties of pulverized Tejon Lookout granite in Bear Trap
Canyon along the Garlock fault began as an attempt to compare our results with the
previously published results from Tejon Pass. However, after preliminary particle
distributions were determined with a laser particle analyzer, the results were significantly
different from the previous work. Hence, we began an investigation into different
methods used to determine the PSD of pulverized rocks. We recollected four non oriented
samples of Tejon Lookout granite from the Tejon Pass locality for direct comparison with
the Bear Trap Canyon samples and the study of WILSON et al. (2005). We split the field
samples from both localities into *40 g splits using a mechanical splitter, and used
different splits for the various analyses conducted in this work.
For the study of particle size distribution, we utilized a Horiba LA 930 Laser Particle
Size Analyzer and a pipette rack (classical particle size distribution). We used both
Vol. 166, 2009 Characteristics of Pulverized Tejon Lookout Granite 1727
methods to crosscheck the laser analyzer against traditional particle size analysis using
settling time (FOLK, 1974).
Elemental concentrations were analyzed with a Phillips MagiX Pro instrument to
investigate the degree of weathering. For this aspect of our study, we determined major
Table 1
Sample transects for both study areas. T-1, T-2 and T-3 are from the Garlock fault in Bear Trap Canyon, and
SAF indicates the transect from the Wilson locality in Tejon Pass
Distance from the PSS
GF
T-1 GF T1a GF T1b GF T1c
2.7 m 4.6 m 61.0 m
T-2 GF T2a GF T2b GF T2c
2.4 m 5.5 m 7.6 m
T-3 GF T3a GF T3b GF T3c GF T3d
0.3 m 2.4 m 7.6 m 45.7 m
SAF SAFa SAFb SAFc SAFd
0.1 m 1.0 m 5.0 m 20.0 m
Figure 1
Sampling localities used in this study. The site at Tejon Pass is identical to that sampled by WILSON et al. (2005).
The three transects along the Garlock fault were sampled in trenches excavated by Earth Consultants
International as part of a seismic hazard study for Tejon Ranch.
1728 T. Rockwell et al. Pure appl. geophys.,
elemental concentrations of samples extracted from both field sites using fused discs.
Trace elements were analyzed using powdered pressed pellets. Loss on Ignition (LOI)
(representing the sum of all volatile components in each sample) was also determined for
each sample.
The mineralogy of the clay-sized sample fraction (<4 lm) was analyzed using a
Phillips Xpert Plus X-ray multipurpose diffractometer with Ka radiation of 1.5405 A, and
45 kV and 40 mA settings. We used a pipette to extract clay-sized particles, and this
mixture was then used to produce standard clay smears on glass slides. The clay smears
were first analyzed in their unheated and untreated states, and then were run glycolated
after they were heated to 350�C, and finally after being heated to 550�C.
2.2. Rock Chemistry
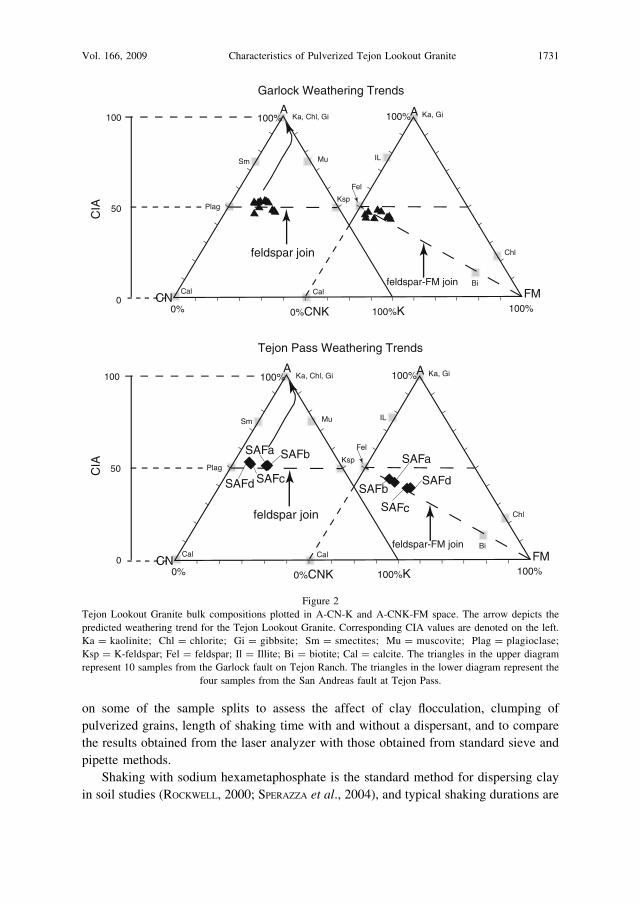
XRF Elemental Analysis. The results of XRF analysis are shown in the ternary diagrams
in Figure 2. Note that all samples in A-CN-K space plot relatively tightly about the join
between plagioclase and K-feldspar (NESBITT and YOUNG, 1982). This result implies a lack
of severe weathering in all samples collected at both the Tejon Pass and Tejon Ranch
field areas. Such an interpretation is supported by CIA values (A/[A ? C?N ? K])
ranging from 46 to 54 (Table 2), well within the CIA values published for unweathered
granite (NESBITT and YOUNG, 1982; NESBITT and MARKOVICS, 1997). This result suggests
that particle size distributions are largely not influenced by chemical weathering.
Nevertheless, some samples from both studied locations plot slightly above the ‘‘feldspar
join,’’ a relationship that may suggest incipient or minor weathering.
In A-CNK-FM space, our samples plot about the join between plagioclase and biotite
(Fig. 2). However, some samples plot slightly above this join; a result that is consistent
with minor weathering.
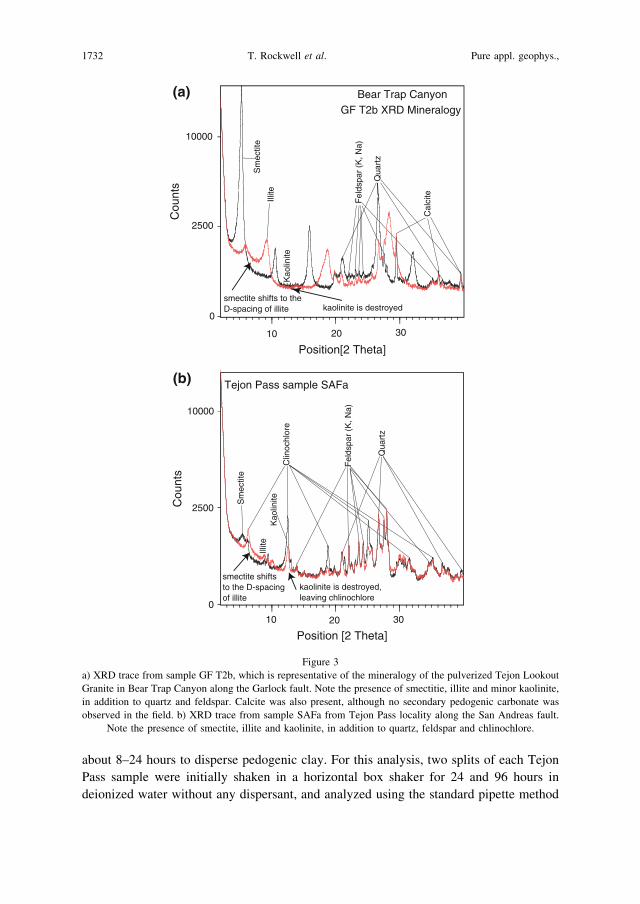
XRD Mineralogy. The diffractograms from all <4 lm samples clearly demonstrate the
presence of secondary clay minerals (Fig. 3). For example, the samples from along the
Garlock fault in Bear Trap Canyon (Fig. 3a) display peaks indicative of the presence of
smectite, illite and kaolinite in various quantities, with the later (kaolinite) being the least
prominent, as expected for this weathering environment. Samples taken from the Tejon
Pass locality along the San Andreas fault revealed a similar suite of clay minerals, along
with the presence of clinochlore (Fig 3b). The presence of these weathering products
clearly demonstrates that some alteration is present in all samples, which is not surprising,
as all samples were recovered from shallow exposures. These results are also consistent
with the XRF analyses which indicate the possible presence of minor weathering.
2.3. Particle Size Distribution
To establish the complete and most reproducible methods for determination of
particle size distribution of pulverized granitic materials, we ran a series of baseline tests
Vol. 166, 2009 Characteristics of Pulverized Tejon Lookout Granite 1729

Tab
le2
Ma
jor
elem
ent
con
ten
ts,
LO
Ia
nd
CIA
of
bu
lksa
mp
les
from
the
Tej
on
Lo
okg
rani
te
Sam
ple
sG
FT
1c
GF
T1
bG
FT
1a
GF
T2
aG
FT
2b
GF
T2
cG
FT
3a
GF
T3
bG
FT
3c
GF
T3
dS
AF
aS
AF
bS
AF
cS
AF
d
SiO
26
7.5
46
8.3
07
3.7
57
2.0
07
2.9
37
1.9
07
3.7
17
3.7
76
8.3
86
8.1
66
8.7
37
1.2
76
2.9
35
9.8
9
Al 2
O3
15
.55
15
.18
11
.66
13
.86
14
.01
11
.24
12
.79
12
.35
15
.13
15
.49
14
.32
13
.32
16
.48
15
.87
Fe 2
O3
3.2
52
.79
1.3
71
.73
1.4
70
.55
0.5
10
.51
2.8
43
.02
2.4
31
.96
4.4
24
.54
Ca
O2
.90
2.2
61
.72
1.3
31
.27
4.3
32
.00
1.4
92
.61
2.8
62
.10
2.0
34
.46
6.9
2
Mg
O0
.71
0.5
80
.27
0.3
00
.22
0.2
60
.28
0.2
00
.64
0.7
20
.98
0.6
01
.70
1.7
2
K2O
2.8
43
.38
4.6
33
.59
3.8
32
.99
3.3
35
.23
3.3
53
.00
4.0
73
.92
2.4
22
.00
Na
2O
3.6
63
.61
2.6
73
.65
3.6
52
.96
3.4
93
.08
3.4
33
.69
3.5
73
.12
3.9
13
.68
Mn
O0
.05
0.0
40
.02
0.0
30
.03
0.0
10
.02
0.0
20
.04
0.0
50
.05
0.0
30
.08
0.0
7
TiO
20
.60
0.5
20
.09
0.2
30
.20
0.0
30
.04
0.0
40
.53
0.5
70
.36
0.2
90
.86
0.9
1
P2O
50
.12
0.1
30
.01
0.0
60
.05
0.0
10
.01
0.0
10
.14
0.1
50
.09
0.0
60
.26
0.2
7
LO
I2
.19
1.5
61
.24
4.3
11
.76
1.6
61
.32
1.1
21
.25
1.7
42
.15
1.9
61
.27
2.8
1
CIA
52
.49
53
.12
48
.27
53
.25
53
.17
46
.42
49
.66
47
.93
52
.49
52
.23
50
.75
50
.73
51
.55
52
.65
1730 T. Rockwell et al. Pure appl. geophys.,
on some of the sample splits to assess the affect of clay flocculation, clumping of
pulverized grains, length of shaking time with and without a dispersant, and to compare
the results obtained from the laser analyzer with those obtained from standard sieve and
pipette methods.
Shaking with sodium hexametaphosphate is the standard method for dispersing clay
in soil studies (ROCKWELL, 2000; SPERAZZA et al., 2004), and typical shaking durations are
feldspar join
feldspar-FM join
0% 100%KCN
0%CNK 100%
FM
AA100%100%
Garlock Weathering Trends
Tejon Pass Weathering Trends
Ka, GiKa, Chl, Gi
Sm Mu IL
PlagKsp
Fel
Chl
Cal CalBi
100
50
0
CIA
feldspar join
feldspar-FM join
0% 100%KCN
0%CNK 100%FM
AA100%100% Ka, GiKa, Chl, Gi
Sm Mu IL
PlagKsp
Fel
Chl
Cal CalBi
100
50
0
CIA
SAFb
SAFa
SAFc
SAFd
SAFbSAFa
SAFcSAFd
Figure 2
Tejon Lookout Granite bulk compositions plotted in A-CN-K and A-CNK-FM space. The arrow depicts the
predicted weathering trend for the Tejon Lookout Granite. Corresponding CIA values are denoted on the left.
Ka = kaolinite; Chl = chlorite; Gi = gibbsite; Sm = smectites; Mu = muscovite; Plag = plagioclase;
Ksp = K-feldspar; Fel = feldspar; Il = Illite; Bi = biotite; Cal = calcite. The triangles in the upper diagram
represent 10 samples from the Garlock fault on Tejon Ranch. The triangles in the lower diagram represent the
four samples from the San Andreas fault at Tejon Pass.
Vol. 166, 2009 Characteristics of Pulverized Tejon Lookout Granite 1731
about 8–24 hours to disperse pedogenic clay. For this analysis, two splits of each Tejon
Pass sample were initially shaken in a horizontal box shaker for 24 and 96 hours in
deionized water without any dispersant, and analyzed using the standard pipette method
10000
2500
0
Cou
nts
Position[2 Theta]10 3020
Sm
ectit
e
Illite
Kao
linite
Qua
rtz
Fel
dspa
r (K
, Na)
Cal
cite
Bear Trap CanyonGF T2b XRD Mineralogy
Position [2 Theta]
Cou
nts
10000
2500
0
10 20 30
Clin
ochl
ore
Illite
Sm
ectit
e
Kao
linite
Fel
dspa
r (K
, Na)
Qua
rtz
Tejon Pass sample SAFa
kaolinite is destroyedsmectite shifts to the D-spacing of illite
kaolinite is destroyed,leaving chlinochlore
smectite shifts to the D-spacing of illite
(a)
(b)
Figure 3
a) XRD trace from sample GF T2b, which is representative of the mineralogy of the pulverized Tejon Lookout
Granite in Bear Trap Canyon along the Garlock fault. Note the presence of smectitie, illite and minor kaolinite,
in addition to quartz and feldspar. Calcite was also present, although no secondary pedogenic carbonate was
observed in the field. b) XRD trace from sample SAFa from Tejon Pass locality along the San Andreas fault.
Note the presence of smectite, illite and kaolinite, in addition to quartz, feldspar and chlinochlore.
1732 T. Rockwell et al. Pure appl. geophys.,
(FOLK, 1974). We repeated this experiment with an additional two splits of each of the
four samples mixed with an 0.05% solution of sodium hexa metaphosphate as a
dispersant and shaken for 24 and 96 hours. The samples shaken for 96 hours show
slightly finer particle distributions than those shaken for 24 hours, although the decrease
in grain size was not significant. In contrast, the samples run without any dispersant
displayed significantly coarser distributions indicating that a substantial proportion of the
sample remained aggregated, even after 96 hours of vigorous shaking. We conclude from
this analysis that the use of a dispersant may be critical in disaggregating near-surface
samples of pulverized granite when even small amounts of weathering product are
present, as with the samples we analyzed of the Tejon Lookout Granite.
To compare results from the Horiba laser particle size analyzer and data generated
using the standard pipette method of FOLK (1974), we used identical splits [splitting errors
are approximately ±1%, based on comparative analysis exceeding a thousand standard
runs (ROCKWELL, 2000)], and processed both sets with sodium hexametaphosphate
dispersant. The samples were wet-sieved through a 63 lm sieve to separate the sand from
the silt and clay. This is required for the standard pipette technique, as well as the Horiba,
as laser particle size analyzers are only appropriate for determination of particle size
distribution in fine sand and finer materials. Consequently, all laser particle size and
pipette data discussed below are for the silt and clay fractions only.
The coarse material (> 63 lm) was dried, sieved at standard phi fractions (-1 through
4), and weighed to determine the percent of each sand fraction. These data were then
combined with the settling tube data to determine the full particle range. Sieving also
allowed for the visual inspection of each of the coarse fractions to assess for grain
damage and to verify that the coarser grains were, in fact, not agglomerates of finely-
shattered material. In the dry-sieving process, a small amount of material passed through
the 63 lm sieve, which indicates incomplete rinsing of the sample during the initial wet-
sieving process. This ‘‘pan fraction’’ was reanalyzed and found to be entirely in the 45–63
micron size range, so the weight of the pan fraction was binned with the coarse silt in the
final particle size assessment.
For the fine fraction analyses, one split was analyzed by the standard pipette
technique (FOLK, 1974), and one was analyzed with the Horiba instrument. For the laser
analyzer, we started the analyses using the manufacturer’s default circulation speed
(preset at 2: flow rate = 3 l/min), and a refractive index = 1.163 based on the
composition of the material being measured (primarily quartz and feldspar) and the
solution in which the particles are suspended (deionized water with a 0.05%
concentration of sodium hexa-metaphosphate for clay dispersion).
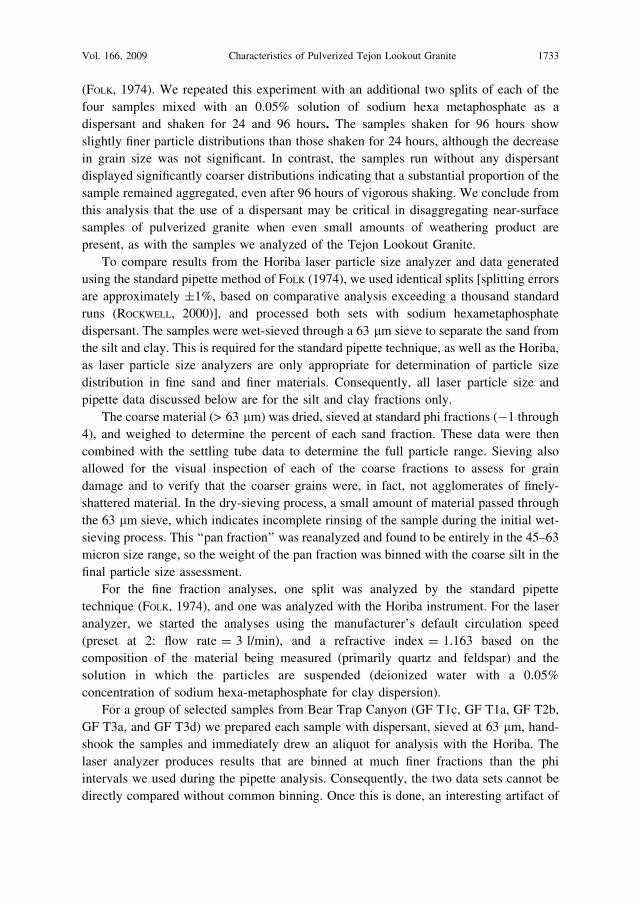
For a group of selected samples from Bear Trap Canyon (GF T1c, GF T1a, GF T2b,
GF T3a, and GF T3d) we prepared each sample with dispersant, sieved at 63 lm, hand-
shook the samples and immediately drew an aliquot for analysis with the Horiba. The
laser analyzer produces results that are binned at much finer fractions than the phi
intervals we used during the pipette analysis. Consequently, the two data sets cannot be
directly compared without common binning. Once this is done, an interesting artifact of
Vol. 166, 2009 Characteristics of Pulverized Tejon Lookout Granite 1733

the laser analyzer is the ‘‘tail’’ of coarse fraction that is distributed out from 63 lm into
the few hundred micron range (Fig. 4). As all of the samples were initially passed
through a 63 lm sieve, there can be no real data representing particles greater in size than
63 lm. Discussions with the manufacturer revealed that the Horiba LA 930 analyzer
software utilizes an algorithm that smoothes the results and displays them as a Gaussian
distribution (T. Shimamoto, pers. comm., 2006). In the case of our samples, it
redistributed data and apparently added a coarse fraction that is not present in our sample,
and we must assume that it has had a similar affect on the finest fraction.
We also tested the time dependant method for PSD of WILSON (2004) and WILSON
et al. (2005), using the Horiba LA 930 laser analyzer (they employed a Beckman Coulter
LS 230 Particle Size Analyzer) with measurements taken at 0, 24, 48, 72 and 96 hour
intervals. A similar marked decrease in grain size was observed beginning from the initial
measurement (0 hours) and at each subsequent measurement (Fig. 5). However,
following the measurement taken at the 96-hour interval, the circulation speed was
increased stepwise from speed 2 (flow rate = 3 l/min) to 3 (flow rate = 3.5 l/min) and
finally to 4 (flow rate = 4 l/min), and at each increase in circulation speed there was a
noticeable increase in the grain sizes of the PSD of the sample, with the entire initial PSD
recovered at the final measurement (Fig. 5). These observations demonstrate that the
coarse fraction of the sample settled out of suspension due to slow circulation over long
periods of time, and was recovered when the circulation rate was increased.
We note that the final measurement has a 12% increase in mean grain size over the
first measurement. We attribute this result to either rapid sedimentation of the coarsest
63 µ
Fre
quen
cy %
0
5
10
15
20
25
30
Particle Size in Microns
1 10 100 1000
artifact of the laser analyser
screen size
Figure 4
Horiba laser particle size analyzer data for a representative sample of pulverized granite along the Garlock fault.
Note that this sample was wet-seived at 63 l, so all of the apparent material above 63 l in size (the ‘‘tail’’ to the
right) is a result of the laser analyzer placing a Gaussian distribution on the particle size estimate. As the sample
was seived at 63 l, there can be no material of this size present in the analyzed sample.
1734 T. Rockwell et al. Pure appl. geophys.,
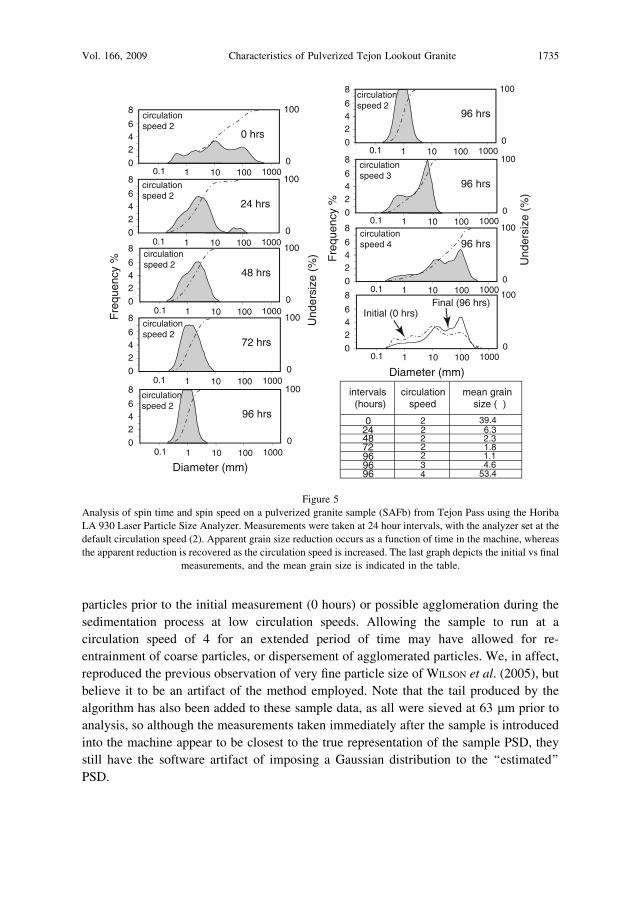
particles prior to the initial measurement (0 hours) or possible agglomeration during the
sedimentation process at low circulation speeds. Allowing the sample to run at a
circulation speed of 4 for an extended period of time may have allowed for re-
entrainment of coarse particles, or dispersement of agglomerated particles. We, in affect,
reproduced the previous observation of very fine particle size of WILSON et al. (2005), but
believe it to be an artifact of the method employed. Note that the tail produced by the
algorithm has also been added to these sample data, as all were sieved at 63 lm prior to
analysis, so although the measurements taken immediately after the sample is introduced
into the machine appear to be closest to the true representation of the sample PSD, they
still have the software artifact of imposing a Gaussian distribution to the ‘‘estimated’’
PSD.
Fre
quen
cy %
Und
ersi
ze (
%)
8
642
00.1 1 10 100 1000
0
100circulation speed 2
0 hrs
8
642
00.1 1 10 100 1000
0
100circulation speed 2
24 hrs
8
642
00.1 1 10 100 1000
0
100circulation speed 2
48 hrs
8
642
00.1 1 10 100 1000
0
100circulation speed 2
72 hrs
8
642
00.1 1 10 100 1000
0
100circulation speed 2
96 hrs
8
642
00.1 1 10 100 1000
0
100circulation speed 3
96 hrs
8
642
00.1 1 10 100 1000
0
100circulation speed 4 96 hrs
8
642
00.1 1 10 100 1000
0
100
8
642
00.1 1 10 100 1000
0
100circulation speed 2
96 hrs
Initial (0 hrs)Final (96 hrs)
intervals (hours)
circulation speed
mean grainsize (µ)
0 2244872969696
39.46.32.31.81.14.6
53.4
222
2
34
Diameter (mm)
Fre
quen
cy %
Und
ersi
ze (
%)
Diameter (mm)
Figure 5
Analysis of spin time and spin speed on a pulverized granite sample (SAFb) from Tejon Pass using the Horiba
LA 930 Laser Particle Size Analyzer. Measurements were taken at 24 hour intervals, with the analyzer set at the
default circulation speed (2). Apparent grain size reduction occurs as a function of time in the machine, whereas
the apparent reduction is recovered as the circulation speed is increased. The last graph depicts the initial vs final
measurements, and the mean grain size is indicated in the table.
Vol. 166, 2009 Characteristics of Pulverized Tejon Lookout Granite 1735
We conclude that laser particle size results, although quick and easy, may not
provide an accurate representation of the particle distribution in pulverized rocks,
although we are continuing to work on this problem. Consequently, we ran all samples
using the standard pipette method of FOLK (1974), which is generally believed to be
accurate to about 1%, and we took aliquot samples to determine the 31–63 lm,
16–31 lm, 8–16 lm, 4–8 lm, 2–4 lm, 1–2 lm and <1 lm fractions (phi 4 through 10,
respectively).
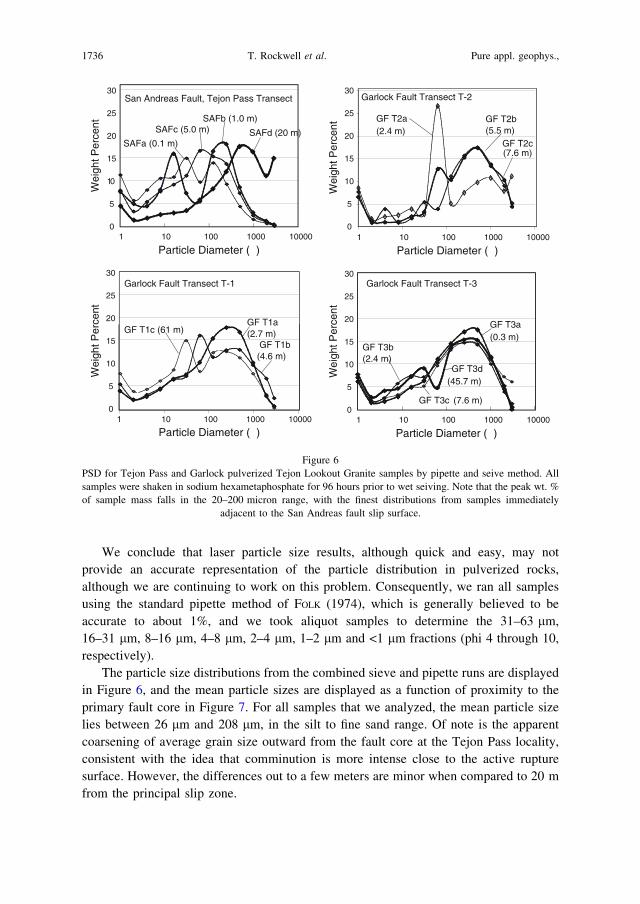
The particle size distributions from the combined sieve and pipette runs are displayed
in Figure 6, and the mean particle sizes are displayed as a function of proximity to the
primary fault core in Figure 7. For all samples that we analyzed, the mean particle size
lies between 26 lm and 208 lm, in the silt to fine sand range. Of note is the apparent
coarsening of average grain size outward from the fault core at the Tejon Pass locality,
consistent with the idea that comminution is more intense close to the active rupture
surface. However, the differences out to a few meters are minor when compared to 20 m
from the principal slip zone.
GF T1c (61 m)
GF T1b(4.6 m)
GF T1a(2.7 m)
10 100 1000 100000
5
10
15
20
25
30
Wei
ght P
erce
nt
Particle Diameter (µ)
Garlock Fault Transect T-1
0
5
10
15
20
25
30
1 10 100 1000 10000
GF T2b(5.5 m)
GF T2a(2.4 m)
Particle Diameter (µ)
Wei
ght P
erce
nt
GF T2c(7.6 m)
Garlock Fault Transect T-2
GF T3a (0.3 m)
Garlock Fault Transect T-3
GF T3d(45.7 m)
1 10 100 1000 10000
Particle Diameter (µ)
Wei
ght P
erce
nt
GF T3c (7.6 m)
GF T3b(2.4 m)
0
5
10
15
20
25
30
SAFd (20 m)SAFc (5.0 m)SAFb (1.0 m)
SAFa (0.1 m)
1 10 100 1000 100000
5
10
15
20
25
30
Particle Diameter (µ)
Wei
ght P
erce
ntSan Andreas Fault, Tejon Pass Transect
1
Figure 6
PSD for Tejon Pass and Garlock pulverized Tejon Lookout Granite samples by pipette and seive method. All
samples were shaken in sodium hexametaphosphate for 96 hours prior to wet seiving. Note that the peak wt. %
of sample mass falls in the 20–200 micron range, with the finest distributions from samples immediately
adjacent to the San Andreas fault slip surface.
1736 T. Rockwell et al. Pure appl. geophys.,

In contrast, samples recovered from along the Garlock fault in Bear Trap Canyon
do not show as clear a trend outward from the principal fault core. In transect 1, all
three samples have a peak in the few hundred micron range, whereas the samples taken
farther from the principal slip surface have finer particle distributions. In transect 2, the
samples display a more normal trend, with the finest pulverized sample closest (2.4 m)
to the principal slip surface. Transect 3 shows all samples damaged to about the same
degree, but again with the samples taken away from the principal slip surface
displaying slightly finer particle distributions. A possible explanation is the presence of
a secondary break out thrust at Bear Trap Canyon that is a few tens of meters or less
south of the three sampling transects. The presence of this structure means that the
Garlock samples were collected from an actively deforming wedge between two fault
strands. Although we see no evidence of shear dislocations in the thin sections, it is
likely that the presence of a nearby secondary strand has affected the local
pulverization signal. It is also possible that the thrust was a primary slip zone, which
may explain the apparent reversal in particle size trend. In any case, more examples of
fault perpendicular transects are clearly warranted to test the variability of damage
relative to proximity to the active slip zone.
Microscope Comparison of Particle Size. To further confirm that coarse fragments make
up the dominant particle size (by weight) in these samples of pulverized granite, we cut
Mea
n P
artic
le S
ize
(µ)
Distance From the Primary Fault Core (m)
0.01 1010.1 100
0
50
100
150
200
250
GF T1c
GF T1b
GF T2cGF T2b
GF T2a
GF T3cGF T3b
GF T1aGF T3a
GF T3d
SAFaSAFb SAFc
SAFd
Approximate location of secondary fault,Garlock samples
Figure 7
Plot of mean particle size versus distance from the primary fault core for the San Andreas and Garlock samples.
Note that the San Andreas samples become finer, on average, as the fault core is approached, whereas the
Garlock samples do not show as clear a trend. This may be due, in part, to the presence of a second significant
fault strand about a hundred meters south of the main fault, and some of the samples were recovered from near
that second fault.
Vol. 166, 2009 Characteristics of Pulverized Tejon Lookout Granite 1737

PG8-1
0 1 mm 0 1 mm
PG4-1
0 1 mm
PG9-1
0 1 mm
twinning
twinning
(a) GF T3b GF T2a
GF T3d
GF T3c(c)
(b)
(d)
(e)
Figure 8
Photomicrographs of representative thin section from the Tejon Lookout Granite along the Garlock fault. All
sections showed the extensive in situ shattering of the crystalline components of the granite. a and b demonstrate
the abundance of residual coarse fragments of quartz and feldspar that are broken to the *100l scale. c and d
show more extensively damaged portions from samples GF T3c and GF T3d, and c also shows twinned feldspar
with no evidence of shear, as does the lower photomicrograph (e), which exhibits fine twinning.
1738 T. Rockwell et al. Pure appl. geophys.,
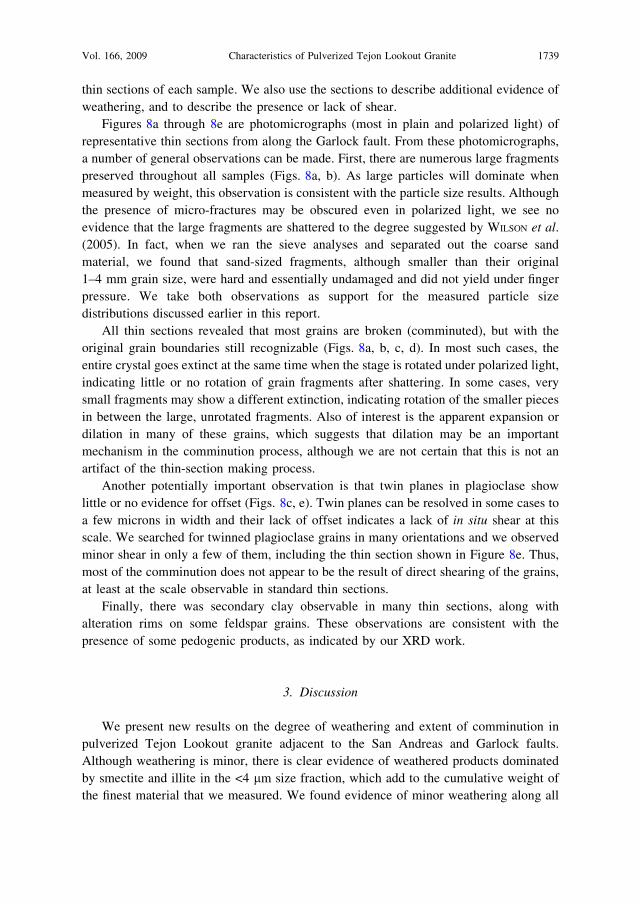
thin sections of each sample. We also use the sections to describe additional evidence of
weathering, and to describe the presence or lack of shear.
Figures 8a through 8e are photomicrographs (most in plain and polarized light) of
representative thin sections from along the Garlock fault. From these photomicrographs,
a number of general observations can be made. First, there are numerous large fragments
preserved throughout all samples (Figs. 8a, b). As large particles will dominate when
measured by weight, this observation is consistent with the particle size results. Although
the presence of micro-fractures may be obscured even in polarized light, we see no
evidence that the large fragments are shattered to the degree suggested by WILSON et al.
(2005). In fact, when we ran the sieve analyses and separated out the coarse sand
material, we found that sand-sized fragments, although smaller than their original
1–4 mm grain size, were hard and essentially undamaged and did not yield under finger
pressure. We take both observations as support for the measured particle size
distributions discussed earlier in this report.
All thin sections revealed that most grains are broken (comminuted), but with the
original grain boundaries still recognizable (Figs. 8a, b, c, d). In most such cases, the
entire crystal goes extinct at the same time when the stage is rotated under polarized light,
indicating little or no rotation of grain fragments after shattering. In some cases, very
small fragments may show a different extinction, indicating rotation of the smaller pieces
in between the large, unrotated fragments. Also of interest is the apparent expansion or
dilation in many of these grains, which suggests that dilation may be an important
mechanism in the comminution process, although we are not certain that this is not an
artifact of the thin-section making process.
Another potentially important observation is that twin planes in plagioclase show
little or no evidence for offset (Figs. 8c, e). Twin planes can be resolved in some cases to
a few microns in width and their lack of offset indicates a lack of in situ shear at this
scale. We searched for twinned plagioclase grains in many orientations and we observed
minor shear in only a few of them, including the thin section shown in Figure 8e. Thus,
most of the comminution does not appear to be the result of direct shearing of the grains,
at least at the scale observable in standard thin sections.
Finally, there was secondary clay observable in many thin sections, along with
alteration rims on some feldspar grains. These observations are consistent with the
presence of some pedogenic products, as indicated by our XRD work.
3. Discussion
We present new results on the degree of weathering and extent of comminution in
pulverized Tejon Lookout granite adjacent to the San Andreas and Garlock faults.
Although weathering is minor, there is clear evidence of weathered products dominated
by smectite and illite in the <4 lm size fraction, which add to the cumulative weight of
the finest material that we measured. We found evidence of minor weathering along all
Vol. 166, 2009 Characteristics of Pulverized Tejon Lookout Granite 1739

three of the Garlock transects as well as at the Tejon Pass locality. This is not unexpected
as all sites are within a few meters of the modern ground surface and potentially are
within the weathering zone. These results differ from the previous conclusion of WILSON
(2004) on the relative absence of weathered material. To what degree the weathering has
affected other aspects of the analysis, such as particle size distribution, is not clear.
However, as the degree of weathering appears to be minor, we believe that its overall
affect on the particle size distribution is also small.
Based on the prior results of WILSON et al. (2005), the particle sizes that we measured
are markedly different than we expected. In fact, part of the reason we recollected the
Tejon Pass locality was because the initial Garlock fault results, as well as preliminary
results from samples of pulverized granitic rock collected from along the San Jacinto
fault (STILLINGS, 2007), displayed much coarser overall grain size distributions. This led
to our methodological experiments on the laser particle size analyzer, to which we
attribute most of the differences.
Our first-order conclusion is that the Tejon Lookout granite is pulverized along both
the San Andreas and Garlock faults, but that the average grain size ranges between
about 26 and 208 microns (silt to fine sand), with the size distribution partly a function
of distance from the principal fault core, at least for the Tejon Pass sample suite. This
average grain size is much coarser than the previously reported data on pulverized
rocks, a result that we attribute to sedimentation of the relatively coarse particles in the
measurements of WILSON et al. (2005) with the laser particle size analyzer. Although
we cannot be certain of the methodology employed by WILSON et al. (2005), as we did
not use the same laser analyzer and the specific details of the previous analysis were
not clearly laid out, we were able to reproduce their result of decreasing average
particle size with increasing circulation time, and then we were able to recover
essentially instantaneously the initial particle size distribution by increasing the
circulation speed. We confirmed our particle distributions through analysis of thin
sections, and we confirmed the presence of very coarse material (0.5–5 mm in some
samples) by testing the coherence and strength of the coarse fraction after it had been
separated by dry sieving. In all cases, the remaining coarse sand and pebble-sized
particles were found to be fresh and unbroken and could not be further broken without
use of a hammer.
We attempted to correct for the ‘‘Gaussian artifact’’ of the laser particle size analyzer
by taking the coarse tail fraction (> 63 lm) and rebinning it with the next lower fraction
(coarse silt, 31–63 lm). This resulted in a final distribution that is quite similar to the
settling tube results, but not the same. More work is warranted in this area.
The implications for the amount of fracture energy and type of stress field required to
have produced the observed damage are significant, as the inferred energy depends
strongly on the grain size distribution, and the existence of very small grains may imply
tensile stress (e.g., RECHES and DEWERS, 2005; SAMMIS and BEN-ZION, 2008). Rather
than C 50% of the earthquake energy budget being consumed by dynamic fracturing and
pulverization as suggested by WILSON et al., (2005), we find that the average value is
1740 T. Rockwell et al. Pure appl. geophys.,
closer to 1%. This value is compatible with estimates of fracture energy needed to
comminute the fault core rock (CHESTER et al., 2005), as well as estimates based on
seismological data (e.g., KANAMORI et al. 1998; MCGARR, 1999), rock mechanics
experiments (e.g., LOCKNER and OKUBO, 1983), and measurements of energy components
in computer simulations (e.g., SHI et al., 2008).
The actual mechanism of fracturing in the damage zone needed to produce
pulverized fault zone rock is still not clear, but our data shed light on the process. The
study of CHESTER et al. (2005) of thin sections in the ultra-cataclasite core of the
Punchbowl fault indicates that the particles in the fault core follow a power-law
distribution from the micron to the nanoscale. SAMMIS and KING (2007) suggest, based
on model considerations, that a fractal distribution is mechanically favored for
situations in which the primary mechanism for grain-size reduction is by shear and
grinding assumed to characterize fault cores. However, several recent studies on natural
and experimentally deformed rocks show (e.g., HEILBRONNER and KEULEN, 2006; KEULEN
et al., 2007) that the grain-size distribution follows a strict power law only over a
narrow range, and has a pronounced slope break that may be related to the grinding
limit of quartz. HEILBRONNER and KEULEN (2006) and KEULEN et al. (2007) also found
differences in the slope of the particle distribution between quartz and feldspar, a result
that supports the idea of a mineralogical control on grain size distribution. These
authors suggest that the slope break common in their experimental results represents a
change in process from grain cracking produced by rupturing to comminution by wear
and attrition.
For the pulverized Tejon Lookout granite, it is not clear that shear is a significant
contributor to grain size reduction, as there is little evidence of shear in any of the thin
sections: Plagioclase twin planes show little to no offset in any orientation and large
quartz grains, although shattered, have similar extinction in cross-polars. This is
consistent with previous suggestions that pulverized rocks are generated by dynamic
reduction of normal stress during successive earthquake ruptures, possibly aided by
strong dynamic dilation and transient fault opening at the tip of ruptures propagating
along bimaterial fault interfaces in a preferred direction (e.g., BRUNE, 2001; BEN-ZION and
HUANG, 2002). We note, however, that pulverized sandstones in the damage zone of the
San Andreas fault near Little Rock, California, show evidence of preferred fracture
orientations along with radial and conical Hertzian cracking (DOR et al., 2009). These
observations in porous sandstones suggest that pulverization may have a contribution
from transient compressive stressing associated with earthquake ruptures on the San
Andreas fault.
To compare our mechanically-derived particle size data to those from studies using
thin sections, we converted the particle data into the standard format of log particle size
density versus log particle class (SAMMIS and KING, 2007). Figure 9 shows the Tejon Pass
particle size data, with a best-fit line for each sample that follows a power-law
distribution and a best-fit curve that has a continuously varying slope with increasing
particle size. Sample SAFd recovered from about 20 m from the fault core can be fitted
Vol. 166, 2009 Characteristics of Pulverized Tejon Lookout Granite 1741

well using a power-law distribution with a single exponent, however, the other three
samples recovered from closer distances to the fault core are better fit by a continuously
varying slope.
The four Tejon Pass samples exhibit a clear trend towards finer particle sizes as the
primary fault core is approached. This relationship is seen clearly in Figure 10a, where
we plot together the data for the different SAF samples, as well as in the particle size
plots of Figures 6 and 7. In contrast, the Garlock samples (Figs. 10b–10d) do not show as
clear a trend. We do not use the material that was coarser then 2 mm as it is all grouped
as > 2 mm rather than by phi scale dimensions. The finest fraction generally falls along
% N
umbe
r pa
rtic
les
per
clas
s
10
10
10
10
10
10
10
102
1
0
10
10
10
-1
-2
-3
1
-4
-6
-5
-7
-8
10100 1 32 1010 104
Particle Size (µ)
y(x) = axn
2300.4 -3.2896 0.99426 (log)
a n R
259.3 -0.4039 -1.834 0.99951 (log)
a b c R
y(x) = ax(b log (x) + c)10
SampleSAFa
y(x) = axn
a n R
1446 -3.1073 0.99348 (log)
a b c R
239.4 -0.3328 -1.908 0.99748 (log)
y(x) = ax(b log (x) + c)10
y(x) = ax n
a n R
2035.8 -3.115 0.99281 (log)
a b c R
201.2 -0.4282 -1.572 0.99939 (log)
y(x) = ax(b log (x) + c)
10
y(x) = axn
a n R
565.6 -2.6025 0.99899 (log)
370.2 -0.0784 -2.320 0.99931 (log)
y(x) = ax(b log (x) + c)
10
SampleSAFb
SampleSAFc
SampleSAFd
% N
umbe
r pa
rtic
les
per
clas
s
10
10
10
10
10
10
10
102
1
0
10
10
10
-1
-2
-3
1
-4
-6
-5
-7
-8
% N
umbe
r pa
rtic
les
per
clas
s
10
10
10
10
10
10
10
10 2
1
0
10
10
10
-1
-2
-3
1
-4
-6
-5
-7
-8
% N
umbe
r pa
rtic
les
per
clas
s
10
10
10
10
10
10
10
102
1
0
10
10
10
-1
-2
-3
1
-4
-6
-5
-7
-8
10100 1 32 1010 104
Particle Size (µ)
10100 1 32 1010 104
Particle Size (µ)
10100 1 32 1010 104
Particle Size (µ)
a b c R
Figure 9
Particle size plots of the four samples collected from along the San Andreas fault at Tejon Pass (the Wilson
locality), plotted as particle diameter class against the number of particles in that class. These data are derived
directly from the particle size data determined by pippette analyses. The best-fit curves for each sample are
plotted, with one that follows a power-law distribution and one that has a continuously varying slope with
increasing particle size. Note that the data from the more pulverized samples from within 10 m of the fault core
are best fit by the continuously changing slope, although the sample from 20 m (SAFd) can be well fit with either
regression.
1742 T. Rockwell et al. Pure appl. geophys.,
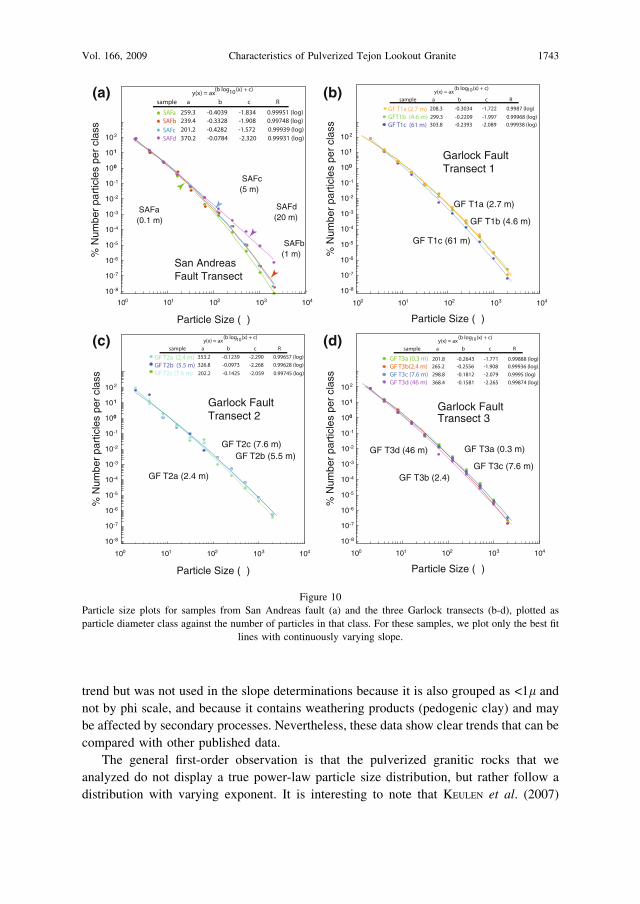
trend but was not used in the slope determinations because it is also grouped as <1l and
not by phi scale, and because it contains weathering products (pedogenic clay) and may
be affected by secondary processes. Nevertheless, these data show clear trends that can be
compared with other published data.
The general first-order observation is that the pulverized granitic rocks that we
analyzed do not display a true power-law particle size distribution, but rather follow a
distribution with varying exponent. It is interesting to note that KEULEN et al. (2007)
% N
umbe
r pa
rtic
les
per
clas
sParticle Size (µ)
GF T1c (61 m)
GF T1b (4.6 m)
Garlock FaultTransect 1
% N
umbe
r pa
rtic
les
per
clas
s
Particle Size (µ)
GF T2a (2.4 m)
GF T2b (5.5 m)
Garlock FaultTransect 2
GF T2c (7.6 m)
% N
umbe
r pa
rtic
les
per
clas
s
Particle Size (µ)
GF T3a (0.3 m)
GF T3b (2.4)GF T3c (7.6 m)
GF T3d (46 m)
Garlock FaultTransect 3
% N
umbe
r pa
rtic
les
per
clas
s
10
10
10
10
10
10
10
102
1
0
10
10
10
-1
-2
-3
0
1
-4
-6
-5
-7
-8
10100 1 32 1010 104
Particle Size (µ)
SAFa(0.1 m)
SAFb(1 m)
SAFc(5 m)
SAFd(20 m)
San AndreasFault Transect
GF T1a (2.7 m)
10100 1 32 1010 104
10100 1 32 1010 10410100 1 32 1010 104
10
10
10
10
10
10
10
102
1
0
10
10
10
-1
-2
-3
0
1
-4
-6
-5
-7
-8
10
10
10
10
10
10
10
102
1
0
10
10
10
-1
-2
-3
0
1
-4
-6
-5
-7
-8
10
10
10
10
10
10
10
102
1
0
10
10
10
-1
-2
-3
0
1
-4
-6
-5
-7
-8
(a) (b)
(d)(c)
Figure 10
Particle size plots for samples from San Andreas fault (a) and the three Garlock transects (b-d), plotted as
particle diameter class against the number of particles in that class. For these samples, we plot only the best fit
lines with continuously varying slope.
Vol. 166, 2009 Characteristics of Pulverized Tejon Lookout Granite 1743

report the main slope break (rK) around 1–2 lm, whereas the pulverized granites from
this study show a progressive slope reduction towards the finer material. The primary
difference, of course, is that they looked at sheared rock of the fault core while we are
looking at pulverized rocks within the broader damage zone. Also, in our case we
analyzed the pulverized rock primarily over the dimensions of 1–1000 lm, which is
appropriate for the methods we employed. In contrast, thin section studies can quantify
the finer material that is typically less than a micron in size. In any case, if the SAMMIS and
KING (2007) model is applicable, the observed distributions in our study suggest that
direct shear is not likely the primary cause of the shattering. Our observations that most
grains appear to have deformed at least partially by dilation are consistent with some
shattering during dynamic rupture under locally tensile stress (e.g., BRUNE et al., 1993;
BEN-ZION, 2001).
4. Conclusions
Pulverization along large continental strike-slip faults may be quite common, as
there are now well-documented observations of pulverized granitic rock along the San
Andreas, Garlock, and San Jacinto faults in southern California (WILSON et al., 2005;
DOR et al., 2006a; STILLINGS, 2007, this study), and the Arima-Takatsuki fault in Japan
(MITCHELL et al., 2008). These faults have tens of kilometers of lateral offset, with the
extent of pulverization possibly related to the magnitude of fault offset, the size of
earthquake that can be generated, and the possible existence of a bimaterial interface in
the fault structure. Of the damage zones studied in California, the Tejon Pass site along
the San Andreas fault exhibits the most intense damage, and this fault arguably is
capable of producing the largest earthquakes among the strike-slip faults in southern
California. It is also the fault with the most cumulative slip and the most pronounced
lithology contrast between the bounding crustal blocks. If varying degrees of
displacement, seismic potential, and lithologic contrast are factors controlling the
degree and extent of pulverization, then more work on faults with these characteristics
is warranted.
Pulverization appears to be spatially related to the active fault core however, direct
evidence for significant shear is lacking. At Tejon Pass, the comminution is most intense
close to the fault core, but the particle size distribution follows a pseudo power law with a
continuously changing exponent and suggests a shattering mechanism other than direct
shear. In all thin sections open cracks were observed in many grains, suggesting some
degree of dilatancy, although we cannot be sure that some of these open cracks formed
during the thin-section process. Nevertheless, such an observation, along with the lack of
evidence for significant shear, suggests that at least part of the shattering and
comminution of grains may result from a rapid decrease in normal stress and perhaps
transient fault opening during passage of the dynamic rupture front, as suggested by
BRUNE (2001) and BEN-ZION and SHI (2005).
1744 T. Rockwell et al. Pure appl. geophys.,

Acknowledgements
We thank Tejon Ranch and Earth Consultants International for access to trench
exposures along the Garlock fault. The study benefited from highly informative discus-
sions with Toshi Shimamoto and Oliver Spieler regarding measurements of particle-size
distributions with the laser analyzer. We thank Charlie Sammis and Tom Mitchell for
comments that improved the presentation of this paper. This research was supported by
the Southern California Earthquake Center. SCEC is funded by NSF Cooperative
Agreement EAR-0106924 and USGS Cooperative Agreement 02HQAG0008. The SCEC
contribution number for this paper is 1258.
REFERENCES
ABERCROMBIE, R., MCGARR, A., KANAMORI, H., and DI TORO, G. (eds.) Earthquakes: Radiated Energy and the
Physics of Faulting, Geophysical Monograph Series, Vol. 170, (2006) 327 pages, hardbound.
BEN-ZION, Y. (2001), Dynamic rupture in recent models of earthquake faults, J. Mechan. Phys. Solids 49, 2209–
2244.
BEN-ZION Y. and HUANG, Y. (2002), Dynamic rupture on an interface between a compliant fault zone layer and a
stiffer surrounding solid, J. Geophys. Res. 107 (B2): Art. No. 2042, doi 10.1029/2001JB000254.
BEN-ZION, Y. and. SAMMIS, C. G (2003), Characterization of fault zones, Pure Appl. Geophys. 160, 677–715.
BEN-ZION, Y. and SHI, Z. (2005), Dynamic rupture on a material interface with spontaneous generation of
plastic strain in the bulk, Earth Planet. Sci. Lett. 236, 486-496, doi: 10.1016/j.epsl.2005.03.025.
BRUNE, J.N. (2001), Fault normal dynamic loading and unloading: an explanation for ‘‘non-gouge’’ rock powder
and lack of fault-parallel shear bands along the San Andreas fault, EOS Trans. Am. Geophys. Union, 82.
BRUNE, J. N., BROWN, S. and JOHNSON P.A. (1993), Rupture mechanism and interface separation in foam rubber
models of earthquakes; a possible solution to the heat flow paradox and the paradox of large overthrusts,
Tectonophys. 218, 1–3.
CHESTER, J. S., CHESTER, F. M., and KRONENBERG, A. K. (2005), Fracture surface energy of the Punchbowl fault,
San Andreas system, Nature, 437, 133–136.
DOR, O., BEN-ZION, Y, ROCKWELL, T. K. and BRUNE, J. (2006a), Pulverized Rocks in the Mojave section of the
San Andreas Fault Zone, Earth Planet. Sci. Lett. 245, 642–654.
DOR, O., ROCKWELL, T. K., and BEN-ZION, Y. (2006b), Geological observations of damage asymmetry in the
structure of the San Jacinto, San Andreas and Punchbowl Faults in southern California: A possible indicator
for preferred rupture propagation direction, Pure Appl. Geophys. 163 (2–3), 301–349.
DOR, O., YILDIRIM, C., ROCKWELL, T. K., BEN-ZION, Y., EMRE, O., SISK, M., DUMAN, T. Y. (2008), Geologic and
geomorphologic asymmetry across the rupture zones of the 1943 and 1944 earthquakes on the North
Anatolian Fault: Possible signals for preferred earthquake propagation direction, Geophys. J. Int. 173, 483–
504, doi: 10.1111/j.1365-246X.2008.03709.x.
DOR, O., CHESTER J. BEN-ZION Y., ROCKWELL T., BRUNE J. (2009), Characterization of damage in sandstones
along the Mojave section of the San Andreas Fault: Implications for the shallow extent of damage generation,
Pure Appl. Geophys. 166, (10).
FOLK, R. L., Petrology of Sedimentary Rocks, (Hemphill Publishing Company1974).
HEILBRONNER, R., and N. KEULEN, (2006), Grain size and grain shape analysis of fault rocks, Tectonophys. 427
(1–4), 199–216.
KANAMORI, H., ANDERSON, D.L., and HEATON, T.H. (1998), Frictional melting during the rupture of the 1994
Bolivian Earthquake. Science 279, 839–842.
KEULEN, N., HEILBRONNER, R., STUNITS, H., BOULLIER, A. M., and Ito, H. (2007), Grain size distributions of fault
rocks: A comparison between experimentally and naturally deformed granitoids, J. Struct. Geol. 29, 1282–
1300.
Vol. 166, 2009 Characteristics of Pulverized Tejon Lookout Granite 1745
LOCKNER, D. A., and OKUBO, P. G. (1983), Measurements of frictional heating in granite, J. Geophys. Res. 88,
B5, 4313–4320.
MCGARR, A. (1999), On relating apparent stress to the stress causing earthquake fault slip, J. Geophys. Res.
104, 3003–3011.
MITCHELL, T.M., SHIMAMOTO, T. ANDO, J. BEN-ZION, Y. (2008), The seismic velocity and permeability properties
of pulverized rocks, Geophys. Res. Abstracts 10, EGU2008-A-00000, EGU General Assembly.
NESBITT, H. W., and YOUNG, G. M. (1982), Early Proterozoic climates and plate motions inferred from major
element chemistry of lutites, Nature 299, 715–717.
NESBITT, H. W., and MARKOVICS, G. (1997), Weathering of Granodioritic crust, long-term storage of elements in
weathering profiles, and petrogenesis of siliciclastic sediments, Geochimica et Cosmochimica Acta 61 (8),
1653–1670.
RECHES, Z., and DEWERS, T. A. (2005), Gouge formation by dynamic pulverization during earthquake rupture,
Earth Planet. Sci. Lett. 235, 361–374.
ROCKWELL, T.K. (2000), Use of soil geomorphology in fault studies: In Quaternary Geochronology: Methods
and Applications. J.S. Noller, J.M. Sowers, and W.R. Lettis, eds. AGU Reference Shelf 4 Am. Geophys.
Union, Washington D.C., 2000, pp 273–292.
ROCKWELL, T. K. and BEN-ZION Y. (2007), High localization of primary slip zones in large earthquakes from
paleoseismic trenches: Observations and implications for earthquake physics, J. Geophys. Res. 112, B10304,
doi:10.1029/2006JB004764.
SAMMIS, C. G. and BEN-ZION, Y. (2008), The mechanics of grain-size reduction in fault zones, J. Geophys. Res.
113, B02306, doi:10.1029/2006JB004892.
SAMMIS, C. G., KING, G. C. P., and BIEGEL, R. (1987), The kinematics of gouge deformation, Pure. Appl.
Geophys. 125, 777–812.
SAMMIS, C. G., and KING, G. C. P. (2007), Mechanical origin of power law scaling in fault zone rock, Geophys.
Res. Lett. 34, L04312.
SHI, Z., BEN-ZION, Y., and NEEDLEMAN, A. (2008), Properties of dynamic rupture and energy partition in a two-
dimensional elastic solid with a frictional interface, J. Mech. Phys. Solids 56, 5–24, doi:10.1016/
j.jmps.2007.04.006.
SISK, M., ROCKWELL, T., GIRTY, G., DOR, O., and BEN-ZION, Y. (2005), Potentially pulverized granites along the
Garlock fault: An analysis into their physical and chemical properties, EOS Trans. Amer. Geophys. Union 86
(52), Fall Meet. Suppl., Abstract S41B-0994,.
SPERAZZA, M., MOORE, J.N., and HENDRIX, M.S. (2004), High-resolution particle size analysis of naturally
occurring very fine-grained sediment through laser diffractometry. J. Sedimentary Res. 74, (5), 736–743.
STILLINGS, M. (2007), Structural, textural, and geochemical analyses of fault damage zones: Clark strand, San
Jacinto fault zone, southern California, M.S. Thesis, San Diego State University, San Diego, California.
WILSON, B. T. (2004), Meso- and micro-structural Analysis of the San Andreas Fault at Tejon Pass, California,
USA, M.S. Thesis, University of Oklahoma, Norman, Oklahoma.
WILSON, B., DEWERS, T., RECHES, Z., and BRUNE, J. (2005), Particle size and energetics of gouge from earthquake
rupture zones, Nature 434 (7034), 749–752.
(Received September 3, 2008, accepted February 12, 2009)
Published Online First: June 30, 2009
To access this journal online:
www.birkhauser.ch/pageoph
1746 T. Rockwell et al. Pure appl. geophys.,
Copyright © 2022 FDOKUMEN